In SituElectrochemical Promotion by Sodium of the Selective Hydrogenation of Acetylene over Platinum
11
Subscriber access provided by POLYTECHNIC OF CRETE The Journal of Physical Chemistry B is published by the American Chemical Society. 1155 Sixteenth Street N.W., Washington, DC 20036 Article In Situ Electrochemical Promotion by Sodium of the Platinum-Catalyzed Reduction of NO by Propene Ioannis V. Yentekakis, Alejandra Palermo, Neil C. Filkin, Mintcho S. Tikhov, and Richard M. Lambert J. Phys. Chem. B, 1997, 101 (19), 3759-3768 • DOI: 10.1021/jp963052c Downloaded from http://pubs.acs.org on November 26, 2008 More About This Article Additional resources and features associated with this article are available within the HTML version: • Supporting Information • Links to the 1 articles that cite this article, as of the time of this article download • Access to high resolution figures • Links to articles and content related to this article • Copyright permission to reproduce figures and/or text from this article
-
Upload
independent -
Category
Documents
-
view
0 -
download
0
Transcript of In SituElectrochemical Promotion by Sodium of the Selective Hydrogenation of Acetylene over Platinum

Subscriber access provided by POLYTECHNIC OF CRETE
The Journal of Physical Chemistry B is published by the American Chemical Society.1155 Sixteenth Street N.W., Washington, DC 20036
Article
In Situ Electrochemical Promotion by Sodium of thePlatinum-Catalyzed Reduction of NO by Propene
Ioannis V. Yentekakis, Alejandra Palermo, Neil C. Filkin, Mintcho S. Tikhov, and Richard M. LambertJ. Phys. Chem. B, 1997, 101 (19), 3759-3768 • DOI: 10.1021/jp963052c
Downloaded from http://pubs.acs.org on November 26, 2008
More About This Article
Additional resources and features associated with this article are available within the HTML version:
• Supporting Information• Links to the 1 articles that cite this article, as of the time of this article download• Access to high resolution figures• Links to articles and content related to this article• Copyright permission to reproduce figures and/or text from this article

In Situ Electrochemical Promotion by Sodium of the Platinum-Catalyzed Reduction of NOby Propene
Ioannis V. Yentekakis,† Alejandra Palermo,‡ Neil C. Filkin, Mintcho S. Tikhov, andRichard M. Lambert*Department of Chemistry, UniVersity of Cambridge, Cambridge CB2 1EW, England
ReceiVed: October 3, 1996; In Final Form: February 19, 1997X
The Pt-catalyzed reduction of NO by propene exhibits strong electrochemical promotion by spillover Nasupplied from aâ′′-alumina solid electrolyte. In the promoted regime, rate increases by an order of magnitudeare achievable. At sufficiently high loadings of Na the system exhibits poisoning, and excursions betweenthe promoted and poisoned regimes are fully reversible. Reaction kinetic data obtained as a function ofcatalyst potential, temperature, and gas composition indicate that Na increases the strength of NO chemisorptionrelative to propene. This is accompanied by weakening of the N-O bond, thus facilitating NO dissociation,which is proposed as the critical reaction-initiating step. The dependence of N2/N2O selectivity on catalystpotential is in accord with this view: Na pumping to the Pt catalyst favors N2 production at the expense ofN2O. X-ray photoelectron spectroscopic (XPS) data confirm that electrochemical promotion of the Pt filmdoes indeed involve reversible pumping of Na to or from the solid electrolyte. They also show that underreaction conditions the promoter phase consists of a mixture of sodium nitrite and sodium nitrate and that thepromoted and poisoned conditions of the catalyst correspond to low and very high loadings of these sodiumcompounds. Under all reaction conditions, a substantial fraction of the promoter phase is present as 3Dcrystallites.
Introduction
Electrochemical promotion (EP), discovered and developedby Vayenaset al., is an entirely new way of controlling catalystperformance.1 Reference 1 provides a detailed account of thephenomenology and outlines a theoretical basis in terms ofwhich the EP effect may be interpreted. The method entailselectrochemical pumping of ions from a solid electrolyte to thesurface of a porous, catalytically active metal film: the resultingchanges in work function (∆Φ) of the catalyst alter theadsorption enthalpies of adsorbed species and the activationenergies of reactions involving these species. It has been shown1
that the electrochemically induced changes in catalyst potentialmeasured with respect to a reference electrode (∆VWR) areidentical to∆Φ. The effects on activity and selectivity arereversible, and the phenomenon provides a uniquely efficaciousand controllable method for thein situ tuning of workingcatalytic systems. Thus, in addition to its potential practicalutility, EP also provides a means for the systematic investigationof certain aspects of promoter action in a manner that washitherto not possible. Note that EP is strongly non-faradaic:one is not dealing with conventional electrocatalysis. Theelectrochemically induced catalytic rate changes are typically103-105 times greater than the rate of supply of promoterspecies. The EP phenomenon has been reported for over 40catalytic reactions on Pt, Rh, Pd, Ag, Ni and IrO2 catalyst filmswith a variety of solid electrolytes including oxygen,2-4
sodium,1,5-8 fluorine,9 and hydrogen ion conductors.10
It is well-known that reactions involving the catalyticreduction of NO are of major environmental importance.11 In
this connection, Rh plays a key role in current three-wayconverters because it is highly effective for the dissociativechemisorption and reduction of NO. In a recent study ofelectrochemical promotion of the CO+ NO reaction over Pt,8
we showed that the selectivity, and especially the activity, of aPt film electrochemically fed with sodium from aâ′′-alumina(a Na+ ion conductor) support could be dramatically en-hanced: in effect, Pt could be induced to behave like Rh. Theresults indicated that Na induces NO dissociation which isthought to be the crucial reaction-initiating step. Here wepresent an extension of this work to a potentially more importantsystem: EP of the reduction of NO by propene over Pt/â′′-alumina. (Propene is the major constituent of the hydrocarboncomponent in automotive exhaust and is the industry standardfor catalyst testing.) Very large rate accelerations and substantialgains in selectivity towards N2 production were achieved, whileXP spectra gave insight into the nature of the promoting speciesand the origin of the poisoning effects observed at high promoterloadings.
Methods
The platinum catalyst (working electrode, W) consisted of aporous continuous thin film (∼2 cm2 geometric area) depositedon one face of a 20 mm diameterâ′′-Al2O3 disc (Ceramatec)as described in detail elsewhere.5 Au reference (R) and counter(C) electrodes were attached to the other face of the solidelectrolyte wafer (see Figure 1, ref5) by vacuum evaporation, aprocedure that produced electrodes with good adhesion and lowelectrical resistance. The actual active surface area of the Ptcatalyst electrode (W) was estimated by comparing the observedrate of CO oxidation under standard conditions (6 kPa of O2,1.8 kPa of CO, 623 K, andVWR ) +800 mV) with thoseobtained5 using samples whose surface area had been directlydetermined using an O2/CO titration technique.12 This gave avalue of 5× 10⁻⁷ mol of Pt (∼200 cm2) for the active metalarea. The Pt/â′′-Al2O3/Au sample was suspended in a quartz,
* Corresponding author. Telephone 44 1223 336467; FAX 44 1223336362; e-mail [email protected].
† Institute of Chemical Engineering and High Temperature ChemicalProcesses and Department of Chemical Engineering, University of Patras,Patras, GR-26500, Greece.
‡ Institute of Materials Science and Technology (INTEMA), UNMDP-CONICET, J. B. Justo 4302, (7600) Mar del Plata, Argentina.
X Abstract published inAdVance ACS Abstracts,April 1, 1997.
3759J. Phys. Chem. B1997,101,3759-3768
S1089-5647(96)03052-0 CCC: $14.00 © 1997 American Chemical Society
atmospheric-pressure well-mixed reactor with all three electrodesexposed to the reactant gas mixture.7,8 The reactor volume was115 cm3, and the system behaved as a single pellet, continuousstirred tank reactor (CSTR) as described and discussed else-where.4,5,7,13,14
Inlet and exit gas analysis was carried out by a combinationof on-line gas chromatography (Shimadzu-14B; molecular sieve5A and Porapak-N columns) and on-line mass spectrometry(Balzers QMG 064). N2, N2O, CO, CO2, and C3H6 weremeasured by gas chromatography, and NO was measuredcontinuously by mass spectrometry after performing the requiredcalibrations. The mass spectrometer was also used to monitorcontinuouslym/z ) 28 (N2 + CO), 44 (CO2 + N2O), 16 (O),41 (propene), and 17 (NH3). Reactants were pure NO (DistillersMG) and propene (Matheson) diluted in ultrapure He (99.996%)and fed to the reactor by mass-flow controllers (Brooks 5850TR). The total flow rate was kept essentially constant in allexperiments at 1.3× 10⁻⁴ mol s-1 (190 cm3 (STP)/min), withpartial pressuresPNO, andPC3H6 varying between 0-6.5 and0-0.4 kPa, respectively. Conversion of the reactants wasrestricted to<15% in order to avoid mass transfer limitations.An AMEL 553 galvanostat-potentiostat was used to carry
out measurements in both galvanostatic and potentiostaticmodes. In the galvanostatic mode, constant current,I, wasapplied between the catalyst (W) and the counter electrode (C)while monitoring the potentialVWR between the catalyst andthe reference electrode (R).8 This gave information about thetime-dependent behavior of the system. The galvanostatictransient behavior ofVWR was also used to calibrate the Nacoverage scale.5,15 As noted above, changes in catalyst potential,VWR, are related to concomitant changes in catalyst workfunction according toe∆VWR ) ∆(eΦ) as predicted theoreti-cally1 and confirmed experimentally.16
In the potentiostatic mode, a constant potentialVWR wasmaintained between the catalyst and the reference electrodesthisgave information about activity, selectivity, and kinetics understeady-state conditions. Most experiments were carried out inthe potentiostatic mode by following the effect of the appliedcatalyst potential (VWR) on reaction rates. Periodic reversal ofthe direction of Na+ pumping (required in order to regeneratea clean Pt surface on the working electrode) appeared to avoidpossible difficulties due to Na depletion of the electrolyte. Inthis connection, note that an amount of sodium equivalent toθNa∼ 3 corresponds to 0.04% of the total amount of Na in theelectrolyte wafer.XPS measurements were carried out in a VG ADES 400
ultrahigh-vacuum spectrometer system. The EP sample wasmounted on a machinable ceramic block resistively heated byembedded, electrically insulated tungsten filaments. XP spectrawere acquired with Mg KR radiation with the Pt catalystelectrode always at ground potential; appropriate electrochemicalpotentials (VWC) were imposed between the Pt working electrodeand the Au counter electrode by applying voltage bias to thelatter. The potential (VWR) of the Pt working electrode withrespect to the Au reference electrode was also monitored.Quoted binding energies are referred to the Au 4f7/2 emissionat 83.8 eV, and Au reference spectra were provided by the Auwire which formed the electrical connection to the workingelectrode. The EP catalyst assembly used for XPS studymeasurements was first tested in the EP reactor to ensure thatit exhibited the same catalytic behavior as the samples used toacquire the reactor data.
Results
The only detectable reaction products were CO2, N2, N2Oand H2O. Overall carbon and nitrogen mass balance closures
within 5% were found by a combination of GC and massspectroscopic analyses.Transient Electrochemical Promotion. In order to obtain
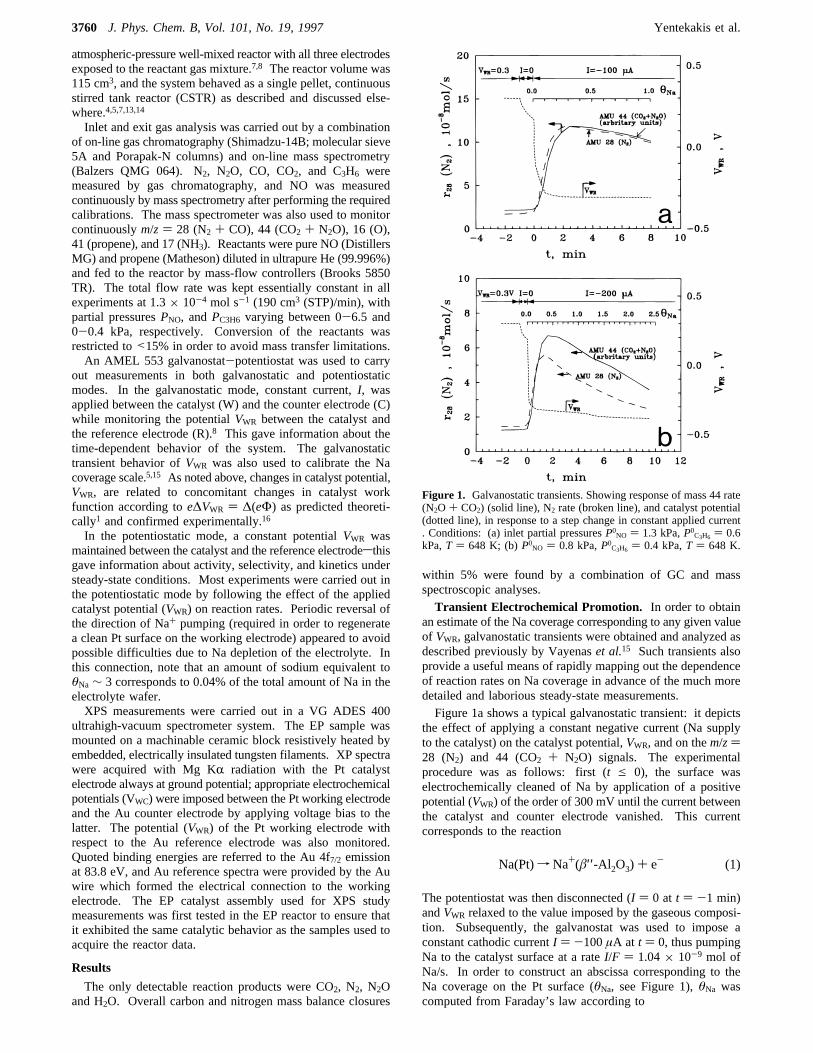
an estimate of the Na coverage corresponding to any given valueof VWR, galvanostatic transients were obtained and analyzed asdescribed previously by Vayenaset al.15 Such transients alsoprovide a useful means of rapidly mapping out the dependenceof reaction rates on Na coverage in advance of the much moredetailed and laborious steady-state measurements.Figure 1a shows a typical galvanostatic transient: it depicts
the effect of applying a constant negative current (Na supplyto the catalyst) on the catalyst potential,VWR, and on them/z)28 (N2) and 44 (CO2 + N2O) signals. The experimentalprocedure was as follows: first (t e 0), the surface waselectrochemically cleaned of Na by application of a positivepotential (VWR) of the order of 300 mV until the current betweenthe catalyst and counter electrode vanished. This currentcorresponds to the reaction
The potentiostat was then disconnected (I ) 0 at t ) -1 min)andVWR relaxed to the value imposed by the gaseous composi-tion. Subsequently, the galvanostat was used to impose aconstant cathodic currentI ) -100µA at t ) 0, thus pumpingNa to the catalyst surface at a rateI/F ) 1.04× 10⁻⁹ mol ofNa/s. In order to construct an abscissa corresponding to theNa coverage on the Pt surface (θNa, see Figure 1),θNa wascomputed from Faraday’s law according to
Figure 1. Galvanostatic transients. Showing response of mass 44 rate(N2O + CO2) (solid line), N2 rate (broken line), and catalyst potential(dotted line), in response to a step change in constant applied current. Conditions: (a) inlet partial pressuresP0NO ) 1.3 kPa,P0C3H6 ) 0.6kPa,T ) 648 K; (b)P0NO ) 0.8 kPa,P0C3H6 ) 0.4 kPa,T ) 648 K.
Na(Pt)f Na+(â′′-Al 2O3) + e- (1)
3760 J. Phys. Chem. B, Vol. 101, No. 19, 1997 Yentekakis et al.
whereN ()5.0× 10⁻⁷ mol) is the number of available Pt sitesindependently measured as described above. Under theseconditions (Na pumpingto the catalyst surface), a pronounceddecrease in the catalyst potentialVWR, and consequently in thecatalyst work function (e∆VWR ) ∆eΦ) occurred. This wasaccompanied by a very marked increase (by a factor of 7) inthe production rate of N2. As is apparent from Figure 1, thereaction rates(r) exhibit maxima forθNa∼ 0.3-0.4 atVWR ∼-300 mV, and continued Na pumping eventually leads topoisoning of the system. Them/z) 44 (CO2 + N2O) signal isgiven in arbitrary units because the separate contributions ofCO2 and N2O could not be measured by mass spectrometryalone. Potentiostatic imposition of the initialVWR restored therates to their initial unpromoted values, corresponding to cleanPt, thus demonstrating that the system was perfectly reversible.In general, the relationship betweenVWR and θNa depends
on the gaseous composition as discussed previously.5,8 Forpresent purposes, it is sufficient to note that theVWR/θNacalibration (Figure 1a) was performed in the identical gasatmosphere to that used in the steady-state measurements to bedescribed below. Figure 1b shows a transient obtained usingthe same reactant partial pressure ratio as that in Figure 1a, butwith a higher current and smaller reactant pressures. In linewith expectation the maximum is more pronounced in this case,and it is interesting to note that it occurs at essentially the samevalue ofθNa as that found in Figure 1a.It should be emphasized that the “θNa” scales in Figure 1a,b
are computed on the basis of uniform coverage of the entire Ptsurface by the relevant amount of electrochemically suppliedNa. That is, “θNa” is proportional to the total amount of pumpedNa. If the morphology of the promoter phase is nonuniform,e.g., 3D islands of Na compound(s) coexisting with a submono-layer film of promoter species on the Pt surface,θNa > 1 wouldstill correspond to a catalytically active system. The data inFigure 1a,b suggest that this is indeed the casesnominalcoverages of greater than unity exhibit activity well in excessof clean Pt because a substantial amount of the promoter materialis present as 3D crystallites. XPS data (see below) are in accordwith this view. A useful check is provided by∆VWR transientsmeasured in He as opposed to the reaction gas. These showmonotonic behavior similar to that shown in Figures 1a,b.Additionally, the behavior of∆VWR () ∆Φ) as a function ofcomputedθNa is in good quantitative agreement with resultsobtained for Pt{111}/Na in ultrahigh vacuum.17 This indicatesthat in a He atmosphere one is dealing with metallic Nauniformly distributed on the Pt surface.A convenient parameter for expressing electrochemically
induced promoting or poisoning effects is the promotion index,PNa, defined18 as
This takes positive or negative values for promotion orpoisoning, respectively. Here,PNa values up to 20 were foundfor the rate of N2 production in the promoted regime. This isfollowed by a poisoned regime forθNa > 0.5. This “volcanotype” behavior is also apparent in the potentiostatic, steady-state data to be presented in the following section. Similarpromoting-poisoning behavior of Na has been also observedin the cases of CO5 and ethylene13 oxidation and NO reductionby CO8 over Pt/â′′-alumina under appropriate conditions.Steady-State Effect of Catalyst Potential (VWR) on Reac-
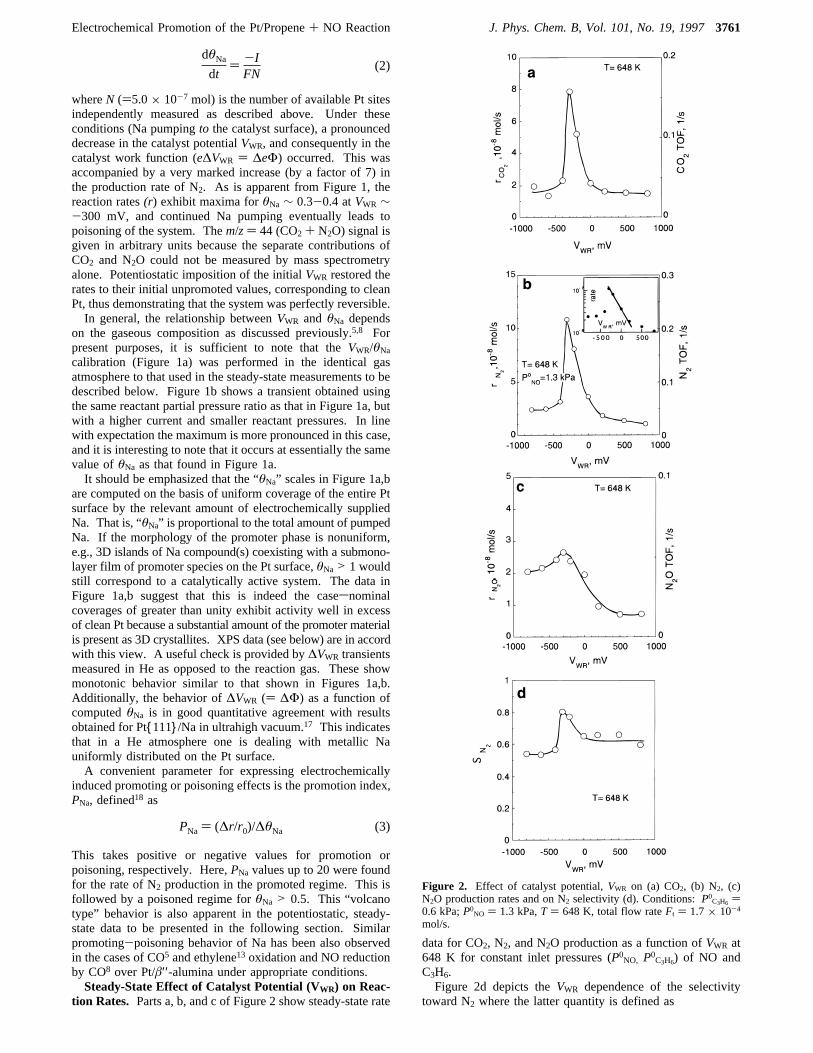
tion Rates. Parts a, b, and c of Figure 2 show steady-state rate
data for CO2, N2, and N2O production as a function ofVWR at648 K for constant inlet pressures (P0NO, P0C3H6) of NO andC3H6.Figure 2d depicts theVWR dependence of the selectivity
toward N2 where the latter quantity is defined as
Figure 2. Effect of catalyst potential,VWR on (a) CO2, (b) N2, (c)N2O production rates and on N2 selectivity (d). Conditions:P0C3H6 )0.6 kPa;P0NO ) 1.3 kPa,T ) 648 K, total flow rateFt ) 1.7× 10⁻⁴
mol/s.
dθNa
dt) -IFN
(2)
PNa ) (∆r/r0)/∆θNa (3)
Electrochemical Promotion of the Pt/Propene+ NO Reaction J. Phys. Chem. B, Vol. 101, No. 19, 19973761

The data presented in Figure 2a,b show that, for both theCO2 and N2 rates, a regime of strong promotion is followed bystrong poisoning. Relatively low rates are observed at both verypositive (clean Pt) and very negative (high Na loading) catalystpotentials. In particular, both rates exhibit an exponentialincrease with decreasingVWR in the interval∼0 to-300 mV:this is made more apparent by a logarithmic plot, e.g., as shownin the inset to Figure 2b. The rate of N2O production alsoexhibits “volcano-type” behavior, though the effect is not aspronounced (Figure 2c)sthe point is of significance with respectto our subsequent discussion of the reaction mechanism. Themaximum enhancements in CO2, and N2 rates over the cleansurface rates are∼7, and for N2O ∼3. Note also that theselectivity toward N2 increases from 60% on the clean Pt surfaceto 80% on the Na-promoted Pt surface atVWR ∼-300 mV.Control experiments were carried out in which the total flow
rate was varied by a factor of 2 in order to verify that theobserved changes in activity were due to a true increase insurface reaction rates and not due to mass transfer limitationsin the reactor. As found in previous EP studies with Pt/â′′-alumina5,13 for any given reaction conditions, the promotionaleffect is entirely controlled by the applied potential and theresulting Na coverage. After current interruption the promotedrates remained practically constant over periods of manyminutessthe slow decline that occurred under open circuitconditions is associated with various possible loss mechanismsfor the surface Na species, e.g., slow evaporation at reactiontemperature. In order to restore the initial unpromoted catalyticrate, potentiostatic imposition of the initial potential of+300mV was necessary.5 It is significant that in a reaction gasenvironment the total amount of Na pumped in order to attaina given value ofVWR was about an order of magnitude higherthan in a He environment. This is consistent with the ac-cumulation of the Na into 3D islands of a surface compound inthe presence of a reactive atmosphere.Effect of PC3H6 and PNO on Promoted and Unpromoted
Steady-State Rates.Parts a, b, and c of Figure 3 show 648 Kpotentiostatic data for the rates and turnover frequencies (TOFs)of CO2, N2, and N2O taken at four different fixed values ofcatalyst potential as a function of the outlet pressure of propene,for a fixed NO outlet pressure of 1.4 kPa. Figure 3d shows thecorresponding results for the N2 selectivity,SN2. In every casethe system was perfectly reversible and exhibited no hysteresiswhen switching between negative and positive catalyst poten-tials.The observed rate variations show that the reaction obeys
Langmuir-Hinshelwood (LH) type kinetics with the charac-teristic rate maximum reflecting competitive adsorption of thetwo reactants. It is also apparent that as the catalyst potentialis decreased to more negative values (increasingθNa), there isa systematic shift of the rate maxima tohigherpropene partialpressure (P*C3H6). Figure 4a-d depicts analogous results forthe effect of NO at four different catalyst potentials for fixedPC3H6 ) 0.27 kPa. The CO2 and N2 rates show essentiallysimilar behavior asPNO is variedsa pronounced enhancementin catalytic activity occurs upon decreasing the catalyst potentialfrom 300 to -300 mV. In this case the rate maxima areinaccessible within the constraints imposed by our experimentalconditionsshere, one expects the opposite effect, namely thatincreasing levels of Na should shift the (inaccessible) value ofP*NO to lower values. A comparison of the trends shown inFigures 3 and 4 indicates that under these conditions theadsorption of propene on Pt is stronger than that of NO.
Effect of Temperature on Promoted and UnpromotedSteady-State Rates.It is of interest to compare the temperaturedependent-behavior of the chemically complex NO+ propenesystem with the simpler NO+ CO system and the even simpler
Figure 3. Effect of C3H6 partial pressure (PC3H6) on the rate of (a)CO2, (b) N2, (c) N2O production and on N2 selectivity SN2, (d) atdifferent catalyst potentials,VWR. Conditions: PNO ) 1.4 kPa,T )648 K, total flow rateFt ) 1.3× 10⁻⁴ mol/s.
SN2) rN2
/(rN2+ rN2O
) (4)
3762 J. Phys. Chem. B, Vol. 101, No. 19, 1997 Yentekakis et al.
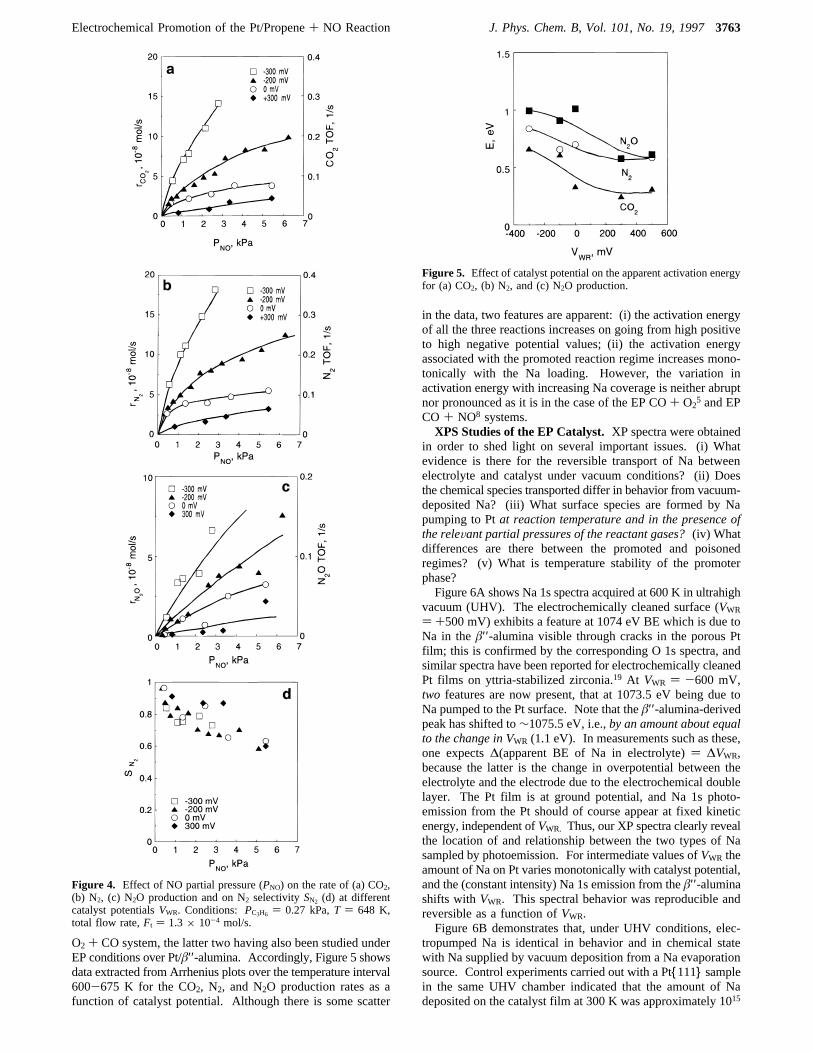
O2 + CO system, the latter two having also been studied underEP conditions over Pt/â′′-alumina. Accordingly, Figure 5 showsdata extracted from Arrhenius plots over the temperature interval600-675 K for the CO2, N2, and N2O production rates as afunction of catalyst potential. Although there is some scatter
in the data, two features are apparent: (i) the activation energyof all the three reactions increases on going from high positiveto high negative potential values; (ii) the activation energyassociated with the promoted reaction regime increases mono-tonically with the Na loading. However, the variation inactivation energy with increasing Na coverage is neither abruptnor pronounced as it is in the case of the EP CO+ O2
5 and EPCO + NO8 systems.XPS Studies of the EP Catalyst.XP spectra were obtained
in order to shed light on several important issues. (i) Whatevidence is there for the reversible transport of Na betweenelectrolyte and catalyst under vacuum conditions? (ii) Doesthe chemical species transported differ in behavior from vacuum-deposited Na? (iii) What surface species are formed by Napumping to Ptat reaction temperature and in the presence ofthe releVant partial pressures of the reactant gases?(iv) Whatdifferences are there between the promoted and poisonedregimes? (v) What is temperature stability of the promoterphase?Figure 6A shows Na 1s spectra acquired at 600 K in ultrahigh
vacuum (UHV). The electrochemically cleaned surface (VWR
) +500 mV) exhibits a feature at 1074 eV BE which is due toNa in theâ′′-alumina visible through cracks in the porous Ptfilm; this is confirmed by the corresponding O 1s spectra, andsimilar spectra have been reported for electrochemically cleanedPt films on yttria-stabilized zirconia.19 At VWR ) -600 mV,two features are now present, that at 1073.5 eV being due toNa pumped to the Pt surface. Note that theâ′′-alumina-derivedpeak has shifted to∼1075.5 eV, i.e.,by an amount about equalto the change in VWR (1.1 eV). In measurements such as these,one expects∆(apparent BE of Na in electrolyte)) ∆VWR,because the latter is the change in overpotential between theelectrolyte and the electrode due to the electrochemical doublelayer. The Pt film is at ground potential, and Na 1s photo-emission from the Pt should of course appear at fixed kineticenergy, independent ofVWR. Thus, our XP spectra clearly revealthe location of and relationship between the two types of Nasampled by photoemission. For intermediate values ofVWR theamount of Na on Pt varies monotonically with catalyst potential,and the (constant intensity) Na 1s emission from theâ′′-aluminashifts withVWR. This spectral behavior was reproducible andreversible as a function ofVWR.Figure 6B demonstrates that, under UHV conditions, elec-
tropumped Na is identical in behavior and in chemical statewith Na supplied by vacuum deposition from a Na evaporationsource. Control experiments carried out with a Pt{111} samplein the same UHV chamber indicated that the amount of Nadeposited on the catalyst film at 300 K was approximately 1015
Figure 4. Effect of NO partial pressure (PNO) on the rate of (a) CO2,(b) N2, (c) N2O production and on N2 selectivitySN2 (d) at differentcatalyst potentialsVWR. Conditions: PC3H6 ) 0.27 kPa,T ) 648 K,total flow rate,Ft ) 1.3× 10⁻⁴ mol/s.
Figure 5. Effect of catalyst potential on the apparent activation energyfor (a) CO2, (b) N2, and (c) N2O production.
Electrochemical Promotion of the Pt/Propene+ NO Reaction J. Phys. Chem. B, Vol. 101, No. 19, 19973763

cm-2 (spectrum 1). Heating to 400 K under open circuitconditions caused no change (spectrum 2). At 500 K (whentheâ′′-alumina becomes appreciably conducting) and withVWR
) +1000 mV, the vacuum-deposited Na was strongly pumpedaway from the surface (spectrum 3).The XP spectra in Figure 7 were obtained after exposing the
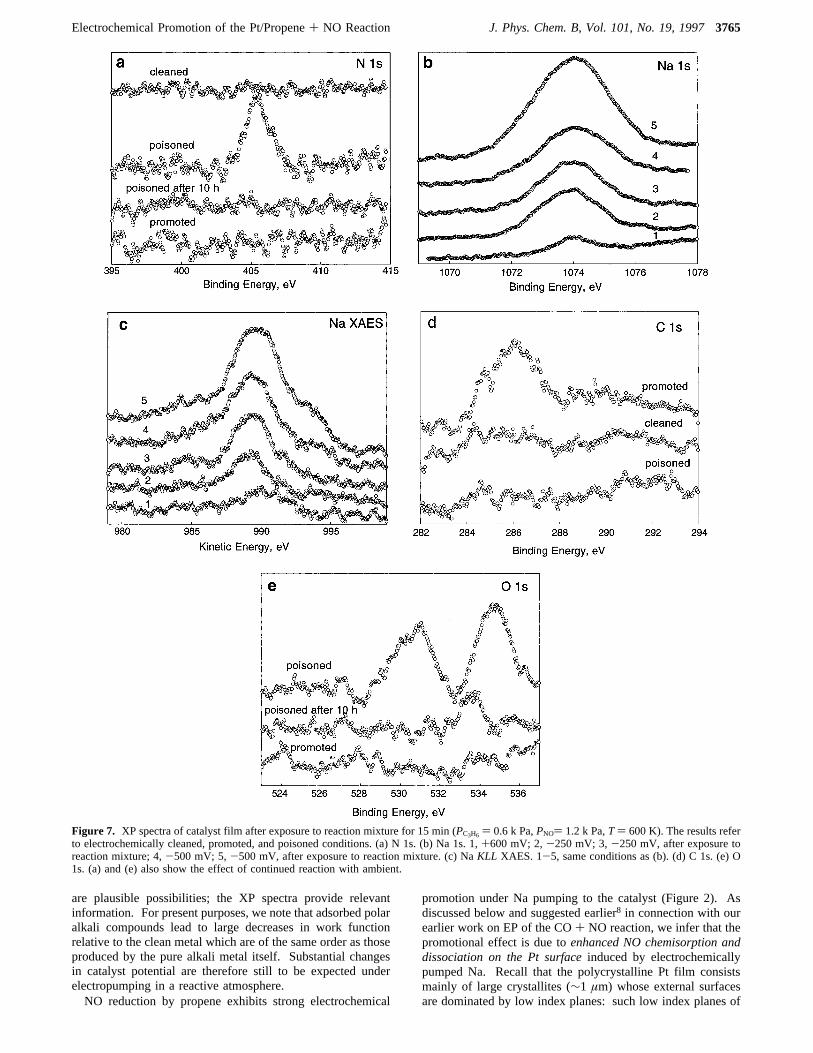
appropriately biased catalyst film to theconditions of temper-ature and reactant partial pressures typical of those encounteredin the reactor(PC3H6) 0.6 kPa,PNO ) 1.2 kPa,T ) 600 K).During exposure of the catalyst to the reaction mixture, theVWR
conditions were such that the Pt film was either (i) electro-chemically clean, (ii) promoted, or (iii) poisoned. The spectrawere acquired after a pump-down period of 2 h. The sampletemperature was lowered to 420 K before pump-down, and theimposed voltage bias (Vwc) was switched off when the sampletemperature was below 450 K, i.e., when the Na mobility waslow. It is apparent from the N 1s spectra (Figure 7A) that nodetectable N-containing species were retained on either the cleanor the promoted Pt film. However, the poisoned film shows avery significant line at 405.6 eV, which we ascribe20 to sodiumnitrite (NaNO2). Note in the figure that exposure of this surfaceto the base vacuum for 10 h at 420 K resulted in removal ofthe nitrite, presumably due to slow reaction with ambientreducing gases. Figure 7B (upper) shows corresponding (raw)Na 1s data from which it is clear that the loading of Nacompounds is highest on the poisoned surface and smallest on
the electrochemically cleaned surface, with the promoted surfacelevel lying in between. Figure 7c shows the corresponding NaKLL X-ray-excited Auger spectrasnotice that the difference inintegrated intensities between the promoted and poisoned casesis much more apparent here. It is important to note that theabsolute intensity of the Pt 4f spectrum was measurablyattenuated on both the promoted and poisoned surfaces relativeto the electrochemically cleaned case (∼6 and∼15%, respec-tively), indicating a substantially higher loading of Na surfacecompounds in the latter case. Based on our Pt{111}/Nacalibration, the estimated Na loadings of the promoted andpoisoned surfaces areg1.5× 1015 andg4.5× 1015 cm-2, i.e.,equivalent toθNa g 1 andg 3, respectively. The former valueagain implies that even in the promoted case, a substantialproportion of the Na compound(s) must be present in 3D islands,thus leaving a significant amount of uncovered (promoted) Ptsurface on which the reaction takes place. That is, one hasVolmer-Weber growth of the promoter on the metal surface:the driving force behind agglomeration comes partly from the3D Madelung energy of the polar crystals that are formed.Analogous C 1s spectra are shown in Figure 7d: carbon-
containing species are detectable only on the clean and promotedsurfaces. Finally, Figure 7e shows O 1s results. The behavioris similar to that of the N 1s spectra: the promoted surfaceshows no detectable lines; the poisoned surface shows peaks at531 and 535 eV BE, and these are quenched by 10 h exposureto the ambient vacuum at 300 K.As will be argued below, the data in Figure 7 are to varying
extents influenced by the sample handling procedure andespecially by continuing reactions that occurred during reactorpump-out and sample cool-down, prior to transfer into thespectrometer. In order to characterize the promoter/poisonphase(s), their temperature stability and their reactivity in moredetail, XP spectra were also acquired aftersequentialexposureof the sample to NO followed by propene. The results of thisapproach are illustrated in Figure 8. The spectra in Figure 8awere acquired as a function of temperature under open circuitconditions after gas pump-out. The spectra in Figure 8b,c wereacquired as a function of gas exposure at 485 K under opencircuit conditions; data were recorded at 485 K, also under opencircuit conditions, so as to avoid any voltage/temperature-assisted effects. The object of this procedure was to “freezeout” the catalyst surface in a condition that captured at leastsome aspects of its properties under actual EP reaction condi-tions. Figure 8a shows temperature-dependent effects, asfollows. NO dosing at 600 K leads to the formation of twodistinct sodium nitroxy surface compounds. The 405 eV BEis assigned to NaNO2 (as above in regard to Figure 7A); the409 eV BE is assigned to NaNO3.21 Heating to 500 K leads toa definite (∼25%) increase in intensity of the nitrite emissionwhile the nitrate emission is constant within experimental error.We attribute this to increased dispersion of the nitrite but notthe nitrate (consistent with the melting points of the bulk com-pounds: 544 and 580 K respectively). After 520 K heatingthe nitrite begins to diminish relative to the nitrate, and after530 K heating the nitrite intensity is the smaller of thetwosagain, consistent with the decomposition temperatures ofthe bulk compounds (590 and 650 K).
Discussion
As noted above, the term “Na coverage” does not imply thatthe promoter is thought to be present in the form of chemisorbedmetallic sodium, as it would be in vacuum.In the reaction mixture one expects the formation of surface
compounds of Nasin the present case, carbonate and nitrate
Figure 6. Na 1s XPS. (a) Showing effect of catalyst potential inpumping sodium to/from the Pt film under UHV conditions at 600 K.(b). Demonstrating electrochemical pumping of vacuum-deposited Naaway from the surface under UHV conditions at sufficiently hightemperature and positive catalyst potential.
3764 J. Phys. Chem. B, Vol. 101, No. 19, 1997 Yentekakis et al.
are plausible possibilities; the XP spectra provide relevantinformation. For present purposes, we note that adsorbed polaralkali compounds lead to large decreases in work functionrelative to the clean metal which are of the same order as thoseproduced by the pure alkali metal itself. Substantial changesin catalyst potential are therefore still to be expected underelectropumping in a reactive atmosphere.NO reduction by propene exhibits strong electrochemical
promotion under Na pumping to the catalyst (Figure 2). Asdiscussed below and suggested earlier8 in connection with ourearlier work on EP of the CO+ NO reaction, we infer that thepromotional effect is due toenhanced NO chemisorption anddissociation on the Pt surfaceinduced by electrochemicallypumped Na. Recall that the polycrystalline Pt film consistsmainly of large crystallites (∼1 µm) whose external surfacesare dominated by low index planes: such low index planes of
Figure 7. XP spectra of catalyst film after exposure to reaction mixture for 15 min (PC3H6 ) 0.6 k Pa,PNO) 1.2 k Pa,T) 600 K). The results referto electrochemically cleaned, promoted, and poisoned conditions. (a) N 1s. (b) Na 1s. 1,+600 mV; 2,-250 mV; 3,-250 mV, after exposure toreaction mixture; 4,-500 mV; 5,-500 mV, after exposure to reaction mixture. (c) NaKLL XAES. 1-5, same conditions as (b). (d) C 1s. (e) O1s. (a) and (e) also show the effect of continued reaction with ambient.
Electrochemical Promotion of the Pt/Propene+ NO Reaction J. Phys. Chem. B, Vol. 101, No. 19, 19973765

Pt are known to be relatively ineffective for NO dissociation.22
Na-induced NO dissociation produces the Oa species which arethen responsible for initiating the ensuing oxidation reactionsof adsorbed propene and propene fragments. The maximumgains in rate over the clean surface rates are of the order offactors of 13 and 25 for N2 and CO2 production, respectively(Figures 3 and 4). In the region of strong electrochemical
promotion (0 to-350 mV), the activity toward formation ofall products shows an exponential increase with (decreasing)catalyst potential, as predicted by the model of Vayenas.1,3
Eventually, at around-350 mV, there is a precipitous fall inrates as the amount of Na species increases beyond a criticalvalue; i.e., the regime of electrochemical promotion is followedby a regime of strong poisoning. This poisoning behavior isdiscussed below.The dependence of activity and selectivity on catalyst
potential may be rationalized by considering the effects of theNa promoter species on the surface chemistry of propene andNO. At high positiveVWR the Pt surface is free of sodium andcovered mainly with propene: the relative strengths of propeneand NO chemisorption on Pt are apparent from Figures 3 and4. We postulate that the low clean surface residual rate is dueto dissociation of NO at defect sites; as noted above, we takethe view that NOa f Na + Oa is the reaction-initiating step.As the catalyst potential is decreased toward negativeVWR
values (pumping Na to the Pt), the electronic effect of thesodium promoter strengthens the Pt-N bond (increasing NOcoverage) and weakens the N-O bond (facilitating NO dis-sociation). The dissociation of chemisorbed diatomic moleculesin the field of coadsorbed cations has been discussed in detailby Langet al.23 More recently, the Na-induced dissociation ofNO on Pt{111} has been demonstrated directly.24 Thus, theeffect of the promoter is to activate previously inactive crystalplanes on the catalyst surface toward NO dissociation. Thiseffect increases progressively with the amount of Na pumped,and the exponential dependence of rate onVWR in the promotedregime suggests that changes in catalyst work function areindeed strongly correlated with the dramatically increasedactivity.1 In addition, Na pumping also enhances the selectivitytoward N2 formation from 60 to 80% (Figure 2). This quantityis determined by the competition between the followingreactions that occur on the Pt surface.
The observed increase in selectivity is a consequence of theNa-induced decrease and increase, respectively, in the amountsof molecularly adsorbed NO and atomic N on the surface, thusfavoring the first reaction over the second. Qualitatively similareffects onSN2 have been found for the electrochemicallypromoted reduction of NO by CO8 and by H26 with the samecatalyst system.The systematic effect ofVWR on the reaction kinetics (Figures
3 and 4) is also understandable in terms of the effects of theNa promoter. For the range ofVWR values investigated inFigures 3 and 4 (clean surface, promoted, and further promoted),EP by Na leads to activity enhancement under all conditions ofpartial pressure. This is consistent with the arguments developedabove. The systematic shift ofP*C3H6 to higher propene partialpressures (Figure 3) as the sodium coverage is increased reflectsan increase in chemisorption bond strength of NO relative topropene with increasing Na coverage. Such behavior is exactlywhat one would expect in the case of an electropositivepromoter: the chemisorption strength of electron donors (pro-pene) should be decreased, whereas the chemisorption ofelectron acceptors (NO and its dissociation products) shouldbe enhanced.The systematic increase in activation energies with increasing
Na loading deserves some comment. In our earlier EP studiesof the CO+ O2
5 and CO+ NO8 reactions over Pt/â′′-alumina,a pronounced step increase inEa was observed as the amount
Figure 8. N 1s spectra (open circuit) after exposure to NO at 600 Kand-500 mV, showing the effect of (a) temperature: 1, clean, 600 K;2, 470 K; 3, 485 K; 4, 510 K; 5, 530 K; 6, 560 K. (b) differentialreactivity of nitrate and nitrite species toward propene dosed at 485 K:1, as 6 in (a); 2, 103 langmuirs; 3, 6× 10³ langmuirs; 4, 3× 10⁶
langmuirs; (c) O1s spectra corresponding to (b).
Na + Na f N2
Na + NOa f N2O (5)
3766 J. Phys. Chem. B, Vol. 101, No. 19, 1997 Yentekakis et al.
of Na increased. There is persuasive evidence5 that this stepchange is associated with a surface phase transitionstheformation or disruption of islands of CO. Although CO hasbeen detected as a surface intermediate in the Pt-catalyzedoxidation of ethylene,13 one may speculate that the absence ofa step change in the present case is not unexpected, given thegreater chemical complexity of the adsorbed phase. It ispossible that the systematically increasingEa values are at leastpartly associated with Na-induced increase in chemisorptionstrength of the three electron-withdrawing adsorbates (Na, Oa,NOa), though the complexity of the system precludes detailedanalysis. The increase inEas is accompanied by large increasesin the preexponential factors (thus giving the net rate accelera-tion) which may plausibly be associated at least in part with anincreased density of sites for NO dissociation due to the presenceof Na.The strong poisoning behavior observed at high Na loadings
is understandable in terms of the XPS results (see below) whichindicate the presence of large amounts of Na compounds at verynegative catalyst potentials. In other words, coverage of activePt sites by overloading with promoter is a likely major causeof poisoning. Additionally, as noted above, the chemisorptionbonds of propene and oxygen should be respectively weakenedand strengthened by an electropositive promoter. Therefore,at high levels of Na the coverage of propene should be markedlyattenuated, while the activation energy for reactions involvingOa could be increased.The central assumption underlying all of the preceding
discussion is that, under EP conditions, reversible changes inVWR correspond to the reversible pumping of Na to/from the Ptfrom/to the solid electrolyte. Our XPS data (Figure 6a) clearlydemonstrate that such reversible transport of Na betweenâ′′-alumina and the gas-exposed surface of the Pt film does indeedoccur under the conditions of voltage and temperature that wereused for the reactor studies. This is an important observationthat substantiates our view of the mode of action of the EPsystem. Additionally, the identical electrotransport propertiesand electron binding energies exhibited by vacuum depositedNa and by electropumped Na in vacuum clearly establish thatthese are the same chemical species. This is an important pointand should help to clarify apparent misunderstandings thatsometimes arise about the chemical nature of alkali promoterson metal catalyst surfaces. The mode of delivery of pure Nato the Pt surface is irrelevant: in vacuum it is present as anadatom that has undergone significant charge transfer to the(in this case) Pt surface, Naδ+/Ptδ-. The presence of a reactivegas atmosphere converts this Na into surface compound(s)whose composition and degree of dispersion depend on thetemperature and the composition of the gas phase, as discussedbelow. We have found that these surface compounds can alsobe electrochemically destroyed by pumping Na away from thePt film.The XPS results reveal the identity of the principal surface
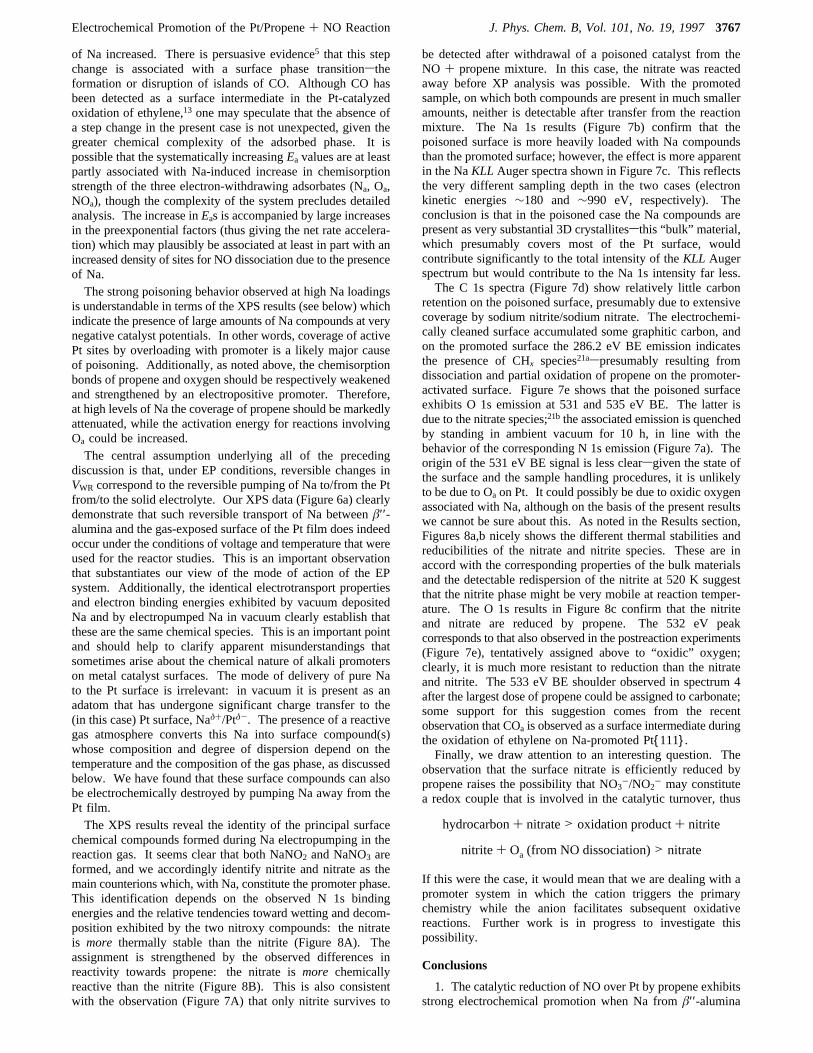
chemical compounds formed during Na electropumping in thereaction gas. It seems clear that both NaNO2 and NaNO3 areformed, and we accordingly identify nitrite and nitrate as themain counterions which, with Na, constitute the promoter phase.This identification depends on the observed N 1s bindingenergies and the relative tendencies toward wetting and decom-position exhibited by the two nitroxy compounds: the nitrateis more thermally stable than the nitrite (Figure 8A). Theassignment is strengthened by the observed differences inreactivity towards propene: the nitrate ismore chemicallyreactive than the nitrite (Figure 8B). This is also consistentwith the observation (Figure 7A) that only nitrite survives to
be detected after withdrawal of a poisoned catalyst from theNO + propene mixture. In this case, the nitrate was reactedaway before XP analysis was possible. With the promotedsample, on which both compounds are present in much smalleramounts, neither is detectable after transfer from the reactionmixture. The Na 1s results (Figure 7b) confirm that thepoisoned surface is more heavily loaded with Na compoundsthan the promoted surface; however, the effect is more apparentin the NaKLL Auger spectra shown in Figure 7c. This reflectsthe very different sampling depth in the two cases (electronkinetic energies∼180 and ∼990 eV, respectively). Theconclusion is that in the poisoned case the Na compounds arepresent as very substantial 3D crystallitessthis “bulk” material,which presumably covers most of the Pt surface, wouldcontribute significantly to the total intensity of theKLL Augerspectrum but would contribute to the Na 1s intensity far less.The C 1s spectra (Figure 7d) show relatively little carbon
retention on the poisoned surface, presumably due to extensivecoverage by sodium nitrite/sodium nitrate. The electrochemi-cally cleaned surface accumulated some graphitic carbon, andon the promoted surface the 286.2 eV BE emission indicatesthe presence of CHx species21aspresumably resulting fromdissociation and partial oxidation of propene on the promoter-activated surface. Figure 7e shows that the poisoned surfaceexhibits O 1s emission at 531 and 535 eV BE. The latter isdue to the nitrate species;21b the associated emission is quenchedby standing in ambient vacuum for 10 h, in line with thebehavior of the corresponding N 1s emission (Figure 7a). Theorigin of the 531 eV BE signal is less clearsgiven the state ofthe surface and the sample handling procedures, it is unlikelyto be due to Oa on Pt. It could possibly be due to oxidic oxygenassociated with Na, although on the basis of the present resultswe cannot be sure about this. As noted in the Results section,Figures 8a,b nicely shows the different thermal stabilities andreducibilities of the nitrate and nitrite species. These are inaccord with the corresponding properties of the bulk materialsand the detectable redispersion of the nitrite at 520 K suggestthat the nitrite phase might be very mobile at reaction temper-ature. The O 1s results in Figure 8c confirm that the nitriteand nitrate are reduced by propene. The 532 eV peakcorresponds to that also observed in the postreaction experiments(Figure 7e), tentatively assigned above to “oxidic” oxygen;clearly, it is much more resistant to reduction than the nitrateand nitrite. The 533 eV BE shoulder observed in spectrum 4after the largest dose of propene could be assigned to carbonate;some support for this suggestion comes from the recentobservation that COa is observed as a surface intermediate duringthe oxidation of ethylene on Na-promoted Pt{111}.Finally, we draw attention to an interesting question. The
observation that the surface nitrate is efficiently reduced bypropene raises the possibility that NO3-/NO2
- may constitutea redox couple that is involved in the catalytic turnover, thus
If this were the case, it would mean that we are dealing with apromoter system in which the cation triggers the primarychemistry while the anion facilitates subsequent oxidativereactions. Further work is in progress to investigate thispossibility.
Conclusions
1. The catalytic reduction of NO over Pt by propene exhibitsstrong electrochemical promotion when Na fromâ′′-alumina
hydrocarbon+ nitrate> oxidation product+ nitrite
nitrite+ Oa (from NO dissociation)> nitrate
Electrochemical Promotion of the Pt/Propene+ NO Reaction J. Phys. Chem. B, Vol. 101, No. 19, 19973767
is pumped to the catalyst surface. The effects are reversiblewith catalyst potential and rate gains of about an order ofmagnitude over the clean surface rates can be achieved. Atsufficiently high Na loadings the reaction is poisoned.2. All the data are consistent with Na-induced NO dissocia-
tion being the critical reaction-initiating step.3. The selectivity toward N2 formationVersusN2O produc-
tion always increases with decreasing catalyst potential (increas-ing Na coverage): this is understandable in terms of point 2.4. XPS data confirm that the mode of operation of the
electrochemically promoted Pt film does indeed involve revers-ible pumping of Na to or from Pt from or to the solid electrolyte.Under UHV conditions, this electropumped Na is indistinguish-able from Na put down by vacuum deposition.5. Under reaction conditions the Na promoter is present
mainly as a mixture of nitrate and nitrite; it is possible that someform of sodium oxide is also present. The nitrate is thermallymore stable but also more easily reduced than the nitrite. Theloading of promoter compounds is relatively low under pro-moted conditions and much higher under poisoned conditions.A substantial fraction of the Na compounds is present as 3Dcrystallites under all reaction conditions.
Acknowledgment. A.P. holds a Postdoctoral External Fel-lowship, CONICET. A.P. and R.M.L. acknowledge support bythe British Council and Fundacio´n Antorchas. Financial supportfrom the UK Engineering and Physical Sciences ResearchCouncil under Grant GR/K45562 is gratefully acknowledged.
References and Notes
(1) Vayenas, C. G.; Bebelis, S.; Yentekakis, I. V.; Lintz, H.-G.Catal.Today1992, 11 (3), 303.
(2) Pliangos, C.; Yentekakis, I. V. ; Verykios, X.; Vayenas, C. G.J.Catal. 1995, 154, 124.
(3) Bebelis, S.; Vayenas, C. G.J. Catal.1989, 118, 125.(4) Yentekakis, I. V.; Bebelis, S.J. Catal.1992, 137, 278.(5) Yentekakis, I. V.; Moggridge, G. D.; Vayenas, C. G.; Lambert, R.
M. J. Catal.1994, 146, 292.(6) Marina, O. A.; Yentekakis, I. V.; Vayenas, C. G.; Palermo, A.;
Lambert, R. M.J. Catal., in press.(7) Lambert, R. M.; Tikhov, M.; Palermo, A.; Yentekakis, I. V.;
Vayenas, C. G.Ionics1995, 5, 366.(8) Palermo, A.; Lambert, R. M.; Harkness, I. R.; Yentekakis, I. V.;
Marina, O.; Vayenas, C. G.J. Catal.1996, 161, 471(9) Yentekakis, I. V.; Vayenas, C. G.J. Catal.1994, 149, 238.(10) Politova, T. I.; Sobyanin, V. A.; Belyaev,V. D.React. Kinet. Catal.
Lett. 1990, 41, 321.(11) Taylor, K. C.Catal. ReV.sSci. Eng.1993, 35, 457.(12) Yentekakis, I. V.; Neophytides, S.; Vayenas, C. G.J. Catal.1988,
111, 152.(13) Harkness, I. R.; Hardacre, C.; Lambert, R. M.; Yentekakis, I. V.;
Vayenas, C. G.J. Catal.1996, 160, 19.(14) Harkness, I. R.; Lambert, R. M.J. Catal.1995, 152, 211.(15) Vayenas, C. G.; Bebelis, S.; Despotopoulou, M.J. Catal. 1991,
128, 415.(16) Vayenas, C. G.; Bebelis, S.; Ladas, S.Nature1990, 343, 625.(17) Bonzel, H. P.; Pirug, G.; Ritke, C.Langmuir1991, 7, 3006.(18) Cavalca, C.; Larsen, G.; Vayenas, C. G.; Haller, G. L.J. Phys.Chem.
1993, 97, 6115.(19) Ladas, S.; Kennou, S.; Bebelis, S.; Vayenas, C. G.J. Phys.Chem.
1993, 97, 8845.(20) (a) Folkesson, B.Acta Chem. Scand.1973, 27, 287. (b) Fuggle, F.
G.; Menzel, D.Surf. Sci.1984, 79, 1. (c) Kiskinova, M.; Pirug, G.; Bonzel,H. P.Surf. Sci.1983, 140, 1.
(21) (a) Siegban, K.; Nordling, C.; Fahlman, A.; Nordberg, R.; Hamrin,K.; Hedman, J.; Johansson, G.; Bergmark, T.; Karlsson, S.-E.; Lindgren,I.; Lindberg, B.ESCA-atomic, molecular and solid state structure studiesby means of electron spectroscopy;Nova Acta Regiae Societatis ScientariumUpsaliensis, ser. IV, 1967; Vol. 20. (b) Allen, H. C.; Laux, J. M.; Vogt, R.;Finlayson-Pitts, B. J.; Hemminger, J. C.J. Phys. Chem.1996, 100, 6371.
(22) Masel, R. I.Catal. ReV.sSci. Eng. 1986, 28 (2,3), 335.(23) Lang, N. D.; Holloway, S.; Norskov, J. K.Surf. Sci.1985, 150,
24.(24) Harkness, I. R.; Lambert, R. M.J. Chem. Soc., Faraday Trans.,in
press.
3768 J. Phys. Chem. B, Vol. 101, No. 19, 1997 Yentekakis et al.