In situ imaging of organic sulfur in 700–800 My-old Neoproterozoic microfossils using X-ray...
15
In situ imaging of organic sulfur in 700–800 My-old Neoproterozoic microfossils using X-ray spectromicroscopy at the S K-edge Laurence Lemelle a,b , Philippe Labrot c , Murielle Salome ´ d , Alexandre Simionovici e , Michel Viso f , Frances Westall c, * a Universite ´ de Lyon, Ecole Normale Supe ´rieure de Lyon, France b CNRS, UMR5570, USR3010, France c Centre de Biophysique Mole ´culaire, CNRS, Rue Charles Sadron, 45071 Orle ´ans Cedex 2, France d ID21 Beamline, European Synchrotron Radiation Facility (ESRF), 6 rue J. Horowitz, BP 220, 38043 Grenoble Cedex, France e LGIT, Observatoire des Sciences de l’Univers de Grenoble, BP 53, 38041 Grenoble Cedex, France f CNES, 2 place Maurice-Quentin, 75039 Paris Cedex 01, France Received 26 March 2007; received in revised form 26 September 2007; accepted 30 October 2007 Available online 21 November 2007 Abstract The study of very ancient microfossils has recently raised contentious issues regarding interpretation of the biogenicity of the structures. In situ investigation of certain elements such as sulfur within potential microfossils is a powerful com- plement to other methods of investigation that can provide valuable information on biogenicity. We present here a first such study on Precambrian microfossils from the 700–800-My-old Neoproterozoic Draken Formation, Svalbard, using scanning X-ray microscopy (SXM) in the fluorescence mode and X-ray absorption near edge spectroscopy (XANES) at the sulfur K-edge. SXM allowed mapping of up to 300 ppm of probably endogenous sulfur within the kerogenous walls of Myxococcoides chlorelloidea microfossils. XANES showed that the sulfur is most likely contained in heterocyclic organic compounds, such as thiophene(s). Ó 2007 Elsevier Ltd. All rights reserved. 1. Introduction The identification and study of microfossils in Precambrian sedimentary rocks is still challenging, despite its importance in the resolution of critical scientific issues such as reliably establishing the appearance of life on Earth and the onset of differ- ent biogeochemical cycles. One of the major difficul- ties results from the very small size of the structures (lm to sub-lm) and the difficulty in correlating the morphological and biochemical characteristics of such minute fossils (Buick, 1990; Schopf, 1993; Bra- sier et al., 2002; Schopf et al., 2002). Since it is prin- cipally the wall or sheath of the microorganism that is preserved (Knoll, 1982; Westall, 1997), only a very tiny fraction of the chemical information pres- ent in the original cell has the potential of being partly transformed into kerogen during diagenesis. 0146-6380/$ - see front matter Ó 2007 Elsevier Ltd. All rights reserved. doi:10.1016/j.orggeochem.2007.10.008 * Corresponding author. Tel.: +33 (0)2 38 25 79 12; fax: +33 (0)2 38 63 15 17. E-mail address: [email protected] (F. Westall). Available online at www.sciencedirect.com Organic Geochemistry 39 (2008) 188–202 www.elsevier.com/locate/orggeochem Organic Geochemistry
-
Upload
independent -
Category
Documents
-
view
3 -
download
0
Transcript of In situ imaging of organic sulfur in 700–800 My-old Neoproterozoic microfossils using X-ray...
In situ imaging of organic sulfur in 700–800 My-oldNeoproterozoic microfossils using X-ray spectromicroscopy
at the S K-edge
Laurence Lemelle a,b, Philippe Labrot c, Murielle Salome d, Alexandre Simionovici e,Michel Viso f, Frances Westall c,*
a Universite de Lyon, Ecole Normale Superieure de Lyon, Franceb CNRS, UMR5570, USR3010, France
c Centre de Biophysique Moleculaire, CNRS, Rue Charles Sadron, 45071 Orleans Cedex 2, Franced ID21 Beamline, European Synchrotron Radiation Facility (ESRF), 6 rue J. Horowitz, BP 220, 38043 Grenoble Cedex, France
e LGIT, Observatoire des Sciences de l’Univers de Grenoble, BP 53, 38041 Grenoble Cedex, Francef CNES, 2 place Maurice-Quentin, 75039 Paris Cedex 01, France
Received 26 March 2007; received in revised form 26 September 2007; accepted 30 October 2007Available online 21 November 2007
Abstract
The study of very ancient microfossils has recently raised contentious issues regarding interpretation of the biogenicityof the structures. In situ investigation of certain elements such as sulfur within potential microfossils is a powerful com-plement to other methods of investigation that can provide valuable information on biogenicity. We present here a firstsuch study on Precambrian microfossils from the 700–800-My-old Neoproterozoic Draken Formation, Svalbard, usingscanning X-ray microscopy (SXM) in the fluorescence mode and X-ray absorption near edge spectroscopy (XANES) atthe sulfur K-edge. SXM allowed mapping of up to 300 ppm of probably endogenous sulfur within the kerogenous wallsof Myxococcoides chlorelloidea microfossils. XANES showed that the sulfur is most likely contained in heterocyclicorganic compounds, such as thiophene(s).� 2007 Elsevier Ltd. All rights reserved.
1. Introduction
The identification and study of microfossils inPrecambrian sedimentary rocks is still challenging,despite its importance in the resolution of criticalscientific issues such as reliably establishing theappearance of life on Earth and the onset of differ-
ent biogeochemical cycles. One of the major difficul-ties results from the very small size of the structures(lm to sub-lm) and the difficulty in correlating themorphological and biochemical characteristics ofsuch minute fossils (Buick, 1990; Schopf, 1993; Bra-sier et al., 2002; Schopf et al., 2002). Since it is prin-cipally the wall or sheath of the microorganism thatis preserved (Knoll, 1982; Westall, 1997), only avery tiny fraction of the chemical information pres-ent in the original cell has the potential of beingpartly transformed into kerogen during diagenesis.
0146-6380/$ - see front matter � 2007 Elsevier Ltd. All rights reserved.doi:10.1016/j.orggeochem.2007.10.008
* Corresponding author. Tel.: +33 (0)2 38 25 79 12; fax: +33(0)2 38 63 15 17.
E-mail address: [email protected] (F. Westall).
Available online at www.sciencedirect.com
Organic Geochemistry 39 (2008) 188–202
www.elsevier.com/locate/orggeochem
OrganicGeochemistry

Whereas whole rock analysis of Precambrian rocksprovides bulk information on the totality of the car-bonaceous material in a sample, including the allo-chthonous and reworked organic fractions, in situanalysis at the micron scale is required to obtainspecific information on a given microfossil and todetect any elemental, molecular or isotopic differ-ences in the microfossil population.
Over the last few years, significant advances havebeen made in obtaining in situ carbon data on indi-vidual Precambrian fossilized cells, for example,micro-isotopic measurements made on the walls oflarge microfossils with an ion microprobe (Houseet al., 2000), lm -scale carbon mapping with an elec-tron microprobe (Boyce et al., 2001), as well asin situ organic analysis with laser micropyrolysisgas chromatography–mass spectrometry (GC–MS;Arouri et al., 2000), laser Raman microspectroscopy(Arouri et al., 2000; Schopf et al., 2002), Fouriertransform infrared spectroscopy (FTIR; Marshallet al., 2005) and C-XANES (X-ray near edge spec-troscopy of carbon). C-XANES has already beensuccessfully used in the analysis and imaging of fos-sil material such as permineralized plant fossils ofDevonian age (Boyce et al., 2002) or coal (Codyet al., 1996). In this study, we show that thein situ characterisation of sulfur using XANES atthe K-edge can lead to novel and complementaryresults. S K-edge XANES was first shown to bean efficient probe for S-containing metabolites inintact biological systems on human blood (Picker-ing et al., 1998; Rompel et al., 1998).
Compared to carbon, little in situ work on sulfurat the micron scale has been done, although sulfur isthe fifth most abundant element in planktonic cellsand the third most abundant in sedimentary organicmatter (OM; Tissot and Welte, 1984). Whereas liv-ing biomass generally contains between 0.5% and1.5% sulfur, kerogen derived from marine OMmay contain up to 10% owing to the adsorption ofallochthonous S to the kerogen (Summons, 1993).The important role of sulfur in the formation andpreservation of fossil sulfur-rich OM was estab-lished on the basis of analysis of organic extractsfrom whole rocks (Durand and Monin, 1980; Whe-lan and Thompson-Rizer, 1993). By forming inter-molecular sulfur bonding (single, double orpolysulfide links) and sequestering organic materialinside a macromolecular network, sulfur stabilizeslabile compounds such as lipids, thereby prolongingtheir lifetime in the geological record (e.g., Kohnenet al., 1990). Advances in macroscopic S L-edge
XANES and, to a lesser extent, S K-edge XANESmethods offer a way of directly investigating theorganically bound and inorganic sulfur forms incomplex fossilized organic material. These methodshave been applied to describe maturation vs. S spe-ciation in sulfur-rich kerogen, asphaltenes, petro-leum, coals and oil shales (see Fleet, 2005;Kelemen et al., 2007 for a review of applications).In particular, S K-edge XANES studies (Sarretet al., 1999) showed that, with increasing alteration,the proportion of disulfide and sulfide speciesdecreases in asphaltene, whereas that of the mostoxidized sulfur species increases. They also demon-strated that, regardless of kerogen type, the ratioof aliphatic to total organic sulfur decreased con-comittantly with aromatic carbon as the level ofmaturity increased (Kelemen et al., 2007). In gen-eral, the intimate coexistence of minute amountsof organic, and major amounts of inorganic, sulfurspecies dispersed in the mineral matrix (Whelan andThompson-Rizer, 1993; Acholla and Orr, 1993)implies that in situ studies, at a sub-micron scale,are even more critical for sulfur than for carbon.A few studies using in situ elemental imaging of sul-fur have been performed on 100 lm sized, well pre-served permineralized wood cells using an electronmicroprobe (Boyce et al., 2001). The correlationbetween the elementary C and S maps suggestedthat sulfur had been incorporated into organic com-pounds and it was proposed that the in situ S/Cratio could provide an indication of the types of cellwall compounds originally present in the living cell(Boyce et al., 2001). A first attempt at in situ ele-mental imaging of Precambrian cells was also madeusing secondary ion mass spectrometry (nano-SIMS), showing uncorrelated C, N and S distribu-tions (Oehler et al., 2006). The in situ determinationof the amount and speciation of sulfur on anorganic-walled microfossil therefore appears to bea promising approach for obtaining informationabout the state of preservation of its residual OMand about the original cell wall compounds.
In this study, our goal was to detect and quanti-tatively characterise the sulfur distribution and spe-ciation, if any, in the carbonaceous wall ofindividual Precambrian microfossils (Myxococco-
ides chlorelloidea) from the 700–800 My-old DrakenFormation on Spitzbergen. Given the small amountof S and the micron-scale thickness of the microbialwalls, one of the most promising techniques forachieving this goal is the combination of in situ X-ray fluorescence microscopy with X-ray absorption
L. Lemelle et al. / Organic Geochemistry 39 (2008) 188–202 189

near edge spectroscopy (XANES) at the sulfur K-edge using a micro-focussed synchrotron X-raybeam (Susini et al., 2002; Prietzel et al., 2003). Qual-itative scanning X-ray microscopy (SXM) has beenapplied to search for S bound to organic molecules(thiol and alkyl monosulfide) in recent, single pro-karyotic cells (Lemelle et al., 2003). In that study,an Escherichia coli cell was imaged as a micron-sizedrod containing more phosphorus than S, with aXANES spectrum characterized by a strong peakattributed to the absorption edge of an aminoacid-linked S species. The same technique permittedimaging of the distribution of structures interpretedas probable terrestrial microorganisms that contam-inated the surface of the Tatahouine meteorite(Lemelle et al., 2004). Using the same methodology,amino acids were detected in SiO2 filaments fromfossil hydrothermal chimneys a few thousand yearsold (Foriel et al., 2004). Our SXM study at theS K-edge of 700–800 My-old microfossils differsfrom earlier studies in that the refractory macromo-lecular organic complex has undergone diagenesisand hundreds of millions of years of post-diageneticalteration, processes inducing critical changes in themineral and organic phases that are eventuallyresponsible for the difficulties in the recognition ofvery ancient and/or metamorphosed Precambrianmicrofossils (Buick, 1990).
2. Materials and methods
2.1. Sample and preparation
2.1.1. Draken Formation microfossils
The microfossils come from the well character-ized 700–800 My-old Draken Formation on Spits-bergen, a conglomerate formed in a tropical tidalflat/lagoonal setting (Knoll, 1982; Knoll et al.,1991). The mainly dolomitic conglomerate containssiliceous clasts formed in situ within the sediment.The formation contains some 28 different speciesof microfossils (Knoll, 1982; Knoll et al., 1991),representing both components of local microbialmats as well as allochthonous photosynthetic plank-tonic cells washed into the depositional area. Wechose the vesicle-like microfossil Myxococcoides,described by Knoll (1982) and Knoll et al. (1991)as probably belonging to a planktonic photosyn-thetic species of unidentified affinity (either prokary-otic cyanobacterial or eukaryotic algal). These wellpreserved microfossils occur either isolated or ingroups in both the silicified microbial mats and
the dolomicrite clasts. The ca. 20 lm diameter cellswe studied occur in redeposited cherty clasts in theconglomerate (Figs. 1A, 2A and 4A) and are char-acterized by a conspicuous, 1–2 lm thick, darkbrown wall in light microscope thin section observa-tion. Occasionally, they contain round internal ves-icles and sometimes an eccentric internal wrinkledbleb. Small pyrite crystals (many having a framboi-dal habit) are associated with the microfossils in thesilicified clasts. The carbon isotope signal of �28‰is typical for photosynthetic fractionation, whereasthe sulfur isotopes, measured on the associated pyr-ite crystals, reflect sulfate reduction (Knoll, 2003).
2.1.2. Petrological section preparation
A set of polished, 30 lm thick sections were pre-pared from the fossiliferous conglomerate. Sectionscontaining silicified clasts, which contain the bestpreserved microstructures, were studied. Pre-selec-tion of the microfossils was made with a petro-graphic microscope (transmitted and reflectedlight, Olympus BX51) and the selected microfossilswere carefully characterized using optical micros-copy. Two clasts containing microfossils identifiedas Myxococcoides chlorelloidea by Knoll (1982)and Knoll et al. (1991) were selected for study. Acircle was engraved around each microfossil on thesurface of the polished sections for location pur-poses, using a special objective equipped with a dia-mond tip (Leica M25). The sections were gentlyetched in S-free HF (1%, 40 min) to remove a fewtens of nm of the surface, as well as laboratory sur-face contaminants. The etched sections were care-fully washed with ultra-pure water in multiplebaths for 5 h and finally dried in a vacuum chamber.Non-etched thin sections were also analyzed to ver-ify that the etching did not introduce artifacts orcontaminate the fossil OM. The presence of organiccarbon in Myxococcoides chlorelloidea cells (exhibit-ing a brownish color in light microscopy) was con-firmed using micro-Raman spectrometry and EDXwith a scanning electronic microscope (SEM; Lab-rot, 2006). To aid location and detect surface con-tamination, the selected microfossils were scannedwith an atomic force microscope (Nanoscope IIIa,D3100 Digital Instruments). A part of the fossilifer-ous thin section was Pt coated and imaged usingSEMs equipped with an energy dispersive X-rayspectrometer (Hitachi S4200/S4500 FEG-SEM atthe University of Orleans and ZEISS DSM 982Gemini at the Faculty of Medicine, University ofTours). A 1 cm2 section of the petrographical
190 L. Lemelle et al. / Organic Geochemistry 39 (2008) 188–202
section enclosing the microfossils was cut from thenon-Pt coated portions of the fossiliferous thin sec-tions for focussed ion beam sectioning (FIB).
2.1.3. FIB section preparation
A section normal to the cell wall of a Myxococco-
ides chlorelloidea was made with a 20 keV Ga Phi-lips FIB 200 TEM instrument at the CentrePluridisciplinaire de Microscopie Electronique etde Microanalyse at the University of Marseille.The thin sections were coated with a thin layer ofAu (4 nm) to permit secondary electron imagingand to avoid charging at the surface caused by theion beam. The microfossils were located using the
circles made with the diamond tip and the AFMimages. A 1 lm Pt layer was deposited on top ofthe section surface in order to protect it from Ga+
sputtering damage. The sectioning process by sput-tering was monitored using secondary electronimaging. The 100 nm ultra-thin section was depos-ited on to a carbon film-coated, 3 mm diameterCu-TEM grid using a micromanipulator.
2.2. Analytical procedure
2.2.1. SXM set-up
With a 2–7 keV energy range, the ID21 scanningX-ray microscope (SXM) of the European Synchro-
Fig. 1. Cluster of Myxococcoides in 700–800 My-old Draken conglomerate from Svalbard. (A) Optical microscope image in transmittedlight of a cluster truncated at the surface of the thin section. The main cell (I) located in the centre of the image, 23.5 lm in diameter, isMyxococcoides chlorelloidea (Knoll, 1982; Knoll et al., 1991). The organic wall has been disrupted by a vein filled with secondary quartz.This cell has an internal vesicle and is flanked by other cells, II–IV; scale bar 10 lm. (B) Fluorescence map obtained at 2.5 keV of Sidistribution showing depletion corresponding to the carbon rich wall of microfossil (I); scale bar 5 lm. (C) Fluorescence map obtained at7.2 keV, integration time 3 s per pixel, showing distribution of Fe, located only in pyrite crystals (white arrows); scale bar 5 lm.(D) Fluorescence map obtained at 2.5 keV, integration time 3 s per pixel, showing distribution of S in both pyrite crystal and organic wallof microfossils I–IV. White arrow indicates lower pyrite crystal in image C. Black cross indicates area selected for S K-edge micro-XANESanalysis; scale bar 5 lm.
L. Lemelle et al. / Organic Geochemistry 39 (2008) 188–202 191

tron Radiation Facility (ESRF) in Grenoble (Susiniet al., 2002) is a unique tool for microspectroscopyat the sulfur K-edge, attaining high spatial (0.5 lm)and spectral (0.25 eV) resolution. It was operated ataround 2472 eV, close to the sulfur K-edge. The har-monics rejection was ensured by a set of two parallelsilicon mirrors deflecting in the horizontal plane withan incident angle of 8 mrad. The energy scan was per-formed with a fixed exit, double crystal Si(1 11)monochromator providing a spectral resolution of0.25 eV in this configuration. A tantalum Fresnelzone plate lens was used for focussing, demagnifyingthe X-ray source to generate a 0.5 � 0.3 lm spot (hor-izontal � vertical) with a photon flux of 4 � 108 pho-ton s�1. Microfluorescence maps were also obtainedat the Fe K-edge at around 7112 eV with a compara-ble set up.
The sample was positioned at an angle of 60� (90�between beam and fluorescence detector axis) with
respect to the incoming beam. It was mounted ona mechanical sample stage combining a steppermotor equipped stage (10 � 10 mm2) for coarsesample positioning and a piezoelectric stage(100 � 100 lm2) for accurate scanning of theselected area. The selected clasts in the 30 lm thickpetrographical sections were centered in the hole ofa high purity plastic sample holder (Peek, free of Feand S traces). The FIB cuts mounted on TEM gridswere held between 4 lm thick Ultralene foils. Pre-alignment of every sample was ensured using thelight video-microscope located inside the X-raymicroscope chamber.
2.2.2. Fluorescence imaging and XANES at the ID21
beamline
Elemental composition maps were obtained byraster scanning of the sample in order to acquire atwo-dimensional (2D) image point-by-point. The
Fig. 2. Myxococcoides chlorelloidea cell in Draken conglomerate. (A) Optical microscope image in transmitted light of a 24 lmMyxococcoides chlorelloidea cell (white arrow). Note the black pyrite crystals associated with organic wall and in adjacent matrix, as wellas interruption of wall in the bottom; scale bar 20 lm. (B) Same fossil (white arrow) in reflected light showing position of two pyritecrystals (I and II, black arrows); scale bar 20 lm. (C) AFM image in contact mode of cell in (A) exposed at upper surface of polished thinsection. Black arrow points to pyrite crystal II; scale bar 5 lm. (D) Fluorescence map obtained at 7.2 keV, integration time 4 s per pixel,showing distribution of Fe, located only in pyrite crystals I and II; scale bar 5 lm. (E) Fluorescence map obtained at 2.5 keV, integrationtime 3 s per pixel, showing distribution of S in both pyrite crystal and organic wall (white arrow). Note the absence of S in the areaindicated by a black arrow, which corresponds to interruption of organic wall. Black cross indicates area selected for S K-edge XANESanalysis; scale bar 5 lm. (F) Fluorescence map obtained at 2.5 keV showing distribution of Si and depletion corresponding to pyrite grainand carbon rich wall; scale bar 5 lm.
192 L. Lemelle et al. / Organic Geochemistry 39 (2008) 188–202
fluorescence photons emitted by the sample werecollected with an energy-dispersive high purity Gedetector (Princeton Gamma-Tech) with an energyresolution FWHM of 135 eV (MnKa line),mounted in the horizontal plane at 90� to the beam.This geometry minimizes the inelastic scatteringcontribution to the fluorescence spectrum, whichmay decrease the signal/noise ratio. In order todetect fluorescence from low Z elements, the micro-scope was operated under vacuum. The count ratewas kept below 5000 counts s�1. For each pixel ofthe image, a full fluorescence spectrum wasrecorded, allowing off line reconstruction of mapsfor several elements in the sample. Mapping wasrecorded with incident beam energy of 7 keV and2.5 keV respectively. Before mapping at high spatialresolution and high counting rate (steps of 0.5–2lm, counting time of 2–5 s), mapping at low resolu-tion and low counting rate (steps of 5 lm, countingtime of 300 ms) was performed to select the mostsuitable cell in the 100 lm � 100 lm scanned areas.
For semi-quantitative S analysis, a 3-mm thickmulti-element reference target (silica-rich glassSRM 620 standard from the NIST) was used asthe matrix compositional reference material. SO3
concentration was 0.28 wt%, with an uncertaintyof 0.02 wt%. The glass had the following composi-
tion: SiO2 72.08 ± 0.08, Na2O 14.39 ± 0.06, CaO7.11 ± 0.05, MgO 3.69 ± 0.05, Al2O3 1.8 ± 0.03,K2O 0.41 ± 0.03, SO3 0.28 ± 0.02, As2O3 0.056 ±0.003, Fe2O3 0.043 ± 0.004, TiO2 0.018 ± 0.002wt%. The spectra were processed with a non-linearleast squares fitting software, PyMca, developed atthe ESRF: (http://www.esrf.fr/computing/bliss/downloads/index.html#PyMca) for subtracting thebackground and calculating the Ka net peak areas.The net peaks were converted to intensity by nor-malizing with the incident beam intensity. Charac-teristic spectra for the cell wall and surroundingmatrix were obtained by either averaging the fewspectra collected on positions selected after mappingthe cell, or by off-line averaging of the spectra ofinterest from a reconstructed map with the ESRFArtemis software (http://www.esrf.fr/computing/bliss/downloads/index.html#Artemis).
For S speciation, the energy was scannedbetween 2450 eV and 2530 eV in 0.2 eV energy stepsand 1s dwell time. The ID21 SXM was first used inunfocussed mode, i.e. using simply a 200-lm pin-hole, on standard compounds for energy calibrationof the monochromator. All energy values were mea-sured with respect to the position of the white line(s ? p transition peak) of the S K-edge spectrumof CaSO4, which was assigned an energy of
2465 2470 2475 2480 2485 2490
Energy (eV)
( I /
I o ) no
rmal
ized
in A
.U.
Methionine
DBT
Pyrite
S-wall
2.4738 keV2.4719 keV
A
2465 2470 2475 2480 2485 2490Energy (eV)
Thianthrene
DBT
PPT
Methionine
Glutathione
PhenyleneDisulfide
2.4738 keV2.4719 keV
( I / Io ) normalized in A.U
.
B
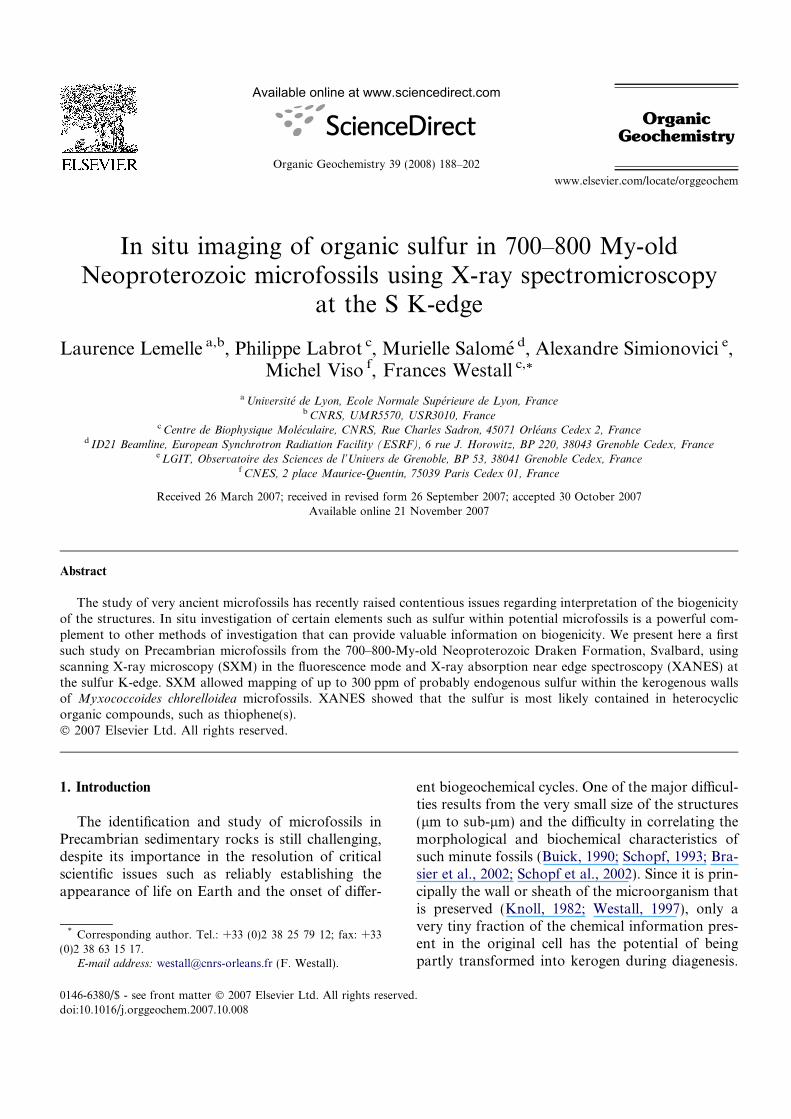
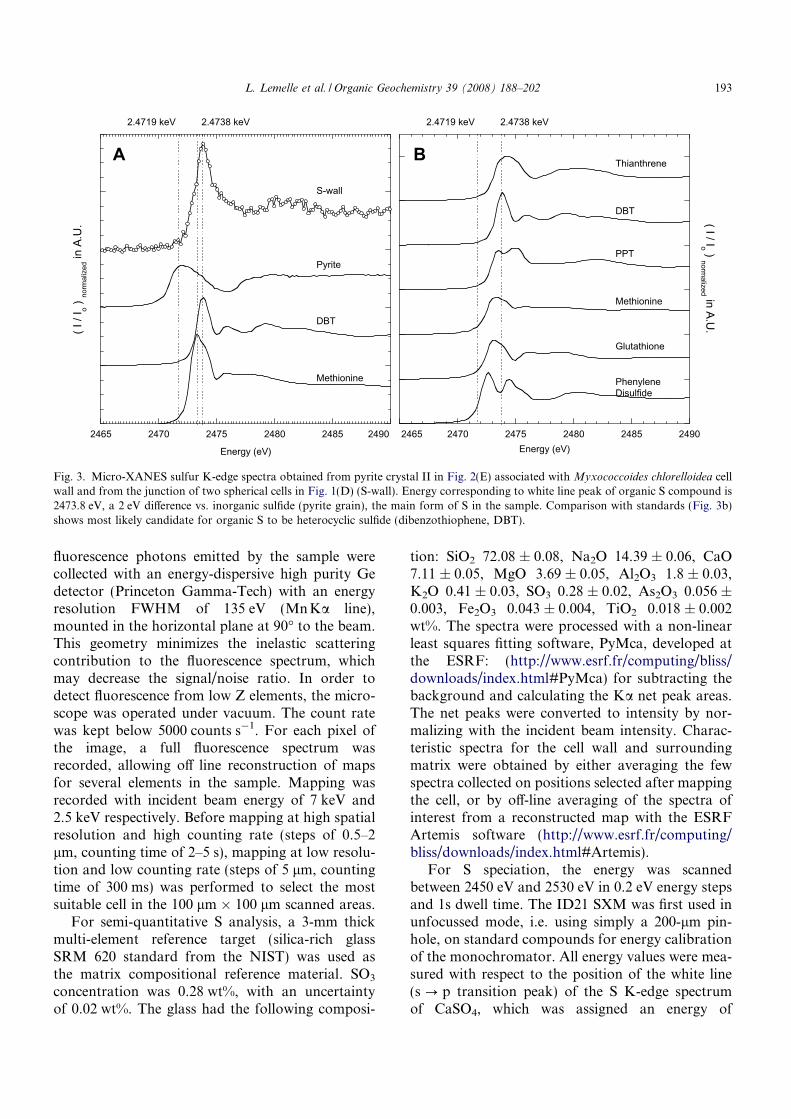
Fig. 3. Micro-XANES sulfur K-edge spectra obtained from pyrite crystal II in Fig. 2(E) associated with Myxococcoides chlorelloidea cellwall and from the junction of two spherical cells in Fig. 1(D) (S-wall). Energy corresponding to white line peak of organic S compound is2473.8 eV, a 2 eV difference vs. inorganic sulfide (pyrite grain), the main form of S in the sample. Comparison with standards (Fig. 3b)shows most likely candidate for organic S to be heterocyclic sulfide (dibenzothiophene, DBT).
L. Lemelle et al. / Organic Geochemistry 39 (2008) 188–202 193
2482.5 eV. Representative S compounds (SigmaInc.) in various oxidation states were used as stan-dards (Table 1): inorganic sulfide (pyrite), thiol (glu-tathione), alkyl monosulfide (methionine), alkyldisulfide (cystine), aryl monosulfide (polyphenylenesulfide), aryl disulfide (phenylene sulfide), heterocy-clic sulfide (dibenzothiophene and thianthrene) andsulfate (CaSO4). Micro-XANES spectra were alsocollected from selected locations within the cellwalls of the microfossils and on pyrite crystalswithin the sample. To verify that potential photore-duction effects were negligible, the final XANESspectra were obtained by summing several low inte-gration time spectra. Each XANES spectrum wasprocessed as follows: the spectra obtained were firstcorrected for I0, the incident beam intensity beforethe sample. This compensates for the slow decay
of the intensity of the electron beam in the storagering and possible rapid fluctuation in intensity dur-ing spectrum acquisition. The region below the edgewas fitted by a straight line which was subtractedfrom the spectrum to flatten and bring the baselineto zero. The spectrum was then normalized to theheight of the edge jump and reported in arbitraryunits.
3. Results
3.1. Fluorescence mapping
The X-ray fluorescence map of Fe at 7.2 keVshows that iron is only located within pyrite crys-tals (Figs. 1C and 2D), which were later identifiedfrom their micro-XANES spectra at the S K-edge,
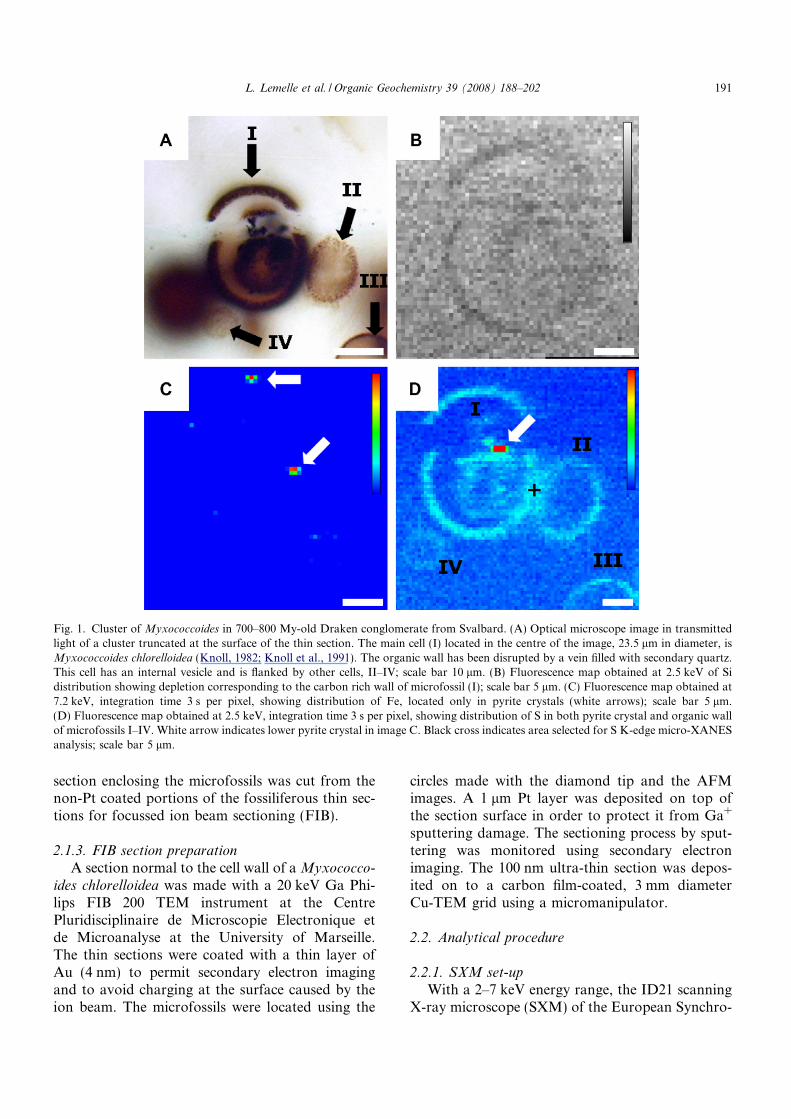
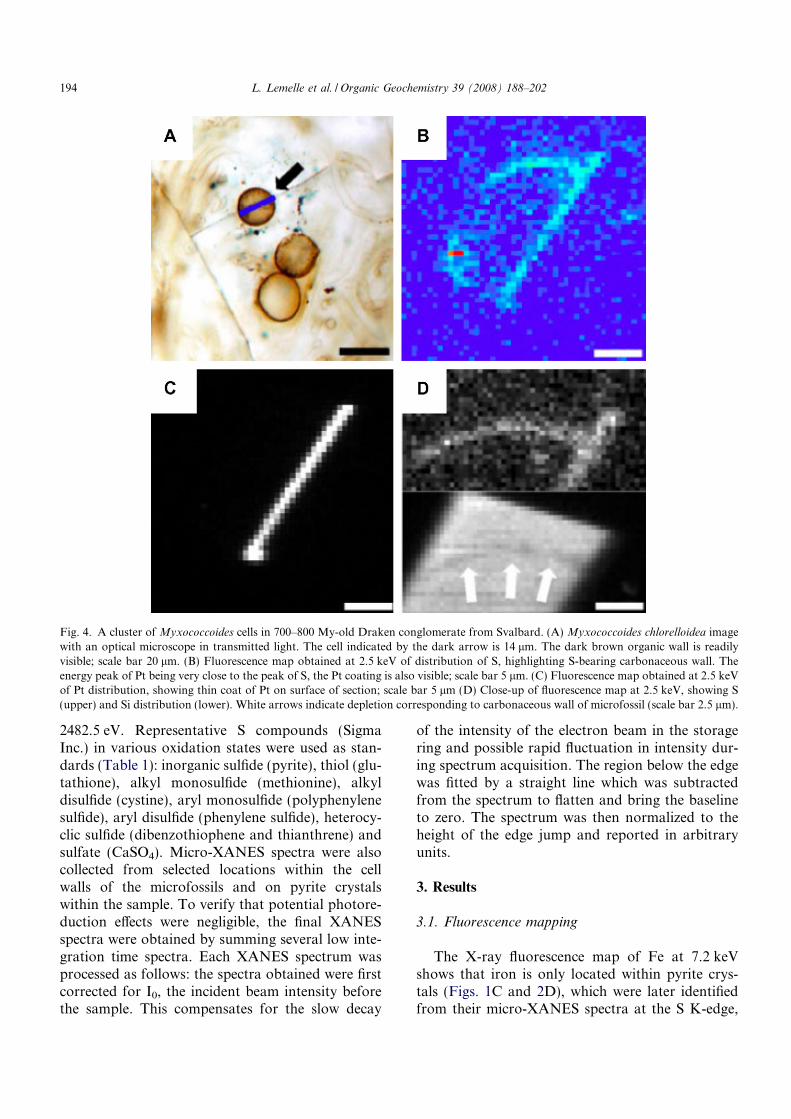
Fig. 4. A cluster of Myxococcoides cells in 700–800 My-old Draken conglomerate from Svalbard. (A) Myxococcoides chlorelloidea imagewith an optical microscope in transmitted light. The cell indicated by the dark arrow is 14 lm. The dark brown organic wall is readilyvisible; scale bar 20 lm. (B) Fluorescence map obtained at 2.5 keV of distribution of S, highlighting S-bearing carbonaceous wall. Theenergy peak of Pt being very close to the peak of S, the Pt coating is also visible; scale bar 5 lm. (C) Fluorescence map obtained at 2.5 keVof Pt distribution, showing thin coat of Pt on surface of section; scale bar 5 lm (D) Close-up of fluorescence map at 2.5 keV, showing S(upper) and Si distribution (lower). White arrows indicate depletion corresponding to carbonaceous wall of microfossil (scale bar 2.5 lm).
194 L. Lemelle et al. / Organic Geochemistry 39 (2008) 188–202

exhibiting a white line peak at 2472 eV (Fig. 3).The pyrite crystals are commonly dispersed inthe silica matrix and are also frequently closelyassociated with individual microfossils. However,Fe was not detected either inside the cell or inthe walls, regardless of the integration time used.The X-ray fluorescence map of S at 2.5 keV overlong integration times (a few seconds per pixel)on both petrographical and FIB preparations indi-cates that, although S is highly concentrated inpyrite, small quantities were also present in thewalls of the microfossils (Figs. 1D and 2E). Sinceno Fe was detected in the cell walls, we concludethat the S there was not linked with Fe and there-fore this element occurred in a form different fromthat in pyrite. The corresponding X-ray fluores-cence maps of Si show depletion in the carbonrich wall of microfossils, both in the petrographi-
cal preparations and in the FIB preparations(Figs. 1B and 2F).
3.2. XANES analysis
S K-edge spectra were obtained from spot analy-sis of the carbonaceous walls of the microfossils(Fig. 3a). S K-edge spectra of standards are re-ported in Fig. 3b, the energy values of the white linepeaks of the standards being reported in Table 1.The energy corresponding to the white line peakof the S compound in the cell wall presented a posi-tive 1.9 eV difference from that of the inorganicsulfide (pyrite grain), the other form of S in the sam-ple. Within the 0.25 eV energy resolution and after acalcite calibration, we verified that the pyrite peakenergy values are identical, 2471.9 eV, in both thefocussed and unfocussed experiments. Given this
Table 1White line peak energy in XANES spectra of different S compounds measured at the ID21 Beamline of the European SynchrotronRadiation Facility for reduced compounds (1) or derived from the literature data (Prietzel et al., 2003) for oxidized compounds (2)
S form Formula Oxidation state Compound White line peak energy
Elemental S S 0Inorganic sulphide S2�
2 �1 Pyrite 2471.9 eV (1)
Alkyl-disulfide +0.2 Cystine 2472.5 eV (1)
Aryl-disulfide +0.2 Phenylene disulfide 2472.5 eV (1)
Thiol +0.5 Glutathione 2473.2 eV (1)
Alkyl-monosulfide +0.5 Methionine 2473.3 eV (1)
Aryl-monosulfide +0.5 Poly-phenylene sulfide (PPT) 2473.5 eV (1)
Thiophene +1 Dibenzothiophene (DBT) 2473.9 eV (1)
+0.5 Thianthrene 2474.3 eV (1)
Sulfoxyde +4 2475.8 eV (2)
Sulfone +5 2480.2 eV (2)
Sulfonate +6 2481.3 eV (2)
Sulfate +6 CaSO4 2482.5 eV (1,2)
L. Lemelle et al. / Organic Geochemistry 39 (2008) 188–202 195

calibration, the energy corresponding to the whiteline peak of the S compound in the cell wall is2473.8 eV.
3.3. Quantitative analysis of S in microfossil walls
Direct empirical XRF analysis was made by com-paring the same fluorescence intensity ratios for thestandard and sample. For two thick multi-elementsamples subjected to a monochromatic incidentbeam of energy E0, the ratio R can be estimatedfrom the Sherman equation (1) (Sherman, 1954),provided only the primary absorption is taken intoaccount and all the instrumental parameters arevery close for the two samples. This ratio can thusbe calculated using the following equations:
R ¼ clFS=clF
Si
cstS=cst
Si¼ IlF
S=IlF
Si
IstS=Ist
Si� llF
MðESiÞ=llF
MðESÞ
lstMðESiÞ=lst
MðESÞ� F
F ¼ 1þ llFMðE0Þ=llF
MðESÞð Þð Þ= 1þ llF
MðE0Þ=llF
MðESiÞð Þð Þ
1þ lstMðE0Þ=lst
MðESÞð Þð Þ= 1þ lst
MðE0Þ=lst
MðESiÞð Þð Þ
8><>: ð1Þ
where clFi and cst
i represent the weight concentrationof the element i (in this particular case, we considerthe element of interest S and the main matrix com-ponent Si) analyzed from the microfossil (lF) andfrom the standard (st), IlF
i and I sti are the back-
ground-corrected fluorescence intensities of the ele-ment i from the sample and the standard, llF
M ðEiÞand lst
MðEiÞ are the total mass attenuation coeffi-cients of the matrix of the microfossil and of the ref-erence matrix at the characteristic line energy ofelement i, respectively, at the incident beam energyE0.
The most representative background-correctedfluorescence intensities for Si, IlF
Si , and S, IlFS , emit-
ted by the wall of one cell were determined by test-ing different analytical approaches (Table 2). Thefirst two methods consist in averaging the numberof photon counts recorded on n positions selectedin a zone previously marked out at the lm scale.Raw accumulated counts are obtained on-line fromthree non-overlapping spectral regions of interest(ROIs) of 80 channels each. The ROIs for the Siand S fluorescence were centred on the characteris-tic Ka lines. The ROI for the background waslocated between the Si-ROI and S-ROI, where noelemental fluorescence was detected. The countingtime, s, is 3 s for the first method and 300 s for thesecond. The optimal third method for quantificationof the photon counts emitted by a lm sized portionof the cell wall was achieved by analyzing the fluo-rescence of one unique representative spectrum with T
able
2X
RF
anal
ysis
a Met
ho
d1
(s=
3s)
Met
ho
d2
(s=
300
s)M
eth
od
3(s
*=
300
s)
nN
Si�
r NS
iN
S�
r NS
NB
G±
rB
GN
Si=
NS�
r NS
i=N
Sn
NS
i�
rN
Si
NS�
r NS
NB
G±
rB
GN
Si=
NS�
r NS
i=N
Sn
NS
i±
rP
yM
CA
NS
±r P
yM
CA
NS
i=N
S�
rN
Si=
NS
SR
M62
060
3466
505
6914
2912
0839
5130
573
2032
4491
4815
67(6
7)(8
)(2
)(1
1.2)
(803
1)(1
00)
(23)
(3)
(569
)(7
8)(1
.1)
Wal
l11
5864
3211
183
1058
0756
3020
1147
192
2058
2785
3139
185
(323
)(8
)(3
)(4
7)(1
7690
)(1
169)
(63)
(74)
(753
)(7
0)(4
.2)
Mat
rix
962
059
12–
861
6062
586
1245
1051
2060
3723
477
1265
(295
)(9
)(6
)(1
4267
)(1
05)
(84)
(190
)(7
66)
(97)
(257
)W
all
FIB
-se
ctio
n–
––
–11
2935
749
84
5920
4405
913
3633
(286
1)(1
65)
(2)
(21)
(267
)(4
0)(1
)M
atri
xF
IB-
sect
ion
––
––
131
469
226
513
920
4352
238
1145
––
––
(269
)(1
3)(4
18)
aM
eth
od
s#
1an
d#
2co
nsi
stin
aver
agin
gth
en
um
ber
of
cou
nts
fro
mS
ifl
uo
resc
ence
,N
Si,
Sfl
uo
resc
ence
,N
San
dS
-bac
kgr
ou
nd
,N
BG
,m
easu
red
on
np
osi
tio
ns
sele
cted
on
azo
ne
pre
vio
usl
ym
ark
edo
ut
atm
icro
met
ersc
ale.
Th
eco
un
tin
gti
me,
s,is
3s
for
met
ho
d1,
300
sfo
rm
eth
od
2.T
he
aver
age
ph
oto
nco
un
ts(b
ack
gro
un
dco
rrec
ted
)ar
ere
po
rted
wit
hth
eco
rres
po
nd
ing
stat
isti
cal
vari
ance
.M
eth
od
#3
isd
escr
ibed
inth
ete
xt.T
he
nu
mb
ero
fsp
ectr
a,n,
tak
enin
toac
cou
nt
toca
lcu
late
the
aver
age
spec
tru
m,
and
r PyM
CA
the
wid
tho
fth
eb
est
gau
ssia
np
eak
fit
of
the
flu
ore
scen
cep
eak
esti
mat
edw
ith
the
PyM
caso
ftw
are
are
rep
ort
edfo
ran
equ
ival
ent
cou
nti
ng
tim
eo
fs*
.T
he
erro
rb
aro
fN
Si/
NS
isca
lcu
late
das
the
vari
ance
of
the
Si
and
Sfl
uo
resc
ence
cou
nts
rati
oas
foll
ow
s:r
NS
i=N
S¼
ffiffiffiffiffiffiffiffiffiffiffiffiffiffiffiffiffiffiffiffiffiffiffiffiffiffiffiffiffiffiffiffi
r2 NS
i
NSþ
r2 N
S
NS
i
N2 S
�� 2
r.
196 L. Lemelle et al. / Organic Geochemistry 39 (2008) 188–202

the PyMCA software. Such a spectrum is calculatedoff line with the Artemis software by averaging spec-tra collected for a short counting time, s, of 3–5 sfrom an area of interest selected from a recordedspectral map. In general, the two first methods areless satisfactory than the third because of the sub-lm spatial instability of the sample between theacquisition of the preliminary map and the reposi-tioning of the beam on the wall (compare r in Table2). In this respect, the second approach using spec-tra obtained during long acquisition times is evenless satisfactory than the first method. This instabil-ity leads to imprecise selection of the irradiatedzone, more intense spectral variability and so tofinal greater variance. The minimal amount of anelement, such as S, in the samples, that can bedetected within a characteristic counting time for agiven experimental set-up can be defined as follow-ing in the range of trace analysis (Mantler, 2006):
CDLS � 3
b
ffiffiffiffiffiffiffiffiffiNBG
pð2Þ
where NBG is the number of the background photonsin the measured total number of photons from the S-peak and b is the proportionality factor between thesum of the characteristic S-photons and the massfraction of sulfur. The lowest detection limit for S cal-culated for a 3 s counting time on the SRM620 matrixis estimated to be about 10 ppm.
In order to apply the Sherman equation, thevalidity of the approximation of ‘‘thick samples”
for the petrographical slices and the reference silicamatrix was first verified. The transmission % vs. depthwas calculated for the incident beam, T EiðzÞ, and forthe excited fluorescence of S and Si, T EeðzÞ, with the‘‘X-ray interaction with matter” calculator ofthe CXRO (Center for X-ray Optics) web site(http://www-cxro.lbl.gov/optical_constants/filter2.html) (Henke et al., 1993). We define the probedthickness of the sample, dp, as the thickness produc-ing more than 99% of the S-photons (or Si-photons).This thickness was then estimated as follows:
R dp
0T EiðzÞ � T EeðzÞ � dzR l
0 T EiðzÞ � T EeðzÞ � dz� 99% ð3Þ
where l is the depth from which less than 1‰ of thefluorescence of S escaped the sample. Distance ob-tained herein is overestimated, given that the reflex-ion geometry of the instrumental set up is not takeninto account. These depths (Table 3) are inferior inall cases to the real thicknesses of the studied slices,
ds. The density and the total mass attenuation coeffi-cients of the two studied matrices, m, deduced by fit-ting the transmittance vs. depth, are reported in Table3. The combination of the fluorescence intensity ratio(Table 2) with the mass attenuation coefficient (Table3) and the formula (1) allows estimation of the rangeof values of R for the wall of the microfossil at be-tween 0.16 and 0.22. Given that the value of the ratioof the S and Si weight compositions for the referencematrix is 3.3 ± 0.3 � 10�3, an approximate S/Siweight ratio for the walls is estimated as 0.8 � 10�3.The S content detected in the apparently most S-en-riched cell walls is then 280 ± 45 ppm. The secondaryfluorescence contribution to the Si Ka intensity,excited by an S-Ka is proportional to the Si and Sconcentrations. Therefore, the effective Si secondaryfluorescence is higher in the reference matrix than inthe microfossil matrix. In conclusion, the S contentin all the imaged cellular walls must be > 10 ppm(MDL) and < 280 ppm.
In comparison, the S content in the cell wall calcu-lated using the same approach for the FIB sections isfive times greater. The overestimation of the S contentis consistent with the lower reabsorption of S fluores-cence relative to Si in the first hundred nm below thesurface. It is also consistent with a wall matrix com-posed of carbonaceous matter being less dense thanthe silica matrix. In both cases, it indicates that thisparticular sample preparation requires the develop-ment of a different semi-quantitative approach.
4. Discussion
4.1. Interpretation of X-ray fluorescence analysis and
S K-edge XANES as S traces in parietal thiophenic
compounds
This study represents the first attempt to quan-tify the S content of the wall of a Precambrian
Table 3Macroscopic properties of the silica matrix of the microfossil andof the reference matrix (SRM620 NIST glass) required to applyformulae (1) given in the text
Matrix of microfossil SRM620 matrix
q (g cm�3) 2.20 2.33dp (lm) 10.7 11ds (lm) 30 3000lM(E0) (cm2 g�1) 935 ± 2 860 ± 2lM(ESi) (cm2 g�1) 715 ± 2 1010 ± 2lM(ES) (cm2 g�1) 1150 ± 2 1070 ± 2lM(ESi)/lM(ES) 0.622 ± 0.003 0.944 ± 0.003cS/cSi 3.3 ± 0.3 � 10�3
L. Lemelle et al. / Organic Geochemistry 39 (2008) 188–202 197

microfossil. Different quantification methods weretested and it was finally established that the detectableS content varied between a minimum of 10 ppm anda maximum of 300 ppm.
The XANES study permits identification of the Sobserved in the wall of the microfossils as a reducedform of organic S (formal oxidation state < +4) thatbelongs, most probably, to a heterocyclic-rich typeof compound such as thiophene-like compounds.The reasons are as follows. The white line peakenergy of the S analyzed is 2473.8 ± 0.1 eV. It istherefore not an alkyl polysulphide (R-Sn-R, withn > 1) since such compounds have white line peakenergy systematically less than 2472.5 eV (Chau-vistre et al., 1997). Neither does it represent a thioln or an alkyl monosulfide: the white line peakenergy of glutathione and methionine studied hereoccur at an energy of 2473.3 ± 0.1 eV. The valuesreported by Sarret et al. (1999) for alkyl monosul-fides vary within a 0.2 eV range, with a maximalvalue of 2473.4 eV recalculated according to ourcalibration based on the energy of the cystine peakin this study. Values reported for thiophenic com-pounds vary within a 0.5 eV range and have a min-imal value of 2473.5 eV. The minimal energyreported for sulfoxides is 2475.6 eV (Sarret et al.,1999; Prietzel et al., 2003). The white line peakenergy of the S in our study at 2473.8 ± 0.1 eV isthus significantly greater than that of alkyl sulfides(< 2473.4 eV) and less than that of sulfoxides(> 2474.6 eV). The white line peak energy at2473.5 ± 0.1 eV of the polyphenylene standard, anaryl sulfide, suggests that the S observed in the wallof the microfossils must be enriched in thiopheniccompounds, so must belong to a thiophenic or anaryl sulfide form, and thus to an organic heterocy-clic-rich sulfide compound. The large, high energyedge of the main peak and the secondary peak iden-tified in the XANES range, 2475–2480 eV, give aclear indication of the diversity of the thiopheniccompounds in the cell walls. However, it is still pos-sible that other reduced forms of sulfur, such asdisulfide and alkyl/aryl sulfides, are present asminor species but in quantities below the limit ofdetection.
In conclusion, micro-imaging of sulfur Ka in thefossilized Myxococcoides chlorelloidea cells of theDraken Formation using the ID21 SXM, coupledwith a first attempt at quantitative analysis of theS fluorescence and qualitative X-ray absorptionnear edge spectroscopy, documents the presence oforganic heterocyclic-rich sulfide compounds, most
probably thiophenic, in the range 10–300 ppm, inthe walls of 700–800-My-old Precambrian micro-fossils.
4.2. Implications of sulfur SXM investigations for
Draken Formation microfossils
An argument in favor of a possible endogenousorigin is the low quantity of S (10–300 ppm) in thecell walls of Myxococcoides chlorelloidea. The rea-sons for this are as follows: the S content measuredin the organic fractions separated from contempo-rary unicellular organisms is generally much lowerthan that in fossil OM, where the S is clearly allo-chthonous (cf. Introduction). For example, in recentOM, Hedges et al. (2002) estimated an organic Scontents of ca. 0.5 wt% for planktonic cells, 1 wt%for certain proteins and negligible quantities forthe lipid and carbohydrate components (i.e.< 500 ppm). Another study reported average ele-mental S concentrations of close to 4000 ppm forsingle marine cyanobacterial cells (Heldal et al.,2003). On the other hand, sulfur content is generallymuch higher (percent level) in kerogen (Tissot andWelte, 1984). Although the total amount of S inrecent cells is even greater than the amount esti-mated for the cell walls of the Myxococcoides chlo-
relloidea microfossils studied here, the 10–300 ppmcontent of the microfossil is closer to that of cellularS than to typical allochthonous S.
There are two potential explanations for the pres-ence of endogeneous sulfur in the cell walls ofMyxococcoides chlorelloidea: either (1) it is endoge-nous to the cell, i.e. is related to an S-containingcompound that originally formed part of the cellwall of the living microorganism, or (2) it is of bio-logical origin but was fixed to the degraded organicmolecules during early diagenesis. S of biogenic ori-gin may have been incorporated into the cell wall ofthe microorganism during early diagenesis andbefore fossilization via the oxidative degradationof organic molecules by bacteria, coupled with thereduction of sulfate to sulfide by sulfate reducingbacteria (SRB; Summons, 1993; Kohnen et al.,1990; Wakeham et al., 1995). As there are no indica-tions of hydrothermal activity in the environment ofdeposition (Knoll, 1982; Knoll et al., 1991), thepresence of pyrite framboids in the silicified, micro-fossiliferous clasts is an additional argument infavor of the activity of SRB in the anoxic layers ofthe shallow water sediment. Even though theshallow water sediment and its biota were rapidly
198 L. Lemelle et al. / Organic Geochemistry 39 (2008) 188–202

silicified, the presence of numerous pyrite crystalsclearly indicates that silicification took place afterthe early diagenetic precipitation of pyrite.
Although the above arguments, based primarilyon the SXM analysis, weigh in favor of an endoge-nous, organic origin for the S and the thiopheniccompounds, we cannot completely exclude a possi-bility of an as yet unidentified (non-hydrothermal)abiotic sulfurization process for the organic parietalcompounds. Neither is it possible to exclude a pos-sible formation of thiophenic compounds duringdiagenesis, for example by the aromatization of ini-tial parietal non-thiophenic organics, as demon-strated in the laboratory with thermal treatmentexperiments (Sarret et al., 2002). It will be necessaryto make complementary analyses, discussed below,to arrive at a conclusive explanation.
4.3. Implications and perspectives for Precambrian
microfossil studies
SXM investigations at the sulfur K-edge such asthe one developed in this study present numerousadvantages for Precambrian microfossil studies.They permit the fast and non-destructive selectionof organically well-preserved, individual microfos-sils from within a population, especially those withcell walls characterized by low S content indicatingsulfur of endogeneous origin. By restricting thenumber of samples of interest, such quantitativeXRF imaging coupled to XANES microspectrome-try at the sulfur K-edge increases and acceleratessignificantly the potential of finding important bio-markers and of better understanding the origin ofthe organic S compounds.
Minimum detection limits for sulfur Ka withSRXRF are better than those obtained using elec-tron probe microanalysis (EPMA) of sulfur in fos-silized carbonaceous cells (Boyce et al., 2001).Moreover, although minimum EPMA detection lev-els as low as 6–8 ppm for Ka peaks of transitionmetals of the first row were estimated by Fialinet al. (1999), the experimental conditions used (totalcounting time 15 min with a beam of 35 kV and500 nA on standards but with a beam-excited areaof 80 lm2) are not relevant to the analysis of thekinds of microstructures investigated in this study.Thus EPMA is not suitable at present for detectingtraces of S in the 10–100 ppm range in our microfos-sils. Apart from the advantage of the detection limitwith high spatial resolution, the hard X-rays canpenetrate to greater depth than possible with EPMA
(several lm as opposed to < 1 lm), thereby enablingobservation of micron-sized structures embedded afew microns below the surface. Nor is it necessaryto coat surfaces with a conductive layer. Anotherclear advantage of SXM is its combination withXANES, which permits chemical speciation studies.Although sulfur L edge is more efficient than SK-edge XANES for overcoming uncertainty in thedetermination of the reduced forms of S (Sarretet al., 1999), the former technique requires consider-able sample preparation (with the production ofultra-thin slices < 800 nm for imaging purposesand < 400 nm for quantitative spectroscopy; Codyet al., 1996). With respect to the study of fossilizedcells, sulfur L edge analysis requires preparation ofultra-thin sections of 100–200 by ultra-microtoming(Boyce et al., 2002) and their demineralisation (Boy-ce et al., 2003). Likewise, although carbon K-edgeXANES has been successfully used to study organiccompounds (Cody et al., 1996), this also requires thepreparation of ultra-thin sections. In contrast, SK-edge XANES is rapid and can be undertakendirectly on petrological 30 lm thick surfaces with-out further painstaking preparation.
In comparison to Nano-SIMS (Robert et al.,2005; Oehler et al., 2006), the spatial resolution ofSXM is comparable. However, Nano-SIMS cannotprovide either a quantitative elemental map ormolecular information. On the other hand, comple-mentary in situ C and S isotope measurements madeon a cellular scale (e.g., Kakegawa and Nanri, 2006;House et al., 2000) would be a useful method forstudying microfossils enriched in S organic com-pounds. In this way, it should be possible to inves-tigate the origin and diagenetic transformations ofwell-preserved Precambrian organic compounds.Such investigations are envisaged for this sample.
Our investigation opens up important perspec-tives for Precambrian microfossil studies in general.For instance, further studies using the quantifica-tion procedure employed and aimed at the precisemeasurement of sulfur in the numerous taxa pre-served in the Draken Formation (Knoll, 1982;Knoll et al., 1991) can potentially reveal interestinginformation concerning the taxonomic and tapho-nomic history of this fossiliferous assemblage. Asan example, it would be interesting to look for Sin other microfossils from the Draken Formation,such as the filamentous Siphonophycus (Knollet al., 1991). It is commonly accepted that these fil-aments are the remnants of the sheaths of ancientcyanobacteria. Having a polysaccharide composi-
L. Lemelle et al. / Organic Geochemistry 39 (2008) 188–202 199

tion, the sheaths of these filaments may be different,from a chemical point of view, from the wall ofMyxococcoides chlorelloidea. It is possible that thisdifference, especially the relative quantity of carbondouble bonds, can be expressed in terms of differ-ence in the concentration of S integrated into thekerogenous wall. In given cases where an allochtho-nous S source can be excluded, the identificationand quantification of specific S species in carbona-ceous microfossils is a very useful biogenicity indica-tor. Our study also shows that SXM could possiblybecome an important instrument in the study ofolder, more controversial carbonaceous Archaeanmicrostructures (e.g. Schopf, 1993; Brasier et al.,2002; Schopf et al., 2002; Westall et al., 2006b) thatare several billion years older than the well pre-served Neoproterozoic microfossils of clear biogenicorigin investigated here.
5. Conclusions
Being element-specific, non-destructive, sensitiveto oxidation state and applicable to small individualmicrofossils without any coating, micro-XRF imag-ing and micro-XANES analysis using scanningX-ray microscopy (SXM) are efficient techniquesfor the in situ mapping and determination of sulfurcontent and species in Precambrian microfossils.The techniques have demonstrated the presence oftrace amounts of sulfur, mainly in the form of het-erocyclic organic sulfur compounds, in the carbona-ceous walls of 700–800-My-old Myxococcoides
chlorelloidea cells of the Draken Formation. Thesulfur is most likely endogenous in origin, althoughit is not possible to determine whether it is directlyrelated to specific S-rich cell components and/orwhether it was incorporated through early diagene-sis. The presence of sulfur indicates that the organicmatter in these microfossils is relatively well pre-served (offering potential for the preservation ofmolecular biomarkers).
The study opens up perspectives for Precambrianmicrofossil studies in general. Quantitative analysisof organic sulfur can be used as an indicator ofbiogenicity and can provide information regardingthe taxonomic and taphonomic history ofmicrofossils.
Acknowledgements
We gratefully acknowledge Professor AndrewKnoll for providing the samples, Annie Richard
and Jean-Gabriel Breheret for SEM imaging, Mag-gy Colas for Raman analysis and the CP2M teamfor FIB, STEM and HRTEM work. We acknowl-edge the European Synchrotron Radiation Facilityfor provision of synchrotron radiation and JeanSusini of the ID21 beamline. Gordon Southam iskindly thanked for critical comments, as are P.F.Greenwood and an anonymous reviewer. The workwas supported by CNES, Region Centre, ANR andthe CNRS.
Associate Editor—L. Schwark
References
Acholla, F.V., Orr, W.L., 1993. Pyrite removal from kerogenwithout altering organic matter: the chromous chloride.Energy and Fuels 7, 406–410.
Arouri, K., Greenwood, P.F., Walter, M.R., 2000. Biologicalaffinities of Neoproterozoic acritarchs from Australia: micro-scopic and chemical characterization. Organic Geochemistry31, 75–89.
Boyce, C.K., Hazen, R.M., Knoll, A.H., 2001. Nondestructive,in situ, cellular-scale mapping of elemental abundancesincluding organic carbon in permineralized fossils. Proceed-ings of the National Academy of Sciences of the USA 98,5970–5974.
Boyce, C.K., Cody, G.D., Feser, M., Jacobsen, C., Knoll, A.H.,Wirick, S., 2002. Organic chemical differentiation within fossilplant cell walls detected with X-ray spectromicroscopy.Geology 30, 1039–1042.
Boyce, C.K., Cody, G.D., Fogel, M.L., Hazen, R.M., Alexan-der, C.M. O’D, Knoll, A.H., 2003. Chemical evidence forcell wall lignification and the evolution of tracheids in EarlyDevonian Plants. International Journal of Plant Science164, 691–702.
Brasier, M.D., Green, O.R., Jephcoat, A.P., Kleppe, A.K., VanKranendonk, M.J., Lindsay, J.F., Steele, A., Grassineau,N.V., 2002. Questioning the evidence for Earth’s oldestfossils. Nature 416, 76–81.
Buick, R., 1990. Microfossil recognition in Archean rocks: anappraisal of spheroids and filaments from a 3500 M.Y. oldchert-barite unit at North Pole, Western Australia. Palaios 5,441–459.
Chauvistre, R., Hormes, J., Hartmann, E., Etzenbach, N., Hosch,R., Hahn, J., 1997. Sulphur K-shell absorption spectroscopyof the sulfanes R-Sn-R, n = 2–4. Chemical Physics 223, 293–302.
Cody, G.D., Botto, R.E., Ade, H., Wirick, S., 1996. Theapplication of soft X-ray microscopy to the in situ analysisof sporinite in Coal. International Journal of Coal Geology32, 69–86.
Durand, B., Monin, J.C., 1980. Elemental analysis of kerogens(C, H, O, N, S, Fe). In: Durand, B. (Ed.), Kerogen, InsolubleOrganic Matter from Sedimentary Rocks. Technip, Paris, pp.113–142.
Fialin, M., Remy, H., Richard, C., Wagner, C., 1999. Traceelement analysis with the electron microprobe: new data andperspectives. American Mineralogist 84, 70–77.
200 L. Lemelle et al. / Organic Geochemistry 39 (2008) 188–202

Foriel, J., Philippot, P., Susini, J., Dumas, P., Somogy, A.,Salome, M., Khodja, H., Menez, B., Fouquet, Y., Moreira,Y., Lopez-Garcia, P.P., 2004. High-resolution imaging ofsulphur oxidation states, trace elements and organic mole-cules distribution in individual microfossils and contemporarymicrobial filaments. Geochimica et Cosmochimica Acta 68,1561–1569.
Fleet, M.E., 2005. XANES Spectroscopy of sulfur in EarthMaterials. The Canadian Mineralogist 43, 1811–1838.
Hedges, J.I., Baldock, J.A., Gelinas, Y., Lee, C., Peterson, M.L.,Wakeham, S.G., 2002. The biochemical and elemental com-positions of marine plankton: a NMR perspective. MarineChemistry 78, 47–63.
Heldal, M., Scanlan, D.L., Norland, S., Thingstad, F., Mann,N.H., 2003. Elemental composition of single cells of variousstrains of marine Prochlorococcus and Synechococcus usingX-ray microanalysis. Limnology and Oceanography 48, 1732–1743.
Henke, B.L., Gullikson, E.M., Davis, J.C., 1993. X-ray interac-tions: photoabsorption, scattering, transmission, and reflec-tion at E = 50–30000 eV, Z = 1–92. Atomic Data andNuclear Data Tables 54, 181–342.
House, C.H., Schopf, J.W., McKeegan, K.D., Coath, C.D.,Harrison, T.M., Stetter, K.O., 2000. Carbon isotopic com-position of individual Precambrian microfossils. Geology 28,707–710.
Kakegawa, T., Nanri, H., 2006. Sulphur and carbon isotopeanalyses of 2.7 Ga stromatolites, cherts and sandstones inJeerinah formation, Western Australia. PrecambrianResearch 148, 115–124.
Kelemen, S.R., Afeworki, A.M., Gorbaty, M.L., Sansone, M.,Kwiatek, P.J., Walters, C.C., Freund, H., Siskin, M., Bence,A.E., Curry, D.J., Solum, M., Pugmire, R.J., Vandenbroucke,M., Leblond, M., Behar, F., 2007. Direct characterization ofkerogen by X-ray and solid state nuclear magnetic resonancemethods. Energy and fuels 21, 1548–1561.
Knoll, A.H., 1982. Microfossils from the late PrecambrianDraken Conglomerate, Ny Friesland, Svalbard. Journal ofPaleontology 56, 755–790.
Knoll, A., 2003. Life on a young planet: the first three billionyears of evolution on earth. Princeton University Press, NewJersey.
Knoll, A.H., Swett, K., Mark, J., 1991. Paleobiology of aNeoproterozoic tidal flat/lagoonal complex: the DrakenConglomerate Formation, Spitsbergen. Journal of Paleontol-ogy 65, 531–570.
Kohnen, M.E.L., Sinninghe Damste, J.S., Kock-van Dalen, A.C.,ten Haven, H.L., Rullkotter, J., de Leeuw, J.W., 1990. Originand diagenetic transformations of C25 and C30 highlybranched isoprenoid S compounds: further evidence for thetransformation of organically bound S during early diagen-esis. Geochimica et Cosmochimica Acta 54, 3053–3063.
Labrot, P., 2006. Microscopie a force atomique de microfossilesPrecambriens. PhD thesis, University of Orleans.
Lemelle, L., Simionovici, A., Susini, J., Oger, P., Chukalina, M.,Rau, C., Golosio, B., Gillet, P., 2003. X-ray imagingtechniques and exobiology. Journal de Physique IV 104,377–380.
Lemelle, L., Salome, M., Fialin, M., Simionovici, A., Gillet, P.,2004. In situ identification and X-ray imaging of microor-ganisms distribution on the Tatahouine meteorite. Spectro-chimica Acta 59, 1703–1710.
Mantler, M., 2006. Errors and reliability in quantitative analysis.In: Beckhoff, B., Kanngiesser, B., Langhoff, N., Wedell, R.,Wolff, H. (Eds.), Handbook of Practical X-Ray FluorescenceAnalysis. Springer, Heidelberg, pp. 309–407.
Marshall, C.P., Javaux, E.J., Knoll, A.H., Walter, M.R., 2005.Combined micro-Fourier transform infrared (FTIR) spec-troscopy and micro-Raman spectroscopy of Proterozoicacritarchs: a new approach to Palaeobiology. PrecambrianResearch 138, 208–224.
Oehler, D.Z., Robert, F., Mostefaoui, S., Meibom, A., Selo, M.,McKay, D., 2006. Chemical mapping of Proterozoic organicmatter at submicron spatial resolution. Astrobiology 6, 838–850.
Pickering, I.J., Prince, R.C., Divers, T., George, G.N., 1998. SulphurK-edge X-ray absorption spectroscopy for determining thechemical speciation of sulphur in biological systems. Federationof European Biochemical Societies Letters 441, 11–14.
Prietzel, J., Thieme, J., Neuhausler, U., Susini, J., Kogel-Knabner, I., 2003. Speciation of S in soils and soil particlesby X-ray spectromicroscopy. European Journal of SoilScience 54, 423–433.
Robert, F., Selo, M., Hillion, F., Skrzypczak, A., 2005. Nanosimsimages of Precambrian fossil cells. Abstract, Lunar andPlanetary Science XXXVI.
Rompel, A., Cinco, R.M., Latimer, M.J., McDermott, A.E.,Guiles, R.D., Quintanilha, A., Krauss, R.M., Sauer, K.,Yachandra, V.K., Klein, M.P., 1998. Sulfur K-edge X-rayabsorption spectroscopy: a spectroscopic tool to examinethe redox state of S-containing metabolites in vivo. Pro-ceedings of the National Academy of Sciences USA 95,6122–6127.
Sarret, G., Connan, J., Kasrai, M., Bancroft, G.M., Charrie-Duhaut, A., Lemoine, S., Adam, P., Albrecht, P., Eybert-Berard, L., 1999. Chemical forms of sulphur in geological andarcheological asphaltenes from Middle East, France andSpain determined by sulphur K-and L-edge X-ray absorptionnear-edge structure spectroscopy. Geochimica et Cosmochi-mica Acta 63, 3767–3779.
Sarret, G., Mongenot, T., Connan, J., Derenne, S., Kasrai, M.,Bancroft, G.M., Largeau, C., 2002. Sulphur speciation inkerogens of the Orbagnoux deposit (Upper kimmeridgian,Jura) by XANES spectroscopy and pyrolysis. Organic Geo-chemistry 33, 877–895.
Schopf, J.W., 1993. Microfossils of the Early Archean Apexchert: new evidence of the antiquity of life. Nature 260, 640–646.
Schopf, J.W., Kudryavtsev, A.B., Agresti, D.G., Wdowiak, T.J.,Czaja, A.D., 2002. Laser-Raman imagery of Earth’s earliestfossils. Nature 416, 73–76.
Sherman, J., 1954. ASTM Special Technical Publication No. 157,p. 27.
Summons, R.E., 1993. A review of fundamental aspects of organicmatter formation, preservation and composition. In: Engel,M.A., Macko, S.A. (Eds.), Organic Geochemistry, Principlesand Applications. Plenum Press, New York, pp. 3–21.
Susini, J., Salome, M., Fayard, B., Ortega, R., Kaulich, B., 2002.The scanning X-ray microprobe at the ESRF by X-raymicroscopy beamline. Surface Review and Letters 9, 203–211.
Tissot, B.P., Welte, D.H., 1984. Petroleum Formation andOccurrence, 2nd ed. Springer, Heidelberg.
Wakeham, S.G., Sinninghe Damste, J.S., Kohnen, M.E.L., deLeeuw, J.W., 1995. Organic sulphur compounds formed
L. Lemelle et al. / Organic Geochemistry 39 (2008) 188–202 201

during early diagenesis in Black Sea sediments. Geochimica etCosmochimica Acta 59, 521–533.
Westall, F., 1997. The influence of cell wall composition on thefossilisation of bacteria and the implications for the search forearly life forms. In: Cosmovici, C.B., Bowyer, S., Werthimer,D. (Eds.), Astronomical and Biochemical Origins and theSearch for Life in the Universe. Editrici Compositori,Bologna, pp. 491–504.
Westall, F., de Vries, S.T., Nijman, W., Rouchon, V., Orberger,B., Pearson, V., Watson, J., Verchovsky, A., Wright, I.,
Rouzaud, Marchesini, D., Anne, S., 2006b. The 3.466 GaKitty’s Gap Chert, an Early Archaean microbial ecosystem.In: Reimold, W.U., Gibson, R. (Eds.), Processes on the EarlyEarth, vol. 405. Geological Society of America SpecialPublication, pp. 105–131.
Whelan, J.K., Thompson-Rizer, C.L., 1993. Chemical methodsfor assessing kerogen and protokerogen types and maturity.In: Engel, M.A., Macko, S.A. (Eds.), Organic Geochemistry,Principles and Applications, vol. 861. Plenum Press, NewYork, pp. 289–353.
202 L. Lemelle et al. / Organic Geochemistry 39 (2008) 188–202