In-situ GPS antenna phase center calibration - CiteSeerX
12
In-situ GPS antenna phase center calibration Kenneth J. Hurst, Yoaz Bar Sever Jet Propulsion Laboratory, California Institute of Technology, Pasadena, California Abstract. In-situ GPS antenna phase center calibrations can be determined from several days of data from a single re- ceiver. phase center variations can introduce both ele- vation cutoff dependence and increased scatter in GPS solutions. A new method of calibration based on pre- cise point positioning yields phase center maps unique to each station and its environment. These maps in- clude not only the true phase center variation of the antenna butalso the effects of repeating stationary mul- tipath, delays from radomes, and any other stationary signal perturbations. Previous methods of calibrating phase center variations in GPS antennas have relied on either antenna range measurements, or differential tech- niques involving a second "known" antenna on a short baseline. Both these approaches fail to adequately ad- dress the environment of the antenna. The new in- situ maps will be available via anonymous FTP from sideshow.jpl.nasa.gov. 1. Introduction It has been known for some time that the apparent location of the phase center for a given GPS antenna varies as the elevation (and sometimes azimuth) of the incoming signal varies. (e.g. [Braun 19941 [Mader 19971 [Nzell 19971 [Rothacher et al. 19951 [Schupler et a/. 19941) Thesephasecentervariationscancause significant errors in the solution for the station position if not treated properly. This effect has been dealt with by either using all the same type of antenna in a survey, or by using phase center maps during the analysis of the GPS data. For eachmeasurement, a correctiondeterminedfromthe map is added to the raw measurement. Several methods have been suggested and used to measure these phase center variations. Initial efforts focused on the determinationof a phase center map for the various antenna types in a calibrated antenna range ( [Schupler et al. 19941, [Dunn 199211. Recently, several investigators ( [Mader 19971 [Rothacher et al. 19951) have determined phase center maps from short baseline studies, wherein a reference antenna with an assumed known phase center variation is used on a short, known baseline to remove the effects of geometry, signal prop- agation, and other noise sources to isolate the effect of the phase variations of the antenna under test. In 1994 the IGS recommended that phase center maps based on short baseline studies incorporating only an elevation dependence be used in the analysis of GPS data. These maps are all relative to a particular type
-
Upload
khangminh22 -
Category
Documents
-
view
0 -
download
0
Transcript of In-situ GPS antenna phase center calibration - CiteSeerX
In-situ GPS antenna phase center calibration
Kenneth J. Hurst, Yoaz Bar Sever Jet Propulsion Laboratory, California Institute of Technology, Pasadena, California
Abstract. In-situ GPS antenna phase center calibrations can be determined from several days of data from a single re- ceiver. phase center variations can introduce both ele- vation cutoff dependence and increased scatter in GPS solutions. A new method of calibration based on pre- cise point positioning yields phase center maps unique to each station and its environment. These maps in- clude not only the true phase center variation of the antenna but also the effects of repeating stationary mul- tipath, delays from radomes, and any other stationary signal perturbations. Previous methods of calibrating phase center variations in GPS antennas have relied on either antenna range measurements, or differential tech- niques involving a second "known" antenna on a short baseline. Both these approaches fail to adequately ad- dress the environment of the antenna. The new in- situ maps will be available via anonymous FTP from sideshow.jpl.nasa.gov.
1. Introduction It has been known for some time that the apparent
location of the phase center for a given GPS antenna varies as the elevation (and sometimes azimuth) of the incoming signal varies. (e.g. [Braun 19941 [Mader 19971 [Nzell 19971 [Rothacher et al. 19951 [Schupler et a / . 19941) These phase center variations can cause significant errors in the solution for the station position if not treated properly.
This effect has been dealt with by either using all the same type of antenna in a survey, or by using phase center maps during the analysis of the GPS data. For each measurement, a correction determined from the map is added to the raw measurement.
Several methods have been suggested and used to measure these phase center variations. Initial efforts focused on the determination of a phase center map for the various antenna types in a calibrated antenna range ( [Schupler et al. 19941, [Dunn 199211. Recently, several investigators ( [Mader 19971 [Rothacher et al. 19951) have determined phase center maps from short baseline studies, wherein a reference antenna with an assumed known phase center variation is used on a short, known baseline to remove the effects of geometry, signal prop- agation, and other noise sources to isolate the effect of the phase variations of the antenna under test.
In 1994 the IGS recommended that phase center maps based on short baseline studies incorporating only an elevation dependence be used in the analysis of GPS data. These maps are all relative to a particular type
2
of Dorn-Morgolan antenna with a choke ring [Mader 19971.
For many stations, there are site-dependent effects which can not be corrected by using phase center maps based solely on the antenna type.
In this paper we present a method of determining insitu phase center maps directly from the GPS data, and demonstrate that these site-specific maps provide improved solutions.
We have used this method to establish phase center calibrations for over 100 stations so far. Almost all sta- tions showed some measure of improvement.
2. Construction of Phase Center Maps We construct phase center variation maps by bin-
ning one-way postfit phase residuals over many days. We used the GIPSY-OASIS I1 analysis software in a fiducial-free, point positioning mode [Zumberge e t al., 19971 to analyze one station at a time. A random walk zenith tropospheric delay and a random walk tro- pospheric gradient were included in the estimated pa- rameters. The "ionospheric free" linear combinations LC(L1, L2) and PC(P1, P 2 ) were used. We used an elevation cutoff of 7 degrees above the horizon.
Typically, if the station is a continuous station with a long data history, we use 90-100 days of data spanning 300-360 days. In this way we average the phase residuals over many weather patterns and many other sources of noise.
If a given bin has no data after all days have been stacked, the value from the nearest bin is assigned. The bin size is 2 degree elevation by 5 degree azimuth. When the phase center maps are used, the correction applied to a given measurement is determined through bi-linear interpolation between the bins to the elevation and az- imuth of the measurement.
The binned post-fit residuals are added to any input phase center map to arrive at an improved map. We have found that this iterative procedure converges after 3 iterations.
This method will include not only the intrinsic phase center variation from the antenna itself, but also any consistent noise sources which always occur a t a given elevation and azimuth. Thus, phase multipath from stationary objects, and phase center variations induced, for example, by the antenna mount structure, will be incorporated into the final phase center map.
3. Effects of using Phase Center Maps There are two primary effects of using the new phase
center maps. The first is an order of magnitude reduc- tion in the sensitivity of the final solution for station position to the elevation angle cutoff. The second is an improved solution for some stations. An improved so- lution in this case is judged by rejection of fewer phase data points, reduction in the RMS of the postift phase
3
residuals, and improved consistency of daily solutions. Stations with RMS postfit phase residuals exceeding 8 mm show improved solutions. In all cases examined so far, use of the phase center maps resulted in RMS postfit phase residuals in the 5-8 mm range.
3.1. Reduced Elevation Angle Cutoff Dependence
[Nzell1997] and [Roihacher et al. 19951 noted a de- pendence in the solution for the station position on the elevation cutoff which can be as large as 10 cm.
This elevation dependence of the solution can cause a systematic error if either the analysis strategy changes to use a different elevation cutoff, or the station changes the percentage of data collected at lower elevations as a function of time. Such a change at a station might be induced by such things as firmware changes in the receiver or growing vegetation around the antenna.
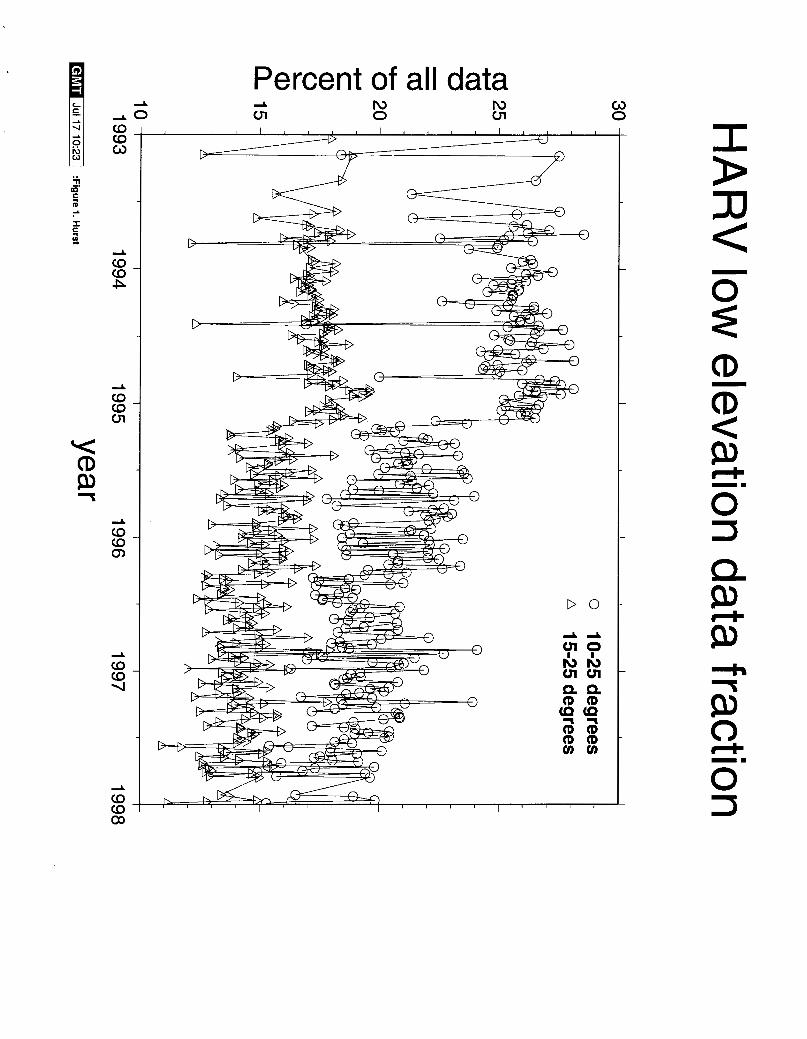
Station HARV (Harvest Oil platform off the Califor- nia coast) provides an example of a station that has recorded less data at low elevation recently than it did earlier. (Figure 1)
In a test of the sensitivity of the station position so- lution to the elevation angle cutoff at FORT (Forteleza Brazil), the use of our phase center map reduced the elevation cutoff sensitivity by almost an order of mag- nitude. Without a phase center map, the station height changed by 31 mm when the elevation cutoff was changed from 15 to 7 degrees. With our phase center map, the station height changed by only 3.6 mm.
FORT uses a Dorn-Morgolan chokering (Turborogue) antenna, so the IGS phase center maps could not affect the elevation cutoff sensitivity because the IGS map for this antenna is identically zero.
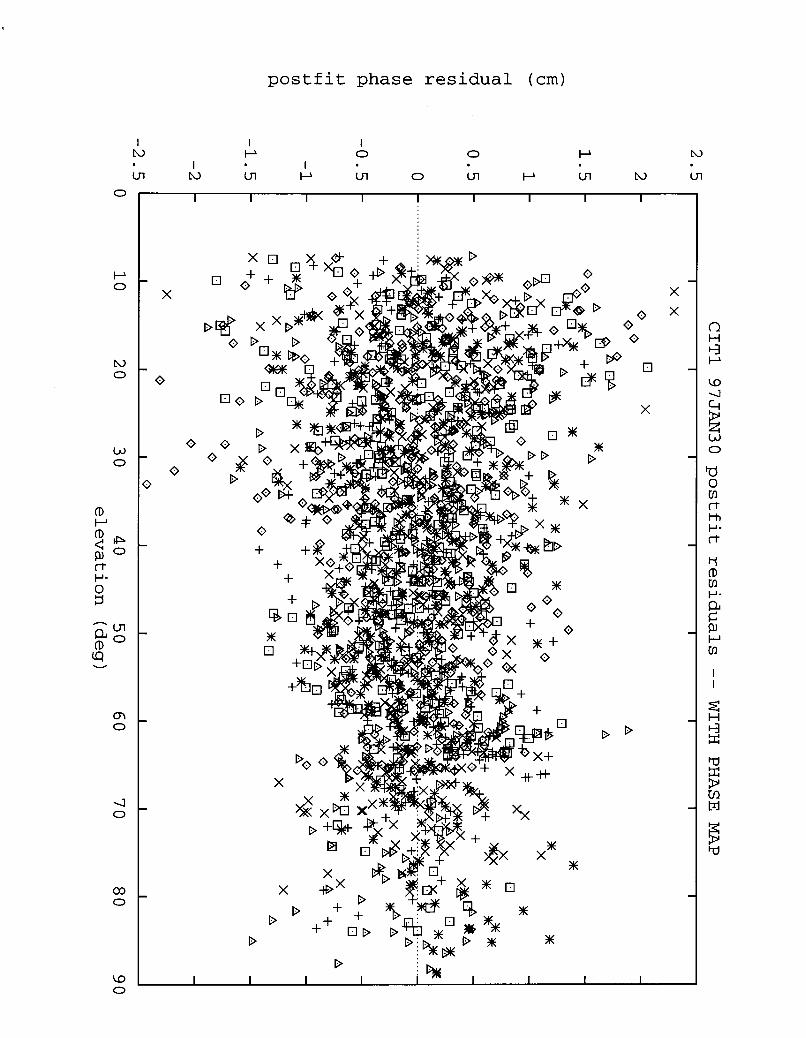
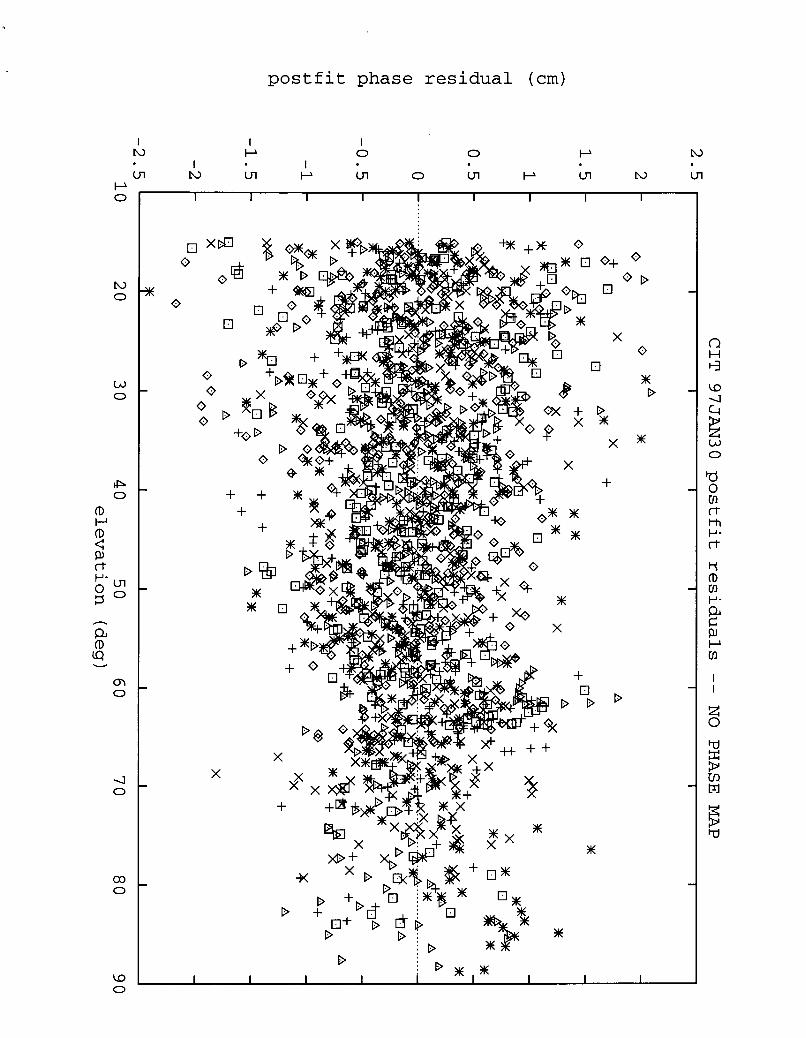
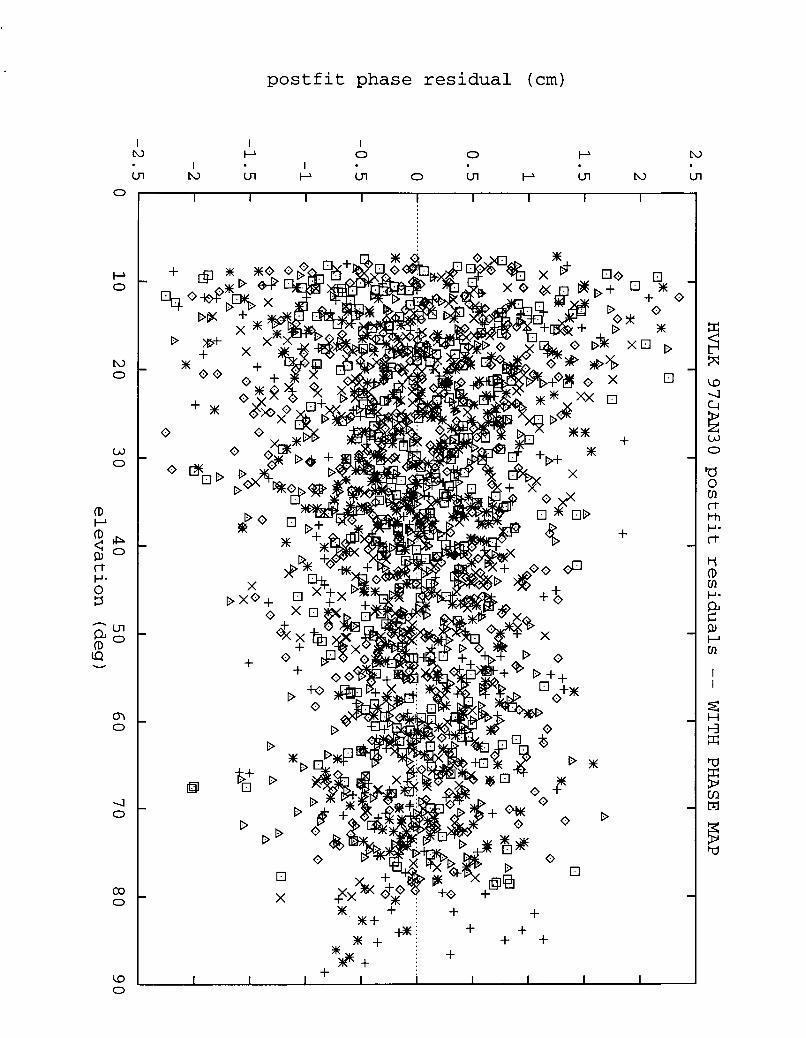
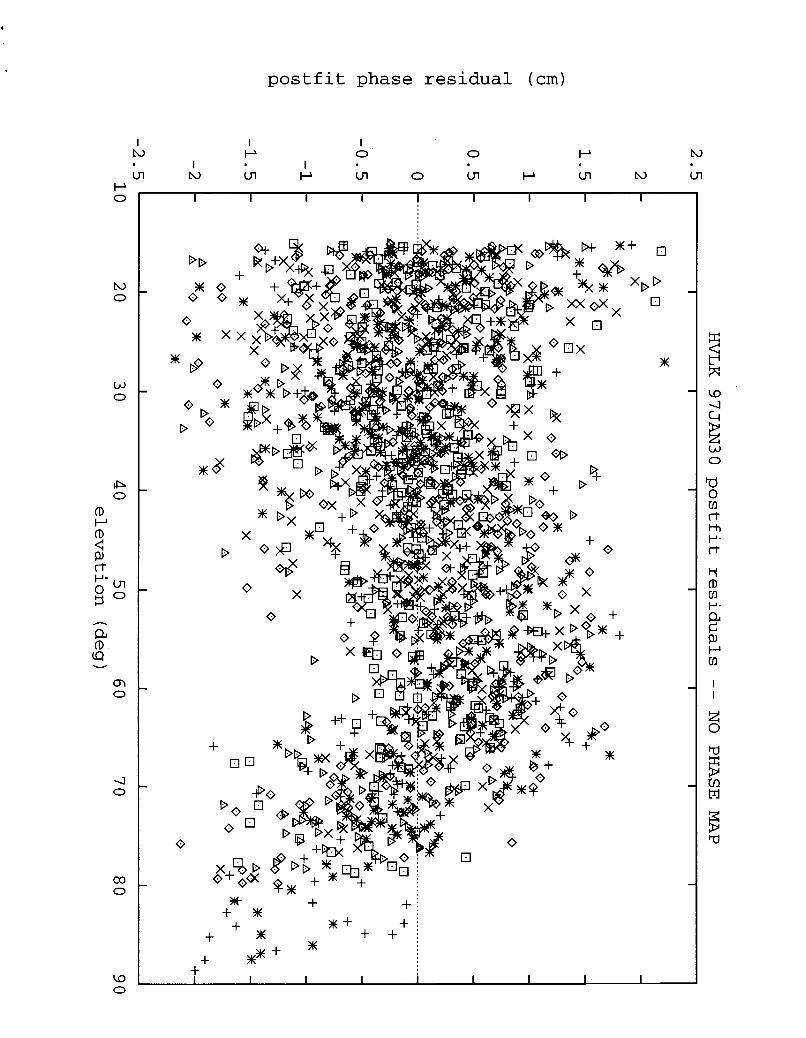
Another way to assess the effect of the phase center maps is to plot post fit phase residuals as a function of elevation. Such a plot is shown in figure 2. Station CITl uses a Turborogue antenna, and although the overall scatter is decreased, there is not much change in the shape of the envelope of the postfit residuals. Station HVLK is a Trimble 4000St L1/L2 antenna, and shows a noticeable dip in the postfit residuals above 70 degrees. The use of our phase center map removes this dip.
3.2. Improved Solution Quality Quality of the solution here is determined from the
RMS of the postfit phase residuals, number of measure- ment points included, and scatter in daily solutions. A reduction in the RMS postfit residual, an increase in the number of measurement points (implying fewer points rejected), and a reduced chi square for the combina- tion of 2 weeks of daily solutions are indicative of an improved solution.
Most stations showed a small improvement in the daily repeatability, with about 1/10 of the stations showing greater than 10% reduction in the daily re- peatability. We take this as evidence that the station installers did a good job at most sites of locating the
4
antenna in a relatively benign environment. Those sta- tions with postfit residuals larger than 8 mm typically showed some improvement in the solution when the new phase center map was used.
3.3. Comparison with IGS phase center maps [Mader 19971 has determined phase center corrections
for various GPS antennas relative to a Dorn-Morgolan choke ring (Turborogue antenna). The Dorn-Morgolan is assumed to have zero phase center variation. These calibrations have been recommended by the IGS and are available from the IGS central bureau.
In figure 3 we compare a map we generated from post- fit phase residuals for station HVLK (Kansas USA), a station using a Trimble 4000ST L1/L2 Geodetic an- tenna, with the corresponding map constructed from the IGS phase center variations. In both maps, we see a high at an elevation of about 45-50 degrees, and a low at zenith which goes down to about 25 mm below this high in our map, and about 35 mm below the high in the IGS map. Other antennas of this type display similar patterns if the site is not noisy.
We note that we also see non-zero phase center vari- ations for Dorn-Morgolan choke ring antennas. In par- ticular, the elevation cutoff test described above was done with a Dorn-Morgolan cokering antenna. Since the IGS maps assume that this antenna has no phase center variations, they would be unable to remove the dependence of the solution on the elevation angle cutoff. Using our phase center map for this station, we reduced the apparent station height change from 31 mm to 3.6 mm when the cutoff changed from 15 to 7 degrees.
4. Conclusion It is possible to construct insitu phase center maps
with GPS data from a continuously operating station. Use of these maps results in reduction of elevation cutoff dependence to insignificant levels and improves the consistency of daily station position solutions for some stations. Maps for many continuously operat- ing stations will be available via anonymous FTP from sideshow.jpl.nasa.gov.
Acknowledgments. Ken Hurst wishes to thank Arthur Niell for his support and encouragement in initiating this work. Bruce Haines kindly provided the figure demonstrat- ing the decreasing percentage of low-elevation measurements collected at station HARV as a function of time. The re- search described in this paper was carried out by the Jet Propulsion Laboratory, California Institute of Technology, under a contract with the National Aeronautics and Space Administration.
5
References Braun, j., C. Rocken, J. Johnson, Consistency of High pre-
cision GPS antennas, EOS Transactions, AGU 1994 Fall Meeting, Vol 75, p 173.
Dunn, C., L. Young, TOPEX POS network antenna phase calibration JPL Interoffice Memorandum 335.9.027-92, 1992 (JPL internal document).
Elbsegui, P., J. L. Davis, R. T. K. Jaldehag, J. M. Johansson, A. E. Niell, and I. I. Shapiro, Geodesy using the Global Positioning System: The effects of signal scattering on estimates of site position, J. Geophys. Res., 100,) 9921- 9934, 1995.
Mader, G., GPS antenna phase calibrations Unknown refer- ence.
Niell, A. Elevation cut-off test using orbits with different minimum elevations Haystack Memo June 6 1997
Rothacher, M., S. Schaer, L. Mervart, and G. Beutler, De- termination of antenna phase center variations using GPS data, paper presented at the 1995 IGS workshop, Potsdam Germany, May 15-17, 1995.
Schupler, B. R., R. L. Allshouse, and T. A. Clark, Signal characteristics of GPS user antennas, Navigation, 4 1 , 227- 295, 1994.
Zumberge, J., M. B. Heflin, D. C. Jefferson, M. M. Watkins, and F. H. Webb, Precise point positioning for the efficient and robust analysis of GPS data from large networks. J. Geophys. Res., , 5005-5017, 1997.
K. J. Hurst, MS 238-600 Jet Propulsion Laboratory California Institute of Technology Pasadena, CA 91109 e- mail: [email protected]
Y. Bar Sever, MS 238-600 Jet Propulsion Laboratory California Institute of Technology Pasadena, CA 91109
(Received January 3, 1996; revised February 27, 1996; accepted March 31, 1996.)
6
Figure 1. Plot of percent of measurements at low ele- vation as a function of time at station HARV (Harvest Oil Platform, California)
Figure 1. Plot of percent of measurements at low elevation as a function of time at station HARV (Harvest Oil Platform, California)
Figure 2. Plot of postfit phase residuals versus el- evation for stations CITl (Caltech, Pasadena Califor- nia, Cokering antenna) and HVLK (Kansas, Trimble antenna), both with and without use of our phase ten- ter maps. The systematic pattern in the plot of HVLK with no map is not present when the phase center map is applied.
Figure 2. Plot of postfit phase residuals versus elevation for stations CITl (Caltech, Pasadena California, Cokering antenna) and HVLK (Kansas, Trimble antenna), both with and without use of our phase center maps. The systematic pattern in the plot of HVLK with no map is not present when the phase center map is applied.
Figure 3. Comparison between phase center maps for HVLK (Kansas, USA) and the IGS standard phase ten- ter map for Trimble antennas. The map for HVLK is unconstrained by data in the "north hole" below about 45 degrees in the north where there are no satellite tracks.
Figure 3. Comparison between phase center maps for HVLK (Kansas, USA) and the IGS standard phase center map for Trimble antennas. The map for HVLK is unconstrained by data in the "north hole" below about 45 degrees in the north where there are no satellite tracks.
I Percent of all data A
cn N 0
N cn
Q 9) . 9)
p o s t f i t phase residual ( c m )
I c3 IJ 0 0 IJ c3
UI c3 Ln P UI 0 Ln t-L Ln c3 Ln
I I I I I I I I I
I I
I I
0
P 0
c3 0
W 0
ct P- o 3
Q
CTI 0
4 0
03 0
\D 0
0 0
0
0
X
D
I
p o s t f i t phase residual ( c m )
m
.
X
m
o x 0
0
0 0
0 0
D m X
+
D
0
m D
m
pos t f i t phase res idua l ( c m )
I I I I I I I I I
m m + + i + + + x i + +
m x + i + + # + i +
I I I I I I I I I +
p o s t f i t phase residual (cm)
I I
I c3 P 0 0 P c3
ul c3 ul P ul 0 ul P ul c3 ul
I
I
+
xD 0
m
* + m + + ; + ; + x + j +
mm +
m +
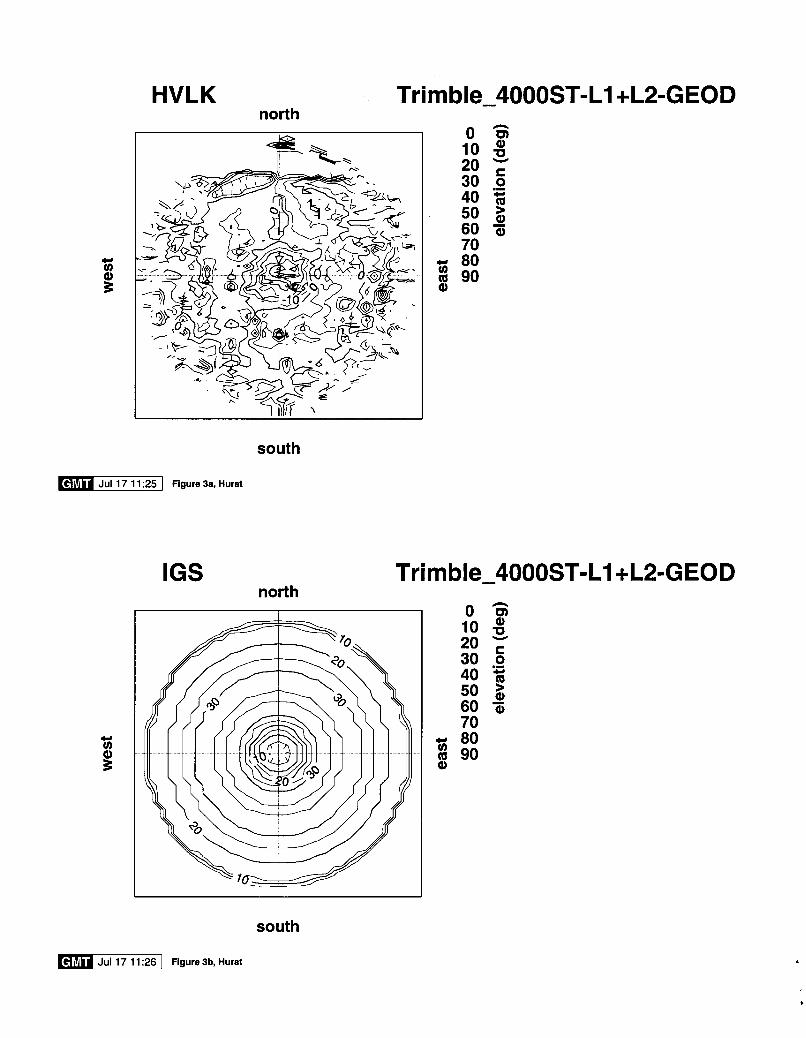
HVLK Trimble-4000ST-L1 +L2=GEOD north
70 CI 80 2 90 aa
south
Jul 17 11 :25 1 Figure 3a, Hurst
IGS Trimble-4000ST-L1 +L2=GEOD north
south
Jul 17 11 :26 I Figure 3b, Hurst