In Situ Building of a Nanoprobe Based on Fluorescent Carbon Dots for Methylmercury Detection
8
In Situ Building of a Nanoprobe Based on Fluorescent Carbon Dots for Methylmercury Detection Isabel Costas-Mora, Vanesa Romero, Isela Lavilla, and Carlos Bendicho* Departamento de Química Analítica y Alimentaria, A ́ rea de Química Analítica, Facultad de Química, Universidad de Vigo, Campus As Lagoas-Marcosende s/n, 36310 Vigo, Spain * S Supporting Information ABSTRACT: A new fluorescent assay based on in situ ultrasound-assisted synthesis of carbon dots (CDs) as optical nanoprobes for the detection of methylmercury has been developed. Application of high-intensity sonication allows simultaneous performance of the synthesis of fluorescent CDs within the analytical time scale and the selective recognition of the target analyte. Microvolume fluorospectrometry is applied for measure- ment of the fluorescence quenching caused by methylmercury. The assay uses low amounts of organic precursors (fructose, poly(ethylene glycol), and ethanol) and can be accomplished within 1 min. A detection limit of 5.9 nM methylmercury and a repeatability expressed as a relative standard deviation of 2.2% (N = 7) were obtained. CDs displayed a narrow size distribution with an average size of 2.5 nm as determined by electron transmission microscopy. To study the quenching mechanism, fluorescence, atomic absorption spectrometry, and Fourier transform infrared spectrometry were applied. Hydrophobicity of methylmercury and its ability to facilitate a nonradiative electron/hole recombination are suggested as the basis of the recognition event. A simple and green assay is achieved for quick detection of methylmercury without the use of tedious sample preparation procedures or complex and expensive instrumentation. I n the past several years, the development of fluorescent probes for the rapid and simple detection of a wide variety of analytes has attracted increasing attention. Organic dyes have been widely used as fluorescent probes, but these tend to have some limitations such as poor photostability, narrow excitation spectra, and broad absorption bands with red tailing. Recently, new fluorescent systems have been proposed to overcome these limitations. Among them, semiconductor nanocrystals, also called quantum dots (QDs), have been extensively applied for the detection of several ions and organic compounds. 1−3 The main properties of QDs are their broad absorption spectrum, narrow, symmetric, and tunable emission band, large quantum yields, and high photostability, 4 which account for the superior optical properties in comparison with those of conventional organic dyes. Nevertheless, the main drawbacks of QDs lie in their complicated and expensive synthesis routes and their composition, since toxic elements are commonly present in their structure. As a new alternative to QDs, carbon dots (CDs) have recently been described by Xu et al. 5 The main properties of CDs include strong fluorescence, tunable color emission, and high photostability, but the main features that make them attractive are the absence of toxic elements and the ease of synthesis using simple, inexpensive, and ecofriendly carbon sources, such as glucose, sucrose, citric acid, or glycerol, among others. In spite of the great potential of CDs for detection of chemical species, only a few works have reported the use of CDs as luminescent probes. 6 Concerning the analysis of metal ions, the most widely studied analyte is Hg(II), 7−10 which usually causes the fluorescence quenching of CD-based systems. Mercury is a well-known environmental pollutant, its main organic form (i.e., methylmercury) being more toxic to living systems than inorganic species 11 due to its lipid solubility and ability to cross biological membranes. Methylmercury has been recognized as a potent neurotoxin that causes damage to the brain and nervous system, being particularly hazardous for pregnant women and infants. 12 Methylmercury is able to be accumulated and bioamplified in the human body through the food chain, so the main human exposure to methylmercury is linked to fish consumption. 13 Usually, complex hyphenated techniques based on separation techniques such as high- performance liquid chromatography (HPLC), gas chromatog- raphy (GC), or capillary electrophoresis (CE) coupled to a specific detector such as mass spectrometry (MS), 14 inductively coupled plasma mass spectrometry (ICPMS), 15 or atomic fluorescence spectrometry (AFS), 16 are required for methyl- mercury detection. In addition, implementation of extraction/ preconcentration procedures is usually needed. 14,17−22 Nowa- days, there is a need for simple and fast assays that can be Received: February 6, 2014 Accepted: March 28, 2014 Article pubs.acs.org/ac © XXXX American Chemical Society A dx.doi.org/10.1021/ac500517h | Anal. Chem. XXXX, XXX, XXX−XXX
-
Upload
independent -
Category
Documents
-
view
0 -
download
0
Transcript of In Situ Building of a Nanoprobe Based on Fluorescent Carbon Dots for Methylmercury Detection
In Situ Building of a Nanoprobe Based on Fluorescent Carbon Dotsfor Methylmercury DetectionIsabel Costas-Mora, Vanesa Romero, Isela Lavilla, and Carlos Bendicho*
Departamento de Química Analítica y Alimentaria, Area de Química Analítica, Facultad de Química, Universidad de Vigo, Campus AsLagoas-Marcosende s/n, 36310 Vigo, Spain
*S Supporting Information
ABSTRACT: A new fluorescent assay based on in situ ultrasound-assistedsynthesis of carbon dots (CDs) as optical nanoprobes for the detection ofmethylmercury has been developed. Application of high-intensitysonication allows simultaneous performance of the synthesis of fluorescentCDs within the analytical time scale and the selective recognition of thetarget analyte. Microvolume fluorospectrometry is applied for measure-ment of the fluorescence quenching caused by methylmercury. The assayuses low amounts of organic precursors (fructose, poly(ethylene glycol),and ethanol) and can be accomplished within 1 min. A detection limit of5.9 nM methylmercury and a repeatability expressed as a relative standarddeviation of 2.2% (N = 7) were obtained. CDs displayed a narrow sizedistribution with an average size of 2.5 nm as determined by electrontransmission microscopy. To study the quenching mechanism, fluorescence, atomic absorption spectrometry, and Fouriertransform infrared spectrometry were applied. Hydrophobicity of methylmercury and its ability to facilitate a nonradiativeelectron/hole recombination are suggested as the basis of the recognition event. A simple and green assay is achieved for quickdetection of methylmercury without the use of tedious sample preparation procedures or complex and expensiveinstrumentation.
In the past several years, the development of fluorescentprobes for the rapid and simple detection of a wide variety of
analytes has attracted increasing attention. Organic dyes havebeen widely used as fluorescent probes, but these tend to havesome limitations such as poor photostability, narrow excitationspectra, and broad absorption bands with red tailing. Recently,new fluorescent systems have been proposed to overcome theselimitations. Among them, semiconductor nanocrystals, alsocalled quantum dots (QDs), have been extensively applied forthe detection of several ions and organic compounds.1−3 Themain properties of QDs are their broad absorption spectrum,narrow, symmetric, and tunable emission band, large quantumyields, and high photostability,4 which account for the superioroptical properties in comparison with those of conventionalorganic dyes. Nevertheless, the main drawbacks of QDs lie intheir complicated and expensive synthesis routes and theircomposition, since toxic elements are commonly present intheir structure.As a new alternative to QDs, carbon dots (CDs) have
recently been described by Xu et al.5 The main properties ofCDs include strong fluorescence, tunable color emission, andhigh photostability, but the main features that make themattractive are the absence of toxic elements and the ease ofsynthesis using simple, inexpensive, and ecofriendly carbonsources, such as glucose, sucrose, citric acid, or glycerol, amongothers.In spite of the great potential of CDs for detection of
chemical species, only a few works have reported the use of
CDs as luminescent probes.6 Concerning the analysis of metalions, the most widely studied analyte is Hg(II),7−10 whichusually causes the fluorescence quenching of CD-basedsystems.Mercury is a well-known environmental pollutant, its main
organic form (i.e., methylmercury) being more toxic to livingsystems than inorganic species11 due to its lipid solubility andability to cross biological membranes. Methylmercury has beenrecognized as a potent neurotoxin that causes damage to thebrain and nervous system, being particularly hazardous forpregnant women and infants.12 Methylmercury is able to beaccumulated and bioamplified in the human body through thefood chain, so the main human exposure to methylmercury islinked to fish consumption.13 Usually, complex hyphenatedtechniques based on separation techniques such as high-performance liquid chromatography (HPLC), gas chromatog-raphy (GC), or capillary electrophoresis (CE) coupled to aspecific detector such as mass spectrometry (MS),14 inductivelycoupled plasma mass spectrometry (ICPMS),15 or atomicfluorescence spectrometry (AFS),16 are required for methyl-mercury detection. In addition, implementation of extraction/preconcentration procedures is usually needed.14,17−22 Nowa-days, there is a need for simple and fast assays that can be
Received: February 6, 2014Accepted: March 28, 2014
Article
pubs.acs.org/ac
© XXXX American Chemical Society A dx.doi.org/10.1021/ac500517h | Anal. Chem. XXXX, XXX, XXX−XXX
applied for on-site analysis, focused on the sensitive detectionof toxic metal species such as methylmercury. To date, no workregarding the detection of methylmercury using CD-basedsystems has been reported.Several pathways have been reported for the synthesis of
fluorescent CDs, including microwave treatment, thermalcarbonization, acid dehydration, electrochemical methods, andultrasonic treatment.6,23 It is well-known that ultrasonicirradiation causes a variety of physical and chemical effectsderived from acoustic cavitation and provides a uniqueinteraction between energy and matter.24,25 Until now, onlythree synthetic pathways have been proposed for the fabricationof fluorescent CDs by ultrasonic treatment.26−28 In spite of thegreat advantages of using ultrasound energy for synthesizingCDs, the time required is too large (from 2 to 24 h), probablydue to use of low-intensity ultrasonic devices (e.g., ultrasonicbath). In addition, the processes of synthesis, functionalization,and later interaction of CDs with the target analyte, to preparethe fluorescent probe, are very time-consuming. An alternativeway to overcome this drawback would be to carry out in situsynthesis of CDs in the presence of the analyte to be detected.Therefore, the synthesis and interaction with the target analytewould occur almost at the same time.Herein, we describe for the first time a fluorescent assay
based on in situ ultrasound-assisted synthesis of CDs using D-fructose as the carbon source for the detection ofmethylmercury. Carbon dot growth under ultrasonic treatmentin the presence of the target analyte extends the potential ofCD-based systems as fluorescent probes. A sensing mechanismaccounting for the selectivity of the assay toward methyl-mercury is outlined.
■ EXPERIMENTAL SECTIONReagents and Chemicals. Ultrapure water was obtained
from an Ultra Clear TWF EDI UV TM system (Siemens AG,Barsbuettel, Germany).
D-Glucose, D-fructose, sucrose, glycerol, citric acid, bovineserum albumin (BSA), glutathione (GSH), and L-cysteine(Sigma-Aldrich, St. Louis, MO) and starch (Probus, Badalona,Barcelona, Spain) were tested as carbon sources.Alcohols, including methanol (Prolabo, Paris, France),
ethanol (Prolabo), 1-propanol (Sigma-Aldrich), 2-propanol(Merck, Darmstadt, Germany), and 1-butanol (Prolabo), weretried for the synthesis of CDs.Poly(ethylene glycol) (PEG; Mw = 200) was purchased from
Sigma-Aldrich. NaOH, HNO3, and HCl were obtained fromProlabo.A 1000 mg L−1 stock solution of CH3Hg
+ was prepared fromCH3HgCl (Riedel-de Hae n, Seelze, Germany). Workingsolutions were prepared by dilution of the stock solution asrequired.The following compounds were employed for assessing the
selectivity of the sensing approach: As2O3 (Merck), Bi5O-(OH)9(NO3)4 (Merck), CaCO3 (Aldrich), CaSO4·2H2O(Merck), CdO (Aldrich), CoCl2·6H2O (Scharlau, Barcelona,Spain), ethylenediaminetetraacetic acid (EDTA) (Carlo Erba),K2Cr2O7 (Prolabo), KNO3 (Probus), CuCl2·2H2O (Merck),FeCl3·6H2O (Sigma), HgCl2 (Prolabo), humic acid (Fluka),MgCl2·6H2O (Prolabo), NaCl (Sigma-Aldrich), Ni(NO3)2·6H2O (Panreac, Barcelona, Spain), Pb(NO3)2 (Panreac), SbCl3(Carlo Erba, Italy), Na2SeO3 (Aldrich), and Sn (Probus). Inaddition, two organometals, i.e., methylcyclopentadienylmanga-nese tricarbonyl (MMT) and tetrabutyltin, purchased from
Aldrich and Merck, respectively, were also tried as potentialinterfering agents.The applicability of the method for CH3Hg
+ detection inwater and marine animal tissues was evaluated using thefollowing certified reference materials (CRMs): DORM-3 (fishprotein) and DOLT-4 (dogfish liver) from the NationalCouncil of Canada (Ottawa, Ontario, Canada) and BCR 464(tuna fish muscle) and BCR 610 (groundwater) from theCommunity Bureau of Reference (Brussels, Belgium). Thelatter CRM was fortified due to the absence of methylmercury.In addition, recovery studies were performed with several realwater samples.
Apparatus. A Sonopuls ultrasonic processor model HD3200 (Bandelin electronic-GmbH & Co. KG, Berlin, Germany)with an output power of 200 W and a frequency of 20 ± 0.5kHz was used for both CD synthesis and methylmercuryextraction from fish. This system is equipped with an MS 72titanium microtip of 2 mm diameter, which allows working withsample volumes in the range of 2−30 mL.A Thermo Scientific NanoDrop 3300 fluorospectrometer
was used to carry out fluorescence measurements. Thetechnical specifications and operation mode have been outlinedin earlier works.29,30 Fluorescence measurements wereperformed at 517 nm after excitation at a wavelength of 470nm using the blue LED. This portable instrument is well suitedto field analysis since it only requires connection through aUSB to a computer. UV− vis absorption measurements wereperformed using a NanoDrop model ND-1000 spectropho-tometer.Transmission electron microscopy (TEM) was performed
with a JEOL JEM-1010 microscope operating at an accelerationvoltage of 100 kV. The TEM samples were prepared bydropping the sample onto a carbon-coated copper grid.Fourier transform infrared (FT-IR) spectra were recorded on
a Nicolet 6700 spectrometer within the range of 400−4000cm−1 with a resolution of 4 cm−1.To study the selectivity of the fluorescent assay toward
methylmercury in the presence of Hg(II), a direct mercuryanalyzer DMA-1 (Milestone Srl, Sorisole, Italy) was used. ThisHg analyzer does not require any sample preparation. Total Hgis directly converted into Hg vapor upon sample combustionfollowed by amalgamation and measurement by atomicabsorption. Experiments were undertaken under the followinginstrument parameters: sample drying for 120 s at 200 °C,sample decomposition for 180 s at 750 °C, waiting for 30 s, andamalgam heating for 12 s.
Sample Preparation. The ultrasound-assisted extraction inmarine animal tissues was carried out as follows: A 0.4 g sampleof each CRM (BCR 464, DORM-3, and DOLT-4) wasaccurately weighed into polypropylene centrifuge tubes. Then 5mL of 5 M HCl solution was added, and the suspension wassonicated at room temperature for 4 min at 12% sonicationamplitude. After extraction, the supernatant was subjected tofiltration through a PTFE syringe filter (0.45 μm pore size) andcleanup using C18 cartridges. Blanks were treated in the sameway. Water samples were filtrated through 0.45 μm cellulosenitrate filters (Sartorius) and stored at 4 °C.
Experimental Procedure for in Situ Synthesis of CDsand CH3Hg
+ Sensing. First, 40−45 mg of D-fructose wasplaced in a 7 mL glass vial. Then 1 mL of acidified water sampleor standard (0.1 M HCl) was added, and D-fructose wasdissolved. Later, 1.2 mL of PEG, 200 μL of 3.5 M NaOH, and100 μL of ethanol were added to the mixture. Finally, the
Analytical Chemistry Article
dx.doi.org/10.1021/ac500517h | Anal. Chem. XXXX, XXX, XXX−XXXB
mixture was subjected to ultrasound irradiation for 60 s at 10%sonication amplitude with the ultrasonic probe directly insertedinto the sample vial. The color of the bulk solution changedfrom clear to light yellow and then to brown. Lastly, when thesolution reached room temperature, a 2 μL aliquot of thesample was withdrawn and placed onto the pedestal of themicrofluorospectrometer to measure the fluorescence signal. Ablank experiment was performed before each measurement.
■ RESULTS AND DISCUSSION
Ultrasonic Synthesis of CDs: Optimization of Exper-imental Parameters. To evaluate the effects of the differentvariables involved in the CD-based assay for methylmercurydetection and the interactions between variables, the 2V
5−1
factorial fractional design was applied for screening optimiza-tion.31 This design allows assessment of the effect of 5 variableswith 16 experiments. The significance of variable effects andtheir interactions were established by comparison with theexperimental error, calculated as 2 times the average standarddeviation of all experiments. Standardized effects are shown inFigure S-1 (Supporting Information). As can be observed, allstudied variables had a significant effect, and no relevantinteractions between them were found, so the effect of thesevariables was investigated in detail following the univariateapproach.Selection of the Carbon Source and Concentration.
Since sonochemical synthesis of CDs has not been extensivelystudied to date, a preliminary evaluation of the different carbonsources to synthesize CDs with suitable optical properties wasmade.In this sense, several carbon precursors were tested, including
D-glucose, D-fructose, sucrose, starch, glycerol, citric acid, BSA,and GSH using 30 mg of each compound. Nevertheless, onlyglucose, fructose, and starch gave rise to fluorescent CDs. In therest of the cases, no fluorescent signal was observed in spite ofthe fact that longer sonication times (up to 7 min) wereemployed. Given that the sonication time needed to form CDsvaried for the different carbon sources, the formation kinetics
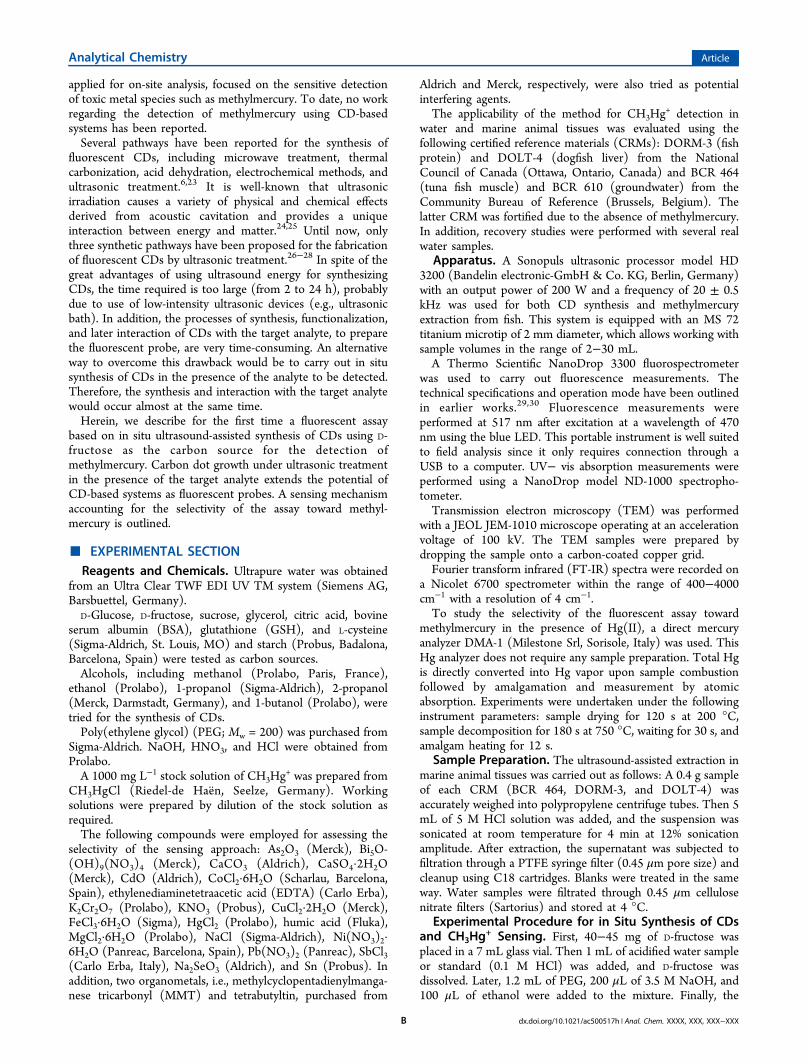
were studied upon application of different sonication times.The results are shown in Figure 1A.
Figure 1. (A) Analytical response for the different carbon sources used as precursors of fluorescent CDs. (B) Effect of fructose mass (B). Effect ofHCl concentration (C). Effect of NaOH concentration (D). The solid line represents the analytical response (I0/I), whereas the dotted line indicatesthe intrinsic fluorescence intensity (relative fluorescence units, RFU) of CDs.
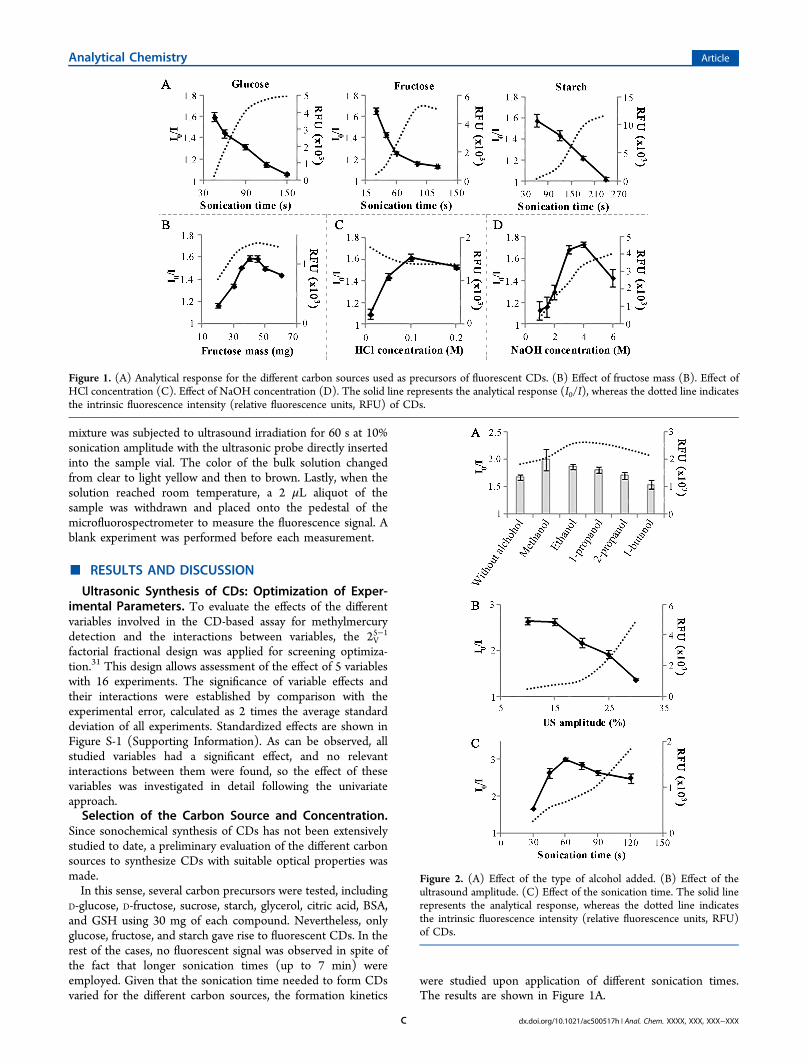
Figure 2. (A) Effect of the type of alcohol added. (B) Effect of theultrasound amplitude. (C) Effect of the sonication time. The solid linerepresents the analytical response, whereas the dotted line indicatesthe intrinsic fluorescence intensity (relative fluorescence units, RFU)of CDs.
Analytical Chemistry Article
dx.doi.org/10.1021/ac500517h | Anal. Chem. XXXX, XXX, XXX−XXXC
As can be observed in Figure 1A (dotted line), CDs aresynthesized in short sonication times using glucose or fructose,whereas longer times are needed to achieve the formation offluorescent CDs from starch as the carbon source. It must behighlighted that, at the end of the reaction, the intrinsicfluorescence intensity of CDs synthesized from starch is nearly3-fold higher than that for glucose or fructose, probably due tothe large number of glucose units contained in its structure.To evaluate the most suitable CD precursor for sensing
CH3Hg+, the synthesis experiments were performed in the
presence of CH3Hg+ and the fluorescence signal wasmonitorized at different sonication times. It was observed(Figure 1A, solid line) that the formation kinetics were notaltered by the presence of CH3Hg
+ but the fluorescence of CDs
was quenched. With all CD precursors tested, the effect on thefluorescence intensity was higher with a decrease of thesonication time. In fact, sonication times of 40, 45, and 60 s forD-fructose, D-glucose, and starch, respectively, provided the bestanalytical responses (I0/I). In view of the obtained results,fructose was selected as the carbon source for furtherexperiments. It should be highlighted that the time requiredfor the synthesis of fluorescent CDs is remarkably lower thanthat reported, i.e., 2−24 h.26−28
The effect of fructose mass was also studied. As can be notedin Figure 1B, this variable notably affects both the intrinsicfluorescence intensity of CDs and the analytical response in thepresence of CH3Hg
+. A D-fructose mass in the range of 40−45mg provides both a suitable intrinsic fluorescence intensity ofCDs (dotted line) and a good analytical response (solid line).
Effect of pH. Several studies have revealed that the pH ofthe medium strongly influences the fluorescence of CDs,32,33 sothe study of this variable is critical for the development of thefluorescent assay.It must be mentioned that, although the final pH of synthesis
must be strongly basic for CD formation, an acidic medium wasused in the sample solution to ensure the stability of CH3Hg
+
prior to the assay. Therefore, the HCl concentration wasstudied in the range of 0.01−0.2 M (Figure 1C). It was foundthat the analytical response increased with the HClconcentration up to 0.1 M and then a plateau was reached,so this concentration was chosen for further experiments.As has been mentioned above, the presence of a basic
medium is mandatory for the synthesis of fluorescent CDs. Forthis, 200 μL of NaOH was added to the medium beforesonochemical treatment. The effect of NaOH concentration inthe range of 1−6 M was studied (Figure 1D). A strong effect onthe fluorescence of CDs was observed, a steady analyticalresponse being found for NaOH concentrations in the range of3−4 M. Probably, this effect is due to the deprotonation ofgroups at the CD surface leading to the repulsion of fluorescentCDs. A 200 μL sample of 3.5 M NaOH was injected into thesynthesis medium to achieve optimal performance. Under thoseconditions, the final pH of the medium was ∼13.
Table 1. Comparison of Analytical Characteristics of Different Methods for CH3Hg+ Detection
methoda linear range LOD (nM) repeatability (%) ref
HPLC−VG-AFS 5.1 1.6 16micro-HPLC−ICPMS 0.1 0.5−2.1 15SPME−ICPMS 0−6.9 μM 0.9 2.4 20SDME−HPLC−photometry 23−556 nM 4.6 5.3 21HS-SDME−ETAAS 0−1.4 μM 20 7.0 22DLLME−CE 46−927 nM 8.3 3.2 17DLLME−HPLC−ICPMS 0.05−9.27 nM 0.04 6.8 18DLLME−HPLC−DAD 23−463 nM 4.4 7.3 19SBSE−TD−GC/MS 0.5−46.4 nM 0.1 14fluorene-based chemodosimeter (spectrofluorimetry) 0−60 μM 44.0 35metal−organic framework (spectrofluorimetry) 0−14 μM 27.8 36lysozyme-type VI-stabilized Au NCs (spectrofluorimetry) 15−500 nM 4.0 37Rhodamine 6G-modified Au NPs (spectrofluorimetry) 0.05−10 μM 10 38CD nanoprobe microfluorospectrometry 23−278 nM 5.9 2.2 this work
aAbbreviations: AFS, atomic fluorescence spectrometry; CE, capillary electrophoresis; CVG, chemical vapor generation; DAD, diode array detection;DLLME, dispersive liquid−liquid microextraction; ETAAS, electrothermal atomic absorption spectrometry; FI, flow injection; GC, gaschromatography; HPLC, high-performance liquid chromatography; HS-SDME, headspace single-drop microextraction; ICP, inductively coupledplasma; MS, mass spectrometry; NCs, nanoclusters; NPs, nanoparticles; SBSE, stir bar sorptive extraction; SDME, single-drop microextraction;SPME, solid-phase microextraction; TD, thermal desorption; VG, vapor generation.
Table 2. Analytical Results for the Detection of CH3Hg+ in
Water Samples and Certified Reference Materials
Water Samples
sampleadded CH3Hg
+ concn(nM)
found CH3Hg+ concn
(nM)recovery(%)
river water 0 <LODa
46 43.6 ± 3.5 94.8116 111 ± 7 95.7232 219 ± 14 94.4
tap water 0 <LOD46 42.3 ± 2.5 92.0116 104 ± 8 89.7232 214 ± 14 92.2
sea water 0 <LOD46 45.7 ± 1.6 99.3116 119 ± 9 103232 234 ± 5 101
BCR-610 23 20.9 ± 1.3 90.9Marine Animal Tissues
CRMcertified value
(mg/kg of CH3Hg+)
found value(mg/kg of CH3Hg
+)recovery(%)
BCR 464 5.50 ± 0.17 6.28 ± 0.47 114DOLT-4 1.43 ± 0.129 1.34 ± 0.084 93.7DORM-3 0.381 ± 0.060 0.369 ± 0.040 96.9
aLOD = detection limit.
Analytical Chemistry Article
dx.doi.org/10.1021/ac500517h | Anal. Chem. XXXX, XXX, XXX−XXXD
Effect of the PEG Concentration. Addition of PEG wasneeded to achieve fluorescent CDs due to its effects as apassivation agent. The effect of the PEG concentration wasstudied in the range of 40−80% (v/v). We found that aconcentration of 50% (v/v) is enough to achieve the bestresults, since the intrinsic fluorescence intensity remainsconstant at higher concentrations and a maximum analyticalresponse is achieved. Therefore, 50% (v/v) PEG was employedfor the rest of the experiments.Effect of Alcohol Addition. The addition of organic
compounds in sonochemical synthesis of metallic nanoparticlesleads to an increase in the reaction kinetics due to thegeneration of a large number of secondary radicals.34 For thisreason, the effect of different alcohols (i.e., methanol, ethanol,1-propanol, 2-propanol, and 1-butanol) on CD synthesis wasstudied.
Figure 2A shows the obtained results for the differentstraight-chain alcohols tested. An increase in the intrinsicfluorescence intensity of CDs as well as an improvement of theanalytical response, except in the case of 1-butanol, wereobserved. The addition of methanol caused a significantuncertainty within replicates. A 100 μL sample of ethanol wasadded for further experiments since it provides suitablesensitivity and precision.
Effect of the Sonication Amplitude and Time. Thesonication amplitude was also studied in the range of 10−30%.As can be observed in Figure 2B, the best analytical response isachieved at low sonication amplitude (10−15%), while highervalues give rise to a decrease in the analytical response. On theother hand, the intrinsic fluorescence intensity of CDsdecreases with a decrease of the sonication amplitude. Thesonication time was studied in the range of 30−120 s. It can beobserved that the intrinsic fluorescence intensity increases with
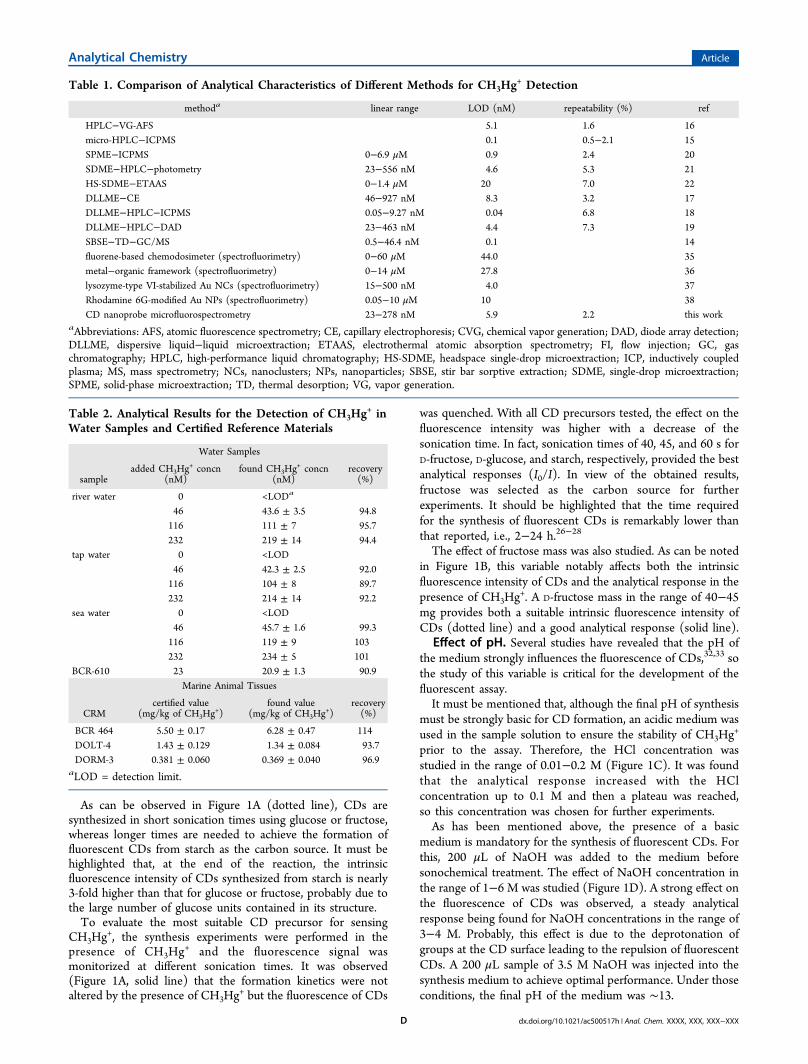
Figure 3. TEM images of CDs (A) prepared under optimized conditions, (B) prepared in the absence of PEG, and (C) prepared by application ofultrasound energy for 2 min. (D) FT-IR spectra for the different samples studied. (E) Volatilization experiments of Hg(II) and CH3Hg
+ in samplescontaining fructose + PEG with and without ultrasonic treatment (the percentage of Hg remaining after hydridation is shown).
Table 3. Comparison of the Main Characteristics of Synthesis Procedures for CDs
synthetic approach precursora CD size (nm) total time for synthesis total volume (mL) ref
microwave treatment citric acid/1,2-EDA 3 2 min + dialysis for 3 days 10 39glucose/PEG200 5 2 min + dialysis overnight 100 33
hydrothermal method EG/H2SO4 1−4 8 h 30 8BSA/H2SO4 1−2 2 h + dialysis 4 32citric acid/BPEI 4−10 3 h 10 40lactose/Tris 1.5 24 h + dialysis for 2 days 40 41PEG200/NaOH 5 6 h + dialysis 60 9
ultrasonic treatment (bath) glucose/NH4OH 10 24 h + dialysis 100 28glucose/NaOH <5 28 h 120 26glucose/HCl <5 10 h 100 26active carbon/H2O2 5−10 15 h 75 27
ultrasonic treatment (probe) D-fructose/PEG/NaOH 2.5 1 min 2.5 this workaAbbreviations: BPEI, branched poly(ethylenimine); BSA, bovine serum albumin; 1,2-EDA, 1,2-ethylenediamine; EG, ethylene glycol; PEG,poly(ethylene glycol); PVP, poly(vinylpyrrolidone); Tris, tris(hydroxymethyl)aminomethane.
Analytical Chemistry Article
dx.doi.org/10.1021/ac500517h | Anal. Chem. XXXX, XXX, XXX−XXXE

the sonication time whereas the best analytical response isachieved within 60 s of sonication time, which provides a fastmethod for synthesis and sensing of CH3Hg
+.Study of Potential Interferences. The effect of potential
interferences (i.e., metal ions, organometals, salts, complexingagents, and natural organic matter) in the detection of CH3Hg
+
in water samples was studied. The results of this study areshown in Table S-1 (Supporting Information).None of the 16 metal species tested caused any noticeable
interference effect at 0.5 mg/L (signal variation within ±20%).Salts and complexing agents typically present in water samplessuch as MgCl2, NaCl, EDTA, KNO3, CaSO4, and CaCO3 andhumic acid (i.e., natural organic matter) did not cause anyinterference effect either. The absence of interference due toHg(II) ions must be highlighted. Hg(II) did not cause anynoticeable interference effect even at a concentration 250-foldhigher than that of CH3Hg
+, which makes the assay highlyselective for methylmercury detection.Analytical Characteristics and Recovery Studies.When
CD synthesis is performed in the presence of CH3Hg+, a
significant fluorescence quenching occurs and no spectral shiftof the emission band is observed (Figure S-2, SupportingInformation). The quenching effect is well described by theStern−Volmer equation
= +I I K C/ [Q]0 SV
where I0 is the fluorescence intensity of CDs synthesized in theabsence of CH3Hg
+, I is the fluorescence intensity afterquenching, KSV is the Stern−Volmer constant, Q is the analyteconcentration, and C is a constant.Analytical figures of merit were established under optimal
conditions for the detection of CH3Hg+. The calibration curve
was linear in the range of 23−278 nM CH3Hg+. The slope of
the calibration curve, which represents the Stern−Volmerconstant, was 1.1 × 10⁷ M−1. The limit of detection (LOD),estimated following the 3σ criterion, was 5.9 nM (∼1.2 ppb).The repeatability of the analytical response (i.e., I0/I),expressed as the relative standard deviation, was 2.2% (N =7), whereas the reproducibility studied as between-day
precision was 4.1% (N = 3). A comparison of several methodsfor the detection of CH3Hg
+ is displayed in Table 1.The figures of merit of our sensing approach for CH3Hg
+ arecomparable with or even better than those of methods usingexpensive and complicated chromatographic interfaces and/orpreconcentration steps. In situ synthesized CDs using high-intensity sonication allow a simple and fast detection ofCH3Hg
+, where simple, safe, and inexpensive precursors arerequired (i.e., fructose, ethanol, and PEG).
Analysis of Water and Fish. The accuracy of the CD-based assay for the detection of CH3Hg
+ was evaluated byanalyzing different certified reference materials of water andmarine animal tissues. Found contents in the marine tissueswere in agreement with the certified values for CH3Hg
+ in allcases (recoveries in the range of 93−114%), no significantdifferences being observed between the certified and exper-imental values (t test, p = 0.05). Several recovery studies werealso performed using different real water samples (i.e., river, tap,and sea waters). Recoveries of CH3Hg
+ in the water samplesvaried between 90% and 103%. The analytical results are shownin Table 2.
Characterization of the CD-Based Nanoprobe. Themorphology and size of CDs synthesized by sonochemicaltreatment of fructose were studied following TEM measure-ments. Under optimized conditions, CDs synthesized by ourproposed method are well dispersed and have a small size. Theinset in Figure 3A shows the size histogram to prove that as-prepared CDs are narrowly distributed with an average size of2.5 nm.In addition, the main function of PEG is the stabilization of
CDs, preventing their agglomeration and resulting in colloidalnanoparticles. This fact was verified by TEM analysis (Figure3A−C). In the case of performing the synthesis in the absenceof PEG (Figure 3B), the nanoparticle size was similar to that ofCDs synthesized in the presence of PEG, but CDagglomeration was found.Other experiments indicated that the sonication time had a
great effect on the size of CDs (Figure 3C). In fact, theapplication of ultrasound for 120 s instead of 60 s led to theformation of CDs with an average size of 7 nm, i.e., nearly 3times greater.To determine the surface functional groups, different
analyses by FT-IR were performed. As can be observed inFigure 3D, different bands were found for the studied species.The sharp band centered at ∼3350 cm−1 corresponds to thestretching vibrations of O−H groups, whereas the peakcentered at ∼2900 cm−1 is typically associated with sp3 C−Hstretching vibrations of alkane groups. The low-intensity peaksin the 400−1450 cm−1 range can be assigned to the bendingvibrations of C−H bonds. In this region, a peak centered at∼1080 cm−1 can be easily identified, which is attributed to thestretching vibrations of C−O. By comparing all FT-IR results, anew peak centered at 1643.4 cm−1 was found, which may beassigned to CO groups. This new peak may be due to thesonochemical treatment of fructose, which causes changes in itsstructure as revealed by the FT-IR spectra. All results suggestthat the surfaces of CDs are surrounded by hydrophilic groups,which accounts for the great potential of CDs for sensing inaqueous samples.Sonochemical synthesis of CDs has advantages over other
synthesis methods (e.g., microwave treatment, thermal carbon-ization, acid dehydration, or electrochemical methods, amongothers), including fast reaction rates and the production of very
Figure 4. Schematic representation of the mechanism involved in thefluorescence quenching caused by the presence of CH3Hg
+.
Analytical Chemistry Article
dx.doi.org/10.1021/ac500517h | Anal. Chem. XXXX, XXX, XXX−XXXF
small CDs and, thus, higher surface-to-volume ratio. The mainfeatures of the most widely applied synthesis methods to datefor CD formation are compared in Table 3.In view of the data reported in Table 3, the reduced time
required for the synthesis of CDs with a size near 2.5 nm mustbe highlighted. This reduced time allows one to use CDs for insitu sensing without the need for purification processes oradditional studies on stability and storing conditions. Anotherrelevant advantage of the proposed system resides in thepossibility of performing it at room temperature, which makesit a safe synthesis method. Another remarkable feature is thegood reproducibility of the synthesis procedure. In fact, norelevant changes in the optical properties of CDs were observedwhen they were synthesized on different days. A variationwithin ±1% in the intrinsic fluorescence intensity was observed,which is considerably lower than that obtained upon microwavetreatment of carbohydrates, i.e., one of the most extendedmethods for synthesis of CDs.Investigation of the Sensing Mechanism. To date,
several CD-based systems have been developed for metal iondetection, Hg(II) ions being the most studied. Nevertheless, tothe best of our knowledge, this is the first system based on theuse of CDs that allows the selective detection of CH3Hg
+. Themain recognition mechanism reported in the CD-based systemsfor Hg(II) detection involves the electrostatic interactionbetween Hg(II) ions and CD functional groups.8,9 Never-theless, the latter interaction is unlikely to occur in ourapproach since mercury species are not ionized. At the pH ofthe assay (i.e., pH 13), the Hg species present should beHg(OH)2 and CH3HgOH.
42
To go in depth into the quenching mechanism involved andmake an explanation for the high selectivity of the fluorescentassay toward CH3Hg
+, several experiments were performedwith solutions containing Hg(II) and CH3Hg
+.First, the possibility of losing Hg(II) by adsorption or
volatilization was considered. Adsorption onto the vessel wallscould occur when solutions of metal ions at trace level arestored. For testing potential losses by adsorption during theassay, alternative reaction vessels made of PTFE and quartzwere used. The results showed no effect caused by the wallmaterial on the analytical response, and the same behavior as inglass vials was found for both Hg species. Another process thatcould account for the different behavior of Hg(II) and CH3Hg
+
in the CD-based assay is the volatilization of Hg speciespromoted by ultrasound. Ultrasound-promoted volatilization ofHg(II) has been reported from acid solutions in the presence ofcertain organic additives.43 To study this process, solutionscontaining both Hg species were subjected to sonochemicaltreatment in the presence of all reaction components (i.e., D-fructose, PEG, NaOH, and EtOH), and the Hg remaining wasquantified by a direct mercury analyzer. It was found that bothspecies, Hg(II) and CH3Hg
+, remained in the solution after thesynthesis of CDs, which indicates that the selectivity of theassay cannot be ascribed to the loss of Hg(II) during thesonochemical treatment.In view of the above results, other characteristics such as
hydrophobicity of CH3Hg+ should be taken into account to
explain the selectivity of the assay. Hydrophobicity facilitatesthe permeation of CH3Hg
+ through the PEG coating, thusenhancing its further interaction with CDs. Therefore, CH3Hg
+
is expected to interact with CDs more strongly than Hg(II) forfluorescence quenching to occur. This different behavior couldbe probed using hydridation with NaBH4 and further analysis
of the Hg remaining in the solution following the sameapproach as above. The weaker the interaction of Hg specieswith CDs−PEG, the easier the volatilization by hydridation. Hganalysis in the reaction media containing fructose, PEG, NaOH,and EtOH was carried out with and without sonochemicaltreatment to compensate for any matrix effects in thehydridation procedure.As can be observed in Figure 3E, addition of 0.3 mg of
NaBH4 is needed to volatilize 90% of the initial Hg(II),regardless of whether CD synthesis takes place. This findingmeans that no interaction between CDs−PEG and Hg(II)exists. On the other hand, CH3Hg
+ was volatilized byhydridation with 0.2 mg of NaBH4 when no CD formationwas carried out. However, when CD synthesis is performed inthe presence of CH3Hg
+, only 35% of the initial amount of thismethylated Hg species can be volatilized, meaning that itbecomes strongly attached to CDs−PEG. Once CH3Hg
+ isattached to CDs, fluorescence quenching should occur. To gaininsight into the quenching mechanism involved in the sensingof CH3Hg
+, several studies were performed. First, emission andabsorption spectra were obtained, and no shift of spectral bandswas observed (Figure S-2, Supporting Information). Thisimplies that neither changes of the CD composition norformation of a complex occurs, so static quenching should bediscarded. When dynamic quenching occurs, collisions betweenfluorophores and quenchers are involved, and these areinfluenced by the temperature and viscosity of the medium.44
It was found that the calibration slope is affected by changes ofthese parameters, hence confirming that dynamic quenching iscaused by collisions between CDs and CH3Hg
+ when the latterpasses through the PEG layer. Ultimately, fluorescencequenching occurs as a result of nonradiative electron/holerecombination through an effective electron transfer process, ashas been suggested for other QD-based systems.7
Additional studies made with thiol-containing compoundssupport our proposed mechanism. One key feature of L-cysteine or GSH lies in its ability to form complexes with Hg-containing compounds through thiol groups. Upon addition ofeach compound prior to the synthesis of CDs, the complex-ation of CH3Hg
+ with L-cysteine or GSH should preventfurther interactions of CH3Hg
+ with CDs. Indeed, it was foundthat no fluorescence quenching occurred when the CDsynthesis was performed in the presence of CH3Hg
+ andthiol-containing compounds. Nevertheless, when the additionof those thiols is carried out after synthesis of CDs in thepresence of CH3Hg
+, no recovery of the fluorescence isachieved, probably due to the strong entrapment of CH3Hg
+.Therefore, thiol compounds are not able to remove it from theCD surface.It was observed that the addition of CH3Hg
+ to the reactionmedium after CD synthesis caused only a weak fluorescencequenching (ca. 3-fold lower than that for direct synthesis in thepresence of CH3Hg+) and complete recovery of thefluorescence occurred upon addition of L-cysteine or GSH.This finding indicates that CH3Hg
+ is integrated within theCDs−PEG during sonochemical synthesis, and therefore, thosethiols are not able to remove CH3Hg
+ by complexation. Thisexperiment confirms the results obtained above usinghydridation with NaBH4.Thus, the selectivity of the assay can be ascribed to the
different abilities of both Hg species to interact with CDsencapsulated in PEG. CH3Hg
+, a hydrophobic species, shouldeasily cross the PEG coating and come into contact with CDs,
Analytical Chemistry Article
dx.doi.org/10.1021/ac500517h | Anal. Chem. XXXX, XXX, XXX−XXXG
this increased transport being facilitated by ultrasound. Hg(II),a hydrophilic Hg species, cannot interact in this way with CDs,and no fluorescence quenching should be expected. In contrastto other fluorescent assays involving CDs,8,9 no interactionbetween Hg(II) and surface hydrophilic groups from PEG (i.e.,−OH and −COOH) can occur under these conditions, as theHg species present at the pH of this assay is Hg(OH)2. Thesuggested mechanism involved in the recognition of CH3Hg
+ isoutlined in Figure 4.
■ CONCLUSIONSIntegration of fluorescent CD synthesis and sensing within asingle step allows an optical nanoprobe to be built, which hasproved to be highly selective for CH3Hg
+ detection at thenanomolar level. A recognition event based on the hydro-phobicity of CH3Hg
+ and its ultrasound-assisted permeationthrough the passivation coating made of PEG is proposed. Theassay can be accomplished within 1 min and is well suited forfield analysis with the use of a portable fluorospectrometer.
■ ASSOCIATED CONTENT*S Supporting InformationAdditional information as noted in text. This material isavailable free of charge via the Internet at http://pubs.acs.org/
■ AUTHOR INFORMATIONCorresponding Author*Phone: +34-986-812281. Fax: +34-986-812556. E-mail:[email protected] authors declare no competing financial interest.
■ ACKNOWLEDGMENTSFinancial support from the Spanish Ministry of Economy andCompetitiveness (Project CTQ2012-32788) and the EuropeanCommission (FEDER) is gratefully acknowledged. I.C.-M.thanks the University of Vigo and V.R. thanks the SpanishMinistry of Education, Culture and Sports for predoctoralresearch grants. E. Lopez and J. B. Rodriguez (CACTI,University of Vigo) are gratefully acknowledged for performingthe FT-IR and TEM measurements, respectively.
■ REFERENCES(1) Costa-Fernandez, J. M.; Pereiro, R.; Sanz-Medel, A. TrAC, TrendsAnal. Chem. 2006, 25, 207−218.(2) Frasco, M. F.; Chaniotakis, N. Sensors 2009, 9, 7266−7286.(3) Freeman, R.; Willner, I. Chem. Soc. Rev. 2012, 41, 4067−4085.(4) Resch-Genger, U.; Grabolle, M.; Cavaliere-Jaricot, S.; Nitschke,R.; Nann, T. Nat. Methods 2008, 5, 763−775.(5) Xu, X.; Ray, R.; Gu, Y.; Ploehn, H. J.; Gearheart, L.; Raker, K.;Scrivens, W. A. J. Am. Chem. Soc. 2004, 126, 12736−12737.(6) Silva, J. C. G. E. d.; Goncalves, H. M. R. TrAC, Trends Anal.Chem. 2011, 30, 1327−1336.(7) Zhou, L.; Lin, Y.; Huang, Z.; Ren, J.; Qu, X. Chem. Commun.2012, 48, 1147−1149.(8) Liu, Y.; Liu, C.-y.; Zhang, Z.-y. Appl. Surf. Sci. 2012, 263, 481−485.(9) Liu, R.; Li, H.; Kong, W.; Liu, J.; Liu, Y.; Tong, C.; Zhang, X.;Kang, Z. Mater. Res. Bull. 2013, 48, 2529−2534.(10) Goncalves, H.; Jorge, P. A. S.; Fernandes, J. R. A.; Silva, J. C. G.E. d. Sens. Actuators, B 2010, 145, 702−707.(11) Morel, F. M. M.; Kraepiel, A. M. L.; Amyot, M. Annu. Rev. Ecol.Syst. 1998, 29, 543−566.
(12) Castoldi, A. F.; Coccini, T.; Ceccatelli, S.; Manzo, L. Brain Res.Bull. 2001, 55, 193−203.(13) Díez, S.; Delgado, S.; Aguilera, I.; Astray, J.; Perez-Gome, B.;Torrent, M.; Sunyer, J.; Bayona, J. M. Arch. Environ. Contam. Toxicol.2009, 56, 615−622.(14) Ito, R.; Kawaguchi, M.; Sakui, N.; Honda, H.; Okanouchi, N.;Saito, K.; Nakazaw, H. J. Chromatogr., A 2008, 1209, 267−270.(15) Castillo, A.; Roig-Navarro, A. F.; Pozo, O. J. Anal. Chim. Acta2006, 577, 18−25.(16) Ai, X.; Wang, Y.; Hou, X.; Yang, L.; Zheng, C.; Wu, L. Analyst2013, 138, 3494.(17) Yang, F.; Li, J.; Lu, W.; Wen, Y.; Cai, X.; You, J.; Ma, J.; Ding, Y.;Chen, L. Electrophoresis 2013, 00, 1−8.(18) Jia, X.; Hana, Y.; Liua, X.; Duana, T.; Chena, H. Spectrochim.Acta, Part B 2011, 66, 88−92.(19) Gao, Z.; Ma, X. Anal. Chim. Acta 2011, 702, 50−55.(20) Mester, Z.; Lam, J.; Sturgeon, R.; Pawliszyn, J. J. Anal. At.Spectrom. 2000, 15, 837−842.(21) Pena-Pereira, F.; Lavilla, I.; Bendicho, C.; Vidal, L.; Canals, A.Talanta 2009, 78, 537−541.(22) Gil, S.; Fragueiro, S.; Lavilla, I.; Bendicho, C. Spectrochim. Acta,Part B 2005, 60, 145−150.(23) Baker, S. N.; Baker, G. A. Angew. Chem., Int. Ed. 2010, 49,6726−6744.(24) Bendicho, C.; Calle, I. D. L.; Pena, F.; Costas, M.; Cabaleiro, N.;Lavilla, I. TrAC, Trends Anal. Chem. 2012, 31, 50−60.(25) Capelo-Martínez, J. L. Ultrasound in Chemistry; John Wiley &Sons: Weinheim, Germany, 2009.(26) Li, H.; He, X.; Liu, Y.; Huang, H.; Lian, S.; Lee, S.-T.; Kang, Z.Carbon 2011, 49, 605−609.(27) Li, H.; He, X.; Liu, Y.; Yu, H.; Kang, Z.; Lee, S.-T. Mater. Res.Bull. 2011, 46, 147−151.(28) Ma, Z.; Ming, H.; Huang, H.; Liu, Y.; Kang, Z. New J. Chem.2012, 36, 861−864.(29) Costas-Mora, I.; Romero, V.; Pena-Pereira, F.; Lavilla, I.;Bendicho, C. Anal. Chem. 2011, 83, 2388−2393.(30) Costas-Mora, I.; Romero, V.; Pena-Pereira, F.; Lavilla, I.;Bendicho, C. Anal. Chem. 2012, 84, 4452−4459.(31) Box, G. E. P.; Hunter, J. S.; Hunter, W. G. Statistics forExperimenters, 1st ed., John Wiley & Sons, Inc.: Hoboken, NJ, 2005.(32) Wee, S. S.; Ng, Y. H.; Ng, S. M. Talanta 2013, 116, 71−76.(33) Liu, J.-M.; Lin, L.-p.; Wang, X.-X.; Lin, S.-Q.; Cai, W.-L.; Zhang,L.-H.; Zheng, Z.-Y. Analyst 2012, 137, 2637−2642.(34) Caruso, R. A.; Ashokkumar, M.; Grieser, F. Langmuir 2002, 18,7831−7836.(35) Ding, L.; Zou, Q.; Su, J. Sens. Actuators, B 2012, 168, 185−192.(36) Xu, F.; Kou, L.; Jia, J.; Hou, X.; Long, Z.; Wang, S. Anal. Chim.Acta 2013, 804, 240−245.(37) Lin, Y.-H.; Tseng, W.-L. Anal. Chem. 2010, 82, 9194−9200.(38) Chang, H.-Y.; Hsiung, T.-M.; Huang, Y.-F.; Huang, C.-C.Environ. Sci. Technol. 2011, 45, 1534−1539.(39) Du, F.; Zeng, F.; Ming, Y.; Wu, S. Microchim. Acta 2013, 180,453−460.(40) Dong, Y.; Wang, R.; Li, G.; Chen, C.; Chi, Y.; Chen, G. Anal.Chem. 2012, 84, 6220−6224.(41) Zhang, Y.-Y.; Wu, M.; Wang, Y.-Q.; He, X.-W.; Li, W.-Y.; Feng,X.-Z. Talanta 2013, 117, 196−202.(42) Bittrich, D. R.; Chadwick, S. P.; Babiarz, C. L.; Manolopoulos,H.; Rutter, A. P.; Schauer, J. J.; Armstrong, D. E.; Collett, J.; Herckes,P. Aerosol Air Qual. Res. 2011, 11, 161−169.(43) Gil, S.; Lavilla, I.; Bendicho, C. Anal. Chem. 2006, 78, 6260−6264.(44) Lakowicz, J. R. Principles of Fluorescence Spectroscopy; Springer:New York, 2006.
Analytical Chemistry Article
dx.doi.org/10.1021/ac500517h | Anal. Chem. XXXX, XXX, XXX−XXXH


![Fluorescent cellulose aerogels containing covalently immobilized (ZnS) ₓ (CuInS ₂) ₁₋ ₓ/ZnS (core/shell) quantum dots [2013]](https://static.fdokumen.com/doc/165x107/63372dc94554fe9f0c05b209/fluorescent-cellulose-aerogels-containing-covalently-immobilized-zns-cuins.jpg)