In itiatin g C o verage CSB Bank
27
Initiating Coverage Turnaround Story CSB Bank (erstwhile Catholic Syrian Bank) has undergone a transformation in last few years after Mr CV Rajendran was appointed as CEO in Dec-16 and after RBI took an exception and permitted a 51% stake by Fairfax India Holdings in Jul-2018. From strengthening its top management, to moving towards product based lending approach, along with balance sheet clean up and improvement in core operating metrics, the bank is now well placed for growth along with adequate capital backing. We expect RoAs to rise to 1.3/1.4% by FY22E/23E led by improving PPoP profile and decline in credit costs. We initiate with an BUY rating with TP of Rs320, valuing the bank at 2.2x Mar-23 P/ABV. Healthy growth prospects with niche in Gold, SME business With ~40% of advances towards gold loans as of 3QFY21, the gold business has helped the bank deliver heathy growth and profitability metrics even amidst the last few quarters of stress and risk aversion. Post the completion of consolidation in SME book undergoing over the last few years, the book is well poised to see accelerated growth. This along with increased lateral hiring at market based compensation and product strategy led by business teams instead of branches should aid a 23-25% over FY22-23E in our view (~20% in FY21E). Improving spreads, subdued CD ratio positive for NIM CSB has a sticky depositor base and amongst the lowest TD/SA rates in industry. Despite lowest SA rates at 2.1%, CASA growth was above industry at 24% YoY in 3QFY21. Margins also benefit from rise in CD ratio (74% as of 3QFY21) and higher gold lending yields, which increased by ~250 bps since end of FY19 despite a declining interest rate scenario. Consequently, NIM improved by over 100 bps over the last seven quarters. We expect margins to stabilize at 4.2-4.5%. Balance sheet risks have come off; limited COVID stress so far Slippages averaged at 1.9% for FY19-20 (2.5% for 9MFY21) against 4.4% of slippages over FY14-18, driven by improved quality of SME portfolio and higher share of gold loans. We expect slippages to be sub 2% in FY22-23E. COVID related stress was limited and lower than peers with decline in pro forma NPAs since Mar-20, restructured book at 0.6%, and SMA (0/1/2/) portfolio at 2.5%. Multiple levers for RoA improvement; Initiate with BUY We expect PPoP/assets to improve to 2.5% by FY22E, driven by healthy NIM at over 4%, higher core fee lines, moderation in opex ratios, and healthy growth metrics. Backed by improved execution capabilities, a strong balance sheet after consolidation in Corp/SME books, and decline in credit costs, we feel the bank is well positioned to deliver a 15% RoE by FY23E. We value the bank 2.2x FY23E P/ABV and initiate with a BUY rating with TP of Rs320. FINANCIALS (Rs Mn) Particulars FY19A FY20A FY21E FY22E FY23E Net Interest Income 4,400 5,923 9,044 10,226 12,166 Growth(%) 34.6 52.7 13.1 19.0 PPOP 134 2,806 5,266 6,071 7,653 PAT (1,974) 127 2,134 3,209 4,153 Growth(%) (106.4) 1577.2 50.4 29.4 EPS (Rs) (23.0) 0.7 12.3 18.5 23.9 ABV (Rs) 42.0 89.6 101.3 121.4 145.4 ROA (%) (1.2) 0.1 1.0 1.3 1.4 ROE(%) (23.6) 0.9 10.3 13.8 15.3 PER(x) (9.9) 309.8 18.5 12.3 9.5 P/ABV (x) 5.4 2.5 2.2 1.9 1.6 CMP Rs 227 Target / Upside Rs 320 / 41% NIFTY 14,762 Scrip Details Equity / FV Rs 1,735mn / Rs 10 Market Cap Rs 39bn USD 536mn 52-week High/Low Rs 268/ 96 Avg. Volume (no) 440,776 Bloom Code CSBBANK IN Price Performance 1M 3M 12M Absolute (%) 1 (2) 33 Rel to NIFTY (%) 1 (2) 32 Shareholding Pattern Jun'20 Sep'20 Dec'20 Promoters 49.7 49.7 49.7 MF/Banks/FIs 7.5 7.9 8.1 FIIs 3.2 3.3 5.1 Public / Others 39.6 39.2 37.1 CSB Bank Relative to SENSEX VP - Research: Mona Khetan Tel: +91 22 40969762 E-mail: [email protected] Associate: Shreesh Chandra Tel: +91 22 40969714 E-mail: [email protected] Analyst: Prithvish Uppal Tel: +91 22 40969714 E-mail: [email protected] 70 90 110 130 150 170 Mar-20 Apr-20 May-20 Jun-20 Jul-20 Aug-20 Sep-20 Oct-20 Nov-20 Dec-20 Jan-21 Feb-21 Mar-21 CSBBANK SENSEX CSB Bank BUY March 02, 2021
-
Upload
khangminh22 -
Category
Documents
-
view
0 -
download
0
Transcript of In itiatin g C o verage CSB Bank

Init
iati
ng
Co
ve
rag
e
Turnaround Story CSB Bank (erstwhile Catholic Syrian Bank) has undergone a transformation in last few years after Mr CV Rajendran was appointed as CEO in Dec-16 and after RBI took an exception and permitted a 51% stake by Fairfax India Holdings in Jul-2018. From strengthening its top management, to moving towards product based lending approach, along with balance sheet clean up and improvement in core operating metrics, the bank is now well placed for growth along with adequate capital backing. We expect RoAs to rise to 1.3/1.4% by FY22E/23E led by improving PPoP profile and decline in credit costs. We initiate with an BUY rating with TP of Rs320, valuing the bank at 2.2x Mar-23 P/ABV.
Healthy growth prospects with niche in Gold, SME business With ~40% of advances towards gold loans as of 3QFY21, the gold business has helped the bank deliver heathy growth and profitability metrics even amidst the last few quarters of stress and risk aversion. Post the completion of consolidation in SME book undergoing over the last few years, the book is well poised to see accelerated growth. This along with increased lateral hiring at market based compensation and product strategy led by business teams instead of branches should aid a 23-25% over FY22-23E in our view (~20% in FY21E).
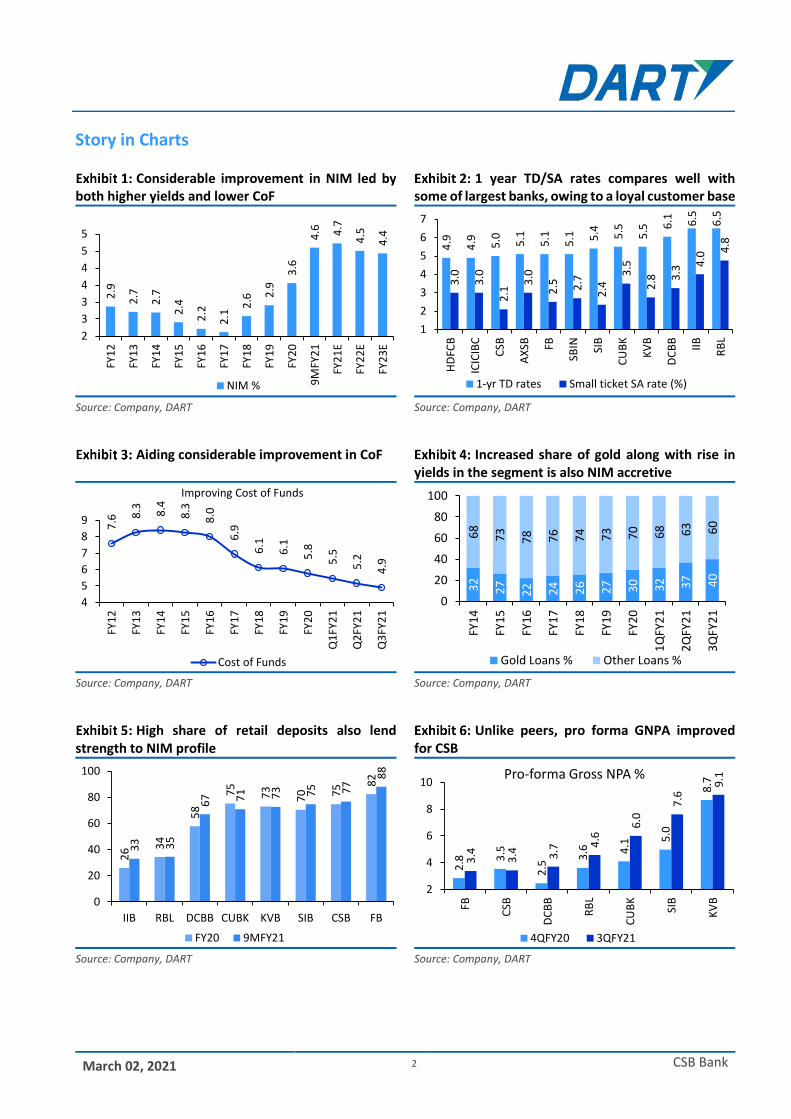
Improving spreads, subdued CD ratio positive for NIM CSB has a sticky depositor base and amongst the lowest TD/SA rates in industry. Despite lowest SA rates at 2.1%, CASA growth was above industry at 24% YoY in 3QFY21. Margins also benefit from rise in CD ratio (74% as of 3QFY21) and higher gold lending yields, which increased by ~250 bps since end of FY19 despite a declining interest rate scenario. Consequently, NIM improved by over 100 bps over the last seven quarters. We expect margins to stabilize at 4.2-4.5%.
Balance sheet risks have come off; limited COVID stress so far Slippages averaged at 1.9% for FY19-20 (2.5% for 9MFY21) against 4.4% of slippages over FY14-18, driven by improved quality of SME portfolio and higher share of gold loans. We expect slippages to be sub 2% in FY22-23E. COVID related stress was limited and lower than peers with decline in pro forma NPAs since Mar-20, restructured book at 0.6%, and SMA (0/1/2/) portfolio at 2.5%.
Multiple levers for RoA improvement; Initiate with BUY We expect PPoP/assets to improve to 2.5% by FY22E, driven by healthy NIM at over 4%, higher core fee lines, moderation in opex ratios, and healthy growth metrics. Backed by improved execution capabilities, a strong balance sheet after consolidation in Corp/SME books, and decline in credit costs, we feel the bank is well positioned to deliver a 15% RoE by FY23E. We value the bank 2.2x FY23E P/ABV and initiate with a BUY rating with TP of Rs320.
FINANCIALS (Rs Mn) Particulars FY19A FY20A FY21E FY22E FY23E
Net Interest Income 4,400 5,923 9,044 10,226 12,166
Growth(%) 34.6 52.7 13.1 19.0
PPOP 134 2,806 5,266 6,071 7,653
PAT (1,974) 127 2,134 3,209 4,153
Growth(%) (106.4) 1577.2 50.4 29.4
EPS (Rs) (23.0) 0.7 12.3 18.5 23.9
ABV (Rs) 42.0 89.6 101.3 121.4 145.4
ROA (%) (1.2) 0.1 1.0 1.3 1.4
ROE(%) (23.6) 0.9 10.3 13.8 15.3
PER(x) (9.9) 309.8 18.5 12.3 9.5
P/ABV (x) 5.4 2.5 2.2 1.9 1.6
CMP Rs 227
Target / Upside Rs 320 / 41%
NIFTY 14,762
Scrip Details
Equity / FV Rs 1,735mn / Rs 10
Market Cap Rs 39bn
USD 536mn
52-week High/Low Rs 268/ 96
Avg. Volume (no) 440,776
Bloom Code CSBBANK IN
Price Performance 1M 3M 12M
Absolute (%) 1 (2) 33
Rel to NIFTY (%) 1 (2) 32
Shareholding Pattern
Jun'20 Sep'20 Dec'20
Promoters 49.7 49.7 49.7
MF/Banks/FIs 7.5 7.9 8.1
FIIs 3.2 3.3 5.1
Public / Others 39.6 39.2 37.1
CSB Bank Relative to SENSEX
VP - Research: Mona Khetan Tel: +91 22 40969762
E-mail: [email protected]
Associate: Shreesh Chandra Tel: +91 22 40969714
E-mail: [email protected]
Analyst: Prithvish Uppal Tel: +91 22 40969714
E-mail: [email protected]
70
90
110
130
150
170
Ma
r-20
Ap
r-20
Ma
y-2
0
Jun
-20
Jul-2
0
Au
g-2
0
Se
p-2
0
Oct-
20
Nov-2
0
Dec-2
0
Jan
-21
Fe
b-2
1
Mar-
21
CSBBANK SENSEX
CSB Bank
BUY
March 02, 2021
March 02, 2021 2 CSB Bank
Story in Charts
Considerable improvement in NIM led by both higher yields and lower CoF
1 year TD/SA rates compares well with some of largest banks, owing to a loyal customer base
Source: Company, DART Source: Company, DART
Aiding considerable improvement in CoF Increased share of gold along with rise in
yields in the segment is also NIM accretive
Source: Company, DART Source: Company, DART
High share of retail deposits also lend
strength to NIM profile Unlike peers, pro forma GNPA improved
for CSB
Source: Company, DART Source: Company, DART
2.9
2.7
2.7
2.4
2.2
2.1
2.6 2
.9
3.6
4.6 4.7
4.5
4.4
2
3
3
4
4
5
5
FY1
2
FY1
3
FY1
4
FY1
5
FY1
6
FY1
7
FY1
8
FY1
9
FY2
0
9M
FY2
1
FY2
1E
FY2
2E
FY2
3E
NIM %
4.9
4.9 5.0 5.1
5.1
5.1 5.4 5.5
5.5 6
.1 6.5
6.5
3.0
3.0
2.1
3.0
2.5 2.7
2.4
3.5
2.8 3
.3
4.0
4.8
1
2
3
4
5
6
7
HD
FCB
ICIC
IBC
CSB
AX
SB FB
SBIN SIB
CU
BK
KV
B
DC
BB
IIB
RB
L
1-yr TD rates Small ticket SA rate (%)
7.6
8.3
8.4
8.3
8.0
6.9
6.1
6.1
5.8
5.5
5.2
4.9
4
5
6
7
8
9
FY1
2
FY1
3
FY1
4
FY1
5
FY1
6
FY1
7
FY1
8
FY1
9
FY2
0
Q1
FY2
1
Q2
FY2
1
Q3
FY2
1
Improving Cost of Funds
Cost of Funds
32
27
22 24 26 27 30 32 37 40
68
73
78 76 74 73 70 68 63 60
0
20
40
60
80
100
FY1
4
FY1
5
FY1
6
FY1
7
FY1
8
FY1
9
FY2
0
1Q
FY2
1
2Q
FY2
1
3Q
FY2
1
Gold Loans % Other Loans %
26 3
4
58
75
73
70 75 8
2
33 35
67 71 73 75 77
88
0
20
40
60
80
100
IIB RBL DCBB CUBK KVB SIB CSB FB
FY20 9MFY21
2.8 3
.5
2.5
3.6 4
.1 5.0
8.7
3.4 3.4 3.7 4
.6
6.0
7.6
9.1
2
4
6
8
10
FB
CSB
DC
BB
RB
L
CU
BK
SIB
KV
B
Pro-forma Gross NPA %
4QFY20 3QFY21
March 02, 2021 3 CSB Bank
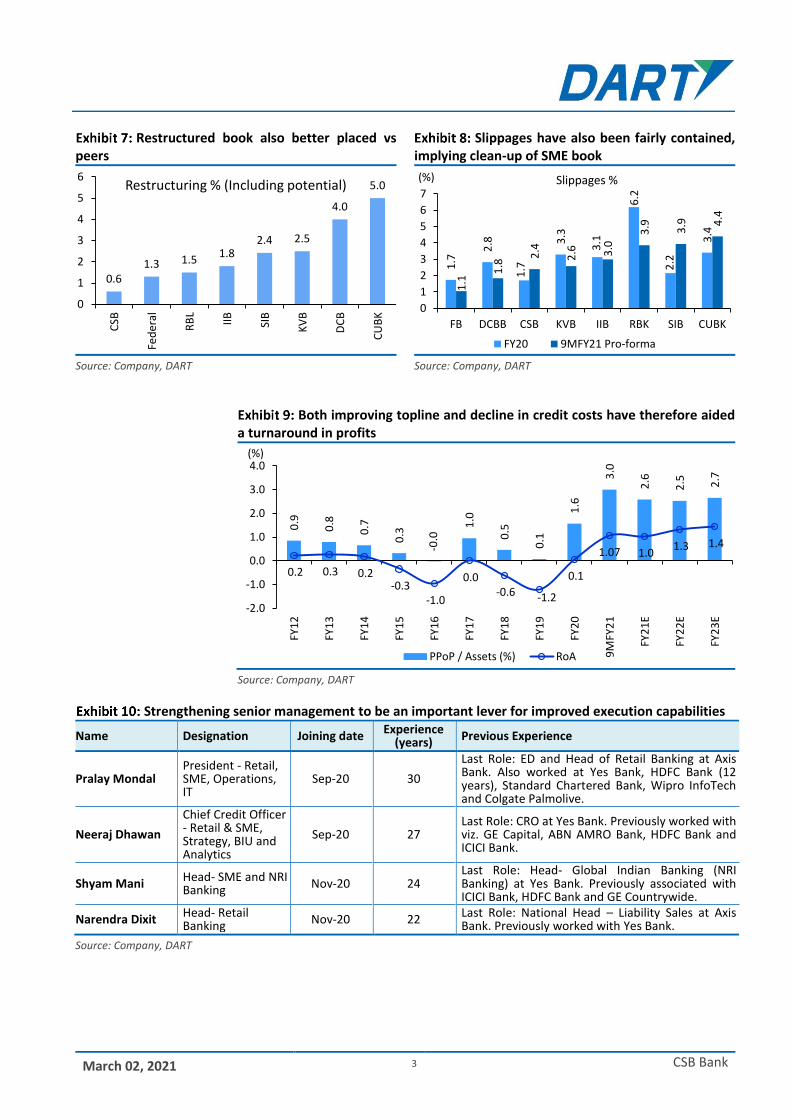
Restructured book also better placed vs
peers Slippages have also been fairly contained,
implying clean-up of SME book
Source: Company, DART Source: Company, DART
Both improving topline and decline in credit costs have therefore aided
a turnaround in profits
Source: Company, DART
Strengthening senior management to be an important lever for improved execution capabilities
Name Designation Joining date Experience
(years) Previous Experience
Pralay Mondal President - Retail, SME, Operations, IT
Sep-20 30
Last Role: ED and Head of Retail Banking at Axis Bank. Also worked at Yes Bank, HDFC Bank (12 years), Standard Chartered Bank, Wipro InfoTech and Colgate Palmolive.
Neeraj Dhawan
Chief Credit Officer - Retail & SME, Strategy, BIU and Analytics
Sep-20 27 Last Role: CRO at Yes Bank. Previously worked with viz. GE Capital, ABN AMRO Bank, HDFC Bank and ICICI Bank.
Shyam Mani Head- SME and NRI Banking Nov-20 24
Last Role: Head- Global Indian Banking (NRI Banking) at Yes Bank. Previously associated with ICICI Bank, HDFC Bank and GE Countrywide.
Narendra Dixit Head- Retail Banking Nov-20 22
Last Role: National Head – Liability Sales at Axis Bank. Previously worked with Yes Bank.
Source: Company, DART
0.61.3 1.5
1.82.4 2.5
4.0
5.0
0
1
2
3
4
5
6
CSB
Fed
eral
RB
L
IIB
SIB
KV
B
DC
B
CU
BK
Restructuring % (Including potential)
1.7
2.8
1.7
3.3
3.1
6.2
2.2
3.4
1.1
1.8
2.4
2.6
3.0
3.9
3.9
4.4
0
1
2
3
4
5
6
7
FB DCBB CSB KVB IIB RBK SIB CUBK
(%) Slippages %
FY20 9MFY21 Pro-forma
0.9
0.8
0.7
0.3
-0.0
1.0
0.5
0.1
1.6
3.0
2.6
2.5
2.7
0.2 0.3 0.2 -0.3
-1.0
0.0 -0.6 -1.2
0.1
1.07 1.0 1.3 1.4
-2.0
-1.0
0.0
1.0
2.0
3.0
4.0
FY1
2
FY1
3
FY1
4
FY1
5
FY1
6
FY1
7
FY1
8
FY1
9
FY2
0
9M
FY2
1
FY2
1E
FY2
2E
FY2
3E
(%)
PPoP / Assets (%) RoA

March 02, 2021 4 CSB Bank
Decline in Union also making the organization more agile
Source: Company, DART
Peer Comparison Loans FY22E RoE* FY22E RoA* P/ABV (Rs bn) % % Trailing FY22E* FY23E*
CSB 131 13.8 1.3 2.2 1.9 1.6
CUBK 359 12.7 1.4 2.6 2.3 1.9
DCB 253 12.3 1.2 1.2 1.0 0.8
Federal 1255 10.5 0.9 1.2 1.1 1.0
IIB 2071 12.2 1.4 2.3 2.0 1.8
KVB 495 7.4 0.7 0.7 0.6 0.6
RBL 564 9.8 1.3 1.2 1.1 1.0
SIB 616 6.1 0.3 0.4 0.4 0.4
Source: Company, DART; *Consensus data for KVB, RBL, SIB.
Peer Comparison (continued) Q3FY21 GNPA (%)* NNPA (%)* PCR (%)* CASA (%) CET-1 Capital CRAR
CSB 3.4 1.9 43.6 30.4 19.8 21.0
CUBK 6.0 3.4 43.8 27.5 16.3 17.4
DCBB 3.7 1.9 48.6 23.1 14.3 18.3
FB 3.4 1.1 66.0 34.5 13.0 14.3
IIB 2.9 0.7 75.9 40.4 15.6 16.3
KVB 9.1 4.1 55.0 35.0 16.5 18.5
RBL 4.6 2.5 44.9 31.1 17.1 17.3
SIB 7.6 NA NA 27.9 11.6 14.5
Source: Company, DART; * Pro-forma
100
60
4133
40
5967
0
20
40
60
80
100
Pre Fairfax Acquisition Pre-IPO Current Post VRS (by Mar-21)
(%)
IBA Employees CTC Employees
March 02, 2021 5 CSB Bank
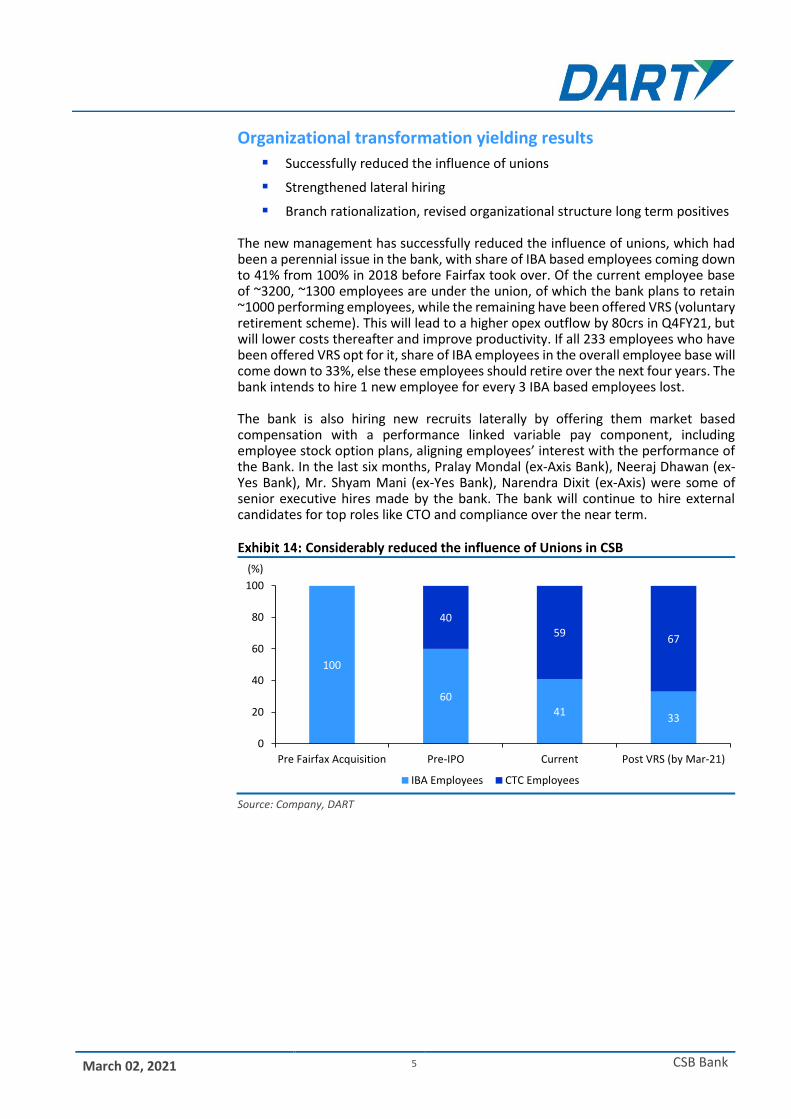
Organizational transformation yielding results
Successfully reduced the influence of unions
Strengthened lateral hiring
Branch rationalization, revised organizational structure long term positives The new management has successfully reduced the influence of unions, which had been a perennial issue in the bank, with share of IBA based employees coming down to 41% from 100% in 2018 before Fairfax took over. Of the current employee base of ~3200, ~1300 employees are under the union, of which the bank plans to retain ~1000 performing employees, while the remaining have been offered VRS (voluntary retirement scheme). This will lead to a higher opex outflow by 80crs in Q4FY21, but will lower costs thereafter and improve productivity. If all 233 employees who have been offered VRS opt for it, share of IBA employees in the overall employee base will come down to 33%, else these employees should retire over the next four years. The bank intends to hire 1 new employee for every 3 IBA based employees lost. The bank is also hiring new recruits laterally by offering them market based compensation with a performance linked variable pay component, including employee stock option plans, aligning employees’ interest with the performance of the Bank. In the last six months, Pralay Mondal (ex-Axis Bank), Neeraj Dhawan (ex-Yes Bank), Mr. Shyam Mani (ex-Yes Bank), Narendra Dixit (ex-Axis) were some of senior executive hires made by the bank. The bank will continue to hire external candidates for top roles like CTO and compliance over the near term.
Considerably reduced the influence of Unions in CSB
Source: Company, DART
100
60
4133
40
5967
0
20
40
60
80
100
Pre Fairfax Acquisition Pre-IPO Current Post VRS (by Mar-21)
(%)
IBA Employees CTC Employees
March 02, 2021 6 CSB Bank
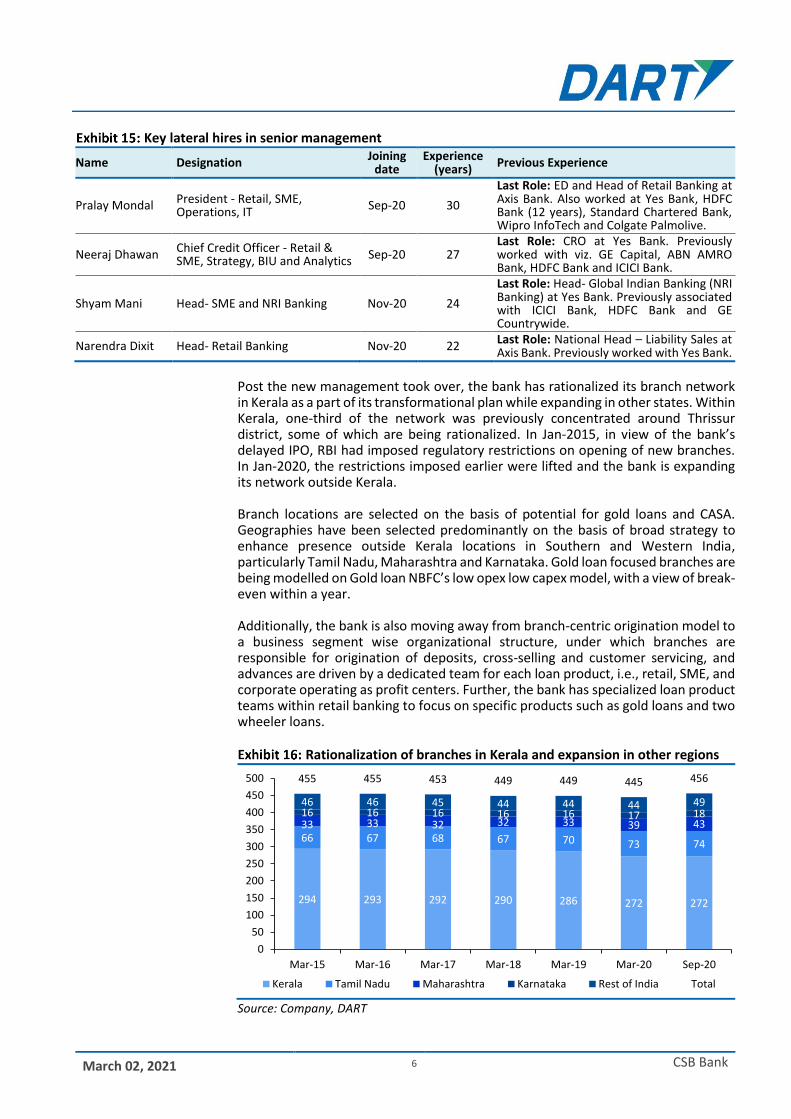
Key lateral hires in senior management
Name Designation Joining
date Experience
(years) Previous Experience
Pralay Mondal President - Retail, SME, Operations, IT
Sep-20 30
Last Role: ED and Head of Retail Banking at Axis Bank. Also worked at Yes Bank, HDFC Bank (12 years), Standard Chartered Bank, Wipro InfoTech and Colgate Palmolive.
Neeraj Dhawan Chief Credit Officer - Retail & SME, Strategy, BIU and Analytics Sep-20 27
Last Role: CRO at Yes Bank. Previously worked with viz. GE Capital, ABN AMRO Bank, HDFC Bank and ICICI Bank.
Shyam Mani Head- SME and NRI Banking Nov-20 24
Last Role: Head- Global Indian Banking (NRI Banking) at Yes Bank. Previously associated with ICICI Bank, HDFC Bank and GE Countrywide.
Narendra Dixit Head- Retail Banking Nov-20 22 Last Role: National Head – Liability Sales at Axis Bank. Previously worked with Yes Bank.
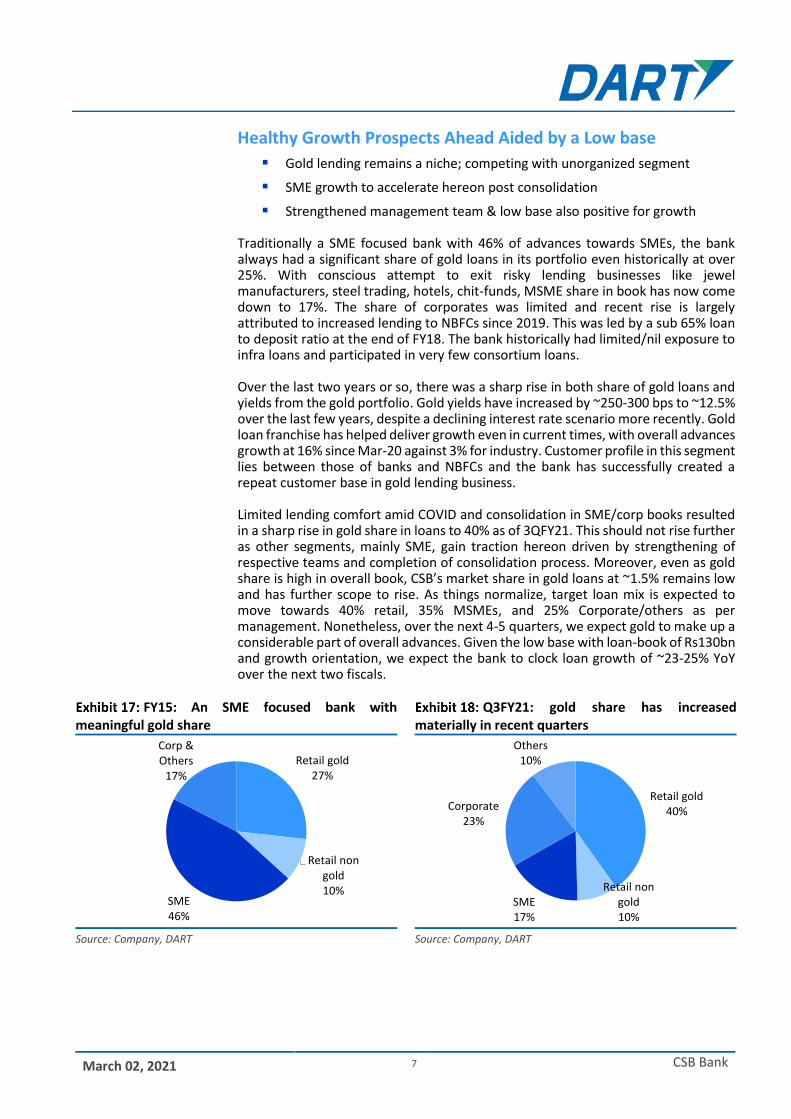
Post the new management took over, the bank has rationalized its branch network in Kerala as a part of its transformational plan while expanding in other states. Within Kerala, one-third of the network was previously concentrated around Thrissur district, some of which are being rationalized. In Jan-2015, in view of the bank’s delayed IPO, RBI had imposed regulatory restrictions on opening of new branches. In Jan-2020, the restrictions imposed earlier were lifted and the bank is expanding its network outside Kerala. Branch locations are selected on the basis of potential for gold loans and CASA. Geographies have been selected predominantly on the basis of broad strategy to enhance presence outside Kerala locations in Southern and Western India, particularly Tamil Nadu, Maharashtra and Karnataka. Gold loan focused branches are being modelled on Gold loan NBFC’s low opex low capex model, with a view of break-even within a year. Additionally, the bank is also moving away from branch-centric origination model to a business segment wise organizational structure, under which branches are responsible for origination of deposits, cross-selling and customer servicing, and advances are driven by a dedicated team for each loan product, i.e., retail, SME, and corporate operating as profit centers. Further, the bank has specialized loan product teams within retail banking to focus on specific products such as gold loans and two wheeler loans.
Rationalization of branches in Kerala and expansion in other regions
Source: Company, DART
294 293 292 290 286 272 272
66 67 68 67 70 73 74
33 33 32 32 33 39 4316 16 16 16 16 17 1846 46 45 44 44 44 49
455 455 453 449 449 445 456
0
50
100
150
200
250
300
350
400
450
500
Mar-15 Mar-16 Mar-17 Mar-18 Mar-19 Mar-20 Sep-20
Kerala Tamil Nadu Maharashtra Karnataka Rest of India Total
March 02, 2021 7 CSB Bank
Healthy Growth Prospects Ahead Aided by a Low base
Gold lending remains a niche; competing with unorganized segment
SME growth to accelerate hereon post consolidation
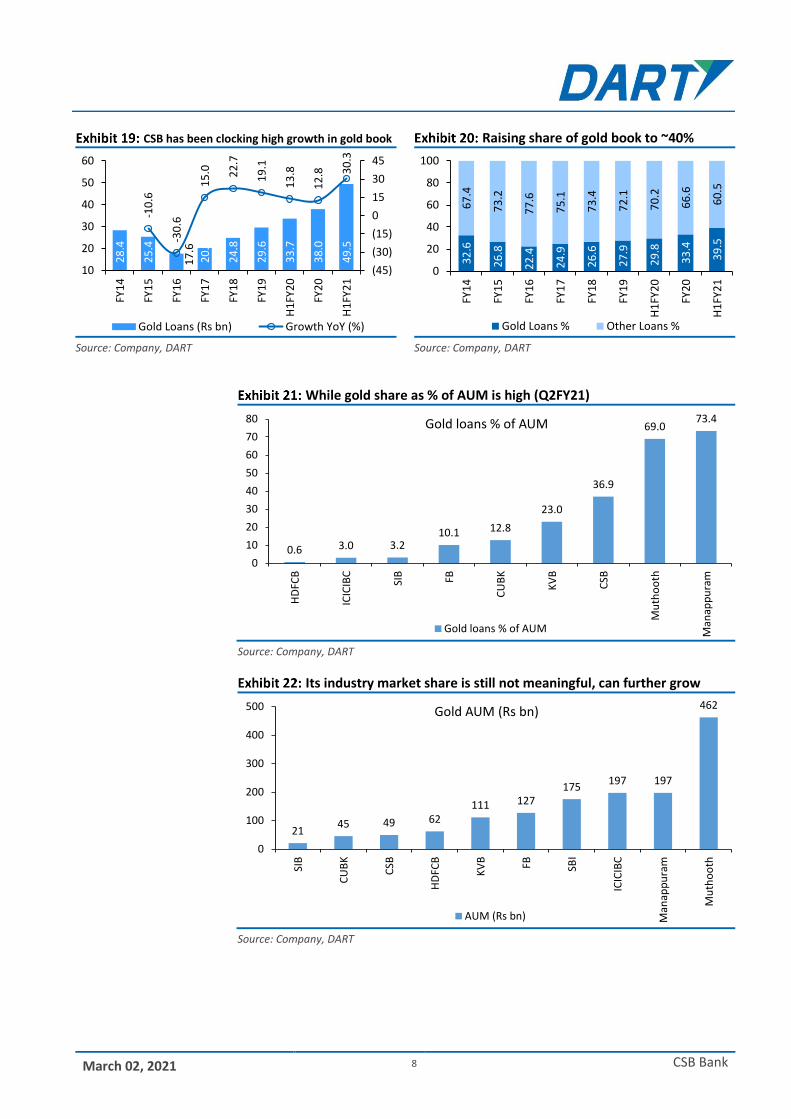
Strengthened management team & low base also positive for growth Traditionally a SME focused bank with 46% of advances towards SMEs, the bank always had a significant share of gold loans in its portfolio even historically at over 25%. With conscious attempt to exit risky lending businesses like jewel manufacturers, steel trading, hotels, chit-funds, MSME share in book has now come down to 17%. The share of corporates was limited and recent rise is largely attributed to increased lending to NBFCs since 2019. This was led by a sub 65% loan to deposit ratio at the end of FY18. The bank historically had limited/nil exposure to infra loans and participated in very few consortium loans. Over the last two years or so, there was a sharp rise in both share of gold loans and yields from the gold portfolio. Gold yields have increased by ~250-300 bps to ~12.5% over the last few years, despite a declining interest rate scenario more recently. Gold loan franchise has helped deliver growth even in current times, with overall advances growth at 16% since Mar-20 against 3% for industry. Customer profile in this segment lies between those of banks and NBFCs and the bank has successfully created a repeat customer base in gold lending business. Limited lending comfort amid COVID and consolidation in SME/corp books resulted in a sharp rise in gold share in loans to 40% as of 3QFY21. This should not rise further as other segments, mainly SME, gain traction hereon driven by strengthening of respective teams and completion of consolidation process. Moreover, even as gold share is high in overall book, CSB’s market share in gold loans at ~1.5% remains low and has further scope to rise. As things normalize, target loan mix is expected to move towards 40% retail, 35% MSMEs, and 25% Corporate/others as per management. Nonetheless, over the next 4-5 quarters, we expect gold to make up a considerable part of overall advances. Given the low base with loan-book of Rs130bn and growth orientation, we expect the bank to clock loan growth of ~23-25% YoY over the next two fiscals.
FY15: An SME focused bank with meaningful gold share
Q3FY21: gold share has increased materially in recent quarters
Source: Company, DART Source: Company, DART
Retail gold27%
Retail non gold10%
SME46%
Corp & Others
17%
Retail gold40%
Retail non gold10%
SME17%
Corporate23%
Others10%
March 02, 2021 8 CSB Bank
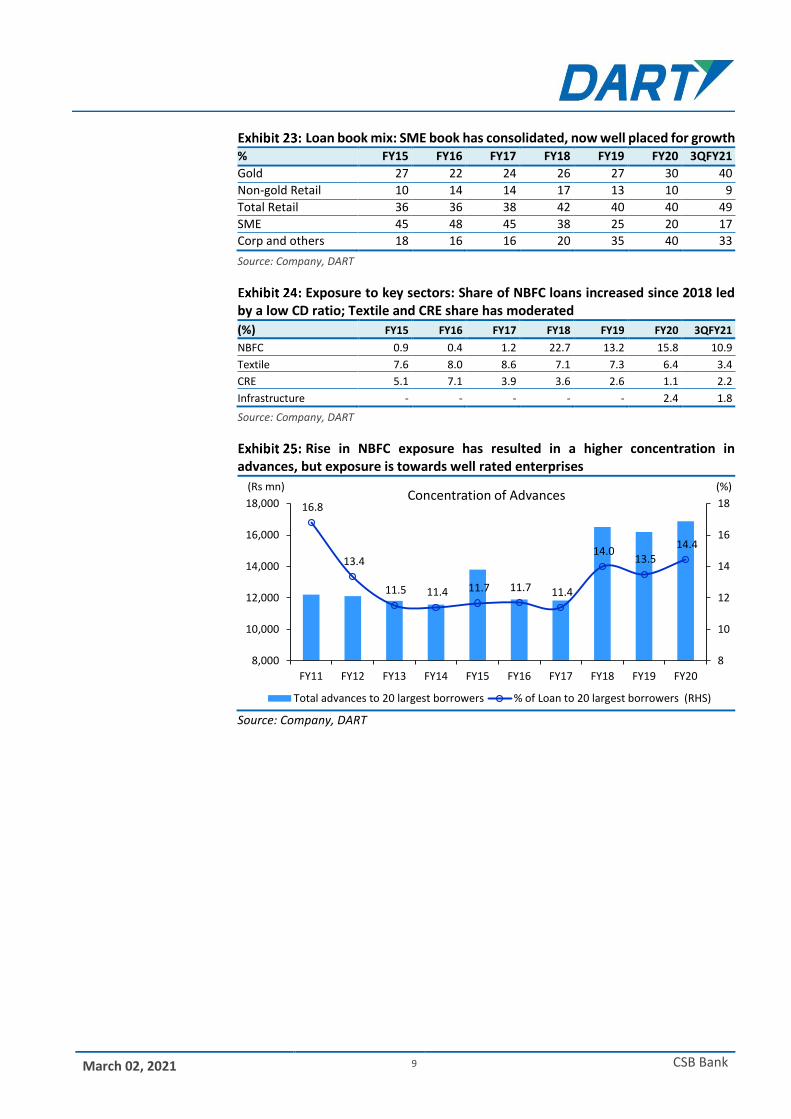
CSB has been clocking high growth in gold book Raising share of gold book to ~40%
Source: Company, DART Source: Company, DART
While gold share as % of AUM is high (Q2FY21)
Source: Company, DART
Its industry market share is still not meaningful, can further grow
Source: Company, DART
28
.4
25
.4
17
.6
20
.3
24
.8
29
.6
33
.7
38
.0
49
.5
-10
.6
-30
.6
15
.0 22
.7
19
.1
13
.8
12
.8 30
.3
(45)
(30)
(15)
0
15
30
45
10
20
30
40
50
60
FY1
4
FY1
5
FY1
6
FY1
7
FY1
8
FY1
9
H1
FY2
0
FY2
0
H1
FY2
1
Gold Loans (Rs bn) Growth YoY (%)
32
.6
26
.8
22
.4
24
.9
26
.6
27
.9
29
.8
33
.4
39
.5
67
.4
73
.2
77
.6
75
.1
73
.4
72
.1
70
.2
66
.6
60
.5
0
20
40
60
80
100
FY1
4
FY1
5
FY1
6
FY1
7
FY1
8
FY1
9
H1
FY2
0
FY2
0
H1
FY2
1
Gold Loans % Other Loans %
0.6 3.0 3.210.1 12.8
23.0
36.9
69.073.4
0
10
20
30
40
50
60
70
80
HD
FCB
ICIC
IBC
SIB FB
CU
BK
KV
B
CSB
Mu
tho
oth
Man
app
ura
m
Gold loans % of AUM
Gold loans % of AUM
2145 49 62
111 127175
197 197
462
0
100
200
300
400
500
SIB
CU
BK
CSB
HD
FCB
KV
B FB SBI
ICIC
IBC
Man
app
ura
m
Mu
tho
oth
Gold AUM (Rs bn)
AUM (Rs bn)
March 02, 2021 9 CSB Bank
Loan book mix: SME book has consolidated, now well placed for growth
% FY15 FY16 FY17 FY18 FY19 FY20 3QFY21
Gold 27 22 24 26 27 30 40
Non-gold Retail 10 14 14 17 13 10 9
Total Retail 36 36 38 42 40 40 49
SME 45 48 45 38 25 20 17
Corp and others 18 16 16 20 35 40 33
Source: Company, DART
Exposure to key sectors: Share of NBFC loans increased since 2018 led by a low CD ratio; Textile and CRE share has moderated
(%) FY15 FY16 FY17 FY18 FY19 FY20 3QFY21
NBFC 0.9 0.4 1.2 22.7 13.2 15.8 10.9
Textile 7.6 8.0 8.6 7.1 7.3 6.4 3.4
CRE 5.1 7.1 3.9 3.6 2.6 1.1 2.2
Infrastructure - - - - - 2.4 1.8
Source: Company, DART
Rise in NBFC exposure has resulted in a higher concentration in advances, but exposure is towards well rated enterprises
Source: Company, DART
16.8
13.4
11.5 11.4 11.7 11.7 11.4
14.0 13.5
14.4
8
10
12
14
16
18
8,000
10,000
12,000
14,000
16,000
18,000
FY11 FY12 FY13 FY14 FY15 FY16 FY17 FY18 FY19 FY20
(%)(Rs mn)Concentration of Advances
Total advances to 20 largest borrowers % of Loan to 20 largest borrowers (RHS)
March 02, 2021 10 CSB Bank
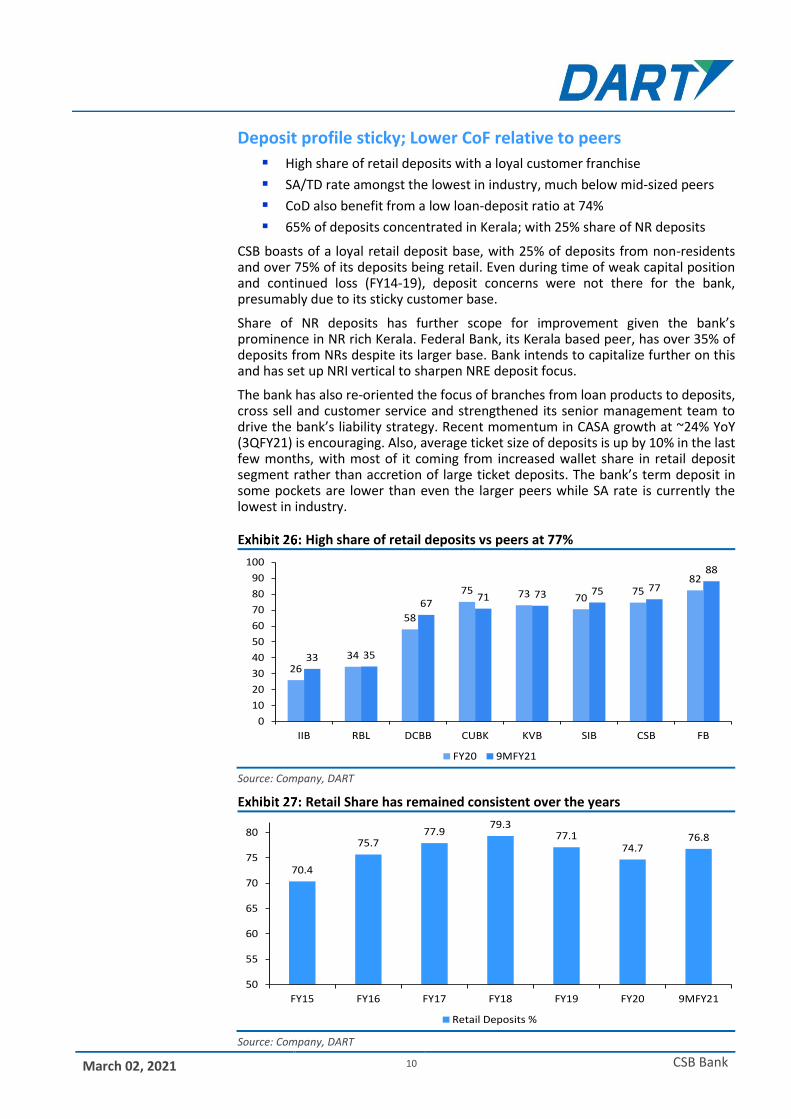
Deposit profile sticky; Lower CoF relative to peers
High share of retail deposits with a loyal customer franchise
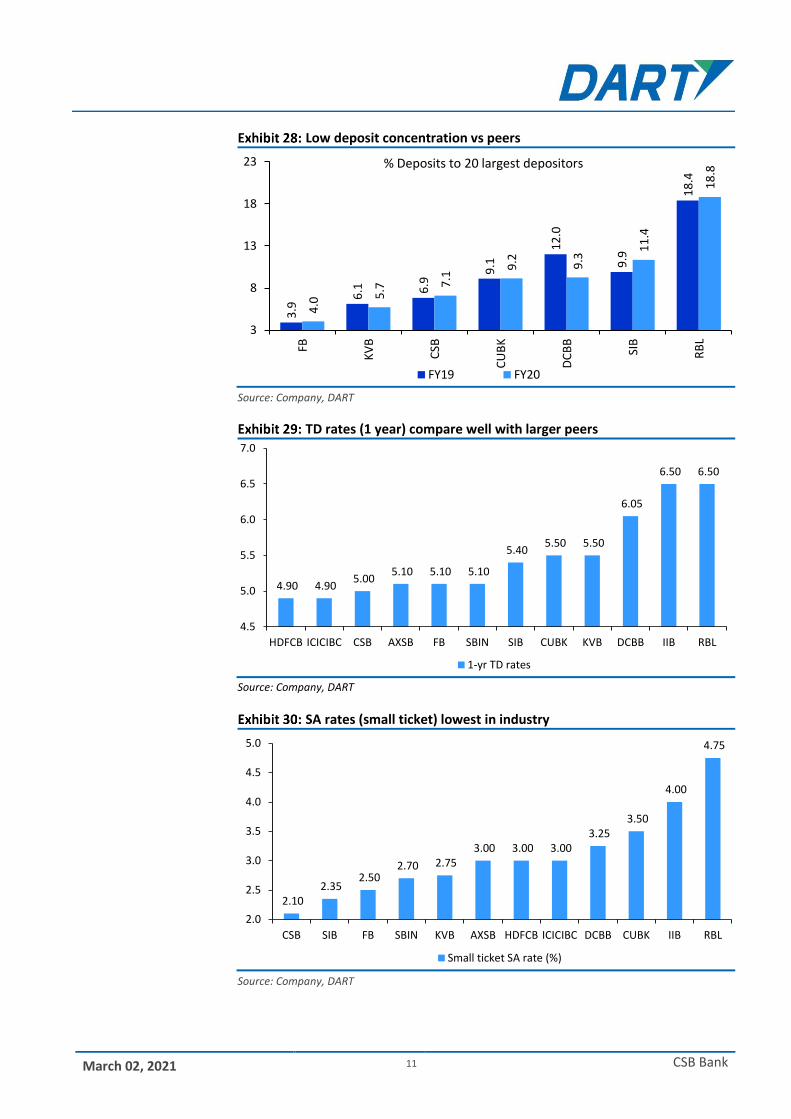
SA/TD rate amongst the lowest in industry, much below mid-sized peers
CoD also benefit from a low loan-deposit ratio at 74%
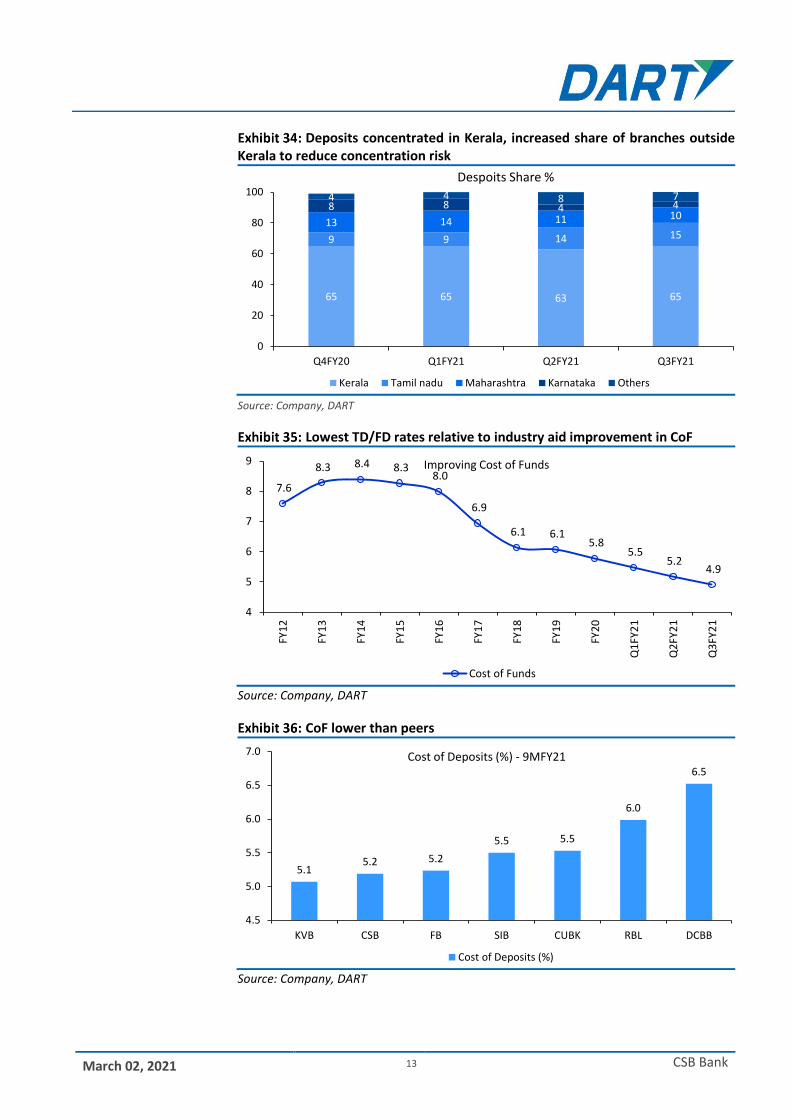
65% of deposits concentrated in Kerala; with 25% share of NR deposits
CSB boasts of a loyal retail deposit base, with 25% of deposits from non-residents and over 75% of its deposits being retail. Even during time of weak capital position and continued loss (FY14-19), deposit concerns were not there for the bank, presumably due to its sticky customer base.
Share of NR deposits has further scope for improvement given the bank’s prominence in NR rich Kerala. Federal Bank, its Kerala based peer, has over 35% of deposits from NRs despite its larger base. Bank intends to capitalize further on this and has set up NRI vertical to sharpen NRE deposit focus.
The bank has also re-oriented the focus of branches from loan products to deposits, cross sell and customer service and strengthened its senior management team to drive the bank’s liability strategy. Recent momentum in CASA growth at ~24% YoY (3QFY21) is encouraging. Also, average ticket size of deposits is up by 10% in the last few months, with most of it coming from increased wallet share in retail deposit segment rather than accretion of large ticket deposits. The bank’s term deposit in some pockets are lower than even the larger peers while SA rate is currently the lowest in industry.
High share of retail deposits vs peers at 77%
Source: Company, DART
Retail Share has remained consistent over the years
Source: Company, DART
2634
58
75 73 7075
82
33 35
6771 73 75 77
88
0
10
20
30
40
50
60
70
80
90
100
IIB RBL DCBB CUBK KVB SIB CSB FB
FY20 9MFY21
70.4
75.777.9
79.377.1
74.776.8
50
55
60
65
70
75
80
FY15 FY16 FY17 FY18 FY19 FY20 9MFY21
Retail Deposits %
March 02, 2021 11 CSB Bank
Low deposit concentration vs peers
Source: Company, DART
TD rates (1 year) compare well with larger peers
Source: Company, DART
SA rates (small ticket) lowest in industry
Source: Company, DART
3.9
6.1 6
.9
9.1
12
.0
9.9
18
.4
4.0
5.7 7
.1
9.2 9.3
11
.4
18
.8
3
8
13
18
23
FB
KV
B
CSB
CU
BK
DC
BB
SIB
RB
L
% Deposits to 20 largest depositors
FY19 FY20
4.90 4.90 5.00
5.10 5.10 5.10
5.40 5.50 5.50
6.05
6.50 6.50
4.5
5.0
5.5
6.0
6.5
7.0
HDFCB ICICIBC CSB AXSB FB SBIN SIB CUBK KVB DCBB IIB RBL
1-yr TD rates
2.10 2.35
2.50 2.70 2.75
3.00 3.00 3.00 3.25
3.50
4.00
4.75
2.0
2.5
3.0
3.5
4.0
4.5
5.0
CSB SIB FB SBIN KVB AXSB HDFCB ICICIBC DCBB CUBK IIB RBL
Small ticket SA rate (%)

March 02, 2021 12 CSB Bank
Meaningful share of NR deposits led by its Kerala presence
Source: Company, DART
Recent pick-up in CASA growth is encouraging
Source: Company, DART
CASA ratio in line with peers
Source: Company, DART
13
17
20
23 24
26 25 25
12
14
16
18
20
22
24
26
28
FY13 FY14 FY15 FY16 FY17 FY18 FY19 FY20
NR Share in total deposits %
19.3 17.5 17.3 18.0
20.0
24.8 27.0 27.8
29.2 29.2 29.4 30.4
0
5
10
15
20
25
30
10
13
15
18
20
23
25
28
30
33
FY1
2
FY1
3
FY1
4
FY1
5
FY1
6
FY1
7
FY1
8
FY1
9
FY2
0
Q1
FY2
1
Q2
FY2
1
Q3
FY2
1
(%)(%) CASA Trajectory
CASA Ratio % CASA Growth YoY (RHS)
23.1
27.5 27.9
30.431.1
34.5 35.0
20
22
24
26
28
30
32
34
36
DCBB CUBK SIB CSB RBL FB KVB
CASA Ratio - 9MFY21
CASA %
March 02, 2021 13 CSB Bank
Deposits concentrated in Kerala, increased share of branches outside
Kerala to reduce concentration risk
Source: Company, DART
Lowest TD/FD rates relative to industry aid improvement in CoF
Source: Company, DART
CoF lower than peers
Source: Company, DART
65 65 63 65
9 9 14 1513 14 11 108 8 4 44 4 8 7
0
20
40
60
80
100
Q4FY20 Q1FY21 Q2FY21 Q3FY21
Despoits Share %
Kerala Tamil nadu Maharashtra Karnataka Others
7.6
8.3 8.4 8.3 8.0
6.9
6.1 6.1 5.8
5.5 5.2
4.9
4
5
6
7
8
9
FY1
2
FY1
3
FY1
4
FY1
5
FY1
6
FY1
7
FY1
8
FY1
9
FY2
0
Q1
FY2
1
Q2
FY2
1
Q3
FY2
1
Improving Cost of Funds
Cost of Funds
5.15.2 5.2
5.5 5.5
6.0
6.5
4.5
5.0
5.5
6.0
6.5
7.0
KVB CSB FB SIB CUBK RBL DCBB
Cost of Deposits (%) - 9MFY21
Cost of Deposits (%)
March 02, 2021 14 CSB Bank
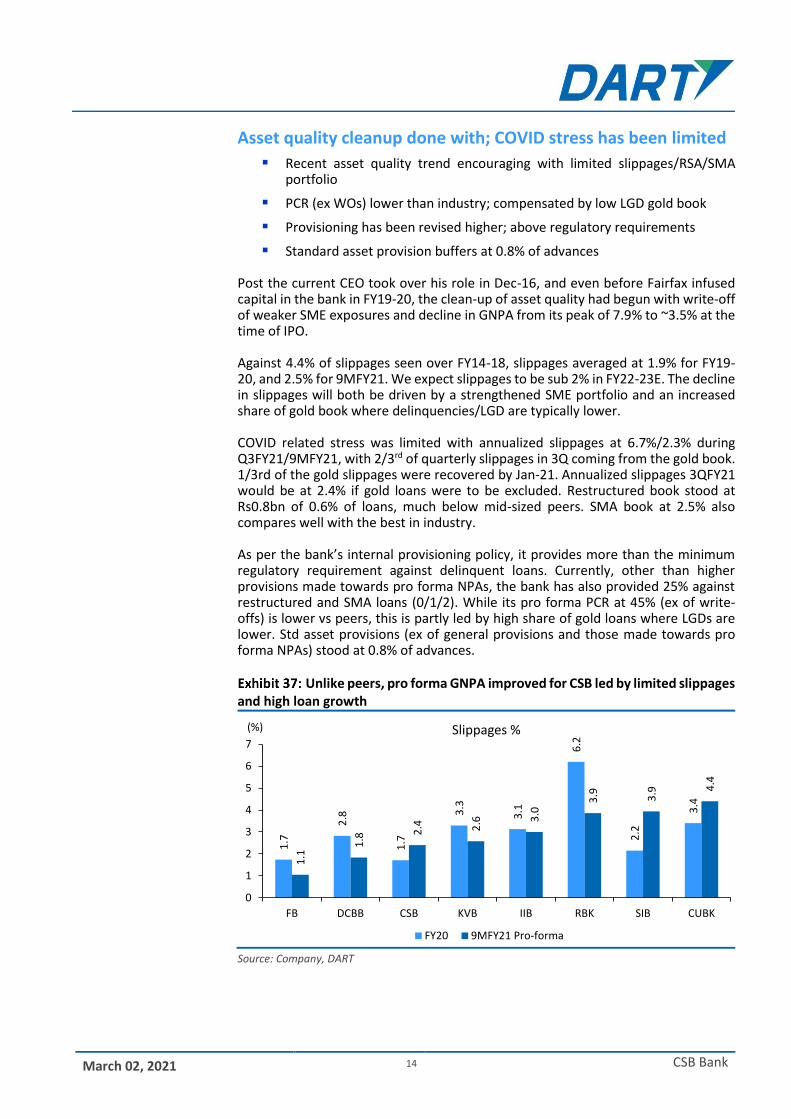
Asset quality cleanup done with; COVID stress has been limited
Recent asset quality trend encouraging with limited slippages/RSA/SMA portfolio
PCR (ex WOs) lower than industry; compensated by low LGD gold book
Provisioning has been revised higher; above regulatory requirements
Standard asset provision buffers at 0.8% of advances
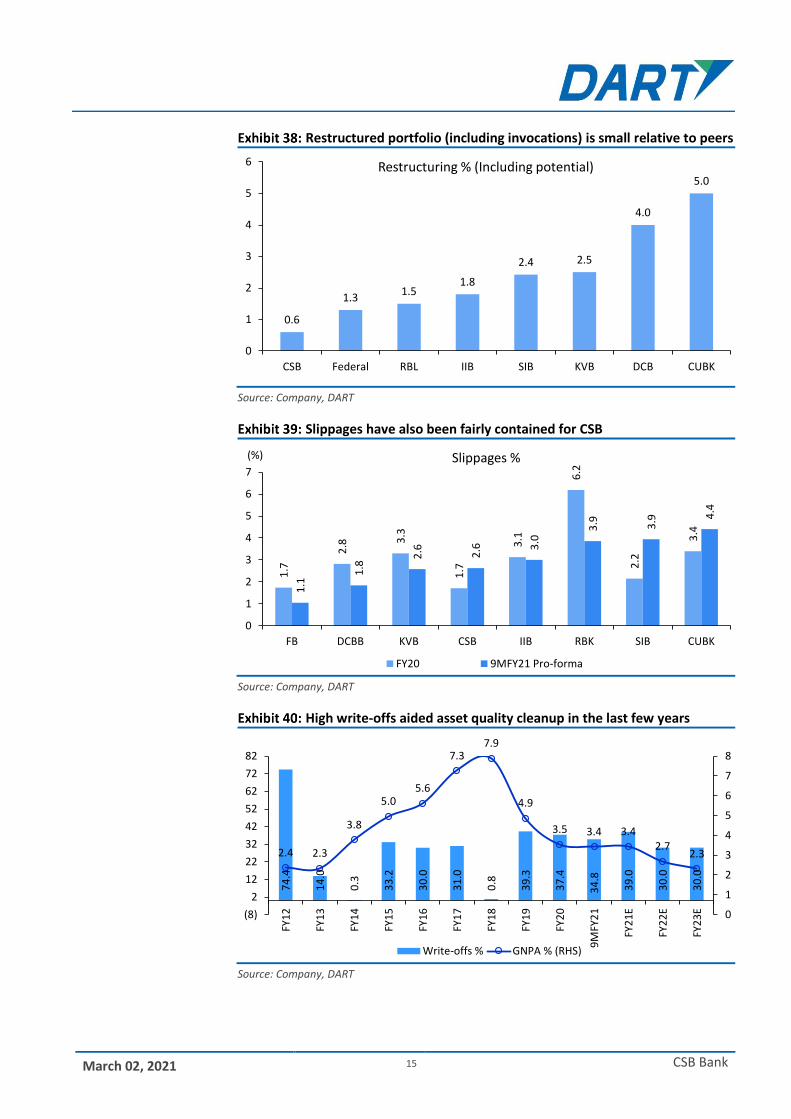
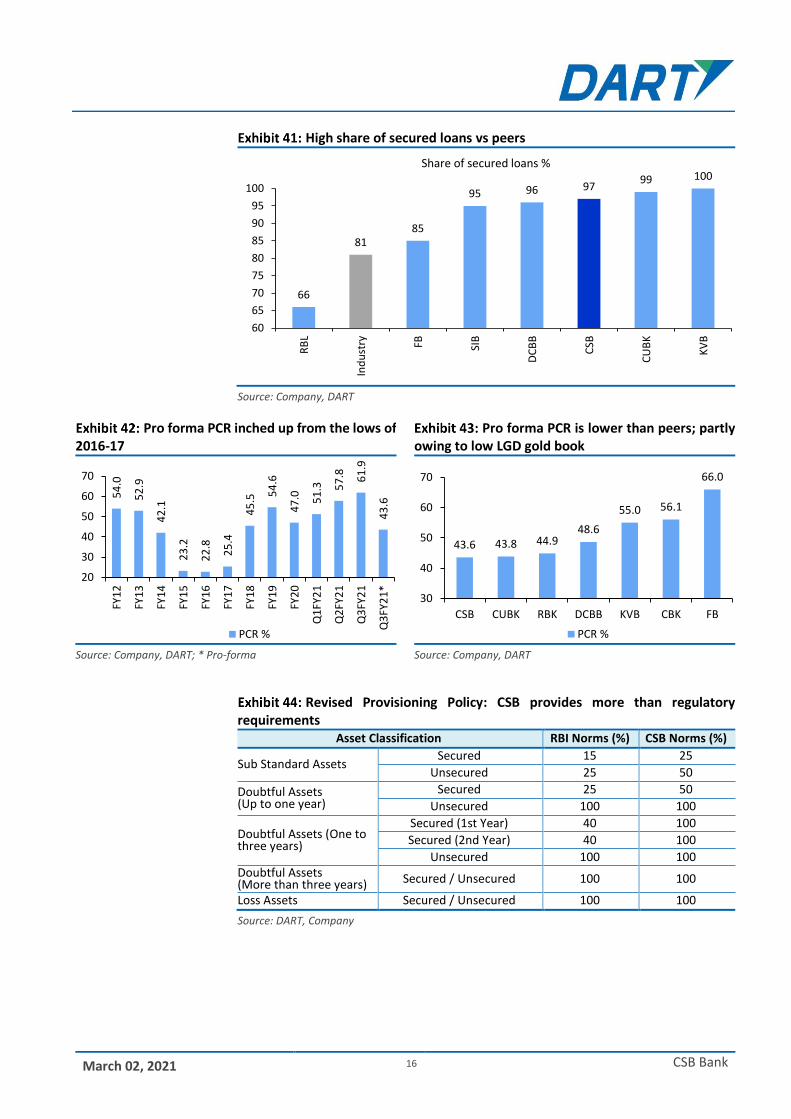
Post the current CEO took over his role in Dec-16, and even before Fairfax infused capital in the bank in FY19-20, the clean-up of asset quality had begun with write-off of weaker SME exposures and decline in GNPA from its peak of 7.9% to ~3.5% at the time of IPO. Against 4.4% of slippages seen over FY14-18, slippages averaged at 1.9% for FY19-20, and 2.5% for 9MFY21. We expect slippages to be sub 2% in FY22-23E. The decline in slippages will both be driven by a strengthened SME portfolio and an increased share of gold book where delinquencies/LGD are typically lower. COVID related stress was limited with annualized slippages at 6.7%/2.3% during Q3FY21/9MFY21, with 2/3rd of quarterly slippages in 3Q coming from the gold book. 1/3rd of the gold slippages were recovered by Jan-21. Annualized slippages 3QFY21 would be at 2.4% if gold loans were to be excluded. Restructured book stood at Rs0.8bn of 0.6% of loans, much below mid-sized peers. SMA book at 2.5% also compares well with the best in industry. As per the bank’s internal provisioning policy, it provides more than the minimum regulatory requirement against delinquent loans. Currently, other than higher provisions made towards pro forma NPAs, the bank has also provided 25% against restructured and SMA loans (0/1/2). While its pro forma PCR at 45% (ex of write-offs) is lower vs peers, this is partly led by high share of gold loans where LGDs are lower. Std asset provisions (ex of general provisions and those made towards pro forma NPAs) stood at 0.8% of advances.
Unlike peers, pro forma GNPA improved for CSB led by limited slippages and high loan growth
Source: Company, DART
1.7
2.8
1.7
3.3
3.1
6.2
2.2
3.4
1.1
1.8
2.4
2.6
3.0
3.9
3.9
4.4
0
1
2
3
4
5
6
7
FB DCBB CSB KVB IIB RBK SIB CUBK
(%) Slippages %
FY20 9MFY21 Pro-forma
March 02, 2021 15 CSB Bank
Restructured portfolio (including invocations) is small relative to peers
Source: Company, DART
Slippages have also been fairly contained for CSB
Source: Company, DART
High write-offs aided asset quality cleanup in the last few years
Source: Company, DART
0.6
1.31.5
1.8
2.4 2.5
4.0
5.0
0
1
2
3
4
5
6
CSB Federal RBL IIB SIB KVB DCB CUBK
Restructuring % (Including potential)
1.7
2.8
3.3
1.7
3.1
6.2
2.2
3.4
1.1
1.8
2.6
2.6
3.0
3.9
3.9
4.4
0
1
2
3
4
5
6
7
FB DCBB KVB CSB IIB RBK SIB CUBK
(%) Slippages %
FY20 9MFY21 Pro-forma
74
.4
14
.0
0.3
33
.2
30
.0
31
.0
0.8
39
.3
37
.4
34
.8
39
.0
30
.0
30
.0
2.4 2.3
3.8
5.05.6
7.37.9
4.9
3.5 3.4 3.42.7
2.3
0
1
2
3
4
5
6
7
8
(8)
2
12
22
32
42
52
62
72
82
FY1
2
FY1
3
FY1
4
FY1
5
FY1
6
FY1
7
FY1
8
FY1
9
FY2
0
9M
FY2
1
FY2
1E
FY2
2E
FY2
3E
Write-offs % GNPA % (RHS)
March 02, 2021 16 CSB Bank
High share of secured loans vs peers
Source: Company, DART
Pro forma PCR inched up from the lows of 2016-17
Pro forma PCR is lower than peers; partly owing to low LGD gold book
Source: Company, DART; * Pro-forma Source: Company, DART
Revised Provisioning Policy: CSB provides more than regulatory
requirements Asset Classification RBI Norms (%) CSB Norms (%)
Sub Standard Assets Secured 15 25
Unsecured 25 50
Doubtful Assets (Up to one year)
Secured 25 50
Unsecured 100 100
Doubtful Assets (One to three years)
Secured (1st Year) 40 100
Secured (2nd Year) 40 100
Unsecured 100 100 Doubtful Assets (More than three years) Secured / Unsecured 100 100
Loss Assets Secured / Unsecured 100 100
Source: DART, Company
66
8185
95 96 9799 100
60
65
70
75
80
85
90
95
100
RB
L
Ind
ust
ry FB SIB
DC
BB
CSB
CU
BK
KV
B
Share of secured loans %
54
.0
52
.9
42
.1
23
.2
22
.8
25
.4
45
.5 54
.6
47
.0
51
.3
57
.8
61
.9
43
.6
20
30
40
50
60
70
FY1
2
FY1
3
FY1
4
FY1
5
FY1
6
FY1
7
FY1
8
FY1
9
FY2
0
Q1
FY2
1
Q2
FY2
1
Q3
FY2
1
Q3
FY2
1*
PCR %
43.6 43.8 44.948.6
55.0 56.1
66.0
30
40
50
60
70
CSB CUBK RBK DCBB KVB CBK FB
PCR %

March 02, 2021 17 CSB Bank
High share of BB and below book owing to MSME exposures graduating to Corporate book
83% of MSME loans in low to medium risk category a positive
Source: Company, DART Source: Company, DART
55%
26%
10%
9%
External Rating of Corporate Accounts (>250mn) - Q3FY21
A and Above BBB <BBB Others
28%
55%
11%
1%5%
Internal Rating of SME Accounts - Q3FY21
Low Medium High Very High Others
March 02, 2021 18 CSB Bank
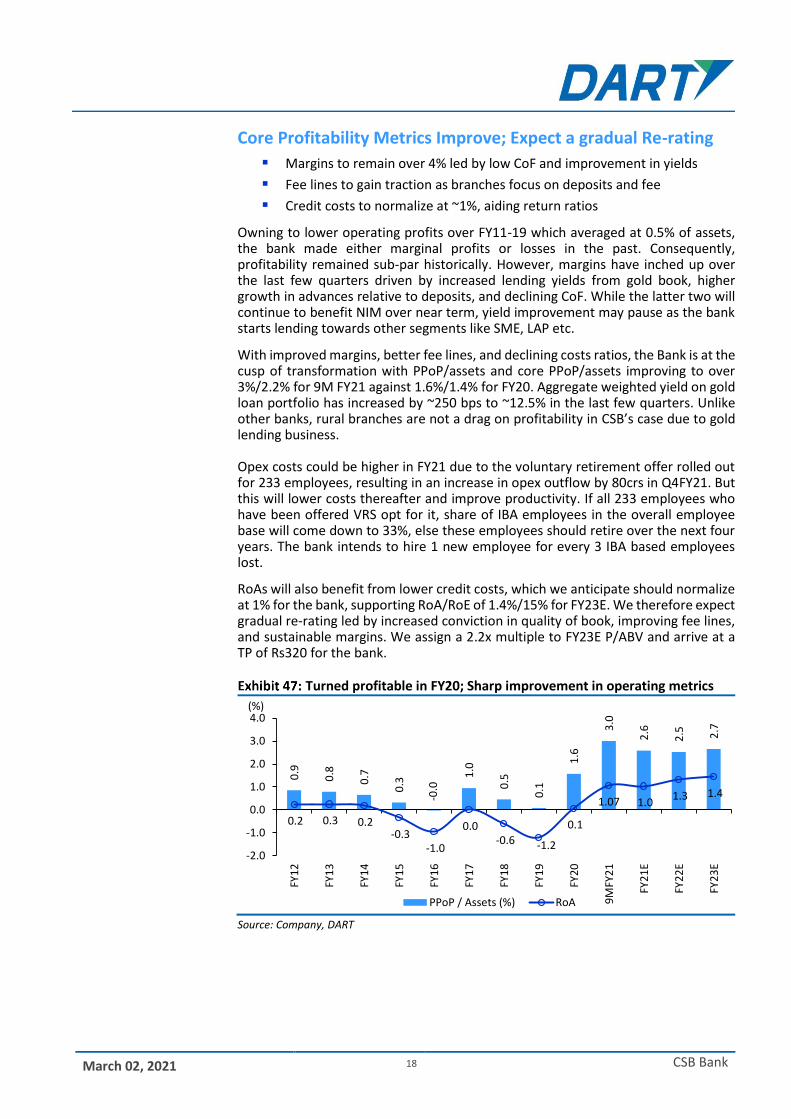
Core Profitability Metrics Improve; Expect a gradual Re-rating
Margins to remain over 4% led by low CoF and improvement in yields
Fee lines to gain traction as branches focus on deposits and fee
Credit costs to normalize at ~1%, aiding return ratios
Owning to lower operating profits over FY11-19 which averaged at 0.5% of assets, the bank made either marginal profits or losses in the past. Consequently, profitability remained sub-par historically. However, margins have inched up over the last few quarters driven by increased lending yields from gold book, higher growth in advances relative to deposits, and declining CoF. While the latter two will continue to benefit NIM over near term, yield improvement may pause as the bank starts lending towards other segments like SME, LAP etc.
With improved margins, better fee lines, and declining costs ratios, the Bank is at the cusp of transformation with PPoP/assets and core PPoP/assets improving to over 3%/2.2% for 9M FY21 against 1.6%/1.4% for FY20. Aggregate weighted yield on gold loan portfolio has increased by ~250 bps to ~12.5% in the last few quarters. Unlike other banks, rural branches are not a drag on profitability in CSB’s case due to gold lending business. Opex costs could be higher in FY21 due to the voluntary retirement offer rolled out for 233 employees, resulting in an increase in opex outflow by 80crs in Q4FY21. But this will lower costs thereafter and improve productivity. If all 233 employees who have been offered VRS opt for it, share of IBA employees in the overall employee base will come down to 33%, else these employees should retire over the next four years. The bank intends to hire 1 new employee for every 3 IBA based employees lost.
RoAs will also benefit from lower credit costs, which we anticipate should normalize at 1% for the bank, supporting RoA/RoE of 1.4%/15% for FY23E. We therefore expect gradual re-rating led by increased conviction in quality of book, improving fee lines, and sustainable margins. We assign a 2.2x multiple to FY23E P/ABV and arrive at a TP of Rs320 for the bank.
Turned profitable in FY20; Sharp improvement in operating metrics
Source: Company, DART
0.9
0.8
0.7
0.3
-0.0
1.0
0.5
0.1
1.6
3.0
2.6
2.5
2.7
0.2 0.3 0.2 -0.3
-1.0
0.0 -0.6 -1.2
0.1
1.07 1.0 1.3 1.4
-2.0
-1.0
0.0
1.0
2.0
3.0
4.0
FY1
2
FY1
3
FY1
4
FY1
5
FY1
6
FY1
7
FY1
8
FY1
9
FY2
0
9M
FY2
1
FY2
1E
FY2
2E
FY2
3E(%)
PPoP / Assets (%) RoA
March 02, 2021 19 CSB Bank
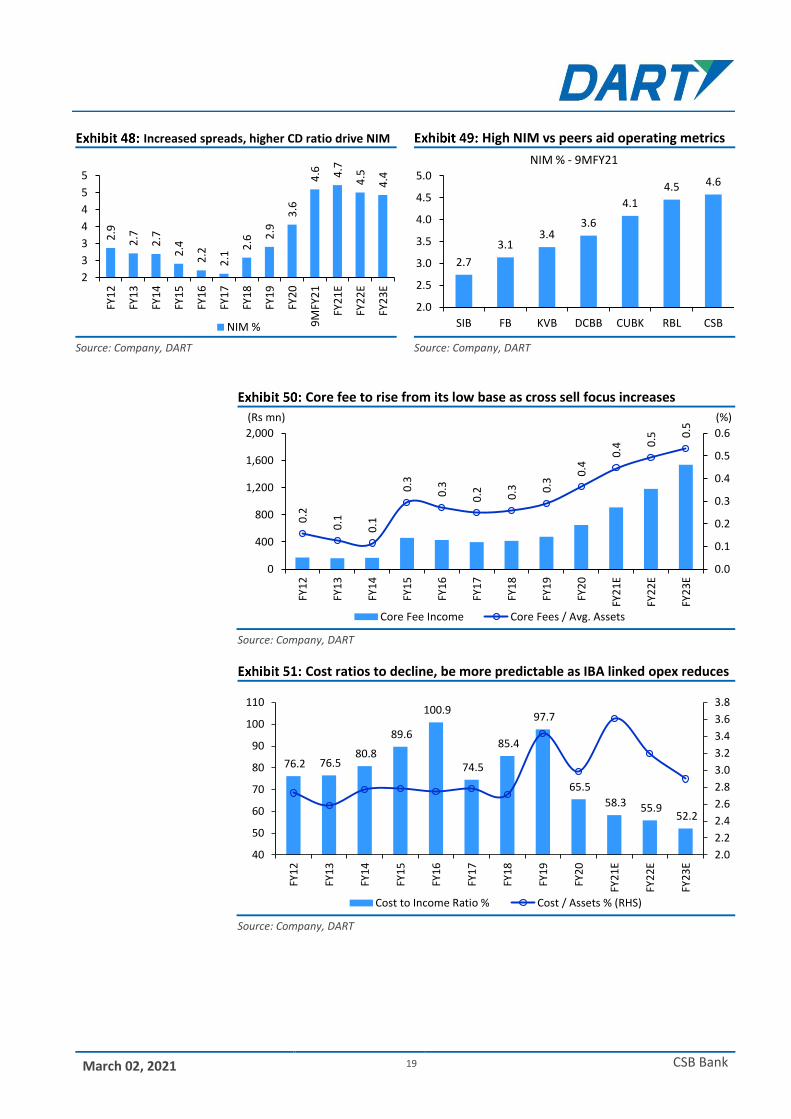
Increased spreads, higher CD ratio drive NIM High NIM vs peers aid operating metrics
Source: Company, DART Source: Company, DART
Core fee to rise from its low base as cross sell focus increases
Source: Company, DART
Cost ratios to decline, be more predictable as IBA linked opex reduces
Source: Company, DART
2.9
2.7
2.7
2.4
2.2
2.1
2.6 2
.9
3.6
4.6 4.7
4.5
4.4
2
3
3
4
4
5
5
FY1
2
FY1
3
FY1
4
FY1
5
FY1
6
FY1
7
FY1
8
FY1
9
FY2
0
9M
FY2
1
FY2
1E
FY2
2E
FY2
3E
NIM %
2.7
3.13.4
3.6
4.1
4.5 4.6
2.0
2.5
3.0
3.5
4.0
4.5
5.0
SIB FB KVB DCBB CUBK RBL CSB
NIM % - 9MFY21
0.2
0.1
0.1
0.3
0.3
0.2 0.3 0
.3
0.4
0.4 0
.5 0.5
0.0
0.1
0.2
0.3
0.4
0.5
0.6
0
400
800
1,200
1,600
2,000
FY1
2
FY1
3
FY1
4
FY1
5
FY1
6
FY1
7
FY1
8
FY1
9
FY2
0
FY2
1E
FY2
2E
FY2
3E
(%)(Rs mn)
Core Fee Income Core Fees / Avg. Assets
76.2 76.5 80.8
89.6
100.9
74.5
85.4
97.7
65.5
58.3 55.9 52.2
2.0
2.2
2.4
2.6
2.8
3.0
3.2
3.4
3.6
3.8
40
50
60
70
80
90
100
110
FY1
2
FY1
3
FY1
4
FY1
5
FY1
6
FY1
7
FY1
8
FY1
9
FY2
0
FY2
1E
FY2
2E
FY2
3E
Cost to Income Ratio % Cost / Assets % (RHS)

March 02, 2021 20 CSB Bank
RoA Decomposition: Several levers to RoA improvement
Source: Company, DART
Return Profile – vs Key Peers
Source: Company, DART
High capital base conducive for growth
Source: Company, DART
2.8 2.6 2.6 2.3 2.1 2.0 2.4 2.7 3.3 4.4 4.3 4.2
0.8 0.7 0.8 0.8 0.7 1.8 0.8 0.8
1.2
1.8 1.5 1.3
-2.7 -2.6 -2.8 -2.8 -2.8 -2.8 -2.7 -3.4 -3.0 -3.6 -3.2 -2.9
-0.6 -0.5 -0.4 -0.9 -1.4 -1.0 -1.4
-1.9
-0.8 -1.2
-0.8 -0.7 -0.0 -0.1 -0.1
0.2 0.5
0.1 0.3 0.6
-0.7 -0.4
-0.4 -0.5
-1.5
-1.0
-0.5
0.0
0.5
1.0
1.5
2.0
-6.0
-4.0
-2.0
0.0
2.0
4.0
6.0
FY12 FY13 FY14 FY15 FY16 FY17 FY18 FY19 FY20 FY21E FY22E FY23E
(%)(%)
NII Other Income Opex Provisions Tax RoA(RHS)
0.10.5 0.6 0.8 0.8 0.9 1.1 1.3
1.0
3.7
5.1
9.8
6.5
10.3
12.911.7
0
2
4
6
8
10
12
14
0.0
0.2
0.4
0.6
0.8
1.0
1.2
1.4
SIB KVB RBL FB IIB DCBB CSB CUBK
RoA (%) and ROE (%) - 9MFY21
RoA (%) RoE (%) - RHS
8.8 9.6 9.1 9.3 9.8 11.5
9.5
16.0
21.8 11.1 12.3
11.0 11.0 10.6 12.1
9.9
16.7
22.5
5
10
15
20
25
FY12 FY13 FY14 FY15 FY16 FY17 FY18 FY19 FY20
Capital Adequacy %
CET 1 Ratio Tier 2 Ratio Total CRAR Ratio
%
March 02, 2021 21 CSB Bank
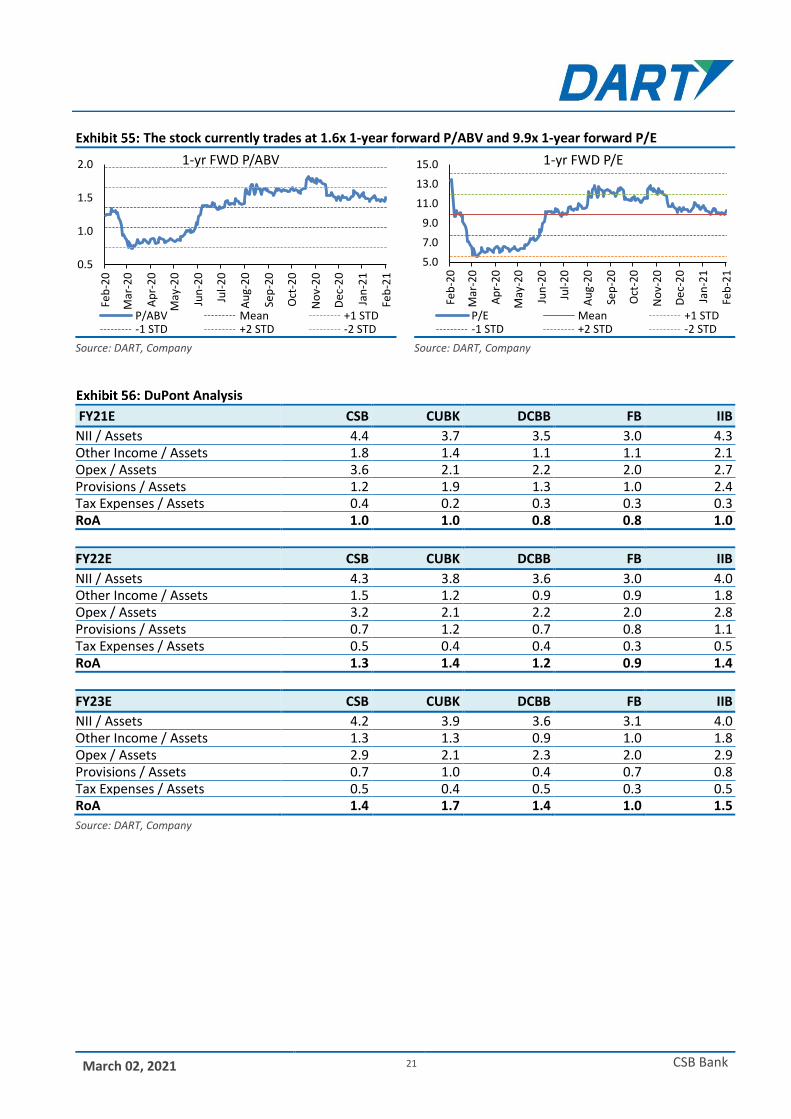
The stock currently trades at 1.6x 1-year forward P/ABV and 9.9x 1-year forward P/E
Source: DART, Company Source: DART, Company
DuPont Analysis
FY21E CSB CUBK DCBB FB IIB
NII / Assets 4.4 3.7 3.5 3.0 4.3
Other Income / Assets 1.8 1.4 1.1 1.1 2.1
Opex / Assets 3.6 2.1 2.2 2.0 2.7
Provisions / Assets 1.2 1.9 1.3 1.0 2.4
Tax Expenses / Assets 0.4 0.2 0.3 0.3 0.3
RoA 1.0 1.0 0.8 0.8 1.0
FY22E CSB CUBK DCBB FB IIB
NII / Assets 4.3 3.8 3.6 3.0 4.0
Other Income / Assets 1.5 1.2 0.9 0.9 1.8
Opex / Assets 3.2 2.1 2.2 2.0 2.8
Provisions / Assets 0.7 1.2 0.7 0.8 1.1
Tax Expenses / Assets 0.5 0.4 0.4 0.3 0.5
RoA 1.3 1.4 1.2 0.9 1.4
FY23E CSB CUBK DCBB FB IIB
NII / Assets 4.2 3.9 3.6 3.1 4.0
Other Income / Assets 1.3 1.3 0.9 1.0 1.8
Opex / Assets 2.9 2.1 2.3 2.0 2.9
Provisions / Assets 0.7 1.0 0.4 0.7 0.8
Tax Expenses / Assets 0.5 0.4 0.5 0.3 0.5
RoA 1.4 1.7 1.4 1.0 1.5
Source: DART, Company
0.5
1.0
1.5
2.0
Feb
-20
Mar
-20
Ap
r-2
0
May
-20
Jun
-20
Jul-
20
Au
g-2
0
Sep
-20
Oct
-20
No
v-2
0
De
c-2
0
Jan
-21
Feb
-21
1-yr FWD P/ABV
P/ABV Mean +1 STD-1 STD +2 STD -2 STD
5.0
7.0
9.0
11.0
13.0
15.0
Feb
-20
Mar
-20
Ap
r-2
0
May
-20
Jun
-20
Jul-
20
Au
g-2
0
Sep
-20
Oct
-20
No
v-2
0
De
c-2
0
Jan
-21
Feb
-21
1-yr FWD P/E
P/E Mean +1 STD-1 STD +2 STD -2 STD
March 02, 2021 22 CSB Bank
About the Company CSB, founded in Nov 1920 as Catholic Syrian Bank, is an old private sector bank headquartered in Thrissur, Kerala. It has a strong base in southern states, especially Kerala, which houses ~60% of its branches. The bank has had a chequered history with weak corporate governance, low operating profits and fragile capital levels. In Feb-18, RBI allowed Fairfax India through FIHM (Fairfax India Holdings Mauritius) to acquire 51% stake resulting in capital infusion of ~INR12bn in the bank, the second and final tranche of which was infused in Aug-2019. As part of regulatory requirements, the bank was subsequently listed in Dec-2019. The Rs4.1bn IPO offer involved fresh issue of Rs0.24bn and offer for sale by investors of Rs3.85bn. In the year 2019, the bank rebranded itself to “CSB Bank Limited” from ‘The Catholic Syrian Bank Limited’. According to road map prepared around the time of Fairfax’s acquisition of CSB, Fairfax was required to cut its stake to 40% in CSB over the next five years, to 30% in the subsequent five, and to 15% by the end of 15 years. This may however change if the ownership guidelines which are currently under review are revised, as per which cap on promoter holding may be raised upwards to 26% from 15% currently. With the Fairfax’s backing, CSB is now focusing on implementation of strategic changes in their business model to function efficiently as a full service new age bank by (a) re-aligning organizational set-up, (b) digitization & technology, (c) expanding products and services, (d) enhancing customer experience and (e) marketing & branch building.
Top Shareholders (Dec-2020) Particulars (%)
FIH Mauritius Investments Ltd 49.73
SBI Small Cap Fund 4.93
Yusuffali Musaliam Veettil Abdul Kader 2.14
Omers Administration Corporation 2.07
Nomura Singapore Limited 1.73
Sundaram Equity hybrid Fund 1.67
Plutus Wealth Management 1.27
Vallabh Bhanshali 1.26
Infinity Holdings 1.14
Zafar Ahmadullah 1.07
Volrado Venture Partners (AIF) 1.03
Source: DART, Company
March 02, 2021 23 CSB Bank
KMP
Name Designation Details
Mr. Rajendran Chinna Veerappan
MD & CEO
Mr. CV Rajendran holds a bachelor’s and a master’s degree in commerce from Madurai Kamaraj University and is an associate of the Indian Institute of Bankers. He previously served as the chief executive of the AMFI. He has over 40 years of experience and was previously associated with Corporation Bank, Andhra Bank and BoM. He has been on the Board since November 24, 2016.
Mr. B K Divakara CFO
Mr. B K Divakara holds a bachelor's degree in Business Management from University of Mysore. Further he is a CA and CS. Prior to joining CSB, he has worked with CBoI and Corporation Bank and has over 33 years of experience in the field of banking.
Mr. Pralay Mondal President - Retail, SME, Operations, IT
Mr. Pralay Mondal joined the Bank in Sep-20. He is an Engineer from IIT, Kharagpur and a MBA from IIM, Calcutta. Prior to joining CSB Bank, he was ED and Head of Retail Banking at Axis Bank. He also played an instrumental role in setting up the retail franchise at Yes Bank. Mr. Mondal has around 30 years of banking experience across HDFC Bank (12 years), Standard Chartered Bank, Wipro InfoTech and Colgate Palmolive.
Mr. Neeraj Dhawan
Chief Credit Officer - Retail & SME, Strategy, BIU and Analytics
Mr. Neeraj Dhawan holds a bachelor’s degree in Commerce from University of Calcutta. He is a Chartered Accountant and also an associate of the ICAI and ICWAI. Prior to CSB, he was the CRO at Yes Bank. He has 27 years of experience and has previously worked with viz. GE Capital, ABN AMRO Bank, HDFC Bank and ICICI Bank.
Mr. Ganesan V Head (Recovery and Credit Monitoring)
Mr. Ganesan V. holds a bachelor’s degree in science from Madurai University. He has over 40 years of experience in the field of banking. He was associated with the Bank since 1978 and retired in 2016 on attaining superannuation. Thereafter, he worked with Pegasus Assets Reconstruction Private Limited and joined CSB in 2018.
Mr. Kesava Naidu Rayar Head (Treasury)
Mr. Rayar joined the bank in 2018. He holds a bachelor’s degree in law and master’s degree in psychology from Annamalai University. He is also a certified associate of ICWA and a CS. He has about 35 years of experience in the field of banking. Prior to joining the Bank, he was associated with Andhra Bank.
Mr. Arvind K Sharma Chief Risk Officer
Mr Sharma brings more than twenty-seven years of diverse banking experience, having worked previously with SBI for 24 years and Bank Sohar in Oman for three years. Arvind is a MA in Economics with a PG Diploma in Financial Engineering and a Graduate of Advanced Management Programme from Harvard Business School.
Mr. Shyam Mani Head- SME and NRI Banking
Shyam Mani joined CSB in Nov-20. Mr. He is an Engineer from Bangalore University. He has overall 24 years of experience in varied functions that includes Branch Banking, SME, Retail and NRI Banking. He has previously worked with Yes Bank, ICICI Bank, HDFC Bank and GE Countrywide in leadership and senior roles covering retail, SME and Retail.
Mr. Prem Kumar Thampi Head- Wholesale Banking
Mr Thampi holds a bachelor’s and master’s degree in science from BHU and joined the bank in 2015. He is a fellow member of the Institute of Directors and has over 30 years of experience in the field of banking and treasury. Prior to joining our Bank, he was associated with the SBI, Bank M (Tanzania) and ICICI Bank.
Mr Narendra Dixit Head- Retail Banking
Narendra Dixit is joined CSB in Nov-20 and has over 22 years of experience in the field of banking. Prior to joining CSB, he was associated with Axis Bank as National Head – Liability Sales. Prior to Axis Bank, he has also worked with Yes Bank.
Mr. Vuppala Srinivasa Rao
Chief Technology Officer
Mr. Rao holds a bachelor’s degree in commerce from Sri Venkateswara University and is a certified associate of the Indian Institute of Bankers. Mr Srinivasa joined the bank in 2018 and has about 39 years of experience. He was previously associated with Andhra Bank.
Source: DART, Company

March 02, 2021 24 CSB Bank
Profit and Loss Account (Rs Mn)
Particulars FY20A FY21E FY22E FY23E
Interest Income 15,099 18,368 20,766 25,032
Interest expenses 9,176 9,324 10,540 12,866
Net interest income 5,923 9,044 10,226 12,166
Other incomes 2,216 3,585 3,520 3,840
Total expenses 5,333 7,363 7,674 8,353
- Employee cost 3,313 5,201 5,253 5,568
- Other 2,020 2,162 2,421 2,785
Pre provisioning profit 2,806 5,266 6,071 7,653
Provisions 1,466 2,413 1,781 2,101
Profit before taxes 1,340 2,853 4,290 5,552
Tax provision 1,213 719 1,081 1,399
Profit after tax 127 2,134 3,209 4,153
Adjusted profit 127 2,134 3,209 4,153
Balance Sheet (Rs Mn)
Particulars FY20A FY21E FY22E FY23E
Sources of Funds
Equity Capital 1,735 1,735 1,735 1,735
Reserves & Surplus 17,872 19,977 23,226 27,450
Minority Interest 0 0 0 0
Net worth 19,607 21,712 24,961 29,185
Borrowings 7,940 8,411 4,317 2,562
- Deposits 157,907 178,497 211,555 253,662
- Other interest bearing liabilities 0 0 0 0
Current liabilities & provisions 3,189 10,087 20,095 30,506
Total Liabilities 188,642 218,707 260,928 315,916
Application of Funds
Cash and balances with RBI 9,393 11,678 14,021 17,066
Investments 53,599 58,244 65,909 74,724
Advances 113,664 136,396 167,767 209,709
Fixed assets 2,283 2,489 2,838 3,295
Other current assets, loans and advances 9,704 9,898 10,393 11,121
Total Assets 188,642 218,707 260,928 315,916
E – Estimates

March 02, 2021 25 CSB Bank
Important Ratios
Particulars FY20A FY21E FY22E FY23E
(A) Margins (%)
Yield on advances 10.6 10.9 10.5 10.4
Yields on interest earning assets 9.1 9.6 9.1 9.1
Yield on investments 8.5 6.6 7.9 6.9
Costs of funds 5.8 5.3 5.2 5.5
Cost of deposits 5.8 5.8 5.3 5.3
NIMs 3.6 4.7 4.5 4.4
(B) Asset quality and capital ratios (%)
GNPA 3.5 3.5 2.7 2.3
NNPA 1.9 1.9 1.4 1.1
PCR 47.0 45.0 48.0 52.0
Slippages 1.7 2.6 1.8 1.7
NNPA to NW 12.0 12.9 9.9 8.4
CASA 29.2 30.5 31.0 31.0
CAR 22.5 22.0 19.9 17.8
Tier 1 21.8 20.2 18.4 16.5
Credit - Deposit 72.0 76.4 79.3 82.7
(C) Dupont as a percentage of average assets
Interest income 8.4 9.0 8.7 8.7
Interest expenses 5.1 4.6 4.4 4.5
Net interest income 3.3 4.4 4.3 4.2
Non interest Income 1.2 1.8 1.5 1.3
Total expenses 3.0 3.6 3.2 2.9
- cost to income 65.5 58.3 55.8 52.2
Provisions 0.8 1.2 0.7 0.7
Tax 0.7 0.4 0.5 0.5
RoA 0.1 1.0 1.3 1.4
Leverage 1045.4 1083.8 1115.7 1147.1
RoE 0.9 10.3 13.8 15.3
RoRwa 0.2 2.2 2.6 2.6
(D) Measures of Investments
EPS - adjusted 0.7 12.3 18.5 23.9
BV 104.0 116.3 134.8 158.7
ABV 89.6 101.3 121.4 145.4
DPS 0.0 0.0 0.0 0.0
Dividend payout ratio 0.0 0.0 0.0 0.0
(E) Growth Ratios (%)
Net interest income 34.6 52.7 13.1 19.0
PPoP 1998.4 87.7 15.3 26.1
Adj PAT (106.4) 1577.2 50.4 29.4
Advances 7.1 20.0 23.0 25.0
Total borrowings 5.9 (48.7) (40.7)
Total assets 11.5 15.9 19.3 21.1
(F) Valuation Ratios
Market Cap (Rs. mn) 39,430 39,430 39,430 39,430
CMP (Rs.) 227 227 227 227
P/E (x) 309.8 18.5 12.3 9.5
P/BV (x) 2.2 2.0 1.7 1.4
P/ABV (x) 2.5 2.2 1.9 1.6
Div Yield (%) 0.0 0.0 0.0 0.0
E – Estimates
DART RATING MATRIX
Total Return Expectation (12 Months)
Buy > 20%
Accumulate 10 to 20%
Reduce 0 to 10%
Sell < 0%
DART Team
Purvag Shah Managing Director [email protected] +9122 4096 9747
Amit Khurana, CFA Head of Equities [email protected] +9122 4096 9745
CONTACT DETAILS
Equity Sales Designation E-mail Direct Lines
Dinesh Bajaj VP - Equity Sales [email protected] +9122 4096 9709
Kapil Yadav VP - Equity Sales [email protected] +9122 4096 9735
Yomika Agarwal VP - Equity Sales [email protected] +9122 4096 9772
Jubbin Shah VP - Equity Sales [email protected] +9122 4096 9779
Ashwani Kandoi AVP - Equity Sales [email protected] +9122 4096 9725
Lekha Nahar AVP - Equity Sales [email protected] +9122 4096 9740
Equity Trading Designation E-mail
P. Sridhar SVP and Head of Sales Trading [email protected] +9122 4096 9728
Chandrakant Ware VP - Sales Trading [email protected] +9122 4096 9707
Shirish Thakkar VP - Head Domestic Derivatives Sales Trading [email protected] +9122 4096 9702
Kartik Mehta Asia Head Derivatives [email protected] +9122 4096 9715
Dinesh Mehta Co- Head Asia Derivatives [email protected] +9122 4096 9765
Bhavin Mehta VP - Derivatives Strategist [email protected] +9122 4096 9705
Dolat Capital Market Private Limited. Sunshine Tower, 28th Floor, Senapati Bapat Marg, Dadar (West), Mumbai 400013
Our Research reports are also available on Reuters, Thomson Publishers, DowJones and Bloomberg (DCML <GO>)
Analyst(s) Certification The research analyst(s), with respect to each issuer and its securities covered by them in this research report, certify that: All of the views expressed in this research report accurately reflect his or her or their personal views about all of the issuers and their securities; and No part of his or her or their compensation was, is, or will be directly or indirectly related to the specific recommendations or views expressed in this research report.
I. Analyst(s) and Associate (S) holding in the Stock(s): (Nil)
II. Disclaimer: This research report has been prepared by Dolat Capital Market Private Limited. to provide information about the company(ies) and sector(s), if any, covered in the report and may be distributed by it and/or its affiliated company(ies) solely for the purpose of information of the select recipient of this report. This report and/or any part thereof, may not be duplicated in any form and/or reproduced or redistributed without the prior written consent of Dolat Capital Market Private Limited. This report has been prepared independent of the companies covered herein. Dolat Capital Market Private Limited. and its affiliated companies are part of a multi-service, integrated investment banking, brokerage and financing group. Dolat Capital Market Private Limited. and/or its affiliated company(ies) might have provided or may provide services in respect of managing offerings of securities, corporate finance, investment banking, mergers & acquisitions, financing or any other advisory services to the company(ies) covered herein. Dolat Capital Market Private Limited. and/or its affiliated company(ies) might have received or may receive compensation from the company(ies) mentioned in this report for rendering any of the above services. Research analysts and sales persons of Dolat Capital Market Private Limited. may provide important inputs to its affiliated company(ies) associated with it. While reasonable care has been taken in the preparation of this report, it does not purport to be a complete description of the securities, markets or developments referred to herein, and Dolat Capital Market Private Limited. does not warrant its accuracy or completeness. Dolat Capital Market Private Limited. may not be in any way responsible for any loss or damage that may arise to any person from any inadvertent error in the information contained in this report. This report is provided for information only and is not an investment advice and must not alone be taken as the basis for an investment decision. The investment discussed or views expressed herein may not be suitable for all investors. The user assumes the entire risk of any use made of this information. The information contained herein may be changed without notice and Dolat Capital Market Private Limited. reserves the right to make modifications and alterations to this statement as they may deem fit from time to time. Dolat Capital Market Private Limited. and its affiliated company(ies), their directors and employees may; (a) from time to time, have a long or short position in, and buy or sell the securities of the company(ies) mentioned herein or (b) be engaged in any other transaction involving such securities and earn brokerage or other compensation or act as a market maker in the financial instruments of the company(ies) discussed herein or act as an advisor or lender/borrower to such company(ies) or may have any other potential conflict of interests with respect to any recommendation and other related information and opinions. This report is neither an offer nor solicitation of an offer to buy and/or sell any securities mentioned herein and/or not an official confirmation of any transaction. This report is not directed or intended for distribution to, or use by any person or entity who is a citizen or resident of or located in any locality, state, country or other jurisdiction, where such distribution, publication, availability or use would be contrary to law, regulation or which would subject Dolat Capital Market Private Limited. and/or its affiliated company(ies) to any registration or licensing requirement within such jurisdiction. The securities described herein may or may not be eligible for sale in all jurisdictions or to a certain category of investors. Persons in whose possession this report may come, are required to inform themselves of and to observe such restrictions.
For U.S. Entity/ persons only: This research report is a product of Dolat Capital Market Private Limited., which is the employer of the research analyst(s) who has prepared the research report. The research analyst(s) preparing the research report is/are resident outside the United States (U.S.) and are not associated persons of any U.S. regulated broker-dealer and therefore the analyst(s) is/are not subject to supervision by a U.S. broker-dealer, and is/are not required to satisfy the regulatory licensing requirements of FINRA or required to otherwise comply with U.S. rules or regulations regarding, among other things, communications with a subject company, public appearances and trading securities held by a research analyst account.
This report is intended for distribution by Dolat Capital Market Private Limited. only to "Major Institutional Investors" as defined by Rule 15a-6(b)(4) of the U.S. Securities and Exchange Act, 1934 (the Exchange Act) and interpretations thereof by U.S. Securities and Exchange Commission (SEC) in reliance on Rule 15a 6(a)(2). If the recipient of this report is not a Major Institutional Investor as specified above, then it should not act upon this report and return the same to the sender. Further, this report may not be copied, duplicated and/or transmitted onward to any U.S. person or entity.
In reliance on the exemption from registration provided by Rule 15a-6 of the Exchange Act and interpretations thereof by the SEC in order to conduct certain business with Major Institutional Investors, Dolat Capital Market Private Limited. has entered into an agreement with a U.S. registered broker-dealer Ltd StoneX Financial Inc.(“StoneX”). Transactions in securities discussed in this research report should be effected through StoneX Financial Inc.(“StoneX”) or another U.S. registered broker dealer/Entity as informed by Dolat Capital Market Private Limited. from time to time.
Dolat Capital Market Private Limited.
Corporate Identity Number: U65990DD1993PTC009797 Member: BSE Limited and National Stock Exchange of India Limited.
SEBI Registration No: BSE – INZ000274132, NSE - INZ000274132, Research: INH000000685 Registered office: Office No. 141, Centre Point, Somnath, Daman – 396 210, Daman & Diu
Board: +9122 40969700 | Fax: +9122 22651278 | Email: [email protected] | www.dolatresearch.com