In-Depth Review of the Energy Efficiency Policy of Montenegro
222
In-Depth Review of the Energy Efficiency Policy of Montenegro Energy Charter Protocol on Energy Efficiency and Related Environmental Aspects PEEREA
-
Upload
khangminh22 -
Category
Documents
-
view
0 -
download
0
Transcript of In-Depth Review of the Energy Efficiency Policy of Montenegro

In-Depth Review of theEnergy Efficiency Policy of Montenegro
Energy Charter Protocol on Energy Efficiency and Related Environmental AspectsPEEREA

In-Depth Review of theEnergy Efficiency Policy of Montenegro
Energy Charter Protocol on Energy Efficiency and Related Environmental AspectsPEEREA
2018

DISCLAIMER
Information contained in this work has been obtained from sources believed to be reliable. However, neither the Energy Charter Secretariat nor the work’s author guarantees the accuracy or completeness of any information published herein, and neither the Energy Charter Secretariat nor the work’s author shall be responsible for any losses or damages arising from the use of this information or from any errors or omissions therein. This work is published on the understanding that the Energy Charter Secretariat and the work’s author supply the information but do not attempt to render legal or other professional services.
This study is published without prejudice to the position of Contracting Parties/Signatories of the Energy Charter Treaty or to their rights or obligations under the Energy Charter Treaty or any other international investment agreement.
This review report has been prepared by the Energy Charter Secretariat in cooperation with the Ministry of Economy of Montenegro. The peer review team was composed of officials from countries that are parties to the Protocol on Energy Efficiency and Related Environmental Effects (PEEREA).
© Energy Charter Secretariat, 2018 Boulevard de la Woluwe, 46B-1200 Brussels, Belgium
ISBN: 978-905948-211-1 (PDF, English)ISBN: 978-905948-210-4 (Paperback, English)Depot number: D/2019/7850/1
The reproduction of this work, save where otherwise stated, is authorised, provided the source is acknowledged. All rights are otherwise reserved.
Layout Design and Prepress: Diana Spotinova for Spotinov Print Ltd.Printed by Spotinov Print Ltd.Photos: Krnovo Green Energy
2018

List of Peer Review Team Members
Mihai Ramniceanu, Energy Regulatory Authority (ANRE), Romania
Peter Gvero, University of Banja Luka, Bosnia and Herzegovina
Jan Ciampor, Ministry of Industry and Trade, Czech Republic
Borko Raicevic, Energy Community Secretariat
Sarah Keay-Bright, Energy Charter Secretariat
Oleksandr Antonenko, Energy Charter Secretariat


List of Contributors
Bozidar Pavlovic, Expert seconded to the Energy Charter Secretariat, Directorate for Energy Efficiency, Ministry of Economy (main author of the report)
Marko Radulovic, Directorate for Energy Efficiency, Ministry of Economy
Milorad Burzan, Directorate for Energy Efficiency, Ministry of Economy
Velibor Sinanovic, Directorate for Energy Efficiency, Ministry of Economy
Danilo Barjaktarovic, Directorate for Energy, Ministry of Economy
Biljana Maslac, MEEP project (WB)
Sandra Sipcic, EEPPB project (KfW)
Marija Vujadinovic, EEPPB project (KfW)
Jasna Sekulovic, GIZ
Aleksandra Kikovic, UNDP
Matija Tadic, KfW
Jamez Falzon, EBRD
Dragan Cizmovic, HPP Perucica
Dragomir Blagojevic, HPP Piva
Sreten Gojkovic, EPCG
Marko Delibasic, EPCG
Ivan Mrvaljevic, EPCG
Rajko Jaredic, EPCG
Radeta Sukovic, Energy Regulatory Agency
Igor Malidzan, Energy Regulatory Agency
Jelena Anicic, Energy Regulatory Agency
Milica Knezevic, Energy Regulatory Agency
Predrag Damjanovic, Energy Regulatory Agency
Jaksa Riger, Energy Regulatory Agency
Ivan Bulatovic, CGES
Ranko Vukovic, CEDIS
Sava Ostojic, CEDIS
Predrag Bogetic, CEDIS
Vanja Vukcevic, CEDIS
Anja Nedovic, CEDIS
Marga Kokovic, Chamber of Economy of Montenegro
Mladen Bajkovic, ETG Inzenjering
Biljana Gligoric, NGO Expeditio
Olivera Kujundzic, Ministry for Sustainable Development and Tourism
Jelena Raicevic, Ministry for Sustainable Development and Tourism

6
In-Depth Review of the Energy Efficiency Policy of Montenegro | 2018
Table of Contents
List of Peer Review Team Members ..................................................................................................................................................................................................3
List of Contributors .................................................................................................................................................................................................................................................5
Acronyms .........................................................................................................................................................................................................................................................................12
Executive Summary ...........................................................................................................................................................................................................................................16
Recommendations .............................................................................................................................................................................................................................................24
Kratak sadržaj .............................................................................................................................................................................................................................................................32
Preporuke ........................................................................................................................................................................................................................................................................40
1. Background............................................................................................................................................................................................................................................................48
1.1. Country Overview .............................................................................................................................................................................................................................48
1.2. Economic Background ................................................................................................................................................................................................................49
2. Energy Supply and Demand .........................................................................................................................................................................................................60
2.1. Electricity ......................................................................................................................................................................................................................................................62
2.2. Coal ....................................................................................................................................................................................................................................................................64
2.3. Oil Products ...............................................................................................................................................................................................................................................65
2.4. Natural Gas .................................................................................................................................................................................................................................................67
2.5. Heat .....................................................................................................................................................................................................................................................................67
3. Market Structure for Electricity, Natural Gas and Heat ..............................................................................................................................72
3.1 Electricity ......................................................................................................................................................................................................................................................72
3.2 Natural Gas and Heat ......................................................................................................................................................................................................................75
4. Energy-Pricing Policy ..............................................................................................................................................................................................................................78
4.1. Electricity Tariffs ....................................................................................................................................................................................................................................78
4.2. Subsidies for Vulnerable Consumers ........................................................................................................................................................................85
4.3. Taxes and Other Charges ........................................................................................................................................................................................................86
4.4. Emissions Trading ...............................................................................................................................................................................................................................88
5. Energy and Energy Efficiency Policy ....................................................................................................................................................................................92
5.1. Strategic Framework .....................................................................................................................................................................................................................92
5.2. Legal Framework for Energy Efficiency ...................................................................................................................................................................94
5.3. National Targets and Action Plans ..............................................................................................................................................................................101
5.4. Institutional Framework .........................................................................................................................................................................................................104
6. Renewable Energy Policy ..............................................................................................................................................................................................................110
6.1. Background and Potential of Renewable Energy Sources ...........................................................................................................110
6.2. Renewable Energy Sources: Policies and Measures .............................................................................................................................111
7. Environmental and Climate Change Policies Related to Energy ..............................................................................................118
7.1. Legislative Framework for Environmental Protection ........................................................................................................................118
7.2. Air Quality .................................................................................................................................................................................................................................................119

7
Table of Contents
7.3. Nature Protection and Hydropower ........................................................................................................................................................................120
7.4. Climate Change Impacts, Mitigation and Adaptation .......................................................................................................................120
7.5. Emissions of Carbon Dioxide (CO2) Caused by Fuel Combustion .......................................................................................122
8. Finance and International Assistance.............................................................................................................................................................................126
9. Assessment of the Energy Efficiency Potential and Policies at the Sectoral Level ............................................130
9.1. General Assessment ...................................................................................................................................................................................................................130
9.2. Power Sector .......................................................................................................................................................................................................................................138
9.3. Industry ......................................................................................................................................................................................................................................................152
9.4. Buildings .....................................................................................................................................................................................................................................................161
9.5. Energy-Using Products .............................................................................................................................................................................................................170
9.6. Transport ....................................................................................................................................................................................................................................................175
Glossary ........................................................................................................................................................................................................................................................................184

8
In-Depth Review of the Energy Efficiency Policy of Montenegro | 2018
List of Figures
Figure 1: Map of Montenegro 48
Figure 2: GDP per capita (thousand €) and GDP growth (%) for Montenegro, 2007-2016 50
Figure 3: Breakdown of GDP by sector of economic activity 2016, % 51
Figure 4: Export and import shares of Montenegro in 2016 (per sector) 52
Figure 5: Rank of Montenegro in the “Ease of Doing Business” indicators (190 countries), 2018 54
Figure 6: Figure 6: Energy intensity - TPES/GDP, 2006–2015, toe per thousand 2010 USD PPP 55
Figure 7: Comparison of energy intensity and TFC per capita in Western Balkans and OECD countries in 2015 56
Figure 8: Total primary energy supply (TPES), 2007–2016, ktoe 61
Figure 9: Total final consumption (TFC), 2005–2014, %. 61
Figure 10: Total final consumption by sector, 2007–2016, ktoe 62
Figure 11: Electricity generation, imports and exports, 2007–2016, ktoe 63
Figure 12: Electricity consumption by sector, 2007–2016, ktoe 64
Figure 13: Consumption of coal, 2007–2016, ktoe 65
Figure 14: Consumption of oil products, 2007–2016, ktoe 66
Figure 15: Consumption of oil products by sector in 2016, % 66
Figure 16: Montenegro’s electricity market structure 72
Figure 17: Structure of electricity tariffs in 2016, €c/kWh 78
Figure 18: Electricity tariffs for the period 2007-2016, without VAT, €c/kWh 79
Figure 19: Dynamics of electricity losses in 2007-2017, % to input 83
Figure 20: Electricity prices for household consumers with tax and VAT, first half 2017, €/kWh 87
Figure 21: Structure of retail fuel prices in May 2018, €/litre 88
Figure 22: Organisation of the Ministry of Economy with details on departments responsible for energy policy 104
Figure 23: Energy sector projects supported by donor organisations from 2008–2018 127
Figure 24: Estimates of the energy-saving potential for Montenegro in 2020 and 2030 (ktoe) for the scenario “with EE policy measures” and distribution of the total energy saving potential by sector in 2030, % 131
Figure 25: Comparison of energy savings estimated by the strategy and EEAP 2016-2018 and the 2018 indicative energy saving target, ktoe 132
Figure 26: The multiple benefits of energy efficiency improvements 134
Figure 27: Distribution of estimated investments in the power sector for the period 2016–2020, million € 138
Figure 28: Dynamics of distribution electricity losses, 2007–2017, % of input 143
Figure 29: Electricity losses in transmission and distribution networks in 2014, % of output 144
Figure 30: Share of vulnerable consumers (on the left) and total amount of subsidies (on the right) by size of electricity bill, June 2017, % 147
Figure 31: Overview of the final energy consumption of key industries, ktoe 152
Figure 32: Final energy consumption by industry sub-sector in 2016, ktoe 153
Figure 33: Total final energy consumption by residential consumers, 2007–2016, ktoe 162

9
Table of Contents
Figure 34: Energy consumption of the services sector by subsector, 2014, % 163
Figure 35: Comparison of energy savings in residential and services sectors estimated by the Strategy and EEAP 2016-2018, ktoe 167
Figure 36: Energy consumption of the transport sector by mode (left) and by fuel type (right) in 2016, % 175
Figure 37: Energy consumption of the transport sector by fuel type, 2007-2016, ktoe 176
Figure 38: Fuel prices during January 2007 – May 2018, €/litre 176

10
In-Depth Review of the Energy Efficiency Policy of Montenegro | 2018
List of Tables
Annexes
Annex 1: Electricity retail tariffs, by component charges and by consumer category in 2018 190
Annex 2: List of the bylaws of the Law on Efficient Use of Energy 196
Annex 3: List of the bylaws of the Law on Energy related to implementation of RES policy 199
Annex 4: Energy sector projects supported by donor organisations from 2008–2018 200
Annex 5: Programme of the Peer Review Mission to Montenegro 219
Table 1: Montenegro FDI flows 2011-2016 53
Table 2: Major changes of the Montenegrin electricity tariff design, 2007-2018 80
Table 3: Components of the electricity retail tariff applied to consumer categories, 2018 81
Table 4: Calculation of efficiency factors for system operators in 2016-2019 82
Table 5: Comparison of allowed CEDIS (DSO) technical and actual losses during 2016-2018 84
Table 6: Amount of annual subsidies for consumed electricity allocated to socially vulnerable consumers 86
Table 7: Main priorities of the Montenegrin Energy Policy until 2030 92
Table 8: Overview of the regulatory framework for energy efficiency in buildings in Montenegro as of June 2018 96
Table 9: Obligation of public entities according to the Law on Efficient Use of Energy 97
Table 10: Targeted projects for energy efficiency improvement in public buildings 98
Table 11: Energy efficiency projects intended to residential sector in Montenegro 101
Table 12: Overview of the energy efficiency improvement measures from the 3rd EEAP 103
Table 13: Contribution of RES in final energy consumption by 2020 (2009 base year), ktoe 111
Table 14: Calculation of the feed-in tariffs, as of 01.03.2017 113
Table 15: Small HPPs put into operation from 2014–2018 114
Table 16: Forecast of emissions of CO2 caused by combustion of fossil fuels, Gg CO2 122
Table 17: Planned supply-side energy efficiency improvement project/programmes of the action plan 2016-2020 139
Table 18: Potential savings from the production of aluminium 154
Table 19: Comparison of similar size aluminium production companies in Montenegro and Romania 155
Table 20: Household building stock in Montenegro 162
Table 21: Energy consumption of energy-related products in households in Montenegro 170
Table 22: Potential energy savings in 2030 (per year), ktoe, est. 171
Table 23: EE improvement measures for the transport sector of Montenegro, 2016 177
Table 24: Annual taxes for the transport sector of Montenegro 180

Acronyms

12
In-Depth Review of the Energy Efficiency Policy of Montenegro | 2018
Acronyms
ALRO Romanian Aluminium Production Company (ALRO SA)
ANRE Romanian Energy Regulatory Authority
AP Action Plan
B&H Bosnia and Herzegovina
BAU Business-as-Usual
CEDIS Crnogorski elektrodistributivni system, DSO
CEFTA Central European Free Trade Agreement
CGES Crnogorski elektroprenosni system, TSO
CHP Cogeneration/combined heat and power
CLRTAP Convention on Long-range Trans-boundary Air Pollution
CO2 Carbon dioxide
COTEE Crnogorski operator tržišta električne energije, Electricity market operator
DEE Directorate for Energy Efficiency (Ministry of Economy)
DSM Demand side management
DSO Distribution system operator
EBRD European Bank for Reconstruction and Development
EC European Commission
EDS Energy Development Strategy
EE Energy Efficiency
EEAP Energy Efficiency Action Plan
EEO Energy Efficiency Obligation
EEPPB Energy Efficiency Program in Public Buildings
EIA Environmental Impact Assessment
EIB European Investment Bank
EnC Energy Community
EnCT Energy Community Treaty
ENTSOG European Network of Transmission System Operators for Gas
EPBD Energy Performance Building Directive
EPC Energy Performance Contract
EPCG Elektrorprivreda Crne Gore, electricity supply and generation company
REGAGEN Energy Regulatory Agency of Montenegro
ESCO Energy Service Company
ETS Emissions Trading System
EU European Union
FDI Foreign Direct Investment
FEC Final energy consumption
FYROM Former Yugoslav Republic of Macedonia

13
Acronyms
GDP Gross Domestic Product
GHG Greenhouse Gas
GIZ German Society for International Cooperation
GoM Government of Montenegro
HPP Hydropower plant
HVAC Heating, ventilation, and air conditioning
HVDC High-voltage direct current
IAP Ionian-Adriatic Pipeline
IBRD International Bank for Reconstruction and Development
IEA International Energy Agency
IMELS Italian Ministry for Environment, Land and Sea
INDC Intended Nationally Determined Contribution
IPA II Instrument for Pre-Accession Assistance
IPCC Intergovernmental Panel on Climate Change
ISO International Organisation for Standardization
JSC Joint-stock company
KAP Kombinat Aluminijuma Podgorica AD, Aluminium Plant Podgorica
KfW German Development Bank
kV Kilovolts
kVArh Kilovolt amperes reactive hours
KWh Kilowatt-hour
LPG Liquefied petroleum gas
MEPR Minimum Energy Performance Requirements
MoE Ministry of Economy
MONSTAT Statistical Office of Montenegro
MoSDT Ministry of Sustainable Development and Tourism
MRVA Monitoring, reporting, verification and accreditation
Mtoe Million Tonnes of Oil Equivalent
MW Megawatts
MWe Megawatt electrical
NDC National Dispatching Centre
NGO Non-governmental Organisation
NO2 Nitrogen dioxide
NREAP National Renewable Energy Action Plan to 2020
NZEB Nearly Zero Energy Buildings
OECD Organisation for Economic Co-operation and Development
PM Particulate matter
PPP Purchasing power parity

14
In-Depth Review of the Energy Efficiency Policy of Montenegro | 2018
PPP Public–Private Partnership
PV Photovoltaics
REEP Regional Energy Efficiency Program (in Western Balkans)
RES Renewable energy sources
RIPAP Regional Implementation of Paris Agreement Project
SCADA Supervisory Control and Data Acquisition
SEA Strategic Environmental Assessment
SEECAO Coordinated Auction Office in South East Europe
SFR Socialist Federal Republic
SMEs Small and medium-sized enterprises
SO2 Sulphur dioxide
TALCO Tajik Aluminium Company
TA Technical assistance
TAP Trans Adriatic Pipeline
TFC Total final consumption
toe Tonne of oil equivalent
TPES Total primary energy supply
TPP Thermal power plant
TSO Transmission system operator
U4E United for Efficiency
UK United Kingdom
UNDP United Nations Development Programme
UNEP United Nations Environment Programme
UNFCCC United Nations Framework Convention on Climate Change
USD United States dollar
VAT Value added tax
VOCs Volatile organic compounds
WB World Bank
WB GEFF Western Balkans Residential Green Economy Financing Facility
WHO World Health Organisation

Executive Summary

16
In-Depth Review of the Energy Efficiency Policy of Montenegro | 2018
Executive Summary
BackgroundMontenegro is one of the smallest and youngest countries in Europe, having restored its independence in 2006 following a national referendum. Montenegro has a parliamentary democratic system. The country has a total area of 13,812 km2 and 293 km of coastline and shares land borders with Albania, Croatia, Bosnia and Herzegovina, Serbia and Kosovo. The country’s population, at just over 600,000, is split approximately two-thirds to one-third in urban and rural areas, respectively. The country has an extremely varied topography and geomorphology. The climate is distinctively Mediterranean in the south and more continental in the north.
Montenegro is an upper-middle-income country with a Gross Domestic Product (GDP) per capita at purchasing power parity (PPP, current international USD) of 17,665, which is 44% of the EU28 average. Montenegro has a small open economy without its own currency, using the euro despite not being a member of the EU. Foreign Direct Investment (FDI) inflows typically account for around 10% of the country’s GDP. The structure of the Montenegrin economy has undergone some significant changes in recent years, particularly due to a substantial structural shift from industry to services and tourism, which has contributed to high unemployment that currently stands at around 22% of the working population.
Montenegro is committed to joining the EU and is implementing economic reforms and harmonising its policies with the EU acquis communautaire. This includes pursuing economic policy aligned with the market economy model and reducing the role of the state. Recent assessment by the European Commission identified progress but raised concerns regarding the rapidly rising public debt, high fiscal deficits, high external imbalances and high unemployment. Large-scale public infrastructure investments and several expensive new social expenditure programmes challenge fiscal sustainability. Regarding energy, Montenegro’s accession process is facilitated through its membership of the Energy Community.
The energy intensity of Montenegro’s economy decreased by 29%, from 0.16 to 0.11 tonne of oil equivalent (toe) per thousand USD PPP from 2006 to 2015 but is still high compared to OECD countries in Europe. The Energy Development Strategy (to 2030) of Montenegro estimates indicative investment needs at the level of €4.19 billion, of which €3.08 billion is planned to be delivered before 2021 and with a considerable share allocated to renewable energy sources (RES) and energy efficiency. Investment conditions in the country are slowly improving according to global indicators on ease of doing business, competitiveness and transparency. According to 2018 Ease of Doing Business ranking, the complicated and time-consuming procedures to get an electricity connection and high connection costs in comparison to income per capita are currently key obstacles for improving the overall business climate of the country. The DSO is aware of the low position of the country on “Ease of Getting Electricity” indicator and takes necessary steps to decrease in the number of procedures related to the connection to the grid.
Energy Supply and DemandMontenegro is not an oil or gas producer, has no access to gas and imports all oil products. The country has reserves of coal, with three coal basins located in the Pljevlja region, for which the total balance reserve was estimated to be 188.4 million tons in 2014. Nearly all coal mined in Montenegro is used for generation of electricity by TPP Pljevlja. Hydro is the dominant source

17
Executive Summary
of electricity production, followed by coal and, recently added, wind, with power generation capacities as follows: HPP Perucica of 307 MW and HPP Piva of 342 MW; 19 small HPPs of total 32 MW; coal-based TPP Pljevlja of 218.5 MW; and Krnovo wind plant of 72 MW.
The TPES of the country has decreased by 13% during the last decade and has fluctuated around the level of about 1 Mtoe since 2013. A considerable amount of the fluctuation in the structure of TPES is explained by the varying availability of water for hydroelectricity production, fluctuations in energy demand (particularly due to the fluctuations and decline in industrial production) and downtime of the coal thermal power plants (TPP) for refurbishment in 2009 and general maintenance. TPP Pljevlja will need to be modernised in order to meet EU environmental standards, and the Government of Montenegro is considering replacing it with the construction of a second plant, Pljevlja TPP II, from the end of its lifetime. Montenegro has largely been a net importer of electricity over the last decade.
The TFC of the country decreased by 19% to 740 ktoe in 2016, relative to 2007, while the total electricity demand of the country reduced by 32% during this time. This is largely due to structural change in the Montenegrin economy with the significant decline of industrial production over this time and the more recent rise of tourism and services. The structure of TFC by fuel has remained relatively stable over the last decade, with a slight and gradual shift from electricity to biofuels. As of 2016, the residential sector accounted for 46% of electricity demand, whereas services and industry accounted for 27% and 25%, respectively.
All oil products are imported, and diesel is the dominant oil product, with a 65% share, almost exclusively used for transport, while gasoline accounts for just under 12%. The consumption of oil products, mainly mazut, decreased by 19% over the last decade, with most of this reduction occurring between 2008 and 2009 due to the declining industrial production of aluminium oxide. In recent years, the consumption of oil products, particularly diesel, has been rising due to increasing demand from the transport sector, which was consuming 71% of all oil products in 2016.
While Montenegro currently has no access to natural gas, the Ionian-Adriatic Pipeline (IAP) and the Trans Adriatic Pipeline (TAP) infrastructure developments could provide both a stable natural gas supply to Montenegro and cause Montenegro to become a transit country for the supply of gas to the Western Balkans and other neighbouring countries. The Government of Montenegro has already implemented some preparatory activities to support the projects.
District heating (DH) in Montenegro is limited, although an EU-supported study reveals economically viable potential for the development of DH and biomass-based CHP. Buildings in the residential sector are heated/cooled by individual systems such as air conditioners, boilers and stoves, sized for the individual apartment or house. Buildings in the services sector are typically equipped with central heating systems running on light fuel oil, electricity, coal or biomass.
Market Structure for Electricity, Natural Gas and HeatThere exists no natural gas or heat markets in Montenegro as the country does not have access to natural gas, and only micro district heating systems are available in the country.
As part of the accession process to the EU, Montenegro is taking steps towards joining the EU’s single and integrated energy market. Progress has been made in transposing and implementing EU law for the electricity market, in accordance with Montenegro’s commitments under the Energy Community Treaty. The electricity market structure was vertically integrated until

18
In-Depth Review of the Energy Efficiency Policy of Montenegro | 2018
2009, and the electricity distribution and transmission networks were legally unbundled from electricity generation and supply in 2009 and 2016, respectively.
EPCG is the dominant electricity generation company in Montenegro, responsible for the operation of the three large state-owned generating plants – two hydropower plants (627 MW) and one thermal power plant (218 MW) – as well as 5 small HPPs (2.45 MW). The Government’s efforts to expand the country’s electricity generation capacity have attained mixed results, with success in attracting investment small hydro and wind and setbacks for new large hydro and thermal plants.
The electricity market is gradually being opened for different consumers, and since January 2015, all consumers can chose their supplier. The Energy Regulatory Agency (REGAGEN) has issued five licences for suppliers to operate in the electricity market, but still, households and small consumers continue to be supplied by EPCG.
Montenegro’s electricity transmission network, consisting of 1,300 km of overhead lines and 24 substations, has a radial structure on three voltage levels: 400 kV, 220 kV and 110 kV. CGES, the sole TSO, is responsible for maintaining and operating the transmission network, while the operation of Montenegro’s power system is managed by the National Dispatching Centre (NDC). CGES supports significant electricity trade with neighbouring power systems (B&H, Serbia, Albania and Kosovo). Further market integration will be enhanced with the construction of an HVDC cable from Italy to Montenegro with a capacity of 600 MW, scheduled to be completed in 2019. Additional network reinforcements and interconnections will be necessary before the capacity of the undersea cable can be fully utilised. Allocation of cross-border transmission capacities between the TSOs of Montenegro and other Balkan countries (except Serbia), Greece and Turkey is facilitated by SEECAO, based in Podgorica and established in 2014. As of 2017, SEECAO had more than 100 registered auction participants.
Montenegro has one DSO, CEDIS, which operates the network at 35 kV, 10 kV and 0.4 kV voltage levels. In recent years, the electricity distribution system has struggled to meet increasing customer demand resulting from intense construction of buildings and infrastructure, especially in Podgorica and the coastal region of Montenegro. Connecting additional small HPPs (with an installed capacity above 1 MW) in the Northern region of Montenegro is also a challenge due to network capacity constraints.
Energy-Pricing Policy The Montenegrin energy price policy underwent major reforms over the last decade, including the establishment of the regulator, abolishment of cross-subsidies, introduction of explicit price components and the opening of the electricity market for all consumers.
According to the Law on Energy, the Energy Regulatory Agency (REGAGEN) is an independent regulatory body responsible for regulating energy sectors. 2016 was the last year when the retail price of electricity supplied by EPCG was regulated, because, according to the previous Law on Energy, the EPCG, as the incumbent supply company, had the status of the Public Supplier. Until the establishment of a liquid electricity market, the Law on Energy envisages transitional provisions related to capping the growth of electricity price for households and small consumers supplied by the EPCG.
The determination of allowed revenues and prices for TSO and DSO is based on a hybrid regulatory method (which combines the revenue cap and price cap methods) approved by the regulator in July 2016. Both methodologies include the efficiency factor (X) aiming to

19
Executive Summary
incentivise the reduction of operational costs and application of new technologies. According to the calculated X factors, from 2017–2019, the TSO is obliged to reduce its operational costs by 1.81% and DSO by 1.67% per year.
In 2010, network charges were divided into the following tariff components: TSO charges, TSO losses, DSO charges and DSO losses, where the latter included actual DSO losses (including commercial losses). Following the decision of the Constitutional Court, REGAGEN introduced a ‘technical losses only’ approach, and consequently decreased the DSO losses component in April 2011. This approach represents a clear incentive to reduce losses and resulted in the additional costs for the DSO from €12 million in 2012 to €7.5 million in 2017, or more than €70 million in total from 2011 to 2017. In 2011, REGAGEN also introduced incentives to invest in the measures targeting the reduction of losses. However, there is no publically available information about the additional revenue that the DSO received as a result of this regulatory incentive during the period of 2011–2017. In 2017, the first year after the unbundling from EPCG, CEDIS operated with profit.
Vulnerable consumers receive subsidies in the form of 40% subsidy for electricity bills up to 60 €/month or €24 for electricity bills over €60. During the period of 2011–2016, the number of consumers eligible to receive subsidies increased by almost 50%, and the total amount of subsidies awarded increased by almost 70%. In 2016, €3.31 million was paid to vulnerable consumers living in 20,318 households, representing 7.6% of all households. In total, the Government of Montenegro spent approximately €15 million on energy subsidies in 2011–2016.
As of June 2018, electricity tariffs include 21% of VAT and an RES fee of 0.47 €c/kWh. Fuel taxes represent from 54% to 72% of the retail fuel prices, including VAT (21%), port tax (app. 0.0009 €/litre) and excise (from 0.17 to 0.549 €/litre depending on the fuel type).
Energy and Energy Efficiency PolicyThe Ministry of Economy is responsible for Montenegro’s energy policy, which is based on the principles underpinning EU energy policy and transposition of the EU acquis communautaire as set out in the Energy Community Treaty. Montenegro’s energy policy also takes account of its status as a contracting party to the UNFCCC and the Kyoto Protocol and as a signatory of the Paris Agreement. The Energy Policy of Montenegro until 2030 (adopted in March 2011) sets out 20 key strategic objectives based on three priority areas: security in the energy supply; development of the competitive energy market; and sustainable energy development. The Energy Development Strategy of Montenegro until 2030 (adopted in July 2014) sets out the approach and measures to achieve the objectives of the energy policy.
Montenegro has concrete obligations to transpose key EU laws and regulations relating to energy efficiency into the national legal framework, including:
- Directive 2012/27/EC on Energy Efficiency;
- Directive 2010/31/EC on the Energy Performance of Buildings;
- Directive 2010/30/EU on Energy Labelling of Energy Related Products and accompanying regulations.
In addition to the obligations above, Montenegro also transposes Directive 2009/125/EC, establishing a framework for the setting of ecodesign requirements for energy-related products and accompanying regulations.

20
In-Depth Review of the Energy Efficiency Policy of Montenegro | 2018
The Directorate for Energy Efficiency, under the Ministry of Economy, is responsible for energy efficiency policy through three departments that separately deal with development of the energy efficiency legal framework and implementation of energy efficiency measures. To transpose the aforementioned EU laws, Montenegro has adopted two main national laws regulating energy efficiency:
- Law on Energy (adopted in January 2016) – focused on efficiency in energy supply;
- Law on Efficient Use of Energy (adopted in December 2014) – focused on final consumption.
The Energy Development Strategy until 2030 defines long-term targets for the utilisation of renewable energy, but not for energy efficiency improvements. Instead, there exists only a short-term indicative energy saving target until 2018, representing 9% savings of the final energy consumption compared with the final average energy consumption from 2002–2006. Adoption of Energy Efficiency Action Plans (EEAPs) is one of the requirements of Directive 2012/27/EU, and Montenegro is now implementing its third Energy Efficiency Action Plan for 2016–2018, adopted in June 2016, which covers all end-use sectors, energy entities and horizontal measures.
Renewable Energy Policy Development of renewable energy is one of the key priorities of the Energy Development Policy and the Energy Development Strategy of Montenegro until 2030. The Law on Energy complies with EU Directive 2009/28/EC and recognises obligations to adopt a National Renewable Energy Action Plan (NREAP) and the determination of the national RES targets.
For Montenegro, the national RES target was determined at a level of a 33% share of energy produced from RES in the gross final energy consumption by 2020 by the Decision of the Ministerial Council of the Energy Community. The NREAP, adopted in 2014, provides detailed forecasts with the aim of reaching the RES target. According to the Government of Montenegro, the country achieved a 31.7% of share of RES in final energy consumption in 2016. However, the Eurostat data indicates that Montenegro already surpassed the 33% target and reached the level of 41.5% in 2016. The identified difference is related to different methodologies applied to the calculation of the contribution of biomass to the RES target.
The legislative framework envisages the following support schemes for RES:
- Guaranteed purchase of electricity using ‘feed-in-tariffs (FIT)’ from privileged producers for a period of 12 years;
- Priority in delivery of electricity generated into transmission or distribution systems;
- Exemption from any payment related to imbalances, network charges and electricity losses for SHPPs connected to the distribution system.
Twelve small HPPs, with total installed capacity of 24.1 MW, and the Krnovo windfarm, with installed capacity of 72 MW, were put into operation during 2014–2018. Apart from completed projects, there are also a number of ongoing projects, including the Možura windfarm, with installed capacity of 46 MW and a solar power plant in the Briska Gora Locality, with installed capacity of 250 MW. As for the latter, the project is being implemented without any support from the Government of Montenegro in the form of the FITs. Despite the progress in promoting solar power plants, the use of solar thermal systems is not well developed, as there exist no state incentives for the utilisation of these systems in Montenegro.

21
Executive Summary
Environmental and Climate Change Policies Related to EnergyThe responsible authority for environmental policy and climate mitigation in Montenegro is the Ministry of Sustainable Development and Tourism (MoSDT), whereas the implementation and enforcement of these affairs is supported by the Environment Protection Agency and Administration for Inspection Affairs.
Montenegro continues harmonising its strategic and legal frameworks with relevant international commitments and requirements of the EU framework. In 2016, the Government adopted a National Strategy with Action Plan for the transposition, implementation and enforcement of the EU acquis on Environment and Climate Change for 2016–2020 in order to achieve gradual and complete transposition of the EU acquis.
Montenegro is a party to the UNFCCC (and to the Kyoto Protocol until the moment it is repealed) and is obligated to fulfil obligations arising from these international treaties. With its “Intended Nationally Determined Contribution” (INDC) document submitted to UNFCCC, Montenegro committed to an ambitious target of reducing GHG emissions by 30% by 2030 compared to the 1990 base year. In October 2017, the Montenegrin Parliament ratified the Paris Agreement and, by this, confirmed Montenegro’s intention to become part of joint efforts to reduce global carbon emissions.
The emission level of greenhouse gases for Montenegro from sectors covered by INDC was 5239 Gg in 1990, and Montenegro pledges to reduce it at least by 1572 Gg, to the level below or at 3667 Gg, by 2030. The national strategy in the field of climate change until 2030 gives strategic guidelines for achieving the objective within the INDC. At the same time, the Energy Development Strategy (EDS) of Montenegro until 2030 forecasts a significant increase in CO2 due to the start-up of new thermal power plants and the growth in final energy consumption, especially in the transport and industry sectors. The CO2 emission forecast of the EDS is significantly higher than the country’s international commitments to limit greenhouse gas emissions by 2030, and therefore the Energy Development Strategy of Montenegro until 2030 needs to be updated accordingly.
Finance and International Assistance The EU is the largest provider of financial assistance to Montenegro, and this support is closely connected with the country’s accession to the EU. For the period of 2007–2020, Montenegro has been provisionally allocated €506.2 million in EU funds. To date, the country has also benefited from European Investment Bank loans of €621 million. An additional €81 million has been provided through Western Balkans Investment Framework grants, leveraging investments of €732 million.
For the period of 2014–2020, the EU is providing €270.5m (excluding the allocation for cross-border cooperation) through its Instrument for Pre-Accession Assistance (IPA II), including €37.5 million for environment and climate action and €32.1 million for transport, of which 80% is climate-change relevant. The €37.5 million in funds allocated to environment and climate action includes activities that will enable the establishment and functioning of an ‘Eco Fund’. The fund, which is to operate on the ‘polluter pays’ principle, would use financial mechanisms such as soft loans, guarantees and grants (non-repayable subsidies) to support environmental investments.
From 2008–2018, the country has benefited from 50 projects (completed and ongoing) funded by donor organisations, with a total value of €405.7 million, including €348.3 million of loan

22
In-Depth Review of the Energy Efficiency Policy of Montenegro | 2018
and credit lines, €40.5 million of grants and €16.9 million of technical assistance (TA) projects. The majority of the loans and credit lines have been provided by EBRD and KfW, mainly to support the interconnectivity, modernisation and development of the energy sector. The KfW has also provided €39 million out of €40.5 million in total grants for the implementation of energy projects. As for TA projects, the largest donors from 2008–2018 have been the German Federal Ministry for Economic Cooperation and Development, the EBRD and the EU.

Recommendations

24
In-Depth Review of the Energy Efficiency Policy of Montenegro | 2018
Recommendations
General Recommendations
1. Update the Energy Development Strategy until 2030 to include outcome-oriented, long-term targets and objectives for energy efficiency and demand-side management.
2. Establish a new short-term energy efficiency target as soon as possible. Ensure coordination and coherence between the Energy Development Strategy until 2030 and the EEAPs with regards to estimates of potential energy savings and targeted end-use sectors.
3. Prioritise full transposition and implementation of the framework Energy Efficiency Directive 2012/27/EU and other energy efficiency acquis. Beyond achieving minimum requirements, identify and implement actions (greater ambition and/or additional/complementary measures) that can yield the highest net benefits, particularly job creation and new opportunities for small and medium enterprises (SMEs).
4. Take action to improve implementation of energy efficiency policies and measures, such as:
• Improving institutional arrangements and establishment and protection of stable revenue streams. It may be advantageous to separate the policy development, policy implementation and policy evaluation functions of the Directorate for Energy Efficiency, which is more likely to be successfully achieved by placing responsibility for implementation and evaluation with separate, new or existing entities independent of the Directorate, ideally with legal basis;1
• Ensure effective feedback loops by improving coordination between the development, implementation and the evaluation of energy efficiency policy, energy sector strategy development and energy system planning. Disseminate monitoring and evaluation results widely, including via the Internet;
• The funds for the implementation of energy efficiency policies, programmes and measures need to be separated from the general budget of the Directorate and ideally should be based on stable revenue streams (e.g. public benefit charge on electricity rates, taxes). Establishment of the Eco-Fund may provide the opportunity to achieve this, so long as management of its funds is transparent, and funds for energy efficiency are clearly earmarked and tracked.
5. Explore ways to strengthen the coordination of policy development relevant to energy efficiency, whether being led by the Directorate of Energy Efficiency or otherwise. Ensure effective engagement and coordination of relevant directorates and ministries in order to develop more coherent and impactful policy (e.g. develop and adopt joint strategies, programmes, measures):
1 A number of options are possible, each with pros and cons. For more information see: IEA Energy Efficiency Governance handbook 2010 http://www.iea.org/publications/freepublications/publication/gov_handbook.pdf (accessed June 2018)

25
Recommendations
• Develop and adopt principles that pursue the least cost energy system development by employing energy efficiency and demand side management when more cost-effective than supply-side options. In energy system planning, ensure all energy resources, including energy savings gathered through efficiency measures, are properly assessed to meet existing and future energy demand. Appoint an employee of the Directorate of Energy Efficiency who should be held accountable for these principles and embed this in legislative framework;
• Ensure transparency of decision-making related to the strategic planning and public finance support of Montenegro’s energy system, including studies and modelling used to support decisions. Engage regional and national technical/academic resources in the strategic planning process.
6. Improve the general investment conditions of the country in accordance with the EU acquis:
• Ensure Public-Private Partnership regulatory framework is in place and implemented;
• Use competitive tenders and auctions for energy efficiency services in order to develop the ESCO industry.
Recommendations: Power Sector
7. Prioritise the measures targeting the reduction of distribution electricity losses to the allowed level. The DSO and CEDIS should be provided with additional incentives and support to efficiently fight commercial losses. The reduction of the distribution losses to the allowed level can additionally contribute to the country’s economy with more than €18 million revenue per year. Thus, the costs needed to speed up the reduction of the losses should be evaluated against the benefits for the economy. According to Articles 7(2) and 7(3) of the Energy Efficiency Directive, the reduction of losses in the distribution network can be also used for a reduction of up to 25% of the amount of energy savings calculated according to the Energy Efficiency Obligation (EEO) scheme.
8. Conduct further reforms supporting the competition in the electricity supply market. The expected further integration of Montenegro’s wholesale electricity market into wider regional markets will put downward pressure on the wholesale electricity price, but the benefits will likely not pass through to Montenegrin electricity consumers if they only have access to one supplier. The price reductions that come with more competitive markets are a crucial counter-weight, in terms of achieving public acceptance, to new charges that may need to be added to consumer bills to support interventions such as energy efficiency programmes (even if they provide net benefits).
9. Prioritise the development of the TSO and DSO study on the potential application of EE measures at the demand side. Based on the results of the study, introduce amendments to the TSO and DSO tariff methodologies in order to use the least expensive approach to the network development. Both the TSO and DSO can be required to pursue a least-cost approach to network/system development and

26
In-Depth Review of the Energy Efficiency Policy of Montenegro | 2018
investment by properly assessing and exploiting EE and DSM solutions. The regulator should be more proactive in mobilising DSM by imposing obligations on the TSO and DSO. The TSO and DSO can be also mandated to deliver energy savings as a part of the EEO scheme, as they have overall access to the information on network congestion and the need for location of demand reduction.
10. Network operators can be required to encourage demand side participation in ancillary service auctions by improving procedures and communications. The TSO should ensure that adequate information concerning the timetable of expected auctions for ancillary services, rules for participation, minimum technical requirements (including aggregation), application forms and pro forma of contracts are clearly advertised on their websites.
11. The regulator should review electricity tariff design, taking into account available studies in order to align with Article 15 of the EED. Customers’ tariffs should encourage efficient consumption of energy and response to actual power system needs.
12. Review the scheme for providing subsidies for vulnerable consumers in order to ensure much greater targeting of subsidies to those in real need. Ensure that the design of the subsidy mechanism encourages energy efficient behaviour, for example, by weighting support more heavily on the first units of electricity consumption, declining as consumption increases. Drawing from EU best practices and EPOV, use the subsidy mechanism as a means to gather necessary information that can be used to design and deliver effectively targeted energy efficiency measures for vulnerable households. Decide which authority or market actor will be responsible for overseeing and delivering the initiative. Energy suppliers can be also mandated to deliver energy efficiency measures for vulnerable consumers as a part of the EEO scheme.
Recommendations: Industry
13. Appoint a responsible authority for the implementation of the energy audit system, training/certification of experts and monitoring of the implementation of the audit system in the country. The responsible authority should also facilitate and promote the implementation of the measures identified in energy audit reports.
14. Include industry in the calculation of EE targets for future periods, i.e. 2019–2030, and in the future Energy Development Strategy and EE Action Plans.
15. Transpose the requirements of the EE Directive related to the introduction of mandatory energy audits of large enterprises, amending the Law on Efficient Use of Energy accordingly. Introduce restrictive measures, including fines for non-compliance with mandatory energy audit requirements, and recycle the revenue from these fines to fund the energy audit system. Adopt international standards for conducting energy audits and for establishing energy/environmental management systems.
16. Establish training and certification schemes for energy auditors for industrial enterprises. Design an energy audit system as a self-funding instrument, where the

27
Recommendations
revenue from conducting trainings and accreditation of energy auditors covers the costs related to its management and quality assurance.
17. Identify actions to facilitate the supply of and access to finance in order to enable industry’s finance and the implementation of EE measures identified in energy audit reports.
18. Develop support programmes to promote energy audits among SMEs, i.e. tax exemption or direct financial incentives to support the implementation of EE measures based on the results of the conducted energy audit, awareness raising campaigns, etc.
19. Increase awareness of ministries’ decision-makers and civil servants, energy sector stakeholders and the public regarding the multiple benefits that EE measures in industry can deliver, i.e. the creation of new jobs, attracting new investments, increasing of exports, etc., using real evidence and case studies.
20. Develop support mechanisms for producing modern EE equipment. The support mechanisms can include new incentive measures, subsidised loans, tax exemptions, etc.; for example, the introduction of tax holidays for the production of high efficiency solar water heating systems in the country.
Recommendations: Buildings
21. Update the Minimum Energy Performance Requirements (MEPR) to include requirements on overall energy performance rather than provisions on separate building elements. Gradually develop more stringent MEPRs to achieve the nearly zero-energy building target according to the requirements of the Energy Performance of Buildings Directive.
22. Enhance the implementation of the MEPR and energy performance certification scheme. Design the Energy Performance Certificates scheme as a self-funding mechanism, where the revenue from issuing Energy Performance Certificates covers all costs related to its management and quality assurance. Design the Energy Performance Certificates software in such a way that the collected information on buildings’ energy performance is automatically available for the Statistical office of Montenegro and for a wider decision-making process.
23. Conduct a study on the potential utilisation of solar thermal systems especially in the regions with high solar radiations and a deficit of the network capacity. Evaluate the potential of solar water systems to contribute to the electricity system development in a more cost-effective way, comparing to supply-side option (see Recommendation 5).
24. Develop a supporting mechanism for the installation of the solar thermal systems in the residential and service sector. Evaluate the costs of running this support scheme against the multiple benefits for the Montenegrin economy (creation of jobs, increase of investments, increase of electricity export, decrease of electricity consumption during peak hours and investments in the network reinforcement, promotion of sustainable tourism, etc). Consider opportunities for the creation

28
In-Depth Review of the Energy Efficiency Policy of Montenegro | 2018
of additional incentives for local producers of solar water heating systems (see Recommendation 20).
25. Introduce incentives for local authorities and the owners of public buildings to reduce energy consumption and implement energy efficiency measures. The local authorities should be allowed to use energy savings for the repayment of investment in EE and, once the debt has been repaid, to keep the energy savings each year.
26. Conduct targeted campaigns to improve the awareness of consumers about their historical energy consumption and promote no-cost or low-cost measures to reduce their energy bills. Ensure that the requirements of the EED on easy access to information about consumers’ historical consumption (up to a three-year period) is fully implemented. Awareness-raising campaigns on no-cost and low-cost measures to reduce energy bills could be based on international best practices and promoted nationwide.
Recommendations: Energy-Using Products
27. Assign direct responsibilities to a relevant governmental authority/department for overall control and implementation of ecodesign requirements. Provide sufficient resources appropriate to the fulfilment of such responsibilities. Continue enhancing the capacity of involved stakeholders on efficient implementation of ecodesign requirements and market surveillance. Strengthen the cooperation and coordination of activities between all involved stakeholders (see Recommendation 4).
28. Prioritise the adoption and implementation of ecodesign requirements as one of the highest-impact EE policy measures to achieve future EE targets.
29. Improve the collection of statistical data on imports and sales of energy-related products. The statistical information should be a basis for the calculation of achieved energy savings as a result of the implementation of ecodesign and labelling regulations.
30. Prioritise the programme and measures promoting the installation of efficient household heating appliances, as they are currently the most important source of air pollution in the country.
31. Provide general support and assistance for facilitating a higher take of highly efficient products and appliances, including the following:
• Continue improving the implementation of efficiency criteria in procurement procedures for energy-related products;
• Facilitate accelerated implementation of ‘low-hanging fruit projects’ (i.e. projects that are easy to implement with a short payback period, such as replacing incandescent lamps with LED lamps in public buildings, installation of automatic control for heating/cooling, etc.);
• Promote use of the ESCO/EPC model for product replacement investments at sufficient scale;

29
Recommendations
• Develop targeted awareness-raising campaigns to enhance awareness of final consumers on the benefits of using more energy efficient appliances.
Recommendations: Transport
32. Assign clear responsibilities to a relevant governmental authority/department for the overall control and implementation of energy efficiency measures in the transport sector. Provide sufficient resources for managing such responsibilities (see Recommendation 4).
33. Promote the use of public transport by improving its comfort, accessibility and affordability. Explore the cost benefits of adding new routes and creating dedicated road space for buses so they can avoid traffic jams, particularly in tourist destinations. Promote sustainable transport, including an obligation on the airport and airline companies to promote public transport travels to/from the airport.
34. Explore options to further restrict or influence vehicle imports to favour vehicles that are more fuel-efficient and have lower emissions, taking advantage of the improving fuel efficiency and emissions performance of the EU market.
35. Continue the policy of setting eco charges and re-introduce the eco charge for petroleum products. The revenue from the eco charges should be a source of revenue for the Eco Fund. Transparency in relation to spending of Eco Funds, particularly vis-a-vis improving the energy efficiency and reducing the environmental impact of the transport sector, will facilitate public acceptance of the eco charge on fuel.
36. Link annual taxes for vehicles to CO2 emissions according to EU best practices. Provide incentives to promote the most efficient cars on the market, including hybrid and electric cars, using mechanisms such as ‘feebates’. The taxes can be a source of revenue for the Eco Fund.
37. Conduct targeted campaigns to promote measures related to behavioural changes, including eco-driving, car-sharing and proper vehicle maintenance.


Kratak sadržaj

32
In-Depth Review of the Energy Efficiency Policy of Montenegro | 2018
Kratak sadržaj
Polazne osnoveCrna Gora je jedna od najmanjih i najmlađih zemalja u Evropi koja je obnovila svoju nezavisnost 2006. godine nakon održanog nacionalnog referenduma. Crna Gora je uređena prema principu parlamentarne demokratije. Teritorija Crne Gore zauzima ukupnu površinu od 13.812 km2, dužina obale je 293 km i graniči se sa Albanijom, Hrvatskom, Bosnom i Hercegovinom, Srbijom i Kosovom. Crna Gora ima nešto više od 600.000 stanovnika, od kojih približno dvije trećine naseljava urbana dok jedna trećina naseljava ruralna područja. Zemlja ima izuzetno raznovrsnu topografiju i geomorfologiju. Klima je izrazito mediteranska na jugu i kontinentalna na sjeveru.
Crna Gora je zemlja sa višim do srednjim prihodom sa bruto domaćim proizvodom (BDP) po glavi stanovnika po paritetu kupovne moći (PPP, tekući međunarodni USD) od 17.665, što je na nivou 44% prosjeka EU-28. Crna Gora prestavlja malu otvorenu ekonomiju bez sopstvene valute, u upotrebi je Euro, uprkos tome što nije članica EU. Prilivi stranih direktnih investicija (FDI) obično čini oko 10% BDP-a zemlje. Struktura crnogorske ekonomije pretrpjela je značajne promjene u posljednjih nekoliko godina, prije svega prelazak sa industrije na sektor usluga i turizam, što je doprinijelo relativno visokoj stopi nezaposlenosti koja trenutno iznosi oko 22% radno sposobnog stanovništva.
Crna Gora je posvećena pridruživanju EU i sprovodi ekonomske reforme i usklađuje svoje politike sa pravnom tekovinom EU. Ovo prije svega podrazumijeva vođenje ekonomske politike u skladu sa modelom tržišne ekonomije i smanjivanje uloge države. Nedavna procjena Evropske komisije je utvrdila da postoji napredak, ali je izražena zabrinutost u pogledu brzog rasta javnog duga, visokog fiskalnog deficita, velikih vanjskih neuravnoteženosti i visoke stope nezaposlenosti. Velike investicije u javnu infrastrukturu i nekoliko skupih novih programa socijalnih troškova predstavljaju izazov za fiskalnu održivost. Kada je riječ o energetici, proces pridruživanja Crne Gore EU je olakšan kroz članstvo u Energetskoj zajednici.
Energetski intenzitet crnogorske ekonomije smanjio se za 29%, odnosno sa 0,16 na 0,11 tona naftnog ekvivalenta (toe) po hiljadu USD PPP od 2006. do 2015. godine, ali je to i dalje visok procenat u poređenju sa zemljama članicama OECD-a u Evropi. Strategijom razvoja energetike Crne Gore do 2030. godine procijenjen je indikativni investicioni trošak od 4,19 milijardi eura, od čega je 3,08 milijardi eura planirani trošak do 2021. godine, uz značajan udio investicija obnovljive izvore energije (OIE) i energetsku efikasnost. Prema globalnim indikatorima vezanim za lakoću poslovanja, konkurentnost i transparentnost (eng. Ease of Doing Business), uslovi za ulaganja u zemlji polako se poboljšavaju. Ovi indikatori za 2018. godinu, ukazuju da trenutno najveću prepreku za unapređenje poslovne klime u zemlji predstavljaju složene i dugotrajne procedure za priključenje na elektroenergetsku mrežu u odnosu na prihod po glavi stanovnika. Operator distributivnog sistema (ODS) je svjestan niske pozicije Crne Gore na rang listi u vezi sa indikatorom “jednostavnost dobijanja električne energije” (eng. “Ease of Getting Electricity”) i preduzima korake za pojednostavljenje procedura vezanih za priključenje na elektroenergetsku mrežu.
Snabdijevanje energijom i potražnjaCrna Gora nije proizvođač nafte ili gasa, nema pristup gasu i uvozi sve naftne derivate. Crna Gora ima rezerve uglja sa tri basena uglja na području Pljevalja sa ukupnim bilansnim rezervama prema procjeni iz 2014. godine od 188,4 miliona tona. U Crnoj Gori skoro sve količine uglja iz

33
Kratak sadržaj
rudnika koriste se za proizvodnju električne energije u TE Pljevlja. Hidroenergija je dominantni izvor za proizvodnju električne energije, uz energiju koja se dobija od uglja, a u skorije vrijeme za proizvodnju električne energije koriste se i kapaciteti vjetroelektrana. Proizvodni kapaciteti su: HE Perućica od 307 MW i HE Piva od 342 MW; 19 malih hidroelektrana od ukupno 32 MW; TE Pljevlja koja koristi ugalj kao energent od 218,5 MW; i vjetroelektrana Krnovo od 72 MW.
Ukupna potrošnja primarne energije u zemlji se smanjila za 13% u posljednjoj deceniji uz varijacije od oko 1 Mtoe od 2013. godine. Značajne oscilacije u strukturi ukupne potrošnje primarne energije rezultat su promjena u količini raspoložive vode za proizvodnju električne energije iz hidroelektrana, oscilacija u pogledu potražnje za energijom (posebno usljed fluktuacija i pada industrijske proizvodnje) i prekida rada termoelektrane na ugalj (TE) zbog izvođenja radova na obnovi i redovnom održavanju u 2009. godini. Termoelektrana Pljevlja će morati da se modernizuje kako bi ispunila ekološke standarde EU, a Vlada Crne Gore razmišlja o izgradnji drugog bloka termoelektrane Pljevlja, odnosno TE Pljevlja II i zamjeni postojeće termoelektrane nakon isteka njenog operativnog ciklusa. Crna Gora je u posljednjoj deceniji većinom bila neto uvoznik električne energije.
Ukupna finalna potrošnja energije (TFC) u zemlji se smanjila za 19% na 740 ktoe u 2016. godini, u odnosu na 2007. godinu, dok je u ovom periodu ukupna potražnja električne energije u Crnoj Gori smanjena za 32%. Ove okolnosti su u velikoj mjeri rezultat strukturnih promjena u crnogorskoj ekonomiji sa značajnim padom industrijske proizvodnje u ovom periodu i skorijim razvojem turizma i sektora usluga. Struktura energenata u ukupnoj finalnoj potrošnji je relativno stabilna u posljednjoj deceniji uz blagi i postepeni prelazak sa električne energije na biogoriva. Od 2016. godine udio stambenog sektora u potražnji električne energije iznosio je 46%, dok su udjeli sektora usluga i industrije činili 27%, odnosno 25%.
Svi naftni derivati se uvoze, a dizel gorivo je dominantan energent sa 65% udjela i gotovo sva količina se isključivo koristi u sektoru transporta, dok je udio benzina nešto ispod 12%. Potrošnja naftnih derivata, uglavnom mazuta, smanjena je za 19% u posljednjoj deceniji, pri čemu je u periodu od 2008. do 2009. godine zabilježen najveći pad potrošnje ovog energenta usljed smanjenja industrijske proizvodnje aluminijske industrije. U posljednjih nekoliko godina potrošnja naftnih derivata, posebno dizel goriva, porasla je zbog povećane potražnje sektora transporta čiji je udio u potrošnji svih naftnih derivata u 2016. godini iznosio 71%.
Iako Crna Gora trenutno nema pristup prirodnom gasu, infrastrukturni razvoj Jonsko-jadranskog gasovoda (IAP) i Trans-jadranskog gasovoda (TAP) mogao bi da obezbijedi stabilno snabdijevanje Crne Gore prirodnim gasom i doprinese da Crna Gora postane tranzitna zemlja za snabdijevanje Zapadnog Balkana i drugih susjednih zemalja gasom. Vlada Crne Gore je već sprovela određene pripremne aktivnosti za podršku ovim projektima.
Daljinsko grijanje u Crnoj Gori je ograničeno, iako studije podržane od strane EU ukazuju na ekonomski održiv potencijal za razvoj daljinskog grijanja i kombinovanu proizvodnju toplote i električne energije (kogeneracija) sa biomasom kao energentom. U stambenom sektoru za grijanje/hlađenje u zgradama koriste se manji sistemi kao što su klima uređaji, kotlovi i peći, namijenjeni za pojedinačne stanove ili kuće. Zgrade u sektoru usluga obično su opremljene sistemima centralnog grijanja na lako lož ulje, električnu energiju, ugalj ili biomasu.
Struktura tržišta električne energije, prirodnog gasa i toplotne energije U Crnoj Gori nema tržišta prirodnog gasa ili toplotne energije budući da zemlja nema pristup prirodnom gasu i postoje jedino mikro sistemi za daljinsko grijanje.

34
In-Depth Review of the Energy Efficiency Policy of Montenegro | 2018
Kao dio procesa pristupanja EU, Crna Gora preduzima korake ka pridruživanju jedinstvenom i integrisanom energetskom tržištu EU. Postignut je napredak u prenošenju i primjeni pravnog okvira EU kojim se reguliše tržište električne energije, u skladu sa obavezama Crne Gore iz Sporazuma o energetskoj zajednici. Struktura tržišta električne energije bila je vertikalno integrisana do 2009. godine, a subjekti odgovorni za prenos i distribuciju električne energije su pravno razdvojeni od proizvodnje i snabdijevanja električnom energijom u 2009. i 2016. godini.
Elektroprivreda Crne Gore je glavni proizvođač električne energije u Crnoj Gori, koji je odgovorna za rad tri velika proizvodna postrojenja - dvije hidroelektrane (627 MW) i jednu termoelektranu (218 MW) - kao i 5 malih hidroelektrana (2.45 MW). Napori Vlade za proširenje kapaciteta za proizvodnju električne energije u zemlji su dali određene rezultate - postignut je uspjeh u privlačenju investicija za proizvodnju energije iz obnovljivih izvora (solarna energija / energija vjetra), ali nije došlo do realizacije većih projekata izgradnje hidro i termoelektrana.
Tržište električne energije je postepeno otvarano za različite kategorije potrošača i od 2015. godine svi potrošači imaju pravo da biraju svog snabdjevača energije. Regulatorna agencija za energetiku izdala pet licenci za snabdjevače na tržištu električne energije, ali potrošače u sektoru domaćinstava i druge male potrošače i dalje snabdijeva EPCG.
Crnogorska elektroprenosna mreža koja se sastoji od 1.300 km nadzemnih vodova i 24 podstanice, ima radijalnu strukturu na tri naponska nivoa: 400 kV, 220 kV i 110 kV. Crnogorski elektroprenosni sistem (CGES), odnosno jedini operator prenosnog sistema (OPS) nadležan je za održavanje i upravljanje prenosnom mrežom, dok je Nacionalni dispečerski centar (NDC) zadužen za operativno upravljanje elektroprenosnim sistemom Crne Gore.
CGES podržava značajnu trgovinu električnom energijom sa susjednim energetskim sistemima (BiH, Srbija, Albanija i Kosovo). Dalja integracija tržišta biće omogućena izgradnjom HVDC kabla između Italije i Crne Gore kapaciteta 600 MW čiji završetak je planiran za 2019. godinu. Da bi se kapacitet podvodnog kabla mogao u potpunosti iskoristiti potrebno je dodatno izgraditi prenosno mrežu i uspostaviti interkonekcije sa zemljama u okruženju. Raspodjela prekograničnih prenosnih kapaciteta između OPS Crne Gore i drugih balkanskih zemalja (osim Srbije), Grčke i Turske omogućen je kroz Aukcijsku kuću za koordinirane aukcije u jugoistočnoj Evropi (eng. Coordinated Auction Office in South East Europe – SEECAO) koji je uspostavljen 2014. godine sa sjedištem u Podgorici. Od 2017. godine SEECAO ima više od 100 registrovanih učesnika na aukcijama.
Crna Gora ima jednog operatora distributivnog sistema (ODS) CEDIS, koji upravlja mrežom na naponskim nivoima od 35 kV, 10 kV i 0,4 kV. Jedan od glavnih izazova za sistem distribucije električne energije, proteklih godina, je bio sve veća potražnja za energijom zbog intenzivne izgradnje zgrada i infrastrukture, posebno u Podgorici i primorskom regionu Crne Gore. Priključenje dodatnih malih hidroelektrana (sa instalisanom snagom većom od 1MW) u sjevernom dijelu Crne Gore takođe predstavlja izazov, zbog ograničenih mrežnih kapaciteta.
Politika utvrđivanja cijena energije Politika utvrđivanja cijena energije u Crnoj Gori pretrpjela je značajne reforme u posljednjoj deceniji, uključujući uspostavljanje regulatornog tijela, ukidanje unakrsnog subvencionisanja, uvođenje eksplicitnih komponenti cijena i otvaranje tržišta električne energije za sve potrošače.
Prema Zakonu o energetici, Regulatorna agencija za energetiku (RAE) je nezavisno regulatorno tijelo sa nadležnostima u oblasti energetskog sektora. Godina 2016. je bila poslednja godina

35
Kratak sadržaj
u kojoj je regulisana maloprodajna cijena električne energije isporučena od strane EPCG, jer je prema prethodnom Zakonu o energetici EPCG kao zvanična kompanija za snabdijevanje električnom energijom imala status javnog snabdjevača. Do uspostavljanja likvidnog tržišta električne energije, Zakon o energetici, kroz prelazne odredbe, predviđa ograničenje rasta maloprodajnih cijena električne energije za domaćinstva i druge male potrošače koje snabdijeva EPCG.
Utvrđivanje dozvoljenih prihoda i cijena za OPS i ODS zasnovano je na hibridnoj regulatornoj metodologiji (koja kombinuje metodologije ograničenja prihoda i ograničenja cijena), a koju je odobrio regulator u julu 2016. godine. Obije metodologije uzimaju u obzir faktor efikasnosti (X) koji ima za cilj podsticanje smanjenja operativnih troškova i primjenu novih tehnologija. Prema izračunatim X faktorima, u periodu 2017-2019. godine, OPS je dužan da smanji svoje operativne troškove za 1,81%, a ODS za 1,67% na godišnjem nivou.
U 2010. godini naknada za korišćenje mreže bila je podeljena na sljedeće tarifne komponente: naknade za korišćenje OPS, gubici u OPS, naknade za korišćenje ODS i gubici u ODS, koji su obuhvatali i stvarne gubitke ODS (uključujući komercijalne gubitke). Nakon odluke Ustavnog suda, RAE je uvela pristup “isključivo tehnički gubici” i smanjila komponentu gubitaka ODS u aprilu 2011. godine. Ovaj pristup predstavlja jasan podsticaj smanjenju gubitaka i rezultirao je dodatnim troškovima za ODS od 12 miliona eura u 2012. godini i 7,5 miliona eura u 2017. godini ili više od 70 miliona eura u ukupnom periodu od 2011. do 2017. godine. Regulatorna agencija je u 2011. godini takođe uvela podsticaje za ulaganja u mjere usmjerene na smanjenje gubitaka. Međutim, nijesu dostupne informacije o dodatnom prihodu ODS koji je rezultat ovog regulatornog podsticaja u period 2011-2017. godina. U 2017. godini, prvoj godini nakon razdvajanja od EPCG, CEDIS je poslovao sa dobitkom.
Ugroženi potrošači mogu ostvariti subvencije u visini od 40% na račune za električnu energiju do 60 eura/mjesečno ili 24 eura za račune za električnu energiju preko 60 eura. Tokom perioda 2011-2016. godina, broj potrošača koji su ostvarili pravo na subvencije porastao je za skoro 50%, a ukupan iznos subvencija je povećan za skoro 70%. U 2016. godini uloženo je 3,31 miliona eura za ugrožene potrošače koji žive u 20318 domaćinstava a što predstavljaju 7,6% ukupnog broja domaćinstava u Crnoj Gori. Vlada Crne Gore potrošila oko 15 miliona eura za subvencije za električnu energiju u periodu 2011-2016. godine.
Od juna 2018. godine tarife električne energije uključuju 21% PDV-a i naknadu za OIE u iznosu od 0,47 € c/kWh. Nameti na cijenu goriva kreću se u opsegu 54%-72% maloprodajne cijene goriva, uključujući PDV (21%), porez na pristanište (oko 0.0009 €/litar) i akcize (od 0,17 do 0,549 €/litar u zavisnosti od vrste goriva).
Energetska politika i politika u oblasti energetske efikasnostiMinistarstvo ekonomije je odgovorno za energetsku politiku Crne Gore koja se zasniva na principima kojim se uvažava energetska politika EU i prenošenje pravne tekovine EU, na način kako je to definisano Sporazumom o energetskoj zajednici. Energetska politika Crne Gore uzima u obzir preuzete obaveze koje Crna Gora ima kao članica Okvirne konvencije Ujedinjenih nacija o klimatskim promjenama (UNFCCC) i Kjoto protokola i kao potpisnica Pariskog sporazuma. Energetska politika Crne Gore do 2030. (usvojena u martu 2011. godine) utvrđuje 20 ključnih strateških opredeljenja zasnovanih na tri glavna prioriteta: sigurnost u snabdijevanju energijom; razvoj konkurentnog tržišta energije; i održiv energetski razvoj. Strategija razvoja energetike Crne Gore do 2030. godine (usvojena u julu 2014. godine) utvrđuje pristup i mjere za postizanje ciljeva energetske politike.

36
In-Depth Review of the Energy Efficiency Policy of Montenegro | 2018
Crna Gora je preuzela obavezu prenošenja ključnih propisa EU u oblasti energetske efikasnosti u nacionalno zakonodavstvo, a koji uključuju:
- Direktivu 2012/27/EC o energetskoj efikasnosti;
- Direktivu 2010/31/EC o energetskim karakteristikama zgrada;
- Direktivu 2010/30/EU o označavanju proizvoda koji utiču na potrošnju energije i pripadajuće implementirajuće regulative.
Pored navedenih obaveza, Crna Gora je takođe preuzela obavezu prenošenja Direktive 2009/125/EC o uspostavljanju okvira za uvođenje zahtjeva eko dizajna za proizvoda koji utiču na potrošnju energije i pratećih implementacionih regulativa.
Direktorat za energetsku efikasnost, u okviru Ministarstva ekonomije, odgovoran je za politiku energetske efikasnosti kroz poslova tri odjeljenja koja se bave razvojem pravnog okvira u oblasti energetske efikasnosti i implementacijom politike/mjera energetske efikasnosti. Prenošenja navedenih propisa EU, Crna Gora je realizovala usvajanjem dva zakona koji regulišu energetsku efikasnost:
- Zakon o energetici (usvojen u januaru 2016. godine) – koji uređuje energetsku efikasnost na strani snabdijevanja energijom;
- Zakon o efikasnom korišćenju energije (usvojen u decembru 2014) - koji uređuje energetsku efikasnost na strani finalne potrošnje.
Strategija razvoja energetike do 2030. godine definiše dugoročne ciljeve za korišćenje obnovljive energije, ali ne i za poboljšanje energetske efikasnosti. Umjesto toga, posebno je utvrđen srednjoročni indikativni cilj uštede energije do 2018. godine, koji predstavlja 9% uštede potrošnje finalne energije u poređenju sa finalnom prosječnom potrošnjom energije u periodu 2002-2006. godina. Usvajanje Akcionih planova za energetsku efikasnost (APEE) jedan je od zahtjeva Direktive 2012/27/EU i Crna Gora trenutno sprovodi treći Akcioni plan energetske efikasnosti za period 2016-2018. godina koji je usvojen u junu 2016. godine i koji obuhvata mjere u svim sektorima finalne potrošnje, mjere kod energetskih subjekata i horizontalne mjere.
Politika u oblasti obnovljivih izvora energije Razvoj obnovljivih izvora energije je jedan od ključnih prioriteta Energetske politike Crne Gore i Strategije razvoja energetike Crne Gore do 2030. godine. Zakon o energetici je usklađen sa Direktivom EU 2009/28/EC i prepoznaje obaveze u vezi sa usvajanjem Nacionalnog akcionog plana za korišćenje energije iz obnovljivih izvora (NAPOIE) i utvrđivanjem nacionalnih ciljeva korišćenja energije iz OIE.
Prema Odluci Ministarskog savjeta Energetske zajednice nacionalni cilj udjela energije iz obnovljivih izvora u ukupnoj bruto finalnoj potrošnji energije do 2020. godine za Crnu Goru iznosi 33%. Nacionalni akcioni plan za korišćenje energije iz OIE, usvojen 2014. godine, daje detaljne prognoze u cilju postizanja cilja OIE. Prema informacijo koju je usvojila Vlada Crne Gore, Crna Gora je ostvarila 31,7% učešća OIE u finalnoj potrošnji energije u 2016. godini. Međutim, podaci Eurostata pokazuju da je Crna Gora već prevazišla cilj od 33% i dostigla nivo od 41,5% u 2016. godini. Utvrđena razlika odnosi se na primjenu različitih metodologija za izračunavanje udjela OIE, a naročito po pitanju doprinosa biomase cilju OIE.

37
Kratak sadržaj
Zakonodavni okvir predviđa sledjeće šeme podrške za OIE:
- Garantovani otkup električne energije po podsticajnoj cijeni od povlašćenih proizvođača tokom 12 godina;
- Prioritet u isporuci proizvedene električne energije prenosnom ili distributivnom sistemu;
- Izuzeće od naplate za: usluge balansiranja, mrežne naknade i gubitke električne energije za mHE koje su povezane na distributivni sistem.
Ukupno 12 malih hidroelektrana sa ukupnim instalisanim kapacitetom od 24,1 MW i vjetroelektrana Krnovo sa instalisanim kapacitetom od 72 MW pušteno je u rad tokom perioda 2014-2018. godina. Osim završenih projekata, postoji i više projekata čija realizacija je u toku, uključujući vjetroelektranu Možura sa instalisanim kapacitetom od 46 MW i solarnu elektranu na lokalitetu Briska Gora sa instalisanom snagom od 250 MW. Projekat izgradnje solarne elektrane na lokalitetu Briska Gora realizuje se bez podrške Vlade Crne Gore u obliku FIT-ova. Uprkos napretku u promovisanju solarnih sistema za proizvodnju električne energije, upotreba solarnih termalnih sistema nije dovoljno razvijena budući da ne postoje državni podsticaji za korišćenje ovih sistema u Crnoj Gori.
Politike zaštite životne sredine i klimatskih promjena u oblasti energetikeNadležna institucija za donošenje politike zaštite životne sredine i ublažavanje klimatskih promjena u Crnoj Gori je Ministarstvo održivog razvoja i turizma (MORT), dok implementaciju i primjenu podržavaju Agencija za zaštitu životne sredine i Uprava za inspekcijske poslove.
Crna Gora nastavlja sa usklađivanjem svog strateškog i zakonodavnog okvira sa relevantnim međunarodnim obavezama i zahtjevima okvira EU. U 2016. godini Vlada je usvojila Nacionalnu strategija za transpoziciju, implementaciju i primjenu pravne tekovine EU u oblasti životne sredine i klimatskih promjena s Akcionim planom za period 2016-2020, kako bi se postigla postepena i potpuna transpozicija pravne tekovine EU.
Crna Gora je ugovorna strana UNFCCC (i Kjoto protokola do njegovog ukidanja) i obavezala se na ispunjavanje obaveza koje proističu iz ovih međunarodnih ugovora. Dokumentom “Namjeravani nacionalno utvrđeni doprinos” (INDC) koji je podnesen UNFCCC-u, Crna Gora se obavezala da ispuni ambiciozan cilj smanjenja emisije gasova sa efektom staklene bašte za 30% do 2030. godine u odnosu na baznu 1990. godinu. U oktobru 2017. godine crnogorski parlament ratifikovao je Pariski sporazum i time je potvrdio namjeru Crne Gore da se pridruži zajedničkim naporima za smanjenje emisija ugljenika u svijetu.
Nivo emisije gasova sa efektom staklene bašte za Crnu Goru iz sektora koji pokriva INDC iznosio je 5.239 Gg u 1990. godini, a Crna Gora se obavezala da će smanjiti ovaj nivo za najmanje 1.572 Gg, odnosno na nivo ispod ili na 3667 Gg do 2030. godine. Nacionalna strategija u oblasti klimatskih promjena do 2030. godine daje strateške smjernice za postizanje cilja u okviru INDC-a. Istovremeno, Strategija razvoja energetike Crne Gore do 2030. godine predviđa značajan porast CO2 usljed puštanja u rad novih termoelektrana i rasta potrošnje finalne energije, posebno u sektoru transporta i industrijskom sektoru. Prognoza emisije CO2 prema Strategiji razvoja energetike je znatno veća i poređenju sa međunarodnim obavezama koje je Crna Gora preuzela u pogledu ograničenja emisije gasova sa efektom staklene bašte do 2030. godine te je u skladu sa tim potrebno ažurirati Strategiju razvoja energetike Crne Gore do 2030. godine.

38
In-Depth Review of the Energy Efficiency Policy of Montenegro | 2018
Finansiranje i međunarodna pomoćEvropska unija je pruža najveću finansijsku pomoć Crnoj Gori i ova podrška je usko povezana sa pristupanjem zemlje EU. Za period 2007-2020. godine Crnoj Gori je privremeno dodijeljeno 506,2 miliona eura u fondovima EU. Do danas, zemlja je takođe koristila kredite Evropske investicione banke u iznosu od 621 milion eura. Dodatnih 81 milion eura obezbijeđeno je kroz grantove Investicionog okvira za Zapadni Balkan (WBIF), za realizaciju investicija od 732 miliona eura.
Za period 2014-2020. godina, EU obezbjeđuje 270,5 miliona eura (bez sredstava za prekograničnu saradnju) kroz svoj Instrument za pretpristupnu pomoć (IPA II), uključujući 37,5 miliona eura za aktivnosti u oblasti životne sredine i klimatskih promjena i 32,1 miliona eura za sektor transporta od kojih se 80% odnosi na klimatske promjene. Sredstva u iznosu od 37,5 miliona eura namenjenih za aktivnosti u oblasti životne sredine i klimatskih promjena obuhvataju aktivnosti koje će omogućiti uspostavljanje i funkcionisanje “Eko fonda”. Ovaj fond, koji treba da funkcioniše po principu zagađivač plaća, koristio bi finansijske mehanizme kao što su krediti, garancije i grantovi (nepovratne subvencije) za podršku investicijama u oblast životne sredine.
Tokom perioda 2008-2018. godina, u Crnoj Gori je realizovano 50 projekata (završenih i tekućih) koje su finansirali donatorske organizacije ukupne vrijednosti 405,7 miliona eura, uključujući 348,3 miliona eura zajmova i kreditnih linija, 40,5 miliona eura grantova i 16,9 miliona eura u tehničkoj pomoći. Većina zajmova i kreditnih linija osigurale se finansijske institucije EU: EBRD i KfW koje uglavnom podržavaju međusobnu povezanost, modernizaciju i razvoj energetskog sektora. Njemačka razvojna banka (KfW) je takođe obezbijedila 39 miliona eura od ukupno 40,5 miliona eura ukupnih grantova za realizaciju energetskih projekata. Što se tiče projekata tehničke pomoći, najznačajniji donatori u periodu 2008-2018. godina bili su Njemačko Savezno ministarstvo za ekonomsku saradnju i razvoj, EBRD i EU.

Preporuke

40
In-Depth Review of the Energy Efficiency Policy of Montenegro | 2018
Preporuke
Opšte preporuke
1. Ažurirati Strategiju razvoja energetike do 2030. godine i uvrstiti dugoročne ciljeve energetske efikasnost i upravljanja potražnjom (Demand Side Management - DSM).
2. Uspostaviti novi srednjoročni cilj energetske efikasnosti u što kraćem roku. Osigurati koordinaciju i koherentnost između Strategije razvoja energetike do 2030. godine i Akcionog plana energetske efikasnosti u pogledu procjene potencijala za energetske uštede i ciljne sektore finalne potrošnje.
3. Dati prioritet potpunoj transpoziciji i implementaciji Direktive o energetskoj efikasnosti 2012/27/EU i ostale pravne tekovine u oblasti energetske efikasnosti. Pored ispunjavanja minimalnih zahtjeva, utvrditi i sprovesti aktivnosti (ambicioznije i/ili dodatne/komplementarne mjere) koje će rezultirati najvećim neto benefitima, posebno po pitanju otvaranja novih radnih mjesta i stvaranja novih mogućnosti za mala i srednja preduzeća (MSP).
4. Preduzeti aktivnosti za poboljšanje sprovođenja politike i mjera energetske efikasnosti, kao što su:
• Unapređenje institucionalnog okvira i uspostavljanje i obezbjeđenje stabilnih tokova prihoda. Razmotriti opravdanost razdvajanja kreiranja politike, sprovođenja politike i evaluacije politike u Direktoratu za energetsku efikasnost, što je vjerovatno moguće uspješno postići ukoliko se odgovornost za sprovođenje politika i odgovornost za evaluaciju dodijeli novim ili postojećim strukturama koje su nezavisne od Direktorata i koje bi imale pravnu osnov za funkcionisanje2;
• Obezbijediti djelotvorno dobijanje povratnih informacija kroz unapređenje koordinacije između kreiranja, sprovođenja i evaluacije politike energetske efikasnosti, strategije razvoja energetike i planiranja energetskog sistema. Promovisati rezultate monitoringa i evaluacije javnosti, i putem interneta;
• Sredstva za sprovođenje politike energetske efikasnosti i odgovarajućih programa i mjera moraju biti odvojena od budžeta Direktorata i u idealnim uslovima ova sredstva treba da budu zasnovana na stabilnim tokovima prihoda, npr. naknada za javnu korist na cijenu električne energije, porezi i dr. Prilika za to može biti uspostavljanje Eko-fonda može pružiti priliku da to postigne, uz uslov da je upravljanje sredstvima ovog fonda transparentno, a sredstva za energetsku efikasnost jasno namijenjena i praćena.
5. Razmotriti načine za jačanje koordinacije razvoja politika koje su relevantne za oblast energetske efikasnosti, bez obzira da li vodeću ulogu ima Direktorat za energetsku efikasnost ili drugo tijelo. Obezbijediti efikasno uključenje i koordinaciju relevantnih direktorata i ministarstava kako bi se razvila koherentnija i djelotvornija politika, npr. priprema i usvajanje zajedničkih strategija, programa, mjera i dr.:
2 Moguće su brojne opcije, od kojih svaka ima određene prednosti i nedostke. Za više informacija pogledati Priručnik IEA za upravljanje potrošnjom energije iz 2010. godini http://www.iea.org/publications/freepublications/publication/gov_handbook.pdf (accessed June 2018)

41
Preporuke
• Razviti i usvojiti principe koji obezbjeđuju razvoju energetskih sistema uz najmanje troškove kroz primjenu mjera energetske efikasnosti i upravljanja na strani potražnje (Demand Side Management - DSM) u slučaju da su isti troškovno efektivniji od opcija na strani ponude/snabdijevanja. U planiranju energetskog sistema, obezbijediti da svi energetski resursi, uključujući uštede energije ostvarene kroz primjenu mjera energetske efikasnosti, budu pravilno procijenjeni kako bi se zadovoljila postojeća i buduća potražnja za energijom. Imenovati zaposlenog u Direktoratu za energetsku efikasnost koji bi bio odgovoran za primjenu navedenih principa i iste uvrstiti u zakonodavni okvir;
• Obezbijediti transparentnost procesa donošenja odluka koje se odnose na strateško planiranje i podršku javnom finansiranju elektroenergetskog sistema Crne Gore, uključujući izrade studija i modela koje podržavaju opravdavaju određene odluke. Uključiti regionalne i nacionalne tehničke/akademske kapacitete i resurse u proces strateškog planiranja.
6. Poboljšati opšte uslove za investicije u skladu sa pravnom tekovinom EU, odnosno:
• Obezbijediti uspostavljanje i primjenu regulatornog okvira za javno-privatno partnerstvo;
• Iskoristiti konkurentske nabavke i aukcije za pružanje usluga u oblasti energetske efikasnosti u cilju razvoja ESCO tržišta.
Preporuke: Elektroenergetski sektor
7. Utvrditi prioritetne mjere usmjerene na smanjenje gubitaka u elektrodistibutivnom sistemu na dozvoljeni nivo. Operatoru elektrodistibutivnog sistema, CEDIS-u potrebno je obezbijediti dodatne podsticaje i podršku za efikasno rješavanje pitanja komercijalnih gubitaka. Smanjenje distributivnih gubitaka na dozvoljeni nivo može dodatno doprinijeti ekonomiji zemlje za više od 18 miliona eura prihoda na godišnjem nivou. Stoga je troškove potrebne za intezivniju realizaciju aktivnosti na smanjenju gubitaka potrebno procijeniti u odnosu na benefite za ekonomiju. Prema članovima 7 (2) i 7 (3) Direktive o energetskoj efikasnosti, smanjenje gubitaka u distributivnoj mreži može se iskoristiti za smanjenje ciljeva za uštede energije u iznosu do 25%, u skladu sa obavezujućim šemama energetske efikasnosti (EEO šeme) za energetske subjekte.
8. Sprovesti dalje reforme koje podržavaju konkurentnost na tržištu snabdijevanja električnom energijom. Očekivana dalja integracija veleprodajnog tržišta električne energije u Crnoj Gori u šira regionalna tržišta uticaće na cijenu električne energije na veleprodajnom tržištu, ali ukoliko postoji samo jedan snabdjevač električnom energijom, potrošači električne energije u Crnoj Gori vjerovatno neće osjetiti benefite ove integracije. Smanjenje cijena koja donose konkurentnija tržišta su presudan faktor da javnost prihvati nove moguće naknade, koje bi bile prikazane na računu za električnu energiju, kako bi se podržale određene intervencije poput programa energetske efikasnosti (čak i ako iste donose benefite).
9. Utvrditi prioritete za izradu studije za operatora prenosnog sistema (OPS) i operatora distributivnog sistema (ODS) o potencijalnoj primjeni mjera EE na strani potražnje.

42
In-Depth Review of the Energy Efficiency Policy of Montenegro | 2018
Na osnovu rezultata studije izvršiti izmjene i dopune tarifnih metodologija OPS-a i ODS-a sa ciljem uvođenja pristupa najmanjih troškova za razvoj mreže. Od operatora prenosnog i distributivnog sistema može se zahtijevati da izaberu pristup najmanjih troškova za razvoj i ulaganje u mrežu/sistem na osnovu odgovarajuće procjene za korišćenje rješenja za unapređenje energetske efikasnosti i upravljanje na strani potražnje (DSM). Regulator treba da bude proaktivan u mobilizaciji DSM-a uvođenjem obaveza OPS-u i ODS-u. Takođe moguće je operatore prenosnog i distributivnog sistema obavezati da obezbijede uštede energije kao dio programa obaveza energetskih subjekata za podsticanje smanjenja potrošnje energije (EEO šeme) budući da imaju pristup informacijama o zagušenju mreže i potrebi za smanjenjem potražnje.
10. Razmotriti mogućnost za uvođenje obaveze mrežnim operaterima da podstaknu učešće strane potražnje na aukcijama pomoćnih usluga na način da poboljšaju procedure i komunikaciju. Operator prenosnog sistema treba da obezbijedi da se odgovarajuće informacije o: rasporedu očekivanih aukcija za pomoćne usluge, pravilima za učešće, minimalnim tehničkim zahtjevima (uključujući agregaciju), obrascima za prijavu i formama ugovora objavljuju na njegovoj internet stranici.
11. Potrebno je da regulator izvrši pregled modela tarifa za električnu energiju, uzimajući u obzir raspoložive studije, u cilju usklađivanja sa članom 15 Direktive o energetskoj efikasnosti. Tarife za kupce treba da podstiču efikasnu potrošnju energije i odgovor na stvarne potrebe elektroenergetskog sistema.
12. Analizirati program za pružanje subvencija za ugrožene kupce kako bi se osigurale veće ciljne subvencije za one kod kojih postoji stvarna potreba za subvencijama. Obezbijediti da koncept mehanizma subvencija podstiče energetsko efikasno ponašanje, npr. davanjem veće podrške prvim jedinicama potrošnje električne energije, sa tendencijom smanjenja podrške sa povećanjem potrošnje. Uzimajući u obzir najbolje prakse EU i EPOV, koristiti mehanizam subvencija kao sredstvo za prikupljanje potrebnih informacija koje se mogu koristiti za koncipiranje i pružanje efektnih mjera energetske efikasnosti za ugrožena domaćinstva. Donijeti odluku o nadležnom organu ili subjektu na tržištu koji će biti odgovoran za praćenje i sprovođenje ove aktivnosti. Snabdjevači energije mogu takođe biti zaduženi za sprovođenje mjera energetske efikasnosti za ugrožene potrošače kao dio programa obaveza energetskih subjekata za podsticanje smanjenja potrošnje energije (EEO šeme).
Preporuke: Industrija
13. Imenovati nadležno tijelo za uspostavljanje sistema energetskih pregleda, obuke/ sertifikacije stručnih lica i praćenja implementacije u zemlji. Nadležno tijelo/organ takođe treba da olakša i promoviše sprovođenje mjera identifikovanih u izvještajima o energetskim pregledima.
14. Uključiti sektor industrije u proračun ciljeva EE u budućem periodu, tj. 2019-2030, i u budućoj Strategiji razvoja energetike i akcionim planovima energetske efikasnosti.
15. Prenijeti zahtjeve Direktive o energetskoj efikasnosti koji se odnose na uvođenje obaveznih energetskih pregleda za velike kompanije, kroz izmjene i dopune Zakona

43
Preporuke
o efikasnom korišćenju energije. Uvesti restriktivne mjere uključujući novčane kazne za nepoštovanje zahtjeva o obaveznim energetskim pregledima i iskoristiti prihod od novčanih kazni za finansiranje sistema energetskih pregleda. Usvojiti međunarodne standarde za vršenje energetskih pregleda i za uspostavljanje sistema upravljanja energijom/zaštitom životne sredine.
16. Uspostaviti programe obuke i sertifikacije energetskih auditora za sektor industrije. Dizajnirati sistem energetskih pregleda kao instrument samofinansiranja, na način prihod od sprovođenja obuka i sertifikacije energetskih auditora pokriva troškove vezane za upravljanje i obezbjeđenje kvaliteta.
17. Identifikovati aktivnosti koje će olakšati pristup finansijskim sredstvima za industrijske subjekte i implementaciju mjera energetske efikasnosti koje su identifikovane u izvještajima o energetskim pregledima.
18. Razviti programe podrške za promovisanje energetskih pregleda kod malih i srednjih preduzeća, tj. oslobađanje od poreza ili direktne finansijske podsticaje za podršku implementaciji mjera EE zasnovanih na rezultatima izvršenih energetskih pregleda, kampanje za podizanje svijesti itd.
19. Povećati svijest kod donosioca odluka, državnih službenika, subjekata energetskog sektora i šire javnosti u vezi sa višestrukim koristima koje EE mjere u sektoru industrije mogu pružiti, tj. stvaranje novih radnih mjesta, privlačenje novih investicija, povećanje izvoza itd. koristeći realne analize i studije slučaja.
20. Razviti mehanizme podrške za proizvodnju moderne EE opreme. Mehanizmi podrške mogu uključivati finansijske podsticaje, subvencionisane kredite, poreske olakšice itd., npr. uvođenje poreskih olakšica za proizvodnju visoko efikasnih solarnih sistema za pripremu tople vode u zemlji.
Preporuke: Zgrade
21. Ažurirati minimalne zahtjeve energetske efikasnosti na način da uključe zahtjeve u pogledu ukupnih energetskih performansi zgrade, a ne samo zahtjeve za pojedine elemente zgrade. Postepeno uvesti strožije minimalne zahtjeve za energetske efikasnosti za postizanje nivoa efikasnosti za zgrade sa gotovo nultom energetskom potrošnjom, u skladu sa zahtjevima Direktive o energetskoj efikasnosti zgrada.
22. Unaprijediti implementaciju minimalnih zahtjeva energetske efikasnosti i sistema sertifikacije energetskih karakteristika zgrada. Dizajnirati sistem sertifikacije energetskih karakteristika kao mehanizam samofinansiranja, na način da prihod od izdavanja energetskih sertifikata pokriva sve troškove vezane za njegovo upravljanje i obezbjeđenje kvaliteta. Dizajnirajti softver za proračun energetskih karaktersitika zgrada na način da su prikupljene informacije o energetskim karakteristikama zgrada budu automatski dostupne Zavodu za statistiku Crne Gore i za proces donošenja odluka.
23. Sprovesti studiju o potencijalu korišćenja solarnih termalnih sistema, posebno u područjima sa visokim solarnim zračenjem i deficitom mrežnog kapaciteta. Procijeniti mogući doprinos primjene solarnih termalnih sistema razvoju elektroenergetskog

44
In-Depth Review of the Energy Efficiency Policy of Montenegro | 2018
sistema, na troškovno-efikasan način, u poređenju sa opcijama na strani ponude energije (pogledati Preporuku 5).
24. Uspostaviti mehanizme podrške za ugradnju solarnih termalnih sistema u stambenom i uslužnom sektoru. Procijeniti troškove sprovođenja ovakve šeme podrške i uporediti sa višestrukim benefitima za crnogorsku ekonomiju: otvaranje radnih mjesta, povećanje investicija, povećanje izvoza električne energije, smanjenje potrošnje električne energije tokom perioda sa vršnim opterećenjem i ulaganja u proširenje mrežnih kapaciteta, promocija održivog turizma itd. Razmotriti mogućnosti za uspostavljanje dodatnih podsticaja za lokalne proizvođače solarnih sistema za pripremu tople vode (pogledati Preporuku 20).
25. Uvesti podsticaje za lokalne samouprave i vlasnike javnih zgrada za smanjenje potrošnje energije i sprovođenje mjera energetske efikasnosti. Navedenim subjektima treba omogućiti korišćenje sredstava po osnovu ostvarenih uštede energije za vraćanje ulaganja u mjere energetske efikasnosti, kao i njihovo zadržavanje nakon otplate investicije.
26. Sprovesti ciljane kampanje sa ciljem podizanja svijesti potrošača o njihovoj istorijskoj potrošnji energije i promovisali bestroškovne ili nisko-troškovne mjere za smanjenje potrošnje energije. Obezbijediti da se zahtjevi Direktive o energetskoj efikasnosti o pristupu informacijama o istorijskoj potrošnji potrošača (do tri godine) u potpunosti primjenjuju. Kampanje podizanja svesti o bestroškovnim ili nisko-troškovnim mjerama za smanjenje računa za energiju treba bazirati na dobrim međunarodnim praksama i promovisati ih na cijeloj teritoriji države.
Preporuke: Proizvodi koji utiču na potrošnju energije
27. Dodijeliti direktne nadležnosti odgovarajućem državnom organu/odjeljenju za ukupnu kontrolu i implementaciju zahtjeva eko dizajna proizvoda. Obezbijediti odgovarajuće resurse za sprovođenje takvih nadležnosti. Nastaviti jačanje kapaciteta uključenih strana u cilju efikasne implementacije zahtjeva eko dizajna i nadzora nad tržištem. Unaprijediti saradnju i koordinaciju aktivnosti između svih uključenih strana (pogledati Preporuku 4).
28. Učiniti prioritetnim donošenje i sprovođenje pravnog okvira za uvođenje zahtjeva eko dizajna proizvoda koji utiču na potrošnju energije kao jednu od mjera politike energetske efikasnosti sa najvećim uticajem na ostvarivanje budućih ciljeva energetske efikasnosti.
29. Unaprijediti prikupljanje statističkih podataka o uvozu i prodaji proizvoda koji utiču na potrošnju energije. Statistički podaci treba da budu osnova za izračunavanje postignutih ušteda energije koje su rezultat implementacije propisa vezanih za eko dizajn i označavanje energetske efikasnosti proizvoda koji utiču na potrošnju energije.
30. Učiniti prioritetnim programe i mjere koje promovišu ugradnju efikasnih uređaja za grijanje prostora u domaćinstvima, koji trenutno predstavljaju najvažniji izvor zagađenja vazduha u zemlji.

45
Preporuke
31. Obezbijediti odgovarajuću podršku i pomoć za olakšavanje veće upotrebe visoko-efikasnih proizvoda i uređaja, uključujući sledeće:
• Nastaviti sa unapređenjem primjene kriterijuma energetske efikasnosti u postupcima nabavke proizvoda koji utiču na potrošnju energije;
• Obezbijediti intenzivniju realizaciju projekata koje je jednostavno implementirati (eng. low-hanging fruit projects), sa kratkim periodom otplate, kao što je zamjena inkadescentnih sijalica sa LED rasvjetom u javnim zgradama, ugradnja automatske regulacije za grijanje/hlađenje itd.;
• Promovisati upotrebu ESCO modela finansiranja za investicije na zamjeni proizvoda, u većoj mjeri;
• Razviti ciljane kampanje za podizanje svijesti krajnjih potrošača o prednostima korišćenja energetski efikasnih proizvoda i uređaja.
Preporuke: Transport
32. Dodijeliti jasne odgovornosti nadležnom državnom organu/odjeljenju za ukupnu kontrolu i primjenu mjera energetske efikasnosti u sektoru transporta. Obezbijediti odgovarajuća sredstava i resurse za sprovođenje takvih nadležnosti (pogledati Preporuku 4).
33. Promovisati upotrebu javnog prevoza kroz unapređenje njegove udobnosti, dostupnosti i pristupačnosti. Analizirati isplativost uvođenje novih ruta i stvaranja namjenskog putnog prostora za autobuse kako bi izbjegli saobraćajne gužve, posebno u turističkim destinacijama. Promovisati održivi transport, uključujući obavezu aerodroma i avio kompanija da promovišu upotrebu javnog prevoza do/sa aerodroma.
34. Analizirati opcije za dalje ograničavanje ili uticanje na uvoz vozila sa ciljem favorizovanja vozila koja su efikasnija u pogledu potrošnje goriva i imaju manje emisije štetnih gasova, koristeći prednosti EU tržišta u pogledu efikasnosti potrošnje goriva i nivoa emisija.
35. Nastaviti sa politikom uspostavljanja eko naknada i ponovo uvesti eko naknade za naftne derivate. Prihod od eko naknada treba da bude izvor prihoda Eko-fonda. Transparentnost u pogledu trošenja sredstava Eko-fonda, posebno u odnosu na poboljšanje energetske efikasnosti i smanjenje uticaja transportnog sektora na životnu sredinu, ubrzaće prihvatanje eko naknade na gorivo od stane javnosti.
36. Povezati godišnje takse za vozila sa emisijama CO2 shodno dobrim praksama u zemljama EU. Obezbijediti podsticaje za promociju najefikasnijih vozila na tržištu, uključujući hibridne i električne automobile, koristeći mehanizme kao što su nagrade i penali. Takse mogu biti izvor prihoda Eko-fonda.
37. Sprovesti ciljane kampanje za promovisanje mjera vezanih za promjene u ponašanju učesnika u saobraćaju, uključujući eko vožnju, dijeljenje automobila (eng. car-sharing) i pravilno održavanje vozila.


1. Background

48
In-Depth Review of the Energy Efficiency Policy of Montenegro | 2018
1. Background
1.1. Country Overview
Figure 1: Map of Montenegro
Source: https://upload.wikimedia.org/wikipedia/ commons/2/27/Montenegro-map.gif
Montenegro is one of the smallest and youngest countries in Europe, having restored its independence in 2006 following a national referendum. The country has a total area of 13,812 km2 and shares land borders with Albania, Croatia, Bosnia and Herzegovina, Serbia and Kosovo3 (Figure 1).4 Montenegro’s territory is divided into 23 municipalities, and Podgorica is the country’s capital city. According to the latest 2011 census, the population of Montenegro was 620,029, split between 63.23% and 36.77% in urban and rural areas, respectively.5 As of June 2018, Montenegro has an estimated population of 629,219.6
Despite being one of the smallest European nations by land area, Montenegro has extremely varied topography and geomorphology, ranging from the high rugged limestone mountains in the interior to its narrow coastal plain bordering the Adriatic Sea with 293 km of coastline. The climate is distinctively Mediterranean in the south and more continental in the north, with high seasonal temperature variations, characterised by hot dry summers and autumns and cold winters with high snowfall inland, particularly in the mountainous regions.
Montenegro has a parliamentary democratic system. The Parliament is a unicameral legislature with representatives elected by proportional representation. The President is appointed Head of State by national election, and the Prime Minister, as Head of Government, is nominated by the President and appointed by the Parliament.
3 This designation is without prejudice to positions on status, and is in line with UNSCR 1244(1999) and the ICJ Opinion on the Kosovo declaration of independence.
4 Statistics Office of Montenegro (MONSTAT), Statistical Yearbook for 2017, http://monstat.org/cg/novosti.php?id=2577 (accessed June 2018)
5 Statistics Office of Montenegro (MONSTAT), Demography, http://monstat.org/cg/page.php?id=47&pageid=47 (accessed June 2018)6 http://worldpopulationreview.com/countries/montenegro-population/ (accessed June 2018)

49
1. Background
One of the dominant aspects of Montenegrin political development, since restoring its independence in 2006, is the country’s undertaking of the accession process to the EU. Montenegro has been strongly devoted to the process of European integration and is committed to implementing economic reforms and harmonising its policies with the EU acquis communautaire. While EU membership promises many benefits, the accession process is economically challenging. Montenegro started negotiations to join the EU in June 2012, and in 2017, talks were opened on 26 out of 33 negotiation ‘chapters’. Regarding energy, Montenegro’s accession process is facilitated through its membership of the Energy Community, which supports Montenegro in adopting the body of EU law, more formally known as the acquis communautaire, relating to energy.
1.2. Economic BackgroundOverview Montenegro is an upper-middle-income country, with GDP per capita at purchasing power parity PPP (current international USD) of 17,665, which is 44.34% of the EU28 average.7
Montenegro uses the euro as a de facto domestic currency, although the country does not have any official agreements with the EU in this domain.8 The German mark had been Montenegro’s de facto currency since 1996, but was replaced by the euro in 2002 when euro notes and coins entered into circulation in Germany and other EU countries.
Montenegro is a small, open economy without its own currency and reliant on capital inflows from abroad to stimulate its growth. Consequently, the country is vulnerable to external shocks.
GDP and growthPrior to the outbreak of the global economic crisis, the Montenegrin economy was characterised by rapid growth (6.8% in 2007 and 7.9% in 2008), but in 2009, economic growth plummeted by 5.8%. It quickly recovered in 2010 and since then has remained fairly stable, fluctuating between 1.8% and 3.5%, except in 2012 when GDP decreased by 2.7%.
Over the last decade, GDP per capita has shown a positive trend, growing by 5% per annum on average (Figure 2). This progress was mainly based on a high inflow of foreign direct investment and increased government spending. The Government expects the economy to continue expanding in the medium term as a result of new large infrastructure investments.
7 The World Bank data website: https://data.worldbank.org/indicator/NY.GDP.PCAP.PP.CD (accessed June 2018)8 See “The euro outside the euro area”, available at the European Commission website: https://ec.europa.eu/info/business-economy-
euro/euro-area/euro/use-euro/euro-outside-euro-area_en (accessed June 2018)

50
In-Depth Review of the Energy Efficiency Policy of Montenegro | 2018
Figure 2: GDP per capita (thousand €) and GDP growth (%) for Montenegro, 2007-2016
4,366
5,030 4,842 5,045 5,265 5,126 5,4125,561
5,873 6,3546.8
7.2
‐5.8
2.73.2
‐2.7
3.51.8
3.42.9
‐8
‐6
‐4
‐2
0
2
4
6
8
0
1,000
2,000
3,000
4,000
5,000
6,000
7,000
2007 2008 2009 2010 2011 2012 2013 2014 2015 2016
GDP per capita, thousand € GDP growth, %
Source: Montenegro Statistical Office, Statistical Yearbook for 2017
The structure of the Montenegrin economy has undergone some significant changes in recent years, particularly due to a substantial structural shift from industry to services and tourism. In 2016, the three major GDP-generating activities of the country’s economy were: domestic trade, including the repair of vehicles (14.8%); agriculture, forestry and fishing (9.03%); and public administration and defence (8.94%). After these, the next three activities of importance (i.e. accommodation and food service activities, real estate activities and construction) are mainly related to the sector of tourism, which has been a major source of economic growth and employment in recent years (Figure 3). The power sector, along with gas, steam and air conditioning, accounts for 4.01% of GDP.

51
1. Background
Figure 3: Breakdown of GDP by sector of economic activity 2016, %
Domestic trade, 13.7%
Agriculture, forestryand �shing, 8.4%
Public administration and defense, 8.3%
Accommodation andfood service activities,
8.0%
Real estateactivities, 6.7%Construction, 6.3%
Financial andinsurance activities,
5.0%
Education, 4.8%
Transportation and storage, 4.5%
Information and communication,
4.4%
Human health andsocial work
activities, 4.3%
Manufacturing,4.2%
Electricity, gas, steamand air conditioning
supply, 4.0%
Professional, scienti�cand technical
activities, 2.7%
Others, 7.4%
Source: Montenegro Statistical Office, Statistical Yearbook for 2017
Imports and exportsCountries of the Central European Free Trade Agreement (CEFTA) and EU countries are the largest export trading partners for Montenegro. The main export partner of Montenegro, in 2016, was Serbia (25.2%), followed by Hungary (10.7%) and Bosnia and Herzengovnia (B&H) (8.2%). In the same year, the main import partner of Montenegro was Serbia (22.2%), followed by Germany (10.5%) and Italy (7.4%). In 2016, Montenegro’s main export was related to sectors of manufactured goods (26.6%) and crude materials, except fuels (22.1%), whereas imports were dominated by machinery and transport equipment (25.6%), as well as food and live animals (19.3)9 (Figure 4).
9 Statistics Office of Montenegro (MONSTAT) on foreign trade, available at: https://www.monstat.org/eng/page.php?id=32&pageid=32 (accessed June 2018)

52
In-Depth Review of the Energy Efficiency Policy of Montenegro | 2018
Figure 4: Export and import shares of Montenegro in 2016 (per sector)
Export Shares Import Shares
Others35.5%
Manufacturedgoods26.6%
Mineralfuels andlubricants
15.9%
Crudematerials
exceptfuels
22.1%
Others38.6%
Manufacturedgoods16.6%
Foodand liveanimals19.3%
Machinery and
transport equip.25.6%
Source: Montenegro Statistical Office, Foreign Trade of Montenegro in 2016
Labour marketThe structural change in Montenegro’s economy has contributed to high unemployment as the decline of agriculture and industry led to the shedding of workers from these traditional areas of economic activity. The Montenegrin labour market is characterised by significant underutilisation of labour resources due to weak labour demand. The main contributor to this situation is the existence of a relatively large public sector that does not create an enabling environment for entrepreneurship and an underdeveloped private sector. According to data from the Employment Agency of Montenegro, the total number of unemployed people was 50,905 in January 2018, which is a high proportion of the labour market at 21.94% and slightly higher than the previous year (21.29%).10 While this is less than the proportion of unemployment following the financial crisis in 2009, it is still very high given that the EU28 unemployment rate was 7.3 % in January 2018.11
FDI flowsNet foreign direct investment (FDI) inflows to Montenegro in 2016 amounted to €687.15 million, according to the Central Bank of Montenegro. This is 9.8% less than in the previous year (2015), but is similar to levels witnessed from 2011 to 2014. Every year since 2011, FDI inflows have accounted for at least 9% of the country’s GDP12 (see Table 1).
In 2016, Norway provided the largest source of FDI inflow for Montenegro with a share of 27.51%, followed by the Russian Federation (7.69%), Italy (7.36%) and Azerbaijan (5.01%). Of the total FDI inflows in 2016, 25.52% (or €175.3 million) was related to investment in companies and banks, 19.36% (or €133 million) to the sale of real estate and 27.2% (or €186.9 million) to intercompany debt.13
10 Employment Agency of Montenegro, Weekly statistical report from 9 January 201811 See the Eurostat website: http://ec.europa.eu/eurostat/statistics-explained/index.php/Unemployment_statistics (accessed June
2018)12 Central Bank of Montenegro, Annual Report for 201613 Central Bank of Montenegro, Annual Report for 2016

53
1. Background
Table 1: Montenegro FDI flows 2011-2016
2011 2012 2013 2014 2015 2016
Total inflow, thousand € 494,741 633,690 479,191 498,084 757,435 687,154
Total outflow, thousand € 105,636 172,104 155,313 144,144 138,161 315,586
Net FDI, thou-sand € 389,104 461,591 323,879 353,940 619,274 371,568
Net FDI flows, % of GDP 11.9% 14.5% 9.6% 10.2% 16.9% 9.4%
Source: Central Bank of Montenegro, Annual Report for 2016
EU accession economic assessmentAs part of the process to accede to the EU, Montenegro pursues economic policy aligned with the market economy model, reducing the role of the state. The latest progress report14 of the European Commission on Montenegro’s accession process summarised progress on economic criteria as follows:
“As regards economic criteria, Montenegro is moderately prepared in developing a functioning market economy. Some progress was made to strengthen the functioning of the financial and labour markets, as well as on improving the business environment. Investments in infrastructure and tourism support economic activity. However, rapidly rising public debt and high fiscal deficits, together with high external imbalances and high unemployment are of concern. The combined effects of large-scale public infrastructure investments and several new expensive social expenditure programmes challenge fiscal sustainability. Immediate corrective measures are required, as called for by the ERP policy guidance. Other problems to be tackled include high external imbalances and low labour market participation and still low credit growth amid high impaired bank loans.”
In order to improve the macroeconomic situation and to move in the direction of long-term growth and sustainable economic development, the European Commission advises Montenegro to stabilise and reduce public debt, as well as to develop a comprehensive strategy to foster the disposal for non-performing loans. For the labour market, the recommendation is to prolong working lives and reduce disincentives to work.
Investment conditionsBased on ten aggregated indicators, the World Bank has ranked Montenegro at the 42nd position out of 190 countries for overall “Ease of Doing Business” in 2018, rising from the 51st
position in the previous year. It should also be noted that in comparison to other Western Balkan countries, the performance of Montenegro is higher compared to Serbia (ranked 43rd), Albania (ranked 65th), Croatia (ranked 51st) and B&H (ranked 86th), and is lower compared to Former Yugoslav Republic of Macedonia (FYROM) (ranked 11th) and Kosovo (ranked 40th).15
14 p.5, SWD (2016) 360 published 9.11.2016, available at: https://ec.europa.eu/neighbourhood-enlargement/sites/near/files/pdf/key_documents/2016/20161109_report_montenegro.pdf (accessed June 2018)
15 http://www.doingbusiness.org/rankings (accessed January 2018)

54
In-Depth Review of the Energy Efficiency Policy of Montenegro | 2018
The analysis of the World Bank’s “Ease of Doing Business” indicators shows that the “Ease of Getting Electricity” indicator is currently one of the main obstacles to improving the overall business climate of the country (Figure 5). Closer inspection of the methodology and sub-indicators for this indicator reveals two problematic issues: complicated and time-consuming procedures to get an electricity connection; and high connection costs in comparison to income per capita. According to the information provided during the Peer Review mission to Podgorica in June 2018, the distribution system operator (DSO) is aware of the low position of the country in terms of the “Ease of Getting Electricity” indicator and is taking the necessary steps to decrease the number of procedures related to the connection to the grid.
Figure 5: Rank of Montenegro in the “Ease of Doing Business” indicators (190 countries), 2018
12
37
42
42
44
51
60
70
76
78
127
0 20 40 60 80 100 120 140
Ease of getting credit
Ease of resolving insolvency
Overall ease of doing business
Ease of enforcing contracts
Ease of trading across borders
Protecting minority investors
Ease of starting a business
Ease of paying taxes
Ease of registering property
Ease of dealing with construction permits
Ease of getting electricity
Source: http://www.doingbusiness.org/rankings
Analysis of the ratings of Montenegro for other internationally recognised benchmarking indicators, including competiveness and transparency, shows some improvement for competitiveness relative to other countries, but demonstrates a static performance for corruption perceptions:
- Global Competitiveness Index 2016–2017: ranked 77th out of 138 countries, progressing from 82nd in the previous year;16
- Corruption Perceptions Index 2016: ranked 64th out of 176 ranking positions, declining from 61st in the previous year. (The country’s score increased one point from 44 in 2015 to 45 in 2016, reflecting minor improvement, but its ranking slipped due to greater relative improvement of other countries.)17
The Montenegrin rankings for these indicators relating to the ease of doing business, competitiveness and transparency confirm that the country has made some progress in
16 http://reports.weforum.org/global-competitiveness-index-2017-2018/at-a-glance-global-competitiveness-index-2017-2018-rankings/ (accessed June 2018)
17 See Transparency International website: http://www.transparency.org/news/feature/corruption_perceptions_index_2016 (accessed June 2018)

55
1. Background
improving investment conditions. This is also reflected by the national financial data (see Figure 2). The process of EU integration should facilitate further improvement in the overall prosperity of the country, but completion of this process will require several more years of dedicated work to achieve sufficient progress in all areas.
Energy sector development and investmentThe Energy Development Strategy (to 2030) of Montenegro estimates indicative investment needs at the level of €4.19 billion, of which €3.08 billion is to be delivered before 2021, with the remaining amount of €1.11 billion to be invested in the period 2022–2030. The action plan to implement this strategy is applicable to the period of 2016–2020 and provides more precise estimation of the necessary resources for implementation. The sum of investments identified for concrete projects and activities in the energy sector amounts to €2.05 billion over a 5-year period. The largest share in the investment portfolio is predominately related to the construction of large hydropower plant (HPPs) and small HPPs and accounts for €705.6 million. The improvement of the energy efficiency of existing generation, transmission and distribution facilities accounts for €558.1 million. Cleaner and more efficient energy production from fossil fuels and the development of district heating networks account for €457.2 million and €78.5 million, correspondingly.
Energy intensityThe energy intensity of Montenegro’s economy decreased by 29%, or from 0.16 to 0.11 tonne of oil equivalent (toe) per thousand USD PPP during 2006–2015 (Figure 6). The dynamics of the energy intensity follow the economic development of the country, where the negative peak in 2009 was associated with an economic recession causing a decline in industrial production. Nevertheless, the country’s energy intensity is still significantly higher compared with an average indicator for Organisation for Economic Co-operation and Development (OECD) countries in Europe.
Figure 6: Energy intensity - TPES/GDP, 2006–2015, toe per thousand 2010 USD PPP
0.08
0.09
0.1
0.11
0.12
0.13
0.14
0.15
0.16
2006 2007 2008 2009 2010 2011 2012 2013 2014 2015
Europe, TPES/GDP Montenegro, TPES/GDP
Source: Database of the International Energy Agency, 2017

56
In-Depth Review of the Energy Efficiency Policy of Montenegro | 2018
The further comparison of energy intensity of Montenegro with neighbouring countries indicates that the energy intensity of the country is significantly lower than that of Bosnia and Herzegovina, Serbia and Kosovo, but higher compared to Croatia, FYROM and Albania (Figure 7). Taking into account that the analysis of the energy intensity alone does not reflect the overall efficiency of the country without the analysis of other indicators, Figure 7 also provides the comparison of energy consumption per capita. Thus, despite the fact that the energy intensity of Albania is the lowest in the region, energy consumption per capita of this country is 35% lower than in Montenegro and more than three times lower than in OECD countries. This can also indicate that the standards of living in this country are among the lowest in the region, whereas Montenegro’s correlation between energy intensity and energy consumption per capita is second best in the regions after Croatia.
Figure 7: Comparison of energy intensity and TFC per capita in Western Balkans and OECD countries in 2015
0
0.5
1
1.5
2
2.5
0
0.05
0.1
0.15
0.2
0.25
Alb
ania
OEC
D E
urop
e
FYRM
Croa
tia
Mon
tene
gro
Koso
vo
Serb
ia
Bosn
ia a
nd
Her
zego
vina
toe
per c
apita
toe
per t
hous
and
2010
USD
PPP
TPS/GDP TFC/capita
Source: Database of the International Energy Agency, 2017

57
1. Background
Summary: Background
Montenegro is one of the smallest and youngest countries in Europe, having restored its independence in 2006 following a national referendum. Montenegro has a parliamentary democratic system. The country has a total area of 13,812 km2 and 293 km of coastline and shares land borders with Albania, Croatia, Bosnia and Herzegovina, Serbia and Kosovo. The country’s population, at just over 600,000, is split approximately two-thirds to one-third in urban and rural areas, respectively. The country has an extremely varied topography and geomorphology. The climate is distinctively Mediterranean in the south and more continental in the north.
Montenegro is an upper-middle-income country with a Gross Domestic Product (GDP) per capita at purchasing power parity (PPP, current international USD) of 17,665, which is 44% of the EU28 average. Montenegro has a small open economy without its own currency, using the euro despite not being a member of the EU. Foreign Direct Investment (FDI) inflows typically account for around 10% of the country’s GDP. The structure of the Montenegrin economy has undergone some significant changes in recent years, particularly due to a substantial structural shift from industry to services and tourism, which has contributed to high unemployment that currently stands at around 22% of the working population.
Montenegro is committed to joining the EU and is implementing economic reforms and harmonising its policies with the EU acquis communautaire. This includes pursuing economic policy aligned with the market economy model and reducing the role of the state. Recent assessment by the European Commission identified progress but raised concerns regarding the rapidly rising public debt, high fiscal deficits, high external imbalances and high unemployment. Large-scale public infrastructure investments and several expensive new social expenditure programmes challenge fiscal sustainability. Regarding energy, Montenegro’s accession process is facilitated through its membership of the Energy Community.
The energy intensity of Montenegro’s economy decreased by 29%, from 0.16 to 0.11 tonne of oil equivalent (toe) per thousand USD PPP from 2006 to 2015 but is still high compared to OECD countries in Europe. The Energy Development Strategy (to 2030) of Montenegro estimates indicative investment needs at the level of €4.19 billion, of which €3.08 billion is planned to be delivered before 2021 and with a considerable share allocated to renewable energy sources (RES) and energy efficiency. Investment conditions in the country are slowly improving according to global indicators on ease of doing business, competitiveness and transparency. According to 2018 Ease of Doing Business ranking, the complicated and time-consuming procedures to get an electricity connection and high connection costs in comparison to income per capita are currently key obstacles for improving the overall business climate of the country. The DSO is aware of the low position of the country on “Ease of Getting Electricity” indicator and takes necessary steps to decrease in the number of procedures related to the connection to the grid.


2. Energy Supply and Demand

60
In-Depth Review of the Energy Efficiency Policy of Montenegro | 2018
2. Energy Supply and Demand Before declaring its independence in 2006, the Montenegrin economy was mainly based on industrial production facilities and infrastructure inherited from Socialist Federal Republic (SFR) Yugoslavia. During the global financial crisis in 2009, Montenegro’s industrial sector faced serious challenges. Government intervention in response to those challenges supported an economic structural shift from industry to tourism and services.
This structural change in the economy caused significant changes in the energy balance of the country. The total primary energy supply (TPES) of the country has decreased by 13% during the last decade, with a sharp dip in 2009. TPES has fluctuated around the level of about one million tonnes of oil equivalent (Mtoe) since 2013 (see Figure 8). A considerable amount of the fluctuation in the structure of primary energy supply is explained by the varying availability of water for hydroelectricity production, fluctuations in energy demand (particularly due to the fluctuations and decline in industrial production) and downtime of the coal thermal power plants (TPP) for refurbishment in 2009 and general maintenance.
At the same time, significant changes occurred in the primary consumption of different energy carriers (Figure 8):
- An increase in utilisation of hydro resources during 2007–2010 and 2014–2016 with two sharp decreases of 56% and 31% in 2011 and 2014, correspondingly. There was also a decrease of electricity import from 222 ktoe in 2007 to 0.17 ktoe in 2010 and a significant fluctuation from -30 ktoe to 135 ktoe since then (see Section 2.1).
- A substantial yearly fluctuation in coal demand during 2007–2010 with a major but temporary dip due to refurbishment of the thermal plant in 2009, accounting for the major dip in TPES that year. In total, the coal primary supply increased by 69% during 2007–2010, but decreased by 26% during 2011–2016 (see Section 2.2);
- A decrease in consumption of oil products – by 33% during 2007–2013 followed by an increase of 20% during 2013–2016 (see Section 2.3);
- An increase of biofuels by 13% during 2007–2012 with fluctuations at the level of ±5% during 2013–2016 (see Section 2.5).

61
2. Energy Supply and Demand
Figure 8: Total primary energy supply (TPES), 2007–2016, ktoe
0
200
400
600
800
1,000
1,200
1,400
2007 2008 2009 2010 2011 2012 2013 2014 2015 2016
Coal and coal products Oil products Hydro Biofuels and waste Electricity
Source: Energy balances of Montenegro (MONSTAT), 2017
While the structure of TPES shows considerable variation over the last decade, the structure of total final consumption (TFC) remained relatively stable with a slight and gradual shift of 6% of TFC from the share of electricity to the share of biofuels and waste (mainly biofuels) (Figure 9).
Figure 9: Total final consumption (TFC), 2005–2014, %.
1.8% 1.8% 1.7% 1.4% 0.8% 1.1% 0.8% 1.1% 1.6% 1.6%
44.7% 46.1% 43.8% 41.5% 39.3% 38.4% 40.7% 41.5% 42.4% 45.0%
16.6% 16.8% 20.7% 21.0% 22.3% 23.5% 24.5% 24.2% 23.7% 22.4%
36.9% 35.4% 33.7% 36.0% 37.6% 37.0% 34.0% 33.2% 32.3% 31.0%
0%10%20%30%40%50%60%70%80%90%
100%
2007 2008 2009 2010 2011 2012 2013 2014 20162015
ElectricityCoal and coal products Oil products Biofuels and waste
Source: Energy balances of Montenegro (MONSTAT), 2017
The TFC of the country decreased by 19% over the last decade, largely due to declining industrial production, and was about 740 ktoe in 2016 (Figure 10). The analysis of TFC by sector

62
In-Depth Review of the Energy Efficiency Policy of Montenegro | 2018
clearly illustrates the aforementioned structural shift of the Montenegrin economy with the decline of industry and the rise of tourism and services. Energy consumption of the industrial sector decreased by a factor of three over the last decade.18 As of 2016, the residential and transport sectors were the dominant energy consumers of the economy with TFC shares of 35.6% and 32.2%, respectively.
Figure 10: Total final consumption by sector, 2007–2016, ktoe
379 381231 199 227 197 175 121 132 120
214 217
212 232 221 222189
193 206 239
246 251
267 275 270 281269
256 265 264
0
200
400
600
800
1,000
2007 2008 2009 2010 2011 2012 2013 2014 2015 2016
Industry Transport Residential Services Agriculture Non‐speci�ed Non‐energy Use
Source: Energy balances of Montenegro (MONSTAT), 2018
2.1. ElectricityElectricity generated in Montenegro is mainly produced from the following plants:
- Hydropower Plant (HPP) Perucica with an installed capacity of 307 MW;
- HPP Piva with an installed capacity of 342 MW;
- 19 small HPPs with total installed capacity of 32 MW;
- Coal Thermal Power Plant (TPP) Pljevlja with an installed capacity of 218.5 MW;
- Krnovo wind farm with installed capacity of 72 MW.
The electricity sector of the country is highly dependent on the country’s hydrological situation and the water level in the rivers, as evidenced by the fluctuation of the share of hydropower in the total primary energy supply over the years, e.g. sharp decreases of 56% and 31% in years 2011 and 2014, correspondingly (see Figure 8). A favourable hydrological situation in 2010 and 2013 allowed the HPPs to operate at maximum capacity during these years (Figure 11). The availability of hydropower has clearly influenced the variability of the net import-export balance over time, but it is not on its own the most important factor. The production capacities have been constantly increasing since 2014 mostly due to the development of small hydro and the construction of the first wind farm that became operational in 2017.
18 The decrease in energy consumption by industry during the period of 2014–2016 and the increase in energy consumption by the service sector over the same period is also influenced by the changes in the methodology for preparation of the energy balances by the national statistics office, MONSTAT.

63
2. Energy Supply and Demand
Figure 11: Electricity generation, imports and exports, 2007–2016, ktoe
232
162
10563
171
124
3378 89 104
184
243 237
346
228 245
328
261 247 260
‐9 ‐9 ‐15
‐63‐37 ‐20
‐63 ‐55 ‐44‐78
‐100
‐50
0
50
100
150
200
250
300
350
400
‐100
‐50
0
50
100
150
200
250
300
350
400
2007 2008 2009 2010 2011 2012 2013 2014 2015 2016
Imports Generation Exports Net import‐export balance
Source: Energy balances of Montenegro (MONSTAT), 2017
The varying industrial electricity consumption has been the other major factor which, together with the availability of hydropower, explains the historic variation in the net import-export balance of electricity. Montenegro has largely been a net importer of electricity over the last decade.
Figure 12 illustrates the considerable extent to which electricity consumption by industry has fluctuated and decreased over the years. The total electricity demand of the country has reduced by 32% from 2007 to 2016, which is mainly accounted for by structural change in the economy with the decline in industrial production during this time and the more recent emergence and growth of the services sector.19 As of 2016, the residential sector accounted for 46% of electricity demand, whereas services and industry accounted for 27% and 25%, respectively.
19 The sharp decrease of electricity consumption in industry and increase in services during 2013–2014 is a result of the changes in the methodology for preparation of the energy balances by the national statistics office, MONSTAT.

64
In-Depth Review of the Energy Efficiency Policy of Montenegro | 2018
Figure 12: Electricity consumption by sector, 2007–2016, ktoe
0
50
100
150
200
250
300
350
400
2007 2008 2009 2010 2011 2012 2013 2014 2015 2016
Residential Industry Transport Services Agriculture
Source: Energy balances of Montenegro (MONSTAT), 2017
2.2. Coal After hydropower, coal is the second most important source of electricity production in Montenegro. Coal is mined in the north of the Montenegro Pljevlja region. This region is home to three coal basins: Pljevlja basin (under exploitation); Ljuce-Sumanski basin (almost depleted); and Maoce Basin (new coal mine). According to Montenegro’s energy development strategy,20 the total balance reserve of the Pljevlja region amounts to around 188.4 million tons.
All coal produced in Montenegro is used in the local market, where about 97%-98% is consumed by the TPP Pljevlja, and the rest is consumed by households, industry and services (Figure 13). Thus, the production of the coal is mainly dependant on the electricity production cycle of the Pljevlja TPP, which, in turn, is influenced by the availability of hydropower and energy demand. It should also be noted that the power plant underwent modernisation in 2009, which negatively impacted coal production in that year.
20 Energy Development Strategy of Montenegro to 2030, Adopted by Government Conclusion No. 08-1591/3 of 17 July 2014.

65
2. Energy Supply and Demand
Figure 13: Consumption of coal, 2007–2016, ktoe
234
360
192
408 418373 363 351 367
296
16
16
13
11 68 5 7 11
12
050
100150200250300350400450
2007 2008 2009 2010 2011 2012 2013 2014 2015 2016
TPP Pljevlja Final consumption
Source: Energy balances of Montenegro (MONSTAT), 2018
The Pljevlja TPP, which has been in operation for more than 35 years, will soon require further modernisation in order to comply with the requirements of EU environmental standards. In March 2018, the Elektrorprivreda Crne Gore (EPCG), the company owning the TPP, selected a consultant to design the reconstruction of the plant. In addition, the Government of Montenegro is considering the construction of a second plant, Pljevlja TPP II, which will replace the existing one from the end of its lifetime. The construction of the new plant also includes the development of the district heating system in Pljevlja, which will enhance the efficiency of the energy production of the plant.
2.3. Oil ProductsMontenegro does not have its own oil production or refining industry, and all oil products are imported. Figure 14 shows that diesel is the dominant fuel in the country. In 2016, the share of diesel in the balance of oil products was 65.3%, followed by gasoline at 11.7% and other oil products (non-energy use) accounted for 10.5%.
Overall, the consumption of oil products decreased by 19% over the last decade. Figure 14 shows that the trend of reduced consumption is mainly due to a sharp decrease in the consumption of fuel oil (mazut). The latter is associated with the decline in industrial production of aluminium oxide. The consumption of diesel and kerosene has increased by 43% and 69%, correspondingly, and is related to the growing energy demand of vehicle and airplane fleets. As of 2016, 96% of diesel was used by transport, and the remaining 4% was used as a heating fuel.

66
In-Depth Review of the Energy Efficiency Policy of Montenegro | 2018
Figure 14: Consumption of oil products, 2007–2016, ktoe
0
50
100
150
200
250
300
350
400
450
2007 2008 2009 2010 2011 2012 2013 2014 2015 2016
Diesel Gasoline LPG KeroseneOther oil products Fuel oil
Source: Energy balances of Montenegro (MONSTAT), 2017
The transport sector dominates the consumption of oil products. The sector’s share has been increasing over time, reflecting not only the increasing demand of the transport sector, but also the decline in industrial production since 2009. In 2016, the transport sector was responsible for the consumption of 71.1% of oil products, followed by industry at 14.3% and non-energy use at 10.5% (Figure 15).
Figure 15: Consumption of oil products by sector in 2016, %
Non‐energyconsumption,
10.5%
Other sectors,4.1%
Transport,71.1%
Industry,14.3%
Source: Energy balances of Montenegro (MONSTAT),2017

67
2. Energy Supply and Demand
2.4. Natural GasMontenegro has no access to natural gas. However, the Government of Montenegro implements preparatory steps for potential gasification which could be achieved through involvement in the infrastructure developments concerning the Ionian-Adriatic Pipeline (IAP) and/or the Trans Adriatic Pipeline (TAP). The construction of the natural gas pipelines will enable both a stable natural gas supply to Montenegro and its transit to the Western Balkans and other neighbouring countries. The Government of Montenegro has already implemented the following activities to support the IAP and TAP projects:
- In 2010 and 2016, the laws on energy transposed the main requirements of the EU acquis regarding gas, and the development of the relevant regulatory framework is ongoing;
- In 2013, the Government of Montenegro appointed Montenegro Bonus Ltd to be the operator of the Montenegrin gas transmission system which cooperates with the European Network of Transmission System Operators for Gas (ENTSOG), primarily through the forums and bodies of the Energy Community;
- In 2017, the Government adopted the Master Plan for the development of the gas transport system (gasification) of Montenegro,21 accompanied by the report on the strategic environmental impact assessment as well as the guidelines for the planning of priority investments in gas pipeline projects. The Master Plan explains the construction of the TAP (with total capacity of 5 billion cubic meters of gas per year and with a total length of 530 km), which is an important project for EU gas infrastructure, as well as the gasification of several large cities inside the country.
2.5. HeatDistrict heating in Montenegro exists on a very limited scale. At present, district heating solutions are being neither developed nor explored. According to available information, there are only two operational boilers in Pljevlja (PE Grijanje and Sports Center Ada) that produce heat for district heating for a limited number of consumers located in the city centre. Buildings in the service sector are usually equipped with a central heating system based on light fuel oil, electricity, coal or biomass. Buildings in the residential sector tend to be heated and cooled by individual systems such as air-conditioners, including air source heat pumps, individual boilers for apartments or houses and biomass stoves (see Section 9.4.2).
In 2016, a comprehensive study on the potential for district heating/cooling and high efficiency cogeneration was prepared by consultants and funded by the EU under the project “Developing Sustainable Energy Use in Montenegro”.22 The study reveals the economically viable potential for the development of district heating systems as well as for combined heat and power (CHP) plants running on biomass. This topic is due to be further elaborated in the Action Plan for District Heating and/or Cooling and High Efficiency Cogeneration, which is expected to be finalised and adopted by the Government in 2018.
21 Master Plan for the development of the gas transport system (gasification) of Montenegro, adopted by Government Conclusion No. 07-1898, 30 June 2017.
22 Developing Sustainable Energy Use in Montenegro - EuropeAid/132799/C/SER/ME

68
In-Depth Review of the Energy Efficiency Policy of Montenegro | 2018
Summary: Energy Supply and Demand
Montenegro is not an oil or gas producer, has no access to gas and imports all oil products. The country has reserves of coal, with three coal basins located in the Pljevlja region, for which the total balance reserve was estimated to be 188.4 million tons in 2014. Nearly all coal mined in Montenegro is used for generation of electricity by TPP Pljevlja. Hydro is the dominant source of electricity production, followed by coal and, recently added, wind, with power generation capacities as follows: HPP Perucica of 307 MW and HPP Piva of 342 MW; 19 small HPPs of total 32 MW; coal-based TPP Pljevlja of 218.5 MW; and Krnovo wind plant of 72 MW.
The TPES of the country has decreased by 13% during the last decade and has fluctuated around the level of about 1 Mtoe since 2013. A considerable amount of the fluctuation in the structure of TPES is explained by the varying availability of water for hydroelectricity production, fluctuations in energy demand (particularly due to the fluctuations and decline in industrial production) and downtime of the coal thermal power plants (TPP) for refurbishment in 2009 and general maintenance. TPP Pljevlja will need to be modernised in order to meet EU environmental standards, and the Government of Montenegro is considering replacing it with the construction of a second plant, Pljevlja TPP II, from the end of its lifetime. Montenegro has largely been a net importer of electricity over the last decade.
The TFC of the country decreased by 19% to 740 ktoe in 2016, relative to 2007, while the total electricity demand of the country reduced by 32% during this time. This is largely due to structural change in the Montenegrin economy with the significant decline of industrial production over this time and the more recent rise of tourism and services. The structure of TFC by fuel has remained relatively stable over the last decade, with a slight and gradual shift from electricity to biofuels. As of 2016, the residential sector accounted for 46% of electricity demand, whereas services and industry accounted for 27% and 25%, respectively.
All oil products are imported, and diesel is the dominant oil product, with a 65% share, almost exclusively used for transport, while gasoline accounts for just under 12%. The consumption of oil products, mainly mazut, decreased by 19% over the last decade, with most of this reduction occurring between 2008 and 2009 due to the declining industrial production of aluminium oxide. In recent years, the consumption of oil products, particularly diesel, has been rising due to increasing demand from the transport sector, which was consuming 71% of all oil products in 2016.
While Montenegro currently has no access to natural gas, the Ionian-Adriatic Pipeline (IAP) and the Trans Adriatic Pipeline (TAP) infrastructure developments could provide both a stable natural gas supply to Montenegro and cause Montenegro to become a transit country for the supply of gas to the Western Balkans and other neighbouring countries. The Government of Montenegro has already implemented some preparatory activities to support the projects.

69
2. Energy Supply and Demand
District heating (DH) in Montenegro is limited, although an EU-supported study reveals economically viable potential for the development of DH and biomass-based CHP. Buildings in the residential sector are heated/cooled by individual systems such as air conditioners, boilers and stoves, sized for the individual apartment or house. Buildings in the services sector are typically equipped with central heating systems running on light fuel oil, electricity, coal or biomass.


3. Market Structure for Electricity, Natural Gas and Heat

72
In-Depth Review of the Energy Efficiency Policy of Montenegro | 2018
3. Market Structure for Electricity, Natural Gas and Heat
3.1 Electricity The electricity market in Montenegro is relatively small, with total installed capacity of 971.7 MW provided by HPPs, the Pljevlja TPP and the Krnovo wind farm. Until 2009, the Montenegrin electricity system was operated by a single, vertically integrated, state-owned company, Elektrorprivreda Crne Gore (EPCG), responsible for all power generation, transmission, distribution and supply. In accordance with Montenegro’s commitments under the Energy Community Treaty, the process of legal unbundling began in 2009, resulting in the establishment of the following entities (Figure 16):
- Electric power company - “Elektroprivreda Crne Gore” (EPCG JSC) - responsible (since 2016) for electricity supply and operation of three large state-owned generating plants and 5 SHPPs;
- Transmission system operator (TSO) - “Crnogorski elektroprenosni sistem” (CGES JSC) - unbundled from the EPCG in 2009;
- Electricity market operator - Crnogorski operator tržišta električne energije (COTEE Ltd) - unbundled from CGES in 2010;
- Distribution system operator (DSO) - Crnogorski elektrodistributivni system (CEDIS Ltd) - unbundled from the EPCG in 2016;
The Stock Exchange Electric Energy Company (Berza električne energije Ltd) was created in 2017, but is still not yet functioning.
Figure 16: Montenegro’s electricity market structure
privileged7 1
1
1
5
Producers
Customers
376.7353
Cross-border �ows(import/export)
DSO
TSO
EPCG1
Market Operator
COTEE
Supplier
EPCG2
4
5
H & S6
CEDIS
CGES
1 Incumbent producer2 Supplier of last resort and vulnerable consumers that in 2017 supplied
households and small consumers (transitional provisions of law)3 The number includes 8 direct customers4 Electricty �ow from customers to the grid based on net-metering5 Commercial �ow includes transfer of RES related fees collected by supplier6 Households and Small Customers
Electricity �ow
Commercial �ow
Commercial �ow related to imbalance settlement
Source: REGAGEN, 2018

73
3. Market Structure for Electricity, Natural Gas and Heat
The electricity market was opened for large consumers on the 1st of January 2009 and for all consumers on the 1st of January 2015, meaning that all consumers now have the right to choose their electricity supplier. The Energy Regulatory Agency has issued five licences for suppliers operating in the market: Montenegrin Electric Power Company (EPCG), Uniprom, Montenegro bonus, Petrol Crna Gora MNE DOO Podgorica and Energia Gas & Power DOO Podgorica. However, only one of the licenced suppliers – the Montenegrin Electric Power Company (EPCG) – is currently active and carrying out electricity supply activities.
Since the opening of the electricity market in January 2015, no energy consumers have requested to change their supplier, and all electricity customers remained supplied by the EPCG, except for some large consumers that are connected to the TSO and purchase electricity from other suppliers or, in case they are consumers self-suppliers, from traders/generators. Indeed, in comparison with other electricity suppliers, EPCG has had a number of market advantages in the early stages of market opening, including the operation of the DSO (until mid 2016) and three major generating plants, as well as decades of experience on the national market. According to the information provided by the Energy Regulatory Agency (REGAGEN), after opening the market, the following steps have been implemented to enhance the competitiveness of the national electricity supply market:
- Unbundling of the DSO CEDIS from the EPCG that provided a non-discriminatory access to the distribution system to all suppliers;
- Adoption of the rules for changing energy suppliers by REGAGEN.
With the establishment of the Energy Community, the EU has created preconditions for further expansion of the internal market to contracting parties, including Montenegro. Coordinated allocation of cross-border transmission capacities at the regional level represents a very important aspect of regional market establishment. To ensure a transparent allocation of free capacities in coordinated procedures in the regions, the South East Europe Coordinated Auction Office (SEECAO) was established in 2014. The SEECAO is based in Podgorica, Montenegro, and its key task is to perform an explicit allocation of cross-border transmission capacities between TSOs of Greece, Turkey and all Western Balkan countries, except Serbia. In 2017, more than 100 Auction Participants were registered with SEECAO.
Electricity generationThe EPCG dominates the electricity generation sector and operates the following facilities:
- Two HPPs, Perucica and Piva, with total installed capacity of 649 MW;
- Pljevlja TPP with total installed capacity of 218.5 MW;
- 5 small HPPs with total installed capacity of 2.45 MW.23
In 2017, beside the EPCG facilities, electricity was produced by another 14 small HPPs, with a total install capacity of 29.5 MW, and the Krnovo wind power plant, with an installed capacity of 72 MW. Montenegro is committed to creating a favourable investment climate for investments in renewable energy sources (RES). The Government’s efforts have had mixed results with success in attracting investment for distributed renewable energy and setbacks for new large hydro and thermal plants. The Ministry of Economy introduced a system of incentives in 2011 for the generation of energy from RES which attracted considerable investment over the last few years (see Chapter 6).
23 http://regagen.co.me/cms/public/image/uploads/20180223_Analiza_udjela_OIE_2017.docx.pdf (accessed June 2018)

74
In-Depth Review of the Energy Efficiency Policy of Montenegro | 2018
In addition to developing small HPPs, the Government of Montenegro also developed plans for the construction of two large power plants: HPP Morača (238 MW) and TPP Pljevlja II (225 MW). However, the Government’s tender process has not yet been successful in attracting investment.
The Energy Development Strategy of Montenegro until 2030 also recognises the potential for the implementation of other large electricity generation projects, but they are at a lower level of readiness in comparison with the aforementioned projects for different reasons, e.g. environmental issues, impact on protected areas (national parks) and issues with international waters, etc.
Electricity transmissionThe transmission network of Montenegro is characterised by a radial structure on three voltage levels. CGES is the sole TSO in Montenegro, providing services through the grid on 400 kV, 220 kV and 110 kV voltage levels. The transmission grid is composed of over 1,300 km of overhead lines, 24 substations and switchgears on respective voltage levels. The operation of Montenegro’s power system is managed by the National Dispatching Centre (NDC), which uses Supervisory Control and Data Acquisition (SCADA) to manage, control and optimise the system in real time. Electricity from the transmission grid is taken off by the DSO and by large consumers connected to the transmission grid such as Kombinat Aluminijuma Podgorica AD – KAP, Steelwork Niksic and JSC Railways Infrastructure Podgorica.
There exist good connections with neighbouring power systems (B&H, Serbia, Albania and Kosovo) that effectively support the reliability of Montenegro’s power system. CGES provides services supporting significant electricity exchanges between systems in the region. In 2016, CGES transited 2.61 TWh to neighbouring countries, representing 45% of the total electricity transferred by the national transmission system.24 Montenegro evidently plays an important role as an electricity transit country, and this is set to continue.
Significant development of the transmission network in South East Europe is currently underway, involving construction of an undersea cable between Italy and Montenegro and improved interconnection across the region. This will lead to a significant increase in electricity flows across the South East region towards Italy and will likely engender improvements in the quality of the internal electricity network of the countries of the region, as well as potentially enabling higher utilisation of variable RES.
The construction of the HVDC cable from Italy to Montenegro, with a capacity of 600 MW, is scheduled to be completed in the beginning of 2019. The full operation of the cable is expected to be achieved after the necessary reinforcements of both internal transmission lines in Montenegro (under construction) and interconnections from Montenegro to the neighbouring systems in B&H and/or Serbia (in the preparatory phase). The total capacity of the undersea cable is planned to be increased to 1,200 MW within the next five years.
It should also be mentioned that following the positive opinion of the Energy Community Secretariat, in April 2018, the REGAGEN issued a decision certifying that the CGES is fully independent from energy undertakings carrying out activities on electricity generation and supply and therefore is entitled to carry out cross-border transmission of electricity.
24 Operating statements of CGES for year 2016, http://www.cges.me/en/documents/reports?download=125:operating-statements-for-the-year-2016 (accessed June 2018)

75
3. Market Structure for Electricity, Natural Gas and Heat
Electricity distributionThere is only one electricity distribution system operator in Montenegro – CEDIS Ltd – that operates the network at 35 kV, 10 kV and 0.4 kV voltage levels. The network is mainly based on two levels of transformation, 35/10 kV and 10/0.4 kV, but there are also 35/6 kV and 35/0.4 kV transformers that are used to meet the needs of industry and sparsely populated areas.
The development of the distribution network in Montenegro has been rather challenging in recent years due to intense building construction, especially in Podgorica and the coastal region of Montenegro. This has stressed the electricity distribution system as it has been unable to adequately respond to the increasing demand for electricity connections and supply in these areas. This is consistent with the World Bank’s Ease of Doing Business assessment, which identified that complicated and time-consuming procedures to get an electricity connection exist in Montenegro and that the cost of electricity in comparison to income per capita is high (see Section 1.2.). An additional challenge for the distribution network is the connection of small HPPs (with an installed capacity above 1 MW) in the Northern region of Montenegro to the grid, as the capacity of existing power lines is insufficient, and additional network investments are needed.
3.2 Natural Gas and HeatThere exist no natural gas or heat markets in Montenegro as the country does not have access to natural gas, and only micro district heating systems are available in the country (see Sections 2.4 and 2.5).

76
In-Depth Review of the Energy Efficiency Policy of Montenegro | 2018
Summary: Market Structure for Electricity, Natural Gas and Heat
There exists no natural gas or heat markets in Montenegro as the country does not have access to natural gas, and only micro district heating systems are available in the country.
As part of the accession process to the EU, Montenegro is taking steps towards joining the EU’s single and integrated energy market. Progress has been made in transposing and implementing EU law for the electricity market, in accordance with Montenegro’s commitments under the Energy Community Treaty. The electricity market structure was vertically integrated until 2009, and the electricity distribution and transmission networks were legally unbundled from electricity generation and supply in 2009 and 2016, respectively.
EPCG is the dominant electricity generation company in Montenegro, responsible for the operation of the three large state-owned generating plants – two hydropower plants (627 MW) and one thermal power plant (218 MW) – as well as 5 small HPPs (2.45 MW). The Government’s efforts to expand the country’s electricity generation capacity have attained mixed results, with success in attracting investment small hydro and wind and setbacks for new large hydro and thermal plants.
The electricity market is gradually being opened for different consumers, and since January 2015, all consumers can chose their supplier. The Energy Regulatory Agency (REGAGEN) has issued five licences for suppliers to operate in the electricity market, but still, households and small consumers continue to be supplied by EPCG.
Montenegro’s electricity transmission network, consisting of 1,300 km of overhead lines and 24 substations, has a radial structure on three voltage levels: 400 kV, 220 kV and 110 kV. CGES, the sole TSO, is responsible for maintaining and operating the transmission network, while the operation of Montenegro’s power system is managed by the National Dispatching Centre (NDC). CGES supports significant electricity trade with neighbouring power systems (B&H, Serbia, Albania and Kosovo). Further market integration will be enhanced with the construction of an HVDC cable from Italy to Montenegro with a capacity of 600 MW, scheduled to be completed in 2019. Additional network reinforcements and interconnections will be necessary before the capacity of the undersea cable can be fully utilised. Allocation of cross-border transmission capacities between the TSOs of Montenegro and other Balkan countries (except Serbia), Greece and Turkey is facilitated by SEECAO, based in Podgorica and established in 2014. As of 2017, SEECAO had more than 100 registered auction participants.
Montenegro has one DSO, CEDIS, which operates the network at 35 kV, 10 kV and 0.4 kV voltage levels. In recent years, the electricity distribution system has struggled to meet increasing customer demand resulting from intense construction of buildings and infrastructure, especially in Podgorica and the coastal region of Montenegro. Connecting additional small HPPs (with an installed capacity above 1 MW) in the Northern region of Montenegro is also a challenge due to network capacity constraints.

4. Energy-Pricing Policy

78
In-Depth Review of the Energy Efficiency Policy of Montenegro | 2018
4. Energy-Pricing Policy Montenegro’s Energy Regulatory Agency (REGAGEN) is an independent regulatory body with responsibilities in the field of energy, including electricity, natural gas, oil/petroleum products and heat energy. REGAGEN also has responsibility for regulating public utilities managing water supply and municipal wastewater (see Section 5.4).
The legal basis for the regulation of DSO and TSO is the Law on Energy, which is harmonised with the relevant EU acquis and was adopted in 2016, repealing the previous law, which had been adopted in 2010. The law stipulates that tariffs for end-users should also reflect actual costs, including operational costs, depreciation and return on assets of TSO and DSO. According to the Law on Energy, REGAGEN is responsible for developing and implementing the methodologies for determining the allowed revenue for the DSO, TSO and the market operator, which includes treatment of the allowed level of losses to be included in tariffs for the end-user. REGAGEN also determines the rules regarding the quality of electricity supply.
4.1. Electricity TariffsIn accordance with the Energy Law, from January 2015, wholesale electricity (and gas) prices are freely established for all consumers through the organised market or bilaterally in contracts between sellers and buyers. 2016 was the last year when the retail price of electricity supplied by EPCG was regulated, because, according to the previous Law on Energy, the EPCG, as the incumbent supply company, had the status of the Public Supplier. The structure of the electricity tariffs applied in 2016 to consumers connected at 0.4kV, 10kV and 35kV voltage levels (i.e. not energy-intensive industry, at 110kV) is presented in Figure 17.
Figure 17: Structure of electricity tariffs in 2016, €c/kWh
0
2
4
6
8
10
12
14
VAT Supply DSO TSO Energy
0.4
kV N
on‐h
ouse
hold
s, da
y&ni
ght t
ari�
s
0.4
kV H
ouse
hold
s, da
y&ni
ght t
ari�
s
0.4
kV H
ouse
hold
s, sin
gle
tari�
0.4
kV N
on‐h
ouse
hold
s, sin
gle
tari�
0.4
kV N
on‐h
ouse
hold
s w
ith p
ower
mea
sure
men
t, da
y&ni
ght t
ari�
s10 kV
35 kV
RES fee Electricity market operator Losses (DSO) Losses (TSO)
Source: Energy Charter Secretariat based on REGAGEN, 2018

79
4. Energy-Pricing Policy
How electricity tariffs varied from 2007 to 2016, since their regulation by REGAGEN beginning in 2007, is presented in Figure 18. The most significant change is evident for small, non-household tariffs in 2010 when cross-subsidies between consumer categories were abolished.
Figure 18: Electricity tariffs for the period 2007-2016, without VAT, €c/kWh
4
6
8
10
12
14
16
18
10 kV0.4 kV Non‐households, single tari� 0.4 kV Households, single tari�
35 kV0.4 kV Households, day&night tari�s 0.4 kV Non‐households, day&night tari�s
0.4 kV Non‐households with power measurement, day&night tari�s
Source: Energy Charter Secretariat based on REGAGEN, 2018
Regulatory changes applied to electricity tariff design are summarised in Table 2. A number of reforms were particularly significant to improving energy efficiency. One of the most important is that from 2012, the revenue cap methodology was applied to the setting of the utility’s allowed revenues. When total revenues are capped, an important incentive for regulated utilities to increase energy throughput in order to increase revenues is removed. Another important factor is that since 2011, following the relevant court decision, REGAGEN has set the level of allowed losses that can be included in the final electricity price.

80
In-Depth Review of the Energy Efficiency Policy of Montenegro | 2018
Table 2: Major changes of the Montenegrin electricity tariff design, 2007-2018
Year Electricity price system changes
2007 start of the energy price regulation by the Energy Regulatory Agency (REGAGEN);allowed revenues are determined based on ‘cost-plus’ methodology
2009 final electricity prices are divided into explicit price components such as production, transmission, distribution and supplyopening of the electricity market for large consumers
2010 abolishment of cross-subsidies;network components are divided into sub-components: TSO charges, TSO losses, DSO charges & DSO losses (all losses)
2011 stop of electricity generation regulation on the basis of costs. Gradual approximation to the market prices is introducedintroduction of ‘allowed losses’ for TSO and DSO. Reduction of TSO and DSO losses com-ponents to the level of allowed losses. Only allowed losses can be included in end-users’ bills
2012 allowed revenues of TSO and DSO are determined based on ‘revenue cap’ methodology;electricity market operator fee is separated from TSO charges as a part of legal and func-tional unbundling of the market operator from TSO
2013 increase of the VAT from 17% to 19%
2014 introduction of ‘RES & cogeneration fee’ as a separate tariff component
2015 opening of the electricity market for all consumers
2016 allowed revenues for TSO and DSO are determined based on ‘hybrid’ methodology
2018 increase of the VAT from 19% to 21%
Source: Energy Charter Secretariat, based on information provided by the Ministry of Economy and REGAGEN, 2018, and Technical Assistance to Develop Policy Guidelines for the Distribution Network Tariffs, Energy Community, 2017
http://ec.europa.eu/eurostat/statistics-explained/index.php/Electricity_price_statistics
4.1.1. Energy Component of Electricity TariffsSince January 2015, wholesale electricity prices are freely established through the organised market or bilaterally in contracts between sellers and buyers. However, transitional provisions of the Law on Energy, i.e. Article 249, stipulate transitional provisions related to capping the growth of electricity prices for households and small consumers supplied by EPCG until the establishment of the liquid electricity market. The restriction is implemented only to ‘suppliers’ who, by the date at which the new law came into force, had the status of ‘public supplier’ through a price cap based on the weighted electricity prices index to the reference energy market,25 but cannot exceed:
- 7% in 2017;
- 6% in 2018 and 2019.
All components of electricity tariffs – that is, charges or rates relating to networks, energy, fees, taxes, etc. – are presented to the customer in a single bill via the electricity supplier, i.e. EPCG.26
25 Hungarian Power Exchange (HUPX) was chosen as a reference energy market for the requirements of this law by the REGAGEN. 26 See the following websites for sample bills provided by the EPCG: https://www.epcg.com/en/households/explanation-individ-
ual-items-bill (accessed June 2018) and https://www.epcg.com/en/households/explanation-individual-items-bill-backside# (ac-cessed June 2018)

81
4. Energy-Pricing Policy
Application of the different components varies by consumer category, as shown in Table 3. The current electricity retail tariffs, by component charges and by consumer category, are available in Annex 1.
Table 3: Components of the electricity retail tariff applied to consumer categories, 2018
Tariff component Unit Industry Non-house-holds Households
Active energy (day & night price) €c/kWh + + +
Active energy (single price) €c/kWh + +
Reactive energy, (day & night price) €c/kVArh + +Network variable demand charge €c/kW + + +
Network fixed charges €/customer + +
Network losses (day & night price) €c/kWh + + +
Network losses (single price) €c/kWh + +
Market operator fee €c/kWh + + +
RES & cogeneration fee €c/kWh + + +
Source: Energy Charter Secretariat, based on the decision of the EPCG No 50-00-14910, dated 14.12. 2017, http://ec.europa.eu/eurostat/statistics-explained/index.php/Electricity_price_statistics
While respecting the price cap mentioned above, EPCG is responsible for passing through the energy charge to electricity consumers based on its energy purchasing costs, although it can structure this charge as it chooses. At present, EPCG offers both single and day/night rates for active energy to all consumer categories (industry, non-household, household) and for day/night rates for reactive energy to non-households and industry.
4.1.2. Network Component of Electricity Tariffs
DSO & TSO network chargesAllowed revenues and prices for the use of electricity transmission and distribution systems are determined by a hybrid revenue cap and price cap methods approved by the regulator on July 7, 2016.27 The methodologies are based on principles intended to improve transparency and non-discriminatory access, to facilitate trading and competition, to create favourable investment conditions and avoid cross-subsidies, to reduce costs and to encourage improvement of the efficiency. As for the latter, both methodologies include the efficiency factor (X), which is calculated as a sum of the following sub-factors:
- X1 – inefficiency sub-factor which is calculated as a correlation of actual and approved costs for the previous regulatory periods;
- X2 – efficiency sub-factor that includes application of new technologies (constant value of 0.005).
27 http://regagen.co.me/cms/public/image/uploads/CGES_METODOLOGIJA_ZA_RDP_precisceni_tekst3.pdf (accessed June 2018)

82
In-Depth Review of the Energy Efficiency Policy of Montenegro | 2018
For 2016, REGAGEN set the same inefficiency sub-factor (X1) of 0.0025 for the TSO and DSO.28 For 2017–2019, REGAGEN calculated the following inefficiency sub-factor (X1) for TSO – 0.0131 and for DSO – 0.0117. Table 4 summarises the calculation of the efficiency factor (X) according to the existing methodologies for determining TSO and DSO regulatory allowed revenues and prices.
Table 4: Calculation of efficiency factors for system operators in 2016-2019
Operator Year Inefficiency sub-factor (X1)
Efficiency sub-factor for the
application of new technologies (X2)
Efficiency Factor X= (X1+X2)
TSO2016 0.0025 0.005 0.0075
2017-2019 0.0131 0.005 0.0181
DSO2016 0.0025 0.005 0.0075
2017-2019 0.0117 0.005 0.0167
Source: Energy Charter Secretariat Based on information provided by the REGAGEN, 2018
Thus, according to the methodologies, both TSO and DSO were incentivised to improve the efficiency of their activities and reduce their operational costs by 0.75% in 2016. In 2017–2019, the TSO should reduce its operational costs by 1.81% and DSO by 1.67% per year. The methodologies also include the adjustment of the costs to the annual inflation index.
DSO & TSO lossesThe treatment of electricity losses was changed several times over the last decade, but the major changes were related to the losses at the distribution level. At the beginning of ERA’s price regulation in 2007, the existing (baseline) situation was respected, and consumers payed the costs of all losses, including 22.8% of distribution losses (technical and non-technical) (Figure 19). In the same year, REGAGEN determined the gradual reduction of losses in the DSO tariff to the level of 11% in 2011, out of which 9% referred to technical and 2% to commercial (non-technical) losses.
28 For 2016, X1 factor was set as a half of IPC index. IPC index is a weighted average projected growth of consumer prices in Monte-negro for all calendar years in which the regulatory years begin, and which are published in the document of the economic policy guidelines for the year in which the regulatory period begins. For the first regulatory period, the IPC is determined on the basis of the Economic Policy Guidelines for 2012.

83
4. Energy-Pricing Policy
Figure 19: Dynamics of electricity losses in 2007-2017, % to input
2.65 2.59 2.56 2.55 2.60 2.45 2.10 1.77 2.28 2.03 2.26
2.26 22.97 22.79
19.99 19.1920.84
18.9617.65 17.11
15.61 14.96
0.00
5.00
10.00
15.00
20.00
25.00
2007 2008 2009 2010 2011 2012 2013 2014 2015 2016 2017
TSO (total)* DSO (total)
*TSO (total) include losses from (i) transit energy and (ii) electricity delivered to consumers in Montenegro. This indicator can be also used for benchmarking with other systems in Europe outlined in 2017 CEERs Report on Power Losses, available at https://www.ceer.eu/documents/104400/-/-/09ecee88-e877-3305-6767-e75404637087
Source: REGAGEN, 2018
As outlined in Table 2 the REGAGEN divided network components into sub-components: TSO charges, TSO losses, DSO charges and DSO losses (all losses) in January 2010. At that point in time, DSO non-technical losses were still included in the DSO losses component. However, the Ombudsman’s office of Montenegro submitted the claim to the Constitutional Court and requested to exclude the non-technical losses from the losses component. On 10 February 2011, the Constitutional Court made a final decision that REGAGEN had gone beyond its mandate by introducing the costs of the network losses as a new charge and ordered REGAGEN to exclude non-technical losses linked to the electricity theft from the calculation of the retail price.29
In 2011, respecting the Court’s decision, the regulator adapted the methodology for determining the revenue of the TSO and DSO. Namely, since 2011, the regulator has been recognising the costs incurred only due to technical losses. For TSO, the allowed level of losses30 was calculated on a historical basis (i.e. as an average of previous three years) until 2017 and, according to a study prepared by the TSO, for a new regulatory period:
- 3.66% for the period 01.08.2012–31.12.2014;
- 3.60% for 01.01.2015–31.12.2016;
- 3.73% for 01.01.2017–31.12.2019 (according to the externally revised study).
For DSO, the level of allowed technical losses was set at 9% according to a study carried out by the DSO. In the same year, REGAGEN also established some incentives for the DSO to increase
29 Technical Assistance to Develop Policy Guidelines for the Distribution Network Tariffs, Energy Community, 2017, https://www.energy-community.org/dam/jcr:fde76489-9cf4-4d56-83b3-47426e9ce609/Muratovic_tariffs_2017.pdf (accessed June 2018)
30 The TSO allowed losses include only losses related to the electricity transferred to national consumers only. The part of the TSO losses caused by cross-boarder transit are covered by other TSOs that are members of ENTSO-E under the ITC Mechanism (Inter-TSO-Compensation Mechanism).

84
In-Depth Review of the Energy Efficiency Policy of Montenegro | 2018
investments in the improvement of the distribution system that could target the reduction of losses, i.e. in addition to the applied rate of return on assets, DSO was also allowed to get returns on planned investments. In October 2013, the DSO also conducted a study titled “Reduction of Power Losses in the Electro-Distributing Networks of Montenegro”, which was submitted to REGAGEN for the technical justification for the DSO component.
The losses incurred in the transmission system resulting from electricity transmission for the needs of national customers amounted to 3.52% of gross consumption and therefore did not exceed the allowed level in 2017. The comparison of allowed technical and actual losses at the distribution level during April 2011–2018 is provided in Table 5.
Table 5: Comparison of allowed CEDIS (DSO) technical and actual losses during 2016-2018
Period Actual,% Allowed (technical),% Difference, pp
Apr.-Dec. 2011 19.19 9 -10.19
Jan.-Dec. 2012 20.84 9 -11.84
Aug.-Dec. 2012 20.84 9 -11.84
2013 18.96 9 -9.96
2014 17.65 9 -8.65
2015 17.11 8.43 -8.68
2016 15.61 8.43 -7.18
2017 14.96 8.43 -6.53
2018 - 8.43 -
Source: Energy Charter Secretariat Based on information provided by the REGAGEN, 2018
Table 5 illustrates that despite the general reduction of the losses, the CEDIS (DSO) has achieved a limited progress in reaching the allowed level of losses since 2011. Indeed, the CEDIS has had clear incentives to reduce its actual losses, as only allowed (technical) losses can be included in the electricity price for the end-users since April 2011. This approach resulted in additional costs for the DSO from €12 million in 2012 to €7.5 million in 2017, or more than €70 million in total during the period of 2011–2017.31 There is no publically available information about the additional revenue that the DSO received as a result of the regulatory incentive to increase investments targeting the reduction of losses from 2011–2017. In 2017, the first year after the unbundling from EPCG (see Section 3.1), CEDIS operated with profit.
DSO & TSO network qualityThe existing methodologies for determining the regulatory allowed revenues and prices for the use of electricity transmission and distribution systems do not stipulate any correlation between the quality of electricity supply and allowed revenues. However, in 2017, REGAGEN adopted the Rules on the Minimum Quality of Delivery and Supply of Electricity. The ‘quality of service’ provisions relating to minimum standards for issuance of the consent to connection of customers, timely notifying of supply interruptions, removal of supply interruptions, removal
31 The calculation of additional costs for the DSO is based on the difference between allowed and actual losses, average EPCG wholesale electricity prices and TSO charges in relevant periods from 01.04.2011 to 31.12.2017

85
4. Energy-Pricing Policy
of voltage variations, reconnection of customers and treatment of applications for control of proper operability of a measuring point, are applied in accordance with the Energy Law,32 and penalties will apply in the case of non-compliance from 2019 onwards.33
4.1.3. Other IncentivesAfter the retail electricity market was opened in 2015, the EPCG introduced a system of discounts for its customers. The discounts mainly serve to retain existing customers and encourage timely payment for the electricity supplied. EPCG established the following discounts for its supplied consumers, connected to the distribution system:34
- 13% of the price of active energy for households who do not have any outstanding electricity debts at the beginning of the calendar year, i.e. “golden customers”;
- 5% of the price for other regular customers;
- 3% for other small consumers consuming less than 30.000 kWh per year.
The 13% discount is relatively large, and most households will benefit from it, except those that exercise poor management of their finance and unfortunately those who may be genuinely suffering from energy poverty, particularly as they have no alternative suppliers to choose from (see Section 3.1). Those people not receiving the 13% discount essentially pay for the others receiving it. EPCG has recently launched a campaign, “Share the Burden”,35 to help indebted customers pay their bills, but energy efficiency support is not an aspect of this campaign. Subsidies are, however, available for consumers defined as ‘vulnerable’.
4.2. Subsidies for Vulnerable Consumers The Government’s practice of subsidising electricity bills for vulnerable consumers began in 2007. In recent years, the number of consumers eligible to receive subsidies has increased by almost 50%, and the total amount of subsidies awarded has increased by almost 70% (Table 6). The Government of Montenegro spent approximately €15 million on energy subsidies from 2011–2016, with €3.31 million of this being paid in 2016. In 2016, the number of households receiving subsidies reached 20,318, representing 7.6% of all households. The Law on Energy36 sets down the provisions for the protection of vulnerable customers who are eligible for electricity subsidies provided by the Government. This law envisages the adoption of secondary legislation which defines more detailed criteria for determining vulnerable electricity customers and the amount of the subsidy, as well as the restriction for the use of the subsidy.
As of June 2018, the draft Government Decree On the supply of electricity to vulnerable consumers identified eight groups of consumers that can be categorised as vulnerable, i.e. users of state welfare assistance, disabled people, combat veterans and unemployed persons. According to the information provided by the Ministry of Economy, the Decree is expected to be adopted by the end of 2018.
Until the adoption of this Decree, electricity consumers who can be categorised as ‘vulnerable’ have been determined on an annual basis by the Ministry of Labour and Social Welfare. According to the existing methodology, vulnerable consumers receive the following subsidies:
32 Official Gazette of Montenegro 5/201633 Official Gazette of Montenegro 50/201734 Decision of the Board of Directors of the EPCG #10-00-68775 dated Nov 16, 201635 See EPCG website: https://www.epcg.com/en/households/share-burden-4 (accessed June 2018)36 Official Gazette of Montenegro 5/2016

86
In-Depth Review of the Energy Efficiency Policy of Montenegro | 2018
- for electricity bills less than €60 per month (approximately up to 500 kWh/month), eligible [consumers or households] receive a subsidy equating to 40% of the electricity bill;
- for electricity bills over €60 (more than 500 kWh/month), eligible [consumers or households] can receive the maximum subsidy of €24.
Table 6: Amount of annual subsidies for consumed electricity allocated to socially vulnerable consumers
2011 2012 2013 2014 2015 2016
Number of households eligible for receiving subsidies (recorded in December)
13,724 N/A N/A N/A N/A 20,318
Total amount of subsidies (€)
1,967,922 1,924,109 2,374,287 2,593,337 2,854,539 3,312,556
Source: Ministry of Economy, 2018
4.3. Taxes and Other Charges
ElectricityAs of June 2018, electricity prices for all consumers included the following taxes and charges:
- VAT at 21% since January 2018 (from July 2002, 17%; from July 2013, 19%);
- RES fee of 0.47 €c/kWh since January 2017 (approved by the Government on an annual basis, i.e. 2014 – 0.00652 €c/kWh, 2015 – 0.046239 €c/kWh, 2016 – 0.058715 €c/kWh);
- Market operator fee of 0.0152 €c/kWh.
Comparison of electricity prices for households in the EU and Energy Community (Figure 20) shows that the share of taxes and charges in Montenegro’s electricity prices is relatively low. Many EU countries tend to apply charges to final prices in order to recoup regulatory costs, such as those relating to renewable energy support schemes or capacity remuneration mechanisms. Deciding whether and how such additional costs are allocated to electricity tariffs requires consideration of factors such as impact on competition, fairness for consumers, impact on vulnerable consumers and the need to achieve efficient price signals from a policy perspective.

87
4. Energy-Pricing Policy
Figure 20: Electricity prices for household consumers with tax and VAT, first half 2017, €/kWh
0.35
0.30
0.35
0.30
0.35
0.30
0.35
Ukr
aine
Koso
vo
Alb
ania
Bulg
aria
Mon
tene
gro
Mol
dova
Turk
ey
Lith
uani
a
Hun
gary
Croa
tia
Rom
ania
Esto
nia
Mal
ta
Slov
akia
Czec
h Re
publ
ic
Pola
nd
Net
herla
nds
Finl
and
Latv
ia
Icel
and
Slov
enia
Luxe
mbo
urg
Nor
way
Fran
ce
Liec
hten
stei
n
Uni
ted
King
dom
Cypr
us
Gre
ece
Swed
en
Aust
ria
EU-2
8
Italy
Euro
are
a
Port
ugal
Spai
n
Irela
nd
Belg
ium
Ger
man
y
Den
mar
k
Bosn
ia a
nd H
erze
govi
na
Serb
iaFo
rmer
Yug
osla
v Re
publ
ic o
f Mac
edon
ia
Without taxes Other taxes VAT
*This designation is without prejudice to positions on status, and is in line with UNSCR 1244 and the ICJ Opinion on the Kosovo Declaration of Independence.
Source: Eurostat (online data code: nrg_pc_204), 2018, http://ec.europa.eu/eurostat/statistics-explained/index.php/Electricity_price_statistics
FuelsAs of June 2018, the following taxes and other charges are applied to fuel prices:37
- VAT at 21% since January 2018 (from July 2002, 17%; from July 2013, 19%);
- Port Tax – approximately 0.0009 €/litre;
- Excise – from 0.17 to 0.549 €/litre depending on the type of fuel.
In total, fuel taxes and excises account for 54% to 72% of the retail fuel prices (Figure 21).
Apart from the aforemention taxes, the Montenegrin legislative framework envisages other taxes and charges that are currently introduced at the level of 0.00 €/litre for all types of fuel:
- Customs duties;
- Weight tax;
- Eco tax
- Fee for highway construction and financing of representative sport.
37 According to the information provided during the Peer Review mission in June 2018

88
In-Depth Review of the Energy Efficiency Policy of Montenegro | 2018
Figure 21: Structure of retail fuel prices in May 2018, €/litre
.000
.200
.400
.600
.800
1.000
1.200
1.400
Gazoline 98 Gazoline 95 Euro diesel Extra LightFuel Oil
VAT, 21% Port taxExcise
Source: Ministry of Economy, 2018 http://www.cges.me/en/about/electrical-transmission-system/overhead-line-network
4.4. Emissions TradingIn Montenegro, the draft Law on Industrial Emissions, which is currently in the process of adoption, transposes the relevant EU legislation framework relating to the EU ETS and envisages the development of a specific implementation plan for energy-intensive companies such as Kombinat Aluminijuma Podgorica (KAP). The responsible body for the implementation of the draft Law is the Ministry for Sustainable Development and Tourism. Importantly, emissions trading can yield an important source of revenue for the Government of Montenegro, which can be used to support energy efficiency improvements, including in energy-intensive industry.

89
4. Energy-Pricing Policy
Summary: Energy-Pricing Policy
The Montenegrin energy price policy underwent major reforms over the last decade, including the establishment of the regulator, abolishment of cross-subsidies, introduction of explicit price components and the opening of the electricity market for all consumers.
According to the Law on Energy, the Energy Regulatory Agency (REGAGEN) is an independent regulatory body responsible for regulating energy sectors. 2016 was the last year when the retail price of electricity supplied by EPCG was regulated, because, according to the previous Law on Energy, the EPCG, as the incumbent supply company, had the status of the Public Supplier. Until the establishment of a liquid electricity market, the Law on Energy envisages transitional provisions related to capping the growth of electricity price for households and small consumers supplied by the EPCG.
The determination of allowed revenues and prices for TSO and DSO is based on a hybrid regulatory method (which combines the revenue cap and price cap methods) approved by the regulator in July 2016. Both methodologies include the efficiency factor (X) aiming to incentivise the reduction of operational costs and application of new technologies. According to the calculated X factors, from 2017–2019, the TSO is obliged to reduce its operational costs by 1.81% and DSO by 1.67% per year.
In 2010, network charges were divided into the following tariff components: TSO charges, TSO losses, DSO charges and DSO losses, where the latter included actual DSO losses (including commercial losses). Following the decision of the Constitutional Court, REGAGEN introduced a ‘technical losses only’ approach, and consequently decreased the DSO losses component in April 2011. This approach represents a clear incentive to reduce losses and resulted in the additional costs for the DSO from €12 million in 2012 to €7.5 million in 2017, or more than €70 million in total from 2011 to 2017. In 2011, REGAGEN also introduced incentives to invest in the measures targeting the reduction of losses. However, there is no publically available information about the additional revenue that the DSO received as a result of this regulatory incentive during the period of 2011–2017. In 2017, the first year after the unbundling from EPCG, CEDIS operated with profit.
Vulnerable consumers receive subsidies in the form of 40% subsidy for electricity bills up to 60 €/month or €24 for electricity bills over €60. During the period of 2011–2016, the number of consumers eligible to receive subsidies increased by almost 50%, and the total amount of subsidies awarded increased by almost 70%. In 2016, €3.31 million was paid to vulnerable consumers living in 20,318 households, representing 7.6% of all households. In total, the Government of Montenegro spent approximately €15 million on energy subsidies in 2011–2016.
As of June 2018, electricity tariffs include 21% of VAT and an RES fee of 0.47 €c/kWh. Fuel taxes represent from 54% to 72% of the retail fuel prices, including VAT (21%), port tax (app. 0.0009 €/litre) and excise (from 0.17 to 0.549 €/litre depending on the fuel type).


5. Energy and Energy Efficiency Policy

92
In-Depth Review of the Energy Efficiency Policy of Montenegro | 2018
5. Energy and Energy Efficiency Policy
5.1. Strategic Framework Montenegro’s strategic documents in the energy field take into account international and regional commitments. Montenegrin energy policy follows the principles of the EU’s energy policy through the country’s accession to the EU, as well as the country’s obligations to transpose the EU acquis communautaire as set out in the Energy Community Treaty. Montenegro is a contracting party to the UNFCCC as well as the Kyoto Protocol and is obliged to fulfil the obligations arising from these international commitments. Furthermore, the Montenegrin Parliament ratified the Paris Agreement in October 2017 and, by doing so, confirmed the intention of Montenegro to become a part of joint efforts to reduce global greenhouse gas emissions. This clearly has implications for the development of the country’s energy sector.
There are two main documents establishing the strategic framework for development of the country’s energy sector:
- Energy Policy of Montenegro until 2030 (adopted in March 2011),38
- Energy Development Strategy of Montenegro until 2030 (adopted in July 2014).39
Energy Policy of Montenegro until 2030The Energy Policy of Montenegro until 2030 is the main strategic document in the energy field which establishes three main priorities (Table 7) and twenty key strategic objectives, more than half of which are relevant to energy efficiency. The Energy Policy also stipulates that energy efficiency represents a priority in Montenegrin energy policy.
Table 7: Main priorities of the Montenegrin Energy Policy until 2030
Priority Meaning
1. Security in the energy supply
Permanent, secure, high-quality and diversified energy supply aimed to meet supply and demand;
2. Development of the competitive energy market
Securing a liberalised, non-discriminatory, competitive and open energy market on the basis of transparent conditions.Establishing competition in market activities (electricity and natural gas pro-duction and supply), basing price policy solely on market principles, as well as creating conditions for new energy undertakings to emerge (independent energy producers, suppliers, traders);
3. Sustainable en-ergy development
Securing sustainable development of the energy sector based on high level of deployment, but rational use of own energy resources in compliance with the principles of environmental protection, increased energy efficiency (EE) and increased use of renewable energy sources (RES), as well as meeting the socio-economic development needs of Montenegro.
Source: Energy Policy of Montenegro until 2030
38 Adopted by Government in 2011 - http://www.energetska-efikasnost.me/ee/uploads/file/Dokumenta/Energetska%20poli-tika%20Crne%20Gore%20do%202030.%20godine.pdf (accessed December 2018)
39 Adopted by Government Conclusion No. 08-1591/3 of 17 July 2014

93
5. Energy and Energy Efficiency Policy
Through its key objectives, the country’s energy policy recognises the importance of its energy system development as a part of wider regional and EU energy market developments and that this process is further supported by domestic and foreign investments. More intense exploitation of domestic energy resources (especially renewables), as well as the improvement of energy efficiency in all sectors of the economy, are recognised as priorities, and with the realisation of the commitments undertaken in these areas, Montenegro can become an important energy partner in regional and EU energy markets.
Energy Development Strategy of Montenegro until 2030The Energy Development Strategy until 2030 is based on the previous Energy Development Strategy until 2025, which was updated according to the priorities and strategic objectives of the Energy Policy of Montenegro until 2030 (see above). The periodic update of the state’s key strategic documents in the field of energy is an obligation arising from the Law on Energy. However, the legislative framework does not specify how often the update should be performed.
The Energy Development Strategy specifies:
- long-term development objectives and guidelines for the development of energy supply and meeting energy demand, while taking into account technological and economic criteria and environmental protection criteria;
- the development direction of energy infrastructure, taking into account possibilities for encouraging the use of renewable energy sources and increasing energy efficiency;
- long-term energy balance forecasts, timeline and methods to be used for tracking progress and monitoring the achievement of objectives, as well as the assessment of their effects on the economy;
- tentative financial resources for the implementation of the strategy.
The updated strategy has a chapter on energy efficiency that provides specific recommendations and guidelines for medium- and long-term programmes and measures. The overall objective of the strategy with regards to energy efficiency (EE) is the improvement of EE and the reduction of energy intensity in all sectors, from generation to final consumption of energy. This objective should be achieved through the strengthening of the legal and institutional framework and its further alignment with the Energy Community acquis, as well as through the implementation of targeted policies and projects. The strategy defines key recommendations on the supply side (electricity generation, district heating, smart grids and obligation schemes), as well as for all sectors on the demand side (households, services, buildings, industry and transport).
It should also be mentioned that the strategy defines long-term targets for the utilisation of renewable energy only. As for energy efficiency, the strategy does not define targets, but estimates potential energy savings according to three scenarios (see Section 9.1). Thus, there is only a short-term indicative energy saving target until 2018 that was officially set by the Government of Montenegro in April 201140 as partial fulfilment of the country’s commitments under the Energy Community Treaty. The indicative target represents 9% savings of final energy consumption compared with the final average energy consumption from 2002–2006 (See Section 5.3).
40 Official Gazette of Montenegro 48/2011

94
In-Depth Review of the Energy Efficiency Policy of Montenegro | 2018
5.2. Legal Framework for Energy EfficiencyThe main driving force for the development of Montenegro’s energy policy and its promotion of energy efficiency and increased use of renewable energy sources is the accession process of Montenegro to the EU, which is further facilitated by Montenegro’s membership in the Energy Community. As a contracting party to the Energy Community, Montenegro has concrete obligations for the harmonisation of its legal framework in the energy field with the relevant EU acquis, meaning that key EU Directives and regulations have to be transposed into the national legal framework.
In recent years, the Ministerial Council of the Energy Community adopted several decisions which introduced obligations for the transposition of the following EU directives in the field of energy efficiency:
- Directive 2012/27/EC on Energy Efficiency;
- Directive 2010/31/EC on the Energy Performance of Buildings;
- Directive 2010/30/EU on Energy Labelling of Energy Related Products (and a certain number of the accompanying regulations for specific groups of products);
Additionally, as a part of the EU accession process, Montenegro has also decided to transpose Directive 2009/125/EC, establishing a framework for the setting of ecodesign requirements for energy-related products as well as accompanying regulations for different product groups.
In response to these undertaken commitments, Montenegro has adopted two laws regulating energy efficiency, which are further elaborated on in this section:
- Law on Energy (adopted in January 2016)41 – regulating energy efficiency on the supply side;
- Law on Efficient Use of Energy (adopted in December 2014)42 – regulating energy efficiency on the final consumption side.
The further sections of this chapter contain a short overview of key elements of the legal framework, particularly:
- Law on Energy;
- Law on Efficient Use of Energy;
- Energy performance in buildings;
- Efficiency of energy-related products;
- Exemplary role of the public sector;
- Energy services;
- Energy efficiency in industry;
- Vehicle fuel efficiency;
- Mandatory reconstruction of administrative buildings;
- Energy efficiency obligation schemes;
- Financial incentives or tax concessions.
41 Official Gazette of Montenegro 5/2016 42 Official Gazette of Montenegro 57/2014 and 3/2015

95
5. Energy and Energy Efficiency Policy
Law on EnergyThe Law on Energy, adopted in 2016, regulates the generation, transmission and distribution of energy. The key energy efficiency provisions of the law are mainly related to the requirements of the Energy Efficiency Directive (2012/27/EU) on the promotion of improved efficiency in heating and cooling (Article 14), energy efficiency in network tariffs, priority access to the grid and priority dispatching of electricity produced from high-efficiency cogeneration (Article 15). The Law has transposed the main requirements of the directive, while further harmonisation is planned through bylaws to be adopted in coming years.
Law on Efficient Use of EnergyThe Law on the Efficient Use of Energy, adopted in 2014, replaced the previous Law on Energy Efficiency, mainly due to significant changes in the EU legal framework that had occurred since the adoption of the previous Law in 2010. The Law regulates the responsibilities for the introduction and the implementation of energy efficiency policy and measures in order to enable efficient energy consumption by end-users.
The text of the Law is compliant with the main EU directives in the field of energy efficiency, whereas the implementation of the Law is ensured through the adoption of bylaws. By March 2018, the Government of Montenegro had adopted about 40 bylaws on energy efficiency in buildings, energy efficiency of energy-related products, the exemplary role of the public sector and promotion of energy services, among others. A list of relevant bylaws developed according to the requirements of the Law on efficient use of energy is provided in Annex 2.
Energy performance in buildingsThe Law on Efficient Use of Energy introduces specific obligations related to energy performance of buildings, including energy audits, minimum energy efficiency requirements and energy performance certification. The provisions of the law and relevant secondary legislation acts represent the transposition of the requirements of the EU Energy Performance of Buildings Directive (Directive 2010/31/EU).
The Ministry of Economy, in cooperation with the Ministry of Sustainable Development and Tourism, has adopted a set of five rulebooks regulating this field in a detailed manner (development of the rulebooks was supported by the GIZ). However, as presented in Table 8, some provisions of the law, like energy certification and energy audits of heating systems, have not yet been fully implemented in practice.

96
In-Depth Review of the Energy Efficiency Policy of Montenegro | 2018
Table 8: Overview of the regulatory framework for energy efficiency in buildings in Montenegro as of June 2018
Title of the rulebook and the scope Status of implementation
The Rulebook on Minimum Energy Efficiency Requirements in Buildings43 (adopted in December 2015) defines the mini-mum requirements related to energy efficiency of buildings and the methodology of calculating energy performance of buildings.
Provisions for the compliance check of technical requirements (U-values, airtightness etc.) are in place at the design and the commissioning stages.
The Rulebook on the Energy Performance Certification of Buildings44 (adopted in December 2015) defines the certifica-tion process of buildings, energy classes of buildings, layout and content of the label, content of certificates and registry of issued certificates.
Implementation of energy certifica-tion of buildings has not yet begun due to the lack of the national software for the calculation of energy performance.
The Rulebook on Performing Energy Audits of Buildings45 (adopted in December 2015) determines the methodology for performing energy audits of buildings.
Trained capacities of the energy audi-tors are not fully used, because the process of building energy certifica-tion has not started.
The Rulebook on Regular Energy Audits of Heating Systems and Air-Conditioning Systems46 (adopted in December 2015) determines the manner and deadlines for performing regular energy audits of air conditioning systems of nominal power of ≥12 kW and for gas, liquid or solid fuel heating systems of nominal power of ≥20 kW.
Not implemented in practice because of poor law enforcement. Owners of the heating and air-conditioning systems do not follow prescribed deadlines for inspection.
The Rulebook on Procedures for Performing Training, Obtain-ing of Authorisation and Manner of the Managing of the Registry for Energy Audits Conducting47 (adopted in Decem-ber 2015) determines:- the training programme for energy audits of buildings and regular energy audits of heating systems and air condition-ing systems;- procedure of issuing authorisations to conduct energy audits;- authorisations to perform training programmes and exami-nation.
Demand for services provided by new energy auditors is not very high due to an underdeveloped market for such services.
Source: Energy Charter Secretariat
Efficiency of energy-related products The Law on Efficient Use of Energy stipulates the following policy measures for energy-related products:
- setting up minimum energy performance requirements for certain groups of products through the adoption of the ecodesign technical rulebooks;
- introduction of energy efficiency labelling for different groups of products.
43 Official Gazette of Montenegro 75/2015 44 Official Gazette of Montenegro 75/2015 45 Official Gazette of Montenegro 75/2015 46 Official Gazette of Montenegro 76/2015 47 Official Gazette of Montenegro 75/2015

97
5. Energy and Energy Efficiency Policy
Development of the bylaws for ecodesign requirements and energy efficiency labelling of products in Montenegro is based on the transposition of relevant EU regulations and providing the conditions for their implementation. As of June 2018, energy efficiency labelling bylaws had been adopted for six groups of products, mainly household appliances, while ecodesign rulebooks had been developed for 16 groups of products, also covering some industrial products, such as electric motors, water pumps and ventilators, among others (see Annex 2). The Government of Montenegro continues to work on the development of bylaws covering other groups of products.
Since 2016, the Administration for Inspection Affairs has been responsible for the market surveillance in the area of energy efficiency, but this process still requires permanent capacity building of the market inspectors in order to be in a position to cover the full range of energy-related products.
Exemplary role of the public sectorThe Law on Efficient Use of Energy stipulates a significant obligation for public entities, particularly for state administration bodies and local self-government units (Table 9). These obligations are further regulated by several bylaws describing: content of the planning document; manner of the reporting; content of the information system on energy efficiency; and instructions on the establishment of energy management systems and implementation of energy efficiency measures (see Annex 2 for the full list of rulebooks in this area).
Table 9: Obligation of public entities according to the Law on Efficient Use of Energy
State administration bodies’ obligations Local self-governments’ obligations- establishing energy management in buildings that
they use, - establishing energy management in build-
ings/facilities that they use/operate
- preparation of operational plans for energy ef-ficiency improvement
- preparation of three-year programmes for energy efficiency improvement,
- preparation of annual plans for energy ef-ficiency improvement
- implementation of energy efficiency measures- establishment of an information system on energy consumption - annual reporting on implemented measures and achieved results - annual reporting to the central information system on energy efficiency
Source: Energy Charter Secretariat based on the analysis of the Law on Efficient Use of Energy
In addition, the Law on Efficient Use of Energy requires the introduction of energy efficiency criteria in public procurement procedures for goods and services, as well as for purchasing and leasing buildings. This is further regulated by the adoption of the Rulebook on Methodology for Determining energy Efficiency Levels in Public Procurement Procedures48 (adopted in February 2016). However, its practical implementation is still pending due to the necessary capacity-building of officials responsible for public procurement, without which the proper introduction/evaluation of energy efficiency criteria in procurement procedures would not be possible.
48 Official Gazette of Montenegro 09/2016

98
In-Depth Review of the Energy Efficiency Policy of Montenegro | 2018
Regarding energy efficiency investments in public sector facilities, Montenegro has achieved significant progress. There are two ongoing projects aimed at the improvement of energy performance of buildings (mainly educational and healthcare facilities; to be expanded to administrative and social welfare facilities), which are coordinated by the Ministry of Economy, with a total value of investment of around €53.7 million (Table 10)49.
Table 10: Targeted projects for energy efficiency improvement in public buildings
Project title Energy Efficiency Project in Montene-gro (MEEP)
Energy Efficiency Program in Public Buildings (EEPPB)
Budget €17.5 mil (€11.5 mil – I phase + 6.00 mil – II phase) loan from International Bank for Reconstruction and Development (IBRD)
€36.183 million (€13.44 mil - I phase + €22.743 mil -II phase) loan + grant from KfW bank
Implementing institutions
Ministry of Economy (Directorate for Energy Efficiency), Ministry of Health, Ministry of Education, World Bank
Ministry of Economy (Directorate for Energy Efficiency), Ministry of Education, Ministry of Labor and Social Welfare, Property Administration, Ministry of Finance, KfW Bank
Implementa-tion time
2009 – 2023 2012 –2020
Reconstructed to date
25 facilities (9 educational and 16 health)
28 educational facilities
Source: Energy Charter Secretariat based on the data received by the Ministry of Economy
Despite all legal preconditions being met, it can be said that the implementation of energy efficiency measures in the public sector is not at the expected level, primarily due to the lack of capacity and the motivation of employees to achieve energy savings, as well as complex procedures for the allocation of budget funds for energy efficiency projects.
Energy servicesThe contracting of energy services is regarded positively in Montenegro for the implementation of energy efficiency projects, especially bearing in mind the current financial difficulties of local self-government units. However, the establishment of the framework for the performing of energy services is still in progress.
Provision of energy services in Montenegro is regulated by the Law on Efficient Use of Energy. With the aim of further regulating this field and developing the ESCO model of financing in Montenegro, the Ministry of Economy receives technical assistance from the project “Regional energy efficiency program in Western Balkans” (REEP), implemented by the European Bank for Reconstruction and Development (EBRD) in partnership with the Energy Community Secretariat and co-financed by the EU.50 The REEP initiative has supported the development of an adequate legal framework for the implementation of the ESCO concept in Montenegro and developed models of energy performance contracts for buildings, water supply systems and
49 EE projects in Montenegro - http://energetska-efikasnost.me/projekti/ (accessed December 2018) 50 http://www.ebrd.com/cs/Satellite?c=Content&cid=1395250338716&d=Mobile&pagename=EBRD%2FContent%2FContentLayo
ut (accessed June 2018)

99
5. Energy and Energy Efficiency Policy
public lighting. However, the implementation of pilot ESCO projects (which was also planned to be supported by EBRD) has not started due to the delay in the adoption of the Public–Private Partnership (PPP) Law, which should serve as a basis for procurement of energy services in the public sector. According to the information provided during the Peer Review Mission in June 2018, the adoption of the PPP Law is planned for the end of 2018.
Energy efficiency in industryThe Law on Efficient Use of Energy does not provide any specific requirements for the industrial sector, except specific reporting obligations for big energy consumers.51 The obligations for big companies include the mandatory registration of large energy consumers, annual planning of energy efficiency measures and reporting on implementation, as well as recording energy consumption. All these aspects are covered by the Rulebook on Methodology for Determining Annual Consumption of Primary Energy, the Content of the Energy Efficiency Improvement Plan and the Report on Implementation of the Plan of Large Consumers52 (adopted in December 2015).
However, despite the adoption of the legal framework, no specific results have yet been achieved, primarily due to the fact that large companies do not declare themselves as large consumers according to the requirements of the law. At the same time, the law neither allows the Ministry to identify automatically them based on statistical information, nor does it stipulate any fines for non-compliance.
The requirements for the introduction of mandatory energy audits of large enterprises envisaged by the Energy Efficiency Directive has still not been transposed into the Montenegrin legal system.
Vehicle fuel efficiencyThere are no CO2 emissions standards for cars and vans in Montenegro. Vehicle toxic emission standards are envisaged by the Law on Road Traffic Safety,53 adopted in 2012. Based on this law, the Ministry of Transport and Maritime Affairs adopted the Rulebook on Technical Requirements for Vehicles in 2015. The rulebook concerns those vehicles imported or placed on the market in Montenegro for the first time.54 The rulebook prescribes minimum toxic emission standards for new vehicles when imported to Montenegro to meet at least the EURO 5 engine standard and for used vehicles to meet at least the EURO 3 engine standard.
On the basis of the Law on Efficient Use of Energy, the Ministry of Economy also adopted a Rulebook on Energy Efficiency Labelling of Vehicles’ Tires and Other Essential Parameters55 (adopted in December 2017). This rulebook transposes requirements of the Regulation 1222/2009/EC, which regulates labelling of tires indicating the fuel efficiency class, wet grip class and external rolling noise class.
Mandatory reconstruction of administrative buildings Montenegro, as a member of the Energy Community, has an obligation to adopt a target for reconstruction of administrative buildings (Article 5). In response, the Government of Montenegro, in February 2016, adopted the decree on reconstruction of official buildings.56
51 According to the law, a large energy consumer is “a company whose activities are predominantly implemented in production sector, trade and service sectors, and whose total annual consumption of primary energy exceeds 10.000 MWh”.
52 Official Gazette of Montenegro 73/2015 53 Official Gazette of Montenegro 33/2012 and 58/201454 Official Gazette of Montenegro 5/201555 Official Gazette of Montenegro 90/2017 56 Official Gazette of Montenegro 09/2016

100
In-Depth Review of the Energy Efficiency Policy of Montenegro | 2018
The decree defines an annual level of reconstruction of 1% and prioritises buildings with the lowest energy performance. Additionally, in December 2016, the Government of Montenegro adopted a 3-year plan for reconstruction of administrative buildings that are owned by the state for the period of 2017–2019.57
The total useful area of buildings covered by the plan is 12,218 m2, or approximately 17% of the total floor area of all official buildings within the purview of the Property Administration (72,253 m2). Funds for the implementation of the plan are provided under Energy Efficiency Program in Public Buildings (EEPPB) project, which is financed by the KfW (Table 10)58.
Energy efficiency obligation schemesAccording to Article 7 of the Energy Efficiency Directive, Montenegro also has an obligation to introduce energy efficiency obligation (EEO) schemes. As of June 2018, Montenegro has only conducted preparatory activities, with technical assistance provided through the REEP project, implemented by the EBRD in partnership with Energy Community Secretariat and co-financed by the EU,59 which included:
- preparation of the feasibility analysis related to introduction of EEO schemes for suppliers/distributors of energy;
- assistance with the development of secondary legislation for EEO schemes;
- assessment of impact of the EEO scheme costs on stakeholders.
Financial incentives or tax concessionsFinancial support for the improvement of the energy efficiency of final consumers is rather limited, as no fund exists which could provide sustainable financing of such projects. However, the establishment of the Eco Fund is currently underway (see Chapter 7). Montenegro has not yet established tax measures to promote energy efficient technologies or products.
In previous periods, support was provided mainly to the residential sector through donor-funded projects (Table 11), which mainly targeted switching to more efficient RES technologies.
57 Adopted by Government Decision No. 08-3444 of 12 January 201758 EEPPB - http://energetska-efikasnost.me/projekti/ (accessed December 2018)59 http://www.ebrd.com/cs/Satellite?c=Content&cid=1395250338716&d=Mobile&pagename=EBRD%2FContent%2FContentLayo
ut (accessed June 2018)

101
5. Energy and Energy Efficiency Policy
Table 11: Energy efficiency projects intended to residential sector in Montenegro
Project title ENERGY WOOD MONTESOL SOLARNI KATUNI
Scope Interest-free credit line for installation of modern biomass heating systems in households
Interest-free credit line for installation of solar water heating systems in households
Installation of pho-tovoltaic systems in households residing on summer pasture lands
Budget I phase - €130.000 were provided from Luxem-bourg Development Agency; II phase - €240.000 is pro-vided from Norwegian GovernmentIII phase (ongoing) – 85.000 € provided form the state budget
1 million USD were provided from and Italian Ministry for Environment, Land and Sea (IMELS) for project implementation and management.
In total, 210,000 € were provided from the state budget which is used to subsidise 70-80% of the price of the PV system, while the participation of users was 20-30%
Implementing institutions
Ministry of Economy (Directorate for Energy Efficiency), Lux Develop-ment, local partner banks and companies
Ministry of Economy (Directorate for Energy Efficiency), United Na-tions Environment Pro-gramme (UNEP), IMELS and local partner banks and companies
Ministry of Economy (Directorate for Energy Efficiency), Ministry of Agriculture and Rural Development
Implementation time
2013–2018 2011– 2015 (cancelled by the donor)
2012, 2013, 2016
Results 1010 heating systems on modern biomass installed
145 solar water heating systems is installed
243 installed PV systems
Source: Energy Charter Secretariat based on the data received by the Ministry of Economy
Regarding regional initiatives which support the building sector, the Western Balkans (WB) Residential Green Economy Financing Facility (WB GEFF - Residential)60 aims to provide direct subsidies to the implementation of EE measures in the households in the WB region through local commercial banks. However, Montenegro still is not a part of the facility due to the low interest from the local banks in being included in the project.
5.3. National Targets and Action PlansMid-term and short-term planning in the energy field is provided through the following action plans:
- Action plan for the implementation of the Energy Development Strategy of Montenegro for the period 2016–2020;61
- Energy Efficiency Action Plan for 2016–2018;62
60 http://www.ebrd.com/work-with-us/projects/psd/western-balkans-geff-residential.html (accessed June 2018)61 Adopted by Government Decision No. 08-3177 of 21 January 201662 http://www.energetska-efikasnost.me/ee/ee.php?id=71&l=mn (accessed December 2018)

102
In-Depth Review of the Energy Efficiency Policy of Montenegro | 2018
- National Renewable Energy Action Plan to 202063 (see Chapter 6 for more details);
- Action plans by other authorities.
Action Plan for the Implementation of the Energy Development Strategy of Montenegro for the period 2016–2020The Action Plan (AP) for the implementation of the Energy Development Strategy of Montenegro for the period of 2016–2020 was adopted by the Government of Montenegro in January 2016. The main AP objectives are:
- identify and set up specific programmes and projects (including investments, regulatory measures, research and capacity building);
- define the preconditions and the implementation process with regard to activities, responsibility, timelines, financing, sources of funding, ecological and social effects;
- propose mechanisms for the AP implementation monitoring and follow-up.
The AP also identifies the main projects for energy efficiency improvement relating to the existing generation, transmission and distribution facilities (supply side) and key energy efficiency activities that are further explained in the Energy Efficiency Action Plan (EEAP).
Energy Efficiency Action PlansAdoption of three-year national Energy Efficiency Action Plans (EEAPs) is one of the requirements of Directive 2012/27/EU that was transposed into the Law on Efficient Use of Energy. This is currently the third action plan adopted by the Government of Montenegro.
The main objective of the EEAP is to define energy efficiency measures for achieving a national indicative energy savings target. The indicative target represents a planned savings of final energy consumption in country, which is expressed in absolute units in GWh or as a percent of the average final energy consumption. In order to meet this obligation, the Government of Montenegro adopted a Decision on Indicative Energy Savings Target64 in April 2011. The indicative target was set to an amount of 58.9 ktoe or 9% of final primary energy consumption of Montenegro and is established for a nine-year period, from 2010–2018.
The third Energy Efficiency Action Plan for 2016–201865 was adopted by the Government of Montenegro in June 2016. The existing EEAP takes into account the experience of implementation of the first and second EEAPs, as well as requirements of the updated EU directives. A short overview of the measures in the third EEAP per sector of final energy consumption is provided in Table 12.
The third Energy Efficiency Action Plan also contains information on the energy savings achieved by the implementation of the two previous EAAPs for the period of 2010–2015. It is calculated that 14.78 ktoe66 of the 33.0 ktoe intermediate indicative target for 2015 has been achieved by implementation of planned energy efficiency measures.
63 Adopted by Government Decision No. 08-2860/3 of 18 December 201464 Official Gazette of Montenegro 48/2011 65 Adopted by Government Decision No. 08-3177 of 21 January 201666 Achieved energy savings in 2015 were estimated only by using a “bottom-up” approach for individual measures. Application of a
“top-down” approach (which takes into account improvement from market) was not possible due to the unreliability of data from energy balances and will be implemented in future periods.

103
5. Energy and Energy Efficiency Policy
Table 12: Overview of the energy efficiency improvement measures from the 3rd EEAP
EE IMPROVEMENT MEASURES
Buildings- Improvement
of regulatory framework for EE of buildings
- Implementa-tion of building certification and regular energy audits of HVAC systems
Households- Implementa-
tion of energy labelling
- Financial sup-port for citizens for EE invest-ments
Services- Implementation
of EE criteria in public procure-ment
- Implementation of EE measures in public build-ings and utility companies of municipalities
- Financial sup-port to SME for EE investments
Transport - Development of
EE Action Plan in transport and implementation of pilot projects
- Infrastructural measures in the transport sector with the energy savings effects
Energy entities - Individual
metering and informative billing
Horizontal measures - Further development of legal and institutional framework for EE in Montenegro- Adoption of planning documents for energy efficiency- Establishment of statistical and monitoring system for EE- Establishment and development of energy management in all sectors- Information campaign for EE improvement- Improvement of education and application of professional training in the energy efficiency field
Source: Energy Charter Secretariat analysis based on the 3rd EEAP
Energy Efficiency Action Plans for the period 2019-2021As of June 2018, there were no national targets and action plans beyond 2018. In fact, Montenegro follows the requirements of the Energy Community, which is currently in the process of developing a new NEEAP template and recommendations for adopting EE indicative targets for the period of 2019–2021. As a part of this process, the Energy Community also considers the possibility of substituting NEEAPs with integrated National Energy and Climate Plans (NECPs) for the period of 2021–203067.
Energy efficiency planning by other authoritiesEnergy efficiency planning at the level of local self-governments (municipalities) is defined by the Law on Energy through ten-year local energy plans. In addition, local self-governments are required to prepare three-year programmes and one-year plans for improving energy efficiency that will consist of energy efficiency measures/actions in premises in which they perform functions, as well as to report to the Ministry of Economy on the results achieved on an annual basis.
The state national authorities are obliged to report on energy efficiency measures that they plan to implement in the coming year through an annual operational plan for energy efficiency improvement in public administration institutions, which is fully integrated into the single Annual Operational Plan for Energy Efficiency Improvement of State Authorities and adopted by the Government (Article 9 of the Law on Efficient Use of Energy).67 Energy Community, Climate Action Group (CAG) Work Programme 2017-2019

104
In-Depth Review of the Energy Efficiency Policy of Montenegro | 2018
5.4. Institutional Framework The Ministry of Economy (MoE), through the Directorate for Energy, Directorate for Energy Efficiency and Directorate for Mining and Geological Explorations, is responsible for developing and implementing energy policy. According to the Law on Energy and the Law on Efficient Use of Energy, the Ministry is also responsible for the preparation of strategic documents in the energy field, as well as for the development of the legal framework.
Figure 22 provides an overview of the structure of the ministry, as well as the composition of the departments responsible for energy policy.
Figure 22: Organisation of the Ministry of Economy with details on departments responsible for energy policy
Ministry of Economy
Directorate for Energy
Directorate for Energy E�ciency
Directorate for Miningand Geological
Researches
Department forEnergy Development
and Reform
Department forDevelopment and
Promotion of EnergyE�ciency
Department for Mining,Geology and
Hydrocarbons
Department forRenewable Energy
Sources
Department forPlanning and
Implementation ofEnergy E�ciency
Measures
Department forStrategic Oil Reserves
Department formonitoring and analysisof energy consumption
in public sector
Directorate forconcessions in the �eld
of mineral rawmaterials
Directoratefor Transformation
and Investments
Directorate for Industry and Entrepreneurship
Directorate for InternalMarket and Competition
Directorate for Development
Directorate for Developmentof National Brand andConsumer Protection
Directorate for Multilateraland Regional Trade
Cooperation and EconomicForeign Relations
Directorate for ElectronicCommunications, Postal
Services and Radio ‐ Spectrum
Source: Energy Charter Secretariat based on the data received from the Ministry of Economy

105
5. Energy and Energy Efficiency Policy
The Directorate for Energy Efficiency was established in November 2009 in the Ministry of Economy with an aim of implementing the energy efficiency policy of the country. Currently, the Directorate employs six full-time staff members, including a Director-General, and four consultants engaged on the projects for EE improvement in public buildings. The Law on Efficient Use of Energy provides the Ministry of Economy with the central role in the implementation of energy efficiency policy, with a wide scope of responsibilities, including (among others) the following:
- preparation of strategic and planning document;
- monitoring of achievement of indicative energy saving target;
- development of the regulator’s framework for EE;
- issuing authorisation for energy auditors;
- coordination of energy efficiency projects;
- promotion and international cooperation etc.
The Ministry of Economy is also responsible for energy system and policy modelling. However, due to the lack of capacity and resources in the ministry, this process is usually supported by the donor community. The review and update of strategic documents related to energy is mainly coordinated by relevant directorates within the ministry.
The Energy Regulatory Agency (REGAGEN) is the energy regulator of the country. REGAGEN was established in 2004 as an autonomous, functionally independent, non-profit organisation that carries out its public authorisations in the energy sector in accordance with the Law on Energy. Regulation is carried out in a non-discriminatory and transparent manner in accordance with EU directives. In addition, the Law on Energy specifies duties and responsibilities of REGAGEN in terms of its regulatory oversight of energy entities.
The Ministry of Sustainable Development and Tourism (MoSDT) is the governmental authority which is responsible for several areas that interact with development of the energy sector, particularly: spatial planning, construction, environmental protection and climate change. Inter-ministerial cooperation regarding activities such as adoption of spatial plans, construction of energy infrastructure or development of building codes is very important for the coherent development of the energy sector. The MoSDT is also responsible for the legal framework in the area of environmental protection as well as for the implementation of the UNFCCC, the Paris agreement and transposing the EU legislative framework on emissions standards and trading.
The Nature and Environmental Protection Agency is the governmental authority responsible for issuing environmental permits, i.e. Strategic Environmental Assessment (SEA) and Environmental Impact Assessment (EIA) forms.
The Chamber of Economy of Montenegro is a business association representing the general interests of the economy and all economic entities in Montenegro. The Chamber of Economy also actively presents business opportunities and encouraging investment in the Montenegrin economy, relevant to the development of the energy sector of the country. The Chamber also has an important role in the awareness raising of local economic entities in terms of new legal obligations and new business opportunities. This is particularly important for the implementation of the ecodesign and energy labelling framework in Montenegro where the Chamber is used as a channel to reach all interested parties (producers, suppliers, dealers,

106
In-Depth Review of the Energy Efficiency Policy of Montenegro | 2018
academic level, civil sector) in order to give them the opportunity to contribute to the process and to keep them informed.
The Administration for Inspection Affairs is an authority responsible for inspection affairs in different areas which are relevant for the implementation of the legal framework in the energy field, as well as investment in energy infrastructure. As regards energy efficiency policy implementation, the Administration for Inspection Affairs is a key player for ensuring compliance with the requirements for ecodesign and energy labelling, undertaking market surveillance of energy-related products which are put on the market in Montenegro.

107
5. Energy and Energy Efficiency Policy
Summary: Energy and Energy Efficiency Policy
The Ministry of Economy is responsible for Montenegro’s energy policy, which is based on the principles underpinning EU energy policy and transposition of the EU acquis communautaire as set out in the Energy Community Treaty. Montenegro’s energy policy also takes account of its status as a contracting party to the UNFCCC and the Kyoto Protocol and as a signatory of the Paris Agreement. The Energy Policy of Montenegro until 2030 (adopted in March 2011) sets out 20 key strategic objectives based on three priority areas: security in the energy supply; development of the competitive energy market; and sustainable energy development. The Energy Development Strategy of Montenegro until 2030 (adopted in July 2014) sets out the approach and measures to achieve the objectives of the energy policy.
Montenegro has concrete obligations to transpose key EU laws and regulations relating to energy efficiency into the national legal framework, including:
- Directive 2012/27/EC on Energy Efficiency;
- Directive 2010/31/EC on the Energy Performance of Buildings;
- Directive 2010/30/EU on Energy Labelling of Energy Related Products and accompanying regulations.
In addition to the obligations above, Montenegro also transposes Directive 2009/125/EC, establishing a framework for the setting of ecodesign requirements for energy-related products and accompanying regulations.
The Directorate for Energy Efficiency, under the Ministry of Economy, is responsible for energy efficiency policy through three departments that separately deal with development of the energy efficiency legal framework and implementation of energy efficiency measures. To transpose the aforementioned EU laws, Montenegro has adopted two main national laws regulating energy efficiency:
- Law on Energy (adopted in January 2016) – focused on efficiency in energy supply;
- Law on Efficient Use of Energy (adopted in December 2014) – focused on final consumption.
The Energy Development Strategy until 2030 defines long-term targets for the utilisation of renewable energy, but not for energy efficiency improvements. Instead, there exists only a short-term indicative energy saving target until 2018, representing 9% savings of the final energy consumption compared with the final average energy consumption from 2002–2006. Adoption of Energy Efficiency Action Plans (EEAPs) is one of the requirements of Directive 2012/27/EU, and Montenegro is now implementing its third Energy Efficiency Action Plan for 2016–2018, adopted in June 2016, which covers all end-use sectors, energy entities and horizontal measures.


6. Renewable Energy Policy

110
In-Depth Review of the Energy Efficiency Policy of Montenegro | 2018
6. Renewable Energy Policy
6.1. Background and Potential of Renewable Energy SourcesThe Energy Development Strategy until 2030 estimates the following potential for the utilisation of Renewable Energy Sources (RES) in Montenegro:
- theoretical hydro potential – 10.8 TWh/year and technical – 5 TWh/year;
- technical wind potential – approximately 900 GWh/yr;
- theoretical solar potential – 20 PWh/year.
The Energy Development Strategy until 2030 is dedicated to the promotion of RES utilisation, which is also in line with the priorities of the Energy Policy of Montenegro. According to the forecast energy balances and assumptions of the strategy, the total utilisation of RES is projected to be at the level of 509.4 ktoe and 572.6 ktoe in 2020 and 2030, respectively. The strategy sets out the projects for the following energy sources as follows:
- Biomass - 233.5 ktoe/year (~ 80% for heating purposes);
- Large HPPs - 225.4 ktoe/year;
- Small HPPs - 36.3 ktoe/year;
- Wind farms - 37.5 ktoe/year;
- Solar - 14.9 ktoe/year;
- Biofuels - 21.7 ktoe/year;
- Geothermal - 3.1 ktoe/year.
More detailed forecasts of RES utilisation are given in the National Renewable Energy Action Plan (NREAP),68 with the aim of reaching the RES target. For Montenegro, the national target for RES was determined by the Decision of the Ministerial Council of the Energy Community,69 establishing this target at a level of a 33% share of energy produced from RES in the gross final energy consumption until 2020. The share of energy from renewable sources in gross final consumption of energy reached 26.3% in 2009. Based on an estimated energy demand of 1002.5 ktoe for 2020, the amount of energy from renewables corresponding to the 2020 target would be 330.8 ktoe.
The forecast model for the NREAP made separate estimates for the electricity, heating/cooling and transport sectors, in comparison to 2009 as the base year, such that the three sectoral targets are 51.4% for electricity, 38.2% for heating and cooling and 10.2% for transport as regards share of renewable energy in 2020. The contribution of RES in 2020 based on these sectoral shares is projected to be 359.9 ktoe, corresponding to a share of renewable energy in gross final energy consumption of 35.9% (Table 13). According to Eurostat, Montenegro already surpassed the 33% target and reached the level of 41.5% in 2016.70 However, according to the Information on the Level of the Implementation of the National Renewable Energy Action Plan in 2016, adopted at the Government session on 02. February 2017, Montenegro achieved a 31.7% of share of RES in final energy consumption in 2016. According to the information provided by the Ministry of Economy, the identified difference is related to the methodologies
68 Adopted by Government Decision No. 08-2860/3 of 18 December 201469 In accordance with the Decision 2012/04/MC-EnC of 18 October 2012 of the 10th Ministerial Council of the Energy Community.70 Eurostat statistics based on European Environment Agency data
http://ec.europa.eu/eurostat/data/database?node_code=t2020_31 (accessed June 2018)

111
6. Renewable Energy Policy
for calculation of contribution of biomass to the RES target.71 According to the information provided by the Ministry of Economy, the share of RES is expected to reach 33% in the next reporting period that should be completed by the end of 2018 and will include 2016 and 2017 achievements.
Table 13: Contribution of RES in final energy consumption by 2020 (2009 base year), ktoe
2009 2017 2020
Electricity 144.9 184.2 216.4
Heating/cooling sector 61.2 114.7 121.5
Transport sector 1.3 15.2 22.0
Total 207.4 314.1 359.9
Source: Energy Charter Secretariat analysis based on the NREAP of Montenegro by 2020
NREAP also predicts that electricity generation from RES will increase by almost 50% in 2020 in comparison to the base year, and the following share of renewable energy sources is foreseen in new RES investments:
- 81.5% large and small hydropower plants;
- 13.8% wind power plants;
- 4% power plants on biomass;
- 0.7% solar power plants.
6.2. Renewable Energy Sources: Policies and MeasuresThe incentives for RES in Montenegro were introduced in 2010 by the Law on Energy. In 2016, the Law on Energy was updated to further facilitate the process of RES development in accordance with the requirements of Directive 2009/28/EC on the promotion of the use of energy from renewable sources. The 2016 Energy Law envisages some improvements and simplifications of procedures for RES project development, taking into account positive experiences of EU countries, as well as lessons learned from the previous experience of implementing RES projects by respective institutions and investors.
In addition to the promotion of renewable energy, the law also recognises the importance of the implementation of high efficiency cogeneration and envisages the possibility of introducing support schemes for both RES and high efficiency cogeneration. According to the Energy Law and adopted bylaws, the support scheme for electricity produced from renewable energy sources and high efficiency cogeneration includes the following:
- guaranteed purchase of electricity using “feed-in-tariffs” from privileged producers72 for a period of 12 years;
- priority in delivery of electricity generated into transmission or distribution systems;
71 The Ministry of Economy, EUROSTAT and MONSTAT used the same data for the calculation of the RES share in final energy con-sumption, but applied different calorific values for biomass.
72 Privileged producer means an energy undertaking that generates electricity from renewable energy sources or high-efficiency cogeneration and is entitled to the support scheme/incentive measures.

112
In-Depth Review of the Energy Efficiency Policy of Montenegro | 2018
- exemption from any payment related to imbalances, network charges and electricity losses for SHPPs connected to the distribution system.
According to the Law on Energy, the procedure for the implementation of RES projects is approved by the Ministry of Economy in two different ways, depending on the installed capacity:
- For installations greater than 1 MW of installed capacity, the Ministry of Economy organises tenders in accordance with the Law on Concessions and the Law on State Property. The entire procedure, data, information and analysis related to awarding concessions, as well as the obligations to be met by a concessionaire during the performance of concession activities, is defined in the Concession Act;
- For projects with installed capacity up to 1 MW or facilities for production/distribution of heat for district heating, there is a simplified procedure of issuing energy permits. The procedure is defined in the Rulebook On the Contents of the Request for Issuing an Energy Permit and the Content of the Energy Permit Register (based on the Energy Law from 2016). Energy permits for renewable energy facilities producing electricity are issued by the Ministry of Economy, while energy permits for facilities producing/distributing heat are issued by local self-governments.
After getting an approval by the Ministry of Economy, a developer should obtain other necessary approvals and permits related to the construction of generating facilities in accordance with the Law on Spatial Planning and Construction of Structures.73 The full list of bylaws related to the implementation of Montenegro’s RES policy and provisions of the Energy Law are presented in Annex 3.
The Law on Energy also recognises obligations on the adoption of a National Renewable Energy Action Plan (NREAP), as well as the determination of the national targets for a share of energy from RES in the final energy consumption, which are requirements of EU Directive 2009/28/EC. In 2014, the Government of Montenegro adopted the National Renewable Energy Action Plan to 2020.
6.2.1. Development and Implementation of Feed-In TariffsFeed-In Tariffs (FIT) are established by the Law on Energy and further regulated by the Decree on Tariff System for Determining Incentive Prices for Electricity Produced from RES and High Efficiency Cogeneration.74 The FITs are based on the type of RES and the scale of the installation, as shown in Table 14. According to the law, FITs are provided for 12 years.
73 Official Gazette of Montenegro 64/201774 Official Gazette of Montenegro 52/2011, 28/2014 and 79/2015

113
6. Renewable Energy Policy
Table 14: Calculation of the feed-in tariffs, as of 01.03.2017
Type of plant Scale of the installation c€/kWh
Small HPP net power output of power plant Ppe < 1 MW 10.44
net power output of power plant 1<Ppe < 3 MW 10.44 – 0.7* Ppe
net power output of power plant 3<Ppe < 5 MW 8.87 – 0.24* Ppe
net power output of power plant 5<Ppe < 8 MW 8.35 – 0.18* Ppe
net power output of power plant 8<Ppe < 10 MW 6.8
Photovoltaic on buildings and engineering constructions 12.00
Wind power plants 9.60
Biomass from forestry and agriculture 13.71
from wood processing industry 12.31
Solid landfill waste 9.00
Gas from landfills 8.00
Biogas 15.00
High efficiency cogeneration
installed capacity up to 1 MWe 10.00
installed capacity (P) from 1 MWe up to 5 MWe according to formula: 10.00 – 0.5 x (P-1)
installed capacity from 5 MWe up to 10 MWe 8.00
Source: Decree on the tariff system for determining the incentive prices for electricity produced from RES
6.2.2. Development of a Concept for Development of SHPPs From 2007–2016, Montenegro completed hydrological measurements at 45 watercourses. In addition to this work, the EBRD supported the preparation of the cadastre of small watercourses for the construction of small hydropower plants with an installed capacity up to 1 MW. Currently, the cadastre includes measurements of 87 watercourses in the territory of 13 municipalities.75
According to the NREAP, a total of 90 MW of new generating capacity of small HPPs should be put into operation by 2020. The new small HPPs can play a significant role in the energy system, as they can potentially increase the existing electricity production by about 10%. From 2015–2017, the Government of Montenegro conducted three tenders and granted 18 concessions for the construction of 37 small HPPs. From 2014–2018, the construction of 13 small HPPs was completed, and Table 15 provides information on their capacity and planned output.
75 According to the information provided by the Ministry of Economy

114
In-Depth Review of the Energy Efficiency Policy of Montenegro | 2018
Table 15: Small HPPs put into operation from 2014–2018
River/Municipality Small HPPInstalled capacity,
MW
Planed annual generation,
GWh
Bistrica/Berane SHPP Bistrica 5.600 18.000
SHPP Jezerštica 0.844 3.00
Šekularska/Berane SHPP Orah 0.954 3.900
SHPP Rmuš 0.509 1.800
SHPP Spaljevići 1 0.650 2.600
SHPP Šekular 1.668 4.800
Vrelo/Bijelo Polje SHPP Vrelo 0.5875 2.760
Bradavec/Andrijevica SHPP Bradavec 0.970 3.823
Babinopoljska/Plav SHPP Jara 4.636 14.547
SHPP Babino Polje 2.450 6.860
Piševska rijeka/Andrijevica SHPP Piševska 0.945 2.914
Bistrica pritoka Ljuboviđe/Bijelo Polje SHPP Bistrica 3.497 11.319
Šremet/Andrijevica SHPP Šeremet 0.795 3.460
Total 24.1055 79.783
Source: Ministry of Economy, 2018
6.2.3. Development of Wind and Solar Atlases and projectsThe Ministry for the Environment, Land and Sea of Italy supported the development of the study Renewable Energy Resource Assessment in Montenegro,76 which found that significant potential exists for wind and solar energy on the basis of the research and numerical simulations.
Following the findings of the study, several companies obtained approval for measuring and exploring wind potential in Montenegro, which resulted in the actual implementation of two projects:
- Windfarm Možura (municipalities Ulcinj and Bar), with an installed capacity of 46 MW and planned annual production of about 100 GWh – construction is ongoing;
- Windfarm Krnovo (municipalities Nikšić and Šavnik) with an installed capacity of 72 MW and planned annual production of about 160 GWh – entered into operation in 2017.
The study also shows that the potential of solar radiation in Montenegro is significant and can be compared to other Mediterranean countries. However, bearing in mind the small size of the country, the Government of Montenegro currently provides incentives only for photovoltaics (PV) installed on roofs. This decision, combined with a relatively low FIT for solar renewable energy generation (0.12 Eurcents/kWh), has limited the development of PV systems in Montenegro.
76 http://www.oie-res.me/uploads/archive/Renewable%20Energy%20Resource%20Assessment%20Feb.2007.pdf (accessed June 2018)

115
6. Renewable Energy Policy
At the same time, the existing legislative framework in Montenegro allows investors to lease state-owned land for the construction of any type of power plant, including solar plants. Taking into account the significant price drop of PV panels over recent years, the Ministry of Economy was approached by a potential developer of a solar plant that does not require any financial assistance from the Government of Montenegro in the form of FIT. In 2017, a potential developer officially submitted a request to build a solar power plant near the aforementioned windfarm, Možura, with an install capacity of 250 MW that equals about 34% of the existing total capacity of the country. To proceed with the request, the Government of Montenegro has implemented a number of official steps that can be summarised as follows:
- On 23.10.2017, the Ministry of Economy officially created a Working Group for determining further activities on the commencement of building of the solar plant Mozura.77 The Working Group developed an action plan for the solar project implementation;
- On 23.11.2017, the Government of Montenegro adopted the action plan and ordered the Ministry of Economy to proceed with defining procedures for tendering;
- On 18.01.2018, the Government of Montenegro adopted a Decision on establishment of a Commission for the evaluation of the land owned by the State at the Mozura locality Briska Gora, Municipality of Ulcinj. The Commission has drafted tender documentation;
- On 04.05.2018, the Government of Montenegro adopted the tender documentation and ordered the Ministry of Economy to issue a public tender invitation;
- On 19.05.2018, the Ministry of Economy published the public invitation to lease land owned by the state at Briska Gora for the purpose of constructing a solar power plant;78
- On 03.09.2018, the Tender Commission evaluated the bids on the basis of the established criteria and made a list of the bidders. The first-ranked bidder was the Consortium of Fortum and EPCG. The offer of the first-ranked bidder envisaged the construction of a solar power plant with an installed capacity of 250 MW;
- On 28.12.2018, a contract for land lease for the construction of a solar power plant at Briska Gora locality with a first-ranked bidder was concluded.
Despite the progress in promoting solar power plants, the use of thermal solar systems for the preparation of hot water is not well developed, as there exist no state incentives for the utilisation of these systems in Montenegro. As for donor activities in this area, there was only one 3-year project funded by the Italian Ministry of Environment, Land and Sea that supported the installation of solar water heating systems in households and was completed in 2014 (see Table 11).
77 Decision of the Government No: 310-788 / 2017-6 dated 23 October 201778 Deadline for submission of bids is 3 September 2018

116
In-Depth Review of the Energy Efficiency Policy of Montenegro | 2018
Summary: Renewable Energy Policy
Development of renewable energy is one of the key priorities of the Energy Development Policy and the Energy Development Strategy of Montenegro until 2030. The Law on Energy complies with EU Directive 2009/28/EC and recognises obligations to adopt a National Renewable Energy Action Plan (NREAP) and the determination of the national RES targets.
For Montenegro, the national RES target was determined at a level of a 33% share of energy produced from RES in the gross final energy consumption by 2020 by the Decision of the Ministerial Council of the Energy Community. The NREAP, adopted in 2014, provides detailed forecasts with the aim of reaching the RES target. According to the Government of Montenegro, the country achieved a 31.7% of share of RES in final energy consumption in 2016. However, the Eurostat data indicates that Montenegro already surpassed the 33% target and reached the level of 41.5% in 2016. The identified difference is related to different methodologies applied to the calculation of the contribution of biomass to the RES target.
The legislative framework envisages the following support schemes for RES:
- Guaranteed purchase of electricity using ‘feed-in-tariffs (FIT)’ from privileged producers for a period of 12 years;
- Priority in delivery of electricity generated into transmission or distribution systems;
- Exemption from any payment related to imbalances, network charges and electricity losses for SHPPs connected to the distribution system.
Twelve small HPPs, with total installed capacity of 24.1 MW, and the Krnovo windfarm, with installed capacity of 72 MW, were put into operation during 2014–2018. Apart from completed projects, there are also a number of ongoing projects, including the Možura windfarm, with installed capacity of 46 MW and a solar power plant in the Briska Gora Locality, with installed capacity of 250 MW. As for the latter, the project is being implemented without any support from the Government of Montenegro in the form of the FITs. Despite the progress in promoting solar power plants, the use of solar thermal systems is not well developed, as there exist no state incentives for the utilisation of these systems in Montenegro.

7. Environmental and Climate Change Policies Related to Energy

118
In-Depth Review of the Energy Efficiency Policy of Montenegro | 2018
7. Environmental and Climate Change Policies Related to Energy The development of the strategic and legal framework for environmental protection and climate change in Montenegro is based on the relevant international commitments as well as requirements of the EU framework. In order to achieve gradual and complete transposition of the EU acquis into the legal framework, the Government adopted a National Strategy with Action Plan for transposition, implementation and enforcement of the EU acquis on Environment and Climate Change for 2016–2020.79
The responsible authority for environmental policy and climate mitigation is the Ministry of Sustainable Development and Tourism (MoSDT), and implementation and enforcement is supported by the Environment Protection Agency and Administration for Inspection Affairs.
Bearing in mind that the development of the energy sector has an impact on the environment, the development of the energy sector must be carefully planned, and environmental issues and climate change mitigation measures have to be fully considered. This chapter elaborates on the interrelation between energy policy and relevant elements of Montenegro’s environmental policy.
7.1. Legislative Framework for Environmental ProtectionInternational obligations of Montenegro regarding environmental protection relate to numerous conventions and protocols signed by the state. The energy projects most relevant to the implementation of these obligations are the following:
- Convention on Access to Information, Public Participation in Decision-making and Access to Justice in Environmental Matters (Aarhus Convention);
- Convention on Environmental Impact Assessment in a Trans-Boundary Context (Espoo Convention);
- Protocol on Strategic Environmental Assessment in a Trans-Boundary Context (SEA Protocol).
Montenegro has harmonised its legal framework with the aforementioned commitments and relevant EU directives in this field. Preparation of all strategic documents, programmes and projects in the energy field and strategic assessment of the environmental impact have to be carried out.
The national legislation of Montenegro, which incorporates the requirements of these international treaties and directives, includes:
- Law on Strategic Environmental Impact Assessment, which transposes Directive 2001/42/EC on the assessment of the effects of certain plans and programmes on the environment (SEA);80
- Law on Environmental Impact Assessment, which transposes Directive 2011/92/EU on the assessment of the effects of certain public and private projects on the environment (EIA);81
- The new Law on Environmental Impact Assessment, which transposes the new EIA Directive – Directive 2014/52/EU, amending Directive 2011/92/EU, which has passed parliamentary committees and is set to be discussed at the plenary session during Autumn of 2018.
79 Published on 12.09.2016, available at http://www.mrt.gov.me/en/news/164797/National-Strategy-with-Action-Plan-for-transposi-tion-implementation-and-enforcement-of-the-EU-acquis-on-Environment-and-Climate.html (accessed June 2018)
80 Off. Gazette of Montenegro, No. 80/05, Off. Gazette of Montenegro, No. 40/11, 59/1181 “Off. Gazette of Montenegro“, No 80/05, “Off. Gazette of Montenegro“, No. 40/10, 73/10, 40/11, 27/13)

119
7. Environmental and Climate Change Policies Related to Energy
In addition, a set of bylaws is being adopted which regulates environmental impact assessments. Currently, the Decree on Projects that are subject to Environmental Impact Assessment stipulates two lists of projects that are subjected to EIA (i.e. List I ‘Projects for which an environmental impact assessment is mandatory’ and List II ‘Projects that may require environmental impact assessment’).
Besides the strategic environmental assessment for the implementation of energy policy and realisation of related projects, the following aspects of environmental policy are of particular importance:
- Nature protection and internationally protected areas. Planning and valorisation of Montenegro’s natural resources in the area of energy need to consider protected areas at national and international levels, that is, ecological networks, since their non-observation may lead to permanent loss of biological diversity for Montenegro. The latter, if it were to occur, could eventually result in extremely negative consequences for the overall development of Montenegro and its positioning among EU countries. The fundamental law for nature protection in Montenegro is the Law on Nature Protection. In addition, Montenegro is a signatory to several international initiatives and conventions regarding nature protection (Convention on Biological Diversity, Convention on Wetlands, Natura 2000 Process, etc.).
- Air quality. In the area of air quality and air pollution control, Montenegro’s international commitments relate mainly to the Convention on Long-range Trans-boundary Air Pollution (CLRTAP) and accompanying protocols, as well as the provisions of the Athens Treaty of the Energy Community referring to environmental legislation. In order to fulfil the obligations arising from these international treaties, Montenegro has adopted the Law on Air Protection and 12 implementing acts (six decrees and six rulebooks), which have transposed the requirements of the main EU directives: Directive 2008/50/EC (AAQ on ambient air quality); Directive 2004/107/EC (four daughter directives on air pollutants); Directive 2001/81/EC (NEC – national emissions ceilings); Directive 94/63/EC (VOCs – volatile organic compounds); Directive 2009/126/EC (VOCs-II); and Directive 1999/32/EC (sulphur content of certain liquid fuels).
- Integrated pollution prevention and control (IPPC). The aim of the integrated pollution prevention and control legislation is to achieve greater sustainable balance between human activities and social and economic development, on the one hand, and natural resources and regenerative capability of nature, on the other. Montenegro has adopted the Law on IPCC and a set of bylaws, which are harmonised with the EU framework in this area, particularly Directive 2008/1/EC on IPPC.
7.2. Air QualityIn 2016, the results of an assessment82 of existing national data on air quality were undertaken within the framework of collaboration between Montenegro and the World Health Organisation (WHO). The analysis indicated the following:
- Over 250 premature deaths and 140 hospital admissions per year in addition to some other health outcomes are associated with exposure exceeding the level of particulate matter (PM) recommended by the WHO air quality guidelines;
82 Assessment conducted by Michal Krzyzanowski, King’s College London, published in paper “Health Impacts of Air Pollution in Montenegro”, 5 January 2016. Retrieved 24 May 2018 from http://www.un.org.me/Library/Health/1a%20Health%20Impacts%20of%20Air%20Pollution%20in%20Montenegro.pdf (accessed June 2018)

120
In-Depth Review of the Energy Efficiency Policy of Montenegro | 2018
- More than half of the health effects are associated with elevated levels of pollution in winter, caused mainly by combustion of solid fuels for heating and cooking;
- The occurrence of health effects of air pollution in Pljevlja is more common than in Niksic and Podgorica, but due to larger populations residing in the latter two cities, the absolute burden of pollution on health is similar in all cities.
The European Environment Agency reported an annual mean of 15.6 μg/m3 for PM2.5 (relative to WHO air quality guidelines of 10 μg/m3) and associated premature deaths ranging between 470–550, depending on assumptions regarding the baseline.83
Due to EU legislation, SO2 concentrations across Europe are generally well below the limit values for the protection of human health. However, the EEA reported84 that in 2015, six monitoring stations, including one in Montenegro, registered concentrations above the EU’s hourly limit value, and four stations, including one in Montenegro, registered concentrations above the EU’s hourly limit value for SO2. The TPP in Pljevlja is the primary source of SO2 emissions in Montenegro and around half of NOx emissions.85
In accordance with the legislative framework mentioned above, the national strategy for air quality and action plans are in place. Air quality plans have been developed for the Pljevljia, Niksic and Podgorica municipalities, where levels of pollutants exceed limit values. The most recent assessment by the European Commission on Montenegro’s progress in aligning with the EU acquis showed that more effort is needed to properly implement Pljevlja’s action plan.
7.3. Nature Protection and HydropowerExperience from across the EU shows that full consideration of the EU’s legislation relating to nature protection needs to be taken into account in relation to developing hydropower and energy system planning more broadly in order to avoid stranded investments or costs. The European Commission advises that Montenegro’s institutional framework for designating and managing future Natura 2000 sites needs to be streamlined and adequately resourced and that potential investments in hydropower should ensure nature protection obligations are met, particularly for national protected areas or areas that could potentially become Natura 2000 sites under EU law.
7.4. Climate Change Impacts, Mitigation and AdaptationMontenegro is a party to the UNFCCC (and to the Kyoto Protocol until the moment it is repealed) and is required to fulfil obligations arising from these international treaties. Efforts are being made to ensure complementary fulfilment of these obligations and obligations in the process of transposing the climate change acquis of the EU. In October 2017, the Montenegrin Parliament ratified the Paris Agreement and by this confirmed Montenegro’s intention to become part of joint efforts to reduce global carbon emissions.
With its “Intended Nationally Determined Contribution” (INDC) document submitted to UNFCCC, Montenegro committed to an ambitious target of reducing greenhouse gas (GHG) emissions by 30% by 2030, compared to the 1990 base year. The emission level of greenhouse gases for Montenegro from sectors covered by INDC was 5239 Gg in 1990, and Montenegro pledges to reduce it at least by 1572 Gg, to the level below or at 3667 Gg by 2030.86 The 83 EEA report No13/2017 “Air quality in Europe – 2017 report”, p. 57, 2017.84 EEA report No13/2017 “Air quality in Europe – 2017 report”, p. 45, 2017.85 According to UNECE 3rd environmental performance review for Montenegro, published 201586 Government of Montenegro, “Intended Nationally Determined Contribution (INDC) of Montenegro following decision 1/CP.19
and decision 1/CP.20” issued 2015, retrieved from http://www4.unfccc.int/submissions/INDC/Published%20Documents/Monte-negro/1/INDCSubmission_%20Montenegro.docx (accessed June 2018)

121
7. Environmental and Climate Change Policies Related to Energy
national strategy in the field of climate change by 2030 gives strategic guidelines for achieving the objective within the INDC.
To implement the INDC policies and measures requires joint efforts of all relevant stakeholders, that is, the Ministry of Sustainable Development and Tourism, the Ministry of Economy and the Ministry of Transport and Maritime Affairs, as well as some large companies, namely the thermal power plant “Pljevlja” and the aluminium plant in Podgorica.
Inter-sectoral cooperation and integration of the climate change aspects into other relevant sectoral polices and strategies is improved through the establishment of the designated Directorate for Climate Change, a specific department within the Ministry of Sustainable Development and Tourism. Further capacity building is necessary to ensure the appropriate institutional set-up is in place in order to be able to respond adequately to the requirements of full harmonisation with the EU climate acquis.
Montenegro is also a part of the new Regional Implementation of Paris Agreement Project (RIPAP) that supports Albania, Bosnia and Herzegovina, Macedonia, Kosovo, Montenegro, Serbia and Turkey in implementing the goals of the Paris Agreement. RIPAP started in August 2017 and continues until October 2018. It is based on previously established cooperation that was carried out within the framework of the RENA project (2010–2013) and ECRAN (2013–2016). The project is supported by DG Climate Action and DG NEAR and includes three components:
1. Identification of relevant policies and development of strategies to support the implementation of obligations under the Paris Agreement;
2. Assistance in the preparation of capacity building plans aiming at the establishment of a National Greenhouse Gas Inventory System;
3. Strengthening the monitoring, reporting, verification and accreditation system (MRVA) within the EU Emissions Trading System (ETS).
The European Commission’s latest assessment87 of Montenegro’s alignment with the EU acquis, published 2016, demonstrated that Montenegro’s legislation is only partially aligned in the field of addressing climate change. For example, only very limited provisions of the EU Emissions Trading Directive (ETS) have been transposed, among others, and the administrative capacity for policy development and implementation remains weak. However, Montenegro’s Action Plan for transposition, implementation and enforcement of the EU acquis on Environment and Climate Change for 2016–2020 recognises the importance of full transposition of the EU acquis in the area of climate change during a four-year period. In this way, Montenegro will fulfil obligations arising from the international treaties to which it acceded and to which the EU is a party as well. Transposition of the major share of legislation governing climate change in the existing structure of the administration falls under the purview of different ministries, such as, for instance, the Ministry of Transport and Maritime Affairs (in the area of transport) and the Ministry of Economy (ME) (in the area of RES and biofuels). This process is at an early stage in Montenegro. Certain matters are regulated under the Law on Air Protection (2010, amended 2015), the Law on Road Safety (2015), the Law on Energy (2016) and the law amending the Law on Environmental Impact Assessment (2013), and further harmonisation will need to be facilitated during the upcoming period.
87 European Commission SWD(2016)360 final “Montenegro 2016 Report” issued 9.11.2016

122
In-Depth Review of the Energy Efficiency Policy of Montenegro | 2018
7.5. Emissions of Carbon Dioxide (CO2) Caused by Fuel CombustionAccording to the Energy Development Strategy of Montenegro, the combustion of fossil fuels will cause, by 2030, more than 90% of all CO2 emissions in Montenegro and represent around 55% of all anthropogenic emissions of GHG. According to statistical data, Montenegro can be recognised as a very small country on the global scale. In the baseline year of 2008, Montenegro had a population of 628,804 and represented 0.009% of the global population (of 6.69 billion), with a total domestic energy consumption of approximately 49.5 PJ, which was 0.008% of global energy consumption (513,611 PJ), representing no more than 0.009% of global emissions of CO2 (29,381 million tCO2).
88
The Energy Development Strategy of Montenegro by 2030 made a calculation of CO2 emissions, based on the revised 1996 IPCC recommendations for the calculation of national GHG inventories according to a sectoral approach. In the base year (2008), CO2 emissions were 3,037 Gg, out of which 51% were caused by energy transformation (thermal power plants and public boiler rooms), 19% by industry, 24% by traffic and transport and 7% by other consumption (Table 16). The structure of emissions in terms of fuels was 52% caused by coal and 48% by oil products.
The strategy also made forecasts of the CO2 emissions for the future period (up to 2030), and a significant increase in CO2 emissions is expected due to the start-up of new thermal power plants. The strategy also envisages an increase of CO2 emissions due to growth in final energy consumption, especially in the transport and industry sectors, regardless of planned implementation of energy efficiency measures and the introduction of biofuels in transport (Table 16). At the same time, Montenegro’s INDC, submitted to the UNFCCC, mentioned above, commits to limiting greenhouse gas emissions to 3667 Gg by 2030.
Table 16: Forecast of emissions of CO2 caused by combustion of fossil fuels, Gg CO2
Sectoral approach 2008 2015 2020 2025 2030
Energy transformations 1,537.6 1,340.4 1,340.4 2,797.8 2,797.8
- Thermal power plants 1,532.9 1,340.4 1,340.4 2,797.8 2,797.8
- Heating plants 3.9 - - - -
- Own use of energy sector 0.7 - - - -
Final energy consumption 1,499.3 1,774.6 1,998.4 2,226.1 2,421.2
- Industry 585.8 578.0 652.8 737.5 809.8
- Transport 716.3 994.3 1,082.5 1,173.5 1,235.7
- Others 197.2 202.3 263.1 315.1 375.8
Total 3,036.9 3,115.0 3,338.8 5,023.9 5,219.0
Source: Energy Charter Secretariat based on the data from Energy Development Strategy of Montenegro until 2030
Options to develop natural gas network in Montenegro are being explored, and a gasification master plan has been finalised, including a list of investment projects, but the strategic environmental impact assessment has yet to be finalised.
88 According to the Energy Development Strategy of Montenegro by 2030

123
7. Environmental and Climate Change Policies Related to Energy
Summary: Environmental and Climate Change Policies Related to Energy
The responsible authority for environmental policy and climate mitigation in Montenegro is the Ministry of Sustainable Development and Tourism (MoSDT), whereas the implementation and enforcement of these affairs is supported by the Environment Protection Agency and Administration for Inspection Affairs.
Montenegro continues harmonising its strategic and legal frameworks with relevant international commitments and requirements of the EU framework. In 2016, the Government adopted a National Strategy with Action Plan for the transposition, implementation and enforcement of the EU acquis on Environment and Climate Change for 2016–2020 in order to achieve gradual and complete transposition of the EU acquis.
Montenegro is a party to the UNFCCC (and to the Kyoto Protocol until the moment it is repealed) and is obligated to fulfil obligations arising from these international treaties. With its “Intended Nationally Determined Contribution” (INDC) document submitted to UNFCCC, Montenegro committed to an ambitious target of reducing GHG emissions by 30% by 2030 compared to the 1990 base year. In October 2017, the Montenegrin Parliament ratified the Paris Agreement and, by this, confirmed Montenegro’s intention to become part of joint efforts to reduce global carbon emissions.
The emission level of greenhouse gases for Montenegro from sectors covered by INDC was 5239 Gg in 1990, and Montenegro pledges to reduce it at least by 1572 Gg, to the level below or at 3667 Gg, by 2030. The national strategy in the field of climate change until 2030 gives strategic guidelines for achieving the objective within the INDC. At the same time, the Energy Development Strategy (EDS) of Montenegro until 2030 forecasts a significant increase in CO2 due to the start-up of new thermal power plants and the growth in final energy consumption, especially in the transport and industry sectors. The CO2 emission forecast of the EDS is significantly higher than the country’s international commitments to limit greenhouse gas emissions by 2030, and therefore the Energy Development Strategy of Montenegro until 2030 needs to be updated accordingly.


8. Finance and International Assistance

126
In-Depth Review of the Energy Efficiency Policy of Montenegro | 2018
8. Finance and International AssistanceThe EU is the largest provider of financial assistance to Montenegro, and this support is closely connected with the country’s accession to the EU.89 For the period of 2007–2020, Montenegro has been provisionally allocated €506.2 million in EU funds. To date, the country has also benefited from European Investment Bank loans of €621 million. An additional €81 million has been provided through Western Balkans Investment Framework grants, leveraging investments of €732 million.
For the period 2014–2020, the EU is providing €270.5m (not including the allocation for cross-border cooperation) through its Instrument for Pre-Accession Assistance (IPA II).90 This funding breaks down as follows: €37.5m for environment and climate action (of which 80% is climate change relevant); €32.1m for transport (of which 80% is climate-change relevant); €21.2m for competitiveness and innovation; €46.9m for democracy and governance; €52.3m for rule of law and fundamental rights; €28.1m for education, employment and social policies; and €52.4m for agriculture and rural development.
The funds for actions relating to the environment, climate action and transport have significant synergies with the development of the energy sector, and many of these actions are targeted towards helping Montenegro to align with EU standards and laws. A substantial share of the IPA II funds, however, is dedicated to cross-cutting areas such as rule of law, governance and competitiveness that will significantly support policy development, implementation and enforcement in the energy sector.
The €37.5m funds allocated to environment and climate action include activities that will enable the establishment and functioning of an “Eco Fund”. The fund, which is to operate on the ‘polluter pays’ principle, would use financial mechanisms such as soft loans, guarantees and grants (non-repayable subsidies) to support environmental investments. Funds would gather revenues from various sources, including rates, billing and taxation (e.g. water, soil, air pollution, waste disposal, fuel, new cars, emissions trading scheme). The supported activities will also include studies that will be carried out to establish affordability references and benchmarks. On tariff setting policy, concepts or principles to be applied include: “Territorial Solidarity” with uniform tariffs throughout Montenegro; “Maximum Affordable Tariffs”; and “Full Cost Recovery Tariffs”.
The 2016–2020 Regional Development Operational Programme for Montenegro91 (used for IPA II planning purposes) identifies three key areas that are insufficient and need to be addressed through IPA II: private sector competitiveness, private sector innovation and administrative capacity and level of alignment to the EU acquis in the field of competitiveness and innovation. In the IPA II plan for 2014–2020 on strengthening the competitiveness and innovation sector,92 enabling access to finance for SMEs through a favourable financial framework is identified as a key priority. A more developed financial framework providing a range of suitable financial instruments will help improve competitiveness and innovation in the private sector. It is reported in this IPA II plan that while there exists financial assistance to SMEs through several credit lines, the interest rates in both the traditional banking system 89 See EU infographic for summary: https://ec.europa.eu/neighbourhood-enlargement/sites/near/files/near_factograph_montene-
gro.pdf (accessed June 2018)90 IPA II “Indicative Strategy Paper for Montenegro (2014-2020)” adopted on 18/08/2014 retrieved on 4th May 2018 from
https://ec.europa.eu/neighbourhood-enlargement/sites/near/files/pdf/key_documents/2014/20140919-csp-montenegro.pdf (accessed June 2018)
91 As referred to in IPA II 2014-2020 “Strengthening the competitiveness and innovation sector of Montenegro”: https://ec.europa.eu/neighbourhood-enlargement/sites/near/files/ipa_2016_37896_2_me_competitiveness_and_innovation.pdf (accessed June 2018)
92 Ibid.

127
8. Finance and International Assistance
and in the microfinance lending facilities in Montenegro generally remain higher than in the neighbouring countries. Incentives such as interest rate subsidies are not available, business angel funding and venture capital funding are largely absent and the use of equity financing is very limited. The IPA II plan points to the need to improve the existing investment framework for industrial modernisation, as processes and technologies used in Montenegro’s industry are typically obsolete, over-exploited, labour-intensive and of low value-add.
IPA II-supported activities are intended to improve Montenegro’s export potential, increase the efficiency of investments and stimulate movement of production towards higher value-add. A key strategy to help achieve this is promoting the internationalisation of the Montenegrin economy, with a focus on SMEs. IPA II-supported activities therefore target, among other things, exploitation of smarter processes and technologies, development of new industrial products, improving access to finance of the private sector, provision of improved research and innovation infrastructure and advanced advisory services for the private sector.
As for specific energy-related international assistance, the country has benefited from 50 projects (completed and ongoing) funded by donor organisations with the total value of €405.7 million from 2008–2018. Figure 23 shows the distribution of the funds provided by the donor community to finance energy-related projects and to support reforms, whereas Annex 4 provides a brief description and the implementation status of these projects.
Figure 23: Energy sector projects supported by donor organisations from 2008–2018
Loan/Creditlines,
348,280,000 €
Grants,40,453,540 €
TechnicalAssistance,
16,942,337 €
Source: Ministry of Economy, 2018
Further analysis of the donor-funded projects indicates that the majority of the loans and credit lines have been provided by EBRD (€169 million) and KfW (€162 million). Annex 4 also indicates that the key beneficiaries of the loans have been Montenegro’s energy market actors, including TSO, DSO and generation companies (both public and private). The EBRD and KfW are currently dominant providers of such financial support, targeting interconnectivity, modernisation and development of the energy sector, with loan portfolios of €174.7 million and €83.9 million, respectively. The KfW has also been a main provider of grants supporting the

128
In-Depth Review of the Energy Efficiency Policy of Montenegro | 2018
implementation of energy projects and accounted for €39 million out of €40.5 million grants93 provided during the period of 2008–2018.
The World Bank loans portfolio in the energy sector accounts for €17.5 million. Reinforcing the EU’s financial strategy for Montenegro, the World Bank targets its support towards enabling innovation and SME business development, sustainable economic development and EU accession. For example, the World Bank is currently covering finance costs and providing support to enhance the impact of a project involving the retrofitting of important health facilities throughout the country to improve their energy efficiency.94
As for technical assistance (TA) projects, the largest donors providing technical support during 2008–2018 have been: the German Federal Ministry for Economic Cooperation and Development via GIZ projects with a total value of €7 million (44.3%); EBRD, with a total value of €3.5 million (20.4%); and the EU, with a total value of €3.3 million (19.5%) (see Annex 4 for more details).
Summary: Finance and International Assistance
The EU is the largest provider of financial assistance to Montenegro, and this support is closely connected with the country’s accession to the EU. For the period of 2007–2020, Montenegro has been provisionally allocated €506.2 million in EU funds. To date, the country has also benefited from European Investment Bank loans of €621 million. An additional €81 million has been provided through Western Balkans Investment Framework grants, leveraging investments of €732 million.
For the period of 2014–2020, the EU is providing €270.5m (excluding the allocation for cross-border cooperation) through its Instrument for Pre-Accession Assistance (IPA II), including €37.5 million for environment and climate action and €32.1 million for transport, of which 80% is climate-change relevant. The €37.5 million in funds allocated to environment and climate action includes activities that will enable the establishment and functioning of an ‘Eco Fund’. The fund, which is to operate on the ‘polluter pays’ principle, would use financial mechanisms such as soft loans, guarantees and grants (non-repayable subsidies) to support environmental investments.
From 2008–2018, the country has benefited from 50 projects (completed and ongoing) funded by donor organisations, with a total value of €405.7 million, including €348.3 million of loan and credit lines, €40.5 million of grants and €16.9 million of technical assistance (TA) projects. The majority of the loans and credit lines have been provided by EBRD and KfW, mainly to support the interconnectivity, modernisation and development of the energy sector. The KfW has also provided €39 million out of €40.5 million in total grants for the implementation of energy projects. As for TA projects, the largest donors from 2008–2018 have been the German Federal Ministry for Economic Cooperation and Development, the EBRD and the EU.
93 Including EU grant of 25 millions for undersea cable that was disbursed through KfW94 See http://projects.worldbank.org/P145399?lang=en (accessed June 2018)

9. Assessment of the Energy Efficiency Potential and Policies at the Sectoral Level

130
In-Depth Review of the Energy Efficiency Policy of Montenegro | 2018
9. Assessment of the Energy Efficiency Potential and Policies at the Sectoral Level
9.1. General Assessment
9.1.1. Whole energy sector energy efficiency potential and main measuresThe Energy Policy of Montenegro until 2030 (adopted in 2011) recognises the improvement of energy efficiency and the promotion of renewable energy sources as the main solutions for sustainable energy development. Thus, energy efficiency is acknowledged in the country’s strategic framework as an important element of the overall energy policy, as well as a key tool for reducing the energy intensity of all economic sectors and to improve energy efficiency across the entire energy value chain, from generation to final consumption of energy.
As presented earlier in Figure 10, the largest energy-consuming sectors in 2016 were residential (35.6%) and transport (32.2%), followed by industry (16.2%) and services (10.7%). The Energy Development Strategy of Montenegro until 2030, adopted in 2014, also recognises the transport and households end-use sectors as having the highest energy-saving potential (Figure 24). At the same time, the strategy estimates relatively high potential energy savings in the service sector – a possible contribution of 21.6% of total energy savings from this relatively small sector that accounted for just 10.7% of Montenegro’s final energy consumption in 2016.
The strategy estimates the potential energy savings in the final energy consumption by taking into account three scenarios:
- “frozen”, which extrapolates the situation of the base year, 2008;
- “without measures”, which consider only EE improvements led by the market itself and due to technological progress;
- “with EE policy measures”, which consider also the impact of the EE policy (Figure 24).
A closer analysis of the forecast model of the strategy shows that the major part of EE savings are expected to be achieved through market transformation and technological progress, whereas the EE policy is estimated to contribute only 44% and 40% of expected savings by 2020 and 2030, respectively (Figure 24). However, the recent findings of the IEA’s 2017 EE market report proves that well-designed and enforceable policies and standards are the main driving forces for energy-efficiency markets, delivering greater technological progress and energy efficiency-improvements than could be delivered through energy markets alone, as they not only limit inefficient products on the market, but they can also create demand for highly efficient services and products.95 Such policies and standards are particularly crucial when the affordability of energy is a key public policy objective, as is the case for many governments, including that of Montenegro.
95 2017 EE market report, available at https://www.iea.org/publications/freepublications/publication/Energy_Efficiency_2017.pdf (accessed June 2018)

131
9. Assessment of the Energy Efficiency Potential and Policies at the Sectoral Level
Figure 24: Estimates of the energy-saving potential for Montenegro in 2020 and 2030 (ktoe) for the scenario “with EE policy measures” and distribution of the total energy saving potential by sector in 2030, %
300.0
250.0
200.0
150.0
100.0
50.0
0.02020
48.0
59.2
2030
Transport32.7%
Industry14.0%
Services21.6%
Households31.6%108.2
159.1
EE policy EE improvements led by the market
Source: Energy Charter Secretariat based on Energy Development Strategy of Montenegro until 2030
According to the EEAP, the Minimum Energy Performance Requirements (MEPR) for buildings is the key EE policy measure that should contribute around half of Montenegro’s indicative energy savings target by 2018. Further comparison of energy savings estimated in the strategy and the Energy Efficiency Action Plans for 2016–2018 (Figure 25) reveals the following:
- the strategy significantly underestimated the maximum potential energy savings in the residential sector, as EEAP’s achieved and estimated savings for the residential sector are considerably higher than in the strategy;
- the Government of Montenegro is primarily focused on the implementation of policy measures targeting the households and service end-use sectors, neglecting the energy savings potential of the industry and transport sectors;
- the strategy and the EEAP use different conversion factors for potential energy savings in electricity.

132
In-Depth Review of the Energy Efficiency Policy of Montenegro | 2018
Figure 25: Comparison of energy savings estimated by the strategy and EEAP 2016-2018 and the 2018 indicative energy saving target, ktoe
0
20
40
60
80
100
120
Strategy (2020potential)*
3rd EEAP(achieved &
estimated for2010‐2018)*
3rd EEAP (normalised achieved &
estimated for2010-2018)**
2018 Indicativetarget**
EE improvements led by the market
Industry Transport Households Services
*does not take into account the conversion factor of 2.5 for electricity that is used for calculation of the indicative targets **takes into account the conversion factor of 2.5 for electricity
Source: Energy Charter Secretariat based on Energy Development Strategy of Montenegro until 2030 and EEAP 2016-2018
Figure 25 also reveals that the EEAP does not include any information on energy savings achieved by the transformation of the market, whereas the strategy estimates that more than half of the savings by 2020 should be achieved through EE improvements led by the market itself, due to prices and technological progress. The EEAP further explains that the absence of this information is related to the unreliability of data from energy balances.
The approved EEAP for 2016–2018 also includes errors related to the calculation of energy savings, which did not take into account the conversion factor of 2.5 for electricity, which is used for calculation of the indicative targets.96 These errors resulted in the decrease in achieved and estimated energy savings of 42% in comparison with the corrected estimation (Figure 25).97 According to the information provided by the Ministry of Economy, the country expects to make relevant corrections to the figures in the next annual report to the Energy Community for 2018 and in the next EEAP.
Comparison of the corrected savings (taking into account the conversion factor) estimated in the third EEAP with the 2018 indicative target shows that the country is on track to meet and perhaps exceed its EE target. In fact, it is expected that the indicative target will primarily be
96 The calculation of the indicative EE target for 2009–2018 took into account the conversion factor of 2.5 for electricity to primary equivalent. However, this conversion factor was not taken into account in the calculation of achieved and estimated savings in the 3rd EEAP.
97 Calculation of the Energy Charter Secretariat on the basis of the available data from the 3rd EEAP

133
9. Assessment of the Energy Efficiency Potential and Policies at the Sectoral Level
met by energy savings from policy measures applied to the households and services sectors, as the third EEAP does not include the potential energy savings from:
- the introduction of policy measures applied to the transport and industrial sectors;
- the implementation of energy labelling and ecodesign legislation;
- the market transformation due to energy markets (prices) and technological progress.
The identified differences between the EEAPs and the Energy Development Strategy of Montenegro until 2030 should result in an updated version of the strategy. The strategy should also include long-term targets and objectives for energy efficiency and demand-side management (DSM). According to the assessment provided in Section 5.1, the periodic update of the country’s strategic energy documents is an obligation arising from the Law on Energy. However, as explained during the peer-review mission in June 2018 (see Annex 5), the Ministry of Economy does not have sufficient human resources to update the Energy Strategy, and this process is usually supported by the donor community.
9.1.2. Optimising institutional arrangementsDespite the fact that the strategic and legislative framework is in place, the country is still facing some difficulties with the implementation and enforcement of EE policy measures. These difficulties seem to be partially influenced by the fact that the Directorate for EE is an integral part of the Ministry of Economy (see Figure 22), which is responsible for both the development and the implementation of energy efficiency policy through three corresponding departments. In practice, the Directorate is manly focused on the transposition of the relevant EU acquis in the national legislative framework and the fulfilment of the country’s obligation under the Energy Community Treaty. Another limitation of the Directorate can be explained by the specific rules and regulations of the state authorities, which limit the Ministry’s flexibility and available operational mechanisms. Effective implementation of energy efficiency policies requires sufficient human resources, both in terms of capacity and capability. It is important, therefore, that the human resource needs for implementation be properly estimated and allocated to policy implementation. In order to avoid the situation where policy development is favoured over policy implementation, as it is necessary to advance both in parallel, the budget for human resources dedicated to policy implementation should be separated from that of policy development.
It is crucial that public funds to support energy efficiency programmes and measures, which are often in place for several years or more, come from stable revenue sources, and it is desirable that they not be subject to the annual budget-setting process of the civil service. The Eco Fund, currently under discussion, can be set up to ensure a stable flow of funds to energy efficiency programmes and measures, so long as governance arrangements are appropriate, with high transparency on fund sources and spending.
9.1.3. Multiple benefits of energy efficiencyOne of the main drivers for the transposition of the EU acquis communautaire on EE for the Government of Montenegro is the fulfilment of the obligation under the Energy Community Treaty so that the country may accede to the EU. However, the actual implementation of EE policies delivers investments and net benefits which are positive for the country’s socio-economic and sustainable development (as illustrated in Figure 26). It is necessary, therefore, to take strong interest in the level of ambition and impact of policies and measures. Estimating

134
In-Depth Review of the Energy Efficiency Policy of Montenegro | 2018
the costs and benefits of policies and measures in the policy development phase and evaluating them in the post-implementation phase are crucial to improving policy, obtaining stakeholder buy-in and ensuring successful energy efficiency policy for the long term.
Examples from around the world show that global leaders in both developed and developing countries are increasingly recognising the multiple benefits of energy efficiency and are introducing reforms to try to capture this value on a large scale. Such examples can be found in the US, where the value of energy efficiency as firm capacity has been recognised,98 in China, where the value of energy efficiency in improving air quality99 has been recognised, and in the EU, where the aim of unlocking the multiple benefits of energy efficiency underpins the European Commission’s proposals for EU energy sector reforms.100
Figure 26: The multiple benefits of energy efficiency improvements
Disposableincome
Energy e�ciencyimprovement
Assetvalues
Energysavings GHG
emissions
Energysecurity
Energydelivery
Energyprices
Macro-economicimpacts
Industrialproductivity
Povertialleviation
Health andwell-being
Employment
Local airpollution
Resourcemanagement
Publicbudgets
Source: IEA (2014), Capturing the Multiple Benefits of Energy Efficiency
When developing energy efficiency policy, the European Commission assesses multiple benefits to some extent. For example, modelling for the EU’s Clean Energy for All Europeans
98 R. Cowart, “Unlocking the Promise of the Energy Union: ‘Efficiency First’ is Key”, December 2014, RAP, available at https://www.raponline.org/wp-content/uploads/2016/05/rap-cowart-efficiencyfirst-2014-dec-04.pdf (accessed June 2018)
99 IEA (2016), Energy Efficiency Market Report, available at https://www.iea.org/eemr16/files/medium-term-energy-efficiency-2016_WEB.PDF (accessed June 2018)
100 European Climate Foundation, Introduction by Maroš Šefčovič, European Commission Vice President for Energy Union, in “Ef-ficiency First: A New Paradigm for the European Energy System”, available at https://europeanclimate.org/wp-content/up-loads/2016/06/ECF_Report_v9-screen-spreads.pdf (accessed June 2018)

135
9. Assessment of the Energy Efficiency Potential and Policies at the Sectoral Level
package101 showed that a binding EU-wide target of 30% for energy efficiency by 2030102 compared to a less ambitious target of 27% would create an additional €70 billion and 400,000 jobs. Modelling underpinning the recent EU proposals to change the Energy Performance of Buildings Directive estimated that by 2030 the proposed changes should:
- increase the market for insulation and flat glass by €23.8 billion;
- create a building renovation market for SMEs with a value of between €80-120 billion;
- generate other energy efficiency work in the construction sector to a value of around €47.6 billion.
9.1.4. Main Barriers IdentifiedSummarising and drawing from the evidence presented in this chapter, the following key barriers to advancing energy efficiency improvements in Montenegro can be summarised as follows:
- The only national energy efficiency target that exists is for 2018, and therefore there are no energy efficiency targets in place for the future;
- There is insufficient coordination and coherence between the Energy Development Strategy until 2030 and the EEAP with regards to estimates of potential energy savings and targeted end-use sectors;
- Inconsistency with regards to the utilisation of conversion factors for the calculation of energy savings in the EDS, EEAP and the indicative EE target;
- The current policy measures are mostly concentrated in the end-use sectors of households and services, missing the opportunity to unlock energy savings potential in the end-use sectors of transport and industry;
- The Ministry of Economy is responsible for the development, implementation and evaluation of energy efficiency policies. However, in practice, the Ministry is mainly focused on the development of the policy and the transposition of the relevant EU acquis in the national legislative framework to fulfil of the country’s obligations under the Energy Community Treaty, as well as to the implementation of EE projects;
- There is generally a low level of enforcement of adopted EE policy measures;
- There is a general lack of a reliable and consistent funding streams to support energy efficiency programmes and investments in various end-use sectors of the economy.
101 https://ec.europa.eu/energy/en/topics/energy-strategy-and-energy-union/clean-energy-all-europeans (accessed June 2018)102 The proposed 30% target for 2030 translates into final energy consumption of 987 Mtoe and primary energy consumption of 1321
Mtoe in the EU, according to 2017 assessment of the progress made by Member States towards the national energy efficiency tar-gets for 2020, http://eur-lex.europa.eu/legal-content/EN/TXT/?qid=1511978095545&uri=COM:2017:687:FIN (accessed April 2018)

136
In-Depth Review of the Energy Efficiency Policy of Montenegro | 2018
General Recommendations
1. Update the Energy Development Strategy until 2030 to include outcome-oriented, long-term targets and objectives for energy efficiency and demand-side management.
2. Establish a new short-term energy efficiency target as soon as possible. Ensure coordination and coherence between the Energy Development Strategy until 2030 and the EEAPs with regards to estimates of potential energy savings and targeted end-use sectors.
3. Prioritise full transposition and implementation of the framework Energy Efficiency Directive 2012/27/EU and other energy efficiency acquis. Beyond achieving minimum requirements, identify and implement actions (greater ambition and/or additional/complementary measures) that can yield the highest net benefits, particularly job creation and new opportunities for small and medium enterprises (SMEs).
4. Take action to improve implementation of energy efficiency policies and measures, such as:
• Improving institutional arrangements and establishment and protection of stable revenue streams. It may be advantageous to separate the policy development, policy implementation and policy evaluation functions of the Directorate for Energy Efficiency, which is more likely to be successfully achieved by placing responsibility for implementation and evaluation with separate, new or existing entities independent of the Directorate, ideally with legal basis;103
• Ensure effective feedback loops by improving coordination between the development, implementation and the evaluation of energy efficiency policy, energy sector strategy development and energy system planning. Disseminate monitoring and evaluation results widely, including via the Internet;
• The funds for the implementation of energy efficiency policies, programmes and measures need to be separated from the general budget of the Directorate and ideally should be based on stable revenue streams (e.g. public benefit charge on electricity rates, taxes). Establishment of the Eco-Fund may provide the opportunity to achieve this, so long as management of its funds is transparent, and funds for energy efficiency are clearly earmarked and tracked.
5. Explore ways to strengthen the coordination of policy development relevant to energy efficiency, whether being led by the Directorate of Energy Efficiency or otherwise. Ensure effective engagement and coordination of relevant directorates and ministries in order to develop more coherent and impactful policy (e.g. develop and adopt joint strategies, programmes, measures):
103 A number of options are possible, each with pros and cons. For more information see: IEA Energy Efficiency Governance handbook 2010 http://www.iea.org/publications/freepublications/publication/gov_handbook.pdf (accessed June 2018)

137
9. Assessment of the Energy Efficiency Potential and Policies at the Sectoral Level
• Develop and adopt principles that pursue the least cost energy system development by employing energy efficiency and demand side management when more cost-effective than supply-side options. In energy system planning, ensure all energy resources, including energy savings gathered through efficiency measures, are properly assessed to meet existing and future energy demand. Appoint an employee of the Directorate of Energy Efficiency who should be held accountable for these principles and embed this in legislative framework;
• Ensure transparency of decision-making related to the strategic planning and public finance support of Montenegro’s energy system, including studies and modelling used to support decisions. Engage regional and national technical/academic resources in the strategic planning process.
6. Improve the general investment conditions of the country in accordance with the EU acquis:
• Ensure Public-Private Partnership regulatory framework is in place and implemented;
• Use competitive tenders and auctions for energy efficiency services in order to develop the ESCO industry.

138
In-Depth Review of the Energy Efficiency Policy of Montenegro | 2018
9.2. Power Sector
9.2.1. Sector overview The Montenegrin electricity system operated as a single, vertically-integrated, state-majority-owned company, Elektrorprivreda Crne Gore (EPCG), until 2009. The process of legal unbundling during the period of 2009–2016 resulted in the establishment of separate entities responsible for network infrastructure, energy generation and supply of energy services (see Section 3.1). The electricity market was ‘open access’ from the 1 January 2015, but the EPCG continues to supply electricity to all consumers except some large consumers that are connected to the TSO and purchase electricity from other suppliers or, in case they are consumers self-suppliers, from traders or generators.
Hydropower dominates Montenegro’s power mix, with 75% of the installed capacity and 50%-68% of electricity production. The electricity production from coal and the net import-export of electricity fluctuates with energy demand and the seasonal hydrological situation. The total electricity demand of the country has reduced by 32% during the last decade, mainly related to the significant decrease in consumption by industrial consumers. Despite this reduction, electricity consumption by residential consumers grew by 11% over the same period, such that the share of household electricity consumption in Montenegro’s total electricity consumption increased from 29% to 47% over the period of 2007–2016.
9.2.2. Planned power system investmentsThe potential for the improvement of the efficiency of the power sector is recognised by the Energy Development Strategy (EDS) of Montenegro until 2030 and the action plan for its implementation. Namely, the action plan for EDS implementation for the period of 2016–2020 envisages 17 projects aimed at improving the energy efficiency of generating facilities, as well as reducing electricity losses in transmission and distribution systems. The investment needed for the implementation of these programmes/projects by 2020 is estimated to be €558 million. The allocation of investments between generation, transmission and distribution activities is set out in Figure 27 and Table 17. While many of these activities involve expanding either generation or transmission capacity, they also involve investment relating to efficiency improvements.
Figure 27: Distribution of estimated investments in the power sector for the period 2016–2020, million €
Generation Transmission Distribution
93.8, 16.8%
191.5, 34.3%
273.1, 48.9%
Source: Action Plan for EDS implementation for the period 2016-2020

139
9. Assessment of the Energy Efficiency Potential and Policies at the Sectoral Level
Figure 27 shows that 49% of all planned investments in the power sector are related to the transmission system. These projects are mainly associated with the strategic development of the transmission network across South East Europe, which includes the laying of an undersea cable between Italy and Montenegro and improving interconnection across the entire region.
Generation projects account for 34% of planned investments. The action plan envisages the rehabilitation of all three large power plants (HPPs Piva and Perucica, and TPP Pljevlja) and seven small HPPs. Rehabilitation of the plants will involve refurbishment of mechanical and electrical systems and replacement of equipment related to system operation, such as measuring equipment and information systems.
The distribution system projects represent 17% of the total planned investments and primarily target smart grid solutions as well as grid new construction and reconstruction of existing network elements. Montenegro has pursued a commendable energy efficiency strategy in maximising the use of existing assets by refurbishing them. The next question is whether efficient system operation, prices and application of smart-grid technologies are achieving their full potential in contributing to this strategy of maximising the use of existing assets.
Table 17: Planned supply-side energy efficiency improvement project/programmes of the action plan 2016-2020
Projects/programs Energy efficiency improvementEstimated
investments(mill. €)
Generation side 191.5 total (38.3 per year)
Rehabilitation of HPP Piva Increase installed capacity from 342 MW to 363 MW and planned annual electricity production from 762 GWh to 800 GWh.
62.70
Rehabilitation of HPP Pe-rucica
Reconstruction of three aggregates will increase ca-pacity of the power plant from 285 MW to 307 MW, and installation of the additional aggregate (8th) with installed capacity of 65 MVA /58.5 MW will increase annual production to about 20 GWh.
44.00
Rehabilitation of TPP Pljevlja Increase of current capacity from 218.5 MW to 225 MW and average production from 1,150 GWh/year to 1,179 GWh/year.
64.50
Rehabilitation of small HPPs Rehabilitation of existing 7 small HPPs, through recon-struction and replacement of parts of mechanical and electrical equipment and auxiliary equipment will in-crease installed capacity from 8.7 MW to 11.4 MW and production from 21 MWh to 37.4 MWh of electricity.
20.25
Transmission System 273.1 total (54.6 per year)
Laying of undersea cable for connection of Montenegro with Italy as well as associ-ated projects involving con-struction of new substations and transmission lines.
Improvements in the quality of the internal electric-ity network in Montenegro and interconnection with other neighbouring countries will contribute to reduction of energy losses and bottlenecks in the transmission system
183.46
New interconnections with neighbouring systems.
13.05

140
In-Depth Review of the Energy Efficiency Policy of Montenegro | 2018
Projects/programs Energy efficiency improvementEstimated
investments(mill. €)
Construction of new substa-tions 110/x kV.
Modernisation of old transmission lines and facilities as well as construction of new ones (to the coast or for the new highway) will improve the overall performance of the transmission system and reduce electricity losses. In addition, system operation will be optimised through introduction of remote moni-toring and management.
34.12
Construction of new 110 kV transmission lines.
20.33
Reconstruction of transmis-sion facilities.
12.54
Set up of secondary systems (NDC, protection, manage-ment, communication).
9.61
Distribution System 93.8 total (18.8 per year )
Construction and reconstruc-tion of the primary distribu-tion network.
Modernisation of power lines and transformer sta-tions and further development of the distribution network will provide better coverage for final con-sumers and will improve the overall performance of the distribution system and reduce electricity losses. In addition, the system will be optimised through in-troduction of an automation system, smart metering and remote system operation and management.
23.17
Improvements to the second-ary distribution network.
19.47
Management of and auto-mation of the distribution network.
2.12
Development of a concept programme for the distri-bution network as well as introduction of modern ICT, measurement systems and smart-grid solutions.
49.00
Source: Action Plan for EDS implementation for the period 2016-2020
9.2.3. Regulation of the TSO and DSOMontenegro’s transposition of the EU’s Energy Efficiency Directive (EED) requires implementing Article 15, which relates to improving energy efficiency and demand response (EED) in gas and electricity networks:
Article 15(1) of the EED requires that “Member States shall ensure that national energy regulatory authorities pay due regard to energy efficiency in carrying out the regulatory tasks specified in Directives 2009/72/EC and 2009/73/EC regarding their decisions on the operation of the gas and electricity infrastructure”.
Annex XI elaborates that “Network tariffs shall be cost-reflective of cost-savings in networks achieved from demand-side and demand- response measures and distributed generation, including savings from lowering the cost of delivery or of network investment and a more optimal operation of the network.”
Article 15(4) requires that “Member States shall ensure the removal of those incentives in transmission and distribution tariffs that are detrimental to the overall efficiency

141
9. Assessment of the Energy Efficiency Potential and Policies at the Sectoral Level
(including energy efficiency) of the generation, transmission, distribution and supply of electricity or those that might hamper participation of demand response, in balancing markets and ancillary services procurement. Member States shall ensure that network operators are incentivised to improve efficiency in infrastructure design and operation, and, within the framework of Directive 2009/72/EC, that tariffs allow suppliers to improve consumer participation in system efficiency, including demand response, depending on national circumstances.”
Tariff design can have a significant impact on energy efficiency because:
- the methodology used to determine the level of allowed revenues can motivate, or not motivate, network/system operators to improve energy efficiency; and
- how revenues are collected, through end-user tariffs, can influence energy consumers to consume energy more efficiently or in a fashion that is more aligned with power system needs.
Since July 2016, the allowed revenues and end-user tariffs for the use of electricity transmission and distribution systems have been determined by REGAGEN using hybrid methodologies.104 The methodologies are based on principles intended to: improve transparency; offer non-discriminatory access to networks; facilitate trading and competition; create favourable investment conditions; avoid cross-subsidies; reduce costs; and encourage improvement of cost efficiency.
Aside from the day/night energy rate, which is cheaper in the day time compared to night time, and the provision of energy savings information on its website,105 the EPCG does not offer any energy saving services or incentives to its customers. EPCG could move in the direction of offering its customers more targeted time-varying pricing and energy services to reduce or shift demand and thereby assist with improving power system efficiency and costs. However, in the absence of Government intervention or regulation, it is not incentivised to do so beyond meeting its own needs (self-balancing). After all, its core business is generation and supply of electricity, and therefore maximising energy sales is the priority.
Tariffs should be cost-reflective such that they recuperate all costs, but, more specifically, costs should be allocated to consumers in a cost-reflective way. At the same time, the design of end-user tariffs should send consumers efficient price signals, reflecting the costs consumers impose when using the networks so that they respond appropriately. If the latter is achieved, then costs will consequently be allocated to consumers in a cost-reflective way. Some tariff designs, however, might allocate costs to consumers in a cost-reflective way, but fail to send consumers efficient price signals so that they are unaware of the costs they are causing and therefore miss the opportunity to influence consumer behaviour effectively in a way that could reduce power system costs and yield system benefits.
Volumetric end-user tariffs (Euro/kWh) do encourage consumers to be energy efficient, as the more electricity they use, the more they have to pay. Inclining block rates enhance this effect. However, it is capacity, not energy, that is the driver of network costs. The combined capacity of users can drive the need for network reinforcements or cause network congestion and power system reliability issues.
104 http://regagen.co.me/cms/public/image/uploads/CGES_METODOLOGIJA_ZA_RDP_precisceni_tekst3.pdf http://regagen.co.me/cms/public/image/uploads/CEDIS_METODOLOGIJA_ZA_RDP_precisceni_tekst3.pdf (accessed June 2018)105 See EPCG website: https://www.epcg.com/en/households/energy-savings (accessed June 2018)

142
In-Depth Review of the Energy Efficiency Policy of Montenegro | 2018
A study was conducted in 2015 to analyse the extent to which Montenegro’s regulatory framework is aligned (or otherwise) with the requirements of Article 15.106 The current approach allocates allowed revenues (i.e. historical costs) to each voltage level based on load, whereas allocating costs to consumer categories based on marginal costs, load profiles and voltage level would be more forward-looking and have a greater impact on consumer behaviour. The latter approach is recommended particularly if modernisation investments are being made that are load-related or if losses are high due to overloading.
Another issue relates to the application of demand charges in the network tariffs.107 These are based on the customer’s peak energy demand (average of every month of the year) and are not based on usage coincident to the system peak, nor are they focused on the season when energy demand is highest. The study recommends consideration of a time-of-use (ToU) tariff design, to be applied over specific time periods in order to target peak demand reduction. Managing peak demand can prevent or reduce network reinforcements and can also reduce network energy losses, as they are highest at peak times. The study estimated that if ToU is applied only to customers connected at 10kV and higher, potential monetary savings could be €2.1 million per annum. Further impact analysis and consultation is necessary, however, before ToU tariffs are introduced.
Following the rollout of smart meters. and learning from experience, if the regulator started with simple ToU design applied at the higher voltage levels, the regulator would, in time, be in a position to gradually increase the coverage and sophistication of dynamic pricing, including for households.
9.2.4. Power system lossesThe losses incurred in the transmission system in 2017 were lower than the TSO allowed (technical) losses approved by REGAGEN (see Section 4.1.2.). However, the actual distribution losses remain significantly higher than the allowed level, though gradual improvements have been achieved over the years.
Figure 28 illustrates the dynamics of distribution electricity losses during the period of 2007–2017 and the level of losses that the regulator, REGAGEN, has allowed to include in the retail electricity price since April 2011 (see Section 4.1.2).
106 “Energy Efficiency in Network Tariffs and Market Regulation – Policy Paper”, October 2015. Conducted by Economic Consulting As-sociates and Karanovic/Nikolic and submitted to the EBRD, Energy Community Secretariat and the Montenegro Technical Working Group
107 See Annex 1 – the component is referred to as ‘network capacity occupancy’.

143
9. Assessment of the Energy Efficiency Potential and Policies at the Sectoral Level
Figure 28: Dynamics of distribution electricity losses, 2007–2017, % of input
22.76 22.97 22.79
19.99 19.1920.84
18.9617.65 17.11
15.61 14.96
9.00 9.00 9.00 9.00 8.43 8.43 8.43
4.006.008.00
10.0012.0014.0016.0018.0020.0022.0024.00
2007 2008 2009 2010 2011 2012 2013 2014 2015 2016 2017
DSO (total) DSO (allowed)
Source: REGAGEN, 2018
The ‘technical losses only’ approach was introduced by REGAGEN in April 2011 based on the corresponding decision of the Constitutional Court. In 2013, DSO conducted a study “Reduction of Power Losses in the Electro-Distributing Networks of Montenegro” that was submitted to REGAGEN for the technical justification for the DSO component. However, there have not been any other studies or publications on cost-effective ways to fight non-technical losses and whether the distribution company, CEDIS, had sufficient instruments and resources to decrease its losses by more than two times in a short period of time.
It should be also noted that in 2007, before the start of the first regulatory period, REGAGEN requested the development of a multi-annual programme of distribution network loss reduction. The DSO submitted this programme based on a study conducted by Technical University for DSO indicating that the level of losses in 2011 would be 11%, including 9% technical and 2% commercial losses. However, this projection had not been met even as late as 2017. There is also no public information related to strengthening the responsibility of consumers for electricity thefts during 2007–2017.
Indeed, there are costs involved in the reduction of losses that would need to be set against the benefits, but it is clear that considerable potential exists. Figure 29 reveals that in 2014, electricity losses in Montenegro were among the highest in the region, after FYROM and Albania, and almost two times higher than the average in Europe and Central Asia.
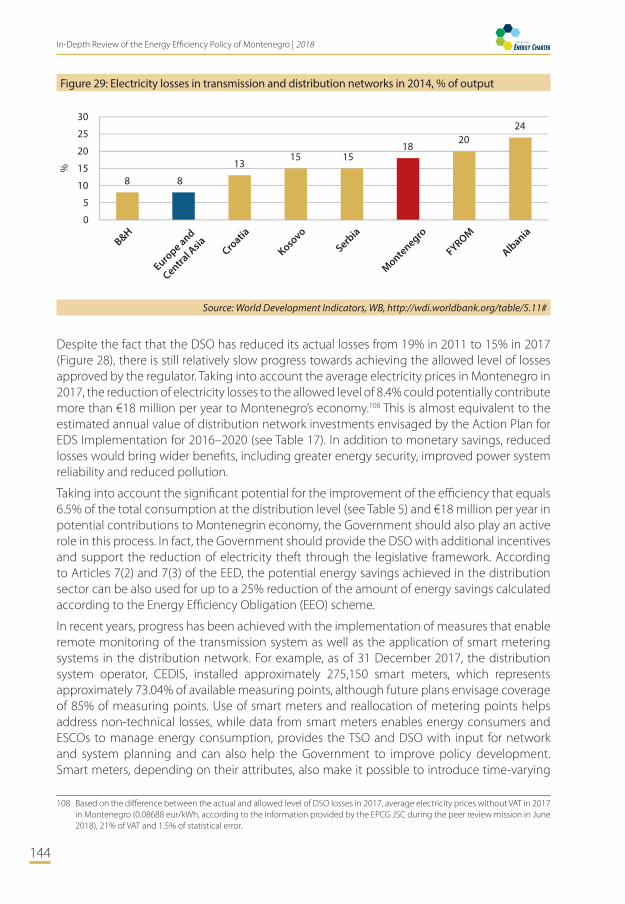
144
In-Depth Review of the Energy Efficiency Policy of Montenegro | 2018
Figure 29: Electricity losses in transmission and distribution networks in 2014, % of output
8 8
1315 15
1820
24
0
B&H
Europe and
Central A
sia
5
10
15
20
25
30
%
Croatia
Kosovo
Serbia
Montenegro
FYROM
Albania
Source: World Development Indicators, WB, http://wdi.worldbank.org/table/5.11#
Despite the fact that the DSO has reduced its actual losses from 19% in 2011 to 15% in 2017 (Figure 28), there is still relatively slow progress towards achieving the allowed level of losses approved by the regulator. Taking into account the average electricity prices in Montenegro in 2017, the reduction of electricity losses to the allowed level of 8.4% could potentially contribute more than €18 million per year to Montenegro’s economy.108 This is almost equivalent to the estimated annual value of distribution network investments envisaged by the Action Plan for EDS Implementation for 2016–2020 (see Table 17). In addition to monetary savings, reduced losses would bring wider benefits, including greater energy security, improved power system reliability and reduced pollution.
Taking into account the significant potential for the improvement of the efficiency that equals 6.5% of the total consumption at the distribution level (see Table 5) and €18 million per year in potential contributions to Montenegrin economy, the Government should also play an active role in this process. In fact, the Government should provide the DSO with additional incentives and support the reduction of electricity theft through the legislative framework. According to Articles 7(2) and 7(3) of the EED, the potential energy savings achieved in the distribution sector can be also used for up to a 25% reduction of the amount of energy savings calculated according to the Energy Efficiency Obligation (EEO) scheme.
In recent years, progress has been achieved with the implementation of measures that enable remote monitoring of the transmission system as well as the application of smart metering systems in the distribution network. For example, as of 31 December 2017, the distribution system operator, CEDIS, installed approximately 275,150 smart meters, which represents approximately 73.04% of available measuring points, although future plans envisage coverage of 85% of measuring points. Use of smart meters and reallocation of metering points helps address non-technical losses, while data from smart meters enables energy consumers and ESCOs to manage energy consumption, provides the TSO and DSO with input for network and system planning and can also help the Government to improve policy development. Smart meters, depending on their attributes, also make it possible to introduce time-varying
108 Based on the difference between the actual and allowed level of DSO losses in 2017, average electricity prices without VAT in 2017 in Montenegro (0.08688 eur/kWh, according to the information provided by the EPCG JSC during the peer review mission in June 2018), 21% of VAT and 1.5% of statistical error.

145
9. Assessment of the Energy Efficiency Potential and Policies at the Sectoral Level
pricing and enable demand response, which can help reduce technical losses, as they are greatest in times of peak demand, and can also help avoid the need for the relatively expensive reinforcement of grid capacity.
9.2.5. Distribution network capacity and DSMIncreased demand for electricity caused by intensive construction (see Section 9.1.), especially in Podgorica and the coastal region of Montenegro, resulted in new challenges for the development and operation of the distribution network. An additional challenge for the distribution network is also related to the connection of small HPPs (with the installed capacity above 1 MW) in the Northern region of Montenegro, where the capacity of power lines is insufficient and additional network investments are needed.
Ranked by the World Bank at 127 among 190 countries on the “Ease of Getting Electricity” indicator, Montenegro has clearly challenges in providing new customers with access to the electricity network, particularly considering that the country performs relatively well overall in the bank’s “Ease of Doing Business” assessment, claiming the 42nd position (see Section 1.2). The management of the DSO, Crnogorski elektrodistributivni system, is well-informed about the low rank of the country related to the ease of getting electricity and works on the improvement of procedures relating to grid connection. According to the information provided during the Peer Review mission to Podgorica in June 2018, the DSO has already decreased the number of procedures to obtain a permanent electricity connection from 7 to 4 in 2018. The management of the DSO considers that the decrease in the number of procedures should lead to the improvement of the country’s rating from 127 in 2018 to 95 in 2019.
As of June 2018, demand side management is not a feature of planning processes relating to electricity system development. The growing electricity demand is primarily met by the development of new generating capacities and electricity network reinforcement. The methodology for the determination of allowed revenues and prices for the use of electricity transmission and distribution systems (see Section 4.1.2) does not allow DSM expenditures to be included in the allowed revenues of the TSO and DSO. At the same time, the TSO and DSO plan to develop a study on the potential application of EE measures and DSM.
Demand-side measures deserve to be evaluated routinely against supply-side options in network planning and resource adequacy or reliability assessment processes. In many jurisdictions around the world, utilities are required to seek out the least expensive options for developing and investing in the energy system, with full consideration of energy efficiency investment opportunities and of various benefits, including system reliability, reduced greenhouse gas emissions and positive economic impacts. Even though these requirements and assessment methodologies identify cost-effective energy efficiency or DSM potential, mechanisms are still needed for their delivery.
EPCG or CEDIS could be mandated to deliver energy efficiency improvements on the demand side. Around the world, there are (e.g. many EU countries, some US states, Brazil, China and South Africa) many examples of energy suppliers or distribution system operators who are obligated to achieve energy demand reduction and DSM. This does not mean obligated actors necessarily have to deliver investments; obligated parties are responsible for achieving goals and therefore can establish mechanisms (e.g. auctions, procurement tenders) for delivery. Within the EU, many Member States are opting to introduce Energy Efficiency Obligations (EEO) in order to implement Article 7 of the EU Energy Efficiency Directive. As mentioned in the previous Section, 9.2.3, one of the proposals developed within the EBRD-implemented project includes the introduction of

146
In-Depth Review of the Energy Efficiency Policy of Montenegro | 2018
the EEO to the EPCG with a specific target for achieving EE savings in low-income households.109 However, as of June 2018, the EEO scheme is still under development (see Section 5.2.).
Considerable progress has been achieved in promoting the participation of big consumers in the ancillary services market. In 2015, an EBRD-funded study concluded that there was no clear route to market for demand-side response, as there are no known tender processes nor are there clearly defined technical modalities for their market participation.110 To align with Article 15 of the EED, the study recommended that the TSO, CGES, be obligated to ensure adequate information is clearly advertised on its website concerning the timetable of expected auctions for ancillary services,111 rules for participation, minimum technical requirements (including aggregation), application forms and pro forma of contracts. In 2016, REGAGEN adopted the Methodology for setting prices, deadlines and conditions for providing ancillary and balancing services to TSO,112 which introduces the possibility for consumers to take part in the balancing of the electricity market. Namely, the methodology defined conditions and prices for providing tertiary reserve from big consumers. At the same time, the participation of consumers is not actively promoted by the TSO and REGAGEN.
Currently, there are no regulatory incentives or programmes for DSM. Ancillary services costs, including the costs related to tertiary reserve services from big consumers, are considered as a part of allowed revenue of the TSO. However, the methodology for the determination of allowed revenues and prices for the use of the electricity transmission and distribution systems does not allow DSM expenditures to be included in the allowed revenues of the TSO and DSO. During the Peer Review Mission in June 2018, the representatives of the TSO and DSO confirmed that the DSM cannot be financed from their allowed revenue, even if such measures are more cost-effective in comparison with the reinforcement of the network to meet the growing electricity demand. At the same time, the Energy Law (art. 112 and 116) and Network Codes prescribe obligations to TSO and DSO to include concrete measures improving energy efficiency in a cost-effective way in their investment plans. However, there are no specific provisions or incentives related to DSM measures in the legislative framework. Quality of service regulation and performance-based regulation can also be used to incentivise achievement of goals related to energy efficiency and DSM.113
9.2.6. Protecting vulnerable consumers and addressing energy povertyGovernments in many countries allow discounts for low-income consumers, as it is recognised that energy is crucial to societal development and welfare. The design of such discounts and support varies widely, ranging from payments during the winter season to help cover energy bills when heating costs are high, to electricity tariff design where the first block of electricity consumption per period of time is heavily discounted. Such discounts or electricity tariffs are typically only available to very small users of power and/or low-income users. In many jurisdictions, where it is recognised that inefficient homes are a major part of the energy poverty problem, qualifying vulnerable energy consumers might be eligible to claim grants for energy-saving measures or products such as highly energy efficient boilers or insulation.
109 http://www.ebrd.com/cs/Satellite?c=Content&cid=1395250338716&d=Mobile&pagename=EBRD%2FContent%2FContentLayout (accessed June 2018)
110 “Energy Efficiency in Network Tariffs and Market Regulation – Policy Paper”, October 2015. Conducted by Economic Consulting As-sociates and karanovic/nikolic and submitted to the EBRD, Energy Community Secretariat and the Montenegro Technical Working Group
111 The study recommended to start with tertiary reserve and to progress to secondary and primary reserve/regulation in time once experience and learning had been obtained.
112 Official Gazette of Montenegro 44/2016 and 40/2017113 “Performance-Based Regulation for EU DSOs”, Jim Lazar, Regulatory Assistance Project, 2014. Available at: https://www.raponline.
org/knowledge-center/performance-based-regulation-for-eu-distribution-system-operators/ (accessed June 2018)

147
9. Assessment of the Energy Efficiency Potential and Policies at the Sectoral Level
In Montenegro, financial support is provided to vulnerable consumers in the form of a 40% subsidy for electricity bills up to 60 €/month or €24 for electricity bills over €60 (as explained in Section 4.2). From 2011–2016, the number of consumers eligible to receive subsidies increased by almost 50%, and the total amount of subsidies increased by almost 70% (see Table 6). According to the latest available information provided by the Ministry of Economy, these figures continue to grow. For example, in June 2017 there were 20,766 households eligible for subsidies, an increase of 2% relative to December 2016. The distribution of vulnerable consumers and subsidies received by size of electricity bill is illustrated in Figure 30.
Figure 30: Share of vulnerable consumers (on the left) and total amount of subsidies (on the right) by size of electricity bill, June 2017, %
2% 2%
25%
38%
15%
4%
3%
7%
34%
37%
25%
8%
Up to 20 EUR 20 – 40 EUR 40 – 60 EUR 60 – 80 EUR 80 – 100 EUR more than 100 EUR
Source: Energy Charter Secretariat based on data provided by the Ministry of Economy, 2018
Figure 30 indicates that the shares of vulnerable consumers with electricity bills of up to 20 €/month and 40-60 €/month were almost the same, as each category represented about 25% of the total number of vulnerable households. At the same time, consumers spending less than 20 €/month for electricity received 7% of total subsidies, whereas 40-60 €/month consumers received 37%. Similarly, the 12% of vulnerable consumers spending more than 60 €/month received a relatively larger share of the subsidies, at 22%. There currently exist no government programmes targeting energy efficiency improvements in the homes of vulnerable consumers.
During the last five years, the Government of Montenegro spent around €15 million subsidising the electricity bills of vulnerable consumers (see Table 6). Part of this money could have been channelled towards targeted energy efficiency programmes for the low-income consumers that are really struggling to pay their bills and keep their homes warm. Such targeted energy efficiency programmes are typically more cost-effective than electricity bill subsidies in the long run. The programmes can also deliver co-benefits, such as more business for the ESCO industry, and associated benefits such as job creation, improved health of all household members, associated economic productivity benefits, reduced burden on the public health service and power system benefits due to energy demand reduction.

148
In-Depth Review of the Energy Efficiency Policy of Montenegro | 2018
Good examples can be derived from the “Living better” programme in France114 that provides financial support to improve the performance of vulnerable consumers’ houses through different types of grants and loans. The programme estimates an average 38% reduction of energy bills post-renovation.115 Another example from Wales, UK – a strategic energy performance investment programme, “Arbed” – provides evidence that energy efficiency investments help to eradicate fuel poverty and, at the same time, boost economic development and support regeneration at regional scale.116
The UK, France and a number of other EU MS have introduced requirements for energy suppliers to achieve energy savings in low-income households as a part of the Energy Efficiency Obligation (EEO) scheme. The study “Support for the development of an EEO scheme”, implemented by EBRD within the REEP project,117 also highlights the potential for Montenegro to target its vulnerable households through an obligation scheme. However, as of June 2018, the EE obligation scheme in Montenegro is still under development (see Section 5.2).
9.2.7. Main Barriers IdentifiedSummarising the key findings and conclusions of the previous chapters, the following main barriers have been identified:
- There was relatively slow progress in the reduction of DSO losses from 2011–2017; There are no official plans or voluntary agreements indicating a timeframe for the reduction of the actual distribution losses to the allowed level;
- There is insufficient support of the Government compared to the level of potential energy savings and wider benefits for the economy from the reduction of distribution losses to the allowed level;
- There is a lack of competition in the electricity supply market, where all consumers, except large energy consumers, have remained supplied by the EPCG since the opening of the market in January 2015;
- The methodology for the determination of allowed revenues and prices for the use of the electricity transmission and distribution systems does not explicitly allow or promote DSM expenditures to be included in the allowed revenues of the TSO and DSO;118
- DSM does not feature in the planning processes for electricity system development in Montenegro. The growing electricity demand is primarily met by the development of new generating capacities and electricity network reinforcement;
- There are no regulatory incentives, tariffs or programmes to promote targeted load shifting or peak demand reduction. Demand-side energy resources are not currently participating in balancing markets;
114 Habiter Mieux programme, https://www.energypoverty.eu/measure-policy/living-better-programme 115 https://www.anah.fr/fileadmin/anah/Mediatheque/Publications/Les_aides/Dossier_d_info_Habiter_Mieux.pdf (accessed June
2018)116 https://gov.wales/topics/environmentcountryside/energy/efficiency/arbed/?lang=en (accessed June 2018)117 http://www.ebrd.com/cs/Satellite?c=Content&cid=1395250338716&d=Mobile&pagename=EBRD%2FContent%2FContentLayo
ut (accessed June 2018)118 During the Peer review mission in June 2018, the representatives of the TSO and DSO confirmed that the demand-side measures
cannot be financed from their budget even if such measures are more cost-effective than the reinforcement of the network to meet the growing electricity demand.

149
9. Assessment of the Energy Efficiency Potential and Policies at the Sectoral Level
- Current day and night tariffs are not based on usage coincident to system peak (i.e. day tariffs do not address system peaks during specific hours of weekdays), nor are they focused on the season when energy demand is highest;
- Subsidies for vulnerable consumers are unsustainably high. They have increased substantially in recent years and continue to grow.

150
In-Depth Review of the Energy Efficiency Policy of Montenegro | 2018
Recommendations: Power Sector
7. Prioritise the measures targeting the reduction of distribution electricity losses to the allowed level. The DSO and CEDIS should be provided with additional incentives and support to efficiently fight commercial losses. The reduction of the distribution losses to the allowed level can additionally contribute to the country’s economy with more than €18 million revenue per year. Thus, the costs needed to speed up the reduction of the losses should be evaluated against the benefits for the economy. According to Articles 7(2) and 7(3) of the Energy Efficiency Directive, the reduction of losses in the distribution network can be also used for a reduction of up to 25% of the amount of energy savings calculated according to the Energy Efficiency Obligation (EEO) scheme.
8. Conduct further reforms supporting the competition in the electricity supply market. The expected further integration of Montenegro’s wholesale electricity market into wider regional markets will put downward pressure on the wholesale electricity price, but the benefits will likely not pass through to Montenegrin electricity consumers if they only have access to one supplier. The price reductions that come with more competitive markets are a crucial counter-weight, in terms of achieving public acceptance, to new charges that may need to be added to consumer bills to support interventions such as energy efficiency programmes (even if they provide net benefits).
9. Prioritise the development of the TSO and DSO study on the potential application of EE measures at the demand side. Based on the results of the study, introduce amendments to the TSO and DSO tariff methodologies in order to use the least expensive approach to the network development. Both the TSO and DSO can be required to pursue a least-cost approach to network/system development and investment by properly assessing and exploiting EE and DSM solutions. The regulator should be more proactive in mobilising DSM by imposing obligations on the TSO and DSO. The TSO and DSO can be also mandated to deliver energy savings as a part of the EEO scheme, as they have overall access to the information on network congestion and the need for location of demand reduction.
10. Network operators can be required to encourage demand side participation in ancillary service auctions by improving procedures and communications. The TSO should ensure that adequate information concerning the timetable of expected auctions for ancillary services, rules for participation, minimum technical requirements (including aggregation), application forms and pro forma of contracts are clearly advertised on their websites.
11. The regulator should review electricity tariff design, taking into account available studies in order to align with Article 15 of the EED. Customers’ tariffs should encourage efficient consumption of energy and response to actual power system needs.

151
9. Assessment of the Energy Efficiency Potential and Policies at the Sectoral Level
12. Review the scheme for providing subsidies for vulnerable consumers in order to ensure much greater targeting of subsidies to those in real need. Ensure that the design of the subsidy mechanism encourages energy efficient behaviour, for example, by weighting support more heavily on the first units of electricity consumption, declining as consumption increases. Drawing from EU best practices and EPOV, use the subsidy mechanism as a means to gather necessary information that can be used to design and deliver effectively targeted energy efficiency measures for vulnerable households. Decide which authority or market actor will be responsible for overseeing and delivering the initiative. Energy suppliers can be also mandated to deliver energy efficiency measures for vulnerable consumers as a part of the EEO scheme.

152
In-Depth Review of the Energy Efficiency Policy of Montenegro | 2018
9.3. Industry
9.3.1. Sector Overview and ConsumptionIn the 2000, industry was responsible for almost half of the final energy consumption in Montenegro. During this time, more than 70% of industry’s energy consumption was accounted for by the highly energy intensive aluminium industry (Kombinat Aluminijuma Podgorica, KAP) and the steel industry (Steelwork Niksic). A significant reduction of production in both companies occurred in 2009, resulting in more than a 50% decrease in energy consumption. This descending trend continued in the following years, but in 2016, both companies still consumed about half of industry’s total energy demand (Figure 31), although industry’s share of final energy consumption was only 16% (Figure 10).
Figure 31: Overview of the final energy consumption of key industries, ktoe
0
50
100
150
200
250
300
350
400
2007 2008 2009 2010 2011 2012 2013 2014 2015 2016
Non‐ferrous metals Iron and steel Iron and steel Wood and wood products Others
Source: Montenegro Statistical Office, Energy Balances, 2017
Although these two major companies (KAP and Steelwork Niksic) were privatised in the 2000s, their operation was not sustainable due to the fact that production was based on obsolete technologies (40-50 years old). At that time, the state provided the companies with generous support, mainly in the form of subsidised electricity tariffs. These tariffs, however, did not incentivise the companies to invest in new EE technologies. Providing subsidies to the inefficient companies was a significant burden for the state budget. An unsustainable situation came to a head in 2009 during the world economic crisis, when aluminium and iron prices experienced a significant decline in the world market. This immediately resulted in production curtailment for both companies, creating an unfavourable situation for the Montenegrin economy and labour market. From 2010 onwards, the Government has supported organisational restructuring in both companies so that redundant workers would be targeted by appropriate employment and social programmes. As of May 2018, the operation of both companies is stable, but their output is significantly lower compared to pre-2009 production levels.
The long-standing problems associated with the industrial sector, the modernisation of which would require significant investments, caused the Government of Montenegro to re-examine its economic policy and re-orient the economy towards the development of other sectors

153
9. Assessment of the Energy Efficiency Potential and Policies at the Sectoral Level
(tourism and SMEs) in order to increase competitiveness (see Chapter 1). The success of this policy reorientation is reflected by growth in certain sub-sectors and associated growth in energy demand. For example, during the period of 2007–2015, energy consumption by the food and tobacco industries and the wood/wood products sectors increased by factors of 2.5 and 10, respectively.
9.3.2. Assessment of the Existing Energy Efficiency PotentialThere are no specific studies or analyses that estimate the energy efficiency potential of Montenegro’s industrial sector. Figure 32 shows that more than 50% of the industry’s energy consumption is accounted for by the aluminium and steel companies. The remaining energy consumption is accounted for by food and tobacco (16%), wood and wood products (10%), mining (4%), chemical and petrochemical companies (4%) and the “non-specified” category or companies not belonging to other consumer categories (15%). Other sectors, like machinery and non-metallic minerals, cumulatively account for about 5% of the final energy consumption by industry (Figure 32).
Figure 32: Final energy consumption by industry sub-sector in 2016, ktoe
Non‐ferrous metals39.3%
Food and tobacco16.0%
Non‐speci�ed14.7% Wood and wood
products10.0%
Iron and steel6.7% Mining and
4.0%
Chemical apetrochem
3.6%Machinery
3.0%
Nmm
Paper, pulp a0.5%
Textile and 0.4%
Quarrying
and
Non‐metallic
inerals1.7%
and print
Leather
ical
Source: Montenegro Statistical Office, Energy balances, 2017
Figure 32 shows that aluminium production consumes about 40% of the energy used by the industrial sector, but there are no publically available studies or energy audit reports estimating the energy savings potential of KAP. However, it is possible to roughly estimate the potential savings based on the available statistical data on KAP’s output and electricity consumption, as

154
In-Depth Review of the Energy Efficiency Policy of Montenegro | 2018
well as benchmark indicators from a 2015 JRC study.119 According to the results of the analysis presented in Table 18, it can be assumed that the average consumption of electricity per kilogramme of the produced aluminium T-ingots by the KAP was about 7%-18% higher than the best available technology during 2012–2015.
Table 18: Potential savings from the production of aluminium
Indicator 2012 2013 2014 2015 2016
Unwrought non-alloy aluminium, tonns 74,813 47,951 42,767 42,499 38,915
Electricity consumption, ktoe 96.49 63.20 57.34 55.43 47.23
Total electricity consumption, GWh 1122.16 735.00 666.87 644.63 549.33
Specific consumption, kWh/kg 15.00 15.33 15.59 15.17 14.12
2015 Benchmark, state of art, kWh/kg120 13.2 13.2 13.2 13.2 13.2
Potential savings, ktoe 11.6 8.8 8.8 7.2 3.1
Source: Energy Charter Secretariat based on Montenegro Statistical Office, Energy Balances, 2017 and benchmarking JRC study, 2015
Table 18 also shows that the energy efficiency of the plant improved over time, with a notable step change in 2012 and 2016, but these energy efficiency improvements cannot be supported by publically available information. The current potential energy savings now stand at 3.1 ktoe, falling from 11.6 ktoe in 2012, although both aluminium output and electricity consumption has approximately halved during this time.
Analysis of energy audits of other aluminium plants in Tajikistan and Romania can provide helpful insights and information. In general, the results of the audits illustrate that investments in EE measures generally have a short payback time and positively influence the prosperity and competitiveness of the concerned companies participating in international markets. For example, the energy audit of Tajik TALCO Aluminium company, funded by the WB,121 showed that the simple payback for the majority of the proposed energy efficiency measures was less than two years. The results of the energy audit of Romanian ALRO allowed the company to identify cost-effective measures and attract more than 180 million USD of investments in EE projects that consequently helped the company to increase its competitiveness and meet EU environmental requirements.122 From 2015 onwards, according to the EU Energy Efficiency Directive and Romanian legislation for energy efficiency, ALRO is required to undertake a mandatory energy audit carried out by an independent auditor that is certified by the Romanian Energy Regulatory Authority (ANRE).
The introduction of mandatory energy audits for large enterprises according to the requirements of the EU Energy Efficiency Directive helps companies to identify investment opportunities that can increase their productivity and competitiveness in international markets.
119 Benchmarking JRC study 2015 as presented in https://ec.europa.eu/energy/sites/ener/files/documents/023_c_marian_cilianu_seif_bucharest_01-02-18.pdf (accessed June 2018)
120 Ibid 121 http://documents.worldbank.org/curated/en/886731468131731121/pdf/NonAsciiFileName0.pdf (accessed June 2018)122 Ibid

155
9. Assessment of the Energy Efficiency Potential and Policies at the Sectoral Level
An illustration of the multiple benefits that can result by implementing energy efficiency measures and modern technologies is provided through a comparison of a similar type aluminium production companies operating in Montenegro and Romania (Table 19).
Table 19: Comparison of similar size aluminium production companies in Montenegro and Romania
Indicator Romanian ALRO
Montenegrin KAP
Year of construction (start of operation) 1963 (1965) 1969 (1971)
Year of privatisation 2002 2005
Amount of investment company received since its privatisa-tion
$570 million n/a
Designed production capacity, thousand tons of aluminium per year
270 120
Production in 2015, thousand tons of aluminium per year 288 42.8
Specific consumption in 2015, kWh/kg 13.2 15.6
Average Electricity Costs in 2015 5 €c/kWh 5 €c/kWh
Production of ingots (with the lowest added value) 10% 100%
Production of slabs for rolling, aluminium alloy bars, billets and wire (with high added value)
90% 0%
Number of employees 2450 500
Average Salary 1450 €/month 800 €/month
Source: Energy Charter Secretariat based on https://aluminiuminsider.com/alro-flourishes-kap-flounders/, https://ec.europa.eu/energy/sites/ener/files/documents/023_c_marian_cilianu_seif_bucharest_01-02-18.pdf
The results of the analysis presented in Table 19 reveal the importance of the implementation of EE measures for highly energy intensive industries and the creation of regulatory framework incentivising companies to identify and implement such measures. In the case of Romanian ALRO, the company not only improved the efficiency of its production, but also started producing more than 90% of products with comparatively higher added value. Whereas 100% of KAP’s outputs represent lower added value products, that, together with the higher energy intensity, result in the less production, redundancy and lower salaries in comparison with Romanian ALRO.
Indeed, the transformation to higher value production depends on a number of factors, including greater efficiency, but also a professional skill base, research and development and international or domestic demand. The 2017 KAPSARC study revealed that the evolution of energy-intensive industries requires careful policy management to maintain a competitive advantage while creating more higher added value products and activities.123 The government of Montenegro could undertake similar benchmark analyses for other industrial sub-sectors. However, the most important aspect is that the energy policy should consider energy audits and energy management systems as tools for achieving a variety of benefits in addition to energy savings, such as the possibility to attract new investments, create jobs and increase the competitiveness of local products in international markets.
123 https://www.kapsarc.org/wp-content/uploads/2017/09/KS-2017-WB08-How-to-Achieve-Economic-Prosperity-Through-In-dustrial-Energy-Productivity-Improvement-.pdf (accessed June 2018)

156
In-Depth Review of the Energy Efficiency Policy of Montenegro | 2018
Since June 2014, energy audits have been mandatory in EU Member States for all large enterprises124 that employ over 250 persons or have an annual turnover exceeding €50 million and/or an annual balance sheet total exceeding €43 million. The introduction of mandatory energy audits for large enterprises is a requirement of the Energy Efficiency Directive, which is also obligatory for Montenegro from 2016 onwards, although it is yet to be transposed into the national legal framework. International best practice shows that the introduction of mandatory energy audits and the application of energy management systems deliver significant energy savings, especially if implementation of EE measures is supported by financial incentives, emission trading system (ETS) or soft loans provided by the government or international financial institutions.
The introduction of minimum energy standards for industrial products such as electric motors, ventilators, water pump, circulation pumps and transformers could also deliver significant energy and cost savings. For example, the replacement of inefficient motor systems with modern ones can, on average, save up to 40% of consumed energy. It is estimated that 30% of global electricity consumption is used in industrial electric motor-driven systems,125 and the potential for energy efficiency improvement from replacing motors is significant in many countries.
Montenegro has adopted minimum energy standards for certain industrial products by transposing relevant EU ecodesign regulations into its national framework (see Section 5.2). However, this policy measure is related to placing industrial equipment on the Montenegrin market; incentives are needed to drive the take-up of the more efficient equipment. Therefore, the main challenge besides the implementation of the adopted legal framework for ecodesign will be to determine and implement the means of encouraging the replacement of existing inefficient equipment with more efficient equipment (e.g. financial incentives, audit implementation requirements, penalties).
It is expected that the introduction of mandatory energy audits for large enterprises, promotion of energy audits among SMEs, introduction of incentives for industry and a wider implementation of ecodesign requirements can substantially contribute to improved energy efficiency, industrial productivity and greater economic prosperity.
9.3.3. Existing Policies and Implementation
Mandatory energy auditsThere are no requirements for mandatory energy audits for large enterprises in Montenegro, but there are specific obligations for large energy consumers126 to keep records regarding their energy consumption, planned EE measures and implementation progress and to report this information to the Ministry of Economy on an annual basis. These reporting obligations for large energy consumers were introduced in December 2015, but enforcement of this policy is lacking, as national law allows large enterprises not to follow the legal requirements if they do not declare themselves as large enterprises (see Section 5.2). As of May 2018, none of the large consumers had registered with the Ministry of Economy according to the requirements of the Law on Efficient Use of Energy adopted in 2014.
Availability of high quality energy auditsAn energy audit certification scheme exists in Montenegro, but its scope is currently limited to the building sector.124 Large enterprises are defined according to Commission Recommendation 2003/361/EC of 6 May 2003. 125 2016 IEA World Energy Outlook126 Companies with total annual consumption of primary energy exceeding 10,000 MWh

157
9. Assessment of the Energy Efficiency Potential and Policies at the Sectoral Level
Energy management systemsAccording to the existing legal framework in Montenegro, energy management is recognised as an obligation for public sector entities and large consumers, but there is no national certification scheme for energy management or environmental systems standards in Montenegro. Also, there are no established training programmes for energy management which would develop local capacity and capability in this area.
Action Plan for the Implementation of the Energy Development Strategy of Montenegro for the period of 2016–2020The action plan does not envisage any specific measures targeting energy efficiency in the industrial sector of the economy. The improvement of EE in industry is recognised as a part of the horizontal activity for the establishment of the support programmes for the all sectors of energy consumption. Additionally, the action plan recognises the importance of the investigation of possibilities for use of waste heat from industry, but does not specify any particular measures in this area.
Energy Efficiency Action Plans for the period of 2016–2018The existing EEAP does not recognise industry as an important end-use sector in terms of potential energy savings, largely because of the long-lasting financial problems of the two largest companies: the aluminium plant in Podgorica (KAP) and Steelwork Niksic. The difficult financial situation of these companies (especially in the years following the world economic crises), as well as low levels of performance (due to outdated, inefficient technologies), resulted in the exclusion of KAP from the 2018 energy saving target at the time of its introduction in 2010. Although they were removed from the country’s energy efficiency target, large energy consumers could have been addressed separately (e.g. with individual targets). The exclusion of the KAP from the calculation of the energy saving indicative target (i.e. 9% energy savings by 2018 relative to average TFC from 2002–2006), and indeed from any requirement to take action, was also related to the company’s highly uncertain future.
Energy efficiency improvements for the industrial sector set out in the EEAP are expected to be delivered through energy management measures and EU product policy. There are no energy efficiency measures that are specific to the industrial sector (see Section 5.3).
Financial incentives Currently, there are no state incentive schemes, such as soft loans, grants or tax relief, to encourage industrial consumers to implement energy efficiency measures.
Demand-side management and load shiftingAluminium electrolysis can provide effective demand-side flexibility for the power system, as the power demand of the electrolysis process can be reduced by up to 25% for up to four hours without negatively impacting the process.127
Compared to aluminium production, steel manufacturing processes are more complicated industries to schedule.128 Nevertheless, steel producing factories are providing useful demand-response in various jurisdictions around the world; around half of the steel mills in Germany have pre-qualified their furnaces in the tertiary reserve market as positive capacity.129
127 Shoreh et al, “A Survey of Industrial Applications of Demand Response”, Shoreh et al, Electric Power Systems Research, Volume 141, December 2016, pp. 31-49
128 Ibid.129 Ibid.

158
In-Depth Review of the Energy Efficiency Policy of Montenegro | 2018
DSM programmes and prices need to be designed to deliver optimal outcomes for the industry providing the DSM services, the power system operator, TSO and DSO, as well as the wider society. It is necessary to understand properly the load profiles of the industries, the possible options for providing demand response (with effective management of trade-offs against energy efficiency) and the price/tariff designs and regulatory requirements that will enable the best options (e.g. inclining block rates; time-of-use pricing; critical peak pricing).
According to the information provided during the Peer Review Mission in June 2018, the existing methodology on ancillary services introduces the possibility for consumers to take part in the balancing of the electricity market, although a recent study identified that there is no clear route to market and changes could be made to enable this.130 The same study recommended that tariffs be revised to better incentivise consumers to provide demand response and to consume energy efficiently. There is no publicly available information on the actual participation of energy consumers in the ancillary services market.
EcodesignIn 2017, the Ministry of Economy adopted a number of bylaws introducing ecodesign requirements for energy-related products, which also cover equipment used in industry, namely, electric motors, ventilators, water pumps, circulators and lighting. This process is ongoing, with bylaws being developed to extend time horizons and include other groups of products (see Section 5.2).
ESCOImplementation of ESCO projects in the industry has not materialised in Montenegro, largely due to the fact that there exists little demand for energy services. Consequently, few ESCOs exist, and potential customers that might need ESCO services have little awareness of the ESCO concept and the existence of any ESCOs. Due to well-known market barriers, prices will not drive consumers to procure energy services. Governments and regulators must create the demand for energy services through energy efficiency mechanisms, programmes and other interventions.
That said, Governments do need to get pricing right so that energy consumers are appropriately guided by price signals and so that prices do not undermine the business case for energy efficiency. In addition, Governments can take action to support and facilitate development of the ESCO industry (e.g. technical support; awareness-raising; capacity-building; access to low cost finance).
9.3.4. Main Barriers IdentifiedSummarising the key findings and conclusions of the previous chapters, the following main barriers have been identified:
- There are insufficient data and information regarding technical and economic energy efficiency potential in the industrial sector;
- There is a legislation loophole allowing large energy consumers to choose not to declare themselves as such and therefore not to undertake energy management measures;
- The country’s EE target, as well as the EDS and EE Action Plans, do not target industry for energy efficiency improvements. Consequently, there are no supportive regulatory
130 “Energy Efficiency in Network Tariffs and Market Regulation – Policy Paper”, October 2015. Conducted by Economic Consulting As-sociates and karanovic/nikolic and submitted to the EBRD, Energy Community Secretariat and the Montenegro Technical Working Group

159
9. Assessment of the Energy Efficiency Potential and Policies at the Sectoral Level
arrangements or infrastructures, such as energy audit or Energy Management standards and certification procedures, training/certification schemes for energy auditors for industrial enterprises or financial incentives to encourage implementation of identified EE improvements;
- The justification for exempting industry from the country’s indicative energy saving target was based on concerns for KAP’s financial situation and uncertain future, and for the cost to industry more broadly that could affect profitability. This approach reveals decision-makers’ low awareness of the multiple benefits associated with improving energy efficiency, not only for industry but also for the TSO/DSO, electricity consumers and the wider society;
- Industry is not particularly encouraged by the TSO/DSO/regulator to provide demand reduction or demand response due to the reasons set out in Section 9.2.

160
In-Depth Review of the Energy Efficiency Policy of Montenegro | 2018
Recommendations: Industry
13. Appoint a responsible authority for the implementation of the energy audit system, training/certification of experts and monitoring of the implementation of the audit system in the country. The responsible authority should also facilitate and promote the implementation of the measures identified in energy audit reports.
14. Include industry in the calculation of EE targets for future periods, i.e. 2019–2030, and in the future Energy Development Strategy and EE Action Plans.
15. Transpose the requirements of the EE Directive related to the introduction of mandatory energy audits of large enterprises, amending the Law on Efficient Use of Energy accordingly. Introduce restrictive measures, including fines for non-compliance with mandatory energy audit requirements, and recycle the revenue from these fines to fund the energy audit system. Adopt international standards for conducting energy audits and for establishing energy/environmental management systems.
16. Establish training and certification schemes for energy auditors for industrial enterprises. Design an energy audit system as a self-funding instrument, where the revenue from conducting trainings and accreditation of energy auditors covers the costs related to its management and quality assurance.
17. Identify actions to facilitate the supply of and access to finance in order to enable industry’s finance and the implementation of EE measures identified in energy audit reports.
18. Develop support programmes to promote energy audits among SMEs, i.e. tax exemption or direct financial incentives to support the implementation of EE measures based on the results of the conducted energy audit, awareness raising campaigns, etc.
19. Increase awareness of ministries’ decision-makers and civil servants, energy sector stakeholders and the public regarding the multiple benefits that EE measures in industry can deliver, i.e. the creation of new jobs, attracting new investments, increasing of exports, etc., using real evidence and case studies.
20. Develop support mechanisms for producing modern EE equipment. The support mechanisms can include new incentive measures, subsidised loans, tax exemptions, etc.; for example, the introduction of tax holidays for the production of high efficiency solar water heating systems in the country.

161
9. Assessment of the Energy Efficiency Potential and Policies at the Sectoral Level
9.4. Buildings
9.4.1. Sector Overview and Energy Consumption TrendsThere are no available data on energy performance of buildings in Montenegro. Determination of the energy efficiency potential in buildings is planned to be conducted through ongoing support provided by the KfW bank (EEPPB project).131 One of the main aims of the project is to establish a national building inventory (covering all building categories) that will be used for the definition of the reference buildings in Montenegro and the determination of cost-optimal levels of efficiency, as well as for the estimation of the energy saving potential in the building sector.
In the absence of official statistical data, energy consumption in the buildings sector can be estimated based on available data for the residential and services sectors as together they cover the energy consumption of buildings, including heating, cooling and appliances. The analysis of the energy balances of the country shows that the share of energy consumed by the residential and services sectors in the TFC has increased from 27% in 2007 to 46% in 2016 (see Figure 10), mainly because of the following factors:
- A three-fold decrease in energy consumption by industry (see Section 9.3);
- Increase in the energy consumption of the residential sector by 7%;
- Increase in the energy consumption of the service sector from 3 ktoe in 2007 to 79 ktoe in 2017 (the changes represent both increased economic activities in this sector and changes to MONSTAT’s methodology).132
Residential sectorThe household sector is the dominant end-use sector, representing 46.8% of electricity and 38% of final energy demand in Montenegro in 2016. Another important issue is that electricity represents only about 40% of the final energy consumption by this sector (see Figure 33), with remaining energy needs covered primarily by biomass and small shares of waste and coal.
For rural areas, biomass (wood) is frequently used for space heating, especially in the Northern part of Montenegro. According to a MONSTAT survey conducted in 2011, 68% of households used solid fuels for heating, 79% of which used firewood as a primary heating fuel. Natural gas is not available, and district heating has not yet been developed in the country.
At the same time, electricity is a primary energy source for residential consumers in urban areas. This is due to the existence of low electricity prices during the 1990s, as well as ease and convenience of using electric appliances for space heating. Consequently, electric appliances are often used for space heating and hot water. In many cases, electricity is the only heating source for residential consumers in urban areas. Poor-performing air conditioners are often used for heating and cooling.
131 EEPPB - http://energetska-efikasnost.me/program-energetske-efikasnosti-u-javnim-zgradama-eeppb/ (accessed December 2018)132 Due to changes of MONSTAT’s methodology related to accounting industrial and service consumers, introduced in 2013.

162
In-Depth Review of the Energy Efficiency Policy of Montenegro | 2018
Figure 33: Total final energy consumption by residential consumers, 2007–2016, ktoe
0
50
100
150
200
250
300
2007 2008 2009 2010 2011 2012 2013 2014 2015 2016
Total �nal consumption Electricity
Source: Energy balances of Montenegro (MONSTAT), 2018
Overall, the total energy consumption of the residential sector increased by 7% during the last decade due to both the rising energy demand of households and increased tourism activity. Tourism in the country is predominantly based on rental of private apartments, and their energy consumption is counted in the residential sector rather than the services sector. This increase in energy consumption has not been steady over time, largely due to fluctuations in levels of tourism.
The total number of dwellings (including apartments and private houses) in Montenegro in 2016 was around 268,000, with a total area of 19,119,000 m2 and an average surface area of 71 m2/per apartment, according to available data from the Statistical Office of Montenegro. Statistical data on the floor area indicates that around three-quarters of the residential building stock was built before 2003,133 when minimum energy performance requirements for buildings did not yet exist in Montenegro (Table 20).
Table 20: Household building stock in Montenegro
1971 1981 1991 2003 2011 2016*
Population, thous. people 529,604 584,310 615,035 620,145 620,029 622,387
Number of dwellings, thous. 112 131 170 206 247 268
Area of dwellings, thous. m2 5,184 8,041 10,878 13,607 17,673 19,119
Average surface area of a dwelling, m2 46 61 64 66 71 71
*Estimation on the basis of available data form statistical Office of Montenegro
Source: Energy Charter Secretariat based on Montenegro Statistical Office, Statistical Yearbook for 2017
133 Assuming limited replacement of existing stock.

163
9. Assessment of the Energy Efficiency Potential and Policies at the Sectoral Level
Further analysis of energy consumption by households and data concerning existing building stock reveals that the average energy consumption of residential buildings in Montenegro decreased from 178 kWh/m2/year in 2011 to 161 kWh/m2/year in 2016. This was partially achieved with the introduction of the MEPR for new buildings in 2013 (see Section 5.2.).
Table 20 also shows that the majority of buildings in Montenegro were constructed before 1990 in accordance with standards set by the former Socialist Federal Republic of Yugoslavia (SFRY), which required relatively low energy performance. Even though some old buildings have thermal insulation, this insulation often does not function effectively due to the age and the deterioration of these buildings.
The period of 2004–2011 can be characterised as a construction boom in Montenegro, especially in the residential sector in the Central and Southern parts of the country. According to available statistical data, the average annual construction rate was around 508,000 m2, double the rate during 1991–2003. In the period following this elevated construction activity, 2012–2016, the dynamics of the construction sector slowed down but remained at a relatively high level of 290,000 m2 per year.
Service sectorThe service sector includes commercial services and public sector activities, with energy consumption mainly relating to buildings. The service sector accounted for a 10% share of Montenegro’s final energy consumption in 2016 (Figure 10). A survey on energy consumption in the service sector performed by MONSTAT in 2014 provides a detailed overview of energy consumption for the subsectors of the service sector (Figure 34). The commercial subsectors (accommodation, food services and trade) cover about 61% of the service sector’s total energy consumption, whereas the public subsectors (public administration, health and education) cover 21%. The energy consumption of other service activities,134 accounting for the remaining 18% share, is not related to buildings, but rather, to the delivery of public services such as water treatment, public lighting and other services.
Figure 34: Energy consumption of the services sector by subsector, 2014, %
Accommodationand
food
services
31.7%
Trade28.8%
Other service activities
17.9%
Education10.1%
Health6.2%
Public administration
5.2%
Source: Energy Consumption of the Service Sector in Montenegro, Montenegro Statistical Office, 2014
134 Other commercial and public services according to the Activity Classification – AC 2010 (NACE Rev.2)

164
In-Depth Review of the Energy Efficiency Policy of Montenegro | 2018
According to the MONSTAT, buildings in the service sector use electricity as their primary energy source. Electricity is used for space heating or cooling and the preparation of hot water, as well as for other needs related to the production of heat. According to available statistical data, the energy mix of the service sector is as follows: electricity (76.3%), light fuel oil (9%), fuelwood (8.8%), coal (3%), LPG (1.8%), wood pellet and briquette (1%) and solar energy (0.1%).135
Despite the fact that Montenegro is a country with comparatively high potential for solar energy in South East Europe, there are no publically available studies or reports on the benefits of utilising solar water heating systems in the residential, public and recreation sectors. In general, the utilisation of thermal solar systems is very low relative to the potential. According to the Study on Assessment of Renewables Potential – wind, solar energy and biomass,136 prepared with the support of the Italian Ministry of the Environment and Protection of Land and Sea in 2007, there are more than 2,000 hours per year of sunshine for the majority of Montenegrin territory and more than 2,500 hours per year along the coastline, similar to sunshine levels in Turkey and Italy.137 A study developed by the WBC-INCO project reveals that before the 1990s, solar energy was widely used in the public and tourism sectors. The total sum of installed solar collectors was about 11,000 m2 with installed power of approximately 5,500 kW.138 Due to poor maintenance and consumer preferences in favour of alternatives, current usage of solar energy has declined.
9.4.2. Existing Policies and Implementation
Energy performance certificatesThe legal framework for energy performance in buildings has been in place in Montenegro since 2013. All relevant aspects related to energy audits and energy performance certification are regulated through the Law on Efficient Use of Energy and accompanying rulebooks (see Section 5.2).
However, legal obligations are still not fully applied in practice. The main problem is the absence of energy performance calculation software, which prevents the issuing of energy performance certificates for buildings. There is also a lack of relevant data about the building stock in Montenegro (number, structure, ownership, period of construction, construction and technical characteristics, etc.) needed for defining the energy efficiency classes for existing buildings. The latter is being addressed with the support of KfW bank,139 and it is expected that this process will be completed by 2020.
The absence of software to enable certification has also resulted in the redundancy of about 40 trained energy auditors. While some energy auditors are actively involved in the implementation of donor-funded EE projects, it is the case that, as of June 2018, there was almost no demand for energy audit consultancy services in Montenegro.
Minimum energy performance requirementsThe minimum energy efficiency requirements (MEPR) in buildings were introduced in the country in 2013. Provisions for compliance checks of technical requirements are in place at the design and the commissioning stages. The existing MEPRs include only prescriptive
135 Energy Consumption in Service Sector in Montenegro, Montenegro Statistical Office (2014)136 http://www.oie-res.me/uploads/archive/Renewable%20Energy%20Resource%20Assessment%20Feb.2007.pdf (accessed June
2018)137 http://iet.jrc.ec.europa.eu/remea/sites/remea/files/files/documents/events/montenegro.pdf (accessed June 2018)138 https://danube-inco.net/object/document/10210/attach/0_National_Background_Report_Energy_Montenegro_2012.pdf (ac-
cessed June 2018)139 Energy Efficiency Program in Public Buildings (EEPPB), supported by KfW bank

165
9. Assessment of the Energy Efficiency Potential and Policies at the Sectoral Level
technical requirements for new buildings, such as U-values for buildings’ elements, air quality and heating systems, but do not specify the overall energy performance using the same units as used in the strategy, i.e. kWh/m2/year.
A high potential for the utilisation of solar energy for hot water supply in buildings was recognised by the National Renewable Energy Action Plan by 2020 (NREAP). The NREAP envisages the development of specific requirements for new buildings in certain climate zones to cover a quota of their energy needs for domestic hot water with renewable energy.140 As a response to this provision, the MEPRs include a commitment for new buildings located in coastal areas to cover 30% of their annual energy needs for domestic hot water with solar thermal systems, if economically and technically feasible.
Exemplary role of public buildingsMontenegro has achieved clear progress on the implementation of energy efficiency improvements in public buildings. From 2010–2018, 53 public facilities were reconstructed under two ongoing projects implemented in cooperation with the IBRD and KfW banks, involving a total investment of more than €30 million (see Section 5.2). Besides these two projects, the EEAP also recognises activities performed by other state authorities and autonomous local governments in the improvement of public sector facilities (buildings, pubic lighting, water supply, etc.).
Support for residential consumers and SMEsThere are three ongoing or recent projects supporting residential energy consumers financed with the support of donors and the state budget (see Section 5.2). These projects mainly target switching to more efficient technologies which use renewable energy sources (RES) (e.g. modern biomass systems, solar heating technologies, PV). Additional efforts have not yet materialised for supporting energy efficiency measures aiming at the reduction of the energy demand in buildings (e.g. improvement of the thermal performance of the building envelope). On the other hand, financing of energy efficiency projects within the residential sector is provided on a project-by-project basis through donors’ support programmes and state budget annual allocation. It is clear that opportunities for providing more sustainable financing should be further investigated so that a much higher volume or pipeline of projects can be supported. While the aforementioned issues are recognised by the existing EEAP, there exists no evidence of progress in tackling these issues to date.
There is currently a lack of interest in the bank sector in launching their own programmes targeting the improvement of energy efficiency and deployment of RES for households and SMEs. Some banks provided this kind of support in the previous period of 2010–2013, but currently there are no ongoing projects.
ESCO As outlined in Section 4.2, the legal framework for the implementation of the ESCO projects in buildings has been developed with the support of the REEP project. However, the implementation of pilot ESCO projects has not started due to the delay in the adoption of the Public–Private Partnership (PPP) Law, which should serve as a basis for procurement of energy services in the public sector. According to the information provided during the Peer Review Mission in June 2018, the adoption of the PPP Law is planned for the end of 2018.
140 http://www.oie-res.me/uploads/Dokumenta%202015/EBRD_Montenegro%20Draft%20NREAP%2016%2012%202014.pdf (ac-cessed June 2018)

166
In-Depth Review of the Energy Efficiency Policy of Montenegro | 2018
9.4.3. Assessment of the Existing Energy Efficiency PotentialAccording to publically available information, the Energy Development Strategy until 2030 is the only document estimating the energy efficiency potential in Montenegro’s buildings. The potential energy savings in the residential and services sectors are based on the following assumptions:
- Minimum Energy Performance Requirements (MEPR) for all buildings – 80 kWh/m2/year;
- MEPR for Nearly Zero Energy Buildings (NZEB) after 2020 – 15 kWh/m2/year;
- Thermal modernisation of 4,000 residential dwellings per year starting from 2015;
- Reduction of non-thermal consumption by 150 kWh per household per month as a result of energy labelling requirements;
- Rehabilitation of 2/3 of old floor surface in public sector to 70 kWh/m2/year by 2030;
- 10% reduction of electricity consumption for non-heating purposes by 2030 using ESCO schemes.
Figure 35 enables comparison of analysis of the energy efficiency potential in buildings identified by the Energy Development Strategy for 2020 and 2030 and the energy savings (achieved plus future estimates) outlined in the Energy Efficiency Action Plan (EEAP) for 2010–2018. The comparison reveals the following:
- The Energy Development Strategy significantly underestimates the potential energy savings in buildings for both 2020 and 2030. The energy savings (achieved plus future estimates) that resulted from the actions of the EEAPs for 2010–2018 are at least 50% higher than the energy saving potential to be delivered through policy actions proposed for buildings in the Strategy for 2020;
- The EEAP adopted in June 2016 do not include the conversion factor of 2.5 for converting electricity to primary equivalent that is used for the calculation of an indicative EE target for 2016–2018.

167
9. Assessment of the Energy Efficiency Potential and Policies at the Sectoral Level
Figure 35: Comparison of energy savings in residential and services sectors estimated by the Strategy and EEAP 2016-2018, ktoe
20.546.3
33.757.9
36.5
99.6
0.0
20.0
40.0
60.0
80.0
100.0
120.0
140.0
160.0
Strategy (2020potential)*
Strategy (2030potential)*
3rd EEAP (achieved &estimated for 2010‐
2018)*
Ccorrected 3rd EEAP(achieved & estimated
for 2010‐2018)**
EE policy EE improvements led by the market
*does not take into account the conversion factor of 2.5 for electricity that is used for calculation of the indicative targets **takes into account the conversion factor of 2.5 for electricity
Source: Energy Charter Secretariat based on Energy Development Strategy of Montenegro until 2030 and EEAP 2016-2018
Unfortunately, it is not possible to explain the identified difference in potential energy savings in buildings due to a lack of information in the strategy (and lack of availability of supporting studies/modelling that provided input for the strategy) regarding assumptions used.
The improvement of energy efficiency in buildings of the residential sector is not only important for the improvement of the energy balance of Montenegro and for minimising long-term energy system costs, but also for improving household comfort levels, alleviating energy poverty and improving the quality of life of Montenegrin citizens. Implementing energy efficiency programmes will also create jobs.
Relevant studies and energy audits conducted in previous periods by donor organisations show that there is a significant potential for EE improvement in many areas, including: thermal performance of the building envelope; heating/cooling systems; solar hot water systems especially in the residential sector; and indoor lighting. Certain progress (see Table 10) is being achieved in the implementation of energy efficiency measures in public buildings, but the commercial service sector lags behind and needs support for the implementation of energy efficiency measures.
It is worth mentioning that some measures, such as the introduction of energy management and raising employees’ awareness of energy efficiency, do not often require financing, yet the measures can lead to significant energy savings. Awareness of energy efficiency of staff working in public sector institutions such as schools and hospitals is often low, particularly

168
In-Depth Review of the Energy Efficiency Policy of Montenegro | 2018
when negative incentives exist, as energy bills are sometimes paid by another institution. For example, energy bills for buildings occupied by central government are paid by the Public Administration Office, and energy bills of schools are paid by the Ministry of Education and Sport. Another particularity of Montenegro is that schools are state-owned buildings, whereas in most countries in the region of South East Europe, the school buildings belong to local municipalities.
An additional problem is the insufficient capacity for the implementation of energy management systems. Such schemes need to be established at the national level in alignment with best practices (e.g. standard ISO 50001).
9.4.4. Main Barriers and Policy AssessmentSummarising the key findings and conclusions of the previous chapters, the following main barriers have been identified:
- The Minimum Energy Performance Requirements (MEPR) are based on the requirements for separate building elements, but not on the overall energy performance. There is also no national software for the calculation of building energy performance;
- Lack of state support as well as absence of studies and analysis on the potential utilisation of solar water heating systems, especially taking into account their potential impact on the reduction of the load and the improvement of the efficiency of the power system;
- Lack of financial and human resources for the efficient implementation of the MEPR and an energy performance certification scheme;
- Low awareness of buildings’ owners/users about no-cost and low-cost measures to reduce their energy bills;
- Limited use of the ESCO model and energy performance contracts for EE investments in buildings;
- Insufficient human capacity and financial resources within local authorities to design and deliver energy efficiency strategies and programmes for public buildings and to use EMS (for example, ISO 50001);
- Perverse incentives exist for owners of public buildings to reduce energy consumption and improve energy efficiency;
- General lack of supporting mechanisms and incentives for the owners and users of residential and commercial buildings to use energy efficiently or to contribute to power system efficiency (see main barriers and recommendations of Sections 9.1 and 9.2).

169
9. Assessment of the Energy Efficiency Potential and Policies at the Sectoral Level
Recommendations: Buildings
21. Update the Minimum Energy Performance Requirements (MEPR) to include requirements on overall energy performance rather than provisions on separate building elements. Gradually develop more stringent MEPRs to achieve the nearly zero-energy building target according to the requirements of the Energy Performance of Buildings Directive.
22. Enhance the implementation of the MEPR and energy performance certification scheme. Design the Energy Performance Certificates scheme as a self-funding mechanism, where the revenue from issuing Energy Performance Certificates covers all costs related to its management and quality assurance. Design the Energy Performance Certificates software in such a way that the collected information on buildings’ energy performance is automatically available for the Statistical office of Montenegro and for a wider decision-making process.
23. Conduct a study on the potential utilisation of solar thermal systems especially in the regions with high solar radiations and a deficit of the network capacity. Evaluate the potential of solar water systems to contribute to the electricity system development in a more cost-effective way, comparing to supply-side option (see Recommendation 5).
24. Develop a supporting mechanism for the installation of the solar thermal systems in the residential and service sector. Evaluate the costs of running this support scheme against the multiple benefits for the Montenegrin economy (creation of jobs, increase of investments, increase of electricity export, decrease of electricity consumption during peak hours and investments in the network reinforcement, promotion of sustainable tourism, etc). Consider opportunities for the creation of additional incentives for local producers of solar water heating systems (see Recommendation 20).
25. Introduce incentives for local authorities and the owners of public buildings to reduce energy consumption and implement energy efficiency measures. The local authorities should be allowed to use energy savings for the repayment of investment in EE and, once the debt has been repaid, to keep the energy savings each year.
26. Conduct targeted campaigns to improve the awareness of consumers about their historical energy consumption and promote no-cost or low-cost measures to reduce their energy bills. Ensure that the requirements of the EED on easy access to information about consumers’ historical consumption (up to a three-year period) is fully implemented. Awareness-raising campaigns on no-cost and low-cost measures to reduce energy bills could be based on international best practices and promoted nationwide.

170
In-Depth Review of the Energy Efficiency Policy of Montenegro | 2018
9.5. Energy-Using Products
9.5.1. Sector Overview and Energy Consumption TrendsThere are no official statistics on electricity consumed by energy-using products in Montenegro. However, estimates for electricity consumed by the seven most important groups of energy-related products used in households were established under the Regional Energy Efficiency Program (REEP) supported by EBRD141 (Table 21). Results took into account official statistical data on the availability of durables in households.
9.5.2. Assessment of the Existing Energy Efficiency Potential
Table 21: Energy consumption of energy-related products in households in Montenegro
Product group No. of unitsFinal energy
consumption (ktoe/year, est.)
Final energy savings in 2030
(per year) (ktoe, est.)
Water heaters 184,701 29.62 1.74
Air-conditioning units (<12 kW) 110,129 12.97 5.51
Refrigerators 190,083 6.25 1.17
Lamps 1,921,970 4.75 5.98
Washing machines 183,356 3.92 0.79
Dishwashers 64,386 1.73 0.17
Televisions 186,815 1.63 0.15
Total 60.88 15.52
Source: Findings of Regional Energy Efficiency Program, 2017
Table 21 shows that water heaters and air-conditioners dominate electricity consumption, together representing more than 40% of electricity demand by residential consumers for the selected product groups. At the same time, the highest estimated energy efficiency potential among analysed products exists in lamps and air-conditioners, representing about 74% of the estimated energy savings for the seven analysed products. Unfortunately, there is no publicly available information on the sales rates for the different groups of energy-using households products. That said, typical lifetimes of different product types could be taken into account, as this is a good indicator of stock turnover rate. Table 21 suggests that the market is saturated for products such as washing machines, refrigerators, TVs and water heaters, but not for air-conditioners and dishwashers, so some product ownership growth could be expected for these products with rising household wealth and living standards in addition to growth in household numbers. Higher temperatures due to climate change will also be a driver of increased air-conditioner ownership.
141 http://www.wb-reep.org/eng/about (accessed June 2018)

171
9. Assessment of the Energy Efficiency Potential and Policies at the Sectoral Level
The REEP study does not cover industrial products, whereas the United for Efficiency (U4E) initiative142 estimates significant potential for transformers and industrial motors. Comparison of the potential annual savings from the introduction of minimum energy performance standards estimated by the REEP and U4E is presented in Table 22.
Table 22: Potential energy savings in 2030 (per year), ktoe, est.
N Product group REEP U4E Total
1 Water heaters 1.74 - 1.74
2 Air-conditioning units (<12 kW) 5.51 - 5.51
2.1 - incl. units <3.5kW - 1.68 1.68
3 Refrigerators 1.17 2.87 1.17-2.87
4 Lamps 5.98 8.23 5.98-8.23
5 Washing machines 0.79 - 0.79
6 Dishwashers 0.17 - 0.17
7 Televisions 0.15 - 0.15
8 Transformers - 5.97 5.97
9 Industrial Electric motors - 7.11 7.11
Total 15.52 25.86 28.59-32.54
Source: Findings of Regional Energy Efficiency Program, 2017, United for Efficiency Montenegro Assessment, December 2016
Table 22 presents estimated potential energy savings that could be achieved per year. Differences in the REEP and U4E data are due to slightly differing assumptions used. Summarising the results of two studies, the potential energy savings for nine product groups can help the country to achieve about 28.6-32.5 ktoe savings annually by 2030.
In 2017, the Government of Montenegro adopted ecodesign requirements for 16 product groups, including lamps and air-conditioners, that should gradually come into force in July 2018 and January 2019 (see Section 9.5.2). The Government continues to transpose the EU’s ecodesign regulations for other product groups, but there is no publicly available information on the overall energy savings that will be realised with the introduction of the EU’s ecodesign requirements. Nevertheless, the energy savings are likely to be significant. For example, the studies commissioned by the European Commission143 estimate that eco-design and energy labelling requirements can save the Union about 175 Mtoe of primary energy per year, which is more than Italy’s total annual primary energy consumption or €490 per household per year. Approximating the EU figures to Montenegro, the implementation of the EU’s ecodesign and energy labelling policies can help the country to achieve annual savings of about 80 ktoe of final energy consumption.
142 http://united4efficiency.org/wp-content/uploads/2017/05/MNE_U4E-Country-Assessment-Report.pdf (accessed June 2018)143 Ecodesign Working Plan 2016-2019. COM (2016) 773 final, p. 2.

172
In-Depth Review of the Energy Efficiency Policy of Montenegro | 2018
Ecodesign is currently one of the highest-impact EE policy measures and should be regarded as an investment delivering net benefits. A study published by the UK Department for Environment, Food and Rural Areas in 2015 concluded that each British pound invested in ecodesign generates 3.8 times that amount in earnings for the British economy.144 This supports the case for pursuing additional energy savings and benefits by introducing policy and financial incentives to complement and support the ecodesign and labelling regulations in order to accelerate stock turnover and the transformation of product markets. A wide range of incentives have been used successfully in different jurisdictions but can include, for example, financial support for replacing old and inefficient appliances with energy efficient models and tax incentives to influence product manufacturers’ business development choices and consumers’ purchasing decisions.
In addition to the energy-related products which are dominantly used in households, it is important to consider the energy efficiency potential for other products which are used in the industry and services sectors, and for which it is also important to introduce minimum energy performance standards (see Section 9.3.2).
9.5.3. Existing Policies and Implementation
Energy labelling and ecodesignMontenegro’s Law on Efficient Use of Energy sets the basis for the introduction of ecodesign requirements and energy efficiency labelling of energy-related products. Development of the relevant bylaws is based on the transposition of relevant EU regulations. As of June 2018, energy efficiency labelling bylaws had been adopted for six groups of products. The rulebooks regulating the labelling of these product groups entered into force as follows:
- from the 1st January 2017: refrigerating appliances; televisions; dishwashers; lamps and luminaries;
- from the 30th of June 2017: washing machines and air-conditioners.
The Government of Montenegro continues to work on the development of further bylaws covering the labelling of other groups of products according to obligations arising from its Energy Community membership.
In spite of the fact that the implementation of ecodesign regulations is not one of the obligations under the Energy Community Treaty, the Government of Montenegro adopted ecodesign requirements for 16 groups of products in 2017. The schedule for entry into force of the rulebooks regulating ecodesign requirements is as follows:
- from the 1st July 2018: non-directional household lamps, fluorescent lamps and electric motors;
- from the 1st January 2019: directional lamps, LED lamps and related equipment; household washing machines; household tumble driers; household dishwashers; household refrigerating appliances; air conditioners and comfort fans; televisions; simple set-top boxes; external power supplies; electrical and electronic office and household equipment in standby and off mode and networked standby mode; water pumps; glandless standalone circulators; and fans.
Following EU practice, Montenegrin rulebooks recognise gradual application of the ecodesign requirements with the tightening of requirements over time. The Government plans to continue the process of adopting technical regulations for other product groups in future.
144 https://www.gov.uk/government/uploads/system/uploads/attachment_data/file/406225/defra-regulation-assessment-2015.pdf (accessed June 2018)

173
9. Assessment of the Energy Efficiency Potential and Policies at the Sectoral Level
Market surveillance and awareness raisingThe market surveillance for energy-related products started in January 2017, when the rulebooks regulating labelling of refrigerating appliances, televisions, dishwashers, lamps and luminaries came into force. By July 2018, the country needs to elaborate an adequate market surveillance system for the application of ecodesign requirements for the first three product groups and by January 2019 for the remaining 13 groups of products. Taking into account the Government’s further plans to introduce ecodesign bylaws for other product groups, effective market surveillance will require the establishment of sufficient permanent capacity and capability within the Administration for Inspection Affairs, the body responsible for market inspection.
Given that the control of application of MEPS requires considerable technical expertise, and given that the Montenegrin economy is relatively small, the process of implementation could be efficiently facilitated by involving stakeholders with the relevant technical background (e.g. technical faculties), as well as through membership of relevant regional and EU initiatives.
In addition, the process of transforming energy-using product markets needs to be complemented by strong awareness-raising campaigns targeted to economic operators (producers, suppliers, dealers), as well as to final consumers (citizens and legal entities). The Ministry of Economy has enabled the participation of relevant economic operators in the policy development and legislative processes through direct engagement with the Chamber of Economy, an association representing business interests. This cooperation can be further developed in the implementation phase, involving the Administration for Inspection Affairs.
Public procurementThe introduction of energy efficiency criteria in public procurement can significantly contribute to the achievement of energy savings in the public sector. Montenegro has adopted a legal framework, which entered into force in January 2017, to regulate public procurement, including a methodology for determining the energy efficiency requirements in public procurement procedures (see Section 5.2). The methodology covers procurement of energy-using products that are used in the public sector. However, implementation in practice is at a low level, and further capacity-building targeted to the officials responsible for public procurement is necessary.
9.5.4. Main Barriers IdentifiedSummarising the key findings and conclusions of the previous chapters, the following main barriers have been identified:
- Inadequate market surveillance capacity for the control of application of the requirements for ecodesign and energy labelling of energy-related products;
- Insufficient capacities within the state administration to properly include energy efficiency criteria in procurement procedures for energy-related products;
- Insufficient data and statistics on the imports and sales of energy-related products, which could serve as a basis for estimating energy saving potential as well as for the design of targeted energy efficiency programmes;
- Lack of supporting mechanisms for the promotion of more energy efficient technologies such as incentives, subsidised loans and tax incentives;
- Low awareness of final consumers on the benefits of using more energy efficient appliances.

174
In-Depth Review of the Energy Efficiency Policy of Montenegro | 2018
Recommendations: Energy-Using Products
27. Assign direct responsibilities to a relevant governmental authority/department for overall control and implementation of ecodesign requirements. Provide sufficient resources appropriate to the fulfilment of such responsibilities. Continue enhancing the capacity of involved stakeholders on efficient implementation of ecodesign requirements and market surveillance. Strengthen the cooperation and coordination of activities between all involved stakeholders (see Recommendation 4).
28. Prioritise the adoption and implementation of ecodesign requirements as one of the highest-impact EE policy measures to achieve future EE targets.
29. Improve the collection of statistical data on imports and sales of energy-related products. The statistical information should be a basis for the calculation of achieved energy savings as a result of the implementation of ecodesign and labelling regulations.
30. Prioritise the programme and measures promoting the installation of efficient household heating appliances, as they are currently the most important source of air pollution in the country.
31. Provide general support and assistance for facilitating a higher take of highly efficient products and appliances, including the following:
• Continue improving the implementation of efficiency criteria in procurement procedures for energy-related products;
• Facilitate accelerated implementation of ‘low-hanging fruit projects’ (i.e. projects that are easy to implement with a short payback period, such as replacing incandescent lamps with LED lamps in public buildings, installation of automatic control for heating/cooling, etc.);
• Promote use of the ESCO/EPC model for product replacement investments at sufficient scale;
• Develop targeted awareness-raising campaigns to enhance awareness of final consumers on the benefits of using more energy efficient appliances.

175
9. Assessment of the Energy Efficiency Potential and Policies at the Sectoral Level
9.6. Transport
9.6.1. Sector Overview and Energy Consumption TrendsThe transport sector’s share of total final energy consumption increased from 23% in 2007 to 32% in 2016, mainly because of the significant reduction of industrial consumption (- 68%) and a 12% increase in energy consumption by transport over the last decade (see Figure 10). Road transport was the dominant mode of transport, accounting for 90% of all energy consumed in the transport sector in 2016 (Figure 36, left). The Montenegrin transport sector is dependent on fossil fuels with a very small contribution of electricity used mainly in rail transport (0.74%). The mix of consumed oil products is dominated by diesel at 71.9%, although gasoline (15.73%), kerosene (8.17%) and LPG (3.89%) are also used (Figure 36, right).
Figure 36: Energy consumption of the transport sector by mode (left) and by fuel type (right) in 2016, %
Railways0.7%
Road transport
90%
Air transport
8.2%
Inland navigation
1%LPG3.9%
Kerosene8.2%
Gasoline15.7%
Diesel71.2%
Fuel oil0.3%
Electricity0.7%
Source: Montenegro Statistical Office, Energy Balances, 2017
From 2010–2016, the total number of registered vehicles in Montenegro increased by 11%, from 187,913 to 209,098.145 Total energy consumption by the transport sector fluctuated at the level of 210-220 ktoe from 2007–2012, decreased by 15% in 2013 and gradually increased by 27% during the period of 2014–2016 (Figure 37). During the period of 2013–2016,16 there was a general increase in consumption of all fuels, except residual fuel oil, but the consumption growth rates of LPG and kerosene were the highest.
145 Statistical Yearbook for 2017, MONSTAT

176
In-Depth Review of the Energy Efficiency Policy of Montenegro | 2018
Figure 37: Energy consumption of the transport sector by fuel type, 2007-2016, ktoe
142.8 146.9 139.8167.3 164.2 166.3
136.7 122.7139.2
170.2
57.5 53.3 68.2
60.743.7 38.3
33.035.6
36.2
37.611.5 14.7 2.1
2.110.5 12.6
13.618.1
19.0
19.5
0.0
50.0
100.0
150.0
200.0
250.0
2007 2008 2009 2010 2011 2012 2013 2014 2015 2016
Residual fuel oil Heavy fuel oil LPG Kerosene Motor gasoline Diesel oil
Source: Montenegro Statistical Office, Energy balances, 2017
Figure 37 also shows a general decline of the share of gasoline consumption and an increase of diesel consumption over the last decade. This trend is mainly related to the price difference between diesel and gasoline in the country over the last decade (Figure 38).
Figure 38: Fuel prices during January 2007 – May 2018, €/litre
0101010101010101010202
2007
2008
2009
2010
2011
2012
2013
2014
2015
2016
2017
2018
Gasoline 95 Eurodisel
Source: Ministry of Economy, 2018

177
9. Assessment of the Energy Efficiency Potential and Policies at the Sectoral Level
9.6.2. Assessment of the Existing Energy Efficiency PotentialThere are no specific studies/analyses that quantify the energy efficiency potential of the transport sector in Montenegro that could be realised by implementation of specific measures. However, a non-quantitative study on potential energy efficiency measures that could be implemented in Montenegro’s transport sector was prepared under the EU-funded project Development of Sustainable Energy Use,146 published in 2016. The study took into account existing data on energy consumption by sector, characteristics of the vehicle fleet and transport infrastructure, as well as the status of the development of the legal framework. Five groups of specific measures were elaborated, as set out in Table 23.
Table 23: EE improvement measures for the transport sector of Montenegro, 2016
Group of measure Measures
Introduction of en-ergy efficiency and environmental criteria in transport infrastructure investments, changing transport habits and public procurement requirements for new vehicles
- taxation of heavy duty vehicles for use of transport infrastructure;- development of alternative fuel infrastructure in conventional infra-
structure development projects; - better management of transport infrastructure;- quota of green vehicles in the public sector; - subsidies for purchasing of green vehicles
More stringent environ-mental performance requirements for vehi-cles and promotion of use of energy efficient transport means
- transposition/implementation of EU acquis regarding: fuel economy and CO2 emissions of new passenger cars, energy labelling of tyres and promotion of clean and energy-efficient road transport vehicles;
- taxation of vehicles based on emissions of CO2;- improving fuel quality through imposing strict legal requirements;- introduction of urban mobility plans as part of local EE planning docu-
ments
Use of transport and transport infrastructure more efficiently through the use of improved traffic management and information systems and advanced logistics
- introduction of a real-time traffic information system and improved sophistication of the traffic management system;
- introduction of an electronic payment system for transport infrastruc-ture;
- optimisation of infrastructure on border crossings
Promotion of en-ergy efficiency in freight transport and public transport companies
- training and licencing of professional drivers;- improving knowledge of drivers in the public sector;- campaign on proper maintenance of vehicles;- campaign/support schemes for modernisation of the public transport
fleet;- support schemes to incentivise procurement of green public transport
vehicles
146 http://www.energetska-efikasnost.me/ee/uploads/file/Attachments/DSEU_IPA2011/Studije%20za%20transport%20-%20IPA%202011/Task%201.3%20-%20Study%20on%20Energy%20Efficiency%20Potencials_final.pdf (accessed December 2018)

178
In-Depth Review of the Energy Efficiency Policy of Montenegro | 2018
Group of measure Measures
Awareness raising of efficient transport
- raising public awareness;- eco-driving training in driving schools; - exemplary role of public bodies and introduction of electronic vehicles
(EV);- campaign for broader use of alternatives to transport means;- introduction of bike sharing system;- greater use of public transport
Source: Energy Charter Secretariat analysis based on Study for EE Improvement in the Transport Sector in Montenegro, IPA 2011, 2016
Table 23 illustrates that the study provides an integrated and broad overview of the measures that could improve the energy efficiency of the transport sector based on EU and international best practices. In addition, the study elaborates on the benefits of implementing such measures from environmental, economic and social perspectives, which are very important for the country. For example, international experience presented in the study demonstrates various co-benefits that can result from the implementation of the suggested measures, including reduction of air and noise pollution, especially in urban areas, and associated health benefits.
9.6.3. Existing Policies and Implementation
Action Plan for Introduction of RES and EE Measures in the Transport SectorAs a follow up to the EU-funded project Development of Sustainable Energy Use, an Action Plan for Introduction of the Renewable Energy Sources and Energy Efficiency Measures into the Transport Sector was developed in 2017.147 This action plan determined 12 measures that were further divided into 28 actions related to use of renewable energy sources and energy efficiency improvements in the transport sector. The plan defined the preconditions and the implementation process with regard to the proposed measures and actions, including responsibilities, timelines and financing. Energy efficiency actions proposed by the plan are mainly related to those identified in the study (see Table 23).
The development of the action plan has not been envisaged by any particular law in Montenegro, and therefore it has not been approved by the Government. Thus, the action plan does not impose any implementation obligations on governmental authorities. At the same time, the developed recommendation can be taken into account during regular updates of other existing action plans, including those related to transport, energy, energy efficiency, transport and environment.
Transport sector in the EEAPThe EEAP includes two policy measures:
1. Preparation of an EE action plan in transport and implementation of pilot projects. The EE action plan in transport was completed in 2017, and the implementation of pilot projects is scheduled for a future period;
2. Infrastructural measures in the transport sector with energy savings impact. The development of this policy measure requires a methodology for planning and
147 http://www.energetska-efikasnost.me/ee/uploads/file/Attachments/DSEU_IPA2011/Studije%20za%20transport%20-%20IPA%202011/Task%201.3%20-%20Study%20on%20Energy%20Efficiency%20Potencials_final.pdf (accessed December 2018)

179
9. Assessment of the Energy Efficiency Potential and Policies at the Sectoral Level
evaluating energy savings and environmental impacts resulting from the construction of transport infrastructure and facilities. However, this methodology has not yet been developed.
Sustainable urban mobility planningThe UNDP is currently working with local authorities on the implementation of the Polycentric Sustainable Urban Mobility Plans for the Old Royal Capital Cetinje and three coastal municipalities: Herceg Novi, Kotor and Tiva. The plan includes both technical assistance and potential financing of sustainable transport options, raising awareness and providing incentives for tourists to use low-emission travel modes.148
Vehicle Fuel EfficiencyThe Rulebook on Technical Requirements for Vehicles Imported or Placed on the Market in Montenegro, which came into force in May 2015,149 prescribes that new passenger cars and vans imported to Montenegro must meet at least the EURO 5 engine standard, and used vehicles must meet at least the EURO 3 engine standard (see Section 5.2). Compliance of imported vehicles with the rulebook is controlled by authorised entities to ensure that vehicles below prescribed standards do not enter the Montenegrin market.
The Rulebook on the Closer Content of Labels, Guides, Posters, Displays and Promotional Materials on Fuel Consumption and Emissions of Carbon Dioxide from New Passenger Vehicles150 was adopted in June 2017. Once enforced, the rulebook will transpose the EU Acquis and should influence consumers’ awareness about fuel consumption and CO2 emissions of new passenger cars.
The Decree on Fuel Quality151 and the relevant order issued by Ministry of Economy set specific requirements targeting the improvement of fuel quality.
The Rulebook on Energy Efficiency Labelling of Vehicles’ Tyres and Other Essential Parameters,152 which will come into force in January 2019, requires that all tyres sold in Montenegro be labelled to indicate: fuel efficiency class, wet grip class and external rolling noise class (see Section 5.2). It is expected that this measure will influence consumers’ awareness of how tyres impact fuel consumption.
Fuel efficiency standards/targets for passenger cars do not apply in Montenegro because the EU laws that set mandatory emission reduction targets for new passenger cars and vans are applied to car manufacturers producing and selling cars in the EU. While Montenegro does not host any car manufacturers, the country will benefit from the EU legislation as new cars from leading EU manufacturers are sold in Montenegro. At the same time, however, relatively less efficient new cars from non-EU regions can also be sold in Montenegro, and many cars that are imported are second-hand.
The EURO restrictions on new and existing passenger cars will indirectly help improve the average fuel economy of Montenegro’s car fleet because EU EURO standards and EU fuel economy standards have been tightened over time in parallel and therefore, in general, younger cars that are compliant with more stringent EURO standards will tend to also be relatively more fuel efficient.
148 http://lowcarbonmne.me/en/spatial-planning/sustainable-urban-mobility (accessed June 2018)149 Official Gazette of Montenegro 5/2015150 Official Gazette of Montenegro 40/2017 151 Official Gazette of Montenegro 17/2017152 Official Gazette of Montenegro 90/2017

180
In-Depth Review of the Energy Efficiency Policy of Montenegro | 2018
CO2-linked import tax and purchase tax for vehiclesCurrently, CO2-linked import/purchase taxes are not applied in Montenegro. Such CO2 import/purchase taxes could potentially be a revenue source for the Eco Fund. The latter can be used to help support the energy efficiency of the transport sector, and the transparency of hypothecating revenues can help ensure the political acceptability of increasing citizens’ tax burdens. Another way to ensure public support would be to introduce incentive payments, rebates or zero tax on the highest performing cars, as consumers are then presented with an attractive option, and not all consumers would be penalised in the new tax scheme.
The Law on Tax for Use of Passenger Motor Vehicles, Vessels, Aircrafts and Spacecraft153 regulates taxation of passenger motor vehicles which are registered in Montenegro. The law stipulates annual duties for various types of passenger motor vehicles and motorcycles based on their engine capacity class (Table 24). Though imperfect, engine size is a useful proxy for energy efficiency if vehicles are using similar powertrains and fuels. This annual taxation will not be helpful, however, in promoting low carbon power trains or fuels, although electric vehicles are exempt from the obligation to pay this tax.
Table 24: Annual taxes for the transport sector of Montenegro
Cath. Motor vehicle engine capacity, cm3 Annual tax, € Motorcycle
engine capacity, cm3 Annual tax, €
1 up to 1,300 25.00 up to 125 10.00
2 1,300 – 1,600 40.00 125 – 500 30.00
3 1,600 – 2,000 75.00 500 – 1,100 150.00
4 2,000 – 2,500 220.00 over 1100 300.00
5 2,500 – 3,000 500.00
6 3,000 – 4,000 750.00
7 4,000 – 5,000 1000.00
8 over 5,000 1500.00
Source: Energy Charter Secretariat analysis based on Study for EE improvement in the transport sector in Montenegro
Smaller engines tend to consume less energy than larger engines, but within an engine capacity class, there can be a range of energy efficiency performance depending on technologies used and other factors, so a smaller engine is not always more energy efficient than a larger one. According to the international best practice, the promotion of energy efficient vehicles is implemented by linking circulation/licence/import/purchase taxes or duties to the CO2 emissions of the vehicle, as this is a useful proxy for fuel economy of ICEs powered by gasoline and diesel, and it promotes cars with reduced CO2 emissions.154
153 Official Gazette of the Republic of Montenegro 28/2004, 37/2004 and Official Gazette of Montenegro 86/2009 154 https://www.theicct.org/sites/default/files/publications/2017-Global-LDV-Standards-Update_ICCT-Report_23062017_vF.pdf (ac-
cessed June 2018)

181
9. Assessment of the Energy Efficiency Potential and Policies at the Sectoral Level
The law also prescribes that the annual tax be reduced by 5% for each year of age for the vehicle, though the total discount may not exceed 50%. This is clearly a perverse incentive for energy efficiency, as newer cars tend to be more energy efficient due to technological progress, while older cars become less efficient with time, especially if they are not properly maintained.
Environmental levies and taxes on fuelsThe Decree on Calculation of Maximum Retail Prices of Petroleum Products155 recognises eco charges as a specific item in the calculation of retail prices of fuels. In practice, eco charges had been applicable in the past, but as of 2018, the charge is at the level of 0.00 €/litre for all types of fuel. Taking into account that taxes and excises account for 54% to 72% of retail fuel prices (see Section 4.2.), the Government of Montenegro is very reluctant to create any additional tax burden for citizens, including in the form of eco charges. The unwillingness of the Government to set eco charges is also related to the recent increase of VAT in the country, i.e. from 19% to 21% in January 2018 (see Section 4.2.).
At the same time, the VAT and excise duties significantly contribute to the state’s budget and in 2017 represented about 9% of the Government’s revenues.156 Thus, any sharp decrease in fuel consumption can significantly reduce the state’s budget, which will also be a consideration for the Government.
Awareness raisingThe EEAP promotes activities to raise drivers’ awareness of energy efficient driving practices. Local governments and the NGO sector are also engaged in promoting mode switching and are supported by international organisations (e.g. UNDP, GIZ). Such activities include Car Free Day and Day for Cyclists, as well as a series of actions promoting establishment and use of biking and hiking trails in certain parts of Montenegro. In addition, promotional and educational materials have been developed, for example, to promote cycling and eco-driving.
9.6.4. Main Barriers IdentifiedSummarising the key findings and conclusions of the previous chapters, the following main barriers have been identified:
- There is a general lack of political interest in promoting EE measures in transport.
- There is currently political resistance to taxing fuel due to the recent increase in VAT.
- The existing approach of reducing the annual vehicle tax according to age creates a perverse incentive for consumers to purchase older, more polluting and more inefficient cars.
- There is, in general, a lack of administrative capacity for the development of programmes or measures to promote cleaner-fuel vehicles;
- There are no incentives to promote the purchase of low-emission vehicles (for both public and private sectors);
- There is low awareness of final consumers and lack of incentives regarding eco driving, proper vehicle maintenance and use of alternative transport means.
155 Official Gazette of Republic of Montenegro 52/2002, 55/2002, 23/2003, 32/2005, 35/2006 and Official Gazette of Montenegro 73/2010, 18/2015 and 63/2015
156 Estimation is based on data provided by the Ministry of Economy and the Montenegro Government Revenues in 2017 accessed at https://tradingeconomics.com/montenegro/government-revenues (accessed June 2018).

182
In-Depth Review of the Energy Efficiency Policy of Montenegro | 2018
Recommendations: Transport
32. Assign clear responsibilities to a relevant governmental authority/department for the overall control and implementation of energy efficiency measures in the transport sector. Provide sufficient resources for managing such responsibilities (see Recommendation 4).
33. Promote the use of public transport by improving its comfort, accessibility and affordability. Explore the cost benefits of adding new routes and creating dedicated road space for buses so they can avoid traffic jams, particularly in tourist destinations. Promote sustainable transport, including an obligation on the airport and airline companies to promote public transport travels to/from the airport.
34. Explore options to further restrict or influence vehicle imports to favour vehicles that are more fuel-efficient and have lower emissions, taking advantage of the improving fuel efficiency and emissions performance of the EU market.
35. Continue the policy of setting eco charges and re-introduce the eco charge for petroleum products. The revenue from the eco charges should be a source of revenue for the Eco Fund. Transparency in relation to spending of Eco Funds, particularly vis-a-vis improving the energy efficiency and reducing the environmental impact of the transport sector, will facilitate public acceptance of the eco charge on fuel.
36. Link annual taxes for vehicles to CO2 emissions according to EU best practices. Provide incentives to promote the most efficient cars on the market, including hybrid and electric cars, using mechanisms such as ‘feebates’. The taxes can be a source of revenue for the Eco Fund.
37. Conduct targeted campaigns to promote measures related to behavioural changes, including eco-driving, car-sharing and proper vehicle maintenance.

Glossary

184
In-Depth Review of the Energy Efficiency Policy of Montenegro | 2018
Glossary Allowed revenues/revenue requirement: These terms relate to the regulated revenues that the regulated utility is allowed to collect. Different methods are used to calculate the allowed revenues. Revenue requirements may be established for different customer classes. Generally speaking, two main approaches are used: rate of return (or cost of service) regulation and incentive-based regulation (including price cap regulation, revenue cap regulation and benchmarking or yardstick regulation).
Capacity: The potential to generate, transport, process or utilise power. Capacity is measured in watts, usually expressed as kilowatts (kW) or megawatts (MW). Generators have rated capacities that describe the output of the generator at its bus bar when operated at its maximum output at a standard ambient air temperature and altitude.
Cogeneration/combined heat and power (CHP): A method of producing power in conjunction with providing process heat to an industry or space and/or water heat to buildings.
Customer class: A collection of customers sharing common usage or interconnection characteristics.
Decoupling regulation: A form of revenue regulation in which the utility’s non-variable costs are recovered through a prescribed level of revenues, regardless of the sales volume achieved by the utility. Under traditional regulation, regulators determine a set of customer prices that remain constant (until the next time they are reviewed). As a result, the actual revenues, and implicitly the utility profits, will rise or fall from the expected levels as the sales volumes increase or decrease. Decoupling fixes the amount of revenue to be collected from customers and allows the price charged to float up or down to compensate for variations in the sales volume to maintain the set revenue level. The target revenue is sometimes allowed to increase between tariff reviews on the basis of a fixed inflator or the number of customers served. The effects of abnormal weather can also be removed. Decoupling regulation eliminates the utility management’s incentive to increase the profits by increasing the sales and the converse incentive to undermine end-use energy efficiency and customer-sited generation, both of which reduce the sales volume. In many jurisdictions, decoupling has typically been implemented in conjunction with regulator-required, utility-sponsored energy efficiency programmes.
Demand: In theory, the demand is an instantaneous measurement of the rate at which power or natural gas is being consumed by a single customer, a customer class or the entirety of an electric or gas system. The demand is expressed in kW or MW for electricity or therms for natural gas. It is the load-side counterpart to an electric system’s capacity.
Demand-side management: Controlling the quantity of energy used at specific times through the modification of consumers’ demand – for example, using measures that enable energy efficiency, demand response and energy storage – to reduce the system peak demand, reduce the overall system demand and balance the system supply and demand.
Depreciation: Depreciation, as usually calculated in business accounts, is the systematic and rational allocation of the costs of past expenditures on fixed assets less the estimated salvage value or residual value over subsequent accounting periods corresponding to the assets’ estimated useful life. It is necessary to distinguish between economic depreciation and physical, or capacity, depreciation. The distinction between these two depends on what is eroding or decaying: whether it is the production capabilities of the asset itself or its subsequent

185
Glossary
economic value. The productive efficiency can be seen as the stream of earnings that the asset will produce over time. As the asset experiences wear and tear, its productive efficiency declines and it undergoes a process of physical depreciation. Economic depreciation, however, is defined as the decline in asset value (or asset price) associated with ageing. The asset value of an asset at any point in time should reflect the expected future earnings – that is, the net present value of the future stream of earnings that is expected from owning the asset. The price decline that occurs each year in an asset’s value reflects, in the first instance, the reduction in present value that occurs over a finite service life. In general, an older asset has less opportunity to generate revenue than a younger asset – which reduces the economic value of the former. This decline in asset value, however, will be accelerated if ageing is accompanied by a loss of productive efficiency, as all capital assets that suffer wear and tear can be expected to return a lower stream of benefits in any single period. Utilities can use techniques and technologies to uncover information about the equipment’s true health or condition to identify the most appropriate measure of asset rehabilitation, replacement or extended deployment.
Economic potential of energy efficiency: The economic potential of energy efficiency forms part of the technical potential, which can be implemented cost-effectively using public cost-effectiveness criteria: discount rates, opportunity costs (the export price of natural gas), environmental and other indirect effects and externalities, and so on.
Energy conservation: The use of any device, activity or measure that attempts to reduce energy consumption. Energy conservation is usually meant to denote behavioural changes or changes in patterns of energy use. For example, increasing thermostat settings in the summer or decreasing them in the winter is a form of conservation. Energy conservation may last only as long as the associated behaviour or usage pattern remains in effect.
Energy efficiency: Energy efficiency means the ratio of the output of performance, service, goods or energy to the input of energy. A measure improves energy efficiency if the given energy input achieves greater output or if reduced energy input achieves the given output.
Energy resources: Resources that can be used by the system operator to ensure that the energy supply and demand are met, including generation, demand reduction, load shifting and energy storage.
Externalities: Costs or benefits that are side effects of economic activities and are not reflected in the booked costs of the utility. Environmental impacts are often the principal externalities caused by utilities (e.g., health care costs as a result of air pollution).
Firm capacity: The volume of megawatts guaranteed to be available to provide or reduce energy to the system at any moment in time.
Inclining block tariffs: A form of rate design in which blocks of energy usage have increasing prices as the amount of usage increases. Inclining block rates appropriately, albeit crudely, reflect the fact that increased costs are associated with greater usage. They enhance the economics of energy efficiency by increasing the savings that a customer can achieve by reducing the energy purchases from the utility.
Load: The combined demand for electricity placed on the system. The term is sometimes used in a generalised sense to denote simply the aggregate of customer energy usage on the system or, in a more specific sense, the customer demand at a specific point in time.
Load factor: A measure of the output of a power plant compared with the maximum output that it could produce.

186
In-Depth Review of the Energy Efficiency Policy of Montenegro | 2018
Load shifting/demand response: A broad term to describe intentional actions to adjust electricity use in response to incentives or changes in prices.
Losses/energy losses/technical losses/non-technical losses/commercial losses: The energy (kWh) and power (kW) lost or unaccounted for in the operation of an electric system. Losses generally fall into two categories: “technical losses” in the form of energy lost to heat and “non-technical losses”, or “commercial losses”, which represent energy theft from illegal connections or tampered meters.
Market potential of energy efficiency: The market potential of energy efficiency forms part of the economic potential, which can be implemented cost-effectively using private investment decision-making criteria, given the existing market conditions, prices and restrictions.
Metering discipline: This relates to the use of programmes to manage meters better to prevent electricity theft. Such programmes can incorporate measures: to improve inspectors’ access to meters; to verify meter readings; to replace old meters vulnerable to tampering, enabling theft; and to control and monitor the integrity of utility employees.
Payback period: The amount of time required for the net revenues of an investment to return its costs. This metric is often employed as a simple tool for evaluating energy efficiency measures.
Peak demand/peak load: The maximum demand by a single customer, a group of customers located in a particular portion of the electricity system, all of the customers in a class or all of a utility’s customers during a specific period of time – hour, day, month, season or year. The system peak demand is the maximum demand placed on the electricity system at a single point in time and may be measured for an entire interconnection, for sub-regions within an interconnection or for individual utilities or service areas.
Reliability: The ability to meet the electricity needs of customers connected to the system over various time scales even when unexpected equipment failures or other factors reduce the amount of available electricity. “Reliability” can be broken down into two general categories – resource adequacy and system quality.
- System quality refers to the short-term, reliable operation of the power system as it moves electricity from generating sources to retail customers, including the ability of the system to withstand unanticipated disturbances or imbalances in the system while maintaining the required frequency and voltage levels. Balancing and ancillary services contribute to the system quality.
- Resource adequacy refers to the presence of enough of the right kinds of resources to match the demand and supply across time and geographic dimensions and to deliver an acceptable level of reliability. In many jurisdictions, reliability standards for resource adequacy are defined, and “loss of load probability” (LOLP) is a commonly used metric.
Seasonal tariffs: A tariff that is higher during the peak-usage months of the year. Seasonal tariffs are intended to reflect the differences in the underlying costs of providing the service associated with different times of the year.
Smart meter: An electric meter with electronics that enable the recording of customer usage in short time intervals and two-way communication of data between the utility and the meter (and, optionally, the customer).
Tariff: A listing of the prices, rates, charges and other terms of service for a utility customer class, as approved by the regulator.

187
Glossary
Tariff policy: A broad term used in this paper to refer to the policy, methods and processes related to establishing the allowed revenues for regulated utilities and the tariffs or prices applied to customers to collect these allowed revenues.
Tariff structure/tariff design: Specification of the prices or tariffs used to signal consumers and recover costs. Types of prices or tariffs include inclining block tariffs, seasonal tariffs and time-of-use tariffs.
Tariff review (rate case): A proceeding involving the determination of the rates and policies of a public utility.
Technical (technological) potential of energy efficiency: This is estimated using the assumption that the whole of the existing equipment stock is replaced overnight with the best available models. In other words, specific energy consumption will immediately fall from the “country average” to the “practical minimum”. Technological potential only provides hypothetical energy efficiency opportunities; it takes no account of the implementation costs or limitations.


Annexes

190
In-Depth Review of the Energy Efficiency Policy of Montenegro | 2018
Annex 1: Electricity retail tariffs, by component charges and by consumer category in 2018Electric Power Company of Montenegro, Share Company Niksic
FU SUPPLY
No: 50-00-14910
Niksic, Dec 14, 2017.
In line with the Article 205 of the Law on Energy and Article 15 of General Terms for Electricity Supply, EPCG Share company Niksic – Functional Unit Supply publishes:
Prices for Electricity Supply of End UsersThe prices for supply of end users with electricity are set forth by the following regulation:
• Decision on determination of prices of electricity for supply of customers connected to distribution system, no. 10-00-58377, dated Dec 14, 2017;
• Decision on determination of regulatory allowed revenue and price for use of distribution system for the period 01.01.2017 – 31.12.2019 – Official Gazette of Montenegro 76/2016.
• Decision on determination of regulatory allowed revenue and prices for Montenegrin Transmission Operator Share Company Podgorica for the period 01.01.2017 – 31.12.2019 – Official Gazette of Montenegro 76/016.
• Decision on determination of regulatory allowed revenue and fees of the work of Market Operator for 2018 – Official Gazette of Montenegro 79/2017.
As follows:
T1
Customer Category Calculation elements Unit Daily
period Tariff level
1 2 3 4 5 6
Distribution Custom-ers
35kV
Active energy kWh day 5.2116 €c/kWh
kWh night 2.6058 €c/kWh
Reactive energy kVArh day 1.0423 €c/kVArh
kVArh night 0.5212 €c/kVArh
Network capacity occupancy
Kw 3.6270 €c/kW
Network losses kWh day 0.1377 €c/kWh
kWh night 0.0689 €c/kWh
Market operator fee kWh 0.0152 €c/kWh
Renewables incen-tives fee
kWh 0.47316* €c/kWh

191
Annexes
T2
Customer Category Calculation elements Unit Daily
period Tariff level
1 2 3 4 5 6
Distribution Custom-ers
10kV
Active energy kWh day 5.2116 €c/kWh
kWh night 2.6058 €c/kWh
Reactive energy kVArh day 1.0423 €c/kVArh
kVArh night 0.5212 €c/kVArh
Network capacity occupancy
Kw 9.1818 €c/kW
Network losses kWh day 0.3591 €c/kWh
kWh night 0.1796 €c/kWh
Market operator fee kWh 0.0152 €c/kWh
Renewables incen-tives fee
kWh 0.47316* €c/kWh
T3
Customer Category Calculation elements Unit Daily
period Tariff level
1 2 3 4 5 6
Distribution Custom-ers
0.4 kV with metering of power
Active energy kWh day 5.2116 €c/kWh
kWh night 2.6058 €c/kWh
Reactive energy kVArh day 1.0423 €c/kVArh
kVArh night 0.5212 €c/kVArh
Network capacity occupancy
Kw 16.9386 €c/kW
Network losses kWh day 0.6783 €c/kWh
kWh night 0.3391 €c/kWh
Market operator fee kWh 0.0152 €c/kWh
Renewables incen-tives fee
kWh 0.47316* €c/kWh

192
In-Depth Review of the Energy Efficiency Policy of Montenegro | 2018
T4
Customer Category Calculation elements Unit Daily
period Tariff level
1 2 3 4 5 6
Distribution Custom-ers
0.4 kV with metering of power
(small customers)
Active energy kWh day 4.9422 €c/kWh
kWh night 2.4711 €c/kWh
Reactive energy kVArh day 0.9884 €c/kVArh
kVArh night 0.4942 €c/kVArh
Network capacity occupancy
Kw 16.9386 €c/kW
Network losses kWh day 0.6783 €c/kWh
kWh night 0.3391 €c/kWh
Market operator fee kWh 0.0152 €c/kWh
Renewables incen-tives fee
kWh 0.47316* €c/kWh
T5
Customer Category Calculation elements Unit Daily
period Tariff level
1 2 3 4 5 6
Distribution Custom-ers
0.4 kV with metering of reactive energy
Active energy kWh day 5.2116 €c/kWh
kWh night 2.6058 €c/kWh
Reactive energy kVArh day 1.0423 €c/kVArh
kVArh night 0.5212 €c/kVArh
Network capacity occupancy
Kw 3.2101 €c/kWh
Customer 1.5982 €/customer
Network losses kWh day 0.6918 €c/kWh
kWh night 0.3459 €c/kWh
Market operator fee kWh 0.0152 €c/kWh
Renewables incen-tives fee
kWh 0.47316* €c/kWh

193
Annexes
T6
Customer Category Calculation elements Unit Daily
period Tariff level
1 2 3 4 5 6
Distribution Custom-ers
0.4 kV with metering of reactive energy (small customers)
Active energy kWh day 4.9422 €c/kWh
kWh night 2.4711 €c/kWh
Reactive energy kVArh day 0.9884 €c/kVArh
kVArh night 0.4942 €c/kVArh
Network capacity occupancy
Kw 3.2101 €c/kWh
Customer 1.5982 €/customer
Network losses kWh day 0.6918 €c/kWh
kWh night 0.3459 €c/kWh
Market operator fee kWh 0.0152 €c/kWh
Renewables incen-tives fee
kWh 0.47316* €c/kWh
T7
Customer Category Calculation elements Unit Daily
period Tariff level
1 2 3 4 5 6
Distribution Custom-ers
0.4 kV without meter-ing of power, two-
tariff metering
Active energy kWh day 5.2116 €c/kWh
kWh night 2.6058 €c/kWh
Network capacity occupancy
Kw 3.2101 €c/kWh
Customer 1.5982 €/customer
Network losses kWh day 0.6918 €c/kWh
kWh night 0.3459 €c/kWh
Market operator fee kWh 0.0152 €c/kWh
Renewables incen-tives fee
kWh 0.47316* €c/kWh

194
In-Depth Review of the Energy Efficiency Policy of Montenegro | 2018
T8
Customer Category Calculation elements Unit Daily
period Tariff level
1 2 3 4 5 6
Distribution Custom-ers
0.4 kV without meter-ing of power, two-part tariff metering (small customers)
Active energy kWh day 4.9422 €c/kWh
kWh night 2.4711 €c/kWh
Network capacity occupancy
Kw 3.2101 €c/kWh
Customer 1.5982 €/customer
Network losses kWh day 0.6918 €c/kWh
kWh night 0.3459 €c/kWh
Market operator fee kWh 0.0152 €c/kWh
Renewables incen-tives fee
kWh 0.47316* €c/kWh
T9
Customer Category Calculation elements Unit Daily
period Tariff level
1 2 3 4 5 6
Distribution Custom-ers
0.4 kV without meter-ing of power, single
tariff metering
Active energy kWh 4.2389 €c/kWh
Network capacity occupancy
Kw 3.2101 €c/kWh
Customer 1.5982 €/customer
Network losses kWh 0.5578 €c/kWh
Market operator fee kWh 0.0152 €c/kWh
Renewables incen-tives fee
kWh 0.47316* €c/kWh
T10
Customer Category Calculation elements Unit Daily
period Tariff level
1 2 3 4 5 6
Distribution Custom-ers
0.4 kV without eter-ing of power, single
tariff metering (small customers)
Active energy kWh 4.0270 €c/kWh
Network capacity occupancy
Kw 3.2101 €c/kWh
Customer 1.5982 €/customer
Network losses kWh 0.5578 €c/kWh
Market operator fee kWh 0.0152 €c/kWh
Renewables incen-tives fee
kWh 0.47316* €c/kWh

195
Annexes
T11
Customer Category Calculation elements Unit Daily
period Tariff level
1 2 3 4 5 6
Distribution Custom-ers
0.4 kV Households
Two- tariff metering
Active energy kWh day 4.9422 €c/kWh
kWh night 2.4711 €c/kWh
Network capacity occupancy
Kw 3.2101 €c/kWh
Customer 1.5982 €/customer
Network losses kWh day 0.6918 €c/kWh
kWh night 0.3459 €c/kWh
Market operator fee kWh 0.0152 €c/kWh
Renewables incen-tives fee
kWh 0.47316* €c/kWh
T12
Customer Category Calculation elements Unit Daily
period Tariff level
1 2 3 4 5 6
Distribution Custom-ers
0.4 kV Households
Single tariff metering
Active energy kWh 4.0270 €c/kWh
Network capacity occupancy
Kw 3.2101 €c/kWh
Customer 1.5982 €/customer
Network losses kWh 0.5578 €c/kWh
Market operator fee kWh 0.0152 €c/kWh
Renewables incen-tives fee
kWh 0.47316* €c/kWh
NOTE*: Unit fee for incentivising generation of electricity from renewable energy sources and high-efficiency cogeneration in 2018 is determined by state authority body in charge for energy affairs (Ministry) on annual level and published in Official Gazette of Montenegro until January 25, 2018. Also, it will be published on the webpage of EPCG as it becomes effective.
Stated prices shall apply starting from 01.01.2018.
Executive Manager
Nikola Bezmerevic, Ecc Bsc.
Signature and stamp

196
In-Depth Review of the Energy Efficiency Policy of Montenegro | 2018
Annex 2: List of the bylaws of the Law on Efficient Use of Energy
No BY-LAW TITLE PUBLISHED
Energy Efficiency Targets
1 Rulebook on Determining Methodology for Calculation of the Indicative Energy Saving Target
Official Gazette of Montenegro 18/2011
2 Decision on Determining Indicative Energy Savings Target Official Gazette of Montenegro 48/2011
3 Decree on reconstruction of administrative buildings Official Gazette of Montenegro 09/2016
Energy Efficiency Planning and Reporting
4 Rulebook on the Content of the Operational Plan for Energy Efficiency Improvement and the Report on the Implementa-tion of the Plan
Official Gazette of Montenegro 08/2016
5 Rulebook on the Content of Energy Efficiency Improvement Programme and Energy Efficiency Improvement Plan of the Local Self-government Unit and the Report on the Imple-mentation of the Plan
Official Gazette of Montenegro 73/2015
6 Regulation on Methodology for Determining Annual Consumption of Primary energy, the Content of the Energy Efficiency Improvement Plan and the Report on Implemen-tation of the Plan of Large Consumer
Official Gazette of Montenegro 73/2015
7 Instruction on Energy Efficiency measures with Guidelines for Their Implementation
Official Gazette of Montenegro 73/2015
8 Rulebook on Information Systems of Energy Efficiency and on the Manner of Submission of Data
Official Gazette of Montenegro 73/2015
9 Rulebook on Methodology for Determining Energy Efficiency Level in Public Procurement Procedure
Official Gazette of Montenegro 09/2016
10 Rulebook on Methodology for Determining Energy Savings Official Gazette of Montenegro 22/2016
Energy Efficiency in Buildings
11 Rulebook on Minimal Energy Efficiency Requirements in Buildings
Official Gazette of Montenegro 75/2015
12 Rulebook On Certification Of Energy Performance Of Build-ings
Official Gazette of Montenegro 75/2015
13 Rulebook on Performing Energy Audits of Buildings Official Gazette of Montenegro 75/2015
14 Rulebook on Regular Energy Audits of Heating Systems and Air-conditioning Systems
Official Gazette of Montenegro 76/2015
15 Rulebook on Conditions for Performing Training, Obtaining of Authorisation and Manner of the Managing of the Registry for Energy Audits Performing
Official Gazette of Montenegro 75/2015

197
Annexes
No BY-LAW TITLE PUBLISHED
Energy Efficiency Labelling of Energy-Related Products
16 Rulebook on the Type of Energy-related Products for Which Energy Efficiency Labelling is Mandatory
Official Gazette of Montenegro 75/2015
17 Rulebook on Energy Efficiency Labelling of Washing Ma-chines in a Household
Official Gazette of Montenegro 75/2015
18 Rulebook on Energy Efficiency Labelling of Air-conditioners Official Gazette of Montenegro 75/2015
19 Rulebook on Energy Efficiency Labelling of Refrigerating Ap-pliances in a Household
Official Gazette of Montenegro 74/2016
20 Rulebook on Energy Efficiency Labelling of Televisions Official Gazette of Montenegro 74/2016
21 Rulebook on Energy Efficiency Labelling of Dishwashers in a Household
Official Gazette of Montenegro 74/2016
22 Rulebook on Energy Efficiency Labelling of Lamps and Luminaries
Official Gazette of Montenegro 74/2016
Energy Efficiency Labelling of Tyres
23 Rulebook on Energy Efficiency Labelling of Vehicles’ Tyres and Other Essential Parameters
Official Gazette of Montenegro 90/2017
Ecodesign Requirements for Energy-Related Products
24 Rulebook on Ecodesign of Energy Related Products Official Gazette of Montenegro 09/2016
25 Rulebook on Ecodesign Requirements for Non-Directional Household Lamps
Official Gazette of Montenegro 39/2017
26 Rulebook on Ecodesign Requirements for Fluorescent Lamps Without Integrated Ballast, for High Intensity Discharge Lamps, and for Ballasts and Luminaires Able to Operate Such Lamps
Official Gazette of Montenegro 39/2017
27 Rulebook on Ecodesign Requirements for Electric Motors Official Gazette of Montenegro 39/2017
28 Rulebook on Ecodesign Requirements for Simple Set-top Boxes
Official Gazette of Montenegro 78/2017
29 Rulebook on Ecodesign Requirements for Water Pumps Official Gazette of Montenegro 78/2017
30 Rulebook on Ecodesign Requirements for Glandless Stan-dalone Circulators
Official Gazette of Montenegro 78/2017
31 Rulebook on Ecodesign Requirements for Household Wash-ing Machines
Official Gazette of Montenegro 79/2017
32 Rulebook on Ecodesign Requirements for Household Tumble Driers
Official Gazette of Montenegro 79/2017
33 Rulebook on Ecodesign Requirements for Household Dish-washers
Official Gazette of Montenegro 79/2017

198
In-Depth Review of the Energy Efficiency Policy of Montenegro | 2018
No BY-LAW TITLE PUBLISHED
34 Rulebook on Ecodesign Requirements for External Power Supplies
Official Gazette of Montenegro 81/2017
35 Rulebook on Ecodesign Requirements for Fans Official Gazette of Montenegro 81/2017
36 Rulebook on Ecodesign Requirements for Household Refrig-erating Appliances
Official Gazette of Montenegro 81/2017
37 Rulebook on Ecodesign Requirements for Air Conditioners and Comfort Fans
Official Gazette of Montenegro 81/2017
38 Rulebook on Ecodesign Requirements for Televisions Official Gazette of Montenegro 86/2017
39 Rulebook on Ecodesign Requirements for Standby and Off Mode and Networked Standby Mode Electric Power Con-sumption of Electrical and Electronic Office and Household Equipment
Official Gazette of Montenegro 86/2017
40 Rulebook on Ecodesign Requirements for Directional Lamps, LED Lamps and Related Equipment
Official Gazette of Montenegro 86/2017

199
Annexes
Annex 3: List of the bylaws of the Law on Energy related to implementation of RES policy
No BY-LAW PUBLISHED
1 Rulebook on Types and Classification of Power Plants for Electricity Generation from Renewable Energy Sources and High Efficiency Cogeneration Plants
Official Gazette of Montenegro 60/2016
2 Decree on Acquiring the Status and Accomplishing Entitle-ments of the Privileged Producer of Electricity
Official Gazette of Montenegro 59/2016
3 Decree On Manner Of Issuance, Transfer And Cancellation Of Guarantees Of Origin For Energy Produced from RES And High Efficiency Cogeneration
Official Gazette of Montenegro 37/2011
4 Decree On Tariff System for Determining Incentive Prices for Electricity Produced from RES and High Efficiency Cogenera-tion
Official Gazette of Montenegro 52/2011, 28/2014 and 79/2015
5 Rulebook on the Conditions to be Fulfilled by a Legal Entity for the Research and Measurement of the Potential of Re-newable Energy Sources
Official Gazette of Montenegro 52/2017
6 Decree on Incentive Fees for Promoting Electricity Produc-tion from RES and Cogeneration
Official Gazette of Montenegro 33/2016 and 3/2017
7 Rulebook on the Unit Compensation for Promoting Electric-ity Production from RES and High-efficiency Cogeneration in 2017
Official Gazette of Montenegro 4/2018
8 Rulebook on the Contents of the Request for Issuing an Energy Permit and the Content of the Energy Permit Register
Official Gazette of Montenegro, 52/2017

200
In-Depth Review of the Energy Efficiency Policy of Montenegro | 2018
Ann
ex 4
: Ene
rgy
sect
or p
roje
cts
supp
orte
d by
don
or o
rgan
isat
ions
from
200
8–20
18(in
clud
ing
proj
ects
that
star
ted
earli
er b
ut h
ad n
ot fi
nish
ed b
efor
e 20
08)
No
DO
NO
R / I
FI
(CO
UN
TRY)
PRO
JEC
T TI
TLE
BEN
EFI-
CIA
RY
AM
OU
NT
/ TYP
E /
STAT
US
IMPL
EMEN
-TA
TIO
N
PERI
OD
(Fro
m-T
o)
BRIE
F D
ESCR
IPTI
ON
/ CO
MM
ENT
1.Kf
W (G
er-
man
y)Re
new
able
En
ergi
es
and
Ener
gy
Effici
ency
Fa
cilit
y M
on-
tene
gro
SMED
A –
Smal
l and
M
ediu
m
Ente
rpris
e D
evel
op-
men
t Ag
ency
EUR
2.5
+ 1
9m
ill. c
redi
t lin
e an
d EU
R0.
5 m
ill. T
A
Com
plet
ed
2006
- 20
16O
bjec
tive
of th
e fa
cilit
y is
to c
ontr
ibut
e to
the
impr
ovem
ent o
f the
eco
-no
mic
and
soci
al d
evel
opm
ent a
s wel
l as t
he p
rote
ctio
n of
the
envi
ron-
men
t and
the
reso
urce
s. Cr
edit
line
to lo
cal c
omm
erci
al b
anks
for t
he
exte
nsio
n of
loan
s to
SME
and
othe
r inv
esto
rs to
fina
nce
ener
gy e
ffici
ency
an
d re
new
able
ene
rgy
proj
ects
.Th
irtee
n pr
ojec
ts w
ere
real
ised
by th
e en
d of
200
8, w
ith a
tota
l am
ount
of
EUR
3 m
ill. I
n 20
08, t
he c
redi
t lin
e ha
s bee
n in
crea
sed
with
an
addi
tiona
l EU
R 19
mil.
The
cred
it lin
e is
give
n tr
ough
the
loca
l ban
ks fo
r SM
E en
ergy
effi
cien
cy
proj
ects
.
2.Kf
W (G
er-
man
y)Co
nstr
uc-
tion
and
Ope
ratio
n of
400
kV
Tran
smis-
sion
Line
Ti
rana
-Pod
-go
rica
EPCG
and
KE
SH (A
lba-
nian
Pow
er
Com
pany
)
Loan
(Tot
al
for A
lban
ia
and
Mon
te-
negr
o): E
UR
43.9
mill
. C
ompl
eted
2004
– 2
011
The
obje
ctiv
e is
to c
ontr
ibut
e to
the
furt
her e
cono
mic
dev
elop
men
t of
the
Repu
blic
of A
lban
ia a
s wel
l as t
he R
epub
lic o
f Mon
tene
gro.
Mea
sure
s: Co
nstr
uctio
n of
a 4
00 k
V tr
ansm
issio
n lin
e an
d su
bsta
tions
in P
odgo
rica
and
Elba
san.
Thi
s sho
uld
stre
ngth
en th
e tr
ansm
issio
n gr
id in
the
regi
on,
signi
fican
tly im
prov
e th
e el
ectr
icity
supp
ly se
curit
y in
Alb
ania
and
unl
oad
exist
ing
tran
smiss
ion
grid
ele
men
ts in
Mon
tene
gro.
KfW
is p
rovi
ding
loan
to K
ESH
, whi
ch fu
rthe
r ext
ends
par
t of t
he lo
an (E
UR
11.1
6 m
ill.)
to E
PCG
und
er th
e in
tern
al K
ESH
-EPC
G a
gree
men
t.W
orks
on
cons
truc
tion
of 4
00kV
OH
L fro
m P
odgo
rica
to T
irana
hav
e be
en
final
ised,
and
it w
as p
ut in
to o
pera
tion
in Ju
ly 2
011.

201
Annexes
No
DO
NO
R / I
FI
(CO
UN
TRY)
PRO
JEC
T TI
TLE
BEN
EFI-
CIA
RY
AM
OU
NT
/ TYP
E /
STAT
US
IMPL
EMEN
-TA
TIO
N
PERI
OD
(Fro
m-T
o)
BRIE
F D
ESCR
IPTI
ON
/ CO
MM
ENT
3.Kf
W (G
er-
man
y)Ex
tens
ion/
cons
truc
-tio
n of
the
subs
tatio
ns
Riba
revi
ne
and
Pod-
goric
a 5
EPCG
Gra
nt: E
UR
3.1
mill
.Lo
an: E
UR
5.4
mill
. + Lo
an: E
UR
5.0
mill
. Co
mpl
eted
2007
-201
0+ 20
08-2
012
Enfo
rcem
ent o
f the
ele
ctric
al n
etw
ork
in M
onte
negr
o an
d im
prov
emen
t of
conn
ectio
ns w
ith re
gion
al e
nerg
y sy
stem
. Mea
sure
s: Co
nstr
uctio
n of
new
S/
S Po
dgor
ica
5 in
a v
ery
impo
rtan
t ind
ustr
ial p
art o
f Pod
goric
a, w
hich
w
ill u
nbur
den
the
exist
ing
subs
tatio
ns a
nd im
prov
e th
e su
pply
of t
he c
ity.
Exte
nsio
n of
exi
stin
g su
bsta
tion
Riba
revi
ne, w
hich
is v
ery
impo
rtan
t for
su
pply
ing
the
nort
hern
par
t of c
ount
ry. T
est o
pera
tion
of S
/S 4
00/1
10 k
V Ri
bare
vine
was
star
ted
in D
ecem
ber 2
010.
The
first
par
t (gr
ant +
loan
) is u
nder
“mix
ed fi
nanc
ing”
sche
me,
whi
le th
e la
st lo
an o
f EU
R 5.
0 m
ill. i
s und
er “i
nter
est-
redu
ced”
term
s due
to c
hang
ed
inve
stm
ent r
atin
g of
Mon
tene
gro.
Afte
r the
unb
undl
ing,
EPC
G-C
GES
on-
land
ing
agre
emen
ts, r
efer
ring
to th
e af
orem
entio
ned
loan
s and
gra
nt, a
re si
gned
. Loa
n ag
reem
ents
bet
wee
n EP
CG a
nd K
fW a
men
ded.
4.Kf
W (G
er-
man
y)Re
plac
e-m
ent o
f El
ectr
osta
tic
Prec
ipita
-to
rs in
TPP
Pl
jevl
ja
EPCG
Loan
: EU
R 10
mill
Com
plet
ed
2008
-201
1M
ain
goal
is to
impr
ove
envi
ronm
enta
l pro
tect
ion
of th
e re
gion
, in
part
icu-
lar b
y re
duci
ng e
miss
ion
of p
artic
les o
n le
vel w
hich
will
com
ply
with
the
mos
t rec
ent E
urop
ean
and
Mon
tene
grin
legi
slatio
n.
5.Kf
W (G
er-
man
y)Re
habi
lita-
tion
and
mod
erni
sa-
tion
of H
PP
Peru
cica
, Ph
ase
I
EPCG
Gra
nt: E
UR
4.46
mill
Loan
: EU
R 3.
58 m
ill
Com
plet
ed
2004
-201
1Th
e en
tire
reha
bilit
atio
n of
HPP
Per
ucic
a ai
ms a
t the
ext
ensio
n of
the
life-
time
of th
e pl
ant b
y 25
to 3
0 ye
ars,
to ra
ise th
e pl
ant o
utpu
t fro
m 2
85 M
W.
With
in th
e fir
st p
hase
of r
ehab
ilita
tion,
con
trol
and
com
man
d of
Gen
era-
tor-T
urbi
ne u
nits
1-4
and
ass
ocia
ted
mea
sure
s hav
e be
en p
erfo
rmed
.

202
In-Depth Review of the Energy Efficiency Policy of Montenegro | 2018
No
DO
NO
R / I
FI
(CO
UN
TRY)
PRO
JEC
T TI
TLE
BEN
EFI-
CIA
RY
AM
OU
NT
/ TYP
E /
STAT
US
IMPL
EMEN
-TA
TIO
N
PERI
OD
(Fro
m-T
o)
BRIE
F D
ESCR
IPTI
ON
/ CO
MM
ENT
6.Kf
W (G
er-
man
y)Re
habi
lita-
tion
and
mod
erni
sa-
tion
of H
PP
Peru
cica
, pr
epar
atio
n of
Pha
se II
EPCG
Gra
nt: E
UR
0.54
mill
an
d EU
R 0.
235
mill
Ong
oing
2008
-201
8Th
is ad
ditio
nal g
rant
has
bee
n co
mbi
ned
with
fina
ncia
l con
trib
utio
n fo
r th
e ac
com
pany
ing
mea
sure
s (EU
R 0.
540
mill
) to
prep
are
stud
ies w
ith th
e ob
ject
ive
of re
mov
ing
exist
ing
ener
gy li
mita
tion
and
to e
nsur
e sa
fe o
pera
-tio
n of
hyd
ropo
wer
pla
nt w
ith th
e in
stal
led
max
cap
acity
and
to st
udy
the
optio
n to
inst
all u
nit 8
.In
-situ
test
, as a
pre
cond
ition
for t
hese
stud
ies,
has b
een
carr
ied
out i
n 20
10.
Elab
orat
ion
of th
e St
udy
spec
ifyin
g co
nten
t and
scop
e of
Pha
se II
of t
he
Prog
ram
of M
oder
niza
tion
and
Reha
bilit
atio
n of
HPP
Per
ucic
a.
7.Kf
W (G
er-
man
y)Re
habi
lita-
tion
and
mod
erni
sa-
tion
of H
PP
Piva
, Pha
se I
EPCG
Loan
: EU
R 16
mill
.G
rant
: EU
R 1
mill
. for
ac-
com
pany
ing
mea
sure
s
Ong
oing
2007
-202
1Im
prov
emen
t of t
he sa
fety
and
relia
bilit
y st
anda
rd o
f HPP
Piv
a in
ord
er
to im
prov
e th
e ov
eral
l sta
bilit
y of
the
ener
gy sy
stem
of M
onte
negr
o.
Mea
sure
s: re
habi
litat
ion
of th
e el
ectr
ical
, mec
hani
cal a
nd c
ivil
equi
pmen
t at
the
plan
t.Al
l pla
nned
test
s per
form
ed a
nd st
udie
s nee
ded
for t
he fe
asib
ility
stud
y ha
ve b
een
prep
ared
. Sel
ecte
d eq
uipm
ent:
repl
acem
ent o
f 220
kV S
witc
h-ya
rd D
iscon
nect
ors r
ealis
ed, a
dditi
onal
sele
cted
equ
ipm
ent t
o fin
ance
not
ye
t ide
ntifi
ed.
“Inte
rest
redu
ced”
loan
con
ditio
ns.
8.Kf
W (G
er-
man
y)Pr
ogra
m fo
r th
e Pr
omo-
tion
of
Rene
wab
le
Ener
gies
(H
ydro
-po
wer
)
Min
istry
of
Econ
omy
(ME)
Fina
ncia
l co
ntrib
utio
n up
to E
UR
400,
000
Ong
oing
2009
– To
be
defin
edTh
is fin
anci
al c
ontr
ibut
ion
shal
l be
used
exc
lusiv
ely
for fi
nanc
ing
the
fol-
low
ing
expe
rt se
rvic
es:
Prep
arat
ion
of th
e pr
opos
ed “P
rogr
am fo
r the
Pro
mot
ion
of R
enew
able
En
ergi
es (H
ydro
pow
er)”;
Sele
cted
stud
ies a
nd su
perv
isory
act
iviti
es;
- If
nec
essa
ry, o
ther
exp
ert s
ervi
ces s
till t
o be
agr
eed
betw
een
the
Reci
pi-
ent a
nd K
fW.

203
Annexes
No
DO
NO
R / I
FI
(CO
UN
TRY)
PRO
JEC
T TI
TLE
BEN
EFI-
CIA
RY
AM
OU
NT
/ TYP
E /
STAT
US
IMPL
EMEN
-TA
TIO
N
PERI
OD
(Fro
m-T
o)
BRIE
F D
ESCR
IPTI
ON
/ CO
MM
ENT
9.Kf
W (G
er-
man
y)Ad
viso
ry
Serv
ices
in
Supp
ort o
f Im
plem
en-
tatio
n of
En-
ergy
Sec
tor
Refo
rms
ME
Earm
arke
d up
to E
UR
330.
000
(gra
nt)
Com
plet
ed
2010
– 2
012
(no
pro-
long
atio
n fo
rese
en)
Advi
sory
serv
ices
shal
l com
prise
the
follo
win
g:As
sista
nce
in im
plem
enta
tion
of E
nerg
y D
evel
opm
ent S
trat
egy
and
of th
e ac
tion
plan
;As
sista
nce
in p
rom
otio
n an
d im
plem
enta
tion
of e
nerg
y se
ctor
refo
rms
and
in in
stitu
tiona
l str
engt
heni
ng o
f ME;
Assis
tanc
e to
ME
in p
repa
ratio
n of
a te
nder
dos
sier f
or c
once
ssio
n in
the
Mao
ce B
asin
;Su
ppor
t in
Coor
dina
ted
Auct
ion
Offi
ce re
late
d iss
ues;
Ad-h
oc a
dvic
e to
the
min
ister
bas
ed o
n th
e cu
rrent
nee
ds a
nd d
eman
d.
10.
KfW
(Ger
-m
any)
Ener
gy
Effici
ency
Pr
ogra
mm
e in
Pub
lic
Build
ings
, ph
ase
I (E
EPPB
I)
GoM
, ME,
M
inist
ry o
f Ed
ucat
ion
Loan
: EU
R 11
.5 m
illG
rant
: EU
R 1.
5 m
ill
Com
plet
ed
2011
-201
6En
ergy
effi
cien
cy m
easu
res i
n pu
blic
bui
ldin
gs.
The
aim
is re
duci
ng th
e en
ergy
con
sum
ptio
n in
the
publ
ic se
ctor
, esp
e-ci
ally
in e
duca
tiona
l bui
ldin
g.Th
e fo
llow
ing
activ
ities
wer
e fin
ance
d fro
m th
e lo
an a
nd g
rant
:En
ergy
effi
cien
t rec
onst
ruct
ion
of 2
1 ed
ucat
iona
l fac
ilitie
s;Ex
pert
serv
ices
pro
vide
d by
the
prog
ram
me
cons
ulta
nt.

204
In-Depth Review of the Energy Efficiency Policy of Montenegro | 2018
No
DO
NO
R / I
FI
(CO
UN
TRY)
PRO
JEC
T TI
TLE
BEN
EFI-
CIA
RY
AM
OU
NT
/ TYP
E /
STAT
US
IMPL
EMEN
-TA
TIO
N
PERI
OD
(Fro
m-T
o)
BRIE
F D
ESCR
IPTI
ON
/ CO
MM
ENT
11.
KfW
(Ger
-m
any)
Ener
gy
Effici
ency
Pr
ogra
mm
e in
Pub
lic
Build
ings
, ph
ase
II (E
EPPB
II)
GoM
, ME,
M
inist
ry o
f Ed
ucat
ion,
M
inist
ry o
f La
bor a
nd
Soci
al A
ffair,
Pr
oper
ty
Adm
inist
ra-
tion
Loan
: EU
R 20
mill
Gra
nt: E
UR
2.85
mill
Ong
oing
2015
-201
9En
ergy
effi
cien
cy m
easu
res i
n pu
blic
bui
ldin
gs. T
he a
im is
redu
cing
of t
he
ener
gy c
onsu
mpt
ion
in p
ublic
sect
or. T
he fo
llow
ing
activ
ities
fina
nced
fro
m th
e lo
an a
nd g
rant
:En
ergy
effi
cien
t rec
onst
ruct
ion
and
mod
erni
satio
n of
up
to 2
5 ed
ucat
iona
l bu
ildin
gs;
Ener
gy e
ffici
ent r
econ
stru
ctio
n an
d m
oder
nisa
tion
of u
p to
5 so
cial
faci
li-tie
s;En
ergy
effi
cien
t rec
onst
ruct
ion
and
mod
erni
satio
n of
up
to 6
adm
inist
ra-
tive
faci
litie
s;En
ergy
effi
cien
t rec
onst
ruct
ion
and
mod
erni
satio
n of
up
to 3
faci
litie
s in
serv
ice
of R
esou
rce
Cent
res (
soci
al b
uild
ings
);Ac
com
pany
ing
cons
ulta
nt se
rvic
es (c
onsu
ltanc
y se
rvic
es fo
r des
ign,
ten-
derin
g, a
war
ding
of c
ontr
acts
, sup
ervi
sion
of w
orks
, pre
parin
g of
ene
rgy
audi
ts a
nd a
udits
of t
he b
uild
ing
stru
ctur
e, e
nerg
y ad
viso
ry a
nd e
nerg
y m
onito
ring
and
cont
rol s
ervi
ces)
.
12.
KfW
(Ger
-m
any)
Tran
s-Ba
lkan
El
ectr
ic-
ity C
orrid
or,
tran
smiss
ion
netw
ork
im-
prov
emen
t
CGES
WBI
F G
rant
: EU
R 25
mill
Ong
oing
2016
-201
9‘T
rans
-Bal
kan
Elec
tric
ity C
orrid
or (I
) - G
rid S
ectio
n in
Mon
tene
gro
- Par
t II’
(the
Actio
n) is
par
t of a
larg
er p
roje
ct w
ith th
e fu
ll tit
le “T
rans
-Bal
kan
Elec
tric
ity C
orrid
or (I
) – G
rid S
ectio
n M
onte
negr
o”. T
he p
roje
ct is
div
ided
in
to fo
ur c
ompo
nent
s: Co
mpo
nent
1 c
ompr
ises t
he re
plac
emen
t of h
igh
volta
ge e
quip
men
t in
diffe
rent
subs
tatio
ns;
Com
pone
nt 2
com
prise
s the
reco
nstr
uctio
n of
con
trol
and
pro
tect
ion,
and
SC
ADA
inte
grat
ion;
Com
pone
nt 3
com
prise
s of r
epla
cem
ent e
xist
ing
220k
V O
HL
with
new
40
0kV
OH
L fro
m P
ljevl
ja 2
to M
onte
negr
in b
orde
r and
ext
ensio
n of
400
kV
switc
hyar
d in
subs
tatio
n Pl
jevl
ja 2
; Co
mpo
nent
4 c
ompr
ises t
he se
rvic
es re
late
d to
han
dove
r of W
P Kr
novo
tr
ansm
issio
n in
frast
ruct
ure.

205
Annexes
No
DO
NO
R / I
FI
(CO
UN
TRY)
PRO
JEC
T TI
TLE
BEN
EFI-
CIA
RY
AM
OU
NT
/ TYP
E /
STAT
US
IMPL
EMEN
-TA
TIO
N
PERI
OD
(Fro
m-T
o)
BRIE
F D
ESCR
IPTI
ON
/ CO
MM
ENT
13.
KfW
(Ger
-m
any)
Tran
s-Ba
lkan
El
ectr
icity
Co
rrid
or, S
S La
stva
CGES
Loan
: EU
R 25
mill
Ong
oing
2012
-201
8Sc
ope
of th
e W
orks
: Co
nstr
uctio
n of
400
/110
/35
kV L
astv
a Su
bsta
tion;
Exte
nsio
n of
the
exist
ing
400/
220/
110
kV P
ljevl
ja 2
Sub
stat
ion.
14.
EBRD
EPCG
Met
er-
ing
and
Dist
ribut
ion
proj
ect
EPCG
Corp
orat
e Lo
an: E
UR
65 m
ill
Com
plet
ed
2010
- 20
16Fi
nanc
ing
purc
hase
and
inst
alla
tion
in th
e M
onte
negr
in e
lect
ricity
dist
ri-bu
tion
netw
ork
of e
lect
roni
c m
eter
s, to
geth
er w
ith re
late
d in
frast
ruct
ure,
so
ftwar
e, c
omm
unic
atio
ns e
quip
men
t and
pro
ject
impl
emen
tatio
n as
-sis
tanc
e.
15.
EBRD
CED
IS S
mar
t M
eter
ing
Com
plet
ion
Proj
ect
CED
ISLo
an: E
UR
32,0
00,0
00
(18,
500,
000
On
the
acco
unt o
f EB
RD+ 13
,500
,000
Sy
ndic
ated
lo
an w
ith
ERST
E)
Ong
oing
2017
- pre
-se
ntCo
mpl
etio
n of
the
smar
t met
erin
g pr
ojec
t und
er th
e ne
wly
est
ablis
hed
dist
ribut
ion
syst
em o
pera
tor –
CED
IS.

206
In-Depth Review of the Energy Efficiency Policy of Montenegro | 2018
No
DO
NO
R / I
FI
(CO
UN
TRY)
PRO
JEC
T TI
TLE
BEN
EFI-
CIA
RY
AM
OU
NT
/ TYP
E /
STAT
US
IMPL
EMEN
-TA
TIO
N
PERI
OD
(Fro
m-T
o)
BRIE
F D
ESCR
IPTI
ON
/ CO
MM
ENT
16.
EBRD
Mon
tene
-gr
o: L
astv
a –
Plje
vlja
Tr
ansm
is-sio
n Li
ne
CGES
Sove
reig
n G
uara
ntee
d Co
rpor
ate
Loan
:EU
R 60
,000
,000
Ong
oing
2013
- pr
e-se
ntFi
nanc
ing
the
cons
truc
tion
and
oper
atio
n of
a 4
00 k
V hi
gh v
olta
ge
tran
smiss
ion
line
from
the
onsh
ore
term
inat
ion
of th
e Ita
ly to
Mon
tene
gro
unde
rsea
cab
le to
Plje
vlja
in N
orth
ern
Mon
tene
gro.
17.
EBRD
Krno
vo
Win
d Fa
rm
Akuo
Ene
rgy
Corp
orat
e lo
an:
EUR
48,5
00,0
00
Com
plet
ed
2015
- 20
18Fi
nanc
ing
72 k
W K
rnov
o W
ind
Farm
.
18.
EBRD
WeB
SED
FF
– H
ydro
Bis-
tric
a SH
PP
Hyd
ro
Bist
rica
doo
Podg
oric
a
Proj
ect-
finan
ce
secu
red
loan
: EU
R 4,
200,
000
Com
plet
ed
2015
- 20
17Lo
ng-t
erm
loan
on
a lim
ited
reco
urse
bas
is un
der t
he W
eBSE
DFF
to fi
-na
nce
the
cons
truc
tion
of th
e sm
all h
ydro
pow
er p
lant
Bist
rica
with
a to
tal
inst
alle
d ca
paci
ty o
f 3.6
MW
in M
onte
negr
o.
19.
EBRD
Hilt
on P
od-
goric
aH
otel
Crn
a G
ora
doo
Podg
oric
a
Corp
orat
e Lo
an: E
UR
19,2
00,0
00
Com
plet
ed
2011
- 20
16Re
furb
ishm
ent a
nd e
xten
sion
of th
e H
otel
Crn
a G
ora
loca
ted
in a
prim
e ce
ntra
l loc
atio
n of
Pod
goric
a, in
clud
ing
impl
emen
tatio
n of
sust
aina
ble
ener
gy B
est A
vaila
ble
Tech
niqu
es (B
AT):
build
ing
man
agem
ent s
yste
m,
heat
pum
p an
d th
e so
lar t
herm
al e
nerg
y.

207
Annexes
No
DO
NO
R / I
FI
(CO
UN
TRY)
PRO
JEC
T TI
TLE
BEN
EFI-
CIA
RY
AM
OU
NT
/ TYP
E /
STAT
US
IMPL
EMEN
-TA
TIO
N
PERI
OD
(Fro
m-T
o)
BRIE
F D
ESCR
IPTI
ON
/ CO
MM
ENT
20.
EBRD
Revi
ew a
nd
Upd
ate
of
Rene
w-
able
Ene
rgy
Legi
slatio
n
ME
TA: E
UR
135,
000
Com
plet
ed
2009
-201
0Id
entif
y ne
w, a
nd/o
r refi
ne, e
xist
ing
mec
hani
sms,
proc
edur
es a
nd st
and-
ards
in th
e ar
ea o
f ren
ewab
le e
nerg
y in
Mon
tene
gro.
Spe
cific
pie
ces o
f RES
re
gula
tions
dra
fted.
21.
EBRD
Enha
nce-
men
t of
Mod
ellin
g Ca
pabi
lity
for F
eed-
In
Tariff
s and
its
Impa
ct
ME
TA: E
UR
45,0
00
Com
plet
ed
2010
Dev
elop
men
t, te
stin
g an
d tr
ansf
er o
f a fl
exib
le m
odel
with
the
abili
ty to
an
alys
e se
vera
l sce
nario
s to
calc
ulat
e Fi
Ts a
nd th
eir i
mpa
ct o
n aff
orda
bilit
y. M
odel
dev
elop
ed a
nd tr
ansf
erre
d.
22.
EBRD
Revi
ew
Prop
osed
Re
new
able
En
ergy
Law
to
Ens
ure
it M
eets
EU
Re
quire
-m
ents
ME
TA: E
UR
35,0
00
Com
plet
ed
2010
Revi
ew o
f pro
pose
d dr
afts
of t
he b
ylaw
s to
impl
emen
t wor
ding
of t
he
Ener
gy L
aw a
nd to
refle
ct re
quire
men
ts o
f the
EU
legi
slatio
n. R
ecom
men
-da
tions
for a
revi
ew o
f byl
aws.
23.
EBRD
Feed
-In
Tariff
s (Fi
Ts)
for R
enew
-ab
le E
nerg
y So
urce
s
ME
TA: E
UR
95,0
00
Com
plet
ed
2010
-201
1D
evel
op m
etho
dolo
gy fo
r cal
cula
tion
of F
iTs f
or R
ES a
nd te
chno
logi
es th
at
have
not
bee
n co
vere
d un
der p
revi
ous s
ub-a
ssig
nmen
ts a
nd a
sses
smen
t of
an
impa
ct o
n el
ectr
icity
pric
es a
nd th
eir f
utur
e aff
orda
bilit
y. Fi
Ts fo
r se
lect
ed R
ES a
nd a
fford
abili
ty im
pact
ass
essm
ent.

208
In-Depth Review of the Energy Efficiency Policy of Montenegro | 2018
No
DO
NO
R / I
FI
(CO
UN
TRY)
PRO
JEC
T TI
TLE
BEN
EFI-
CIA
RY
AM
OU
NT
/ TYP
E /
STAT
US
IMPL
EMEN
-TA
TIO
N
PERI
OD
(Fro
m-T
o)
BRIE
F D
ESCR
IPTI
ON
/ CO
MM
ENT
24.
EBRD
Pow
er
Net
wor
k An
alys
is fo
r W
ind
Pow
er
Inte
grat
ion
ME
TA: E
UR
200,
000
Com
plet
ed
2010
-201
1En
able
CG
ES to
det
erm
ine
the
appr
opria
te le
vels
of w
ind
pow
er c
apac
ity
whi
ch m
ay b
e co
nnec
ted
to th
e na
tiona
l grid
and
app
ropr
iate
ope
ratio
nal
and
tech
nica
l par
amet
ers f
or m
anag
emen
t of s
uch
conn
ecte
d ca
paci
ty,
and
to id
entif
y w
heth
er in
vest
men
t is n
eede
d to
stre
ngth
en th
e na
tiona
l gr
id. R
evie
w o
f cap
acity
ava
ilabl
e fo
r RES
con
nect
ion
and
cost
s of g
rid
capa
city
stre
ngth
enin
g.
25.
EBRD
Nat
iona
l Re
new
-ab
le E
nerg
y Ac
tion
Plan
(N
REAP
)
ME
TA: E
UR
187,
000
Com
plet
ed
2010
-201
3Su
ppor
t in
deve
lopm
ent o
f a re
alist
ic R
ES im
plem
enta
tion
plan
and
fulfi
l-m
ent o
f its
obl
igat
ions
on
subm
issio
n of
the
Nat
iona
l NRE
AP a
s req
uire
d by
the
EU R
ES D
irect
ive.
Dra
ft ve
rsio
n of
NRE
AP d
eliv
ered
to th
e G
ov’t.
26.
EBRD
Pow
er
Purc
hase
Ag
reem
ent
(PPA
)
ME
TA: E
UR
210,
000
Com
plet
ed
2011
-201
2Pr
epar
e a
mod
el P
PA fo
r a re
new
able
ene
rgy
gene
rato
r tha
t will
mee
t the
re
quire
men
ts o
f dom
estic
and
inte
rnat
iona
l inv
esto
rs w
hile
pro
tect
ing
the
inte
rest
s of t
he b
uyer
and
oth
er st
akeh
olde
rs in
the
ener
gy se
ctor
. Dra
ft ve
rsio
n of
PPA
s per
cou
ntry
.
27.
EBRD
Enha
nce-
men
t of
Regi
stry
fo
r SH
PPs
1-10
MW
in
stal
led
capa
city
ME
TA: E
UR
625,
550
Com
plet
ed
2016
-201
8En
hanc
emen
t of r
egist
ry o
f riv
ers t
hat h
ave
pote
ntia
l for
dev
elop
men
t of
SHPP
s of 1
-10M
W in
stal
led
capa
city
.

209
Annexes
No
DO
NO
R / I
FI
(CO
UN
TRY)
PRO
JEC
T TI
TLE
BEN
EFI-
CIA
RY
AM
OU
NT
/ TYP
E /
STAT
US
IMPL
EMEN
-TA
TIO
N
PERI
OD
(Fro
m-T
o)
BRIE
F D
ESCR
IPTI
ON
/ CO
MM
ENT
28.
EBRD
Supp
ort-
ing
ESCO
pr
ojec
ts in
th
e pu
blic
se
ctor
(leg
al
assis
tanc
e fo
r ESC
O
proj
ect e
na-
blin
g le
gal
fram
ewor
k)
unde
r Wes
t-er
n Ba
lkan
s Re
gion
al
Ener
gy
Effici
ency
Pr
ogra
mm
e (R
EEP)
ME
TA: E
UR
196,
759.
00*
*Est
imat
ed
shar
e of
M
onte
ne-
gro
unde
r re
gion
al
proj
ect
Com
plet
ed
2013
-201
8Po
licy
dial
ogue
to su
ppor
t the
dev
elop
men
t of a
n en
ablin
g en
viro
nmen
t fo
r sus
tain
able
ene
rgy
thro
ugh
two
them
es o
f act
ivity
. Leg
al a
ssist
ance
for
an E
SCO
pro
ject
ena
blin
g le
gal f
ram
ewor
k.
29.
EBRD
Supp
ortin
g sc
opin
g po
-te
ntia
l ESC
O
inve
stm
ent
pote
ntia
l in
pub
lic
sect
or
ME
/ Mun
ici-
palit
ies
TA: E
UR
69,4
87.0
0
Com
plet
ed
2015
Iden
tifica
tion
of e
nerg
y effi
cien
cy E
SCO
inve
stm
ent p
oten
tial i
n st
reet
lig
htin
g, p
ublic
bui
ldin
gs.

210
In-Depth Review of the Energy Efficiency Policy of Montenegro | 2018
No
DO
NO
R / I
FI
(CO
UN
TRY)
PRO
JEC
T TI
TLE
BEN
EFI-
CIA
RY
AM
OU
NT
/ TYP
E /
STAT
US
IMPL
EMEN
-TA
TIO
N
PERI
OD
(Fro
m-T
o)
BRIE
F D
ESCR
IPTI
ON
/ CO
MM
ENT
30.
EBRD
Perfo
rman
ce
base
d in
cent
ive
netw
ork
regu
latio
n
Ener
gy
Regu
lato
ry
Agen
cy
TA: E
UR
74,4
70
Com
plet
ed
2017
-201
8Pr
ovid
e an
alyt
ical
supp
ort t
o th
e M
onte
negr
in E
nerg
y Re
gula
tory
Age
ncy
(REG
AGEN
) by
deve
lopi
ng re
com
men
datio
ns fo
r set
ting
ince
ntiv
es fo
r se
rvic
e qu
ality
, dist
ribut
ed g
ener
atio
n an
d de
man
d-sid
e m
anag
emen
t for
tr
ansm
issio
n an
d di
strib
utio
n co
mpa
nies
. Sat
isfac
tory
repo
rt w
ith re
com
-m
enda
tions
del
iver
ed to
REG
AGEN
. Im
plem
enta
tion
of th
e re
com
men
da-
tions
into
the
law
are
ong
oing
.
31.
EBRD
Tariff
syst
em
revi
sion
and
mod
ellin
g ac
hiev
e-m
ent o
f re
new
able
en
ergy
goa
ls
ME
TA: E
UR
59,0
40
Com
plet
ed
2015
-201
61)
Sup
port
Mon
tene
gro
in th
e re
visio
n of
the
Dec
ree
on Ta
riff S
yste
m fo
r D
eter
min
ing
the
Ince
ntiv
e Pr
ices
for E
lect
ricity
Pro
duce
d fro
m th
e Re
new
-ab
le E
nerg
y So
urce
s and
Hig
h Effi
cien
cy C
ogen
erat
ion.
2)
Sup
port
Mon
tene
gro
by p
repa
ring
a ge
nera
l ass
essm
ent o
f the
rene
w-
able
ene
rgy
sect
or in
Mon
tene
gro
with
the
aim
of e
valu
atin
g w
heth
er
Mon
tene
gro
wou
ld a
chie
ve th
e re
new
able
ene
rgy
goal
s if m
ajor
indu
stria
l pr
oduc
ers i
n th
e co
untr
y in
crea
se th
eir e
nerg
y co
nsum
ptio
n.
32.
EBRD
Coor
dina
ted
Auct
ion
Offi
ce in
SEE
–
Esta
blish
-m
ent o
f a
Coor
dina
ted
Auct
ion
Of-
fice
in S
outh
Ea
st E
urop
e (P
roje
ct
Com
pany
)
SEE
CAO
TA: E
UR
859,
907
Com
plet
ed
2011
-201
7TC
pro
ject
to su
ppor
t the
sett
ing
up o
f a C
oord
inat
ed A
uctio
n O
ffice
for
elec
tric
ity tr
ansm
issio
n in
Sou
th E
ast E
urop
e (th
e “S
EE C
AO”).
SEE
CAO
was
es
tabl
ished
succ
essf
ully
with
seve
n sh
areh
olde
rs/T
SO sy
stem
ope
rato
rs
join
ing
the
SEE
CAO
pla
tform
and
ope
ratin
g un
der t
he c
omm
on se
t of
auct
ion
rule
s for
allo
catio
n of
cro
ss-b
orde
r tra
nsm
issio
n ca
paci
ties.
The
plat
form
also
att
ract
ed 1
00+
regi
ster
ed tr
adin
g co
mpa
nies
and
par
tici-
pant
s fro
m 1
6 di
ffere
nt c
ount
ries.

211
Annexes
No
DO
NO
R / I
FI
(CO
UN
TRY)
PRO
JEC
T TI
TLE
BEN
EFI-
CIA
RY
AM
OU
NT
/ TYP
E /
STAT
US
IMPL
EMEN
-TA
TIO
N
PERI
OD
(Fro
m-T
o)
BRIE
F D
ESCR
IPTI
ON
/ CO
MM
ENT
33.
EBRD
Dev
elop
-m
ent
of S
HPP
re
gist
ry fo
r N
orth
ern
Mon
tene
gro
ME
TA: E
UR
268,
889
Com
plet
ed
2011
-201
3
34.
EBRD
Pre-
feas
ibil-
ity st
udy
for
5 SH
PPs i
n M
onte
negr
o
ME
TA: E
UR
72,8
14
Com
plet
ed
2010
-201
1
35.
EBRD
Civi
l Soc
iety
Se
ctor
Civi
l Soc
iety
Se
ctor
TA: E
UR
53,6
50
Com
plet
ed
2013
-201
4To
raise
aw
aren
ess o
f the
EBR
D’s
inve
stm
ent b
y tr
ansf
errin
g sk
ills t
o th
e M
onte
negr
in c
ivil
soci
ety
sect
or, t
o un
ders
tand
the
impo
rtan
ce a
nd
bene
fits o
f sm
art m
eter
ing
and
EE in
the
coun
try
and
to c
ontr
ibut
e to
pr
ompt
ing
beha
viou
ral c
hang
es a
mon
g co
nsum
ers.
The
TC w
ill e
nhan
ce
the
tech
nica
l exp
ertis
e an
d co
mm
unic
atio
n sk
ills o
f civ
il so
ciet
y be
nefi-
ciar
ies t
o pr
omot
e th
e en
ergy
effi
cien
cy a
gend
a in
the
coun
try
thro
ugh
3 tr
aini
ng w
orks
hops
. O
bjec
tives
of t
he T
C m
et fu
lly, f
urth
er d
etai
ls av
aila
ble
in th
e re
port
.
36.
EBRD
REEP
Plu
s (Im
plem
en-
tatio
n of
Ec
odes
ign
and
ener
gy
labe
lling
re-
quire
men
ts
ME
TA: E
UR
95,5
31
Com
plet
ed
2017
-201
8W
ork
has b
een
on-g
oing
und
er th
e RE
EP P
lus p
olic
y w
indo
w to
dev
elop
5
prod
uct r
egul
atio
ns a
nd a
fram
ewor
k fo
r mon
itorin
g, v
erifi
catio
n an
d en
forc
emen
t. Th
ese
have
ent
ered
the
min
ister
ial a
ppro
val p
roce
sses
, an
d en
surin
g ap
prov
al in
201
8 w
ill b
e cr
itica
l to
put i
n pl
ace
a m
arke
t for
en
ergy
effi
cien
t pro
duct
s and
equ
ipm
ent.
Rule
book
s hav
e be
en p
ublis
hed
by th
e M
inist
ry o
f Eco
nom
y. TC
bei
ng e
xten
ded
for e
nfor
cem
ent a
nd
mon
itorin
g ac
tiviti
es.

212
In-Depth Review of the Energy Efficiency Policy of Montenegro | 2018
No
DO
NO
R / I
FI
(CO
UN
TRY)
PRO
JEC
T TI
TLE
BEN
EFI-
CIA
RY
AM
OU
NT
/ TYP
E /
STAT
US
IMPL
EMEN
-TA
TIO
N
PERI
OD
(Fro
m-T
o)
BRIE
F D
ESCR
IPTI
ON
/ CO
MM
ENT
37.
EBRD
Impl
emen
-ta
tion
of
an E
nerg
y Effi
cien
cy
Obl
igat
ion
Sche
me
ME
TA: E
UR
44,7
40
Com
plet
ed
2016
38.
EBRD
Supp
ort
for t
he D
e-ve
lopm
ent
of U
til-
ity E
nerg
y Effi
cien
cy
Obl
igat
ion
Sche
mes
an
d En
ergy
Effi
cien
cy
Crite
ria in
N
etw
ork
Tariff
s
ME
TA: E
UR
59,5
00 *
*Est
imat
ed
shar
e of
M
onte
ne-
gro
unde
r re
gion
al
proj
ect
Com
plet
ed
2014
-201
5
39.
EBRD
Supp
ort
for D
evel
-op
men
t of
Pub
lic
Ener
gy E
f-fic
ienc
y Pr
o-cu
rem
ent
Polic
ies,
Gui
delin
es
and
Code
s
ME
TA: E
UR
75,0
00 *
*Est
imat
ed
shar
e of
M
onte
ne-
gro
unde
r re
gion
al
proj
ect
Com
plet
ed
2013
-201
5

213
Annexes
No
DO
NO
R / I
FI
(CO
UN
TRY)
PRO
JEC
T TI
TLE
BEN
EFI-
CIA
RY
AM
OU
NT
/ TYP
E /
STAT
US
IMPL
EMEN
-TA
TIO
N
PERI
OD
(Fro
m-T
o)
BRIE
F D
ESCR
IPTI
ON
/ CO
MM
ENT
40.
IBRD
/Wor
ld
Bank
Mon
tene
-gr
o En
ergy
Effi
cien
cy
Proj
ect –
ph
ase
1
ME,
Min
istry
of
Edu
ca-
tion,
Min
is-tr
y of
Hea
lth
Loan
: EU
R 11
.5 m
ill.
Com
plet
ed
2009
- 20
17Th
e ob
ject
ive
of th
e pr
ojec
t was
to im
prov
e en
ergy
effi
cien
cy p
erfo
r-m
ance
in ta
rget
ed p
ublic
sect
or b
uild
ings
. With
in p
roje
ct 2
5 pu
blic
fa
cilit
ies w
ere
refu
rbish
ed: 1
6 he
alth
care
, 8 e
duca
tiona
l and
1 st
uden
t do
rmito
ry.
41,
IBRD
/Wor
ld
Bank
Mon
tene
-gr
o En
ergy
Effi
cien
cy
Proj
ect –
ph
ase
2
ME,
Min
istry
of
Hea
lthLo
an: E
UR
6 m
ill.
Ong
oing
2018
- 20
21Co
ntin
uatio
n of
the
Mon
tene
gro
Ener
gy E
ffici
ency
Pro
ject
- ob
ject
ive
of it
is to
impr
ove
ener
gy e
ffici
ency
per
form
ance
in ta
rget
ed h
ealth
care
fa
cilit
ies.
In a
dditi
on, t
he p
roje
ct w
ill c
reat
e m
echa
nism
for s
usta
inab
le
finan
cing
of E
E pr
ojec
ts.
42.
EU fu
nded
pr
ojec
tIP
A 20
07:
“Tec
hnic
al
assis
tanc
e fo
r the
im
plem
en-
tatio
n of
th
e En
ergy
Co
mm
unity
Tr
eaty
”
ME,
Ener
gy
Regu
lato
ry
Agen
cy,
EPCG
/ Mon
-te
negr
in
Tran
smis-
sion
Syst
em
Ope
rato
r (C
GES
)
EUR
1.5
mill
TA Co
mpl
eted
2010
- 20
11Pr
ojec
t aim
is to
dev
elop
ene
rgy
sect
or p
olic
ies t
hat w
ill e
nsur
e th
e im
plem
enta
tion
of c
omm
itmen
ts u
nder
the
Ener
gy C
omm
unity
Tre
aty,
incl
udin
g th
e Re
gion
al E
nerg
y M
arke
t:Su
ppor
t to
the
ME
for p
olic
y an
d st
rate
gy d
evel
opm
ent,
and
the
mon
itor-
ing
of p
rogr
ess o
n im
plem
entin
g of
the
Ener
gy C
omm
unity
Tre
aty
(incl
ud-
ing
Ener
gy E
ffici
ency
Uni
t res
pons
ible
for p
rom
otin
g en
ergy
effi
cien
cy a
nd
rene
wab
le e
nerg
y);
Capa
city
bui
ldin
g an
d su
ppor
t to
the
Ener
gy R
egul
ator
y Ag
ency
in o
ver-
seei
ng th
e es
tabl
ishm
ent o
f the
regi
onal
ele
ctric
ity m
arke
t;Sp
ecia
lised
tech
nica
l ass
istan
ce to
the
EPCG
/CG
ES, i
n pa
rtic
ular
, to
the
unbu
ndle
d tr
ansm
issio
n an
d m
arke
t sys
tem
ope
rato
rs.

214
In-Depth Review of the Energy Efficiency Policy of Montenegro | 2018
No
DO
NO
R / I
FI
(CO
UN
TRY)
PRO
JEC
T TI
TLE
BEN
EFI-
CIA
RY
AM
OU
NT
/ TYP
E /
STAT
US
IMPL
EMEN
-TA
TIO
N
PERI
OD
(Fro
m-T
o)
BRIE
F D
ESCR
IPTI
ON
/ CO
MM
ENT
43.
EU fu
nded
pr
ojec
tIP
A 20
11:
“Dev
elop
ing
Sust
aina
ble
Ener
gy U
se
in M
onte
ne-
gro”
ME
EUR
0.8
mill
TA Com
plet
ed
2015
-201
7Th
e ob
ject
ive
of th
e pr
ojec
t was
to c
ontr
ibut
e to
con
tinua
tion
of th
e en
ergy
refo
rms i
n th
e co
untr
y an
d fu
rthe
r har
mon
isatio
n of
nat
iona
l and
th
e Eu
rope
an U
nion
’s le
gisla
tion
in th
e en
ergy
fiel
d. T
hus,
proj
ect a
ctiv
ities
w
ere
focu
sed
on d
evel
opm
ent a
nd e
nfor
cem
ent o
f rel
evan
t reg
ulat
ory
fram
ewor
k in
ord
er to
incr
ease
sust
aina
ble
ener
gy u
se, w
ith a
focu
s on
the
tran
spor
t sec
tor.
Furt
herm
ore,
num
erou
s act
iviti
es w
ere
dedi
cate
d to
exp
ansio
n of
stud
ies o
n su
stai
nabl
e us
e of
ene
rgy,
on c
ogen
erat
ion,
im
prov
emen
ts in
ene
rgy
stat
istic
s and
impr
ovem
ents
of t
he in
form
atio
n sy
stem
on
ener
gy e
ffici
ency
. Rai
sing
publ
ic a
war
enes
s and
the
know
ledg
e le
vel,
as w
ell a
s str
engt
heni
ng o
f ins
titut
iona
l cap
acity
in th
e co
untr
y, w
ere
also
com
pone
nts o
f the
pro
ject
.
44.
EU fu
nded
pr
ojec
tIP
A 20
12:
“Opt
imal
U
se o
f En
ergy
and
N
atur
al
Reso
urce
s”
ME,
Ene
rgy
Regu
lato
ry
Agen
cy
TA: E
UR
1 m
ill
Com
plet
ed
2017
-201
8Th
e ob
ject
ive
of th
e pr
ojec
t was
alig
nmen
t of t
he n
atio
nal l
egal
fram
e-w
ork
in e
nerg
y fie
ld w
ith T
hird
ene
rgy
pack
age;
dev
elop
men
t of t
he L
ocal
En
ergy
Pla
ns fo
r cer
tain
num
ber o
f mun
icip
aliti
es; d
evel
opm
ent o
f the
le
gal f
ram
ewor
k fo
r oil
stoc
k re
serv
es; a
naly
sis o
f the
est
ablis
hmen
t of
sust
aina
ble
finan
cial
mec
hani
sm fo
r im
plem
enta
tion
of E
E/RE
S pr
ojec
ts.

215
Annexes
No
DO
NO
R / I
FI
(CO
UN
TRY)
PRO
JEC
T TI
TLE
BEN
EFI-
CIA
RY
AM
OU
NT
/ TYP
E /
STAT
US
IMPL
EMEN
-TA
TIO
N
PERI
OD
(Fro
m-T
o)
BRIE
F D
ESCR
IPTI
ON
/ CO
MM
ENT
45.
The
Fede
ral
Min
istry
for
Econ
omic
Co
oper
atio
n an
d D
evel
-op
men
t (G
erm
any)
M
inist
ry
of F
orei
gn
Affai
rs (N
or-
way
)Im
plem
ent-
ing
Agen
cy:
GIZ
(Ger
-m
any)
GIZ
-ASE
Pr
ojec
t (A
dviso
ry
Serv
ices
to
Ene
rgy
Effici
ency
in
Mon
tene
-gr
o)
ME
TA: E
UR
5 m
ill
Com
plet
ed
2008
–20
13
Toge
ther
with
its s
trat
egic
par
tner
, the
Min
istry
of E
cono
my
of M
onte
ne-
gro,
GIZ
ASE
is im
plem
entin
g a
serie
s of a
ctiv
ities
that
rang
e ov
er se
vera
l ca
tego
ries:
Esta
blish
ing
and
enha
ncin
g th
e le
gisla
tive
and
inst
itutio
nal f
ram
ewor
k in
th
e ar
ea o
f ene
rgy
effici
ency
;Ed
ucat
ion
of p
upils
of a
ll el
emen
tary
scho
ols o
n th
e te
rrito
ry o
f Mon
tene
-gr
o W
ithin
the
spec
ial p
roje
ct “E
nerg
y To
ur”;
Cam
paig
n of
aw
aren
ess r
aisin
g ab
out t
he te
rm, i
mpo
rtan
ce a
nd o
ppor
tu-
nitie
s of e
nerg
y effi
cien
cy;
Org
anisi
ng tr
aini
ng, c
ertifi
catio
n of
ene
rgy
audi
tors
and
the
actu
al im
ple-
men
tatio
n of
ene
rgy
audi
ts;
Org
anisi
ng c
onfe
renc
es, p
erfo
rman
ce a
t fai
rs a
nd o
ther
sign
ifica
nt e
vent
s w
ith th
e ai
m o
f rai
sing
the
leve
l of k
now
ledg
e, d
issem
inat
ion
of in
form
a-tio
n an
d ex
chan
ge o
f exp
erie
nces
, as w
ell a
s int
erco
nnec
ting
rele
vant
en
titie
s in
the
coun
try,
regi
on a
nd w
ider
are
a.

216
In-Depth Review of the Energy Efficiency Policy of Montenegro | 2018
No
DO
NO
R / I
FI
(CO
UN
TRY)
PRO
JEC
T TI
TLE
BEN
EFI-
CIA
RY
AM
OU
NT
/ TYP
E /
STAT
US
IMPL
EMEN
-TA
TIO
N
PERI
OD
(Fro
m-T
o)
BRIE
F D
ESCR
IPTI
ON
/ CO
MM
ENT
46.
The
Fede
ral
Min
istry
for
Econ
omic
Co
oper
atio
n an
d D
evel
-op
men
t (G
erm
any)
Impl
emen
t-in
g Ag
ency
: G
IZ (G
er-
man
y)
GIZ
-ORF
EE
pro
ject
(O
pen
Re-
gion
al F
und
for S
outh
-ea
st E
urop
e - E
nerg
y Effi
cien
cy)
Mul
ti-be
nefic
iary
pr
ojec
t for
co
untr
ies i
n So
uth
East
Eu
rope
Mon
tene
-gr
o: G
oM,
ME,
Cap
itol
City
Pod
-go
rica,
Scho
ol fo
r D
emoc
ratic
Le
ader
ship
;U
nion
of
mun
icip
ali-
ties
TA: a
pp. E
UR
2.5
mill
For
M
NE
Mul
ti-be
nefic
iary
pr
ojec
ts
2009
- 202
0G
IZ-O
RF E
E pr
ojec
t sup
port
s diff
eren
t reg
iona
l ini
tiativ
es in
the
field
of
ener
gy e
ffici
ency
on
stat
e an
d m
unic
ipal
leve
ls, a
s wel
l as t
he le
vel o
f civ
il so
ciet
y le
vel:
Prep
arat
ion
of M
etho
dolo
gies
for M
onito
ring
and
Verifi
catio
n an
d Ev
alu-
atio
n of
Nat
iona
l EE
Actio
n Pl
ans (
M&V
&E) i
n co
oper
atio
n w
ith M
inist
ry o
f Ec
onom
y; S
uppo
rt fo
r pre
para
tion
of th
e 3.
NEE
AP;
Sinc
e 20
17, u
pgra
de o
f MVP
(Mon
itorin
g an
d Ve
rifica
tion
Plat
form
) for
ca
lcul
atio
n of
ene
rgy
savi
ngs;
trai
ning
s for
loca
l lev
el a
nd m
inist
ry fo
r us
age
of th
e so
ftwar
e; U
pgra
de o
f the
softw
are
to c
alcu
late
the
prim
ary
ener
gy sa
ving
s and
to su
ppor
t the
min
istry
in re
port
ing
on th
e EE
Dire
c-tiv
e Ar
ticle
s 5, 7
and
3;
Publ
ic D
ialo
gue
Initi
ativ
e on
Sus
tain
able
Use
of E
nerg
y in
coo
pera
tion
with
civ
il so
ciet
y or
gani
satio
n, th
e Sc
hool
for D
emoc
ratic
Lea
ders
hip;
st
akeh
olde
r dia
logu
e ev
ents
with
diff
eren
t sta
keho
lder
s; pa
rliam
enta
ry
hear
ings
on
EE L
aw im
plem
enta
tion;
Sinc
e 20
17 w
ork
with
mem
bers
of p
arlia
men
t, es
tabl
ishm
ent o
f an
Info
rmal
gre
en p
arlia
men
tary
gro
up, t
rain
ings
for M
Ps a
nd p
arl.
staff
on
EE,
clim
ate
and
sust
aina
ble
urba
n m
obili
ty; r
egio
nal e
xcha
nge
and
regi
onal
fo
rum
s and
stud
y tr
ips f
or M
Ps a
nd p
arl.
staff
;Co
oper
atio
n w
ith C
apito
l City
Pod
goric
a in
fram
e of
Net
wor
k of
Ene
rgy
Effici
ent C
apito
l Citi
es in
Sou
th E
ast E
urop
e; p
repa
ratio
n of
the
Sust
ain-
able
Ene
rgy
Actio
n Pl
an fo
r Pod
goric
a un
der C
oven
ant o
f May
ors,
EE In
fo
Cent
re a
nd o
rgan
ising
of E
nerg
y D
ays;
Sinc
e 20
17 p
repa
ring
of su
stai
nabl
e ur
ban
mob
ility
pla
n fo
r Pod
goric
a an
d aw
aren
ess-
raisi
ng a
ctiv
ities
on
urba
n m
obili
ty;
Coop
erat
ion
with
ass
ocia
tion
of se
lf-go
vern
men
ts (i
n M
NE
with
Uni
on o
f M
unic
ipal
ities
); EE
pilo
t pro
ject
s in
Bera
ne, P
odgo
rica,
Dan
ilovg
rad
and
NIk
sic);
Sinc
e 20
17 tr
aini
ng fo
r mun
icip
aliti
es o
n su
stai
nabl
e ur
ban
mob
ility
.

217
Annexes
No
DO
NO
R / I
FI
(CO
UN
TRY)
PRO
JEC
T TI
TLE
BEN
EFI-
CIA
RY
AM
OU
NT
/ TYP
E /
STAT
US
IMPL
EMEN
-TA
TIO
N
PERI
OD
(Fro
m-T
o)
BRIE
F D
ESCR
IPTI
ON
/ CO
MM
ENT
47.
UN
DP
- GEF
Tow
ards
Ca
rbon
Neu
-tr
al To
urism
in
Mon
tene
-gr
o
Min
istry
of
Sust
aina
ble
Dev
elop
-m
ent a
nd
Tour
ism
3,15
0,00
0 U
SD
(TA:
2,
100,
000
USD
+
Gra
nt:
1,05
0,00
0 U
SD)
2014
–20
19Fa
cilit
ate
GH
G e
miss
ions
redu
ctio
ns fr
om th
e M
onte
negr
in to
urism
sect
or
and
thus
low
er it
s env
ironm
enta
l im
pact
. It w
ill d
o so
by:
Prom
otin
g th
e co
untr
y’s tr
ansit
ion
tow
ards
car
bon
neut
ral t
rave
l & to
ur-
ism, t
hus e
nhan
cing
Mon
tene
gro’
s gre
en re
puta
tion
on th
e gl
obal
mar
ket;
Max
imisi
ng th
e effi
cien
t use
of e
nerg
y an
d pr
omot
ing
gree
nfiel
d in
vest
-m
ents
in to
urism
;Pr
omot
ing
deve
lopm
ent o
f low
car
bon
spat
ial p
lann
ing
and
deve
lopm
ent
of su
stai
nabl
e tr
ansp
ort s
olut
ions
;H
elpi
ng to
urism
sect
or id
entif
y an
d im
plem
ent c
ost-
effec
tive
miti
gatio
n op
tions
– e
spec
ially
in th
e ac
com
mod
atio
n se
ctor
;In
trod
ucin
g ca
rbon
offs
et sc
hem
es a
nd o
ther
inno
vativ
e fin
anci
al m
echa
-ni
sms t
o co
mpe
nsat
e fo
r the
resid
ual e
miss
ions
, and
to g
ener
ate
addi
tion-
al re
venu
es fo
r clim
ate
miti
gatio
n an
d ad
apta
tion
actio
ns in
tour
ism;
Raisi
ng a
war
enes
s on
impo
rtan
ce a
nd b
enefi
ts o
f dev
elop
ing
carb
on
neut
ral/g
reen
tour
ism a
nd th
us h
elp
tran
sfor
m M
onte
negr
o in
to th
e ne
xt
carb
on-n
eutr
al, g
reen
-frie
ndly
hot
spot
.KE
Y ac
hiev
emen
ts:
GH
G in
vent
ory
for t
ouris
m se
ctor
– m
etho
dolo
gy a
nd a
nnua
l rep
orts
de
velo
ped
for 2
013
– 20
16;
Eco
Fund
– D
ecisi
on o
n es
tabl
ishm
ent i
s rea
dy to
be
adop
ted
by th
e G
over
nmen
t;85
0,00
0 EU
R in
vest
ed in
28
proj
ects
lead
ing
to re
duct
ion
of 7
.5 k
t CO
2 in
tour
ism se
ctor
, and
leve
ragi
ng m
ore
than
6 m
illio
n EU
R in
vest
men
ts;
14 h
otel
s rec
eive
d EU
Eco
Lab
el o
r Tra
velif
e ce
rtifi
cate
;N
umer
ous m
edia
cam
paig
ns c
ondu
cted
lead
ing
to a
15%
incr
ease
in v
isi-
tors
’ aw
aren
ess o
f and
dem
and
for l
ow- a
nd n
o-ca
rbon
tour
ism se
rvic
es
as c
ompa
red
to b
asel
ine
and
that
71%
of t
ouris
ts v
isitin
g M
onte
negr
o ar
e w
illin
g to
pay
mor
e fo
r a g
reen
hol
iday
.

218
In-Depth Review of the Energy Efficiency Policy of Montenegro | 2018
No
DO
NO
R / I
FI
(CO
UN
TRY)
PRO
JEC
T TI
TLE
BEN
EFI-
CIA
RY
AM
OU
NT
/ TYP
E /
STAT
US
IMPL
EMEN
-TA
TIO
N
PERI
OD
(Fro
m-T
o)
BRIE
F D
ESCR
IPTI
ON
/ CO
MM
ENT
48.
IMEL
S (It
aly)
/ U
NEP
The
Balk
an
Rene
w-
able
Ene
rgy
Prog
ram
me
(BAL
REP)
/ M
ON
TESO
L pr
ojec
t
ME,
MoS
DT
TA a
nd g
rant
fo
r est
ablis
h-in
g in
tere
st
free
cred
it lin
e1
mil.
USD
(178
.540
,00
€ sp
ent f
or
subs
idie
s)
Canc
eled
2011
- 201
5Th
e ob
ject
ive
of th
e BA
LREP
in M
onte
negr
o is
to a
ccel
erat
e an
d su
stai
n th
e re
new
able
ene
rgy
mar
ket t
hrou
gh th
e ad
optio
n of
resid
entia
l and
/or
col
lect
ive
sola
r wat
er h
eatin
g sy
stem
s. Su
ppor
t for
the
BALR
EP fi
nanc
e co
mpo
nent
com
es fr
om IM
ELS.
BALR
EP sh
all f
ocus
and
seek
to re
plic
ate
the
com
bina
tions
of m
easu
res
test
ed a
nd im
plem
ente
d by
the
Med
iterr
anea
n Re
new
able
Ene
rgy
Prog
ram
me
(MED
REP)
to p
rom
ote
the
depl
oym
ent o
f sol
ar e
nerg
y in
M
oroc
co, T
unisi
a an
d Eg
ypt.
MO
NTE
SOL
proj
ect –
inte
rest
-free
cre
dit l
ine
for i
nsta
llatio
n of
sola
r wat
er
heat
ing
syst
ems f
or th
e ho
useh
old
sect
or o
ffici
ally
laun
ched
in Ju
ly 2
011,
an
d ca
ncel
led
by d
onor
in 2
015.
49.
Gov
ern-
men
t of
Luxe
mbu
rg
(Lux
De-
velo
pmen
t Ag
ency
)
ENER
GY
WO
OD
ME
Gra
nt: E
UR
130.
000
Com
plet
ed
2013
-201
5EN
ERG
Y W
OO
D -
Inte
rest
-free
cre
dit l
ine
for i
nsta
llatio
n of
hea
ting
syst
ems
on m
oder
n bi
omas
s fue
ls (p
elle
ts, b
rique
ttes
) for
hou
seho
lds.
Fund
s fro
m
the
gran
t are
use
d to
subs
idise
inte
rest
rate
of c
omm
erci
al b
anks
.
50.
Gov
ernm
ent
of N
orw
ayEN
ERG
Y W
OO
D II
ME
Gra
nt: E
UR
240.
000
Com
plet
ed
2015
- 20
17Co
ntin
uatio
n of
EN
ERG
Y W
OO
D p
rogr
amm
e - I
nter
est-
free
cred
it lin
e fo
r ins
talla
tion
of h
eatin
g sy
stem
s on
mod
ern
biom
ass f
uels
(pel
lets
, br
ique
ttes
) for
hou
seho
lds.
Fund
s fro
m th
e gr
ant a
re u
sed
to su
bsid
ise
inte
rest
rate
of c
omm
erci
al b
anks
.
Sour
ce: M
inis
try
of E
cono
my,
201
8

219
Annexes
Annex 5: Programme of the Peer Review Mission to MontenegroPodgorica, 12-14 June 2018
Venue: Best Western Premier Hotel, 45, Bulevar Svetog Petra Cetinjskog, Podgorica
Time Participants Discussion points
Day 1 - 12.06.2018
8:00-11:00 Directorate for Energy EfficiencyDirectorate for Energy
Greeting speeches----------------------Overall energy policy in MNE and main challenges of energy sector;Overview of EE policy and strategies, governance frame-work for their implementation (i.e. institutions – responsi-bility, accountability, budget, capacity/capability; moni-toring and evaluation), current status (achievements and barriers/issues) and future outlook/plans with attention to at least the following areas:Overarching EE targets and coordination in energy system planning and implementation;Main measures to improve EE:Energy Efficiency Obligation or alternative;Energy Performance in Buildings; Ecodesign and Energy Labelling;Industry;Transport;Financing of measures - the Eco Fund.
11.00 -12.30
Directorate for Energy Efficiency
Clarification of main findings and questions of the draft In-Depth Energy Efficiency Review report.
13:30 – 15:30
Meeting with donors: KfW Bank, EBRD, WB, UNDP, GIZ etc.
Overview of ongoing and planned activities in EE field; Main barriers for the implementation of EE policies and scaling up EE investments.
Day 2 - 13.06.2018
8:30 – 10:00
Energy Power Company (EPCG) responsible for electricity generation and supply
Existing and planned measures for increasing EE in genera-tion and supply of electricity;Main barriers for the implementation of EE measures.
10.00 -12.15
Energy Regulatory Agency
Tariff Policy, tariff menu and provisions for vulnerable consumers:Methodology for calculation of allowed revenues for regu-lated entities;Details of energy consumer tariff menu/design, provision for vulnerable consumers and break down of costs/prices (generation, network tariffs, subsidies, taxes etc.);Incentives for regulated entities to improve efficiency and make appropriate investments, including reduction of energy losses and operational costs; Perspectives for demand response and least cost electricity system planning;RES policy and Feed-in Tariffs.

220
In-Depth Review of the Energy Efficiency Policy of Montenegro | 2018
Time Participants Discussion points
13.00 - 15.00
Transmission system operator - CGESDistribution system op-erator - CEDIS
Existing and planned measures for increasing EE in trans-mission and distribution of electricity;Existing and planned measures to address growing de-mand, system adequacy and bottlenecks; Main barriers for the implementation of EE measures.
Day 3 - 14.06.2018
8:30 – 10:00
Chamber of Economy(business sector and NGOs)
Perspective of business sector and civil society on EE policy of Montenegro;Cooperation and engagement between the Government/Regulator and business sector and civil society in the field of EE.
10.00 – 12.00
Ministry for Sustainable Development and Tour-ismEnvironmental Protection Agency
Development and implementation of the building codes – main barriers and the way forward; Environmental protection policy, legislative and institu-tional frameworks, current status and outlook for environ-mental protection.
12:30-15:30
Directorate for Energy EfficiencyDirectorate for Energy
Discussion of peer review team’s findings and recommen-dations.

© Energy Charter Secretariat, 2018 Boulevard de la Woluwe, 46B-1200 Brussels, Belgiumt Tel.: +32-2-775-98-00 ∙ Fax: +32-2-775-98-01 E-mail: [email protected] ∙ www.encharter.org
ISBN: 978-905948-211-1 (PDF, English)ISBN: 978-905948-210-4 (Paperback, English)Depot number: D/2019/7850/1
In-Depth Review of theEnergy Efficiency Policy of Montenegro
Energy Charter Protocol on Energy Efficiency and Related Environmental AspectsPEEREA