IMPULSIVITY, SOCIAL PROBLEM SOLVING AND ALCOHOL DEPENDENCY AS CONTRIBUTORS TO AGGRESSION IN A SAMPLE...
146
IMPULSIVITY, SOCIAL PROBLEM SOLVING AND ALCOHOL DEPENDENCY AS CONTRIBUTORS TO AGGRESSION IN A SAMPLE OF PROVINCIALLY INCARCERATED OFFENDERS A Thesis Submitted to the College of Graduate Studies and Research In Partial Fulfillment of the Requirements For the Degree of Master of Arts In the Department of Psychology University of Saskatchewan Saskatoon By DENA MARIE DERKZEN Keywords: aggression, social problem solving, impulsivity, alcohol dependency, offenders © Copyright Dena Marie Derkzen, December, 2007. All rights reserved.
-
Upload
carleton-ca -
Category
Documents
-
view
4 -
download
0
Transcript of IMPULSIVITY, SOCIAL PROBLEM SOLVING AND ALCOHOL DEPENDENCY AS CONTRIBUTORS TO AGGRESSION IN A SAMPLE...
IMPULSIVITY, SOCIAL PROBLEM SOLVING AND ALCOHOL DEPENDENCY AS
CONTRIBUTORS TO AGGRESSION IN A SAMPLE OF PROVINCIALLY
INCARCERATED OFFENDERS
A Thesis Submitted to the College of
Graduate Studies and Research
In Partial Fulfillment of the Requirements
For the Degree of Master of Arts
In the Department of Psychology
University of Saskatchewan
Saskatoon
By
DENA MARIE DERKZEN
Keywords: aggression, social problem solving, impulsivity, alcohol dependency, offenders
© Copyright Dena Marie Derkzen, December, 2007. All rights reserved.

Permission to Use
In presenting this thesis in partial fulfilment of the requirements for a Postgraduate degree from
the University of Saskatchewan, I agree that the Libraries of this University may make it freely
available for inspection. I further agree that permission for copying of this thesis in any manner,
in whole or in part, for scholarly purposes may be granted by the professor or professors who
supervised my thesis work or, in their absence, by the Head of the Department or the Dean of the
College in which my thesis work was done. It is understood that any copying or publication or
use of this thesis or parts thereof for financial gain shall not be allowed without my written
permission. It is also understood that due recognition shall be given to me and to the University
of Saskatchewan in any scholarly use which may be made of any material in my thesis.
Requests for permission to copy or to make other use of material in this thesis in whole or
part should be addressed to:
Head of the Department of Psychology
University of Saskatchewan
Saskatoon, Saskatchewan S7N 5A5

iii
ABSTRACT
Numerous cognitive, personality and situational factors have been found to be related to
aggression. Understanding how these factors interrelate is essential to predicting violence and
critical to the assessment and treatment of offenders with violent histories. Previous research has
suggested a potential role for social problem solving as a mediator between impulsivity and
aggression (McMurran et al., 2002). Additionally, it is well established that aggression is more
likely to occur in the context of alcohol use (Collins, 1993; Reiss & Roth, 1993; Lipsey, Wilson,
Cohen & Derzon 1997). Based on existing literature, a model of aggression was developed
involving impulsivity, social problem solving and alcohol dependency. Utilizing path analysis
with multiple regression, a mediational model of aggression was assessed on a sample of 179
provincially incarcerated offenders, 87% of whom were Aboriginal and 45% of whom had a
previous conviction of domestic abuse. The data suggest that social problem solving, alcohol
dependency and impulsivity are all important in understanding and predicting aggression. Social
problem solving does not appear to act as a mediator in the relationship between impulsivity and
aggression, although preliminary results suggest that impulsivity, may serve the function in this
relationship and in the manifestation of aggression. The implications of these findings for our
understanding about human factors contributing to aggression and for further advancement of
treatment programs are provided.

iv
ACKNOWLEDGMENTS
I wish first to thank Dr. J. Stephen Wormith for supporting my academic interests from
the beginning of my studies. Your patience, enthusiastic assistance and insight are all greatly
appreciated. I wish to express my gratitude to the members of my Advisory Committee, Dr. Peter
Grant and Dr. Gerald Farthing, for volunteering their time and sharing their expertise. I would
like to express thanks to Dr. Phil Dwyer for serving as my external examiner.
I would like to acknowledge the Saskatchewan Department of Corrections and Public
Safety for agreeing to review this project and providing access to the institutions. I would like to
acknowledge the inmates and staff of the Prince Albert Correctional Centre and Saskatoon
Correctional Centre for assisting with or agreeing to participate in the study. Lastly, I would like
to thank Russell Stasiuk and Rob Arthur for assisting with my data collection. The contribution
of their time and effort made this project possible.

v
TABLE OF CONTENTS
ABSTRACT ....................................................................................................................... iii
ACKNOWLEDGMENTS ................................................................................................. iv
LIST OF TABLES ........................................................................................................... viii
LIST OF FIGURES ........................................................................................................... ix
LIST OF ABBREVIATIONS ..............................................................................................x
LITERATURE REVIEW ....................................................................................................1
1.1. Impulsivity and Aggression ................................................................................2 1.2. Social Problem Solving and Aggression...........................................................10 1.3. Impulsivity and Social Problem Solving ..........................................................13 1.4. Alcohol Use and Aggression ............................................................................17 1.5. Alcohol Use and Impulsivity ............................................................................21 1.6. Purpose and Hypotheses of the Research .........................................................25
METHOD ..........................................................................................................................28
2.1. Participants ...................................................................................................... 28 2.3. Procedure......................................................................................................... 28
2.3.1. Recruitment ............................................................................................28 2.3.2. Testing....................................................................................................29
2.2. Measures ......................................................................................................... 30 2.2.1. Demographics and Offence History .......................................................30 2.2.2. Impulsivity Measure ..............................................................................30 2.2.3. Aggression Measures .............................................................................32 2.2.4. Social Problem Solving Measure ...........................................................35 2.2.5. Alcohol Use and Dependency Measures ...............................................36 2.2.6. Impression Management ........................................................................37
2.4. Research Design and Hypotheses ................................................................... 38 2.4.8. Social Problem Solving as a Mediating Variable. .................................39 2.4.9. Exploratory analyses of Impulsivity as a Mediating Variable. ..............40 2.4.10. Model of Aggression............................................................................40

vi
RESULTS ..........................................................................................................................42
3.1. Assumptions .................................................................................................... 42 3.1.1. Outliers/Normality ....................................................................................... 42 3.1.2. Multicollinearity ........................................................................................... 46 3.2. Scale Properties and Intercorrelations among Measures ................................ 46 3.3. Analysis of Demographic Difference.............................................................. 50 3.4. Hypotheses ...................................................................................................... 54
3.4.1. Hypothesis 1...........................................................................................54 3.4.2. Hypothesis 2...........................................................................................54 3.4.3. Hypothesis 3...........................................................................................58 3.4.4. Hypothesis 4...........................................................................................59 3.4.5. Hypothesis 5...........................................................................................60 3.4.6. Hypothesis 6...........................................................................................60 3.4.7. Hypothesis 7...........................................................................................60
3.5. Regression analysis to assess mediation ......................................................... 61 3.6. Path analysis of model .................................................................................... 63 3.7. Regression analysis to assess potential mediational role of impulsivity......... 67
DISCUSSION ....................................................................................................................73
4.1. Levels of Endorsement .................................................................................... 73 4.2. Impulsivity ...................................................................................................... 76 4.3. Social Problem Solving ................................................................................... 79 4.4. Alcohol Dependency ....................................................................................... 80 4.5. Impulsive aggressors versus Premeditated Aggressors ................................... 81 4.6. Mediational Model of Aggression .................................................................. 83 4.7. Practical Application of Findings ................................................................... 89 4.8. Limitations and Future Considerations ........................................................... 90 4.9. Future Directions ............................................................................................. 93 4.10. General Conclusions ..................................................................................... 94
LIST OF REFERENCES ...................................................................................................97
APPENDIX A ..................................................................................................................127
APPENDIX B ..................................................................................................................129
APPENDIX C ..................................................................................................................131
APPENDIX D ..................................................................................................................133
APPENDIX E ..................................................................................................................134
APPENDIX F...................................................................................................................127

vii
APPENDIX G ..................................................................................................................136
APPENDIX H ..................................................................................................................129
APPENDIX I ...................................................................................................................131
APPENDIX J ...................................................................................................................132
APPENDIX K ..................................................................................................................133

vii
LIST OF TABLES
Table page Table 3.1 Summary of skewness and kurtosis for raw and transformed variables ...........45
Table 3.2 Means and Standard Deviations of each measures ...........................................47
Table 3.3 Pearson Correlation Coefficients Among Variables ........................................49
Table 3.4 Pearson Correlation Coefficients Among Variables
while controlling for Impression Management .................................................................50
Table 3.5 Means, Standard Deviations and t-test results of each measure as
a function of ethnicity. .......................................................................................................52
Table 3.6 Means, Standard Deviations and t-test results of each measure as
a function of institution. .....................................................................................................53
Table 3.7 Factor Loading for the Rotated Factors of the BIS-11 ......................................57
Table 3.8 Regression Analyses to assess Social Problem Solving (SPSI) as a mediator
with Aggression and Impulsivity ......................................................................................63
Table 3.9 Regression Analyses to assess Impulsivity (BIS) as a potential mediator
with Aggression and Social Problem Solving ..................................................................69

ix
LIST OF FIGURES
Figure page
Figure 1.2. Proposed Path Analytic Model of Aggression ................................................27
Figure 2.1.Proposed Path Analysis model of Aggression..................................................41
Figure 3.1. Correlation results among impulsivity, social problem solving,
alcohol dependency and aggression. ..................................................................................61
Figure 3.2. Path analysis results for proposed model of aggression in
complete sample ................................................................................................................65
Figure 3.3. Path analysis results for proposed model of aggression in
Aboriginal subsample ........................................................................................................66
Figure 3.4. Path analysis results for post hoc model of aggression in
complete sample ................................................................................................................71
Figure 3.5. Path analysis results for post hoc model of aggression in
Aboriginal subsample ........................................................................................................72

x
LIST OF ABBREVIATIONS
AG Anger Subscale of BPAQ ABQ Antisocial Behavior Questionnaire AIC Akaike Information Criterion AMOS Analysis of Moment Structures AS Avoidance Style Subscale of SPSI-R:S BDHI Buss Durkee Hostility Inventory BIDR Balanced Inventory of Desirable Responding BIS-11 Barratt Impulsivity Scale - 11 BPAQ Buss Perry Aggression Questionnaire CFI Comparative Fit Index DV Dependent Variable HT Hostility Subscale of BPAQ IM Short Impression Management Scale from BIDR ICS Impulsivity/Carelessness Style Subscale of SPSI-R:S IPAS Impulsive/Premeditated Aggression Scale IPAS: IM Impulsivity Subscales of IPAS IPAS: PM Premeditated Subscale of IPAS IV Independent Variable NFI Normed Fit Index NPO Negative Problem Orientation Subscale of SPSI-R:S PA Physical Aggression Subscale of BPAQ PACC Prince Albert Correctional Centre PPO Positive Problem Orientation Subscales of SPSI-R:S PSAP Point Subtraction Aggression Paradigm RMSEA Root Mean Square Error of Approximation RPS Rational Problem Orientation Subscale of SPSI-R:S SADD Short Alcohol Dependency Data Questionnaire SCC Saskatoon Correctional Centre SD Standard Deviation SPSI-R:S Social Problem Solving Inventory – Revised Short Form SPSS Statistical Package for the Social Sciences SQRT Square Root Transformation SRMR Standardized Root Mean Square Residual TAP Taylor Aggression Paradigm TR Transformed VA Verbal Aggression Subscale of BPAQ ZRES Standardized Residuals

1
CHAPTER 1 LITERATURE REVIEW
“Violence is a complex and multifaceted form of behaviour.
It is likely that there is no simple explanation of violence”
(National Research Council, 1993)
Aggression is a complex area of human behaviour and experience. It incorporates human
violence, mental disorders, and criminality. Violent aggression has become one of the most
prevalent and persistent public health and social problems in North America, as well as
elsewhere around the world. A large amount of research exists on this topic; our understanding
of its genesis and influence, however, remains modest.
The study of aggression is complicated by a number of factors. One of the major challenges in
research into violence and aggression is that of defining the construct. With the many diverse
causes and manifestations of aggression, it is not surprising that researchers of various
disciplines have defined it differently. A profusion of data exists on aggression from disciplines
such as psychology, criminology, law enforcement, and zoology, but a consensual definition of
aggression between disciplines is seldom observed. Social scientists even may focus on different
elements such as the form of the behaviour, the goal of the behaviour or the overall results of the
event (Blackburn, 1993). All contribute to various permutations of how one defines aggression.
For the purposes of this discussion, aggression will be considered as “any form of behaviour
directed towards the goal of harming or injuring another living being which is motivated to avoid
such treatment” (Baron & Richardson, 1994 (pp. 7); Bartol, 2002).

2
A number of cognitive, personality and situational factors have been found to influence or
impact aggression and its subtypes. This study describes previous research on aggression and its
relations with a number of these factors, specifically impulsivity, social problem solving, and
alcohol use. A discussion of these findings in relation to a model based upon work by
McMurran, Blair and Egan (2002) is presented. This will be followed by the current research
study, which attempts to examine and extend our knowledge of the influence of the
aforementioned factors on aggression.
1.1. Impulsivity and Aggression
Impulsivity is a multidimensional concept related to an individual’s ability to restrain or
regulate one’s behaviour. Impulsivity is acknowledged as a deficit phenomenon: that is, it
appears when “normal” regulation is not functioning properly. Individuals exhibiting this deficit
are poor at delaying gratifications, are often overly concerned with novelty seeking, and have
difficulty showing emotions in a socially appropriate manner, particularly aggressive or sexual
emotions (Barratt, 1985; Patton, Stanford, & Barratt, 1995; Plutchik & van Praag, 1995).
Impulsivity has both biological and social-cognitive determinants. It is a defining feature of
several neurological disorders: hyperactive syndrome in children, antisocial personality disorder,
borderline personality disorder, delinquency, and alcohol and substance abuse (Plutchik & van
Praag, 1995).
Support has been provided for a relationship between impulsivity and aggression; a precise
understanding of the association, however, is unknown (Gray, Owen, Davis & Tsaltas, 1983).
Furthermore, little effort has been made to distinguish between impulsive behaviour with an
aggressive tendency and impulsive behaviour without aggressive inclination (Seroczynski,
Bergeman & Coccaro, 1999). Distinctions have been made concerning different types of
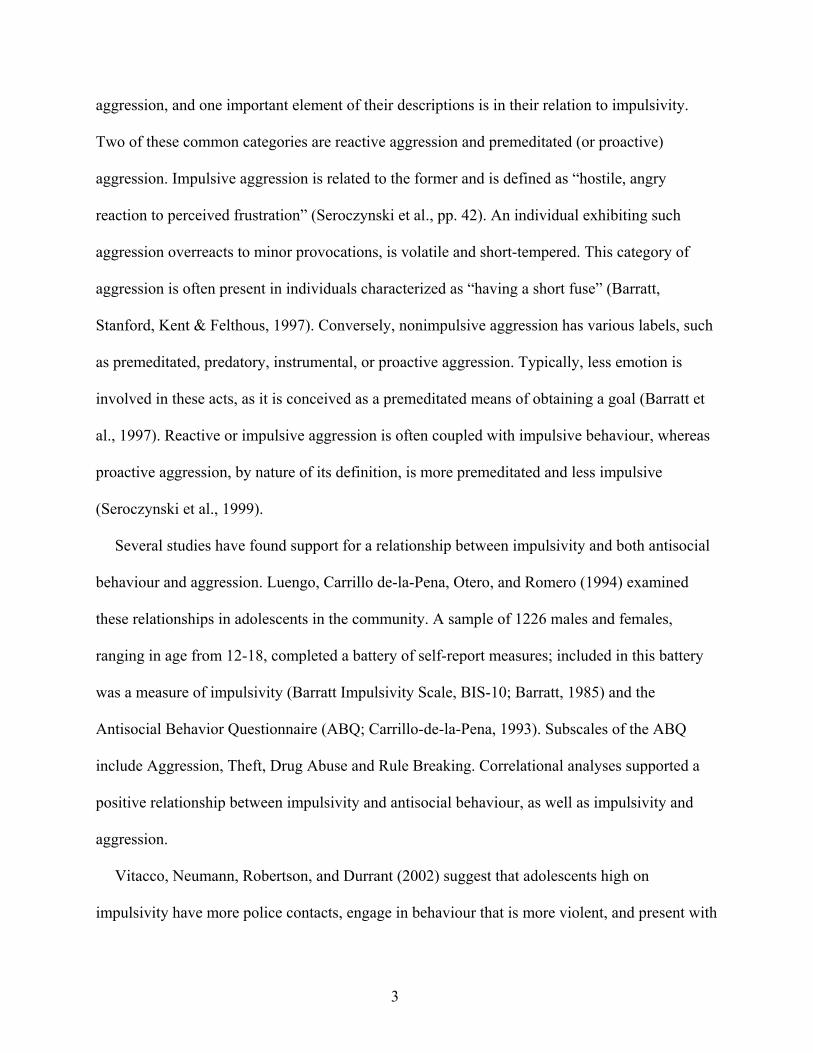
3
aggression, and one important element of their descriptions is in their relation to impulsivity.
Two of these common categories are reactive aggression and premeditated (or proactive)
aggression. Impulsive aggression is related to the former and is defined as “hostile, angry
reaction to perceived frustration” (Seroczynski et al., pp. 42). An individual exhibiting such
aggression overreacts to minor provocations, is volatile and short-tempered. This category of
aggression is often present in individuals characterized as “having a short fuse” (Barratt,
Stanford, Kent & Felthous, 1997). Conversely, nonimpulsive aggression has various labels, such
as premeditated, predatory, instrumental, or proactive aggression. Typically, less emotion is
involved in these acts, as it is conceived as a premeditated means of obtaining a goal (Barratt et
al., 1997). Reactive or impulsive aggression is often coupled with impulsive behaviour, whereas
proactive aggression, by nature of its definition, is more premeditated and less impulsive
(Seroczynski et al., 1999).
Several studies have found support for a relationship between impulsivity and both antisocial
behaviour and aggression. Luengo, Carrillo de-la-Pena, Otero, and Romero (1994) examined
these relationships in adolescents in the community. A sample of 1226 males and females,
ranging in age from 12-18, completed a battery of self-report measures; included in this battery
was a measure of impulsivity (Barratt Impulsivity Scale, BIS-10; Barratt, 1985) and the
Antisocial Behavior Questionnaire (ABQ; Carrillo-de-la-Pena, 1993). Subscales of the ABQ
include Aggression, Theft, Drug Abuse and Rule Breaking. Correlational analyses supported a
positive relationship between impulsivity and antisocial behaviour, as well as impulsivity and
aggression.
Vitacco, Neumann, Robertson, and Durrant (2002) suggest that adolescents high on
impulsivity have more police contacts, engage in behaviour that is more violent, and present with

4
a greater number and variation of criminal offences. White et al., (1994) similarly assessed
impulsivity in delinquents and found further support for a relationship. More specifically,
impulsivity strongly differentiates stable, serious delinquents from other delinquents in
adolescence. Both behavioural measures and cognitive measures of impulsivity were employed
in this sample of over 400 adolescent males. The authors propose that, “Impulsivity may be
related to the development of stable, long-term serious antisocial behaviour” (pp. 202).
Seager (2005) assessed the relations between impulsivity and a self-schema for a hostile
world in a sample of violent offenders at a medium-security federal Canadian institution. A self-
schema was assessed with social vignettes in which offenders were asked to make attributions on
the motives of individuals in the vignette (Serin, 1988; Seager, 2005) Each were coded for
hostile responses. Correlations of impulsivity and the self-schema measures were positive,
indicating that high impulsivity was related to a high self-schema for a hostile world.
Additionally, impulsivity was positively correlated with all measures of violent behaviour.
Regression analysis indicated that 31% of the variance in violent offence history was accounted
for by the combination of impulsivity and self-schemas for a hostile world.
Cherek, Moeller, Dougherty and Rhoades (1997) explored impulsivity and aggression in male
violent and nonviolent parolees. A Delay of Gratification Task, involving a small monetary
reward, and a self-report measure of impulsivity (Barratt Impulsivity Scale – 11, BIS-11; Barratt,
1985) were administered to the parolees. Results indicated that violent parolees scored higher or
more impulsively on the BIS and selected the impulsive option more frequently on the Delay of
Gratification Task than their nonviolent counterparts. Also, the number of impulsive choices was
significantly correlated with the psychometric measure of impulsivity (BIS-11).

5
Examining impulsivity in relation to behavioural measures of aggression, Cherek, Moeller,
Schnapp and Dougherty (1997b) administered the Point Subtraction Aggression Paradigm
(PSAP; Cherek, 1981) to a sample of nonviolent and violent parolees. Within this paradigm,
participants are asked to choose one of two options for each trial of the experiment: 1) Press
button A to accumulate points exchangeable for money, or 2) Press button B to ostensibly
subtract points from a fictitious person (this being the aggressive response). Results indicated
that the violent parolees responded more aggressively, choosing button B more often, than the
nonviolent parolees.
With respect to impulsivity, there was no significant difference in impulsivity scores (BIS-11;
Barratt, 1985) between the violent and nonviolent parolees (Cherek, Moeller, Schnapp and
Dougherty, 1997b). This is consistent with previous findings by Cherek, Schnapp, Moeller and
Dougherty, (1996), but inconsistent with Cherek, Moeller, Dougherty and Rhoades (1997a).
Research concerning psychometric self-report measures of impulsivity and its relations with
measures of aggression based upon criminal history appear mixed. However, examining only
behavioural measures of impulsivity and aggression, Cherek et al., (1997a) correlated the
number of impulsive choices for both violent and nonviolent parolees in the original sample with
the number of aggressive responses reported in the Cherek et al., (1997b) sample. Results
indicated a significant positive correlation between impulsive choices and aggressive responses
in both the violent and nonviolent parolees.
Summarizing both the behavioural and the psychometric data, Cherek et al., (1996; 1997a;
1997b) reported that parolees with violent criminal histories respond more impulsively and
exhibit more aggressive responses than nonviolent parolees. Therefore, Cherek and colleagues

6
suggest that “a very fundamental mechanism that acts to inhibit behaviour in a variety of
situations may be less operative” in violent parolees (pp. 529; Cherek et al 1997a).
The majority of the studies examining impulsivity and its relation to aggression, however,
have examined impulsivity as a unidimensional concept, ignoring the multidimensional nature of
this construct. It has been proposed that some subtypes of impulsivity may correlate stronger
with criminality and aggression than other subtypes (Fink & McCown, 1993). The Barratt
Impulsivity Scale-11 (BIS; Barratt, 1985; Patton, Stanford, & Barratt, 1995) described these
subtypes of impulsivity; 1) motor impulsivity–acting on the spur of the moment; 2)
cognitive/attention impulsivity–not focusing on the task at hand; and 3) nonplanning
impulsivity–not planning and thinking carefully.
Findings are mixed concerning the success of measuring each of these subtypes. Patton et al.,
(1995) have been consistent in their assessment of motor and nonplanning impulsivity, but
support for subtype of cognitive/attention impulsivity has been discrepant. There are two
possible explanations for these inconsistent findings. First, because cognitive/attention
impulsivity loaded on all of the factors, it is thought that this factor may be measuring the
general cognitive process underlying impulsivity. That is, the “thought processes” underlying the
trait of impulsivity, which ultimately may be difficult to differentiate or pull apart from the
others. Second, because the BIS-11 is a self-report measure, subjects may lack the ability to
independently assess thought processes that characterize impulsivity, and therefore findings of
this factor may not be assessed accurately. Regardless, two subtypes of impulsivity are apparent
in the common impulsivity measure the BIS-11 (Patton et al., 1995).
Further examining these subtypes of impulsivity, Barratt (1985, 1990) revealed that levels of
impulsivity are higher for motor and cognitive impulsivity in delinquents when compared to
7
nondelinquents and that no difference appears to exist in nonplanning impulsivity between
delinquents and nondelinquents. More recently, Luengo, Carrillo-de-la-Pena, Otero and Romero
(1994) examined a similar theme in adolescents; their findings, however, were incongruous with
Barratt’s (1985; 1990). Although the overall impulsivity scores on the BIS were correlated with
antisocial behaviour and aggression, the nonplanning component demonstrated the strongest
relationship with antisocial behaviour and the cognitive component demonstrated the weakest
relationship.
Having discussed the subtypes of impulsivity, how do the subtypes of reactive and
premeditated aggression relate to impulsivity? Reactive, by the nature of its definition, is more
impulsive and is therefore expected to correlate highly with impulsivity. Stanford, Greve and
Dickens (1995) examined impulsive/reactive aggression (BDHI; Buss & Durkee, 1957) and
impulsivity (BIS-11; Patton et al., 1995) in a sample of 214 university students. Group
classification, impulsive aggressive versus nonaggressive, was determined by self-report
identification of impulsive aggressive episodes in the last 6 months. The impulsive aggressive
individuals scored significantly higher on both the aggression measure (BDHI) and the
impulsivity measure (BIS-11) than the nonaggressive participants. A second analysis examined
the number of impulsive aggressive episodes in relation to the aggression and impulsivity. The
number of impulsive aggressive episodes was positively correlated with impulsivity and the
overall score of the BDHI. Impulsivity has been clearly defined here as an important dimension
in the control of behaviour involved in the inhibition of aggressive impulsive acts. What, then, is
the role of impulsivity in premeditated aggression?
Barratt, Stanford, Kent and Felthous (1997) examined various neuropsychological,
personality and psychophysiological measures of impulsive aggressive and premeditated

8
aggressive inmates and a noninmate control group. Results were contrary to the original
prediction: there were no differences in impulsivity, as measured by the BIS, between the
impulsive and premeditated groups. There were as predicted, however, significant differences
between each of the aggressive subtypes and the nonaggressive control. That is, the aggressive
subtypes exhibited a higher level of behaviourally measured impulsivity. Furthermore, one of the
most notable findings was a significant difference between the two aggressive subtypes with
respect to verbal skills. The impulsive aggressive group exhibited more deficits on verbal
information processing than the premeditated group. Related to this finding is a deficit in
attention and concentration between the two groups, as well as a difference between each of the
two groups and the nonaggressive control. The authors suggest that deficits with respect to an
individual’s reading and verbal ability may influence everyday activities and result in stressors.
These deficits may interact with “differences in arousability thresholds” and may result in a
tendency to act aggressively and in an impulsive manner. It is implied that impulsivity on its own
may not be sufficient to cause impulsive aggression; rather, its interactions with other factors
such as verbal skills and arousal level may have a significant role in contributing to aggression.
Stanford, Houston, Villemarette-Pittman and Greve (2003) in a similar study examined
various personality and neuropsychological measures in a sample of aggressive outpatients and a
nonaggressive control group. Overall, the aggressive participants scored higher, or more
aggressively, on the Buss Perry Aggression Questionnaire (BPAQ), as well as on the impulsivity
measure (BIS-11; Patton et al., 1995). Few significant differences however, were found on
neuropsychological and psychophysiological measures. Results from this study can only support
personality differences between aggressive participants and nonaggressive controls and explain

9
little in terms of differences between premeditated and reactive aggressive subtypes and
impulsivity.
The concept of impulsivity or dyscontrol plays a major role in understanding criminal
behaviour. Gottfredson and Hirschi (1990) have proposed impulsivity as the fundamental factor
contributing to criminal behaviour. It is argued that criminal behaviour stems from low self-
control, as many criminal acts provide immediate or easy gratification of desires either by
relieving an irritation or providing some reward (e.g. getting high). However, it is admitted that a
lack of self-control does not necessary imply that criminal behaviour will occur.
Few studies have demonstrated a causal relationship between impulsivity and aggression, but
a multitude of studies have demonstrated an indirect association between these factors.
Researchers have suggested impulsivity as a fundamental factor in aggression and criminal
behaviour in general, but at the same time acknowledge various other factors, such as verbal skill
or social problem solving, which may contribute to or mediate this relationship (Gottfredson &
Hirschi, 1990; McMurran, Blair & Egan, 2002). A relationship between these factors appears to
exist, but the specifics and influences of the relationship between impulsivity and aggression
remains unclear. Further research is necessary to understand better the relations of impulsivity
and its involvement in offending and violent behaviour in offenders.
This study examines the relationship between aggression and a measure of impulsivity in a
cross-section of incarcerated offenders. Aggression will be assessed by two psychometric
measures: the Buss-Perry Aggression Questionnaire and the Impulsive/Premeditated Aggression
Scale. A common psychometric measure of impulsivity, the BIS-11, will be used to assess
individuals’ overall level of impulsivity as well as its subtypes of motor, cognitive, and
nonplanning impulsivity. Impulsive aggression and premeditated aggression subscales of the

10
Impulsive/Premeditated Aggression Scale will be examined to assess their relationship with
impulsivity. Social problem solving as a potential mediator in this relationship is considered and
described in a subsequent section.
1.2. Social Problem Solving and Aggression
Every day we are faced with a multitude of problems, whether it is deciding how to deal with
clashing personalities at work, how to balance the budget at home, or what to do when the car
will not start. Fortunately, most of the time, individually or collectively, we are able to solve
these problems with little conscious effort. From our experiences, we have developed some
social cognitive and problem-solving strategies that help us move through our daily lives with
little turmoil. Conceivably, some of our problem solving strategies may be so rehearsed that we
take them for granted.
Social problem solving is one of the more sophisticated subcategories of social cognition.
When we encounter a difficult social situation, we may utilize one or more of the following
processes a) discuss the problem and its constraints, and generate a collection of possible plans
of action (‘alternative thinking’); b) consider the possible consequences that result from each
plan of action (‘consequential thinking’); c) plan a method to achieve the favoured outcome
(‘means-end thinking’); and finally, d) decide whether we have the resources to act accordingly
to achieve the favoured outcome (Howells, 1986). One’s ability to utilize the preceding
processes is an indication of one’s ability to problem solve.
Social problem solving is central to our everyday functioning yet the question then remains,
what happens when an individual is unable to solve social problems effectively. Research on
various patient groups has revealed an association between problem solving and their disorders.
Generally speaking, deficits in social problem solving ability are related to higher levels of

11
psychological distress (D’Zurilla, Nezu, & Maydeu-Olivares, 2002). Some of these include
Attention Deficit Hyperactive Disorder (ADHD) and conduct disorder (CD) (Matthys, Cuperus,
& van Engeland, 1999), depressive symptomatology (Nezu, 1985, 1986a, 1987) heroin abuse
(Platt, Scura, & Hannon, 1973) and anxiety (Nezu, 1985, 1986b; Nezu & Carnevale, 1987).
More specifically, when examining offender populations, problem solving deficits are present
among various types of offenders. Examples include mentally disordered offenders (McMurran,
Egan, Richardson, & Ahmadi, 1999), sex offenders (Grier, 1988), and violent offenders (Crick &
Dodge 1994; 1996).
In the current study, we are interested in social problem solving as it relates to offending,
particularly violent offending. Research on aggressive adolescents suggests that these youth
produce fewer solutions to problems, and the solutions they produce are poor, ineffective, and
more aggressive than the solutions of their nonaggressive counterparts (Evans & Short, 1991).
Among adult violent offenders, research suggests that aggressive offenders utilize a smaller
range of ‘alternative thinking’ to solve problems, consider less the consequences of their actions,
and rely more on physical and verbal aggression than nonaggressive controls (Hains & Ryan,
1983; Slaby & Guerra, 1988; Guerra & Slaby, 1990). Further, Howells (1986) has provided
evidence to suggest that violent offenders may have difficulty with social skills; in particular, it
is thought that when an individual encounters a social problem, it is a combination of frustration,
an inability in development, and the use of ‘alternative thinking’ that causes the individual to
resort to violence.
Since social problem solving deficits may be implicated in the maintenance and use of
aggression and violence, examining interventions addressing this issue is important. Kazdin
Esveldt-Dawson, French and Unis (1987) examined the efficacy of a social problem solving

12
skills program on conduct/antisocial disordered children (7-13 year olds). Notable results
included reductions in aggression and overall problem behaviour at school and at home. Results
were maintained at a 1-year follow-up (Kazdin et al., 1987).
Evaluations of social problem solving programs for aggressive adolescents have generated
similar findings. Guerra and Slaby (1990) assessed the ability of a cognitive mediation
intervention program for aggressive offenders to alter social problem solving skills and
subsequent aggressive institutional behaviour. Results supported an increase in social problem
solving skills, a decrease in endorsement of aggressive and hostile beliefs, and a reduction in
aggressive and impulsive behaviour, as rated by staff.
With respect to adult offenders, many of Correctional Service of Canada’s Violence
Prevention Programs integrate theories of social information processing and social learning
theory. Correctional treatment programs such as Reasoning and Rehabilitation (R&R) and
Enhanced Thinking Skills (ETS) (Robinson, 1991; Robinson, 1995; Ross, Fabiano & Ross,
1986; McGuire, 2000) provide training on social problem skills as part of a general cognitive
skills treatment program. Evaluations of such programs have demonstrated success in improving
offenders’ problem solving ability and subsequent recidivism. More specifically, for the treated
group, pre- and post-intervention difference scores on an impulsivity measure were greater; with
respect to recidivism, treatment resulted in a reduction of reconviction by 20% and a reduction of
35% in recidivism when examining high risk violent offenders on their own (Robinson, 1991;
Robinson, 1995).
Deficiencies in social problem solving may lead to violent and aggressive criminal
behaviours. Treatment programs teaching social problem solving skills show promise in
decreasing aggression both in youth and in incarcerated adult offenders (Guerra & Slaby, 1990;

13
Robinson, 1991; Robinson, 1995). Additional examination of social problem solving in criminal
behaviour and aggression remains essential to understanding how all factors interact. The current
study examines further the relationship between social problem solving and aggression in a
cross-section of offenders. Specific relationships examined will include the association between
social problem solving ability and aggression, as well as social problem solving and its potential
role as a mediator in the relationship between impulsivity and aggression.
1.3. Impulsivity and Social Problem Solving
There is agreement on a relationship between impulsivity and aggression; the relationship,
however, may not necessarily be a simple one-to-one association as potential mediating variables
may contribute to the link. Social problem solving is one of these potential mediating variables.
Shure and Spivack (1982), pioneers in this field, postulated that improving a child’s problem
solving ability might decrease the rate and intensity of impulsive and dysfunctional behaviour.
These researchers developed the Interpersonal Cognitive Problem Solving (ICPS) program, a
program designed to teach children fundamental skills related to problem solving. Dialogues and
role-playing offer the children the opportunity to practice these complex skills. Results have
demonstrated that, improving a child’s problem solving skills reduces impulsivity, as measures
of impulsivity remained lower at a 1-year follow up (Shure, 1997; Shure & Spivack, 1988). The
program and its ability to reduce aggression were not discussed.
Brennan and Raine (1997) claimed that impulsivity is a strong predictor of later aggression
and violence. Further investigation into this relationship has suggested that poor verbal skills
mediate the relationship between impulsivity and aggression (Barratt, Stanford, Kent, &
Felthous, 1997). Developmentally, it is thought that poor verbal skills in conjunction with
impulsivity and low intelligence present great difficulty for an individual attempting to learn

14
adequate problem solving skills. Since the individual is unable to utilize or develop adequate
thinking and behaviour skills to defuse a problematic situation, as the child ages and encounters
ambiguous situations, these encounters may escalate to aggression and violence (McMurran,
Blair, & Egan, 2002).
McMurran, Blair and Egan (2002), a British research group, investigated the inter-correlations
between impulsivity, social problem solving, alcohol use, and aggression in a male university
student sample (N=70). In this correlational study, the relationships between the aforementioned
factors were examined by administrating a series of self-report questionnaires, with one
questionnaire assessing each factor. McMurran et al.’s (2002) preliminary model is portrayed in
Figure 1. The following self-report questionnaires were utilized to assess the relationship among:
Aggression: Buss Perry Aggression Questionnaire (BPAQ; Buss & Perry, 1992); Impulsivity:
Barratt Impulsiveness Scale- 11 (BIS-11); Patton, Stanford, & Barratt, 1995); Social Problem
Solving: Social Problem Solving Inventory – Revised (SPSI-R; D’Zurilla, Nezu, & Maydeu-
Olivares, 2000) and; Alcohol Dependency: Short Alcohol Dependence Data Questionnaire
(SADD; Davidson & Raistrick, 1986; Raistrick, Dunbar, & Davidson, 1983).
Results of the McMurran, Blair and Egan, (2002) study, although based on an undergraduate
university sample, provide an understanding into issues relating to offenders and offending.
Additionally, they help to point to where personality influences criminal behaviour and where it
does not. Of the three proposed relationships among social problem solving, impulsivity, and
aggression, only two were significant, as the association between impulsivity and aggression was
not supported. Significant negative correlations were found between impulsivity and social
problem solving, and between social problem solving and aggression. That is, a higher level of
impulsivity is related to lower levels of social problem solving ability. Similarly, lower levels of

15
social problem solving are related to higher level of aggression. By partially out the influence of
aggression or impulsivity in this triad of variables, it was discovered, that problem solving ability
had a mediating effect on the relationship between impulsivity and aggression. The noteworthy
finding from this research is that poor social problem solving, not impulsivity, exerts the most
influence over aggression.
McMurran et al., (2002) have attempted to provide an explanation for their findings. They
proposed that during a child’s development, impulsivity might create an obstacle to learning,
especially learning how to most effectively problem solve. Because of this obstacle, the child
lacks adequate problem solving skills and it is this deficiency that potentially contributes to
aggressive outcomes in uncertain interpersonal interactions. Therefore, it is suggested that high
levels of impulsivity lead to poor problem solving, which then leads to aggression. This supports
previous research, discussed above, that has suggested that problem solving ability influences
one’s level of aggression. With respect to impulsivity’s indirect role in the relationship to
aggression, the results do not refute previous research; rather, it further specifies the relationship
and how it can be influenced by social problem solving (McMurran et al., 2002).

16
-ve Impulsivity Social Problem
Solving
Aggression
Alcohol Use
-ve
Figure 1.1 Relationships among impulsivity, social problem solving, aggression, and alcohol
use. Adapted from McMurran, Blair, & Egan (2002). Solid lines represent significant
associations between the variables. Dashed lines represent nonsignificant associations.
An abundance of literature is available on interventions addressing social problem solving in
offenders. Often these programs offer a self-control or impulsivity component to the curriculum.
Robinson, Grossman and Porporino (1991) evaluated the effectiveness of a Cognitive Skills
Training Program on offenders in Canadian federal institutions. One of the principal targets of
this program was to address impulsivity. Outcome measures included an impulsivity measure,
cognitive skills measures, and recidivism. Significant positive changes for the treatment group,
relative to the control group, were found within most areas. General cognitive ability and
impulsivity were both more favourable post-treatment. At a one-year follow up, readmissions
rates for new convictions were lower for the treatment group than the control group.
An intervention designed to address social problem solving deficits in mentally disordered
offenders was assessed for its effectiveness (McMurran, Egan, Richardson, & Ahmadi, 1999).
The intervention was designed to improve the patients’ ability to “define problems clearly,
produce and analyze a range of potential solutions, and select and implement an effective action

17
plan” (p. 318). The Social Problem Solving Inventory – Revised (SPSI-R; D’Zurilla, Nezu, &
Maydeu-Olivares, 2000) was utilized as a pre- and post- measure of problem solving ability. The
intervention was successful in improving the patients’ overall SPSI-R scores as well as reducing
the impulsivity/carelessness subscale of the measure (McMurran, Egan, Richardson, & Ahmadi,
1999).
1.4. Alcohol Use and Aggression
A considerable body of research, both nonexperimental and experimental, has investigated the
relationship between alcohol use and aggression. Epidemiological studies and nonexperimental
studies have consistently found an association between alcohol use and violence (Murdoch, Pihl,
& Ross (1990). A study assessing this relationship noted alcohol use in 42% of violent crimes
(Pernanen, 1991). It was however, estimated to be as high as 55% to 60% due to the
underreporting of alcohol use during such violent exchanges. A review of research from 11
countries by Murdoch, Pihl, and Ross (1990) identified alcohol as a factor in 63% of violent
crimes. That is, the majority of offenders convicted of these violent offences had been drinking
prior to committing their offence. However, the majority of individuals who use alcohol are not
violent (Fagan, 1990). It is also important to consider the quality or type of alcohol abuse
typically present in offenders. Collins and Schlenger (1988) ascertain that acute alcohol
consumption, rather than chronic alcohol abuse, is more strongly associated with individuals
incarcerated for a violent offence. However, neither acute alcohol use nor chronic alcohol abuse
are sufficient for aggression to occur: there are many drinking episodes that do not result in
violence, and some acts of violence do occur without the influence of alcohol (Chermack &
Giancola, 1997). Therefore the question remains, what factors influence the relationship between
alcohol and aggression?

18
A New Zealand longitudinal study followed 1265 males and females from birth to age 15/16.
Initial results suggest that individuals who misused alcohol were six times more likely to commit
violent offences and 12-13 times more likely to commit property offences. After adjusting for
confounding risk factors (social background, family characteristics, etc.) they found that males
and females who misused alcohol were three times more likely to commit violent offences. In
addition, after the adjustment, no relationship was found between alcohol misuse and property
offences. These findings are consistent with literature supporting alcohol consumption increasing
aggression.
Many of the experimental studies assessing this relationship have utilized the Taylor
Aggression Paradigm (TAP) (Taylor & Chermack, 1993). Within this paradigm, participants are
asked to compete on a reaction-time task with a fictitious opponent in another room. Participants
are asked to select the intensity, on a scale of 1-10, of shock that they wish to administer to the
opponent if he/she loses. The reaction time task occurs and the loser receives the shock. The
participant is unaware that the rate of wins and loses are predetermined and distributed evenly.
The measure of aggression in this paradigm is the intensity of the shocks selected by the
participant (Chermack & Giancola, 1997). The majority of the studies utilizing this paradigm
have reported that individuals who received alcohol are more aggressive: they administer a
higher intensity of shock than those individuals who received a nonalcoholic beverage or placebo
(Chermack & Taylor, 1995; Chermack & Giancola, 1997; Laplace, Chermack, & Taylor, 1994).
Based upon the scores from Buss-Durkee Hostility Inventory, Bailey and Taylor (1991)
separated individuals into three groups of low, moderate, and high aggression. These individuals
then completed the TAP after consuming either an alcoholic or nonalcoholic beverage. Findings
indicated that individuals with high and moderate aggression were more aggressive when

19
intoxicated than individuals also with high or moderate aggression but sober. Additionally,
individuals with low levels of aggression were more aggressive than their sober counterparts;
this occurred, however, only under the condition of low provocation.
Utilizing the TAP, Giancola (2003) examined the influence of dispositional aggression on
alcohol related aggression. Trait aggression was measured by the Buss-Perry Aggression
Questionnaire (BPAQ; Buss & Perry, 1992) in this sample of males and females. Overall, results
indicated that individuals with higher trait aggression exhibited more behavioural aggression on
the TAP than those with lower dispositional aggression. Moreover, alcohol increased aggression
in individuals with a high disposition; however this was not the case for those with a low
dispositional aggression. The authors conclude that alcohol consumption does not necessarily
result in aggression in everyone in all situations.
Another widely used experimental measure of aggression is the Point Subtraction Aggression
Paradigm (Cherek, 1981). In this task each participant sits in front of a computer and mechanical
box with two buttons. They are asked to press one of the buttons on the box as fast as possible in
order to earn the amount of money displayed on the computer screen. The participants are told
that they have been paired up with an opponent, albeit a fictitious opponent, whom they can
ostensibly take money away from. This can be done by pressing the second button. The
participants are provoked by having money taken away from them, ostensibly by the ‘opponent’.
The number of times the participant presses the second button to take money from the
‘opponent’ serves as the participant’s measure of aggression.
Bushman and Cooper (1990) reviewed 30 studies that used laboratory based aggression
measures such as the Point Subtraction Aggression Paradigm to assess the effects of alcohol use
on aggression. Overall, across the majority of the studies, the consumption of alcoholic
20
beverages resulted in a greater amount of aggression than did the nonalcohol or placebo group.
The authors therefore concluded that alcohol increased aggressive behaviour.
Even though research investigating the link between alcohol and aggression has been studied
extensively for decades, and both laboratory and epidemiological studies have shown a
relationship between these factors, high variability exists in the findings. Various individual,
environmental, cultural, and situational factors influence the strength of this relationship. Such
factors include previous drinking experience (Laplace, Chermack, & Taylor, 1994), frontal lobe
functioning (Lau, Pihl, & Peterson, 1995), problem solving (Chermack & Giancola, 1997) and
personality disorders (Moeller & Dougherty, 2001).
In a review, Chermack and Giancola (1997) noted an association between information
processing deficits and aggression. Also noted was the ability of alcohol to disrupt executive
cognitive functioning and problem solving, and to limit abstract reasoning. Therefore, alcohol
consumed by an individual with information processing deficits may increase risk for impulsive
aggression. As a result, it is suggested that alcohol abuse is a potential mediating variable in the
association between impulsivity and aggression. This relationship will be discussed in more
detail in the following section.
Specific interventions designed to control and treat alcohol related violence are scarce. The
Control of Violence for Angry Impulsive Drinkers (COVAID) is a cognitive behavioural,
community based treatment program addressing alcohol related violence. An evaluation of the
COVAID pilot program, administered a battery of pre- and post- psychometric measures and
self-report alcohol consumption and aggression measures. Results for program completers (N=6)
demonstrated improvement on alcohol-related aggression beliefs, anger control, social problem
solving and impulsiveness. Recidivism rates for violent offences were lower for the COVAID

21
treatment group (17%) than the control group (30%). Due to the small sample size, statistical
significance could not be tested.
McMurran et al., (2002) in their preliminary test of their model of aggression found no
significant relationship between alcohol use and aggression. The authors provided two potential
explanations for why this hypothesis was not supported. First, the sample in this study was
undergraduate and post graduate university students with a mean age of twenty-seven. They were
assessed as mild to moderate drinkers and were thought to be beyond the “peak age of drinking”.
Therefore, their overall low level of drinking is one possible reason for the null results. Secondly,
upon further examination, the overall sample was moderate in social problem solving, and it was
proposed that moderate social problem solving may be a protective factor against alcohol abuse
or problem drinking, regardless of the level of impulsivity. This is an interesting notion that
needs further investigation. Although McMurran et al., (2002) found no association between
alcohol dependency and aggression, a relationship between these factors has been found in
previous literature, as described above. Therefore, further consideration of the relationship is
examined in the present study. More specifically, alcohol use and alcohol dependency are
examined in relation to aggression, as measured by three self-report questionnaires, in a cross-
section of offenders.
1.5. Alcohol Use and Impulsivity
Similar to the literature on alcohol use and aggression, the literature on alcohol abuse and
impulsivity is complicated. Substance abuse, in general, is a complex behaviour that is not
innately impulsive (Moeller, Barratt, Dougherty, Schmitz, & Swann, 2001). However, if
impulsivity is related in some way to substance abuse, we would expect individuals who
exhibited impulsive behaviour to have higher rates of substance use. Brady, Myrick, and

22
McElroy (1998) reviewed prior studies that examined this association and found that impulsively
violent offenders and individuals with intermittent explosive disorder had higher rates of
substance dependence than the general population.
Other findings provide further support for this relationship. King, Jones, Scheuer, Curtis, and
Zacone (1990) utilized the Eysenck Personality Inventory and compared impulsivity scores
between inpatient substance abusers and a nonpatient control group. The substance abusers were
found to score significantly more impulsive than controls. Also, individuals who are dependent
on multiple substances are more impulsive than those dependent on single substances (McCown,
1988; O’Boyle & Barratt, 1993; Moeller et al., 2001). In terms of personality disorders,
individuals with borderline personality disorder (BPD) are more impulsive and use more
substances than those not meeting the specific criteria for BPD (Kruendelbach, McCormick,
Schulz, & Grueneich 1993; Moeller et al., 2001).
In line with the proposed study, Klinteberg, Andersson, Magusson, and Stattin, (1993) noted a
relationship between impulsivity, drinking, and violence. In this longitudinal study of
delinquents and violent offending, it was found that individuals scoring higher on impulsivity
and hyperactivity measures were three times more likely to develop an alcohol problem by age
25. Furthermore, individuals high on impulsivity and alcohol problems were ten times more
likely to have been arrested for a violent offence than those individual not exhibiting impulsivity
or alcohol problems. Evidently, they found that delinquents who are impulsive and drink heavily
are most likely to be violent.
The abovementioned research suggests a positive relationship between alcohol use and
impulsivity. Physiologically, the relationship between impulsivity, alcohol use and aggression
may occur under two conditions. The first is when a low amount of alcohol is consumed, as this

23
may reduce inhibitory factors, thereby facilitating aggression; the second condition occurs under
large amounts of alcohol consumption, as this may cause a sedative effect and impair one’s
ability to make judgments, which may also lead to aggression (Swann & Hollander, 2000).
Dougherty et al., (1999) utilizing a common behavioural measure of impulsivity, the
Continuous Performance Task, provides further support for belief that substance abuse
disinhibits impulses. Results indicate that alcohol use increased reward-delay impulsivity in a
nonpatient group. More explicitly, individuals using alcohol were more likely to choose the most
immediate reward, even if it was a smaller reward versus a larger reward in which they had to
delay their response.
Petry (2001) compared alcohol dependent individuals, alcohol abstainers (formally
dependent) and controls on a delayed-reward laboratory measure of impulsivity. Results showed
that alcohol-dependent participants were more impulsive than controls. The alcohol dependent
individuals were also more impulsive than the alcohol abstainers suggesting a direct relationship
with alcohol use and impulsivity.
Utilizing the Point Subtraction Aggression Paradigm (PSAP) as described earlier, Fulwiler,
Eckstine and Kalsy (2005) examined aggression, impulsivity, serotonin function and alcohol use
in a sample of healthy normal males. Participants were administered the PSAP, an impulsivity
measure (BIS-11), and an aggression measure (BPAQ). All tests and measures were
administered over two days. Administration during the first day did not involve the consumption
of alcohol, and therefore provided a baseline for the psychometric and behavioural measures.
Administration on the second day involved the behavioural measure of aggression after the
consumption of an alcoholic beverage. Correlations were used to examine the relationship
between scores on the psychometric measures and the change in aggressive responding after the

24
consumption of alcohol. Results demonstrated that only impulsivity (BIS) correlated with the
increase in aggressive responding during the alcohol condition. More specifically, the subscales
of cognitive and nonplanning impulsivity were the most prominent. The authors conclude that
impulsivity plays a mediating role in the effects of alcohol on aggression.
From the multitude of research, we know that a high level of impulsivity exists in substance
dependent individuals. We do not know, however, if the high level of impulsivity is a result of
substance abuse, or if it is a factor leading individuals to abuse. Furthermore, the specific role
impulsivity plays in either the understanding or the treatment of substance abuse is unclear.
Only one study was found that examined how impulsivity was related to treatment outcome.
Fifty cocaine-dependent individuals were assessed for their level of impulsivity (BIS-11) and
their current cocaine usage (Moeller, Dougherty, Barratt et al., 2001). A significant positive
correlation between BIS-11 scores and average daily cocaine use was found. After a 12-week,
double blind group therapy treatment program, individuals with a lower impulsivity score stayed
in treatment for a significantly longer period of time than those with a high level of impulsivity.
Therefore the authors concluded that impulsivity was not only a predictor of substance abuse but
it was also a negative predictor for treatment retention (Moeller & Dougherty, 2002; Moeller,
Dougherty, Barratt et al., 2001).
Impulsivity, assessed by either psychometric or behavioural measures, has demonstrated a
positive relationship with alcohol use. There also appears to be a relationship between these two
factors and aggression, as individuals with higher impulsivity and alcohol use were ten times
more likely to be arrested for a violent offence. Although it is evident that a relationship between
impulsivity, alcohol use and aggression exists, the specifics of this relationship are not apparent.
In the current study, I attempted to examine further the role alcohol plays in aggression by

25
assessing the relations of alcohol use and impulsivity in a cross section of offenders.
Psychometric measures of each factor, impulsivity and alcohol use, are utilized to examine their
relation to an individuals’ level of aggression.
1.6. Purpose and Hypotheses of the Research
The purpose of this study was to examine how impulsivity, social problem solving and
alcohol use contribute to aggression in a sample of provincially incarcerated offenders. The
specific research questions that are addressed include the following:
a) To what extent and with what predictive ability does impulsivity, social problem solving
and alcohol dependency relate to aggression in a sample of incarcerated offenders?;
b) Does social problem solving act as a mediator in the relationship between impulsivity and
aggression?;
c) How do these variables, interact in their contribution to aggression?
Based on the abovementioned literature, the following hypotheses, are tested in an effort to
understand better the relationships among impulsivity, social problem solving, alcohol
dependency and aggression in a sample of incarcerated offenders:
Hypothesis 1: It is hypothesized that high levels of impulsivity should be related to
greater levels of general aggression.
Hypothesis 2: It is hypothesized that high levels of each impulsivity subtype (motor,
cognitive/attention and nonplanning) should be related to greater levels of general
aggression.

26
Hypothesis 3: It is hypothesized that levels of impulsivity should be greater for those
individuals classified as exhibiting impulsive aggression than for those individuals
classified as exhibiting premeditated aggression.
Hypothesis 4: It is hypothesized that lower levels of social problem solving should be
related to higher levels of impulsivity.
Hypothesis 5: It is hypothesized that lower levels of social problem solving should be
related to higher levels of general aggression.
Hypothesis 6: Higher levels of alcohol dependency should be related to higher levels of
general aggression.
Hypothesis 7: Higher levels of alcohol dependency should be related to higher levels of
impulsivity.
Proposed Model of Aggression
The aforementioned hypotheses provide the foundation for a testable model of aggression
The only known research study to examine all relationships among social problem solving,
alcohol dependency, impulsivity and aggression was conducted by McMurran, Blair, and Egan
(2002). This British research group investigated the inter-correlations between these variables in
a university male sample. Positive correlations were found between impulsivity and social
problem solving, and between social problem solving and aggression. Social problem solving

27
established itself as an effective mediator between impulsivity and aggression. There were,
however, no relationships between alcohol and any of the other factors. McMurran et al., (2002)
has provided valuable insights into the associations between impulsivity, social problem solving,
drinking, and aggression. Furthermore, they have provided the foundation for future researchers
interested in this area. In addition to McMurran et al., (2002), the collection of aforementioned
studies provided the framework for the current study and provided the basis for the development
of the proposed model on the relationships between impulsivity, social problem solving, alcohol
dependency and aggression in offenders.
(Figure 1.2).
Figure1.2. Proposed Path Analytic Model of Aggression
Impulsivity SPSI
Aggression
Alcohol
e1
e2
e3

28
CHAPTER 2 METHOD
2.1. Participants
The sample consists of (N = 185) provincially incarcerated male offenders from the Saskatoon
Provincial Correctional Centre (SCC; n = 54; 29%), located in Saskatoon, Saskatchewan, and the
Prince Albert Correctional Centre (PACC; n = 131; 71%), in Prince Albert, Saskatchewan. All
participants were male with a mean age of 29.66 (SD = 9.3) and an average of a Grade 10
education (SD = 1.7). Regarding ethnicity, 84.3% (n = 156) of the sample self-identified as First
Nations, Métis or Inuit, 11.9% (n = 22) as Caucasian, 1.6% (n = 3) as other and 2.2% were
unknown (n = 4).
Ethical approval from the University of Saskatchewan advisory committee on Ethics in
Behavioural Science was obtained. Research Approval was also obtained from the Saskatchewan
Department of Corrections and Public Safety. In order to participate, each offender was required
to provide informed consent by reading and signing the consent to participate form (see
Appendix A).
2.2. Procedure
2.2.1. Recruitment
Participants were recruited by the student researcher or the Program Coordinator at each
institution. Participants were approached and asked to participate in a research study on
aggression. In order to partake in the study, individuals had to have been convicted and

29
sentenced for their current offence(s). Individuals on remand awaiting trial were not permitted to
participate. Basic reading ability was a selective criterion for participation and was assessed by
self-report when the participants was being asked if they would be interested in be involved in
the study. If participants did not meet these criteria, they were thanked for their interest and
informed that they were not eligible to participate. Participation was voluntary, and individuals
were informed that choosing to participate or not to participate would have no impact on their
treatment within the institution.
2.2.2. Testing
2.2.2.1. Consent to participate. Upon accepting the invitation to participate, individuals were
explained further the details of the study and were asked to read and sign the consent form and
assured of the confidentiality of their responses (See Appendix A).
2.2.2.2. Survey completion. In order to ensure anonymity, consent forms were collected
separately from the questionnaires and participants were asked not to provide any identifying
information (i.e. name, inmate number) on the survey. Testing occurred in small groups or
individually in a classroom or in the common area on each unit. On average, the questionnaire
took 30-40 minutes to complete and the student researcher was available throughout the testing
session to address any concerns or queries. Upon completion, participants were provided with a
copy of the consent form and any questions about the study were addressed. Furthermore,
participants were encouraged to contact the researcher if they had any further concerns.
30
2.3. Measures
For the present study, data were collected by having participants complete an 11-page battery
of six self-report measures that are described in the subsequent section. In addition, each
individual was asked to complete basic demographic information and questions regarding their
offence history. The administration sequence of the seven measures (six self-report, one
demographic) were randomized for each set of 25 booklets. Although complete counterbalancing
was not possible, efforts were made to minimize such measurement errors. (Appendix B – H).
2.3.1. Demographics and Offence History
Standard questions on age, level of education, ethnicity and current institution were collected
with respect to general demographic data (See Appendix H). Regarding self-reported offence
history, participants were assessed on (a) the number of categories of violent convictions in the
community; (b) occurrence and number of previous domestic violence convictions; (c)
occurrence and number of previous institutional misconduct convictions and; (d) current
convictions.
2.3.2. Impulsivity Measure
2.3.2.1. Barratt Impulsiveness Scale – 11 (BIS-11; Patton, Stanford, & Barratt, 1995). The
BIS-11 is a 30-item self-report questionnaire measured on a 4-point Likert scale, assessing the
multidimensional nature of impulsivity (see Appendix D). There are three subscales: 1) motor
impulsivity (10 items), 2) cognitive/attentional impulsivity (8 items), and 3) nonplanning
impulsivity (12 items). A total score of impulsivity, in addition to a subtotal for each subscale
was computed. The higher the overall score, the higher the level of impulsiveness. In order to
31
avoid participants developing a response set, a number of items have been worded to imply a
lack of impulsivity and therefore are reversed scored.
Since it original version in the 1950s, the Barratt Impulsivity Scale has gone though many
revisions. The majority of the studies describing the reliability and validity of the BIS report
findings with earlier versions of the measure. Previous versions have differentiated impulsive
offenders and individuals with personality disorders from control groups (Barratt, 1985, 1994).
In the development of the most recent version, Patton, Stanford and Barratt (1995) compared
BIS-11 scores of a sample of general psychiatric patients, inmates and undergraduates. Inmates
were found to have significantly higher scores than both the psychiatric patients and the
undergraduates. Reliability has shown to be adequate in both American (Patton, Stanford &
Barratt, 1995) and Italian samples (Fossati, De Ceglie, Acquarini & Barratt, 2001). The BIS-11
has a high internal consistency of .80 in a sample of prison inmates (Barratt, 1985; Patton et al.,
1995). The internal consistency scores for the groups are as follows: undergraduates .82,
substance abusers .79, and general psychiatric patients .83. This measure has also been
acknowledged as having clinical utility for assessing impulsivity among patient and inmate
populations (Patton et al., 1995).
The factor structure of the BIS-11 however, is inconsistent as a number of items that define
each factor (cognitive, nonplanning and motor) load on other factors as well. The subscales of
motor and nonplanning have been the strongest and most consistently measured, however the
cognitive/attentional factor often fails to be identified as a distinct dimension from the other two
factors (Barratt, 1991; Patton et al., 1995; Ramirez & Andreu, 2006). It is proposed that the lack
of support for the cognitive dimension might result from an inability of participants to have the
insight into the characteristics of impulsivity (Ramirez & Andreu, 2006).

32
The reliability scores for each subscale of the BIS in the present study ranged from .45 for
attentional impulsivity, .54 for non-planning impulsivity and .67 for motor impulsivity. The
pattern and magnitude of these reliability scores is consistent with previous work conducted on
the BIS-11. Specifically, internal consistency of the motor impulsivity is generally higher than
the values for either the attentional or nonplanning subscales. The overall internal consistency for
the BIS-11 in the current sample was assessed at a Cronbach’s Alpha of .78.
2.3.3. Aggression Measures
2.3.3.1. Buss-Perry Aggression Questionnaire (BPAQ; Buss & Perry, 1992). The BPAQ is a
29-item self-report questionnaire, rated on a 5-point Likert scale. Respondents were asked to rate
each item on the degree to which that item describes them, from 1 = extremely uncharacteristic
of me to 5 = extremely characteristic of me. There are four subscales: physical aggression (PA, 9
items), verbal aggression (VA, 5 items), anger (AG, 7 items), and hostility (HT, 8 items).
The Buss-Perry Aggression questionnaire was developed from revisions of the Buss-Durkee
Hostility Inventory (BDHI; Buss & Durkee, 1957). Revisions addressed the inconsistent
findings and weak psychometric properties of the true-false format of the BDHI. In the original
BPAQ study, utilizing a sample of undergraduates, four subscales were distinct factors with
Cronbach’s alphas ranging from .72 verbal to .85 physical, and with an overall alpha of .85 (Buss
& Perry, 1992). Correlations of the BPAQ with peer rated aggression measures further support
the validity as the magnitude for the correlations ranged from .20 for verbal aggression to .45 for
physical aggression (Buss & Perry, 1992). Williams, Boyd, Cascardi and Poythress (1996)
examined the validity of the BPAQ and in an offender population. Results support concurrent
validity as positive correlations of .79 were reported between the Novaco’s Anger Scale and the
BPAQ.

33
Subsequent confirmatory factor analyses have confirmed the presence of four factors
specifically, physical aggression, verbal aggression, anger and hostility (Archer, Kilpatrick &
Bramwell, 1995; Berstin & Gesn, 1997). Comparing the BPAQ with the Aggression Inventory
(AI), the authors noted that the physical and verbal scales of the BPAQ correlated with similar
scales of the AI. Berstein and Gesn (1997) examined gender differences on the subscales and
reported that males tend to score higher than females on all scales, however the only significant
difference being for physical aggression.
Smith and Waterman (2006) were able to differentiate among violent, non-violent offenders
and undergraduates with the BPAQ. Specifically, violent offenders scored higher on the
subscales and the total BPAQ score, than non-violent offenders and undergraduates. Non-violent
offenders also scored higher on physical aggression and hostility than undergraduates.
Archer, Holloway and McLoughlin (1995) examined the link between physical aggression
and anger as measured by the BPAQ and the presence of a fight during the past 5 years. Results
indicated that those who had experienced a fight within the past 5 years scored higher on
physical aggression and anger subscales compared with those who had not experienced a fight.
The questionnaire has been developed and predominantly used on student populations,
however studies that have used it with inmate samples have reported acceptable levels of
reliability, as alphas range from .77 to .84 (Ireland & Archer, 2004; O’Connor, Archer, & Wu,
2001) (Appendix B). Within the present study, reliability values for the subscales of the BPAQ
were .66 verbal aggression, .69 anger, .76 physical aggression and .78 hostility. The overall
alpha level for the BPAQ was .89 indicating high internal consistency.

34
2.3.3.2. Impulsive/Premeditated Aggression Scales (IPAS; Stanford et al., 2003).
The IPAS is a 30-item self-report instrument to assess the impulsive and/or premeditated
characteristics associated with an individual’s aggression (Appendix C). Participants are asked to
recall their previous aggressive acts in the last 6 months and to score each item in relation to
these acts. Items are scored on a 5-point Likert scale from 1 – strongly disagree to 5 – strongly
agree. This measure was utilized as a secondary measure of aggression to classify individuals as
predominately impulsive or premeditated aggressive subtypes.
Classifying an individual’s behaviour as either premeditated or impulsive was based on
responses from 20 of the 30 items on the IPAS. There are eight items for impulsive (IA: 3, 5, 7,
8, 9, 21, 24, 26) aggression and 12 items for premeditated (PM: 1, 2, 6, 10, 11, 12, 14, 16, 17, 20,
29, 30) aggression. Endorsing either a strongly agree or agree on any of these items is rated as
positive, with the exception of items 5 and 8, which are reverse scored. A total number of
positive items and percentage is calculated for each subscale (IA and PM). Classification into
groups is determined by the category with the highest percentage of positively endorsed items. If
an individual scored the same percentage on both subscales they were not classified into either
group. In addition, to the classification of each participant as premeditated or impulsive, a total
mean score on each subscale was calculated.
Principal Component Analysis with varimax rotation has confirmed the two distinct factors of
aggression namely premeditated and impulsive subtypes (Stanford et al., 2003). Examining
group differences has suggested that premeditated aggressors have higher levels of hostility,
antisocial behaviour and higher levels of general aggression; whereas impulsive aggressors tend
to display higher levels of irritability. Concurrent validity has been supported with significant
35
relationships between related personality inventories (e.g. Life History of Aggression
Questionnaire and the State-Trait Anger Expression Inventory).
A number of studies have reported on the internal consistency of the IPAS. Specifically
Stanford et al., (2003) reported Cronbach’s alphas for the impulsive and premeditated subscales
of .77 and .82 respectively. Kockler, Stanford, Nelson, Meloy and Sanford (2006) reported
similar values of .81 and .72 respectively, providing further support for the homogeneity of the
subscale items. Within the present study, reliability values are lower relative to previous
literature for the impulsivity subscale with a value of .63; however they are comparable for the
premeditated component at an alpha of .74.
2.3.4. Social Problem Solving Measure
2.3.4.1. Social Problem Solving Inventory – Revised Short Form (SPSI–R:S; D’Zurilla, Nezu,
& Maydeu-Olivares 2000). The SPSI-R:S is a self-report questionnaire assessing one's social
problem solving skills. The measure is based on previous work by the same authors which
examine and assesses the major components of a theoretical model of social problem solving
(D’Zurilla & Nezu, 1982, 1999). The SPSI-R:S has five subscales, consisting of 25 items, scored
on a 5-point scale from not at all true of me to extremely true of me. Two of the scales measure
problem solving orientation, positive problem orientation (PPO) and negative problem
orientation (NPO); and three subscales measure problem solving styles – rational problem
solving (RPS), avoidance style (AS) and impulsivity/carelessness style (ICS). Two of the scales,
PPO and RPS, measure constructive problem solving and the remaining three scales, NPO, AS,
and ICS measure dysfunctional problem solving. By reverse scoring the dysfunctional scales and
adding the five subscales, a total social problem-solving scale was calculated. Utilizing the
normative data provided in the measures’ manual and based upon age, standard scores were

36
computed for each individual’s total score. This provides a standard score to allow for
comparison among groups.
Test-retest reliabilities for the SPSI-R:S scale are between .68 and .91 and alpha coefficients
and between .69 and .95 (D’Zurilla, Nezu, & Maydeu-Olivares, 2000). Validity of the SPSI-R is
supported by way of confirmatory factor analysis and correlations with other problem solving
measures and overlapping psychological constructs (D’Zurilla, Nezu & Maydeu-Olivares, 2000).
All analyses have upheld the validity of the SPSI-R as an assessment instrument. Alpha levels in
the present study provide further support for the reliability of the SPSI. The internal consistency
of the SPSI-R:S in the present study was good with an overall alpha level of .74. Cronbach’s
alpha levels of each subscale are as follows: avoidance style .77, negative problem orientation
.76, positive problem orientation .76, rational problem solving .67, and impulsivity/carelessness
style .66.
2.3.5. Alcohol Use and Dependency Measures
2.3.5.1. Short Alcohol Dependence Data Questionnaire (SADD; Davidson & Raistrick, 1986;
Raistrick et al., 1983). The SADD is a 15-item self-report questionnaire, rated on a 4-point scale,
which assesses the severity of an individual’s dependence on alcohol. The questions cover
various subjective, behavioural and psychobiological (i.e. withdrawal) aspects of dependency.
The maximum score is 45 with a score in the range of 0-9 considered low dependence, 10-19
medium dependence, and 20-45 high dependence (See Appendix F).
Construct validity of the SADD was supported; rho = .51, p <.05 in a sample of 127 British
outpatients (Davidson & Raistrick, 1986; Davidson, 1987). Support for the homogeneity of the
SADD has been provided by a factor analysis indicating its unidimensional nature (Davidson,
Bunting & Raistrick, 1989). Test-rest reliability was significant in a sample of incarcerated

37
young offenders r(44) = .87, p <.001 (McMurran, Hollin & Bowen, 1990). An overall
Cronbach’s alpha levels of .93 with the current sample provide strong support for the internal
consistency of the SADD.
2.3.5.2. Alcohol Use. Based on previous research by McMurran et al., (2002) participants
were asked the following questions based upon their experiences prior to their incarceration
while they were in the community:
1. How many days per week did you drink alcohol? 0-7 days
2. How many days per week did you drink more than five drinks?
3. How would you have rated yourself as a drinker: nondrinker, light, moderate, or a heavy
drinker? (See Appendix E).
The first two questions were assessed on an eight point scale from 0 days to 7 days. The final
question asked the participants to indicate their level of drinking as a nondrinker, light, moderate
or heavy drinker.
2.3.6. Impression Management
2.3.6.1. The Short Impression Management Scale From BIDR Version 6 (IM; Paulhus 1995).
The IM is a 12-item measure assessing Impression Management (IM) (Appendix G). High scores
on this scale indicate that the person is trying to present himself in a socially desirable manner or
in a more favourable light than he believes to be true, similar to a "lie" scale. Responses to the
scales are provided on a 7-point Likert type scale ranging from 1 = not true to 7 = very true.
With respect to reliability, Cronbach’s alpha for the IM in a sample of undergraduates was .75
and for prison inmates specifically the Cronbach’s alpha was .84. In the current study, the
reliability was considerably lower than much of the literature with an alpha level of .52. A

38
Spearman – Brown correction for the calculation of alpha was conducted as this 12 item version
is only 60% as long as the original (D.L. Paulhus, personal communication, October 19th, 2007).
After the correction, the alpha level was .68, a more acceptable level of internal consistency;
however still not as high as the original study conducted with undergraduates. Normative data
with male undergraduates support a mean of 2.93 (SD = 2.8). Results from the current study 3.87
(SD = .89) are significantly higher than the normative data, t(187) = -4.07, p <.001.
2.4. Research Design and Hypotheses
2.4.1. Hypothesis 1: It was hypothesized that high levels of impulsivity should be related to
greater levels of general aggression. To test this hypothesis a Pearson correlational analysis was
performed to assess the relationship between the total impulsivity score (BIS-11) and the total
score of the general measure of aggression (BPAQ).
2.4.2. Hypothesis 2: It was hypothesized that high levels of each impulsivity subtype should
be related to greater levels of general aggression. Correlations coefficients were computed
between each subscale of the BIS-11 (cognitive/attentional, nonplanning and motor) and the
general aggression measure (BPAQ).
2.4.3. Hypothesis 3: It was hypothesized that levels of impulsivity should be greater for those
individuals classified as exhibiting impulsive aggression than for those individuals classified as
exhibiting premeditated aggression. Correlations between general aggression, as measured by the
BPAQ and BIS were performed. Additionally, a t-test was conducted to compare the means of
impulsivity for each subtype of aggression, specifically impulsive and premeditated.
2.4.4. Hypothesis 4: It was hypothesized that lower levels of social problem solving should be
related to higher levels of impulsivity. The standard score of the SPSI-R:S was correlated with

39
total score on the BIS-11 in order to assess the relationship between social problem solving and
impulsivity.
2.4.5. Hypothesis 5: It was hypothesized that lower levels of social problem solving should be
related to higher levels of general aggression. Pearson correlation coefficients were calculated
between the standard score of the SPSI -R:S and the total score of the BPAQ.
2.4.6. Hypothesis 6: Higher levels of alcohol dependency should be related to higher levels of
general aggression. A total SADD score was calculated and correlated with the sum of the BPAQ
in order to assess the relationship between alcohol dependency and general aggression.
2.4.7. Hypothesis 7: Higher levels of alcohol dependency should be related to higher levels of
impulsivity. Pearson correlation coefficients were calculated between the total scores of the
BPAQ and the SADD.
2.4.8. Social Problem Solving as a Mediating Variable. Utilizing Baron and Kenny’s (1986)
method to assess mediation, three separate regression analyses were conducted. The proposed
mediator in this study was social problem solving, as it was predicted to mediate the relationship
between impulsivity and aggression. The first step was to assess if the independent variable (IV)
was related to the proposed mediator. The mediator, in this case being social problem solving,
was regressed onto the IV, impulsivity. The second regression analysis involved assessing if the
IV: impulsivity was related to the dependent variable (DV: aggression). The final step involved
regressing aggression on both the impulsivity and the proposed mediator, social problem solving.
Having conducted these analyses, an examination of the regression coefficients indicates the
presence of a mediator. Specifically, if a mediator is present, the coefficient for the relationship
between the IV and DV will be significantly reduced when the mediator is present. The Sobel
40
test was utilized to determine if the indirect effect of impulsivity on aggression via social
problem solving was significant (Baron & Kenny, 1986).
2.4.9. Exploratory analyses of Impulsivity as a Mediating Variable. Additional regression
analyses were conducted to investigate the role of impulsivity as mediator in its relationship to
aggression. These analyses were conducted post hoc on account of the results of the study and
are therefore exploratory. The following regression analyses were conducted: a) regress
impulsivity (mediator) on social problem solving (IV); (b) regress aggression (DV) on social
problem solving (IV) and (c) regress aggression (DV) on social problem solving (IV) and
impulsivity (mediator).
2.4.10. Model of Aggression. Formulated from an extensive review of literature on aggression
and its influences, the aforementioned hypotheses provided the foundation for a testable model
of aggression (Figure 2.1). Path Analysis is a variation of multiple regression that allows for the
examination of hypothesised causal pathways among multiple variables (Stage, Carter & Nora,
2004). The goal of the analysis is to estimate the magnitude and significance of relationships
among variables by assessing the fit of the variance-covariance matrix of the proposed model. A
path diagram was developed in AMOS (Analysis of Moment Structures; Arbuckle 1999) version
6.0. Path analysis was used to test the overall model of aggression as well as the specified causal
paths derived from literature on aggression and its influences. In evaluating the fit of the model,
five goodness of fit indices were used, Comparative Fit Index, CFI; Normed Fit Index, NFI;
Root Mean Squared Error of Approximation, RMSEA, Akaike Information Criterion, AIC;
Standardized Room Mean Square Residual, SRMR) in addition to the χ2 statistic.

41
Figure 2.1. Proposed Path Analysis model of Aggression
Impulsivity SPSI
Aggression
Alcohol
e1
e2
e3

42
CHAPTER 3 RESULTS
3.1. Assumptions
3.1.1. Outliers/Normality
Prior to the statistical examination of each hypothesis, the raw data were inspected for
statistical outliers and normality of distribution. All data was entered and analysed in SPSS
(Statistical Package for the Social Sciences) version 15.0. A summary of the normality and
kurtosis for the raw data, transformed data and data following the removal of univariate and
multivariate outliers is presented in Table 3.1.
The first step in screening the data was to examine each measure for outliers. Standardized
scores for each measure were calculated for each of the 185 cases. Z scores of 3.29 or greater
indicated an outlier. In total, there were 3 cases identified as univariate outliers. Subsequently
individuals identified as outliers were removed from the dataset as they represented extreme
scores. Additionally, one participant was removed for an invalid response pattern. This case had
a preponderance of responses at either the lower end or the upper end of the scales on several of
the measures.
Results of a regression analysis, with a p < .001 criterion for Mahalanobis distance, screened
for the presence of multivariate outliers. Two outliers were detected, deleted and excluded from
further analyses, leaving 179 cases for analysis.
The variable BIS was normally distributed zs = -0.82, p = 0.412, with negative kurtosis zk = -
1.98, p = 0.048 at the p <.05 level.
43
The IPAS: IA variable was normally distributed zs = 1.76, p = 0.078 with normal kurtosis zk =
0.08 p = 0.936.
The IPAS: PM variable was normally distributed zs = -1.58, p = 0.114, with normal kurtosis zk
= 1.36, p = 0.174.
The variable SPSI was normally distributed zs = 0.88, p = .379, with normal kurtosis zk = 0.30,
p = 0.764.
The IM variable was normally distributed zs = 0.46, p = 0.646, with normal kurtosis zk =
-0.72, p = 0.472.
The SADD variable was normally distributed zs = 1.52, p = 0.129, with slightly negative
kurtosis zk = -2.23, p = 0.026 at the p <.05 level.
The dependent variable BPAQ was found to be slightly skewed, zs = -1.96, p = 0.05 with
normal kurtosis zk = -0.58, p = 0.562. Although this is a conservative indication of skewness
examining the detrended normal plot and the normal probability plot of the BPAQ confirmed the
slightly negative distribution. In order to achieve normality, the BPAQ variable was reflected
and a Square Root transformation was conducted. After the transformation, the variable was
reflected back to ease with interpretation. Normality was achieved zs = -0.53, p = 0.521 and
kurtosis remained within normal range zk = -0.33, p = 0.629. Note that BPAQTR was used for all
subsequent analyses as no differences were present between the results with the raw or
transformed variables. Correlational results with the untransformed BPAQ and all other variables
are listed in Appendix I.
In terms of the demographic characteristics of the 6 outliers: 3 out were from Saskatoon
Correctional Centre, 3 from Prince Albert Correctional Centre; 4 were Aboriginal, 1 was
Caucasian and 1 ethnicity was unknown.

44
Normality was reassessed following the removal of the 6 outliers and the transformation of
the BPAQ. Refer to Table 3.1 for a summary of normality for the raw data, transformed data and
data upon removing the outliers. After the removal of the outliers both BIS and SADD were
negatively kurtotic at the p <.05 level, zk = -1.98, p = 0.048 and zk = -2.23, p = 0.026
respectively. However, both values were normally distributed and the sample size is relatively
large which diminishes the effect of the underestimation usually associated with negative
kurtosis. Therefore, no further transformations were conducted (Tabachnick & Fidell, 2001) and
all subsequent analyses were performed on the transformed variables.

45
Table 3.1
Summary of skewness and kurtosis for raw and transformed variables
zs p
zk
p
Num. of Outliers
Raw Data Aggression BPAQ -2.01* .044 -0.07 .484 0
Impulsivity BIS -0.50 .617 -0.93 .352 2
Alcohol Dependency SADD 2.36* .018 -1.65 .099 0
Social Problem Solving SPSI – R:S 1.61 .107 1.99* .047 1
Impulsive Aggression IPAS: IA -1.63 .103 1.09 .276 1
Premeditated Aggression IPAS: PM -2.11* .035 1.32 .187 1
Impression Management IM 0.08 .934 -0.47 .638 1
With Outliers
Removed
Aggression BPAQ -1.96* .050 -0.58 .562 0
Impulsivity BIS -0.82 .412 -1.98* .048 0
Alcohol Dependency SADD 1.52 .129 -2.23* .026 0
Social Problem Solving SPSI – R:S 0.88 .379 0.30 .764 0
Impulsive Aggression IPAS: IA 1.76 .078 0.08 .936 0
Premeditated Aggression IPAS: PM -1.58 .114 1.36 .174 0
Impression Management IM 0.46 .646 -0.72 .472 0
Reflected & Square Root
Aggression BPAQ TR -0.53 .521 -0.33 .629 0
*z-score significantly differs from 0, p <. 05, indicating skewness or kurtosis in the distribution.

46
3.1.2. Multicollinearity
Multicollinearity does not appear to be a concern as the Pearson correlation coefficients for all
measures are below the .70 level suggested by Tabachnick and Fidell, (2001).
3.2. Scale Properties and Intercorrelations among Measures
The means and standard deviations of each measure and relevant subscales are reported for all
participants in Table 3.2. A range of possible scores for each measure is included in order to
assess the overall extent of endorsement for each construct.
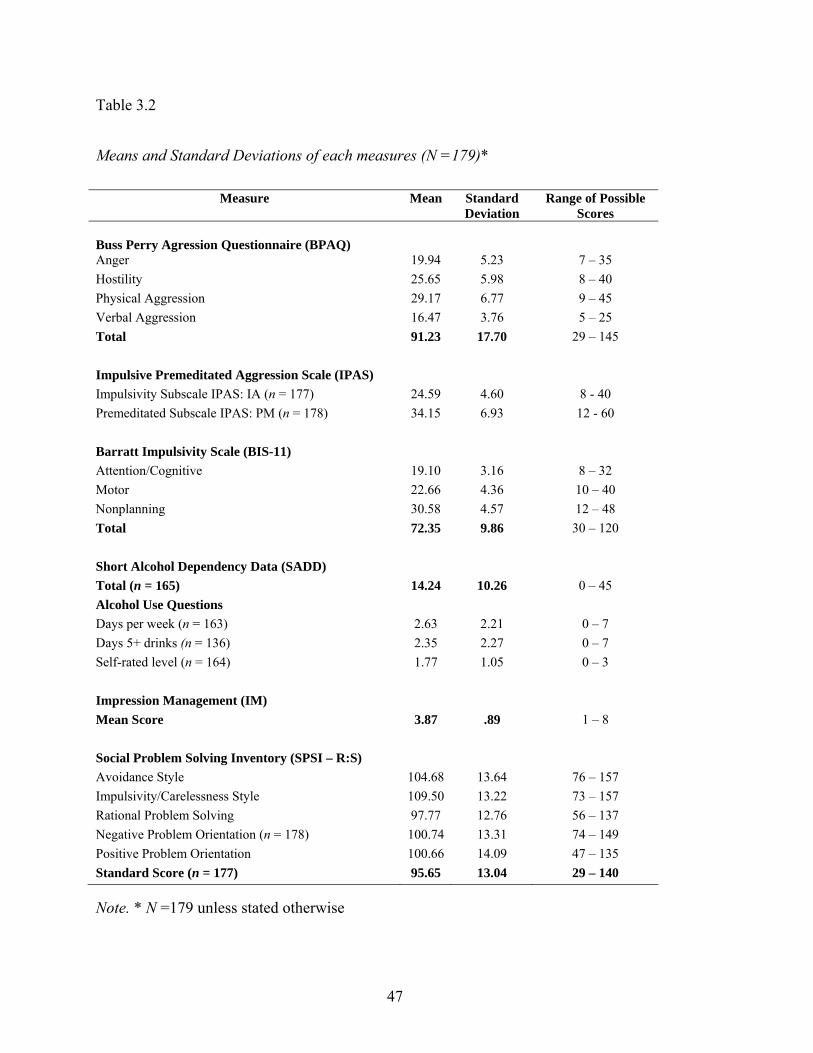
47
Table 3.2
Means and Standard Deviations of each measures (N =179)*
Note. * N =179 unless stated otherwise
Measure Mean Standard Deviation
Range of Possible Scores
Buss Perry Agression Questionnaire (BPAQ)
Anger 19.94 5.23 7 – 35 Hostility 25.65 5.98 8 – 40 Physical Aggression 29.17 6.77 9 – 45 Verbal Aggression 16.47 3.76 5 – 25 Total 91.23 17.70 29 – 145 Impulsive Premeditated Aggression Scale (IPAS) Impulsivity Subscale IPAS: IA (n = 177) 24.59 4.60 8 - 40 Premeditated Subscale IPAS: PM (n = 178) 34.15 6.93 12 - 60 Barratt Impulsivity Scale (BIS-11) Attention/Cognitive 19.10 3.16 8 – 32 Motor 22.66 4.36 10 – 40 Nonplanning 30.58 4.57 12 – 48 Total 72.35 9.86 30 – 120 Short Alcohol Dependency Data (SADD) Total (n = 165) 14.24 10.26 0 – 45 Alcohol Use Questions Days per week (n = 163) 2.63 2.21 0 – 7 Days 5+ drinks (n = 136) 2.35 2.27 0 – 7 Self-rated level (n = 164) 1.77 1.05 0 – 3 Impression Management (IM) Mean Score 3.87 .89 1 – 8 Social Problem Solving Inventory (SPSI – R:S) Avoidance Style 104.68 13.64 76 – 157 Impulsivity/Carelessness Style 109.50 13.22 73 – 157 Rational Problem Solving 97.77 12.76 56 – 137 Negative Problem Orientation (n = 178) 100.74 13.31 74 – 149 Positive Problem Orientation 100.66 14.09 47 – 135 Standard Score (n = 177) 95.65 13.04 29 – 140

48
Intercorrelations among each of the measures are presented in Table 3.3. The impression
management scale (IM) significantly correlated with the aggression measure (BPAQTR),
impulsive aggression scale (IPAS: IA), premeditated aggression scale (IPAS: PM), impulsivity
scale (BIS) and social problem solving measure (SPSI – R:S).
Impression management was controlled for despite its low reliability as its overall mean was
high relative to normative data and it significantly correlated with a number of measures. In
order to eliminate the influence of IM on each of these variables regression analyses were
conducted. The following regression analyses were conducted:
1) BPAQ TR was regressed on IM;
2) IPAS:IA regressed on IM;
3) IPAS: PM on IM;
4) BIS on IM and;
5) SPSI on IM.
The standardized residuals from these analyses were then considered as the adjusted BPAQZRES
TR, BISZRES, IPAS: IAZRES, IPAS: PMZRES and SPSIZRES scores and used in each subsequent
analysis. Table 3.4 reports the intercorrelations among measures after controlling for IM. Refer
to Appendix J for regression results.

49
Table 3.3
Pearson Correlation Coefficients Among Variables (N =179)
Aggression BPAQ TR
Impulsivity
BIS
Alcohol
Dependency SADD
Social Problem Solving
SPSI
Impulsive
Aggression IPAS: IA
Premeditated Aggression IPAS: PM
Aggression BPAQ TR
--
Impulsivity
BIS .461** --
Alcohol
Dependency SADD
.207** .231** --
Social
Problem Solving
SPSI
-.350** -.571** -.369** --
Impulsive
Aggression IPAS: IA
.530** .379** .339** -.500** --
Premeditated Aggression IPAS: PM
.490** .391** .177* -.321** .364** --
Impression
Management IM
-.253** -.190* .018 .152* -.158* -.169*
Note. * p < .05 ** p < .01
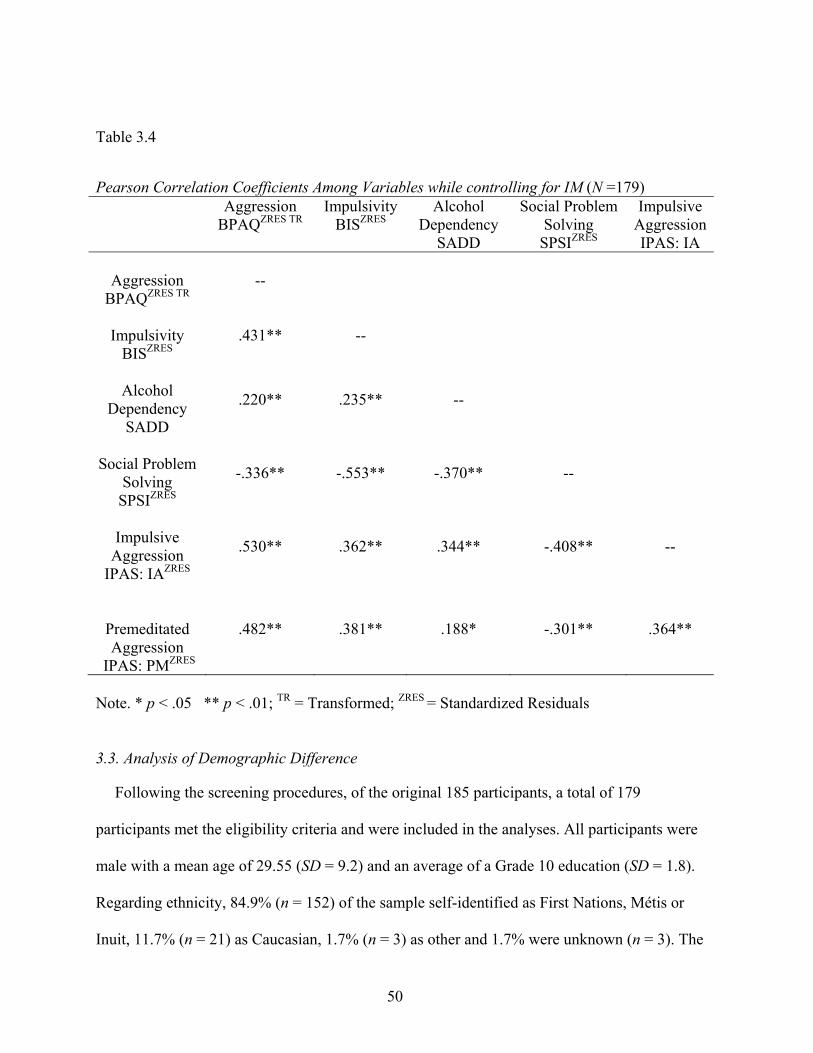
50
Table 3.4
Pearson Correlation Coefficients Among Variables while controlling for IM (N =179) Aggression
BPAQZRES TR Impulsivity
BISZRES Alcohol
Dependency SADD
Social Problem Solving
SPSIZRES
Impulsive Aggression IPAS: IA
Aggression
BPAQZRES TR --
Impulsivity
BISZRES .431** --
Alcohol
Dependency SADD
.220** .235** --
Social Problem
Solving SPSIZRES
-.336** -.553** -.370** --
Impulsive
Aggression IPAS: IAZRES
.530** .362** .344** -.408** --
Premeditated Aggression
IPAS: PMZRES
.482** .381** .188* -.301** .364**
Note. * p < .05 ** p < .01; TR = Transformed; ZRES = Standardized Residuals
3.3. Analysis of Demographic Difference
Following the screening procedures, of the original 185 participants, a total of 179
participants met the eligibility criteria and were included in the analyses. All participants were
male with a mean age of 29.55 (SD = 9.2) and an average of a Grade 10 education (SD = 1.8).
Regarding ethnicity, 84.9% (n = 152) of the sample self-identified as First Nations, Métis or
Inuit, 11.7% (n = 21) as Caucasian, 1.7% (n = 3) as other and 1.7% were unknown (n = 3). The

51
sample was collected from two provincial correctional centres in Saskatchewan, Canada. These
facilities included the Prince Albert Correctional Centre (PACC; n = 128; 71.5%) and the
Saskatoon Correctional Centre (SCC; n = 51; 28.5%).
For each measure, independent t-tests were conducted in order to determine whether
differences were present with respect to ethnicity. Table 3.5 displays the means, standard
deviations and results of these analyses. Differences were observed between Aboriginal and non
Aboriginal participants with respect to scores on the alcohol measures. Specifically, Aboriginal
offenders indicated a higher self-identified level of alcohol use t(172) = 3.32, p = .001; and
scored higher on the SADD indicating a higher level of alcohol dependency t(172) = 2.39, p =
.018. Aboriginal participants also scored higher on the IM scale t(171) = 2.04, p = .043.
Bonferroni corrections for the significance levels were utilized as multiple comparisons were
conducted (Howell, 2002). The adjusted alpha level was determined by dividing the alpha level
by the number of comparisons performed in the current study. After adjusting the significance
levels, only the difference between Aboriginal and non Aboriginal offenders on self-identified
level of alcohol use was significant.
Similarly, independent t-tests were conducted to examine potential differences on each
measure by institution. The means, standard deviations and results of these analyses are
presented in Table 3.6. Offenders incarcerated at the PACC indicated a higher self-identified
level of alcohol use t(80.1) = -2.94, p = .005; greater number of days per week of alcohol
consumption t(173) = -2.23, p = .027; greater number of days per week consuming more than 5
drinks t(144) = -2.02, p = .045 and higher on the SADD, indicating an elevated level of alcohol
dependency t(175) = -2.63, p = .009. The sample from SCC exhibited lower levels of impulsive
aggression as assessed by the IPAS: IA t(158) = -2.72, p = .007. Again, Bonferroni corrections
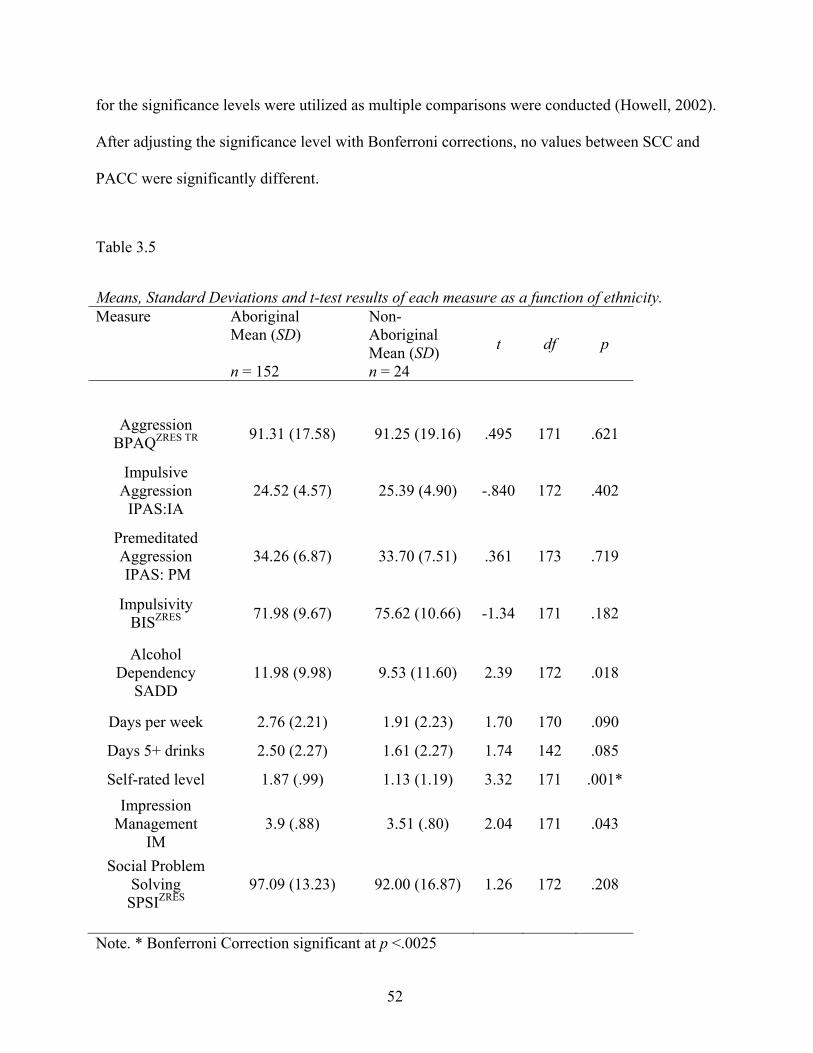
52
for the significance levels were utilized as multiple comparisons were conducted (Howell, 2002).
After adjusting the significance level with Bonferroni corrections, no values between SCC and
PACC were significantly different.
Table 3.5
Means, Standard Deviations and t-test results of each measure as a function of ethnicity. Measure Aboriginal
Mean (SD) n = 152
Non-Aboriginal Mean (SD) n = 24
t df p
Aggression BPAQZRES TR 91.31 (17.58) 91.25 (19.16) .495 171 .621
Impulsive Aggression
IPAS:IA 24.52 (4.57) 25.39 (4.90) -.840 172 .402
Premeditated Aggression IPAS: PM
34.26 (6.87) 33.70 (7.51) .361 173 .719
Impulsivity BISZRES 71.98 (9.67) 75.62 (10.66) -1.34 171 .182
Alcohol Dependency
SADD 11.98 (9.98) 9.53 (11.60) 2.39 172 .018
Days per week 2.76 (2.21) 1.91 (2.23) 1.70 170 .090
Days 5+ drinks 2.50 (2.27) 1.61 (2.27) 1.74 142 .085
Self-rated level 1.87 (.99) 1.13 (1.19) 3.32 171 .001* Impression
Management IM
3.9 (.88) 3.51 (.80) 2.04 171 .043
Social Problem Solving
SPSIZRES 97.09 (13.23) 92.00 (16.87) 1.26 172 .208
Note. * Bonferroni Correction significant at p <.0025

53
Table 3.6
Means, Standard Deviations and t-test results of each measure as a function of institution. Measure SCC
Mean (SD) n = 51
PACC Mean (SD) n = 128
t df p
Aggression BPAQZRES TR
92.00 (17.98) 90.93 (17.64) .109 174 .914
Impulsive Aggression
IPAS:IA
23.22 (4.79) 25.13 (4.42) -2.52 172 .013
Premeditated Aggression IPAS: PM
33.66 (6.94) 34.34 (6.94) -.848 173 .398
Impulsivity BISZRES
73.31 (9.80) 71.96 (9.89) .778 174 .438
Alcohol Dependency
SADD
11.04 (10.99) 15.49 (9.72) -2.63 158 .009
Days per week 2.06 (2.40) 2.83 (2.09) -2.23 173 .027
Days 5+ drinks 1.81(2.27) 2.61 (2.24) -2.02 144 .045
Self-rated level 1.39 (1.15) 1.92 (.964) -2.89 80.10 .005
Impression Management
IM
3.78 (.88) 3.90 (.89) -.784 174 .434
Social Problem Solving
SPSIZRES
96.20 (14.22) 95.43 (12.58) .345 172 .731
Note. * Bonferroni Correction significant at p <.0025 Note: a Levene’s test for Equality of Variances significant; equal variances not assumed.
Pearson correlational analyses were performed to assess the intercorrelations among each
variable and to test Hypotheses 1 to 7. Refer to Table 3.4 for a correlation matrix.

54
3.4. Hypotheses
3.4.1. Hypothesis 1: High levels of impulsivity should be related to high levels of general
aggression.
The Buss Perry Aggression Questionnaire (BPAQ) was used to assess one’s level of general
aggression. Impulsivity was measured from the total score of the Barratt Impulsivity Scale (BIS
– 11). As predicted, a significant positive correlation was found between impulsivity and general
aggression (r = .431, p < .001) indicating a moderate relationship between these variables. This
hypothesis was further supported with the raw correlation results between BIS and BPAQ
without controlling for impression management (r = .461, p < .001).
3.4.2. Hypothesis 2: Increased levels of impulsivity subtypes should be related to greater
levels of general aggression.
Subtypes of impulsivity include motor, nonplanning and attention/cognitive as measured by
the BIS-11. Utilizing the original subscales of the measure, each subscale was found to have a
positive relationship with general aggression, motor impulsivity (r = .436, p < .001);
nonplanning (r = .253, p < .001) and attention/cognitive impulsivity (r = .297, p < .001).
As reported in the previous chapter, the reliability scores for each of the BIS subscales were
.45 for cognitive/attentional impulsivity, .54 for non-planning impulsivity and .67 for motor
impulsivity. The pattern of the reliability scores is consistent with previous work conducted on
the BIS-11, however the levels of internal consistency are low. Specifically, internal consistency
of the motor impulsivity is generally higher than the values for either the attentional or
nonplanning subscales. Previous literature has reported inconsistent findings with respect to the
number of items that define each factor. Generally speaking, the motor and nonplanning
55
subscales have consistently been measured, however the cognitive/attention subscale often fails
to be identified as a distinct dimension as it tends to load on the other two factors (Barratt, 1991;
Patton et al., 1995; Ramirez & Andreu, 2006).
As a result of the poor reliability measures within the subscales of the BIS and on account of
the inconsistent factor structures presented in the literature, a series of factor analysis were
conducted to assess the underlying factor structure of the measure within this sample. Principal
axis factor analysis with oblimin rotation was conducted to assess the underlying structure of the
30 items of the BIS-11. A four factor model was chosen, based on the initial exploratory analysis
and scree plot. Other criteria considered in choosing the number of factors included:
a) examining the size and amount of residuals between the observed and reproduced
correlations, the four factor results reported 33% of non-redundant residuals with
absolute values greater than .05;
b) examining the number of complex items as the four factor results had no items greater
than .30 loading on more than one factor;
c) and examining the amount of variance as the factor model accounted for 29% of total
variance
Table 3.7 displays each item and their factor loadings. Loadings with less than .30 were
omitted for clarity. The first factor grouped items relating to behavioural impulsivity. Most of the
items in this factor are from the original motor impulsivity subscale; however, two items are
from each of the original cognitive/ attention and nonplanning subscales. The second factor
grouped items related to cognitive aspects of impulsivity and was comprised of 6 items.
However, only two of these items have loading above .40. The third factor, grouped items related

56
to nonplanning and was comprised of 3 items. The fourth factor grouped items related to
controlled or cautious behaviour and was comprised of 10 items.
The between-factor correlations were low to moderate ranging from .088 to .285. The highest
correlations were found between the first and second factor and the first and fourth factor as they
were .245 and .238 respectively. The lowest correlations were found between the second and
third factor and the second and fourth factor as they were .089 and -.081 respectively.
Having determined the factor structure of the BIS- 11 within this sample, the reliability for the
4 factors were examined. Question 19, ‘I am a steady thinker’, in factor 2, had a large negative
loading of -.71. This item was reversed scored in the reliability analysis. Cronbach’s alpha for
Factor 1 was .76, Factor 2 .64, Factor 3 .44, and Factor 4 .63.
The factor analysis results do not support the original factor structure of the BIS-11 with three
subscales of motor, nonplanning and cognitive/attention impulsivity (Patton et al., 1995). Nor do
they fully support previous findings suggesting that attention/cognitive subscale loads onto the
motor and nonplanning subscales (Luengo et al. 1991; Patton et al., 1995). Taken together this
suggests that any results regarding the subscales should be interpreted with caution as the
underlying structure was not supported.

57
Table 3.7
Factor Loading for the Rotated Factors of the BIS-11
Item
Factor Loadings
Orignal Subscale 1 2 3 4
I am restless at lectures or talks .574 MotorI buy things on impulse .566 Motor I act on impulse .552 Motor I get easily bored when solving thought problems .540 AttnI act on the spur of the moment .514 Motor I say things without thinking .480 Motor I find it hard to sit still for long periods of time .467 Motor I spend or charge more than I earn .356 Nonplan I talk fast .312 Motor I am a steady thinker -.712 Attn I walk and move fast .590 Motor I solve problem by trial and error .384 Attn I am more interested in the present than the future .382 Nonplan I have racing thoughts .354 Attn I change where I live .316 Nonplan I have outside thoughts when thinking Attn I change jobs .494 Nonplan I do things without thinking .447 Motor I finish what I start .404 Nonplan I am self-controlled .574 Motor I concentrate easily .562 Attn I am a careful thinker .523 Attn I save regularly .490 Nonplan I plan tasks carefully .480 Nonplan I am happy-go-lucky -.451 Nonplan I plan trips well ahead of time .398 Nonplan I plan for job security .389 Nonplan I have regular medical/dental checkups .361 Nonplan I like to think about complex problems .350 Attn I plan for the future Nonplan Eigenvalues 4.89 3.01 1.71 1.64 % of variance 13.99 8.00 3.37 3.23
Note. Loadings <.30 are omitted.

58
3.4.3. Hypothesis 3: Levels of impulsivity should be greater for those individuals classified as
exhibiting impulsive aggression than for those classified as exhibiting premeditated
aggression.
Classification of aggression subtypes was assessed by the Impulsive Premeditated Aggression
Scale (IPAS). Correlations between general aggression, as measured by the BPAQ and BIS, were
significant for the predominately impulsive aggression group (r = .448, p < .001) and
predominately premeditated aggression group (r = .398, p = .001). An independent t-test
indicates a nonsignificant difference on impulsivity level between the impulsive, M = 71.86 (SD
= 10.53) and premeditated subtypes, M = 73.14 (SD = 9.08) t(156.6) = -.758, p = .450.
A number of exploratory analyses were conducted with respect to group differences
between impulsive aggressors and premeditated aggressors. Upon examining the correlations
between IPAS subscales in Table 3.3, it noteworthy to report that a significant correlation
between the impulsive aggression and premeditated subscales (r = .364, p < .001; Table 3.3).
This indicates that the subscales are partially confounded. As a result of this finding, partial
correlations were conducted for each subtype of aggression with impulsivity controlling for the
other subtype of aggression. Partially out the effect of premeditated aggression in the relationship
between impulsive aggression and impulsivity decreased the correlation from r = .353, p < .001
to r = .265, p < .001. Although the magnitude decreased, the relationship remained significant.
Similarly, partially out the effect of impulsive aggression in the relationship between
premeditated aggression and impulsivity lowered the magnitude of the correlation from r = .378,
p < .001 to r = .294, p < .001. Although the magnitude decreased, the relationship remained
significant.

59
In exploring aggression subtypes and alcohol use, in general it appears that levels of
alcohol dependency were moderate for both subtypes and no significant differences were present
between groups on SADD scores; impulsive aggressors M = 15.15 (SD = 10.03), premeditated
aggressors M = 13.05 (SD = 10.43), t(160) = 1.3, p = .197. There were however, differences
between groups with respect to the following items: number of days per weeks that alcohol was
consumed; impulsive aggressors M = 2.94 (SD = 2.23), premeditated aggressors M = 2.24 (SD =
1.99), t(158) = 2.02, p = .045; number of days per week that more than five drinks were
consumed impulsive aggressors M = 2.72 (SD = 2.33), premeditated aggressors M = 1.89 (SD =
2.04), t(126.1) = 2.18, p = .031; self reported level of drinking impulsive aggressors impulsive
aggressors M = 1.93 (SD = .99), premeditated aggressors M = 1.57 (SD = 1.07), t(160) = 2.15, p
= .035 with the impulsive aggressors scoring higher on all three measures.
3.4.4. Hypothesis 4: Lower levels of social problem solving should be related to higher levels
of impulsivity.
The Social Problem Solving Inventory – Short Form (SPSI-R:S) was used to assess one’s
level of social problem solving ability. Impulsivity was measured from the total score of the
Barratt Impulsivity Scale (BIS–11). As predicted, a significant negative correlation was found
between impulsivity and social problem solving ability (r = -.553, p < .001) indicating a
moderate relationship between these variables. This hypothesis was further supported by the raw
correlation results between SPSI-R:S and BIS without controlling for impression management (r
= -.571, p < .001).
The SPSI – R:S has an Impulsivity/Carelessness subscale, therefore a partial correlation
between social problem solving and impulsivity while controlling for this subscale was

60
performed. The correlation remained significant, however was lower in magnitude (r = -.350, p <
.001).
3.4.5. Hypothesis 5: Lower levels of social problem solving should be related to higher levels
of general aggression.
As predicted, a significant negative correlation was found between general aggression, as
measured by the BPAQ, and social problem solving ability (r = -.336, p < .001). This hypothesis
was further supported with the raw correlation results between SPSI-R:S and BPAQ without
controlling for impression management (r = -.350. p < .001).
3.4.6. Hypothesis 6: Higher levels of alcohol dependency should be related to higher levels of
general aggression.
A significant positive correlation was found between general aggression and alcohol
dependency as assessed by the Short Alcohol Dependency Data (SADD) (r = .220, p = .004).
This hypothesis was further supported with the raw correlation results between SADD and
BPAQ without controlling for impression management (r = .207, p = .006).
3.4.7. Hypothesis 7: Higher levels of alcohol dependency should be related to higher levels of
impulsivity.
As hypothesized, a significant positive relationship was found between impulsivity and
SADD (r = .235, p = .004). This hypothesis was further supported with the raw correlation
results between BIS and SADD without controlling for impression management (r = .231, p <
.002). Figure 3.1 provides a summary of the relationships between each variable in the study.
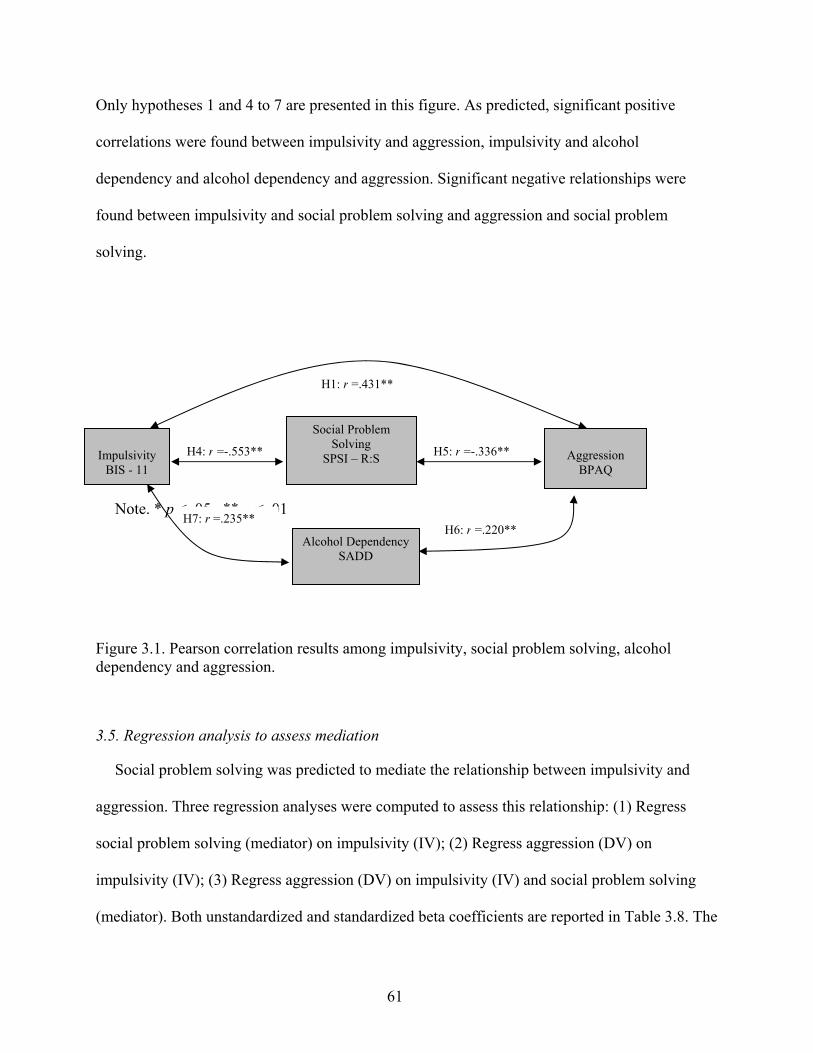
61
Only hypotheses 1 and 4 to 7 are presented in this figure. As predicted, significant positive
correlations were found between impulsivity and aggression, impulsivity and alcohol
dependency and alcohol dependency and aggression. Significant negative relationships were
found between impulsivity and social problem solving and aggression and social problem
solving.
Note. * p < .05 ** p < .01
Figure 3.1. Pearson correlation results among impulsivity, social problem solving, alcohol dependency and aggression.
3.5. Regression analysis to assess mediation
Social problem solving was predicted to mediate the relationship between impulsivity and
aggression. Three regression analyses were computed to assess this relationship: (1) Regress
social problem solving (mediator) on impulsivity (IV); (2) Regress aggression (DV) on
impulsivity (IV); (3) Regress aggression (DV) on impulsivity (IV) and social problem solving
(mediator). Both unstandardized and standardized beta coefficients are reported in Table 3.8. The
Impulsivity
BIS - 11
Social Problem Solving
SPSI – R:S
Aggression BPAQ
Alcohol Dependency SADD
H4: r =-.553**
H7: r =.235**
H5: r =-.336**
H6: r =.220**
H1: r =.431**

62
unstandardized coefficients are reported within the text as the Sobel test is calculated with the
unstandardized values.
Examination of the coefficients for the first regression analyses in Table 3.8 indicate that
impulsivity is significantly related to the hypothesized mediator, social problem solving b = -
.549, p <.001. Investigating the second regression analysis, impulsivity is a significant predictor
of the dependent variable, aggression b = .422, p <.001. The third analyses indicates that social
problem solving is not a significant predictor of aggression over and above impulsivity, b = -
.132, p = .107 a requirement if it was to act as a mediator in this relationship. The original Beta
weight value between impulsivity and aggression was .422 (p <.001) however, when controlling
for social problem solving the relationship decreased to .352 (p <.001). Although this does
indicate that the relationship between impulsivity and aggression was reduced when controlling
for social problem solving, results from the Sobel statistic indicate that the relationship remained
significant and its value was not greatly reduced. See Table 3.8. Therefore, the hypothesis was
not supported for social problem solving acting as a mediator in this relationship.

63
Table 3.8
Regression Analyses to assess the role of Social Problem Solving (SPSI) as a mediator with Aggression (BPAQ), and Impulsivity (BIS) (N =179)
Regression Analyses b SE β
t p
1. Social Problem Solving on Impulsivity
-.549
.063
-.553 -8.71 <.001**
2. Aggression on Impulsivity
.422
.068
.424 6.17 <.001**
3. Aggression on Impulsivity
and Social Problem Solving
.352 -.132
.081
.081
.359 -.133
4.37 -1.62
<.001** .107
Sobel Statistic -- --
--
-1.58 .115
Note. b = unstandardized regression coefficient; SE = Standard error of unstandardized regression coefficients; β = standardized regression coefficient Note. * p < .05 ** p < .01 3.6. Path analysis of model
In the present study, four different models of aggression were evaluated for the best fit.
Specifically, 1) the proposed model with the full sample; 2) the proposed model with the
Aboriginal subsample; 3) the post hoc model with the full sample and; 4) the post hoc model
with the Aboriginal subsample were assessed. Aboriginal offenders were examined as a
subsample as this group comprised the majority of the sample. T-test results revealed differences
between Aboriginal and non Aboriginal offenders on a number of measure. Conducing a path
analysis with this subsample examined whether group differences were affecting the relationship
among variables. Path Analysis in AMOS 6 (Arbuckle, 2005) was used to test the overall model

64
of general aggression as well as the specified causal paths derived from literature on aggression
and its influences. The first model, as depicted in Figure 3.2, examined the relationships
between impulsivity, social problem solving, alcohol dependency and general aggression. Within
path analysis, variables are commonly depicted by rectangles as they are observed or measured
variables rather than latent constructs. All path coefficients are standardized beta weights with
ranges in value from -1 to 1.
To begin, in the proposed model with the complete sample, impulsivity directly affects
general aggression b = .33, p <.001. Impulsivity also predicts social problem solving b = -.57, p
<.001; however, social problem solving does not significantly predict aggression b = -.11, p
=.20. Similar results are seen with impulsivity, alcohol dependency and aggression. That is,
impulsivity predicts alcohol dependency b = .23, p = .002; however, alcohol dependency does
not significantly predict aggression b = .10, p = .15. Results from this model confirm what has
previously been determined from the multiple regression analyses. That is, social problem
solving does not act as a mediator in this model of aggression as pathways between social
problem solving and aggression are not significant. Furthermore, the direct pathway between
impulsivity and aggression was significant. If social problem solving was to act as a mediator in
this relationship we would expect this pathway to be weak as social problem solving would
account for much of the relationship.

65
Note. * p < .05 ** p < .01
Figure 3.2. Path analysis results for proposed model of aggression in complete sample n = 179
With respect to the overall fit of the model, results suggest an approximate fit of the data
χ2 (1, n = 172) = 16.69, p < .001; CFI = .95; NFI = .95; AIC = 42.65; RMSEA = .300,
RMSEALO = .185, RMSEAHI = .434; and SRMR = .067. The NFI, CFI and SRMR indices
suggest an acceptable fit of the data with values over .90 for the NFI, .95 for the CFI and a value
of SRMR close to zero. However, both the χ2 and RMSEA fail to support a good fit for the data
as the χ2 is significant and the RMSEA value is greater than .05. The χ2 however, is sensitive to
large sample sizes; therefore, this result is expected due to the moderately sized sample in the
present study. With respect to the RMSEA values, reasonable models have levels <.05 with a
lower confidence interval below .05 and a higher interval cut-off of .10. The current sample was
not successful in achieving a reasonable fit with respect to the RMSEA; however, this index is
Impulsivity .32
SPSI
.19
Aggression
.05
Alcohol
.23*
-.57** -.11
.10
e1
e2
e3
.33**

66
classified as a noncentrality based index and is a function of chi-square, df and N which may
result in a biased estimate.
Overall, the model accounts for 19% of the variance in general aggression. As mentioned
above, impulsivity is the only significant determinant of general aggression in this model, as
social problem solving and alcohol dependency are not direct determinants of general
aggression.
Note. * p < .05 ** p < .01
Figure 3.3. Path analysis results for proposed model of aggression in Aboriginal subsample n = 146
Generally speaking, results with the Aboriginal subsample are similar to the results with the
complete sample. Specifically, impulsivity directly affects general aggression b = .36, p < .001;
and social problem solving b =-.55, p < .001; however, social problem solving does not
significantly predict aggression b = -.12, p = .172;. Similarly, impulsivity predicts alcohol
Impulsivity .30
SPSI
.24
Aggression
.09
Alcohol
.30**
-.55** -.12
.13
e1
e2
e3
.36**
67
dependency b = .30, p < .001. However alcohol dependency does not significantly predict
aggression b = .13, p = .078. Results from this subsample of Aboriginal offenders provide
further support that social problem solving does not appear to mediate the relationship between
impulsivity and aggression.
With respect to the overall fit of the model, results are similar to the complete sample with an
approximate fit of the data, χ2 (1, n = 146) = 16.67, p < .001; CFI = .95; NFI = .944; AIC =
42.67; RMSEA = .325, RMSEALO = .200, RMSEAHI = .471 and SRMR = .110. The NFI, CFI
and SRMR indices suggest an acceptable fit of the data. However, both the χ2 and RMSEA fail
to support a good fit for the data as the χ2 is significant and the RMSEA value is greater than .05.
The model accounts for 24% of the variance in general aggression. As mentioned above,
impulsivity is the only significant determinant of general aggression in this model as social
problem solving and alcohol dependency are not direct determinants of general aggression.
3.7. Exploratory regression analysis to assess potential mediational role of impulsivity
A series of regression analyses were conducted to assess the relationship between impulsivity,
aggression and social problem solving. These analyses, unlike the previous set of regression
analyses, were exploratory and performed to examine the role of impulsivity as mediator in its
relationship with aggression and social problem solving. This relationship was examined post
hoc in light of the strong relationship impulsivity shares with both social problem solving and
aggression and in combination with social problem solving failing to be supported as a mediator.
The following regression analyses were conducted: (1) impulsivity (mediator) is regressed on
social problem solving (IV); (2) aggression (DV) regressed on social problem solving (IV) and;
(3) aggression is regressed on both social problem solving (IV) and impulsivity (mediator). Both
unstandardized and standardized beta coefficients are reported in Table 3.9. The unstandardized

68
coefficients are reported within the text as the Sobel test is calculated with the unstandardized
values.
The results for this series of regression analyses suggest that impulsivity, and not social
problem solving, may be acting as an important mediator in its relationship with aggression.
Examination of the coefficients for the first regression analyses in Table 3.9, indicate that social
problem solving is significantly related to impulsivity b = -.558, p <.001. Investigating the
second regression analysis, social problem solving is a significant predictor of the dependent
variable, aggression b = -.328, p <.001. The third analyses indicates that impulsivity is a
significant predictor of aggression b = -.352, p < .001, when controlling for social problem
solving, a requirement if it was to act as a mediator in this relationship. The original
unstandardized coefficient value between social problem solving and aggression was -.328, p
<.001; however, when controlling for impulsivity the relationship decreased to -.132, p = .107.
This substantial decrease indicates that the relationship between social problem solving and
aggression was reduced when impulsivity was statistically controlled. Results also indicate that
the relationship between social problem solving and aggression was no longer significant.
Results from the Sobel test of mediated effect reveal that the decrease was significant and
provides preliminary support that impulsivity may be acting as a mediator between social
problem solving and aggression. See table 3.9 for results.

69
Table 3.9
Regression Analyses for to assess role of Impulsivity (BIS) as a potential mediator with Aggression (BPAQ), and Social Problem Solving (SPSI) (N =179)
Regression Analyses b SE β
t p
1. Impulsivity on Social Problem Solving
-.558
.064
-.553 -8.71 <.001
2. Aggression on Social Problem Solving
-.328
.071
-.332 -4.61 <.001
3. Aggression on Social Problem Solving and Impulsivity
-.132.352
.081
.081
-.133 .359
-1.62 4.37
.107 <.001
Sobel Statistic -- --
--
-3.17 .0015
Note. b = unstandardized regression coefficient; SE = Standard error of unstandardized regression coefficients; β= standardized regression coefficient Note. * p < .05 ** p < .01
Results suggest that the proposed model of general aggression was an acceptable fit of the
data; however, the regression results suggest that social problem solving is not acting as a
mediator as presented in the model. In an effort to understand better the interrelations among
variables within this model, the regression analyses were re-examined in context of the
approximate fit of the proposed model. As previously noted, social problem solving is not acting
as a mediator in the relationship between impulsivity and aggression as initially predicted.
However, it appears that impulsivity may be playing a significant role in the model and its
relationship with aggression. Based upon these results and literature suggesting the considerable
role that impulsivity may play with each of these variables a new model was developed.

70
This post hoc model situates impulsivity as the mediating variable between social problem
solving and aggression as well as alcohol dependency and aggression. A direct pathway from
alcohol dependency to aggression is included. Covariance is assumed between social problem
solving and alcohol dependency.
Results from this model maintain significant pathways for impulsivity as a determinant of
aggression b = .39, p < .001. Social problem solving directly predicts impulsivity b = -.54, p <
.001; however alcohol dependency does not predict impulsivity b = .03, p = .673 nor aggression
b = .13, p = .067. Overall, the model accounts for 20% of the variance in general aggression. A
significant correlation r = -.37 p <.001 was found between SPSI and alcohol dependency. With
respect to the overall fit of the model, results suggest a good fit to the data χ2 (1, n = 172) = 1.28,
p = .26; CFI = .99; NFI = .996; SRMR = .03; AIC, 27.28; RMSEA = .04, RMSEALO = .000,
RMSEAHI = .208. The AIC index is used to compare models, the lower the AIC the value the
better the fit of the model. When comparing the proposed model and the post hoc model of
aggression on this index, the post hoc model suggests a better fit of the data as its value of 27.28
is lower than the AIC value 42.69 in the proposed model.

71
Note. * p < .05 ** p < .01
Figure 3.4. Path analysis results for post hoc model of aggression in complete sample n = 175
Path analyses with the Aboriginal subsample were conducted with the post hoc model.
Results from this version of the model maintain significant pathways for impulsivity as a
determinant of aggression b = .42, p < .001. Social problem solving again, directly predicts
impulsivity b = -.49, p < .001; and alcohol dependency does not predict impulsivity b = .09, p =
.260. However, within the Aboriginal sample, alcohol dependency does predict aggression b =
.16, p = .029. In terms of significant pathways, this is the only difference between the Aboriginal
and complete sample. Overall, the model accounts for 25% of the variance in general
aggression. With respect to the overall fit of the model, results suggest a good fit to the data χ2
SPSI
Alcohol
.30
Impulsivity
.20
Aggression
-.54**
.03
e1 e2
-.37
.39**
.13

72
(1, n = 146) = 1.196, p = .27; CFI = .99; NFI = .996, SRMR = .01, AIC = 27.20; RMSEA = .036,
RMSEALO = .000, RMSEAHI = .223.
Note. * p < .05 ** p < .01
Figure 3.5. Path analysis results for post hoc model of aggression with the Aboriginal subsample n = 146
SPSI
Alcohol
.29
Impulsivity
.25
Aggression
-.49**
.09
e1 e2
-.42
.42**
.16*

73
CHAPTER 4 DISCUSSION
Numerous cognitive, personality and situational factors have been found to be related to
aggression. Understanding how these factors interrelate is essential to predicting violence and
critical to the assessment and treatment of offenders with violent histories. The main purpose of
this study was to examine the inter-relationships among variables known to influence the
likelihood of an aggressive act. Such variables include social problem solving, impulsivity and
alcohol dependency.
Whilst many of the hypotheses and relationships among variables emerged as predicted,
there were some unanticipated and noteworthy results. These results reveal the intricate
relationships among the variables and how collectively and individually they contribute to
aggression. The implications of these findings for our understanding of human factors
contributing to the study of aggression and for further advancement of treatment programs are
provided.
4.1. Levels of Endorsement
Although the levels of impulsivity and aggression in the present study were high relative to a
nonoffender sample, they were quite similar to normative data found in previous studies that
used these same measures with offender samples (Patton et al., 1995; Cherek, Schnapp, Moeller
& Dougherty, 1996). With respect to alcohol dependency, collectively the sample fell within the
moderate range. Group differences were present between Aboriginal and non Aboriginal

74
subsamples with Aboriginal participants endorsing higher levels of alcohol use. Moreover, in
terms of social problem solving the overall standard score fell within the normal range of ability.
The impression management scale demonstrated relatively poor reliability in the current
study. Overall the current sample had a higher level of impression management than the
normative data presented in the original study (Paulhus, 1999). It is not clear as to why the
reliability level was low. There were significant differences between Aboriginal and non
Aboriginal offenders on the mean impression management scores, with Aboriginal offenders
scoring higher. Currently, normative data is not available for First Nations individuals in Canada.
Although it remains unclear as to specific reason for the low reliability, one possible explanation
is that the content of the measure may be less appropriate within the current sample of primarily
Aboriginal offenders. Perhaps some of the items are not interpreted as intended, as previous
research and normative data on this measure has been with undergraduates. For example, the
statement “I don’t gossip about other people’s business” may be interpreted differently within an
Aboriginal context. Perhaps stronger cultural norms are present with respect to discussing other
people’s lives which may then result in a higher endorsement for that item. Other examples
include, “I have said something bad about a friend behind his/her back” and “When I hear people
talking privately, I avoid listening”. In examining the means for each item, these three items
scored higher than the overall mean. If these items, as well as others, are being interpreted
differently, then collective they may contribute to a higher overall mean. The result is an
elevated impression management score which may actually represent a difference in cultural
interpretation. This may explain the low reliability in that, if some of the items are culturally
biased, they may be responded to in a different manner than other items. Therefore, disrupting
the internal consistency of the measure and resulting in a lower reliability.

75
Although the results indicate the impression management scale was not a unitary
construct within the current sample, efforts to control for social desirability by partially out its
influence were conducted. Only the measures which correlated significantly with impression
management were adjusted. Correlations among all of the measures were presented with and
without adjusting for impression management. The path analysis results without the adjustment
for impression management are presented in Appendix K. Generally speaking, there were few
differences in terms of significance between the results with and without the adjustment.
The setting in which the study was conducted in an important element to take into
consideration when evaluating impression management and the reliability and validity of
responding. Data was collected within two provincial correctional institutions. The researcher
was not affiliated with the institution, however worked closely with the program coordinator at
each location to help recruit participants. It is possible that the response rate and the specific
response style of inmates were affected by the presence of an authoritative figure (i.e. program
coordinator) during the data collection. The impression management levels were elevated for
Aboriginal offenders, which comprised the majority of the sample, and it is possible that this
may have influenced responding. Also, although the participants were explained the
confidentially and anonymity of their responses, there was reluctance to respond and participate
in some instances. In a few cases, participants would volunteer to participate, but once beginning
to complete the survey they would withdraw from the study, claiming that they were not
interested in responding to the questions due to the personal nature of the items. Moreover, a
few measures required participants to recall events prior to their incarceration and provide
insight as to how they behaved in certain situations. This may have been difficult as participants
may not have been able to recall their experiences prior to their incarceration or they may not
76
have had the insight into their behavior. These are examples of various challenges to the
reliability and validity of data within a correctional context.
4.2. Impulsivity
As predicted, the present study demonstrated a strong positive relationship between impulsivity
and aggression in a sample of provincially incarcerated adult male offenders. Coupled with
experimental and correlational research, this finding suggests that inhibitory mechanisms which
are responsible for controlling or restraining behaviour may be less effective in male offenders
with high levels of trait aggression (Cherek et al., 1997a; 1997b; Lane & Cherek, 2000).
Concerning the subtypes of impulsivity, motor, cognitive/attention and nonplanning, all
three significantly correlated with aggression. However, due to the low reliability of each
subscale in the current study, these results should be interpreted with caution as the purity of the
subscales is questionable. Significant correlations with the original BIS subscales suggest that
actions associated with impulsivity, versus the unplanned or cognitive components, have the
strongest relationship with aggression. Barratt’s (1985, 1990) work comparing delinquents and
nondelinquents on impulsivity supports the notion that motor impulsivity often displays the
highest relationship with aggression. Conversely, other research has maintained that the
nonplanning component of impulsivity has the strongest relationship with aggression among
delinquents (Luengo et al., 1994). Regardless of the contention that appears with respect to the
strongest associated subtypes with aggression, there is a consensus that the cognitive/attention
component of impulsivity demonstrates the weakest, albeit still a significant, relationship with
aggression. There has been discussion regarding the ability of the BIS-11 to capture the
cognitive/attention aspect of impulsivity. A factor analysis of the measure demonstrated that the
cognitive/attention subtype loaded on all factors. Luengo et al., (1994) proposed that attempting

77
to assess the underlying ‘thought processes’ of impulsivity may be difficult to pull apart from the
other subtypes especially in a self-report measure (Patton et al., 1995).
Within the current sample, a principal axis factor analysis with oblimin rotation was
conducted on the BIS-11 on account of the low reliability scores for each subscales and the
inconsistent factor structures presented in the literature (Luengo et al. 1991; Patton et al., 1995).
Findings indicate that a four factor structure represents the data in this sample. The four factors
include behavioural impulsivity, cognitive aspects, nonplanning aspects and controlled/planned
behaviour. The results of the analysis fail to support Barratt’s original factor structure of the BIS
(Patton et al., 1995). It does support the notion that subtypes of impulsivity exist; however, the
focus of these subtypes is inconsistent with previous literature. Examining the items of the first
factor, many of these items are shared with the original motor subscale. Two items, “I spend or
charge more than I earn” and “I get easily bored when solving thought problems” are factors
from the original nonplanning and cognitive/attention subscales, respectively. The items in this
factor tend to focus on behavioural or active aspects of impulsivity. For many of these items the
action described is an indication of impulsive behaviour. The fourth factor contains items which
are the opposite of impulsive behaviour and represent planned and controlled behaviour. Many
of these items are from the original nonplanning subscale; however, they represent the items that
are indicating a lack of impulsivity. The internal consistency of factors one and four are
acceptable within this sample, .76 and .63 respectively.
The second and third factors are less distinct in terms of what they are capturing. The second
factor appears to measure cognitive aspects of impulsivity; however, it does not match up with
the original cognitive/attention subscale. Factor 2 appears to represent the negative components
of cognitive impulsivity; that is, cognitive items which are related to impulsive actions e.g. “I

78
have racing thoughts” or “I solve problem by trial and error”. The third factor has three items
that appear to represent nonplanning. Although this factor does not represent the original
nonplanning subscale, it does share two of the original items. The internal consistency for factors
two and three are poor with levels of .22 and .44 respectively.
With some exceptions, the outcome or the valence of the items within each factor appears to
be central to each factor. For example, factor one appears to be negative behavioural aspects
related to impulsivity; factor two concentrates on negative cognitive aspects of impulsivity;
factor three presents as negative nonplanning aspects of impulsivity; and factor four concentrates
on positive controlled thoughts related to impulsivity. Many of the factors are not solely based
on the process (i.e. cognitive or motor) as in Barratt’s original scales but also on the outcome
(i.e. controlled/cautious behaviour, impulsive actions).
Recent work conducted on impulsivity and its subcomponents suggest that instead of the three
subcomponents of motor, nonplanning and attention/cognitive impulsivity, impulsivity should be
classified as either rapid-response impulsivity or reward-delay impulsivity. Rapid response
impulsivity is related to an inability to assess the social context and conform one’s responses to
that context. Reward-delay on the other hand, is essentially nonplanning impulsivity and is an
inability to delay one’s gratification for a larger reward for a smaller more immediate reward.
Research has suggested that rapid response impulsivity is related to trait impulsivity as assessed
by an overall BIS scores and has a stronger relationship with personality disturbances (Houston
& Stanford, 2005; Houston et al., 2003; Ramirez & Andreu, 2006; Swann et al., 2002).
Although this research fails to support the factor structure of Barratt’s impulsivity scale, it
does support the notion that subcomponents of impulsivity exist. Examining each of the four
factors it does seem that aspects of cognition, behaviour and nonplanning are related to

79
impulsivity; however, not in the manner present in the original subscales. Further examination of
the BIS factor structure is needed as these results are only supported in the current sample.
Furthermore, results regarding the subscales of the BIS are to be interpreted with caution as the
underlying subscales are not reliable.
4.3. Social Problem Solving
The findings of the correlational results in the current study support those of previous
studies in that lower levels of social problem solving were associated with higher levels of
impulsivity and aggression (Slaby & Guerra, 1988; Evans & Short, 1991; Crick & Dodge, 1994).
Much of the literature in this area involves work with adolescent samples. Studies have
suggested that adolescents with a history of aggressive acts have deficits in social problem
solving ability. Specifically, it is noted that aggressive youths generate fewer effective solutions
to problems and the solutions which they offer are qualitatively poor, aggressive and overall
ineffective (Akhtaw & Bradley, 1991; Slaby & Guerra, 1988; Evans & Short, 1991; Crick &
Dodge, 1994; Keltikangas-Jarvinen, 2001). Of the many qualities of social problem solving, an
inability to generate a number of effective nonaggressive solutions, appears to be key in
differentiating nonaggressive and aggressive youths (Keltikangas-Jarvinen & Kangas, 1988;
Keltikangas-Jarvinen, 2001). Although less research is present on the direct relationship
between aggression and social problem solving in adult samples, it has been assumed that a
similar link exists. Moreover, many offender treatment interventions are based on the social
cognitive or social problem solving framework (Porporino & Beal, 1998). This is in line with
the current results indicating a positive relationship between the variables. The results with
respect to social problem solving as a mediator were not supported and are described in a
subsequent section.
80
In terms of impulsivity, a relationship with social problem solving was supported. The
social problem solving scale utilized in the current study has an impulsivity subscale and even
after controlling for the variance affected by the subscale, the negative relationship between
impulsivity and social problem solving remains significant. Some researchers have suggested
that impulsivity may act as an obstacle in acquiring or utilizing adequate social problem solving
skills especially in combination with other deficits such as poor verbal ability or low intelligence
(McMurran, Egan, Blair & Richardson, 2001; McMurran et al., 2002).
4.4. Alcohol Dependency
As predicted, correlations with alcohol dependency exhibited a positive relationship with
both aggression and impulsivity. Consistent with previous findings, higher rates of alcohol
dependency are commonly found in individuals with higher levels of impulsivity (Patton,
Stanford & Barratt, 1995; Allen, Moeller, Rhoades & Cherek, 1998) and aggression (Brady et
al., 1998; Moeller, Barratt, Dougherty, Schmitz & Swann, 2001).
The literature offers a number of potential explanations for the relationship between
impulsivity and alcohol use or substance abuse more generally. To begin, there is considerable
support for the proposition that impulsivity acts as a risk factor for alcohol abuse. Developmental
literature has shown that individuals with childhood disorders such as Attention Deficit
Hyperactivity Disorder (ADHD) have higher rates of developing substance abuse disorders as
adults (Moeller & Dougherty, 2002). ADHD is characterized by impulsivity and it is one of its’
DSM – IV diagnostic criteria (American Psychiatric Association, 1994). Furthermore, the co-
morbidity of conduct disorder and ADHD offers an even higher rate of developing a substance
abuse disorder as an adult. Clearly, impulsivity appears as a considerable risk factor for the
development of substance abuse disorders (Sullivan & Rudnik-Levin, 2001; Moss & Lynch,

81
2001; Moeller & Dougherty, 2002). Conversely, alcohol abuse has been suggested to increase
impulsivity; that is, impulsivity is present because of one’s alcohol use or abuse. Both acute and
long-term effects have been shown (Giancola, 2000; Dougherty, Moeller, Steinberg et al., 1999;
Dougherty, Marsh, Moeller et al., 2000; Moeller & Dougherty, 2002). Again, the results of the
alcohol dependency in relation to the model are discussed in a subsequent section.
4.5. Impulsive aggressors versus Premeditated aggressors
While it was predicted that those individuals classified as impulsive aggressors would
score higher on impulsivity than those classified as premeditated, this was not found to be the
case. This may have occurred for a number of reasons. To begin, the manner in which
individuals were classified as impulsive or premeditated failed to result in two groups that were
pure subtypes, as each individual’s group assignment was based on the subscale with the highest
endorsement. Research on adult and young offenders suggest that approximately 20% of
offenders predominately commit either premeditated or impulsive aggressive acts and the
remaining 60% commit a combination of these subtypes (Barratt, Feltous, Kent Liebman &
Coates, 2000). The classification in the current study has nearly all individuals classified as
either impulsive or premeditated aggressors, even though they may represent part of the 60% that
commit a combination of subtypes. The resulting groups are therefore not homogenous subtypes
as proposed. The heterogeneity of these subgroups may ultimately diminish any differences in
impulsivity between true impulsive and premeditated aggressors. In future studies, efforts should
be made to triangulate group classification with file reviews examining previous criminal
offences. It may be useful to include a third category of individuals who commit both impulsive
and premeditated aggression.

82
Moreover, there is support that impulsivity is not exclusively associated with impulsive
aggressors, as research has also linked it with premeditated aggressor subtypes (Barratt et al.
1997; Stanford et al., 2003., Houston & Stanford, 2005). This is supported in the present study,
as the relationship between premeditated aggression and impulsivity remains significant while
controlling for impulsive aggression and vice versa. That is, high levels of impulsivity are
present with elevated levels of either impulsive or premeditated aggression. It is proposed that
the key difference between the two groups with respect to impulsivity is the control of one’s
emotional state. Individuals high on impulsivity and that are premeditated aggressors may
participate in aggressive behaviour; however, the action is controlled and not related to their
current emotional state. This is in contrast to impulsive aggressors, where it is thought that a
lack of control results from the fuelling of emotions and the affective components of aggression
such as anger, irritability and hostility (Houston & Stanford, 2005). It appears that higher levels
of impulsivity may be present in both subtypes, but it may be the manner in which it manifests
itself with respect to aggressive acts that differentiates the subtypes (i.e. level of emotional
control). The route in which impulsivity interacts with aggressor subtypes appears to be more
complex than originally predicted. Findings are preliminary and further work is needed to
replicate this work and to refine these distinctions in aggressive subtypes.
In an exploratory analysis between aggressive subtypes, one significant finding involved
participant’s level of alcohol use. Those classified as impulsive aggressors had a higher level of
self-rated alcohol use. They also drank alcohol more days per week and drank more than 5 drinks
more days per week than the premeditated group. If it is known that impulsivity is associated
positively with alcohol use and in light of the discussion in the previous section one could
speculate, that in a particular situation, alcohol use may contribute to increased impulsivity. This

83
would result in a lack of behavioural control with respect to one’s emotional state, with the
outcome potentially resulting in an impulsive aggressive act.
4.6. Mediational Model of Aggression
Multiple regression was utilized to examine the potential relationships among variables
prior to conducting the path analyses for each model of aggression. With respect to the assessing
the mediational role of social problem solving with aggression and impulsivity, the multiple
regression results would have been sufficient to examine this relationship. That is, there was
some redundancy in conducting both types of analyses as they examine and present similar
results. Path analyses, being an extension of multiple regression, allows the researcher to
examine more complicated relationships, direct and indirect pathways, among social problem
solving, alcohol dependency, impulsivity and aggression, and not solely the meditational
relationship (Streiner, 2006). Moreover, relationships between the independent variables can
also be assessed. In the proposed model, the direct pathway between social problem solving and
alcohol dependency was set to zero to allow one degree of freedom in order to test how well the
model fit the data. Another benefit of path analysis is assessing competing models as various
indices allow for model comparisons to assess the best fit (Streiner, 2006).
Four models of aggression were assessed in the present study utilizing path analysis. Two
proposed models were examined to assess the role of social problem solving as a mediating
variable in its relationship with impulsivity and aggression. This model was examined with the
complete sample and with a subsample of only Aboriginal offenders. Two post hoc models were
also examined to assess the role of impulsivity as a mediating variable in its relationship with
impulsivity and aggression. The post hoc model was also examined with both the complete
sample and with a subsample of only Aboriginal offenders. For the most part, results between

84
the complete sample and Aboriginal subsample were quite similar. Therefore, general discussion
of the results relate to both samples. Any differences in results between Aboriginal and non
Aboriginal subsamples are discussed separately.
Although the preliminary model resulted in an adequate fit for the data, for both the
complete and Aboriginal subsample, (Figure 3.2) the results were not encouraging for the
proposition that social problem solving functions as a mediator between impulsivity and
aggression. While there were significant relationships between impulsivity and aggression and
impulsivity and social problem solving, there were also nonsignificant pathways between social
problem solving and aggression and alcohol dependency and aggression.
Despite the documented findings regarding its role with aggression, social problem
solving failed to act as a mediator or show a direct relationship with impulsivity within the
current sample. These results were confirmed by a series of regression analyses. McMurran et
al., (2002) have previously examined similar relationships between social problem solving,
alcohol dependency and impulsivity in a sample of undergraduates. Findings suggested that
problem solving exerted the most influence on aggression and it was proposed that regardless of
impulsivity level, if strong social problem solving skills are present the likelihood of aggression
diminishes. There are however, a number of reasons low levels of poor social problem solving
may be present in an individual. First, poor social problem solving may be a result of an
inhibition of skill; that is, a person may have the ability to problem solving effectively but is not
able to implement that knowledge or skill. Another reason may be a true lack or deficit of social
problem solving ability. Developmentally, the individual may not have acquired a sufficient
ability in order to function effectively (McGuire, 2001). Acknowledging that social problem
solving deficits may present in a number of different ways may help us better understand the

85
dynamics of social problem solving. It appears that being low on social problem solving ability
is related to higher levels of aggression and impulsivity, but social problem solving does not
appear to account for much of the relationship between impulsivity and aggression.
Despite the contrary findings, McMurran et al., (2002) acknowledged that impulsivity
may contribute to the relationship between social problem solving and aggression
developmentally by inhibiting a child’s development of effective social problem solving skills.
This is in line with the current study and was the impetus for the development of the post hoc
model. It is thought that one’s level of impulsivity could greatly influence one’s social problem
solving ability and ultimately affect the likelihood of an aggressive act occurring. It is proposed
that social problem solving impacts on aggression only in as much as it affects (controls or
inhibits) an one’s impulsivity, or conversely, that one’s degree of impulsivity can negate any
progress or ability to problem solving.
The post hoc model was developed taking into account much of the literature suggesting
impulsivity’s prominent role with aggression and its significant relationship with social problem
solving (Cherek et al., 1997a; Cherek et al., 1997b; Guerra and Slaby, 1990; Lane & Cherek,
2000; McMurran et al., 2002). Gottfredson and Hirschi (1990) claim that the concept of
impulsivity or dyscontrol plays a major role in understanding criminality and have proposed
impulsivity as the fundamental factor contributing to criminal behaviour.
Moreover, exploratory regression analysis indicated that impulsivity may be acting as a
mediator in its relationship with social problem solving and aggression. Therefore, a revised post
hoc model (Figure 3.3) was developed which situates impulsivity as a mediating variable
between social problem solving and aggression and between alcohol dependency and aggression.

86
In terms of considering the role of alcohol dependency in the post hoc model, a direct
pathway was considered as literature suggests a direct effect on aggression. A number of
laboratory studies have examined a causal link with alcohol use and aggression (Bushman &
Cooper, 1990; Chermack & Taylor, 1995; Chermack & Giancola, 1997; Laplace, Chermack &
Taylor, 1994). Additionally, when conducting a path analysis, it is necessary to allow for at least
one degree for freedom in order to test the fit of the model. In order to fulfill the requirement, the
pathway from social problem solving and aggression was set to zero. This was evaluated on the
basis that social problem solving had no direct effect with aggression in the proposed model and
that it was expected to contribute indirectly through its mediational relationship with impulsivity,
as discussed above. Examining impulsivity and aggression with similar measures as in the
current study, Fulwiter, Eckstein and Kalsy (2005) examined these variables before and after the
consumption of alcohol. The authors suggested that impulsivity may play a mediating role in its
effects of alcohol on aggression. In evaluating the literature and within the constraints of path
analysis, a direct pathway from alcohol to aggression and an indirect pathway from alcohol
dependency to aggression were considered in the post hoc model.
Results from the path analysis of the post hoc model, in both the full sample and
Aboriginal subsample, revealed significant pathways between social problem solving and
impulsivity and social problem solving and aggression. Broken down these results indicate that
social problem solving significantly predicts impulsivity and that impulsivity significantly
predicts aggression. It appears from both of these models that impulsivity may be acting as a
mediator in its relationship with social problem solving and aggression. Exploratory analyses
examining the regression analyses of social problem solving, impulsivity and aggression support
this finding. Moreover, fit indices indicated that the revised model was a better fit to the data. It

87
is thought that one’s level of impulsivity could greatly influence one’s social problem solving
ability and ultimately affect the likelihood of an aggressive act occurring. Although further
research and replication is needed, based on these preliminary results it appears that social
problem solving impacts aggression only in as much as it affects controls an offender’s
impulsivity. Impulsivity appears to mediate the relationship in this triad of variables in
accounting for much of the relationship. This is groundwork to further examine the notion that
one’s degree of impulsivity can negate any progress in social problem solving ability and
supports previous work by McMurran et al., (2002) acknowledging the role impulsivity plays in
the inhibition of effective social problem solving skills. Results are post hoc and these
preliminary results must be replicated before conclusive findings may be stated.
With respect to alcohol dependency, in the complete sample with both the proposed and
post hoc models, neither direct nor indirect relationships were found with alcohol and
aggression; although the direct pathway approached significance in the post hoc model. This
finding counters the current literature which suggests a positive relationship between aggression
and alcohol use or even that alcohol may predict aggression (Bushman & Cooper, 1990;
Chermack & Taylor, 1995; Chermack & Giancola, 1997; Laplace, Chermack & Taylor, 1994).
Howver, within the subsample of Aboriginal offenders, in the post hoc model, the direct pathway
from alcohol dependency to aggression was significant. This suggests that alcohol dependency
within this sample predicts aggression. This is inline with the literature indicating a relationship
between alcohol and aggression (Bushman & Cooper, 1990; Chermack & Taylor, 1995;
Chermack & Giancola, 1997; Laplace, Chermack & Taylor, 1994). Again, the results are
preliminary and further research is needed before conclusive statements can be made.
88
Group differences were present in terms of alcohol use between Aboriginal offenders and
non Aboriginal offenders. Specifically, the Aboriginal offenders had higher levels of self-
reported alcohol use. This is relevant even though the models that were tested were on the
complete sample and an Aboriginal subsample and not a comparison of between Aboriginal and
non Aboriginal subsamples. This indicates that as a complete sample, group differences
weakened the effect of alcohol dependency on aggression. The subsample of Aboriginal
offenders is a more homogenous group with elevated levels of alcohol use.
Although only preliminary, it appears that any influence alcohol dependency has on
aggression is through a potentially direct relationship. Within the current study, this finding is
only present within Aboriginal offenders with high levels of alcohol dependency. Alcohol does
not significantly predict impulsivity in either post hoc model with either the complete sample
nor Aboriginal sample. Correlational results from this study indicate a positive relationship
between alcohol dependency and impulsivity. The direction of the relationship from the path
analysis results remains uncertain as results are present within a subsample of the population.
The proposed model however, indicates that impulsivity significantly predicted alcohol
dependency but the reverse is not true, alcohol dependency does not predict impulsivity. The
results regarding the direction of the relationship between impulsivity and alcohol need to be
replicated before any conclusive statements can be made.
In terms of limitations in assessing alcohol use, the measure utilized in the current study
assessed alcohol dependency. Research reports that acute alcohol consumption is more strongly
related to aggression than alcohol dependency (Collins & Schlenger, 1988). Therefore, it is
possible that assessing acute alcohol consumption rather than alcohol dependency would result in
significant results and pathways to aggression within the complete sample or subsequent

89
samples. This is something to be considered in future studies examining the relationship between
aggression and alcohol in offenders.
Taken together these data suggest social problem solving, alcohol dependency and
impulsivity are all important in understanding and predicting aggression. Social problem solving
does not appear to act as a mediator in the relationship with impulsivity and aggression within
this sample. However, preliminary results suggest that impulsivity, may serve the function in this
relationship and in the manifestation of aggression. Alcohol dependency appears to play a direct
role. Indicated in the post hoc model with Aboriginal offenders, alcohol dependency significantly
predicted aggression. No such relationship was found with the complete sample. This speaks to
the heterogeneity of violent offender and the importance of considering subsample
characteristics in order to ensure successful treatment.
4.7. Practical Application of Findings
If post hoc results are replicated, the results of current research may have implications for
the assessment and treatment of violent offenders. Findings suggest that social problem solving,
alcohol dependency and impulsivity are all important in understanding and predicting
aggression. Preliminary results from the current study suggest that impulsivity may have a
considerable function in its manifestation. If the results are replicated in subsequent studies, this
may suggest that treatment programs should consider assessing the role of impulsivity in an
offender’s crime cycle and subsequently incorporate behavioural methods to decrease
impulsivity as part of the curriculum of violent offender programming. Specifically, the findings
of the current study, favouring the post hoc model, suggest that clinicians and program
developers should consider examining the role of an offender’s impulsivity is addressing their
needs in treatment. From this model, it is proposed that social problem solving impacts on

90
aggression only in as much as it affects (controls or inhibits) an offender’s impulsivity, or
conversely, that one’s degree of impulsivity can negate any progress in social problem solving if
left unaddressed. If this is truly the case, the sequence of treatment may also be important. It
may be beneficial to treat impulsivity first and then social problem solving. Otherwise social
problem solving will be ineffective in its impact on aggression.
Also, this study speaks to the heterogeneity of violent offenders and to the importance of
responding to specific criminogenic needs in treatment. To exemplify this case, note that the
relationship between alcohol dependency and aggression was only present within the subsample
of Aboriginal offenders. If treatment was based on the results for the complete sample, where no
such relationship was found, the criminogenic need of substance abuse may not have been
addressed. In line with the principles of effective correctional treatment, considering the specific
needs of a subpopulation or type of offenders is essential to success of treatment programs for
violent offending (Andrews & Bonta, 2003).
4.8. Limitations and Future Considerations
Clearly, there are some limitations to this research. As previously discussed Aboriginal
offenders are currently overrepresented in the current sample. Although Aboriginal offenders are
overrepresented within the federal and provincial correctional systems in Canada, the magnitude
of that overrepresentation is much higher in the current study. Aboriginal offenders represent
18.7% of the incarcerated population in Canada, and within the current study, they account for
85% of the sample (Public Safety and Emergency Preparedness Canada, 2006). The sample may
reflect a central and northern Saskatchewan population and therefore these findings are limited in
terms of their generalizability to other regions of Canada and their largely Caucasian
populations.

91
It is important to note the differences in alcohol dependency that were present within the
sample. Aboriginal offenders, which constituted 85% of the sample, reported a higher level of
alcohol dependency and a higher self-rated level of alcohol use, than non Aboriginal offenders.
The number of non Aboriginal offenders in the sample was quite small relative to Aboriginal
offenders and anecdotal evidence from the data collection support the findings that non-
Aboriginal offenders have lower rates of alcohol dependency or use. A number of non
Aboriginal offenders, either verbally or by written comments, suggested that drug use and not
alcohol use was a concern relating to their offending behaviour. Qualitatively and quantitatively
there appears to be differences between these subgroups, which may ultimately affect the
interpretation and generalizability of the findings.
Furthermore, the reliance on self-report measures may be a limitation, as participants may
be sensitive to social desirability. Attempts were made, however, to control for this by the
inclusion of a social desirability measure. It is often noted that participants, when completing
self-report measures, may deny the extent of their aggression or other socially undesirable
behaviour. A study by Richardson and Green (2003), examining this impression management
bias, compared self-report data on aggressive acts with a peer report from an individual who
knew the respondent well and with whom they have had a recent angry episode. Results
suggested that although rates were lower, that is there was hesitation to reveal aggressive
behaviour, rates between self-report and peer reports were positively related. This suggests that
self-report measures are adequate in providing valid responses regarding socially unacceptable
behaviour.
A further limitation is that the design of the study was cross-sectional. Differences
between types of offenders, therefore, were not examined. Research on aggression supports the

92
heterogeneity of violent offenders and one cannot assume that all violent offender subtypes
exhibit the same cognitive and personality characteristics (Serin & Kuriychuk, 1994). Separate
path analyses were originally proposed to examine how social problem solving, impulsivity and
aggression interact within subsamples of impulsive aggressors and premeditated aggressors.
However, the relatively small sample size precluded us from performing these additional
analyses for each subtype of aggression and more generally from performing sophisticated
analyses such as structural equation modeling. Consequently, future analyses should consider
various subgroups such as domestic abusers, impulsive aggressors and premeditated aggressors.
In the present study, group categories were based on a self-report measure; however, future
research should attempt to triangulate group designation with additional information such as
previous convictions and offence history.
In utilizing path analysis with multiple regression or AMOS for the analysis of the
models, it is important to note that competing models may be compatible with the same set of
data (Hoyle & Panter, 1995; Pedhazur, 1982). In addition, it is important to acknowledge that the
second path analysis model was conducted post hoc and therefore can only be considered to be
preliminary. Future studies should look to replicate the current findings and to assess further the
roles of such variables a priori and their relation to aggression in an offender sample.
Multiple t-tests were used to assess potential differences for each variable with respect to
ethnicity (Table 3.5) and institutional location (Table 3.6). These analyses were post hoc and
involved multiple comparisons. In an attempt to control for Type 1 errors, the critical level was
adjusted and all results were assessed against the new critical value which resulted in a more
conservative assessment of the comparisons. When designing studies to further examine these
variables in relation to aggression, comparisons between ethnic groups and location ought be
93
considered a priori. This is recommended, as offender samples constitute a heterogeneous group
and being cognizance of within group differences will provide a more accurate assessment and
interpretation of results. It is evident from the Table 3.5 and Table 3.6 that a number of
comparisons, namely alcohol dependency and level of impulsive aggression, would have been
significant if a critical level of alpha = .05 had been used. Although we are limited in terms of
interpretation based on statistical significance, acknowledging the potential qualitative
differences between subsamples, either between ethnicities or institutions, is imperative to our
understanding of the findings.
4.9. Future Directions
In addition, a number of other interesting variables known to influence aggression may be
considered in future studies. Such variables include age as a covariate, as impulsivity levels are
known to be related to age, specifically higher levels of impulsivity being present in younger
individuals (D’Zurilla et al., 2002). Moreover, drug abuse versus alcohol dependency was often
discussed by some participants with respect to their aggressive acts. Again, this would speak to
the heterogeneity of violent behaviour; perhaps those who consume drugs have different patterns
of behaviour than those who solely consume alcohol. Considering drug use as a separate variable
in addition to alcohol use, could further supplement our understanding of factors related to
aggression.
Furthermore, as stated in a previous section, future studies should look to replicate the
current findings and to assess further the roles of social problem solving, impulsivity, alcohol
dependency a priori and their relation to aggression in an offender sample.

94
4.10. General Conclusions
Social problem solving, impulsivity and alcohol dependency were all related to
aggression in a predictable fashion. Specifically, higher levels of impulsivity and alcohol
dependency and lower levels of social problem solving were related to higher levels of
aggression. The specifics of how these three variables interacted were not predicted correctly.
Particularly, the hypothesis that social problem solving acts as a mediator in its relationship with
impulsivity and aggression was not supported in the present study. Post hoc analyses suggest that
impulsivity may be a key player in this relationship however, until results are replicated and
further investigation of its role is conducted, results are only suggestive.
With respect to the relationship between aggression and alcohol dependency, again the
evidence indicates a positive correlation between the variables. However, upon examining
whether a casual, direct or indirect relationship between these variables was present, results were
nonsignificant within the complete sample. However, the direct pathway was significant in the
Aboriginal sample whom had a higher level of alcohol use than the non Aboriginal offenders.
Alcohol dependency appears to play a role with aggression; however, the results are preliminary
and outstanding questions remain regarding its role in predicting aggression in an offender
sample
Taken together these findings appear to be consistent with much of the literature
supporting relationships among impulsivity, social problem solving, alcohol dependency and
aggression. Furthermore, all variables play an important role in understanding and even
predicting aggression. These findings reinforce the notion that cognitive, personality and
situational variables play a considerable role in the manifestation of aggression. As the quotation
at the beginning of the thesis states, there are a multitude of factors which contribute to
aggression that do not appear to operate in isolation. Understanding how these factors interrelate

95
is essential to predicting violence and critical to the assessment and treatment of offenders with
violent histories. Efforts to understand these complex relationships will continue to be of interest
to researchers in the years to come.


97
LIST OF REFERENCES
Akhtar, N., & Bradley, E.J. (1991). Social information processing deficits of aggressive children:
Present findings and implications for social skills training. Clinical Psychology Review,
11, 621-644.
Allen, T.J., Moeller, F.G., Rhoades, H.M., & Cherek, D.R. (1998). Impulsivity and history of
drug dependence. Drug Alcohol and Dependence, 50, 137-145.
American Psychiatric Association. (1994). Diagnostic and Statistical Manual of Mental
Disorders. 4th Ed. Washington, D.C.: American Psychiatric Association
Andrews, D.A. & J. Bonta (2003). Psychology of Criminal Conduct. Cincinnati, OH: Anderson
Publishing Co.
Arbuckle, J. L. (2005). Amos 6.0. User’s Guide. Chicago, IL: SmallWaters
Archer, J. Holloway, R., & Mcloughlin, K. (1995). Self-reported physical aggression
among young men. Aggressive Behaviour, 21, 326-342.
Archer, J., Kilpatrick., & Bramwell, R. (1995). Comparison of two aggression
inventories, Aggressive Behaviour, 21, 371-380.

98
Bailey, D.S., & Taylor, S.P. (1991). Effects of alcohol and aggressive disposition on human
physical aggression. Journal of Research in Personality. 25, 334-342.
Baron, R.M., & Kenny, D.A. (1986). The moderator-mediator variable distinction in social
psychological research: Conceptual, strategic, and statistical consideration. Journal of
Personality and Social Psychology, 51, 1173-1182.
Baron. R. & Richardson. D. (1994). Human Aggression (2nd Edition). New York:
PlenumPress.
Barratt, E.S. (1985). Impulsiveness subtraits: Arousal and information processing. In J.T. Spence
& C.E. Izard (Eds.), Motivation, emotion, and personality (pp.137-146). Amsterdam:
Elsevier Science.
Barratt, E.S. (1990, September). Impulsiveness and aggression. Paper presented at the Risk
Special Studies Meeting, Pittsburgh, PA.
Barratt, E.S. (1991). Measuring and prediction aggression within the context of a personality
theory. Journal of Neuropsychiatry and Clinical Neurosciences, 3, S35-S39.
Barratt, E.S., & Slaughter, L. (1998). Defining, measuring, and predicting impulsive aggression:
A heuristic model. Behavioural Science and the Law, 16, 285-302.

99
Barratt, E.S., Felthous, A.R., Kent, T.A., Liebman, M.J., & Coates, D.D. (2000). Criterion
measures of aggression – impulsive versus premeditated aggression. In D. Fishbein (ed.),
The science, treatment and prevention of antisocial behaviors: Application to the
criminal justice system. Kingston, NY: Civic Research Institute.
Barratt, E.S., Stanford, M.S., Kent, T.A., & Felthous, A. (1997). Neuropsychological and
cognitive psychophysiological substrates of impulsive aggression. Biological Psychiatry,
41, 1045-1061.
Bartol, C. (2002). Criminal Behavior: A Psychosocial Approach, 6e. Upper Saddle River, NJ:
Prentice Hall.
Berstein, I.H., & Gesn, P.R. (1997). On the dimensionality of the Buss-Perry Aggression
Questionnaire, Behaviour Research and Theory, 35, 563-568.
Blackburn, R. (1993). The Psychology of Criminal Conduct: Theory, Research and Practice.
Toronto, CA: Wiley.
Boles, S.M., & Miotto, K. (2003). Substance abuse and violence: A review of the literature.
Aggression and Violent Behavior, 8(2), 155-174.

100
Brady, K.T., Myrick, H., & McElroy, S. (1998). The relationship between substance use
disorders, impulse control disorder, and pathological aggression. American Journal of
Addiction, 7, 221-230.
Brennan, P.A., & Raine, A. (1997). Bio-social basis of antisocial behaviour:
Psychophysiological, neurological, and cognitive factors. Clinical Psychology Review,
17, 589-604.
Bushman B.J. & Cooper, H.M. (1990). Effects of alcohol on human aggression: An integrative
research review. Psychological Bulletin, 107, 341-354.
Buss, A.H. & Durkee, A. (1957). An inventory for assessing different kinds of hostility. Journal
of Consulting and Clinical Psychology, 21, 343-349.
Buss, A.H. & Perry, M. (1992). The aggression questionnaire. Journal of Personality and Social
Psychology, 63, 452-459.
Carrillo de la Peña, M.T. (1993). An analysis of the impulsivity construct and of its relevance for
the understanding of antisocial behaviour among adolescents. Unpublished Doctoral
Dissertation, University of Santiago de Compostela, Spain.
Cherek, D.R. (1981). Effects of smoking different doses of nicotine on human aggressive
behavior. Psychopharmacology, 75, 339-349.

101
Cherek, D.R. & Lane, S.D. (1999). Laboratory and Psychometric Measurements of Impulsivity
among Violent and Nonviolent Female Parolees. Biological Psychiatry, 46, 273-280.
Cherek, D.R., Moeller, F.G., Dougherty, D.M., & Rhoades, H. (1997a). Studies of Violent and
Nonviolent Male Parolees: II Laboratory and Psychometric Measurements of Impulsivity.
Biological Psychiatry, 41, 523-529.
Cherek, D.R., Moeller, F.G., Schnapp, W., & Dougherty, D.M. (1997b). Studies of Violent and
Nonviolent Male Parolees: I. Laboratory and Psychometric Measures of Aggression.
Biological Psychiatry, 41, 514-522.
Cherek, D.R., Schnapp, W., Moeller F.G. & Dougherty, D.M (1996). Laboratory Measures of
Aggressive Responding in Male Parolees with Violent and Nonviolent Histories.
Aggressive Behavior, 22, 27-36.
Chermack, S.T., & Giancola, P.R. (1997). The relations between alcohol and aggression: An
integrated biopsychosocial conceptualization. Clinical Psychology Review, 17, 621-649.
Chermack, S.T. & Taylor, S.P. (1995). Alcohol and human physical aggression: Pharmacological
versus expectancy effects. Journal of Studies on Alcohol 56, 449-456.

102
Christian, R.E., Frick, P.J., Hill, N.L., & Tyler, L. (1997). Psychopathy and conduct problems in
children: II. Journal of the American Academy of Child and Adolescent Psychiatry, 36,
233-241.
Collins, J.J. (1993). Drinking and Violence: An individual offender focus. In S.E. Martin (Ed.),
Alcohol and interpersonal violence: Fostering multidisciplinary perspectives (pp. 221-
236). Rockville, MD: US Department of Health and Human Services, Public Health
Service, National Institute of Health, National Institute on Alcohol Abuse and
Alcoholism.
Collins, J.J., & Schlenger, W. (1988). Acute and chronic effects of alcohol use on violence.
Journal of Studies on Alcohol, 46, 161-171.
Crick, N.R. & Dodge, K.A., (1994). A review and reformulation of social information-
processing mechanism in children’s social adjustment. Psychological Bulletin, 115, 74-
101.
Crick, N.R. & Dodge, K.A., (1996). Social information-processing mechanisms in reactive and
proactive aggression. Child development, 67, 993-1002.
Davidson, R. (1987). Assessment of the alcohol dependence syndrome: A review of self-report
screening questionnaires. British Journal of Clinical Psychology, 26. 243-255.
103
Davidson, R., Bunting, B. & Raistrick, D. (1989). The homogeneity of the alcohol
dependence syndrome: A factor analysis of the SADD questionnaire. British
Journal of Addiction, 84, 907-915.
Davidson, R., Raistrick, D. (1986). The validity of the Short Alcohol Dependence Data (SADD)
questionnaire. British Journal of Addiction, 81, 217-222.
Dougherty, D.M., Marsh, D.M., Moeller, F.G., Chokski, R.V., Rosen, B.C. (2000). Effects of
moderate and high doses of alcohol on attention, impulsivity, discriminability, and
response bias in immediate and delayed memory task performance. Alcoholism: Clinical
and Experimental Research, 24, 1702-1711.
Dougherty, D.M., Moeller, F.G., Steinberg, J.L., Marsh, D.M., Hines, S.E., & Bjork, J.M.
(1999). Alcohol increases commission error rates for a continuous performance test.
Alcoholism: Clinical and Experimental Research, 23, 1342-1351.
D’Zurilla, T.J., & Nezu, A.M. (1982). Social problem solving in adults. In P.C. Kendall (Ed.).
Advances in cognitive-behavioral research and therapy (Vol. 1) New York: Academic
Press.
D’Zurilla, T.J., & Nezu, A.M., (1999). Problem-solving therapy: A social competence approach
to clinical intervention (2nd ed.). New York: Springer.

104
D’Zurilla, T.J., Nezu, A.M., & Maydeu-Olivares, A. (2002). Social Problem Solving Inventory –
Revised. North Tonawanda, NY: Multi-Health Systems Inc.
Evans, S.W., & Short, E.J. (1991). A qualitative and serial analyses of social problem solving in
aggressive boys. Journal of Abnormal Psychology, 19, 331-340.
Fagan, J. (1990). Social and legal policy dimensions of violent juvenile crime. Criminal Justice
and Behavior 17, 93-133.
Fink, A. D., & McCown, W. G. (1993). Impulsivity in children and adolescents: Measurement,
causes, and treatment. Washington, DC: American Psychological Association.
Fossati, A., DiCeglie, A., Acquarini, E., & Barratt, E.S. (2001). Psychometric properties of an
Italian version of the Barratt Impulsiveness Scale-11 (BIS-11) in nonclinical subjects.
Journal of Clinical Psychology, 57, 815-828.
Frey, K.S. Hirschstein, M.K., & Guzzo, B.A. (2000). Second step: preventing aggression by
promoting social competence. Journal of Emotional and Behavioral and Disorders, 8,
102-112.
Fulwiler, C., Eckstine, J., & Kalsy, S. (2005). Impulsive-Aggressive Traits, Serotonin Function,
and Alcohol-Enhanced Aggression. Journal of Clinical Pharmacology, 45, 94-100.

105
Giancola, P.R. (2000). Executive functioning: A conceptual framework for alcohol-related
aggression. Experimental and Clinical Psychopharmacology, 8, 576–597.
Giancola, P.R. (2003). The moderating effects of dispositional empathy on alcohol-related
aggression in men and women. Journal of Abnormal Psychology, 112, 275-281.
Gottfredson, M., & Hirschi, T. (1990). A General Theory of Crime. Stanford, CA: Stanford
University Press.
Gray, J.A., Owen, S., Davis, N., & Tsaltas, E. (1983). Psychological and physiological relation
between anxiety and impulsivity. In M. Zuckerman (Ed.), The biological basis of
sensation seeking, impulsivity, and anxiety (pp. 181-227). Hillsdale, NJ: Erlbaum.
Grier P.E. (1988). Cognitive problems solving in anti-social rapist. Criminal Justice and
Behaviour, 15, 501-514.
Guerra, N.G., & Slaby, R.G. (1990). Cognitive Mediators of Aggression in Adolescent
Offenders : 2. Intervention. Developmental Psychology, 26(2), 269-277.
Hains, A.A. & Ryan, E.B. (1983). The development of social cognitive processes among juvenile
delinquents and non-delinquent peers. Child Development, 54, 1536-1544.

106
Houston, R. J., & Stanford, M. S. (2005). Electrophysiological substrates of impulsiveness:
Potential effects on aggressive behavior. Progress in Neuro-Psychopharmacology and
Biological Psychiatry, 29, 305-313.
Houston, R. J., Stanford, M.S., Villemarette-Pittman, N.R., Conklin, S.M., & Helfritz, L.E.
(2003). Neurobiological correlates and clinical implications of aggressive subtypes.
Journal of Forensic Neuropsychology, 3, 67-87.
Howell, D. (2002). Statistical methods for psychology (5th ed.). Pacific Grove, CA: Duxbury.
Howells, C.R. (1986). Social skills training and criminal and antisocial behaviour in adults. In
Hollin C.R., & Trower, P. (Eds.). Handbook of Social Skills Training, Volume 1:
Applications Across the Life Span. Oxford: Pergamon Press: 185-210.
Hoyle, R. H., & Panter, A. T. (1995). Writing about structural equation models. In R. H. Hoyle
(Ed.), Structural equation modeling (pp. 158-176). Thousand Oaks, CA: Sage.
Ireland, J.L. & Archer, J. (2004). The association between measures of aggression and bullying
among juvenile and young offenders. Aggressive Behavior, 30, 29-42.
Kazdin, A.E., Esveldt-Dawson, K., French, N.H., & Unis, A.S. (1987). Problem-solving skills
training and relationship therapy in the treatment of anti-social behavior. Journal of
Consulting and Clinical Psychology, 55, 76-85.

107
Keltikangas-Jarvinen, L., & Kangas, P. (1988). Problem solving strategies in aggressive and
nonaggressive children. Aggressive Behavior, 14, 255-264.
Keltikangas-Jarvinen, L. (2001). Aggressive behavior and social problem-solving strategies: A
review of the finding of a seven-year follow-up from childhood to late adolescence.
Criminal Behaviour and Mental Health, 11, 236-250.
King, R.J., Jones, J., Scheuer, J.W., Curtis, D., & Zarcone, V.P. (1990). Plasma cortisol
correlates of impulsivity and substance abuse. Personality and Individual Difference, 11,
287-291.
Klinteberg, B.A.F., Andersson, T., Magnusson, D., & Stattin, H. (1993). Hyperactive Behavior
in childhood as related to subsequent alcohol problems and violent offending: A
longitudinal study of male subjects. Personality and Individual Differences, 15(4), 381-
388.
Kockler, T.R., Stanford, M.S., Nelson, C.E., Meloy, J.R., & Sanford, K. (2006). Characterizing
Aggressive Behavior in a Forensic Population. American Journal of Orthopsychiatry,
76(1), 80-85.

108
Kruedelbach, N., McCormick, R.A., Schulz, S.C., & Grueneich, R. (1993). Impulsivity, coping
styles, and triggers for craving in substance abusers with borderline
personality disorder. Journal of Personality Disorders, 7, 214-222.
Lane, S.D., & Cherek, D.R. (2000). Biological and behavioral investigation of aggression and
impulsivity. In D.H. Fishbein. (Ed). The science, treatment, and prevention of antisocial
behaviors: Application to the criminal justice system. (pp. 5-1-5-21). xiii, 27-25 pp.
Kingston, NJ, US: Civic Research Institute.
LaPlace, A.C., Chermack, S.T., & Taylor, S.P. (1994). Effects of alcohol and drinking
experience on human physical aggression. Pers. Social Psychol. Bull. 20, 439-444.
Lau, M.A., Pihl, R.O, & Peterson, J.B. (1995). Provocation, acute alcohol intoxication, cognitive,
performance, and aggression. Journal of Abnormal Psychology, 104, 150-155.
Lipsey, M.W., Wilson, D.B., Cohen, M.A., & Derzon, J.H. (1997). Is there a causal relationship
between alcohol use and violence? A synthesis of evidence. In M. Galanter (Ed.), Recent
developments in alcoholism: Alcohol and Violence (Vol. 13, pp. 245-282). New York:
Plenum Press.
Luengo, M.A., Carrillo-de-la-Pena, M.T., Otero, J.M. & Romero, E. (1994). A Short-Term
Longitudinal Study of Impulsivity and Antisocial Behavior. Journal of Personality and
Social Psychology, 66(3), 542-548.

109
Matthys, W., Cuperus, J.M., & van Engeland, H. (1999). Deficient social problems solving in
boys with ODD/CD, with ADHD, and with both disorders. Journal of the American
Academy of Child and Adolescent Psychiatry, 38, 311-321.
McCown, W. (1988). Multi-impulsive personality disorder and multiple substance abuse:
Evidence from members of self-help groups. British Journal of Addiction, 83, 431-432.
McGuire, J. (2000). Cognitive Behaviour Modification: An Integrative Approach. London: home
Office HM Inspectorate of Probation.
McGuire, J. (2001). What is problem solving? A review of theory, research and applications.
Criminal Behaviour and Mental Health, 11, 210-235.
McMurran, M., Egan, V., Blair, M., & Richardson, C. (2001). The relationship between social
problem-solving and personality in mentally disorder offenders. Personality and
Individual Differences, 30, 517-524.
McMurran, M., Blair, M., & Egan, V. (2002). An Investigation of the Correlations between
Aggression, Impulsiveness, Social Problem-Solving, and Alcohol Use, Aggressive
Behaviour, 28, 439-445.
110
McMurran, M., Egan, V., Richardson, C., & Ahmadi, S. (1999). Social problem-solving in
mentally disordered offenders: A brief report. Criminal Behaviour and Mental Health, 9,
315-322.
McMurran, M., Hollin, C.R. & Bowen, A. (1990). Consistency of alcohol self-report
measures in a male young offender population. British Journal of Addiction, 85,
205-208.
Moeller, E.G., Barratt, E.S., Dougherty, D.M., Schmitz, J.M., & Swann, A.C. (2001). Psychiatric
Aspects of Impulsivity. American Journal of Psychiatry, 158, 1783-1793.
Moeller, F.G., & Dougherty, D.M. (2001). Antisocial personality disorder, alcohol, and
aggression. Alcohol Research and Health, 25, 5-11.
Moeller, F.G., & Dougherty, D.M. (2002). Impulsivity and substance abuse: What is the
connection? Addictive Disorders and Their Treatment 1, 3-10.
Moeller, F.G., Dougherty, D.M., Barratt, E.S., Schmitz, J.M., Swann, A.C., & Grabowski, J.
(2001). The impact of impulsivity on cocaine use and retention in treatment. Journal of
Substance Abuse Treatment, 21, 193-198.
111
Moss, H.B., & Lynch, K.G. (2001). Comorbid disruptive behavior disorder symptoms and their
relationship to adolescent alcohol use disorder. Drug and Alcohol Dependency, 61, 75-
83.
Murdoch, D., Pihl, R.O. & Ross, D. (1990). Alcohol and crimes of violence: present issues.
International Journal of the Addictions, 25, 1065-1081.
National Research Council (1993). Understanding and Prevention of Violence. In A.J. Reiss, &
J.A. Roth (Eds.), Understanding and preventing violence. pp. 381 Washington, DC:
National Academy Press.
Nezu, A.M. (1985). Differences in psychological distress between effective and ineffective
problem solvers. Journal of Counselling Psychology, 32, 135-138.
Nezu, A.M. (1986a). Cognitive appraisal of problem solving effectiveness: Relation to
depression and depressive symptoms. Journal of Clinical Psychology, 42, 847-852.
Nezu, A.M. (1986b). Negative life stress and anxiety: Problem solving as a moderator variable.
Psychological Reports, 58, 279-283.
Nezu, A.M. (1987). A problem-solving formulation of depression: A literature review and
proposal of a pluralistic model. Clinical Psychology Review, 7, 121-144.

112
Nezu, A.M., & Carnevale, G.J. (1987). Interpersonal problem solving and coping reactions of
Vietnam veterans with posttraumatic stress disorder. Journal of Abnormal Psychology,
96, 155-157.
O’Boyle, M. & Barratt, E.S (1993). Impulsivity and DSM-III-R personality disorders.
Personality and Individual Differences, 14, 609-611.
O’Connor, D.B., Archer, J., & Wu, F. (2001). Measuring aggression: Self-reports, partner
reports, and responses to provocation situations. Aggressive Behavior, 27, 79-101.
Petry, N.M. (2001). Delay discounting of money and alcohol in actively using alcoholics,
currently abstinent alcoholics, and controls. Psychopharmacology, 154, 243-250.
Patton, J.H., Stanford, M.S., & Barratt, E.S. (1995). Factor structure of the Barratt Impulsiveness
Scale. Journal of Clinical Psychology, 51, 768-774
Paulhus, D.L. (1995). Impression Management scale: Short version from the BIDR – 6.
Unpublished instrument, University of British Columbia.
Paulhus, D.L. (1999). Paulhus Deception Scales. Toronto, Canada: Multi-Health Systems Inc.
Pedhazur, Elazer J. (1982). Multiple regression in behavioral research, 2nd edition. NY: Holt.

113
Pernanen, K. (1991). Alcohol in human violence. NY: Guilford.
Platt, J., Scura, W., & Hannon, J. (1973). Problem-solving thinking of youthful incarcerated
heroin addicts. Journal of Community Psychology, 31, 278-281.
Plutchik, R., & van Praag, H.M. (1995). The nature of impulsivity: Definitions, ontology,
genetics, and relations to aggression. In F. Hollander & D.J. Stein (Eds.), Impulsivity and
aggression (pp. 7-24). New York: Wiley.
Public Safety and Emergency Preparedness Canada (2006). Corrections and Conditional
Release Statistical Overview: Annual Report 2006. Ottawa, ON: Public Works
and Government Services Canada.
Raistrick, D., Dunbar, G., Davidson, R. (1983). Development of a questionnaire to develop
alcohol dependence. British Journal of Addictions, 78, 89-95.
Ramirez, J.M., & Andreu, J.M. (2006). Aggression, and some related psychological constructs
(anger, hostility, and impulsivity) Some comments from a research project. Neuroscience
and Biobehavioral Reviews, 30, 276-291.
Reiss, A.J., & Roth, J.A. (1993). Alcohol, other psychoactive drugs and violence. In A.J. Reiss,
& J.A. Roth (Eds.), Understanding and preventing violence (pp. 182-220). Washington,
DC: National Academy Press.

114
Richardson, D.S., & Green, L.R. (2003). Defining direct and indirect aggression: The Richardson
Conflict Response Questionnaire. International Review of Social Psychology, 16(3), 11-
30.
Robinson, D. (1991). Effectiveness of the Cognitive Skills Training Program: From Pilot to
National Implementation. Research Brief B– 07. Ottawa, ON: Correctional Service of
Canada.
Robinson, D. (1995). The Impact of Cognitive Skills Training on Post-Release
Recidivism among Canadian Federal Offenders. Ottawa: Correctional Service of Canada.
Robinson, D., Grossman, M., and Porporino, F. (1991). Effectiveness of the Cognitive Skills
Training Program: From Pilot to National Implementation, Research Brief No. B-07,
Ottawa, ON: Correctional Service of Canada.
Robinson, D., Porporino, F., & Beal, C. (1998). A Review of the Literature on
Personal/Emotional Need Factors. Research Report R-76 Ottawa, ON: Correctional
Service of Canada.
Ross, R.R., Fabiano, E.A., & Ross, R.D. (1986). Reasoning and Rehabilitation: A Handbook for
Reaching Cognitive Skills. Ottawa: University of Ottawa.

115
Seager, J.A. (2005). Violent Men: The Importance of Impulsivity and Cognitive Schema.
Criminal Justice and Behavior, 32(1), 26-49.
Serin, R. (1988). PCL/PCL-R and violence in prisoner. Unpublished doctoral dissertation,
Queen’s University, Kingston, Ontario, Canada
Serin, R.C., & Kuriychuk, M. (1994). Social and cognitive processing deficits in violent
offenders: Implications for treatment. International Journal of Law and Psychiatry, 174.
431-441.
Seroczynski, A.D., Bergeman, C.S., & Coccaro, E.F. (1999). Etiology of the
impulsivity/aggression relationship: Genes or environment? Psychiatry Research, 86, 41-
57.
Shure, M.B. (1997). Interpersonal Cognitive Problem Solving: Primary Prevention of Early
High-Risk Behaviors in the Preschool and Primary Years. In G. Albee, & T. Gullotta
(Eds.), Primary Prevention Works (pp. 167-188). Thousand Oaks, CA: Sage Publications.
Shure, M.B. & Spivack, G. (1982). Interpersonal problem-solving in young children: A cognitive
approach to prevention. American Journal of Community Psychology, 10, 341-355.
116
Shure, M.B., & Spivack, G. (1988). Interpersonal Cognitive Problem Solving. In R.H. Price, E.L.
Cowen, R.P. Lorion, & J. Ramos-McKay (Eds.), 14 Ounces of Prevention: A Casebook
for Practitioners (pp. 69-82). Washington, DC: American Psychological Association.
Spivack, G., Platt, J., & Shure, M.B. (1976). The problem solving approach to adjustment. San
Francisco: Jossy-Bass.
Stage, F.H., Carter, H.C. & Nora, A. (2004) Path Analysis: An introduction and analysis of a
decade of research. The Journal of Educational Research, 98 (1), 5-12.
Stanford, M.S., Greve, K.W., & Dickens, T.J. (1995). Irritability and impulsiveness:
Relationship to self-reported impulsive aggression. Individual and Personality
Differences, 19 (5), 757-760.
Stanford, M.S., Houston, R.J., Mathias, C.W., Villemarette-Pittman, N.R., Helfritz, L.E., &
Conklin, S.M. (2003). Characterizing Aggressive Behavior. Assessment, 10, 183-90.
Stanford, M. S., Houston, R. J., Villemarette-Pittman, N. R. and Greve, K. W. (2003).
Premeditated aggression: Clinical assessment and cognitive psychophysiology.
Personality and Individual Differences, 34, 773-781
Slaby, R.G. & Guerra, N.G. (1988). Cognitive mediators of aggression in adolescent offenders 1:
Assessment. Developmental Psychology, 24, 580-588.
117
Streiner, D.L. (2006). Finding our way: An introduction to Path Analysis. Canadian Journal of
Psychiatry, 50 (2), 115-122.
Sullivan, M.A., Rudnik-Levin, R., (2001). Attention deficit/hyperactivity disorder and substance
abuse. Diagnostic and therapeutic considerations. Annals of the New York Academy of
Sciences, 931, 251-270.
Swann, A.C., Bjork, J.M., Moeller, F.G., Dougherty, D.M. (2002). Two models of impulsivity:
Relationship to personality traits and psychopathology. Biological Psychiatry, 51, 988-
994.
Swann, A.C. & Hollander, E. (2000). Impulsivity and Aggression: Diagnostic Challenges for the
Clinician. Arlington Heights, IL: Access Medical Group, Department of Continuing
Medical Education.
Tabachnick, B.G. & Fidell, L.S. (2001). Using Multivariate Statistics, Fourth Edition. Needham
Heights, MA: Allyn & Bacon.
Taylor, S.P. & Chermack, S.T. (1993). Alcohol, drugs and human physical aggression. Journal
of Studies on Alcohol, suppl. 11,78–88.

118
Vitacco, M.J., Neumann, C.S., Robertson, A.A. & Durrant, S.L. (2002). Contributions of
impulsivity and callousness in the assessment of adjudicated male adolescents: A
prospective study, Journal of Personality Assessment, 78, 87-103.
White, J.L. Moffitt, T.E., Caspi, A., Jeglum Bartusch, D., Needles, D.J. & Stouthamer-Loeber,
M. (1994). Measuring Impulsivity and Examining its Relationship to Delinquency.
Journal of Abnormal Psychology, 103(2), 192-205.

119
APPENDIX A
CONSENT FORM
You are invited to participate in a study about a possible link between violence and factors such as a person’s impulsiveness, ability to solve problems and alcohol use. Please read this form carefully and feel free to ask questions you might have. The purpose of this consent form is to describe the study to you and to obtain your permission to take part in it. Student Researcher:
Dena Derkzen – Tel: (306) 966 – 6719 Email: [email protected] Department of Psychology, University of Saskatchewan
Faculty Supervisor:
Dr. Stephen Wormith – Tel: (306) 966 – 6818 Email: [email protected] Department of Psychology, University of Saskatchewan
Purpose and Procedure: The purpose of this study is to understand some of the factors that might be related to aggression in offenders. We would like to give you 6 questionnaires that will require about 45 - 60 minutes to answer. Some examples of the types of questions that may be asked include: Please choose the word that describes you the best.
1. I have no trouble controlling my temper. Rarely Occasionally Often Always
2. I like to spend my money. Rarely Occasionally Often Always 3. I like to move from job to job. Rarely Occasionally Often Always
4. I hate having to solve the problems Rarely Occasionally Often Always
that occur in life. Potential Risks: You should not experience any negative consequences by participating in this study. Potential Benefits: By taking part in this study, you may help increase our knowledge about the causes of violence and aggression. More specifically, your participation may increase our understanding of the relationship between a person’s impulsiveness, ability to solve problems, alcohol use and aggression. This may ultimately help to improve the development and quality of community and facility treatment programs.
Consent Form
Aggression and the inter-relations of impulsivity, social problem solving and alcohol use.

120
Right to Withdraw: Your participation in this project is entirely voluntary and you are free to withdraw or choose not to complete these questionnaires at any time. Deciding to withdraw or choosing not to participate in the study will have no negative consequences and will have no affect on your treatment by the staff at your correctional institution. If you withdraw from the study, any information that you have contributed will be destroyed. Confidentiality: Your answers to the questions are private; you are asked to NOT put your name or any other identifying information on the questionnaire. Therefore, nobody, including the researcher, will know how you answered any questions. Although every effort will be made to ensure confidentiality and anonymity, because the questionnaire may be completed in a classroom setting this cannot be assured. During recruitment you may be identified as a participant if you agree to volunteer in this study. The information gathered from this study may be presented in journal articles and conference presentations however; all of the responses will be reported in a summarized/aggregate form which will NOT allow you to be identified. A summary of the results will be provided to your unit and/or institution upon completion of this project. Storage of Data: If you chose to participate your responses will be held confidential and only the researchers will have access to the completed surveys, which will be securely stored by the research supervisor at the University of Saskatchewan for a minimum of five years upon completion of the study. Questions: If you have any questions concerning the study, please feel free to ask at any point; you are also free to contact the researchers at the number provided below if you have any questions at a later time. This project was approved by the University of Saskatchewan, Behavioural Ethics Research Board on (June 16th, 2005). If you have any questions or concerns about this survey or your rights as a participant in this survey or your participation in this study, please contact Dena Derkzen at (306) 966 – 6719 [e-mail: [email protected]] or Office of Research Services, (306) 966 – 2084. Collect calls are accepted by the Office of Research Services. You may contact the researcher at the address below if you would like the results of the study. Please take a moment to decide if you want to participate. Consent to Participate: I have read and understood the description provided above. I have been provided with an opportunity to ask questions and my questions have been answered satisfactorily. I consent to participate in the study described above, understanding that I may withdraw this consent at any time. A copy of this consent form has been given to me for my records. ____________________________________________ Date: _______________________ Signature of Participant ____________________________________________ Signature of Researcher Dena Derkzen Department of Psychology 9 Campus Drive, Saskatoon, Saskatchewan S7N 5A5 Phone: (306) 966 – 6719

121
APPENDIX B
GENERAL AGGRESSION MEASURE
BPAQ (Buss & Perry, 1992).
Instructions: Using the 5 point scale shown below, read the following items and decide to what extent each statement is like or unlike you. Please indicate your rating by circling the corresponding number to the right of each statement.
Very unlike me
▼
Somewhat unlike me
▼
Neither unlike me nor like me
▼
Somewhat like me
▼
Very like me
▼
1. Some of my friends think I am a hothead.
1
2
3
4
5
2. If I have to resort to violence to protect my rights, I will.
1
2
3
4
5
3. When people are especially nice to me, I wonder what
they want.
1
2
3
4
5
4. I tell my friends openly when I disagree with them.
1
2
3
4
5
5. I have become so mad that I have broken things.
1
2
3
4
5
6. I can’t help getting into arguments when people
disagree with me.
1
2
3
4
5
7. I wonder why sometimes I feel so bitter about things.
1
2
3
4
5
8. Once in a while, I can’t control the urge to strike
another person.
1
2
3
4
5
9. I am an even-tempered person.
1
2
3
4
5
10. I am suspicious of overly friendly strangers.
1
2
3
4
5
11. I have threatened people I know.
1
2
3
4
5
12. I flare up quickly but get over it quickly.
1
2
3
4
5
13. Given enough provocation, I may hit another person.
1
2
3
4
5
14. When people annoy me, I may tell them what I think of
them.
1
2
3
4
5
15. I am sometimes eaten up with jealousy.
1
2
3
4
5
16. I can think of no good reason for ever hitting a person.
1
2
3
4
5
17. At times I feel I have gotten a raw deal out of life.
1
2
3
4
5

122
Very unlike
me
▼
Somewhat unlike me
▼
Neither
unlike me nor like me
▼
Somewhat
like me
▼
Very like
me
▼ 18. I have trouble controlling my temper.
1
2
3
4
5
19. When frustrated, I let my irritation show.
1
2
3
4
5
20. I sometimes feel that people are laughing at me behind
my back.
1
2
3
4
5
21. I often find myself disagreeing with people.
1
2
3
4
5
22. If somebody hits me, I hit back.
1
2
3
4
5
23. I sometimes feel like a powder keg ready to explode.
1
2
3
4
5
24. Other people always seem to get the breaks.
1
2
3
4
5
25. There are people who pushed me so far that we came
to blows.
1
2
3
4
5
26. I know that ‘friends’ talk about me behind my back.
1
2
3
4
5
27. My friends say that I’m somewhat argumentative.
1
2
3
4
5
28. Sometimes I fly off the handle for no good reason.
1
2
3
4
5
29. I get into fights a little more than the average person.
1
2
3
4
5

123
APPENDIX C
IMPULSIVE PREMEDITATED AGGRESSION SCALE IPAS (Stanford et al., 2003).
Instructions: When people become frustrated, angry or enraged they express that anger in a variety of ways. An aggressive act is defined as striking and/or verbally insulting another person or breaking/throwing objects because you were angry or frustrated. Take a minute and think about your aggressive acts during your last 6 months in the community. Now please answer the following questions with these aggressive acts in mind. Please indicate your rating by circling the corresponding number to the right of each statement.
Strongly Disagree
▼
Disagree
▼
Neutral
▼
Agree
▼
Strongly Agree ▼
1. I planned when and where my anger was
expressed.
1
2
3
4
5
2. I felt my outbursts were justified.
1
2
3
4
5
3. When angry I reacted without thinking.
1
2
3
4
5
4. I typically felt guilty after the aggressive acts.
1
2
3
4
5
5. I was in control during the aggressive acts.
1
2
3
4
5
6. I feel my actions were necessary to get what I
wanted.
1
2
3
4
5
7. I usually can’t recall the details of the incidents
well.
1
2
3
4
5
8. I understood the consequences of the acts
before I acted.
1
2
3
4
5
9. I feel I lost control of my temper during the
acts.
1
2
3
4
5
10. Sometimes I purposely delayed the acts until a
later time.
1
2
3
4
5
11. I felt pressure from others to commit the acts.
1
2
3
4
5
12. I wanted some of the incidents to occur.
1
2
3
4
5
13. I feel some of the incidents went too far.
1
2
3
4
5
14. I think the other person deserved what
happened to them during some of the incidents.
1
2
3
4
5
15. I became agitated or emotionally upset prior to
the acts.
1
2
3
4
5

124
Strongly Disagree
▼
Disagree
▼
Neutral
▼
Agree
▼
Strongly Agree ▼
16. The acts led to power over others or improved
social status for me.
1
2
3
4
5
17. I was under the influence of alcohol or other
drugs during the acts.
1
2
3
4
5
18. I knew most of the persons involved in the
incidents.
1
2
3
4
5
19. I was concerned for my personal safety during
the acts.
1
2
3
4
5
20. Some of the acts were attempts at revenge.
1
2
3
4
5
21. I feel I acted out aggressively more than the
average person over the last six months.
1
2
3
4
5
22. I was confused during the acts.
1
2
3
4
5
23. Prior to the incidents I knew an altercation was
going to occur.
1
2
3
4
5
24. My behaviour was too extreme for the level of
provocation.
1
2
3
4
5
25. My aggressive outbursts were usually directed
at a specific person.
1
2
3
4
5
26. I consider the acts to have been impulsive.
1
2
3
4
5
27. I was in a bad mood the day of the incident.
1
2
3
4
5
28. The acts were a “release” and I felt better
afterwards.
1
2
3
4
5
29. I am glad some of the incidents occurred.
1
2
3
4
5
30. Anything could have set me off prior to the
incidents.
1
2
3
4
5

125
APPENDIX D
IMPULSIVITY MEASURE
BIS – 11 (Patton, Stanford & Barratt, 1995).
Directions: People differ in the ways they act and think in different situations. This is a test to measure some of the ways in which you act and think. Read each statement and place a check in the appropriate box on the right side of the page. Do not spend too much time on any statement. Answer quickly and honestly.
Rare
ly/Ne
ver
Occa
siona
lly
Often
Alwa
ys
1. I plan tasks carefully.
2. I do things without thinking.
3. I am happy-go-lucky.
4. I have “racing” thoughts.
5. I plan trips well ahead of time.
6. I am self-controlled.
7. I concentrate easily.
8. I save regularly.
9. I find it hard to sit still for long periods of time.
10. I am a careful thinker.
11. I plan for job security.
12. I say things without thinking.
13. I like to think about complex problems.
14. I change jobs.
15. I act “on impulse”.
16. I get easily bored when solving thought problems.
17. I have regular medical/dental checkups.
18. I act on the spur of the moment.
19. I am a steady thinker.
20. I change where I live.
21. I buy things on impulse.
22. I finish what I start.
23. I walk and move fast.
24. I solve problems by trial-and-error.
25. I spend or charge more than I earn.
26. I talk fast.
27. I have outside thoughts when thinking.
28. I am more interested in the present than the future.
29. I am restless at lectures or talks.
30. I plan for the future.

126
APPENDIX E
ALCOHOL USE
Alcohol Related Questions (McMurran et al., 2003)
1. How many days per week did you drink alcohol?
0 1 2 3 4 5 6 7
2. How many days per week did you drink more than five drinks?
0 1 2 3 4 5 6 7
3. How would you have rated yourself as a drinker: non-drinker, light drinker, moderate drinker, or
a heavy drinker?
Non-Drinker Light Moderate Heavy
This section asks you some questions about your drinking habits PRIOR to your custody. Please answer the questions as honestly as you can.

127
APPENDIX F
ALCOHOL DEPENDENCY
SADD (Davidson & Raistrick, 1986; Raistrick et al., 1983) Instructions: The following questions cover a wide range of topics having to do with drinking. Please read each question carefully, but do not think too much about its exact meaning. Think about your drinking habits PRIOR to your custody and answer each question by circling the most correct answer.
Never
▼
Sometimes
▼
Often
▼
Nearly Always ▼
1. Do you find difficulty in getting the thought of drinking out of your mind?
0
1
2
3
2. Is getting drunk more important than your next meal?
0
1
2
3
3. Do you plan your day around when and where you can drink?
0
1
2
3
4. Do you drink in the morning, afternoon, and evening?
0
1
2
3
5. Do you drink for the effect of alcohol without caring what the drink is?
0
1
2
3
6. Do you drink as much as you want irrespective of what you are doing the
next day?
0
1
2
3
7. Given that many problems might be caused by alcohol, do you still drink too
much?
0
1
2
3
8. Do you know that you won't be able to stop drinking once you start?
0
1
2
3
9. Do you try to control your drinking by giving it up completely for days or
weeks at a time?
0
1
2
3
10. The morning after a heavy drinking session do you need your first drink to
get yourself going?
0
1
2
3
11. The morning after a heavy drinking session do you wake up with a definite
shakiness of your hands?
0
1
2
3
12. After a heavy drinking session do you wake up and retch or vomit?
0
1
2
3
13. The morning after a heavy drinking session do you go out of your way to
avoid people?
0
1
2
3
14. After a heavy drinking session do you see frightening things that later you
realize were imaginary?
0
1
2
3
15. Do you go drinking and the next day and find that you have forgotten what
happened the night before?
0
1
2
3

128
APPENDIX G
IMPRESSION MANAGEMENT
IM scale from BIDR Version 6 (Paulhus, D.L., 1995)
Using the scale below as a guide, write a number beside each statement to indicate how true it is.
+ + + + + + + 1 2 3 4 5 6 7 not true somewhat very true
____ 1. I never cover up my mistakes. ____ 2. There have been occasions when I have taken advantage of someone. ____ 3. I always obey laws, even if I'm unlikely to get caught. ____ 4. I have said something bad about a friend behind his/her back. ____ 5. When I hear people talking privately, I avoid listening. ____ 6. I have received too much change from a salesperson without telling him or her. ____ 7. When I was young, I sometimes stole things. ____ 8. I have never dropped litter on the street. ____ 9. I never look at sexy books or magazines. ____ 10. I have done things that I don't tell other people about. ____ 11. I have pretended to be sick to avoid work or school. ____ 12. I don't gossip about other people's business.

129
APPENDIX H
OFFENCE HISTORY AND DEMOGRAPHICS
1. Have you ever been convicted of any of the following violent offences. If so, please indicate which
offences by checking the appropriate box beside each item. Also, please indicate whether the offence occurred in the community or in an institution by checking the correct box to the right of each item.
Convictions (please check all that apply)
Location of Offence
Armed Robbery Community Institution Robbery with violence Community Institution
Attempted Murder Community Institution Causing bodily harm with intent to wound Community Institution Kidnapping Community Institution Abduction Community Institution
Forcible Confinement Community Institution Aggravated Assault Community Institution Choking Community Institution Administering a noxious thing Community Institution
Assault causing bodily harm Community Institution Assault with a weapon Community Institution Assault Community Institution Assaulting a police officer Community Institution
Murder Community Institution Manslaughter Community Institution Criminal negligence causing death Community Institution
I have never been convicted of any of the above listed offences
General Information. This section asks some general questions about you. However, the information you provide cannot be used to identify you.

130
2. Have you ever had any violent convictions involving domestic violence (wife, spouse or partner)? Yes No
a. If yes, how many convictions for domestic violence have you had? __________________
3. Have you ever had any “institutional misconducts” for violent behaviour (e.g. fighting with other inmates, assaulting staff etc.)?
Yes No
a. If yes, how many violent institutional misconducts have you had? __________________
4. Current Institution:
Saskatoon Correctional Centre (SCC) Prince Albert Correctional Centre (PACC)
5. What are your current charges or convictions? 6. Please indicate your ethnicity:
First Nations Métis Inuit Caucasian Black Hispanic East Indian Asian: please specify_______________ Other: please specify_______________
7. Highest level of education/grade completed_________________ 8. Please indicate your age: ______________years
Thank you for completing this Questionnaire!

131
APPENDIX I
CORRELATIONS WITH UNTRANSFORMED AGGRESSION MEASURE
Table I.1
Pearson Correlation Coefficients Among Variables (N =179) Note. * p < .05 ** p < .01; TR = Transformed ZRES = Standardized Residuals
Aggression
BPAQ
Impulsivity
BIS
Alcohol
Dependency SADD
Social Problem Solving
SPSI
Impulsive
Aggression IPAS: IA
Premeditated Aggression IPAS: PM
Aggression BPAQ --
Impulsivity BIS .424** --
Alcohol Dependency
SADD .220** .231** --
Social Problem Solving
SPSI
-.332** -.571** -.369** --
Impulsive Aggression IPAS: IA
.527** .379** .339** -.500** --
Premeditated Aggression IPAS: PM
.491** .391** .177* -.321** .364** --
Impression Management
IM -.245** -.190* .018 .152* -.158* -.169*

132
APPENDIX J
REGRESSION ANALYSIS CONTROLLING FOR IM
Regression Analyses to control for Impression Management (IM) (N =179)
Regression Analyses B SE B β
t p
BPAQ on IM -4.84 1.47 -.245 -3.30 .001
BIS on IM -2.11 .828 -.190 -2.55 .012
SPSI on IM 2.85 1.10 .194 2.59 .010
IPAS-IM on IM -.820 .390 -.158 -2.1 .037
IPAS-PM on IM -1.32 .586 -.169 -2.25 .026
Note. B = unstandardized regression coefficient; SE = Standard error of unstandardized regression coefficients

133
APPENDIX K
PATH ANALYSIS RESULTS WITHOUT CONTROLLING
FOR IMPRESSION MANAGMENT
Note. * p < .05 ** p < .01
Figure K1. Path analysis results for proposed model of aggression with complete sample n = 175 Fit indices χ2 (1, n = 175) = 15.98, p < .001 CFI = .89 NFI = .89 AIC = 42.69 RMSEA = .293, RMSEALO = .178, RMSEAHI = .428
Impulsivity .34
SPSI
.21
Aggression
.05
Alcohol
.23**
-.59** -.13
.08
e1
e2
e3
.34**
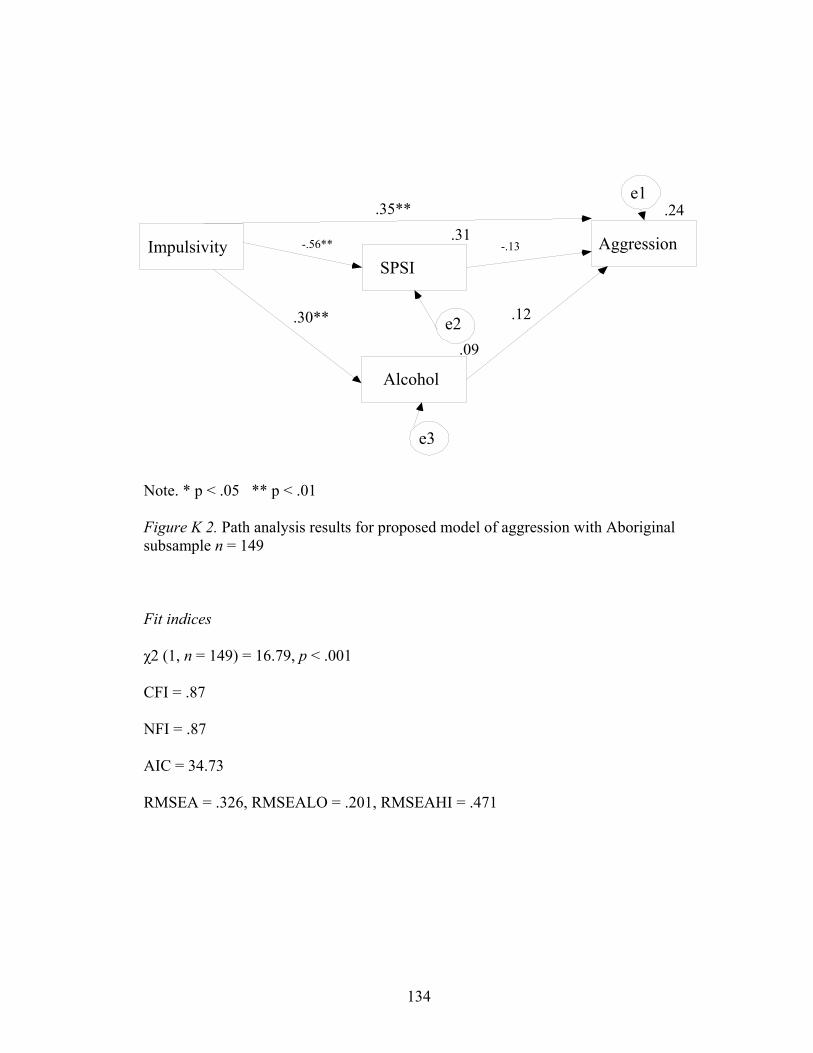
134
Note. * p < .05 ** p < .01
Figure K 2. Path analysis results for proposed model of aggression with Aboriginal subsample n = 149 Fit indices χ2 (1, n = 149) = 16.79, p < .001 CFI = .87 NFI = .87 AIC = 34.73 RMSEA = .326, RMSEALO = .201, RMSEAHI = .471
Impulsivity .31
SPSI
.24
Aggression
.09
Alcohol
.30**
-.56** -.13
.12
e1
e2
e3
.35**

135
Note. * p < .05 ** p < .01
Figure K 3. Path analysis results for post hoc model of aggression with complete sample n = 175 Fit indices χ2 (1, n = 149) = 2.31, p = .128 CFI = .99 NFI = .99 AIC = 28.31 RMSEA = .087, RMSEALO = .000, RMSEAHI = .240
SPSI
Alcohol
.34
Impulsivity
.20
Aggression
-.58**
.02
e1 e2
-.37
.41**
.11
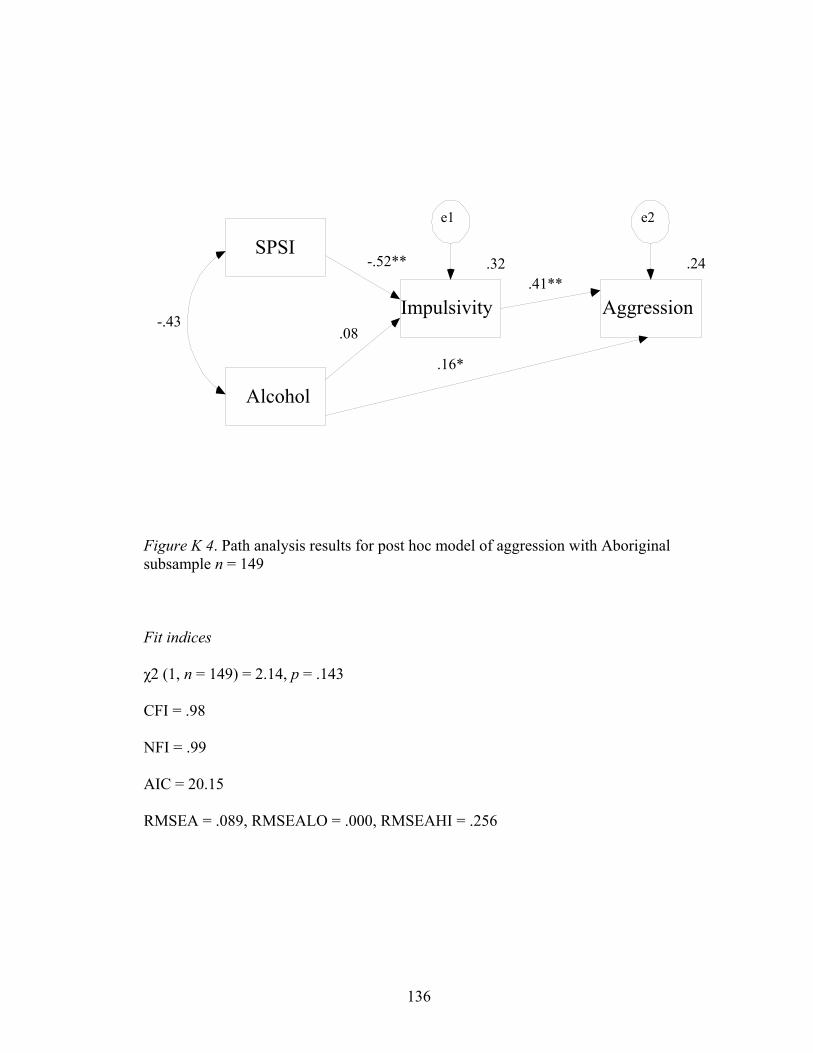
136
Figure K 4. Path analysis results for post hoc model of aggression with Aboriginal subsample n = 149 Fit indices χ2 (1, n = 149) = 2.14, p = .143 CFI = .98 NFI = .99 AIC = 20.15 RMSEA = .089, RMSEALO = .000, RMSEAHI = .256
SPSI
Alcohol
.32
Impulsivity
.24
Aggression
-.52**
.08
e1 e2
-.43
.41**
.16*