Parents’ Reactions to Youths’ Hyperactivity, Impulsivity, and Attention Problems
© 2012 The Authors
Addiction © 2012 Society for the Study of Addiction
Running head: IMPULSIVITY TRAJECTORIES AND GAMBLING
Impulsivity Trajectories and Gambling in Adolescence among Urban Male Youth 1
Weiwei Liu1
Grace P. Lee2
Asha Goldweber2
Hanno Petras2, 3
Carla L. Storr2, 4
Nicholas S. Ialongo2
Silvia S. Martins5*
1NORC at the University of Chicago.
2Department of Mental Health, Johns Hopkins University.
3JBS International Inc.
4Department of Family and Community Health, University of Maryland.
5Department of Epidemiology, Columbia University.
*Corresponding author:
Silvia S. Martins, M.D., Ph.D.
Department of Epidemiology
Columbia University Mailman School of Public Health
722 West 168th street, Rm. 509
New York, NY 10032
Phone: 212-305-2848/410-929-9303
E-mail: [email protected]
Declarations of interest: None.
Total word count: 3,492
This article has been accepted for publication and undergone full peer review but has not been through the
copyediting, typesetting, pagination and proofreading process, which may lead to differences between this
version and the Version of Record. Please cite this article as doi: 10.1111/add.12049 Acc
epte
d A
rticl
e
Impulsivity Trajectories and Gambling
2
© 2012 The Authors
Addiction © 2012 Society for the Study of Addiction
Abstract
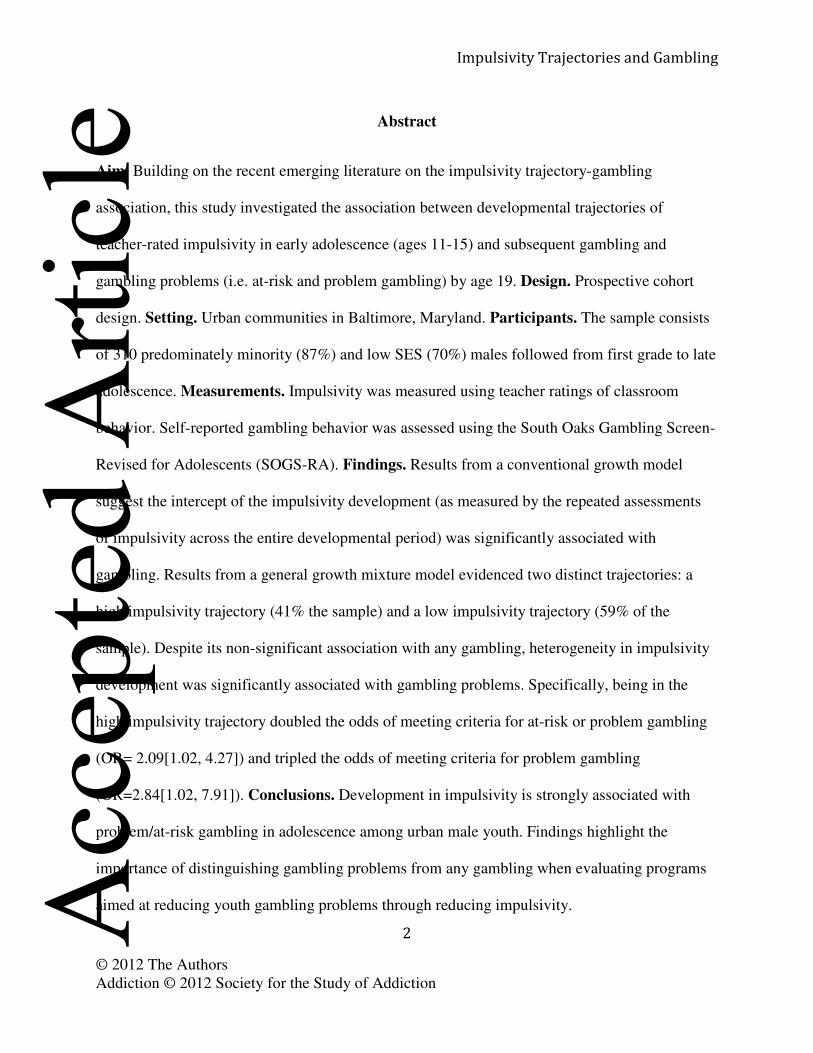
Aim. Building on the recent emerging literature on the impulsivity trajectory-gambling
association, this study investigated the association between developmental trajectories of
teacher-rated impulsivity in early adolescence (ages 11-15) and subsequent gambling and
gambling problems (i.e. at-risk and problem gambling) by age 19. Design. Prospective cohort
design. Setting. Urban communities in Baltimore, Maryland. Participants. The sample consists
of 310 predominately minority (87%) and low SES (70%) males followed from first grade to late
adolescence. Measurements. Impulsivity was measured using teacher ratings of classroom
behavior. Self-reported gambling behavior was assessed using the South Oaks Gambling Screen-
Revised for Adolescents (SOGS-RA). Findings. Results from a conventional growth model
suggest the intercept of the impulsivity development (as measured by the repeated assessments
of impulsivity across the entire developmental period) was significantly associated with
gambling. Results from a general growth mixture model evidenced two distinct trajectories: a
high impulsivity trajectory (41% the sample) and a low impulsivity trajectory (59% of the
sample). Despite its non-significant association with any gambling, heterogeneity in impulsivity
development was significantly associated with gambling problems. Specifically, being in the
high impulsivity trajectory doubled the odds of meeting criteria for at-risk or problem gambling
(OR= 2.09[1.02, 4.27]) and tripled the odds of meeting criteria for problem gambling
(OR=2.84[1.02, 7.91]). Conclusions. Development in impulsivity is strongly associated with
problem/at-risk gambling in adolescence among urban male youth. Findings highlight the
importance of distinguishing gambling problems from any gambling when evaluating programs
aimed at reducing youth gambling problems through reducing impulsivity. Acc
epte
d A
rticl
e

Impulsivity Trajectories and Gambling
3
© 2012 The Authors
Addiction © 2012 Society for the Study of Addiction
Key words: Impulsivity; Gambling; Problem gambling; Convention growth model; General
growth mixture model.
Acc
epte
d A
rticl
e

Impulsivity Trajectories and Gambling
4
© 2012 The Authors
Addiction © 2012 Society for the Study of Addiction
Youth problem gambling is widespread and associated with a broad range of high-risk
behaviors such as delinquency and substance use [1], and thus is a public health concern.
Research has focused on examining the developmental antecedents (such as impulsivity,
depression, and anxiety) of gambling in late adolescence/early adulthood [2]. Impulsivity has
received the most attention [3-6]. Many scholars have taken note on the multifaceted nature of
impulsivity as well as the heterogeneity in its manifestation [7-10]. Despite the difficulty in
defining a single trait of impulsivity, two elements must be present, i.e. an impulse or an urge to
act and a lack of inhibition or restrain of that urge [11]. Thus, impulsivity is defined as a
tendency towards making rush decisions without carefully considering potential negative
consequences [12]).
Despite evidence that impulsivity is not stable during adolescence [13-15], most studies
evaluating the impulsivity-gambling association have only measured impulsivity at a single
point-in-time and gambling either concurrently or at a later time-point. Longitudinal links
between the development of impulsivity and late adolescent gambling have not been adequately
explored. Most studies were based on samples of French Canadian, predominantly Caucasian
adolescents [3,5], leaving low socio-economic status (SES), minority, urban youth understudied.
Such oversight is problematic as this population is disproportionately more likely to exhibit both
higher levels of impulsivity [16] and problem gambling (e.g. [17-22]).
Characterized by an imbalance between a reasonably-developed reward and punishment
processing system and an underdevelopment of impulse control [23], adolescents are vulnerable
to risk-taking behaviors including problem gambling [24]. Such vulnerability, together with easy Acc
epte
d A
rticl
e

Impulsivity Trajectories and Gambling
5
© 2012 The Authors
Addiction © 2012 Society for the Study of Addiction
access of gambling opportunities, has resulted in most North American adolescents engaging in
gambling activities [25]. The prevalence of gambling problems among adolescents (3-8%) is
significantly higher than that among adults (1-3%; [25]).
Several theories make the impulsivity-gambling association plausible. Jacobs’ general
theory of addictions [26] proposes that highly stimulating activities, such as gambling, are often
pursued as means to relieve stress. Individuals with a greater propensity for risk taking and
sensation seeking, both important components of impulsivity [27], tend to be more exposed to
excessive chronic stress resulted from a hypo-aroused psychological state [28], and, in turn, are
more likely to engage in addictive behavior such as gambling. Jessor and Jessor’s problem
behavior theory [29] posits problem behaviors, such as gambling, substance use, and criminal
offending often co-occur in a problem behavior syndrome, and individuals’ likelihood of
engaging in such behaviors is strongly associated with their levels of impulsivity.
Research examining the development of impulsivity during adolescence, shows a general
downward trend (e.g. [13]) as well as interindividual heterogeneity in that trend [30,31]. To date,
Betancourt et al. [30] is the only study that related developmental heterogeneity in impulsivity to
gambling (although not as the main focus of the study): the authors found three longitudinal
profiles in impulsivity among a sample of predominately middle-class Caucasian youth followed
from age 10 to 15: low (6%), moderate (57%), and high (37%) trajectories. Youth in the high
impulsivity trajectory were twice as likely to engage in gambling by age 15, compared to those
in the moderate and low impulsivity groups.
While Betancourt and colleagues’ findings [30] are informative, impulsivity and
gambling were measured during the same time periods, blurring the directionality of the Acc
epte
d A
rticl
e
Impulsivity Trajectories and Gambling
6
© 2012 The Authors
Addiction © 2012 Society for the Study of Addiction
association. The authors only studied any involvement in gambling without distinguishing
problem gamblers from those who did not meet criteria for problem gambling. Not making such
a distinction hinders the ability to study what distinguishes gambling problems from any
gambling which is very relevant from an etiological as well as a prevention perspective.
Based upon theories that make the impulsivity-gambling association plausible [26-29],
the present study aims to explore the association between impulsivity development in early
adolescence and gambling in late adolescence using growth modeling. First, we examine whether
the starting point and change of impulsivity during early adolescence (ages 11- 15) are related to
subsequent gambling among a sample of high-risk urban males. Second, we explore whether
there are distinct patterns (i.e. population heterogeneity) of impulsivity development among the
study sample. Third, we further investigate whether these distinct trajectories are differentially
related to subsequent gambling. We explore whether different trajectories are associated with
engaging in any gambling, meeting criteria for at-risk gambling or problem gambling, and
meeting criteria for problem gambling in late adolescence.
Acc
epte
d A
rticl
e

Impulsivity Trajectories and Gambling
7
© 2012 The Authors
Addiction © 2012 Society for the Study of Addiction
Methods
Sample
In 1993, 678 urban first-graders from 27 classrooms in nine elementary schools in
western Baltimore, Maryland participated in the Johns Hopkins University Preventive
Intervention Research Center (PIRC) Second Generation Intervention Trial [32]. Details about
the sample design and the trial are described elsewhere [32]. Out of the 362 males enrolled we
selected a sample of 310 males according to the following criteria: a) the individual had a valid
impulsivity assessment upon entering school (i.e. fall of first grade), b) the individual had at least
one of the five impulsivity assessments from ages 11 to 15 and c) the individual had valid
information on all covariates included in the analyses. Attrition analysis showed that selected
cases resembled the unselected cases on all variables included. Among the 310 selected males,
most were African American (87%), and 13% were Caucasian. Over 70% originated from low
SES families.
Measures
Impulsivity (ages 11 to 15). Impulsivity was assessed yearly from ages 11 to 15 as part
of the Teacher Report of Classroom Behavior Checklist (TRCBC; an adaptation of the Teacher
Observation of Classroom Adaptation-Revised (TOCA-R; [33])), a structured interview used in
grade one to three. The impulsivity subscale included three items: “waits for turn”, “interrupts or
intrudes on others”, and “blurts out answer before question is complete”. Ratings range from 1
(never) to 6 (always). The total item average scores were used and treated as continuous
variables. The Cronbach’s alpha coefficient for reliability ranged from 0.73 to 0.81 across the
Acc
epte
d A
rticl
e

Impulsivity Trajectories and Gambling
8
© 2012 The Authors
Addiction © 2012 Society for the Study of Addiction
five years. Similar teacher-rated impulsivity measures have been widely used and found to
predict self-reported gambling behavior in past studies (e.g. [34]).
Covariates. SES: receiving free or reduced-cost lunch or low-SES (1) and not receiving
free or reduced-cost lunch or high-SES (0) [35]. Race: African American (1) and Caucasian (0).
Age in fall of first grade: 7 years or younger (0) and older than 7 years (1). Impulsivity in fall of
first grade: TOCA-R impulsivity subscale. Intervention status in fall of first grade: intervention
(1) and control (0).
Gambling in late adolescence. To better capture the prevalence of meeting criteria for
gambling problems during late adolescence, study participants were interviewed about their past-
year gambling at ages 17, 19 and 20, and the highest score was taken. The interview used the
South Oaks Gambling Screen-Revised for Adolescents (SOGS-RA; [1]), an instrument adopted
from the adult- oriented SOGS [36] with wording of questions and responses modified to reflect
age-appropriate adolescent gambling behavior [37]. Respondents were first asked about their
involvement in gambling during the past 12 months. For those who reported involvement, a list
of 12 yes/no questions were asked based on the DSM-III-R criteria for pathological gambling,
and a SOGS-RA score was created as the sum of these 12 items, ranging from 0 to 12, with
higher scores indicating more gambling problems. The internal consistency reliability was
satisfactory (alpha=0.71).
To distinguish between any gambling and gambling problems, a four-level ordinal
variable was then created according to the recommended criteria [38] and to reflect the clear
ranking of the four levels of gambling involvement. Those who did not report past-year gambling A
ccep
ted
Arti
cle

Impulsivity Trajectories and Gambling
9
© 2012 The Authors
Addiction © 2012 Society for the Study of Addiction
were considered as non-gamblers (NG). Among those who reported past-year gambling, a score
of 0 or 1 indicates social gambling (SG), a score of 2 or 3 indicates meeting criteria for at-risk
gambling (AG), and a score of 4 or more indicates meeting criteria for problem gambling (PG).
This four-level ordinal gambling variable captures a continuous underlying propensity of
gambling, that is the latent propensity is only partially observed by the four categories. The
different thresholds or cut points presented in this variable provide a unique opportunity to test
the tipping point of the impulsivity-gambling association, i.e. it allows us to study the cumulative
probabilities of engaging in any gambling (i.e. being in the category of SG, AG, or PG), meeting
the criteria of at-risk or problem gambling (i.e. being in the category of AG or PG), and meeting
the criteria of problem gambling (i.e. being in the category of PG), given different levels of
impulsivity. Two-thirds of the sample (67%) has engaged in any gambling, 20% met criteria for
at- risk gambling or problem gambling, and 9% met criteria for problem gambling. The estimate
for problem gambling is considerably higher than those in previous studies using population
representative data from the U.S. (in which the percentage for problem gambling ranges from 3-
6%; [17, 22, 38, 39]), but lower than the estimates for boys in a study conducted by Wickwire
and colleagues [40] among inner-city mainly minority youth in Memphis, providing added
support for the general evidence that urban minority youths are more vulnerable to gambling
problems compared to their Caucasian counterparts.
Analytical plan
Conventional growth modeling (CGM) and general growth mixture modeling (GGMM;
[41]) were used to describe impulsivity development and to identify distinct developmental
trajectories of impulsivity from ages 11 to 15. Missing data on impulsivity measures over time Acc
epte
d A
rticl
e
Impulsivity Trajectories and Gambling
10
© 2012 The Authors
Addiction © 2012 Society for the Study of Addiction
were accounted for by using the full information maximum likelihood (FIML) estimation, a
widely accepted method to handle missing data [42,43]. Among the 310 males, 60% had valid
information on all five measures of impulsivity, 22% missed only one measure, and the
remaining 18% missed two or more measures. The bivariate coverage2 ranged from .70 to .89.
While a CGM is used to describe the functional form, i.e. the starting point and change
(i.e. growth factors) in impulsivity allowing for individual variation, GGMM formally explores
the heterogeneity in individual variation, i.e. whether the study population consists of two or
more discrete classes of individuals with varying growth trajectories. In this study, we used
CGM to empirically demonstrate the advantage of using longitudinal measures by examining the
extent to which growth factors influence the outcome while taking into account the entire
developmental period. CGM is also a necessary step to determine the measurement model that
feeds into GGMM. GGMM was then used to determine the optimal class membership for each
individual and to empirically classify individual impulsivity profiles, such as “high” and “low”
rather than relying on expert knowledge or information from previous studies. GGMM specifies
class membership in a probabilistic fashion, i.e. it allows for the uncertainty of individuals being
in each of the latent classes.
Model building proceeded in a stepwise fashion [44]. For the CGM, nested models with
fixed and random intercept, linear and nonlinear slopes were compared using a Likelihood Ratio
Test and other structural equation model selection criteria, such as Comparative Fit Index (CFI),
2 Bivariate coverage measures the coverage of the data points between two variables. For
example, a bivariate coverage of 0.826 between impulsivity measure at age 11 and impulsivity measure at
age 12 indicates that 83% of the sample has valid measures of impulsivity at both time points. A
bivariate coverage higher than 10% is necessary for efficient FIML estimation. In this sample the
bivariate coverage ranged from .70 to .89, which indicates reasonably high coverage. Acc
epte
d A
rticl
e
Impulsivity Trajectories and Gambling
11
© 2012 The Authors
Addiction © 2012 Society for the Study of Addiction
Tucker-Lewis Index (TLI) and Root Mean Square Error of Approximation (RMSEA). Then, we
investigated whether the starting point and growth of impulsivity during ages 11-15 were both
associated with the gambling outcome by regressing the four-level ordinal gambling variable on
growth factors (e.g. intercept and slope) via ordered logistic regression [45] (see conceptual
model in Figure 1a).
Figure 1a about here
We explored heterogeneity in the longitudinal development of impulsivity by performing
class enumeration tests on the best fitting CGM [44], based on theoretical reasoning as well as fit
statistics used to compare non-nested models, e.g. Bayesian Information Criterion (BIC) and Lo-
Mendell-Rubin likelihood ratio chi-square test (LMR; [46]). The model that achieved an optimal
balance between fit and parsimony was selected as the best GGMM model. Class membership
was regressed on covariates, such as race and SES, via categorical logistic regression [45].
Additionally, gambling was regressed on class membership via ordered logistic regression [45]
(see conceptual model in Figure 1b). Analyses were conducted using Mplus version 6.11 [47]
and the clustering of students within classrooms was accounted for by computing robust standard
errors using a sandwich estimator [48]. Data can be obtained through Johns Hopkins
University Prevention Intervention Research Center at www.jhsph.edu/prevention.
Figure 1b about here
Acc
epte
d A
rticl
e

Impulsivity Trajectories and Gambling
12
© 2012 The Authors
Addiction © 2012 Society for the Study of Addiction
Results
Conventional growth model.
Nested model comparisons3 suggested that a model with random intercept, random slope
and fixed quadratic slope achieved optimal fit (LL=-1782.12 (11), CFI=0.94, TLI=0.94,
RMSEA=0.08 [0.05, 0.12]; see Table 1). While the overall trend is downward, significant
individual variation around the starting points as well as in the linear change factor exist, i.e.,
some individuals display an increase or decrease, and others experience no change in impulsivity
over time.
Table 1 about here
The association between growth factors and gambling.
It was found that the intercept, but not the slope, was significantly associated with later
gambling at the conventional .05 level (intercept: logit coefficient=0.32, p=.018; slope: logit
coefficient=2.07, p=.058). The three cumulative probabilities of gambling are presented for the
three conditions in Figure 2, i.e. when growth factors are a) at the mean level, b) at one standard
deviation below the mean, and c) at one standard deviation above the mean. The probabilities of
gambling in each category increased with increasing level of intercept and slope, indicating that
individuals were more likely to engage in gambling and develop gambling problems when
starting at a higher level on impulsivity development. These effects can also be interpreted on an
3 “Nested models” within the growth model framework can be understood in the same fashion as
nested models in a regular regression, that is, two models are nested when both contain the same number
of terms and one has one additional term. The one with the additional term is named “full model” and the
one with one less term is named “reduced model”. In a growth model context, for example, a model with
an intercept only is nested within a model with an intercept and a linear slope, and a model with an
intercept and a linear slope is nested within a model with an intercept, a linear slope, and a quadratic
slope. Acc
epte
d A
rticl
e

Impulsivity Trajectories and Gambling
13
© 2012 The Authors
Addiction © 2012 Society for the Study of Addiction
odds ratio scale, using those who have an intercept and slope at one standard deviation below the
mean as the reference group. Those at the mean level of intercept and slope had 1.77 the odds,
and those with an intercept and slope at one standard deviation above the mean had 2.46 the odds
of engaging in any gambling, compared to those with an intercept and slope at one standard
deviation below the mean.
Figure 2 about here
GGMM and covariate effects.
Class enumeration was performed based on the above selected CGM to explore the
heterogeneity in development patterns of impulsivity [44]. Fit indices for these models are
presented in Table 2. Based on statistical criteria as well as substantive considerations, a 2-class
model with the slope variance fixed to 0 for the low class (i.e. 2-class (b)) was chosen as the best
measurement model (LL=-1756.67 (14), BIC=3593.65). While the CGM reasonably captures the
mean of the individual trajectories, the 2-class GGMM provides further improvement in fit by
capturing the non-normal variability of individual trajectories around the mean4.
Table 2 about here
Two distinct impulsivity trajectories identified were: a high class that consists of 41% of
the sample and a low class that consists of 59% of the sample (Figure 3). When regressing class
membership on covariates, the only covariate significantly related to class membership was first-
grade impulsivity, with a one unit increase in first-grade impulsivity increasing the odds of being
in the high class by 2 folds (OR=2.34[ 1.26, 4.34]).
4 The univariate skewness and kurtosis values for the five repeated outcomes were estimated
more accurately by the 2-class GGMM model than the CGM that assumes multivariate normality of the
observed outcomes (data available upon request). Acc
epte
d A
rticl
e
Impulsivity Trajectories and Gambling
14
© 2012 The Authors
Addiction © 2012 Society for the Study of Addiction
Figure 3 about here
The association between class membership and gambling.
We investigated the extent to which gambling in late adolescence varied as a function of
latent class membership by regressing gambling on class membership. Pr (SG/AG/PG), Pr
(AG/PG), and Pr (PG) for both classes are presented in Table 3. Differences in these
probabilities between classes vary by thresholds. While there is virtually no difference between
the predicted probabilities of engaging in any gambling between the two classes (0.68 vs. 0.66),
males in the high class were substantially more likely to meet criteria for problem gambling
(0.14 vs. 0.06).
Table 3 about here
The effects of class membership on gambling behavior are also presented as odds ratios
with 95% confidence intervals and p-values. Although males in the high impulsivity class were
slightly more likely to engage in any gambling than those in the low class, the effect is not
statistically significant (OR=1.10[0.63, 1.92]). Males in the high impulsivity class had on
average twice the odds of meeting criteria for at-risk or problem gambling (OR=2.09[1.02, 4.27])
than those in the low impulsivity class. Additionally, being in the high impulsivity class
increased the odds of meeting criteria for problem gambling by nearly three folds
(OR=2.84[1.02, 7.91]).
Acc
epte
d A
rticl
e

Impulsivity Trajectories and Gambling
15
© 2012 The Authors
Addiction © 2012 Society for the Study of Addiction
Discussion
This study investigated the relationship between developmental trajectories of
impulsivity in early adolescence and subsequent gambling in late adolescence. Consistent with
past studies [15], we found a general downward trend of impulsivity in our sample. We further
identified a high impulsivity class (41% of the sample) and a low impulsivity class (59% of the
sample). Impulsivity in first grade significantly predicted class membership during adolescence,
providing evidence for the construct validity of the latent classes and the continuity of
impulsivity between childhood and adolescence.
When comparing our findings regarding impulsivity trajectories with Betancourt et al.’s
[30] work we attribute the differences (in terms of number of classes) to the different samples
used in the two studies. While their study sample consisted of both males and females, the
sample used in our study consisted of males only. Females tend to exhibit lower levels of
impulsivity and show a different pattern of development than males [14, 15, 31]. Thus, it may
not be appropriate to analyze them together, assuming the same measurement model for both
genders. While Betancourt et al.’s [30] study is based on a sample of predominately Caucasian,
middle-class youths, the sample in this study consists of predominately urban African American
and low SES males. Different sources of impulsivity measures may also contribute to the
different findings in the two studies. Specifically, Betancourt et al.’s study [30] used study
participants’ self-reported measures of impulsivity, while teacher-reported measures were
utilized in the current study. Despite that teacher ratings of youth impulsivity may potentially be
influenced by various factors such as children’s demographic information [49], evidence has Acc
epte
d A
rticl
e
Impulsivity Trajectories and Gambling
16
© 2012 The Authors
Addiction © 2012 Society for the Study of Addiction
suggested that both teacher- and parent-reports of adolescent psychological adjustment (such as
hyperactivity-inattention and conduct problems) have higher internal consistency and test-retest
reliability, and can better predict future psychiatric disorder diagnosis than adolescent self-
reports [50].
Heterogeneity in the development of adolescent impulsivity was found to be strongly
associated with subsequent gambling in late adolescence among the study sample, a finding
consistent with past studies (e.g. [3, 30]). Our study went beyond Betancourt et al.’s [30] study in
three important ways: 1) we ensured the proper temporal order by only considering gambling
behavior that occurred after impulsivity measures, 2) we demonstrated that the intercept of the
impulsivity development (as measured by the repeated assessments of impulsivity across the
entire developmental period) was significantly associated with gambling outcome, 3) we not
only studied the association between impulsivity development and gambling, but also raised the
important question of whether impulsivity development is equally associated with engaging in
any gambling activities and problem gambling by using a widely-used and age-appropriate
measure of youth gambling, namely SOGS-RA. Heterogeneity of impulsivity development was
only significantly related to at-risk and problem gambling but not any gambling. Being in the
high impulsivity trajectory doubled the odds of meeting criteria for at-risk/problem gambling,
and tripled the odds of meeting criteria for problem gambling.
This study is not without limitations. First, the study sample consisted primarily of urban,
minority participants. While this may be viewed as strength of the study given the relative lack
of research on impulsivity-gambling association among urban minority populations, the findings Acc
epte
d A
rticl
e
Impulsivity Trajectories and Gambling
17
© 2012 The Authors
Addiction © 2012 Society for the Study of Addiction
of this study may not be generalizable to the general population and thus should be extrapolated
with caution. Second, although we have ensured the logical temporal order of events, the
observed significant association between heterogeneity in impulsivity development and
gambling behavior does not necessarily indicate a causal relationship. Third, given that only an
extremely small percentage (less than 1%) of females in this sample met the criteria of problem
gambling, we could not study the impulsivity-problem gambling association among females.
Last, self-reports of gambling problems may be subject to reporting bias. However, given that
the gambling and impulsivity measures were obtained from different sources, it is unlikely that
the reporting bias is associated with impulsivity in a systematic fashion.
Findings have important implications for the prevention of problem gambling. The
significant association of youth impulsivity development with subsequent gambling provides
added research support for targeting impulsivity to prevent youth problem gambling. Past studies
found evidence that lowering impulsivity may have promise in reducing positive attitudes toward
gambling [51]. A brief school-based intervention with a teaching impulse control component
implemented among high school students in Canada reduced student’s positive attitudes toward
gambling, although there was no direct impact on gambling participation during the one week
follow-up period [51]. Most gambling prevention efforts have targeted middle and high school
students (e.g. [51-53]). The association between first grade impulsivity with impulsivity
trajectories in adolescence suggests that teaching impulse control early in elementary school may
have long-term benefit in decreasing the likelihood of youth following an elevated trajectory of
impulsivity. Impulsivity was related only to at-risk and problem gambling but not any gambling
indicating that although reduced level of impulsivity may not have any impact on engagement of Acc
epte
d A
rticl
e

Impulsivity Trajectories and Gambling
18
© 2012 The Authors
Addiction © 2012 Society for the Study of Addiction
gambling activities, it may reduce the likelihood of youth’s meeting criteria for at-risk and
problem gambling. Future evaluation of intervention trials aimed at reducing youth gambling
problems through teaching impulse control should distinguish gambling problems from any
gambling.
Acknowledgements: This study was supported by the National Institute of Child and Human
Development grant (R01HD060072, PI: Silvia Martins) and National Institution of Mental
Health training grant (T32 MH18834, PI: Nick Ialongo). We thank Scott Hubbard for data
management. This work was performed while Weiwei Liu was a postdoctoral fellow at Johns
Hopkins Bloomberg School of Public Health.
Acc
epte
d A
rticl
e

Impulsivity Trajectories and Gambling
19
© 2012 The Authors
Addiction © 2012 Society for the Study of Addiction
References
1. Winters, K., Stinchfield, R., Fulkerson, J. Patterns and characteristics of adolescent gambling.
J Gambl Stud 1993; 9: 371-386.
2. Blinn-Pike, L., Worthy, S.L., Jonkman, J. Adolescent gambling: A review of an emerging
field of research. J Adolesc Health 2010; 47: 223-236.
3. Auger, N., Lo, E., Cantinotti, M., O’Loughlin, J. Impulsivity and socio-economic status
interact to increase the risk of gambling onset among youth. Addiction 2010; 105: 2176-
2183.
4. Dussault, F., Brendgen, M., Vitaro, F., Wanner, B., Tremblay, R.E. Longitudinal links
between impulsivity, gambling problems and depressive symptoms: A transactional
model from adolescence to early adulthood. J Child Psychol Psychiatry 2011; 52: 130–
138.
5. Vitaro, F., Arseneault, L., Tremblay, R.E. Impulsivity predicts problem gambling in low SES
adolescent males. Addiction 1999; 94: 565-575.
6. American Psychiatric Association. Diagnostic and Statistical Manual of Mental Disorder:
DSM IV. 4th ed. Washington, DC: American Psychiatric Association; 1994.
7. Lynam, D.R., Hoyle, R.H., Newman, J.P. The perils of partialling: Cautionary tales from
aggression and psychopathy. Assessment 2006; 13: 328–341.
8. Whiteside, S.P., Lynam, D.R. The Five–Factor Model and impulsivity: Using a structural
model of personality to understand impulsivity. Pers Individ Dif 2001; 30: 669-689.
9. Whiteside, S.P., Lynam, D.R., Miller, J.D., Reynolds, S.K. Validation of the UPPS impulsive
behavior scale: A four-factor model of impulsivity. Eur J Pers 2005; 19: 559-574. Acc
epte
d A
rticl
e

Impulsivity Trajectories and Gambling
20
© 2012 The Authors
Addiction © 2012 Society for the Study of Addiction
10. Zuckerman, M. Faites vos jeux anouveau: Still another look at sensation seeking and
pathological gambling. Pers Individ Dif 2005; 39: 361-365.
11. Hofmann, W., Friese, M., Strack, F. Impulse and self-control from a dual-systems
perspective. Perspect Psychol Sci 2009; 4: 162-176.
12. Moeller, F.G., Barratt, E.S., Dougherty, D.M., Schmitz, J.M., Swann, A.C. Psychiatric
aspects of impulsivity. Am J Psychiatry 2001; 158: 1783-1793.
13. Harden, P.K., Tucker-Drob, E.M. Individual differences in the development of sensation
seeking and impulsivity during adolescence: Further evidence for a dual systems model.
Dev Psychol 2011; 47: 739-746.
14. Olson, S.L., Schilling, E.M., Bates, J.E. Measurement of impulsivity: Construct coherence,
longitudinal stability, and relationship with externalizing problems in middle childhood
and adolescence. J Abnorm Child Psychol 1999; 27: 151-165.
15. Steinberg, L., Albert, D., Cauffman, E., Banich, M., Graham, S., Woolard, J. Age differences
in sensation seeking and impulsivity as indexed by behavior and self-report: Evidence for
a dual systems model. Dev Psychol 2008; 44: 1764-1778.
16. Vazsonyi, A.T., Trejos-Castillo, E., Young, M.A. Rural and non-rural African American
Youth: Does context matter in the etiology of problem behaviors? J Youth Adolesc 2008;
37: 798-811.
17. Langhinrichsen-Rohling, J., Rhode, P., Seeley, J.R., Rohling, M.L. Individual, family, and
peer correlates of adolescent gambling. J Gambl Stud 2004; 20: 23-46.
Acc
epte
d A
rticl
e
Impulsivity Trajectories and Gambling
21
© 2012 The Authors
Addiction © 2012 Society for the Study of Addiction
18. Mooss, A.D. Gambling Behaviors among Youth Involved in Juvenile and Family Courts.
2009. (Doctoral dissertation, Georgia State University). Retrieved from
http://digitalarchive.gsu.edu/cgi/viewcontent.cgi?article=1062&context=psych_diss
19. Stinchfield, R., Cassuto, N., Winters, K., Latimer, W. Prevalence of gambling among
Minnesota public school students in 1992 and 1995. J Gambling Stud 1997; 13: 25-48.
20. Thomas, PL. Gambling-associated behaviors of adolescent male and female populations by
Pamela Lynnet Thomas. 2004. (Masters Thesis, Eastern Michigan University). Retrieved
from http://commons.emich.edu/cgi/viewcontent.cgi?article=1055&context=theses
21. Volberg, R.A. Gambling and problem gambling among adolescents in Nevada. Report to the
Nevada Department of Human Resources. Northampton, MA: Gemini Research; 2002.
22. Westphal, J.R., Rush, J.A., Stevens, L., Johnson, L.J. Gambling behavior of Louisiana
students in grades 6 to 12. Psychiatr Serv 2000; 51: 96-99.
23. Chambers, R.A., Taylor, J.R., Potenza, M.N. Developmental neurocircuitry of motivation in
adolescence: A critical period of addiction vulnerability. Am J Psychiatry 2003; 160:
1041-1052.
24. Casey, B.J., Jones, R.M., Hare T.A. The adolescent brain. Ann N Y Acad Sci 2008; 1124:
111-126.
25. Derevensky, J., Gupta, R. Adolescent gambling: Current knowledge, myths, assessment
strategies and public policy implications. In: Smith, G., Hodgins, D., Williams, R.,
editors. Research and measurement issues in gambling studies. New York: Academic
Press; 2007. p. 437-463. Acc
epte
d A
rticl
e

Impulsivity Trajectories and Gambling
22
© 2012 The Authors
Addiction © 2012 Society for the Study of Addiction
26. Jacobs, D.F. A general theory of addictions: A new theoretical model. Journal of Gambling
Behavior 1986; 2: 15-31.
27. Eysenck, S.B.G., Eysenck, H.J. The place of impulsiveness in a dimensional system of
personality description. Br J Soc Psychol 1977; 16: 57-68.
28. Gupta, R., & Derevensky, J.L. Adolescent gambling behavior: A prevalence study and
examination of the correlates associated with problem gambling. J Gambl Stud 1998; 14:
319-345.
29. Jessor, R., Jessor, S.L. Problem behavior and psychosocial development: A longitudinal
study of youth. New York: Academic Press; 1977.
30. Betancourt, L.M., Brodsky, N.L., Brown, C.A., McKenna, K.A., Giannetta, J.M., Yan, W., et
al. (In press). Is executive cognitive function associated with youth gambling? J Gambl
Stud in press.
31. Cote, S., Tremblay, R.E., Nagin, D., Zoccolillo, M., Vitaro, F. The development of
impulsivity, fearfulness, and helpfulness during childhood: Patterns of consistency and
change in the trajectories of boys and girls. J Child Psychol Psychiatry 2002; 43: 609-
618.
32. Ialongo, N., Poduska, J., Werthamer, L., Kellam, S. The distal impact of two first-grade
preventive interventions on conduct problems and disorder in early adolescence. J Emot
Behav Disord 2001; 9: 146-161.
33. Werthamer-Larsson, L., Kellam, S., Wheeler, L. Effect of first-grade classroom environment
on shy behavior, aggressive behavior, and concentration problems. Am J Community
Psychol 1991; 19: 585–602. Acc
epte
d A
rticl
e

Impulsivity Trajectories and Gambling
23
© 2012 The Authors
Addiction © 2012 Society for the Study of Addiction
34. Vitaro, F., Wanner, B. Predicting early gambling in children. Psychology of Addictive
Behavior 2011; 25: 118-126.
35. Sirin, S.R. Socioeconomic status and student achievement: A meta-analytic review of
research. Rev Educ Res 2005; 75: 417-453.
36. Lesieur, H.R., Blume, S.B. The South Oaks Gambling Screen (SOGS): a new instrument for
the identification of pathological gamblers. Am J Psychiatry 1987; 144: 1184-1188.
37. Stinchfield, R., Govoni, R., Frisch, G.R. Screening and Assessment Instruments. In: Grant,
J.E., Potenza, M.N., editors. Pathological Gambling: A Clinical Guide to Treatment.
Washington, DC: American Psychiatric Press, Inc; 2004. p. 207–258.
38. Winters, K.C., Stinchfield, R.D., Kim, L.G. Monitoring adolescent gambling in Minnesota. J
Gambl Stud 1995; 11: 165-168.
39. Carlson, M.J., Moore, T.L. Adolescent gambling in Oregon: A report to the Oregon
gambling addiction treatment foundation. Salem, OR: Oregon Gambling Addiction
Treatment Foundation; 2008.
40. Wickwire, E., Whelan, J.P., Meyers, A.W., Murray, D.M. Environmental correlates of
gambling behavior in urban adolescents. J Abnorm Child Psychol 2007; 35: 179-190.
41. Muthén, B. Latent variable analysis: Growth mixture modeling and related techniques for
longitudinal data. In: Kaplan, D., editor. Handbook of Quantitative Methodology for the
Social Sciences. Newbury Park, CA: Sage Publications; 2004. p. 345 – 368.
42. Arbuckle, J.L. Full information estimation in the presence of incomplete data. In:
Marcoulides,G.A., Schumacker, R.E., editors. Advanced structural equation modeling.
Mahwah, NJ: Lawrence Erlbaum Associates, Inc.; 1996. p. 243-277. Acc
epte
d A
rticl
e

Impulsivity Trajectories and Gambling
24
© 2012 The Authors
Addiction © 2012 Society for the Study of Addiction
43. Schafer, J. L., Graham, J. W. Missing data: Our view of the state of the art. Psycholol
Methods 2002; 7: 147-177.
44. Petras, H., & Masyn, K. General Growth Mixture Models. In: Piquero, A., Weisburd, D.,
editors. Handbook of Quantitative Criminology. New York: Springer; 2010. p. 69-100
45. Long, J.S., Cheng, S. Regression models for categorical outcomes. In: Hardy M., Bryman,
A., editors. Handbook of Data Analysis. Thousand Oaks, CA: Sage; 2004. p. 259-284.
46. Lo, Y., Mendell, N.R., Rubin, D.B. Testing the number of components in a normal mixture.
Biometrika 2001; 88: 767-778.
47. Muthén, L.K., Muthen, B.O. Mplus Users' Guide. 6th ed. Los Angeles, CA: Muthen and
Muthen; 1998-2010.
48. White, H. A heteroskedasticity-consistent covariance matrix estimator and a direct test for
heteroskedasticity. Econometrica 1980; 48: 817-838.
49. Koth, C.W., Bradshaw, C.P., Leaf, P.J. Teacher Observation of Classroom Adaptation-
Checklist (TOCA-C): development and factor structure. Meas Eval Couns Dev 2009; 42:
15-30.
50. Goodman, R. Psychometric properties of the Strengths and Difficulties Questionnaire
(SDQ). J Am Acad Child Adolesc Psychiatry 2001; 40: 1337-1345.
51. Williams RJ, West BL, Simpson RJ. Prevention of problem gambling. In: Smith, G.,
Hodgins, D., Williams, R.J., editors. Research and measurement in gambling studies.
Amsterdam: Elsevier; 2007. p. 399-435.
52. Ferland, F., Ladouceur, R., Vitaro, F. Prevention of problem gambling: modifying
misconceptions and increasing knowledge. J Gambl Stud 2002; 18: 19–29. Acc
epte
d A
rticl
e

Impulsivity Trajectories and Gambling
25
© 2012 The Authors
Addiction © 2012 Society for the Study of Addiction
53. Turner, N.E., Macdonald, J., & Somerset, M. Life skills, mathematical reasoning and critical
thinking: A curriculum for the prevention of problem gambling. J Gambl Stud 2008; 24:
367-380.
54. Kellam, S.G., Brown, C.H., Poduska, J.M, Ialongo, N.S., Wang, W., Toyinbo, P., Petras, H.,
Ford, C., Windham, A., & Wilcox, H.C. Effects of a universal classroom behavior
management program in first and second grades on young adult behavioral, psychiatric,
and social outcomes. Drug and Alcohol Dependence 2008; 95: S5-S28.
Acc
epte
d A
rticl
e

Impulsivity Trajectories and Gambling
26
© 2012 The Authors
Addiction © 2012 Society for the Study of Addiction
Table 1: Growth Factors in the Best Conventional Growth Model for Impulsivity Development
Intercept
Mean (std. error)
Slope
Mean (std. error)
Quadratic Slope
Mean (std. error)
Mean 2.55 (0.07) 0.03 (0.05) -0.04 (0.01)
Variance 0.78 (0.09) 0.02 (0.01) 0 (fixed)
Acc
epte
d A
rticl
e
Impulsivity Trajectories and Gambling
27
© 2012 The Authors
Addiction © 2012 Society for the Study of Addiction
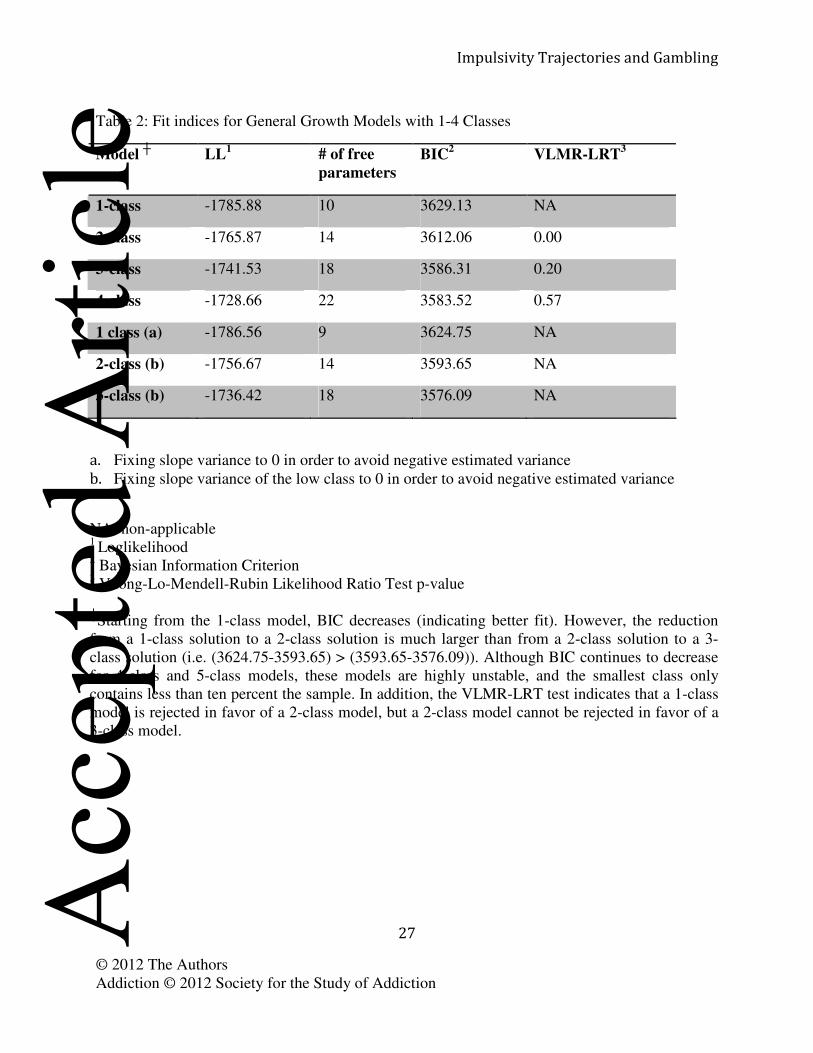
Table 2: Fit indices for General Growth Models with 1-4 Classes
Model ┼ LL
1 # of free
parameters
BIC2
VLMR-LRT3
1-class -1785.88 10 3629.13 NA
2-class -1765.87 14 3612.06 0.00
3-class -1741.53 18 3586.31 0.20
4-class -1728.66 22 3583.52 0.57
1 class (a) -1786.56 9 3624.75 NA
2-class (b) -1756.67 14 3593.65 NA
3-class (b) -1736.42 18 3576.09 NA
a. Fixing slope variance to 0 in order to avoid negative estimated variance
b. Fixing slope variance of the low class to 0 in order to avoid negative estimated variance
NA: non-applicable 1
Loglikelihood 2 Bayesian Information Criterion
3 Vuong-Lo-Mendell-Rubin Likelihood Ratio Test p-value
┼Starting from the 1-class model, BIC decreases (indicating better fit). However, the reduction
from a 1-class solution to a 2-class solution is much larger than from a 2-class solution to a 3-
class solution (i.e. (3624.75-3593.65) > (3593.65-3576.09)). Although BIC continues to decrease
for 4-class and 5-class models, these models are highly unstable, and the smallest class only
contains less than ten percent the sample. In addition, the VLMR-LRT test indicates that a 1-class
model is rejected in favor of a 2-class model, but a 2-class model cannot be rejected in favor of a
3-class model.
Acc
epte
d A
rticl
e

Impulsivity Trajectories and Gambling
28
© 2012 The Authors
Addiction © 2012 Society for the Study of Addiction
Table 3: The Association between Impulsivity Trajectory Class Membership and Subsequent
Gambling
Gambling outcome Est. prob.
for the
high class
Est. prob.
for the low
class
ORa
95% C.I P-value
Any gambling 0.68 0.66 1.10 (0.63, 1.92) 0.730
At-risk/problem gambling 0.28 0.16 2.09 (1.02, 4.27) 0.044
Problem gambling 0.14 0.06 2.84 (1.02, 7.91) 0.047
a.Odds (gambling | membership in the high class)/ Odds (gambling | membership in the low
class)
Acc
epte
d A
rticl
e
Impulsivity Trajectories and Gambling
29
© 2012 The Authors
Addiction © 2012 Society for the Study of Addiction
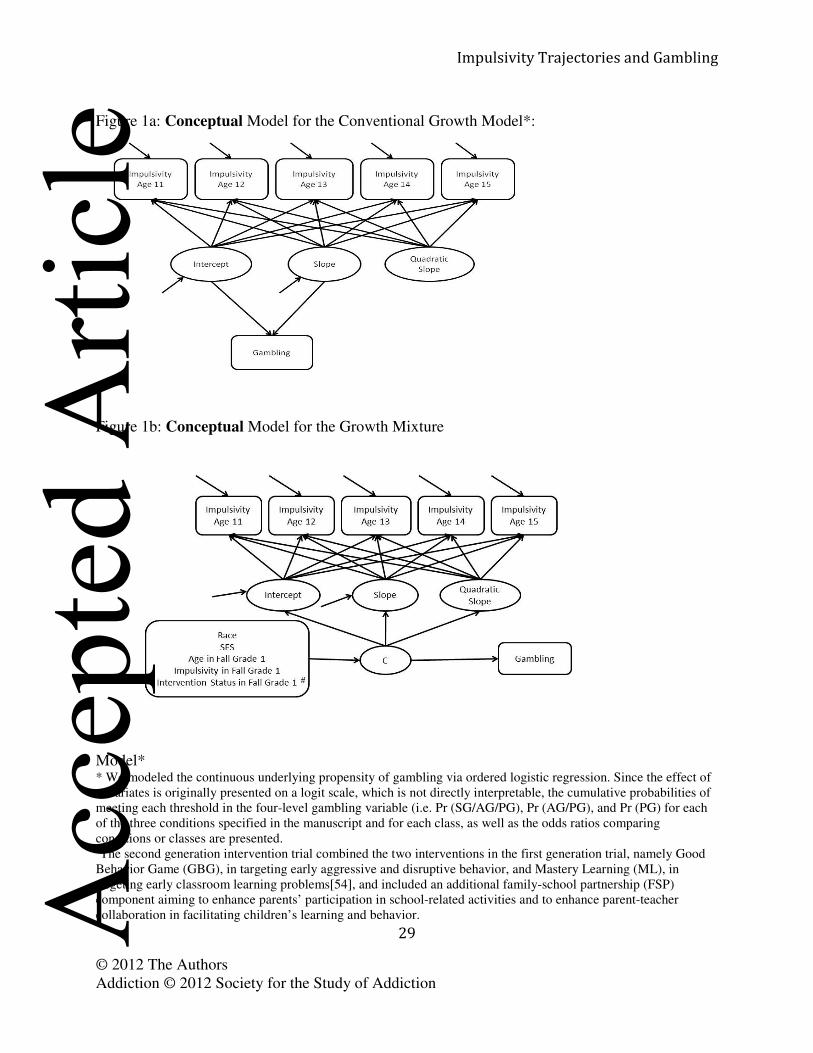
Figure 1a: Conceptual Model for the Conventional Growth Model*:
Figure 1b: Conceptual Model for the Growth Mixture
Model* * We modeled the continuous underlying propensity of gambling via ordered logistic regression. Since the effect of
covariates is originally presented on a logit scale, which is not directly interpretable, the cumulative probabilities of
meeting each threshold in the four-level gambling variable (i.e. Pr (SG/AG/PG), Pr (AG/PG), and Pr (PG) for each
of the three conditions specified in the manuscript and for each class, as well as the odds ratios comparing
conditions or classes are presented. #The second generation intervention trial combined the two interventions in the first generation trial, namely Good
Behavior Game (GBG), in targeting early aggressive and disruptive behavior, and Mastery Learning (ML), in
targeting early classroom learning problems[54], and included an additional family-school partnership (FSP)
component aiming to enhance parents’ participation in school-related activities and to enhance parent-teacher
collaboration in facilitating children’s learning and behavior. Acc
epte
d A
rticl
e

Impulsivity Trajectories and Gambling
30
© 2012 The Authors
Addiction © 2012 Society for the Study of Addiction
Figure 2: Predicted Probabilities of Gambling with Varying Levels of Intercept and Slope
Acc
epte
d A
rticl
e

Impulsivity Trajectories and Gambling
31
© 2012 The Authors
Addiction © 2012 Society for the Study of Addiction
Figure 3: Heterogeneity in the Development of Impulsivity among Males from Age 11 to Age 15
Acc
epte
d A
rticl
e
Copyright © 2022 FDOKUMEN