IMPULSE NOISE REMOVAL FROM MEDICAL IMAGES USING FUZZY GENETIC ALGORITHM
14
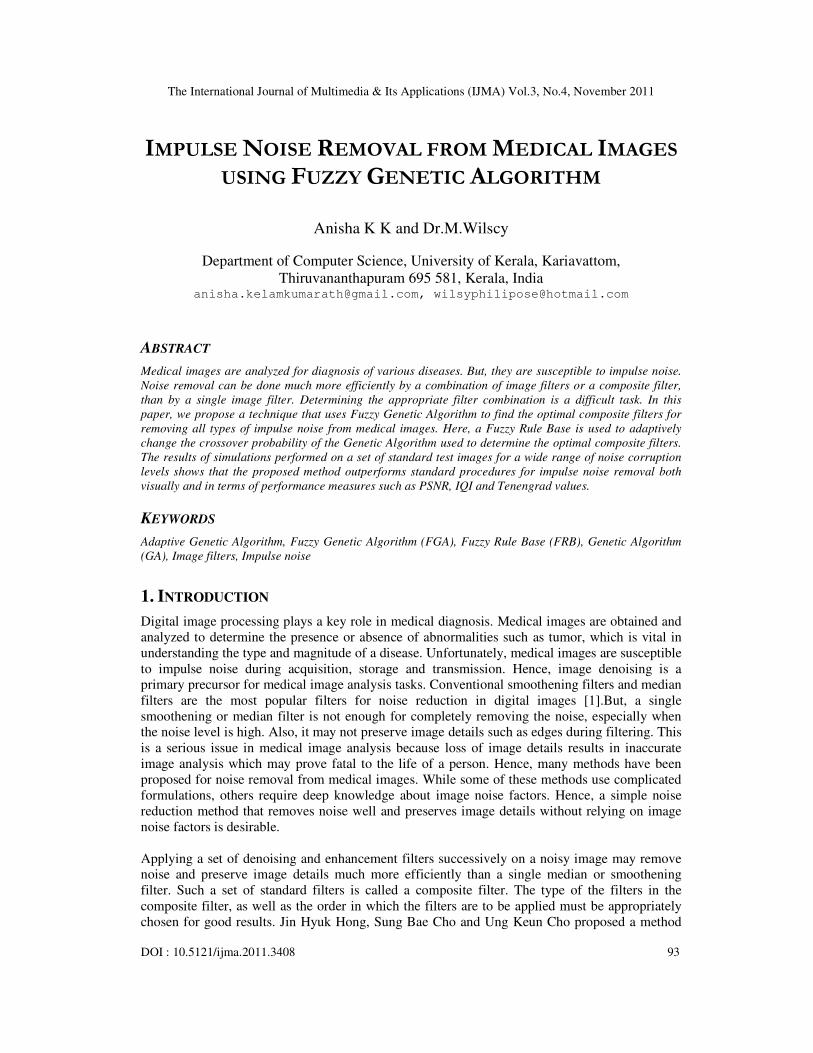
The International Journal of Multimedia & Its Applications (IJMA) Vol.3, No.4, November 2011 DOI : 10.5121/ijma.2011.3408 93 IMPULSE NOISE REMOVAL FROM MEDICAL IMAGES USING FUZZY GENETIC ALGORITHM Anisha K K and Dr.M.Wilscy Department of Computer Science, University of Kerala, Kariavattom, Thiruvananthapuram 695 581, Kerala, India [email protected], [email protected] ABSTRACT Medical images are analyzed for diagnosis of various diseases. But, they are susceptible to impulse noise. Noise removal can be done much more efficiently by a combination of image filters or a composite filter, than by a single image filter. Determining the appropriate filter combination is a difficult task. In this paper, we propose a technique that uses Fuzzy Genetic Algorithm to find the optimal composite filters for removing all types of impulse noise from medical images. Here, a Fuzzy Rule Base is used to adaptively change the crossover probability of the Genetic Algorithm used to determine the optimal composite filters. The results of simulations performed on a set of standard test images for a wide range of noise corruption levels shows that the proposed method outperforms standard procedures for impulse noise removal both visually and in terms of performance measures such as PSNR, IQI and Tenengrad values. KEYWORDS Adaptive Genetic Algorithm, Fuzzy Genetic Algorithm (FGA), Fuzzy Rule Base (FRB), Genetic Algorithm (GA), Image filters, Impulse noise 1. INTRODUCTION Digital image processing plays a key role in medical diagnosis. Medical images are obtained and analyzed to determine the presence or absence of abnormalities such as tumor, which is vital in understanding the type and magnitude of a disease. Unfortunately, medical images are susceptible to impulse noise during acquisition, storage and transmission. Hence, image denoising is a primary precursor for medical image analysis tasks. Conventional smoothening filters and median filters are the most popular filters for noise reduction in digital images [1].But, a single smoothening or median filter is not enough for completely removing the noise, especially when the noise level is high. Also, it may not preserve image details such as edges during filtering. This is a serious issue in medical image analysis because loss of image details results in inaccurate image analysis which may prove fatal to the life of a person. Hence, many methods have been proposed for noise removal from medical images. While some of these methods use complicated formulations, others require deep knowledge about image noise factors. Hence, a simple noise reduction method that removes noise well and preserves image details without relying on image noise factors is desirable. Applying a set of denoising and enhancement filters successively on a noisy image may remove noise and preserve image details much more efficiently than a single median or smoothening filter. Such a set of standard filters is called a composite filter. The type of the filters in the composite filter, as well as the order in which the filters are to be applied must be appropriately chosen for good results. Jin Hyuk Hong, Sung Bae Cho and Ung Keun Cho proposed a method
-
Upload
independent -
Category
Documents
-
view
1 -
download
0
Transcript of IMPULSE NOISE REMOVAL FROM MEDICAL IMAGES USING FUZZY GENETIC ALGORITHM
The International Journal of Multimedia & Its Applications (IJMA) Vol.3, No.4, November 2011
DOI : 10.5121/ijma.2011.3408 93
IMPULSE NOISE REMOVAL FROM MEDICAL IMAGES
USING FUZZY GENETIC ALGORITHM
Anisha K K and Dr.M.Wilscy
Department of Computer Science, University of Kerala, Kariavattom,
Thiruvananthapuram 695 581, Kerala, India [email protected], [email protected]
ABSTRACT
Medical images are analyzed for diagnosis of various diseases. But, they are susceptible to impulse noise.
Noise removal can be done much more efficiently by a combination of image filters or a composite filter,
than by a single image filter. Determining the appropriate filter combination is a difficult task. In this
paper, we propose a technique that uses Fuzzy Genetic Algorithm to find the optimal composite filters for
removing all types of impulse noise from medical images. Here, a Fuzzy Rule Base is used to adaptively
change the crossover probability of the Genetic Algorithm used to determine the optimal composite filters.
The results of simulations performed on a set of standard test images for a wide range of noise corruption
levels shows that the proposed method outperforms standard procedures for impulse noise removal both
visually and in terms of performance measures such as PSNR, IQI and Tenengrad values.
KEYWORDS
Adaptive Genetic Algorithm, Fuzzy Genetic Algorithm (FGA), Fuzzy Rule Base (FRB), Genetic Algorithm
(GA), Image filters, Impulse noise
1. INTRODUCTION
Digital image processing plays a key role in medical diagnosis. Medical images are obtained and
analyzed to determine the presence or absence of abnormalities such as tumor, which is vital in
understanding the type and magnitude of a disease. Unfortunately, medical images are susceptible
to impulse noise during acquisition, storage and transmission. Hence, image denoising is a
primary precursor for medical image analysis tasks. Conventional smoothening filters and median
filters are the most popular filters for noise reduction in digital images [1].But, a single
smoothening or median filter is not enough for completely removing the noise, especially when
the noise level is high. Also, it may not preserve image details such as edges during filtering. This
is a serious issue in medical image analysis because loss of image details results in inaccurate
image analysis which may prove fatal to the life of a person. Hence, many methods have been
proposed for noise removal from medical images. While some of these methods use complicated
formulations, others require deep knowledge about image noise factors. Hence, a simple noise
reduction method that removes noise well and preserves image details without relying on image
noise factors is desirable.
Applying a set of denoising and enhancement filters successively on a noisy image may remove
noise and preserve image details much more efficiently than a single median or smoothening
filter. Such a set of standard filters is called a composite filter. The type of the filters in the
composite filter, as well as the order in which the filters are to be applied must be appropriately
chosen for good results. Jin Hyuk Hong, Sung Bae Cho and Ung Keun Cho proposed a method
The International Journal of Multimedia & Its Applications (IJMA) Vol.3, No.4, November 2011
94
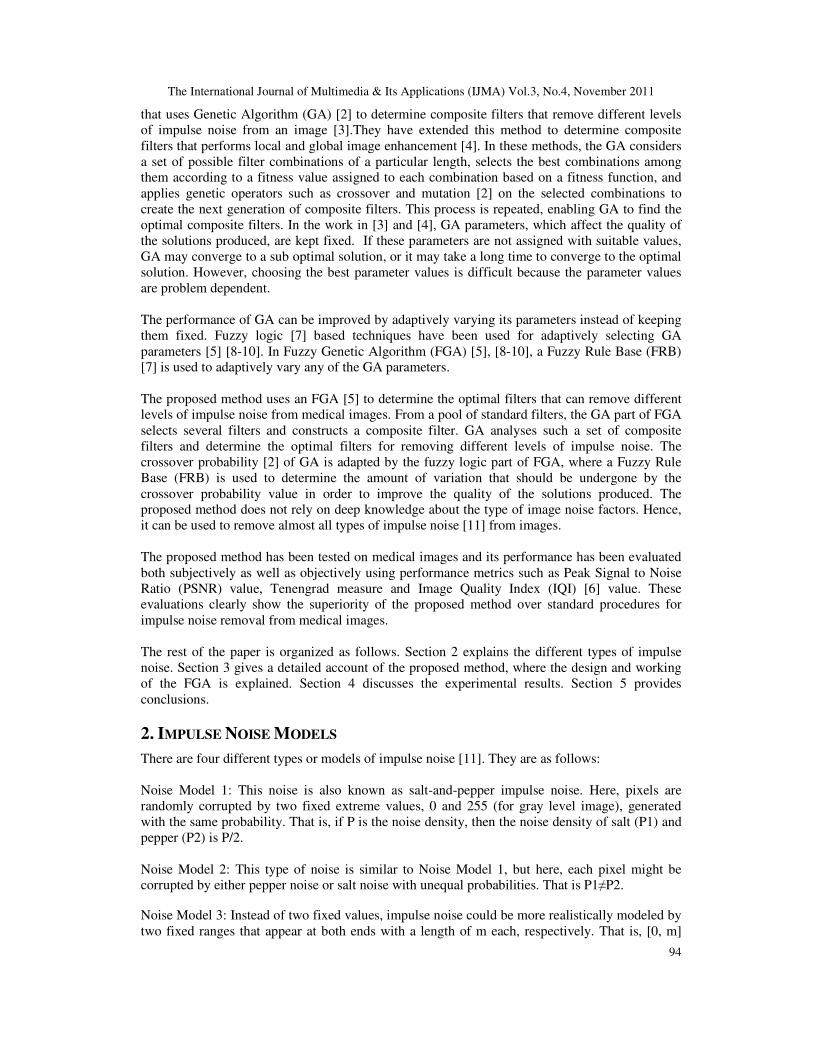
that uses Genetic Algorithm (GA) [2] to determine composite filters that remove different levels
of impulse noise from an image [3].They have extended this method to determine composite
filters that performs local and global image enhancement [4]. In these methods, the GA considers
a set of possible filter combinations of a particular length, selects the best combinations among
them according to a fitness value assigned to each combination based on a fitness function, and
applies genetic operators such as crossover and mutation [2] on the selected combinations to
create the next generation of composite filters. This process is repeated, enabling GA to find the
optimal composite filters. In the work in [3] and [4], GA parameters, which affect the quality of
the solutions produced, are kept fixed. If these parameters are not assigned with suitable values,
GA may converge to a sub optimal solution, or it may take a long time to converge to the optimal
solution. However, choosing the best parameter values is difficult because the parameter values
are problem dependent.
The performance of GA can be improved by adaptively varying its parameters instead of keeping
them fixed. Fuzzy logic [7] based techniques have been used for adaptively selecting GA
parameters [5] [8-10]. In Fuzzy Genetic Algorithm (FGA) [5], [8-10], a Fuzzy Rule Base (FRB)
[7] is used to adaptively vary any of the GA parameters.
The proposed method uses an FGA [5] to determine the optimal filters that can remove different
levels of impulse noise from medical images. From a pool of standard filters, the GA part of FGA
selects several filters and constructs a composite filter. GA analyses such a set of composite
filters and determine the optimal filters for removing different levels of impulse noise. The
crossover probability [2] of GA is adapted by the fuzzy logic part of FGA, where a Fuzzy Rule
Base (FRB) is used to determine the amount of variation that should be undergone by the
crossover probability value in order to improve the quality of the solutions produced. The
proposed method does not rely on deep knowledge about the type of image noise factors. Hence,
it can be used to remove almost all types of impulse noise [11] from images.
The proposed method has been tested on medical images and its performance has been evaluated
both subjectively as well as objectively using performance metrics such as Peak Signal to Noise
Ratio (PSNR) value, Tenengrad measure and Image Quality Index (IQI) [6] value. These
evaluations clearly show the superiority of the proposed method over standard procedures for
impulse noise removal from medical images.
The rest of the paper is organized as follows. Section 2 explains the different types of impulse
noise. Section 3 gives a detailed account of the proposed method, where the design and working
of the FGA is explained. Section 4 discusses the experimental results. Section 5 provides
conclusions.
2. IMPULSE NOISE MODELS
There are four different types or models of impulse noise [11]. They are as follows:
Noise Model 1: This noise is also known as salt-and-pepper impulse noise. Here, pixels are
randomly corrupted by two fixed extreme values, 0 and 255 (for gray level image), generated
with the same probability. That is, if P is the noise density, then the noise density of salt (P1) and
pepper (P2) is P/2.
Noise Model 2: This type of noise is similar to Noise Model 1, but here, each pixel might be
corrupted by either pepper noise or salt noise with unequal probabilities. That is P1≠P2.
Noise Model 3: Instead of two fixed values, impulse noise could be more realistically modeled by
two fixed ranges that appear at both ends with a length of m each, respectively. That is, [0, m]
The International Journal of Multimedia & Its Applications (IJMA) Vol.3, No.4, November 2011
95
denotes salt and [255-m, 255] denotes pepper. Here for noise density P, P1=P2= P/2.This noise is
also known as random impulse noise or uniform noise.
Noise Model 4: This noise is similar to Noise Model 3 but here probability densities of low
intensity impulse noise and high intensity impulse noise are different. That is,P1≠P2.
Many techniques have been proposed for impulse noise removal from grayscale images. Some of
these methods work only for either low density noisy images or high density noisy images. Some
other techniques are specifically designed for certain noise models. Some techniques use
complicated formulations or require deep knowledge about the image noise factors. The proposed
method, which is explained in section 3, is a method which removes any level of impulse noise, is
applicable for almost all noise models, does not use complicated formulations and does not
require deep knowledge on image noise factors.
3. THE PROPOSED METHOD USING FUZZY GENETIC ALGORITHM
The proposed method for impulse noise removal consists of two parts: A GA part and a Fuzzy
Logic part. The GA part selects several filters and constructs a composite filter. GA analyses such
a set of composite filters and determine the optimal filters for removing different levels of
impulse noise. The crossover probability [2] of GA, which determines the number of selected
solutions that undergo crossover operation, is adapted by the fuzzy logic part of FGA, where an
FRB is used to determine the amount of variation that should be undergone by the crossover
probability value in order to improve the quality of the solutions produced. The following
subsections explain these two parts of the proposed method.
3.1. The GA Part
When there are m filters in the filter pool, optimal composite filters containing l standard filters
are to be determined from a total of (m+1)l filter combinations, where m+1 includes the case of
not using any filter on the image. Trying all cases to find out the best one is practically
impossible, especially when m is large. In this paper, GA is used to find the optimal composite
filters. In GA [2], each solution to the problem to be solved is called an individual or a
chromosome. GA starts by randomly initializing a set or a population of individuals. This is the
first generation of individuals. Each individual is assigned a fitness value based on a fitness
function. GA selects those individuals with a good fitness value and applies operations such as
crossover and mutation on them to create the next generation of individuals. This process is
repeated until GA satisfies a predefined termination criterion such as the number of generations
created, upon which GA is expected to have produced very good individuals.
Table 1 shows the filter pool used in this paper which contains 23 image filters, each indexed by a
value from 1 - 23. Value 0 represents the case where no filtering operation is performed. The first
3 filters are histogram brightness measures that adjust the value of the pixel p in the image
according to (1) for a given scale (-100<=s<=100).
100
*)()()(
spvvv
oldpoldpnew +=
(1)
Filters 4 – 7 are histogram contrast measures that adjusts the value of the pixel p for a given scale
(-127 <=s <=127) as shown in (2).
128
*128)()()(
spvpvpv
oldoldnew
−+=
(2)
Filter 8 performs contrast stretching by spanning the range of intensity values in an image, [c, d],
to a desired range of values [a, b]. It scales each image pixel p according to (3).
The International Journal of Multimedia & Its Applications (IJMA) Vol.3, No.4, November 2011
96
acd
abcpvpv oldnew +
−
−−= *)()(
(3)
Filter 9equalizes the histogram of the image, thereby improving the image contrast. Filters 10 –
13 are edge enhancement filters of different types. Filters 14 – 22 are standard median filters of
different sizes and shapes. Filter 23 is an adaptive median filter with a maximum window size of
7 [1].
Table 1. Description of image filters used in this paper.
Filter Type Index
Brightness 3 values of s 1~3
Contrast 4 values of s 4~7
Stretch - 8
Equalize - 9
Sharpening 4 masks 10~13
Median,
Adaptive Median
10 masks 14~23
None 0
Each composite filter is represented by a string of l integers, where each integer is the index of the
corresponding filter in the composite filter and l is the number of standard filters in the composite
filter.
At first, GA randomly initializes a population of composite filters. Then, the fitness of each
composite filter is evaluated using the fitness function given in (4). Here, the objective of GA is
to find the optimal composite filter that can remove impulse noise from all the training images in
a given training set. The training images are created by artificially corrupting an image with
different levels of impulse noise. In (4), n is the number of training images used, MAEi is the
mean absolute error (MAE) of the output image obtained after applying the composite filter x on
the ith training image, and MAEmax is the maximum MAE; it would be 255 for 8-bit grayscale
images. The fitness value f(x), which is the average of the performance of x on all the training
images, is assigned to x. From (4), it is clear that the composite filter x receives a high fitness
value if it can considerably remove the noise from all the training images.
f(x) = )/(11
max
1
MAEMAEn
n
i
i∑=
−
(4)
GA then selects the composite filters with high fitness value from the current generation using
Roulette Wheel selection strategy [2], where selection is based on the probability assigned to each
composite filter proportional to its fitness value. Then, genetic operators such as crossover and
mutation are applied on the selected individuals, to produce the next generation of individuals.
Elitist-strategy [2] that passes the best individuals of the current generation directly to the next
generation is also used here. This process is repeated until a predefined termination criterion is
satisfied. Here, the termination criterion is the maximum number of generations created by GA.
Since the GA selects only the best solutions from each generation and as Elitism is used, after a
particular number of generations, the population contains only good composite filters, from which
the optimal composite filters for removing different levels of impulse noise will be the ones with
the highest fitness values.
The International Journal of Multimedia & Its Applications (IJMA) Vol.3, No.4, November 2011
97
When GA parameter values are kept fixed for solving a problem, it must be ensured that the
parameter values suit the problem. Otherwise, the convergence of GA may be to a sub optimal
solution. Even if GA converges to the optimal solution, it may take a large amount of time to do
so. The occurrence of these problems can be avoided by adaptively varying the GA parameters. In
the proposed method, the fuzzy logic part adapts the crossover probability of the GA using a
FRB. The fuzzy logic part is explained in detail in the next subsection.
3.2. The Fuzzy Logic Part
An FGA [5], [8 – 10] is an adaptive GA in which a Fuzzy Rule Base (FRB) is used to adapt one
or more of the GA parameters so as to increase the quality of the solutions produced by GA. FGA
accepts one or more values that indicate the quality of the outputs produced by GA as inputs.
These values are fuzzified[7] using the corresponding membership functions[7]. From these
fuzzified input values, one or more fuzzy outputs are determined using a FRB [7]. These outputs
are then defuzzified [7] using the output membership functions. The defuzzified outputs enable
the adaptive variation of one or more GA parameters, thereby enabling GA to converge to the
most optimal solution. It also results in an increase in the speed of convergence of the GA to the
best solution.
In the proposed method, a FRB is used to adapt the crossover probability of GA. Probability of
crossover pc determines the number of individuals in the population that must undergo crossover
operation. A high crossover probability value results in loss of good chromosomes in the current
generation, and a low crossover probability value results in loss of diversity in the subsequent
generations because these generations may get constituted of copies of just a few average
individuals. Both these cases may result in convergence of GA to a suboptimal solution. Hence it
is important to have an optimal crossover probability value.
The fuzzy logic part accepts Genotypic diversity (GD) and Phenotypic diversity (PD) as inputs
[5].GD and PD are two measures that depict the quality of the composite filters produced by GA.
GD represents the genetic diversity of the population and it is evaluated as shown in (5).
GD = (d – dmin) / (dmax – dmin) (5)
Where d, dmax and dmin are the average, maximum and minimum distances of the chromosomes in
the population from the composite filter with the highest fitness value.
PD, as shown in (6), is the ratio of average fitness of the population, favg, to the best fitness fbest.
PD = favg / fbest (6)
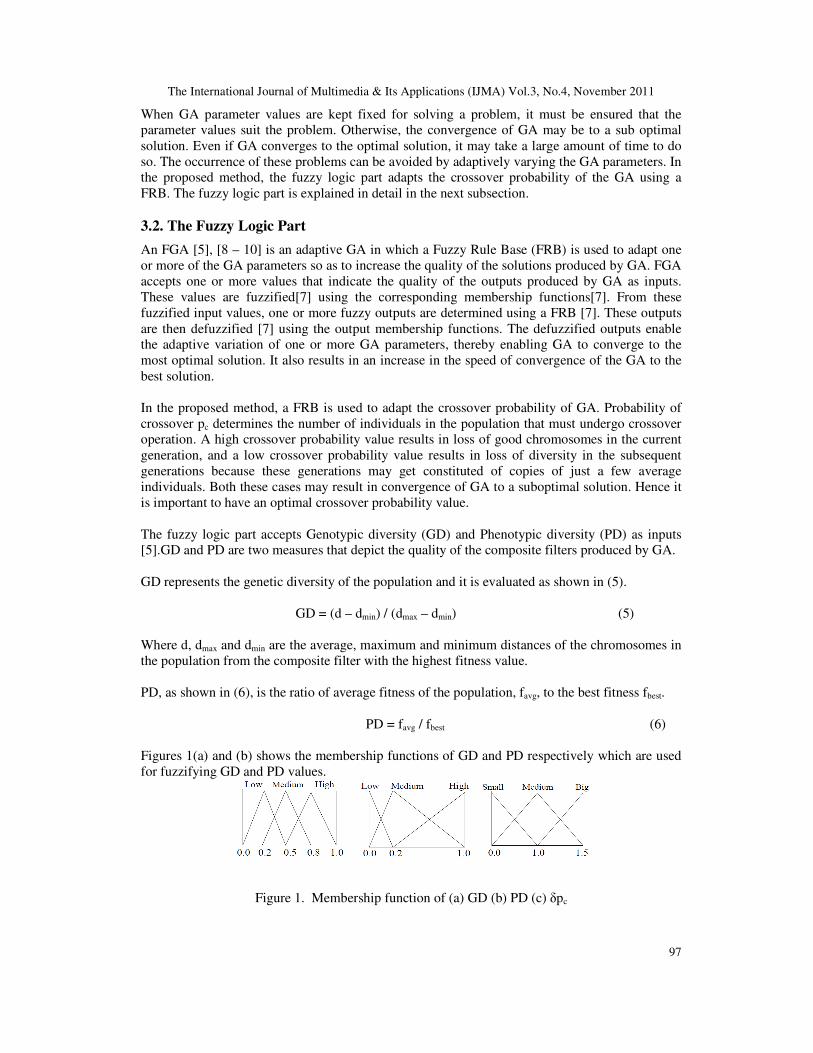
Figures 1(a) and (b) shows the membership functions of GD and PD respectively which are used
for fuzzifying GD and PD values.
Figure 1. Membership function of (a) GD (b) PD (c) δpc
The International Journal of Multimedia & Its Applications (IJMA) Vol.3, No.4, November 2011
98
Table 2 shows the FRB which is used to determine the fuzzy output value, which is defuzzified
using the membership function shown in figure 1(c) to obtain the crisp output value δpc. GD and
PD values range from Low to High, for which the change in δpc, which ranges from Small to Big,
is given in the respective cells. When GD and PD values are ‘Low’, the population is diverse,
even if it has not converged to the best solution. In this case, a low crossover probability is
desired to prevent loss of this diversity due to crossover. Hence, δpc is given a ‘Small’ value, to
allow as little crossover operations as possible. Similar arguments follow for all the conditions
specified in the rule base.
δpc, which ranges from [0, 1.5], determines the degree to which the current pc value, which is kept
within the range [0.25, 0.75], should vary. The new pc value is obtained by multiplying the δpc
value with the current pc value.
Table 2. Description of image filters used in this paper.
GD PD
Low Medium High
Low Small Small Medium
Medium Big Big Medium
High Big Big Medium
In the proposed method, GA creates the first generation of composite filters using a randomly
initialized pc value. The GD and PD values for this generation are fed into the fuzzy logic part of
FGA, which calculates the value of δpc, which is multiplied with the current pc value. This
adapted pc value is given to the GA, which uses it to create the next generation to produce a better
population of composite filters. The entire process is repeated until GA satisfies its termination
criterion.
4. RESULTS AND DISCUSSION
The proposed method was implemented and tested on medical images. The experimental setup is
given below:
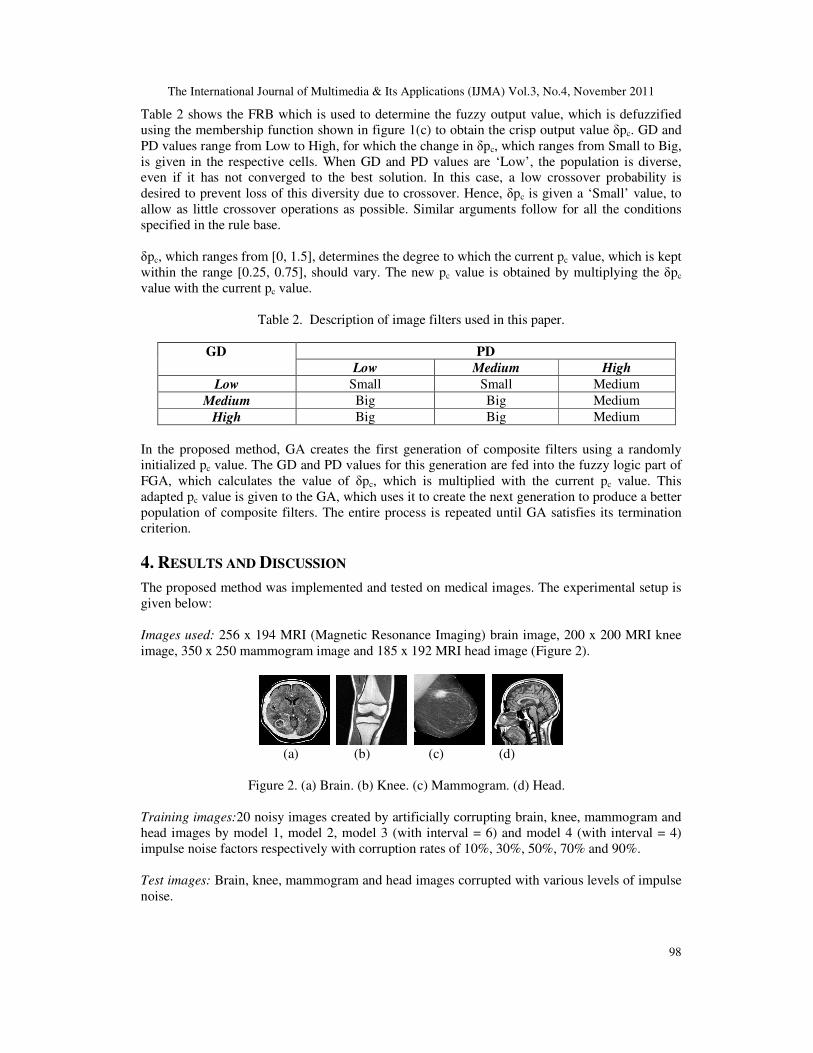
Images used: 256 x 194 MRI (Magnetic Resonance Imaging) brain image, 200 x 200 MRI knee
image, 350 x 250 mammogram image and 185 x 192 MRI head image (Figure 2).
(a) (b) (c) (d)
Figure 2. (a) Brain. (b) Knee. (c) Mammogram. (d) Head.
Training images:20 noisy images created by artificially corrupting brain, knee, mammogram and
head images by model 1, model 2, model 3 (with interval = 6) and model 4 (with interval = 4)
impulse noise factors respectively with corruption rates of 10%, 30%, 50%, 70% and 90%.
Test images: Brain, knee, mammogram and head images corrupted with various levels of impulse
noise.
The International Journal of Multimedia & Its Applications (IJMA) Vol.3, No.4, November 2011
99
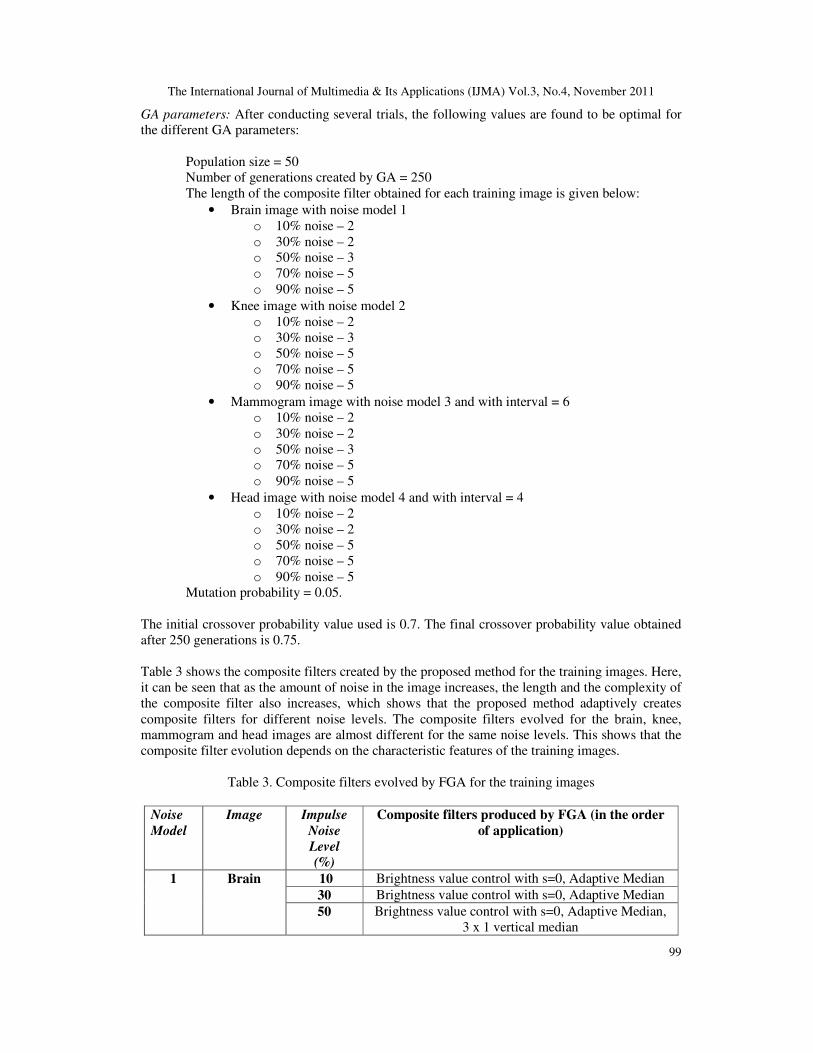
GA parameters: After conducting several trials, the following values are found to be optimal for
the different GA parameters:
Population size = 50
Number of generations created by GA = 250
The length of the composite filter obtained for each training image is given below:
• Brain image with noise model 1
o 10% noise – 2
o 30% noise – 2
o 50% noise – 3
o 70% noise – 5
o 90% noise – 5
• Knee image with noise model 2
o 10% noise – 2
o 30% noise – 3
o 50% noise – 5
o 70% noise – 5
o 90% noise – 5
• Mammogram image with noise model 3 and with interval = 6
o 10% noise – 2
o 30% noise – 2
o 50% noise – 3
o 70% noise – 5
o 90% noise – 5
• Head image with noise model 4 and with interval = 4
o 10% noise – 2
o 30% noise – 2
o 50% noise – 5
o 70% noise – 5
o 90% noise – 5
Mutation probability = 0.05.
The initial crossover probability value used is 0.7. The final crossover probability value obtained
after 250 generations is 0.75.
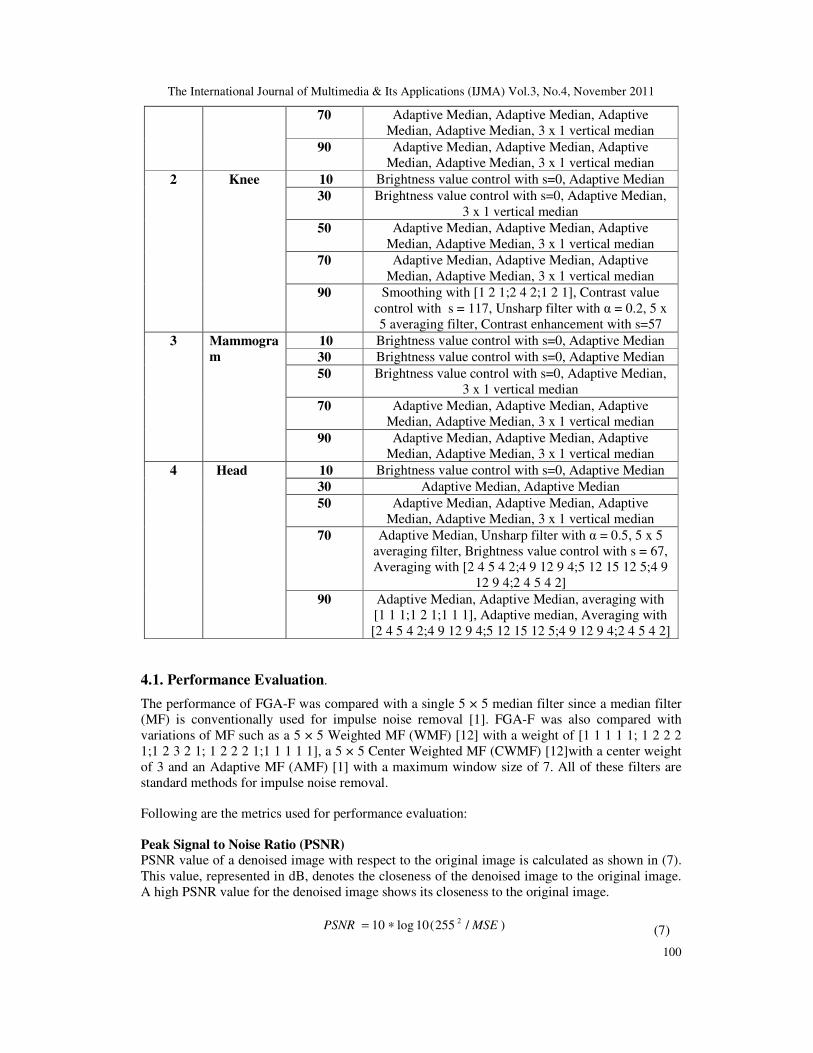
Table 3 shows the composite filters created by the proposed method for the training images. Here,
it can be seen that as the amount of noise in the image increases, the length and the complexity of
the composite filter also increases, which shows that the proposed method adaptively creates
composite filters for different noise levels. The composite filters evolved for the brain, knee,
mammogram and head images are almost different for the same noise levels. This shows that the
composite filter evolution depends on the characteristic features of the training images.
Table 3. Composite filters evolved by FGA for the training images
Noise
Model
Image Impulse
Noise
Level
(%)
Composite filters produced by FGA (in the order
of application)
1 Brain 10 Brightness value control with s=0, Adaptive Median
30 Brightness value control with s=0, Adaptive Median
50 Brightness value control with s=0, Adaptive Median,
3 x 1 vertical median
The International Journal of Multimedia & Its Applications (IJMA) Vol.3, No.4, November 2011
100
70 Adaptive Median, Adaptive Median, Adaptive
Median, Adaptive Median, 3 x 1 vertical median
90 Adaptive Median, Adaptive Median, Adaptive
Median, Adaptive Median, 3 x 1 vertical median
2 Knee 10 Brightness value control with s=0, Adaptive Median
30 Brightness value control with s=0, Adaptive Median,
3 x 1 vertical median
50 Adaptive Median, Adaptive Median, Adaptive
Median, Adaptive Median, 3 x 1 vertical median
70 Adaptive Median, Adaptive Median, Adaptive
Median, Adaptive Median, 3 x 1 vertical median
90 Smoothing with [1 2 1;2 4 2;1 2 1], Contrast value
control with s = 117, Unsharp filter with α = 0.2, 5 x
5 averaging filter, Contrast enhancement with s=57
3 Mammogra
m
10 Brightness value control with s=0, Adaptive Median
30 Brightness value control with s=0, Adaptive Median
50 Brightness value control with s=0, Adaptive Median,
3 x 1 vertical median
70 Adaptive Median, Adaptive Median, Adaptive
Median, Adaptive Median, 3 x 1 vertical median
90 Adaptive Median, Adaptive Median, Adaptive
Median, Adaptive Median, 3 x 1 vertical median
4 Head 10 Brightness value control with s=0, Adaptive Median
30 Adaptive Median, Adaptive Median
50 Adaptive Median, Adaptive Median, Adaptive
Median, Adaptive Median, 3 x 1 vertical median
70 Adaptive Median, Unsharp filter with α = 0.5, 5 x 5
averaging filter, Brightness value control with s = 67,
Averaging with [2 4 5 4 2;4 9 12 9 4;5 12 15 12 5;4 9
12 9 4;2 4 5 4 2]
90 Adaptive Median, Adaptive Median, averaging with
[1 1 1;1 2 1;1 1 1], Adaptive median, Averaging with
[2 4 5 4 2;4 9 12 9 4;5 12 15 12 5;4 9 12 9 4;2 4 5 4 2]
4.1. Performance Evaluation.
The performance of FGA-F was compared with a single 5 × 5 median filter since a median filter
(MF) is conventionally used for impulse noise removal [1]. FGA-F was also compared with
variations of MF such as a 5 × 5 Weighted MF (WMF) [12] with a weight of [1 1 1 1 1; 1 2 2 2
1;1 2 3 2 1; 1 2 2 2 1;1 1 1 1 1], a 5 × 5 Center Weighted MF (CWMF) [12]with a center weight
of 3 and an Adaptive MF (AMF) [1] with a maximum window size of 7. All of these filters are
standard methods for impulse noise removal.
Following are the metrics used for performance evaluation:
Peak Signal to Noise Ratio (PSNR) PSNR value of a denoised image with respect to the original image is calculated as shown in (7).
This value, represented in dB, denotes the closeness of the denoised image to the original image.
A high PSNR value for the denoised image shows its closeness to the original image.
)/255(10log10 2MSEPSNR ∗= (7)
The International Journal of Multimedia & Its Applications (IJMA) Vol.3, No.4, November 2011
101
where MSE is the mean squared error.
Tenengrad Measure
Tenengrad measure indicates the amount of edge details present in an image. Higher the value,
the more edge details present in the image. Tenengrad method is based on obtaining the gradient
magnitude from the Sobel operator. It is calculated as shown in (8).
( )∑∑−
=
−
=
>∇∇=1
2
1
2
2Ty)S(x,for ),(
M
x
N
y
yxSTEN
(8)
Where T is a discrimination threshold value and ),( yxS∇ is the Sobel gradient magnitude value.
Here, T is taken to be zero. When the TEN for the denoised image R is close to the original image
O, it shows that the denoising process preserves the edge details in the image. TEN of R is less
than TEN of O when the denoising process results in loss of edge details. TEN of R is greater
than TEN of O when the denoising process creates false edge details.
Image Quality Index (IQI)
IQI [6] is designed by modelling any image distortion as a combination of three factors: lossof
correlation, luminance distortion and contrast distortion. It is calculated as shown in (9).The value
of IQI ranges from [-1, 1]. A denoised image which is much similar to the original image has an
IQI value close to one.
),(),(),( ROContROLumROCorrIQI ∗∗= (9)
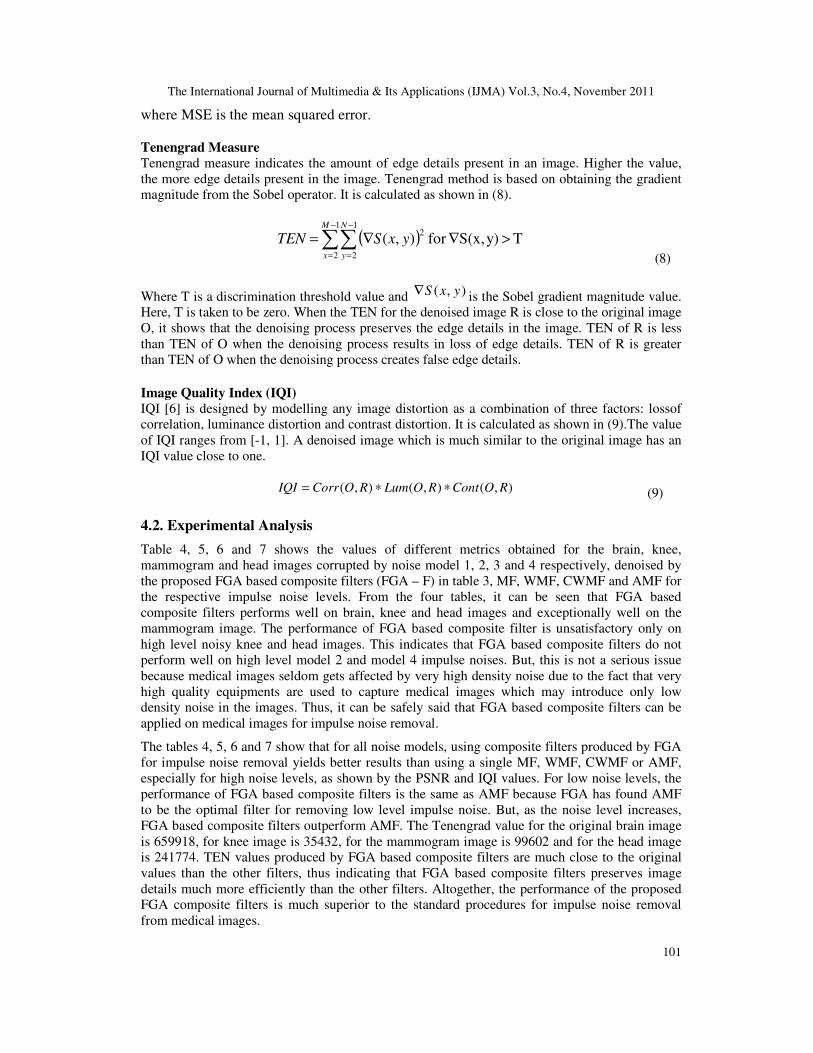
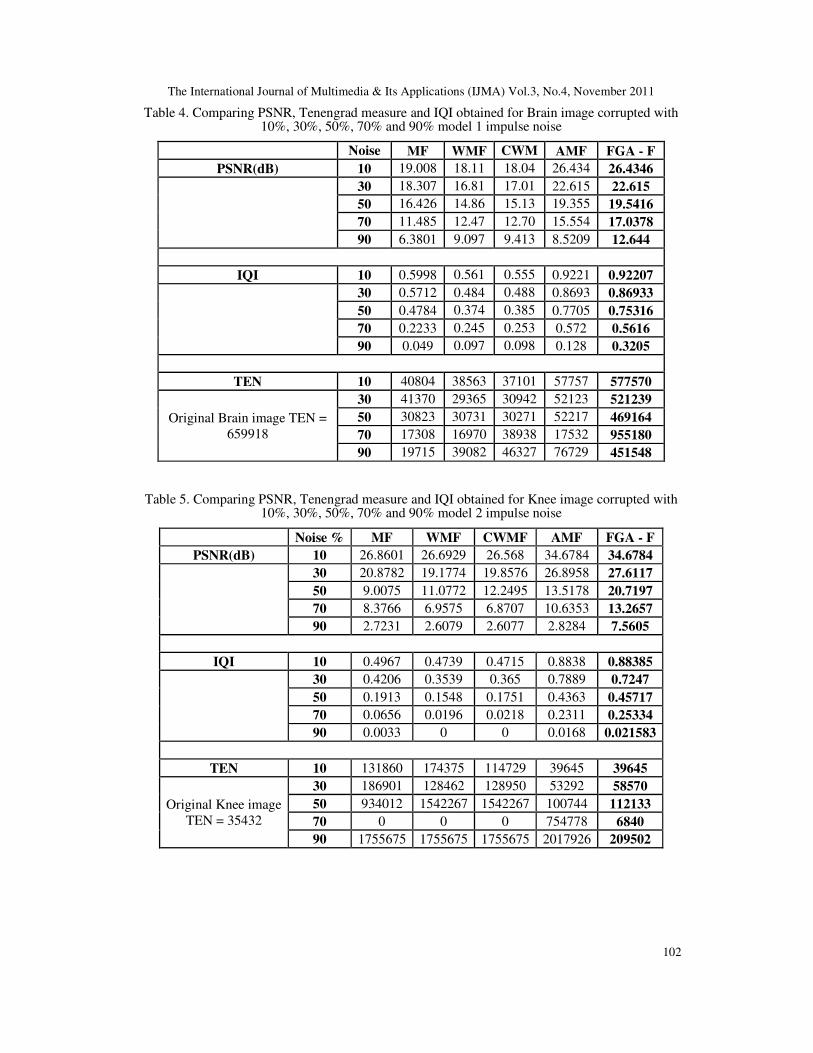
4.2. Experimental Analysis
Table 4, 5, 6 and 7 shows the values of different metrics obtained for the brain, knee,
mammogram and head images corrupted by noise model 1, 2, 3 and 4 respectively, denoised by
the proposed FGA based composite filters (FGA – F) in table 3, MF, WMF, CWMF and AMF for
the respective impulse noise levels. From the four tables, it can be seen that FGA based
composite filters performs well on brain, knee and head images and exceptionally well on the
mammogram image. The performance of FGA based composite filter is unsatisfactory only on
high level noisy knee and head images. This indicates that FGA based composite filters do not
perform well on high level model 2 and model 4 impulse noises. But, this is not a serious issue
because medical images seldom gets affected by very high density noise due to the fact that very
high quality equipments are used to capture medical images which may introduce only low
density noise in the images. Thus, it can be safely said that FGA based composite filters can be
applied on medical images for impulse noise removal.
The tables 4, 5, 6 and 7 show that for all noise models, using composite filters produced by FGA
for impulse noise removal yields better results than using a single MF, WMF, CWMF or AMF,
especially for high noise levels, as shown by the PSNR and IQI values. For low noise levels, the
performance of FGA based composite filters is the same as AMF because FGA has found AMF
to be the optimal filter for removing low level impulse noise. But, as the noise level increases,
FGA based composite filters outperform AMF. The Tenengrad value for the original brain image
is 659918, for knee image is 35432, for the mammogram image is 99602 and for the head image
is 241774. TEN values produced by FGA based composite filters are much close to the original
values than the other filters, thus indicating that FGA based composite filters preserves image
details much more efficiently than the other filters. Altogether, the performance of the proposed
FGA composite filters is much superior to the standard procedures for impulse noise removal
from medical images.
The International Journal of Multimedia & Its Applications (IJMA) Vol.3, No.4, November 2011
102
Table 4. Comparing PSNR, Tenengrad measure and IQI obtained for Brain image corrupted with 10%, 30%, 50%, 70% and 90% model 1 impulse noise
Noise
% MF WMF CWM
F AMF FGA - F
PSNR(dB) 10 19.008
8
18.11
33
18.04
62
26.434
6 26.4346
30 18.307
7
16.81
66
17.01
64 22.615 22.615
50 16.426
1
14.86
06
15.13
36
19.355
3 19.5416
70 11.485
6
12.47
67
12.70
91
15.554
1 17.0378
90 6.3801 9.097
9
9.413
8 8.5209 12.644
IQI 10 0.5998 0.561
1
0.555
5 0.9221 0.92207
30 0.5712 0.484 0.488
6 0.8693 0.86933
50 0.4784 0.374
4
0.385
5 0.7705 0.75316
70 0.2233 0.245
3
0.253
9 0.572 0.5616
90 0.049 0.097
1
0.098
9 0.128 0.3205
TEN 10 40804
0
38563
5
37101
9
57757
0 577570
Original Brain image TEN =
659918
30 41370
2
29365
6
30942
5
52123
9 521239
50 30823
2
30731
2
30271
7
52217
0 469164
70 17308
72
16970
3
38938
5
17532
05 955180
90 19715
9
39082
5
46327
5
76729
2 451548
Table 5. Comparing PSNR, Tenengrad measure and IQI obtained for Knee image corrupted with 10%, 30%, 50%, 70% and 90% model 2 impulse noise
Noise % MF WMF CWMF AMF FGA - F
PSNR(dB) 10 26.8601 26.6929 26.568 34.6784 34.6784
30 20.8782 19.1774 19.8576 26.8958 27.6117
50 9.0075 11.0772 12.2495 13.5178 20.7197
70 8.3766 6.9575 6.8707 10.6353 13.2657
90 2.7231 2.6079 2.6077 2.8284 7.5605
IQI 10 0.4967 0.4739 0.4715 0.8838 0.88385
30 0.4206 0.3539 0.365 0.7889 0.7247
50 0.1913 0.1548 0.1751 0.4363 0.45717
70 0.0656 0.0196 0.0218 0.2311 0.25334
90 0.0033 0 0 0.0168 0.021583
TEN 10 131860 174375 114729 39645 39645
Original Knee image
TEN = 35432
30 186901 128462 128950 53292 58570
50 934012 1542267 1542267 100744 112133
70 0 0 0 754778 6840
90 1755675 1755675 1755675 2017926 209502
The International Journal of Multimedia & Its Applications (IJMA) Vol.3, No.4, November 2011
103
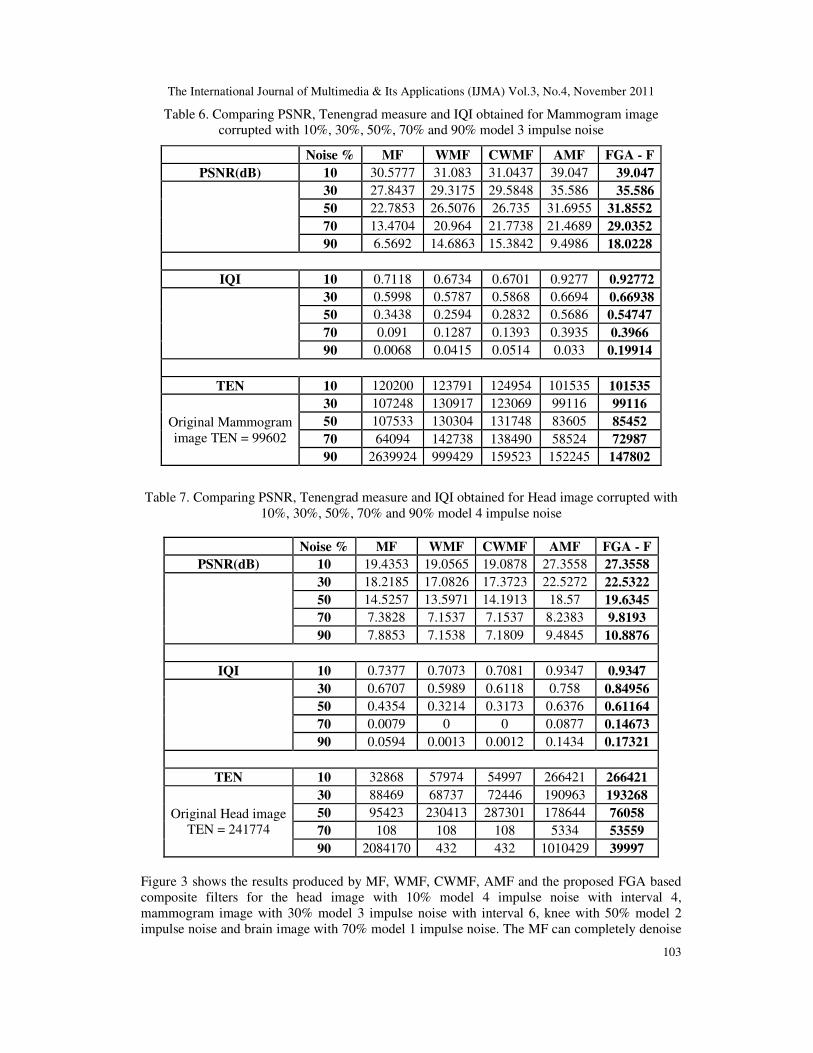
Table 6. Comparing PSNR, Tenengrad measure and IQI obtained for Mammogram image
corrupted with 10%, 30%, 50%, 70% and 90% model 3 impulse noise
Noise % MF WMF CWMF AMF FGA - F
PSNR(dB) 10 30.5777 31.083 31.0437 39.047 39.047
30 27.8437 29.3175 29.5848 35.586 35.586
50 22.7853 26.5076 26.735 31.6955 31.8552
70 13.4704 20.964 21.7738 21.4689 29.0352
90 6.5692 14.6863 15.3842 9.4986 18.0228
IQI 10 0.7118 0.6734 0.6701 0.9277 0.92772
30 0.5998 0.5787 0.5868 0.6694 0.66938
50 0.3438 0.2594 0.2832 0.5686 0.54747
70 0.091 0.1287 0.1393 0.3935 0.3966
90 0.0068 0.0415 0.0514 0.033 0.19914
TEN 10 120200 123791 124954 101535 101535
Original Mammogram
image TEN = 99602
30 107248 130917 123069 99116 99116
50 107533 130304 131748 83605 85452
70 64094 142738 138490 58524 72987
90 2639924 999429 159523 152245 147802
Table 7. Comparing PSNR, Tenengrad measure and IQI obtained for Head image corrupted with
10%, 30%, 50%, 70% and 90% model 4 impulse noise
Noise % MF WMF CWMF AMF FGA - F
PSNR(dB) 10 19.4353 19.0565 19.0878 27.3558 27.3558
30 18.2185 17.0826 17.3723 22.5272 22.5322
50 14.5257 13.5971 14.1913 18.57 19.6345
70 7.3828 7.1537 7.1537 8.2383 9.8193
90 7.8853 7.1538 7.1809 9.4845 10.8876
IQI 10 0.7377 0.7073 0.7081 0.9347 0.9347
30 0.6707 0.5989 0.6118 0.758 0.84956
50 0.4354 0.3214 0.3173 0.6376 0.61164
70 0.0079 0 0 0.0877 0.14673
90 0.0594 0.0013 0.0012 0.1434 0.17321
TEN 10 32868 57974 54997 266421 266421
Original Head image
TEN = 241774
30 88469 68737 72446 190963 193268
50 95423 230413 287301 178644 76058
70 108 108 108 5334 53559
90 2084170 432 432 1010429 39997
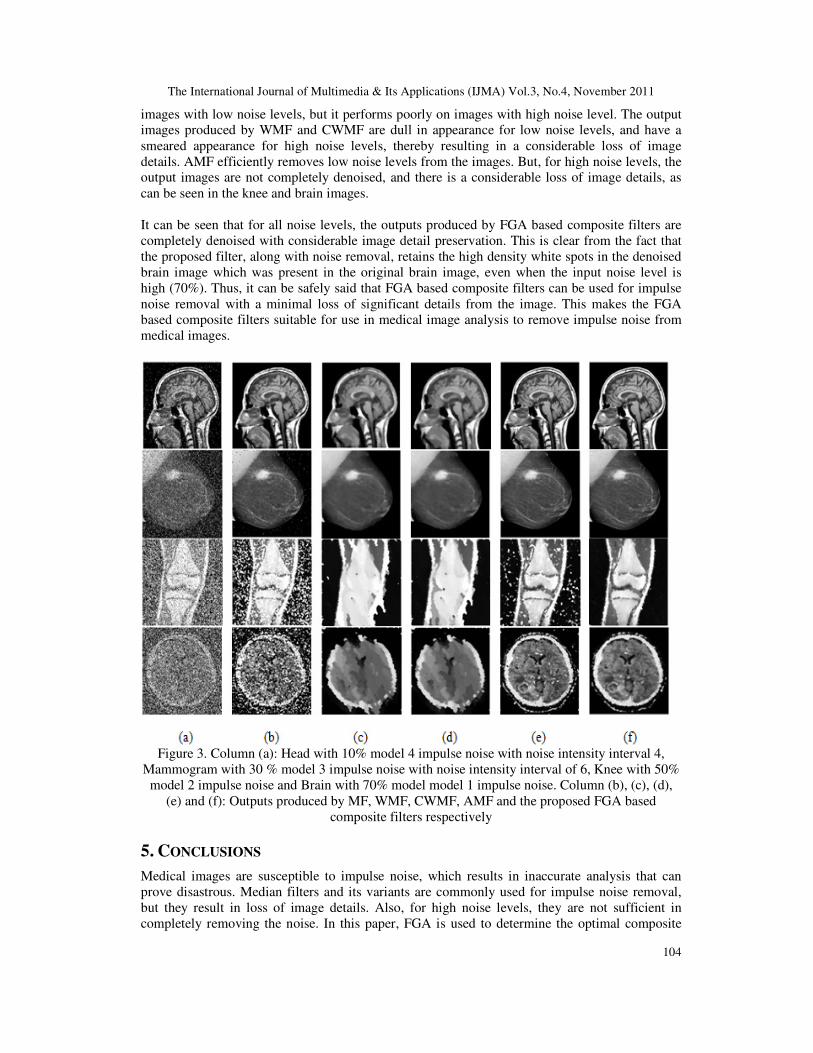
Figure 3 shows the results produced by MF, WMF, CWMF, AMF and the proposed FGA based
composite filters for the head image with 10% model 4 impulse noise with interval 4,
mammogram image with 30% model 3 impulse noise with interval 6, knee with 50% model 2
impulse noise and brain image with 70% model 1 impulse noise. The MF can completely denoise
The International Journal of Multimedia & Its Applications (IJMA) Vol.3, No.4, November 2011
104
images with low noise levels, but it performs poorly on images with high noise level. The output
images produced by WMF and CWMF are dull in appearance for low noise levels, and have a
smeared appearance for high noise levels, thereby resulting in a considerable loss of image
details. AMF efficiently removes low noise levels from the images. But, for high noise levels, the
output images are not completely denoised, and there is a considerable loss of image details, as
can be seen in the knee and brain images.
It can be seen that for all noise levels, the outputs produced by FGA based composite filters are
completely denoised with considerable image detail preservation. This is clear from the fact that
the proposed filter, along with noise removal, retains the high density white spots in the denoised
brain image which was present in the original brain image, even when the input noise level is
high (70%). Thus, it can be safely said that FGA based composite filters can be used for impulse
noise removal with a minimal loss of significant details from the image. This makes the FGA
based composite filters suitable for use in medical image analysis to remove impulse noise from
medical images.
Figure 3. Column (a): Head with 10% model 4 impulse noise with noise intensity interval 4,
Mammogram with 30 % model 3 impulse noise with noise intensity interval of 6, Knee with 50%
model 2 impulse noise and Brain with 70% model model 1 impulse noise. Column (b), (c), (d),
(e) and (f): Outputs produced by MF, WMF, CWMF, AMF and the proposed FGA based
composite filters respectively
5. CONCLUSIONS
Medical images are susceptible to impulse noise, which results in inaccurate analysis that can
prove disastrous. Median filters and its variants are commonly used for impulse noise removal,
but they result in loss of image details. Also, for high noise levels, they are not sufficient in
completely removing the noise. In this paper, FGA is used to determine the optimal composite
The International Journal of Multimedia & Its Applications (IJMA) Vol.3, No.4, November 2011
105
filters for removing different levels of impulse noise from medical images without using deep
knowledge about noise factors. Here, a FRB is used to adaptively change the crossover
probability of GA. Experiments conducted show that the proposed method is much better than the
standard procedures for removing impulse noise from medical images along with image detail
preservation. As future work, the proposed method can be used in applications such as impulse
noise removal from satellite images.
ACKNOWLEDGEMENTS
The authors would like to thank each and everyone who have helped in the creation of this paper.
REFERENCES
[1] Gonzalez, R. and Woods, R. (1992) Digital Image Processing, Addison Wesley, Reading, MA.
[2] Goldberg, G (1989) Genetic Algorithm in Search, Optimization and Learning, Addison Wesley.
[3] Jin Hyuk Hong, Sung Bae Cho and Ung Keun Cho (2009) “A Novel Evolutionary Method to Image
Enhancement Filter Design: Method and Applications”, IEEE Transactions on Systems, Man and
Cybernetics – Part B, Cybernetics, Vol. 39, No. 6, pp. 1446—1457.
[4] Jin Hyuk Hong, Sung Bae Cho and Ung Keun Cho (2006) “Image Enhancement for Impulsive Noise
Reduction”, Huang, D.S., Li, K., Irwin, G.W., (eds.) ICIC 2006. LNCS, Vol. 4113, pp. 678--683.
Springer, Heidelberg.
[5] Herrera, F. and Lozano, M (1996) “Adaptive Genetic Algorithms based on Fuzzy Techniques”,
Proceedings of the Sixth International Conference on Information Processing and Management
Uncertainty in Knowledge Based Systems, IEEE, pp. 775—780.
[6] Wang, Z. and Bovik, A.C (2002) “A universal image quality index”, IEEE Transactions on Signal
Processing Letters, 9(3), pp. 81—84.
[7] Ross, T. J (1995) Fuzzy Logic with Engineering Applications, McGraw Hill.
[8] Herrera, F. and Lozano, M (2001) “Adaptive Genetic Operators Based on Co evolution with Fuzzy
Behaviours”, IEEE Transactions on Evolutionary Computation, Vol. 5, No. 2, pp. 149—165.
[9] Lee, M. A. and Hideyuki Takagi (1993) ”Dynamic Control of Genetic Algorithms using Fuzzy Logic
Techniques”, Proceedings of Fifth International Conference on Genetic Algorithms, Urbana –
Champaign, IL, pp. 76—83.
[10] Cordon, O., Herrera, F., Hoffmann, F. and Magdalena, L (2001) “Genetic Fuzzy Systems -
Evolutionary Tuning and Learning of Fuzzy Knowledge Bases”, Advances in Fuzzy Systems —
Applications and Theory, Vol. 19,World Scientific Publishing Co. Pte. Ltd.
[11] Madhu S. Nair and G. Raju (2010) “A new fuzzy-based decision algorithm for high-density impulse
noise removal”, Springer-Verlag, London Limited. Signal Image and Video processing. DOI
10.1007/s11760-010-0186-4.
[12] Sung JeaKo and Yong Hoon Lee (1991) “Center Weighted Median Filters and their application to
Image Enhancement”, IEEE Transactions on Circuits and Systems, Vol 38, No 9.
The International Journal of Multimedia & Its Applications (IJMA) Vol.3, No.4, November 2011
106
Authors
Anisha K K obtained her B.Tech in Computer Science and Engineering from Government Engineering
College, Sreekrishnapuram, Kerala, India under University of Calicut, Kerala. She is currently pursuing her
M.Tech degree in Digital Image Computing from University of Kerala, Kariavattom, Thiruvananthapuram,
Kerala, India.
Dr. M. Wilscy received her B.Sc (Engg.) degree in Electrical Engineering from Kerala University, ME in
Automation from School of Automation, Indian Institute of Science, Bangalore and Ph.D
from Indian Institute of Technology, Madras. She is currently the Head of the Computer
Science department of University of Kerala, Kariavattom, Thiruvananthapuram, Kerala, India. She has
more than 30 years of teaching experience and her current research interests include applying intelligent
techniques to Digital Image Processing. She is a Fellow of the Institution of Engineers India, a Member of
IEEE, and member of Indian Society of Technical Education