IMPROVING WIND FARM OPERATION PRACTICE THROUGH NUMERICAL MODELLING AND DATA MINING
8
IMPROVING WIND FARM OPERATION PRACTICE THROUGH NUMERICAL MODELLING AND DATA MINING Francesco Castellani University of Perugia - Department of Industrial Engineering [email protected] Davide Astolfi University of Perugia Department of Industrial Engineering davide.astolfi.green@gma il.com Ludovico Terzi Sorgenia Green [email protected] Emanuele Piccioni University of Perugia - Department of Industrial Engineering [email protected] Abstract Knowledge of the wind energy production potential is fundamental both for the development and construction of a new wind farm as well as during the operational phase, especially in the early period. Usually wind energy assessment is carried out with the maximum effort prior the installation of the turbines using both numerical and experimental investigations. Anyway, despite the very fast development of the assessment techniques, too many times the actual wind farm performances during operation are not as good as expected according to the previous estimations. This issue can be fixed not only pushing the wind assessment methods to the maximum reliability standards but also with a deep analysis of the operational conditions of the wind farm. The large amount of data collected by the SCADA (Supervisory Control And Data Acquisition) systems installed on the turbines can be very helpful. In present work the performances of a wind farm were analysed through the elaboration of SCADA data from a wind farm in southern Italy; in this site Sorgenia Green installed nine aerogenerators with a rated power of 2 MW on an hilly area with quite gentle slopes. All the most important turbine parameters were used not only for the performance analysis but also to enrich the operational practice trying to define the wind farm behaviour especially in the main direction sectors. This goal was pursued basically with data mining and using wind flow numerical modelling. Keywords: SCADA, condition monitoring, wind farm performance, data mining. 1 Introduction The expertise on wind farm operation is a very important skill that can be fundamental to improve the actual performances in the energy conversion. Many useful information on the expected wind farm response to the wind can be found in the wind energy assessment study through the analysis of measurements and numerical simulations. Anyway a very deep operational analysis needs to be enriched by data mining of all available information spreading out from the turbine’s control systems. In this work a new method of performance analysis using both experimental data as well numerical techniques was tested on a small wind farm operating onshore on an hilly terrain. This kind of approach allowed unveiling all the fundamental information that can be available from operational SCADA data and that could be very useful in order to schedule maintenance intervention in an optimal way or to plan wind turbine stops when power regulation can be useful. 2 The Wind Farm This work deals with the production and wind data of a wind farm located in the south of Italy: it is located in a quite flat land where there are installed nine REpower turbines with a specific rated power of 2000 kW, a hub height of 80 m and a rotor diameter of 82 m. Sorgenia Green, the wind farm owner, provided a database of SCADA and anemometer data that was analyzed and compared with results from numerical simulations. In figure 1 the wind farm layout is represented.
Transcript of IMPROVING WIND FARM OPERATION PRACTICE THROUGH NUMERICAL MODELLING AND DATA MINING
IMPROVING WIND FARM OPERATION PRACTICE THROUGH NUMERICAL MODELLING AND DATA MINING
Francesco Castellani University of Perugia -
Department of Industrial Engineering
Davide Astolfi University of Perugia
Department of Industrial Engineering
Ludovico Terzi Sorgenia Green
Emanuele Piccioni University of Perugia -
Department of Industrial Engineering
Abstract Knowledge of the wind energy production potential is fundamental both for the development and construction of a new wind farm as well as during the operational phase, especially in the early period.
Usually wind energy assessment is carried out with the maximum effort prior the installation of the turbines using both numerical and experimental investigations. Anyway, despite the very fast development of the assessment techniques, too many times the actual wind farm performances during operation are not as good as expected according to the previous estimations.
This issue can be fixed not only pushing the wind assessment methods to the maximum reliability standards but also with a deep analysis of the operational conditions of the wind farm.
The large amount of data collected by the SCADA (Supervisory Control And Data Acquisition) systems installed on the turbines can be very helpful.
In present work the performances of a wind farm were analysed through the elaboration of SCADA data from a wind farm in southern Italy; in this site Sorgenia Green installed nine aerogenerators with a rated power of 2 MW on an hilly area with quite gentle slopes.
All the most important turbine parameters were used not only for the performance analysis but also to enrich the operational practice trying to define the wind farm behaviour especially in the main direction sectors. This goal was pursued basically with data mining and using wind flow numerical modelling.
Keywords: SCADA, condition monitoring, wind farm performance, data mining.
1 Introduction The expertise on wind farm operation is a very
important skill that can be fundamental to improve the actual performances in the energy conversion.
Many useful information on the expected wind farm response to the wind can be found in the wind energy assessment study through the analysis of measurements and numerical simulations.
Anyway a very deep operational analysis needs to be enriched by data mining of all available information spreading out from the turbine’s control systems.
In this work a new method of performance analysis using both experimental data as well numerical techniques was tested on a small wind farm operating onshore on an hilly terrain.
This kind of approach allowed unveiling all the fundamental information that can be available from operational SCADA data and that could be very useful in order to schedule maintenance intervention in an optimal way or to plan wind turbine stops when power regulation can be useful.
2 The Wind Farm This work deals with the production and wind data
of a wind farm located in the south of Italy: it is located in a quite flat land where there are installed nine REpower turbines with a specific rated power of 2000 kW, a hub height of 80 m and a rotor diameter of 82 m. Sorgenia Green, the wind farm owner, provided a database of SCADA and anemometer data that was analyzed and compared with results from numerical simulations.
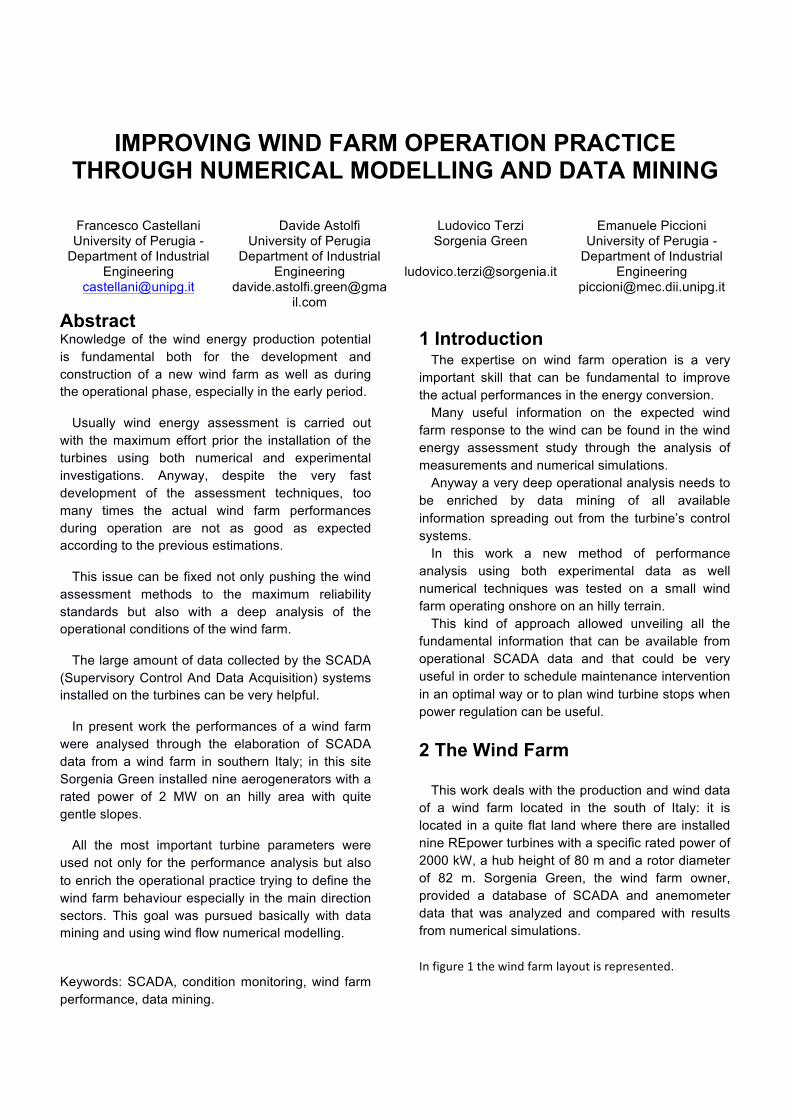
In figure 1 the wind farm layout is represented.
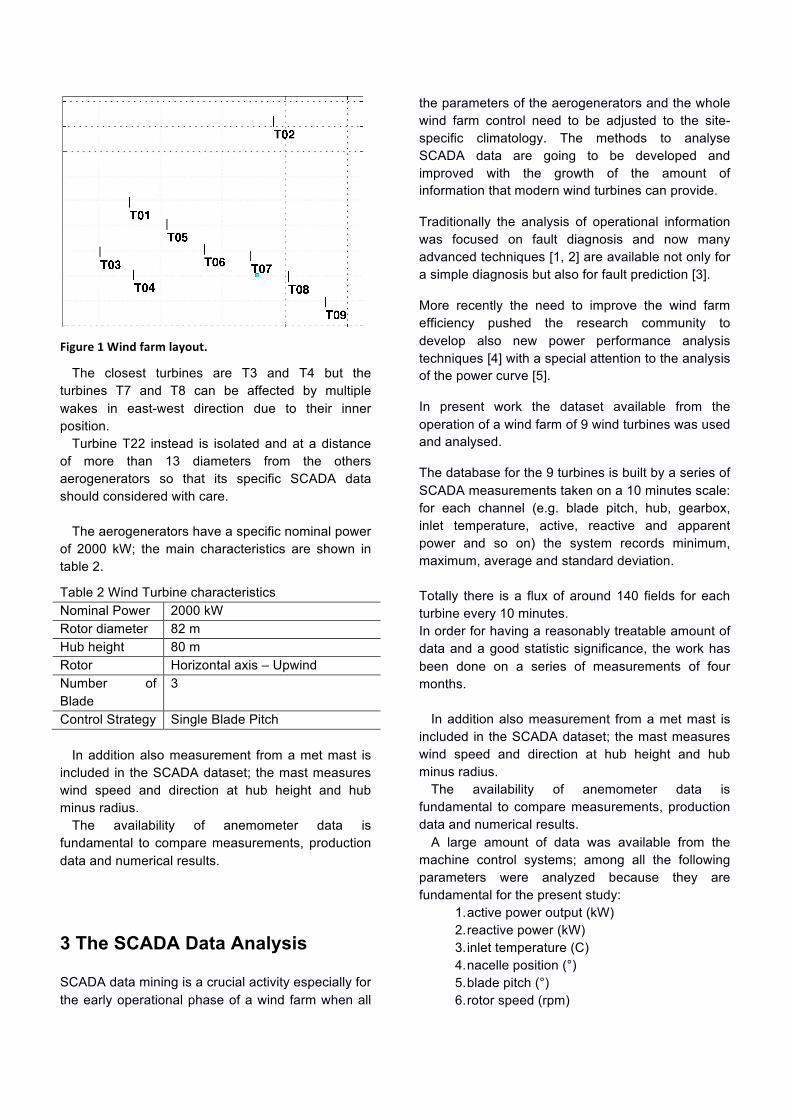
Figure 1 Wind farm layout.
The closest turbines are T3 and T4 but the turbines T7 and T8 can be affected by multiple wakes in east-west direction due to their inner position.
Turbine T22 instead is isolated and at a distance of more than 13 diameters from the others aerogenerators so that its specific SCADA data should considered with care.
The aerogenerators have a specific nominal power
of 2000 kW; the main characteristics are shown in table 2.
Table 2 Wind Turbine characteristics Nominal Power 2000 kW Rotor diameter 82 m Hub height 80 m Rotor Horizontal axis – Upwind Number of Blade
3
Control Strategy Single Blade Pitch In addition also measurement from a met mast is
included in the SCADA dataset; the mast measures wind speed and direction at hub height and hub minus radius.
The availability of anemometer data is fundamental to compare measurements, production data and numerical results.
3 The SCADA Data Analysis SCADA data mining is a crucial activity especially for the early operational phase of a wind farm when all
the parameters of the aerogenerators and the whole wind farm control need to be adjusted to the site-specific climatology. The methods to analyse SCADA data are going to be developed and improved with the growth of the amount of information that modern wind turbines can provide.
Traditionally the analysis of operational information was focused on fault diagnosis and now many advanced techniques [1, 2] are available not only for a simple diagnosis but also for fault prediction [3].
More recently the need to improve the wind farm efficiency pushed the research community to develop also new power performance analysis techniques [4] with a special attention to the analysis of the power curve [5].
In present work the dataset available from the operation of a wind farm of 9 wind turbines was used and analysed.
The database for the 9 turbines is built by a series of SCADA measurements taken on a 10 minutes scale: for each channel (e.g. blade pitch, hub, gearbox, inlet temperature, active, reactive and apparent power and so on) the system records minimum, maximum, average and standard deviation. Totally there is a flux of around 140 fields for each turbine every 10 minutes. In order for having a reasonably treatable amount of data and a good statistic significance, the work has been done on a series of measurements of four months.
In addition also measurement from a met mast is included in the SCADA dataset; the mast measures wind speed and direction at hub height and hub minus radius.
The availability of anemometer data is fundamental to compare measurements, production data and numerical results.
A large amount of data was available from the machine control systems; among all the following parameters were analyzed because they are fundamental for the present study:
1. active power output (kW) 2. reactive power (kW) 3. inlet temperature (C) 4. nacelle position (°) 5. blade pitch (°) 6. rotor speed (rpm)
The main goal of this study is to understand the real operational conditions relating to the main wind flow conditions especially when wakes interaction and alignment can be the driving phenomena. For this purpose the analysis was focused on the machine parameters that could be strictly related to the wind flow. These data have been crosschecked against the control system status code report on the same temporal basis. The status code report is built as a series of discrete data, describing the incoming or phasing out of a status. The status codes are classified as follows: error, warning, info and operating state. The operating states are mutually exclusive between themselves and there is a special info code (System OK) which, when incoming, turns off all the other status codes that might be active. Routines have been developed in Matlab and C++ which systematically crosscheck these two basis of data and perform a series of controls: the IEC standards actually require a level of depth which goes beyond usual routine monitoring and it is instructive as well as useful providing solid mathematical and computational tools. First of all it is checked whether the turbine active power, read from the 10 minute basis measurements, is as it should when the system is in the operating system which should guarantee the maximum power performance. From the status code report, control conditions are therefore easily obtained, with respect to which one can filter the measurements. Thus while the status code database is a consultative tool, i.e. read only, the measurements database is interactive. i.e. it can be cut or judiciously chosen parts of it can be copied to obtain a filtered database. In the following Figure 2, a sketch of the nature of interactions between the databases (SCADA turbines, Meteo station, Status Code database) is plotted.
Figure 2 The data flow The theoretical available power curve (Betz limit) of
a wind turbine is the function f (v) = 1627
π8ρd 2v3 ,
ρ being the density in kg per cubic metre, d being the rotor diameter. One can appreciate how the shape of the plot of the active power measurements against the wind velocity at the nacelle cleans up and becomes sensibly compatible with the above f(v), having filtered the data on the operating state which gives information about the proper power production. Actually output power can be curtailed by the system adjusting to the blade pitch angle, and is not actually due to a degradation of the wind turbine. Further one can renormalize the velocities with the density factor ρ , which is available from the SCADA data. This tool is crucial in order to check whether the contractual obligations between the Original Equipment Manufacturer and the wind farm operator are met. In the following Figures 3-5 the power curves of T1 are shown. Firstly (3), without filtering the data at all, then (4) requiring the product power times velocity being greater than 1, then (5) also requiring the operating state of maximum power production being on. In figure (6), the power curves of turbines 1 to 7 is shown in a unique plot. Only seven out of nine are plotted only for reader’s clarity, but the shape is similar.
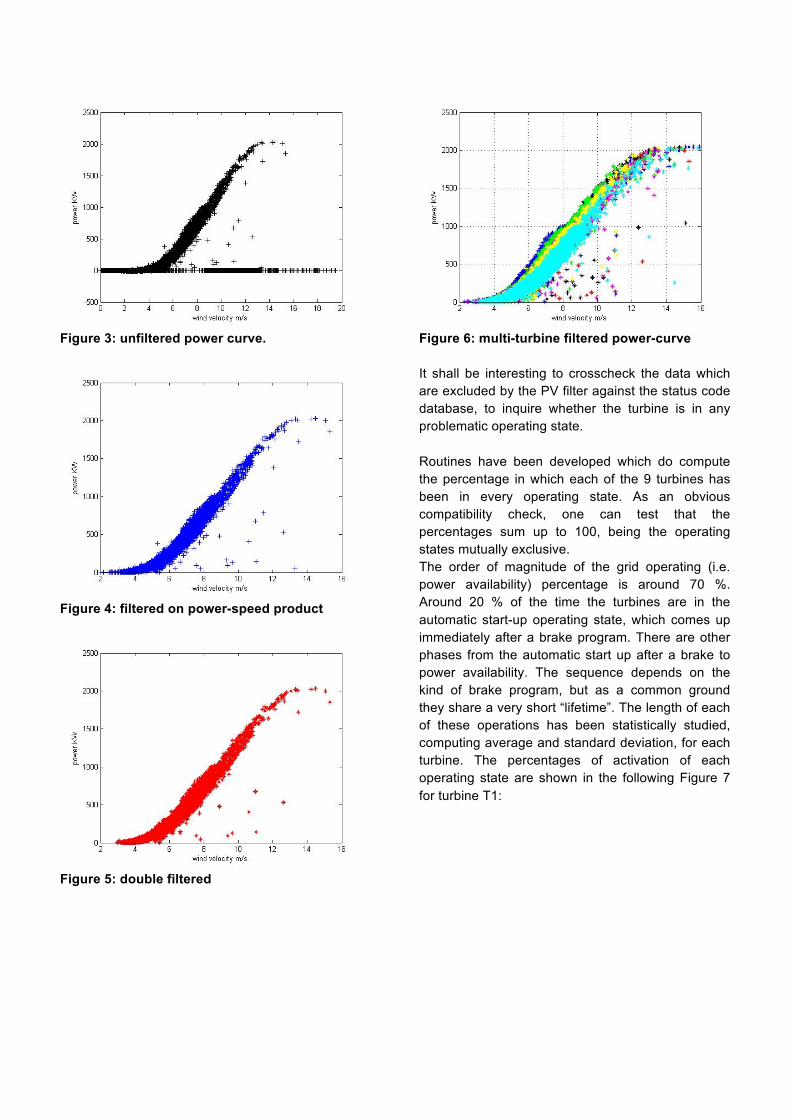
Figure 3: unfiltered power curve.
Figure 4: filtered on power-speed product
Figure 5: double filtered
Figure 6: multi-turbine filtered power-curve It shall be interesting to crosscheck the data which are excluded by the PV filter against the status code database, to inquire whether the turbine is in any problematic operating state. Routines have been developed which do compute the percentage in which each of the 9 turbines has been in every operating state. As an obvious compatibility check, one can test that the percentages sum up to 100, being the operating states mutually exclusive. The order of magnitude of the grid operating (i.e. power availability) percentage is around 70 %. Around 20 % of the time the turbines are in the automatic start-up operating state, which comes up immediately after a brake program. There are other phases from the automatic start up after a brake to power availability. The sequence depends on the kind of brake program, but as a common ground they share a very short “lifetime”. The length of each of these operations has been statistically studied, computing average and standard deviation, for each turbine. The percentages of activation of each operating state are shown in the following Figure 7 for turbine T1:
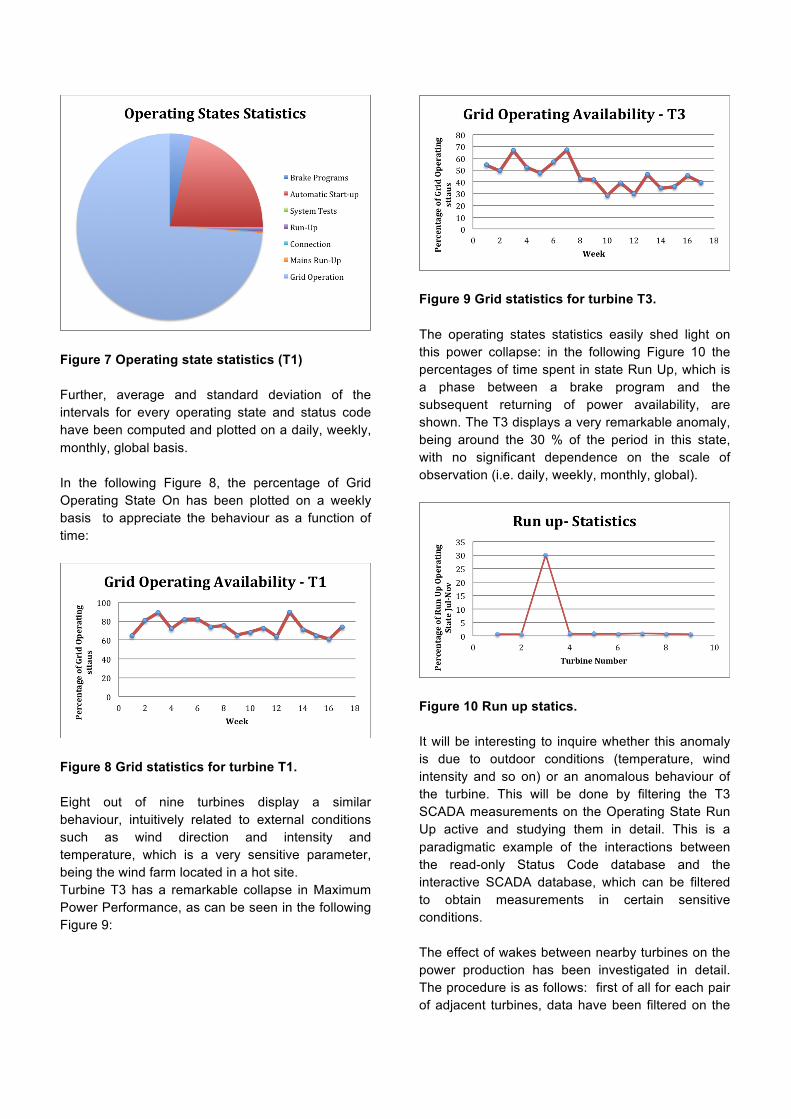
Figure 7 Operating state statistics (T1) Further, average and standard deviation of the intervals for every operating state and status code have been computed and plotted on a daily, weekly, monthly, global basis. In the following Figure 8, the percentage of Grid Operating State On has been plotted on a weekly basis to appreciate the behaviour as a function of time:
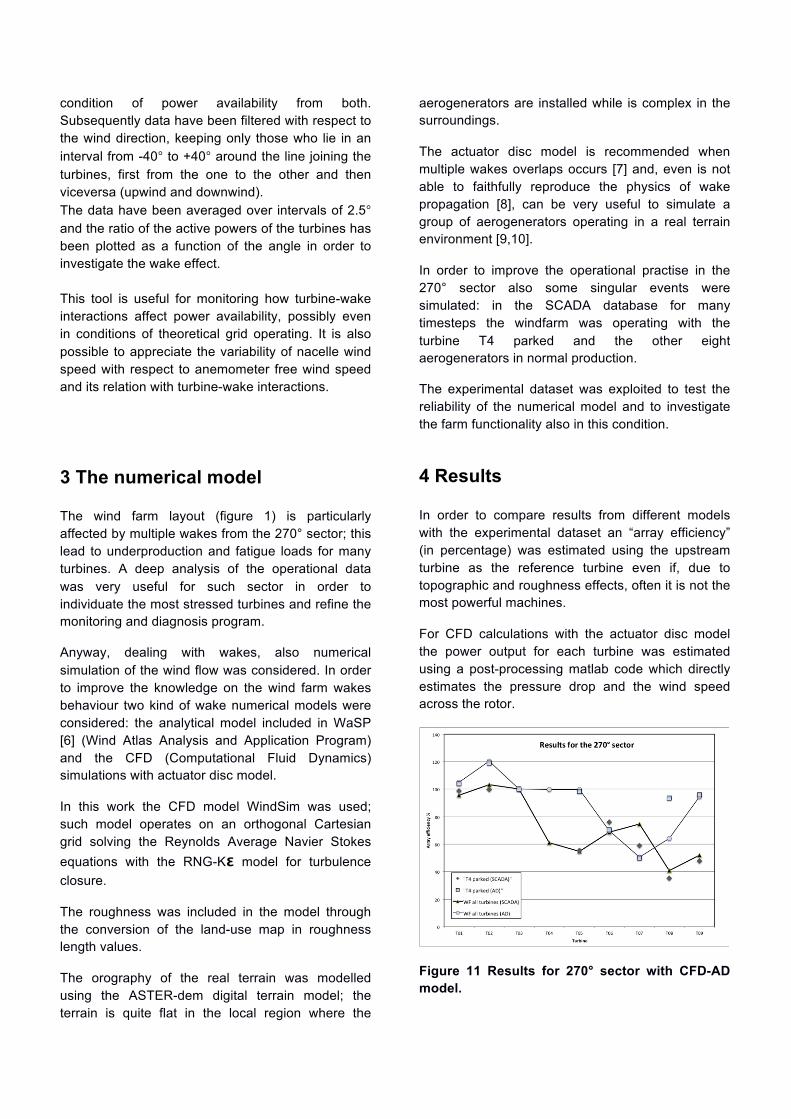
Figure 8 Grid statistics for turbine T1. Eight out of nine turbines display a similar behaviour, intuitively related to external conditions such as wind direction and intensity and temperature, which is a very sensitive parameter, being the wind farm located in a hot site. Turbine T3 has a remarkable collapse in Maximum Power Performance, as can be seen in the following Figure 9:
Figure 9 Grid statistics for turbine T3. The operating states statistics easily shed light on this power collapse: in the following Figure 10 the percentages of time spent in state Run Up, which is a phase between a brake program and the subsequent returning of power availability, are shown. The T3 displays a very remarkable anomaly, being around the 30 % of the period in this state, with no significant dependence on the scale of observation (i.e. daily, weekly, monthly, global).
Figure 10 Run up statics. It will be interesting to inquire whether this anomaly is due to outdoor conditions (temperature, wind intensity and so on) or an anomalous behaviour of the turbine. This will be done by filtering the T3 SCADA measurements on the Operating State Run Up active and studying them in detail. This is a paradigmatic example of the interactions between the read-only Status Code database and the interactive SCADA database, which can be filtered to obtain measurements in certain sensitive conditions. The effect of wakes between nearby turbines on the power production has been investigated in detail. The procedure is as follows: first of all for each pair of adjacent turbines, data have been filtered on the
condition of power availability from both. Subsequently data have been filtered with respect to the wind direction, keeping only those who lie in an interval from -40° to +40° around the line joining the turbines, first from the one to the other and then viceversa (upwind and downwind). The data have been averaged over intervals of 2.5° and the ratio of the active powers of the turbines has been plotted as a function of the angle in order to investigate the wake effect. This tool is useful for monitoring how turbine-wake interactions affect power availability, possibly even in conditions of theoretical grid operating. It is also possible to appreciate the variability of nacelle wind speed with respect to anemometer free wind speed and its relation with turbine-wake interactions.
3 The numerical model The wind farm layout (figure 1) is particularly affected by multiple wakes from the 270° sector; this lead to underproduction and fatigue loads for many turbines. A deep analysis of the operational data was very useful for such sector in order to individuate the most stressed turbines and refine the monitoring and diagnosis program.
Anyway, dealing with wakes, also numerical simulation of the wind flow was considered. In order to improve the knowledge on the wind farm wakes behaviour two kind of wake numerical models were considered: the analytical model included in WaSP [6] (Wind Atlas Analysis and Application Program) and the CFD (Computational Fluid Dynamics) simulations with actuator disc model.
In this work the CFD model WindSim was used; such model operates on an orthogonal Cartesian grid solving the Reynolds Average Navier Stokes equations with the RNG-Kε model for turbulence closure.
The roughness was included in the model through the conversion of the land-use map in roughness length values.
The orography of the real terrain was modelled using the ASTER-dem digital terrain model; the terrain is quite flat in the local region where the
aerogenerators are installed while is complex in the surroundings.
The actuator disc model is recommended when multiple wakes overlaps occurs [7] and, even is not able to faithfully reproduce the physics of wake propagation [8], can be very useful to simulate a group of aerogenerators operating in a real terrain environment [9,10].
In order to improve the operational practise in the 270° sector also some singular events were simulated: in the SCADA database for many timesteps the windfarm was operating with the turbine T4 parked and the other eight aerogenerators in normal production.
The experimental dataset was exploited to test the reliability of the numerical model and to investigate the farm functionality also in this condition.
4 Results In order to compare results from different models with the experimental dataset an “array efficiency” (in percentage) was estimated using the upstream turbine as the reference turbine even if, due to topographic and roughness effects, often it is not the most powerful machines.
For CFD calculations with the actuator disc model the power output for each turbine was estimated using a post-processing matlab code which directly estimates the pressure drop and the wind speed across the rotor.
Figure 11 Results for 270° sector with CFD-AD model.
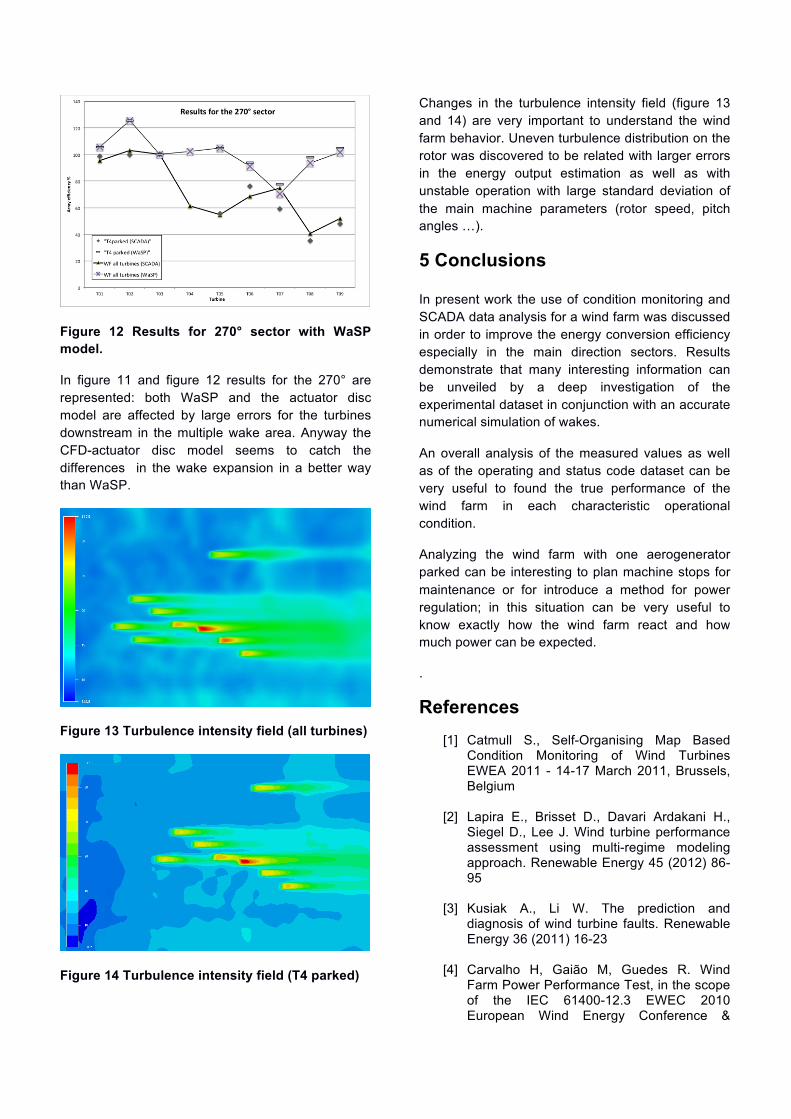
Figure 12 Results for 270° sector with WaSP model.
In figure 11 and figure 12 results for the 270° are represented: both WaSP and the actuator disc model are affected by large errors for the turbines downstream in the multiple wake area. Anyway the CFD-actuator disc model seems to catch the differences in the wake expansion in a better way than WaSP.
Figure 13 Turbulence intensity field (all turbines)
Figure 14 Turbulence intensity field (T4 parked)
Changes in the turbulence intensity field (figure 13 and 14) are very important to understand the wind farm behavior. Uneven turbulence distribution on the rotor was discovered to be related with larger errors in the energy output estimation as well as with unstable operation with large standard deviation of the main machine parameters (rotor speed, pitch angles …).
5 Conclusions In present work the use of condition monitoring and SCADA data analysis for a wind farm was discussed in order to improve the energy conversion efficiency especially in the main direction sectors. Results demonstrate that many interesting information can be unveiled by a deep investigation of the experimental dataset in conjunction with an accurate numerical simulation of wakes.
An overall analysis of the measured values as well as of the operating and status code dataset can be very useful to found the true performance of the wind farm in each characteristic operational condition.
Analyzing the wind farm with one aerogenerator parked can be interesting to plan machine stops for maintenance or for introduce a method for power regulation; in this situation can be very useful to know exactly how the wind farm react and how much power can be expected.
. References
[1] Catmull S., Self-Organising Map Based Condition Monitoring of Wind Turbines EWEA 2011 - 14-17 March 2011, Brussels, Belgium
[2] Lapira E., Brisset D., Davari Ardakani H., Siegel D., Lee J. Wind turbine performance assessment using multi-regime modeling approach. Renewable Energy 45 (2012) 86-95
[3] Kusiak A., Li W. The prediction and
diagnosis of wind turbine faults. Renewable Energy 36 (2011) 16-23
[4] Carvalho H, Gaião M, Guedes R. Wind
Farm Power Performance Test, in the scope of the IEC 61400-12.3 EWEC 2010 European Wind Energy Conference &

Exhibition Proceedings - Tuesday 20 - Friday 23 April 2010, Warsaw, Poland
[5] Gill S., Stephen B. and Galloway S. Wind
Turbine Condition Assessment Through Power Curve Copula Modeling IEEE TRANSACTIONS ON SUSTAINABLE ENERGY, VOL. 3, NO. 1, JANUARY 2012
[6] WAsP – the Wind Atlas Analysis and
Application Program web site: http://www.wasp.dk/
[7] Sanderse B. Aerodynamics of wind turbine wakes - Literature review. ECN-Energy research centre of the Netherlands http://www.ecn.nl/docs/library/report/2009/e09016.pdf
[8] Rèthoré PE, Sørensen NN, Zahle F.
Validation of an Actuator Disc Model. EWEC 2010 European Wind Energy Conference & Exhibition Proceedings - Tuesday 20 - Friday 23 April 2010, Warsaw, Poland
[9] Castellani F. , Vignaroli A. – “An application
of the actuator disc model for wind turbine wakes calculations.” – Applied Energy – Elsevier – ISSN 0306-2619 – 2012 – In press – 10.1016/j.apenergy.2012.04.039;
[10] Crasto G., Gravdahl A.R., Castellani F.,
Piccioni E. – “Wake Modeling with the Actuator Disc Concept.” – Energy Procedia – Elsevier ISSN 1876-6102 - 24-2012 - 0.1016/j.egypro.2012.06.122;