agl-silverton-wind-farm-bird-bat-adaptive-management-plan ...
128
-
Upload
khangminh22 -
Category
Documents
-
view
4 -
download
0
Transcript of agl-silverton-wind-farm-bird-bat-adaptive-management-plan ...

Bird & bat adaptive management plan
for Silverton Wind Farm
Prepared for GE Renewable Energy Onshore Wind - Projects and Services
05 May 2018

Biosis Pty Ltd
This document is and shall remain the property of Biosis Pty Ltd. The document may only be used for the purposes for which it was commissioned and in accordance with the Terms of the Engagement for the commission. Unauthorised use of this document in any form whatsoever is prohibited.
Disclaimer:
Biosis Pty Ltd has completed this assessment in accordance with the relevant federal, state and local legislation and current industry best practice. The company accepts no liability for any damages or loss incurred as a result of reliance placed upon the report content or for any purpose other than that for which it was intended.
© Biosis 2018 - Leaders in Ecology and Heritage Consulting - www.biosis.com.au i
Biosis offices
NEW SOUTH WALES
Newcastle
Phone: (02) 4911 4040 Email: [email protected]
Sydney
Phone: (02) 9101 8700 Email: [email protected]
Wollongong
Phone: (02) 4201 1090 Email: [email protected]
VICTORIA
Ballarat
Phone: (03) 5304 4250 Email: [email protected]
Melbourne (Head Office)
Phone: (03) 8686 4800 Fax: (03) 9646 9242 Email: [email protected]
Wangaratta
Phone: (03) 5721 9453 Email: [email protected]
Document information
Report to: GE Renewable Energy Onshore Wind - Projects and Services
Prepared by: Ian Smales
Biosis project no.: 26357
File name: 26357.Silverton.WF.BBAMP.Biosis.20180502
Citation: Biosis 2018. Bird & bat adaptive management plan for Silverton Wind Farm. Report for GE Renewable Energy Onshore Wind - Projects and Services. Author: I. Smales, Biosis Pty Ltd, Melbourne. Project no. 26357
Document control
Version Reviewer Date issued
Draft version 01 06/11/2017
Draft version 02 10/11/2017
Draft version 03 Client / DPE /OEH 15/11/2017
Draft version 04 Client 27/11/2017
Final version 01 Client 15/03/2018
Final version 02 Client 24/04/2018
Final version 03 02/05/2018
Acknowledgements
Biosis acknowledges the contribution of the following people and organisations in development of this plan:
• Catherine Powers: GE Renewable Energy Onshore Wind - Projects and Services
• Bree Lacey: AGL

© Biosis 2018 – Leaders in Ecology and Heritage Consulting II
Contents 1 Introduction ...................................................................................................................................................... 3
2 Baseline information ..................................................................................................................................... 6
3 Significant impact & trigger levels ............................................................................................................... 10
3.1 Guiding principles for determining significance of impacts .................................................................... 10 3.2 Trigger levels for management responses to bird & bat collisions at Silverton Wind Farm ............ 11
4 Monitoring strikes & effectiveness of impact minimisation ...................................................................... 15
4.1 Monitoring of turbine collisions ..................................................................................................................... 15 4.1.1 Carcass search method ....................................................................................................................... 15 4.1.2 Fall zone and estimation for unsearchable zones ......................................................................... 15 4.1.3 Turbines to be searched ...................................................................................................................... 16 4.1.4 Search duration and frequency ......................................................................................................... 17 4.1.5 Carcass & data collection & management ...................................................................................... 17 4.1.6 Carcass persistence trials .................................................................................................................... 20 4.1.7 Searcher efficiency trials ...................................................................................................................... 21 4.1.8 Incidental finds of bird and bat carcasses ....................................................................................... 22
4.2 Analyses of results ............................................................................................................................................ 23 4.3 Reporting ............................................................................................................................................................ 24 4.4 Injured birds and bats ...................................................................................................................................... 25
5 Management to minimise impacts on birds and bats ................................................................................ 27
5.1 Turbine locations relative to raptor nests ................................................................................................... 27 5.2 Minimising raptor perch sites ........................................................................................................................ 27 5.3 Large animal carcass removal ....................................................................................................................... 28 5.4 Pest animal control ........................................................................................................................................... 29 5.5 Deterrence of bats from turbines ................................................................................................................. 30 5.6 Adaptive management of turbines to reduce collisions .......................................................................... 31
References ................................................................................................................................................................ 33
Appendices ............................................................................................................................................................... 35
Appendix 1: Turbine mortality survey data sheet ................................................................................................. 35 Appendix 2: Dead or injured bird / bat data sheet ............................................................................................... 36 Appendix 3. Carcass persistence trial: carcass deployment data sheet .......................................................... 38 Appendix 4: Consolidated Bird Observation Map ................................................................................................. 39 Appendix 5: Consolidated Bat Observation Map .................................................................................................. 41 Appendix 6: Baseline bird and bat survey methods; risk assessment & results............................................ 43

© Biosis 2018 – Leaders in Ecology and Heritage Consulting www.biosis.com.au 3
1 Introduction
This Bird and Bat Adaptive Management Plan (BBAMP) for Silverton Wind Farm has been prepared in response to items in condition 17 and 19 of schedule 3 of the third modification of the project approval (‘condition 17 and 19 of schedule 3 of the MOD 3 project approval’) which was issued by the Planning Assessment Commission of NSW on the 22 December 2016 as well as the Statement of Commitments and Section 9.3 of the Environmental Assessment Main Report Part 2 undertaken by NGH Environmental in 2008. The relevant details of condition 17 and 19 of schedule 3 of the MOD 3 project approval are presented in the box below. This BBAMP should be read in conjunction with the Operations Environmental Management Plan (OEMP) which forms part of a set of documents known as the Service Plans.
Condition 17 and 19 of schedule 3 of the MOD 3 project approval is as follows:
Condition 17, Schedule 3
The Proponent must:
(b) ensure wind turbines are located as far as possible, but at least 200 metres, from raptor nests unless the Secretary agrees otherwise;
(e) minimise:
• impacts on the Barrier Range Dragon;
• impacts on threatened bird and bat populations;
• the clearing of native woodland vegetation and fauna habitat, in particular spinifex habitat,
• standing dead trees and woody habitat and high biodiversity value vegetation communities;
Condition 19, Schedule 3
Prior to the construction of any wind turbines, the Proponent must prepare a Bird and Bat Adaptive Management Plan for the project in consultation with OEH to the satisfaction of the Secretary. This program must include:
(a) baseline data on threatened and ‘at risk’ bird and bat species and populations in the locality that could potentially be affected by the project;
(b) a detailed description of the measures that would be implemented on site for minimising bird and bat strike during the project, including:
• locating turbines as far as possible away from any raptor nests;
• minimising the availability of raptor perches;
• prompt carcass removal;
• controlling pests;
• using best practice methods for bat deterrence; and
• adaptive management of turbines to reduce mortality; and
(c) trigger levels for further investigation of the potential impacts of the project on particular bird or bat species or populations, and the potential implementation of measures to enhance or protect these species or populations in the locality; and
(d) a detailed program to monitor and report on the effectiveness of these measures, and any bird or bat strikes on site.
Following the Secretary’s approval, the Proponent must implement the Bird and Bat Adaptive Management Plan, and incorporate it into the Biodiversity Management Plan.
[OEH = Office of Environment and Heritage]

© Biosis 2018 – Leaders in Ecology and Heritage Consulting www.biosis.com.au 4
This plan is set out to meet the requirements of the conditions as follows:
• Section 2 is provided to meet requirements of Condition 19 of schedule 3 of the MOD 3 (a) • Section 3 is provided to meet requirements of Condition 17 b) and Condition 19 of schedule 3 of the
MOD 3 (b) • Section 4 is provided to meet requirements of Condition 19 of schedule 3 of the MOD 3 (c) re trigger
levels for potential impacts • Section 5 is provided to meet requirements of Condition 19 of schedule 3 of the MOD 3 (d) • Section 6 is provided to meet requirements of Condition 19 of schedule 3 of the MOD 3 (c) re
potential measures to enhance or protect relevant species.
GE Renewable Energy Onshore Wind – Projects and Services will contract a Certified Environmental Practitioner (contract qualified ecologist) to oversee implementation of this plan.
In its response to conditions 17 and 19 of schedule 3 of the MOD 3 project approval, the BBAMP also address SOC55 (previously SOC46) in the updated Statement of Commitments.
In its response to conditions 17 and 19 of schedule 3 of the MOD 3 project approval, the BBAMP also addresses Section 9.3 of the Environmental Assessment – Main Report – Part 2.
SOC55 (SOC46) Design and implement an adaptive management monitoring program to document bird and bat mortalities, remove carcasses and assess the effectiveness of controls. If the results of assessment demonstrate that further mitigation is required, further turbine ridge habitat modification and enhancement of off-site habitats would be undertaken.
9.3 MONITORING AND ADAPTIVE MANAGEMENT
Monitoring and adaptive management mechanisms will be in place to reduce the operational impacts of the Proposal, should unforeseen impacts result. The Proposal has a degree of flexibility to address unforeseen impacts. Specific management responses will be determined by the nature and extent of impacts, but could include adjustments to the turbines and associated infrastructure or to offsite areas; for example, to install visual screening offsite or habitat enhancement away from turbine locations.
The CEMP and OEMP will employ adaptive management in response to monitoring results and other inputs. Due to the level of detail and site specific investigation required, monitoring programs will not be designed prior to project consent.
However, an indicative program is outlined below to assess the impact of the operational Proposal on birds and bats.
9.3.1 Example: bird and bat impact monitoring
Monitoring methods and data standards for dead bird searches, indirect disturbance impact assessment and habitat avoidance studies will be based on protocols in the Interim Standards for Assessing the Risks to Birds from Wind Farms in Australia (Brett Lane and Associates 2005).
In the case of bird and bat mortality, threshold mortality rates for threatened or sensitive bird and bat species would be determined for three monitoring periods (first six months, first two years, ongoing). The thresholds will trigger a management response, which will vary depending on the nature and extent of the impact.
The OEMP will contain details of a three-tiered monitoring program for bird and bat mortalities and habitat utilisation impacts:
1. First six months of operation
⎯ An intensive period of monitoring required because birds and bats are in the process of habituating to the new

© Biosis 2018 – Leaders in Ecology and Heritage Consulting www.biosis.com.au 5
[DECC: Department of Environment and Climate Change]
development, and sensitive species may experience higher levels of mortality during this period
⎯ During this period all turbine sites will be surveyed to determine variation in impact over the study area. Surveys may include monthly dead bird searches, bird utilisation surveys, observation of avoidance/diversion behaviour and targeted surveys for species of concern (such as raptors)
⎯ Reporting will examine the impacts on potentially vulnerable species (such as threatened species, waterbirds and raptors)
2. First two years of operation
⎯ Monitoring to assess mortality rates and trends over several seasons and longer term changes to local species abundance, habitat use patterns and possibly breeding success, directed by the results of previous monitoring
⎯ The surveys may be limited to representative or higher risk turbine sites, based on the results of previous monitoring.
⎯ Reporting will examine the impacts on potentially vulnerable species (such as threatened species, waterbirds and raptors)
3. Ongoing monitoring
⎯ Mortality inspection and reporting to be continued for the life of the wind farm, at intervals determined by the results of previous monitoring. The inspection regime may be linked to turbine inspection and maintenance cycles.
Mortalities of any significant species will be reported to DECC.

© Biosis 2018 – Leaders in Ecology and Heritage Consulting www.biosis.com.au 6
2 Baseline information
Information in this section is provided to meet requirements of Condition 19 of schedule 3 of the MOD 3 (a).
Pre-construction surveys for birds and bats at the site of Silverton Wind Farm were undertaken in accordance with Survey guidelines for Australia’s threatened birds. Guidelines for detecting birds listed as threatened under the Environment Protection and Biodiversity Conservation Act 1999 (Commonwealth of Australia 2010a) and Survey guidelines for Australia’s threatened bats. Guidelines for detecting bats listed as threatened under the Environment Protection and Biodiversity Conservation Act 1999 (Commonwealth of Australia 2010b). As noted in those guidelines, the surveys were designed to determine presence or the probability of presence of various species. They were not designed to establish or assess species abundance or other measures such as quantified flight rates of different species.
Raptor nest mapping and bat observations identified in the below studies undertaken by NGH Environmental (2016; 2018a; b) have been consolidated and identified in the maps at Appendix 4 and Appendix 5.
• Environmental Assessment – Biodiversity Assessment (dated March 2008) • Baseline bird surveys – pre-construction: • Spring / Summer Study 2016 • Autumn / Winter Study 2017 • Spring Study 2017 • Autumn Study 2018
The methods used for all baseline surveys are set out in Appendix 6. The cumulative results of the baseline surveys have informed the current plan and its adaptive framework for management of the wind farm, particularly in respect of the risk assessment process set out below. The baseline investigations have documented species of birds and bats at the site and the risk assessment has been applied to them. Further monitoring of the operational wind farm will be undertaken as part of the BACI design of these investigations (see below). The adaptive approach will permit application of the risk assessment process to address any identified new or altered risks for known species or for any additional species found to be using the site.
Bat calls were recorded by NGH Environmental (2016) using automated bat call detectors. The principal objective of that work was to determine the composition of the local bat fauna. Species abundance or flight frequencies cannot be determined from bat calls because there is no known correlation between bat calls and bat activity. Further, as noted by Law et al. (2015), natural and sampling variability in detected bat calls tends to be very high with night-to-night variation due to minor weather variables alone being a substantial variable.
Pennay (2017) recommended the inclusion of two additional species of threatened bats in the assessment because it is possible that they might occur at the site of Silverton Wind Farm. They are Corben’s Long-eared Bat Nyctophilus corbeni and Bristle-faced Freetail Bat Mormopterus eleryi.
Ecology and Heritage Partners (undated maps) have documented a small number of additional threatened passerine birds from the site and its environs.
Investigations of the presence and locations of bird and bat species at Silverton Wind Farm site have been established as a Before-After-Control-Impact (BACI) design. It is important that bird and bat surveys continue once the wind farm becomes operational and that the survey methods used prior to construction are continued using the same methods so that results from before- and after construction are appropriately comparable. The survey and study methods are set out in Appendix 6. Surveys prior to construction of the facility include Before and Control components. Studies after commissioning of the wind farm provide After, Control and Impact components. The BACI design is intended to be able to measure changes that may result

© Biosis 2018 – Leaders in Ecology and Heritage Consulting www.biosis.com.au 7
from operation of the wind farm. Annual reviews of the results of the BACI studies will be used to refine the adaptive framework of this BBAMP for management of the wind farm.
The NGH surveys for birds and bats have been undertaken at a series of point locations that provide a sample of habitats and environments for birds and bats. Hence, the results they provide are point locations at which relevant species were detected. Their results (NGH Environmental 2016; 2018a; b) show that species of birds and bats ‘of concern’ have been recorded widely distributed across the site. There is potential that collision risk for various species may differ between turbines and this will continue to be monitored as part of investigations of both bird and bat utilisation (i.e. continuation of baseline monitoring) and of bird and bat collisions, as set out in this plan. In accordance with the adaptive management framework, responsive actions will be implemented as necessary. We note, that the international and Australian literature includes a number of studies of raptors that have demonstrated that presence and even rates of utilisation are poor predictors of collision risk (Madders & Whitfield 2006; de Lucas et al. 2008; Ferrer et al. 2012; Hull et al. 2013).
NGH Environmental (2016, 2018b) provided methods and qualitative assessment of risk for listed threatened and migratory species of birds and bats known from the site and its environs. They included Rainbow Bee-eater as a species listed as migratory under the EPBC Act. It is no longer listed under that provision of the Act.
NGH Environmental (2016) also applied the risk assessment to additional species of raptors and some bats that are not threatened. Risk assessment for these additional species was undertaken particularly because it is considered that their flight behaviours may put them at a greater risk of collisions than most other taxa.
NGH Environmental (2016, 2018b) developed and applied a risk matrix for individual species of birds and bats that incorporates probability that the wind farm might alienate birds or bats from habitats at the wind farm and the likelihood that particular species might collide with turbines. Risks were ranked as Low; Medium or High on the basis of a set of defined likelihood and consequence factors. The risk assessment applied by NGH Environmental (2016, 2018b) indicates that collision or barotrauma due to interaction by birds or bats with turbines represents a greater risk than does the possibility that the wind farm might alienate birds or bats from their habitats or that it might present a barrier to their movements. Empirical evidence from operational wind farms in Australia supports this approach, as collisions by some species certainly occur, but there is no known documentary evidence for wind farm infrastructure resulting in alienation of Australian species of birds or bats. For that reason, this Plan is substantially concentrated on management to reduce effects of turbine collisions.
It is important to note that the assessment of turbine collision risk relates to the probability that particular species may collide with turbines. It is not an indication of the likelihood that collisions might represent a significant impact on the population of any species.
The risk matrix used by NGH (2016, 2018b), with three risk levels: Low, Moderate and High, assigned based on the likelihood, is replicated as Table 1, below.
Table 1 Risk matrix [from NGH (2016)]
Likelihood Consequence
Insignificant Minor Moderate Significant
Rare Low Low Moderate High Unlikely Low Low Moderate High Possible Low Moderate High High Probable Moderate High High High
Descriptions of likelihood and consequence factors for birds and bats, as used by NGH (2016), are set out in Table 2.

© Biosis 2018 – Leaders in Ecology and Heritage Consulting www.biosis.com.au 8
Table 2 Likelihood and consequence descriptors used in the NGH risk matrix
Likelihood Description Consequence Description
Rare An impact may occur only in unusual circumstances Insignificant
Impact on species not detectable in the short term
Unlikely An impact might occur at some time Minor
Impact may cause non-significant changes to local abundance of some species
Possible An impact could occur during most circumstances
Moderate
Impacts may cause significant changes to local abundance of species
Probable An impact is expected to occur in most circumstances
Significant Impacts may be significant at a population scale
Table 3 uses the NGH Environmental (2018b) revised collision risk assessment applied to listed threatened and migratory bird and bat species, including species from all sources noted above, that are considered to have potential to use the site and to the non-threatened species included in the assessment of NGH Environmental (2018b).
The risk assessment is qualitative (i.e. it is not quantitative in the manner of mathematical collision-risk modelling) and is indicative about potential risk for particular taxa. It has been used to determine three categories of taxa that are considered to be at a level of risk (listed species, non-threatened raptor species; and other non-threatened species) during operation of the wind farm. For this reason, the triggers in this BBAMP apply to any taxa in those categories regardless of current predictions of risk.
This BBAMP is applicable to all the taxa listed in Table 3. It also applies to any species subsequently found to occur at the site and that are listed as:
• threatened or migratory under provisions of the EPBC Act; • threatened on schedules of the NSW Biodiversity Conservation Act 2016; and, • non-threatened species of ‘at-risk’ birds and bats that were not previously known or predicted for the
site and/or have not been the subject of a risk assessment.
For the purpose of this plan, these are collectively termed ‘species of concern’.
Table 3 Qualitative assessment of turbine collision risk for birds & bats at Silverton Wind Farm
EPBC = Environment Protection & Biodiversity Conservation Act 1999; BAC = Biodiversity Conservation Act 2016
Species Conservation status Collision risk
Birds
Freckled Duck Stictonetta naevosa Vulnerable BCA Moderate
Black Kite Milvus migrans High
Square-tailed Kite Lophoictinia isura Moderate
Black-breasted Buzzard Hamirostra melanosternon Vulnerable BCA High

© Biosis 2018 – Leaders in Ecology and Heritage Consulting www.biosis.com.au 9
Species Conservation status Collision risk
Collared Sparrowhawk Accipiter cirrocephalus Low
Little Eagle Hieraaetus morphnoides Vulnerable BCA High
Wedge-tailed Eagle Aquila audax High
Spotted Harrier Circus assimilis Vulnerable BCA High
Brown Falcon Falco berigora High
Nankeen Kestrel Falco cenchroides Moderate
Grey Falcon Falco hypoleucos Endangered BCA Moderate
Pink Cockatoo Lophocroa leadbeateri Vulnerable BCA Moderate
White-throated Needletail Hirundapus caudacutus Migratory EPBC Moderate
Rufous Fieldwren Calamanthus campestris Vulnerable BCA Low
Redthroat Pyrrholaemus brunneus Vulnerable BCA Low
Pied Honeyeater Certhionyx variegatus Vulnerable BCA Moderate
Painted Honeyeater Grantiella picta Vulnerable BCA Moderate
White-fronted Chat Epthianura albifrons Vulnerable BCA Low
Hooded Robin (SE form) Melanodryas cucullata Vulnerable BCA Low
Varied Sittella Daphoenositta chrysoptera Vulnerable BCA Low
Dusky Woodswallow Artamus cyanopterus Vulnerable BCA Low
Diamond Firetail Stagonopleura guttata Vulnerable BCA Moderate
Bats
Yellow‐bellied Sheathtail Bat Saccolaimus flaviventris Vulnerable BCA High
Gould’s Wattled Bat Chalinolobus gouldii Moderate
Little Pied Bat Chalinolobus picatus Vulnerable BCA Moderate
Corben’s Long-eared Bat Nyctophilus corbeni Vulnerable EPBC & BCA Low
Inland Forest Bat Vespadelus baverstocki Vulnerable BCA High
Bristle-faced Freetail Bat Mormopterus eleryi Endangered BCA Low
White‐striped Freetail Bat Tadarida australis High

© Biosis 2018 – Leaders in Ecology and Heritage Consulting www.biosis.com.au 10
3 Significant impact & trigger levels
Information in this section is provided to meet requirements of Condition 19 of schedule 3 of the MOD 3 (c) in relation to trigger levels for potential impacts.
3.1 Guiding principles for determining significance of impacts
While the most desirable outcome for Silverton Wind Farm is that it will operate without any negative effect on birds and bats, it is recognised that some impact is likely to occur.
The overarching objective will be that the wind farm does not have a significant impact on the viability of the population of any species. It is worth noting that density dependence is an important ecological concept of relevance for consideration of effects on viability of wildlife populations. In essence, the size of any natural population is regulated by availability of resources to support it. This will include food, breeding sites, roost sites, mating opportunities, etc. all of which in combination represent ‘habitat’ for the species in question. Where an impact removes habitat the population will be reduced as a direct consequence. However, where the key resources for the species are not reduced and the population is otherwise stable, the mortality of one individual makes resources available to another whose survival prospects are improved and the net result is that the size of the population is not altered. Construction and operation of Silverton Wind Farm will have little impact on resource availability for most species of birds and bats and mortalities due to turbine collisions can be expected to function in accordance with density dependence with little influence on the equilibrium of affected populations.
Various guidelines published by the Commonwealth for application of the EPBC Act offer some principles of value in consideration of impacts on populations. Significant impact guidelines for threatened and migratory species listed under the EPBC Act are contained in Matters of National Environmental Significance: Significant impact guidelines 1.1 Environment Protection and Biodiversity Conservation Act 1999 (Commonwealth of Australia 2013), which also provides criteria for what might constitute a 'significant impact'. However, the criteria are not quantifiable in numbers of individual animals and only two of the species of concern for Silverton Wind Farm are listed under the EPBC Act.
The EPBC Act Policy Statement 2.3 Wind Farm Industry (Commonwealth of Australia 2009) provides some further explanation and examples relative to potential effects of the wind industry. The following excerpt is useful in its indication that the risk should be considered as proportional to the population size of particular species:
"An activity that affects, or is likely to affect, a small number of individuals usually would not be expected to have a significant impact on the species as a whole. However, when a species or community is in small numbers nationally, or its distribution or habitat is limited, or if the habitat has particular importance for the species, the activity could have a significant impact. In general, this would apply to species or communities that are most at risk of extinction and are, as such, listed as critically endangered or endangered.
An action is likely to have a significant impact on a species listed as vulnerable where it significantly affects an important population of that species. An example might be where a wind farm is proposed on an island or headland, or near a wetland, that has a key breeding population of a bird species listed as vulnerable. The breeding frequency and success rate for that species would also be relevant considerations."
None of the species of concern at Silverton Wind Farm are covered by Draft referral guideline for 14 birds listed as migratory species under the EPBC Act (Commonwealth of Australia 2015a), nonetheless it is provides further

© Biosis 2018 – Leaders in Ecology and Heritage Consulting www.biosis.com.au 11
guidance in that it considers that a significant impact would entail mortalities equalling or exceeding 1% of the population of a species and that further investigation would be required if it equalled or exceeds 0.1% of the population.
The Commonwealth guidance documents clearly indicate that the level of impact that may be significant is based on the measure of change that may be experienced by the population of a threatened or migratory species. This ‘population’ approach is ecologically meaningful as it responds appropriately to the population sizes of different species. Ideally, it would be possible to consider a number of turbine collision mortalities for a particular species as a proportion of its entire population and determine numbers and frequency of collisions that would warrant management response(s) according to whether they represent an ecologically important influence on the population’s viability (Smales 2017). That approach requires good estimates for the population sizes of relevant species. However, accurate population estimates are not available for any of the species of concern for Silverton Wind Farm.
At present there is little published information about rates of bird and bat fatalities at Australian wind farms. The only published peer-review information is from two Tasmanian wind farms with a combined total of 62 turbines that were monitored for different periods but over a total span of eight years (Hull et al. 2013; Hull & Cawthen 2013). They detected 245 bird carcasses and 54 bat carcasses during a total of 12,908 searches. It is important to note that due to sampling methods their detection rates do not equate to total numbers of collision fatalities that may have occurred. Nonetheless, extrapolating from their samples it appears unlikely that total collision fatalities represent significant impacts on the population viability of any species.
It is considered to be extremely unlikely that bird and bat fatalities due to collisions by any species at Silverton Wind Farm will be sufficient to represent a significant impact on the species overall population (e.g. to equal or exceeding 1% of the population of any species).
Baseline and post-construction studies of birds and bats at Silverton Wind Farm are aimed at detecting changes in distribution, abundance and activity (collectively termed ‘utilisation’) of these groups. Multiple variables external to operation of the wind farm, including land management practices, weather and climate are all likely to affect the local utilisation by birds and bats and the levels of collision mortalities of this fauna at other large wind energy facilities in Australia suggests that they are routinely too low and rare to be detectable by utilisation studies. For that reason, the discussion below about trigger levels for management response(s) at Silverton Wind Farm are defined by numbers of mortalities that may be actually detected by carcass searches, rather than by the indirect measures obtainable from utilisation studies. Nonetheless, the BACI bird and bat utilisation monitoring will remain important as a means to assess whether changes in species composition occur after the wind farm becomes operational and will be analysed to ascertain whether changes in utilisation by any species can be discerned.
3.2 Trigger levels for management responses to bird & bat collisions at Silverton Wind Farm
In the absence of population estimates for bird and bat species at Silverton Wind Farm, it is necessary to determine levels of collision mortality that represent levels that will trigger management responses measured by numbers of detected bird and bat collisions with turbines. As outlined above, the significance of any collision mortalities that may occur will differ according to the abundance and population dynamics, as well as the level of threat, for various taxa. Collision mortalities that might occur for any given species can be expected to fall into one of two levels depending upon the number and frequency at which they occur:
1. The number of collisions per annum is low and is unlikely to have any meaningful ecological effect on the local population

© Biosis 2018 – Leaders in Ecology and Heritage Consulting www.biosis.com.au 12
2. The number of collisions per annum represents a low, but uncertain potential to result in a negative effect on the local population
If the number and frequency of any detected collision mortalities is low and is unlikely to have any meaningful ecological effect on the local population (i.e. it does not exceed level 1, above), no action is required.
Triggers for responsive management actions will apply where the number of collisions per annum represents a low, but uncertain potential to result in a negative effect on the local population (level 2, above). The response is thus precautionary as it will be implemented at levels substantially below numbers of fatalities that are considered likely to represent a significant impact on the viability of the overall population of any species.
Defined trigger levels are set out below. For consistency, trigger levels are similar to those that have been adopted in other recently approved BBAMPs for wind energy in N.S.W. (e.g. White Rock Wind Farm (Brett Lane & Associates 2017)). The levels will be used, if required, as triggers for implementation of adaptive management aimed at reducing impacts to a level below the set trigger levels.
Trigger levels are for numbers of bird and bat fatalities detected during carcass searches (see Section 5, below). It is important to note that the number of fatalities detected by searches will almost certainly not represent the total number of animals killed because searches rarely detect all carcasses and because some carcasses will be removed by scavengers before they can be found. These effects are well known and there is an existing science for determining estimates of total mortalities from numbers of mortalities detected during searches (e.g. Huso et al. 2017). While estimation of total numbers of collision fatalities is important and will be undertaken for Silverton Wind Farm, the small numbers of collisions that generally occur at wind farms in Australia most often result in estimates of total mortality with very large confidence intervals (usually using 95% C. I.). For that reason, extrapolated estimates of total mortality do not provide a sound basis for use as trigger levels.
NGH Environmental (2016) allocated predicted risk of collisions for a range of bird and bat species, primarily for threatened species, but also including all raptors and some non-threatened taxa believed to be at high risk. That information, updated to include some additional species, is replicated as Table 3 (Section 2) of the current plan. Experience at the operational wind farm will tell whether additional species are at risk of collisions. Trigger levels are set here for three groups of species according to their differing conservation status and their relative natural abundance. The trigger levels will apply for all taxa that may use the site, regardless of whether they are included in Table 3, and for any species that are listed as threatened in future. For the purposes of this plan the following trigger levels will apply:
Listed threatened species
A trigger-level impact will occur where any carcass; featherspot; or injured individual of a single threatened species is found under or close to a wind turbine during any mortality search or incidentally by wind farm personnel.
Where population numbers are not well understood, an unacceptable impact will be considered to have occurred where more than three carcasses of any one threatened species are detected during formal searches and/or incidentally in the period of any two consecutive months.

© Biosis 2018 – Leaders in Ecology and Heritage Consulting www.biosis.com.au 13
Non-threatened raptor species
A trigger-level impact will occur where more than three carcasses or featherspots of a single non-threatened raptor species are detected during carcasses searches in any two consecutive months.
Where population numbers are not well understood, an unacceptable impact will be considered to have occurred where more than four carcasses of any one non-threatened raptor species are detected during formal searches and/or incidentally in the period of any two consecutive months.
Other non-threatened species (including species listed as migratory but not threatened)
A trigger-level impact will occur where more than four carcasses or featherspots of a single non-threatened species are detected during formal searches and/or incidentally in the period of any two consecutive months.
In line with other approved BBAMPs in N.S.W., trigger levels will not apply to any introduced species.
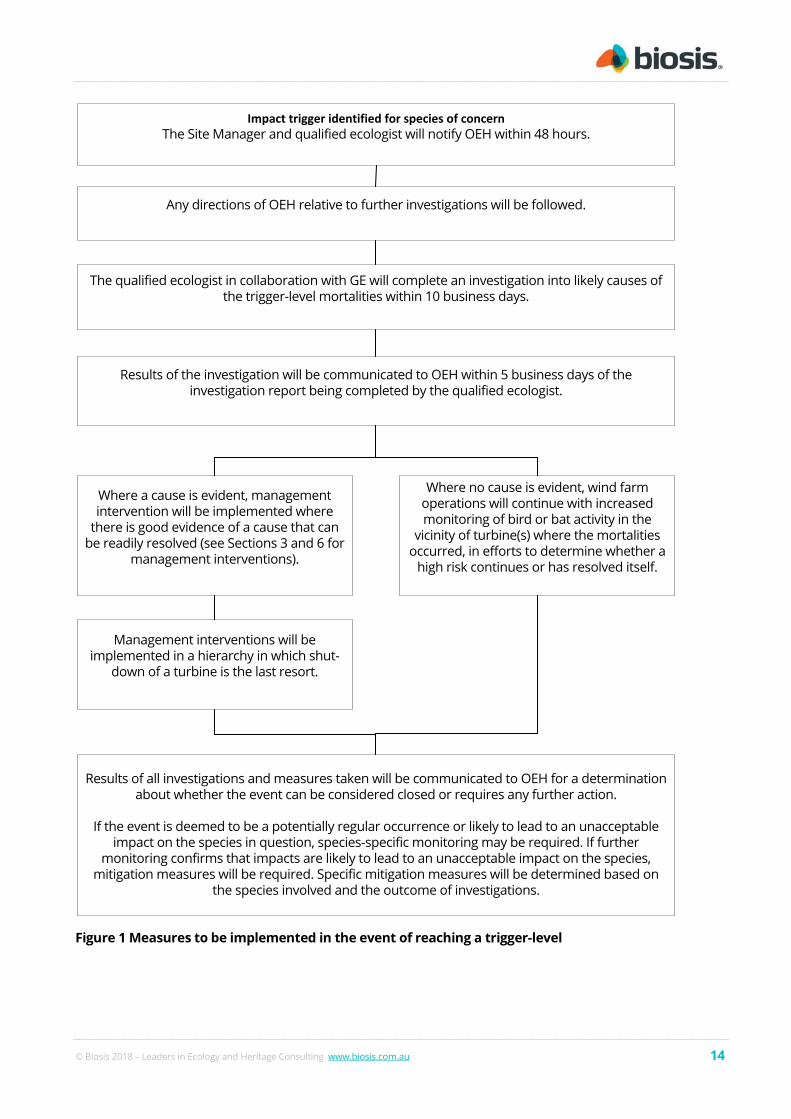
The decision-making process shown in Figure 1 will be implemented where a trigger-level has been reached for a species of concern.
© Biosis 2018 – Leaders in Ecology and Heritage Consulting www.biosis.com.au 14
Impact trigger identified for species of concernThe Site Manager and qualified ecologist will notify OEH within 48 hours.
Any directions of OEH relative to further investigations will be followed.
The qualified ecologist in collaboration with GE will complete an investigation into likely causes of the trigger-level mortalities within 10 business days.
Results of the investigation will be communicated to OEH within 5 business days of the investigation report being completed by the qualified ecologist.
Where no cause is evident, wind farm operations will continue with increased monitoring of bird or bat activity in the
vicinity of turbine(s) where the mortalities occurred, in efforts to determine whether a
high risk continues or has resolved itself.
Where a cause is evident, management intervention will be implemented where
there is good evidence of a cause that can be readily resolved (see Sections 3 and 6 for
management interventions).
Management interventions will be implemented in a hierarchy in which shut-
down of a turbine is the last resort.
Results of all investigations and measures taken will be communicated to OEH for a determination about whether the event can be considered closed or requires any further action.
If the event is deemed to be a potentially regular occurrence or likely to lead to an unacceptable impact on the species in question, species-specific monitoring may be required. If further
monitoring confirms that impacts are likely to lead to an unacceptable impact on the species, mitigation measures will be required. Specific mitigation measures will be determined based on
the species involved and the outcome of investigations.
Figure 1 Measures to be implemented in the event of reaching a trigger-level

© Biosis 2018 – Leaders in Ecology and Heritage Consulting www.biosis.com.au 15
4 Monitoring strikes & effectiveness of impact minimisation
Information in this section is provided to meet requirements of Condition 19 of schedule 3 of the MOD 3 (d).
Assessment against trigger levels will require a program for monitoring collisions in a sample of years. This will entail a regime of searches for dead birds and bats under turbines.
The following important principles have guided the design of studies described here:
• To the extent possible, they should be simple and minimise extraneous variables.
• In order to maximise their potential to meet stated objectives, they should obtain the largest sample sizes that are practicable.
• They must be able to be implemented without significantly compromising the routine operation and management of the wind farm.
The monitoring program set out here is designed to provide information about trigger levels and to inform estimates of total annual numbers of collisions, with associated confidence intervals, for all bird and bat species of concern.
4.1 Monitoring of turbine collisions
4.1.1 Carcass search method
Purpose-trained dogs have been shown to be highly efficient at detecting carcasses (Mathews et al. 2013) and have been used for this purpose at a number of wind farms in in Australia. Using purpose-trained dogs obviates the need for formal transects to be established in the search zones as dogs use scent to detect carcasses and are permitted to roam to do so. Every dog will be fitted with a GPS tracking device while undertaking searches. GPS tracks will be downloaded and maintained for future reference and used for analyses of search effort and coverage. GIS maps showing routes taken by dogs will be made available to OEH on request. The use of trained dogs is the preferred method for searches and will be used, provided appropriately trained dogs and handlers are available. Dog handler(s) must have demonstrated capacity to identify bird and bat species of western NSW.
However, if the use of dogs is not practicable at the Silverton site the alternative is to use people. Human observers will search by walking transects through the search zones. Searches by people will be undertaken by ecologists with demonstrated capacity to identify bird and bat species of western NSW. Transects will be spaced 6 metres apart, or as near to 6 metres as is practical and observers will thus search the ground for 3 metres either side of each transect. Each observer will carry a hand-held GPS unit and record transects they walk. GPS tracks will be downloaded and maintained for future reference and used for analyses of search effort and coverage. GIS maps showing transects walked will be made available to OEH on request.
4.1.2 Fall zone and estimation for unsearchable zones
Hull and Muir (2010) provide the sizes of likely fall zones for different turbines and sizes of birds and bats based on ballistics theory. They note that distance from the base of a turbine is an important factor in dispersion of carcasses and that with increased distance the density of carcasses decreases. They provide modelled fall zones and radii for percentages of expected distribution for two size classes of birds and one for small bats. Huso and Dalthorp (2014) compared five estimators for the relationship of carcass density to distance from modern wind turbines. For all five estimators tested they found that density approached zero at about 70 metres horizontal distance from the turbine base.

© Biosis 2018 – Leaders in Ecology and Heritage Consulting www.biosis.com.au 16
The greatest capacity to detect carcasses is obtained from intensive searches of defined areas of the potential fall zones and the most valid estimates of mortality come from distance-based carcass-density models (Huso and Dalthorp 2014). Because the densities of carcasses diminish with horizontal distance from a turbine, searching of large areas including the outer extremities of potential fall zones were shown by those authors to add little to detection rates but to add very substantially and disproportionally to search effort. Hence, intensive searches of the portion of the fall zone in which the majority of carcasses will be found are the most effective and appropriate. The great majority of birds and bats that may be involved in turbine collisions at Silverton Wind Farm are expected to be found within a radius of 70 metres of the bases of turbines.
The immediate areas around many turbines at Silverton Wind Farm include drop-offs and highly dissected rocky ground. Searches of the entire 70 metre radius under turbines by people or by handlers and dogs would entail substantial occupational health and safety risks. This is common to many wind farms internationally and Huso and Dalthorp (2014) and Huso et al. (2017) provide sound methodology for extrapolation from areas under turbines that are able to be searched safely. Each turbine at Silverton Wind Farm has an approach road and a hardstand of approximately 2300 square metres area. These clear areas will be readily searchable and searching them under all turbines in a given search regime (see 5.1.3, below) will introduce a uniformity to the search regime that would not otherwise be available. Therefore the search program will be confined to coverage of these clear areas out to a distance of 70 metres from the base of each turbine. Under the majority of turbines the access road passes alongside the turbine and the searchable zone will thus extend out to a 70-metre distance in two directions along the road. Where a turbine is situated at the end of a road, the 70-metre distance will extend only along that distance of the approach road. The extent of the 70-metre radius from the base of each turbine will be permanently marked on relevant roadsides. Current peer-review methods will be used to extrapolate from the numbers of carcasses detected within the defined searchable areas under turbines to provide an estimate of the number of carcasses likely to have fallen within the entire fall-zone under each turbine.
4.1.3 Turbines to be searched
Searches will be undertaken at all 58 turbines during an initial period that will encompass the first six months from November 2018 to April 2019, inclusive. This period covers the annual duration of heightened activity by bats and the breeding season of many birds. Subsequently, and in order to maximise capacity to provide statistically meaningful sample sizes and because collisions with turbines are likely to be infrequent events for the species of concern, carcass searching will be carried out under half of the total complement of 58 turbines. The selected 29 turbines will be searched over two consecutive months, 15 in one month, 14 the next and these will be allocated proportional to the total number of turbines situated within different vegetation zones, but otherwise will be selected at random. This may be varied if searches during the initial six months indicate that particular turbines represent significantly higher risk than others. Pre-construction bird surveys do not provide data sufficient to indicate ‘higher-risk’ zones but if searches during the initial six months do indicate higher risk associated with particular turbines, then such turbines will preferentially be included in the selection of turbines for on-going monitoring. The selection of turbines to be searched will be made at completion of the first six months of monitoring and will then be used throughout the remainder of the study.

© Biosis 2018 – Leaders in Ecology and Heritage Consulting www.biosis.com.au 17
4.1.4 Search duration and frequency
The regime of carcass searching will run for two years and will commence when all turbines are commissioned and become operational at the wind farm. At the completion of the first year of the monitoring program results will be collated and an interim report will be prepared. The results will be provided to OEH and in collaboration with OEH a determination will be made about any changes to search duration and/or frequency that might be made to improve effectiveness of the monitoring program. At the conclusion of the two year program and after analyses of results, a review will be undertaken in collaboration with OEH to determine whether any further monitoring is warranted.
It is likely (but uncertain at present) that carcasses of bats and small birds will be scavenged quickly at the site. Carcass persistence trials will be undertaken during the course of the study (see below), particularly to inform analyses required to extrapolate from numbers of carcasses detected to estimate total number of collisions. In order for the search regime to accommodate the likelihood of rapid scavenging, a relatively short period between initial searches is important.
A primary purpose of the search regime is to ascertain the frequency at which collisions occur. This is necessary for use in extrapolation to estimate total fatality rates. A three-day interval between two searches in each search cycle is designed to provide good capacity to determine frequency of collisions, because there is a high probability that a carcass found on day four must have collided in the preceding three days.
In each month when a turbine is to be searched, one search will be undertaken followed by a second search three days later. The frequency of carcass searches may be altered from the regime set out here if results of carcass persistence trials (see Section 5.1.6, below) indicate the value of doing so. The regime may be altered only if approval is first obtained from OEH.
4.1.5 Carcass & data collection & management
During all searches, all species of birds and bats detected as carcasses or as bird featherspots, will be recorded on a data pro forma designed for the purpose (see Appendices). Ideally, data will be collected on-site using electronic tablets which will maximize efficiency in data management. A featherspot is any collection of five or more feathers found grouped together in a manner that suggests a bird has died at the location. All information, including metadata for each turbine search will also be recorded irrespective of whether a carcass is found during a given search. All data will be entered into a single (backed-up) database to be maintained by the wind farm operator. Raw data will be available to relevant regulatory authorities on request.
On finding a carcass, it will be photographed in situ and its location will be logged using a portable GPS device. Carcasses of all taxa, whether species of concern or not, will be collected, labelled with relevant data details and frozen to permit any necessary investigations of cause of death and/or for use in future searcher efficiency or persistence trials. A freezer for this purpose will be available on-site. At the conclusion of the overall investigation, all specimens will be made available to the Australian Museum.
Retrieved carcasses of common species may be used later for scavenger trials and as the presence of human scent may influence scavenging rates, it is best to avoid direct human contact. Therefore, to avoid human scent being imparted to a carcass, and for health and safety reasons, gloves must be worn when handling bird and bat carcasses.

© Biosis 2018 – Leaders in Ecology and Heritage Consulting www.biosis.com.au 18
Table 4 Turbine carcass search regime
Action Timing /Frequency
Adaptive Management
Reporting Responsible Party Objective Measure
Engage dog-handler or human observer team(s) with experience at undertaking carcass searches at wind farms.
Prior to the commissioning of the wind farm; ongoing
Use human observers where a dog handler team is not available
Provide the company details and names of contractors to OEH
GE & contracted qualified ecologist
Determine the best method for conducting carcass searches in the Silverton Wind Farm environment
Demonstrate consideration of both dog handler or human observer search options
Train dog-handler / human observer teams on how to undertake the carcass searches and collect the requisite information
Prior to the commissioning of the wind farm; ongoing
N/A N/A GE & contracted qualified ecologist
Ensure the search team is inducted and qualified to conduct carcass searches in the Silverton Wind Farm environment
Record the date of induction
Undertake turbine collision carcass searches at 29 turbines (15 turbines in one month, 14 turbines in the next month) using a dog-handler team or human observers
Over two-month cycle. In each month when a turbine is to be searched, one search will be undertaken followed by a second search three days later. Commencing post-construction and at commissioning of all wind turbines. Operating for two years
Use human observers where a dog handler team is not available
Carcass search/mortality raw data will be provided with annual reports
GE to appoint search team. Qualified ecologist to oversee searches. GE & qualified ecologist to prepare & submit reports
Determine the number of carcasses found. These will be used in conjunction with the results of the carcass persistence trails to determine estimated annual strike rate
Documented number of carcasses detected for each species. Documented search frequency and effort.
Collection, recording, storage & carcass disposal
On discovery of any featherspot or collision carcass
N/A As above All personnel who detect carcasses
Reduce the instance of carcasses attracting raptors by disposal or storage of carrion for further investigation
Using turbine mortality data sheet

© Biosis 2018 – Leaders in Ecology and Heritage Consulting www.biosis.com.au 19
Action Timing /Frequency
Adaptive Management
Reporting Responsible Party Objective Measure
Review carcass search regime
After first full year of operation
Refine program if necessary in light of first year results.
GE; contracted qualified ecologist; OEH
Document all findings in annual report and review with OEH and ecologist
Submission of report to OEH
A freezer will be available for the purpose of storing bird and bat carcasses
Prior to the commissioning of the wind farm and on-going
Freezer must be large enough to accommodate large birds such as eagles
N/A GE Allow the Australian Museum the opportunity to conduct an autopsy of the carcasses as required
Correspondence with Australia Museum
Apply for a permit under the Biodiversity Conservation Act 2016 to collect and store bird and bat carcasses
Prior to the commissioning of the wind farm and on-going
Permit must be updated regularly to include the all searchers, qualified ecologist(s) and wind farm personnel who find carcasses while on site.
Any reporting conditions attached to the permit must be followed
GE; contracted qualified ecologist
Permission to collect and store carcasses in order to reduce the instance of carcasses attracting raptors by disposal or storage of carrion for further investigation and determine strike rates
Timely permit application to OEH under the Biodiversity Conversation Act 2016
Identify and collect all dead bird and bat carcasses upon discovery and complete data sheets for each carcass collected
During turbine collision carcass searches and for any birds and bats found incidentally by site personnel
Any species that cannot be identified on site will be lodged with the Australian Museum for identification using reference specimens. This may be particularly applicable to feather spots.
A carcass search/mortality report will be provided annually to OEH as part of Annual Bird & Bat Management Report
Contracted qualified ecologist
Document all bird and bat carcass discoveries for the purpose of further investigation and to determine whether trigger levels have been reached
Completed turbine mortality data sheets for all collected bird and bat carcasses, logged in the annual report

© Biosis 2018 – Leaders in Ecology and Heritage Consulting www.biosis.com.au 20
Action Timing /Frequency
Adaptive Management
Reporting Responsible Party Objective Measure
Appropriately label and store bird and bat carcasses
During turbine collision carcass searches and for any birds and bats found incidentally by site personnel
Specimens must be kept until positively identified to species and be made available for OEH officers on request and be made available to the Australian Museum prior to disposal
Develop a database of carcasses collected on the wind farm site, noting whether they have been retained, disposed of or donation
Contracted qualified ecologist
Allow for species identification, review by OEH and the Australian Museum the opportunity to conduct an autopsy of the carcasses as required prior to disposal
Documented notification correspondence to OEH and the Australian Museum
4.1.6 Carcass persistence trials
Carcasses of bird and bats that collide with turbines may be removed by scavengers or will ultimately disappear due to decomposition. Carcass persistence affects the detection of dead bats that collide with turbines and consequently influences estimation of the total number of fatalities for each species.
Trials to determine persistence time of carcasses are required to derive correction factors necessary to estimate total fatalities from the results of the carcass searches. Two persistence trials will be undertaken in each year of the monitoring regime, one in each of spring and autumn.
Remote cameras will be used to record persistence of carcasses placed on-site for the purpose. Carcasses for the trials will be sourced from bird and bat carcasses found at the site or from other local sources, such as roadkills. It is vital that species used are representation of the bird and bat fauna of Silverton Wind Farm. Carcasses used for trials will be individually marked to ensure they are not confused with collision carcasses. Individual marking allows trial carcasses to be identified if they are simply moved by scavengers. Radio-frequency identification (RFID) microchips inserted into carcasses will be used to provide individual identification. Cameras used for the purpose will be set to take a photograph every hour (day and night) and also when triggered by movement and infrared. This method has been demonstrated in Victoria to be highly efficient and substantially reduces potential influence on scavengers as may occur when human observers visit frequently to check carcasses. Cameras are deployed and left to operate for the duration of the trial and this entails substantially less effort than having people check carcasses daily. Cameras have the additional advantage of recording the precise time of carcass removal and the species of scavenger that removes a carcass. As a result of the precise documentation of the time of carcass removal there is no need to estimate the period of carcass persistence which is required when carcasses are checked only at an intervals of several days. Censored analysis will be required when carcasses persist beyond the trial period (Klein & Moschberger 2003).
The field of view of cameras is limited and scavengers can simply move a carcass out of that view. In order to check for this, each trial will commence approximately one week before the next routine search for carcasses.
In each trial, a total of 10 carcasses of birds and 10 carcasses of bats will be distributed under 20 randomly-chosen turbines across the wind farm. Each trial will be run for up to one month, but cameras will be checked after two weeks to check on their operation and at that point the trial may be terminated if the carcass has been removed or a second carcass may be placed to increase the sample size of the trial.
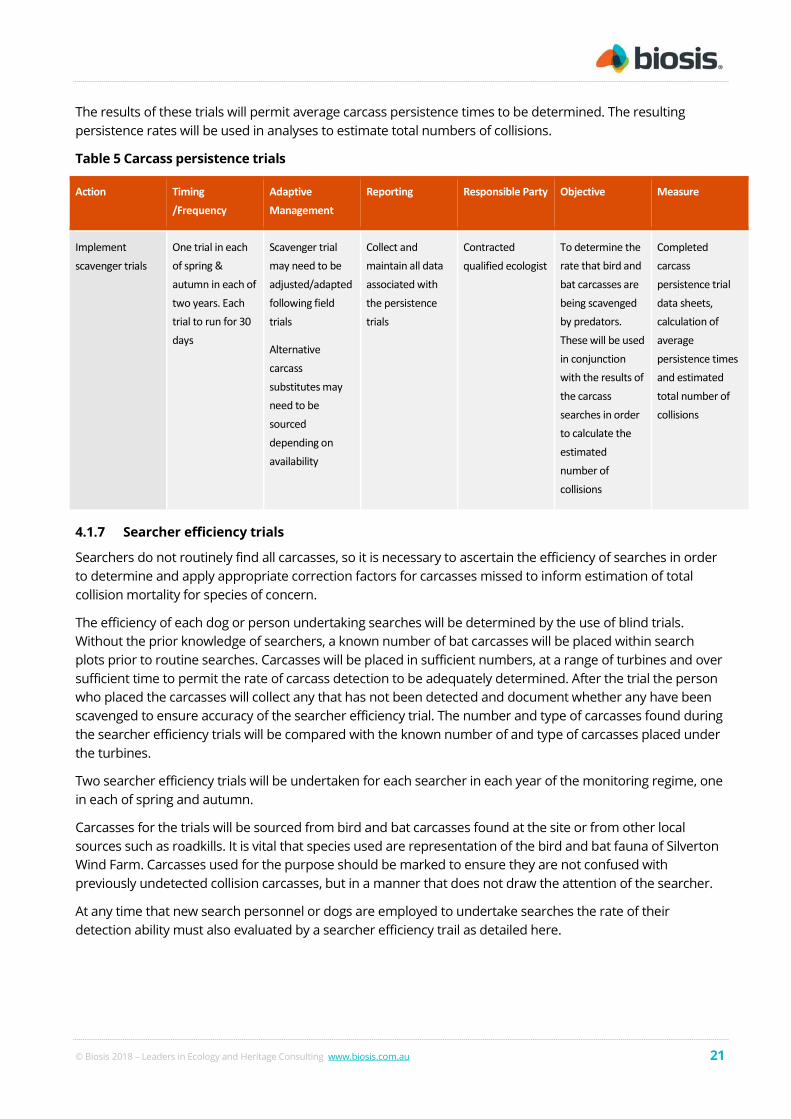
© Biosis 2018 – Leaders in Ecology and Heritage Consulting www.biosis.com.au 21
The results of these trials will permit average carcass persistence times to be determined. The resulting persistence rates will be used in analyses to estimate total numbers of collisions.
Table 5 Carcass persistence trials
Action Timing /Frequency
Adaptive Management
Reporting Responsible Party Objective Measure
Implement scavenger trials
One trial in each of spring & autumn in each of two years. Each trial to run for 30 days
Scavenger trial may need to be adjusted/adapted following field trials
Alternative carcass substitutes may need to be sourced depending on availability
Collect and maintain all data associated with the persistence trials
Contracted qualified ecologist
To determine the rate that bird and bat carcasses are being scavenged by predators. These will be used in conjunction with the results of the carcass searches in order to calculate the estimated number of collisions
Completed carcass persistence trial data sheets, calculation of average persistence times and estimated total number of collisions
4.1.7 Searcher efficiency trials
Searchers do not routinely find all carcasses, so it is necessary to ascertain the efficiency of searches in order to determine and apply appropriate correction factors for carcasses missed to inform estimation of total collision mortality for species of concern.
The efficiency of each dog or person undertaking searches will be determined by the use of blind trials. Without the prior knowledge of searchers, a known number of bat carcasses will be placed within search plots prior to routine searches. Carcasses will be placed in sufficient numbers, at a range of turbines and over sufficient time to permit the rate of carcass detection to be adequately determined. After the trial the person who placed the carcasses will collect any that has not been detected and document whether any have been scavenged to ensure accuracy of the searcher efficiency trial. The number and type of carcasses found during the searcher efficiency trials will be compared with the known number of and type of carcasses placed under the turbines.
Two searcher efficiency trials will be undertaken for each searcher in each year of the monitoring regime, one in each of spring and autumn.
Carcasses for the trials will be sourced from bird and bat carcasses found at the site or from other local sources such as roadkills. It is vital that species used are representation of the bird and bat fauna of Silverton Wind Farm. Carcasses used for the purpose should be marked to ensure they are not confused with previously undetected collision carcasses, but in a manner that does not draw the attention of the searcher.
At any time that new search personnel or dogs are employed to undertake searches the rate of their detection ability must also evaluated by a searcher efficiency trail as detailed here.

© Biosis 2018 – Leaders in Ecology and Heritage Consulting www.biosis.com.au 22
Table 6 Searcher efficiency trials
Action Timing /Frequency
Adaptive Management
Reporting Responsible Party Objective Measure
Undertake searcher efficiency trials
One trial in each of spring & autumn in each of two years
As required when any new people or dogs are employed for searches
Collect and maintain all data associated with the searcher efficiency trials
Contracted qualified ecologist
Determine the efficiency of searchers in order to confirm the validity of the turbine carcass search regime
Trial dates and findings are recorded and reported in the annual report, and used to assist in the review of the monitoring program
4.1.8 Incidental finds of bird and bat carcasses
It is possible that during the life of the wind farm, birds and bat carcasses will be discovered incidentally by site personnel. Therefore, all site personnel will be trained on procedures for the event in which they encounter dead or injured birds and bats. Upon incidental discovery, carcasses and featherspots must be photographed in situ. However, the carcass or featherspot must be left where it was found in order not to introduce bias to detection rates of the official search regime. Any member of the site personnel who finds a carcass of a bird or bat must complete the relevant carcass data sheet (see Appendices). Copies of carcass data sheets must be available on site for use by all site staff.

© Biosis 2018 – Leaders in Ecology and Heritage Consulting www.biosis.com.au 23
Table 7 Requirements for the incidental discovery of carcasses
Action Timing /Frequency
Adaptive Management
Reporting Responsible Party Objective Measure
Training of site personnel on procedures for bird and bat carcasses found incidentally
Prior to the commissioning of the wind farm and ongoing
N/A All incidentally found carcasses and featherspots will be reported to OEH as part of Annual Bird & Bat Management Report
All site personnel; contracted qualified ecologist
Site personnel are inducted to understand the procedures regarding carcass discovery and the possible ramifications for not following this procedure
Inductions have been completed for all site personnel and date of attendance has been recorded.
Photography of incidentally encountered bird and bat carcasses; completion of relevant data form
On discovery of any featherspot or collision carcass
N/A As above All personnel who incidentally detect carcasses
Ensure detailed data and photos are captured and recorded
Completed dead or injured bird/bat data sheet, also recorded in the annual report
4.2 Analyses of results
Trigger levels for all species of concern will be determined directly from results of collision mortality searches.
Estimates of the annual total number of collision mortalities for all species of concern will be undertaken using current best-practice science to account for searched areas; carcass persistence times and searcher efficiency rates. Along with the estimates, 95% confidence intervals will be determined as a measure of variance around the estimates. Current best-practice (2017) for these analyses are provided by Huso et al. (2017) (see also Huso and Dalthorp 2014; and Dalthorp et al. 2017). The analyses will be undertaken by a biometrician with a thorough understanding of the relevant science. In Australia, Symbolix Pty Ltd has developed relevant mathematical algorithms and has experience in provision of appropriate analyses.
A report, including results and analyses, for each of the two years of the study will be prepared and provided to OEH using the below calculation.
Trigger levels will be quantified as the (1) mean number of detected strikes per species per turbine per annum and (2) total estimated number of strikes per species per turbine per annum, with 95% confidence interval. Values for (2) calculated using all the necessary factors such as proportion of turbines searched; portion of fall-zones searched, search frequency; average carcass persistence time; searcher efficiency rates etc.

© Biosis 2018 – Leaders in Ecology and Heritage Consulting www.biosis.com.au 24
Table 8 Analyses of results
Action Timing /Frequency
Adaptive Management
Reporting Responsible Party Objective Measure
Determine collision results relative to trigger levels
Following each search cycle
N/A Report to OEH within 2 working days if a trigger level for any threatened species is reached
GE; contracted qualified ecologist
Determine whether a trigger level has been reached, and if so initiate the Decision Making Framework process at Figure 1
Results exceeded trigger levels have been reported to OEH within 48 hours
Other results have been reported within 10 business days
Calculate mean rates of searcher efficiency and carcass persistence, relevant for all species of concern
Within 3 months of the completion of monitoring, including trials for the year, in year of the monitoring program
N/A Provide as inputs to subsequent analyses
Contracted qualified ecologist; statistician to analyze data
Determine mean searcher efficiency and carcass persistence rates for use in calculations of overall collision estimates
Results have been reported to OEH within 10 business days
Use mean scavenge and searcher efficiency rates in combination with the results of mortality searches to estimate total mortality of all species of concern detected in carcass searches at the wind farm, along with associated 95% confidence intervals.
Within 3 months of the completion of monitoring, including trials for the year, in year of the monitoring program
N/A Results to be provided to OEH in Annual Bird & Bat Management Report
GE; contracted qualified ecologist
Determine whether a trigger level has been reached, and if so initiate the Decision Making Framework process at Figure 1
Results exceeded trigger levels have been reported to OEH within 48 hours
Other results have been reported within 10 business days
4.3 Reporting
Requirements for reporting of results and actions pertaining to this BBAMP are as set out in relevant sections above. GE Renewable Energy Onshore Wind - Projects and Services will be responsible for submission of all relevant reports.

© Biosis 2018 – Leaders in Ecology and Heritage Consulting www.biosis.com.au 25
4.4 Injured birds and bats
Injured birds and bats may be encountered during carcass searches or incidentally. Handling injured birds and bats requires specialist skill as there is the risk of injury to both animals and people and there is potential for disease transmission in some cases. Injured birds and bats will only be handled by person(s) authorised under the Biodiversity Conservation Act 2016. To reduce the risk associated with Australian Bat Lyssavirus, any injured bats must be handled only by people who have up-to-date rabies vaccination (an appropriate level of antibodies for the rabies virus, based on vaccination, is considered to offer the best available protection against Australian Bat Lyssavirus). The details of any injured birds and bats found will be recorded on a dead or injured bird and bat data sheet (see Appendices).
Prior to implementation of this plan, arrangements must be made with a conveniently located veterinary surgery to ensure that arrangements are in place for acceptance and treatment of any injured birds or bats. As options for treatment of injured wildlife may change over the life of the wind farm, an arrangement must be kept current and current telephone numbers for the surgery and for WIRES Wildlife Rescue must be readily available to all site personnel (e.g. on their mobile phones). Where an injured animal can be readily captured it should be placed into a tied calico bag or a box and kept in a quiet and dark location while it is transported to a veterinarian for treatment. In the event that an injured animal cannot be readily captured site personnel should telephone WIRES Wildlife Rescue (current telephone number is 1300 094 737) for assistance.
A data sheet must be completed as per Section 5.1.8 Incidental finds of bird or bat carcasses for any injured bird or bat suspected to have collided with a wind turbine (see Appendices).
Table 9 Requirements for injured birds and bats
Action Timing /Frequency
Adaptive Management
Reporting Responsible Party Objective Measure
Ensure only appropriately qualified, trained and vaccinated personnel are engaged to handle injured bats and birds
Appropriate trained staff or contractor to be engaged prior to the commissioning of the wind farm and on-going
N/A Contracted qualified ecologist; person(s) authorised under Biodiversity Conservation Act 2016
Ensure injured wildlife is appropriately care for by qualified staff or contractors by appointing a contractor or inducting staff appropriately
Provide a list of qualified staff and contractors to OEH
Liaise with local veterinary practitioner in preparation for incidence of injured wildlife
Prior to the commissioning of the wind farm and on-going
Veterinarian may be required to euthanize some injured birds and bats
N/A GE; contracted qualified ecologist
Ensure injured wildlife is appropriately care for a veterinarian as required
Provide a list of engaged veterinarians to OEH

© Biosis 2018 – Leaders in Ecology and Heritage Consulting www.biosis.com.au 26
Action Timing /Frequency
Adaptive Management
Reporting Responsible Party Objective Measure
Train site personnel on procedures for dealing with injured birds and bats found incidentally
Prior to the commissioning of the wind farm and on-going
N/A N/A Contracted qualified ecologist to provide appropriate training
Site Personnel are inducted to understand the procedures regarding injured wildlife and the possible ramifications for not following this procedure
Inductions have been completed for all site personnel and date of attendance has been recorded. A list of qualified staff has been provided to OEH
Complete data sheets for any injured birds and bats found
Injured bats and birds may be found at any time during high intensity or general intensity turbine collision carcass searches or incidentally
N/A N/A Contracted qualified ecologist
Ensure all injured birds and bats are reported and action taken is recorded using the dead or injured bat/bird data sheet
Provide a log of all complete data sheets in the annual report

© Biosis 2018 – Leaders in Ecology and Heritage Consulting www.biosis.com.au 27
5 Management to minimise impacts on birds and bats
Information in this section is provided to meet requirements of Conditions 17 b) and 19 of schedule 3 of the MOD 3 (c) in relation to potential measures to enhance or protect species of concern.
5.1 Turbine locations relative to raptor nests
Condition 17 b) of schedule 3 of the MOD 3 project approval requires turbines are located as far far as possible, but at least 200 metres from raptor nests.The condition pertaining to distance from any raptor nests was applied during the design phase of the wind farm when siting of turbines was determined. The immediate environs of a nest will have a greater frequency of flights by breeding birds than the wider airspace and siting of turbines away from those zones is a precautionary measure intended to reduce the incidence of flights that may be at increased risk of collision with turbines. Pre-construction surveys located a single Wedge-tailed Eagle nest and the closest turbines (T10 and T11) are sited more than one kilometre to its north-west. Pre-construction surveys have not detected nests of any other raptors.
It is possible that raptors of various species may build nests within 200 metres of a turbine during the operational life of the wind farm. Wind farm operations personnel will be provided with training in the identification of potential raptor nests. If a potential raptor nest is detected within 200 metres of a turbine, a qualified ecologist will be called in to confirm identity of the nesting species and to ascertain whether the nest location represents heightened risk to a threatened species. If so, OEH will be notified and a strategy to reduce risk will be determined. Shut-down of turbines will be a last resort, but may be used in the short-term where the nest is particularly close to a turbine and heightened risk is likely to resolve itself once the nesting event finishes.
5.2 Minimising raptor perch sites
The earliest wind farms used turbines with lattice towers that provided multiple perching opportunities for raptors and this attraction to those turbines was implicated in high rates of turbine collisions. As with all modern turbines, the towers to be used at Silverton Wind Farm are monopoles that offer no perching opportunities for raptors or other bird species.
Poles and wires of overhead powerlines can also provide perching and nesting sites for raptors. Silverton Wind Farm has been designed with the majority of power transmission in underground lines. Where overhead powerlines are necessary, power poles have been chosen for their design aimed at restricting opportunities for raptors to use them as perches. This is of value to operation of the wind farm in minimising the risk of birds or their nests resulting in power outages.
Trees and other features provide natural perching sites for raptors. Maps prepared by EHP (undated) show two raptor perches, one each in proximity of turbines T06 and T39. It is not known whether these perches are used more frequently than any others, but from the variety of raptor species identified in the vicinity, there can be no doubt that raptors will use multiple natural sites as perches. It is not considered to be appropriate to remove natural perches or to otherwise actively attempt to discourage birds from using natural perches.
It is possible that raptors of various species may frequent favoured perch locations within 200 metres of a turbine during the operational life of the wind farm. Wind farm operations personnel will be provided with training in the basic identification of raptor species. In the event that a potentially favoured raptor perch site is

© Biosis 2018 – Leaders in Ecology and Heritage Consulting www.biosis.com.au 28
detected within 200 metres of a turbine, a qualified ecologist will be called in to confirm identity of the species and to ascertain whether the perch location represents heightened risk to a threatened species. If so, OEH will be notified and a strategy to reduce risk will be determined. Removal of the perch site may be considered if it is a dead tree and there is considered to be a reasonable likelihood of reducing risk by doing so.
5.3 Large animal carcass removal
The timely removal of carcasses of livestock and other larger animals, such as destroyed feral species, from the wind farm may help reduce the incidence of collision with turbines by raptors that routinely feed on carrion and may be attracted to carcasses. Note that carcasses of birds and bats that may have resulted from collisions with turbines are not to be removed as part of this process.
A carcass removal program will be implemented for the life of the wind farm and will apply to any carcass other than those of birds and bats, found anywhere within the wind farm site. All site personnel (staff and contractors) will be inducted into a reporting procedure that will apply during all wind farm operations, including collision carcass searches (see below). The wind farm will implement a routine for removal and burial of any carcass within 48 hours of its discovery. Any program of feral animal control on the wind farm will include the removal of all carcasses from the wind farm site (see also Silverton Wind Farm Goat Management Plan). The wind farm has legal agreements that cover specific areas including all its infrastructure, roads and hardstand areas. This condition is enforceable on land areas covered by those agreements. The wind farm operator will make all efforts to work collaboratively with adjacent land managers, including, where achievable, entry into formal agreements to provide for co-operative and coordinated detection and removal of large animals carcasses from the area within 200 metres of all turbines.
Table 10 Large animal carcass removal requirements
Action Timing /Frequency
Adaptive Management
Reporting Responsible Party Objective Measure
The wind farm operator will provide information to all staff and contractors on the procedure to follow after discovering a carcass
During daily turbine maintenance and service
N/A N/A GE Site Personnel are inducted to understand the procedures regarding carcass removal and the possible ramifications for not following this procedure
Inductions have been completed for all site personnel and date of attendance has been recorded.

© Biosis 2018 – Leaders in Ecology and Heritage Consulting www.biosis.com.au 29
Action Timing /Frequency
Adaptive Management
Reporting Responsible Party Objective Measure
The wind farm operator will implement a program of carcass removal and burial.
During daily turbine maintenance and service
Specific livestock carcass search and removal may need to be implemented in the event that a high concentration of eagle activity near a turbine indicates they may be at heightened risk.
N/A
GE
Remove carcasses within 48 hours of discover to reduce the incidence of feeding on carrion by raptors
Date of discovery and date of removal are recorded in a Carrion Data Log.
Any exceedance of 48 hours is investigated via incident report and internal audit.
These data logs are included in the report to OEH and DPE
Feral animal control programs.
As part of any feral animal management control program
Specific carcass searches may need to be implemented during any program of feral predator or herbivore control undertaken on the wind farm or its immediate environs.
N/A
GE; pest animal control contractor
Remove carcasses as soon as possible by engaging a relevant pest control expert within 48 hours of discovery
Date of discovery and date of removal are recorded in a Carrion Data Log.
Any exceedance of 48 hours is investigated via incident report and internal audit.
These data logs are included in the report to OEH and DPE
5.4 Pest animal control
Pest animal control will be undertaken as part of routine environmental management of the wind farm and land managed by the wind farm operator. Control of all pest species will be carried out in accordance with NSW legislation, policy and strategies administered by the Department of Primary Industries. Section 3.3 provides detail of the requirements for removal of carcasses, including those of any pest species that may attract large raptors into the close proximity of turbines (see also Silverton Wind Farm Goat Management Plan).
Control of rabbits around wind turbines is a specific action that may minimise collision risk because rabbits are primary prey for large raptors. A pest animal control program will be implemented for the life of the wind farm. All site personnel (staff and contractors) will be inducted into a procedure for reporting the location of any rabbit warren or other site of high rabbit density. The wind farm operator will be responsible for its
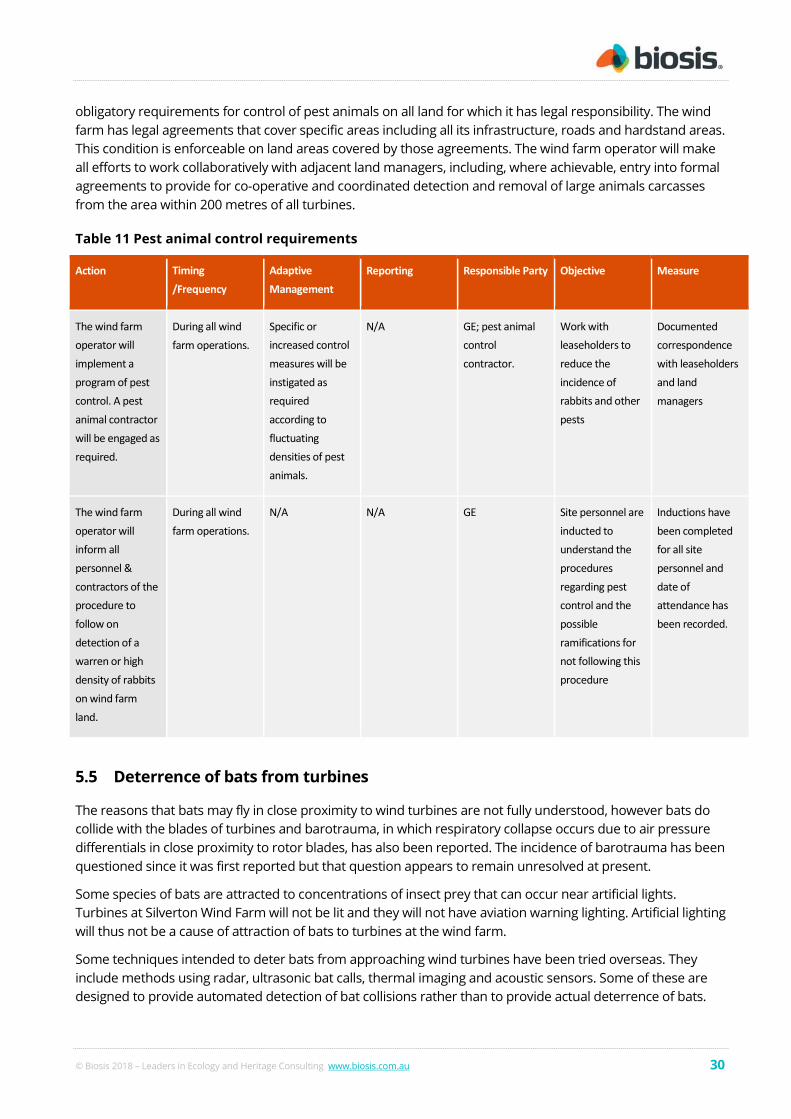
© Biosis 2018 – Leaders in Ecology and Heritage Consulting www.biosis.com.au 30
obligatory requirements for control of pest animals on all land for which it has legal responsibility. The wind farm has legal agreements that cover specific areas including all its infrastructure, roads and hardstand areas. This condition is enforceable on land areas covered by those agreements. The wind farm operator will make all efforts to work collaboratively with adjacent land managers, including, where achievable, entry into formal agreements to provide for co-operative and coordinated detection and removal of large animals carcasses from the area within 200 metres of all turbines.
Table 11 Pest animal control requirements
Action Timing /Frequency
Adaptive Management
Reporting Responsible Party Objective Measure
The wind farm operator will implement a program of pest control. A pest animal contractor will be engaged as required.
During all wind farm operations.
Specific or increased control measures will be instigated as required according to fluctuating densities of pest animals.
N/A GE; pest animal control contractor.
Work with leaseholders to reduce the incidence of rabbits and other pests
Documented correspondence with leaseholders and land managers
The wind farm operator will inform all personnel & contractors of the procedure to follow on detection of a warren or high density of rabbits on wind farm land.
During all wind farm operations.
N/A N/A GE Site personnel are inducted to understand the procedures regarding pest control and the possible ramifications for not following this procedure
Inductions have been completed for all site personnel and date of attendance has been recorded.
5.5 Deterrence of bats from turbines
The reasons that bats may fly in close proximity to wind turbines are not fully understood, however bats do collide with the blades of turbines and barotrauma, in which respiratory collapse occurs due to air pressure differentials in close proximity to rotor blades, has also been reported. The incidence of barotrauma has been questioned since it was first reported but that question appears to remain unresolved at present.
Some species of bats are attracted to concentrations of insect prey that can occur near artificial lights. Turbines at Silverton Wind Farm will not be lit and they will not have aviation warning lighting. Artificial lighting will thus not be a cause of attraction of bats to turbines at the wind farm.
Some techniques intended to deter bats from approaching wind turbines have been tried overseas. They include methods using radar, ultrasonic bat calls, thermal imaging and acoustic sensors. Some of these are designed to provide automated detection of bat collisions rather than to provide actual deterrence of bats.
© Biosis 2018 – Leaders in Ecology and Heritage Consulting www.biosis.com.au 31
The great majority of them are experimental and they have not been widely applied to commercial wind energy facilities and there is no body of peer-reviewed rigorous evidence for their performance. At present a ‘best practice’ mechanism for deterrence of bats in Australian environments is not available.
It is notable that many of the bats species that have been subjects of particular concern in North America and Europe are long-distance migrants and large numbers of collisions documented for some of them appear to relate to high concentrations and specific periods when these species are on migration passage using defined routes. The majority of bat species of concern for Silverton Wind Farm are not known to undertake long-distance migrations and most of them are believed to be year-round residents. Evidence from seasonality of records suggests that Yellow-rumped Sheathtail Bats may be largely absent from southern Australia in the first months of each year, but that they are present during the latter half of the year (Aitken 1975; Churchill 1998). They may thus migrate between the north and south of the continent, however, unlike some northern hemisphere species, there are no known defined migratory pathways where Australian bat species may be at increased risk of collisions and Silverton Wind Farm is certainly not known to be on any such route.
It is possible that reduction of bat collisions can be achieved by the use of low wind speed turbine curtailment, although at present no information is available about response to wind speed by Australian species of bats. Overseas investigations (e. g. Martin et al. 2013) have found that a variety of bats concentrate their flight activities during periods of low wind speed (i.e. at wind speeds of between approximately 0 and 7 metres per second). Subject to confirmation of technical requirements by the turbine manufacturer, consideration may be given to programming turbines so that rotor blades will remain feathered and not rotate during periods of the night when wind speeds are below those at which turbines generate electricity (i.e. at wind speeds of between approximately 0 and 3 metres per second).
5.6 Adaptive management of turbines to reduce collisions
Management measures specifically aimed at reducing specific risks at provided in each subsection above.
Within three months of the completion of each year of all activities set out in this BBAMP, a report will be prepared and submitted to OEH. The report will provide results of all investigations and studies related to effects of Silverton Wind Farm on bird and bat species of concern. In collaboration with OEH, the results will be considered to determine whether any changes to processes or management actions are required. Any such changes will be focussed on improvements to reduce impacts on bird and bat species of concern, specifically, in the event that detected collisions with turbines by any such species have reached or exceeded trigger levels set out here.
Silverton Wind Farm is in an environment different from the great majority of wind energy facilities in Australia that are located within more intensive cropping and grazing agricultural areas. It is not feasible to foresee what potential factors might lead to an unexpectedly high level of collisions by any species.
Appropriate mitigation measures can be prepared only if a cause, or causes, of ecologically significant impacts on the relevant species is known. If a cause is not readily apparent then investigation of the reason(s) for the impact must be undertaken prior to proposal of a mitigation strategy. Advice from OEH will be sought with regard to design and implementation of any such investigations and of an ultimate mitigation strategy, if required. OEH will be notified within two working days of determination by GE or the contracted qualified ecologist that a trigger level for any species of concern is detected. Liaison with OEH will commence to determine a strategy aimed at reducing the incidence of collisions as soon as is practical thereafter.
Any mitigation strategy will be tailored to the needs of the particular species affected and will be formulated if and when the nature and cause(s) of the impact are known. It will be submitted to OEH and will be implemented when approved.

© Biosis 2018 – Leaders in Ecology and Heritage Consulting www.biosis.com.au 32
Broad categories of potential causes of heighten collision risk may include the following:
• Agricultural practices, such as feeding of grain to stock, that may result in concentrations of birds in proximity of turbines
• Control of pest animals and management of stock and large animal carcasses
• Possible seasonal attraction of bats to turbines
• Seasonal nesting or roosting in proximity of turbines
• Periodic environmental conditions such as localised high densities of natural food sources or availability of surface water.
If a trigger level of collisions is detected and it can be attributed to a cause such as one of these, then an appropriate management action may be feasible. Land management practices can be altered or short-term management of turbines may be able to be implemented. Shut-down of turbines will be last resort, but may be used in the short-term if a particular turbine is involved and the cause is likely to resolve itself, for example once a nesting event finishes.

© Biosis 2018 – Leaders in Ecology and Heritage Consulting www.biosis.com.au 33
References
Aitken, P. 1975. Two new bat records from South Australia with a field key and checklist to the bats of the state. South Australian Naturalist 50: 9-15.
Brett Lane & Associates 2017. White Rock Wind Farm Stage 1 Bird and Bat Adaptive Management Program. Prepared for White Rock Wind Farm Pty Ltd.
Churchill. S. 1998 Australian Bats. Reed New Holland, Sydney.
Commonwealth of Australia 2009. EPBC Act Policy Statement 2.3 Wind Farm Industry.
Commonwealth of Australia 2010a. Survey guidelines for Australia's threatened birds. Guidelines for detecting birds listed as threatened under the Environment Protection and Biodiversity Conservation Act 1999.
Commonwealth of Australia 2010b. Survey guidelines for Australia's threatened bats. Guidelines for detecting bats listed as threatened under the Environment Protection and Biodiversity Conservation Act 1999.
Commonwealth of Australia 2013. Matters of National Environmental Significance: Significant impact guidelines 1.1 Environment Protection and Biodiversity Conservation Act 1999.
Commonwealth of Australia 2015a. Draft referral guideline for 14 birds listed as migratory species under the EPBC Act.
Dalthorp, D., Huso, M., and Dail, D. 2017. Evidence of absence (v2.0) software user guide: U.S. Geological Survey Data Series 1055, 109 p., https://doi.org/10.3133/ds1055.
de Lucas, M., Janss, G.F.E., Whitfield, D.P. & Ferrer, M. 2008. Collision fatality of raptors in wind farms does not depend on raptor abundance. Journal of Applied Ecology 45: 1695–1703.
Ferrer, M., de Lucas, M., Janss, G.F.E., Casado, E., Muñoz, A.R., Bechard, M.J. & Calabuig, C.P. 2012. Weak relationship between risk assessment studies and recorded mortality in wind farms. Journal of Applied Ecology 49: 38–46.
Hull, C.L. and Cawthen, L. 2013. Bat fatalities at two wind farms in Tasmania, Australia: bat characteristics, and spatial and temporal patterns. New Zealand Journal of Zoology 40 (1): 5-15.
Hull, C.L. and Muir, S. 2010. Search areas for monitoring bird and bat carcasses at wind farms using a Monte-Carlo model. Australasian Journal of Environmental Management 17: 77 – 87.
Hull, C.L., Stark, E.M., Peruzzo, S. and Sims,C.C. 2013. Avian collisions at two wind farms in Tasmania, Australia: taxonomic and ecological characteristics of colliders versus noncolliders, New Zealand Journal of Zoology, 40 (1): 47-62.
Huso, M. and Dalthorp, D. 2014. Accounting for Unsearched Areas in Estimating Wind Turbine-Caused Fatality. The Journal of Wildlife Management 78:347–358.

© Biosis 2018 – Leaders in Ecology and Heritage Consulting www.biosis.com.au 34
Huso, M., Dalthorp, D. and Korner-Nieverglt, F. 2017. Statistical principles of post-construction fatality monitoring. Chapter 4 in M.R. Perrow (ed) Wildlife and Wind Farms, Conflicts and Solutions. Volume 2 Onshore: Monitoring and Mitigation. Pelagic Publishing. Exeter UK.
Klein, J.P. and Moschberger, M.L. 2003, Survival Analysis: Techniques for Censored and Truncated Data, Springer, New York.
Law, B., Gonsalves, L., Tap, P., Penman, T. and Chide, M. 2015. Optimizing ultrasonic sampling effort for monitoring forest bats. Austral Ecology 40 (8): 886-897.
Madders, M. & Whitfield, D.P. 2006. Upland raptors and the assessment of wind farm impacts. Ibis 148: 43–56.
Martin, C.M., Arnett, E.B., Stevens, R.D. and Wallace, M.C. 2017. Reducing bat fatalities at wind facilities while improving the economic efficiency of operational mitigation. Journal of Mammalogy. 98:378–385.
Mathews, F., Swindells, M., Goodhead, R., August, T.A., Hardman, P., Linton, D.M., Hosken, D.J., 2013. Effectiveness of search dogs compared with human observers in locating bat carcasses at wind-turbine sites: a blinded randomized trial. Wildlife Society Bulletin 37:34–40.
NGH Environmental 2016. Bird and Bat Risk Assessment Silverton Wind Farm. Report for AGL Energy Limited.
NGH Environmental 2018a. Bird and Bat Risk Assessment Silverton Wind Farm. Report for AGL Energy Limited.
NGH Environmental 2018b. Silverton Wind Farm – Bird and Bat Baseline Surveys - Summary of all results combined. Report for AGL Energy Limited.
NGH Environmental 2018b. Silverton Wind Farm – Summary Results of Autumn 2018 Bird and Bat Baseline Surveys. Report for AGL Energy Limited.
Pennay, M. 2017. Review of Silverton wind farm bat monitoring.
Smales, I. 2017. Modelling collision risk and populations. Chapter 3 in M. Perrow (ed) Wildlife and Wind Farms, Conflicts and Solutions. Volume 2 Onshore: Monitoring and Mitigation. Pelagic Publishing. Exeter, UK.

© Biosis 2018 – Leaders in Ecology and Heritage Consulting www.biosis.com.au 35
Appendices
Appendix 1: Turbine mortality survey data sheet
Survey details:
Date: Observers:
Start time: Finish time:
Turbine ID:
Survey methodology (please tick):
Dog ID
Human observers
Incidental (Any bird or bat turbine mortality observed outside a routine survey)
Ground visibility (circle): High Moderate Poor
Was entire search area covered?
Yes / No
NOTE: If not, estimate area covered as a percentage (%) of total search area:
Survey limitations (e.g. long grass, any areas that were inaccessible/not surveyed and why):
Weather details (please circle):
Temperature:
Precipitation: Fine Showers Rain
Wind strength: Calm Breeze Moderate Strong
Wind direction: Cloud cover (%):
Turbine bird and bat mortality record:
Dead/injured bird or bat recorded?
Yes / No
If yes, record total number: Bird and Bat carcass / injury datasheet completed?
Yes / No
Photographs taken?
Yes / No
Additional notes

© Biosis 2018 – Leaders in Ecology and Heritage Consulting www.biosis.com.au 36
Appendix 2: Dead or injured bird / bat data sheet
This datasheet must be completed for every dead / injured bird or bat found during high- and general-intensity turbine mortality surveys. This
datasheet should also be completed for any dead /injured bird or bar recorded incidentally (i.e. not during routine surveys).
Each dead bird or bat (including feather spots) must be removed upon discovery and placed into a clearly labelled plastic bag with the date, time,
location (GPS coordinates) and turbine number, as required for species identification.
Date and location:
Date: Observer/s:
Time animal was found:
Turbine ID:
Easting/Northing of carcass:
Detection:
Survey method (circle): Dog search Human search intensity
Incidental NOTE: turbine survey datasheet must also be completed.
Distance of carcass / injured animal from observer when first detected:
Describe ground visibility within a 1 m radius of where carcass / injured animal was found:
Carcass / injured animal photographed?
Yes / No
Photo and camera details (e.g. camera number, photo numbers, location of saved photos):
Weather details at time of detection (please circle):
Temperature:
Precipitation: Fine Showers Rain
Wind strength: Calm Breeze Moderate Strong
Wind direction: Cloud cover (%):
Carcass / injured animal information and condition:
Species (if unknown closest taxonomic group, e.g. raptor, bat):
Age (circle): Unknown Adult Juvenile
Sex (circle): Unknown Male Female
Condition (circle): Dead (carcass) Injured but alive Feather spot (≥ 10 feathers)
Degree of decay (circle): Fresh More than a week old Very old or highly decayed
Describe location and type of any injuries evident:

© Biosis 2018 – Leaders in Ecology and Heritage Consulting www.biosis.com.au 37
Describe evidence of scavenging, if any:
Notes / additional information:

© Biosis 2018 – Leaders in Ecology and Heritage Consulting www.biosis.com.au 38
Appendix 3. Carcass persistence trial: carcass deployment data sheet
This carcass deployment sheet must be completed for each turbine used in the scavenger trial.
Survey and turbine details:
Date: Observers:
Time:
Turbine ID:
Ground visibility (circle): High Moderate Poor
Description of ground visibility (e.g. grass height, rock cover):
Carcass deployment record:
Carcass type Unique carcass identifier:
Direction from turbine base:
Distance from turbine base:
Easting / northing:
Notes:
Additional notes:

© Biosis 2018 – Leaders in Ecology and Heritage Consulting www.biosis.com.au 39
Appendix 4: Consolidated Bird Observation Map

%L
%L%L
%L
%L
%L
%L
%L
%L
%L
%L
%L
%L
%L
!(
!(
!(
!(
!(
!(
#*#*#*#*
#*#*#*
#*
#*
#*
#*
#*
#*
#*
#*
#*#*#*
#*
#*
T40
T42T43
T45
T44
T27
T28
T30
T31
T35
T34
T29
T32T33
SeeMap 1c
See Map 1b SeeMap 1d
9381_SilvertonWF_BirdObs_MB 15/08/2017 melsley
Map 1aBird ObservationsSilverton Wind Farm -South
LegendSilverton Wind Farm boundary
%L Turbine locationsAccess tracks
Threatened Birds!( Hooded Robin (south-eastern form)!( Rufous Fieldwren!( Varied Sittella
At-risk Birds#* Nankeen Kestrel#* Wedge-tailed Eagle
0 1,000
Metres
¹9381_SilvertonWF_BirdObs_MB 15/08/2017 melsley
Service Layer Credits: Source: Esri, DigitalGlobe, GeoEye, Earthstar Geographics,CNES/Airbus DS, USDA, USGS, AeroGRID, IGN, and the GIS User Community
Map publish date: 15/08/2017Scale at A3 is 1:27,000
%L%L%L%L%L%L%L%L%L%L%L%L%L %L%L%L%L%L%L%L%L
%L%L%L%L%L%L%L%L
%L%L%L%L%L%L%L%L%L%L%L%L%L%L%L%L%L%L%L%L%L%L%L%L
%L%L%L
%L
%L
Baseline data provided to Ecology and Heritage Partnerscourtesy of WGA / Baseline data collected by NGH
Environmental in 2012 and updated in 2013 and 2016

© Biosis 2018 – Leaders in Ecology and Heritage Consulting www.biosis.com.au 41
Appendix 5: Consolidated Bat Observation Map

%L
%L%L
%L
%L
%L
%L
%L
%L
%L
%L
%L
%L
%L
ÛÚ ÛÚ
T40
T42T43
T45
T44
T27
T28
T30
T31
T35
T34
T29
T32T33
SeeMap 1c
See Map 1b SeeMap 1d
9381_SilvertonWF_BatObs_MB 15/08/2017 melsley
Map 2aBat ObservationsSilverton Wind Farm -South
LegendSilverton Wind Farm boundary
%L Turbine locationsAccess tracks
At-risk BatsÛÚ Inland Free-tailed BatÛÚ Lesser Long-eared Bat
0 1,000
Metres
¹9381_SilvertonWF_BatObs_MB 15/08/2017 melsley
Service Layer Credits: Source: Esri, DigitalGlobe, GeoEye, Earthstar Geographics,CNES/Airbus DS, USDA, USGS, AeroGRID, IGN, and the GIS User Community
Map publish date: 15/08/2017Scale at A3 is 1:27,000
%L%L%L%L%L%L%L%L%L%L%L%L%L %L%L%L%L%L%L%L%L
%L%L%L%L%L%L%L%L
%L%L%L%L%L%L%L%L%L%L%L%L%L%L%L%L%L%L%L%L%L%L%L%L
%L%L%L
%L
%L
Baseline data provided to Ecology and Heritage Partnerscourtesy of WGA / Baseline data collected by NGH
Environmental in 2012 and updated in 2013 and 2016

© Biosis 2018 – Leaders in Ecology and Heritage Consulting www.biosis.com.au 43
Appendix 6: Baseline bird and bat survey methods; risk assessment & results

1 May 2018
Adam Mackett
Project Manager
Project Management Office, Group Operations
AGL Energy Limited
L24, 200 George Street
Sydney NSW 2000
NGH Environmental Pty Ltd (ACN: 124 444 622. ABN: 31 124 444 622) and NGH Environmental (Heritage) Pty Ltd (ACN: 603 938 549. ABN: 62 603 938 549) are part of the NGH Environmental Group of Companies.
bega
suite 1, 216 carp st
(po box 470)
bega nsw 2550
t 61 2 6492 8333
bathurst
35 morrisset st
(po box 434)
bathurst nsw 2795
t 61 2 6331 4541
canberra
unit 17/27 yallourn st
(po box 62)
fyshwick act 2609
t 61 2 6280 5053
f 61 2 6280 9387
newcastle
7/11 union st newcastle west nsw 2302 t 61 2 4929 2301
sydney
unit 18, level 3
21 mary st
surry hills nsw 2010
t 61 2 8202 8333
wagga wagga
suite 1, 39 fitzmaurice st
(po box 5464)
wagga wagga nsw 2650
t 61 2 6971 9696
f 61 2 6971 9693
www.nghenvironmental.com.au
Dear Adam,
RE – Silverton Wind Farm – Bird and Bat Baseline Surveys - Summary of all results combined
(our project ref: 16-412)
Please find below a summary of the combined results of the four seasons of bird and bat
baseline surveys, conducted at Silverton Wind Farm from December 2016 through to and
including the final survey in March 2018.
The aim of this letter is to advise you of notable records from the surveys including
observations of listed threatened species, as well as records of ‘at risk’ species observed to be
flying at or above the rotor swept area (RSA) height) within the wind farm site.
If you have any questions, please contact me on the number below. I would be pleased to
discuss any aspect of this project with you further.
Yours sincerely,
Managing Director
NGH Environmental Pty Ltd
0427 260 819

Silverton Wind Farm Bird and Bat Management Baseline Spring 2017 Surveys Results Summary. Project Ref # 16-412
SURVEY METHODS TIMING, EFFORT & PERSONNEL
SURVEY METHODS & EFFORT
The detailed survey methodology is described in detail in the Bird and Bat Survey Methods document (NGH 2017),
accompanying this results summary. The general methods undertaken for this Autumn 2018 survey included the following
elements:
- Passerine bird surveys
- Raptor surveys
- Bat detector surveys
- Bat trapping study (one-off trapping program conducted as part of the Spring 2017 survey)
The survey effort is described in detail in the Bird and Bat Survey Methods document (NGH 2017), accompanying this results
summary (and shown in the Survey Effort Figure at Appendix A). Of note, the surveys included the following:
- 29 Passerine surveys (10 Control and 19 Impact sites). This level of survey effort remained constant across the
entire survey program with the same sites visited each of the four seasonal survey occasions.
- 19 Raptor surveys (8 Control and 11 Impact sites). This level of survey effort remained constant across the
entire survey program with the same sites visited each of the four seasonal survey occasions.
- Bat detector sites. The overall level of survey effort undertaken during each seasonal survey undertaken
differed slightly. Specifically, the first two survey occasions (Summer 2016 and Autumn/Winter 2017) were
generally equivalent in terms of overall survey effort (i.e. Summer 2016 involved the use of 8 detector sites
and Autumn/Winter 2017 involved 9 detector sites). The survey effort undertaken during the two subsequent
surveys (Spring 2017 and Autumn 2018) was substantially increased to address the comments received from
the OEH Expert (Michael Pennay) in relation to the scope of the bat surveys conducted. The revised survey
effort for the bat surveys included a total of 20 detector sites (including 3 located at monitoring masts MM1,
MM2 and MM3 and which involved the use paired detectors to record calls at ground level and at RSA level
(with the microphone attached to a pulley on the mast tower and set at an elevation of approximately 65 m).
A full description of the bat detector survey effort and locations over the course of the baseline monitoring
program is provided in Section 3.2. This includes a description of the number of detectors that have been
established at replicated sites from the first two survey occasions (Summer 2016 and Autumn/Winter 2017),
as well as a description of the habitat type, unit pairing, and deployment as either control/impact recording
units (to detail overall survey stratification).
Please note that for the Spring 2017 survey, two of the sites, BD13 and BD14 and for the Autumn 2018 survey,
one site, BD11, no results were obtained due to equipment malfunctions (such as feral goats chewing on the
microphone cables, and windy conditions that caused the SD memory card to become full on the first night of
recording).
SURVEY TIMING
The Silverton Wind Farm bird and bat baseline surveys were completed across four seasons as described below:
- Summer 2016 (12th to 14th December 2016 inclusive).
- (late) Autumn/Winter 2017 (29th May to 2 June 2017 inclusive).
- Spring 2017 (bird surveys were conducted from 10th to 12th October 2017 inclusive and bat surveys were
conducted from 22nd to 30th November 2017 inclusive).
- (early) Autumn 2018 - conducted from 19th to 28th March 2018 (inclusive).

Silverton Wind Farm Bird and Bat Management Baseline Spring 2017 Surveys Results Summary. Project Ref # 16-412
SURVEY PERSONNEL
The survey personnel over the four seasonal surveys varied however to the greatest extent possible, involved using the
same key NGH staff to keep consistency across the surveys.
The analysis of the bat call files was completed by suitably qualified professionals including Greg Richards for the first
two surveys (Summer 2016 and Autumn/Winter 2017), and Glenn Hoye for the second two survey occasions (Spring
2017 and Autumn 2018). Glenn Hoye was also responsible for undertaking a targeted trapping surveys for microbats
as part of the Spring 2017 survey.
The staff used in the surveys are all suitably experienced in conducting field surveys, and have adequate experience in
the identification of bird species. The names and organisation of each staff field team leader for each survey occasion
is included in each of the seasonal summary results letter.
RESULTS OF THE COMBINED BASELINE SURVEYS
BIRD SURVEYS
Records of threatened species within the site
Records of threatened bird species made within the site included a total of 26 separate records and included a total of nine
(9) threatened species, all of which are listed as Vulnerable under the NSW Biodiversity Conservation Act 2016. The Hooded
Robin Melanodryas cucullata cucullata was the most frequently recorded species, accounting for 15 of the 26 threatened
species records, and was observed in three of the four survey periods (wasn’t recorded during the first Summer 2016 survey).
With regard to threatened species that may also be considered “at risk” from the wind farm development, three threatened
raptor species were recorded at the site over the duration of the baseline survey program, including the Black-breasted
Buzzard Hamirostra melanosternon, Little Eagle, Hieraaetus morphnoides and Spotted Harrier Circus assimilis. All three of
these species were recorded only during the Summer 2016 period, with the latter two species including only a single individual
record, whilst a record of a single individual was made on two separate occasions of the Black-breasted Buzzard.
The other listed threatened species recorded at the site are not regarded as being “at risk’ from the wind farm project given
these are mostly small woodland birds that generally fly close to the ground (at or within the canopy), or, in the case of the
Freckled Duck (Stictonetta naevosa), spends the majority of its time within the water body and generally only disperses from
these habitats when the waterbody dries up. As the record of the Freckled Duck was made at Umberumberka Reservoir,
which is normally inundated, movements into and out of the reservoir by Freckled Ducks are considered to be infrequent and
as such, the wind farm is not expected to place this species at risk.
A revised Risk Assessment has been undertaken and is summarised in the advice letter at Appendix C, and summarised briefly
at the end of this document.
A full description of the threatened species records made over the duration of the baseline monitoring program is provided
in Table 1 below, and also detailed in the maps of recorded threatened species at Appendix B (includes mapped results for
each season, Appendix B.1 and the results for all seasons combined, Appendix B.2).

Silverton Wind Farm Bird and Bat Management Baseline Spring 2017 Surveys Results Summary. Project Ref # 16-412
Table 1 Records of threatened species within the site during the Autumn 2018 survey period
Species Common Name Status Observation Method
No. individuals
Habitat Type Location
(easting/northing Zone 54)
Summer 2016
Calamanthus campestris Rufous Fieldwren V – TSC Act Opportunistic 1 MDF 0527731 6478012
Circus assimilis Spotted Harrier V – TSC Act Opportunistic 1 MDF 0527600 6478283
Daphoenositta chrysoptera Varied Sittella V – TSC Act
Passerine 2 MDF 0525052 6484420 (P19)
Opportunistic 8 MDF 0528912 6483616
Hamirostra melanosternon Black-breasted Buzzard V – TSC Act
Opportunistic 1 MDF 0529276 6488511
Opportunistic 1 MDF 0527081 6472705
Hieraaetus morphnoides Little Eagle V – TSC Act Opportunistic 1 MDF 0527081 6472705
Pyrrholaemus brunneus Redthroat V – TSC Act Opportunistic 2 BB 0527844 6477735
Autumn/Winter 2017
Calamanthus campestris Rufous Fieldwren V – TSC Act Opportunistic 1 PG 523290 6482973
Melanodryas cucullata cucullata Hooded Robin V – TSC Act Passerine BUS 1 MDF 528988 6483655 (5P)
Passerine BUS 2 RR 529672 6485291 (9P)
Opportunistic 1 RR 531621 6486472
Opportunistic 4 RR 529758 6485229
Opportunistic 2 BB 524848 6482126

Silverton Wind Farm Bird and Bat Management Baseline Spring 2017 Surveys Results Summary. Project Ref # 16-412
Species Common Name Status Observation Method
No. individuals
Habitat Type Location
(easting/northing Zone 54)
Opportunistic 1 BB 524422 6481777
Opportunistic 3 MDF 521920 6482239
Opportunistic 4 MDF 521378 6484858
Spring 2017
Melanodryas cucullata cucullata Hooded Robin V – TSC Act
Opportunistic 2 BB 525163 - 6481806
Opportunistic 2 MDF 524430 - 6479617
Passerine survey 11 MDF 522525 - 6478315
Artamus cyanopterus cyanopterus Dusky Woodswallow V – TSC Act Opportunistic 1 MDF 521713 – 6484511
Stictonetta naevosa Freckled Duck V-TSC Act Opportunistic 10 RRG 519852 – 6480104
Autumn 2018
Melanodryas cucullata cucullata Hooded Robin V – TSC Act
Opportunistic 2 BB 519744 - 6483872
Opportunistic 2 BB 519790 - 6483944
Passerine survey 2 MDF 530248 – 6487210 (P1)
Opportunistic 1 MDF 0523783 - 6477342
MDF = Mulga Dead Finish (open) woodland BB = Bluebush shrubland RR= River Red Gum Woodland PG = Porcupine Grass (Spinifex) Sparse Woodland

Silverton Wind Farm Bird and Bat Management Baseline Spring 2017 Surveys Results Summary. Project Ref # 16-412
Records of bird species recorded within or above the RSA
Bird species recorded at the site flying within or above the RSA height (i.e. at a height of greater than 40 metres above ground
level) during the baseline survey program are presented in Table 2 below. The results include a total of 102 observations
across 13 species of birds flying within or above the RSA height during either the surveys.
From the survey observations, it was noted that the Wedge-tailed Eagle (Aquila audax) accounted for the majority of the
records with a total of 75 (of the 102) records, followed by the Nankeen Kestrel (Falco cenchroides) which accounted for nine
records.
Of the 13 species recorded at the site, five of these are considered to be “at risk” from wind farm impacts, being all raptor
species (i.e. Wedge-tailed Eagle, Nankeen Kestrel, Australian Hobby, Whistling Kite and Black Kite). The other eight species
are common species and are not considered to be “at risk” from wind farm impacts.
No listed threatened species were observed within the site flying within or above the RSA height.
A full description of the species recorded flying within or above RSA height over the duration of the baseline monitoring
program is provided in Table 2 below, and also detailed in the maps of species recorded at/above RSA provided at Appendix
B (includes mapped results for each season, Appendix B.3 and the results for all seasons combined, Appendix B.4).
Table 2 Birds recorded within or above RSA height
Species Date Survey Site Impact/Control Location Height
Summer 2016
Wedge-tailed Eagle 12/12/2016 48R Impact 520990 6479811 400
Wedge-tailed Eagle 12/12/2016 4R Impact 521169 6479880 100
Nankeen Kestrel 12/12/2016 21R Control 525502 6482821 50
Wedge-tailed Eagle
13/12/2016 46R Impact 521895 6484114
100-600
Wedge-tailed Eagle 200
Wedge-tailed Eagle
13/12/2016 47R Impact 522554 6484220
30 - 200
Wedge-tailed Eagle 80
Wedge-tailed Eagle
13/12/2016 44R Control 521241 6484976
100 – 200
Wedge-tailed Eagle 80 – 800
Wedge-tailed Eagle 150
Nankeen Kestrel 80
Wedge-tailed Eagle 13/12/2016 7P Impact 522056 6484120 80
Wedge-tailed Eagle 13/12/2016 OPP outside impact
zone 523401 6479513 100
Wedge-tailed Eagle 13/12/2016 28R Control 525426 6475777 200
Wedge-tailed Eagle 13/12/2016 23P Impact 522525 6478315 50
Black Kite
14/12/2016 2P Impact 528049 6482961
50
Black Kite 40 - 100
Wedge-tailed Eagle 14/12/2016 45R Control 522948 6487688 200
Black-Faced Woodswallow
14/12/2016 1P Impact 531161 6487105
100 - 200
Australian Raven 50
Unknown Raptor 14/12/2016 33R Impact 526032 6480126 100 - 300
Autumn/Winter 2017
Wedge-tailed Eagle 30/05/2017 8R Impact 527616 6481250 150

Silverton Wind Farm Bird and Bat Management Baseline Spring 2017 Surveys Results Summary. Project Ref # 16-412
Species Date Survey Site Impact/Control Location Height
Wedge-tailed Eagle
30/05/2017 21R Control 525514 6482888
100
Wedge-tailed Eagle 50
Wedge-tailed Eagle >600
Wedge-tailed Eagle
30/05/2017 43R Impact 519868 6482291
600
Wedge-tailed Eagle 100-400
Wedge-tailed Eagle 100-400
Wedge-tailed Eagle 200-300
Wedge-tailed Eagle 30/05/2017 48R Impact 520995 6479809
200
Wedge-tailed Eagle 40-80
Wedge-tailed Eagle 30/05/2017 16P Impact 527351 6481125 50
Wedge-tailed Eagle 30/05/2017 19P Impact 525030 6484444 50
Wedge-tailed Eagle 30/05/2017 38P Impact 520983 6479967 100
Wedge-tailed Eagle 30/05/2017 OPP outside impact
zone 525189 6483347 150 - 200
Wedge-tailed Eagle 31/05/2017 3R Impact
528784 6483755 200
Wedge-tailed Eagle 31/05/2017 528784 6483755 300-500
Wedge-tailed Eagle 31/05/2017 25R Impact 524214 6480217 150
Wedge-tailed Eagle 31/05/2017 29R Control 527401 6479513 100
Wedge-tailed Eagle
31/05/2017 44R Control 521232 6484971
300 – 500
Wedge-tailed Eagle 100 – 300
Wedge-tailed Eagle 300 – 400
Wedge-tailed Eagle 250
Wedge-tailed Eagle 250
Wedge-tailed Eagle
31/05/2017 45R Control 522950 6487687
50 - 200
Wedge-tailed Eagle 50 - 300
Wedge-tailed Eagle 100
Little Corella 31/05/2017 32P Impact 526347 6480130 40
Wedge-tailed Eagle
1/06/2017 6R Impact 528912 6483616
100 - 300
Wedge-tailed Eagle 50
Wedge-tailed Eagle 50
Wedge-tailed Eagle 1/06/2017 46R Impact 521890 6484116 400
Wedge-tailed Eagle
1/06/2017 47R Impact 522554 6484219
400
Wedge-tailed Eagle 100 – 300
Wedge-tailed Eagle 400
Wedge-tailed Eagle 1/06/2017 41P Impact 522176 6484229 100
Spring 2017
Wedge-tailed Eagle 10/10/2017 21R Control 525514 6482888 60
Nankeen Kestrel 11/10/2017 33R Impact 525983 6480147 40
Wedge-tailed Eagle 12/10/2017 31P Control 527926 6477830 30-50
Tree Martin 10/10/2017 17P Control 528338 6481026 60
Nankeen Kestrel 10/10/2017 4R Impact 528784 6483755 60
Wedge-tailed Eagle
10/10/2017 7P Impact 528049 6482961
200
Raven sp. 80
Black-faced Cuckoo-shrike
80

Silverton Wind Farm Bird and Bat Management Baseline Spring 2017 Surveys Results Summary. Project Ref # 16-412
Species Date Survey Site Impact/Control Location Height
Nankeen Kestrel 10/10/2017 9P Impact 529672 6485291 100
Wedge-tailed Eagle 12/10/2017 30P Control 527157 6479156 50
Tree Martin 12/10/2017 41P Impact 522176 6484229 80
Nankeen Kestrel 11/10/2017 11P Impact 530603 6488157 100
Wedge-tailed Eagle 11/10/2017 21R Control 525514 6482888 60
Wedge-tailed Eagle 11/10/2017 39P Control 521143 6484756 50
Wedge-tailed Eagle 12/10/2017 43R Impact 519868 6482291 50
Autumn 2018
Wedge-tailed Eagle 23/03/2018 3-R Impact 528784 6483755 10-100
Nankeen Kestrel 22/03/2018 6-R Impact 528912 6483616 30-50
Nankeen Kestrel 22/03/2018 10-R Impact 528877 6484015 50-100
Nankeen Kestrel 23/03/2018 2-P Impact 529554 6488781 20-100
Australian Magpie 21/03/2018 11-P Control 530603 6488157 30-80
Wedge-tailed Eagle 21/03/2018 21-R Impact 525514 6482888 100-50
Wedge-tailed Eagle n/r
25-R Impact
524214 6480217 150-200
Wedge-tailed Eagle n/r 524214 6480217 150-200
Wedge-tailed Eagle 23/03/2018 28-R Control 525426 6475777 50-100
Wedge-tailed Eagle 22/03/2018 29-R Control 527401 6479513 0-150
Galah
22/03/2018 17-P Control
528338 6481026
50
Australian Raven 50
Galah 21/03/2018 20-P Control 525195 6484056 60
Black Kite 21/03/2018 30-P Control 527158 6479157 80
Wedge-tailed Eagle 22/03/2018 31-P Impact 527926 6477830 100
Whistling Kite
21/03/2018 36-P Impact
523485 6481778
50
Wedge-tailed Eagle 50
Wedge-tailed Eagle 27/03/2018 37-P Impact 520346 6482029 90
Little Corella
27/03/2018 38-P Impact
520983 6479967
200
Wedge-tailed Eagle 200
Wedge-tailed Eagle
22/03/2018 44-R
Control
521232 6484971
50
Wedge-tailed Eagle 50
Wedge-tailed Eagle 50
Australian Hobby 50
Wedge-tailed Eagle
21/03/2018 45-R
Control
522950 6487687
100
Wedge-tailed Eagle 100
Wedge-tailed Eagle 100
Wedge-tailed Eagle 200
Wedge-tailed Eagle 20/03/2018 46-R Impact 521890 6484116 60
Wedge-tailed Eagle
27/03/2018 48-R Impact
520995 6479809
75
Wedge-tailed Eagle 400

Silverton Wind Farm Bird and Bat Management Baseline Spring 2017 Surveys Results Summary. Project Ref # 16-412
BAT SURVEYS
Results of bat detector surveys
In summarising these results at least nine species (and potentially up to 11 species – depending on whether calls attributed
to a bat call complex (i.e. Scotorepens eleryi and S. greyi which have indistinguishable calls from each other) involved only one
or both of the species included in the complex). Of these, three threatened species (all listed as Vulnerable under NSW
legislation) have been identified from the site including the Yellow-bellied Sheathtail-bat (Saccolaimus flaviventris), and
(possibly) the Inland Forest Bat (Vespadelus baverstocki), and the Corben's Long-eared Bat (Nyctophilus corbeni), although
with the latter two species, the calls could not reliably be distinguished from other similar species calls. As noted in the
November 2017 results that included the one-off trapping survey, the Inland Forest Bat was successfully captured whilst the
Little Forest Bat was not, indicating that at least a portion of the recorded calls from this complex could be reasonably
attributed to the threatened Inland Forest Bat. For the Corben’s Long-eared Bat, this species was not captured whilst the
common Lesser Long-eared Bat was captured, suggesting that the recorded calls from this complex were more likely to be
attributable to the common Lesser Long-eared Bat (although the presence of the threatened Corben’s Long-eared Bat cannot
be completely discounted).
In addition to the above threatened species, the White-striped Freetail-bat (Austronomus australis) was also recorded at the
site. Whilst being relatively common, this species is considered to be potentially at risk from wind farm projects given it is a
known high-flying species.
Overall, the species records were generally similar across each season.
A full description of the threatened bat species records made over the duration of the baseline monitoring program is provided
in Table 3 below, and also detailed in the maps of recorded threatened species at Appendix B (includes mapped results for
each season, Appendix B.1 and the results for all seasons combined, Appendix B.2).
Table 3 Records of threatened and at risk species within the site during the Autumn 2018 survey period
Species Common name Date Unit/ Site
Habitat Type
Location
Easting Northing
Summer 2016
(possible) Saccolaimus flaviventris
Yellow-bellied Sheathtail-bat 14/12/2016 AE-3
RRG 521091 6479805
Vespadelus vulturnus/baverstocki
Little Forest Bat/Inland Forest Bat
13/12/2016 AE-3 RRG 521091 6479805
14/12/2016 AE-3 RRG 521091 6479805
12/12/2016 AE-2 RRG 520606 6479831
Austronomus australis White-striped Free-tailed Bat
14/12/2016 AE-3
RRG 521091 6479805
Autumn/Winter 2017
Austronomus australis White-striped Free-tailed Bat
29/05/2017 AE-5a MDF 527430 6478140
30&31/05/2017 AE-5b MDF 527943 6481253
Vespadelus vulturnus/baverstocki
Little Forest Bat/Inland Forest Bat
29/05/2017 AE-5a MDF 527430 6478140
30/05/2017 AE-5b MDF 527943 6481253
Spring 2017
Saccolaimus flaviventris Yellow-bellied Sheathtail-bat 27/11/2017 BD8 MDF 527119 6481682
Vespadelus vulturnus/baverstocki
Little Forest Bat/Inland Forest Bat
25/11/2017 BD3B* MDF 524804 6479164
26/11/2017 BD4 MDF 520223 6481895
26/11/2017 BD6 MDF 527817 6478249
26/11/2017 BD7 MDF 524861 6478557
27/11/2017 BD9 RRG 521205 6479912

Silverton Wind Farm Bird and Bat Management Baseline Spring 2017 Surveys Results Summary. Project Ref # 16-412
Species Common name Date Unit/ Site
Habitat Type
Location
Easting Northing
28/11/2017 BD9 RRG 521205 6479912
29/11/2017 BD9 RRG 521205 6479912
23/11/2017 BD11 RRG 531026 6485664
23/11/2017 BD12 RRG 531742 6486712
24/11/2017 BD12 RRG 531742 6486712
26/11/2017 BD12 RRG 531742 6486712
Nyctophilus corbeni/N. geoffroyi
Corben's Long-eared Bat / Lesser Long-eared Bat
25/11/2017 BD1B* MDF 528820 6489036
24/11/2017 BD2B* MDF 520505 6482347
25/11/2017 BD4 MDF 520223 6481895
26/11/2017 BD4 MDF 520223 6481895
27/11/2017 BD5 MDF 521022 6480512
23/11/2017 BD6 MDF 527817 6478249
25/11/2017 BD6 MDF 527817 6478249
24/11/2017 BD7 MDF 524861 6478557
25/11/2017 BD7 MDF 524861 6478557
26/11/2017 BD7 MDF 524861 6478557
27/11/2017 BD7 MDF 524861 6478557
27/11/2017 BD8 MDF 527119 6481682
26/11/2017 BD9 RRG 521205 6479912
27/11/2017 BD9 RRG 521205 6479912
28/11/2017 BD9 RRG 521205 6479912
29/11/2017 BD9 RRG 521205 6479912
23/11/2017 BD11 RRG 531026 6485664
24/11/2017 BD11 RRG 531026 6485664
25/11/2017 BD11 RRG 531026 6485664
23/11/2017 BD12 RRG 531742 6486712
24/11/2017 BD12 RRG 531742 6486712
25/11/2017 BD12 RRG 531742 6486712
26/11/2017 BD12 RRG 531742 6486712
23/11/2017 BD16 MRM 530081 6483083
23/11/2017 BD17 PG 522262 6485286
26/11/2017 BD18 PG 521872 6484140
25/11/2017 BD19 PG 522810 6485362
26/11/2017 BD19 PG 522810 6485362
25/11/2017 BD20 PG 522912 6484350
Autumn 2018
Saccolaimus flaviventris Yellow-bellied Sheathtail-bat 25/03/2018 BD10 RRG 522814 6479798
Austronomus australis White-striped Free-tailed Bat
22/03/2018 BD1B* MDF 528820 6489036
25/03/2018 BD4 MDF 520223 6481895
25/03/2018 BD8 MDF 527119 6481682
24/03/2018 BD9 MDF 521205 6479912
22/03/2018 BD16 MDF 530081 6483083
22/03/2018 BD17 PG 522262 6485286
Vespadelus baverstocki/V.vulturnus
Inland Forest Bat/Little forest Bat
24/03/2018 BD6 MDF 527817 6478249
23/03/2018 BD9 RRG 521205 6479912
24/03/2018 BD9 RRG 521205 6479912

Silverton Wind Farm Bird and Bat Management Baseline Spring 2017 Surveys Results Summary. Project Ref # 16-412
Species Common name Date Unit/ Site
Habitat Type
Location
Easting Northing
25/03/2018 BD9 RRG 521205 6479912
26/03/2018 BD9 RRG 521205 6479912
23/03/2018 BD10 RRG 522814 6479798
24/03/2018 BD10 RRG 522814 6479798
25/03/2018 BD10 RRG 522814 6479798
26/03/2018 BD10 RRG 522814 6479798
23/03/2018 BD12 RRG 531742 6486712
24/03/2018 BD12 RRG 531742 6486712
25/03/2018 BD12 RRG 531742 6486712
26/03/2018 BD12 RRG 531742 6486712
Nyctophilus corbeni/N. geoffroyi
Corben's Long-eared Bat / Lesser Long-eared Bat
19/03/2018 BD2B* MDF 520505 6482347
25/03/2018 BD5 MDF 521022 6480512
23/03/2018 BD6 MDF 527817 6478249
24/03/2018 BD6 MDF 527817 6478249
25/03/2018 BD6 MDF 527817 6478249
26/03/2018 BD6 MDF 527817 6478249
24/03/2018 BD7 MDF 524861 6478557
25/03/2018 BD7 MDF 524861 6478557
26/03/2018 BD7 MDF 524861 6478557
25/03/2018 BD8 MDF 527119 6481682
26/03/2018 BD8 MDF 527119 6481682
23/03/2018 BD9 RRG 521205 6479912
24/03/2018 BD9 RRG 521205 6479912
25/03/2018 BD9 RRG 521205 6479912
26/03/2018 BD9 RRG 521205 6479912
23/03/2018 BD10 RRG 522814 6479798
24/03/2018 BD10 RRG 522814 6479798
25/03/2018 BD10 RRG 522814 6479798
26/03/2018 BD10 RRG 522814 6479798
23/03/2018 BD12 RRG 531742 6486712
24/03/2018 BD12 RRG 531742 6486712
25/03/2018 BD12 RRG 531742 6486712
26/03/2018 BD12 RRG 531742 6486712
21/03/2018 BD15 MRM 531012 6487843
22/03/2018 BD16 MRM 530081 6483083
21/03/2018 BD17 PG 522262 6485286
23/03/2018 BD17 PG 522262 6485286
22/03/2018 BD20 PG 522912 6484350
*Unit Mounted at top of Met Mast MDF = Mulga Dead Finish (open) woodland MRM = Mulga/Red Mallee Shrubland RRG = River Red Gum Woodland PG = Porcupine Grass (Spinifex) Sparse Woodland
Silverton Wind Farm Bird and Bat Management Baseline Spring 2017 Surveys Results Summary. Project Ref # 16-412
OVERALL SUMMARY OF SURVEY EFFORT AND RESULTS
The bird and bat baseline surveys conducted over four seasons at the Silverton Wind Farm site have now been completed.
This has involved four seasonal surveys conducted since December 2016. The bird surveys have been repeated consistently
(i.e. same sites) over all four survey occasions, and includes a total of 48 survey sites completed each survey occasion. The
bat surveys were modified in October 2017 to address comments made by OEH (and their appointed expert Michael Pennay),
and consequently, only the Spring 2017 and Autumn 2018 surveys conducted since then have used the same repeated survey
sites. With regard to consistency and repeatability across the four survey occasions, some sites were sampled across both
Summer 2016 and Winter 2017, as well as carried across into the Spring 2017 and Autumn 2018 surveys. These include:
- Site BD4 (previously labelled A4-B for Summer 2016, and labelled SM1 in Winter 2017 survey)
- Site BD8 (previously labelled A1-A for Summer 2016, and labelled AE-5b in Winter 2017 survey)
Some sites were sampled across both Summer 2016 and Winter 2017, as well as carried across into the Spring 2017 and
Autumn 2018 surveys, but were moved slightly to ensure they were clearly in either the control or impact zone (but not in
between). These sites were re-established generally in a similar habitat type as the previous surveys, and include:
- Site BD9 (previously labelled A2-A for Summer 2016, and labelled AE-2 in Winter 2017 survey. This site was
relocated approx. 2.5 km East to be in Control Zone, but staying within River Red Gum Woodland habitat along edge
of Umberumberka Reservoir. Results are therefore considered sufficiently comparable).
- Site BD10 (previously labelled A4-A for Summer 2016, and labelled AE-3 in Winter 2017 survey. This site was
relocated approx. 2 km East to be in Impact Zone, but staying within River Red Gum Woodland habitat along rocky
creeks along a tributary of Umberumberka Reservoir. Results are therefore considered sufficiently comparable).
- Site BD11 (previously labelled A1-B for Summer 2016, and labelled AE-1 in Winter 2017 survey. This site was
relocated approx. 500 m to be in Control Zone, but staying within River Red Gum Woodland habitat. Results are
therefore considered sufficiently comparable.
- Site BD12 (previously labelled A3-B for Summer 2016, and labelled AE-4 in Winter 2017 survey. This site was
relocated approx. 500 m to be in Impact Zone, but staying within River Red Gum Woodland habitat. Results are
therefore considered sufficiently comparable.
In addition, some sites established during either (but not both) the previous Summer 2016 and Winter 2017 surveys were re-
used into the Spring 2017 and Autumn 2018 surveys. These include
- Site BD6 (previously AE-5a for Winter 2017 survey but not established for the Summer 2016 survey)
It is acknowledged that at some of these sites the level of survey effort (i.e. number of nights deployed) was not always
consistent, this was due in part to unit malfunctions as well as access and weather issues at that time (which meant some
units had to be collected early before creeks became impassable with the onset of heavy rain). Since the survey protocol was
improved and submitted to OEH for acceptance, the subsequent Spring 2017 and Autumn 2018 surveys have been conducted
at the same sites and with the same level of survey effort.
The results of the surveys indicate that the site supports a number of threatened bird species, however, many of the
threatened species recorded at the site were on only one survey occasion with only the Rufous Fieldwren and Hooded Robin
recorded on two or more survey occasions. The Hooded Robin was the most frequently recorded threatened species,
accounting for 15 of the 26 threatened species records made at the site. The site was also found to support a number of
threatened bat species, including the Yellow-bellied Sheathtail-bat, Inland Forest Bat and Corben's Long-eared Bat. Of these,
only the Inland Forest Bat was recorded on all four survey occasions (and was also successfully captured during the Spring
2017 trapping survey). The Corben’s Long-eared Bat was only recorded during the last two survey occasions (Spring 2017 and
Autumn 2018), although it was recorded at a number of different sites, however this species was not captured, and it is
possible that the related Lesser Long-eared Bat (Nyctophilus geoffroyi) which was captured, accounts for most or all of the
recorded calls analysed.

Silverton Wind Farm Bird and Bat Management Baseline Spring 2017 Surveys Results Summary. Project Ref # 16-412
River Red Gum Woodland habitats accounted for most of the calls recorded, followed by the Mulga Dead Finish Habitat, whilst
detectors set-up in other habitats (i.e. Mulga/Red Mallee Shrubland and Porcupine Grass (Spinifex) Sparse Woodland yielded
comparatively fewer results.
The findings of the four seasonal surveys have also been considered in the context of the Bird and Bat Risk Assessment for the
Silverton Wind Farm (NGH 2016), and a re-evaluation of the risk status of bird and bat species has been completed based on
these results. A summary letter of the updated risk assessment is included at Appendix C of this letter. In summarising this
updated risk assessment, the review found that the overall risks to birds and bats is generally lower than the previous 2016
assessment due to around 15 m more ground clearance of the minimum RSA (at 45 m) of the GE 3.43-130 turbine model,
compared to the parameters used in the original BBRA, and that one species (Square-tailed Kite) was downgraded from ‘high’
risk of collision to ‘moderate’, whilst another species (Inland Forest Bat) was upgraded from ‘moderate’ to ‘high’. The total
number of ‘high’ risk species remains at nine, and includes: Wedge-tailed Eagle, Little Eagle, Black Kite, Brown Falcon, Spotted
Harrier, Black-breasted Buzzard, Yellow-bellied Sheathtail Bat, White-striped Freetail Bat, Little Forest Bat.
Several of the high risk species are listed as threatened in NSW (Little Eagle, Black-breasted Buzzard, Yellow-bellied Sheathtail
Bat, Little Forest Bat), whilst other (non-high-flying) threatened species recorded on site during baseline surveys (e.g. Dusky
Woodswallow, Hooded Robin, Redthroat, Rufous Fieldwren and Varied Sitella) are not likely to encounter the RSA and are not
species considered to be at risk of collision. The most appropriate vehicle for addressing and managing risks to birds and bats
from operational wind farms is through the Adaptive Bird and Bat Management Plan (i.e. monitoring).
With regard to the provision of the baseline survey data, the location of the survey sites and key survey findings (threatened
and at-risk species) is provided in the figures at Appendix A and Appendix B. A full copy of the data set is provided
(electronically in Microsoft Excel format) with this letter, and includes the following data:
- Summary details of bird survey sites
- Bird species master lists for all four survey occasions (separately)
- Threatened bird species list (four seasons combined)
- Birds observed at/above RSA master list (four seasons combined)
- Threatened and at-risk bat species list (four seasons combined)
Also provided electronically with this summary review letter is a copy of all relevant GIS shapefiles.
Also provided for ease of reference is the accepted Bird and Bat Survey Methods Document for Silverton Wind Farm which
provides further detail and justification on the suitability of the overall survey program employed for the baseline data
collection (Appendix D).

Silverton Wind Farm Bird and Bat Management I Baseline Surveys. Project Ref # 16-412
APPENDIX A MAP OF SURVEY EFFORT

+M
+M+M
+M+M
+M+M
+M +M
+M+M
+M +M
+M
+M+M
+M
+M+M
+M
+M
+M
+M
+M+M
+M
+M
+M
+M+M
+M+M
+M +M+M
+M
+M+M
+M
+M
+M
+M+M
+M
+M
+M
+M+M
+M+M
+M
+M+M+M
+M
+M
+M
+M
#*
#*kj
kj#*kj
#*
kj
#*
kj
#*
#*
#*kj
#*
#*#*kj
#*
#*
kj
#*
#*
#*kj
#*kj
kj
kj
#*
#*
#*kj
#*
#*
#*#*
#*
#*
#*
#*
#*
kj
kj
kj
kj kj
kj
!?!?
!?!?
!?!?
!?
!?
!?
!?
!?
!?!?
!?
!?
!?
!?
!?
!?
!?
!?
!?
!?
T58T57
T56T55T54
T53T52
T51T50T49
T48T47
T46
T45
T44
T43 T42
T41
T40
T39T38
T37
T36
T35T34T33
T32 T31T30T29
T28
T27
T26
T25T24
T23
T22
T21T20T19T18
T17
T16T15
T14
T13T12
T11T10
T09T08T07
T06
T05T04
T03T02
T01
BD9
BD8
BD7BD6
BD5
BD4
BD14
BD13
BD20
BD19
BD18
BD17
BD16
BD15
BD12
BD11
BD10
BD3BBD3A
BD2BBD2A
BD1BBD1A
P9
P7
P5
P2
P1
P42
P41
P40
P39
P38
P37 P36
P35
P34
P32
P31
P30
P26
P24
23P
22P
P20P19
P17P16
P15
P13
P12
P11
R8
R6R4
R3
R48
R45
R44
R43
R33
R29
R28
R27
R25
R21
R18
R14
R10
+M Turbine locationsWind Farm SiteExisting tracksImpact zone (500m)Control zone (1km)
Survey effort#* Passerine surveykj Raptor survey!? Bat detector survey sites
Vegetation typesBlack Bluebush Shrubland (ID153)Black Oak WoodlandBluebush Shrubland (ID155)ChenopodChenopod – Red MalleeWoodland/Shrubland (VEG2)
Mulga - Dead finish (ID123)Mulga/Red Mallee Shrubland (VEG1)Porcupine Grass sparse woodland (ID359)Prickly wattle Shrubland (ID136)River Red Gum on rocky creeksRiver Red Gum woodland (ID41)
1:55000
www.nghenvironmental.com.au
0 1 20.5 Kilometers
°
BIRD AND BAT BASELINE MONITORING SURVEY EFFORT
A3 @Ref: 16-412 Author: JB 01/05/2018
Silverton Wind Farm
Notes:- Data collected by NGH Environmental (2012 & 2017)- Client data courtesy of Jacobs, received 2017

Silverton Wind Farm Bird and Bat Management II Baseline Surveys. Project Ref # 16-412
APPENDIX B RESULTS FIGURES

Silverton Wind Farm Bird and Bat Management III Baseline Surveys. Project Ref # 16-412
B.1 RECORDED THREATENED SPECIES – EACH SEASON

+M
+M+M
+M
+M
+M+M
+M +M
+M+M
+M+M
+M
+M+M
+M
+M+M
+M
+M
+M
+M
+M+M
+M
+M
+M
+M+M
+M+M
+M +M+M
+M
+M
+M
+M
+M
+M
+M+M
+M
+M
+M
+M
+M
+M+M
+M
+M+M+M
+M
+M
+M
+M
kjkj
kj
kj
#*
GF
GF
GFGFGFGF
GFGFGF
GFGF
GFGFGFGFGFGFGFGF
GFGFGFGF
GF
GF
GFGF
GF
kj
kj
kj
kj
kj
kj
kj
kj
")
")
!(
!(
kj
kj
kj
!C
"h
#*
!(
!(
!(!(
!(!(!(
!(
!(!(!(
GF
GF
GFGF
GF
GFGF
GFGFGFGF
GF
GFGFGFGF
GFGFGF
GFGFGFGF
GF
GF
GF
GFGF
GF
XW
!?
%2
%2
$+
$+̂_
"6
#*!(!(!( ")
T58T57
T56
T55T54 T52
T51T50T49
T48T47
T46
T45
T44
T43 T42
T41
T40
T39T38
T37
T36
T35T34T33
T32T31
T30T29
T28
T27
T26
T25T24
T23
T22
T21T20T19T18
T17
T16
T14
T13T12
T11T10
T09T08T07 T06
T05T04
T03T02
T01
+M Turbine locationsWind Farm SiteExisting tracksImpact zone (500m)Control zone (1km)
Summer 2016!( Little Forest Bat/Inland Forest Bat") White-striped Free-tailed Bat#* Yellow-bellied Sheathtail-bat$+ Black-breasted Buzzard_̂ Little Eagle"6 Redthroat
XW Rufous Fieldwren!? Spotted Harrier%2 Varied Sittella
Spring 2017GF Corben's/Lesser Long-eared Bat!( Little Forest Bat/Inland Forest Bat#* Yellow-bellied Sheathtail-bat!C Dusky Woodswallow"h Freckled Duckkj Hooded Robin
Autumn/Winter 2017!( Little Forest Bat/Inland Forest Bat") White-striped Free-tailed Batkj Hooded RobinXW Rufous Field-wren
Autumn 2018GF Corben's/ Lesser Long-eared Bat") Inland Forest Bat/Little forest Bat#* Yellow-bellied Sheathtail-batkj Hooded Robin
Vegetation typesBlack Bluebush Shrubland (ID153)Black Oak WoodlandBluebush Shrubland (ID155)ChenopodChenopod – Red MalleeWoodland/Shrubland (VEG2)
Mulga - Dead finish (ID123)Mulga/Red Mallee Shrubland (VEG1)Porcupine Grass sparse woodland (ID359)Prickly wattle Shrubland (ID136)River Red Gum on rocky creeksRiver Red Gum woodland (ID41)
1:56000
www.nghenvironmental.com.au
0 1 20.5 Kilometres
°
RECORDED THREATENED SPECIES - EACH SEASON
A3 @Ref: 16-412 Author: JB 27/04/2018
Silverton Wind Farm
Notes:- Data collected by NGH Environmental (2012-2018)- Client data courtesy of Jacobs, received 2017

Silverton Wind Farm Bird and Bat Management IV Baseline Surveys. Project Ref # 16-412
B.2 RECORDED THREATENED SPECIES – ALL SEASONS COMBINED
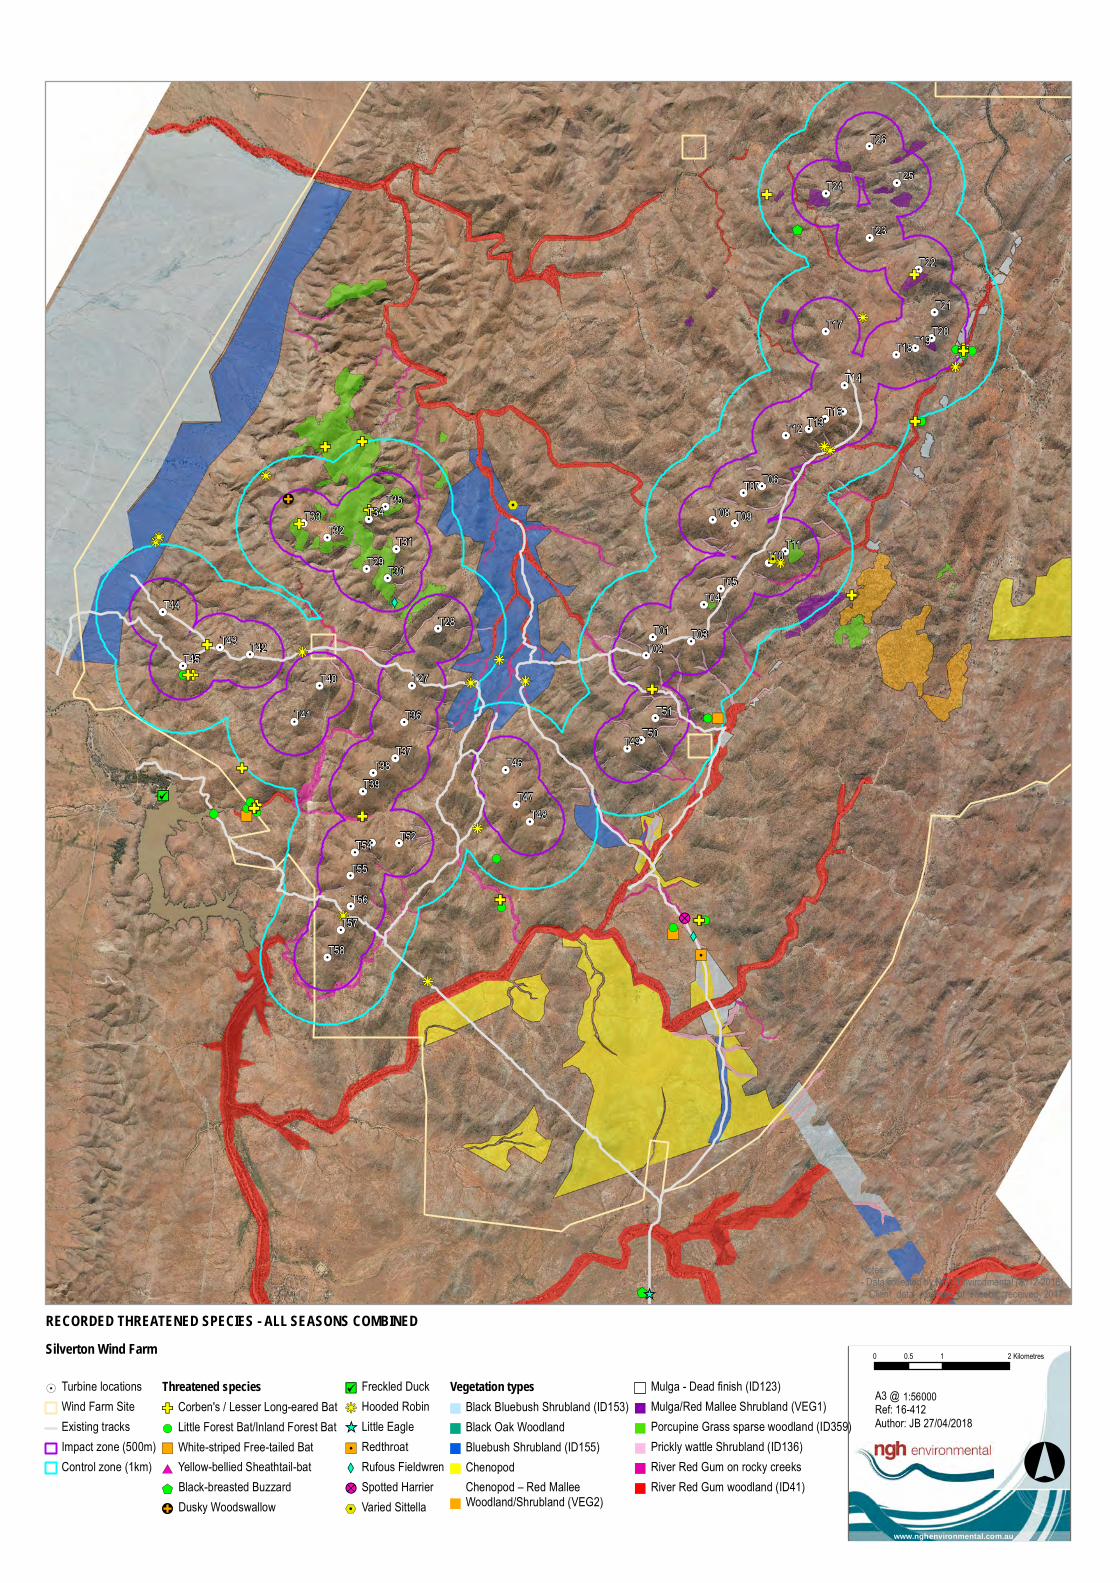
+M
+M+M
+M
+M
+M+M
+M +M
+M+M
+M+M
+M
+M+M
+M
+M+M
+M
+M
+M
+M
+M+M
+M
+M
+M
+M+M
+M+M
+M +M+M
+M
+M
+M
+M
+M
+M
+M+M
+M
+M
+M
+M
+M
+M+M
+M
+M+M+M
+M
+M
+M
+M
XW
!?
%2
%2
$+
$+̂_
"/
kj
kj
kj
kj
kj
kj
kj
kj
XW
kj
kj
kj
!C
"h
kjkj
kj
kj
#*!(!(!( ")
")
")
!(
!(
#*
!(
!(
!(!(
!(!(!(
!(
!(!(!(
GF
GF
GFGF
GF
GFGF
GFGFGFGF
GF
GFGFGFGF
GFGFGF
GFGFGFGF
GF
GF
GF
GFGF
GF
#*
!(
!(!(!(!(!(!(!(!(
!(!(!(!(
GF
GF
GFGFGFGF
GFGFGF
GFGF
GFGFGFGFGFGFGFGF
GFGFGFGF
GF
GF
GFGF
GF
T58T57
T56
T55T54 T52
T51T50T49
T48T47
T46
T45
T44
T43 T42
T41
T40
T39T38
T37
T36
T35T34T33
T32T31
T30T29
T28
T27
T26
T25T24
T23
T22
T21T20T19T18
T17
T16
T14
T13T12
T11T10
T09T08T07 T06
T05T04
T03T02
T01
+M Turbine locationsWind Farm SiteExisting tracksImpact zone (500m)Control zone (1km)
Threatened speciesGF Corben's / Lesser Long-eared Bat!( Little Forest Bat/Inland Forest Bat") White-striped Free-tailed Bat#* Yellow-bellied Sheathtail-bat$+ Black-breasted Buzzard!C Dusky Woodswallow
"h Freckled Duckkj Hooded Robin_̂ Little Eagle"/ RedthroatXW Rufous Fieldwren!? Spotted Harrier%2 Varied Sittella
Vegetation typesBlack Bluebush Shrubland (ID153)Black Oak WoodlandBluebush Shrubland (ID155)ChenopodChenopod – Red MalleeWoodland/Shrubland (VEG2)
Mulga - Dead finish (ID123)Mulga/Red Mallee Shrubland (VEG1)Porcupine Grass sparse woodland (ID359)Prickly wattle Shrubland (ID136)River Red Gum on rocky creeksRiver Red Gum woodland (ID41)
1:56000
www.nghenvironmental.com.au
0 1 20.5 Kilometres
°
RECORDED THREATENED SPECIES - ALL SEASONS COMBINED
A3 @Ref: 16-412 Author: JB 27/04/2018
Silverton Wind Farm
Notes:- Data collected by NGH Environmental (2012-2018)- Client data courtesy of Jacobs, received 2017

Silverton Wind Farm Bird and Bat Management V Baseline Surveys. Project Ref # 16-412
B.3 BIRDS OBSERVED AT/ABOVE RSA – EACH SEASON

+M
+M
+M
+M
+M
+M+M
+M +M
+M+M
+M+M
+M
+M+M
+M
+M+M
+M
+M
+M
+M
+M+M
+M
+M
+M
+M+M
+M+M
+M +M+M
+M
+M
+M
+M
+M
+M
+M+M
+M
+M
+M
+M
+M
+M+M
+M
+M+M+M
+M
+M
+M
+M
GF#*
#*
#*
GF
GFGF
GF
GF
!(
GF
!CGF
GF
GF
GFGFGF̂_
GFGFGFGF
GF
GFGF
GF
#*
GF
XW
#*
GFkj
#*
GF
XW
#*
GF
GF
GF
GF
GFGFGF
GFGFGFGF
GFGF
GF
GF
GF
GFGF
GFGF
GF
GF
GFGFGFGFGF
GFGFGF
GFGFGF
GFGFGFGFGF
GFGF
#*
GF
GFGFGF
GFGFGF#*
GF
GF
GF
GF
!(!(
GF
")
!?
T24
T58
T57T56
T55T54 T52
T51T50T49
T48T47
T46
T45
T44
T43 T42
T41
T40
T39T38
T37
T36
T35T34T33
T32T31
T30T29
T28
T27
T26
T25T24
T23
T22
T21T20T19T18
T17
T16 T15T14
T13T12
T11T10
T09T08T07 T06
T05T04
T03T02
T01
+M Turbine locationsWind Farm SiteExisting tracksImpact zone (500m)Control zone (1km)
Summer 2016!( Black Kite") Black-Faced Woodswallow#* Nankeen Kestrel!? Unknown Raptor
GF Wedge-tailed EagleAutumn/Winter 2017GF Wedge-tailed Eagle
Spring 2017kj Black-faced Cuckoo-shrike
#* Nankeen Kestrel
XW Tree Martin
GF Wedge-tailed Eagle
Autumn 2018_̂ Australian Hobby!( Black Kite#* Nankeen Kestrel
GF Wedge-tailed Eagle
!C Whistling Kite
Vegetation typesBlack Bluebush Shrubland (ID153)Black Oak WoodlandBluebush Shrubland (ID155)ChenopodChenopod – Red MalleeWoodland/Shrubland (VEG2)
Mulga - Dead finish (ID123)Mulga/Red Mallee Shrubland (VEG1)Porcupine Grass sparse woodland (ID359)Prickly wattle Shrubland (ID136)River Red Gum on rocky creeksRiver Red Gum woodland (ID41)
1:53000
www.nghenvironmental.com.au
0 1 20.5 Kilometres
°
BIRDS OBSERVED AT/ABOVE RSA - EACH SEASON
A3 @Ref: 16-412 Author: JB 27/04/2018
Silverton Wind Farm
Notes:- Data collected by NGH Environmental (2012- 2018)- Client data courtesy of Jacobs, received 2017

Silverton Wind Farm Bird and Bat Management VI Baseline Surveys. Project Ref # 16-412
B.4 BIRDS OBSERVED AT/ABOVE RSA – ALL SEASONS COMBINED
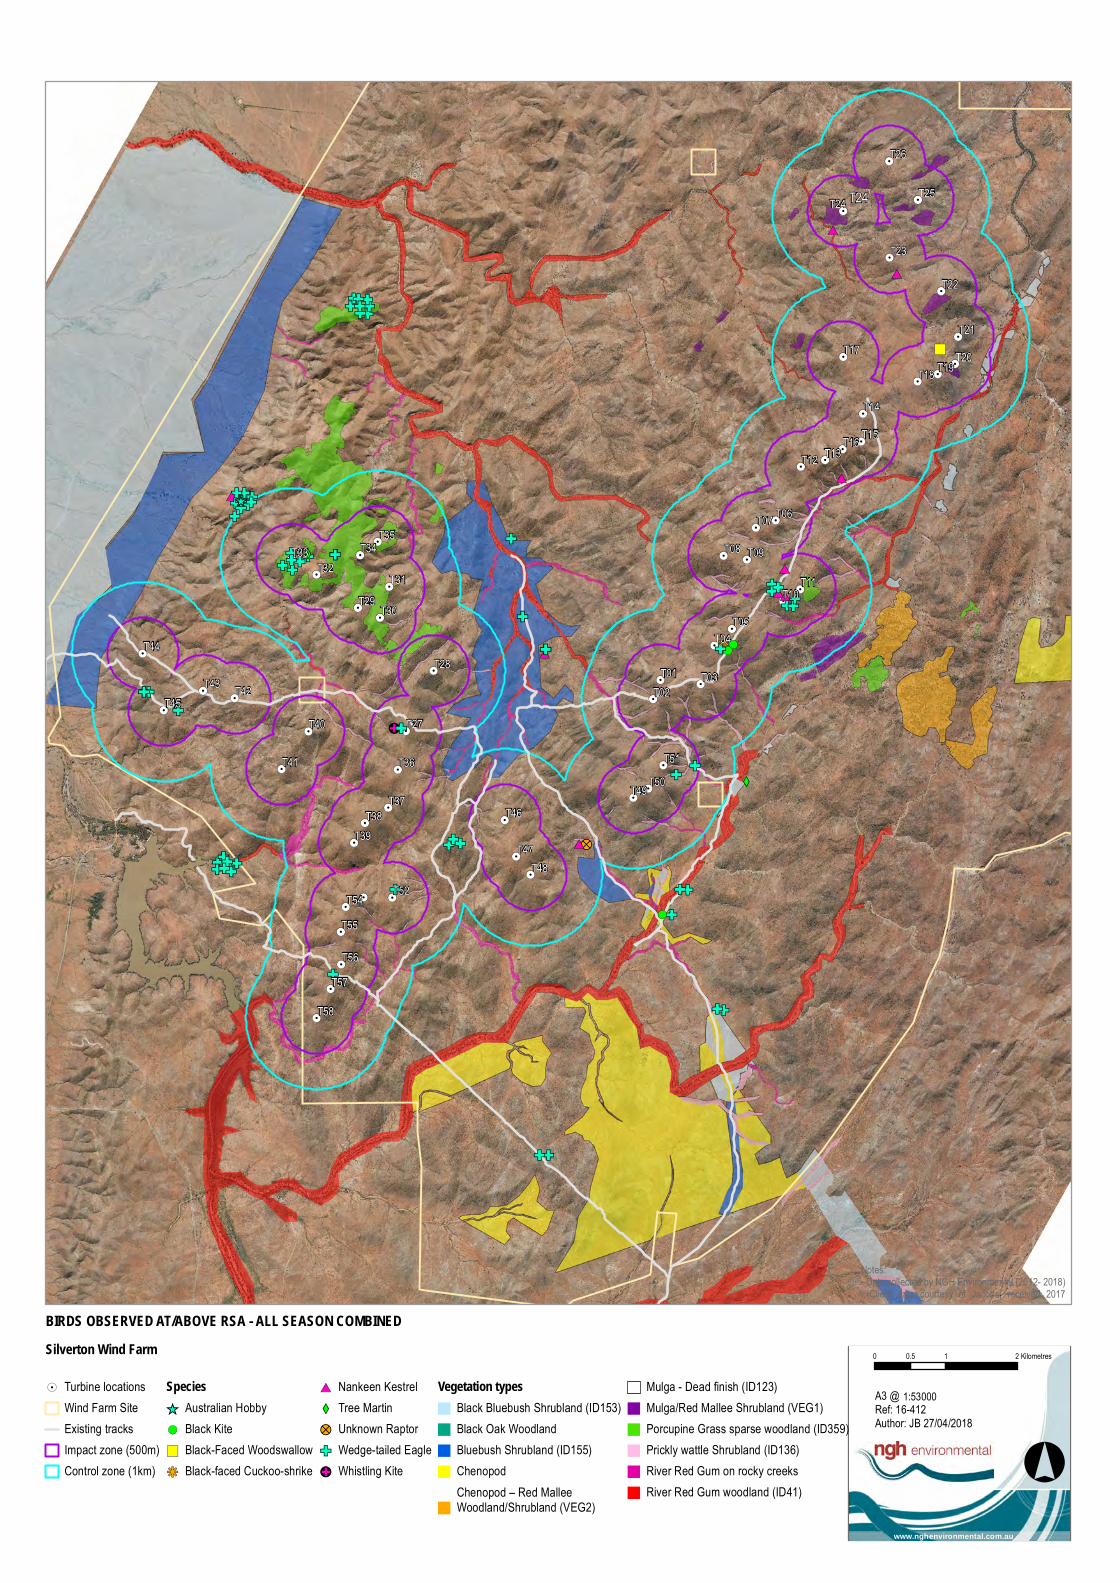
+M
+M
+M
+M
+M
+M+M
+M +M
+M+M
+M+M
+M
+M+M
+M
+M+M
+M
+M
+M
+M
+M+M
+M
+M
+M
+M+M
+M+M
+M +M+M
+M
+M
+M
+M
+M
+M
+M+M
+M
+M
+M
+M
+M
+M+M
+M
+M+M+M
+M
+M
+M
+M
GFGF
#*
GF
GFGFGF
GFGFGF#*
GF
GF
GF
GF
!(!(
GF
")
!?
GF
GFGFGF
GFGFGFGF
GFGF
GF
GF
GF
GFGF
GFGF
GF
GF
GFGFGFGFGF
GFGFGF
GFGFGF
GFGFGFGFGF
GF
#*
GF
XW
#*
GFkj
#*
GF
XW
#*
GF
GF
GF
GF#*
#*
#*
GF
GFGF
GF
GF
!(
GF
!CGF
GF
GF
GFGFGF̂_
GFGFGFGF
GF
GFGF
T24
T58
T57T56
T55T54 T52
T51T50T49
T48T47
T46
T45
T44
T43 T42
T41
T40
T39T38
T37
T36
T35T34T33
T32T31
T30T29
T28
T27
T26
T25T24
T23
T22
T21T20T19T18
T17
T16 T15T14
T13T12
T11T10
T09T08T07 T06
T05T04
T03T02
T01
+M Turbine locationsWind Farm SiteExisting tracksImpact zone (500m)Control zone (1km)
Species_̂ Australian Hobby!( Black Kite") Black-Faced Woodswallowkj Black-faced Cuckoo-shrike
#* Nankeen KestrelXW Tree Martin!? Unknown RaptorGF Wedge-tailed Eagle!C Whistling Kite
Vegetation typesBlack Bluebush Shrubland (ID153)Black Oak WoodlandBluebush Shrubland (ID155)ChenopodChenopod – Red MalleeWoodland/Shrubland (VEG2)
Mulga - Dead finish (ID123)Mulga/Red Mallee Shrubland (VEG1)Porcupine Grass sparse woodland (ID359)Prickly wattle Shrubland (ID136)River Red Gum on rocky creeksRiver Red Gum woodland (ID41)
1:53000
www.nghenvironmental.com.au
0 1 20.5 Kilometres
°
BIRDS OBSERVED AT/ABOVE RSA - ALL SEASON COMBINED
A3 @Ref: 16-412 Author: JB 27/04/2018
Silverton Wind Farm
Notes:- Data collected by NGH Environmental (2012- 2018)- Client data courtesy of Jacobs, received 2017

Silverton Wind Farm Bird and Bat Management VII Baseline Surveys. Project Ref # 16-412
APPENDIX C REVISED RISK ASSESSMENT SUMMARY

1 May 2018
Adam Mackett
Project Manager
Project Management Office, Group Operations
AGL Energy Limited
L24, 200 George Street
Sydney NSW 2000
NGH Environmental Pty Ltd (ACN: 124 444 622. ABN: 31 124 444 622) and NGH Environmental (Heritage) Pty Ltd (ACN: 603 938 549. ABN: 62 603 938 549) are part of the NGH Environmental Group of Companies.
bega
unit 1, 216 carp st
(po box 470)
bega nsw 2550
t 61 2 6492 8333
bathurst
35 morrisset st
(po box 434)
bathurst nsw 2795
t 61 2 6331 4541
canberra
unit 17, 27 yallourn st
(po box 62)
fyshwick act 2609
t 61 2 6280 5053
f 61 2 6280 9387
newcastle
7/11 union st newcastle west nsw 2302 t 61 2 4929 2301
sydney
unit 18, level 3
21 mary st
surry hills nsw 2010
t 61 2 8202 8333
wagga wagga
suite 1, 39 fitzmaurice st
(po box 5464)
wagga wagga nsw 2650
t 61 2 6971 9696
f 61 2 6971 9693
www.nghenvironmental.com.au
Dear Adam,
RE – Silverton Wind Farm – revised Bird and Bat Risk Assessment (Our Ref: 16-412)
A Bird and Bat Risk Assessment (BBRA 2016) was undertaken in 2016 for Silverton Wind Farm,
based on a ‘worse-case scenario’ of a mix of turbine parameters from a range of models being
considered. Construction is nearing completion at Silverton Wind Farm and the turbine model
has been chosen. Baseline bird and bat surveys have been underway at Silverton Wind Farm
over the last two years with a total of four surveys undertaken during 2016, 2017 and 2018.
NSW Department of Planning and Environment (DPE) have requested that the BBRA 2016 be
reviewed in light of the new information (turbine parameters and site-specific bird data) before
the Bird and Bat Adaptive Management Plan (BBAMP) is finalised. This revision of risk begins
overleaf and was undertaken by our Senior Ecologist Bianca Heinze, who conducted the BBRA
2016.
Yours sincerely,
Nick Graham-Higgs
Managing Director
Ph 0427 260 819
NGH Environmental
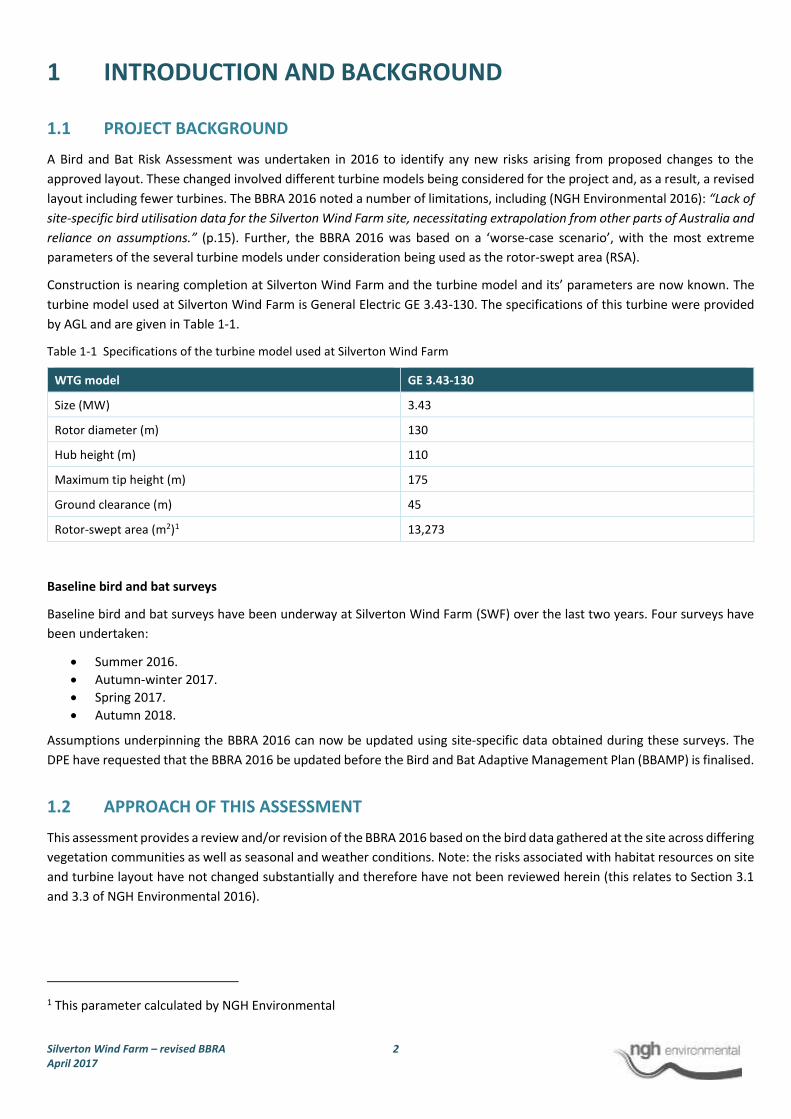
Silverton Wind Farm – revised BBRA 2 April 2017
1 INTRODUCTION AND BACKGROUND
1.1 PROJECT BACKGROUND
A Bird and Bat Risk Assessment was undertaken in 2016 to identify any new risks arising from proposed changes to the
approved layout. These changed involved different turbine models being considered for the project and, as a result, a revised
layout including fewer turbines. The BBRA 2016 noted a number of limitations, including (NGH Environmental 2016): “Lack of
site-specific bird utilisation data for the Silverton Wind Farm site, necessitating extrapolation from other parts of Australia and
reliance on assumptions.” (p.15). Further, the BBRA 2016 was based on a ‘worse-case scenario’, with the most extreme
parameters of the several turbine models under consideration being used as the rotor-swept area (RSA).
Construction is nearing completion at Silverton Wind Farm and the turbine model and its’ parameters are now known. The
turbine model used at Silverton Wind Farm is General Electric GE 3.43-130. The specifications of this turbine were provided
by AGL and are given in Table 1-1.
Table 1-1 Specifications of the turbine model used at Silverton Wind Farm
WTG model GE 3.43-130
Size (MW) 3.43
Rotor diameter (m) 130
Hub height (m) 110
Maximum tip height (m) 175
Ground clearance (m) 45
Rotor-swept area (m2)1 13,273
Baseline bird and bat surveys
Baseline bird and bat surveys have been underway at Silverton Wind Farm (SWF) over the last two years. Four surveys have
been undertaken:
• Summer 2016.
• Autumn-winter 2017.
• Spring 2017.
• Autumn 2018.
Assumptions underpinning the BBRA 2016 can now be updated using site-specific data obtained during these surveys. The
DPE have requested that the BBRA 2016 be updated before the Bird and Bat Adaptive Management Plan (BBAMP) is finalised.
1.2 APPROACH OF THIS ASSESSMENT
This assessment provides a review and/or revision of the BBRA 2016 based on the bird data gathered at the site across differing
vegetation communities as well as seasonal and weather conditions. Note: the risks associated with habitat resources on site
and turbine layout have not changed substantially and therefore have not been reviewed herein (this relates to Section 3.1
and 3.3 of NGH Environmental 2016).
1 This parameter calculated by NGH Environmental

Silverton Wind Farm – revised BBRA 3 April 2017
2 RISK REVIEW
2.1 TURBINE PARAMETERS
The specifications for the turbine model used at SWF are given in Table 1-1 above. Key considerations in relation to collision
risks are:
• The lowest height above the ground that the rotor passes (i.e. the ‘ground clearance’ or ‘minimum RSA’).
• The total level of the RSA from lowest to highest points.
The BBRA 2016 was based on a ground clearance of 29.5 m and a high point of 180 m. Birds and bats flying between around
29 m and 180 m height would potentially be within the RSA. Generally, the lower the minimum RSA, the more frequently birds
would be expected to encounter it. The BBRA 2016 considered that birds may be affected by the wake of moving blades within
10m of the RSA. The BBRA 2016 found a minimum clearance of 9.5 m of vegetation in the Porcupine Grass – Red Mallee –
Gum Coolibah woodland, which affected 15 turbines. The GE 3.43-130 has a much higher ground clearance than previously
assumed at 45 m. Comparing this to the maximum vegetation heights, the minimum clearance between the RSA and the
vegetation canopy is at least 25 m for the Porcupine Grass – Red Mallee – Gum Coolibah woodland, and in some vegetation
types, more than 40 m. The majority of birds travel below this height during the majority of their flights (NGH Environmental
unpubl.). In summary, the turbines at SWF do not pose an automatic risk to all birds travelling above the canopy at woodland
sites.
Table 2-1 Maximum height levels of vegetation on slopes and ridges where turbines are proposed and comparison of RSA clearance and risk for the BBRA 2016 (NGH Environmental 2016) and turbines used at SWF
Vegetation community Maximum vegetation height
(m) **
Minimum clearance between canopy and turbines
BBRA 2016:
29.5 m
SWF (turbines used):
45 m
Porcupine Grass – Red Mallee- Gum Coolibah Hummock Grassland / Low Sparse Woodland
20 9.5 25
Black Oak Woodland 15 14.5 30
Mulga-Dead Finish on Stony Hills 15 14.5 30
Undescribed Community 1: Mulga / Red Mallee shrubland
15 14.5 30
Bluebush shrubland 2 ~ 27 43
2.2 SPECIES RISK ASSESSMENT
2.2.1 Methods
The species risk assessment uses a risk matrix of likelihood of collision and consequence of collision. The consequence builds
in considerations of population impact. It must be emphasised that a ‘high risk’ species does not necessarily infer a high risk
to the population should a collision occur. Table 2-2 shows the risk matrix used in the BBRA 2016 and herein. For example, a
high-risk species may have a ‘probable’ likelihood of collision with a ‘minor’ consequence – such as Wedge-tailed Eagle. But
also, a high-risk species may have a ‘rare’ likelihood of collision with a ‘significant’ consequence – such as a critically
endangered species.

Silverton Wind Farm – revised BBRA 4 April 2017
Table 2-2 Risk matrix with three risk levels: Low, Moderate and High, assigned based on the likelihood and consequence
Likelihood Consequence
Insignificant Minor Moderate Significant
Rare Low Low Moderate High
Unlikely Low Low Moderate High
Possible Low Moderate High High
Probable Moderate High High High
When considering how best to manage high risk species, consideration of likelihood is an important factor. For example, it
would be relatively futile to invest a large quantity of resources to attempt to reduce the likelihood of a ‘rare’ rated species
colliding with a turbine. In this situation, it would be best to consider how to manage the consequence of such an occurrence.
In contrast, there may be scope to manage (i.e. reduce) the likelihood of a species with a ‘probable’ rating. One such example
is removing carcasses around turbines to reduce the likelihood of Wedge-tailed Eagles foraging in the vicinity and therefore
encountering blades. Table 2-3 provides the descriptions of likelihood and consequence ratings.
Table 2-3 Descriptions of likelihood and consequence ratings.
Likelihood Description Consequence Description
Rare An impact may occur only in unusual
circumstances
Insignificant Impact on species not detectable
in the short term
Unlikely An impact might occur at some time Minor Impact may cause non-significant
changes to local abundance of
species
Possible An impact could occur during most
circumstances
Moderate Impacts may cause significant
changes to local abundance of
species
Probable An impact is expected to occur in most
circumstances
Significant Impacts may be significant at a
population scale

Silverton Wind Farm – revised BBRA 5 April 2017
2.2.2 Species assessed
Each species subject to a risk assessment in the BBRA 2016 was reviewed, and one added (in bold):
1. Wedge-tailed Eagle.
2. Little Eagle.
3. Black Kite.
4. Brown Falcon.
5. Nankeen Kestrel.
6. Collared Sparrowhawk.
7. Spotted Harrier.
8. Black-breasted Buzzard.
9. Square-tailed Kite.
10. Grey Falcon.
11. White-throated Needletail.
12. Pink Cockatoo.
13. Diamond Firetail.
14. Pied Honeyeater.
15. Painted Honeyeater.
16. Rainbow Bee-eater.
17. White-fronted Chat.
18. Freckled Duck (added).
19. Yellow-bellied Sheathtail Bat.
20. Inland Forest Bat.
21. Little Pied Bat.
22. White-striped Freetail Bat.
23. Gould’s Wattled Bat
Where there was new relevant information to consider (e.g. from surveys or due to RSA height change), the risk assessment
has been provided in Appendix A, with new information and changes to the assessment highlighted.
The consequence rating for only two species was updated and upgraded due to a change in their listing: Pink Cockatoo and
Diamond Firetail. These are threatened species listed as Vulnerable under the NSW Biodiversity Conservation Act 2017 but
were not assessed as such in the BBRA 2016. All other changes relate to the likelihood of collision. Changes have been due to
either information collected during baseline surveys (e.g. flight height data) or increased minimum height of the RSA, or both.
The primary information used from baseline surveys was:
• Presence/absence.
• Frequency of species observation.
• Records above minimum RSA height (45 m) plus 10 m buffer (i.e. greater than 35 m above ground).
Table 2-4 provides a summary of the risk assessment review, showing likelihood and risk (consequence has not been shown
as it remains unchanged for the majority of species). There have been changes to the risk assessment for:
• Little Eagle.
• Square-tailed Kite.
• Grey Falcon.
• Pink Cockatoo.
• Diamond Firetail.
• Inland Forest Bat.
• Little Pied Bat.
• Gould’s Wattled Bat.

Silverton Wind Farm – revised BBRA 6 April 2017
Table 2-4 Summary of collision ‘likelihood’ and ‘risk’ of assessed species, showing both BBRA 2016 results and those of this review
Species Conservation status
BBRA 2016
Lower RSA at 29.5 m
Revision
Lower RSA at 45 m
Change Reason for change
Likelihood
Risk
Likelihood
Risk
Wedge-tailed Eagle Probable High Probable High None
Little Eagle Vulnerable NSW Probable High Possible High Likelihood downgrade
Risk equivalent
Survey information
Black Kite Probable High Probable High None
Brown Falcon Probable High Probable High None
Nankeen Kestrel Probable Moderate Probable Moderate None
Collared Sparrowhawk
Unlikely Low Unlikely Low None
Spotted Harrier Vulnerable NSW Possible High Possible High None
Black-breasted Buzzard
Vulnerable NSW Possible High Possible High None
Square-tailed Kite Vulnerable NSW Possible High Unlikely Moderate Likelihood downgrade
Risk downgrade
RSA height
Grey Falcon Endangered NSW
Unlikely Moderate Rare Moderate Likelihood downgrade
Risk equivalent
RSA height
White-throated Needletail
Migratory - national
Probable Moderate Probable Moderate None
Pink Cockatoo Vulnerable NSW Rare Low Rare Moderate2 Consequence upgrade
Risk upgrade
Conservation status
Diamond Firetail Vulnerable NSW Rare Low Rare Moderate2 Consequence upgrade
Risk upgrade
Conservation status
Freckled Duck Vulnerable NSW - - Rare Moderate New assessment Recorded near site during baseline surveys
Pied Honeyeater Vulnerable NSW Rare Moderate Rare Moderate None
Painted Honeyeater Vulnerable NSW Rare Moderate Rare Moderate None
Rainbow Bee-eater Migratory - national
Rare Low Rare Low None
White-fronted Chat Vulnerable NSW Rare Low Rare Low None
Yellow‐bellied Sheathtail Bat
Vulnerable NSW Possible High Possible High None
2 Pink Cockatoo has been listed as a threatened species since the BBRA. Diamond Firetail was not assessed as a threatened
species in the BBRA, despite being listed as Vulnerable. Consequence of collision upgraded from ‘minor’ to ‘moderate’,
leading to a risk rating upgrade from ‘low’ to ‘moderate’. Likelihood remained unchanged at ‘rare’.

Silverton Wind Farm – revised BBRA 7 April 2017
Species Conservation status
BBRA 2016
Lower RSA at 29.5 m
Revision
Lower RSA at 45 m
Change Reason for change
Inland Forest Bat Vulnerable NSW Rare Moderate Possible High Likelihood upgrade
Risk upgrade
Survey information
Little Pied Bat Vulnerable NSW Unlikely Moderate Rare Moderate Likelihood downgrade
Risk equivalent
Survey information
White‐striped Freetail Bat
Probable High Probable High None
Gould’s Wattled Bat Probable High Possible Moderate Likelihood downgrade
Risk downgrade
Survey information
2.2.3 Threatened species
The following threatened species were recorded during baseline surveys:
1. Black-breasted Buzzard (V NSW).
2. Dusky Woodswallow (V NSW).
3. Freckled Duck (V NSW).
4. Hooded Robin (V NSW).
5. Little Eagle (V NSW).
6. Redthroat (V NSW).
7. Rufous Field-wren (V NSW).
8. Spotted Harrier (V NSW).
9. Varied Sittella (V NSW).
10. Yellow-bellied Sheathail Bat (V NSW).
11. Inland Forest Bat (V NSW).
12. Corben’s Long-eared Bat (V NSW, V C’th).
These species were briefly considered for their likelihood to encounter the RSA, based on habitat and ecology. With the
exception of raptors and Freckled Duck, the other threatened species are all encountered low in the landscape or close to
the canopy (Dusky Woodswallow) and would not be expected to encounter the RSA at 45 m height. The three species that
may encounter the RSA: Black-breasted Buzzard, Freckled Duck, Little Eagle; have been subjected to a risk assessment,
reported above.
2.2.4 High risk species
Square-tailed Kite has been downgraded from ‘high’ risk species to a ‘moderate’ risk species. With the change in minimum
RSA height now well above the vegetation canopy, the likelihood of collision for this species was downgraded from
‘possible’ to ‘unlikely’.
The Inland Forest Bat was upgraded from a ‘moderate’ risk to a ‘high’ risk species with the likelihood increasing from ‘rare’
to ‘possible’. There is a great deal of uncertainty about the species’ behaviour and flight height is not known. This species
was widely recorded during baseline surveys and on this basis, the precautionary principle was applied: an assumption
was made that it may encounter the RSA while foraging.
Other ‘high’ risk species remain unchanged. The nine ‘high’ risk species are:
1. Wedge-tailed Eagle.
2. Little Eagle.
3. Black Kite.
4. Brown Falcon.
5. Spotted Harrier.
6. Black-breasted Buzzard.
7. Yellow-bellied Sheathtail Bat.

Silverton Wind Farm – revised BBRA 8 April 2017
8. White-striped Freetail Bat.
9. Inland Forest Bat
Each of these is a ‘high’ risk species due to a ‘possible’ or ‘probable’ likelihood (rather than due to a severe consequence
rating).

Silverton Wind Farm – revised BBRA 9 April 2017
3 CONCLUSIONS AND RECOMMENDATIONS
3.1 REVIEW OF PREVIOUS RECOMMENDATIONS
The BBRA 2016 provided a number of recommendations. Those relating to buffer distances and turbine configuration are
outside the scope of this review. The recommendation to address species-specific risk (Section 5.2.3 in BBRA 2016) by
monitoring ‘high’ risk species more frequently however does relate to this review.
All ‘high’ risk species have a high likelihood of collision. The most appropriate way to work out whether any particular species
is at ‘high’ risk is to undertake mortality searches for carcasses around operational turbines. These should not be targeted
toward a particular species but rather attempt to locate all carcasses present during a search. Increasing the frequency of
monitoring toward any particular species is likely to skew the results of monitoring, which is to be avoided as much as
possible.
Species, or group-specific management actions to reduce the likelihood of collisions should be undertaken in response to
an actual mortality event (or pre-determined trigger, such as multiple mortalities of one species). Examples of suitable
management actions might be to remove carcasses (e.g. goats or stock) around turbines if Wedge-tailed Eagles or other
scavenging raptors are being found during mortality searches. The Adaptive Bird and Bat Management Plan would include
such considerations.
3.2 CONCLUSION
Using new information including baseline bird and bat surveys and the final turbine model used for Silverton Wind Farm,
this review has found:
• Overall risks to birds and bats to be generally lower due to around 15 m more ground clearance of the
minimum RSA (at 45 m) of the GE 3.43-130 turbine model, compared to the parameters of the BBRA 2016.
• When discussing ‘high’ risk species, it is important to distinguish those with a higher likelihood of collision
from those with a higher consequence of collision.
• One species downgraded from ‘high’ risk of collision (Square-tailed Kite) to ‘moderate’, and another species
upgraded from ‘moderate’ to ‘high’ (Inland Forest Bat). The total number of ‘high’ risk species remains nine:
Wedge-tailed Eagle, Little Eagle, Black Kite, Brown Falcon, Spotted Harrier, Black-breasted Buzzard, Yellow-
bellied Sheathtail Bat, White-striped Freetail Bat, Little Forest Bat.
• The ‘high’ risk species list is made up of higher flying species (or in the case of Inland Forest Bat, a species
with limited information about flight height) that are likely to encounter the RSA during their daily foraging
activity, if they occur within the ridgetop turbine zone. Several of these species are listed as threatened in
NSW (Little Eagle, Black-breasted Buzzard, Yellow-bellied Sheathtail Bat, Little Forest Bat).
• Other (non-high-flying) threatened species recorded on site during baseline surveys (e.g. Redthroat) are not
likely to encounter the RSA and are not species at risk of collision.
• The most appropriate vehicle for addressing and managing risks to birds and bats from operational wind
farms is through the Adaptive Bird and Bat Management Plan (i.e. monitoring).

Silverton Wind Farm – revised BBRA 10 April 2017
4 REFERENCES Aumann T (2001) Breeding biology of raptors in riparian environments in the south‐west of the Northern Territory, Australia. Emu
101, 305‐315.
BirdLife Australia (undated) Freckled Duck, accessed online at http://www.birdlife.org.au/bird-profile/freckled-duck in February
2017
BOM (2018a) Broken Hill Airport, Daily Weather observations, accessed online at
http://www.bom.gov.au/climate/dwo/IDCJDW2168.latest.shtml. Bureau of Meteorology, Australia.
BOM (2018b) Monthly climate statistics, Broken Hill Airport AWS. Accessed online at
http://www.bom.gov.au/climate/averages/tables/cw_047048.shtml. Bureau of Meteorology, Australia.
Churchill (2008) Australian Bats, 2nd edition Allen & Unwin, New South Wales, Australia
Debus, S. (2012) Birds of Prey of Australia, CSIRO Publishing and BirdLife Australia, Victoria, Australia
Department of Environment and Climate Change (DECC) (2007) Threatened Species website accessed November 2007;
http://www.threatenedspecies.environment.nsw.gov.au/
Hull, C. (2013) Wind farm researcher debunks bird 'myths', accessed online at
http://www.abc.net.au/radionational/programs/ockhamsrazor/5046460, on 24 May 2016
MacMahon, A. (2010) Expert Witness Statement: Yaloak South Wind Farm: Review of Wedge-tailed Eagle Assessment [online].
Available from
http://www.moorabool.vic.gov.au/CA257489001FD37D/Lookup/YaloakWindFarmApplication/$file/Ecology%20Australi
a%20Expert%20Witness%20Statement.pdf [accessed 10 August 2012]
NGH Environmental (2012) Rye Park Wind Farm Biodiversity Constraints Analysis, report prepared for Epuron Pty Ltd.
NGH Environmental (2016) Bird and Bat Risk Assessment, Silverton Wind Farm. Report prepared for AGL.
NSW Scientific Committee (2010) Grey Falcon Falco hypoleucos – endangered species listing – final determination, accessed online
at http://www.environment.nsw.gov.au/determinations/greyfalconFD.htm on 18 May 2016
Pennay, M., Law, B., and Reinhold, L. (2004) Bat Calls of New South Wales, NSW Department of Environment and Conservation
Schodde, R. and Tidemann, S. C., Eds. (2007) Readers Digest Complete Book of Australian Birds, Readers Digest Services, Sydney
SEWPAC (2016) Species Profile and Threats Database [online]. Available from http://www.environment.gov.au/cgi‐
bin/sprat/public/sprat.pl [accessed May 2016]
Smales, I. (2009) Expert Witness Statement of Ian John Smales, Stockyard Hill Wind Farm [online]. Available from
http://www.iberica2000.org/documents/EOLICA/REPORTS/Yaloak_Expert_witness_statement_of_%20Ian_Smales.pdf
[accessed 10 August 2012]
Wen, L., Saintilan, N., Reid, J.R.W., Collof, M.J. (2016) ‘Changes in distribution of waterbirds following prolonged drought reflect
habitat availability in coastal and inland regions’ Ecology and Evolution, 6 (18): 6672-6689

Silverton Wind Farm – revised BBRA 11 April 2017
APPENDIX A REVIEW - SPECIES RISK ASSESSMENT
All species in Appendix B of NGH Environmental (2016) were reviewed. Species for which new information is available or
relevant have been included here. Edits are in orange text.
Wedge-tailed Eagle
Risk factors Observed at site, including nesting
Utilises updrafts around the range when foraging (at blade height)
Large-bodied, low manoeuvrability
Large home range
Male diving displays
Prey source present at turbine sites (goats and rabbits)
Low reproductive rate
Discussion Observed singly and in a pairs soaring over the range and taking flight from within the turbine envelope. Rabbits and goats are local food sources. Rabbit warrens are present on the plains and goat nurseries on rocky outcrops. Important resources are concentrated within the range and adjacent area (habitat of moderate to high importance). Similar habitat is present in other parts of the range although, the proposal would cover an extensive area of preferred habitat. Sedentary, so reduction of habitat area through barrier effect would impact individuals.
Wedge-tailed Eagles continue to be observed utilising habitat, foraging and breeding at wind farm sites. Wedge‐tailed Eagles have a considerably lower avoidance rate than many other species, at between 90% and 95% (Smales 2009, MacMahon 2010). Although mortalities are generally low in number, this species is consistently recorded in carcass monitoring at wind farms in Australia (NGH Environmental 2012).
Regularly recorded in RSA during baseline surveys. Of 102 observations of birds in the RSA plus buffer (i.e. 35 m or higher), 75 were Wedge-tailed Eagle.
Collision risk
Likelihood: Probable
Consequence: Minor
Risk: High
Little Eagle
Risk factors Observed at site irregularly
Utilises updrafts around the range when foraging (at blade height)
Large-bodied, low manoeuvrability
Large home range
Low reproductive rate
Threatened species
Discussion While Little Eagles have not been recorded in the Australian carcass search literature cited herein, it is a medium sized raptor with similar soaring and prospecting foraging behaviour (Aumann 2001) as the Wedge‐tailed Eagle and may be similarly at risk from turbines in certain landscape positions. As for Wedge-tailed Eagles, juvenile Little Eagles with turbines near nests would be most at risk.
Observed in the study area and there are many records of the species in the ALA. Rabbits are local food sources. Rabbit warrens are present on the plains Important resources are concentrated within the range and adjacent area (habitat of moderate to high importance). Similar habitat is present in other parts of the range although, the proposal would cover an extensive area of preferred habitat. Sedentary, so reduction of habitat area through barrier effect would impact individuals.

Silverton Wind Farm – revised BBRA 12 April 2017
Observed one on occasion during baseline studies and not within RSA.
Collision risk
Likelihood: Possible
Consequence: Moderate
Risk: High
Black-breasted Buzzard
Risk factors Utilises updrafts around the range when foraging (at blade height)
Large-bodied, low manoeuvrability
Large home range
Low reproductive rate
Threatened species
Discussion Wide-ranging, sparsely distributed species. There are several records in the locality; mostly observed in wooded habitats and riparian areas. Black-breasted Buzzard observed in the study area and there are many records of the species in the ALA. Rabbits are local food sources.
Collision risk
Likelihood: Possible
Consequence: Moderate
Risk: High
Square-tailed Kite
Risk factors Utilises updrafts around the range when foraging (at blade height)
Large-bodied, low manoeuvrability
Large home range
Low reproductive rate
Threatened species
Discussion Wide-ranging, sparsely distributed species. There are several records in the locality; mostly observed in wooded habitats and riparian areas. Square-tailed Kite has not been observed in the study area. Generally forages directly above the canopy. Minimum RSA height has increased to 45 m, with at least 25 m clearance above the highest growing vegetation type on site.
Collision risk
Likelihood: Unlikely
Consequence: Moderate
Risk: Moderate
Grey Falcon
Risk factors Performs tumbling and diving flight displays
Soaring
Threatened species (endangered)
Discussion There are many records in the locality although species sparsely distributed. Forages using high-speed chase, quartering and high soaring usually over vegetated (including grassland) and riparian areas (Debus 2012). Main prey items are ground-feeding granivores (NSW Scientific Committee (2010). Prey sources present in the wind farm area. Minimum RSA height has increased to 45 m, with at least 25 m clearance above the highest growing vegetation type on site.
Collision risk
Likelihood: Rare
Consequence: Moderate
Risk: Moderate
Silverton Wind Farm – revised BBRA 13 April 2017
Pink Cockatoo
Risk factors Rapid flight at turbine height
Flocking
Threatened species in NSW (Vulnerable)
Discussion Feeds mostly on the ground, on the seeds of native and exotic melons, saltbush, wattles and cypress pines. Normally found in pairs or small groups, though flocks of hundreds may be found where food is abundant (DECC 2007). Observed on site during BA flying with the turbine envelope at blade height. Not observed during baseline surveys. A manoeuvrable flyer. Key habitat is not located within the development envelope. Cockatoos do not feature among regular carcass finds at wind farms (NGH Environmental unpubl. data).
Collision risk
Likelihood: Rare
Consequence: Moderate
Risk: Moderate
Diamond Firetail
Risk factors Seasonal flock aggregations
Threatened species
Discussion Sedentary. Feeds predominantly on the ground on grass seeds, in groups from 5 to 150 individuals (Schodde & Tidemann 2007), nesting in pairs or communally in shrubs and small trees. May form large flocks during winter and autumn. Diamond Firetails are considered to have poor dispersal abilities and are likely to be less common away from tree cover. Recorded in study area.
Collision risk Likelihood: Rare
Consequence: Moderate
Risk: Moderate
Rainbow Bee-eater
Risk factors Migratory
Discussion When migrating may occur in large flocks. Forages by pursuing and catching flying insects, or by aerial sweeping. Considered secure and common in Australia. (SEWPAC 2016). Recorded in study area including during baseline surveys, but not recorded flying above 35 m.
Collision risk Likelihood: Rare
Consequence: Minor
Risk: Low
Freckled Duck
Risk factors Migratory
Threatened species
Waterbirds – awkward flight, night migration
Discussion Generally, for waterbirds coastal habitats provide drought refugia and inland wetlands are used during wet periods (Wen et al. 2016). Freckled Duck is known to retreat to reliable coastal wetlands during dry conditions inland (BirdLife Australia undated). The bird was recorded in spring 2017 at the reservoir – where habitat does not fit descriptions for the species. The region received below average rainfall over winter and spring 2017 (BOM 2018a, b). Freckled Duck may have been utilising the reservoir as drought refugia or as a stop-over between more suitable inland and coastal wetlands.

Silverton Wind Farm – revised BBRA 14 April 2017
Freckled Duck
Freckled Duck has been recorded utilising wetlands near to an operational wind farm in southern NSW, but has not been recorded within the turbine area. At the same wind farm, there have been no waterbirds recorded amongst carcass search data (NGH Environmental, unpubl.)
Collision risk Likelihood: Rare
Consequence: Moderate
Risk: Moderate
Yellow-bellied Sheathtail Bat
Risk factors High-flying, fast flying
Migratory
Discussion Yellow-bellied Sheathtail Bat was recorded during BA and baseline surveys, albeit with a low number of passes. Fast and high-flying species such as this appear to be less able to avoid obstacles while foraging.
Collision risk
Likelihood: Possible
Consequence: Moderate
Risk: High
Inland Forest Bat
Risk factors Threatened species
Colonial
Discussion Little information is available for this species. There are ALA records for this species in the region, e.g. Menindee and Bimbowrie (over the border in SA), although but not in the Broken Hill / Silverton district. Other forest bats fly within the canopy, and their echolocation calls reflect flight in a cluttered environment: steep, fast calls. The call of the Inland Forest Bat is more like the Little Pied Bat (Pennay et al. 2004), suggesting the species flies in more open habitat. However, it is unclear whether this is due to the flight height (i.e. flying above the canopy) or the openness of arid land habitat. The Forest Bat complex (Vespadelus baverstocki/vulturnus) was one of the most frequently recorded microbat during baseline surveys. It was recorded during all four survey events, and recorded widely spring 2017 and autumn 2018. The likelihood of collision for this species is particular should be reviewed again following operational monitoring.
Collision risk Likelihood: Possible
Consequence: Moderate
Risk: Moderate
Little Pied Bat
Risk factors Threatened species
Recorded in study area in BA, but not during baseline surveys.
Discussion Little is known about Little Pied Bat, however, it appears that the species prefers to forage within the canopy or understorey of vegetation communities. The physiology and the short pulse rate of the bat suggest it is a relatively slow flying and manoeuvrable species (Churchill 2008, Pennay et al. 2004).
Collision risk
Likelihood: Rare
Consequence: Moderate
Risk: Moderate

Silverton Wind Farm – revised BBRA 15 April 2017
Gould’s Wattled Bat
Risk factors High-flying, fast flying
Discussion Gould’s Wattled Bat was recorded in study area during BA but not during baseline surveys. This is a sedentary species. Fast and high-flying species such as this appear to be less able to avoid obstacles while foraging. Gould’s Wattled Bats are disproportionately represented in available Australian carcass monitoring data (NGH Environmental 2012, Hull 2013)
Collision risk Likelihood: Possible
Consequence: Minor
Risk: High

Silverton Wind Farm Bird and Bat Management VIII Baseline Surveys. Project Ref # 16-412
APPENDIX D BIRD AND BAT BASELINE DATA SURVEY
METHODS

www.nghenvironmental.com.au e [email protected]
Sydney Region 18/21 mary st
surry hills nsw 2010 (t 02 8202 8333)
Canberra - NSW SE & ACT 17/27 yallourn st (po box 62)
fyshwick act 2609 (t 02 6280 5053)
Wagga Wagga - Riverina and Western NSW suite 1, 39 fitzmaurice st (po box 5464)
wagga wagga nsw 2650 (t 02 6971 9696)
Newcastle - Hunter and North Coast 7/11 union st
newcastle west nsw 2302 (t 02 4929 2301)
Bega - ACT and South East NSW suite 1, 216 carp st (po box 470)
bega nsw 2550 (t 02 6492 8333)
Bathurst - Central West and Orana 35 morrisset st (po box 434)
bathurst nsw 2795 (t 02 6331 4541)
Bird and Bat Survey Methods SILVERTON WIND FARM
NOVEMBER 2017

www.nghenvironmental.com.au e [email protected]
Sydney Region 18/21 mary st
surry hills nsw 2010 (t 02 8202 8333)
Canberra - NSW SE & ACT 17/27 yallourn st (po box 62)
fyshwick act 2609 (t 02 6280 5053)
Wagga Wagga - Riverina and Western NSW suite 1, 39 fitzmaurice st (po box 5464)
wagga wagga nsw 2650 (t 02 6971 9696)
Newcastle - Hunter and North Coast 7/11 union st
newcastle west nsw 2302 (t 02 4929 2301)
Bega - ACT and South East NSW suite 1, 216 carp st (po box 470)
bega nsw 2550 (t 02 6492 8333)
Bathurst - Central West and Orana 35 morrisset st (po box 434)
bathurst nsw 2795 (t 02 6331 4541)
Document Verification
Project Title: Silverton Wind Farm Bird and Bat Survey Methods
Project Number: 16-412
Project File Name: Silverton Wind Farm Bird and Bat Baseline Surveys Revision Date Prepared by (name) Reviewed by (name) Approved by (name)
Final v1.0 9/11/17 Sam Patmore Nick Graham-Higgs Client Review
Nick Graham-Higgs
NGH Environmental prints all documents on environmentally sustainable paper including paper made from bagasse (a by-product of sugar production) or recycled paper.
NGH Environmental is a registered trading name of NGH Environmental Pty Ltd; ACN: 124 444 622. ABN: 31 124 444 622
Bird and Bat survey Methods Silverton Wind Farm
16-412 Silverton Wind Farm Bird and Bat Survey Methods Report i
CONTENTS
1 INTRODUCTION & PROJECT BACKGROUND ............................................................................... 3
2 OVERVIEW OF TYPES OF SURVEYS TO BE CONDUCTED ............................................................... 4
2.1 SURVEY STRATIFICATION .....................................................................................................................4
2.2 CONSIDERATION OF STATISTICAL RIGOUR OF APPROACH ..................................................................5
3 DETAILED SURVEY METHODS .................................................................................................... 6
3.1 BIRD UTILISATION SURVEYS .................................................................................................................6
3.1.1 Passerine bird surveys ........................................................................................................................... 6
3.1.2 Raptor surveys ....................................................................................................................................... 6
3.1.3 Opportunistic Records ........................................................................................................................... 7
3.1.4 Number and location of bird surveys: ................................................................................................... 7
3.1.5 Summary of Bird Utilisation Survey Effort ............................................................................................. 7
3.1.6 Timing of Bird Surveys ........................................................................................................................... 8
3.2 BAT SURVEYS ..................................................................................................................................... 10
3.2.1 Trapping ............................................................................................................................................... 10
3.2.2 Bat Detectors ....................................................................................................................................... 10
3.2.3 Final survey sites for ongoing monitoring ........................................................................................... 17
3.2.1 Timing of Bat Surveys .......................................................................................................................... 21
APPENDIX A SURVEY PLAN .......................................................................................................... A-I
APPENDIX B RESPONSES AGAINST EXPERT REPORT RECOMMENDATIONS ....................................... I
APPENDIX C SYMBOLIX LETTER OF ADVICE .................................................................................. C-I
APPENDIX D DETAILED BIRD SURVEY METHODS ........................................................................... D-I
Bird Utilisation Surveys .................................................................................................................................. D-I
APPENDIX E SUMMARY OF REVISED SURVEY PLAN AGAINST COMMONWEALTH GUIDELINES ....... E-I
APPENDIX F SUMMARY OF REVISED SURVEY PLAN AGAINST NSW THREATENED SPECIES SURVEY
GUIDELINES ………………………………………………………………………………………………………………………………….F-I

Bird and Bat survey Methods Silverton Wind Farm
16-412 Silverton Wind Farm Bird and Bat Survey Methods Report ii
TABLES
Table 1 Passerine bird survey effort ............................................................................................................... 7
Table 2 Raptor bird survey effort .................................................................................................................... 8
Table 3 Seasonal timing of bird surveys ......................................................................................................... 8
Table 4 Schedule of Survey Sites .................................................................................................................... 9
Table 5 Met Mast locations for RSA level monitoring ..................................................................................11
Table 6 Identification of Priority Habitat Areas within the site ....................................................................13
Table 7 Existing sites to be kept for ongoing monitoring (including sites where a minor relocation is
required) .......................................................................................................................................................16
Table 8 Proposed final survey sites ...............................................................................................................18
Table 9 Summary of survey effort (number of sites per hectare of habitat type) .......................................21
Table 10 Seasonal timing of bat surveys .......................................................................................................21
FIGURES
No table of figures entries found.

Bird and Bat survey Methods Silverton Wind Farm
16-412 Silverton Wind Farm Bird and Bat Survey Methods Report 3
1 INTRODUCTION & PROJECT BACKGROUND
Project Approval for Silverton Wind Farm (including the latest Modification 3 project design proposal) was
received in December 2016. Condition 18, of Schedule 3 (Environmental Conditions) of the approval
includes:
Prior to the construction of any wind turbines, the Proponent must prepare a Bird and Bat Adaptive
Management Plan for the project in consultation with OEH to the satisfaction of the Secretary. This
program must include:
(a) baseline data on threatened and ‘at risk’ bird and bat species and populations in the locality that
could potentially be affected by the project;
The key aims of the baseline surveys is to gather adequate baseline data on the existing bird and bat species
composition prior to commencement of construction of the wind farm (i.e. pre-impact data). This data will
be required for future comparisons to be made to detect changes in the species use (including changes in
activity patterns such as avoidance) of the site post-construction and during operation of the wind farm.
This report provides a single consolidated outline of the methods adopted for the overall Silverton Wind
Farm Bird and Bat Baseline Data Collection program. This Baseline Program will be used as an appendix to
the Bird and Bat Adaptive Management Strategy.
Also included in this letter (Appendix B) are summary responses to the main recommendations made in
the OEH Expert Report (Michael Pennay, 2017). The responses should be read in conjunction with the
survey methods proposed in this document and the supporting survey effort plan accompanying this
document. This revised approach seeks to address the concerns raised by OEH, including the
recommendations made in the OEH Expert Report in relation to the bat survey component, as well as
having consideration to the relevant survey guideline documents, including the commonwealth’s Survey
guidelines for Australia’s threatened bats (DWEHA 2010), and the NSW Threatened Biodiversity Survey and
Assessment: Guidelines for Developments and Activities (DEC 2004).

Bird and Bat survey Methods Silverton Wind Farm
16-412 Silverton Wind Farm Bird and Bat Survey Methods Report 4
2 OVERVIEW OF TYPES OF SURVEYS TO BE
CONDUCTED
The Silverton Wind Farm Bird and Bat Baseline Data Surveys have, include the following broad survey types:
1. Bird Utilisation Surveys
2. Raptor Surveys
3. Bat Surveys
The specific methods to be employed for each of the above survey types is detailed further below.
2.1 SURVEY STRATIFICATION
This bird and bat (baseline) survey design has been based on the BACI principle (Before, After, Control,
Impact). The baseline surveys are to be completed before commencement of construction of the turbines,
and therefore forms the Before component of the overall bird and bat surveys. The survey design also
includes both Control and Impact areas as defined below. The After component will be covered by ongoing
monitoring post commencement of operation, and will be managed under the Bird and Bat Adaptive
Management Plan (BBAMP, developed and implemented by others).
Based on previous baseline and ongoing monitoring surveys from other wind farms (and using Boco Rock
Wind Farm as the primary example), Impact and Control zones will be established as follows:
• Impact Zone is defined as the entire area within a 500m radius around each turbine location.
• Control Zone is defined as all areas located more than 1,000m from each turbine (as shown on the
attached survey locations plan, based on the latest available information on turbine placements as
per the GE-Catcon layout, which proposes 58 turbine sites).
An additional layer of the survey stratification is the seasonality of the surveys to account for possible
changes in bird and bat species occurrences and habitat use throughout the year based on seasonal
influences.
To account for seasonal difference, the baseline surveys will be conducted over different seasons, including
summer, autumn winter and spring. To date, a summer survey (December 2016), and a combined
Autumn/Winter period (May/June 2017) have been completed for both bird and bat surveys, and a bird-
only Spring survey was undertaken in October 2017. A further bat-only survey will be undertaken in
November 2017, as per the survey protocols outlined in this report. A Further bat-only Autumn survey
(March 2018) will also be undertaken immediately prior to commencement of operation of turbines to
provide further seasonal before impact data for bats. The current status of the bird and bat surveys is also
detailed in Tables 3 and 10 of this report.
It is noted that OEH had requested that each survey site would be multiple times during different times of
the day. Given the large site area and access difficulties due to lack of existing roads and difficult terrain,
this was not possible to achieve during the same seasonal survey. Given the replication of same survey
sites at different times of the year (including being conducted at different times of the day between the
seasons), as well as the fact that there are numerous sites within the same habitat type (which is relatively
homogenous across the majority of the wind farm site – see below for further discussion of stratification
based on habitat type), it is believed that there has been sufficient survey effort and replication to account
for the majority of species likely to be present at the site, particularly with respect to the differences in
utilisation of the main habitat types within the site.

Bird and Bat survey Methods Silverton Wind Farm
16-412 Silverton Wind Farm Bird and Bat Survey Methods Report 5
The survey design has also been further stratified to consider bird and bat utilisation within the different
habitat types recorded within the broader study area, and informed primarily by the vegetation mapping
already completed for the original environmental assessment of the proposed development. The number
and location of the Control and Impact survey sites is governed by the overall area of each vegetation type
(i.e. habitat availability) present within the study area, and importantly, within both the defined Control
and Impact Zones. Accordingly, vegetation types such as the Mulga – Dead Finish will include the greatest
number of survey sites as this vegetation type occurs over more than 90% of the overall study area. The
breakdown of survey sites within each vegetation type is explained further below in relation to Passerine
and Raptor bird groups.
2.2 CONSIDERATION OF STATISTICAL RIGOUR OF APPROACH
To ensure we have developed a survey approach that will collect sufficient data to enable a statistically
rigorous evaluation to determine if the operation of the wind farm is having an effect on birds or bats, we
have consulted with a statistical expert (Dr Elizabeth Stark, Symbolix Pty Ltd) to examine the overall
approach.
With regard to the bird utilisation surveys, Symbolix note that “The survey design and effort undertaken for
the baseline surveys appears to be in line with (or better than) the baseline survey effort at other Australian
wind farm sites. Provided that post-construction surveys match the timing, location and effort of these
baseline surveys the data set should be sufficient to measure before-after patterns and infer if these
patterns differ between control and impact sites.” (refer to letter of advice included at Appendix C).
With regard to the bat survey component, a detailed summary of the latest methods was not able to be
supplied to Symbolix as some of the final methods (i.e. RSA-level monitoring etc) had not yet been finalised
to provide a consolidated methods statement for their review and comment. Notwithstanding this,
numerous discussions were undertaken with Dr Stark about the general approach undertaken for the bat
surveys. Dr Stark noted that the use of bat detectors has very limited application with respect to detecting
changes in population abundance as the number of calls files cannot be used as a surrogate for the number
of individuals present and contributing to the calls recorded. As such, the data cannot be used reliably to
determine whether the wind farm is resulting in a decline in the population abundance of a species.
Nevertheless, the use of detectors can be seen as a good measure of presence/absence of species, and can
therefore be useful to detect changes/trends in habitat utilisation, from which it can potentially be
determined whether the wind farm is resulting in habitat avoidance impacts for a given species.

Bird and Bat survey Methods Silverton Wind Farm
16-412 Silverton Wind Farm Bird and Bat Survey Methods Report 6
3 DETAILED SURVEY METHODS
3.1 BIRD UTILISATION SURVEYS
The baseline bird surveys are broadly divided into passerine and raptor surveys, and includes timed point-
count utilisation surveys as well as opportunistic observations as described below for each group.
3.1.1 Passerine bird surveys
The passerine1 bird surveys includes a standardised truncated bird survey involving a 20 minute point count
method, with 2 observers stationed at nominated survey sites (see further below for a description of the
number and location of survey sites). The observers ensure that they are positioned to have an adequate,
clear view of the surrounding landscape (to the greatest extent possible) to maximise the ability of
observing all birds within the area. The details recorded during each survey include:
• date, time, site number, GPS co-ordinates, temperature, wind, general habitat description
• Bird observation records, including species, count (number of birds seen if possible), time
of observation, distance of bird/s to observer, flight height2, flight direction, other notes
where possible including habitat flown from/to, distance of flight, any other pertinent
observation on the sighting
A detailed summary of the survey methods is provided at Appendix D.
3.1.2 Raptor surveys
The raptor3 bird surveys includes a standardised truncated bird survey including a 30 minute point count
method similar to the passerine bird survey, but with an added 10 minutes of observation time to account
for the (generally) lower abundance of these species, as well as an added focus on the flight behaviour
(including a minor modification to the data sheet for recording height, direction, landscape etc). As with
the passerine surveys, the survey team spend a brief amount of time (approx. 15 minutes) together viewing
structures of a known height in order to try and calibrate their visual estimation of height.
The selection of site locations for the raptor surveys will utilise the control and impacts sites already
described. Areas where a strategic view is afforded (i.e. along ridgetops and not in deep and/or heavily
vegetated gullies) have been selected to the greatest extent possible, however, given that certain habitat
types (such as the River Red Gum) only occur within the gullies, it was inevitable that some survey sites
would require the location to be lower down in the gullies/valleys.
1 Passerine birds are defined by the arrangement of their toes and are sometimes known as perching birds or, less accurately, as songbirds.
2 Prior to the commencement of surveys, the survey team will spend a brief amount of time (approx. 15 minutes) together viewing structures of a known height in order to try and calibrate their visual estimation of height.
3 Raptors are birds of prey and include eagles, hawks, falcons and the like.

Bird and Bat survey Methods Silverton Wind Farm
16-412 Silverton Wind Farm Bird and Bat Survey Methods Report 7
3.1.3 Opportunistic Records
During the general driving and walking around the site (including movements into and out of the site from
public roads etc) opportunistic records of birds are recorded wherever possible.
3.1.4 Number and location of bird surveys:
A total of 48 sites are included in the survey as follows:
- 29 Passerine (10 Control and 19 Impact sites)
- 19 Raptor (8 Control and 11 Impact sites)
The number of surveys was derived from consideration of the overall area (ha) of the development
footprint, as well the variety of different vegetation types where the impacts would occur. The final
survey density was then derived by a combination of the overall area of the site, the number of
turbines and the total RSA of the development based on the number and design parameter of the
turbines, as follows
▪ Turbine type = GE Turbine (GE 3.43-130) with a diameter of 130m.
▪ Turbine RSA (single) = 13,273m2
▪ Total RSA for Stage 1 (58 Turbines) = 769,834m2
▪ Survey Density = one survey site per 16,038m2 of RSA
The survey density compares favourably with other bird and bat baseline surveys, including/such as
Boco Rock Wind Farm which had one survey site per 17,540m2.
The number and location of the passerine and raptor survey sites are the same as for the Summer
2016 surveys and are described in Tables 1 and 2 below and shown in the Survey Effort figure at
Appendix A.2.
3.1.5 Summary of Bird Utilisation Survey Effort
A summary of the overall bird survey effort for the collection of the baseline data is provided below,
including a summary of the survey effort within each habitat type across the study area. The same number
and location sites has been consistently applied across all survey seasons.
For the habitat types assessed, the following codes are used:
• MD = Mulga Dead Finish (open) woodland
• PG = Porcupine Grass sparse woodland
• RR = River Red Gum riparian woodland
• BB = Bluebush shrubland
Table 1 Passerine bird survey effort
Impact Control Total
MDF PG RR BB MDF PG RR BB
13 2 3 1 4 2 3 1 29

Bird and Bat survey Methods Silverton Wind Farm
16-412 Silverton Wind Farm Bird and Bat Survey Methods Report 8
Table 2 Raptor bird survey effort
Impact Control Total
MDF PG RR MDF PG RR
8 2 1 3 2 3 19
The overall stratification of the bird survey design, including the habitat type that each site is located
within, as well as the allocation of each site as either a Control Zone or Impact Zone site, is
summarised in Table 4.
3.1.6 Timing of Bird Surveys
As stated above, to account for seasonal difference, the baseline surveys will be conducted over
different seasons, including summer, autumn winter and spring. The table below details the survey
timing of the bird surveys (including an indication as to the current status of these surveys as being
complete or yet to be undertaken).
Table 3 Seasonal timing of bird surveys
Season Status
Summer
Completed
(December 2016)
Autumn*
Completed
(May/June 2017)
Winter*
Completed
(May/June 2017)
Spring
Completed
(October 2017)
Autumn
Not yet undertaken.
Scheduled for March (2018)
*Autumn and Winter were combined for the bird surveys given the generally low number of birds
expected to occur at this time of year. Future surveys are to separate these into distinct seasons. A
March 2018 survey will be conducted to add further Autumn data to capture possible migratory
species movements at that time of year.
It is expected that the future operational surveys would be conducted at a minimum during each
season independently, if not more regularly as determined in the BAMP.

Bird and Bat survey Methods Silverton Wind Farm
16-412 Silverton Wind Farm Bird and Bat Survey Methods Report 9
Table 4 Schedule of Survey Sites
Site No Passerine Raptor Control Impact HABITAT
1 P I MDF
2 P I RR
3 R I RR
4 R I MDF
5 P I MDF
6 R I MDF
7 P I PG
8 R I MDF
9 P I RR
10 R I MDF
11 P I MDF
12 P I MDF
13 P I MDF
14 R C PG
15 P C PG
16 P I MDF
17 P C MDF
18 R C RR
19 P C MDF
20 P C RR
21 R C MDF
22 P C MDF
23 P I MDF
24 P I MDF
25 R I MDF
26 P C RR
27 R C RR
28 R C MDF
29 R C RR
30 P C RR
31 P C BB
32 P I BB
33 R I MDF
34 P I MDF
35 P I MDF
36 P I MDF
37 P I MDF
38 P I MDF
39 P C MDF
40 P C PG
41 P I PG
42 P I RR
43 R I MDF
44 R C MDF
45 R C PG
46 R I PG
47 R I PG
48 R I MDF
TOTAL 29 19 18 30

Bird and Bat survey Methods Silverton Wind Farm
16-412 Silverton Wind Farm Bird and Bat Survey Methods Report 10
3.2 BAT SURVEYS
The bat survey scope has been updated from the completed Summer 2017 and Autumn/Winter 2017
surveys. Specifically, the survey locations have been revised to add new sites to increase the overall survey
area covered, and the survey methods have been amended to included bat surveys at the RSA height, as
has been discussed with OEH, and recommended by their expert review (M. Pennay, 2017).
The revised bat survey methods are explained further below. It is expected that this updated approach
will also form the basis of the future ongoing operational monitoring to be established under the BBAMP.
The specific survey methods to be employed as both once-off and ongoing survey monitoring include a
mixture of both trapping and passive call recording. Each survey method and the intended use of that
method is described further below.
3.2.1 Trapping
Generally, trapping will not be used as an ongoing survey method. However, given that there have been
some difficulties in obtaining conclusive positive species identification for some species, a once-off trapping
program is planned to coincide with the use of bat detectors. The physical capture and identification of
specimens at the same time that calls are being recorded will enable a more conclusive identification of
the species included in the call analyses (described further below).
Specifically, the species of interest with inconclusive call results to date and for which trapping will be
targeted include the following:
- Inland Forest Bat (Vulturnus baverstocki) or Little Forest Bat (V. vulturnus) (or both).
- Bristle-faced free-tailed bat (Mormopterus eleryi) or Little broad-nosed bat (Scotorepens greyi)
(or both).
- Corben's Long-eared Bat (Nyctophilus corbeni) or Lesser Long-eared Bat (N. geoffroyii) (or both).
Once the species have been confirmed, this survey method is no longer required and would not continue
as part of the ongoing operational monitoring of the wind farm.
A total of four trapping sites will be established (and potentially more if time/weather permit). One night
of trapping will be conducted at each site. The location of trapping sites will be finalised during the
establishment of the bat detectors to identify suitable sites based on the presence of habitat features
including hollow-bearing trees (roost/shelter habitat) and water (for foraging habitat). The trapping will
occur concurrently with bat detector survey work at the same location/time for comparison of call results
with trapping results.
3.2.2 Bat Detectors
The main survey technique to be employed for both the current baseline data collection as well as on an
ongoing operational monitoring basis is the use of passive bat call detection units, including both Anabat
and Songmeter units, utilising both Zero Crossing Analysis as well as Full Spectrum call file analysis.
The use of call detectors is well established in the current literature, and is a recognised survey technique
in both the NSW and Commonwealth survey guidelines (as applicable). Details on the efficacy of this
technique does not require further consideration, although it is noted that the use of call file numbers of a
species on any particular survey occasion (night), is not regarded as a good surrogate for estimating
population abundance (as only a small number of individuals can repeatedly fly around/near a detector
yielding a large number of call files, suggesting a much larger number of individuals than what is actually

Bird and Bat survey Methods Silverton Wind Farm
16-412 Silverton Wind Farm Bird and Bat Survey Methods Report 11
present). The use of bat detector call recording for determining presence/absence of species, particularly
if coupled with a trapping study as described above, is well accepted.
The overall scope and effort, including the total number and rational for siting of call detectors is described
further below.
Ground vs RSA level monitoring
A main critique of the work conducted to date for the baseline data collection has been the absence of
monitoring of bats flying within the Rotor Sweep Area (RSA). Given that bat species composition and
activity levels within the RSA may not be the same as those recorded at ground level, monitoring at RSA is
required.
One of the challenges to undertaking monitoring at RSA at the Silverton Wind Farm Project Area is that
only existing meteorological monitoring masts (Met Masts) are available for RSA level monitoring. There
are no other structures existing or proposed within or near the site that would enable mounting a bat
detector unit above a minimum required height of 35 m (lowest point of RSA). We explain further below
issues preventing the use of other potential options for RSA level monitoring.
In considering the use of the Met Masts, presently there are only 3 permanent meteorological monitoring
masts (Met Masts) within the Stage 1 (58 Turbine) Project Area available for use on an ongoing basis (Masts
MM1, MM2 and MM3, refer to the table below).
Other Met Masts that were used in the development of the project are no longer available for a number
of reasons, including mainly that the existing previous masts in the Stage 1 project area were established
for temporary use only, with the intention that they would eventually be replaced with permanent wind
monitoring masts, in different locations. Also some of the masts were established for wind monitoring for
other stages of the larger(unapproved) project which at this point in time are not being pursued, and those
masts are now located on properties that are not currently signed up to the (approved) project.
Consequently, there is no existing agreement between the landowner and the proponent to allow ongoing
access to these masts and they will also be removed. Furthermore, the distance from these other four
mast sites to the Stage 1 Project Area (more than 10km) means that any data gained from these site may
have limited application to the Stage 1 Project Area.
Other opportunities for establishing units at RSA level have been considered (i.e. helium weather balloons),
and these were found to be unsuitable for use at an operational wind farm (refer to responses to OEH
Expert
The locations of the Met Masts MM1, MM2 and MM3 that are able to be used for the baseline data
collection and subsequent operational monitoring are described in Table 5 below and shown also in the
Survey Plan accompanying this document.
Table 5 Met Mast locations for RSA level monitoring
MAST Easting Northing General Location Habitat Type
MM1 528825.6 6489040.8 Impact* MDF
MM2 520504.6 6482354.9 Impact MDF
MM3 524804.3 6479164.3 Impact* MDF
*Note: MM1 and MM3 are located outside the 500 m Impact Zone buffer, but not past the 1km buffer for the Control Zone. As these masts cannot be moved, they have been ascribed as Impact Zone sites.

Bird and Bat survey Methods Silverton Wind Farm
16-412 Silverton Wind Farm Bird and Bat Survey Methods Report 12
In summary, all three masts are located within the Impact Zone (noting that masts MM1 and MM3 are
located in the Intermediate Zone; i.e. the area between the 500m Impact Zone and the 1km buffer for the
Control Zone. For the purposes of this survey protocol, these sites be treated as Impact Zone monitoring
sites as neither the masts nor the turbines can be moved to allow location entirely within either Control or
Impact Zones.
For the RSA-level monitoring, the detectors will be mounted at approximately 65m height. Full-spectrum
records (i.e. Anabat Swift or songmeters) will be used for the RSA-level monitoring.
For the bat detector survey sites to be deployed at ground level only (discounting the fixed position of the
units to be deployed at about ground-level on met masts MM1, MM2 and MM3), there is greater flexibility
in the site selection process. However, site selection for these detectors was still limited by a sufficient
amount of available habitat within both the Control and Impact Zone areas of the site to allow a BACI design
to operate.
A description of the survey site selection of the ground-only bat detector monitoring, is described further
below. The general approach taken in developing this method is as follows:
i) Identify which vegetation communities constitute Priority Habitat to be targeted for sampling
ii) Identify which existing survey sites (from Summer 2016 and Autumn/Winter 2017) are suitable
as sites for repeatable ongoing sampling
In taking this approach, we have developed a consolidated list of survey sites that we propose are suitable
for use on an ongoing basis. We also make comment below on how the consolidated list of sites meets the
requirements for a sufficiently stratified BACI design, how they will meet the recommendations of the OEH
Expert Report as well as the requirements of the Commonwealth’s Survey guidelines for Australia’s
threatened bats (DEWHA 2010).
We list the (new and revised) survey sites in Table 7. Each site has been allocated a new numbering system
to be used from this point forward to avoid any confusion resulting from giving each survey site a number
related to the individual Anabat unit. The new numbering will relate to the site location and not the actual
bat detector unit number as has happened in the past. This includes going back to the previous Summer
2016 and Autumn/Winter 2017 surveys and revising the map and reports to use this new numbering so
that future comparisons between seasons/years at the same site can be more readily made.
Rationale for site selection
Identification of Priority Habitat Areas
As per the comments made in the OEH Expert Report (M. Pennay, 2017), the main focus of survey effort
should be toward Priority Habitat Areas. These Priority Habitat Areas are considered to be areas within
the suite that provide important habitat features for bats, and include areas of woodland with potential
for hollow-bearing trees (important for roosting habitat), as well as areas that support or are in close
proximity to water resources (both permanent and ephemeral). Areas that provide a propensity to support
both hollow-bearing trees as well as water are considered to be of the highest priority in terms of potential
bat habitat.
Note that given the very large size of the site, a detailed hollow-bearing tree survey has not been completed
for the project, and as such, the occurrence of hollow-bearing trees as part of a Priority Habitat Area is not
based on survey information, but on the likelihood of hollows, inferred from the observed vegetation
structure and composition of various vegetation community types mapped across the site.

Bird and Bat survey Methods Silverton Wind Farm
16-412 Silverton Wind Farm Bird and Bat Survey Methods Report 13
Note also that whilst some (generally) permanent water resources are known to occur within the project
site (mainly Umberumberka Reservoir, and a large farm dam in the southeast corner (at the location of
Anabat Unit AE-6 from the Autumn/Winter 2017 survey period)), all potential water resources within the
site have not been formally mapped (as either permanent or ephemeral). Whilst it is likely that the larger
stream orders are likely to contain water from time to time, including larger pools where water may occur
on a more permanent basis, this has not been specifically assessed or mapped. As such, targeting water
resources for deployment of bat detectors may not result in consistent repeatable sampling with respect
to habitat availability, as a large inundated pool section of a stream in one season/year may be completely
dry during other seasons/years.
A summary of the occurrence of Priority Habitat Areas within the site based on the existing vegetation
mapping is given in the table below.
Table 6 Identification of Priority Habitat Areas within the site
Vegetation
Community Type
Habitat features for bats Priority
Habitat?
Mulga Dead Finish
woodland
Contains some limited water resources (a single recorded farm dam as well as ephemeral stream gullies not supporting River Red Gum riparian woodland). Low potential for hollow-bearing trees given dominant tree species is Mulga (Acacia aneura) which typically does not readily form hollows.
Generally in poor condition with disturbance from grazing/browsing.
Given extensive occurrence (circa 90% of total site area), with some potential for hollow-bearing trees and water resources, and likely to be foraging habitat, this habitat type has been identified as Priority Habitat.
Yes
Mulga/Red Mallee
shrubland
Generally devoid of any water resources. Some potential for hollows to be present within Red Mallee trees (Eucalyptus socialis) that may be used as roost sites. Is limited to some (relatively small) patches in the northeast of the site.
Yes
Porcupine Grass
(Spinifex) sparse
woodland
The Porcupine Grass spares woodland contains scattered Red Mallee/Gum-barked Coolibah trees (E. intertexta), which have been observed to contain smaller spout-hollows which are often favoured by small microbat species. No obvious water resources in these areas.
Yes
Prickly Wattle
shrubland
Very small occurrence within site, limited mainly to smaller first and second order drainage lines. May contain some temporary water resources during periods of high rainfall, though pools of water unlikely. Highly unlikely to support any tree hollows.
No
River Red Gum on
rocky creeks
Very small occurrence within site, limited mainly to smaller first and second order drainage lines. May contain some temporary water resources during periods of high rainfall, though pools of water unlikely. Contains mature River Red Gum trees, therefore likely to support tree hollows.
Note that this vegetation type is regarded as constituting essentially the same habitat type for bats as the River Red Gum Woodland
Yes

Bird and Bat survey Methods Silverton Wind Farm
16-412 Silverton Wind Farm Bird and Bat Survey Methods Report 14
vegetation unit below, typified by large River Red Gum trees along low-lying valley floors and larger gullies.
River Red Gum
woodland
Occurs along large drainage lines, including (generally) third order streams and above. Likely to support ephemeral water resources and also contains mature River Red Gum trees, therefore likely to support hollow-bearing trees.
Yes
Black Bluebush
shrubland
This vegetation community is characterised by low shrubs, and generally devoid of mature trees. Although mapped in areas close to River Red Gum riparian zones, this community often commences once the riparian zone influences end, and as such there is very low potential for hollow-bearing trees, and limited water resources (with the drainage gullies where the water occurs likely to support either River Red Gum woodland or Prickly Wattle shrubland).
This community does not occur at or near any turbines.
No
Black Oak woodland This woodland occurs in very small patches, and has not been mapped within the project area as occurring in a patch size greater than a few hectares. Woodland areas may support hollows, but given small sporadic occurrence, no mappable habitat areas of this vegetation community type occurs within the Stage 1 58 turbine project area. As such, it is not possible to survey within this vegetation type within the Impact Zone.
Yes (but doesn’t occur within the site)
Bluebush shrubland This vegetation community is characterised by low shrubs, with only minimal scattered trees, and consequently there is considered to be very low potential for hollow-bearing trees to occur in these areas.
Although mapped in areas close to River Red Gum riparian zones, there are no identified water resources within this community (with the nearby drainage gullies likely to support River Red Gum).
This community does not occur at or near any turbines.
No
Chenopod (Saltbush)
shrubland
This vegetation community is characterised by low shrubs, with only minimal scattered trees, and consequently there is considered to be very low potential for hollow-bearing trees to occur in these areas.
This vegetation community occurs in a broad swathe across lands to the south-east of the Project Area, including on lands surrounding ephemeral water courses, but does not extend into (or within 1km of) any of the turbine sites
No
Chenopod – Red
Mallee
woodland/shrubland
This vegetation community is characterised by a mix of predominantly low shrubs with scattered to continuous Mallee trees. There is some potential for hollows to be present in the Mallee trees which may be used as roost sites.
This vegetation community occurs in patches to the east of the Project Area, but does not extend into (or within 1 km of) any of the turbine sites. Also, this community does not appear to support any notable water courses (although very minor unnamed stream order 1 gullies may be present).
Yes (but doesn’t occur within the site)
In summarising the table above, the following Priority Habitat Areas are considered to occur at the site:
- Mulga Dead Finish
- Mulga/Red Mallee Shrubland
- Porcupine Grass (Spinifex) sparse woodland
Bird and Bat survey Methods Silverton Wind Farm
16-412 Silverton Wind Farm Bird and Bat Survey Methods Report 15
- River Red Gum on rocky creeks
- River Red Gum woodland
- Black Oak Woodland
- Chenopod – Red Mallee Woodland/Shrubland
When considering the appropriate number of survey sites to be established within the Priority Habitat
Areas, it is important to note again that this survey program has been designed as a BACI survey with the
aims of observing changes over time in the bird and bat species utilisation and associated impacts from
operation of the Silverton Wind Farm. As a BACI survey design, it is therefore imperative that all aspects
of the proposed survey are repeatable so as to allow collection of data both Before and After the
commencement of operation of the wind farm, as well as to obtain data from both Control and Impact
sites. The OEH Expert Report notes specifically that:
at a minimum it would be expected that at least 2 sites (1 impact & 1 control) would be sampled in
each high priority community …. There are 5 vegetation communities with trees/shrubs reaching >
5m height. If each of these communities is sampled with a control and impact site the total minimum
effort required to produce a meaningful result would be 5 communities x 2 conditions
(control/impact) x 2 detectors x 4 nights = 80 detector nights per season. Plus, an additional 8
detector nights for other sites selected to capture spatial variability and other priority areas such as
wetlands.
As a guide, the Commonwealth threatened bat survey guidelines recommend sampling at a rate of
16 detector nights per 50 ha
The main issue with compliance the above comment is the (incorrect) assumption that all priority habitat
areas occur both within the Control and Impact Zones as established for this survey program. It is noted
that the only vegetation communities identified as Priority Habitat Areas and that have been mapped as
occurring within both the Impact Zone (i.e. within 500m of a proposed turbine site) and Control Zone (i.e.
more than 1km from a proposed turbine), and which support a large enough patch size in each zone to
establish at least 2 Control and Impact Zone survey sites include the following:
- Mulga Dead Finish (MDF)
- Mulga/Red Mallee Shrubland (MRM)
- Porcupine Grass (Spinifex) sparse woodland (PG)
- River Red Gum (includes both the River Red Gum Woodland and River Red Gum on Rocky Creeks
mapped vegetation units) (RRG).
In order to achieve a properly implemented BACI survey, only these areas of the site can therefore be
surveyed on an ongoing basis to allow both Control and Impact site data collection. Based on this scenario,
the total extent of habitat of each of these areas within the Impact (and Control) Zones is summarised in
Table 8 below.
Identification of existing survey sites suitable for ongoing use as repeatable survey sites
We have reviewed the existing survey sites from the Summer 2016 and Autumn/Winter 2017 survey
periods in the context of the comments included in the OEH Expert Report to determine which of these
sites are adequate for continued use in the survey program moving forward. In particular, the existing sites
to be kept were assessed on the basis of the following criteria:
- Location within either the Impact or Control Zone (i.e. sites located in the “intermediate zone”,
being the area >500 m from a proposed turbine, but <1 km where the Control Zone boundary
occurs are not to be continued)

Bird and Bat survey Methods Silverton Wind Farm
16-412 Silverton Wind Farm Bird and Bat Survey Methods Report 16
- Quality of data already collected (for example, the site SM2 from the Autumn/Winter 2017
survey did not record any bats, and so there is no existing data from this location that would
facilitate future comparative analysis that would make this site worthwhile keeping)
- Location in the landscape in terms of achieving adequate coverage of different habitat areas to
meet the requirements for a stratified design with sufficient sites to allow a statistically
meaningful result
Given the above considerations, the existing survey sites that are proposed to be kept for ongoing
monitoring are detailed in Table 7 below.
Table 7 Existing sites to be kept for ongoing monitoring (including sites where a minor relocation is required)
Summer 2016 Site
No.
Autumn/Winter
2017 Site No.
Control/Impact
site
Habitat Type Rationale
Retained Sites
A1-A
n/a
(close to paired unit AE-5b)
IMPACT MDF
Kept as useful for replication and existing baseline data
(new site number BD8).
A4-B SM1 IMPACT MDF Kept as useful for replication
and existing baseline data (new site number BD4).
n/a AE-5a CONTROL MDF Kept as useful for replication
and existing baseline data (new site number BD6).
A3-B AE-4 IMPACT RRG
Kept as useful for replication and existing baseline data (new site number BD12).
Next to waterbody and likely HBTs.
Minor Relocated Sites
A2-A AE-2 CONTROL RRG
Previously in “Intermediate Zone”. Minor relocation, approx. 150-200 m from
current site, to Control Zone (new site number BD9). Next to waterbody and likely HBTs
within RRG habitat type.
A4-A AE-3 IMPACT RRG
Previously in “Intermediate Zone”. Relocation, approx. 2
km E from current site, to Impact Zone (new site
number BD10). Next to waterbody and likely HBTs, and remaining within same
RRG habitat type.
A1-B AE-1 CONTROL RRG
Previously in “Intermediate Zone”. Minor relocation approx. 300m from current site to Control Zone (new site number BD11).
Bird and Bat survey Methods Silverton Wind Farm
16-412 Silverton Wind Farm Bird and Bat Survey Methods Report 17
Next to waterbody and likely HBTs.
As can be seen from the table above, there are four (4) existing sites that were found to be suitable to
retain for ongoing monitoring. Three (3) of these are located within the MDF habitat type (including two
Impact and one Control site), and the fourth is located within the Impact Zone of the RRG habitat type. In
addition to these, there are another three (3) sites that, if relocated to nearby areas (but outside of the
“Intermediate Zone”) would be suitable to retain for ongoing monitoring. All three (3) sites are located
within the RRG habitat type, and includes two (2) Control Zone sites and one (1) Impact Zone site.
3.2.3 Final survey sites for ongoing monitoring
Based on the above considerations in terms of the distribution of Priority Habitat Areas, as well as having
consideration for the ability to establish survey sites within both Impact and Control Zones (to achieve a
BACI design), and in attempting to keep/re-use suitable existing survey sites where possible, we have
identified 20 suitable survey sites to be established to achieve a robust stratified design. The proposed
survey sites to be implemented from this point in time and going forward are described in Table 8 below,
including identification of new site numbering to be used from this point forward.

Bird and Bat survey Methods Silverton Wind Farm
16-412 Silverton Wind Farm Bird and Bat Survey Methods Report 18
Table 8 Proposed final survey sites
(New) Survey
Site No.
Old Site No.
(2016 / 2017)
Proposed Location – Description
Control/Impact
site
Habitat Type Near Water
Resource?
Paired Unit
MULGA DEAD FINISH
BD1A N/A - New Met Mast MM1 – Ground mounted unit (mounted @2-3m height IMPACT^ MDF No BD1B &
BD13/14
BD1B N/A - New Met Mast MM1 – RSA mounted unit (mounted @65m height) IMPACT^ MDF No BD1A &
BD13/14
BD2A N/A - New Met Mast MM2 – Ground mounted unit (mounted @2-3m height IMPACT MDF No BD2B & BD5
BD2B N/A - New Met Mast MM2 – RSA mounted unit (mounted @65m height IMPACT MDF No BD2A & BD5
BD3A N/A - New Met Mast MM3 – Ground mounted unit (mounted @2-3m height IMPACT^ MDF No BD3B & BD6
BD3B N/A - New Met Mast MM3 – RSA mounted unit (mounted @65m height IMPACT^ MDF No BD3A & BD6
BD4 A4-B / SM1 Ground-mounted unit in same location as previous site A4-B/SM1. IMPACT MDF No BD5 & BD6
BD5 N/A - New Ground-mounted unit approx. 500m N of bridge over
Umberumberka Reservoir
CONTROL MDF No BD4
BD6 n-a / AE-5a Ground-mounted unit in same location as previous site AE-5a CONTROL MDF No BD8 & BD3A
BD7 N/A - New Ground-mounted unit located approx. 1km NE of MM1. CONTROL MDF No BD1A
BD8 A1-A / AE-5b Ground-mounted unit located near T51 IMPACT MDF No BD6
RIVER RED GUM WOODLAND
BD9 A2-A / AE-2* Ground-mounted unit. Relocation of previous A2-A/AE-2 site
approx. 2.5 km E to Control Zone, but staying within RRG along edge
of Umberumberka Reservoir
CONTROL RRG Yes BD10
BD10 A4-A / AE-3* Ground-mounted unit. Relocation of previous A4-A/AE-3 site
approx. 2 km E to Impact Zone, but staying within RRG (on rocky
creeks) along tributary of Umberumberka Reservoir arm/branch
IMPACT RRG Yes BD9
BD11 A1-B / AE-1* Ground-mounted unit within RRG. Relocation of previous A1-B/AE-
1 site approx. 300m North or 600m south to within Control Zone,
but staying within RRG. To be chosen/micro-sited for either/both
HBT & pool section
CONTROL RRG Potential BD12

Bird and Bat survey Methods Silverton Wind Farm
16-412 Silverton Wind Farm Bird and Bat Survey Methods Report 19
BD12 A3-B / AE-4 Ground-mounted unit within RRG. Re-use of existing site A3-B/AE-
4. Micro-sited for either/both HBT & pool section
IMPACT RRG Yes* BD11
MULGA/RED MALLEE SHRUBLAND
BD13 N/A - New Ground-mounted unit within small patch of MRM approx. 2 km W
of Turbine T23. Micro-sited for HBT if possible
CONTROL MRM No BD14
BD14 N/A - New Ground-mounted unit within small patch of MRM immediately W
of Turbine T24. Micro-sited for HBT if possible
IMPACT MRM No BD13
BD15 N/A - New Ground-mounted unit within small patch MRM immediately S of
Turbine T22. Micro-sited for HBT if possible
IMPACT MRM No BD22
BD16 N/A - New Ground-mounted unit within small patch MRM approx. 1.5km E of
Turbine T10. Micro-sited for HBT if possible
CONTROL MRM No BD21
PORCUPINE GRASS (SPINIFEX) SPARSE WOODLAND
BD17 N/A - New Ground-mounted unit within PG, approx 500 m E of bird survey
sites R44.
CONTROL PG No BD18
BD18 N/A - New Ground-mounted unit within PG, near bird survey sites P35/R46
(near Turbine T33).
IMPACT PG No BD17
BD19 N/A - New Ground-mounted unit within PG, approx 1.5 Km E of bird survey
sites R44.
CONTROL PG No BD20
BD20 N/A - New Ground-mounted unit within PG, near Turbine T34. IMPACT PG No BD19
*=Sites that are relocated to nearby new sites (but within same habitat type, and generally, moved less than 200m from current location)
^=Sites BD1A/BD1B & BD3A/3B, established on Met Masts MM1 and MM3 respectively, are actually located in the “Intermediate Zone”, between the Control and Impact Zone buffers. As the Met Mast cannot be moved, these sites have been ascribed as Impact Zone sites.
BD = Bat Detector
Bird and Bat survey Methods Silverton Wind Farm
16-412 Silverton Wind Farm Bird and Bat Survey Methods Report 20
In summarising Table 8 above, we note the following survey stratification is achieved:
- There are a total of three (3) paired units at RSA and ground level. All of these are defined as
occurring within the Impact Zone – though noting two of these are in the “Intermediate Zone”.
There are no other existing structures within the project area that units can be attached to for RSA
level monitoring.
- RSA-level detectors will be mounted to permanent met masts at a height of 65m.
- There are a total of eight (8) sites within the Mulga Dead Finish (MDF) habitat type. This includes
5 x Impact sites and 3 x Control Sites.
- There are a total of four (4) sites within the River Red Gum (RRG) habitat type. This includes 2 x
Impact sites and 2 x Control Sites. All Impact and Control sites are paired with a nearby detector
(generally less than 1 km away) in the same habitat type but within the differing control/impact
zone.
- There are a total of four (4) sites within the Porcupine Grass Sparse Woodland (PG) habitat type.
This includes 2 x Impact sites and 2 x Control Sites. All Impact and Control sites are paired with a
nearby detector (generally less than 1 km away) in the same habitat type but within the differing
control/impact zone.
- There are a total of four (4) sites within the Mulga/Red Mallee Shrubland (MRM) habitat type. This
includes 2 x Impact sites and 2 x Control Sites. All Impact and Control sites are paired with a
detector (although only one can be paired with a detector within about 1 km away, the other
survey opportunities for Control and Impact sites in this habitat type prevents pairing with a nearby
detector).
- Bat detectors will be micro-sited at each location to be close to a Hollow-bearing Tree (HBT) if
present/available, and/or any areas of pooled/standing water if present/available.
- There are a total of six (6) sites that have potential to be located next to a water resource. Two (2)
of these are located next to a relatively permanent water source (i.e. Umberumberka Reservoir).
The other four (4) sites could potentially be located next to a pool section along the stream gullies
in the RRG habitat. However, given the ephemeral nature of these watercourses, it cannot be
guaranteed that they will always be located next to available water throughout all seasons and
across all years of the monitoring program.
- In total, across the entire study area there 11 Impact and 9 Control sites.
- The project will involve the deployment of a total of 23 Bat Detectors at 20 “sites” (noting that 3
sites will require two paired detectors for RSA and ground-level monitoring at Met Masts)
- Bat detectors at each site will be deployed for a minimum of 4 (consecutive) nights. As such, the
total survey effort is 92 detector nights for this and each subsequent survey occasion.
- For paired sites, the same unit type will be used (i.e. Songmeters are to be paired with
Songmeters and Anabats are to be paired with Anabats)
- The use of each detector type per site will be determined based on resourcing for the upcoming
November survey, however it is expected that full spectrum analysis units will be used for the
ground and RSA level monitoring at the Met Masts. Once finalised, the use of each detector type
per Met Mast site will become enshrined in the BBAMP. For other ground-only monitoring sites,
replication of the unit type for each site will be performed to the greatest extent possible.
- As we (or any other consultant that we know) do not have 23 bat detectors available at any one
time, it is likely that the survey period will be divided into 2 x 4 night survey periods, with
detectors used in the first 4-night period to be collected and redeployed for the second 4-night
period. Therefore, it will be impossible to achieve data collection for all sites at exactly the same
time.
Bird and Bat survey Methods Silverton Wind Farm
16-412 Silverton Wind Farm Bird and Bat Survey Methods Report 21
In order to confirm the overall level of survey effort, the mapped extent of each community within the
project area is summarised in Table 9 below.
Table 9 Summary of survey effort (number of sites per hectare of habitat type)
Vegetation Type Number of
Turbines
Area in
Impact Zone
(500m radius)
Number of Survey
Sites (Impact &
Control)
Survey Density
(# survey sites /
ha)
Mulga Dead Finish 57 2744.05 ha 8 1/343 ha
Mulga/Red Mallee Shrubland 0 23.68 4 1/6 ha
Porcupine Grass (Spinifex) sparse woodland
1 108.57 4 1/27.1 ha
River Red Gum Woodland + River Red Gum on rocky creeks
0 15.36 4 1/3.8 ha
Prickly Wattle Shrubland 0 47.3 0 0.0
Black Bluebush Shrubland 0 4.21 0 0.0
Bluebush Shrubland 0 0.64 0 0.0
Black Oak Woodland 0 0.0 0 0.0
Total 58 2943.81 20 1/147.2 ha
3.2.1 Timing of Bat Surveys
As stated above, to account for seasonal difference, the baseline surveys will be conducted over
different seasons, including summer, autumn winter and spring. The table below details the survey
timing of the bat surveys (including an indication as to the current status of these surveys as being
complete or yet to be undertaken).
Table 10 Seasonal timing of bat surveys
Season Status
Summer
Completed
(December 2016)
Autumn*
Completed
(May/June 2017)
Winter*
Completed
(May/June 2017)
Spring
Not yet undertaken
Scheduled for November 2017)
Autumn
Not yet undertaken.
Scheduled for March (2018)
*Autumn and Winter were combined for the bat surveys given the generally low number of birds
expected to occur at this time of year. Future surveys are to separate these into distinct seasons.

Bird and Bat survey Methods Silverton Wind Farm
16-412 Silverton Wind Farm Bird and Bat Survey Methods Report 22
A March 2018 survey will be conducted to add further Autumn data to capture possible migratory
species or other seasonal movements at that time of year.
It is expected that the future operational surveys would be conducted at a minimum during each
season independently, if not more regularly as determined in the BAMP.

Bird and Bat survey Methods Silverton Wind Farm
16-412 Silverton Wind Farm Bird and Bat Surveys A-I
APPENDIX A SURVEY PLAN

Bird and Bat survey Methods Silverton Wind Farm
16-412 Silverton Wind Farm Bird and Bat Surveys I
APPENDIX B RESPONSES AGAINST EXPERT REPORT
RECOMMENDATIONS

Bird and Bat survey Methods Silverton Wind Farm
16-412 Silverton Wind Farm Bird and Bat Surveys B-I
X
OEH (Expert) Recommendation Response Responsibility
4.1 RECOMMENDATIONS TO IMPROVE THE RISK ASSESSMENT:
1. Mormopterus eleryi and Nyctophilus corbeni
should be added to the risk assessment. The site
should be surveyed for Mormopterus eleryi and
Nyctophilus corbeni to confirm if present or not.
- The species-specific Risk Assessment table in the BBAMP is to be updated to
include consideration of these species.
- The baseline surveys (as well as future ongoing operation monitoring surveys) will
include consideration of these two species. The current use of bat detectors (as
updated for the Spring 2017 survey period) will address the survey requirements
for these two species, and the call file analysis (performed by an independent
expert) will be briefed to ensure that they are aware that these 2 species are to be
considered (including use of appropriate call references for confirming
presence/number of calls at the site). This will be supported by a trapping study to
be conducted to confirm species identification for those species whose calls are
unable to be confidently determined (see response to recommendation 4.2 (1)).
- E&HP to update
BBAMP
- NGH to
implement
baseline data
collection and
brief expert
conducting call
file analysis
2. The risk status for all species should be
reviewed given 29.5m above ground is not
considered ‘high’ in terms of bat flight for most
species. S. flaviventris, M. eleryi, C. picatus forage
in and above canopy, they readily fly at 29.5m or
above – and should be classified as high risk of
collision. V. baverstocki and N. corbeni are likely
to fly above 29.5m at times but most frequently
forage within or below canopy height so could
probably be classified as moderate risk of
collision.
- Noted. The species Risk Assessment table in the BBAMP is to be updated to revise
the risk status of relevant species identified by the OEH Expert Report.
NOTE: No (other) change to the baseline data survey methods is specifically required by
this recommendation (with the exception of conducting RSA height monitoring as
discussed elsewhere to confirm species flying at RSA height)
- E&HP to update
BBAMP
Bird and Bat survey Methods Silverton Wind Farm
16-412 Silverton Wind Farm Bird and Bat Surveys B-II
3. Emphasis for bat monitoring should focus on
representative sampling of sites in, adjoining or
near to vegetation communities with trees or
water sources (including ephemeral).
A detailed consideration of survey site selection is included in the document above, and
describes where and how sites have been selected to achieve stratification across
habitats, including achieving both Control and Impact sites. From this, it can be seen
that there are a number of sites located in the River Red Gum community, which
includes sites next to the Umberumberka Reservoir, as well as section along the
larger/higher stream order that are likely to support water from time to time (noting
that these streams are predominantly ephemeral and likely to contain water on an
infrequent basis. Notes have been included in the updated design to inspect the stream
to try and identify areas where larger pools of water are likely to form). An existing farm
dam (the only dam known in the Project Area) has also been identified and will be
targeted for ongoing monitoring.
With regard to hollow-bearing trees, a detailed hollow-bearing tree survey has not been
completed for the site. When establishing new survey sites (or minor relocations of
existing sites), attempts will be made to find nearby hollow-bearing trees and bat
detectors will be deployed at these sites. It is noted that the highest proportion/density
of hollow-bearing trees is likely to be within the River Red Gum areas, with only sporadic
occurrences outside of these areas in the Porcupine Grass Sparse Woodland (PG) and
Mulga Dead Finish (MDF) and Mulga/Red Mallee Shrubland (MRM).
Note that it is not possible for all potential habitat types (possibly) containing hollow-
bearing trees to be surveyed, due to restrictions associated with establishing both
Control and Impact sites. For example the River Red Gum on Rocky Creeks, Black Oak
Woodland, and Chenopod – Red Mallee woodland/shrubland do not have any mapped
areas extending into the Impact Zone of the site, and therefore cannot be surveyed
under a BACI design.
NGH
4.2 RECOMMENDATIONS TO IMPROVE THE SURVEY DESIGN

Bird and Bat survey Methods Silverton Wind Farm
16-412 Silverton Wind Farm Bird and Bat Surveys B-III
1. To strengthen the conclusions of acoustic
sampling results. Trapping / netting should be
undertaken to confirm;
a) if V. baverstocki or V. vulturnus (or both) are
present at the site.
b) if Mormopterus eleryi or Scotorepens greyi (or
both) are present at the site. c) if N. corbeni is
present at the site (N. geoffroyii almost certainly
is).
Noted. A single trapping study is proposed to be undertaken to confirm which species
occur at the site. This will be undertaken concurrently with the Spring bat detection
study to confirm species identification in the call analyses.
This method is not required on an ongoing basis as part of the BACI design for monitoring
of wind farm impacts (it is purely to confirm species identification) and therefore, will
only be conducted once and will not be continued as an ongoing survey monitoring
technique.
Trapping will be completed in late November 2017 and concurrently with the bat
detector survey.
NGH
2. To understand bat activity in the rotor sweep
area it is recommended paired bat detectors be
set to record at lowest rotor sweep height (e.g c.
30-35m) and ground level. Detectors could be
mounted on Met towers, turbine towers or other
structures. If towers are not available within
priority locations tethered helium balloons may
be used.
We have 3 available Met Masts for use for mounting bat detectors at RSA level within
the Stage 1 (58 Turbine) Project Area (Masts MM1, MM2 and MM3). These are detailed
in the survey methods document above. It is noted that all 3 masts are located on
ridgelines within the Mulga Dead-Finish habitat type, and are located within the Impact
Zone, although 2 of these Masts MM1 and MM3 are located in the Intermediate Zone
(>500m but <1 km from turbine location).
There are no existing masts or other suitable structures within the Project Area in any
habitat type.
Other masts located in the project area (SLV1, SLV5 and SLV7) as well as others located
outside of the project area (several km’s from nearest turbines) that have been
investigated for use as well. All of these masts are temporary development masts and
are to be decommissioned.
The main problem with meeting this requirement in full (i.e. achieving RSA level
monitoring in a BACI design and across all Priority Habitat Areas) is the lack of any
structure of any type within any other habitat type in the broader Project Area that could
be used for monitoring at RSA height. In particular, the main priority habitat area for
bats is considered to be within the River Red Gum woodlands which is restricted to the
lower-lying gullies. No masts or turbines will be proposed in these habitats that could

Bird and Bat survey Methods Silverton Wind Farm
16-412 Silverton Wind Farm Bird and Bat Surveys B-IV
allow for future ongoing monitoring. Further, only a very small amount of this habitat
actually occurs within 500m (i.e. within the Impact Zone) of any turbine.
We have also investigated a number of options for establishing RSA level bat detectors,
with no suitable outcome achieved. Options considered include towing a large
telescopic tower from more than 600 km away, at significant ongoing cost (as it will need
to be repeated), but also is limited in that it must remain on flat terrain, and also, has
wind speed loadings of 40 km/hr at heights of more than 40 m. The cost and limitations
of this method means that it is clearly not feasible as an ongoing monitoring option.
Regarding establishing new/additional Met Masts, given there are only 3 permanent
met masts in the area (with the previous development masts to be removed), there is
no requirement by the client to install additional masts for wind speed monitoring.
Further, the cost of such structures mean that it is not a feasible option to build more
met masts .when not required
With regard to helium balloons – this has been considered however a number of
problems are associated with this method at the site. Because the site is typically very
windy (hence location for a wind farm), it will be difficult to ensure that the balloons
remain at a constant height during strong winds, with the risk that they could be pushed
back toward the ground. The other significant issue is the ability to undertake this on
an ongoing basis during the operational phase of the windfarm. This method presents
a substantial risk to the turbines should a balloon become untethered and float into and
become entangled in the rotor blades which could then damage the turbine rotors.
Because of these issues, this method has been discounted as a safe and reliable option
for repeated use, and if not repeatable, it cannot be used in a BACI design.
We have also had discussions with the proponent about the feasibility of installing bat
detectors on newly constructed turbines, and prior to their commencement of
generating electricity (i.e. fully operational stage). This also has limitations as the blades
would need to be mechanically braked (whereas normally they would be free-spinning
until the generators are fully operational). The use of these brakes places strain on the

Bird and Bat survey Methods Silverton Wind Farm
16-412 Silverton Wind Farm Bird and Bat Surveys B-V
rotor gears, as well as increased flex of the blades, and so is only suitable for short
periods of time, before it starts to have an impact on the equipment. A period of 4
consecutive nights of full braking of the equipment is potentially too risky to very
expensive equipment. It is therefore not likely that this method will be repeatable over
time. Further almost all of the turbines (>90%) are located within the same Mulga Dead
Finish habitat type, and so this approach would not necessarily solve the problem of
having monitoring in other priority habitat areas. The only other habitat types that
turbines will be located in are the Bluebush (Saltbush) shrubland, and Porcupine
Grass/Spinifex grassland/open woodland. Neither of these are considered Priority
Habitat Areas, given the general lack of larger hollow-bearing trees, although it is
possible that bats may forage in these parts. If anything, bat use is likely to be higher in
the Mulga woodland given the greater structural diversity of the woodland compared
to the grassland and shrubland habitats.
Based on the above consideration, the obvious key point that becomes apparent in the
BACI survey design is what is achievable as an ongoing and regular monitoring option.
The sites regarded as suitable for bat detection on an ongoing basis are identified in
report above, and have been selected on this premise and the limitations outlined
above.
3. If it is impossible to sample in the rotor sweep
area for all sites, at a minimum paired sampling
of ground based and rotor sweep area detectors
should be undertaken and analysed, the results
could then be extrapolated to inform ground
based sampling.
Noted and agreed. It will not be possible to sample at RSA height in all priority habitat
areas. Ground mounted bat detectors will be established in these areas as shown in the
proposed survey plan, and results will be extrapolated as proposed in response below
on statistical approaches.
NGH
4. The BACI design requires greater clarification;

Bird and Bat survey Methods Silverton Wind Farm
16-412 Silverton Wind Farm Bird and Bat Surveys B-VI
a. The metric(s) used should be defined –
suggest species occurrence (present or not)
and abundance (measured by the surrogate
‘activity’ defined as total # call passes per
species per sample).
To date, we have provided the overall number of call files recorded as well as reported
on the number of call files for threatened species. Other species not identified as being
threatened or at risk were recorded simply on an occurrence basis.
All historic call files could be re-analysed to provide the number of calls per species per
sample. It is suggested that this should occur after the trapping study has been
conducted to determine species will difficult call interpretation, as stated above.
NGH (with Glenn
Hoye to re-analyse
data)
b. The thresholds for adaptive management
should be explicit, at what point should
something happen. Suggest that at a minimum
this be if a species occurrence or abundance
has declined at an average rate of 3% / yr (this
equates to the IUCN criteria of 30% decline
over 10 years) that adaptive measures be
triggered.
This is a matter to be addressed in the BBAMP. It does not otherwise specifically affect
survey method. As stated above, the number of calls per species per sample can be
completed and this will provide a base for identifying declines in occurrence or activity.
E&HP
c. The number and stratification of sites should
be clearly enunciated. Sites should adequately
sample identified priority areas based on risk
and representative of the spatial heterogeneity
of the site. The number of sites should be
informed by statistical power analysis.
The number and stratification of sites is clearly explained in the survey methods
document above.
Site selection has been based on identification of Priority Habitat Areas, as well as the
spatial distribution of these habitats to enable surveying within both Control and Impact
zones.
The overall distribution of bat survey sites across the Project Area is detailed in the
survey effort plan (Appendix A). From this, it can be seen that a broad portion of the
overall wind farm area is covered.
There will be a minimum of 23 bat detector survey sites across the identified priority
habitat areas, with detectors to record for 4 nights at each site. A total of 92 detector
NGH

Bird and Bat survey Methods Silverton Wind Farm
16-412 Silverton Wind Farm Bird and Bat Surveys B-VII
nights will therefore be achieved. This number is regarded as sufficient to enable
adequate statistical analysis.
d. Sampling of Control and Impact sites should
be paired e.g each stratified control site should
have a paired site in the same strata in impact
zone (unless there is a good experimental
design reason why not to) the effort at paired
sites should be consistent and matched across
seasons.
Noted. All proposed sites have been paired based on either:
- RSA level sites are directly paired with a ground-mounted unit in the
same location (at Met Masts).
- All (other) sites are paired with a Control and an Impact site located in
the same habitat and (generally) within about 1 km of each other.
NGH
e. Sites should not be located in indeterminate
zones (eg >500m and less than 1km from a
turbine) this is just confusing and messy.
Noted, existing sites in these areas will be moved as required to either within the 500m
radius line of a turbine for the Impact Zone or beyond the 1 km area for the Control
Zone.
Note that this is not possible in relation to met masts MM1 and MM3.
f. Unless there is a good reason to vary site
pairs should stay the same across seasons. If
the site location varies, at a minimum the strata
and CI status should be consistent.
A Total of 4 units will be deployed at the same site as previous surveys, with a further 3
units to be relocated nearby (i.e. within 200m) to an existing site from the previous
surveys.
It is intended that all proposed survey sites in this document will be repeatedly surveyed
during each season from this point in time onward.
5. Survey effort needs to be consistent and
capable of producing statistically meaningful
results;
Noted. As stated in the document above, we have consulted with Symbolix on the
revised survey and the survey effort and design is considered adequate for determining
impacts of the wind farm operation on bat species.
a. Power analysis should inform the number and
duration of sampling to detect trends over a
reasonable time. If the effort is less than 2
The revised survey plan will have at least 4 detectors in each habitat type (including at
least 2 detectors in either the Control or Impact Zones), and will be deployed for at least
4 nights per season/survey occasion.

Bird and Bat survey Methods Silverton Wind Farm
16-412 Silverton Wind Farm Bird and Bat Surveys B-VIII
detectors for 4 nights per site /season this will
need to be explained in detail.
The overall survey effort will involve 23 detectors deployed for 4 nights each, equating
to a total of 92 detector nights.
Given this survey effort is to be repeated for each season/survey occasion going
forward, this will allow adequate statistical power to identify impacts over time.
b. The recommended survey effort needs to be
clearly enunciated
The updated survey effort is clearly explained in the survey methods document above.
c. Survey effort should be consistent between
site pairs (control /impact) and across seasons so
that comparisons can be readily drawn.
The latest survey plan shows that all sites now are sensibly located as pairs in similar
habitats but between control and impact zones, and generally are located within about
1 km of each other (noting that a paired site cannot be closer than 500 m to each other,
except when paired as a RSA level monitoring site at a Met Mast).
6. Survey seasons need to be reviewed, lumping
of Autumn and Winter together is not
satisfactory as it misses the period of highest
activity and risk of mortality (March). Suggest
that sampling be conducted at a minimum in
summer (November – January)16 and March.
Winter and Spring could be conducted separately
or as a merged season.
Noted.
A survey is proposed for end of November and again in March. On completion of the
March survey, all seasons will have been surveyed.
For the longer-term operational monitoring, the plan will be to undertake surveys within
each distinct season, and will be appropriately timed for conditions to be generally
consistent with that seasonal norm. Where possible, surveys will generally be in the
middle part of each season, and appropriately timed apart from each other (dependant
on other factors such as timing to coincide with known peak periods of activity).

Bird and Bat survey Methods Silverton Wind Farm
16-412 Silverton Wind Farm Bird and Bat Surveys C-I
APPENDIX C SYMBOLIX LETTER OF ADVICE

Bird and Bat survey Methods Silverton Wind Farm
16-412 Silverton Wind Farm Bird and Bat Surveys D-I
APPENDIX D DETAILED BIRD SURVEY METHODS
Bird Utilisation Surveys
Purpose:
To quantify which bird species are present, their numbers and activity levels and how they use the site. Data from utilisation surveys will be used to assess whether use of the site by birds changes once turbines have been installed and are functioning and to therefore gauge changes in populations.
Method:
• Surveys are completed through un-truncated point counts.
o Point counts are not limited to a defined search area and the observer should record all observations when seen.
o Point counts will be 20 minutes in duration in which bird movements are recorded by continually scanning, noting the numbers of species and approximate distance to each unit. A unit can consist of an individual, or a flock. In the case of a flock, the approximate number should be estimated.
o Each individual is noted when first sighted; should an individual disappear and a second (or potentially the same) individual appear later, this is noted as a separate sighting.
o Surveys will be completed between dawn and dusk. The potential for collision can occur at any time a turbine is operating (i.e. 24 hrs / day), therefore bird movements require monitoring throughout the day to determine bird activity across this entire period.
• For each sighting, the following is recorded: time at first sighting, distance to first sighting (in metres), species, number, cue type (observed, heard). Metadata will also be recorded including weather conditions, wind speed and direction.
• For the additional raptor surveys, the height at which the bird is flying will be recorded (using a visual estimate), and the distance of the flight will also be recorded (wherever possible).
Additional Considerations:
As monitoring of wind farms and their potential impacts is a rapidly evolving field, the use of point counts is designed to allow for some flexibility in possible future application of the data.
Surveying of the pre-selected locations are conditional upon access, landholder logistics, and operating constraints.

Bird and Bat survey Methods Silverton Wind Farm
16-412 Silverton Wind Farm Bird and Bat Surveys E-I
APPENDIX E SUMMARY OF REVISED SURVEY PLAN
AGAINST COMMONWEALTH
GUIDELINES
We have considered the proposed survey strategy against the Commonwealth’s Survey guidelines for
Australia’s threatened bats (DEWHA, 2010), and provide below a summary of the proposed survey strategy
against the requirements set-out in the guidelines.
To begin with, none of the species that have been recorded at the site are nationally listed as threatened
under the EPBC Act, and consequently, none of the species recorded at the site are included in the species
profiles section of the guidelines which provides species-specific survey methods. Notwithstanding this,
the general survey approach (i.e. techniques and effort) within the guidelines for species generally, has
been considered in regards to the methods proposed under this survey. We summarise these further
below, including a statement as to how the proposed methodology to be employed at Silverton Wind Farm
will comply with, or otherwise not be inconsistent with the commonwealth guidelines.
SURVEY TECHNIQUES
The survey techniques listed in the commonwealth guidelines includes the following:
- Direct Capture methods (including use of Harp Traps, Mist Nets, Trip Lines, Hand Netting)
- Echolocation call detection
- Roost Searches
- Radio-tracking
- Chemi-luminescent tagging
Whilst the Guidelines recommend that a combination of both direct capture methods and use of
echolocation call detection devices yields the best results, this (NGH) document deals only with the use of
echolocation recording devices as a method for efficient ongoing monitoring. Direct capture will be
employed on a one-off basis to ensure that species whose calls cannot be confidently identified can be
confirmed by direct capture.
GENERAL GUIDELINE NOTES ON SPATIAL/TEMPORAL SAMPLING
Spatial Sampling:
The guidelines note that the number of sampling units within the study area (or strata) should be
proportional to its size, a principle referred to as area-proportionate sampling (MacNally & Horrocks 2002).
The Guidelines also note however, that a linear increase in sample number with area will become
impractical at very large study areas.
This is especially the case with Silverton WF as it is a very large site, is difficult to traverse, and is dominated
across the majority of the Project Area by a single habitat type (vegetation complex), being the Mulga Dead

Bird and Bat survey Methods Silverton Wind Farm
16-412 Silverton Wind Farm Bird and Bat Surveys E-II
Finish. As such, the number of survey sites required at SWF should not be directly proportionate in area
compared with the survey density of many other smaller sites with more complex habitats.
Notwithstanding the above, the Guidelines document makes no comment on general survey density (eg
number of detectors / ha of impact/site area), although for the species-specific methods, the survey effort
is quoted based on a hypothetical site of 50 ha. For both species, the recommended effort is 16 detector
nights over a minimum of 4 nights (i.e. 4 detectors set-up for 4 nights each over a 50 ha area). The Project
Area (defined by the Impact Zone) is approximately 2943.8 ha. This survey methodology proposes the use
of 23 detectors over 4 nights for a total of 92 detector nights. This equates to one detector every 147 ha
(for four nights), which compares with the recommended one detector every 12.5 ha (for four nights).
However, given the large distances between turbines and that each single turbine has an Impact Area of
78.6 ha (based on 1 km diameter), the recommended density is not considered directly applicable to this
project, otherwise, 6 detectors per turbine would be required to achieve a comparable survey density to
the guidelines. As an alternative measure, each turbine hardstand is approximately 30 m in diameter,
which equates to a total hardstand area of 16.4 ha for the 58 turbines. This equates to one detector every
0.8 ha of hardstand. An alternative measure also is to consider the RSA as a measure of the “impact Area”.
As mentioned in previous method documents, the turbines will have a blade diameter of 130 m which
equates to a total RSA of 13,273m2 per turbine. This equates to a total of 76.98 ha for the total 58 turbines.
Using this as a measure, the survey density would equate to one survey sites per 3.8 ha of RSA which
compares favourably with the recommended survey guidelines.
Temporal Sampling:
The Guidelines note that “regular sampling over time is recommended as it will increase the probability
that individuals will be detected on at least one occasion.” The guidelines also note that repeated sampling
over time, however is not always practical/possible and in this instance, “off-study area sampling is another
means to address this problem, whereby sampling is conducted in suitable habitat in the area surrounding
the study area. This procedure effectively increases the study area, allowing greater spatial sampling, and
enhances the probability of detecting individuals with home ranges larger than the core study area. In
practice, this will be a useful strategy because temporal replication is often more costly to implement than
spatial replication, as additional travel may be required to and from the study area.”
Whilst the implementation of the BBAMP will allow for repeated sampling over time (to determine
operational impacts of the wind farm), including ongoing sampling (from October 2017 onward) of bats
flying within the RSA (at the location of the existing Met Masts to be used).
SURVEY EFFORT
Echolocation call detectors
The Guidelines state that many survey standards recommend that 30–60 minutes of echolocation call
survey per night for four to five nights is adequate for inventory surveys, whilst other studies state that
recordings must be made across the entire night (de Oliveira 1998; Law et al. 1998; Duffy et al. 2000;
Richards 2001). While many bat species are active soon after dusk, it is well known that the data from a
stationary detector will rarely detect all species present at a site within one hour after dusk. For
unattended bat detectors: should be set recording before sunset and stopped after dawn.
The Australasian Bat Society, Inc. (ABS) has produced a document detailing a set of minimum requirements
for a transparent and sufficiently comprehensive consultative report of identifications made from acoustic

Bird and Bat survey Methods Silverton Wind Farm
16-412 Silverton Wind Farm Bird and Bat Surveys E-III
recordings. These are given in Recommendations of the Australasian Bat Society Inc. for reporting standards
for insectivorous bat surveys using bat detectors), and have been adopted for these survey guidelines. The
recommended survey effort and methods (as relevant to the Silverton WF Project) include:
- A description of the reference library used in the identification process.
- Details of the number of detector hours undertaken during the survey.
- A sample ‘time versus frequency’ graph of each species identified during the survey. These
graphs must be of bats recorded and identified during the survey.
- For species with similar call characteristics, a written description of the characteristics used
to distinguish these species must be included in the methods.
- An indication of the proportion of calls identified, i.e. the total number of calls processed
and the percentage of these that were identified.
- All the call files from a survey are deposited ultimately with the client or agency.
In addition, this document also provides additional suggestions on survey effort and methods. Of relevance
to the Silverton Wind Farm bat monitoring project are the following:
- Typical inventory survey effort should involve detector deployment for at least three complete
nights in each major habitat type in the survey area.
- Surveys should be conducted during the warmer months of the year and in good weather
conditions.
Note: the Guidelines make no further comment on survey density (eg number of detectors / ha of
impact/site area).
In addition to the above, the Guidelines provide species-specific requirements for a number of nationally
listed threatened bat species. The species that have previously been recorded at Silverton WF are not
included in the identified species of the Guidelines. Notwithstanding this, two species have been
considered from this list for consideration of any other relevant survey requirement that should be applied
to the Silverton WF baseline survey project. These species and the survey requirements are listed below.
Bare-rumped sheath-tailed bat (Saccolaimus saccolaimus nudicluniatus)
Bat detectors (Anabat or other frequency division, or time-expansion detector; unattended) should be
located in forest or woodland and ideally placed several metres above the ground (in trees or on poles),
orientated upwards (at least 45°) towards gaps in the vegetation AND at waterholes/dams or in
watercourses. Unattended detectors should be left overnight.
Unattended bat detectors to be used for a minimum of 16 detector nights and over a minimum of 4 nights.
Large-eared pied bat (Chalinolobus dwyeri)
Passive acoustic detection. A range of potential roost habitats can be examined by passive detection with
unattended recorders placed in the vicinity of mines, caves and rocky outcrop, and also in foraging sites
such as vegetation corridors and flyways, sandstone gorges, over watercourses, isolated waterholes and in
representative vegetation types. Quality search-phase echolocation calls are diagnostic but these may not
be recorded from bats emerging from underground roosts if bat detectors are placed at the entrance.
Unattended detectors should be left overnight at multiple locations.
Unattended bat detectors to be used for a minimum of 16 detector nights and over a minimum of 4 nights.

Bird and Bat survey Methods Silverton Wind Farm
16-412 Silverton Wind Farm Bird and Bat Surveys E-IV
From the above two species, it can be seen that Anabat surveys should be conducted over a minimum of
4 nights and achieve at least 16 detector-nights of sampling. Also, the focus of device location should be
toward suitable habitats (though not specifically toward any type of habitat that happens to be present at
a site). The surveys to be undertaken at Silverton have/will meet all of the above requirements.

Bird and Bat survey Methods Silverton Wind Farm
16-412 Silverton Wind Farm Bird and Bat Surveys F-I
APPENDIX F SUMMARY OF REVISED SURVEY PLAN
AGAINST NSW THREATENED SPECIES
SURVEY GUIDELINES
We have considered the proposed survey strategy against the NSW Threatened Biodiversity Survey and
Assessment: Guidelines for Developments and Activities (DEC 2004), and provide below a summary of the
proposed survey strategy against the requirements set-out in the guidelines for bats (noting that these
guidelines are more directed toward assessments of impacts rather than ongoing monitoring surveys).
Methods
The guidelines note that some microchiropteran bat species are best identified by their unique ultrasonic
echolocation calls (Woodside and Taylor 1985), while others can only be reliably identified by trapping
(Helman and Churchill 1986). Therefore, a combination of both ultrasonic detection and trapping is
essential as neither method can detect all species (Corben 1989; Parnaby 1992a, b; Duffy et al. 2000).
Ultrasonic methods are more likely to record high-flying species but trapping methods are needed to detect
low intensity echo locators (eg. long-eared bats and the golden-tipped bat) (Corben 1989).
Given the above, the proposed Silverton Wind Farm monitoring surveys are consistent with the
recommended approach in that echolocators will be used for longer term monitoring, with a trapping study
to be used in Spring to assist in species identification.
Effort
The guidelines note that the following key points with regard to survey effort:
- The location of traps and ultrasonic recorders should be in the areas of greatest potential
activity (such as roost sites or near watering points)
- Bats are most active from October to March and sampling should be undertaken during this period (Lumsden and Bennett 1995). In other months, some bats may be active, particularly in northern NSW, however the probability of recording all the species that are present is reduced.
- Three hours of recording immediately after dusk is required to identify 90% of species present. Echolocation call detection should be conducted for a minimum of four hours, however recording for the entire night is recommended.
Each of the above recommendations for survey effort will be met by this Project, with a focus on stratifying
survey points in Control and Impact Zones across the main habitat types, including extra survey effort for
the River Red Gum Woodland areas regarded as being of primary importance in the landscape to bat
habitat. Surveys will occur within the recommended timing of October to March and each detector will be
programmed to record all night for four consecutive nights.
The suggested survey methods and effort for bats is defined in the table below (adopted from the NSW
guidelines).

Bird and Bat survey Methods Silverton Wind Farm
16-412 Silverton Wind Farm Bird and Bat Surveys F-II
Method Effort per 100 hectares (or portion thereof) of
stratification unit targeting preferred habitat
Survey period
Ultrasonic call
recording
Two sound activated recording devices utilised for the
entire night (a minimum of four hours), starting at dusk
for two nights
October to March
Based on the above, and adopting the RSA as a surrogate measure for overall site area, the Silverton Project
will have a total RSA of 76.98 ha for the total 58 turbines. Using this as a measure, the survey density would
equate to one survey site per 3.8 ha of RSA which compares favourably with the recommended survey
guidelines of one detector for every 50 ha of the stratification unit.