
Improving the PEMFC energy efficiency by optimizing the fuelling rates based on extremum seeking...
14
Improving the PEMFC energy efficiency by optimizing the fueling rates based on extremum seeking algorithm Nicu Bizon a,b, * a University of Pitesti, 1 Targu din Vale, Arges, 110040 Pitesti, Romania b University Politehnica of Bucharest, 313 Splaiul Independentei, 060042 Bucharest, Romania article info Article history: Received 6 March 2014 Received in revised form 24 April 2014 Accepted 26 April 2014 Available online 27 May 2014 Keywords: Fuel cell system Energy efficiency Maximum efficiency point tracking Extremum seeking algorithm Air and fuel flow control abstract In this paper, the energy efficiency of the Proton Exchange Membrane Fuel Cell (PEMFC) systems based on the fueling rates is systematically investigated. The PEMFC system under dynamic load must be operated close to the Maximum Efficiency Point (MEP) to obtain the highest energy efficiency. This is a difficult task because the MEP is dependent on the PEMFC parameters and the control PEMFC variables, besides the load profile. Thus, the MEP must be tracked dynamically with a safe search speed and funded accurately during the stationary regimes. Consequently, a real-time control is recommended to be used. The Extremum Seeking (ES) control scheme is proposed here to evaluate the FC net power at the MEP under different fueling rates and load profiles. Some interesting conclusions are obtained based on the comparative method proposed using as reference a base control technique or a PEMFC stack: 1) the MEP is different based on the control of the fuel or air flow rate; 2) the energy efficiency increases if both fueling flow rates are controlled; 3) the energy efficiency is less sensitive to power losses if the MEP is tracked by the ES controller based on air flow rate; 4) the strategy of load following control considering the fuel flow rate as an input variable is recommended based on the observation that the MEP is more sensitive to this in comparison to the air flow rate; 5) the design of an appropriate MEP tracking controller should equally focus on safe operation and the increase of the perfor- mances such as the search speed and tracking accuracy under dynamic load. All these remarks are based on an extensive numerical simulation, which are highlighted in this paper by the main results shown. Copyright ª 2014, Hydrogen Energy Publications, LLC. Published by Elsevier Ltd. All rights reserved. Introduction Hydrogen is a carrier vector of energy being used to the transport and storage of energy from different sources [1]. Combinations of hydrogen are found in large quantities in nature, but obtaining a molecular hydrogen is an energy consuming process. Thus, the sustainable production of hydrogen is based on the decomposition of water using different renewable energy sources, in particular the solar * University of Pitesti, 1 Targu din Vale, Arges, 110040 Pitesti, Romania. Tel.: þ40 348 453 201; fax: þ40 348 453 200. E-mail addresses: [email protected], [email protected]. Available online at www.sciencedirect.com ScienceDirect journal homepage: www.elsevier.com/locate/he international journal of hydrogen energy 39 (2014) 10641 e10654 http://dx.doi.org/10.1016/j.ijhydene.2014.04.194 0360-3199/Copyright ª 2014, Hydrogen Energy Publications, LLC. Published by Elsevier Ltd. All rights reserved.
Transcript of Improving the PEMFC energy efficiency by optimizing the fuelling rates based on extremum seeking...

ww.sciencedirect.com
i n t e r n a t i o n a l j o u r n a l o f h y d r o g e n en e r g y 3 9 ( 2 0 1 4 ) 1 0 6 4 1e1 0 6 5 4
Available online at w
ScienceDirect
journal homepage: www.elsevier .com/locate/he
Improving the PEMFC energy efficiency byoptimizing the fueling rates based on extremumseeking algorithm
Nicu Bizon a,b,*aUniversity of Pitesti, 1 Targu din Vale, Arges, 110040 Pitesti, RomaniabUniversity Politehnica of Bucharest, 313 Splaiul Independentei, 060042 Bucharest, Romania
a r t i c l e i n f o
Article history:
Received 6 March 2014
Received in revised form
24 April 2014
Accepted 26 April 2014
Available online 27 May 2014
Keywords:
Fuel cell system
Energy efficiency
Maximum efficiency point tracking
Extremum seeking algorithm
Air and fuel flow control
* University of Pitesti, 1 Targu din Vale, ArE-mail addresses: [email protected]
http://dx.doi.org/10.1016/j.ijhydene.2014.04.10360-3199/Copyright ª 2014, Hydrogen Ener
a b s t r a c t
In this paper, the energy efficiency of the Proton Exchange Membrane Fuel Cell (PEMFC)
systems based on the fueling rates is systematically investigated. The PEMFC system under
dynamic load must be operated close to the Maximum Efficiency Point (MEP) to obtain the
highest energy efficiency. This is a difficult task because the MEP is dependent on the
PEMFC parameters and the control PEMFC variables, besides the load profile. Thus, the MEP
must be tracked dynamically with a safe search speed and funded accurately during the
stationary regimes. Consequently, a real-time control is recommended to be used. The
Extremum Seeking (ES) control scheme is proposed here to evaluate the FC net power at
the MEP under different fueling rates and load profiles. Some interesting conclusions are
obtained based on the comparative method proposed using as reference a base control
technique or a PEMFC stack: 1) the MEP is different based on the control of the fuel or air
flow rate; 2) the energy efficiency increases if both fueling flow rates are controlled; 3) the
energy efficiency is less sensitive to power losses if the MEP is tracked by the ES controller
based on air flow rate; 4) the strategy of load following control considering the fuel flow rate
as an input variable is recommended based on the observation that the MEP is more
sensitive to this in comparison to the air flow rate; 5) the design of an appropriate MEP
tracking controller should equally focus on safe operation and the increase of the perfor-
mances such as the search speed and tracking accuracy under dynamic load. All these
remarks are based on an extensive numerical simulation, which are highlighted in this
paper by the main results shown.
Copyright ª 2014, Hydrogen Energy Publications, LLC. Published by Elsevier Ltd. All rights
reserved.
Introduction
Hydrogen is a carrier vector of energy being used to the
transport and storage of energy from different sources [1].
ges, 110040 Pitesti, Roma, [email protected] Publications, LLC. Publ
Combinations of hydrogen are found in large quantities in
nature, but obtaining a molecular hydrogen is an energy
consuming process. Thus, the sustainable production of
hydrogen is based on the decomposition of water using
different renewable energy sources, in particular the solar
nia. Tel.: þ40 348 453 201; fax: þ40 348 453 200.
ished by Elsevier Ltd. All rights reserved.

Fig. 1 e The PEMFC system.
i n t e rn a t i o n a l j o u r n a l o f h y d r o g e n en e r g y 3 9 ( 2 0 1 4 ) 1 0 6 4 1e1 0 6 5 410642
energy [2]. Following the energy generating process, the pure
water is produced, which can be consumed or included to the
industrial water circuit [3]. In this context, the concept of
hydrogen based technology, including the production, storage
and use of hydrogen as energy carrier, will be the center of
attention for researchers in the field of sustainable energy for
coming years [4].
In last decade, a number of topologies hybrid power sour-
ces hydrogen based have been proposed and analyzed in
terms of improving the energy efficiency, optimizing the
control of the DC bus, sizing the energy storage system, and
increasing the life cycle and durability under dynamic load etc
[5,6]. Among the various types of fuel cell, the PEMFC systems
are most used because they are suitable for both automotive
and residential applications due to the high energy density,
low emissions and low temperature operation [7,8].
The PEMFC stack is an electrochemical device in which
chemical energy is converted directly into electrical energy.
The PEMFC stack operates with hydrogen and oxygen to
generate energy with an efficiency of 45e50%, reaching 80%
yield if heat is also recovered [7,8].
The hydrogen is generated by electrolysis or taken from a
hydrogen tank, using different supply modes with hydrogen
[9]: flow-through, dead-end anode, or with recirculation.
Regarding the fuel supply modes, it can be noticed the
following: the continuous-flow mode is not used for normal
applications due to the dangers associated with excess
hydrogen that is eliminated outside of PEMFC system [10]; the
dead-end anode feed mode requires special attention on the
frequency and duration of purging to ensure efficient and
stable operation [11,12]; the recirculation mode is most effi-
cient [9], but can be unpractical to implement it for small
power applications [13]. This paper will analyze the energy
efficiency of the PEMFC system based on the hydrogen flow
rate measured at the input of the PEMFC stack in order to
cover all fuel supply modes. It is obvious that the fuel con-
sumption depends by the fuel supply modes used, but this is
outside the scope of this paper.
Also, it is known that FC net power depends by air flow rate
measured at the input of the PEMFC stack [14,15]. Thus, the
control of thePEMFCsystemto increase theenergyefficiency is
a challenging action if both fueling rates are considered [16,17].
In addition, it is known that other two control systemsmust to
be appropriately designed to maintain the energy efficiency
obtained by optimizing the air/fuel fueling rates of the PEMFC
system [18,19]: the water supply and the heat management.
The analysis presented in this paper is focused on improving
the energy efficiencyby controlling both air and fuel flow rates.
The possibilities to maximize the energy efficiency of the
PEMFC system under different load power levels will be
analyzed in this paper considering the ensemble composed
from the PEMFC stack and the fueling subsystems (Fig. 1).
It is known that the PEMFC system contains other various
auxiliary equipments (including the air compressor, humidifi-
er, pumps, cooling water circulation, and the measurement,
control, signalizing and protection circuits),besides the PEMFC
stack. The power consumption of air compressor is up to 80%
power of the overall auxiliary equipments [20], and this repre-
sents up to 20% of the FC power available [21]. Thus, the PEMFC
systems must operate close to the MEP in order to obtain high
energy efficiency [14,22]. On the other hand, theMEP is difficult
to be tracked because the operating point depends by the
PEMFC system parameters and the load dynamic [23,24].
Consequently, the recent researchwas focused in thisdirection
to maximize the output power of the PEMFC system [25].
To find a better solution for the management of air supply,
different control algorithms were proposed: the dynamic
feed-forwardefeedback control [26], sliding mode control [27],
supper twisting algorithm [15,28], perturb and observe algo-
rithm [29], ES control [30,31], model predictive control [32,33],
and intelligent control based on neural networks [34] and
fuzzy logic [35,36]. Advanced control schemes based on LQR/
LRS strategies [37,38], nonlinear differential flatness-based
control [39,40], time delay control [41], and adaptive control
[42] where proposed in the last years, too. Also, the optimi-
zation strategies have been considered to maximize the effi-
ciency of the whole PEMFC system or the operation of the
compressor [43]. The proposed strategies regulate the air
pressure to the required load power, increasing the FC net
power with about 3%e10% in comparison with the power
obtained in constant pressuremode. It can be noticed that not
all control schemes aforementioned tolerate the uncertainty
on state variables of the PEMFC system [44].
In this paper, the MEP tracking control based on Single-
Input Dual-Output Extremum Seeking (SIDOES) control
scheme proposed in Ref. [45] will be used. This SIDOES control
scheme assures higher search speed and improved tracking
accuracy of the MEP, improving the basic performances of the
classical ES control schemes [46,47].
The static feed-forward (sFF) control technique [21] will be
used as reference to report the improvements on FC net
power. Then the SIDOES control scheme will be used (see
Fig. 2). The improvements on FC net power will be highlighted
by the achievements obtained for the PEMFC system under
test in comparison with the reference.
Themain goal of this paper is to show that energy efficiency
of the PEMFC system can be further improved by controlling
both fueling rates. The SIDOES scheme is used to accurately
determine the unknown MEP of the PEMFC system under
constant and dynamic load. The experiments under dynamic
loadwereperformedbynumerical simulation to showthehigh
search speed of the SIDOES scheme. Also, this paper contrib-
utes to research the fueling flow rates control of the PEMFC

Fig. 2 e The simulation diagram.
i n t e r n a t i o n a l j o u r n a l o f h y d r o g e n en e r g y 3 9 ( 2 0 1 4 ) 1 0 6 4 1e1 0 6 5 4 10643
systemsbasedon load followingcontrol scheme, analyzing the
control sensitivities to the air and fuel flow rates.
The paper is organized as follows. Section PEMFC system
modeling and control briefly presents the issues related to
the system modeling and control. The accuracy of the used
model is not so important in this study because the
improvement of the FC net power will be shown through
comparison. The main relations and parameters used in
simulation are shown. Section The energy efficiency of the
PEMFC system deals with the energy efficiency of the PEMFC
system. Themodel of the SIDOES control scheme is detailed in
Section The single-input dual-output ES (SIDOES) control
scheme. Themethodology to evaluate the FC energy efficiency
is highlighted in Section The methodology to evaluate the FC
energy efficiency. First, it is shown the availabilities in maxi-
mizing the FC net power by regulating air flow rate and fuel
flow rate, respectively. The comparative results on FC energy
efficiency are shown using the sFF control as reference. Sec-
ond, the improvement of the FC energy efficiency is shown if
one of the fueling rates is controlled by the ES control scheme
and other is still controlled by the sFF regulator. The
comparative improvements in the FC net power based on
control of both fueling rates are shown in Section The
improvement in the FC net power. The performances of the
SIDOES control schemes under different load are clearly
highlighted here. The comparative dynamic performances
during the MEP searching and tracking phases are highlighted
in Section The MEP searching and tracking process using the
load following control based on the fuel or air flow rate. Last
Section concludes the paper.
PEMFC system modeling and control
The PEMFC system is complex as a structure, having a
nonlinear model developed based on principles of electro-
chemistry, thermodynamics, and fluid andmass flow transfer
[18]. Themain subsystems of the PEMFC systemare the PEMFC
stack, air supply subsystem, hydrogen supply subsystem,
thermal management subsystem, and a power conditioner.
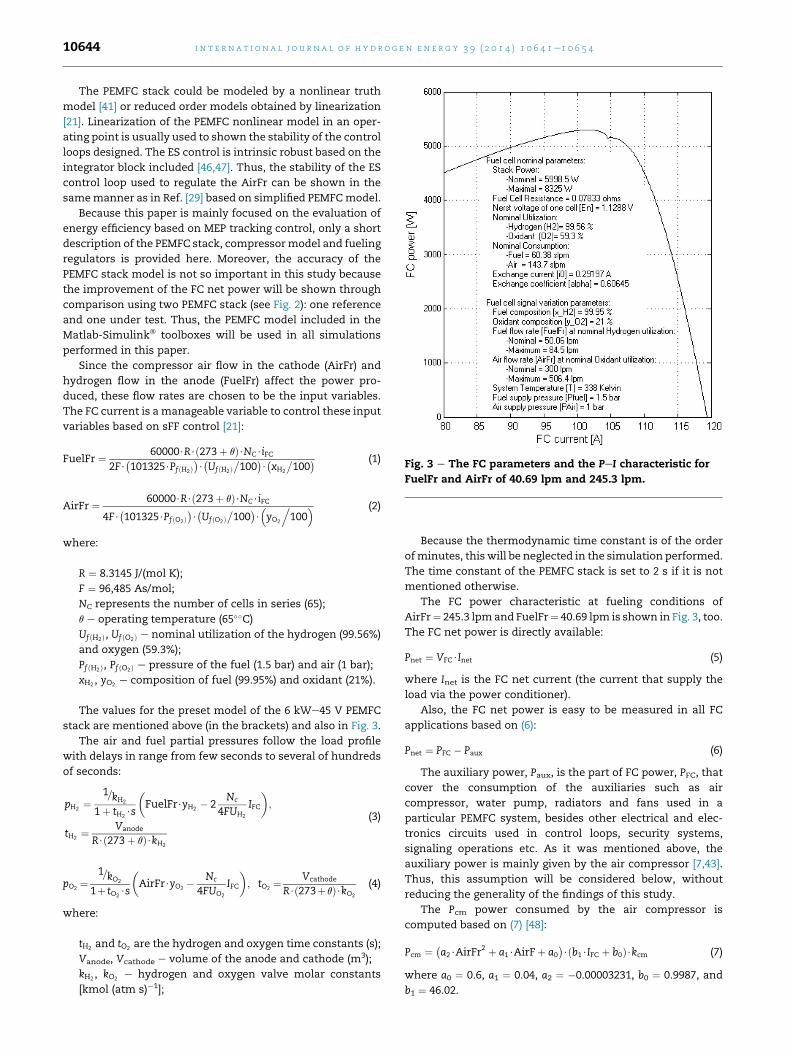
Fig. 3 e The FC parameters and the PeI characteristic for
FuelFr and AirFr of 40.69 lpm and 245.3 lpm.
i n t e rn a t i o n a l j o u r n a l o f h y d r o g e n en e r g y 3 9 ( 2 0 1 4 ) 1 0 6 4 1e1 0 6 5 410644
The PEMFC stack could be modeled by a nonlinear truth
model [41] or reduced order models obtained by linearization
[21]. Linearization of the PEMFC nonlinear model in an oper-
ating point is usually used to shown the stability of the control
loops designed. The ES control is intrinsic robust based on the
integrator block included [46,47]. Thus, the stability of the ES
control loop used to regulate the AirFr can be shown in the
samemanner as in Ref. [29] based on simplified PEMFCmodel.
Because this paper is mainly focused on the evaluation of
energy efficiency based on MEP tracking control, only a short
description of the PEMFC stack, compressormodel and fueling
regulators is provided here. Moreover, the accuracy of the
PEMFC stack model is not so important in this study because
the improvement of the FC net power will be shown through
comparison using two PEMFC stack (see Fig. 2): one reference
and one under test. Thus, the PEMFC model included in the
Matlab-Simulink� toolboxes will be used in all simulations
performed in this paper.
Since the compressor air flow in the cathode (AirFr) and
hydrogen flow in the anode (FuelFr) affect the power pro-
duced, these flow rates are chosen to be the input variables.
The FC current is amanageable variable to control these input
variables based on sFF control [21]:
FuelFr ¼ 60000$R$ð273þ qÞ$NC$iFC2F$
�101325$PfðH2Þ
�$�Uf ðH2Þ
�100
�$�xH2
�100
� (1)
AirFr ¼ 60000$R$ð273þ qÞ$NC$iFC
4F$�101325$Pf ðO2Þ
�$�UfðO2Þ
�100
�$�yO2
.100
� (2)
where:
R ¼ 8.3145 J/(mol K);
F ¼ 96,485 As/mol;
NC represents the number of cells in series (65);
q e operating temperature (65��C)UfðH2Þ, UfðO2Þ e nominal utilization of the hydrogen (99.56%)
and oxygen (59.3%);
PfðH2Þ, PfðO2Þ e pressure of the fuel (1.5 bar) and air (1 bar);
xH2 , yO2 e composition of fuel (99.95%) and oxidant (21%).
The values for the preset model of the 6 kWe45 V PEMFC
stack are mentioned above (in the brackets) and also in Fig. 3.
The air and fuel partial pressures follow the load profile
with delays in range from few seconds to several of hundreds
of seconds:
pH2¼
1=kH2
1þ tH2$s
�FuelFr$yH2
� 2Nc
4FUH2
IFC
�;
tH2¼ Vanode
R$ð273þ qÞ$kH2
(3)
pO2¼
1=kO2
1þ tO2$s
�AirFr$yO2
� Nc
4FUO2
IFC
�; tO2
¼ Vcathode
R$ð273þqÞ$kO2
(4)
where:
tH2 and tO2 are the hydrogen and oxygen time constants (s);
Vanode, Vcathode e volume of the anode and cathode (m3);
kH2 , kO2 e hydrogen and oxygen valve molar constants
[kmol (atm s)�1];
Because the thermodynamic time constant is of the order
ofminutes, this will be neglected in the simulation performed.
The time constant of the PEMFC stack is set to 2 s if it is not
mentioned otherwise.
The FC power characteristic at fueling conditions of
AirFr¼ 245.3 lpmand FuelFr¼ 40.69 lpm is shown in Fig. 3, too.
The FC net power is directly available:
Pnet ¼ VFC$Inet (5)
where Inet is the FC net current (the current that supply the
load via the power conditioner).
Also, the FC net power is easy to be measured in all FC
applications based on (6):
Pnet ¼ PFC � Paux (6)
The auxiliary power, Paux, is the part of FC power, PFC, that
cover the consumption of the auxiliaries such as air
compressor, water pump, radiators and fans used in a
particular PEMFC system, besides other electrical and elec-
tronics circuits used in control loops, security systems,
signaling operations etc. As it was mentioned above, the
auxiliary power is mainly given by the air compressor [7,43].
Thus, this assumption will be considered below, without
reducing the generality of the findings of this study.
The Pcm power consumed by the air compressor is
computed based on (7) [48]:
Pcm ¼ �a2$AirFr
2 þ a1$AirFþ a0
�$ðb1$IFC þ b0Þ$kcm (7)
where a0 ¼ 0.6, a1 ¼ 0.04, a2 ¼ �0.00003231, b0 ¼ 0.9987, and
b1 ¼ 46.02.

Fig. 4 e The net power surface for the 6 kW PEMFC stack
supplied by compressor 1.
i n t e r n a t i o n a l j o u r n a l o f h y d r o g e n en e r g y 3 9 ( 2 0 1 4 ) 1 0 6 4 1e1 0 6 5 4 10645
The parameter kcm changes the level of the Pcm power and
can model the nonlinearities of the compressor based on a
look-up table [43]. This parameter is set to 1 and 2 for
compressor 1 (CM1) and 2 (CM2) used in simulation.
The dynamic of both compressors is considered as a 2nd
order system [48]:
GdðcmÞ ¼ u2cm
s2 þ 2xcmucm$sþ u2cm
(8)
where tcm ¼ 2p/ucm and xcm will set the time constant and the
surge level of the compressor. Usually, this dynamic is
neglected in studies of the PEMFC system behavior [29]. So,
this will also be neglected here in order to highlight the effect
of the PEMFC time constant on the tracking accuracy.
Two different power levels will be used for the air
compressor in order to evaluate the dependence of the PEMFC
energy efficiency by the level of the power losses. The FC net
power and energy efficiency of the PEMFC system will be
computed for the both PEMFC systems based on same PEMFC
stack.
Fig. 5 e The net power surface for the 6 kW PEMFC stack
supplied by compressor 2.
The energy efficiency of the PEMFC system
The energy efficiency of the PEMFC system is one of main
goals related to control techniques analyzed in the literature,
besides the goal to keep optimal oxygen excess ratio trajectory
in order to avoid oxygen starvation [49] or to minimize the
hydrogen consumption [44]. It is known that the PEMFC en-
ergy efficiency is dependent to the dynamic load [50]. So, the
challenging task in designing the fueling controller could be
more difficult if the fueling rates are adaptively changed close
to safety values that depend to load profile [48,51]. This effect
of limiting the fueling rates will be presented here, as well.
The PEMFC energy efficiency is defined as percent of the FC
net power delivered to the load from the FC power available at
the FC terminals [9,43]:
hsys ¼ Pnet=PFC (9)
The overall electric efficiency of the PEMFC system (hel) is
defined in Ref. [43] taking into account the net electric power
used to react one mole of hydrogen and the fuel utilization
coefficient (hf):
hel ¼ hf $hFC$hsys (10)
where the FC stack efficiency (hFC) is the ratio between the
produced energy and the heat produced by burning the
hydrogen fuel.
The analysis performed in this paper will be focused on the
PEMFC system energy efficiency (hsys) that mainly depends on
the load level. An optimum value for the fueling rates must be
determined by the real-time controller (the fuel processor) for
each load level. The optimization problem can be defined if
the objective function is convex. It is know that the FC net
power related to the AirFr (or the oxygen excess ratio) is a
convex function, and a lot of papers use this approach in
solving the MEP tracking control problem [14,29,30].
In this paper, the convex surfaces of the FC net power
related to the AirFr and load level will be used to define the
MEP tracking control problem in next section. Figs. 4 and 5
show the load-level cuts of these surfaces that were drawn
considering the AirFr as linear variable during a load level set
by the FC current. These load-level cuts are shown in Fig. 6 for
both compressors.
The static MEP could be estimated based on static charac-
teristic shown in figures above, but the tracking of dynamic
MEP is a difficult task that could be solved using real-time
optimization algorithms. Different multi-dimensional maps,
which are functions of current density, AirFr, cathode pres-
sure, anode pressure, and cathode inlet humidity, are used in
nonlinear control loops of the PEMFC system. In this paper a
real-time optimization algorithm based on perturbed ES con-
trol scheme is proposed based on 2-D nonlinear map of the FC
net power.
The single-input dual-output ES (SIDOES) controlscheme
Because the FC current, IFC, defines a FuelFr value based on
appropriate controller, it is obvious that the FC net power can
be also represented by a nonlinear convex map, Pnet ¼ J(AirFr,
FuelFr). Also, the dynamics of the FC stack can be represented
by a smooth function, f, based on statesmodel,where the state
vector, x, can be, for example, of a 9th [21] or 6th [15] order.
Thus, in brief, the ES control problem can be mathemati-
cally defined as:

Fig. 6 e The net power characteristics of the 6 kW PEMFC
stack under different load power levels (the air supplied by
the compressor 1 and 2).
i n t e rn a t i o n a l j o u r n a l o f h y d r o g e n en e r g y 3 9 ( 2 0 1 4 ) 1 0 6 4 1e1 0 6 5 410646
Maximize:
Pnet ¼ Jðx; i1; i2; IFCÞ (11)
Subject to:
_x ¼ fðx; i1; i2; IFCÞ; x˛X (12)
where i1 ¼ AirFr and i2 ¼ FuelFr are the control inputs, and IFCis the disturbance input.
So, considering Pnet ¼ J(i1, i2), the net power in an operating
point (i10, i20) can be approximated by the Taylor series:
Pnet ¼ Jði1; i2Þ ¼XNp2¼0
XNp1¼0
ði1 � i10Þp1 ði2 � i20Þp2p1!p2!
$vp1þp2 J
vxp11 vxp2
2
ði10; i20Þ (13)
The gradients, G1 and G2, can be estimated by:
Gp ¼ vJvip
ði10; i20Þ ¼ dJdt
dipdt
; p ¼ 1; 2 (14)
The dithers used in SIDOES control scheme to extract the
gradients can have different frequency or the same frequency,
but complementary phases in the last case. It is known that
the gradients are frequency dependent [45], so the last variant
has the advantage of obtaining a search speed in both di-
rections that is not dependent by the dither frequency.
Consequently, the orthogonal signals sd1 ¼ sin(udt) and
sd2 ¼ cos(udt) will be used (see Fig. 7).
The gradients will be estimated below considering the
following assumptions:
- three components of the Taylor series will be used;
- the band pass filter (BPF) is ideal, having the cut-off fre-
quencies of ul ¼ alud, 3 < al < 4, and uh ¼ ahud, 0 < ah < 1;
- kN ¼ 1 (in simulation kN ¼ 1/VFC).
Consequently, ipBPF signals (p ¼ 1, 2) at BPF outputs will be:
ipBPFðtÞyD1$ipLFðtÞ þ 12D2$i
2pLFðtÞ þ
16D3$i
3pLFðtÞ (15)
where
D1 ¼ vJvi1
ði10; i20Þþ vjvi2
ði10; i20Þ
D2 ¼ vJ2
vi21ði10; i20Þþ2
vJ2
vi1vi2ði10; i20ÞþvJ2
vi22ði10; i20Þ
D3 ¼ vJ3
vi31ði10; i20Þþ3
vJ3
vi21vi2ði10; i20Þþ3
vJ3
vi1vi22ði10; i20ÞþvJ3
vi32ði10; i20Þ
(16)
The low frequency (LF) harmonics of the iLF signal, which
assures the dither persistence in the ES control loop, will be
given by (17):
i1LFðtÞ ¼X3
p¼1
a1p sin�judtþ 41p
�; i2LFðtÞ ¼
X3
p¼1
b1p sin�judtþ j1p
�
(17)
These ipBPF signals are thenmodulated with the orthogonal
dithers, obtaining the ipDM signals:
ipDMðtÞ ¼ ipBPFðtÞ$sin½udtþ ðp� 1Þp=2�; p ¼ 1;2 (18)
The ipDM signals can be rewritten as:
ipDMðtÞyksgp þ ipDMðLFÞðtÞ; p ¼ 1;2 (19)
where:
ksg1 ¼ 12D1a1RSS1 cos 41
ksg2 ¼ 12D1b1RSS2 sin j1
RSS1y1þ 18D3
D1
�a21 þ 2a2
2 þ 2a23
�
RSS2y1þ 18D3
D1
�b21 þ 2b2
2 þ 2b23
�
(20)
The ipDM signals contain the required gradient, besides the
LF components that assures the dither persistence [52]. Finally
an integral controller with gain k1 drives this estimated
gradient to zero during the searching phase.
Thus, the signals injected in the ES control loops (the
probing signals) will be:
ipðtÞyk1ksgp$tþ k2H1p sin½udtþ ðp� 1Þp=2� þ ipLFðtÞ; p ¼ 1; 2
(21)
where H1p is the magnitude of the fundamental harmonic of
the ipBPF signal, p ¼ 1, 2.
Of course, the magnitude of LF components of the probing
signals is time-dependent [52].
If the ES control loop gain, k1, is set proportional to the
dither frequency in order to improve the dither persistence
[45,52],
k1 ¼ kd$ud (22)
then the gradients can be estimated by
KSSðpÞ ¼ ksgðpÞ$kd$ud; p ¼ 1; 2 (23)
In conclusion, the time-evolution of the G1 gradient can be
obtained based on equations of the ES control scheme 1:
Pnet ¼ Jðx; i1; i2; IFCÞ; inet ¼ pnet
�VFC (24)
ihpf�
¼ �uhihpf þuhiN; if ¼ inet � ihpf ; iBPF�
¼ �uliBPF þulif ; (25)
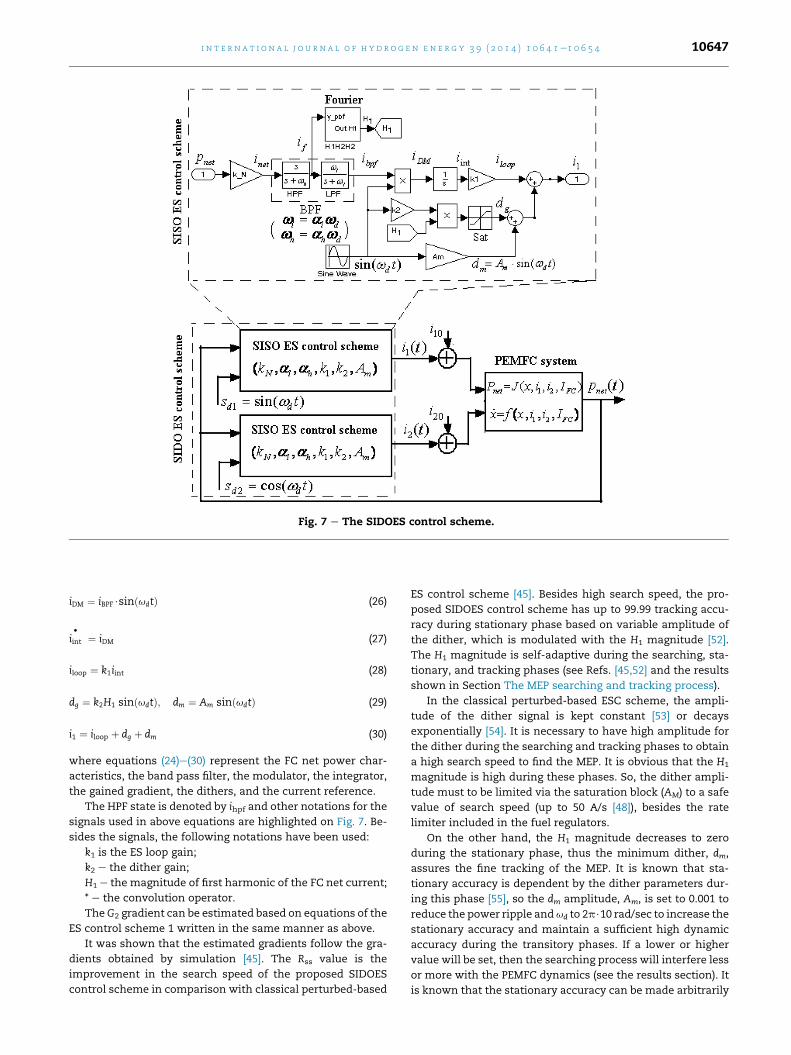
Fig. 7 e The SIDOES control scheme.
i n t e r n a t i o n a l j o u r n a l o f h y d r o g e n en e r g y 3 9 ( 2 0 1 4 ) 1 0 6 4 1e1 0 6 5 4 10647
iDM ¼ iBPF$sinðudtÞ (26)
iint�
¼ iDM (27)
iloop ¼ k1iint (28)
dg ¼ k2H1 sinðudtÞ; dm ¼ Am sinðudtÞ (29)
i1 ¼ iloop þ dg þ dm (30)
where equations (24)e(30) represent the FC net power char-
acteristics, the band pass filter, the modulator, the integrator,
the gained gradient, the dithers, and the current reference.
The HPF state is denoted by ihpf and other notations for the
signals used in above equations are highlighted on Fig. 7. Be-
sides the signals, the following notations have been used:
k1 is the ES loop gain;
k2 e the dither gain;
H1 e the magnitude of first harmonic of the FC net current;
* e the convolution operator.
TheG2 gradient can be estimated based on equations of the
ES control scheme 1 written in the same manner as above.
It was shown that the estimated gradients follow the gra-
dients obtained by simulation [45]. The Rss value is the
improvement in the search speed of the proposed SIDOES
control scheme in comparison with classical perturbed-based
ES control scheme [45]. Besides high search speed, the pro-
posed SIDOES control scheme has up to 99.99 tracking accu-
racy during stationary phase based on variable amplitude of
the dither, which is modulated with the H1 magnitude [52].
The H1 magnitude is self-adaptive during the searching, sta-
tionary, and tracking phases (see Refs. [45,52] and the results
shown in Section The MEP searching and tracking process).
In the classical perturbed-based ESC scheme, the ampli-
tude of the dither signal is kept constant [53] or decays
exponentially [54]. It is necessary to have high amplitude for
the dither during the searching and tracking phases to obtain
a high search speed to find the MEP. It is obvious that the H1
magnitude is high during these phases. So, the dither ampli-
tude must to be limited via the saturation block (AM) to a safe
value of search speed (up to 50 A/s [48]), besides the rate
limiter included in the fuel regulators.
On the other hand, the H1 magnitude decreases to zero
during the stationary phase, thus the minimum dither, dm,
assures the fine tracking of the MEP. It is known that sta-
tionary accuracy is dependent by the dither parameters dur-
ing this phase [55], so the dm amplitude, Am, is set to 0.001 to
reduce the power ripple andud to 2p$10 rad/sec to increase the
stationary accuracy and maintain a sufficient high dynamic
accuracy during the transitory phases. If a lower or higher
value will be set, then the searching process will interfere less
or more with the PEMFC dynamics (see the results section). It
is known that the stationary accuracy can be made arbitrarily

Fig. 8 e The diagram to compute the FC net power under
sFF control.
i n t e rn a t i o n a l j o u r n a l o f h y d r o g e n en e r g y 3 9 ( 2 0 1 4 ) 1 0 6 4 1e1 0 6 5 410648
small by decreasing the Am amplitude, and the search speed
can bemade arbitrarily fast by increasing the dither frequency
[55].
Based on above discussion, if it is not otherwise stated, the
simulation parameters (for both ES control schemes) are the
following: ud ¼ 2p$10, uh ¼ 0.1ud, ul ¼ 5.5ud, k1 ¼ ud, k2 ¼ 2,
AM ¼ 2, Am ¼ 0.001.
The methodology to evaluate the FC energyefficiency
First, the FC net power under sFF control is evaluated,
mentioned by equations (1) and (2).
The stationary value of FC net power is computed for the
FuelFrsFF and AirFrsFF set by the Fuel and Air flow rate’s reg-
ulators considering the FC current as common input (see
Fig. 8). If the switch is on AirFr position that is linear variable,
then the FC net power characteristics (which are shown in
Fig. 6) where drawn based on same simulation diagram.
The values of FC net power obtained for both compressors,
Pnet1 and Pnet2, are listed on column 4 and 6 of Table 1. The
values of the energy efficiency for the PEMFC systems based
on same the PEMFC stack are listed in column 9 and 10 of
Table 1.
Second, the FC net power under sFF control for the FuelFr is
evaluated (the values mentioned on column 2 of Table 1) and
ES control for the AirFr based on simulation diagram shown in
Table 1 e The FC net power under sFF control for airFR and Fu
IFC [A] FuelFrsFF [lpm] AirFrsFF [lpm] Pnet1 [W] Pcm1 [W
115 43.19 258.8 4730 636.2
120 45 270.1 4870 675
125 46.94 281.3 5004 714.7
130 48.82 300.7 5134 754.7
135 50.7 303.8 5259 795.1
140 52.58 315.1 5380 825.9
145 54.45 326.3 5498 877
Fig. 9. The results obtained are mentioned for both compres-
sors in Tables 2 and 3.
The values of the energy efficiency for the PEMFC systems
based on same the PEMFC stack are listed on column 7 of
Tables 2 and 3.
Third, the FC net power under sFF control for the AirFr is
evaluated (the values mentioned on the column 3 of Table 1)
and ES control for the FuelFr. Note that the simulation dia-
gram is similar with that shown in Fig. 9, excepting the fact
that the inputs for the fueling regulators were switched be-
tween them. The results obtained are mentioned for both
compressors in Tables 4 and 5.
The values of the energy efficiency for the PEMFC systems
based on same the PEMFC stack are listed on column 7 of
Tables 4 and 5.
An improvement in energy efficiency for PEMFC systems
can be noted in the last two cases in comparison with the first
case (the sFF control), but it is difficult to compare the obtained
results between them. This is because different values of the
FC current are obtained based on ES control in comparison
with the sFF control. Thus, if both AirFr and FuelFr inputs are
controlled, then amethod to evaluate the improvement in the
FC net power must be considered by comparison, as was
suggested in Introduction section based on Fig. 2.
The improvement in the FC net power
To compute the improvement in net power during the MEP
search process by both input variables two case are
considered.
First, is the case shown in Fig. 10, where the FuelFr is ES
controlled and the optimum AirFr is searched based on FC
current, which is ES controlled, too.
The two FC systems used are equally supplied with air and
hydrogen via the corresponding regulators. The AirFr regu-
lator is controlled by the current of the FC system that oper-
ates as reference under a given load. The load profile can be
set by the load sequence to be constant, linear variable, or to
follows a given load profile (see Fig. 2).
For the 6 kW FC stack supplied by compressor 1, the
improvement in the FC net power,DPnet(1fa)¼ Pnet(1fa)� Pnet(2fa),
is computed on column 2 of Table 6 and shown in Fig. 11. The
trend line shows that the improvement in the net power in-
creases with a rate of 1.3 W/A. Also, the improvement in the
FC net power, DPnet(2fa), for the 6 kW FC stack supplied by
compressor 2 is computed in column 3 of Table 6. In this case,
the improvement in the FC net power increases with a much
higher rate, which is of about 5.3 W/A. This means that the
elFr of the 6 kW FC stack supplied by CM1 and CM2.
] Pnet2 [W] Pcm2 [W] PFC [W] hsys1 [%] hsys2 [%]
4094 1272 5366 88.1 76.3
4194 1350 5545 87.8 75.6
4289 1429 5719 87.5 75.0
4379 1509 5889 87.2 74.4
4463 1590 6054 86.9 73.7
4544 1672 6216 86.6 73.1
4619 1754 6373 86.3 72.5
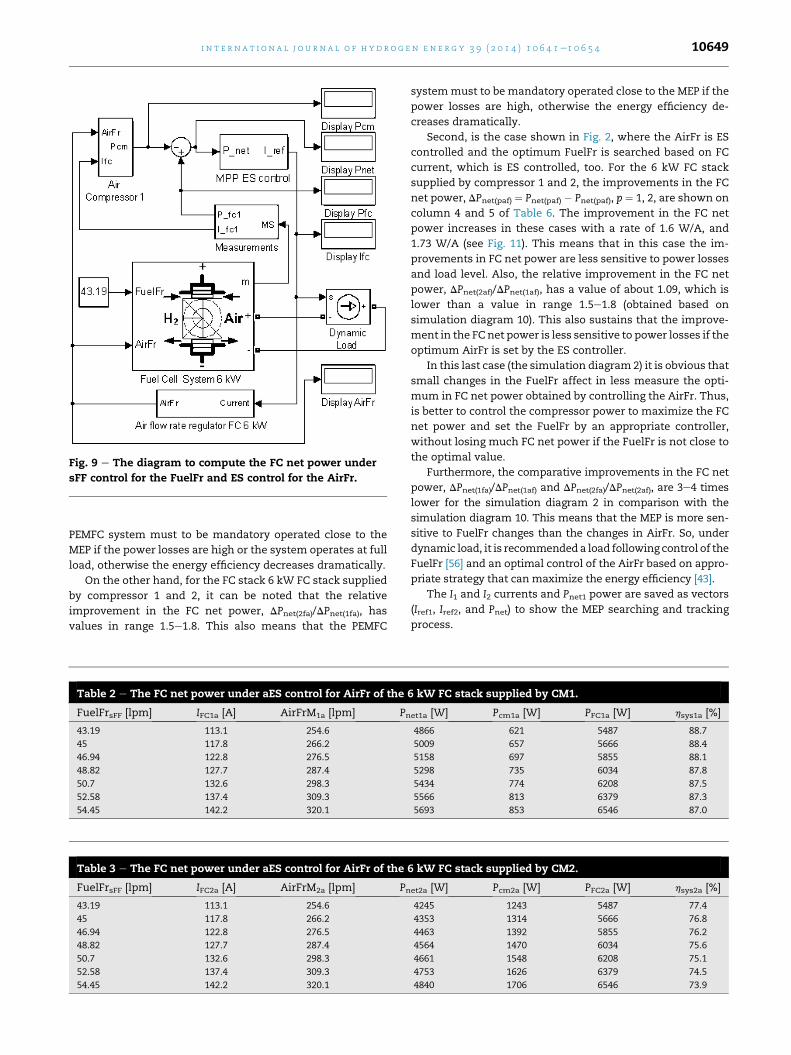
Fig. 9 e The diagram to compute the FC net power under
sFF control for the FuelFr and ES control for the AirFr.
i n t e r n a t i o n a l j o u r n a l o f h y d r o g e n en e r g y 3 9 ( 2 0 1 4 ) 1 0 6 4 1e1 0 6 5 4 10649
PEMFC system must to be mandatory operated close to the
MEP if the power losses are high or the system operates at full
load, otherwise the energy efficiency decreases dramatically.
On the other hand, for the FC stack 6 kW FC stack supplied
by compressor 1 and 2, it can be noted that the relative
improvement in the FC net power, DPnet(2fa)/DPnet(1fa), has
values in range 1.5e1.8. This also means that the PEMFC
Table 3 e The FC net power under aES control for AirFr of the
FuelFrsFF [lpm] IFC2a [A] AirFrM2a [lpm] Pn
43.19 113.1 254.6
45 117.8 266.2
46.94 122.8 276.5
48.82 127.7 287.4
50.7 132.6 298.3
52.58 137.4 309.3
54.45 142.2 320.1
Table 2 e The FC net power under aES control for AirFr of the
FuelFrsFF [lpm] IFC1a [A] AirFrM1a [lpm] Pn
43.19 113.1 254.6
45 117.8 266.2
46.94 122.8 276.5
48.82 127.7 287.4
50.7 132.6 298.3
52.58 137.4 309.3
54.45 142.2 320.1
systemmust to be mandatory operated close to the MEP if the
power losses are high, otherwise the energy efficiency de-
creases dramatically.
Second, is the case shown in Fig. 2, where the AirFr is ES
controlled and the optimum FuelFr is searched based on FC
current, which is ES controlled, too. For the 6 kW FC stack
supplied by compressor 1 and 2, the improvements in the FC
net power, DPnet(paf) ¼ Pnet(paf) � Pnet(paf), p ¼ 1, 2, are shown on
column 4 and 5 of Table 6. The improvement in the FC net
power increases in these cases with a rate of 1.6 W/A, and
1.73 W/A (see Fig. 11). This means that in this case the im-
provements in FC net power are less sensitive to power losses
and load level. Also, the relative improvement in the FC net
power, DPnet(2af)/DPnet(1af), has a value of about 1.09, which is
lower than a value in range 1.5e1.8 (obtained based on
simulation diagram 10). This also sustains that the improve-
ment in the FC net power is less sensitive to power losses if the
optimum AirFr is set by the ES controller.
In this last case (the simulation diagram 2) it is obvious that
small changes in the FuelFr affect in less measure the opti-
mum in FC net power obtained by controlling the AirFr. Thus,
is better to control the compressor power to maximize the FC
net power and set the FuelFr by an appropriate controller,
without losing much FC net power if the FuelFr is not close to
the optimal value.
Furthermore, the comparative improvements in the FC net
power, DPnet(1fa)/DPnet(1af) and DPnet(2fa)/DPnet(2af), are 3e4 times
lower for the simulation diagram 2 in comparison with the
simulation diagram 10. This means that the MEP is more sen-
sitive to FuelFr changes than the changes in AirFr. So, under
dynamic load, it is recommended a load following control of the
FuelFr [56] and an optimal control of the AirFr based on appro-
priate strategy that can maximize the energy efficiency [43].
The I1 and I2 currents and Pnet1 power are saved as vectors
(Iref1, Iref2, and Pnet) to show the MEP searching and tracking
process.
6 kW FC stack supplied by CM2.
et2a [W] Pcm2a [W] PFC2a [W] hsys2a [%]
4245 1243 5487 77.4
4353 1314 5666 76.8
4463 1392 5855 76.2
4564 1470 6034 75.6
4661 1548 6208 75.1
4753 1626 6379 74.5
4840 1706 6546 73.9
6 kW FC stack supplied by CM1.
et1a [W] Pcm1a [W] PFC1a [W] hsys1a [%]
4866 621 5487 88.7
5009 657 5666 88.4
5158 697 5855 88.1
5298 735 6034 87.8
5434 774 6208 87.5
5566 813 6379 87.3
5693 853 6546 87.0
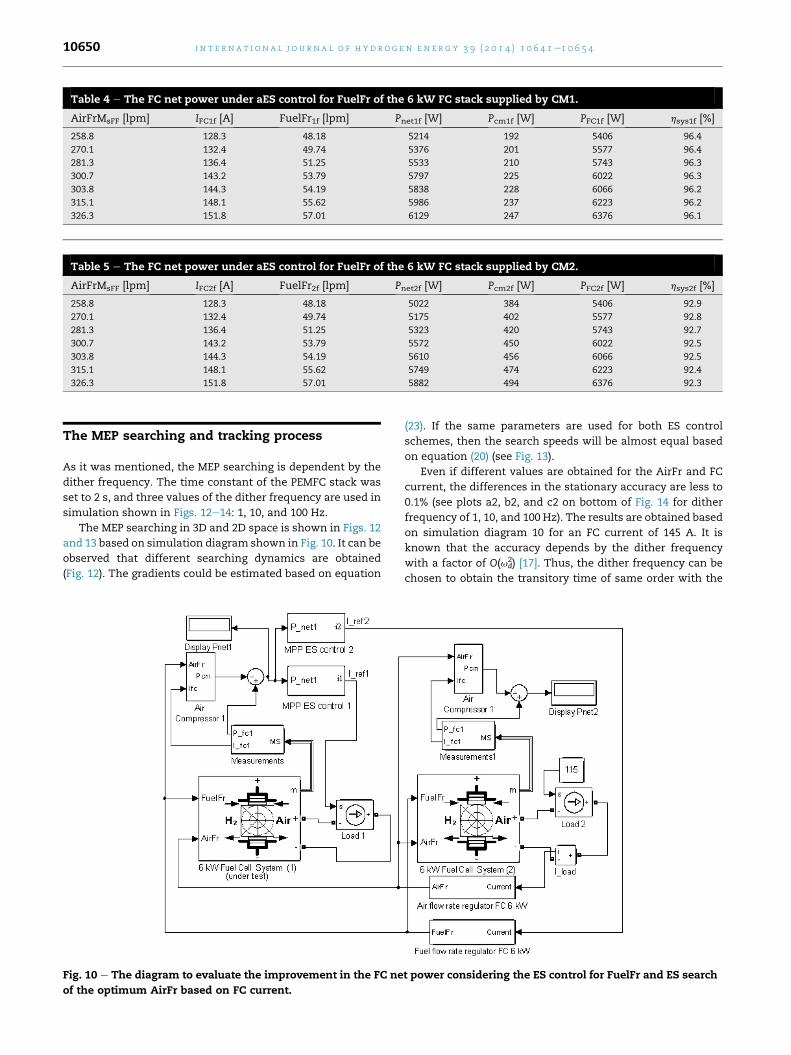
Table 4 e The FC net power under aES control for FuelFr of the 6 kW FC stack supplied by CM1.
AirFrMsFF [lpm] IFC1f [A] FuelFr1f [lpm] Pnet1f [W] Pcm1f [W] PFC1f [W] hsys1f [%]
258.8 128.3 48.18 5214 192 5406 96.4
270.1 132.4 49.74 5376 201 5577 96.4
281.3 136.4 51.25 5533 210 5743 96.3
300.7 143.2 53.79 5797 225 6022 96.3
303.8 144.3 54.19 5838 228 6066 96.2
315.1 148.1 55.62 5986 237 6223 96.2
326.3 151.8 57.01 6129 247 6376 96.1
Table 5 e The FC net power under aES control for FuelFr of the 6 kW FC stack supplied by CM2.
AirFrMsFF [lpm] IFC2f [A] FuelFr2f [lpm] Pnet2f [W] Pcm2f [W] PFC2f [W] hsys2f [%]
258.8 128.3 48.18 5022 384 5406 92.9
270.1 132.4 49.74 5175 402 5577 92.8
281.3 136.4 51.25 5323 420 5743 92.7
300.7 143.2 53.79 5572 450 6022 92.5
303.8 144.3 54.19 5610 456 6066 92.5
315.1 148.1 55.62 5749 474 6223 92.4
326.3 151.8 57.01 5882 494 6376 92.3
i n t e rn a t i o n a l j o u r n a l o f h y d r o g e n en e r g y 3 9 ( 2 0 1 4 ) 1 0 6 4 1e1 0 6 5 410650
The MEP searching and tracking process
As it was mentioned, the MEP searching is dependent by the
dither frequency. The time constant of the PEMFC stack was
set to 2 s, and three values of the dither frequency are used in
simulation shown in Figs. 12e14: 1, 10, and 100 Hz.
The MEP searching in 3D and 2D space is shown in Figs. 12
and 13 based on simulation diagram shown in Fig. 10. It can be
observed that different searching dynamics are obtained
(Fig. 12). The gradients could be estimated based on equation
Fig. 10 e The diagram to evaluate the improvement in the FC ne
of the optimum AirFr based on FC current.
(23). If the same parameters are used for both ES control
schemes, then the search speeds will be almost equal based
on equation (20) (see Fig. 13).
Even if different values are obtained for the AirFr and FC
current, the differences in the stationary accuracy are less to
0.1% (see plots a2, b2, and c2 on bottom of Fig. 14 for dither
frequency of 1, 10, and 100 Hz). The results are obtained based
on simulation diagram 10 for an FC current of 145 A. It is
known that the accuracy depends by the dither frequency
with a factor of O(ud2) [17]. Thus, the dither frequency can be
chosen to obtain the transitory time of same order with the
t power considering the ES control for FuelFr and ES search

Table 6 e The improvements in the FC net power usingsimulation diagram from Fig. 10 (DPnet(1fa) and DPnet(2fa))and Fig. 2 (DPnet(1af) and DPnet(2af)) for both compressors(CM1 and CM2).
IFC[A]
DPnet(1fa)[W]
DPnet(2fa)[W]
DPnet(1af)[W]
DPnet(2af)[W]
115 333 516 111 121
120 337 539 118 129
125 342 563 126 137
130 348 589 134 146
135 355 616 142 155
140 363 645 150 164
145 373 675 159 173
Fig. 12 e The 3D searching of FC net power for different
dither frequencies.
i n t e r n a t i o n a l j o u r n a l o f h y d r o g e n en e r g y 3 9 ( 2 0 1 4 ) 1 0 6 4 1e1 0 6 5 4 10651
PEMFC time constant in order to have the best compromise
between the accuracy and search speed. This conclusion is
also valid for the results obtained based on simulation dia-
gram 2, where the FuelFr is regulated by the ES control scheme
(see plots a1, b1, and c1 on top of Fig. 14).
It can be observed that the H1 magnitude of the FC net
current is high during the search phase and decreases to zero
during the stationary phase. The role of the H1 magnitude
under dynamic load will be shown based on simulation dia-
gram represented in Fig. 10. The dither frequency is set to
50 Hz here to have the best compromise between the accuracy
and search speed. The tracking of the dynamic load is shown
in Figs. 15 and 16, without and with the use of the current rate
limiter, respectively.
The H1 magnitude has high values during the searching
phase in both cases (see plot 2 on Figs. 15 and 16). Thus, the
amplitude of the gained dither must to be limited via a satu-
ration block in order to avoid unsafe gradients. In the first case
(with high search speed), the load profile can be tracked by the
FC net, but the oxygen starvation could appear during sharp
changes in load (see plot 3 on Fig. 15). So, an adaptive rate
limiter for the FC current must to be used [17], even if the
Fig. 11 e The improvement in the FC net power.
dynamic accuracy is reduced by the fueling rates that have a
controlled or limited slope (see plot 4 and 5 on Fig. 16).
Conclusion
In this paper it is performed a systematic approach of the
possibilities to increase the energy efficiency of the PEMFC
system under dynamic load. The dynamic MEP is tracked
using an ES control scheme. The FC net power values are
compared with those obtained using a sFF control scheme. A
mixed control scheme is then used to evaluate the improve-
ment in FC net power if the AirFr or FuelFr variable is used as
controlled input of the PEMFC system in the load following
loop. The improvements in FC net power are different, being
higher if the FuelFr is used as controlled input of the PEMFC
system in the load following loop. This means a lot of
hydrogen economy in standalone or vehicle applications.
Further, if the AirFr is also controlled via an ES controller, then
the MEP could be better tracked dynamically. The stationary
accuracy is about 99.9% for a large range of the dither fre-
quency, but the dynamic accuracy is more dependent on the
chosen value for the dither frequency. Thus, this must to be
set in relation with the principal time constant of the process
controlled. To have the best compromise between the
Fig. 13 e The 2D searching of FC net power for different
dither frequencies.

Fig. 14 e The searching of FC net power for different dither frequencies.
i n t e rn a t i o n a l j o u r n a l o f h y d r o g e n en e r g y 3 9 ( 2 0 1 4 ) 1 0 6 4 1e1 0 6 5 410652
accuracy and search speed, the dither period can be chosen of
about 100 times the principal time constant. In addition, to
avoid the oxygen starvation, an adaptive rate limiter of the
fueling rates to the FC current must to be used under dynamic
load.
In conclusion, the following remarks could be formulated:
1) the energy efficiencies are different for two proposed stra-
tegies of load following control based on the AirFr or FuelFr
variable; 2) the strategy of load following control based on
FuelFr seems to be more efficient, but this issues must be
Fig. 15 e The MEP searching without the use of the rate
limiter for the FC current.
comparatively analyzed based on hybrid power source topol-
ogies with those strategies implemented; 3) the parameters
designed for an appropriate MEP tracking controller must to
assure a limited search speed up to safe value to avoid oxygen
starvation; 4) the tracking controller design should focus
equally on tracking accuracy during transient and stationary
regimes of the PEMFC system under dynamic load.
Besides the higher tracking accuracy obtained, the SIDOES
control scheme proposed here to control the fueling rates
Fig. 16 e The MEP searching with the use of the rate limiter
for the FC current.

i n t e r n a t i o n a l j o u r n a l o f h y d r o g e n en e r g y 3 9 ( 2 0 1 4 ) 1 0 6 4 1e1 0 6 5 4 10653
presents other several advantages in comparison with re-
ported results in the literature: (1) it is faster, (2) it is robust,
and (3) the energy efficiency increases in all cases with a
percent that depend by the nominal power of the compressor.
Apart from these observations and advantages presented
by controlling both fueling rates via an SIDOES control
scheme, a number of issues arise to be further analyzed from
the point of view of the costs of these solutions: 1) the
advanced control solution proposed here must be compared
with the costless solutions that use one or both AirFr and
FuelFr variables with a fixed opening valve with imposed
characteristic pressure-flow; 2) the load following control e
FuelFr based must be compared with the load following con-
trol e AirFr based; 3) the adaptive rate limiter of the fueling
rates to the FC current must be compared with the costless
solutions that use a fixed rate limiter up to a safe value to
avoid oxygen starvation.
A global analysis that will consider the energy efficiency
and implementation costs may be considered to sustain these
advanced implementations suggested here or other from the
literature.
Acknowledgment
The research leading to these results has received funding
from the Romanian e EEA Research Programme operated by
the MEN e PO/UEFISCDI-IA under the Project EEA-JRP-RO-NO-
2013-1-0034 and PN-II-CT-RO-FR-2014-2-0019.
r e f e r e n c e s
[1] Teichmann D, Arlt W, Wasserscheid P. Liquid organichydrogen carriers as an efficient vector for the transport andstorage of renewable energy. Int J Hydrogen Energy2012;27(23):18118e32.
[2] Ghribi D, Khelifa A, Diaf S, Belhamel M. Study of hydrogenproduction system by using PV solar energy and PEMelectrolyser in Algeria. Int J Hydrogen Energy2013;38(20):8480e90.
[3] Petrov K, Baykara SZ, Ebrasu D, Gulin M, Veziroglu A. Anassessment of electrolytic hydrogen production from H2S inBlack Sea waters. Int J Hydrogen Energy 2011;36(15):8936e42.
[4] Barreto L, Makihira A, Riahi K. The hydrogen economy in the21st century: a sustainable development scenario. Int JHydrogen Energy 2003;28(3):267e84.
[5] Thounthong P, Rael S, Davat B. Analysis of supercapacitor assecond source based on fuel cell power generation. IEEETrans Energy Convers 2009;24(1):247e55.
[6] Erdinc O, Vural B, Uzunoglu M, Ates Y. Modeling and analysisof an FC/UC hybrid vehicular power system using a wavelet-fuzzy logic based load sharing and control algorithm. Int JHydrogen Energy 2009;34(12):5223e33.
[7] Vielstich W, Gasteiger H, Lamm A. Handbook of fuel cells e
fundamentals, technology, applications. New York: Wiley;2003.
[8] Eren Y, Erdinc O, Gorgun H, Uzunoglu M, Vural B. A fuzzylogic based supervisory controller for an FC/UC hybridvehicular power system. Int J Hydrogen Energy2009;34(20):8681e94.
[9] Hwang JJ. Effect of hydrogen delivery schemes on fuel cellefficiency. J Power Sources 2013;239:54e63.
[10] Santa Rosa DT, Pinto DG, Silva VS, Silva RA, Rangel CM. Highperformance PEMFC stack with open-cathode at ambientpressure and temperature conditions. Int J Hydrogen Energy2007;32(17):4350e7.
[11] Bussayajarn N, Ming H, Hoong KK, Stephan WYM, Hwa CS.Planar air breathing PEMFC with self-humidifying MEA andopen cathode geometry design for portable applications. Int JHydrogen Energy 2009;34:7761e7.
[12] Choi JW, Hwang YS, Seo JH, Lee DH, Cha SW, Kim MS.Optimization of hydrogen purge in PEMFC operating in dead-end mode. Int J Hydrogen Energy 2010;35:3698e711.
[13] Woo CH, Benziger JB. PEM fuel cell current regulation by fuelfeed control. Chem Eng Sci 2007;62:957e68.
[14] Becherif M, Hissel D. MPPT of a PEMFC based on air supplycontrol of the motocompressor group. Int J Hydrogen Energy2010;35(22):12521e30.
[15] Kunusch C, Puleston PF, Mayosky MA, Riera J. Sliding modestrategy for PEM fuel cells stacks breathing control using asuper-twisting algorithm. IEEE T Contr Syst T2009;17(1):167e73.
[16] Gelbert G, Moeck JP, Paschereit CO, King R. Advancedalgorithms for gradient estimation in one- and two-parameter extremum seeking controllers. J Process Contr2012;22:700e9.
[17] Dochain D, Perrier M, Guay M. Extremum seeking control andits application to process and reaction systems: a survey.Math Comput Simul 2011;82:369e80.
[18] Gou B, Na WK, Diong B. Fuel cells: modeling, control, andapplications. CRC Press; 2010. p. 6.
[19] Mehrdad E, Yimin G, Ali E. Modern electric, hybrid electric,and fuel cell vehicles. CRC Press; 2010. p. 15.
[20] Ehsani M, Gao Y, Emadi A. Modern electric, hybrid electric,and fuel cell vehiclesdfundamentals, theory, and design.China Machine Press; 2010. p. 3.
[21] Pukrushpan J, Stefanopoulou A, Peng H. Control of fuel cellpower systems: principles, modeling and analysis andfeedback design. Springer; 2004.
[22] Feroldi D, Serra M, Riera J. Energy management strategiesbased on efficiency map for fuel cell hybrid vehicles. J PowerSources 2009;190:387e401.
[23] Tirnovan R, Giurgea S, Miraoui A. Strategies for optimizingthe opening of the outlet air circuits nozzle to improve theefficiency of the PEMFC generator. Appl Energy2011;88:1197e204.
[24] Zhi-dan Z, Hai-bo H, Xin-jian Z, Guang-yi C, Yuan R. Adaptivemaximum power point tracking control of fuel cell powerplants. J Power Sources 2008;176:259e69.
[25] Zenith F, Skogestad S. Control of fuel cell power output. JProcess Cont 2007;17:333e47.
[26] Grujicic M, Chittajallu KM, Law EH, Pukrushpan JT. Model-based control strategies in the dynamic interactions of airsupply and fuel cell. Proc Inst Mech Eng Part A e J PowerEnergy 2004;218:487e99.
[27] Garcia-Gabin W, Dorado F, Bordons C. Real-timeimplementation of a sliding mode controller for air supply ona PEM fuel cell. J Process Contr 2010;20:325e36.
[28] Matraji Imad, Laghrouche Salah, Wack Maxime. Pressurecontrol in a PEM fuel cell via second order sliding mode. Int JHydrogen Energy 2012;37(21):16104e16.
[29] Jang M-H, Lee J-M, Kim J-H, Park J-H, Cho B-H. Maximumefficiency point tracking algorithm using oxygen access ratiocontrol for fuel cell systems. J Power Electron2011;11(2):194e201.
[30] Chang YA, Moura SJ. Air flow control in fuel cell systems: anextremum seeking approach. In: American controlconference; 2009. pp. 1052e9.

i n t e rn a t i o n a l j o u r n a l o f h y d r o g e n en e r g y 3 9 ( 2 0 1 4 ) 1 0 6 4 1e1 0 6 5 410654
[31] Dalvi A, Guay M. Control and real-time optimization of anautomotive hybrid fuel cell power system. Control Eng Pract2009;17:924e38.
[32] Gruber JK, Doll M, Bordons C. Design and experimentalvalidation of a constrained MPC for the air feed of a fuel cell.Control Eng Pract 2009;17:874e85.
[33] Vahidi A, Stefanopoulou A, Peng H. Current management ina hybrid fuel cell power system: a model-predictive controlapproach. IEEE Trans Control Syst Technol 2006;14:1047e57.
[34] Almeida PEM, Simoes MG. Neural optimal control of PEM fuelcells with parametric CMAC networks. IEEE Trans Ind Appl2005;41(1):237e45.
[35] Tekin M, Hissel D, Pera M-C, Kauffmann J-M. Energyconsumption reduction of a PEM fuel cell motor-compressorgroup thanks to efficient control laws. J Power Sources2006;156:57e63.
[36] Guo A, Chen W, Li Q, Liu Z, Que H. Air flow control based onoptimal oxygen excess ratio in fuel cells for vehicles. J ModTransp 2013;21(2):79e85.
[37] Niknezhadi A, AlluT-Fantova M, Kunusch C, Ocampo-Martfnez C. Design and implementation of LQR/LQGstrategies for oxygen stoichiometry control in PEM fuel cellsbased systems. J Power Sources 2011;196(9):4277e82.
[38] Al-Durra A, Yurkovich S, Guezennec Y. Study of nonlinearcontrol schemes for an automotive traction PEM fuel cellsystem. Int J Hydrogen Energy 2010;35:11291e307.
[39] da Fonseca R, Bideaux E, Gerard M, Jeanneret B, Desbois-Renaudin M, Sari A. Control of PEMFC system air group usingdifferential flatness approach: validation by a dynamic fuelcell system model. Appl Energy 2014;113:219e29.
[40] Thounthong P, Tricoli P, Davat B. Performance investigationof linear and nonlinear controls for a fuel cell/supercapacitorhybrid power plan. Int J Elect Power 2014;54:454e64.
[41] Wanga Y-X, Xuan D-J, Kim Y-B. Design and experimentalimplementation of time delay control for air supply in apolymer electrolyte membrane fuel cell system. Int JHydrogen Energy 2013;38(1):3381e92.
[42] Zhang J, Liu G, Yu W, Ouyanga M. Adaptive control of theairflow of a PEM fuel cell system. J Power Sources2008;179:649e59.
[43] Tirnovan R, Giurgea S. Efficiency improvement of a PEMFCpower source by optimization of the air management. Int JHydrogen Energy 2012;37:7745e56.
[44] Bao C, Ouyang M, Yi B. Modeling and control of air streamand hydrogen flow with recirculation in a PEM fuel cellsystem e II. Int J Hydrogen Energy 2006;31:1897e913.
[45] Bizon N, Raducu M, Oproescu M, Constantinescu LM. On thesearch speed for the extremum seeking control 2D-schemes.Part II e performances estimation. In: Int conf on electronics,comp artificial intelligence e ECAI, 1; 2013. pp. 89e96. 10.1109/ECAI.2013.6636154; 2013.
[46] Krsti¢ M, Wang HeH. Design and stability analysis ofextremum seeking feedback for general nonlinear systems.Automatica 2000;36(2):595e601.
[47] Ariyur KB, Krstic M. Real-time optimization by extremum-seeking control. Wiley-Interscience, John Wiley & Sons Inc.;2003.
[48] Restrepo C, Ramos-Paja CA, Giral R, Calvente J, Romero A.Fuel cell emulator for oxygen excess ratio estimation onpower electronics applications. Comp Elec Eng2012;38:926e37.
[49] Li Q, Chen W, Liu Z, Guo A, Liu S. Control of proton exchangemembrane fuel cell system breathing based on maximumnet power control strategy. J Power Sources 2013;241:212e8.
[50] Hwang JJ. Transient power characteristic measurement of aproton exchange membrane fuel cell generator. Int JHydrogen Energy 2013;38:3727e40.
[51] Laghrouche S, Matraji I, Ahmed FS, Jemei S, Wack M. Loadgovernor based on constrained extremum seeking for PEMfuel cell oxygen starvation and compressor surge protection.Int J Hydrogen Energy 2013;38(33):14314e22.
[52] Bizon N. FC energy harvesting using the MPP tracking basedon advanced extremum seeking control. Int J HydrogenEnergy 2013;38(4):1952e66.
[53] Tan Y, Nesic D, Mareels I. On the choice of dither inextremum seeking systems: a case study. Automatica2008;44:1446e50.
[54] DeHaan D, Guay M. Extremum-seeking control of state-constrained nonlinear systems. Automatica2005;41:1567e74.
[55] Adetola V, Guay M. Parameter convergence in adaptiveextremum-seeking control. Automatica 2007;43(1):105e10.
[56] Bizon N. Load-following mode control of a standalonerenewable/fuel cell hybrid power source. Energ ConversManage 2014;77:763e72.