A real-time 2D PEMFC model for fuel cell vehicle hardware-in-the-loop applications
6
A real-time 2D PEMFC model for fuel cell vehicle hardware-in-the-loop applications Pierre Massonnat IEEE student member IRTES-SET, University of Technology of Belfort Montbeliard, Belfort, France [email protected] Fei Gao IEEE member IRTES-SET, University of Technology of Belfort Montbeliard, Belfort, France [email protected] David Bouquain IRTES-SET, University of Technology of Belfort Montbeliard, Belfort, France [email protected] Abdellatif Miraoui IEEE senior member IRTES-SET, University of Technology of Belfort Montbeliard, Belfort, France [email protected] Abstract—In this paper, a real-time 2D PEMFC multi- physiques model is developed for fuel cell vehicle simulation purpose. For the consideration of real time model performance, an extrapolation method of a 1D channel pressure model into a 2D pressure map is used in the presented model. The developed PEMFC model is validated with experimental test. From the 2D modeling approach, different channel configuration types are also compared and discussed. The presented PEMFC model is developed for real-time fuel cell vehicle simulation and hardware- in-the-loop applications. I. I NTRODUCTION Fuel cell is a chemical/electrical energy conversion device. Among different type of fuel cells, proton exchange membrane fuel cell shows its great interest in vehicle applications due to its relatively fast start time. Compared to other conventional energy conversion devices, such as internal combustion engine (ICE), a higher energy conversion efficiency can be achieved by fuel cells, because the fuel cell can directly convert chem- ical energy into electricity. In addition, the byproduct of the fuel cell is only water, the emission of green house gas can be thus eliminated for vehicles running with fuel cells. In order to evaluate the fuel cell vehicle performance, a fuel cell model is needed. In the literature, a PEM fuel cell electrochemical model has been developed in [1]. However, the fluidic phenomena is not considered. A 1D multi-physiques real time PEMFC model has been presented in [2]. Due to its 1D approach, the fluid channel configurations are not taken into account. A 2D steady state model has been developed in [3], but the model is not suitable for real time simulations. Many 3D models have been presented in [4], [5] and [6] but all these models depend on commercial finite element software. A complex mathematics multi-physiques model have been developed in [7] and later a more simple one in [8]. A study of PEMFC model parametric sensitivity has been shown in [9]. For fuel cell vehicle on- board hydrogen generation, a PEM electrolyser model and a PEM fuel cell model have also been shown in [10]. Aimed to give a powerful simulation model for PEM fuel cell in vehicles and to understand the associated physical phenomenon, a real-time 2D PEMFC model is developed in this paper. This model is suitable for real-time hardware-in- the-loop applications. The paper is organized as follow: the multi-physiques PEMFC model is introduced in the first part. A presentation of the extrapolation method for 2D modeling approach is given in the second part of the paper. At last, the experimental validations of the model are presented and the results are discussed. II. PEM FUEL CELL MODEL A. Electrochemical model The potential of the fuel cell is determined by : U cell = U NERNST - U act - R mem × i (1) Where U NERNST is the thermodynamic potential in V, U act is the activation loss, R mem is the membrane resistance in Ω and i is the fuel cell current in A. 1) Thermodynamic potential: The thermodynamic poten- tial of a PEMFC is determined by the Nernst law in V: U NERNST =1.23 - 0.85 × 10 -3 (T - 298.15) +4.3085 × 10 -5 T ( ln (P H2 )+ 1 2 ln (P O2 ) ) (2) Where P H2 and P O2 are the respectives hydrogen and oxygen partial pressure in atm. 2) Activation loss: In a PEMFC, the Activation loss can be calculated by Butler-Volmer law : i = i 0 exp αnF RT U act - exp -(1 - α)nF RT U act (3) Where α is electrochemical reaction parameter, n is the number of exchanged electrons in electrochemical reaction and i 0 the electrode reference exchange current in A. 3) Membrane resistance: The membrane resistivity in Ω · m can be determined by the empirical model proposed by Springer found in [11], [12] and [13] : r mem = ( 1 0.1879 exp ( 1268 ( 1 T - 1 303 )) if λ ≤ 1 1 0.5139λ-0.326 exp ( 1268 ( 1 T - 1 303 )) if λ> 1 (4) Where membrane water content λ is the water content of the membrane. 978-1-4799-0224-8/13/$31.00 ©2013 IEEE 7238
-
Upload
independent -
Category
Documents
-
view
3 -
download
0
Transcript of A real-time 2D PEMFC model for fuel cell vehicle hardware-in-the-loop applications

A real-time 2D PEMFC model for fuel cell vehiclehardware-in-the-loop applications
Pierre MassonnatIEEE student member
IRTES-SET,University of Technologyof Belfort Montbeliard,
Belfort, [email protected]
Fei GaoIEEE member
IRTES-SET,University of Technologyof Belfort Montbeliard,
Belfort, [email protected]
David BouquainIRTES-SET,
University of Technologyof Belfort Montbeliard,
Belfort, [email protected]
Abdellatif MiraouiIEEE senior member
IRTES-SET,University of Technologyof Belfort Montbeliard,
Belfort, [email protected]
Abstract—In this paper, a real-time 2D PEMFC multi-physiques model is developed for fuel cell vehicle simulationpurpose. For the consideration of real time model performance,an extrapolation method of a 1D channel pressure model into a2D pressure map is used in the presented model. The developedPEMFC model is validated with experimental test. From the2D modeling approach, different channel configuration types arealso compared and discussed. The presented PEMFC model isdeveloped for real-time fuel cell vehicle simulation and hardware-in-the-loop applications.
I. INTRODUCTION
Fuel cell is a chemical/electrical energy conversion device.Among different type of fuel cells, proton exchange membranefuel cell shows its great interest in vehicle applications due toits relatively fast start time. Compared to other conventionalenergy conversion devices, such as internal combustion engine(ICE), a higher energy conversion efficiency can be achievedby fuel cells, because the fuel cell can directly convert chem-ical energy into electricity. In addition, the byproduct of thefuel cell is only water, the emission of green house gas can bethus eliminated for vehicles running with fuel cells. In orderto evaluate the fuel cell vehicle performance, a fuel cell modelis needed.
In the literature, a PEM fuel cell electrochemical modelhas been developed in [1]. However, the fluidic phenomena isnot considered. A 1D multi-physiques real time PEMFC modelhas been presented in [2]. Due to its 1D approach, the fluidchannel configurations are not taken into account. A 2D steadystate model has been developed in [3], but the model is notsuitable for real time simulations. Many 3D models have beenpresented in [4], [5] and [6] but all these models depend oncommercial finite element software. A complex mathematicsmulti-physiques model have been developed in [7] and later amore simple one in [8]. A study of PEMFC model parametricsensitivity has been shown in [9]. For fuel cell vehicle on-board hydrogen generation, a PEM electrolyser model and aPEM fuel cell model have also been shown in [10].
Aimed to give a powerful simulation model for PEM fuelcell in vehicles and to understand the associated physicalphenomenon, a real-time 2D PEMFC model is developed inthis paper. This model is suitable for real-time hardware-in-the-loop applications. The paper is organized as follow: the
multi-physiques PEMFC model is introduced in the first part.A presentation of the extrapolation method for 2D modelingapproach is given in the second part of the paper. At last, theexperimental validations of the model are presented and theresults are discussed.
II. PEM FUEL CELL MODEL
A. Electrochemical model
The potential of the fuel cell is determined by :
Ucell = UNERNST − Uact −Rmem × i (1)
Where UNERNST is the thermodynamic potential in V, Uactis the activation loss, Rmem is the membrane resistance in Ωand i is the fuel cell current in A.
1) Thermodynamic potential: The thermodynamic poten-tial of a PEMFC is determined by the Nernst law in V:
UNERNST = 1.23− 0.85× 10⁻³(T − 298.15)
+4.3085× 10⁻⁵T(ln (PH2
) + 12 ln (PO2
))(2)
Where PH2and PO2
are the respectives hydrogen andoxygen partial pressure in atm.
2) Activation loss: In a PEMFC, the Activation loss canbe calculated by Butler-Volmer law :
i = i0
(exp
(αnF
RTUact
)− exp
(−(1− α)nF
RTUact
))(3)
Where α is electrochemical reaction parameter, n is the numberof exchanged electrons in electrochemical reaction and i0 theelectrode reference exchange current in A.
3) Membrane resistance: The membrane resistivity in Ω ·m can be determined by the empirical model proposed bySpringer found in [11], [12] and [13] :
rmem =
1
0.1879exp(1268
(1T −
1303
))if λ ≤ 1
10.5139λ−0.326exp
(1268
(1T −
1303
))if λ > 1
(4)Where membrane water content λ is the water content of themembrane.
978-1-4799-0224-8/13/$31.00 ©2013 IEEE 7238

The λ is expressed as:
λ =
0.043 + 17.81amem − 39.85a2mem + 36.0a3mem
if amem < 1
14 + 1.4(amem − 1) if amem ≥ 1 and amem < 3
16.8 if amem ≥ 3(5)
Where amem is the water activity of membrane.
From the equations above, the membrane resistance Rmemis then determined by :
Rmem =rmemδmem
A(6)
Where A is the fuel cell section area and δmem themembrane thickness in m2 and m respectively.
B. Mass transfer model
A 1D mass transfer model is developed first in this sectionto determinate the variations of mass transfer parameters infuel cell channels. After that, the 1D model is then exportedto a 2D matrix by linear interpolation method according tochannel configuration, in order to obtain a 2D model with theconsideration of channel geometry.
1) In the channel: The variation of gas pressure in channelis due to two main phenomena : the friction of gas in thechannel and the diffusion from channel to the gas diffusionlayer.
The gas pressure drop due to the friction can be modeledby Darcy-Weisbach’s law [2] :
∆P = fDρL
Dh× u2
2(7)
Where fD is the Darcy’s parameter in kg ·m−1 · s−2, Dh isthe hydraulic diameter in m, L is the length of channel in m.ρ is the gas density in kg ·m−3, u the gas average speed inm · s−1.
The Darcy’s parameter can be calculated from:
fD =64
Re(8)
Where Re is the Reynold number.
The hydraulic diameter is calculated by :
Dh =4SchaPcha
(9)
Where Scha is the channel surface area and Pcha the perimeterof the section of the channel.
The gas pressure drop due to the diffusion from channel tothe gas difusion layer can be determined by mass conservationlaw :
ρinSchauin − ρoutSchauout −N = 0 (10)
Where N is the mass flow rate across Diffusion layer in kg ·s−1.
1D 2D
Fig. 1. Two dimensional pressure interpolation
2) In Diffusion layer: The first law of Fick is used tocalculate the concentration gradient gaz between channels andgas reaction sites :
N = −Deffi,j
∂ρ
∂x=⇒ ∂ρ = −N∂x
Deffi,j
(11)
Where Deffi,j is the effective diffusivity coefficient, which can
be calculated from Slattery-Bird formula and Bruggemanncorrection:
Di,j = 10.1325Ptot
a
(T√
Tcrit,iTcrit,j
)b (Pcrit,iPcrit,j
1013252
)1/3×(Tcrit,iTcrit,j)
5/12(
10−3
Mi+ 10−3
Mj
)1/2(12)
Deffi,j = Di,j × εξ (13)
Where a = 3.64 × 10⁻⁴ and b = 2.334 because H2O isa polar gas. Tcrit and Pcrit are parameters depending on thegas type. Ptot is the total pressure of the gas.
The mass flows rate of the gas to the gas diffusion layerare directly related to fuel cell current:
NH2= i
MH2
2F(14)
NO2 = iMO2
4F(15)
NH2O = iMH2O
2F(16)
Where M is the molar mass of the gas in kg ·mol−1, i thefuel cell current in A and F is the Faraday constant.
III. NUMERIC SOLVER SCHEME
In order to get a 2D pressure map in the channel withminimal calculation time, a one dimetional mass transfermodel is used to calculate the pressur in channels. After that,the one dimentional map is interpolated to a two dimentionalmap (cf figure 1). Then, the medium pressur is calculated forthe parametric calculation in electrochemical model.
7239
X
P
n n+1
P
function
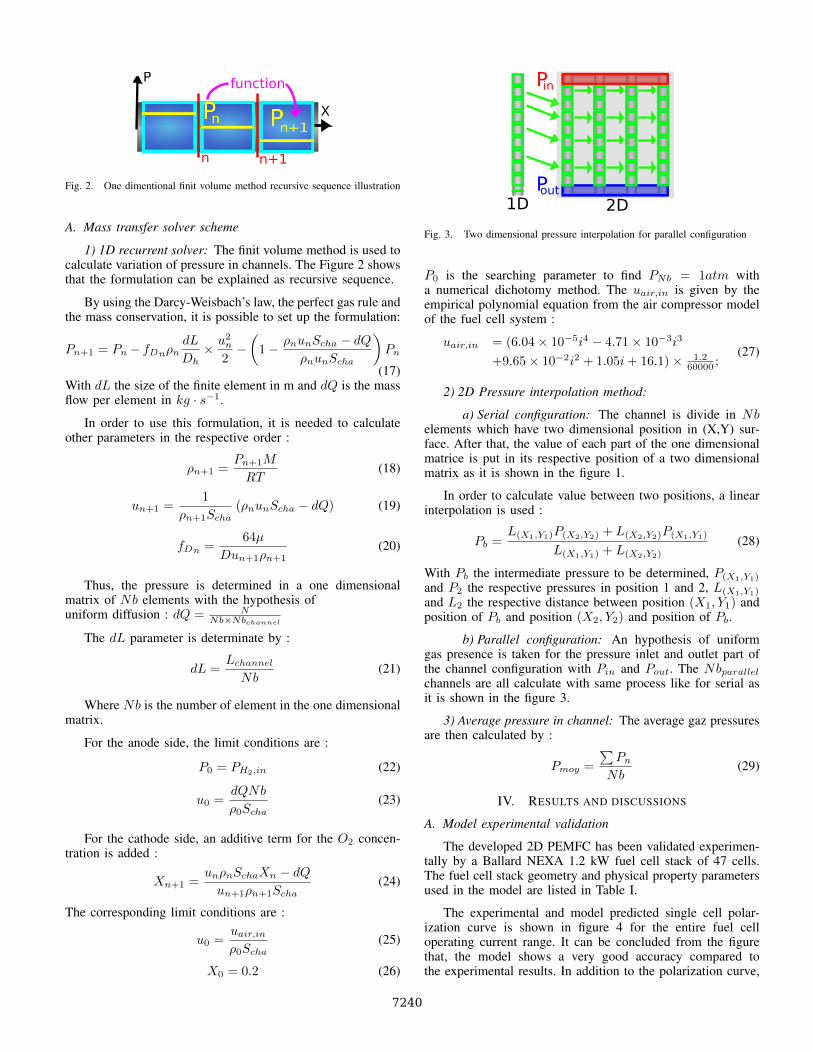
Fig. 2. One dimentional finit volume method recursive sequence illustration
A. Mass transfer solver scheme
1) 1D recurrent solver: The finit volume method is used tocalculate variation of pressure in channels. The Figure 2 showsthat the formulation can be explained as recursive sequence.
By using the Darcy-Weisbach’s law, the perfect gas rule andthe mass conservation, it is possible to set up the formulation:
Pn+1 = Pn− fDnρndL
Dh× u2n
2−(
1− ρnunScha − dQρnunScha
)Pn
(17)With dL the size of the finite element in m and dQ is the massflow per element in kg · s−1.
In order to use this formulation, it is needed to calculateother parameters in the respective order :
ρn+1 =Pn+1M
RT(18)
un+1 =1
ρn+1Scha(ρnunScha − dQ) (19)
fDn =64µ
Dun+1ρn+1(20)
Thus, the pressure is determined in a one dimensionalmatrix of Nb elements with the hypothesis ofuniform diffusion : dQ = N
Nb×Nbchannel
The dL parameter is determinate by :
dL =LchannelNb
(21)
Where Nb is the number of element in the one dimensionalmatrix.
For the anode side, the limit conditions are :
P0 = PH2,in (22)
u0 =dQNb
ρ0Scha(23)
For the cathode side, an additive term for the O2 concen-tration is added :
Xn+1 =unρnSchaXn − dQun+1ρn+1Scha
(24)
The corresponding limit conditions are :
u0 =uair,inρ0Scha
(25)
X0 = 0.2 (26)
1D 2D
Pin
Pout
Fig. 3. Two dimensional pressure interpolation for parallel configuration
P0 is the searching parameter to find PNb = 1atm witha numerical dichotomy method. The uair,in is given by theempirical polynomial equation from the air compressor modelof the fuel cell system :
uair,in = (6.04× 10⁻⁵i4 − 4.71× 10⁻³i3
+9.65× 10⁻²i2 + 1.05i+ 16.1)× 1.260000 ;
(27)
2) 2D Pressure interpolation method:
a) Serial configuration: The channel is divide in Nbelements which have two dimensional position in (X,Y) sur-face. After that, the value of each part of the one dimensionalmatrice is put in its respective position of a two dimensionalmatrix as it is shown in the figure 1.
In order to calculate value between two positions, a linearinterpolation is used :
Pb =L(X1,Y1)P(X2,Y2) + L(X2,Y2)P(X1,Y1)
L(X1,Y1) + L(X2,Y2)(28)
With Pb the intermediate pressure to be determined, P(X1,Y1)
and P2 the respective pressures in position 1 and 2, L(X1,Y1)
and L2 the respective distance between position (X1, Y1) andposition of Pb and position (X2, Y2) and position of Pb.
b) Parallel configuration: An hypothesis of uniformgas presence is taken for the pressure inlet and outlet part ofthe channel configuration with Pin and Pout. The Nbparallelchannels are all calculate with same process like for serial asit is shown in the figure 3.
3) Average pressure in channel: The average gaz pressuresare then calculated by :
Pmoy =
∑Pn
Nb(29)
IV. RESULTS AND DISCUSSIONS
A. Model experimental validation
The developed 2D PEMFC has been validated experimen-tally by a Ballard NEXA 1.2 kW fuel cell stack of 47 cells.The fuel cell stack geometry and physical property parametersused in the model are listed in Table I.
The experimental and model predicted single cell polar-ization curve is shown in figure 4 for the entire fuel celloperating current range. It can be concluded from the figurethat, the model shows a very good accuracy compared tothe experimental results. In addition to the polarization curve,
7240

TABLE I. BALLARD NEXA FUEL CELL STACK AND SIMULATIONPARAMETERS
Parameter Symbol ValueCell geometryAnode channel length LH2
8.807e-1 mAnode channel size DH2
2.0e-3 mAnode channel area Scha,H2
4.0e-6 m2
Anode channel perimeter Pcha,H28.0e-3 m
Anode channel number Nbchannel,H26
Cathode channel length Lair 2.264 mCathode channel size Dair 2.0e-3 mCathode channel area Scha,air 4.0e-6 m2
Cathode channel perimeter Pcha,air 8.0e-3 mCathode channel number Nbchannel,air 2Cell surface A 1.4758e-2 m2
Gas diffusion layer porosity ε 0.45Tortuosity ξ 1.5Gas diffusion layer thickness δGDL 400e-6 mMembrane thickness δmem 200e-6 mButler and Volmer parametersExchanging current i0ref 1.416 A ·m−2
Symetry parameter α 0.25Number of electron exchanged n 2Cell operating conditionsHydrogen supply pressure PH2,in 200000 PaFuel cell temperature T 333 KHydrogen wetness HH2
90 %Air wetness Hair 70 %Hydrogen dynamic viscosity µH2
9.3e-6 Pa · sAir dynamic viscosity µAir 19.4e-6 Pa · sPhysical ConstantPerfect gas constant R 8.314462 J ·mol−1 ·K−1
Faraday constant F 96474.70347 C ·mol−1
Solver parametersFinite elements number Nb 27Parallel channels number Nbparallele 9
0 10 20 30 40 500.4
0.5
0.6
0.7
0.8
0.9
1
1.1
fuel cell current (A)
SinglePEMFCoutputvoltage(V) experimental data
Model
Fig. 4. Polarisation curve for one cell
the model experimental validation has also been made fromdifferent cell temporal current profiles of the 47 cell fuel cellstack.
The figure 5 show a very high dynamic current profiles of300 seconds which is similar to a short fuel cell vehicle drivingcycle. The measured fuel cells stack voltage and the modelpredicted voltage are shown and compared in figure 6. A verygood agreement between the simulation and experimentationcan be seen from the figure. For the whole time range, themaximum difference between the two curves is less than 10 %for a fuel cell stack of 47 individual cells.
A relatively low dynamic current profile is illustrated infigure 7. The stack voltages from both experimental and modelare presented in figure 8. The model predicted values havea good agreement with the experimental one in general. A
0 50 100 150 200 250 3000
5
10
15
20
25
30
35
40
45
50
Time (s)
Curr
ent(A
)
Experimental current (A)
Fig. 5. Experimental validation with fast dynamic 1 (Current)
0 50 100 150 200 250 3000
5
10
15
20
25
30
35
40
45
50
time(s)
po
ten
tia
l(V
)
model
experimental
Fig. 6. Experimental Validation with fast dynamic 1
0 100 200 300 400 500 6000
5
10
15
20
25
30
35
40
45
Time (s)
Curr
ent(A
)
Experimental current (A)
Fig. 7. Experimental Validation with slow dynamic 1 (Current)
slight difference can be observed at high current value. Thepossible reason for that difference is the over-estimation ofthe membrane water content in the developed model. In fact,for the real-time computation efficiency consideration, themembrane water content in the model is simply calculatedfrom the average of the water activities of the anode andthe cathode side. A more accurate nonlinear membrane watercontent model could be used in order to improve the water con-tent estimation [14]. However the model real-time simulationcapacity would be reduced in that case due to the complexityof the nonlinear model
7241

0 100 200 300 400 500 6000
5
10
15
20
25
30
35
40
45
50
time(s)
pote
ntial(V
)
model
experimental
Fig. 8. Experimental Validation with slow dynamic 1
0 10 20 30 40 50 60 70 80 90 1000
5
10
15
20
25
30
35
40
45
50
Time (s)
Curr
ent(A
)
Experimental cuurent
Fig. 9. Experimental Validation with fast dynamic 2 (Current)
Another current profile and the corresponding stack voltagefrom experimentation and simulation are shown in figure 9and figure 10. The developed model shows a good agreementwith the experimental results. A clear dynamic effect of thestack voltage can be seen from the experimental curve forconstant current values. This dynamic is due to the fuel cellstack thermal capacity and the temperature variation duringthe operating [15]. This phenomenon cannot be reproducedfrom the current simulation, because the thermal dynamicof the fuel cell is not considered in the developed PEMFCmodel. Nevertheless, it can be seen from the figure that, themeasured stack voltage converges closely to the steady-statemodel predicted value at the end of the thermal transient time.
A fourth current profile for model validation purpose ispresented in figure 11. The figure 12 shows the model andexperimental results for the fuel cell stack voltage. The resultsshow again a good model accuracy of the model at differentcurrent values.
B. Reactant gas pressure in the channels
As described in the modeling section above, the developed2D model is able to predict the channel pressure distributionfor different gas supply channel geometry (serial and parallelconfiguration in particular). The Ballard NEXA fuel cell stackused for model experimental validation has serial channelgeometry for anode hydrogen supply and parallel channelgeometry for cathode air supply. From the model simulation,
0 10 20 30 40 50 60 70 80 90 1000
5
10
15
20
25
30
35
40
time(s)
pote
ntial(V
)
model
experimental
Fig. 10. Experimental Validation with fast dynamic 2
0 100 200 300 400 500 6000
5
10
15
20
25
30
35
40
45
Time (s)
Curr
ent(A
)
Experimental current (A)
Fig. 11. Experimental Validation with slow dynamic 2 (Current)
0 100 200 300 400 500 6000
5
10
15
20
25
30
35
40
45
50
time(s)
pote
ntial(V
)
model
experimental
Fig. 12. Experimental Validation with slow dynamic 2
the corresponding gas pressure maps in the anode and cathodechannels are also presented in the figure 13 and figure 14, re-spectively. It should be noted that the pressure value presentedin figure 14 is the oxygen partial pressure in channel, whichhas a molar fraction of 21 % in the air. It can also be seenfrom the figures that, the pressure drop in the parallel channelsis smaller compared to the serial one.
C. Practical efficiency modeling aspects
As it was explained, The main advantage of this modeleis its abilit to work in real time. Its calculation time is very
7242

Fig. 13. Anode side channels pressure map (Pa)
Fig. 14. Cathode side channels pressure map (Pa)
fast with less than 0.1s to calculate everything. But at thesame time, it is not a one dimentional model, it gives a twodimentional pressure estimation matrix. The accurency of thisnumerical methode is medium low compare to usual numericalmethode used in the models [3], [4] because the mistake risewith the channel longness.
Some ossilations can be seen on the polarisation curve firhight current due to a begining of instabilities. The main aspectof this model is a compromise between fastness and stabilitywhich does not existe in other modeles [5] and [6].
V. CONCLUSION
In this paper, a real-time 2D PEMFC multiphysiques modelhas been developed. The fuel cell polarization curve, stackvoltage temporal response for different current profiles and2D gas pressure map for anode and cathode channels arepresented and discussed. The developed model is validatedexperimentally with a commercial Ballard NEXA 1.2 kW fuelcell stack. The model predicted results show a very goodaccuracy compared with the experimental data. In order toimprove the real-time simulation capacity of the model, a 1Dto 2D numerical interpolation method has also been proposedto obtain the 2D gas pressure map in the cathode and the anodegas supply channel with the consideration of the differentchannel geometry configurations.
The presented real-time model is developed for a hybridvehicle Hardware-in-the-Loop (HiL) application. In hybrid
vehicle design, the fuel cell stack is usually combined withthe supercapacitor and the battery. In our application, thefuel cell stack is operated around an operating point and thesupercapacitor absorbs or provides the transient peak powerdemand during vehicle operation.
Improvement and future works include the consideration ofnonlinear polymer membrane water content by modeling theelectro osmotic drag and the back diffusion phenomena in themembrane and the expansion of the fluidic domain model tocompare and estimate 2D gas distribution in different fuel cellcomponents for design purpose.
REFERENCES
[1] R. F. Mann, J. C. Amphlett, M. A. I. Hooper, H. M. Jensen, B. A.Peppley, and P. R. Roberge, “Development and application of a gener-alised steady-state electrochemical model for a pem fuel cell,” Journalof Power Sources, vol. 86, pp. 173–180, 2000.
[2] F. Gao, B. Blunier, and A. Miraoui, Modelisation de piles combustiblemembrane changeuse de protons, Lavoisier, Ed. Kermes Science, 2011.
[3] R. M. Rao, D. Bhattacharyya, R. Rengaswamy, and S. Choudhury, “Atwo-dimensional steady state model including the effect of liquid waterfor a pem fuel cell cathode,” Journal of Power Sources, vol. 1, pp.375–393, 2007.
[4] M. Hu, A. Gu, M. Wang, X. Zhu, and L. Yu, “Three dimensional,two phase flow mathematical model for pem fuel cell: Part i. modeldevelopment,” Energy Conversion and Management, vol. 45, pp. 1861–1882, 2004.
[5] H. Meng, “A three-dimensional pem fuel cell model with consistenttreatment of water transport in mea,” Journal of Power Sources, vol.162, pp. 426–435, 2006.
[6] M. A. R. S. Al-Baghdadi, “Three-dimensional computational fluiddynamics model of a tubular-shaped pem fuel cell,” Renewable Energy,vol. 33, pp. 1334–1345, 2008.
[7] J. Baschuk and X. Li, “A general formulation for a mathematical pemfuel cell model,” Journal of Power Sources, vol. 142, pp. 134–153,2004.
[8] ——, “A comprehensive, consistent and systematic mathematical modelof pem fuel cells,” Applied Energy, vol. 86, pp. 181–193, 2009.
[9] G. N. Srinivasulu, T. Subrahmanyam, and V. D. Rao, “Parametric sen-sitivity analysis of pem fuel cell electrochemical model,” InternationalJournal of Hydrogen Energy, vol. 36, pp. 14 838–4844, 2011.
[10] R. Garca-Valverde, N. Espinosa, and A. Urbina, “Simple pem waterelectrolyser model and experimental validation,” International Journalof Hydrogen Energy, vol. 37, pp. 1927–1938, 2012.
[11] C. Bao, M. Ouyang, and B. Yi, “Modeling and control of air stream andhydrogen flow with recirculation in a pem fuel cell system-i. control-oriented modeling,” International Journal of Hydrogen Energy, vol. 141,pp. 96–101, 2005.
[12] F. Barbir, H. Gorgun, and X. Wang, “Relationship between pressuredrop and cell resistance as a diagnostic tool for pem fuel cells,” Journalof Power Sources, vol. 141, pp. 96–101, 2005.
[13] A. Rowe and X. Li, “Mathematical modeling of proton exchangemembrane fuel cells,” Journal of Power Sources, vol. 102, pp. 82–96,2001.
[14] F. Gao, B. Blunier, A. Miraoui, and A. El-Moudni, “Cell layer levelgeneralized dynamic modeling of a pemfc stack using vhdl-ams lan-guage,” International Journal of Hydrogen Energy, vol. 34, no. 13, pp.5498 – 5521, 2009.
[15] ——, “A multiphysic dynamic 1-d model of a proton-exchange-membrane fuel-cell stack for real-time simulation,” Industrial Electron-ics, IEEE Transactions on, vol. 57, no. 6, pp. 1853–1864, 2010.
7243
Powered by TCPDF (www.tcpdf.org)