Improving Program Quality: The Role of Process Measurement Data
10
PROCEEDINGS OF THE 44 TH ANNUAL SOUTHERN AFRICAN COMPUTER LECTURERS ASSOCIATION 2015 (SACLA 2015) “Renewing ICT teaching and learning: Building on the past to create new energies” 1-3 July 2015 Johannesburg South Africa Editor: Emma Coleman Publisher: University of the Witwatersrand, Johannesburg Private Bag X3 WITS 2050 ISBN: 978-0-620-65158-5 E-ISBN: 978-0-620-65159-2
Transcript of Improving Program Quality: The Role of Process Measurement Data

PROCEEDINGS OF THE 44
TH ANNUAL SOUTHERN AFRICAN COMPUTER
LECTURERS ASSOCIATION 2015 (SACLA 2015)
“Renewing ICT teaching and learning: Building on the past to create new energies”
1-3 July 2015 Johannesburg South Africa Editor: Emma Coleman Publisher: University of the Witwatersrand, Johannesburg Private Bag X3 WITS 2050 ISBN: 978-0-620-65158-5 E-ISBN: 978-0-620-65159-2
ii
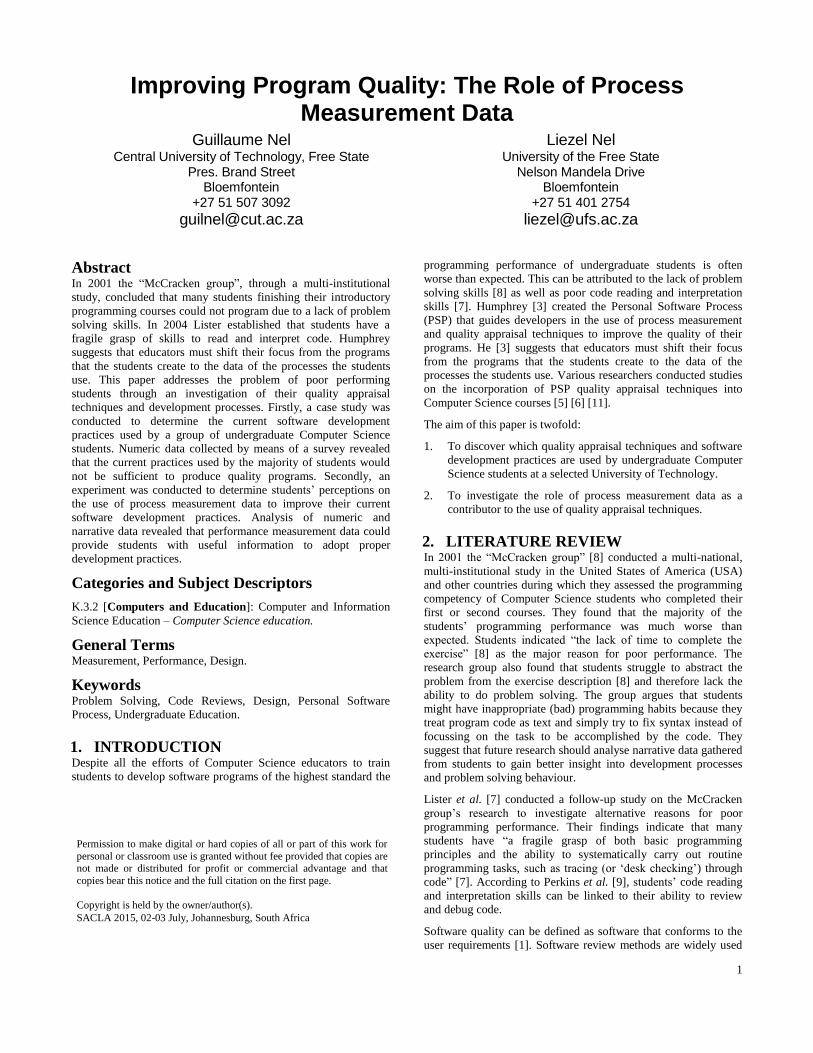
REFEREE PROCEDURE
The annual conference of the Southern African Computer Lecturers Association (SACLA) presents lecturers in
tertiary departments of Computer Science and Information Systems with an opportunity to share experiences of
teaching from undergraduate to doctoral levels. The theme of SACLA 2015 is ‘Renewing ICT teaching and
learning: building on the past to create new energies’.
The research papers included in the PROCEEDINGS OF THE 44th ANNUAL SOUTHERN AFRICAN
COMPUTER LECTURERS ASSOCIATION CONFERENCE (SACLA 2015) were each double-blind peer
reviewed by at least two members of the programme committee. The program committee consisted of both local
and international experts in the fields of computer science and information systems education, and having
expertise and interest in subjects relevant to the theme of the conference.
All papers were initially screened by the programme chairs for fit to the SACLA conference. Papers were then
sent for peer review. A total of 61 academics from 14 local and international institutions constituted the
programme committee and reviewed papers for the conference. .
The review process followed the double-blind peer review model. Every paper received at least two reviews. The
programme chairs solicited additional expert reviews in cases where further clarity was warranted.
Only original, previously unpublished, research papers in English were considered and papers were reviewed
according to South Africa’s Department of Higher Education and Training (DHET) refereeing standards. Papers
were reviewed according to the following criteria:
Relevance of the paper to the conference theme
Originality of the research contribution
Technical/scientific merit of the research
Presentation and clarity of the paper
Before accepting a paper, authors were to include the corrections as stated by the peer reviewers. The double-
blind review process was highly selective. Of the 55 academic papers received for consideration, 27 papers were
accepted for inclusion in the Proceedings after the required changes were made. This constitutes a 49%
acceptance rate of contributed papers. The papers accepted cover a wide range of relevant topics within the
conference theme, and are reproduced within these proceedings.
Dr Emma Coleman, Prof Judy Backhouse, Prof Jason Cohen
The Program Chairs: SACLA 2015
July 2015
School of Economic and Business Sciences
University of the Witwatersrand, Johannesburg
South Africa
Tel: +27 (0)11 717 8160 Fax: +27 (0)11 717 8139

iii
SACLA 2015 COMMITTEE
SACLA 2015 is hosted by the Division of Information Systems, School of Economic and Business Sciences at the
University of the Witwatersrand, Johannesburg.
Emma Coleman (Conference Chair and Programme Co-Chair)
Judy Backhouse (Programme Co-Chair and Workshop Coordinator)
Jason Cohen (Programme Co-Chair and M&D Session Coordinator)
Suzanne Sackstein (Organising Committee Chair)
Mitchell Hughes (Organising Committee and HOD Colloquium Coordinator)
Thomas Grace (Conference Webmaster)
Nalukui Malambo (Organising Committee)
PROGRAM COMMITTEE SACLA 2015
1. Adele Botha (CSIR)
2. Anitta Thomas (UNISA)
3. Arash Raeisi (University of Salford, UK)
4. Beula Samuel (UNISA)
5. Carina De Villiers (University of Pretoria)
6. Colin Pilkington (UNISA)
7. Conrad Mueller (UNISA)
8. Desiree Hamman-Fisher (University of the
Western Cape)
9. Elmarie Kritzinger (UNISA)
10. Elsje Scott (University of Cape Town)
11. Emma Coleman (Wits University)
12. Guillaume Nel (Central University of
Technology)
13. Helene Gelderblom (University of Pretoria)
14. Henk Pretorius (University of Pretoria)
15. Hima Vadapalli (Wits University)
16. Hugo Lotriet (UNISA)
17. Imelda Smit (North West University)
18. Jaco Pretorius (University of Pretoria)
19. Jan Kroeze (UNISA)
20. Jane Nash (Rhodes University)
21. Jason Cohen (Wits University)
22. Jean-Marie Bancilhon (Wits University)
23. Jean-Paul Van Belle (University of Cape
Town)
24. Judy Backhouse (Wits University)
25. Judy van Biljon (UNISA)
26. Karen Renaud (University of Glasgow)
27. Ken Halland (UNISA)
28. Ken Nixon (Wits University)
29. Kerry-Lynn Thomson (Nelson Mandela
Metropolitan University)
30. Laurette Pretorius (UNISA)
31. Laurie Butgereit (Nelson Mandela
Metropolitan University)
32. Leda van der Post (Nelson Mandela
Metropolitan University)
33. Liezel Nel (University of the Free State)
34. Linda Marshall (University of Pretoria)
35. Linda Spark (Wits University)
36. Lisa Seymour (University of Cape Town)
37. Lynn Futcher (Nelson Mandela
Metropolitan University)
38. Mac van der Merwe (UNISA)
39. Machdel Matthee (University of Pretoria)
40. Mariana Gerber (Nelson Mandela
Metropolitan University)
41. Marlien Herselman (CSIR)
42. Martina Jordaan (University of Pretoria)
43. Maureen Tanner (University of Cape Town)
44. Mitchell Hughes (Wits University)
45. Nompilo Tshuma (Rhodes University)
46. Patient Rambe (University of the Free State)
47. Patricia Lutu (University of Pretoria)
48. Ray Kekwaletswe (Wits University)
49. Reuben Dlamini (Wits University)
50. Romeo Botes (North West University)
51. Ronell van der Merwe (UNISA)
52. Roxanne Piderit (University of Fort Hare)
53. Susan Benvenuti (Wits University)
54. Suzanne Sackstein (Wits University)
55. Thomas Grace (Wits University)

iv
56. Thomas van der Merwe (UNISA)
57. Trish Alexander (UNISA)
58. Turgay Celik (Wits University)
59. Vincent Horner (UNISA)
60. Wallace Chigona (University of Cape Town)
61. Walter Uys (University of Cape Town)
SPONSORS
SACLA 2015 was made possible through the generous sponsorship of our partners.
SAP
Oracle
AOS
Deloitte
KPMG
School of Economic and Business Sciences, Wits University
1
Improving Program Quality: The Role of Process Measurement Data
Guillaume Nel Liezel Nel Central University of Technology, Free State University of the Free State Pres. Brand Street Nelson Mandela Drive Bloemfontein Bloemfontein +27 51 507 3092 +27 51 401 2754
[email protected] [email protected]
Abstract In 2001 the “McCracken group”, through a multi-institutional
study, concluded that many students finishing their introductory
programming courses could not program due to a lack of problem
solving skills. In 2004 Lister established that students have a
fragile grasp of skills to read and interpret code. Humphrey
suggests that educators must shift their focus from the programs
that the students create to the data of the processes the students
use. This paper addresses the problem of poor performing
students through an investigation of their quality appraisal
techniques and development processes. Firstly, a case study was
conducted to determine the current software development
practices used by a group of undergraduate Computer Science
students. Numeric data collected by means of a survey revealed
that the current practices used by the majority of students would
not be sufficient to produce quality programs. Secondly, an
experiment was conducted to determine students’ perceptions on
the use of process measurement data to improve their current
software development practices. Analysis of numeric and
narrative data revealed that performance measurement data could
provide students with useful information to adopt proper
development practices.
Categories and Subject Descriptors
K.3.2 [Computers and Education]: Computer and Information
Science Education – Computer Science education.
General Terms
Measurement, Performance, Design.
Keywords
Problem Solving, Code Reviews, Design, Personal Software
Process, Undergraduate Education.
1. INTRODUCTION Despite all the efforts of Computer Science educators to train
students to develop software programs of the highest standard the
programming performance of undergraduate students is often
worse than expected. This can be attributed to the lack of problem
solving skills [8] as well as poor code reading and interpretation
skills [7]. Humphrey [3] created the Personal Software Process
(PSP) that guides developers in the use of process measurement
and quality appraisal techniques to improve the quality of their
programs. He [3] suggests that educators must shift their focus
from the programs that the students create to the data of the
processes the students use. Various researchers conducted studies
on the incorporation of PSP quality appraisal techniques into
Computer Science courses [5] [6] [11].
The aim of this paper is twofold:
1. To discover which quality appraisal techniques and software
development practices are used by undergraduate Computer
Science students at a selected University of Technology.
2. To investigate the role of process measurement data as a
contributor to the use of quality appraisal techniques.
2. LITERATURE REVIEW In 2001 the “McCracken group” [8] conducted a multi-national,
multi-institutional study in the United States of America (USA)
and other countries during which they assessed the programming
competency of Computer Science students who completed their
first or second courses. They found that the majority of the
students’ programming performance was much worse than
expected. Students indicated “the lack of time to complete the
exercise” [8] as the major reason for poor performance. The
research group also found that students struggle to abstract the
problem from the exercise description [8] and therefore lack the
ability to do problem solving. The group argues that students
might have inappropriate (bad) programming habits because they
treat program code as text and simply try to fix syntax instead of
focussing on the task to be accomplished by the code. They
suggest that future research should analyse narrative data gathered
from students to gain better insight into development processes
and problem solving behaviour.
Lister et al. [7] conducted a follow-up study on the McCracken
group’s research to investigate alternative reasons for poor
programming performance. Their findings indicate that many
students have “a fragile grasp of both basic programming
principles and the ability to systematically carry out routine
programming tasks, such as tracing (or ‘desk checking’) through
code” [7]. According to Perkins et al. [9], students’ code reading
and interpretation skills can be linked to their ability to review
and debug code.
Software quality can be defined as software that conforms to the
user requirements [1]. Software review methods are widely used
Permission to make digital or hard copies of all or part of this work for
personal or classroom use is granted without fee provided that copies are not made or distributed for profit or commercial advantage and that
copies bear this notice and the full citation on the first page.
Copyright is held by the owner/author(s).
SACLA 2015, 02-03 July, Johannesburg, South Africa

2
in the industry to improve the quality of software programs [2]
[12]. Testing alone is seen as a very ineffective and time-
consuming debugging strategy [12]. According to Humphrey [4],
effective defect management is essential to managing cost and
schedule during software development and also contributes to
software quality. Humphrey states that testing alone is not the
most effective way to remove defects. He proposes the inclusion
of additional quality appraisal techniques such as inspections,
walkthroughs and personal reviews. An inspection is a kind of
structured team peer review process that was introduced by Mike
Fagan [2]. Walkthroughs are less formal with fewer steps than
inspections [12]. Fagan [2] concludes that a developer’s
productivity increases when he uses inspections because less time
is spent on unit testing. Schach [12] indicates the advantages in
time, cost and essentially project success when defects are picked
up early in the development life cycle.
Humphrey [4] regards inspections and walkthroughs as team
quality techniques. He proposes that individual developers should
review their work before peer inspection, hence the term
“personal reviews”. He indicates that despite all the literature that
guides developers on “good” practices and effective methods, the
only generally accepted short-term priority for a software
engineer is “coding and testing”.
Humphrey [3] claims that one of the biggest challenges in
software development is to persuade software engineers to use
effective methods. Engineers tend to stick to a personal process
that they develop from the first small program they have written
and it is difficult to convince them to adopt better practices.
Humphrey [4] created a PSP course in which a software engineer
gradually learns to adopt his/her software practices according to
personal measurements. The aim of the course is to improve
program quality through personal reviews and to enable an
engineer to make more accurate estimations based on personal
historical performance data (collected by the individual). Analysis
of thousands of PSP students’ measurement data indicate that
personal reviews improve program quality and that students spent
less time in the testing phase if they use quality appraisal
techniques. The course data also indicate an improvement on
predictions based on historical data. Humphrey [3] states that PSP
trained students in an educational environment will only use these
methods if the educator grade them on the use thereof, and that
most students will fall back on a process of coding and testing. He
suggests that Computer Science educators must shift their focus
from the programs that the students create to the data of the
processes the students use. A number of studies have
experimented with the incorporation of personal software process
techniques in educational environments.
Jenkins and Ademoye [5] conducted a pilot and follow-up
experiment in which students used personal code reviews to
improve the quality of their individual programs. Since the pilot
study indicated that students found it difficult to use the provided
checklist, the follow-up study used a different approach by first
training the students in tutorials how to use the checklists. As a
result these students found it easier to use the checklist reviews.
According to the students, the major problem they experienced
with the provided checklist for code reviews was the time spent to
do reviews. In both experiments the narrative feedback from the
students indicate that they believe the process of using code
reviews improved the quality of their programs although there are
no concrete evidence to support this statement.
Rong, Li, Xie and Zheng [11] designed an experiment in which
first year students used checklists to conduct personal reviews in
order to ascertain whether checklist based reviews can effectively
be used by inexperienced students. The authors concluded that
checklists are helpful to guide beginner programmers during code
reviews with the resulting review rates close to the suggested 200
lines of code (LOC)/hour benchmark prescribed by Humphrey [4].
They, however, found no concrete evidence that code reviews
with checklists will improve the efficiency of the reviews. The
study also showed that on average only 33% of the defects found
during code reviews were found with the aid of the checklist – an
indication that the checklist used were ineffective. For future
research, the authors suggest finding methods to improve the
effectiveness of checklists and investigating other factors that
might influence the efficiency of code reviews.
Kemerer and Paulk [6] investigated the effect of review rate on
defect removal effectiveness and the quality of software products.
They analysed data collected by PSP course students and found
that review rate is a significant factor for defect removal
effectiveness. They also found the recommended review rate of
200 LOC/hour or less to be effective for individual reviews.
3. METHODOLOGY This research study followed a mixed method approach based on
the Framework of Integrated Methodologies (FraIM) as suggested
by Plowright [10]. The context of this study was the Information
Technology department at a selected South African University of
Technology. The study was divided into two cases in order to
distinguish between the two main sources of data [10].
In Case 1 a case study was conducted to gather information
regarding undergraduate Computer Science students’ perceptions
of the quality appraisal techniques and software development
processes they normally use when developing programs. The
research population for this case included all first, second and
third year Computer Science students at the selected institution.
Data was collected by means of “asking questions” in a paper-
based self-completion survey containing closed questions [10].
The survey was distributed and completed during normal lectures.
A total of 251 students (the sample) completed the survey. This
sample included 74 first year, 113 second year and 64 third year
students. The numerical data collected through the survey was
analysed in MS Excel and the results grouped according to the
year-level of the respondents.
In Case 2 an experiment was conducted to gain a deeper
understanding of students’ development processes through the
collection of actual process data. The population for this case
included all third year Computer Science students at the selected
institution. These students were selected since they already had
intermediate programming skills and experience in software
defect removal strategies. From this population six students were
randomly selected to participate in the practical experiment. Data
collection included observations, asking questions (post-activity
survey and interviews) as well as artefact analysis (Process
Dashboard© data) [10].
The Case 2 experiment consisted of four steps as summarised in
Table 1. The instructor first conducted a tutorial activity to teach
students how to log and interpret performance measurement data
using the Process Dashboard© software. During this tutorial
students were required to do an exercise in which they had to log
time, size and defect measurements in different phases of the
software development life cycle. The various defect types and
examples of defects categorised into types were also discussed.
After the tutorial the students completed an individual
3
programming exercise during which they had to capture
performance data using the Process Dashboard© software. For this
programming exercise the students had to implement the code to
simulate the “Quick Pick Option” of the South African National
Lottery (LOTTO©) draw1.
Table 1: Experiment Design
Activity Duration Rationale
1 Instructor presents
performance
measurement
tutorial.
1 hour Teach students to do
process measures and
interpret process data.
2 Students do
programming
exercise.
Instructor makes
observations.
3 hours Capture process
measures while doing
programming exercise
(Student).
Record student
behaviour and questions
asked (Instructor).
3 Students complete
post-activity
survey.
15 – 20
min
Explore the students’
perceptions of process
measuring.
4 Instructor
conducts
interviews with
students.
10 min
(per
student)
Gain deeper insights
into students’
development processes.
The students received an extensive background document on how
“LOTTO” draws work. In the “Quick Pick Option” a user of the
system first had to select the number of player lotto rows that
should be generated. The requested number of rows then had to be
generated randomly, sorted and written to a text file. Students
could use any resources, including the Internet, to complete this
activity. While the students worked on the individual
programming exercise the instructor moved around the students
and recorded his observations as well as all questions from the
students. After this exercise the students had to complete a post-
activity survey that consisted of mostly open-ended questions.
The purpose of this survey was to explore the students’
perceptions on the capturing and interpreting of process
measurement data. In the final activity of Case 2 the instructor
conducted interviews with all six students. During these
interviews open-ended questions were used to gather narrative
data regarding the students’ development processes.
4. DISCUSSION OF RESULTS
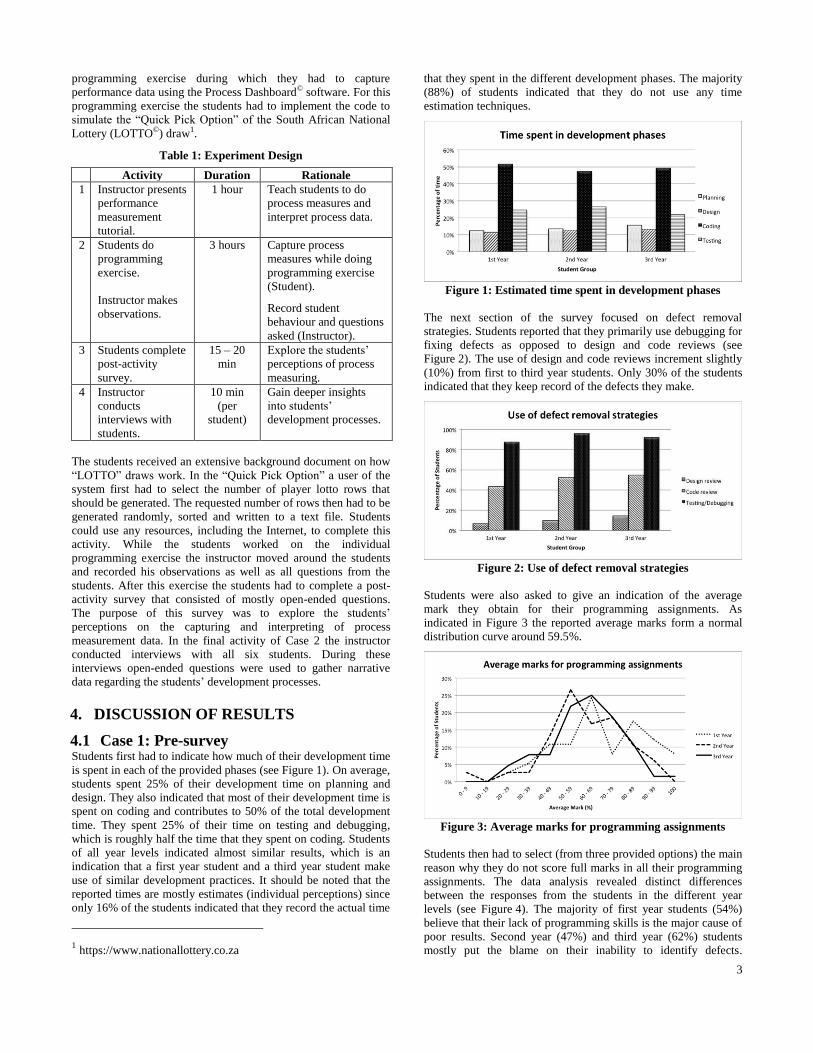
4.1 Case 1: Pre-survey Students first had to indicate how much of their development time
is spent in each of the provided phases (see Figure 1). On average,
students spent 25% of their development time on planning and
design. They also indicated that most of their development time is
spent on coding and contributes to 50% of the total development
time. They spent 25% of their time on testing and debugging,
which is roughly half the time that they spent on coding. Students
of all year levels indicated almost similar results, which is an
indication that a first year student and a third year student make
use of similar development practices. It should be noted that the
reported times are mostly estimates (individual perceptions) since
only 16% of the students indicated that they record the actual time
1 https://www.nationallottery.co.za
that they spent in the different development phases. The majority
(88%) of students indicated that they do not use any time
estimation techniques.
Figure 1: Estimated time spent in development phases
The next section of the survey focused on defect removal
strategies. Students reported that they primarily use debugging for
fixing defects as opposed to design and code reviews (see
Figure 2). The use of design and code reviews increment slightly
(10%) from first to third year students. Only 30% of the students
indicated that they keep record of the defects they make.
Figure 2: Use of defect removal strategies
Students were also asked to give an indication of the average
mark they obtain for their programming assignments. As
indicated in Figure 3 the reported average marks form a normal
distribution curve around 59.5%.
Figure 3: Average marks for programming assignments
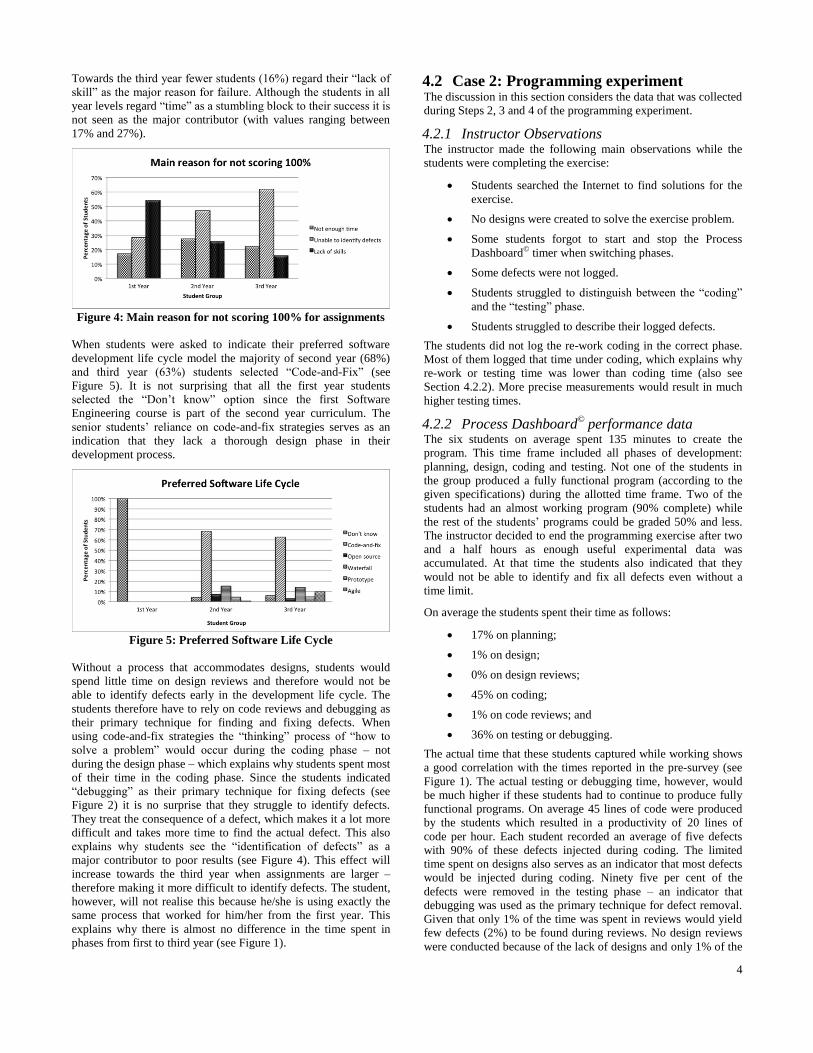
Students then had to select (from three provided options) the main
reason why they do not score full marks in all their programming
assignments. The data analysis revealed distinct differences
between the responses from the students in the different year
levels (see Figure 4). The majority of first year students (54%)
believe that their lack of programming skills is the major cause of
poor results. Second year (47%) and third year (62%) students
mostly put the blame on their inability to identify defects.
4
Towards the third year fewer students (16%) regard their “lack of
skill” as the major reason for failure. Although the students in all
year levels regard “time” as a stumbling block to their success it is
not seen as the major contributor (with values ranging between
17% and 27%).
Figure 4: Main reason for not scoring 100% for assignments
When students were asked to indicate their preferred software
development life cycle model the majority of second year (68%)
and third year (63%) students selected “Code-and-Fix” (see
Figure 5). It is not surprising that all the first year students
selected the “Don’t know” option since the first Software
Engineering course is part of the second year curriculum. The
senior students’ reliance on code-and-fix strategies serves as an
indication that they lack a thorough design phase in their
development process.
Figure 5: Preferred Software Life Cycle
Without a process that accommodates designs, students would
spend little time on design reviews and therefore would not be
able to identify defects early in the development life cycle. The
students therefore have to rely on code reviews and debugging as
their primary technique for finding and fixing defects. When
using code-and-fix strategies the “thinking” process of “how to
solve a problem” would occur during the coding phase – not
during the design phase – which explains why students spent most
of their time in the coding phase. Since the students indicated
“debugging” as their primary technique for fixing defects (see
Figure 2) it is no surprise that they struggle to identify defects.
They treat the consequence of a defect, which makes it a lot more
difficult and takes more time to find the actual defect. This also
explains why students see the “identification of defects” as a
major contributor to poor results (see Figure 4). This effect will
increase towards the third year when assignments are larger –
therefore making it more difficult to identify defects. The student,
however, will not realise this because he/she is using exactly the
same process that worked for him/her from the first year. This
explains why there is almost no difference in the time spent in
phases from first to third year (see Figure 1).
4.2 Case 2: Programming experiment The discussion in this section considers the data that was collected
during Steps 2, 3 and 4 of the programming experiment.
4.2.1 Instructor Observations The instructor made the following main observations while the
students were completing the exercise:
Students searched the Internet to find solutions for the
exercise.
No designs were created to solve the exercise problem.
Some students forgot to start and stop the Process
Dashboard© timer when switching phases.
Some defects were not logged.
Students struggled to distinguish between the “coding”
and the “testing” phase.
Students struggled to describe their logged defects.
The students did not log the re-work coding in the correct phase.
Most of them logged that time under coding, which explains why
re-work or testing time was lower than coding time (also see
Section 4.2.2). More precise measurements would result in much
higher testing times.
4.2.2 Process Dashboard© performance data
The six students on average spent 135 minutes to create the
program. This time frame included all phases of development:
planning, design, coding and testing. Not one of the students in
the group produced a fully functional program (according to the
given specifications) during the allotted time frame. Two of the
students had an almost working program (90% complete) while
the rest of the students’ programs could be graded 50% and less.
The instructor decided to end the programming exercise after two
and a half hours as enough useful experimental data was
accumulated. At that time the students also indicated that they
would not be able to identify and fix all defects even without a
time limit.
On average the students spent their time as follows:
17% on planning;
1% on design;
0% on design reviews;
45% on coding;
1% on code reviews; and
36% on testing or debugging.
The actual time that these students captured while working shows
a good correlation with the times reported in the pre-survey (see
Figure 1). The actual testing or debugging time, however, would
be much higher if these students had to continue to produce fully
functional programs. On average 45 lines of code were produced
by the students which resulted in a productivity of 20 lines of
code per hour. Each student recorded an average of five defects
with 90% of these defects injected during coding. The limited
time spent on designs also serves as an indicator that most defects
would be injected during coding. Ninety five per cent of the
defects were removed in the testing phase – an indicator that
debugging was used as the primary technique for defect removal.
Given that only 1% of the time was spent in reviews would yield
few defects (2%) to be found during reviews. No design reviews
were conducted because of the lack of designs and only 1% of the

5
time spent on the design phase. This resulted in defects being
discovered late in the development life cycle (testing), which
makes it more difficult to identify them.
4.2.3 Post-activity survey Students indicated that capturing time measurement data in the
correct phases was easy but identifying and describing defects
were difficult. For process improvement some students indicated
that they would spend more time on creating effective designs and
need to learn the skill to do effective reviews to pick up defects
earlier in the life cycle. Most students were surprised by how
much time they spent on testing and indicated that debugging
might not be the most effective way to find and fix defects.
4.2.4 Interviews An interview was conducted with each student in order to gain a
deeper understanding of the development processes each one
followed to create the program. The only artefacts that were
created by the students (in addition to the captured Process
Dashboard© measurement data) were the actual code. The
students did not create designs and therefore these interviews
focussed on what each student did during the problem solving
process.
The students all indicated that their first step in solving the
problem was to do an Internet search for possible solutions. They
all found code that they thought could possibly solve the problem.
They copied the code and then tried to change it to solve the
problem. According to the students, this is the method they
usually follow when completing their programming assignments.
In retrospect all the students indicated that they should rather have
started by first solving the problem logically (using flowcharts or
pseudo code) and then searching for code snippets to accomplish
specific tasks. They also indicated that they do not find it easy to
write pseudo code to solve problems and therefore prefer to
search for code solutions where the logical thinking has already
been done. Generally, they find it “hard to start” solving a
problem.
5. CONCLUSION In this paper various attributes contributing to the poor quality of
student programmes have been mentioned. The findings of Case 1
revealed that most students rely on a process of code-and-fix, as
predicted by Humphrey [3]. Code-and-fix remains the
predominate process of choice from first to third year level which
indicates no process improvement through the years of study.
Students also regard “testing” as the most effective strategy to
remove defects. After a selected group of third year students
participated in a practical experiment (Case 2) they – through the
use of process measurement data – realised that they have to
improve their design skills in order to create better quality
programs. These students also realised that quality products are
produced through quality processes that include quality appraisal
techniques. We can therefore conclude that undergraduate
students need more extensive training to reach a level where
reviews would become an effective defect management strategy.
The various methods and tools that can be used to teach students
how to perform effective reviews need further investigation. The
students’ personal reviews indicated that they also lack design and
problem solving skills. This provides further verification for the
findings of McCraken et al.’s study [8]. Future research could
therefore also focus on methods that can be used to teach proper
problem solving and design skills. It is also recommended that
instructors enforce effective design techniques from the first
programs that students write to ensure that they will not fall back
on a “code-and-fix” life cycle. This study has shown that the
effect of process measurement data should be regarded as a
valuable contributor to any process improvement changes
educators want to enforce on students. The ultimate ideal is that
students would be able to adapt their processes according to their
personal data.
6. ACKNOWLEDGMENTS This paper is based on research conducted under the supervision
of Profs J.C. Cronje and L. Nel, in partial fulfilment of the
requirements for the Doctoral Degree in Computer Information
Systems in the Faculty of Natural and Agricultural Sciences at the
University of the Free State, and is published with the necessary
approval.
7. REFERENCES [1] Crosby, P.B. 1979. Quality is free. McGraw-Hill, New York.
[2] Fagan, M.E. 1976. Design and code inspections to reduce
errors in program development. IBM Systems Journal 15, 3
(Sept. 1976), 182-211. DOI=
http://dx.doi.org/10.1147/sj.153.0182.
[3] Humphrey, W.S. 1999. Why Don’t They Practice What We
Preach ? The Personal Software Process (PSP). Annals of
Software Engineering 6, 1-4 (April 1999). DOI=
http://dx.doi.org/10.1023/A:1018997029222.
[4] Humphrey, W.S. 2005. PSP: A self-improvement process for
Software Engineers. Pearson Education Inc., Upper Saddle
River, NJ.
[5] Jenkins, G.L. and Ademoye, O. 2012. Can individual code
reviews improve solo programming on an introductory
course? Innovations in Teaching and Learning in
Information and Computer Sciences (ITALICS) 11,1, 71-79.
DOI= http://dx.doi.org/10.11120/ital.2012.11010071.
[6] Kemerer, C.F. and Paulk, M.C. 2009. The Impact of Design
and Code Reviews on Software Quality : An Empirical Study
Based on PSP Data. IEEE Transactions on Software
Engineering 35, 4 (July 2009), 534-550. DOI=
http://dx.doi.org/10.1109/TSE.2009.27.
[7] Lister, R., Adams, E.S., Fitzgerald, S., Fone, W., Hamer, J.,
Lindholm, M., McCartney, R., Moström, J.E., Sanders, K.
Seppälä, O., Simon, B. and Thomas, L. 2004. A multi-
national study of reading and tracing skills in novice
programmers. In Working group reports from ITiCSE on
Innovation and technology in computer science education
(ITiCSE-WGR '04). ACM, New York, NY, USA, 119-150.
DOI= http://doi.acm.org/10.1145/1044550.1041673.
[8] McCracken, M., Almstrum, V., Diaz, D., Guzdial, M., Hagan,
D., Kolikant, Y.B., Laxer, C., Thomas, L., Utting, I. and
Wilusz, T. 2001. A multi-national, multi-institutional study
of assessment of programming skills of first-year CS
students. In Working group reports from ITiCSE on
Innovation and technology in computer science education
(ITiCSE-WGR '01). ACM, New York, NY, USA, 125-180.
DOI= http://doi.acm.org/10.1145/572133.572137.
[9] Perkins, D.N., Hancock, C., Hobbs, R., Martin, F. and
Simmons, R. 1989. Conditions of Learning in Novice
Programmers. In Soloway, E. and Spohrer, J., Eds., 261-279.

6
[10] Plowright, D. 2011. Using Mixed Methods: Frameworks for
an Integrated Methodology. SAGE Publications, London.
[11] Rong, G., Li, J., Xie, M. and Zheng, T. 2012. The Effect of
Checklist in Code Review for Inexperienced Students: An
Empirical Study. In Proceedings of the 2012 IEEE 25th
Conference on Software Engineering Education and
Training (CSEET '12). IEEE Computer Society, Washington,
DC, USA, 120-124. DOI=
http://dx.doi.org/10.1109/CSEET.2012.22.
[12] Schach, S.R. 2011. Object-oriented and Classical Software
Engineering (8th ed.). McGraw-Hill, Singapore.