
Improving Clinker Production Coal Utilization Using Six Sigma ...
92
ADDIS ABABA UNIVERSITY ADDIS ABABA UNIVERSITY INSTITUTE OF TECHNOLOGY SCHOOL OF MECHANICAL AND INDUSTRIAL ENGINEERING INDUSTRIAL ENGINEERING STREAM Improving Clinker Production Coal Utilization Using Six Sigma Methodology in Mugher Cement Factory BY YEMISRACH BELAY GSE/9021/09 July, 2019
-
Upload
khangminh22 -
Category
Documents
-
view
0 -
download
0
Transcript of Improving Clinker Production Coal Utilization Using Six Sigma ...
ADDIS ABABA UNIVERSITY
ADDIS ABABA UNIVERSITY INSTITUTE OF TECHNOLOGY
SCHOOL OF MECHANICAL AND INDUSTRIAL ENGINEERING
INDUSTRIAL ENGINEERING STREAM
Improving Clinker Production Coal Utilization Using Six Sigma
Methodology in Mugher Cement Factory
BY
YEMISRACH BELAY
GSE/9021/09
July, 2019
i
Improving Clinker Production Coal Utilization Using Six Sigma
Methodology in Mugher Cement Factory
By: Yemisrach Belay
A Master’s Thesis Submitted to School of Graduate Studies of Addis Ababa University
in Partial Fulfillment of the Requirements for Degree of Masters of Science in Industrial
Engineering Stream
Main Advisor: Ameha Mulegeta (PHD)
Co-Advisor: Daniel Ashagre
Addis Ababa University
Addis Ababa University Institute of Technology (AAUIT)
School of Mechanical and Industrial Engineering (SMIE)
(Industrial Engineering Stream)
July, 2019

ii
Submitted by
1. Yemisrach Belay _______________ _____________
Student Signature Date
Approved by
1. Dr.Yelima _____________ _____________
Department Head Signature Date
2. Dr.Ameha Mulegeta ______________ _____________
Main Advisor Signature Date
3. Mr.Daniel Ashagere _____________ _____________
Co-Advisor Signature Date
4. Dr. Ermiyas Tesfaye __________ _____________
Internal Examinor Signature Date
5. Dr. Haileluel Mamo __________ _____________
External Examinor Signature Date

i
Declaration
I hereby declare that the work which is being presented in this thesis entitled “Improvement of
clinker production coal utilization in Mugher Cement ” is original work of my own, has not been
presented for a degree of any other university and all the resource of materials used for this thesis have
been accordingly acknowledged.
_________________________ ____________________
Yemisrach Belay Date
This is to certify that the above declaration made by the candidate is correct to the best of my
knowledge.
_____________________________ ________________________
Dr. Ameha Mulegeta (Advisor) Date
_____________________________ ________________________
Mr. Daniel Ashagrie (Co-advisor) Date
ii
Acknowledgement First and above all I would like to thank the Almighty God for everything he has given me.
Next, my gratitude will goes to my advisor, Dr.Ameha Mulegeta, for his unreserved support and
constructive criticism to make this research realize. His guidance, dedication, and encouragement were
very important to accomplish this study successfully. Also, my co-advisor Mr.Daniel Ashagere for
enormous support and guidance offered during my study.
I would also like to acknowledge Mugher cement factory, specially main operation Manager,
Mr.Mulat Tadesse for allowing me to do this research. Also, Mugher plant clinker production and
quality assurance management and staffs for showing me a keen support in everything that I need to
know by providing with the necessary data and available information.
At last, I would like to thank my family and friends for their invaluable support and encouragement.
Specially my mom , Zewdnesh Tadese and My little sister Mekdes Belay. I am greatly indebted to
them for their care and encouragement!
iii
Abstract Six sigma is the process improvement tools which can be applied in various sector for defect
minimization and better utilization of resource using DMAIC methodology. A DMAIC methodology
is used to identify which output parameter needs to be give more priority to get a better result.. Thus,
in this research which focuses on improvement of clinker production coal utilization without affecting
the clinker quality production, an integration of six sigma with design of experiment was performed.
The tool integration major significance was, it provides a mechanism to narrow down the source of
variation to be more explicit and for optimizing the responses.
This research was conducted by first identifying the major response variable from quality &
resource utilization. Therefore, from coal utilization perspective, coal consumption for the 3rd line kiln
and from quality point of view, C3S and free lime content was selected by first conducting a
brainstorming session with company professionals .Thus, the identified factors which affect this
variables were determined by conducting brainstorming session and with considering the highest coal
consumption month ,which was August,2018 to study the potential causes .As a result ,from the root
cause analysis, different factors were identified. Among them, kiln feed (proportioned raw material )
such as Lime Saturation Factor(LSM), Silica Moduli(SM) and Refractory Moduli(RM) were selected
to observe their influence in coal consumption by considering their quality target range of each
material obtained from the quality department of the case company .
From the analysis result ,the optimized coal consumption was found at the setting of
LSM=97,SM=2.4 and RM=5.5 which give a specific coal consumption of 116kg coal per ton of
clinker production while the company average specific coal consumption during April,2018-
March,2019 was 127kg to produce a ton of clinker. In addition to these, the quality level of the
produced clinker, particularly the C3S and free calcium content were within the preset and expected
quality target levels.
Finally, based on the found improved setting, a controlling mechanism for sustaining the
material proportioning target and uniformity was suggested. In addition, a guiding framework was
proposed for implementation of continual improvement of resource and quality improvement in Muger
Cement Factory.
Key word: Six Sigma, Coal utilization, Clinker production, Design of Experiment
iv
Table of Contents
Acknowledgement .................................................................................................... ii
Abstract .................................................................................................................... iii
List of Table ............................................................................................................ vii
Acronyms ............................................................................................................... viii
Chapter One Introduction ........................................................................................ 9
1. Introduction ...................................................................................................................... 9
1.1 Background and Justification ........................................................................................... 9
1.2 Problem Statement ......................................................................................................... 12
1.3 Objective ........................................................................................................................ 13
1.4 Significance of the Study ............................................................................................... 13
1.5 Scope and Limitation ..................................................................................................... 13
1.6 Organization of the study ............................................................................................... 13
Chapter Two ............................................................................................................. 15
2. Literature Review................................................................................................................ 15
2.1 Organization of the Literature ........................................................................................ 15
2.2 Six sigma and design of experiment (DOE) Techniques ............................................... 15
2.3 Six Sigma Overview and Methodology ......................................................................... 16
2.4 Six sigma in terms of statistic ........................................................................................ 19
2.5 Six sigma Methodology ................................................................................................. 20
2.6 DMAIC/DMADV flow .................................................................................................. 23
2.7 Six sigma application in Energy improvement or optimization ..................................... 24
2.7.1 Energy improvement Research ...................................................................................... 24
2.7.2 Six sigma in Energy utilization improvement ................................................................ 24
2.7.3 Implementation of six sigma .......................................................................................... 25
2.7.4 Implementation of six sigma with integration of Design of experiment........................ 27
2.8 Summary of literature review ......................................................................................... 28
Chapter Three ........................................................................................................... 29
3 Research Methodology ................................................................................................... 29
3.1 Research Design ............................................................................................................. 29
3.2 Method of Data Collection ............................................................................................. 29
v
3.3 Data collection................................................................................................................ 30
3.4 A brief description about the Methodological framework ............................................. 31
3.5 Methodological Frame
Figure 2: Methodological Framework .................................................................................... 34
3.6 DOE model selection ..................................................................................................... 38
Chapter Four ............................................................................................................ 40
4 Data Collection and Analysis ......................................................................................... 40
4.1 Data Collection ............................................................................................................... 40
4.2 Background of the study ................................................................................................ 40
4.3 Define phase ................................................................................................................... 45
4.4 Measure phase ................................................................................................................ 52
4.5 Analyse phase ................................................................................................................. 57
4.6 Improve Phase ................................................................................................................ 62
4.7 Control ............................................................................................................................ 71
4.8 Kiln feed preparation process ......................................................................................... 72
Chapter Five ............................................................................................................. 80
5. Results and Discussions ................................................................................................. 80
5.1 Summary and Future implementation ............................................................................ 80
Chapter Six ............................................................................................................... 84
6. Conclusion and Recommendation .................................................................................. 84
6.1 Further Research ............................................................................................................ 85
Bibliography ........................................................................................................................... 86
vi
List of Figure
Figure 1: The DMAIC/DMAV process flow (H. Abualsauod ,2015) ................................................... 23
Figure 2: Methodological Framework ................................................................................................... 34
Figure 3: A methodology for the selection of the right Design of experiment (Minitab 17)………….38
Figure 4: Cement production process flow diagram .............................................................................. 45
Figure 5 : Clinker production process flow ........................................................................................... 50
Figure 6: Pareto chart for clinker unfulfilled quality parameter ............................................................ 55
Figure 7: August, 2018 Month Specific Coal Consumption versus Daily Production .......................... 58
Figure 8: Root Cause for high coal consumption in the kiln ................................................................. 59
Figure 9: Pareto chart of the standardized effect plot ............................................................................ 66
Figure 10: Residual plots for coal consumption .................................................................................... 69
Figure 11: From Quarry to Kiln feed raw material preparation process ................................................ 74
Figure 12: Six sigma implementation Framework................................................................................. 82
vii
List of Table
Table 1: Sigma level .............................................................................................................................. 20
Table 2: DMAIC Phases and the appropriate tool to use ....................................................................... 21
Table 3: The type , duration and method of Data collection ................................................................. 31
Table 4: DMAIC implementation process ............................................................................................. 33
Table 5: Six sigma and DOE integration ............................................................................................... 35
Table 6: Coal consumption data collected from April, 2018-Feb, 2019 ............................................... 46
Table 7: Clinker Quality Parameter from April,2018-Feb,2019 ............................................................ 47
Table 8: SIPOC diagram for clinker production .................................................................................... 51
Table 9: Clinker Monthly defect level ................................................................................................... 54
Table 10: Defect in Clinker impact on final product cement quality .................................................... 56
Table 11: The significant Factors selected for high coal consumption ................................................. 61
Table 12: List of factors, Range and level ............................................................................................. 62
Table 13: The evaluation was performed based on the following evaluation criteria ........................... 63
Table 14: Test order as per the software randomization method ........................................................... 64
Table 15: Full factorial experiment and the response ............................................................................ 64
Table 16: Analysis of variance in coded coefficient .............................................................................. 67
Table 17: Analysis of variance .............................................................................................................. 68
Table 18: Comparison of Experimental result with predicted result ..................................................... 71
Table 19: control plan for improvement of Raw material proportioning .............................................. 75
viii
Acronyms
OPC: Ordinary Portland Cement
PPC: Portland Pozzolana Cement
ECSD: Ethiopian Cement strategy Development
LSM: Lime saturation Factor
SM: Silica Moduli
RM: Refractory Moduli
C3S: Tri calcium silicate
C2S: Di-Calcium silicate
C3A: Tri-Calcium Aluminate
C2AF: Calcium Alumino-Ferrite
DOE: Design of Experiment
DMAIC: Define, Measure, Analysis, Improve and Control
CCR: Central Control Room
9 | P a g e
Chapter One Introduction
1. Introduction
1.1 Background and Justification
Manufacturing company now a days are seeking for a mechanism for a better utilization of
resource since efficient utilization of resource can ensure optimized production, competitiveness
in the market and overall performance improvement .Hence, to ensure those improvement, a
mechanism should be there to control the work processing variability at the lowest level.
Six-sigma is one of the tools that can be applied to improve the performance of a given
operation. It is a process improvement tools as Pfeifer, T. et al( 2004) described that Six Sigma
seeks to improve the quality of process outputs by identifying and removing the causes of defects
(errors) and minimizing variability in manufacturing and business processes. The distinct
advantage of applying six sigma project as one of improvement tool is, since it is a strict, focused
and highly effective implementation of proven principles and techniques which aims at error-free
business performance target in reducing the error to 3.4 per one million opportunity this is done
by DMAIC(Design, Measure, Analyze, Improve and Control) process improvement model (Pande
and Holpp, 2002). Customer focus and key business initiatives are two focus features that
distinguish Six Sigma from quality models such as Quality Circles and Total Quality
Management Abramowich (2005).Furthermore, Voelkel (2002) also refer that “Six sigma blends
management, financial and methodological elements to make an improvement to processes and
products concurrently”.
Six Sigma is all about process performance and it is a customer-driven approach that can be
applied by first measuring the defect level in the existing operation, then working on minimizing
those defect up to zero. As a result, reduced cost due to minimized rework and create customer
satisfaction. For any objectives of a business e.g if a given organization want to be more
competitive in quality, cost,.etc six sigma can help make the company best at what it does by
focusing on the area of improvement.
10 | P a g e
In the new Era of the Development of industrialization, the growth of competition across the
Globe Makes companies to strive for the improvement in Quality, Cost and Responsiveness as a
major strategy to sustain in the Market .Such competition is very common in the cement sector.
Ethiopian cement industry development strategy, 2015 reports shows that Cement is the
second most consumed material on the planet next to water. Beside this, Summaries of both
regional and global publication strongly confirm that the cement demand in Africa in general and
East Africa region in particular has shown increasing trend. The major drivers for the growth are
increasing government investment in infrastructure expansion and rehabilitation, Steady
population growth, rapid urbanization, housing deficits and infrastructure gap .
As studies of Getachew etal(2013) shows that, Ethiopian Cement production sector is booming
these days to meet the current demand for massive construction of infrastructures, which is
growing from time to time and related as well to economic growth of the country. Currently, the
number of cement factories grew to 20 and annual cement production increased from 2.7 million
tons to 15 million tons and Per capita cement consumption increased from 39 kg to 62 kg, which
is still minimal compared to Sub-Saharan average of 165 kilograms according to reporter news,
2016.
Mugher cement factory is one of the oldest, government owned company in Ethiopia. Which
produce ordinary Portland (OPC) and Portland pozzolana (PPC) cement using clinker as a major
component and pumice and gypsum as additives . It hast three production lines such as 1st , 2nd
and 3rd line started operation in 1984, 1989/90 and 2011 respectively for production of clinker as
well as cement. This Factory produces clinker by burning proportioned mix of raw material
(limestone, sand and clay) at a rate of 5000 ton/day. Presently, this part of the process is
undertaken only in Mugher branch of the plant using three different kilns lines in which, all the
kiln uses coal (3000ton/day production rate for 3rd line ,1000ton/day each for 1st and 2nd
production lines).
Cement is an essential component in the construction and development of infrastructure such
as houses, dam, bridges .. etc. The hydraulic or pozzolanic additions bring about that the pastes
of these cements have usually different properties, particularly the rate of strength development
(early strength), heat of hydration, resistance to corrosion factors W.kurdowski (2013). These
11 | P a g e
property are due to the availability of clinker constituent, C3S, C2S, C3A, C2AF called clinker
mineralogical composition. Which has a great impact in determining the strength development of
the final product . Cement clinker is manufactured primarily from limestone, clay, sand and iron
oxide-bearing materials as raw materials ,crushing and grinding of the raw materials, mixing them
intimately at certain proportions and blended then finely comminuted to form the raw meal and
burning them ,usually in a rotary kiln at a temperature of approximately 1450 ºC Lawrence
CD(1998) . The material sinters and partially fuses to promote the formation of the clinker phases.
The principal phases in the cement clinker are tri-calcium silicate C3S, di-calcium silicate C2S, tri-
calcium aluminate C3A and calcium alumino ferrite C2AF Lawrence CD (1998)
The major controls made in the production of clinker are the process and quality parameters
control. In this production, there are various factors which determine a good operating burning
zone that produces uniform, quality clinker with minimum fuel consumption as Gerald L. Young
etal ( 2004) .The controls involve, raw meal quality ,the feed raw material quality, raw material
mix proportions, free lime content, coal heating value, coal fines and ash composition ,coal firing
rate ,clinker cooler operations are some of the major once.
From cement Production operation, Clinker (kiln process) is a highly energy demanding
process. According to Ethiopian cement strategy (2015) and world bank (2017 ) report, Cement
manufacturing is an energy‐intensive process and the kiln process consumes more than 90% of
the cement manufacturing energy and the cost is up to 40% of total production costs. Beside this,
clinker is the major component for producing OPC and PPC cement also the Quality of finished
product is determined by the quality of this material. Therefore, the research main focus becomes
the clinker production process.
This thesis will show how to use Six Sigma concept to improve coal utilization by maintain
quality clinker production of Mugher cement factory, by first defining the project goal then
measure the rework and coal resource wastage level in the existing process then analyze the data
and find the root cause, provide improvement proposals and control the improved process’s to
ensure sustainable results.

12 | P a g e
1.2 Problem Statement
In the current operation of the clinker production, the third line kilns use a coal as a source of
energy for producing clinker with the designed coal consumption of 110 kg of coal to produce a
ton of clinker. However, referring the company consumption report from April,2018-March,2019
shows that the average specific coal consumption to produce a ton of clinker was 127kg while
the daily log sheet control record shows that the minimum consumption is in the range of 117-
120 kg /ton of clinker. Hence, working on improving the coal utilization will save a significant
amount of cost for the factory.
Beside this, every year for producing OPC and PPC cement, Gypsum and Pumice additives are
mixed with Clinker for PPC and Only gypsum for OPC cement production. Since, the quality of
the finished product mainly depends on the quality clinker used .When the finished product
failed to meet the specified requirement, additional good quality clinker should be used to correct
the defective product. For example in the first half of 2011E.C budget year around 3milion Birr
worth of clinker was used to correct the defective cement. Hence, this poor quality clinker
creates not only a rework cost but also customer dissatisfaction due to longer waiting time and
delay of delivery.
Therefore, this research focus was on how to improve the utilization of coal by maintaining or
without affecting the specified quality level of clinker production by using the concept of six-
sigma.
Research Question
What is the impact of energy and quality in the current performance of the company?
How six sigma concepts can be applied for improving coal utilization by keeping
acceptable quality level of clinker production?
13 | P a g e
1.3 Objective
1.3.1 General Objective
The General objective of the study is, to improve coal utilization in clinker production
without compromising clinker quality using six-sigma methodology in Mugher cement factory.
1.3.2 Specific objectives
Specific objectives are:
To define measurements for improvement in quality and energy utilization
To measure the existing defect levels in clinker
To experiment an improvement method that alleviate the energy and rework problem
To test the Impact of implementing six sigma in the improvement of Energy and Quality
1.4 Significance of the Study
The findings from this research would help the cement companies to evaluate and develop their
own improvement strategies and to find a competitive age in the market. Furthermore, this
research can be used as one input reference for further research.
Since six sigma implementation research project in cement sector is rare, it will add additional
information to the body of research in cement production.
1.5 Scope and Limitation
This research focus is, on the existing technology doing an improvement focusing on process
parameter control. The raw data and tests will only be taken from the Mugher branch of the plant
focusing on the 3rd line kiln. When this experiment is conducted, there was a limitation in selecting
all the input factors and screening out the most significant factors and the level of their impact on the
response variable. This is due to unavailability of measurement system in the current operation of the
plant and some of the measuring instruments were not functional. To mention some, coal heating
value, fines of the input kiln feed and the coal..etc.
1.6 Organization of the study
The rest of this thesis part is structured as follows. In the literature review part ,an overview of
six sigma and design of experiment techniques, a review of different articles on the concept of
14 | P a g e
six sigma and its application, design of experiment related research were covered. This part
offers some context for the next section. After literature review, the next part was a research
methodology. In this section, a detailed description of the method of data collection,
methodological framework which clarify and give a guideline on how six sigma can be applied
with context of coal utilization. The next part, data collection and analysis demonstrate using the
concept taken from different research & using the methodological frame work, an in depth study
of the improvement of coal utilization starting from data collection and using DMAIC
integration with design of experiment was performed.
Using the analysis result found from the previous section, discussion of the result & putting a
mechanism for control input material control for keeping the optimized setting also proposed. In
addition, an implementation plan for future operation for the factory also suggested.
Finally, the thesis ended with a conclusion and recommendations and by suggesting further
research area.
15 | P a g e
Chapter Two
2. Literature Review
2.1 Organization of the Literature
For the review made in this chapter,a systematic literature review techniques were used for the
purpose of reviewing the research relating to six sigma project success and to identify a series of
literature based questions for guiding the actual experimental phase of this research.
This chapter consists of, an overview of six sigma and design of experiment techniques, about
six sigma and statistical techniques, a review of different articles on the concept of six sigma and
its application, Design of experiment related research and the final part will be a summary of all
the concept covered in this chapter.
2.2 Six sigma and design of experiment (DOE) Techniques
A DOE is a statistical approach which is used to experiment design and analysis. It is the
major tool used in six-sigma for modeling the effect of one or more process factor on the
selected output or response. In DOE, the effect of all the factors of interest can be studied by a
single trial by reducing the experimental schedule required and providing information on key
process interactions. Depending on the Types of experiment needed, a DOE is categorized as
single factor, two-level, factorial designs, Taguchi methods, mixture methods, and response
surface models. D. Dixon, et al (2006)
Design of experiment is the procedure used for the improvement of a given process condition
and to get the product set characteristics. These techniques are very essential to companies with a
low production cost, minimum use of energy, .. etc . D.Granato1 and V. Maria(2014)). This has
been revealed in different researches such as G.Antony, etal(2014) apply the design of an
experiment to first identify which process parameters are the most significant and which are less
when it gives a response. Based on the result, methanol and catalyst concentration were the
major influencing, time and temperature was low influence process parameters. Furthermore,
DOE can be used with six sigma methodology to enhance the DMAIC methodology
improvement stage to get an optimized process parameter by iteratively improving those input
process. Different researches have also revealed the integrative effect of six sigma and DOE. A
16 | P a g e
study of Amol.J.Gangai and G.R.Naik(2014) made on optimizing process setting without
compromising the quality of a product, showed that six sigma with the design of experiment tool
and using Minitab statistical software revealed that it is possible to get an optimum setting.
2.3 Six Sigma Overview and Methodology
Six Sigma was first developed and matured between 1985 and 1986 in Motorola Harry,
M(1998). It was developed from being a simple process improvement methodology to a broader
companywide philosophy.
According to different six sigma researchers perspective, the definition of six sigma covers
from a statistical tool used for the improvement of a given process or product variations to
management strategies used for the improvement of a given business.
As G. Knoweles (2011) described, six sigma has a statistical definition that measures how far a
process deviates from perfection and have set a target for the defect level which is 3.4 per million
opportunity. The author explained that it has a long term business strategy to reduce cost through
the reduction of variability in product and process. On the other hand L.Fonseca (2014) also raise
similar concept with the definition of G. Knoweles (2011) that six sigma should not only
considered as a simple statistic tool rather it should be taken as one of a strategic management
approach that should be aligned with the business goal and customer requirement.
According to Ecks (2001) definition, six-sigma has to be linked to organization goal. When
six sigma project implemented in GE, it was provided the company with major returns on
investment. In 1996 G.C, cost of $200milon and return of $150milon, in 1997 cost of $400milon
and return of $ 600milon and the increment continued in the subsequent years. G. Knoweles
(2011)
The other definition is given by P.Pande and L.Holp (2002) describe that Six Sigma provides
a better way to manage a given business by putting the customer first and using facts and data to
drive better solutions. As the author illustrates that the major improvement efforts focus on three
areas, i.e improving customer satisfaction, reducing cycle time and reducing defects. There are
many tools which can be applied to improve the performance in quality or other organizational
performances but six sigma has a unique character from the previous quality improvement that it
17 | P a g e
is a customer-focused approach in which it always seeks a way to fulfill customer requirement
especially the external customer. It has a positive impact on the major return on investment as
explained above in GE company. Furthermore, six sigma changes how management operates
when managements learn on how to use the tools and concept, it will result in a new approach to
thinking, planning and implementing to accomplish the results
Another definition which is almost similar perspective with the previous authors, given by
Pande and Holpp (2002) describes, six sigma is one of business improvement methodology
which can be used to improve business capability by reducing process variations. “The name
“Six Sigma” derives from statistical terminology; Sigma (σ) means standard deviation. For a
normal distribution, the probability of falling within a ±6 sigma range around the mean is
0.9999966. In a production process, the “Six Sigma standard” means that the defective rate of the
process will be 3.4 defects per million units.
In contrast to the aforementioned definitions and benefits of six-sigma, other researchers argue
that six sigma has a limitation especially in promoting innovations and creativity since it is
focusing on optimizing what a given organization already have or focusing on fixing problems
not creating. As Goh, T.N(2002) states that six sigma most likely important for those
organization in which their first priority is to avoid non-conformances. In addition Anderson, et
al(2006) described that since the main focus of six sigma is on the economic and current static to
CTQs aspects, it will distract the attention to unexpected or delighting customer features as in the
Kano quality model.
Based on the above definitions, it can be easy to conclude that Six Sigma provides a
systematic way to achieve business performances improvement and customer requirement
starting from each process that is involved in a given organization. In addition, if that
improvement procedure is properly controlled and standardized, it can be used for the further
continuous improvement program. Furthermore, since each Six Sigma project involves a team
with people from different knowledge and hierarchical levels, it will develop employees’
problem-solving approach and skill.
18 | P a g e
2.3.1 Why six sigma?
Six Sigma can benefit a given organization or business by making an effort on identifying the
cause of process variation and the defects, it will allow creating consistency of purpose. Greg
Brue (2002). Here are the basic results that could be found from the implementation of six-
sigma:
Money
Customer satisfaction
Quality
Impact on employees
Growth
Competitive advantages
As the author observes, at the start of implementing six sigma, most of the participant
considers six sigma as if only useful for the manufacturing sector, it may not consider customer
complaint, may use difficult to understand statistics, etc but six sigma link people, process and
business for successful achievement of the project. In any business, it can bring a tangible result
by focusing on the customer need and organization goal. Since six-sigma is a project based task
and demand the involvement of well aware employee, creating awareness to the involved people
and project management skill for the experts who lead this team should be a pre-requisite to
achieve the project goal.
As Graeme Knowles (2011), six-sigma can improve financial performance and profitability,
reduces the cost of poor quality, reduce waste, to be responsive to and focused on the customer,
to improve product and service performances and contributing to organizational learning. From
the financial and profitability aspect, the different company shows an increase in profit after they
implement six sigma such as Motorola claims to have saved $ 414bilion, increased sales by a
factor of 5 and increased profits by 20% each year Pande et al(2000).In the case of GE during
1996-1998G.C six sigma related saving were about $2bilion, their others.
2.3.2 Six Sigma benefit
Six sigma can benefit a given organization or business by making an effort on identifying the
cause of process variation and the defects, it will allow to create consistency of purpose. Pande

19 | P a g e
and Holpp(2002) .Here are the basic results that could be found from implementation of six-
sigma:
Money
Customer satisfaction
Quality
Impact on employees
Growth
Competitive advantages
As the author observation, at the start of implementing six sigma, most of the participant
consider six as if only useful for manufacturing sector, it may not consider customer complaint,
may uses difficult to understand statistics ,etc but six sigma link people ,process and business for
successful achievement of the project .In any business, it can bring a tangible result by focusing
on the customer need and organization goal. Since six-sigma is a project based task and demand
the involvement of well aware employee, creating awareness to the involved people and project
management skill for the experts who lead this team should be a pre-requisite to achieve the
project goal.
As Graeme Knoweles (2011), six-sigma can improve financial performance and profitability,
reduces cost of poor quality, reduce waste, to be responsive to and focused on customer, to
improve product and service performances and contributing to organizational learning. From the
financial and profitability aspect, different company shows an increase in profit after they
implement six sigma such as Motorola claims to have saved $414bilion ,increased sales by a
factor of 5 and increased profits by 20% each year Pande etal(2000).In the case of GE during
1996-1998G.C six sigma related saving were about $2bilion,there others.
2.4 Six sigma in terms of statistic
As Pande etal(2000) definition, the Greek letter “sigma” or “σ" ” stands for standard
deviation. It is a way of describing how much a given process or product has variation exist in a
set of data, a group of an item or a process. Standard deviation is a statistical term which is used
to describe how much variation exists in a data, a group of items, or a process. P. Pande and L.
Holpp (2002),
The author provides a practical example to make clear the concept of ‘standard deviation’
20 | P a g e
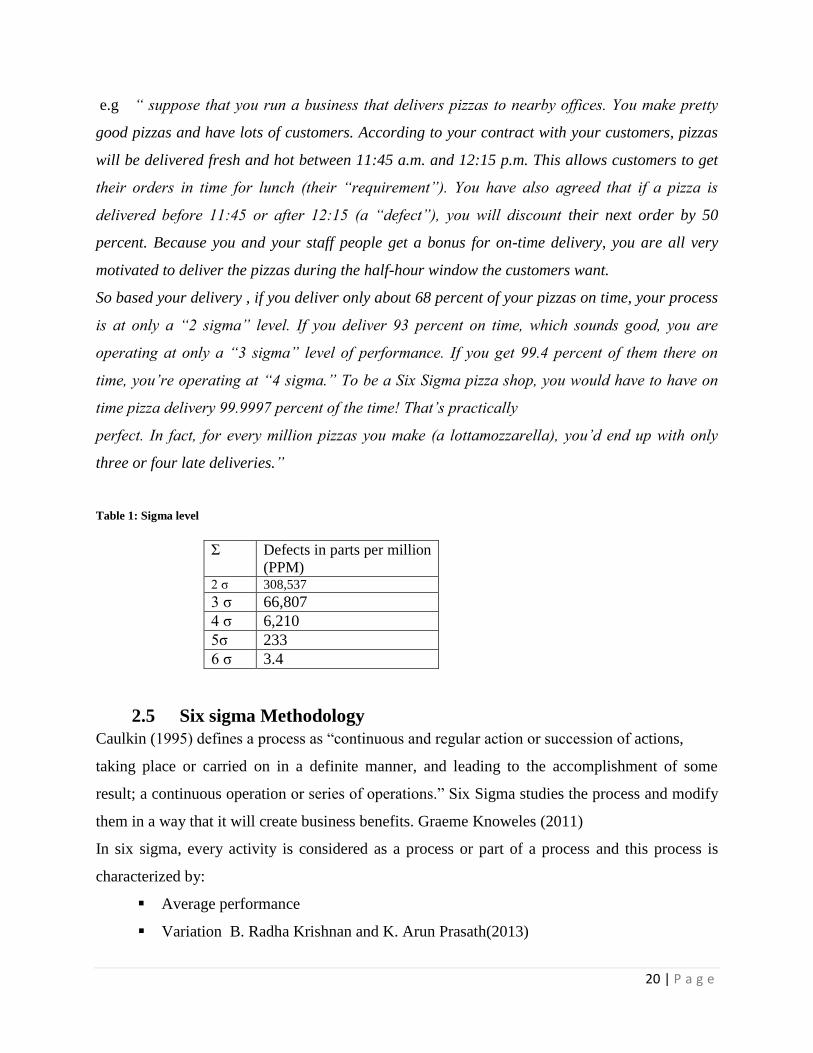
e.g “ suppose that you run a business that delivers pizzas to nearby offices. You make pretty
good pizzas and have lots of customers. According to your contract with your customers, pizzas
will be delivered fresh and hot between 11:45 a.m. and 12:15 p.m. This allows customers to get
their orders in time for lunch (their “requirement”). You have also agreed that if a pizza is
delivered before 11:45 or after 12:15 (a “defect”), you will discount their next order by 50
percent. Because you and your staff people get a bonus for on-time delivery, you are all very
motivated to deliver the pizzas during the half-hour window the customers want.
So based your delivery , if you deliver only about 68 percent of your pizzas on time, your process
is at only a “2 sigma” level. If you deliver 93 percent on time, which sounds good, you are
operating at only a “3 sigma” level of performance. If you get 99.4 percent of them there on
time, you’re operating at “4 sigma.” To be a Six Sigma pizza shop, you would have to have on
time pizza delivery 99.9997 percent of the time! That’s practically
perfect. In fact, for every million pizzas you make (a lottamozzarella), you’d end up with only
three or four late deliveries.”
Table 1: Sigma level
2.5 Six sigma Methodology
Caulkin (1995) defines a process as “continuous and regular action or succession of actions,
taking place or carried on in a definite manner, and leading to the accomplishment of some
result; a continuous operation or series of operations.” Six Sigma studies the process and modify
them in a way that it will create business benefits. Graeme Knoweles (2011)
In six sigma, every activity is considered as a process or part of a process and this process is
characterized by:
Average performance
Variation B. Radha Krishnan and K. Arun Prasath(2013)
Σ Defects in parts per million
(PPM) 2 σ 308,537
3 σ 66,807
4 σ 6,210
5σ 233
6 σ 3.4

21 | P a g e
The Six Sigma DMAIC (Define, Measure, Analyze, Improve, and Control) and Define-Measure-
Analyze-Design-Verify (DMADV), is an approach which is used as a roadmap for problem-
solving and product/process improvement. DMAIC methodology looks like a linear and
explicitly defined, but it is an iterative approach. In addition, prior knowledge of different
statistical tools and techniques such as, design of experiment, Pareto.., etc is necessary for
determining which tools are useful in each phase B. Radha Krishnan and K. Arun Prasath(2013).
The DMAIC method stresses on data analysis and fact-based decision making by providing a
well-structured method for investigation of reasons for leading to the problem. The core agenda
of the DMAIC method is reducing variation in a process to achieve high conformance quality in
customers’ terms
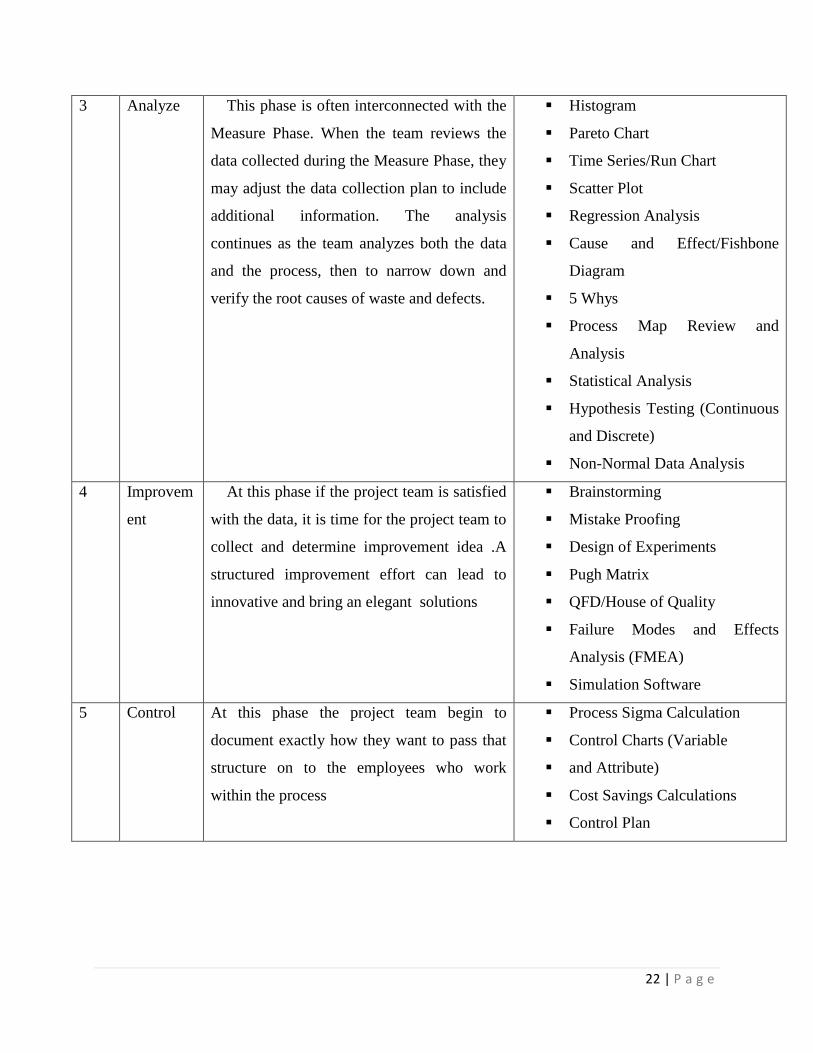
Table 2: DMAIC Phases and the appropriate tool to use
No. DMAIC
Phases
Description Tools used
1 Define Define Phase is the first phase and critical
phase of Six Sigma improvement process. In
this phase, the leaders of this project
Create a Project Charter,
Create a high-level view of the
process, and
begin to understand the needs of
the customers of the process
Project Charter
Process Flowchart
SIPOC Diagram
Stakeholder Analysis
DMAIC Work Breakdown
Structure
CTQ Definitions
Voice of the Customer
Gathering
2 Measure It is a critical phase throughout the life of the
project and when the team focuses on data
collection initially they must focuses on the
two points . to determine the start point or
baseline of the process and the 2nd is to look
for clues to understand the root cause of the
process
Process Flowchart
Data Collection Plan/Example
Benchmarking
Measurement System
Analysis/Gage RandR
Voice of the Customer
Gathering
Process Sigma Calculation
22 | P a g e
3 Analyze
This phase is often interconnected with the
Measure Phase. When the team reviews the
data collected during the Measure Phase, they
may adjust the data collection plan to include
additional information. The analysis
continues as the team analyzes both the data
and the process, then to narrow down and
verify the root causes of waste and defects.
Histogram
Pareto Chart
Time Series/Run Chart
Scatter Plot
Regression Analysis
Cause and Effect/Fishbone
Diagram
5 Whys
Process Map Review and
Analysis
Statistical Analysis
Hypothesis Testing (Continuous
and Discrete)
Non-Normal Data Analysis
4 Improvem
ent
At this phase if the project team is satisfied
with the data, it is time for the project team to
collect and determine improvement idea .A
structured improvement effort can lead to
innovative and bring an elegant solutions
Brainstorming
Mistake Proofing
Design of Experiments
Pugh Matrix
QFD/House of Quality
Failure Modes and Effects
Analysis (FMEA)
Simulation Software
5 Control
At this phase the project team begin to
document exactly how they want to pass that
structure on to the employees who work
within the process
Process Sigma Calculation
Control Charts (Variable
and Attribute)
Cost Savings Calculations
Control Plan
23 | P a g e
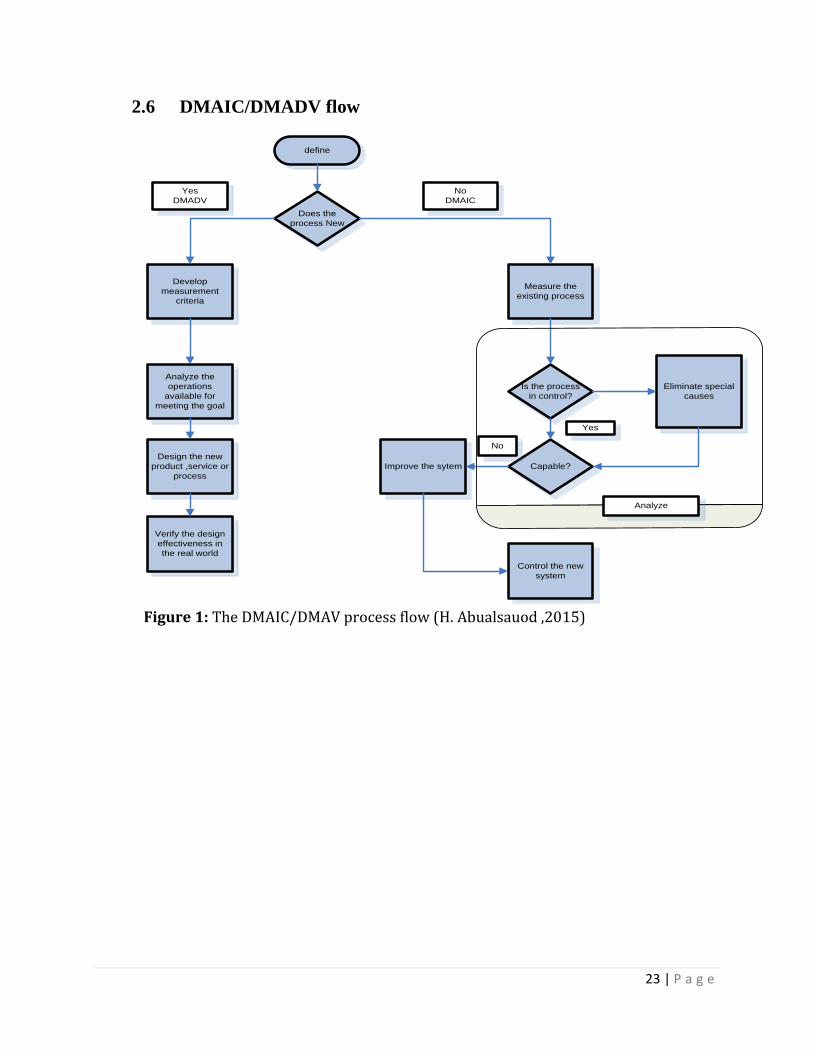
2.6 DMAIC/DMADV flow
define
Does the
process New
Develop
measurement
criteria
Analyze the
operations
available for
meeting the goal
Design the new
product ,service or
process
Verify the design
effectiveness in
the real world
Measure the
existing process
Is the process
in control?
Eliminate special
causes
Capable?Improve the sytem
Control the new
system
Yes
DMADV
No
DMAIC
Yes
No
Analyze
Figure 1: The DMAIC/DMAV process flow (H. Abualsauod ,2015)
24 | P a g e
2.7 Six sigma application in Energy improvement or optimization
2.7.1 Energy improvement Research
Currently, different techniques are used for the optimization of energy. From the recent study, by
M.Mandic(2017) in the optimization of electrical train energy consumption, by first developing
sequential quadratic programming and using a computer program for simulation of train
movement, a significant amount of energy was able to capture. In this study, prior to
implementing to the whole type of train, the developed model was first tested in the test case of a
few sections, and then on real cases of energy consumption for passenger and freight train.
2.7.2 Six sigma in Energy utilization improvement
According to John K.(2003) definition, Six Sigma is a methodology which can provide a
common language and problem-solving platform that can be applied in all aspects of the business
on an equal playing field. Since Six Sigma is a structured approach for solving different kinds of
problem with a strong focus on statistics and use a proven methodology to sustain the
improvement for long-lasting, it can be used as an improvement or optimization methodology in
energy utilization. S.Ojha and N.Verma(2018) have been used six sigma and lean principle, to
study the energy wastage in various process of the small and medium industry. In their research,
they use value stream mapping tool to understand the flow of material and information to
pinpoint the wastage point. Based on their observation, the high energy wastage was seen in the
production of reject. In other studies by J. Kane, etal (2003) indicates that Six Sigma
methodology was implemented to identify and realize energy efficiency improvements and
maintain it well for the future. In this research, the integration of six sigma methodology with
energy makes energy professionals to add a new tool for improvement of energy. The author
shows that integrating six sigma methodology with traditional energy management reduces total
energy cost and assist in achieving the challenging goal of holding total global energy use.
On the other aspect, a study conducted by P.Gaholt (2012) Energy management through six
sigma research made in the medium and micro level industry indicated that the level of energy
efficiency not only depends on the technological factors but also non-technological factors. In
this research, a model was developed for analyzing empirical data from selected industries by
using multiple regression analysis. In addition, the identification of the key variables that affect
25 | P a g e
efficiency has been identified using ANOVA (sequential sum of square). Hence, the areas that
need more focus on improving or optimizing energy have been identified in this case study.
2.7.3 Implementation of six sigma
In this section different research publication has been reviewed in related to the implementation
of six sigma. The categories of the application area are manufacturing (large scale to Small and
medium), services, construction industries etc. In each review the study of the research approach,
the methodology used, the result and contribution of each paper and research gap is reviewed.
In the case of the construction industry which has a different nature from the manufacturing
sector in the aspect of project oriented work process, have been reviewed. According to Seung et
al (2008) research, uses six-sigma to estimate the defect rate in a more quantitative and organized
way. The research focus was to apply six-sigma by developing a general methodology on the
construction operation. For improvement of quality and productivity, an integration of lean (for
optimal performance improvement of resource, reliability of planning and elimination of waste)
and six-sigma principle was applied. Two case studies (iron reinforced bar assembly process and
deck plate installation process) have been presented and process simulation analyses were used
to observe the performance changes. In the case of iron, the process was evaluated based on the
relationship of productivity and cost, the simulation result showed, the changes of sigma level
which vary along with the process reliability that was measured by variations of the performance
indices. From the analysis, to minimize the process variation cycle time and cost, the efficient
amount of iron to keep in stock was determined. For determining the optimum resource buffer
size and most efficient process control to maintain a higher sigma level, cost information was
used .In general, in this research, in both case studies show that even though the nature of this
sector is different from manufacturing, an improvement in the project performance was shown
from traditional construction. The six sigma principle provided more benefits by obtaining an
optimized solution. It is one of the tools that can be used to continuous improvement of a product
or service.
According to Valles etal(2009) research done in Six Sigma project conducted at a
semiconductor company, it was possible to determine the key factors, identify the optimum
levels or tolerances and improvement opportunities by using DMAIC methodology. The
major factors that were found through a design of experiments (DOE) were identified and
26 | P a g e
controlled. Before the implementation of six sigma project, the level of sigma was 3.35 sigma
level and the gain after implementing was 0.37 sigma that represents the elimination of 1.88%
of nonconforming units or 18,788 PPMs.
For effective implementation of six sigma in a given business organization different
researcher recommend ‘the key ingredients’ for improvement of the performance which will
lead the organization to achieve the customer requirements and its business goal. Those are
upper management support, organizational infrastructure, training, application of statistical
tools are mentioned in Henderson and Evans (2000) studies. According to J. Antony and
R.Banuelas( 2002) key ingredients are defined as those factors that are essential to the success
of the implementation of any quality improvement initiative. According to this study, around
11 key ingredients are listed such as management involvement, cultural change,
organizational infrastructure ,training, project management skill, project prioritization and
selection, reviews and selection, linking six sigma project to business strategy, linking six
sigma project to the customer, linking six sigma project to human resources and linking six
sigma project to supplier. The research main focus was on how organization priorities these
key ingredients. The survey shows that top management commitment and involvement are
identified as the most important one and linking the six-sigma to supplier, training and
employee take the least. In addition to this, six sigma project are selected based on their
impact on business performance, profitability and customer satisfaction.
Another research conducted by Kolhe.G etal,(2018) which focuses on the implementation
of six sigma in process industry on the human aspect, tries to develop a model. The author
used different methodology to generate a model for effective implementation of the Six Sigma
in Indian organizations for achieving Process Excellence, such as, by study six sigma
literatures, comparing between various process excellence initiatives and finally by reviewing
various quality award models in India ..etc . and then implementing six sigma in the selected
two case company called Larsen and turbo limited to validate the model developed. From the
implementation result, the author tries to put a strategy for the whole organization in Indian.
Those strategies are implementation strategy should be different in different sizes of the
organization and a given strategy should depend on the organizations existing culture and
structure are some of the points that are addressed in this research. Even though this research
main focus was on soft skill or human aspect, it was limited to one engineering organization.
27 | P a g e
Since the different type of industries like chemical, service organizations may demand a
different strategy.
In a specific sector, implementation of six-sigma has shown a successful result in the
performance improvement of an organization. An implementation made on the food industry
in Taiwan uses a systematic and disciplined approach to achieve the goal of Six Sigma quality
level Hung and Sung ( 2011).In this study, the case company decides to implement six sigma
due to the customer encountered a problem in the finished product. After the approval of the
project, a team was formed which was led by a champion of the project with a black belt team
formation and two projects were chosen based on the customer complaint and using the
DMAIC methodology. At the start of the project, the defect rate was 0.45% (Baseline), and
after implementation, during a six-month period, this fell to below 0.141% (goal).
Six Sigma has a wide area of application starting from small industry to large, service
giving to the manufacturing industry. The survey made for evaluation of Portuguese small and
medium level industries application level of six sigma targeting on the 2012 Excellent SMEs
as L.Fonseca (2014) showed that 49% of the industries didn’t have an opinion about the value
addition by implementing six sigma and58% of them have a low level of knowledge and 3%
of them don’t agree on it. The main reason was the companies believed that the existence of a
satisfactory improvement mechanism, “the satisfaction with existing Management Systems
and the present Quality levels. In this study, for a given organization to use a management
improvement effectively there should be a brainstorming session to see the available options
with regard to bringing superior performance and improved profitability
To use six sigma as an optimization tool, different kinds of statistical tools have been
used in the previous researches.
2.7.4 Implementation of six sigma with integration of Design of
experiment
In the current operational management researches, researchers revealed that the benefit of
integrating various coinciding management practices for better competitiveness Madhuc (2011).
One of the practice is integrating Six Sigma with DoE. Those studies show that DOE tool has a
benefit to strengthen the six sigma, by narrowing down the source of variation to be more
explicit and for optimizing the responses are a major significance.

28 | P a g e
Looking through different research, according to A. Prashar (2015 ) study goal on the application
of Six Sigma/DOE Hybrid framework for improving damping force generation process in a
shock absorber assembly unit, tries to demonstrate the integration effect. The study used a case
study research methodology. In this study, for filtering the process parameter in the analysis
phase Shainin’s Component Search Technique (CST) followed by Taguchi Orthogonal Arrays
(OA) at the ‘improve’ phase were used for optimal parameter setting. On the other hand, a
literature review was conducted by focusing on the research which effectively used classical,
Shanin and Taguchi DOE with DMAIC approach by R. Kumar and Ramkumar (2017). In their
survey, they find out that it has a wide scope of usage for improvement of the “process parameter
setting” and to improve the problem recurrence in different sectors i.e in service, manufacturing,
public …etc. In their conclusion, in the current organization, those research were used for
finding the “optimal setting” for control factors together with six sigma DMAIC
2.8 Summary of literature review
From the previously reviewed literature, six sigma was defined as an improvement
philosophy which can be applied in performance improvement or reduction of variability in the
process. From time to time different tool integration has been developed for improvement of the
quality of result and this technique is guided by DMAIC methodology. In each phase of the
DMAIC a set of generic problem solving tools and techniques was applied. One of the tool is
DoE . Those studies show that DOE tool has a benefit to strengthen the six sigma, by narrowing
down the source of variation to be more explicit and for optimizing the responses is a major
significance of integrating DMAIC with DOE.
Various research use six sigma with the integration of different statistical techniques for
improvement of the quality of result but there was a few research which use six sigma and design
of experiment for addressing the improvement in coal energy utilization by maintaining or
without affecting the quality level of the product. Moreover, from the covered literature though
six sigma was widely implemented in different sector, there is a gap on how it can be adopted to
the specific case organization and be part of the organization system.
Therefore, in this research integration of six sigma and design of experiment for improvement in
coal utilization while considering the effect in quality was addressed. In addition, a way of
adoption of this system in a given company was proposed.

29 | P a g e
Chapter Three
3 Research Methodology
3.1 Research Design
The research design used for this study is a case study research since the study focus is in a
particular case company which is Mugher cement factory. In addition, by doing an experiment
on the selected variable identifying the effect on the improvement of the coal utilization also
performed .Therefor , the nature of this research is an experimental research design.
The source of data is based on the primary and secondary data such as, actual data taken by
direct observation of the process, past record of the process, Annual report of the factory, the
recent survey of the cement development, cement related recent researches.. etc. (Cooper and
Schindler, 2006) described that research design refers to how data collection and analysis are
structured in order to meet the research objectives through empirical evidence.
3.2 Method of Data Collection
To carry out this research the study was used both primary and secondary data sources since
the nature of the data is quantitative and qualitative. Collection of the necessary information is
done by direct observation, from previous data, departmental interviews and other methods to
understand the existing quality control methods used by the company, to identify the main
quality problem of clinker production and coal consumption of kiln and the stage were the
problem encounter and to know the main causes of this characteristics. This study focus
department is raw material supplies, clinker production and quality assurance department
division.
The collected data will include the physical, chemical test data, coal consumption, etc as given
below
The Raw material input data e.g limestone ,silica ,clay, other correctives
composition
Sub process data: e.g on process control of raw material content, Raw material
proportion data, fines of the mixed raw material(raw meal) and kiln meal data,
proportion of Lime saturation(LSM),Silica Moduli(SM), Refractory moduli(RM) in
the kiln meal, per every hour data
30 | P a g e
Finished product (clinker): e.g C3S,C2S ,C3A..etc content data ,on process control
of free lime data, clinker liter weight data ,
Coal consumption:- feed rate, fines ,grade, moisture content ,volatile
composition..etc
kiln operation parameter:-temperature ,pressure, amount of inlet air in the kiln,
flame adjustment, inlet air temperature..etc
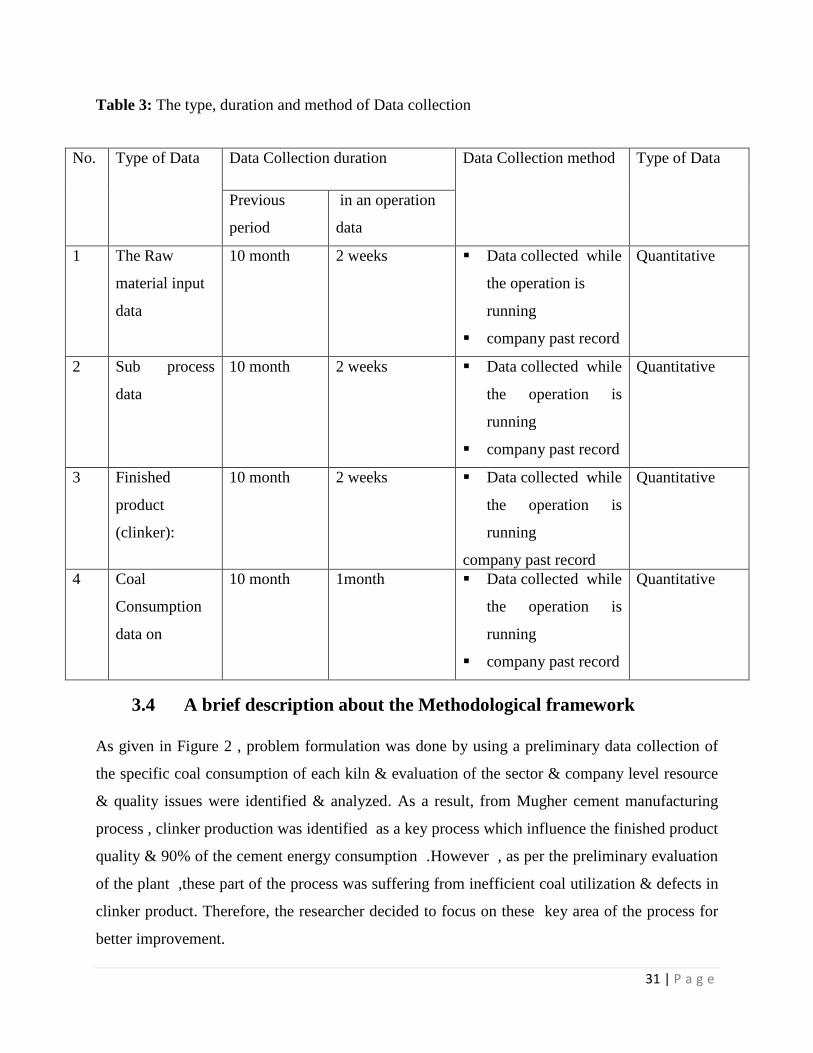
3.3 Data collection
In this summary, the type of data that needs to be collected is illustrated in table 4.The duration
of time that the data need to be collected is classified in to two period .The first is a past record
data collection which starts, from April, 2018-March, 2019 .With in this period, coal
consumption, raw material input (kiln feed data) , sub process data and finished product(in this
stage, clinker) was collected. Secondly, collection of process data while the plant is in an
operation was collected for two weeks by direct observing the process.
31 | P a g e
Table 3: The type, duration and method of Data collection
3.4 A brief description about the Methodological framework
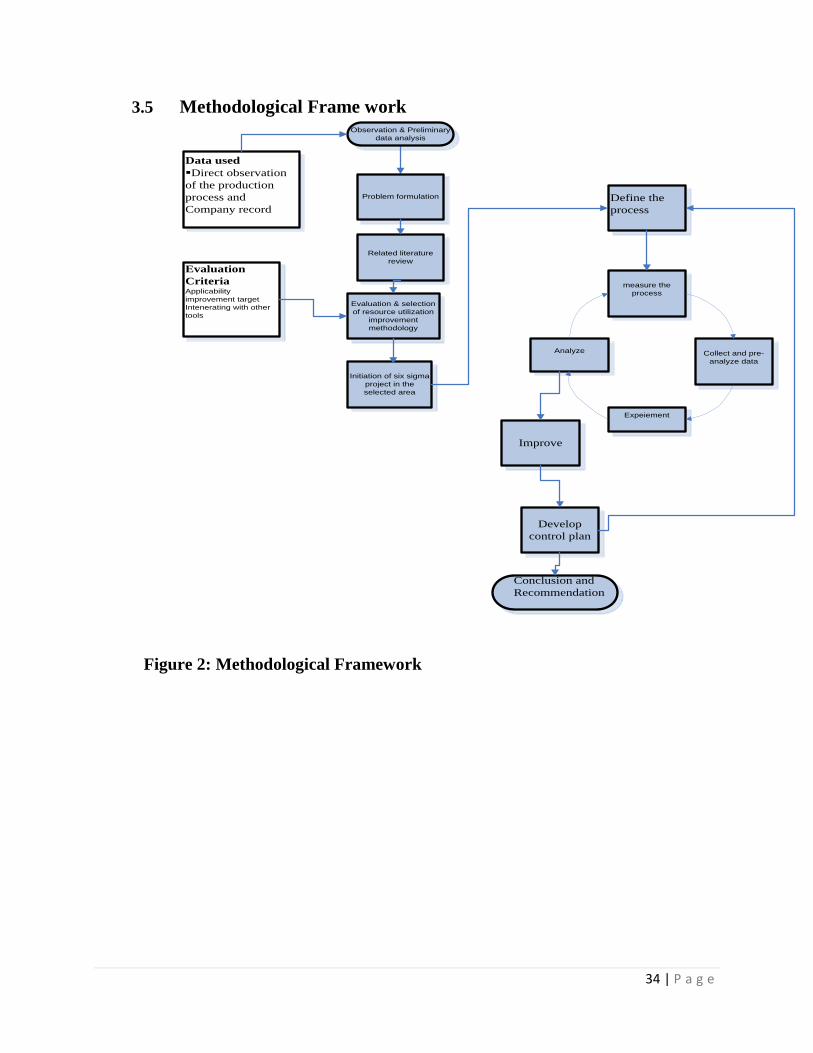
As given in Figure 2 , problem formulation was done by using a preliminary data collection of
the specific coal consumption of each kiln & evaluation of the sector & company level resource
& quality issues were identified & analyzed. As a result, from Mugher cement manufacturing
process , clinker production was identified as a key process which influence the finished product
quality & 90% of the cement energy consumption .However , as per the preliminary evaluation
of the plant ,these part of the process was suffering from inefficient coal utilization & defects in
clinker product. Therefore, the researcher decided to focus on these key area of the process for
better improvement.
No. Type of Data Data Collection duration Data Collection method Type of Data
Previous
period
in an operation
data
1 The Raw
material input
data
10 month 2 weeks Data collected while
the operation is
running
company past record
Quantitative
2 Sub process
data
10 month 2 weeks Data collected while
the operation is
running
company past record
Quantitative
3 Finished
product
(clinker):
10 month 2 weeks Data collected while
the operation is
running
company past record
Quantitative
4 Coal
Consumption
data on
10 month 1month Data collected while
the operation is
running
company past record
Quantitative
32 | P a g e
For addressing this problem, a review of previous research was conducted. Using those
methodology used in the previous literature as an input, evaluation was made based on which
method can bring a better improvement. In this stage from the critical analysis of different
literature, six sigma was selected for its applicability in any kind of performance improvement; it
can be used by integrating with different tool and for its improvement target level which is nearly
zero.
At six sigma initiation stage , from cement production process identification of the process that
should be covered in this research ,selection of the company professional for detailed analysis
(brainstorming session), the necessary data review from CCR was performed .
Starting from define the DMAIC-stage activity, method used and output is described in Table 4
as given below.
33 | P a g e
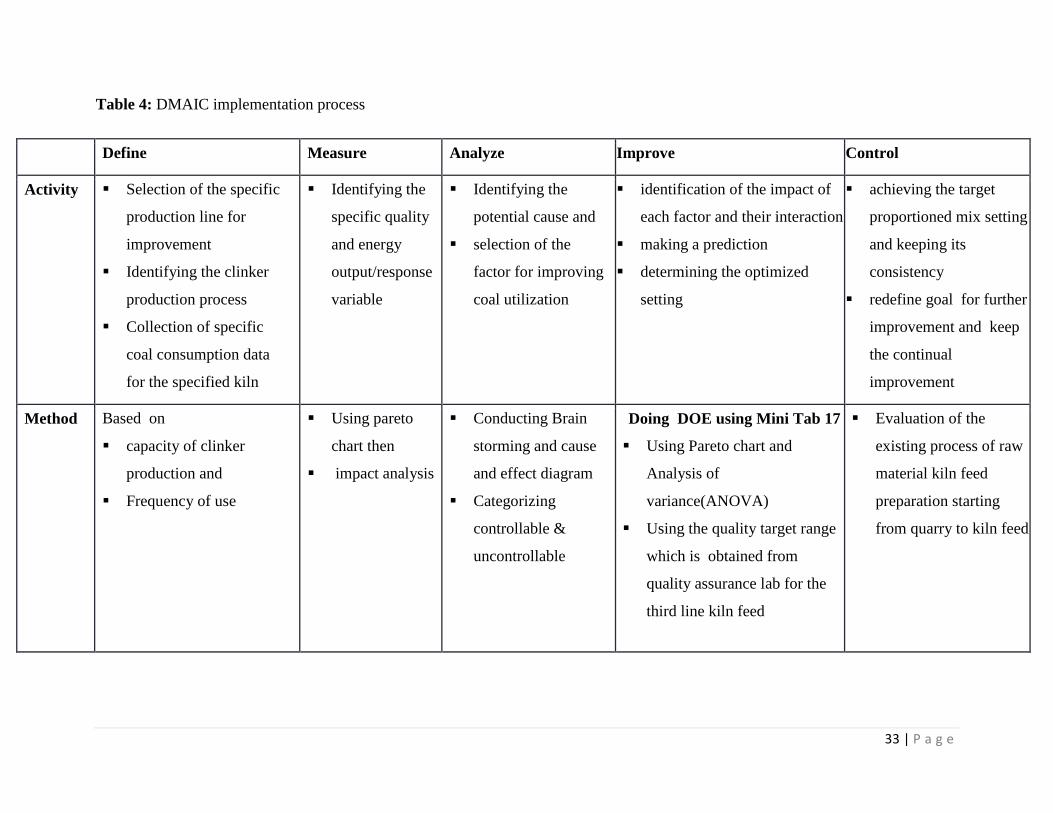
Table 4: DMAIC implementation process
Define Measure Analyze Improve Control
Activity Selection of the specific
production line for
improvement
Identifying the clinker
production process
Collection of specific
coal consumption data
for the specified kiln
Identifying the
specific quality
and energy
output/response
variable
Identifying the
potential cause and
selection of the
factor for improving
coal utilization
identification of the impact of
each factor and their interaction
making a prediction
determining the optimized
setting
achieving the target
proportioned mix setting
and keeping its
consistency
redefine goal for further
improvement and keep
the continual
improvement
Method Based on
capacity of clinker
production and
Frequency of use
Using pareto
chart then
impact analysis
Conducting Brain
storming and cause
and effect diagram
Categorizing
controllable &
uncontrollable
Doing DOE using Mini Tab 17
Using Pareto chart and
Analysis of
variance(ANOVA)
Using the quality target range
which is obtained from
quality assurance lab for the
third line kiln feed
Evaluation of the
existing process of raw
material kiln feed
preparation starting
from quarry to kiln feed
34 | P a g e
3.5 Methodological Frame work
Related literature
review
Evaluation & selection
of resource utilization
improvement
methodology
Initiation of six sigma
project in the
selected area
Evaluation
Criteria Applicability
improvement target
Intenerating with other
tools
Define the
process
measure the
process
Collect and pre-
analyze data
Analyze
Expeiement
Improve
Develop
control plan
Conclusion and
Recommendation
Observation & Preliminary
data analysis
Problem formulation
Data used
Direct observation
of the production
process and
Company record
Figure 2: Methodological Framework
35 | P a g e
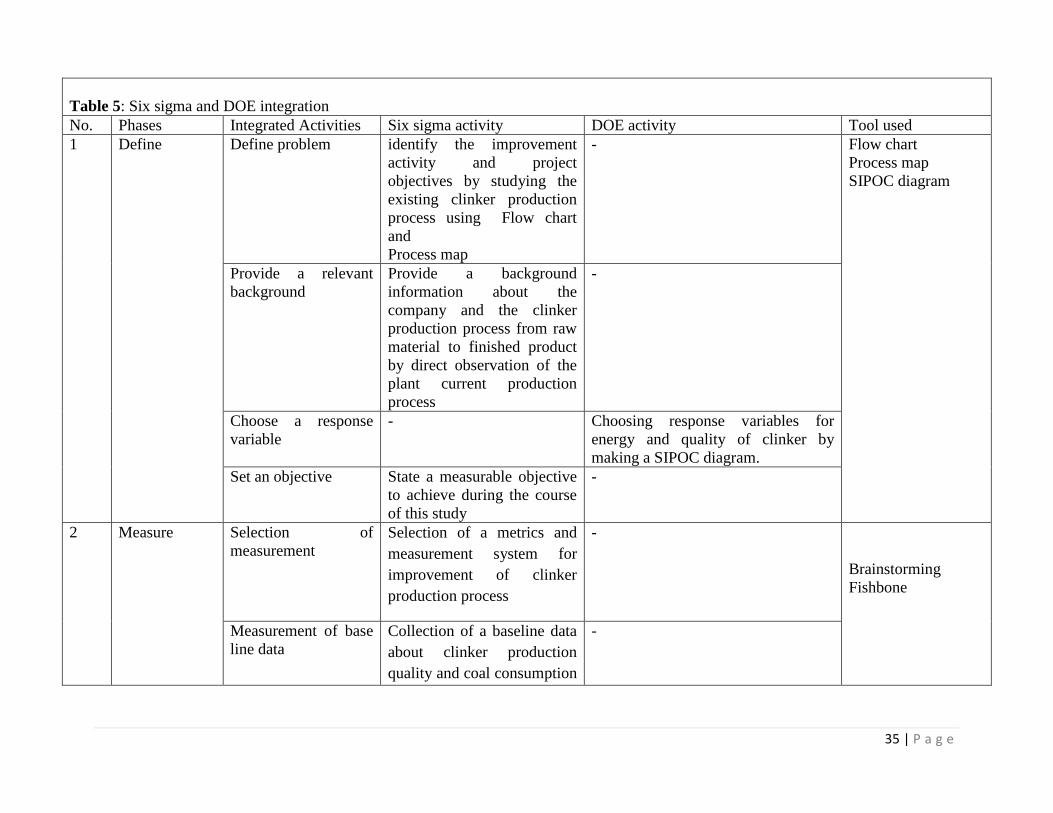
Table 5: Six sigma and DOE integration
No. Phases Integrated Activities Six sigma activity DOE activity Tool used
1 Define Define problem identify the improvement
activity and project
objectives by studying the
existing clinker production
process using Flow chart
and
Process map
- Flow chart
Process map
SIPOC diagram
Provide a relevant
background
Provide a background
information about the
company and the clinker
production process from raw
material to finished product
by direct observation of the
plant current production
process
-
Choose a response
variable
- Choosing response variables for
energy and quality of clinker by
making a SIPOC diagram.
Set an objective State a measurable objective
to achieve during the course
of this study
-
2 Measure Selection of
measurement
Selection of a metrics and
measurement system for
improvement of clinker
production process
-
Brainstorming
Fishbone
Measurement of base
line data
Collection of a baseline data
about clinker production
quality and coal consumption
-
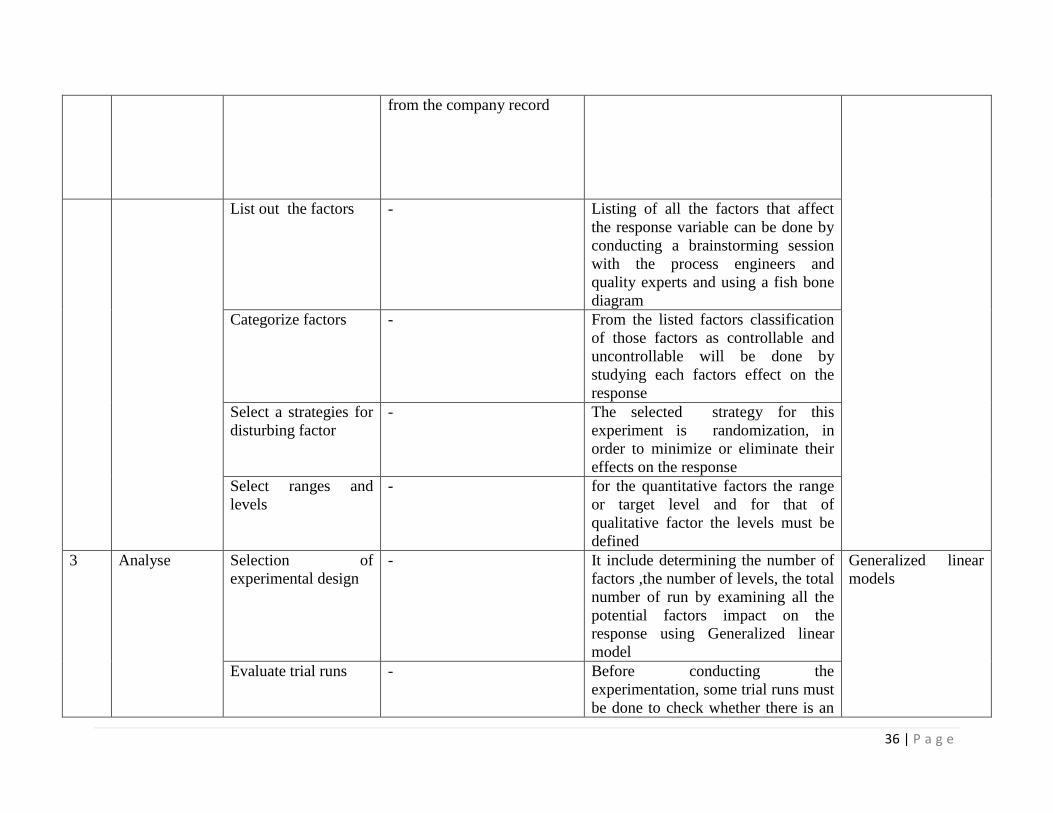
36 | P a g e
from the company record
List out the factors - Listing of all the factors that affect
the response variable can be done by
conducting a brainstorming session
with the process engineers and
quality experts and using a fish bone
diagram
Categorize factors - From the listed factors classification
of those factors as controllable and
uncontrollable will be done by
studying each factors effect on the
response
Select a strategies for
disturbing factor
- The selected strategy for this
experiment is randomization, in
order to minimize or eliminate their
effects on the response
Select ranges and
levels
- for the quantitative factors the range
or target level and for that of
qualitative factor the levels must be
defined
3 Analyse Selection of
experimental design
- It include determining the number of
factors ,the number of levels, the total
number of run by examining all the
potential factors impact on the
response using Generalized linear
model
Generalized linear
models
Evaluate trial runs - Before conducting the
experimentation, some trial runs must
be done to check whether there is an

37 | P a g e
experimental error and assumptions
made in previous steps
Conduct the
experiment and
recollect data
- By randomizing the order the
experiment will be conducted as
planned and the data will be
recollected for more analysis
Analysis of
interaction
- After conducting the experiment and
doing the interaction analysis by
using Minitab 17 software,
identification of the significant and
insignificant effects and interactions
will be done by and ANOVA.
Make a prediction
Model
- Using Minitab 17 software
determination of the empirical
mathematical model of response
versus experimental factors
Optimization - Identification of best factor level
settings from the given experiment
6 Improve Confirming testing - By using the new condition,
conducting a conformation test for
validating the result obtained from
experimentation in those values
should be performed
Make a conclusions
and recommendations
- Based on the result found from
experimentation ,
conclusions and recommendation
must be elaborated by using Graphics
are encouraged
Implement new
conditions
- Setting the new conditions in the
process or product
7 control Implement controls - Proposing a control plan to obtain
the benefit proposed
38 | P a g e
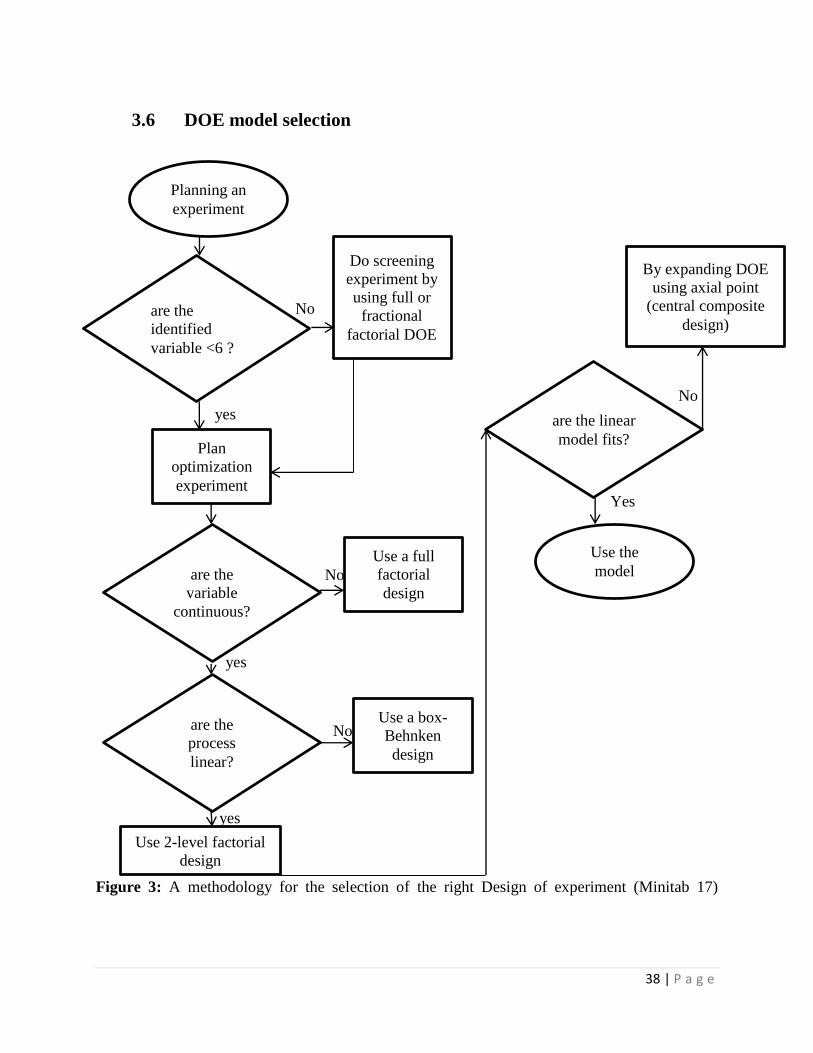
3.6 DOE model selection
No
No
yes
Yes
No
yes
No
yes
Figure 3: A methodology for the selection of the right Design of experiment (Minitab 17)
Planning an
experiment
are the
identified
variable <6 ?
Do screening
experiment by
using full or
fractional
factorial DOE
Plan
optimization
experiment
Use 2-level factorial
design
are the
variable
continuous?
are the
process
linear?
are the linear
model fits?
Use the
model
Use a box-
Behnken
design
Use a full
factorial
design
By expanding DOE
using axial point
(central composite
design)

39 | P a g e
In the above figure, in planning stage before data collection or creating a design for data
clarifying an objective and generating a plan for the experiment is the first priority. For getting
the most information from each experiment the following activities will be performed
Following a sequential experimentation process
Defining the problem that should be addressed through experimentation
Define the factor , response (Y) variable and the goal for Y
Plan for the process of experimentation
Once the variables that affect the response is identified, further evaluation for the number of
variables if they are above or below six will be done. when the number of variable is above six
,since running this amount of experimentation is an expensive and daunting task ,screening of
the most significant factors out of all the listed variable can be done by using full factorial
method.
In the case where the factors are below six, the next evaluation will be whether they are
continuous or discrete .If they are discrete, a full factorial DOE will be used. If not, further
checking of the process whether it is linear or not will be done .If the process is not linear the
box benchem DOE will be used. If it is linear, evaluation of this process linearity model fitness.
If it fits, use the developed model otherwise by expanding DOE using axial point (central
composite design) can be used.
40 | P a g e
Chapter Four
4 Data Collection and Analysis
In this chapter, based on the collected data and using DMAIC methodology data analysis
will be conducted. The first section will cover, defining the process of clinker production then
measurement of the amount of defects in clinker production and the waste in coal consumption
utilization (energy consumption) level of the kiln will be measured .Finally, analysis of the
problem will be conducted by using design of experiment for identifying the optimized setting
and proposing an improvement options.
4.1 Data Collection
Past and online record of process data were taken from CCR (central control room) and log book
record of the company. The collected data include quantitative and qualitative data of the raw
material (limestone, clay, sand),raw mill, kiln meal ,clinker and coal consumption by following
the process of production of clinker. The data were collected from April, 2018-March ,2019 .
4.2 Background of the study
4.2.1 A Brief description of Mugher Cement Factory
Mugher cement factory is one of the oldest and biggest factories in Ethiopia. It produces PPC
(Portland pozzolana cement) and OPC (ordinary Portland cement) cement with annual
production rate of over 1.7 million ton of PPC and OPC cement in a continuous production
process. The process of production is a dry type process. Under this factory there are three sub
branches in which one of the plant(Mugher branch plant) is a full processing plant which
produce OPC and PPC Cement and the rest two (Tatek and Addis Ababa branch plant) use the
sub processed product called clinker delivered from Mugher plant to produce a PPC cement or
finished product. Currently the Mugher branch plant has three clinker production lines namely
first, second and third line with each capacity of 1000 ton/day for the first and second line,
3000ton/day for the third line. The first and second lines are old lines; currently it uses electrical
and fuel energy. Unlike the old lines, the third line is a newly installed kiln line which has made
the company to reduce the cost of energy by replacing heavy fuel oil by a bituminous coal as a
major source of energy.
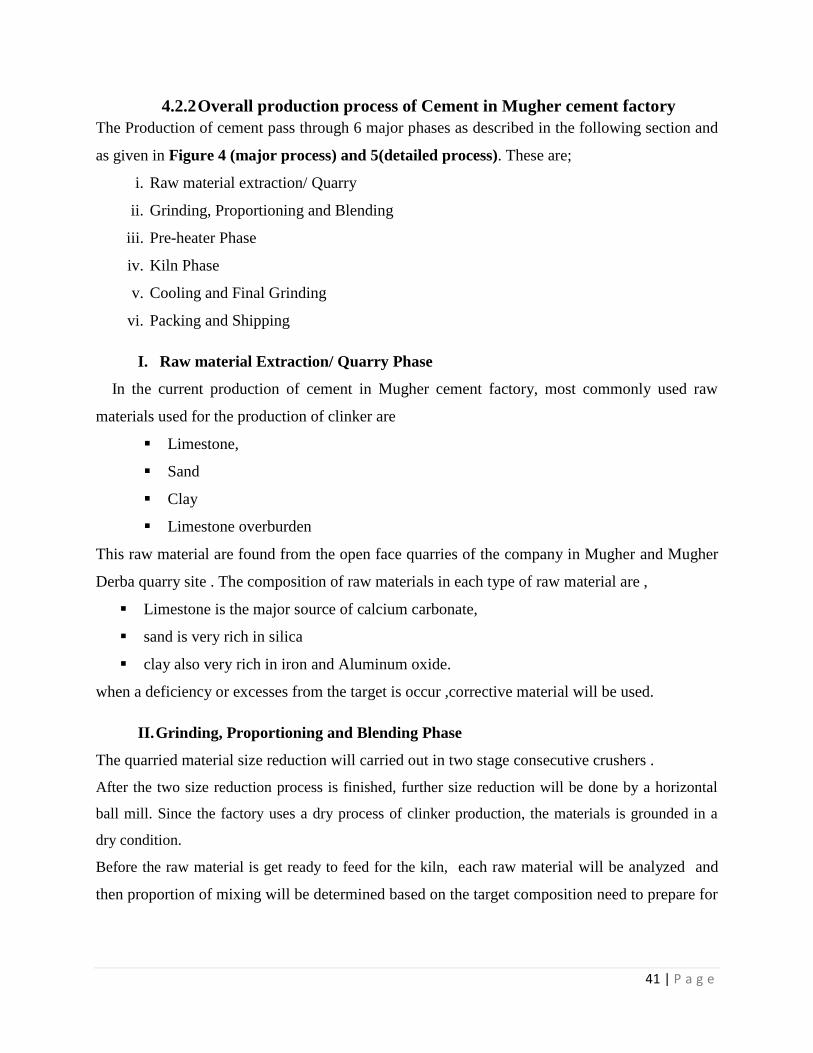
41 | P a g e
4.2.2 Overall production process of Cement in Mugher cement factory
The Production of cement pass through 6 major phases as described in the following section and
as given in Figure 4 (major process) and 5(detailed process). These are;
i. Raw material extraction/ Quarry
ii. Grinding, Proportioning and Blending
iii. Pre-heater Phase
iv. Kiln Phase
v. Cooling and Final Grinding
vi. Packing and Shipping
I. Raw material Extraction/ Quarry Phase
In the current production of cement in Mugher cement factory, most commonly used raw
materials used for the production of clinker are
Limestone,
Sand
Clay
Limestone overburden
This raw material are found from the open face quarries of the company in Mugher and Mugher
Derba quarry site . The composition of raw materials in each type of raw material are ,
Limestone is the major source of calcium carbonate,
sand is very rich in silica
clay also very rich in iron and Aluminum oxide.
when a deficiency or excesses from the target is occur ,corrective material will be used.
II. Grinding, Proportioning and Blending Phase
The quarried material size reduction will carried out in two stage consecutive crushers .
After the two size reduction process is finished, further size reduction will be done by a horizontal
ball mill. Since the factory uses a dry process of clinker production, the materials is grounded in a
dry condition.
Before the raw material is get ready to feed for the kiln, each raw material will be analyzed and
then proportion of mixing will be determined based on the target composition need to prepare for

42 | P a g e
kiln meal chemical composition .Those chemicals composition that will be analyzed by the quality
laboratory of the plant is
Calcium Oxide (CaO),
Silicone-di-Oxide(SiO2),
Magnesium Oxide(MgO),
Iron Oxide(Fe2O3)and
Aluminum Oxide (Al2O3)
In this stage , raw mix design will be done to determine the quantitative proportions of the raw
components in order to give the clinker the desired chemical and mineralogical composition.
Once, the type of clinker to be produced, with the process, raw materials and fuel available is
fixed, the next task will be to calculate the proportion of the raw materials required in preparing
the raw mix. The basis for calculation is the chemical composition proportion of the raw
materials. such as by using the parameters
LSF(lime saturation factory),
SM(silica moduli),
AM(aluminia Moduli) …etc
Then the Raw mix will be stored in a pre-homogenization pile after grinding raw mix to fine
powder.
III. Pre-Heating Raw Material Phase
After the raw mix is finally ground, the material will be ready to face the pre-heating chamber. In
Mugher the Pre-heating chamber consists of 5 vertical cyclones from where the raw material
passes before it reach into the kiln. Pre-heating chamber uses the emitted hot gases from kiln.
This will help the factory to save energy .
IV. Kiln Phase
A Kiln is a huge rotating furnace which is used for burning the raw material by passing the
ground raw material mix from the cyclone preheater to the high temperature kiln. When the dried
raw material pass through the kiln, the calcination (the carbonate constituents decompose into an
oxide and carbon dioxide) then enter into the sintering zone. In the sintering (or clinkering) zone, the
combustion gas reaches a temperature of 14500C to produce a black nodule called clinker. Since
43 | P a g e
the produced clinker is hot by the time when it is discharged from the kiln, a grate cooler is used
in Mugher cement factory.
A Coal is used as the primary fuel for burning and preheating of this raw materials .The burned
material called clinker form a minerals which are responsible mainly for strength development. Such
minerals are
C3S(alite),
C2S(belight),
C3A(aluminate),
C4AF( Ferrite) etc.
V. Cooling and Final Grinding
Once the clinker is formed in the rotary kiln, it will be cooled by means of forced air from a
cooling ID fan. Clinker released the absorb heat when it is exposed to the ambient air and cool
down to lower temperature. The Released heat by clinker is recycled back to the preheating
chamber for preheating of the newly entered raw material.
After cooling the clinker reaches a rotating horizontal drum called grinding mill which is filled with
steel ball for tumbling and crushing of clinker and other additives (Pumice and gypsum for PPC
cement ,only Gypsum for OPC cement production) to form a fine powder called cement.
VI. Packing and Shipping
After grinding the cement powder will be conveyed to the storage silos. Furthermore, it will be
packed and delivered in to 50kg bags or as a bulk form by means of bulk transportation truck s to the
customer
4.2.3 Coal preparation plant
In the factory there is a separate plant for coal storage and grinding .Currently among the type of
coal, a bituminous coal which is a bi-product of petroleum is used in this factory. It has a high
calorific value, in which 5800-6200 kcal/kg of coal can generate. In the current production of
clinker, the third line kiln uses a coal as a primary energy source. The preparation of fuel include
crushing, blending and grinding. Since Coal is delivered with some moisture to prevent dust
formation and fire during transportation. By passing hot gasses through the mill, it will combines
the grinding and drying. The waste heat from clinker cooling can be used to dry the coal.

44 | P a g e
4.2.4 Quality control and assurance of Mugher cement factory
Quality of cement is maintained by using Ethiopian standard requirements and company
requirements. The quality of finished product cement is assured by a regular analysis of raw
material ,clinker and cement based on the company’s developed inspection and quality assurance
procedure. The finished product quality parameters are
Two and Twenty eight days Cement compressive strength
Setting time
Expansion level
Sulphate content
When a clinker is produced , the composition such as C3S,C2S, C3A,C4AF ,..give those quality
characteristics and addition of Gypsum and pumice in clinker will have a significant impact to
control the level of those quality characteristics. e.g addition of gypsum will increase the setting
time and also improve the resistance for the chemical attack .
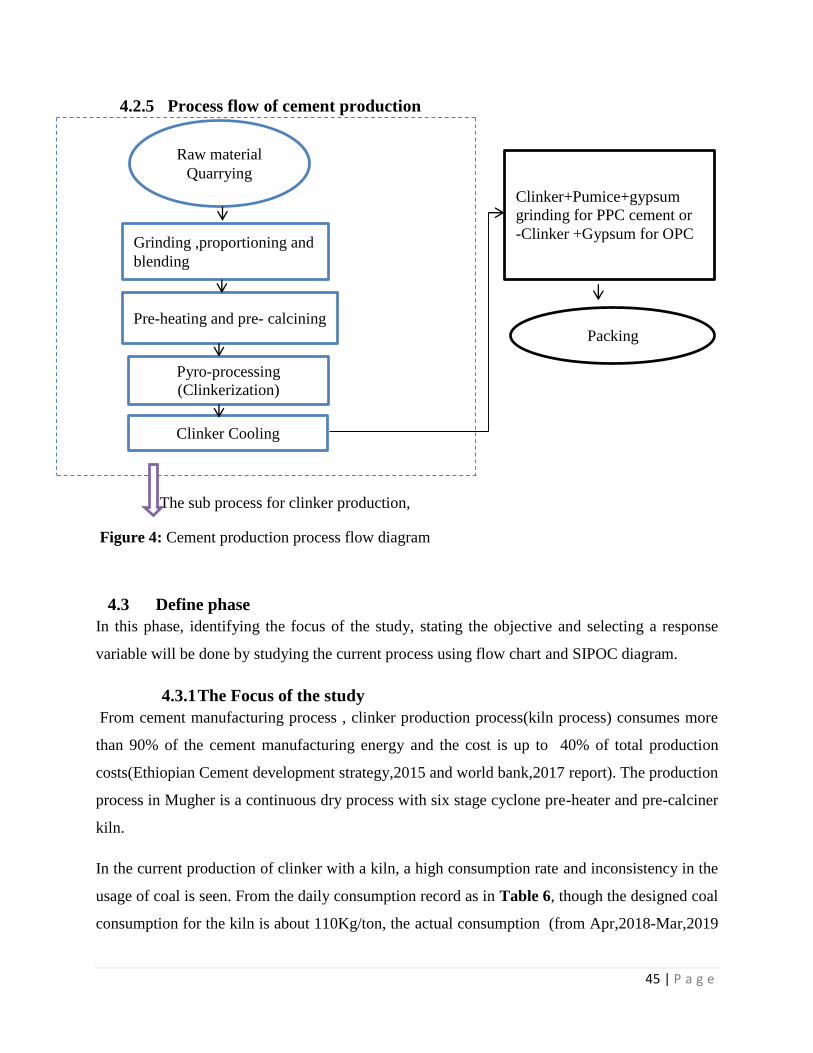
45 | P a g e
4.2.5 Process flow of cement production
The sub process for clinker production,
Figure 4: Cement production process flow diagram
4.3 Define phase
In this phase, identifying the focus of the study, stating the objective and selecting a response
variable will be done by studying the current process using flow chart and SIPOC diagram.
4.3.1 The Focus of the study
From cement manufacturing process , clinker production process(kiln process) consumes more
than 90% of the cement manufacturing energy and the cost is up to 40% of total production
costs(Ethiopian Cement development strategy,2015 and world bank,2017 report). The production
process in Mugher is a continuous dry process with six stage cyclone pre-heater and pre-calciner
kiln.
In the current production of clinker with a kiln, a high consumption rate and inconsistency in the
usage of coal is seen. From the daily consumption record as in Table 6, though the designed coal
consumption for the kiln is about 110Kg/ton, the actual consumption (from Apr,2018-Mar,2019
Raw material
Quarrying
Grinding ,proportioning and
blending
Pre-heating and pre- calcining
Pyro-processing
(Clinkerization)
Clinker Cooling
Packing
Clinker+Pumice+gypsum
grinding for PPC cement or
-Clinker +Gypsum for OPC

46 | P a g e
consumption record ) shows approximately 128kg/ton which is high as compared to the designed
consumption .
As illustrated in Table 7, from the produced clinker during April, 2018 to Feb,2019 a defect
were recorded.In this case to count the defect ,the quality clinker parameters are mention in table
2. Meanwhile, from the three kiln, the 3rd line kiln has more production capacity and the
company use this kiln frequently. Therefore priority is given for improvement of the third line
kiln coal (energy consumption) utilization without compromising the quality of clinker(i.e
C3S>50%,15<C2S ,C4AF(5-15%) ,Free CaO(1.5-2.5%),Litter weight(11250-1350kg/lit).
Therefore, a kiln production process is the main focus of the study.
Table 6: Coal consumption data collected from April, 2018-Feb, 2019
No. Monthly average
consumption
Working
days
Working
hour
Specific Coal consumption
(Kg. Coal/ton Clinker)
1 April,2018 17 320 135
2 May,2018 24 547 122
3 June,2018 11 216 134
4 July,2018 0 - -
5 Aug,2018 24 379 142
6 Sept,2018 22 422 117
7 Oct,2018 21 384 130
8 Nov,2018 6 79 141
9 Dec,2018 0 - -
10 Jan,2019 15 213 126
11 Feb,2019 23 465 124
12 March,2019 26 615 122
Average 127 kg coal/ton clinker
produced
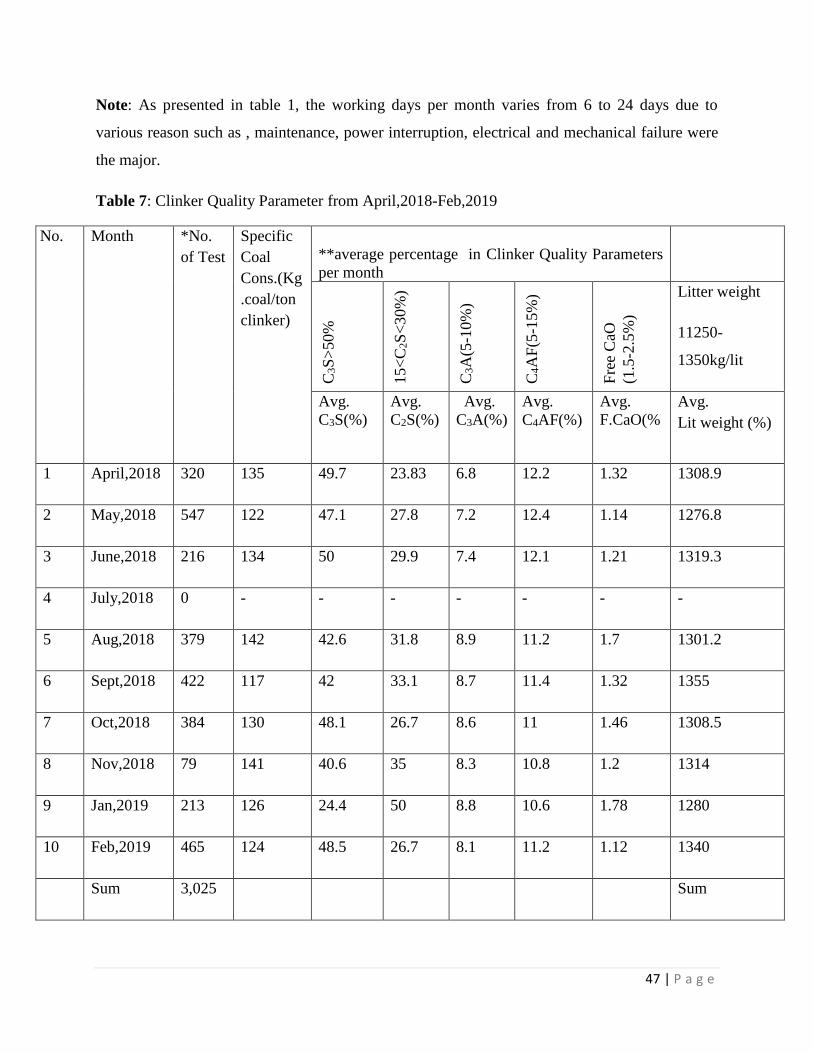
47 | P a g e
Note: As presented in table 1, the working days per month varies from 6 to 24 days due to
various reason such as , maintenance, power interruption, electrical and mechanical failure were
the major.
Table 7: Clinker Quality Parameter from April,2018-Feb,2019
No. Month *No.
of Test
Specific
Coal
Cons.(Kg
.coal/ton
clinker)
**average percentage in Clinker Quality Parameters
per month
C3S
>50%
15<
C2S
<30%
)
C3A
(5-1
0%
)
C4A
F(5
-15%
)
Fre
e C
aO
(1.5
-2.5
%)
Litter weight
11250-
1350kg/lit
Avg.
C3S(%)
Avg.
C2S(%)
Avg.
C3A(%)
Avg.
C4AF(%)
Avg.
F.CaO(%
Avg.
Lit weight (%)
1 April,2018 320 135 49.7 23.83 6.8 12.2 1.32 1308.9
2 May,2018 547 122 47.1 27.8 7.2 12.4 1.14 1276.8
3 June,2018 216 134 50 29.9 7.4 12.1 1.21 1319.3
4 July,2018 0 - - - - - - -
5 Aug,2018 379 142 42.6 31.8 8.9 11.2 1.7 1301.2
6 Sept,2018 422 117 42 33.1 8.7 11.4 1.32 1355
7 Oct,2018 384 130 48.1 26.7 8.6 11 1.46 1308.5
8 Nov,2018 79 141 40.6 35 8.3 10.8 1.2 1314
9 Jan,2019 213 126 24.4 50 8.8 10.6 1.78 1280
10 Feb,2019 465 124 48.5 26.7 8.1 11.2 1.12 1340
Sum 3,025 Sum

48 | P a g e
Note :
* Number of Test: for counting the number of test, assumption were taken to take the number of
inspection performed per each hour as the number of test .
** Clinker Quality Parameters
Quality of a given clinker is measured by its composition of Alite ( C3S), Belite
(C2S), Aluminate (C3A) , Ferrite (C4AF) and free calcium oxide.
***Number of defect
Since the process is a continuous process, the number of defect is counted from each hour
inspection test which failed to fulfill the quality requirement (target),
Clinker Quality parameter and their significance in cement
Alite (C3S) is the most significant constituent of clinker and cement it ranges >50% in
normal Portland cement clinkers. It is tri-calcium silicate (Ca3SiO5) modified in composition
and crystal structure by ionic substitutions.
o It determine an early and later strength of cement (main strength constituent of
cement)
o For rapid hydration, high initial and good final strength
Belite (C2S) constitutes 15-30% of normal Portland cement clinkers. It is di-calcium silicate
(Ca2SiO4) modified by ionic substitutions and normally presents wholly and largely as the P-
polymorph.
o It has low heat of hydration and contribute to late strength
Aluminate (C3A) constitutes 5-10% of most normal Portland cement clinkers. It is Tri-
calcium aluminate (Ca3Al2O6), substantially modified in composition and sometimes also in
structure by ionic substitutions. It’s main benefit are:-
o Used for rapid hydration that promote early strength
o Reacts with sulfate and undergoes volume expansion
o Shrinks appreciably on hydration
49 | P a g e
Ferrite (C4AF) makes up 5-15% of normal Portland cement clinkers. It is a tetra-calcium
alumino ferrite (Ca4AlFeO5), substantially modified in composition by variation in Al/Fe
ratio and ionic substitution.
o Contribute little or no for strength development
o Gives normal cement its colors
o Has moderate heat of hydration
From clinker production process the above quality parameters are inspected after clinker cooling
process as shown in Figure 5 below. On the other hand, for producing a quality clinker different
input are necessary as given in the Table 8(SIPOC diagram)
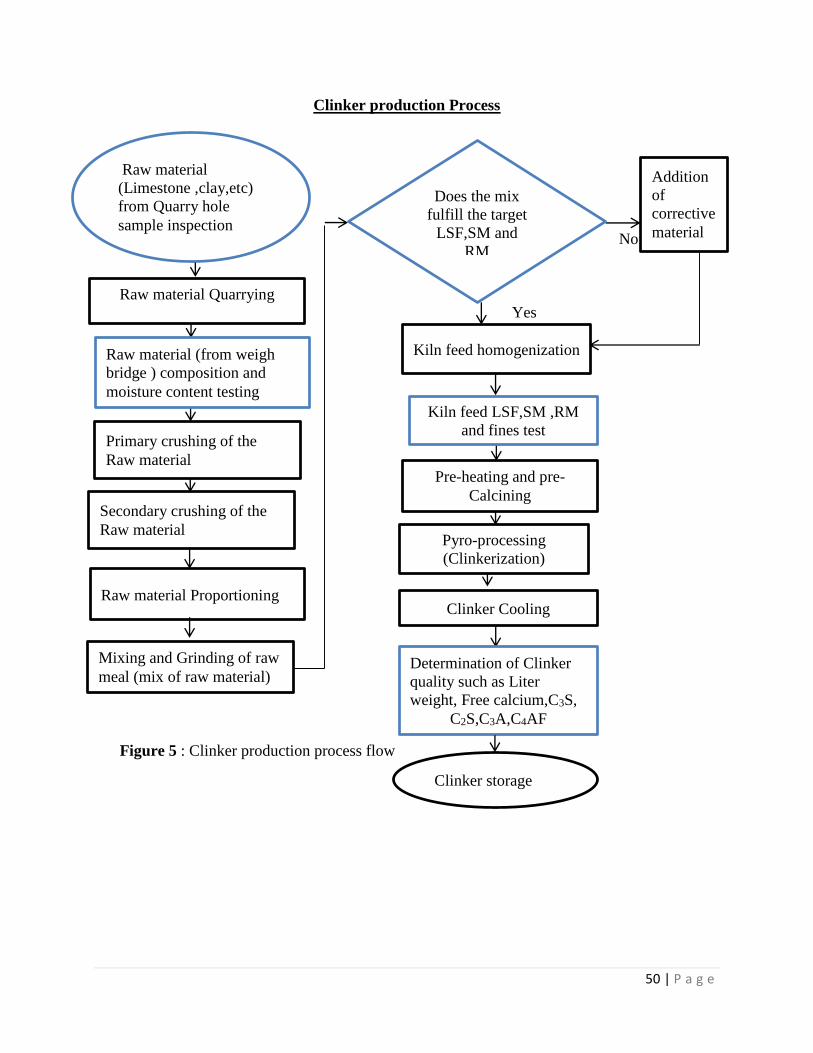
50 | P a g e
Clinker production Process
No
No
Yes
Figure 5 : Clinker production process flow
Raw material
(Limestone ,clay,etc)
from Quarry hole
sample inspection
Raw material Proportioning
Primary crushing of the
Raw material
Kiln feed homogenization
Pre-heating and pre-
Calcining
Pyro-processing
(Clinkerization)
Clinker Cooling
Mixing and Grinding of raw
meal (mix of raw material)
Secondary crushing of the
Raw material
Clinker storage
Raw material (from weigh
bridge ) composition and
moisture content testing
Does the mix
fulfill the target
LSF,SM and
RM
requirement???
Addition
of
corrective
material
Determination of Clinker
quality such as Liter
weight, Free calcium,C3S,
C2S,C3A,C4AF
Raw material Quarrying
Kiln feed LSF,SM ,RM
and fines test
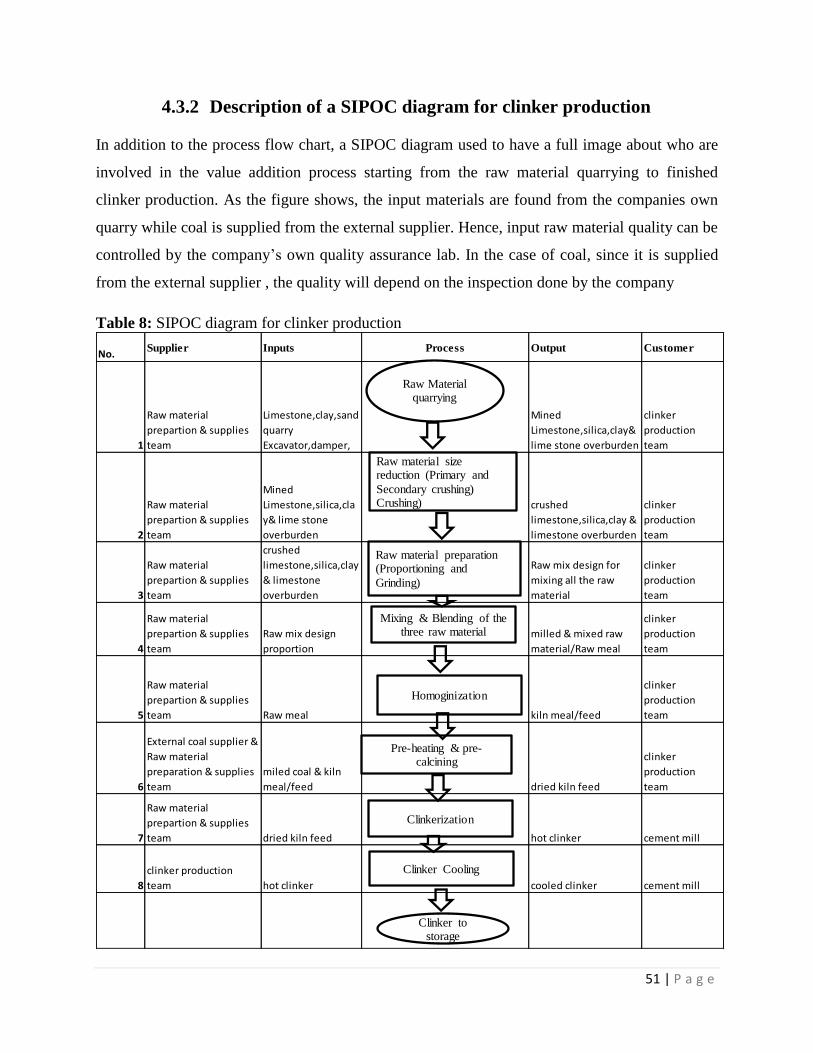
51 | P a g e
4.3.2 Description of a SIPOC diagram for clinker production
In addition to the process flow chart, a SIPOC diagram used to have a full image about who are
involved in the value addition process starting from the raw material quarrying to finished
clinker production. As the figure shows, the input materials are found from the companies own
quarry while coal is supplied from the external supplier. Hence, input raw material quality can be
controlled by the company’s own quality assurance lab. In the case of coal, since it is supplied
from the external supplier , the quality will depend on the inspection done by the company
Table 8: SIPOC diagram for clinker production
No.Supplier Inputs Process Output Customer
1
Raw material
prepartion & supplies
team
Limestone,clay,sand
quarry
Excavator,damper,
Mined
Limestone,silica,clay&
lime stone overburden
clinker
production
team
2
Raw material
prepartion & supplies
team
Mined
Limestone,silica,cla
y& lime stone
overburden
crushed
limestone,silica,clay &
limestone overburden
clinker
production
team
3
Raw material
prepartion & supplies
team
crushed
limestone,silica,clay
& limestone
overburden
Raw mix design for
mixing all the raw
material
clinker
production
team
4
Raw material
prepartion & supplies
team
Raw mix design
proportion
milled & mixed raw
material/Raw meal
clinker
production
team
5
Raw material
prepartion & supplies
team Raw meal kiln meal/feed
clinker
production
team
6
External coal supplier &
Raw material
preparation & supplies
team
miled coal & kiln
meal/feed dried kiln feed
clinker
production
team
7
Raw material
prepartion & supplies
team dried kiln feed hot clinker cement mill
8
clinker production
team hot clinker cooled clinker cement mill
Clinkerization
Clinker Cooling
Clinker to storage
Raw Material quarrying
Raw material size reduction (Primary and
Secondary crushing) Crushing)
Raw material preparation (Proportioning and
Grinding)
Mixing & Blending of the three raw material
Pre-heating & pre- calcining
Homoginization

52 | P a g e
4.3.3 Problem definition
i. Referring the kiln designed specific coal consumption for the third line kiln, it is
110kg/ton of Clinker production but from the daily data record taken from April,2018-
March,2019(Refer Table 6) revealed that the kiln was working on average ,127Kg
coal/ton of clinker produced. Similarly, as the data indicates, there is a chance to reduce
this amount in a consistent way since the range of consumption reaches 24kg coal/ton.
ii. The produced clinker from April,2018- Feb,2019 Producing below the required quality
Clinker i.e the quality parameters C3S, C2S ,C3A,C4AF free calcium content of clinker
and litter weight has a target level as given in Table 7 and based on this range some of
the parameters shows an out of range result.
4.3.4 Objective of the project
In the current production of clinker, identifying an optimized setting for consumption
of coal in the 3rd line kiln by maintaining or improving the existing quality level using
full factorial design of experiment method
4.4 Measure phase
In this phase, establishing of a baseline performance of how the current process of clinker and
coal consumption is performing and selection of a metrics and measurement system
4.4.1 Response/output variable measurements
For Quality
o Percentage composition of C3S , C2S, C3A, C4AF , free lime content and Litter
weight of clinker
For Energy
o Hourly consumption of Coal consumption
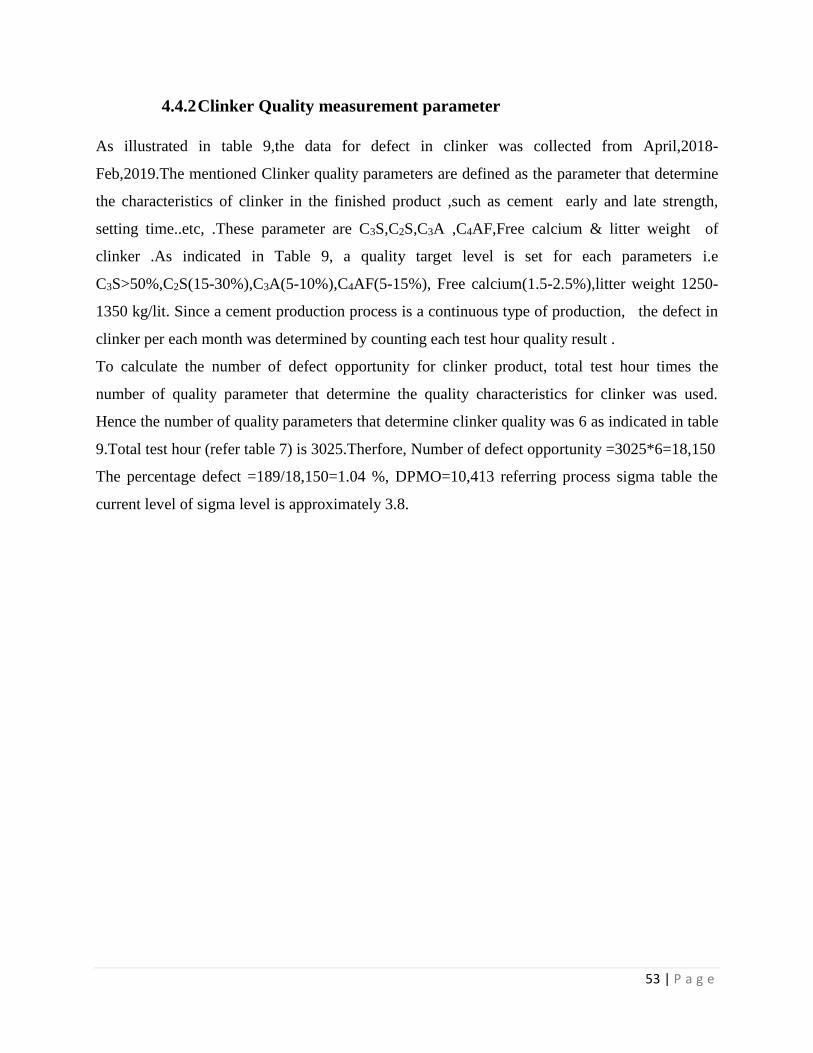
53 | P a g e
4.4.2 Clinker Quality measurement parameter
As illustrated in table 9,the data for defect in clinker was collected from April,2018-
Feb,2019.The mentioned Clinker quality parameters are defined as the parameter that determine
the characteristics of clinker in the finished product ,such as cement early and late strength,
setting time..etc, .These parameter are C3S,C2S,C3A ,C4AF,Free calcium & litter weight of
clinker .As indicated in Table 9, a quality target level is set for each parameters i.e
C3S>50%,C2S(15-30%),C3A(5-10%),C4AF(5-15%), Free calcium(1.5-2.5%),litter weight 1250-
1350 kg/lit. Since a cement production process is a continuous type of production, the defect in
clinker per each month was determined by counting each test hour quality result .
To calculate the number of defect opportunity for clinker product, total test hour times the
number of quality parameter that determine the quality characteristics for clinker was used.
Hence the number of quality parameters that determine clinker quality was 6 as indicated in table
9.Total test hour (refer table 7) is 3025.Therfore, Number of defect opportunity =3025*6=18,150
The percentage defect =189/18,150=1.04 %, DPMO=10,413 referring process sigma table the
current level of sigma level is approximately 3.8.
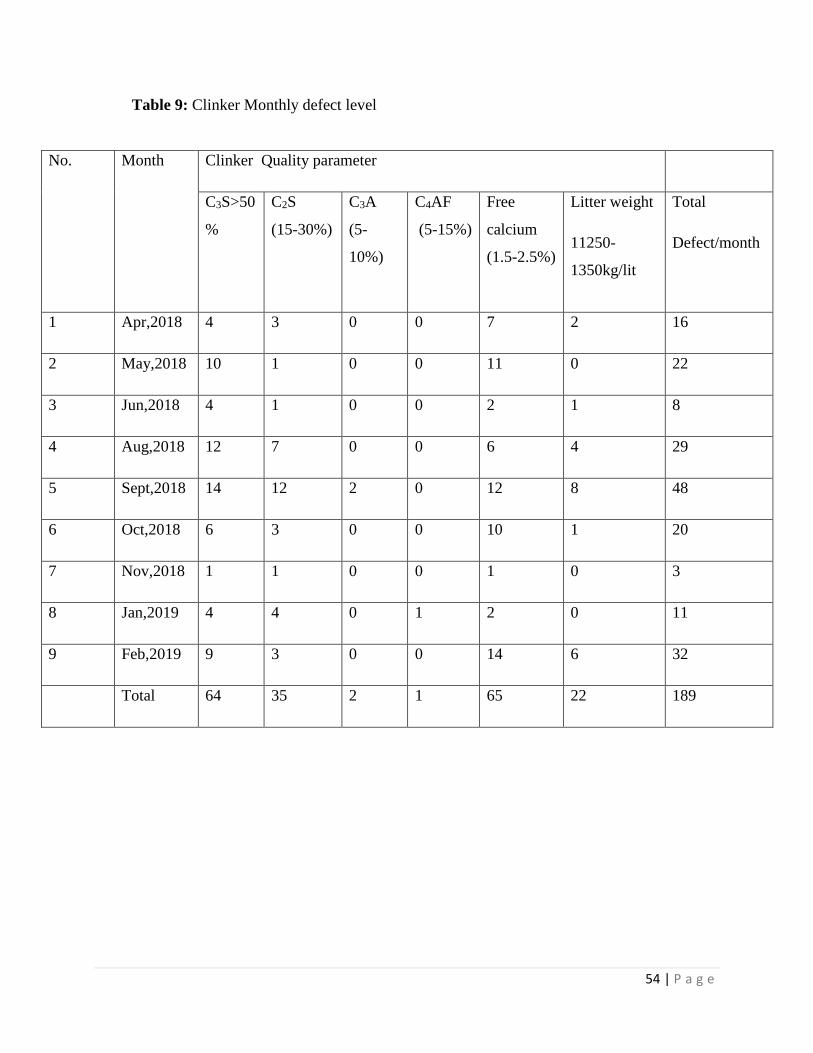
54 | P a g e
Table 9: Clinker Monthly defect level
No.
Month Clinker Quality parameter
C3S>50
%
C2S
(15-30%)
C3A
(5-
10%)
C4AF
(5-15%)
Free
calcium
(1.5-2.5%)
Litter weight
11250-
1350kg/lit
Total
Defect/month
1 Apr,2018 4 3 0 0 7 2 16
2 May,2018 10 1 0 0 11 0 22
3 Jun,2018 4 1 0 0 2 1 8
4 Aug,2018 12 7 0 0 6 4 29
5 Sept,2018 14 12 2 0 12 8 48
6 Oct,2018 6 3 0 0 10 1 20
7 Nov,2018 1 1 0 0 1 0 3
8 Jan,2019 4 4 0 1 2 0 11
9 Feb,2019 9 3 0 0 14 6 32
Total 64 35 2 1 65 22 189
55 | P a g e
Pareto chart of clinker unfulfilled quality parameter from April, 2018 to Feb, 2019
Figure 6: Pareto chart for clinker unfulfilled quality parameter
In the pareto analysis given in Fig.6,from the produced clinker the defect in free calcium oxide,
C3S and C2S composition test takes around 85% contribution of the total defect formed .Thus,
to decide on which quality parameter this research should focus, an impact analysis of those
clinker quality parameter (C3S,C2S,C3A,liter weight and free calcium ) on finished product or
cement was performed by doing a questionnaire evaluation with professionals who are
involved in clinker production process and quality controlling (two senior chemist and two
process Engineer were participated) activity in Mugher cement factory. The content of the
questionnaire includes the impact of each clinker quality parameters (C3S,C2S,C4AF..etc) on the
cement quality such as ,two and twenty eight days compressive strength ,setting time when
cement is mixed with water, expansion etc.
As the evaluation result shows in Table 10, C3S and Free calcium oxide takes the highest rating.
Therefore, from the pareto chart and impact analysis evaluation, C3S and free calcium oxide is
selected to be the major quality parameter to be considered when an improvement in coal
consumption is made.
0%
20%
40%
60%
80%
100%
120%
0
10
20
30
40
50
60
70
Freecalciumoxide
C3S C2S Literweight
C3A C4AF
Frequency
Percentage
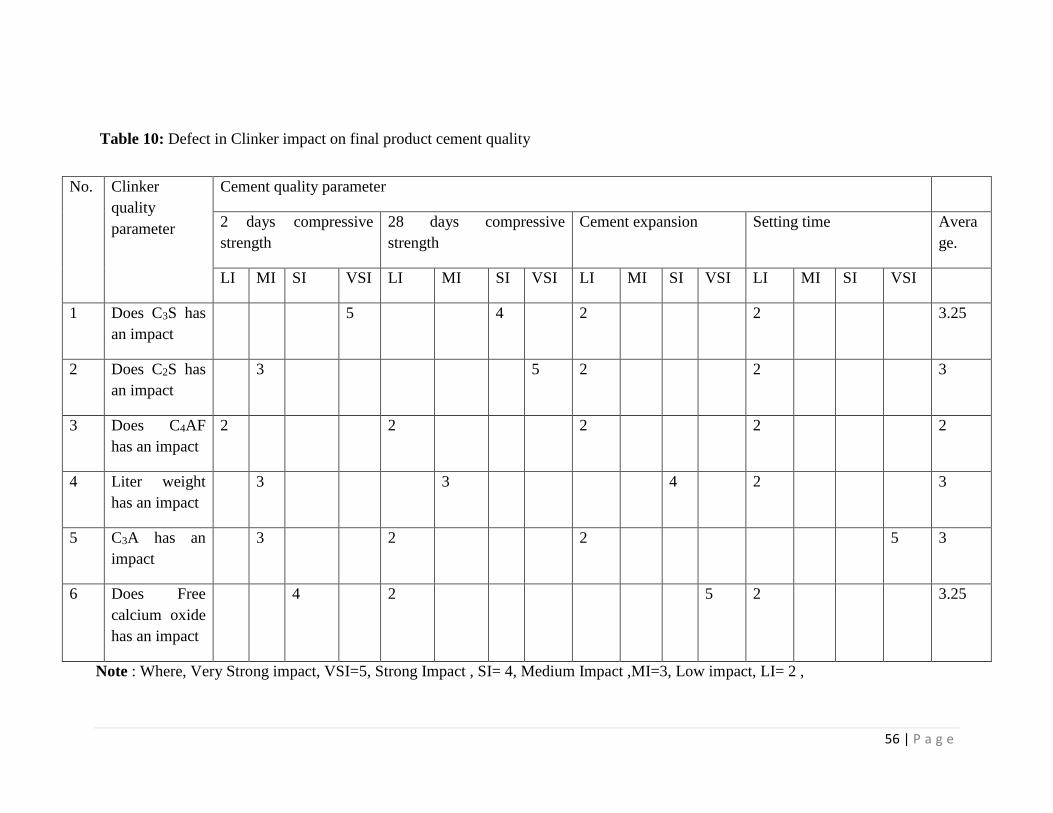
56 | P a g e
Table 10: Defect in Clinker impact on final product cement quality
Note : Where, Very Strong impact, VSI=5, Strong Impact , SI= 4, Medium Impact ,MI=3, Low impact, LI= 2 ,
No. Clinker
quality
parameter
Cement quality parameter
2 days compressive
strength
28 days compressive
strength
Cement expansion Setting time Avera
ge.
LI MI SI VSI LI MI SI VSI LI MI SI VSI LI MI SI VSI
1 Does C3S has
an impact
5 4 2 2 3.25
2 Does C2S has
an impact
3 5 2 2 3
3 Does C4AF
has an impact
2 2 2 2 2
4 Liter weight
has an impact
3 3 4 2 3
5 C3A has an
impact
3 2 2 5 3
6 Does Free
calcium oxide
has an impact
4 2 5 2 3.25
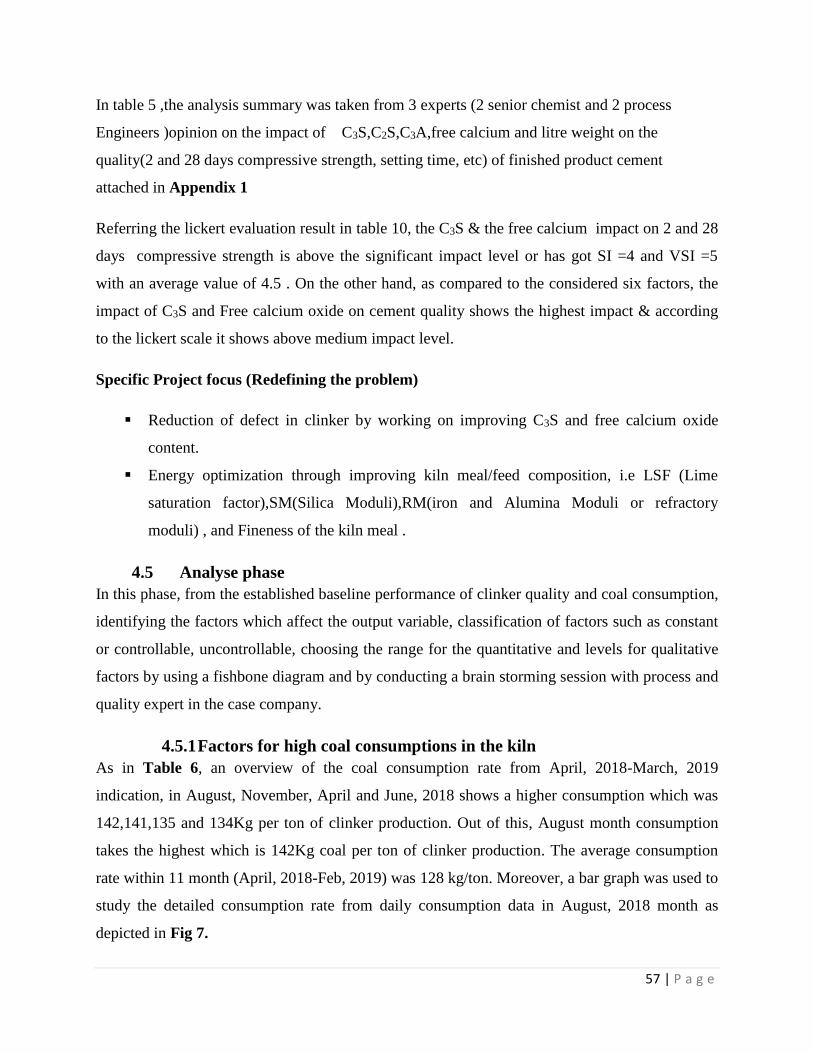
57 | P a g e
In table 5 ,the analysis summary was taken from 3 experts (2 senior chemist and 2 process
Engineers )opinion on the impact of C3S,C2S,C3A,free calcium and litre weight on the
quality(2 and 28 days compressive strength, setting time, etc) of finished product cement
attached in Appendix 1
Referring the lickert evaluation result in table 10, the C3S & the free calcium impact on 2 and 28
days compressive strength is above the significant impact level or has got SI =4 and VSI =5
with an average value of 4.5 . On the other hand, as compared to the considered six factors, the
impact of C3S and Free calcium oxide on cement quality shows the highest impact & according
to the lickert scale it shows above medium impact level.
Specific Project focus (Redefining the problem)
Reduction of defect in clinker by working on improving C3S and free calcium oxide
content.
Energy optimization through improving kiln meal/feed composition, i.e LSF (Lime
saturation factor),SM(Silica Moduli),RM(iron and Alumina Moduli or refractory
moduli) , and Fineness of the kiln meal .
4.5 Analyse phase
In this phase, from the established baseline performance of clinker quality and coal consumption,
identifying the factors which affect the output variable, classification of factors such as constant
or controllable, uncontrollable, choosing the range for the quantitative and levels for qualitative
factors by using a fishbone diagram and by conducting a brain storming session with process and
quality expert in the case company.
4.5.1 Factors for high coal consumptions in the kiln
As in Table 6, an overview of the coal consumption rate from April, 2018-March, 2019
indication, in August, November, April and June, 2018 shows a higher consumption which was
142,141,135 and 134Kg per ton of clinker production. Out of this, August month consumption
takes the highest which is 142Kg coal per ton of clinker production. The average consumption
rate within 11 month (April, 2018-Feb, 2019) was 128 kg/ton. Moreover, a bar graph was used to
study the detailed consumption rate from daily consumption data in August, 2018 month as
depicted in Fig 7.
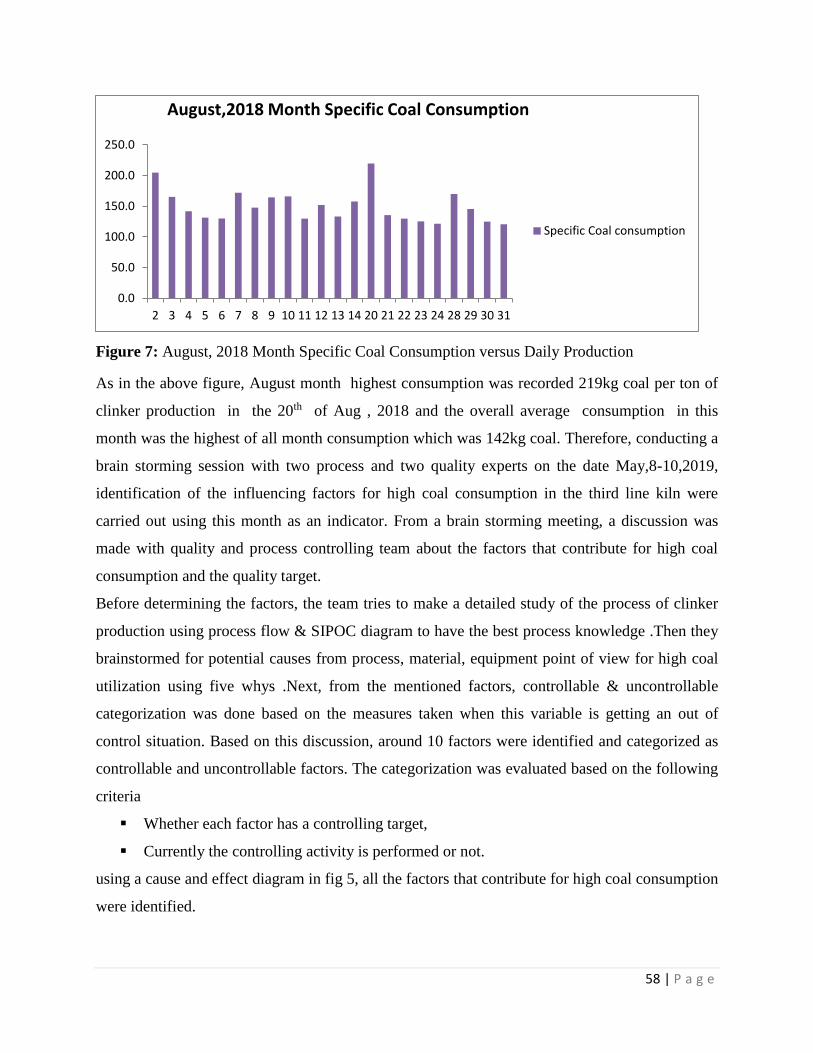
58 | P a g e
Figure 7: August, 2018 Month Specific Coal Consumption versus Daily Production
As in the above figure, August month highest consumption was recorded 219kg coal per ton of
clinker production in the 20th of Aug , 2018 and the overall average consumption in this
month was the highest of all month consumption which was 142kg coal. Therefore, conducting a
brain storming session with two process and two quality experts on the date May,8-10,2019,
identification of the influencing factors for high coal consumption in the third line kiln were
carried out using this month as an indicator. From a brain storming meeting, a discussion was
made with quality and process controlling team about the factors that contribute for high coal
consumption and the quality target.
Before determining the factors, the team tries to make a detailed study of the process of clinker
production using process flow & SIPOC diagram to have the best process knowledge .Then they
brainstormed for potential causes from process, material, equipment point of view for high coal
utilization using five whys .Next, from the mentioned factors, controllable & uncontrollable
categorization was done based on the measures taken when this variable is getting an out of
control situation. Based on this discussion, around 10 factors were identified and categorized as
controllable and uncontrollable factors. The categorization was evaluated based on the following
criteria
Whether each factor has a controlling target,
Currently the controlling activity is performed or not.
using a cause and effect diagram in fig 5, all the factors that contribute for high coal consumption
were identified.
0.0
50.0
100.0
150.0
200.0
250.0
2 3 4 5 6 7 8 9 10 11 12 13 14 20 21 22 23 24 28 29 30 31
August,2018 Month Specific Coal Consumption
Specific Coal consumption
59 | P a g e
Possible root cause for high coal consumption in the kiln
Coal consumption in the kiln
Machine process
Measurement
Material
Un-calibrated measuring instrument
ID fan improper operation Inlet air flow rate Inlet air temprature
Kiln feed rate
Kiln feed finesInlet feed SM
Kiln feed moistureInlet feed LSF
Inlet feed RM
Coal fines
Coal heating value
In homogeneity of kiln feed
Figure 8: Root Cause for high coal consumption in the kiln
From the identified potential causes, before selecting the significant factors, the listed factors
were categorized into controllable and uncontrollable .The controllable factors were defined as
the factors which can be adjusted and has a range or level of operation during processing and that
of uncontrollable factors are difficult to adjust during an operation rather there influence can be
minimized by randomizing the experiment order. Therefore, in this categorization, from the
controllable factors the significant once are selected for conducting full factorial experiment by
adjusting the range of operation.
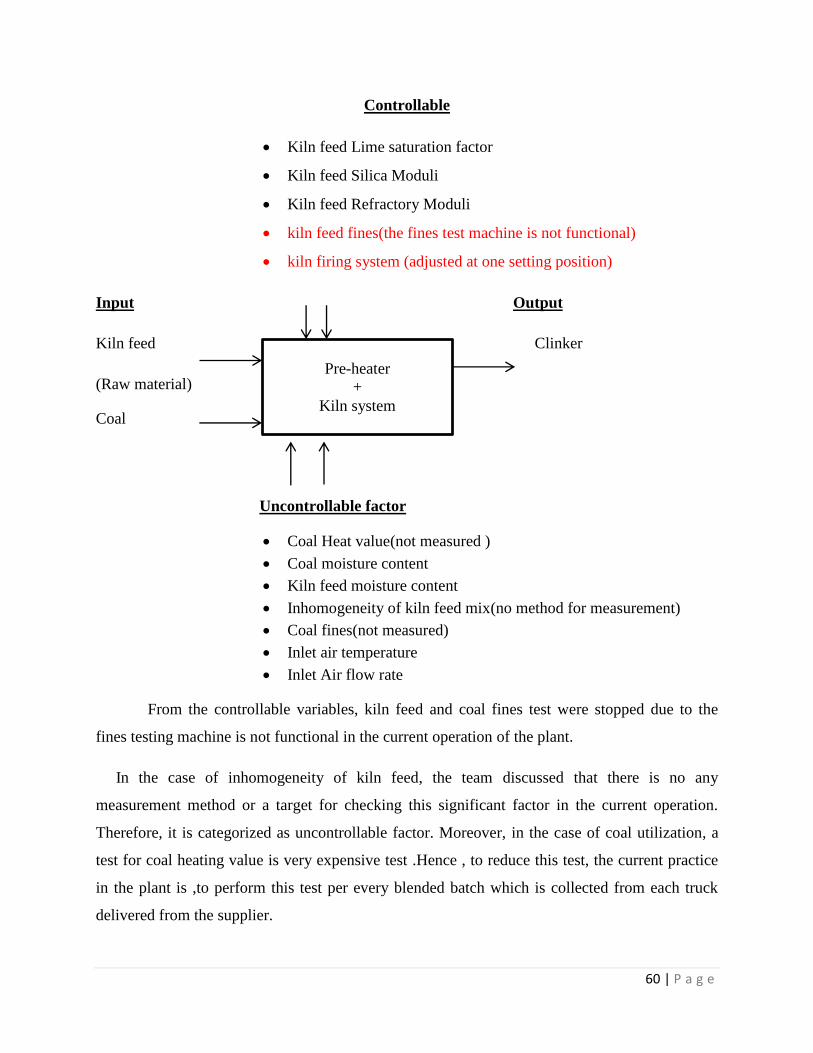
60 | P a g e
Controllable
Kiln feed Lime saturation factor
Kiln feed Silica Moduli
Kiln feed Refractory Moduli
kiln feed fines(the fines test machine is not functional)
kiln firing system (adjusted at one setting position)
Input Output
Kiln feed Clinker
(Raw material)
Coal
Uncontrollable factor
Coal Heat value(not measured )
Coal moisture content
Kiln feed moisture content
Inhomogeneity of kiln feed mix(no method for measurement)
Coal fines(not measured)
Inlet air temperature
Inlet Air flow rate
From the controllable variables, kiln feed and coal fines test were stopped due to the
fines testing machine is not functional in the current operation of the plant.
In the case of inhomogeneity of kiln feed, the team discussed that there is no any
measurement method or a target for checking this significant factor in the current operation.
Therefore, it is categorized as uncontrollable factor. Moreover, in the case of coal utilization, a
test for coal heating value is very expensive test .Hence , to reduce this test, the current practice
in the plant is ,to perform this test per every blended batch which is collected from each truck
delivered from the supplier.
Pre-heater
+
Kiln system
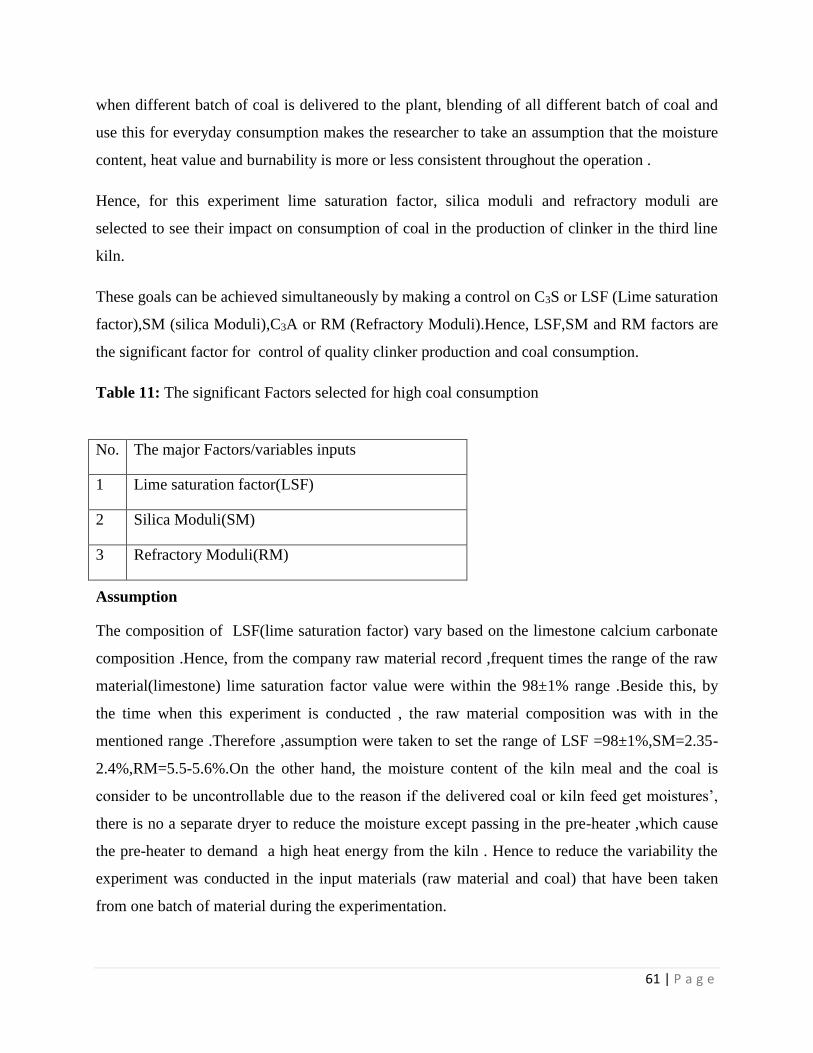
61 | P a g e
when different batch of coal is delivered to the plant, blending of all different batch of coal and
use this for everyday consumption makes the researcher to take an assumption that the moisture
content, heat value and burnability is more or less consistent throughout the operation .
Hence, for this experiment lime saturation factor, silica moduli and refractory moduli are
selected to see their impact on consumption of coal in the production of clinker in the third line
kiln.
These goals can be achieved simultaneously by making a control on C3S or LSF (Lime saturation
factor),SM (silica Moduli),C3A or RM (Refractory Moduli).Hence, LSF,SM and RM factors are
the significant factor for control of quality clinker production and coal consumption.
Table 11: The significant Factors selected for high coal consumption
Assumption
The composition of LSF(lime saturation factor) vary based on the limestone calcium carbonate
composition .Hence, from the company raw material record ,frequent times the range of the raw
material(limestone) lime saturation factor value were within the 98±1% range .Beside this, by
the time when this experiment is conducted , the raw material composition was with in the
mentioned range .Therefore ,assumption were taken to set the range of LSF =98±1%,SM=2.35-
2.4%,RM=5.5-5.6%.On the other hand, the moisture content of the kiln meal and the coal is
consider to be uncontrollable due to the reason if the delivered coal or kiln feed get moistures’,
there is no a separate dryer to reduce the moisture except passing in the pre-heater ,which cause
the pre-heater to demand a high heat energy from the kiln . Hence to reduce the variability the
experiment was conducted in the input materials (raw material and coal) that have been taken
from one batch of material during the experimentation.
No. The major Factors/variables inputs
1 Lime saturation factor(LSF)
2 Silica Moduli(SM)
3 Refractory Moduli(RM)
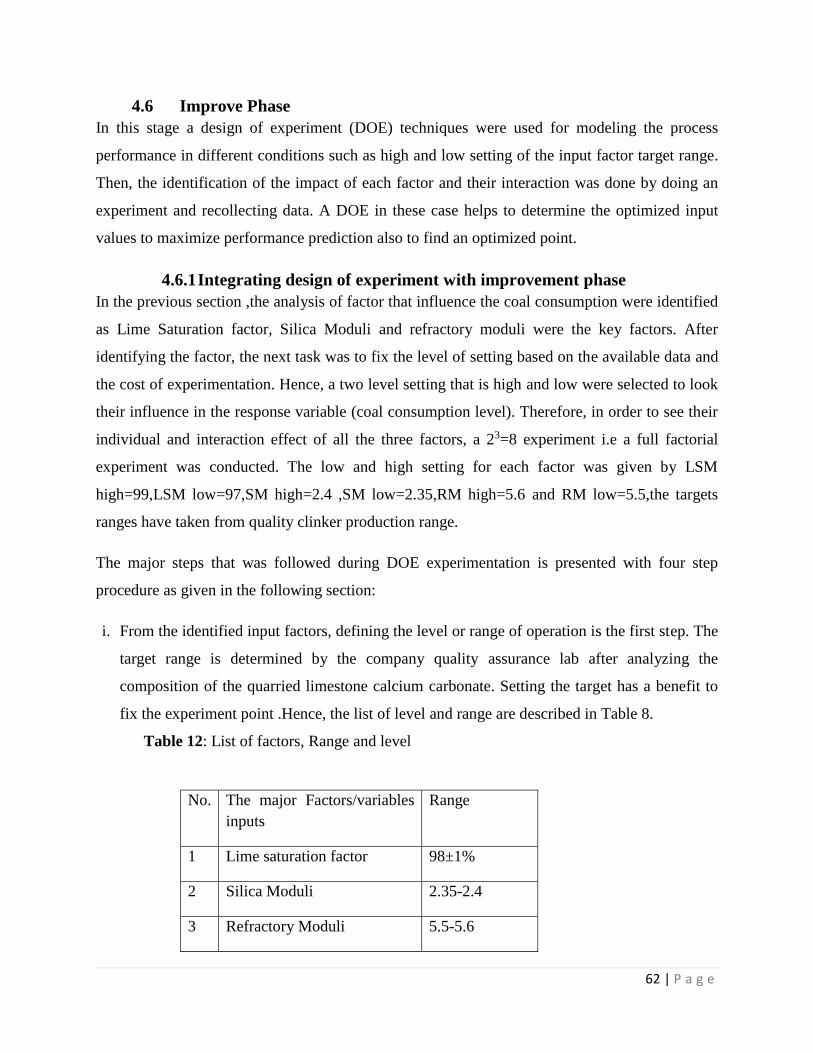
62 | P a g e
4.6 Improve Phase
In this stage a design of experiment (DOE) techniques were used for modeling the process
performance in different conditions such as high and low setting of the input factor target range.
Then, the identification of the impact of each factor and their interaction was done by doing an
experiment and recollecting data. A DOE in these case helps to determine the optimized input
values to maximize performance prediction also to find an optimized point.
4.6.1 Integrating design of experiment with improvement phase
In the previous section ,the analysis of factor that influence the coal consumption were identified
as Lime Saturation factor, Silica Moduli and refractory moduli were the key factors. After
identifying the factor, the next task was to fix the level of setting based on the available data and
the cost of experimentation. Hence, a two level setting that is high and low were selected to look
their influence in the response variable (coal consumption level). Therefore, in order to see their
individual and interaction effect of all the three factors, a 23=8 experiment i.e a full factorial
experiment was conducted. The low and high setting for each factor was given by LSM
high=99,LSM low=97,SM high=2.4 ,SM low=2.35,RM high=5.6 and RM low=5.5,the targets
ranges have taken from quality clinker production range.
The major steps that was followed during DOE experimentation is presented with four step
procedure as given in the following section:
i. From the identified input factors, defining the level or range of operation is the first step. The
target range is determined by the company quality assurance lab after analyzing the
composition of the quarried limestone calcium carbonate. Setting the target has a benefit to
fix the experiment point .Hence, the list of level and range are described in Table 8.
Table 12: List of factors, Range and level
No. The major Factors/variables
inputs
Range
1 Lime saturation factor 98±1%
2 Silica Moduli 2.35-2.4
3 Refractory Moduli 5.5-5.6
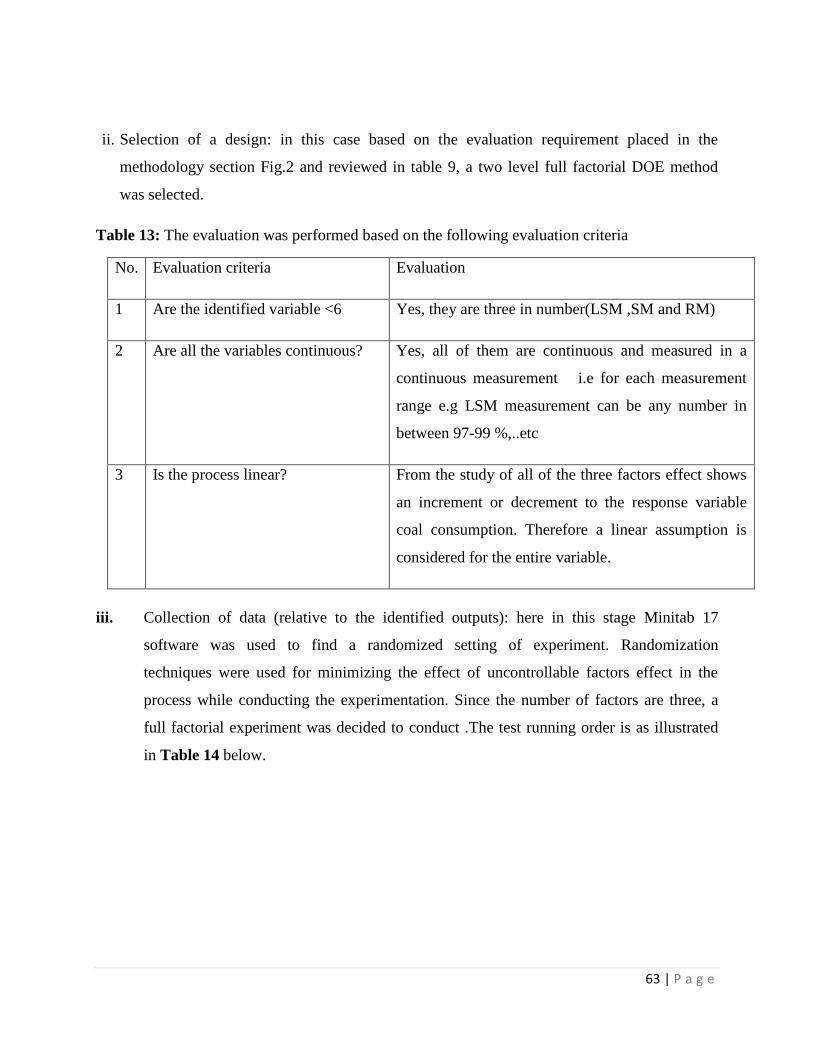
63 | P a g e
ii. Selection of a design: in this case based on the evaluation requirement placed in the
methodology section Fig.2 and reviewed in table 9, a two level full factorial DOE method
was selected.
Table 13: The evaluation was performed based on the following evaluation criteria
No. Evaluation criteria Evaluation
1 Are the identified variable <6 Yes, they are three in number(LSM ,SM and RM)
2 Are all the variables continuous? Yes, all of them are continuous and measured in a
continuous measurement i.e for each measurement
range e.g LSM measurement can be any number in
between 97-99 %,..etc
3 Is the process linear? From the study of all of the three factors effect shows
an increment or decrement to the response variable
coal consumption. Therefore a linear assumption is
considered for the entire variable.
iii. Collection of data (relative to the identified outputs): here in this stage Minitab 17
software was used to find a randomized setting of experiment. Randomization
techniques were used for minimizing the effect of uncontrollable factors effect in the
process while conducting the experimentation. Since the number of factors are three, a
full factorial experiment was decided to conduct .The test running order is as illustrated
in Table 14 below.
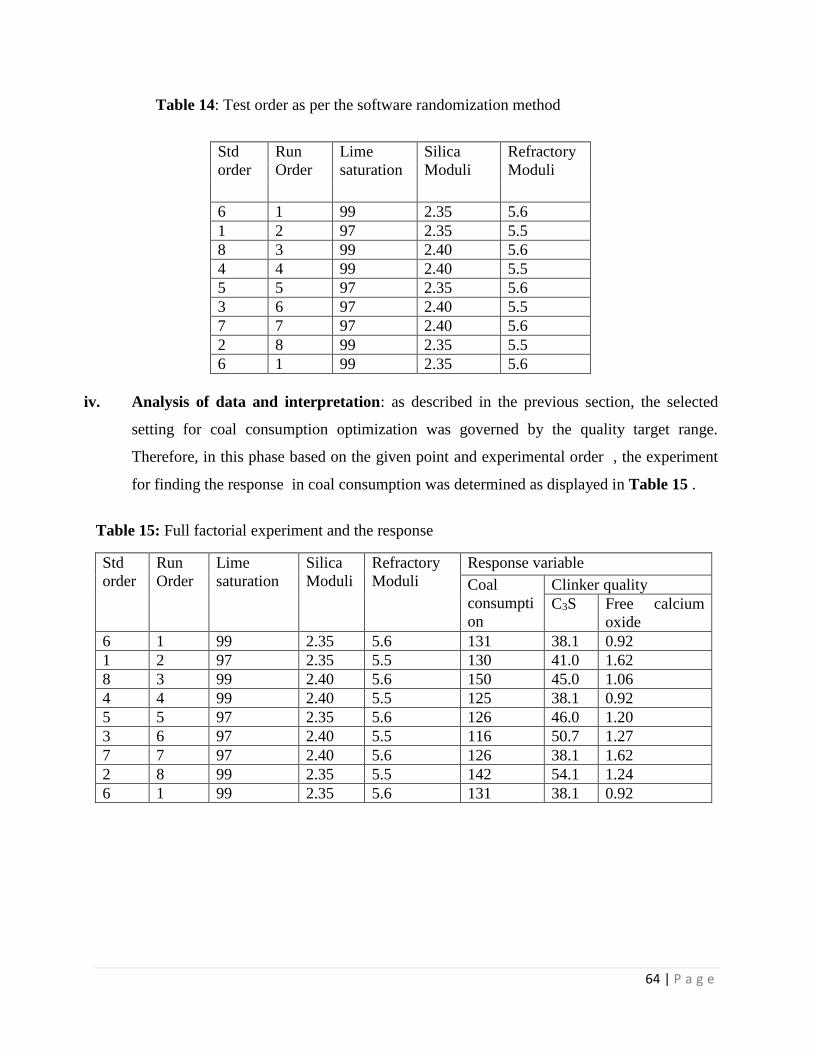
64 | P a g e
Table 14: Test order as per the software randomization method
Std
order
Run
Order
Lime
saturation
Silica
Moduli
Refractory
Moduli
6 1 99 2.35 5.6
1 2 97 2.35 5.5
8 3 99 2.40 5.6
4 4 99 2.40 5.5
5 5 97 2.35 5.6
3 6 97 2.40 5.5
7 7 97 2.40 5.6
2 8 99 2.35 5.5
6 1 99 2.35 5.6
iv. Analysis of data and interpretation: as described in the previous section, the selected
setting for coal consumption optimization was governed by the quality target range.
Therefore, in this phase based on the given point and experimental order , the experiment
for finding the response in coal consumption was determined as displayed in Table 15 .
Table 15: Full factorial experiment and the response
Std
order
Run
Order
Lime
saturation
Silica
Moduli
Refractory
Moduli
Response variable
Coal
consumpti
on
Clinker quality
C3S Free calcium
oxide
6 1 99 2.35 5.6 131 38.1 0.92
1 2 97 2.35 5.5 130 41.0 1.62
8 3 99 2.40 5.6 150 45.0 1.06
4 4 99 2.40 5.5 125 38.1 0.92
5 5 97 2.35 5.6 126 46.0 1.20
3 6 97 2.40 5.5 116 50.7 1.27
7 7 97 2.40 5.6 126 38.1 1.62
2 8 99 2.35 5.5 142 54.1 1.24
6 1 99 2.35 5.6 131 38.1 0.92
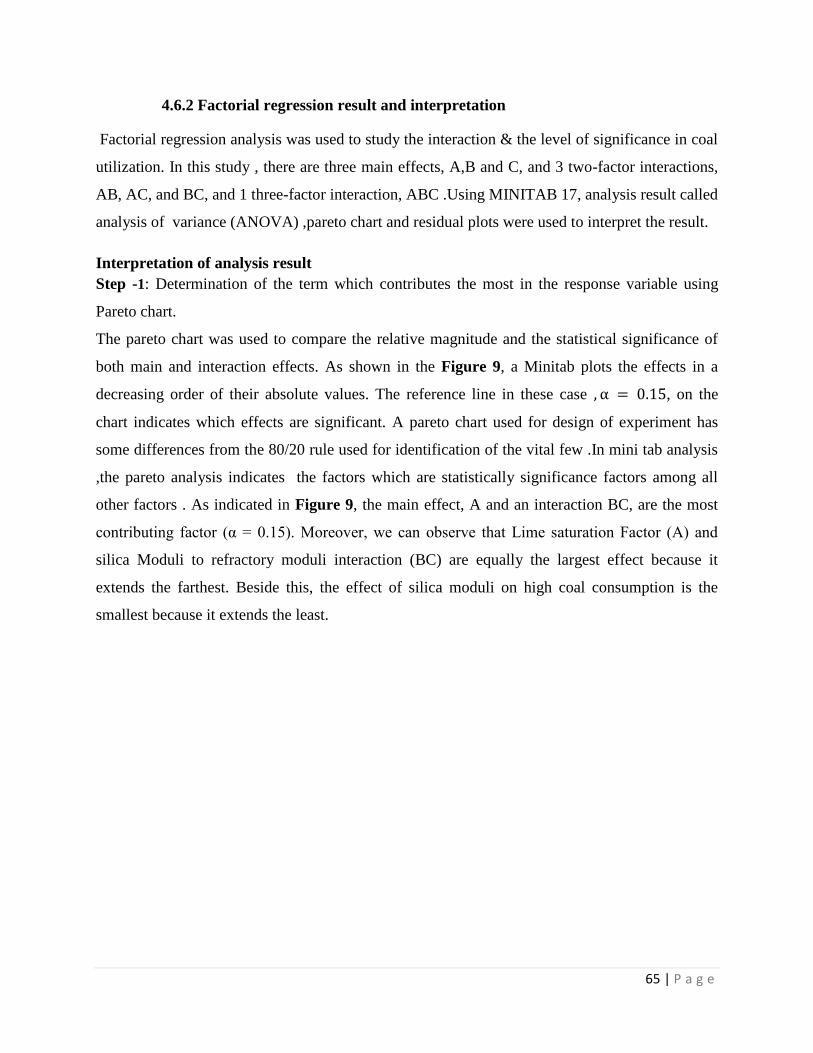
65 | P a g e
4.6.2 Factorial regression result and interpretation
Factorial regression analysis was used to study the interaction & the level of significance in coal
utilization. In this study , there are three main effects, A,B and C, and 3 two-factor interactions,
AB, AC, and BC, and 1 three-factor interaction, ABC .Using MINITAB 17, analysis result called
analysis of variance (ANOVA) ,pareto chart and residual plots were used to interpret the result.
Interpretation of analysis result
Step -1: Determination of the term which contributes the most in the response variable using
Pareto chart.
The pareto chart was used to compare the relative magnitude and the statistical significance of
both main and interaction effects. As shown in the Figure 9, a Minitab plots the effects in a
decreasing order of their absolute values. The reference line in these case , α = 0.15, on the
chart indicates which effects are significant. A pareto chart used for design of experiment has
some differences from the 80/20 rule used for identification of the vital few .In mini tab analysis
,the pareto analysis indicates the factors which are statistically significance factors among all
other factors . As indicated in Figure 9, the main effect, A and an interaction BC, are the most
contributing factor (α = 0.15). Moreover, we can observe that Lime saturation Factor (A) and
silica Moduli to refractory moduli interaction (BC) are equally the largest effect because it
extends the farthest. Beside this, the effect of silica moduli on high coal consumption is the
smallest because it extends the least.
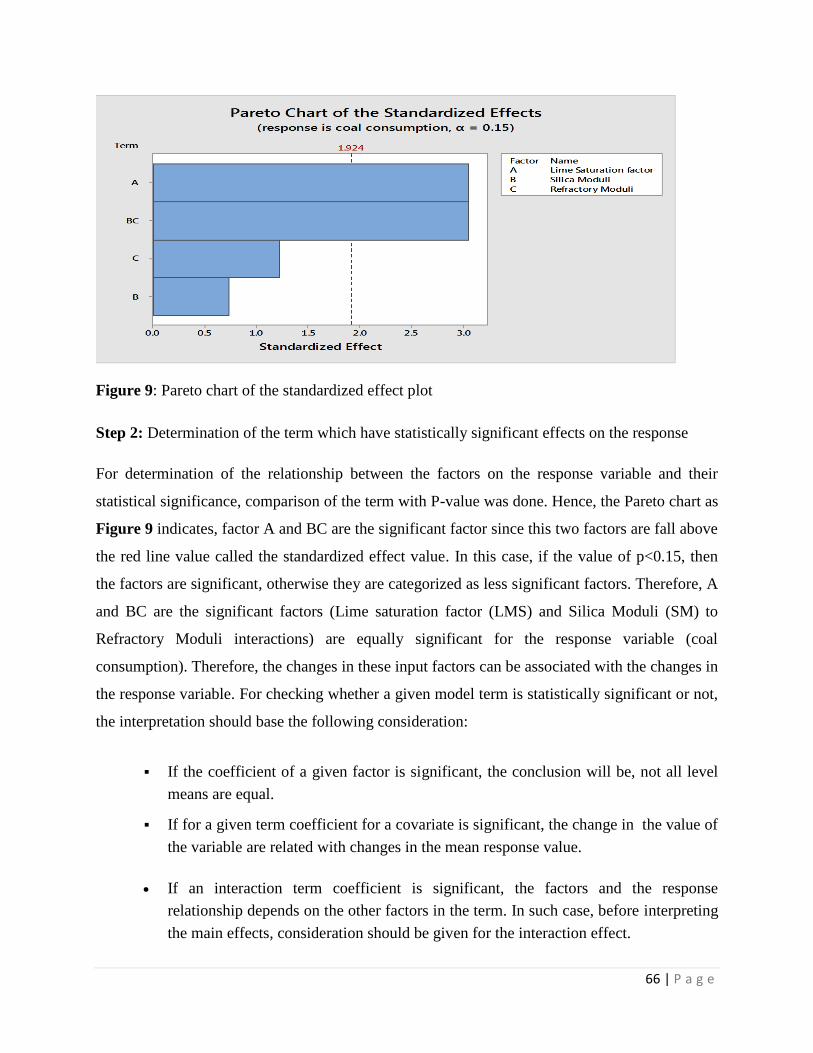
66 | P a g e
Figure 9: Pareto chart of the standardized effect plot
Step 2: Determination of the term which have statistically significant effects on the response
For determination of the relationship between the factors on the response variable and their
statistical significance, comparison of the term with P-value was done. Hence, the Pareto chart as
Figure 9 indicates, factor A and BC are the significant factor since this two factors are fall above
the red line value called the standardized effect value. In this case, if the value of p<0.15, then
the factors are significant, otherwise they are categorized as less significant factors. Therefore, A
and BC are the significant factors (Lime saturation factor (LMS) and Silica Moduli (SM) to
Refractory Moduli interactions) are equally significant for the response variable (coal
consumption). Therefore, the changes in these input factors can be associated with the changes in
the response variable. For checking whether a given model term is statistically significant or not,
the interpretation should base the following consideration:
If the coefficient of a given factor is significant, the conclusion will be, not all level
means are equal.
If for a given term coefficient for a covariate is significant, the change in the value of
the variable are related with changes in the mean response value.
If an interaction term coefficient is significant, the factors and the response
relationship depends on the other factors in the term. In such case, before interpreting
the main effects, consideration should be given for the interaction effect.
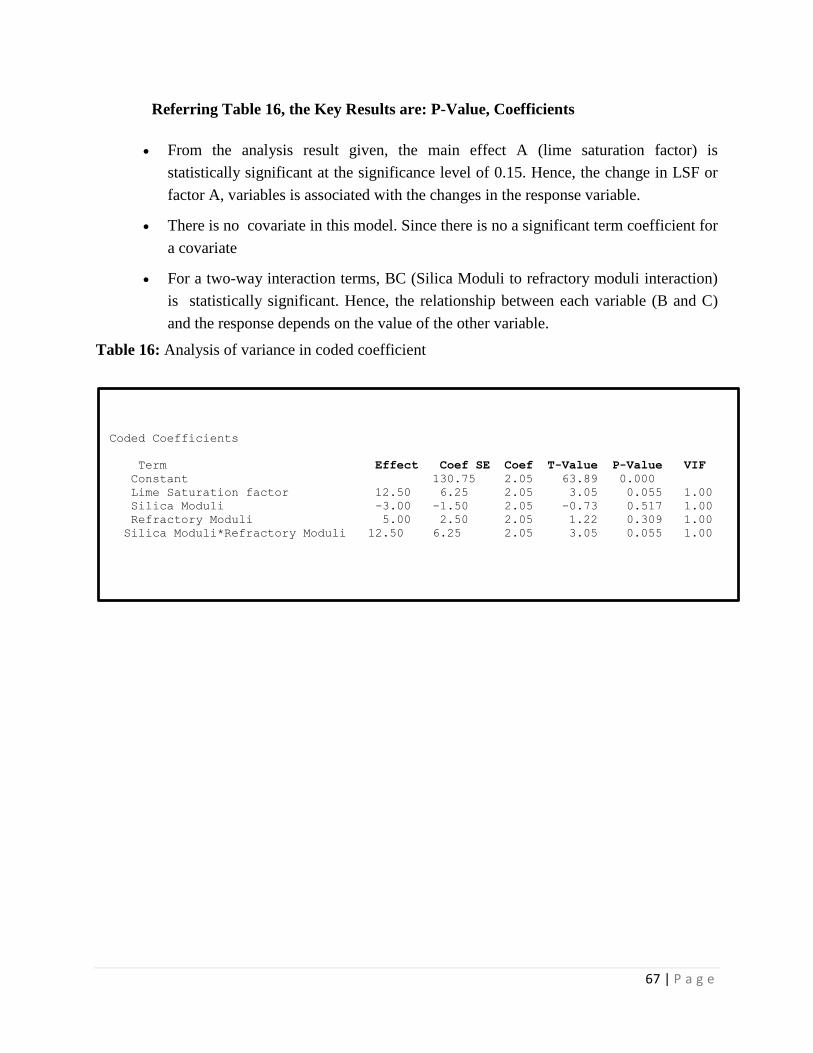
67 | P a g e
Referring Table 16, the Key Results are: P-Value, Coefficients
From the analysis result given, the main effect A (lime saturation factor) is
statistically significant at the significance level of 0.15. Hence, the change in LSF or
factor A, variables is associated with the changes in the response variable.
There is no covariate in this model. Since there is no a significant term coefficient for
a covariate
For a two-way interaction terms, BC (Silica Moduli to refractory moduli interaction)
is statistically significant. Hence, the relationship between each variable (B and C)
and the response depends on the value of the other variable.
Table 16: Analysis of variance in coded coefficient
Coded Coefficients
Term Effect Coef SE Coef T-Value P-Value VIF
Constant 130.75 2.05 63.89 0.000
Lime Saturation factor 12.50 6.25 2.05 3.05 0.055 1.00
Silica Moduli -3.00 -1.50 2.05 -0.73 0.517 1.00
Refractory Moduli 5.00 2.50 2.05 1.22 0.309 1.00
Silica Moduli*Refractory Moduli 12.50 6.25 2.05 3.05 0.055 1.00
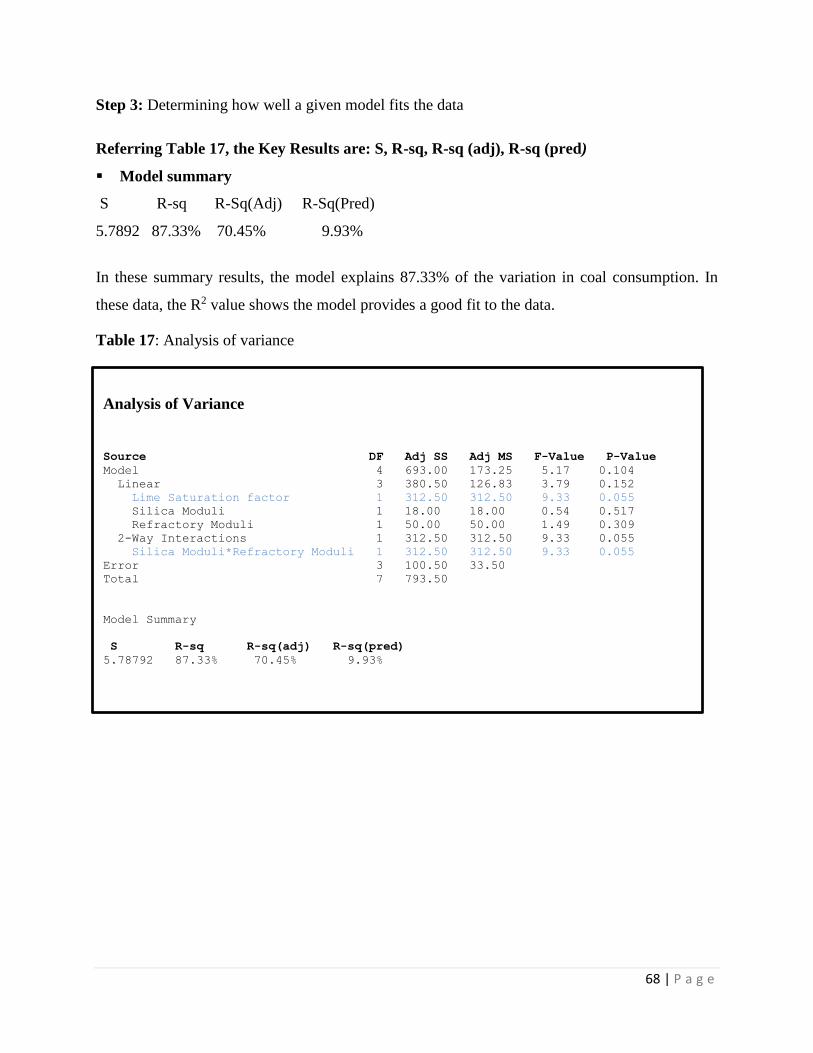
68 | P a g e
Step 3: Determining how well a given model fits the data
Referring Table 17, the Key Results are: S, R-sq, R-sq (adj), R-sq (pred)
Model summary
S R-sq R-Sq(Adj) R-Sq(Pred)
5.7892 87.33% 70.45% 9.93%
In these summary results, the model explains 87.33% of the variation in coal consumption. In
these data, the R2 value shows the model provides a good fit to the data.
Table 17: Analysis of variance
Analysis of Variance
Source DF Adj SS Adj MS F-Value P-Value
Model 4 693.00 173.25 5.17 0.104
Linear 3 380.50 126.83 3.79 0.152
Lime Saturation factor 1 312.50 312.50 9.33 0.055
Silica Moduli 1 18.00 18.00 0.54 0.517
Refractory Moduli 1 50.00 50.00 1.49 0.309
2-Way Interactions 1 312.50 312.50 9.33 0.055
Silica Moduli*Refractory Moduli 1 312.50 312.50 9.33 0.055
Error 3 100.50 33.50
Total 7 793.50
Model Summary
S R-sq R-sq(adj) R-sq(pred)
5.78792 87.33% 70.45% 9.93%
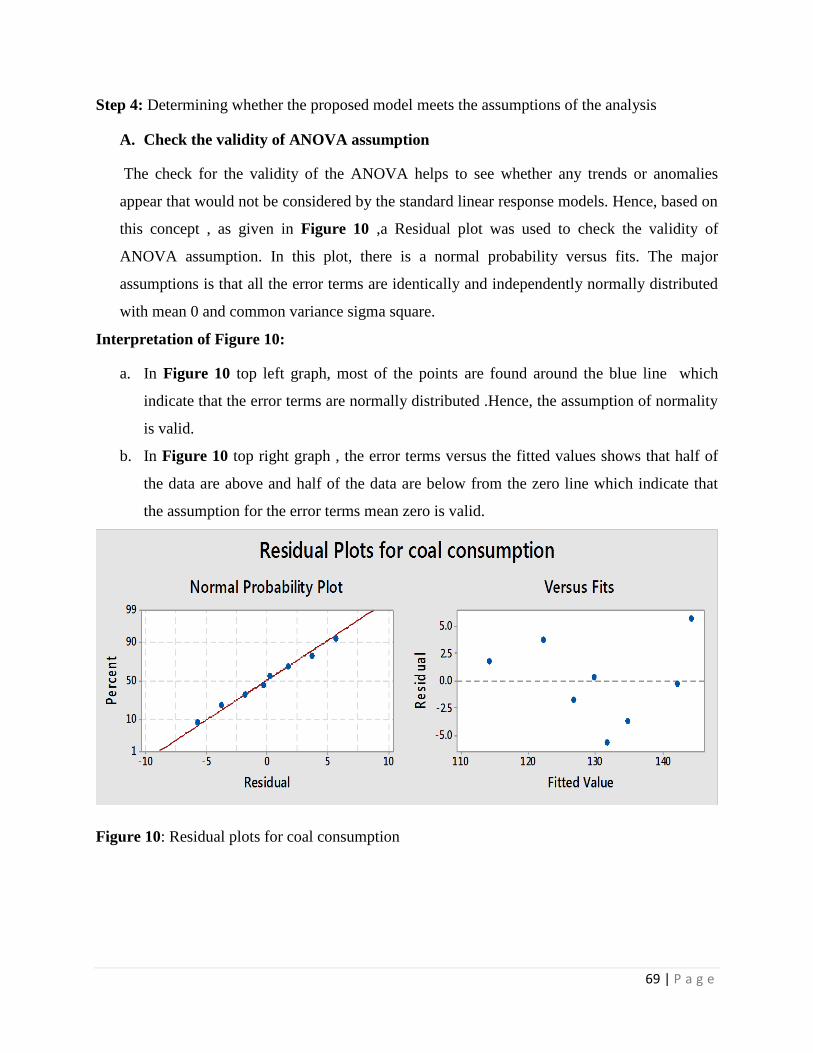
69 | P a g e
Step 4: Determining whether the proposed model meets the assumptions of the analysis
A. Check the validity of ANOVA assumption
The check for the validity of the ANOVA helps to see whether any trends or anomalies
appear that would not be considered by the standard linear response models. Hence, based on
this concept , as given in Figure 10 ,a Residual plot was used to check the validity of
ANOVA assumption. In this plot, there is a normal probability versus fits. The major
assumptions is that all the error terms are identically and independently normally distributed
with mean 0 and common variance sigma square.
Interpretation of Figure 10:
a. In Figure 10 top left graph, most of the points are found around the blue line which
indicate that the error terms are normally distributed .Hence, the assumption of normality
is valid.
b. In Figure 10 top right graph , the error terms versus the fitted values shows that half of
the data are above and half of the data are below from the zero line which indicate that
the assumption for the error terms mean zero is valid.
Figure 10: Residual plots for coal consumption
70 | P a g e
Hence, the linear assumption of the model which is given by the ANOVA is valid, the next task
will be by using this model doing a Prediction at a different variable setting
B. Prediction for coal consumption
A predication for coal consumption using the given regression equation in these case is
required for planning or institutionalizing the improvement found .Thus , before that the
equation should verify that the results are in a predicted range by replicating optimum
conditions as well as other points.
Regression Equation in Un-coded Units,
Coal consumption = 26284 - 270.2 Lime saturation Factor - 11255 Silica moduli
+ 52.5 Refractory Moduli + 115.0 Lime saturation Factor*Silica moduli
i. Variable Setting
Lime saturation Factor 97
Silica moduli 2.35
Refractory Moduli 5.5
Fit SE Fit 95% CI 95% PI
123.375 1.90258 (117.320, 129.430) (113.612, 133.138)
ii. Variable Setting
Lime saturation Factor 99
Silica moduli 2.4
Refractory Moduli 5.6
Fit SE Fit 95% CI 95% PI
135.125 1.90258 (129.070, 141.180) (125.362, 144.888)
The Optimized response in this experiment is 116kg.Coal/ton of clinker at the point 97,
2.4 and 5.5 of LSF, SM and RM respectively.
C. Validation of test : the optimum settings obtained from experimentation
results and the prediction equation ,a confirmation test run was performed on three material
proportioning setting
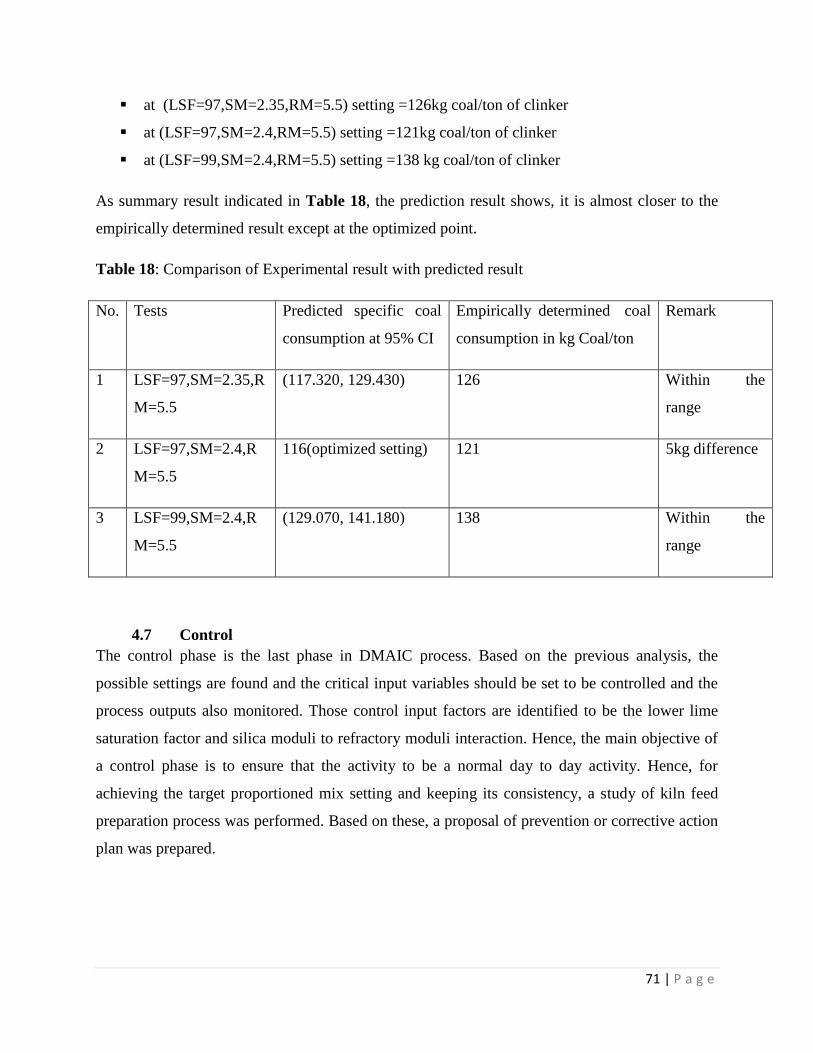
71 | P a g e
at (LSF=97,SM=2.35,RM=5.5) setting =126kg coal/ton of clinker
at (LSF=97,SM=2.4,RM=5.5) setting =121kg coal/ton of clinker
at (LSF=99,SM=2.4,RM=5.5) setting =138 kg coal/ton of clinker
As summary result indicated in Table 18, the prediction result shows, it is almost closer to the
empirically determined result except at the optimized point.
Table 18: Comparison of Experimental result with predicted result
No. Tests Predicted specific coal
consumption at 95% CI
Empirically determined coal
consumption in kg Coal/ton
Remark
1 LSF=97,SM=2.35,R
M=5.5
(117.320, 129.430) 126 Within the
range
2 LSF=97,SM=2.4,R
M=5.5
116(optimized setting) 121 5kg difference
3 LSF=99,SM=2.4,R
M=5.5
(129.070, 141.180) 138 Within the
range
4.7 Control
The control phase is the last phase in DMAIC process. Based on the previous analysis, the
possible settings are found and the critical input variables should be set to be controlled and the
process outputs also monitored. Those control input factors are identified to be the lower lime
saturation factor and silica moduli to refractory moduli interaction. Hence, the main objective of
a control phase is to ensure that the activity to be a normal day to day activity. Hence, for
achieving the target proportioned mix setting and keeping its consistency, a study of kiln feed
preparation process was performed. Based on these, a proposal of prevention or corrective action
plan was prepared.
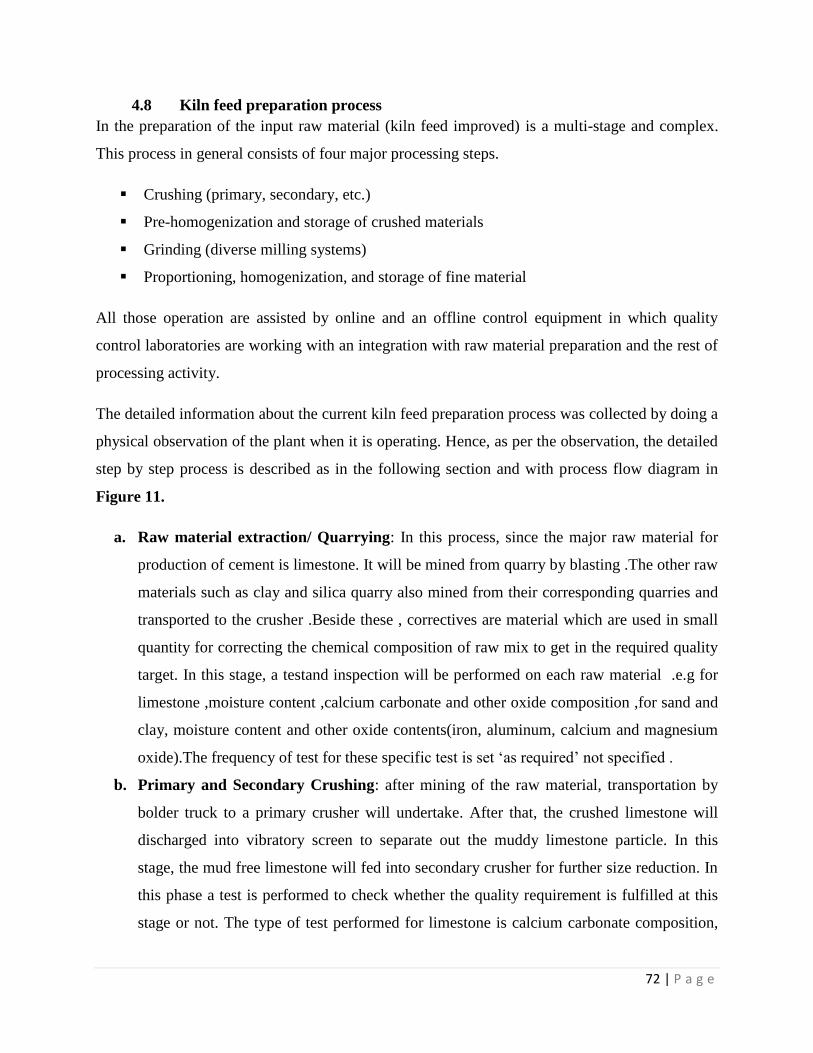
72 | P a g e
4.8 Kiln feed preparation process
In the preparation of the input raw material (kiln feed improved) is a multi-stage and complex.
This process in general consists of four major processing steps.
Crushing (primary, secondary, etc.)
Pre-homogenization and storage of crushed materials
Grinding (diverse milling systems)
Proportioning, homogenization, and storage of fine material
All those operation are assisted by online and an offline control equipment in which quality
control laboratories are working with an integration with raw material preparation and the rest of
processing activity.
The detailed information about the current kiln feed preparation process was collected by doing a
physical observation of the plant when it is operating. Hence, as per the observation, the detailed
step by step process is described as in the following section and with process flow diagram in
Figure 11.
a. Raw material extraction/ Quarrying: In this process, since the major raw material for
production of cement is limestone. It will be mined from quarry by blasting .The other raw
materials such as clay and silica quarry also mined from their corresponding quarries and
transported to the crusher .Beside these , correctives are material which are used in small
quantity for correcting the chemical composition of raw mix to get in the required quality
target. In this stage, a testand inspection will be performed on each raw material .e.g for
limestone ,moisture content ,calcium carbonate and other oxide composition ,for sand and
clay, moisture content and other oxide contents(iron, aluminum, calcium and magnesium
oxide).The frequency of test for these specific test is set ‘as required’ not specified .
b. Primary and Secondary Crushing: after mining of the raw material, transportation by
bolder truck to a primary crusher will undertake. After that, the crushed limestone will
discharged into vibratory screen to separate out the muddy limestone particle. In this
stage, the mud free limestone will fed into secondary crusher for further size reduction. In
this phase a test is performed to check whether the quality requirement is fulfilled at this
stage or not. The type of test performed for limestone is calcium carbonate composition,
73 | P a g e
moisture content and other composition .The frequency of test for crushed limestone is
every hour, once a month for sand and every 15 days for that of clay.
c. Pre-homogenization and storage of crushed materials: pre-homogenization activity
consists of storing or stacking and retrieval or reclaiming of the material .Blending each
type of raw material pile before mixing each other is done by using a stacker and reclaimer
.The blending operation is performed when the stacker receives crushed material from the
incoming belt conveyor and this belt consist of movable carriage and drops the raw
material moves to the stock piles. The main purpose of a stacker is to pile bulk material
into a stock pile. A recliamer also used to layer the material in small thickness by
dislodging from the entire cross section of the pile. Hence, after the raw material is
blended longitudinally and circularly, it will fed into a hopper/bin by using a belt conveyor
in which the three bin holds different raw material i.e limestone, sand and clay. Since the
mined raw material specially the limestone calcium carbonate content vary day by day, to
keep the homogeneity of this material, stocking in the stocker will be in a circular manner
i.e putting it layer by layer every day. At this stage, from each pile of the raw material a
test will performed .By taking a sample for limestone, Clay and sandstone from the
blended pile , moisture content and the material composition test will be done with a
frequency of every new pile for limestone, once a month for sand and every 15 days for
clay.
d. Raw mix Grinding and mixing: from the previous section taken composition of each
raw material, a raw mix deign will be done to determine the quantitative proportion of
each raw material to produce a desired chemical and mineralogical composition of clinker.
In this case, the basis for calculation is the chemical composition of the three raw material
. Specifically, lime saturation factor, silica moduli, refractory moduli (the sum of alumina
moduli and iron moduli).Hence, based on the proportion given by quality assurance lab,
each raw material from their respective hopper will pass through a weigh feeder and mix
and grinding operation will takes place. When the material reaches in this stage which is
known as raw meal or raw mix, Lime saturation factor, silica moduli, refractory moduli
and fines will be checked .If the sample can’t fulfill the target level, corrective materials
such as corrective limestone, silica .etc, will be added.

74 | P a g e
e. Homogenization: after the raw mill is fed into the homogenization silo, further material
blending will carried out in this silo. In this phase after the blending operation is done,
Lime saturation factor, silica moduli, refractory moduli and fines will be checked .In the
current operation, fines test is not performed due to the test machine failure.
From Quarry to Kiln feed Raw material preparation process
Limestone
quarrying
Clay Quarrying
Sand Quarrying
Primary &
secondary
crushing
Moisture & calcium
carbonate analysisi
Moisture & calcium
carbonate analysisi
Each raw material
blending using
stacker recliamer
Store into
limestone bin
Clay Bin
Sand Bin
Mix Proportioning
Mix & Grinding of
Raw material
Does the mix fulfill the
target LSF,SM & RM
requirement???
Storage &
blending(Homoginization)To Kiln feed
No
Yes
Add corrective
materials
Test for
LSF,SM &RM
Figure 11: From Quarry to Kiln feed raw material preparation process
75 | P a g e
As illustrated in the process description and in the process flow diagram, the preparation of input
kiln feed pass through different value addition, test and inspection process. In this process
activity ,an out of target proportion can be identified after raw mix grinding and homogenization
process while the correction activity can be performed only on raw mix grinding section
.Moreover, there is a probability of an out of target kiln feed appearance after inspection is made
from the homogenization silo . Hence, it is one of the limitations of the existing process. Hence,
to alleviate this issue in the existing process condition the following improvement activity are
suggested.

76 | P a g e
Table 19: control plan for improvement of Raw material proportioning
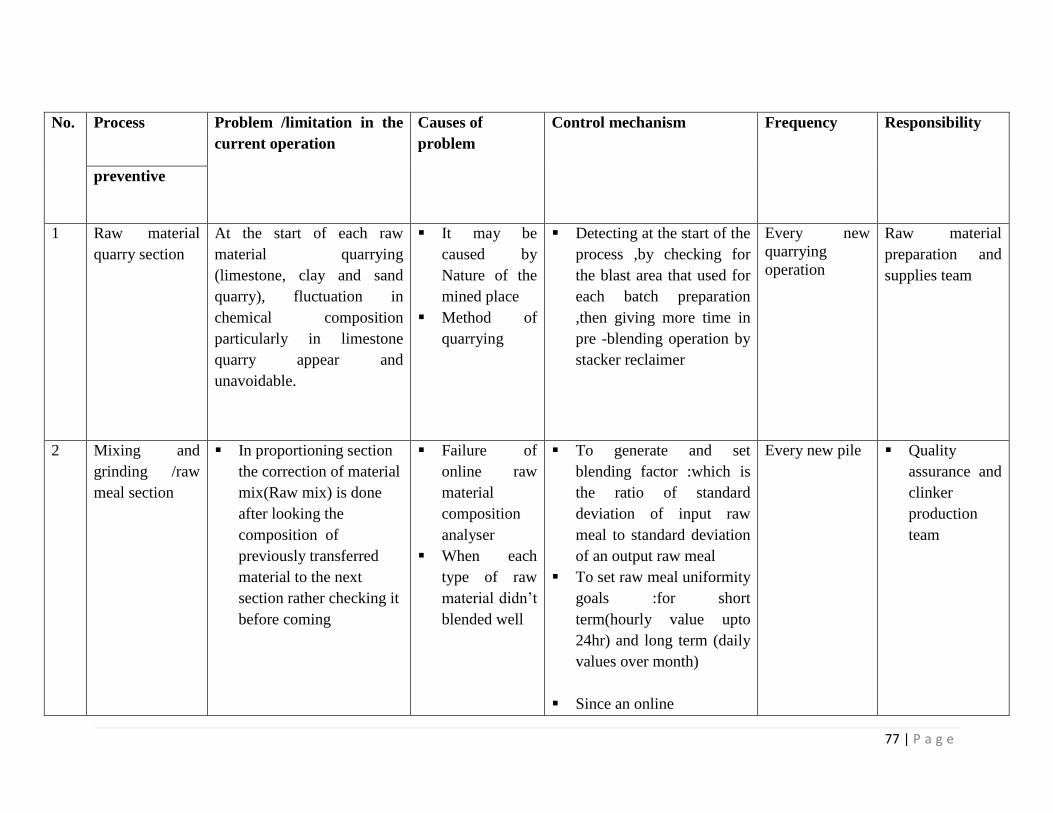
77 | P a g e
No. Process Problem /limitation in the
current operation
Causes of
problem
Control mechanism Frequency Responsibility
preventive
1 Raw material
quarry section
At the start of each raw
material quarrying
(limestone, clay and sand
quarry), fluctuation in
chemical composition
particularly in limestone
quarry appear and
unavoidable.
It may be
caused by
Nature of the
mined place
Method of
quarrying
Detecting at the start of the
process ,by checking for
the blast area that used for
each batch preparation
,then giving more time in
pre -blending operation by
stacker reclaimer
Every new
quarrying
operation
Raw material
preparation and
supplies team
2 Mixing and
grinding /raw
meal section
In proportioning section
the correction of material
mix(Raw mix) is done
after looking the
composition of
previously transferred
material to the next
section rather checking it
before coming
Failure of
online raw
material
composition
analyser
When each
type of raw
material didn’t
blended well
To generate and set
blending factor :which is
the ratio of standard
deviation of input raw
meal to standard deviation
of an output raw meal
To set raw meal uniformity
goals :for short
term(hourly value upto
24hr) and long term (daily
values over month)
Since an online
Every new pile Quality
assurance and
clinker
production
team
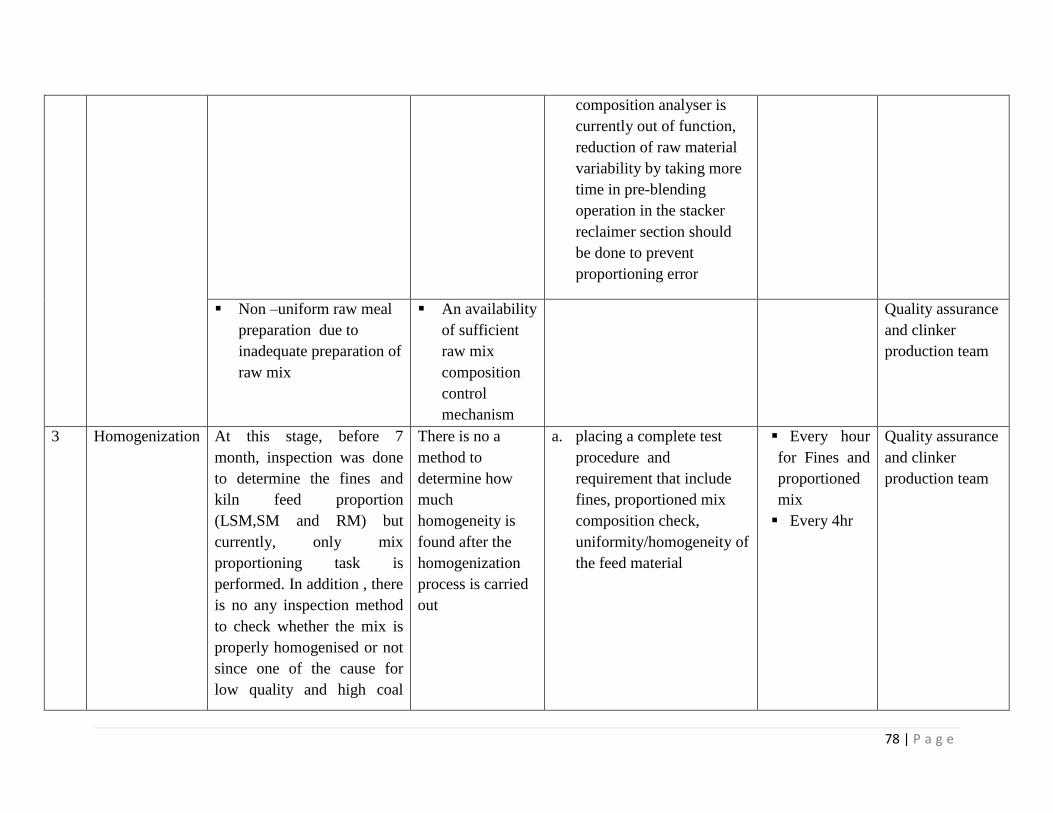
78 | P a g e
composition analyser is
currently out of function,
reduction of raw material
variability by taking more
time in pre-blending
operation in the stacker
reclaimer section should
be done to prevent
proportioning error
Non –uniform raw meal
preparation due to
inadequate preparation of
raw mix
An availability
of sufficient
raw mix
composition
control
mechanism
Quality assurance
and clinker
production team
3 Homogenization At this stage, before 7
month, inspection was done
to determine the fines and
kiln feed proportion
(LSM,SM and RM) but
currently, only mix
proportioning task is
performed. In addition , there
is no any inspection method
to check whether the mix is
properly homogenised or not
since one of the cause for
low quality and high coal
There is no a
method to
determine how
much
homogeneity is
found after the
homogenization
process is carried
out
a. placing a complete test
procedure and
requirement that include
fines, proportioned mix
composition check,
uniformity/homogeneity of
the feed material
Every hour
for Fines and
proportioned
mix
Every 4hr
Quality assurance
and clinker
production team
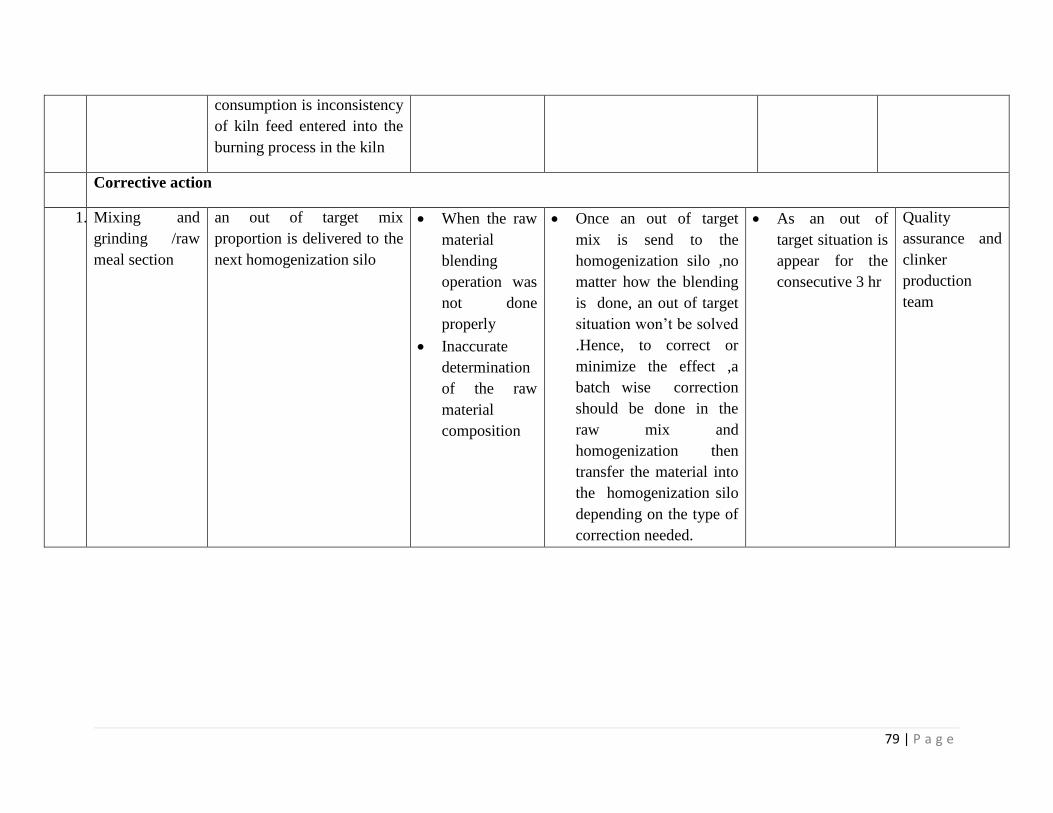
79 | P a g e
consumption is inconsistency
of kiln feed entered into the
burning process in the kiln
Corrective action
1. Mixing and
grinding /raw
meal section
an out of target mix
proportion is delivered to the
next homogenization silo
When the raw
material
blending
operation was
not done
properly
Inaccurate
determination
of the raw
material
composition
Once an out of target
mix is send to the
homogenization silo ,no
matter how the blending
is done, an out of target
situation won’t be solved
.Hence, to correct or
minimize the effect ,a
batch wise correction
should be done in the
raw mix and
homogenization then
transfer the material into
the homogenization silo
depending on the type of
correction needed.
As an out of
target situation is
appear for the
consecutive 3 hr
Quality
assurance and
clinker
production
team

80 | P a g e
Chapter Five
5. Results and Discussions
In this part, a description and discussion of the major result found and their interpretation, how
these result can be considered in developing a guiding framework, explanation of the finding
from coal utilization improvement..etc was discussed.
5.1 Summary and Future implementation
At the start of this research, identifying the area of improvement in coal utilization without
affecting the quality of clinker production was the main focus. At this stage, six sigma was used
by first defining the current process of the clinker production , objective of the project. Then in
measure phase, determining those output /response variable which is the focus of the study for
better improvement task. Those study areas was identified as the 3rd line kiln coal consumption
improvement without affecting the clinker quality parameter (particularly the C3S and the free
lime content of the clinker) .Therefore ,once this response variable is determined the next task
was to identify the input factor which has the highest potential /significance to the increment of
the coal utilization .These factors were determined by taking August ,2018 month ,which is the
highest of all month coal utilization, to study those input factors. During this study, some of the
variables are categorized uncontrolled due to unavailability of a method to monitor and take
action during the operation as well as when this experiment is conducted and some of the test
such as coal heating value is yet a very important character to be studied but not included in this
study, due to the expensiveness of the test material used .Hence, to compromise the effect, a
more blended coal was used during the experimentation to minimize the variation in the coal
calorific value. Therefore based on the availability of test and their significance on burnability
nature of the raw material input , selection of the three material proportion value such as Limes
saturation factor, silica moduli and refractory moduli was undertaken. As a result, improvement
of coal utilization using six sigma implementation have done on input raw material proportion
chemical composition variation because of the variation in the kiln feed composition affect its
burnability and eventually the fuel consumption. In these phase the six sigma was used by
integrating with the design of experiment tool to enhance the analyze and improve section of the
DMAIC to experimentally identify which is the optimal setting for efficient utilization of coal by
81 | P a g e
taking the quality target level which is obtained from the quality assurance lab as a range of
setting for theses experiment. This was done to ensure quality clinker production and improved
coal utilization simultaneously. After a subsequent experimentation and analysis, a result has
shown that from the chosen main factors lime saturation factor has shown a significant impact in
coal utilization. Next ,the interaction effect of silica moduli to refractory moduli has an equal
influence with the main effect A or lime saturation factor .In addition, the researcher also try to
observe the impact of adjusting the input material target within the given setting on the response
in quality particularly in C3S and free lime content. The result shows that from eight experiments
conducted only two of the test shows within the target clinker quality level.
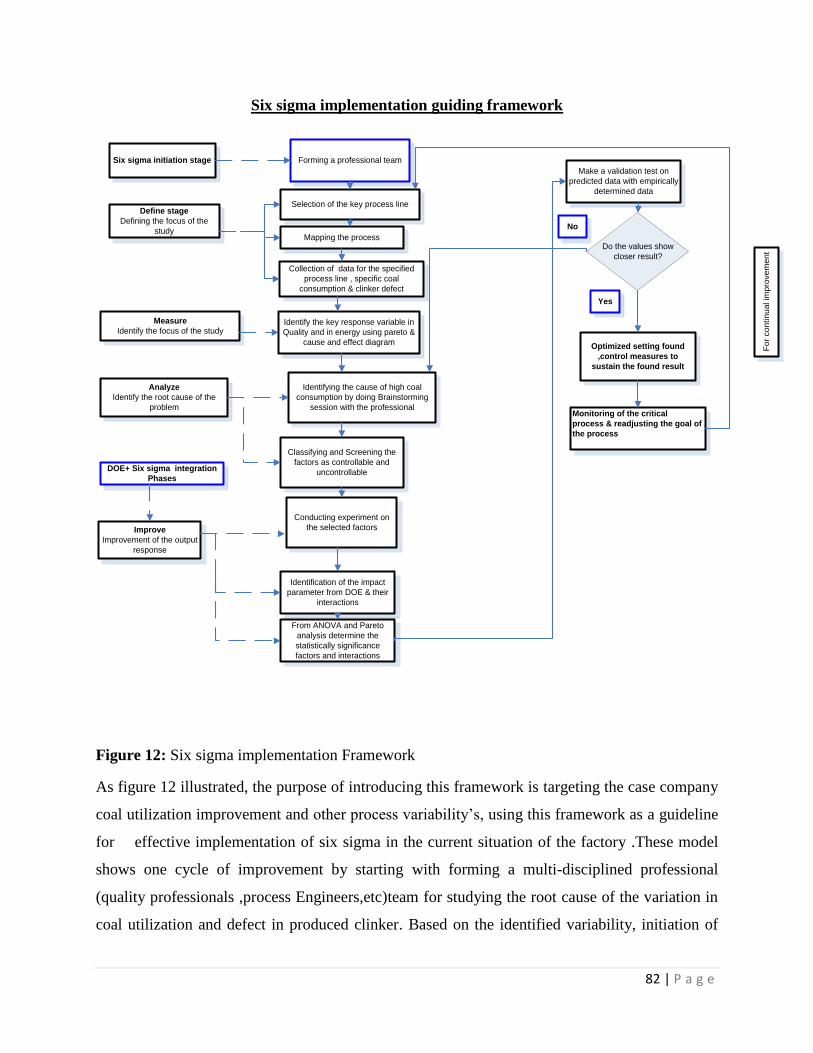
82 | P a g e
Six sigma implementation guiding framework
Fo
r co
ntin
ua
l im
pro
ve
me
nt
Selection of the key process line
Measure
Identify the focus of the study
Identification of the impact
parameter from DOE & their
interactions
Conducting experiment on
the selected factors
Monitoring of the critical
process & readjusting the goal of
the process
Forming a professional team
DOE+ Six sigma integration
Phases
Six sigma initiation stage
Mapping the process
Define stage
Defining the focus of the
study
Collection of data for the specified
process line , specific coal
consumption & clinker defect
Identify the key response variable in
Quality and in energy using pareto &
cause and effect diagram
Analyze
Identify the root cause of the
problem
Identifying the cause of high coal
consumption by doing Brainstorming
session with the professional
Classifying and Screening the
factors as controllable and
uncontrollable
Improve
Improvement of the output
response
From ANOVA and Pareto
analysis determine the
statistically significance
factors and interactions
Make a validation test on
predicted data with empirically
determined data
Do the values show
closer result?
No
Yes
Optimized setting found
,control measures to
sustain the found result
Figure 12: Six sigma implementation Framework
As figure 12 illustrated, the purpose of introducing this framework is targeting the case company
coal utilization improvement and other process variability’s, using this framework as a guideline
for effective implementation of six sigma in the current situation of the factory .These model
shows one cycle of improvement by starting with forming a multi-disciplined professional
(quality professionals ,process Engineers,etc)team for studying the root cause of the variation in
coal utilization and defect in produced clinker. Based on the identified variability, initiation of

83 | P a g e
six sigma in the selected project using DMAIC phases .The full cycle can be constantly repeated
until the process performance improvement reaches an optimal level .In each cycle, a target
improvement goal setting is employed, in order to continually achieve a new level of
improvement.
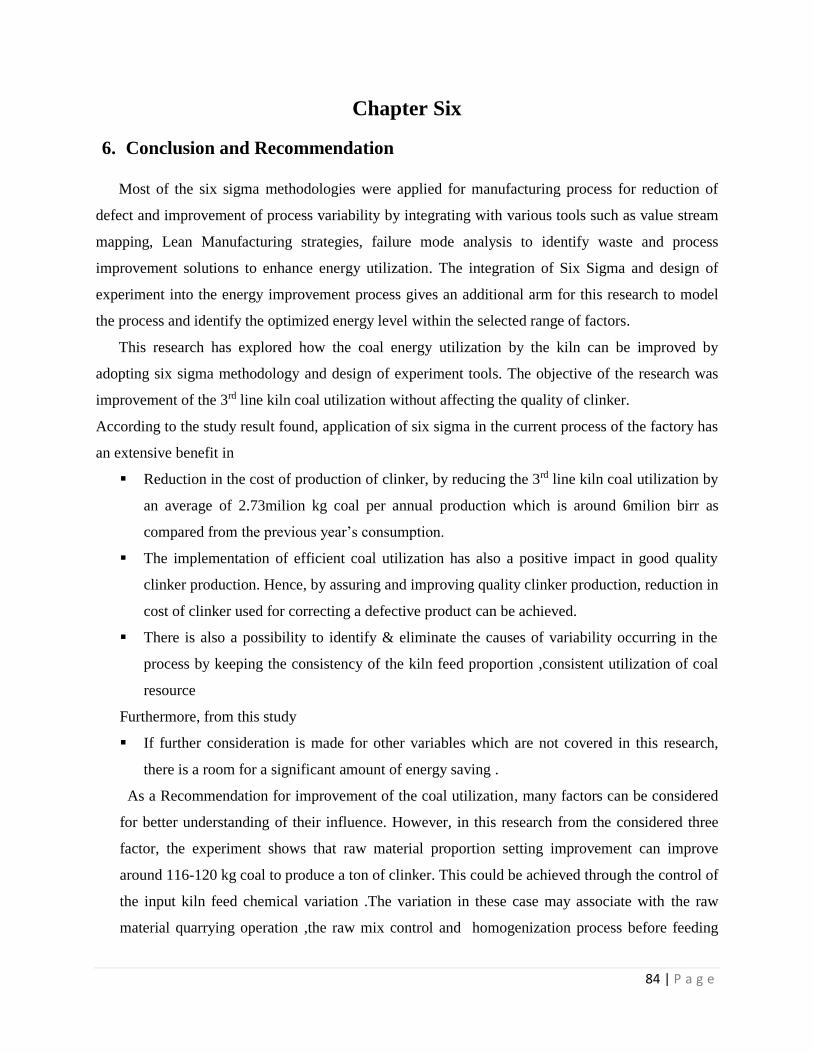
84 | P a g e
Chapter Six
6. Conclusion and Recommendation
Most of the six sigma methodologies were applied for manufacturing process for reduction of
defect and improvement of process variability by integrating with various tools such as value stream
mapping, Lean Manufacturing strategies, failure mode analysis to identify waste and process
improvement solutions to enhance energy utilization. The integration of Six Sigma and design of
experiment into the energy improvement process gives an additional arm for this research to model
the process and identify the optimized energy level within the selected range of factors.
This research has explored how the coal energy utilization by the kiln can be improved by
adopting six sigma methodology and design of experiment tools. The objective of the research was
improvement of the 3rd line kiln coal utilization without affecting the quality of clinker.
According to the study result found, application of six sigma in the current process of the factory has
an extensive benefit in
Reduction in the cost of production of clinker, by reducing the 3rd line kiln coal utilization by
an average of 2.73milion kg coal per annual production which is around 6milion birr as
compared from the previous year’s consumption.
The implementation of efficient coal utilization has also a positive impact in good quality
clinker production. Hence, by assuring and improving quality clinker production, reduction in
cost of clinker used for correcting a defective product can be achieved.
There is also a possibility to identify & eliminate the causes of variability occurring in the
process by keeping the consistency of the kiln feed proportion ,consistent utilization of coal
resource
Furthermore, from this study
If further consideration is made for other variables which are not covered in this research,
there is a room for a significant amount of energy saving .
As a Recommendation for improvement of the coal utilization, many factors can be considered
for better understanding of their influence. However, in this research from the considered three
factor, the experiment shows that raw material proportion setting improvement can improve
around 116-120 kg coal to produce a ton of clinker. This could be achieved through the control of
the input kiln feed chemical variation .The variation in these case may associate with the raw
material quarrying operation ,the raw mix control and homogenization process before feeding
85 | P a g e
into the kiln. Therefore, to ensure consistent coal utilization by maintaining the target quality
level, emphasis should be given to storage and homogenization of raw materials and kiln feed in
the current system.
6.1 Further Research
In this study, though the input kiln feed raw material fulfilled the quality target, there is a tendency of
producing below quality clinker. Hence, the mentioned factors and setting the right quality target
should be investigated further for bringing a better result in improvement of Quality clinker
production and coal utilization in the third line kiln .Beside these, the effect of some of the factors
such as raw material and coal fines ,moisture content and coal calorific values..etc should be studied
further.
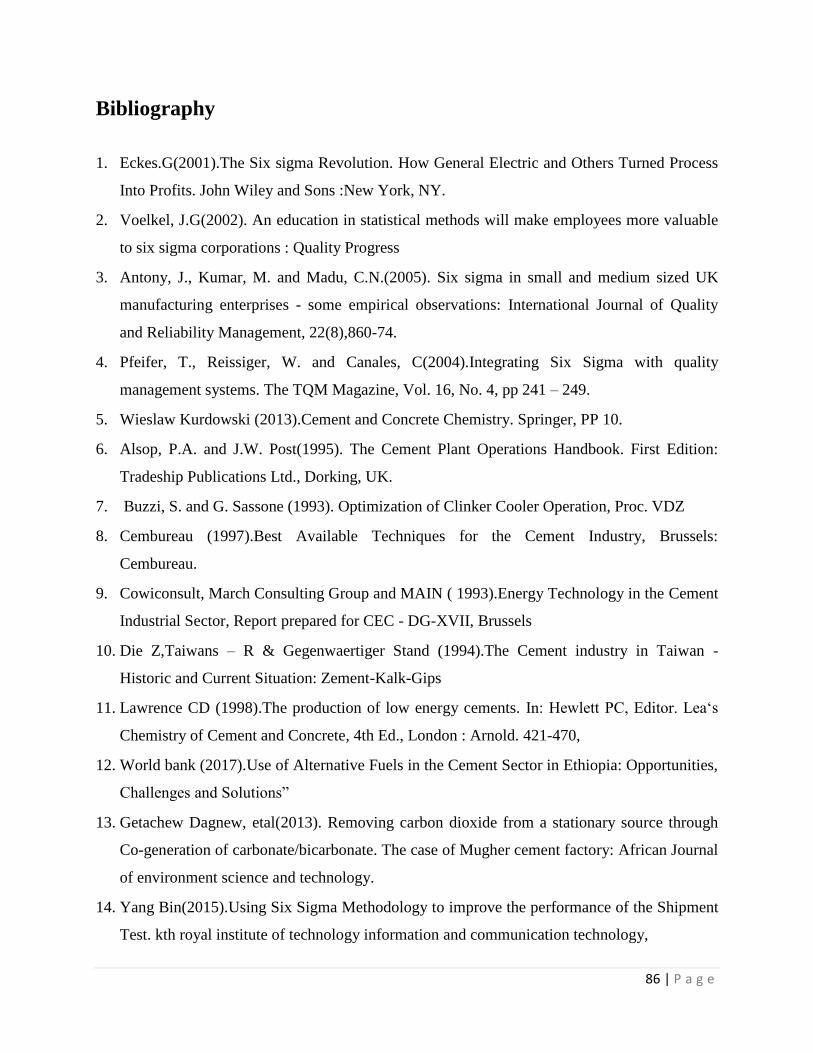
86 | P a g e
Bibliography
1. Eckes.G(2001).The Six sigma Revolution. How General Electric and Others Turned Process
Into Profits. John Wiley and Sons :New York, NY.
2. Voelkel, J.G(2002). An education in statistical methods will make employees more valuable
to six sigma corporations : Quality Progress
3. Antony, J., Kumar, M. and Madu, C.N.(2005). Six sigma in small and medium sized UK
manufacturing enterprises - some empirical observations: International Journal of Quality
and Reliability Management, 22(8),860-74.
4. Pfeifer, T., Reissiger, W. and Canales, C(2004).Integrating Six Sigma with quality
management systems. The TQM Magazine, Vol. 16, No. 4, pp 241 – 249.
5. Wieslaw Kurdowski (2013).Cement and Concrete Chemistry. Springer, PP 10.
6. Alsop, P.A. and J.W. Post(1995). The Cement Plant Operations Handbook. First Edition:
Tradeship Publications Ltd., Dorking, UK.
7. Buzzi, S. and G. Sassone (1993). Optimization of Clinker Cooler Operation, Proc. VDZ
8. Cembureau (1997).Best Available Techniques for the Cement Industry, Brussels:
Cembureau.
9. Cowiconsult, March Consulting Group and MAIN ( 1993).Energy Technology in the Cement
Industrial Sector, Report prepared for CEC - DG-XVII, Brussels
10. Die Z,Taiwans – R & Gegenwaertiger Stand (1994).The Cement industry in Taiwan -
Historic and Current Situation: Zement-Kalk-Gips
11. Lawrence CD (1998).The production of low energy cements. In: Hewlett PC, Editor. Lea‘s
Chemistry of Cement and Concrete, 4th Ed., London : Arnold. 421-470,
12. World bank (2017).Use of Alternative Fuels in the Cement Sector in Ethiopia: Opportunities,
Challenges and Solutions”
13. Getachew Dagnew, etal(2013). Removing carbon dioxide from a stationary source through
Co-generation of carbonate/bicarbonate. The case of Mugher cement factory: African Journal
of environment science and technology.
14. Yang Bin(2015).Using Six Sigma Methodology to improve the performance of the Shipment
Test. kth royal institute of technology information and communication technology,
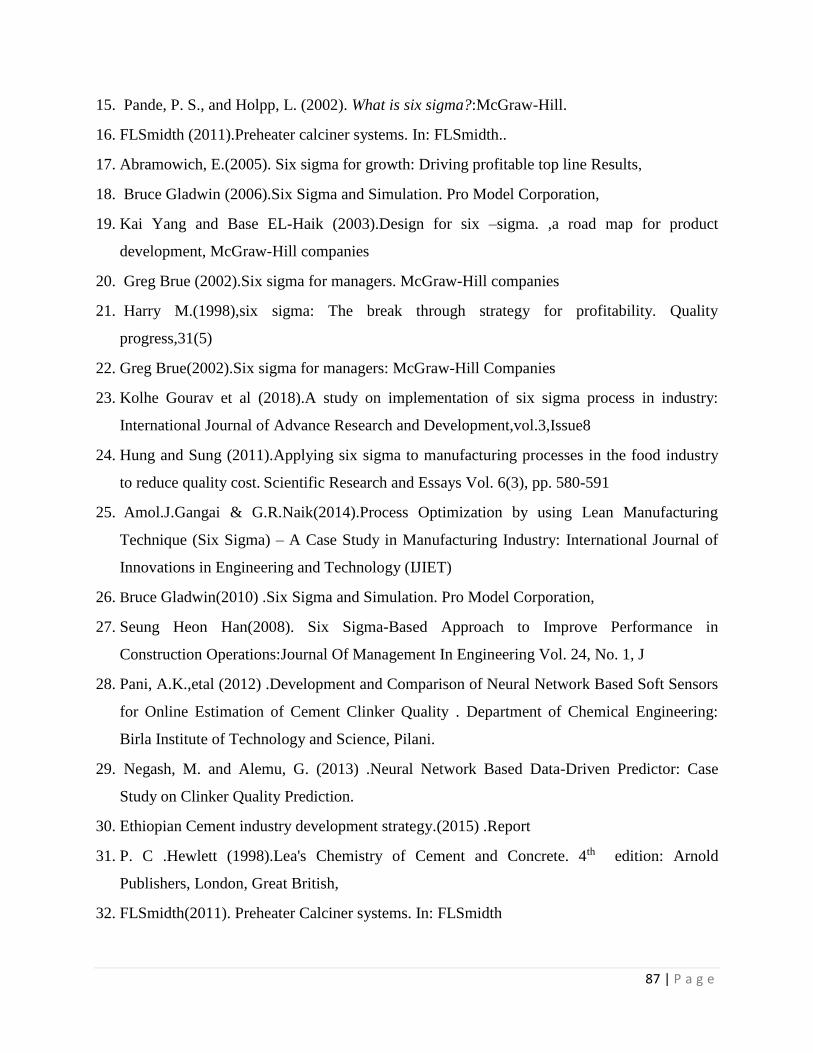
87 | P a g e
15. Pande, P. S., and Holpp, L. (2002). What is six sigma?:McGraw-Hill.
16. FLSmidth (2011).Preheater calciner systems. In: FLSmidth..
17. Abramowich, E.(2005). Six sigma for growth: Driving profitable top line Results,
18. Bruce Gladwin (2006).Six Sigma and Simulation. Pro Model Corporation,
19. Kai Yang and Base EL-Haik (2003).Design for six –sigma. ,a road map for product
development, McGraw-Hill companies
20. Greg Brue (2002).Six sigma for managers. McGraw-Hill companies
21. Harry M.(1998),six sigma: The break through strategy for profitability. Quality
progress,31(5)
22. Greg Brue(2002).Six sigma for managers: McGraw-Hill Companies
23. Kolhe Gourav et al (2018).A study on implementation of six sigma process in industry:
International Journal of Advance Research and Development,vol.3,Issue8
24. Hung and Sung (2011).Applying six sigma to manufacturing processes in the food industry
to reduce quality cost. Scientific Research and Essays Vol. 6(3), pp. 580-591
25. Amol.J.Gangai & G.R.Naik(2014).Process Optimization by using Lean Manufacturing
Technique (Six Sigma) – A Case Study in Manufacturing Industry: International Journal of
Innovations in Engineering and Technology (IJIET)
26. Bruce Gladwin(2010) .Six Sigma and Simulation. Pro Model Corporation,
27. Seung Heon Han(2008). Six Sigma-Based Approach to Improve Performance in
Construction Operations:Journal Of Management In Engineering Vol. 24, No. 1, J
28. Pani, A.K.,etal (2012) .Development and Comparison of Neural Network Based Soft Sensors
for Online Estimation of Cement Clinker Quality . Department of Chemical Engineering:
Birla Institute of Technology and Science, Pilani.
29. Negash, M. and Alemu, G. (2013) .Neural Network Based Data-Driven Predictor: Case
Study on Clinker Quality Prediction.
30. Ethiopian Cement industry development strategy.(2015) .Report
31. P. C .Hewlett (1998).Lea's Chemistry of Cement and Concrete. 4th edition: Arnold
Publishers, London, Great British,
32. FLSmidth(2011). Preheater Calciner systems. In: FLSmidth
88 | P a g e
33. Mohamed A.Aldieb and Hesham G.Ibrahim(2010).Variation of Feed Chemical Composition
and Its Effect on Clinker Formation–Simulation Process. World Congress on Engineering
and Computer Science .Vol II
34. Milivoj Mandic(2017).Method for Optimization of Energy Consumption of Electrical Trains.
International Review of Electrical Engineering ,Vol. 4, n. 6
35. Shruti Ojha & Neha Verma(2018) .Study of Six Sigma Implementation by Energy Value
Stream Mapping In Small Scale Industry: A Review: International Journal for Research in
Applied Science & Engineering Technology (IJRASET) ,Vol 6,IS IV
36. John Kane, Jr., E. I. (2003).Using Six Sigma to Drive Energy Efficiency Improvements at
DuPont: duPont de Nemours & Co.
37. G. Venter(2010). Review of Optimization Techniques. Department of Mechanical and
Mechatronic Engineering Stellenbosch University Private Bag X1 Matieland 7602:South
Africa
38. Emad H. Abualsauod (2005).Integrating multi-objective optimization with the six sigma
methodology for online process control.A dissertation submitted in partial fulfillment of the
requirements for the degree of Doctor of Philosophy: Department of Industrial Engineering
and Management Systems
39. Pardeep Gahlot(2012).Energy Management through six sigma: a case study. Journal of
Information, knowledge and research in Mechanical Engineering
40. Jamil, N. (2012). A Comparison of Direct and Indirect Solvers for Linear Systems of
Equations: International journal of emerging science ,Vol 2(2)
41. Babu R. Kumar, Ramkumar(2017).A Review on Organization practice of Conventional
Design of Experiment (DOE) with DMAIC: Journal of Chemical and Pharmaceutical Sciences
42. Martín Tanco, etal (2007).Manufacturing Industries Need Design of Experiments
(DoE).Proceedings of the World Congress on Engineering 2007 .Vol II
43. D. Dixon,etal(2006 ). Application of Design of Experiment (DOE) Techniques to Process
Validation in Medical Device Manufacture: Journal of Validation Technology,vol-2
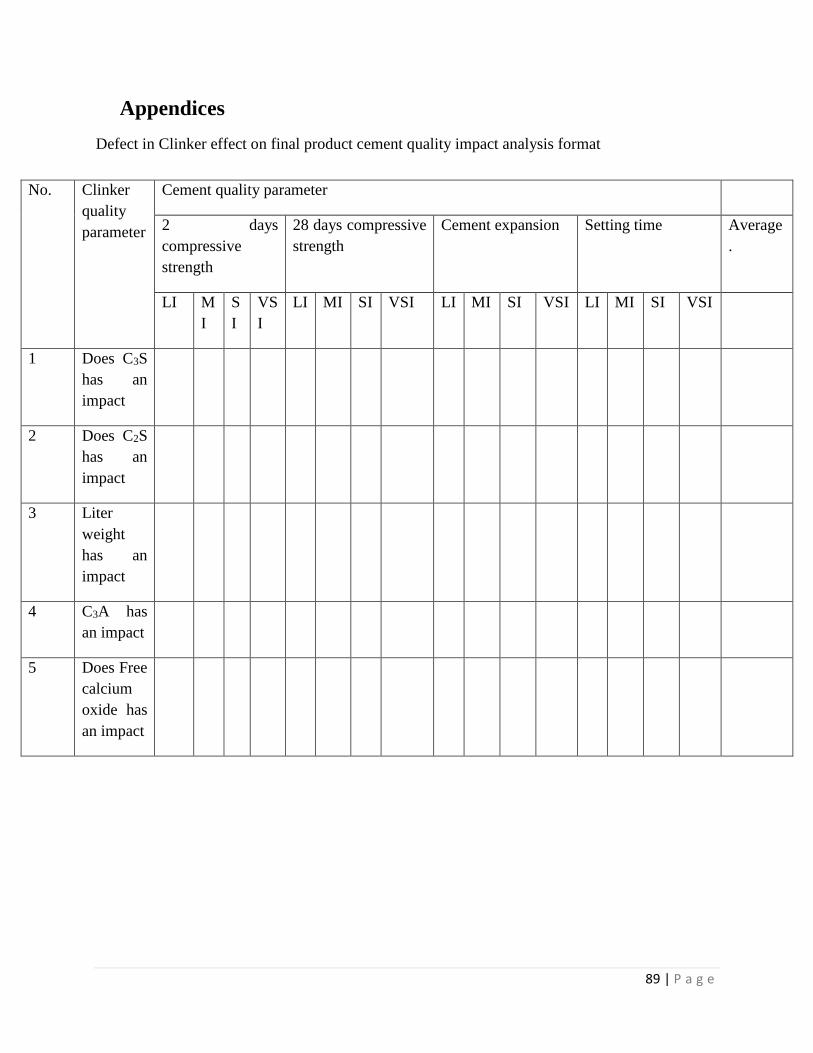
89 | P a g e
Appendices
Defect in Clinker effect on final product cement quality impact analysis format
No. Clinker
quality
parameter
Cement quality parameter
2 days
compressive
strength
28 days compressive
strength
Cement expansion Setting time Average
.
LI M
I
S
I
VS
I
LI MI SI VSI LI MI SI VSI LI MI SI VSI
1 Does C3S
has an
impact
2 Does C2S
has an
impact
3 Liter
weight
has an
impact
4 C3A has
an impact
5 Does Free
calcium
oxide has
an impact