Improving-Agricultural-Interventions-Under-the-New-National ...
96
IMPROVING AGRICULTURAL INTERVENTIONS UNDER THE NEW NATIONAL TARGET PROGRAMS IN VIETNAM
-
Upload
khangminh22 -
Category
Documents
-
view
1 -
download
0
Transcript of Improving-Agricultural-Interventions-Under-the-New-National ...
IMPROVING AGRICULTURALINTERVENTIONS UNDER THE NEW NATIONAL TARGET PROGRAMS IN VIETNAM
© 2020 The World Bank 1818 H Street NW, Washington DC 20433 Telephone: 202-473-1000; Internet: www.worldbank.org
Some rights reserved
This work is a product of the staff of The World Bank. The findings, interpretations, and conclusions expressed in this work do not necessarily reflect the views of the Executive Directors of The World Bank or the governments they represent. The World Bank does not guarantee the accuracy of the data included in this work. The boundaries, colors, denominations, and other information shown on any map in this work do not imply any judgment on the part of The World Bank concerning the legal status of any territory or the endorsement or acceptance of such boundaries.
Rights and Permissions
The material in this work is subject to copyright. Because the World Bank encourages dissemination of its knowledge, this work may be reproduced, in whole or in part, for non-commercial purposes as long as full attribution to this work is given.
Attribution—Please cite the work as follows: “World Bank. 2020. Vietnam: Improving agricultural interventions under the new National Target Programs. © World Bank.”
All queries on rights and licenses, including subsidiary rights, should be addressed to World Bank Publications, The World Bank Group, 1818 H Street NW, Washington, DC 20433, USA; fax: 202-522-2625; e-mail: [email protected].
IMPROVING AGRICULTURALINTERVENTIONS UNDER THE NEW NATIONAL TARGET PROGRAMS IN VIETNAMJune, 2020
Acknowledgments .............................................................................................................................................2
Executive Summary ...........................................................................................................................................3
1. Introduction .................................................................................................................................................12
2. Vietnamese Agricultural Performance: Aggregate Regional Analysis ..........................................................21
3. Narrowing the Agricultural Productivity Gaps—Analysis of Potential Pro-poor Value Chains ....................39
4. Conclusions and Recommendations ............................................................................................................73
References .......................................................................................................................................................87
Annexes ...........................................................................................................................................................89
TABLE OF
CONTENTS
5Improving agricultural interventions under the new national target programs in Vietnam
Abbreviations and Acronyms
3R3G Three Reductions, Three Gains TechnologyARP Agricultural Restructuring PlanASEAN Association of Southeast Asian NationsCEMA Committee on Ethnic Minority AffairsCDRA Climate and Disaster Risk AssessmentCRED Center for Rural Economy DevelopmentCSSP Commercial Smallholder Support ProjectDARD Department of Agriculture and Rural Development DFID Department for International DevelopmentEU European UnionFAO Food and Agriculture OrganizationGACP Good Agricultural and Collection PracticesGDP Gross Domestic ProductGOV Government of VietnamGSO General Statistics Office of Vietnam
HACCP Hazard Analysis and Critical Control Points
ICIMOD International Centre for Integrated Mountain Development
IFAD International Fund for Agricultural DevelopmentIFC International Finance CorporationIPSARD Institute of Policy and Strategy for Agriculture and Rural DevelopmentIRRI International Rice Research InstituteIT Information TechnologyM&E Monitoring and EvaluationM4P Making Markets Work Better for the PoorMARD Ministry of Agriculture and Rural DevelopmentMIS Management Information SystemMOC Ministry of ConstructionMOF Ministry of FinanceMOLISA Ministry of Labor, Invalids and Social AffairsMONRE Ministry of Natural Resources and EnvironmentMPI Ministry of Planning and InvestmentNCO National Coordinating OfficeNGO Nongovernmental Organization NRD New Rural Development
6 Improving agricultural interventions under the new national target programs in Vietnam
NTP National Target ProgramPforR Program-for-ResultsPPP Purchasing Power ParityPRDP Philippine Rural Development Project
SEDEMAProgram for Socioeconomic Development for Ethnic and Mountainous Areas
SPR Sustainable Poverty ReductionTFP Total Factor ProductivityVHLSS Vietnam Household Living Standards SurveyWDI World Development Indicators
7Improving agricultural interventions under the new national target programs in Vietnam
Acknowledgments
This analytical work and the report on the recommendations for improving agricultural interventions under the new National Target Programs in Vietnam has been prepared by Hardwick Tchale (Senior Agricultural Economist, SEAAG), Obert Pimhidzai (Senior Economist, EEAPV), and Carolina V. Figueroa-Geron (Lead Rural Development Specialist, SEAAG).
The report benefited from comments from the following peer reviewers: Jan Joost Nijhoff (Senior Agricultural Economist, SEAAG), Martin Henry Lenihan (Senior Social Development Specialist, SEAS1), and Elliot Mghenyi (Senior Agricultural Economist, SAFA1). Additional guidance was received from Paavo Eliste (Lead Economist, SEAAG), Binh Thang Cao (Senior Agricultural Specialist, SEAAG), Nghi Quy Nguyen (Senior Social Development Specialist, SEAS1), and Ahmed A. R. Eiweida (Sector Leader and Lead Urban Specialist, SEAU2).
The team worked closely with several consultants and consulting teams in undertaking this work. We are therefore greatly indebted to Abhinav Kumar Gupta (Agribusiness and Value Chain Specialist, Consultant), Douglas Forno (Institutional Specialist, Consultant), Claude Saint-Pierre (Social Development Specialist, Consultant, Baies); the team from the Institute for Policy and Strategy for Agriculture and Rural Development (IPSARD) comprising Tran Cong Thang (Director General), Truong Thi Thu Trang, Nguyen Le Hoa, Nguyen Thi Thuy, Nguyen Thuy Nga, Pham Kieu Hanh, Pham Minh Tri; and the team from Center for Rural Economy Development (CRED) comprising Vien Kim Cuong, Hoang Thu Huong, Tran Nhu Trang, Nguyen Lam Giang, and Thai Huyen Nga.
The background studies for the report have been undertaken with financial support from the World Bank and the Government of Australia via the Australia - World Bank Group Strategic Partnership in Vietnam Phase 2 (ABP2)”. The report was prepared with guidance from Dina Umali-Deininger (Practice Manager, SEAAG), Susan Shen (Practice Manager, SEAS1), and Rinku Murgai (Practice Manager, EEAPV).
8 Improving agricultural interventions under the new national target programs in Vietnam
Executive Summary
Main Objectives and Key Clients
The main objective of this analytical work is to recommend improvements to some of the agricultural interventions under the new National Target Programs (NTPs). The analysis and the recommendations thereof are meant to inform the design and implementation of two of the new NTPs. First is the new NTP, focusing on ethnic minority groups, which is being designed by the Committee on Ethnic Minority Affairs (CEMA) in coordination with other sectoral ministries such as Ministry of Agriculture and Rural Development (MARD). This proposed NTP will focus on the socioeconomic development of ethnic minorities and mountainous areas from 2021 to 2030. Second, some of these recommendations, especially those related to value chain development, program planning and management, are also relevant for the new NTP for the New Rural Development (NRD) which is being designed and its implementation will continue to be coordinated by the National Coordinating Office (NCO) under MARD in collaboration with provinces.1 The final report will therefore be submitted to both CEMA and MARD to inform the detailed technical designs and implementation plans of several sub-programs under both the new NTPs on ethnic minorities and the NRD.
This report focuses on improving agricultural incomes as a pathway out of poverty for Vietnam’s lagging areas. Previous studies (World Bank, 2019a, b) have focused on improving access to off-farm opportunities in lagging areas, as expanding non-farm wage incomes have been a key driver of poverty reduction. However, there are also significant gaps in agricultural incomes between the regions, and between the poor and non-poor within the region. This suggests that agriculture transformation is yet to be completed, and there are untapped opportunities to further increase agricultural incomes of the poor. This report thus focuses on closing this gap in agriculture, as another pathway for out of poverty.
While Vietnam has become a major international player in global food markets, there remains a segment of the rural population that has not benefitted much from the country’s success in terms of economic growth, particularly the success of the agricultural sector. However, the old approach of maximizing agricultural productivity is not fully compatible with this segment due to their unique characteristics and challenges in terms of productivity limitations. This means that the agricultural development strategy should now shift toward the integration of these poorer producers and regions, facing major productivity challenges, into specialized value chains where they may have a comparative advantage. While the recent iterations of the NTPs are a step in the right direction in terms of agricultural interventions, changes need to be made in terms of investing in skills and organizational capacity of the farmers themselves, prioritizing integration into niche product value chains, balancing economic with environmental and social concerns, promoting transparent monitoring and evaluation, and balancing the need for top-down administration with a flexible and participatory approach.
Although this work started when the COVID-19 pandemic was not fully pronounced in Vietnam and around the globe—as it had just started in China—the pandemic has had significant influence on the national economy as well as the performance of the agricultural sector. The pandemic has disrupted a lot of economic activities, including the performance of the food supply chains through the disruption of commodity flows, the limitations
1 The World Bank, through the NTP Program-for-Results (PforR) operation, has been supporting the implementation of three NTPs since 2017: NTP for NRD, Sustainable Poverty Reduction (SPR), and P135 (which is the predecessor of the new NTP for Socioeconomic Development for Ethnic and Mountainous Areas (SEDEMA). The PforR support is going to close at the end of 2021.
9Improving agricultural interventions under the new national target programs in Vietnam
on movement and social distancing measures which affect labor mobility, and the availability of agricultural inputs due to the disruption of supply contracts. All these issues are likely to affect productivity negatively in the next production season, both from the demand and supply market point of view. The implementation of the recommendations highlighted in this report could help strengthen the strategies for post-COVID-19 economic recovery. Given its enormous comparative advantage and capacity to increase production, Vietnam, as a net food exporting country, can capitalize on the global disruption of food supply chains and the emerging surge in food demand to ramp up its production and exports. In the northern mountainous regions, there may be need for more support for farmers to recover quickly from the COVID-19 impacts. Some of the recommendations in this report can help to inform the post-COVID-19 support strategies.
Methodology: The report’s findings and recommendations are based on three interrelated studies: (a) analysis of the agricultural labor productivity and the factors correlated with the level of productivity using parametric methods; (b) analysis of pro-poor value chains, focusing on the commodity value chains which are relevant and already being produced in Vietnam, including among the ethnic minorities; and (c) analysis of lessons and experiences from other countries’ inclusive agricultural development programs, to draw on relevant strategies to improve agricultural interventions in the new NTPs, particularly the NTPs for ethnic minorities and NRD. The analysis is performed at two levels: (a) regional level to assess the existing differences in productivity and the factors that explain such differences, with the aim of understanding the country-context factors that may offer potential improvement in other areas, and (b) a slightly deeper analysis of the factors affecting productivity in the most lagging regions, that is, the northern mountainous regions—which is the focus of the new NTP (that is, SEDEMA).
Key Findings and Conclusions
1. Vietnam has a lot of potential to improve agricultural performance in its lagging regions.
Vietnam has achieved remarkable economic development over the last few decades, realizing major gains in productivity and output and contributing to national goals related to poverty reduction and economic transformation, including an increase in per capita income. In 2018, per capita income was estimated to have grown by 7.1 percent, a little higher than 6.8 percent in 2017. Among Association of Southeast Asian Nations (ASEAN) countries, Vietnam ranked second after Cambodia whose per capita income grew at 7.5 percent. Vietnam has almost doubled its per capita income in about a decade.
Vietnam has been a success in terms of agricultural development. Since the early 1990s, it has been moving steadily to become a major force on the global food market. The country has emerged as one of the world’s leading exporters of agro-food commodities, ranking among the top five global suppliers of fish, rice, coffee, tea, cashew nuts, black pepper, rubber, and cassava.2 In 2019, Vietnam was a major supplier in more than eight key global food value chains, on average generating revenues of over US$3 billion from each commodity, resulting in a total agricultural export revenue of US$40 billion in 2018 and 2019. Since 2010, Vietnam’s agricultural exports have registered positive trade balances, reaching over US$7 billion in 2018.
Vietnam has gone through significant structural transformation, but agriculture remains one of the key sources of livelihood and its performance determines the level of labor productivity particularly among the poorest in the rural areas.
Although Vietnam has undergone rapid structural transformation, especially in the rural economy, agriculture is still the main source of livelihood for most households, particularly those in the rural areas. Rural labor is rapidly shifting away from the agriculture sector. Agriculture has, on average, lost 4 percent of
2 From 2010, the number of commodities of which Vietnam has become one of the top five major suppliers doubled.
10 Improving agricultural interventions under the new national target programs in Vietnam
its workers annually to other sectors since 2014. Agriculture’s employment share declined to 40 percent in 2018 from around 50 percent in 2010. But most labor moved into nonagricultural jobs within rural areas, significantly transforming the rural economy and rural household incomes. Nearly as many rural workers are now employed in agriculture as in nonagricultural sectors. The share of agriculture in rural incomes declined to about a third of household income in 2018. However, agriculture remains a key source of livelihoods though households have mostly diversified their livelihoods rather than completely abandoning agriculture. About 80 percent of rural households are still engaged in agriculture, but only 26 percent are purely agricultural. Most households have a combination of agricultural income and nonagricultural wage incomes, sometimes in combination with household business incomes as well.
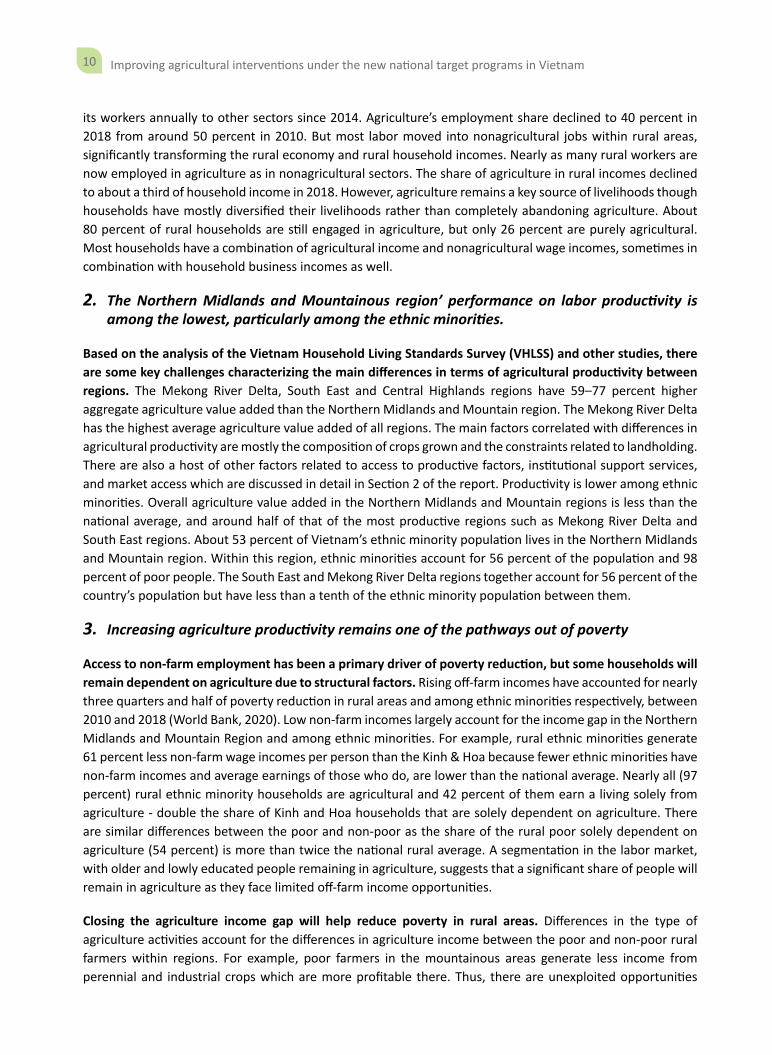
2. The Northern Midlands and Mountainous region’ performance on labor productivity is among the lowest, particularly among the ethnic minorities.
Based on the analysis of the Vietnam Household Living Standards Survey (VHLSS) and other studies, there are some key challenges characterizing the main differences in terms of agricultural productivity between regions. The Mekong River Delta, South East and Central Highlands regions have 59–77 percent higher aggregate agriculture value added than the Northern Midlands and Mountain region. The Mekong River Delta has the highest average agriculture value added of all regions. The main factors correlated with differences in agricultural productivity are mostly the composition of crops grown and the constraints related to landholding. There are also a host of other factors related to access to productive factors, institutional support services, and market access which are discussed in detail in Section 2 of the report. Productivity is lower among ethnic minorities. Overall agriculture value added in the Northern Midlands and Mountain regions is less than the national average, and around half of that of the most productive regions such as Mekong River Delta and South East regions. About 53 percent of Vietnam’s ethnic minority population lives in the Northern Midlands and Mountain region. Within this region, ethnic minorities account for 56 percent of the population and 98 percent of poor people. The South East and Mekong River Delta regions together account for 56 percent of the country’s population but have less than a tenth of the ethnic minority population between them.
3. Increasing agriculture productivity remains one of the pathways out of poverty
Access to non-farm employment has been a primary driver of poverty reduction, but some households will remain dependent on agriculture due to structural factors. Rising off-farm incomes have accounted for nearly three quarters and half of poverty reduction in rural areas and among ethnic minorities respectively, between 2010 and 2018 (World Bank, 2020). Low non-farm incomes largely account for the income gap in the Northern Midlands and Mountain Region and among ethnic minorities. For example, rural ethnic minorities generate 61 percent less non-farm wage incomes per person than the Kinh & Hoa because fewer ethnic minorities have non-farm incomes and average earnings of those who do, are lower than the national average. Nearly all (97 percent) rural ethnic minority households are agricultural and 42 percent of them earn a living solely from agriculture - double the share of Kinh and Hoa households that are solely dependent on agriculture. There are similar differences between the poor and non-poor as the share of the rural poor solely dependent on agriculture (54 percent) is more than twice the national rural average. A segmentation in the labor market, with older and lowly educated people remaining in agriculture, suggests that a significant share of people will remain in agriculture as they face limited off-farm income opportunities.
Closing the agriculture income gap will help reduce poverty in rural areas. Differences in the type of agriculture activities account for the differences in agriculture income between the poor and non-poor rural farmers within regions. For example, poor farmers in the mountainous areas generate less income from perennial and industrial crops which are more profitable there. Thus, there are unexploited opportunities
11Improving agricultural interventions under the new national target programs in Vietnam
for poor farmers in the region to increase agriculture incomes. This makes boosting agriculture income an important pathway out of poverty for households in this region, in addition to expanding off-farm income generating opportunities.
Increasing agricultural productivity in a few of the lagging areas is an appropriate strategy to improve agricultural productivity and overall livelihoods. There are many reasons why increasing labor productivity and access to value chains is a valid proposition for these few lagging areas. First, with a large share of ethnic minority population, the ethnic minorities can only move sustainably out of poverty if agriculture, which is one of their most important sources of income, is productive. Increasing agricultural labor productivity is a secure way to allow labor to shift out of subsistence agriculture, which has so far been insufficiently pursued in Vietnam. Second, mountainous areas and the less fertile midlands in Vietnam have and will remain with limited potential for most of the major agricultural commodities exported. However, these areas have kept a unique diversity of agricultural products and know-how. They have more potential to grow organic food and access niche products. Developing related value chains and exploiting potential niche markets is vital for the large share of the poor in the country’s mountains and midlands. It is also conducive to improving the quality of life of the urban population in Vietnam while preserving the environment in the mountains and midlands and nurturing a unique range of innovative, high-value enterprises.
4. Promoting value chain development therefore offers potential to narrow productivity differences.
One of the key strategies to narrow productivity differences is to promote value chain development, focusing on niche markets and products. Vietnam is recognized for its success in developing pro-poor value chains at the local level. The new NTPs are a unique opportunity to scale up this approach. The analysis of some selected value chains demonstrates some commodities with significant potential to improve the productivity of the people in the northern regions, particularly among the ethnic minority groups, given the unique skills and capabilities they have in the production of most of these nontraditional commodities. Such commodities include spices (for example, cinnamon), medicinal plants (for example, lemon grass, turmeric, coriander), vegetables, tea, handicrafts (for example, brocade, indigo) and small livestock (for example, indigenous chickens). Most of these are unique and produced most by the ethnic minorities than in other areas of Vietnam. Most of these commodities are also linked to niche markets and products in the region and in developed country markets. However, a lot needs to be done to develop these into organized supply chains, capable of competing in the regional and international markets. Investments in infrastructure and logistics are required to promote the vegetable, tea and poultry value chains. Enhanced value chain organization and production standards are required to improve the tea and medicinal herbs as well as the spices. For all the commodities’ value chains analyzed, strengthening collective action is important to improve economies of scale and risk-sharing to encourage farmer innovation beyond the traditional systems. Both horizontal and vertical links need to be promoted to create avenues to access favorable niche markets, which drive investment and innovation.
In order to achieve significant scaling-up, it is important to integrate successful agricultural value chain development in the design of comprehensive national level programs, such the NTP, particularly in the new NTP focusing on ethnic minorities and the mountainous regions in Vietnam. Provincial governments should continue to be responsible for designing social and economic development programs at the provincial level. Centralization of design and implementation of local level programs contributes to fragmentation of development programs and poor coordination of market-related decisions due to the high number of provinces. The agricultural value chain development is better coordinated and implemented by the devolved
12 Improving agricultural interventions under the new national target programs in Vietnam
provincial institutions, such as the provincial Departments of Agriculture and Rural Development (DARDs) or other similar provincial institutions. More recently, the regional-level departments have also been authorized to plan government action in relation to climate change or major infrastructure. Similarly, agricultural value chain strategies deserve being designed and implemented through a more coordinated approach at the provincial level.
The specific recommendations to strengthen the design and implementation of agricultural interventions under the new NTPs include: (i) balancing investment between infrastructure and livelihood and production support; (ii) enhancing program planning and management; (iii) mainstreaming the use of community participation tools to enhance community ownership and accountability; (iv) considering to introduce performance-based budget allocation to provide an incentive for better performance; (v) strengthening governance and accountability for results; (vi) prioritizing value chains based on unique features and comparative advantage; (vii) promoting the “soft” investments in training of rural households in value chain development; (viii) facilitating upgrading of product quality as a critical step to enter organized value chains; (ix) promoting vertical linkages (from primary production to the market) and horizontal linkages (coordinated actions among producers and market operators); and (x) applying adequate care to ensure that the value chain development is in tandem with a “do not harm” approach. These are elaborated in more detail in Section 4 of the report.
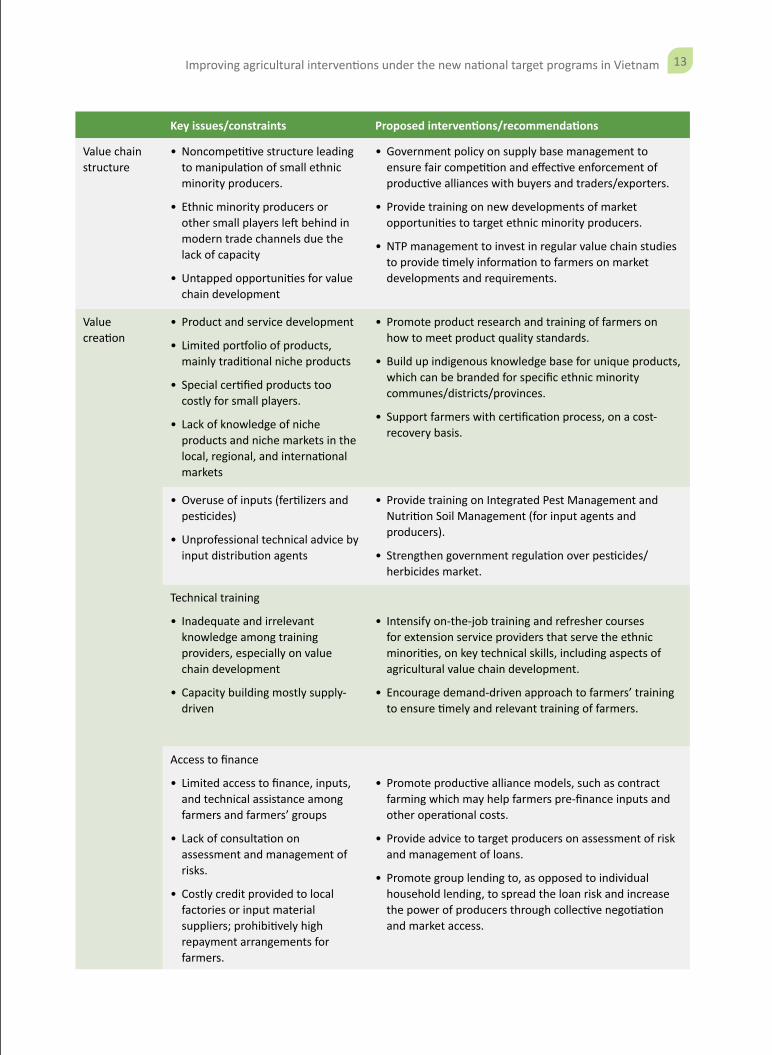
To facilitate value chain development for the commodities that are relevant to the ethnic minorities, NCO/MARD and CEMA should consider the following key issues and proposed recommendations. Other more detailed, granular and commodity-specific recommedations are highlighted in Section 3 and Section 4 of the report. Section 4 also provides additional institutional and process-related recommendations drawn from international lessons and experiences. These are more relevant to inform the institutional and operational aspects of the program design.
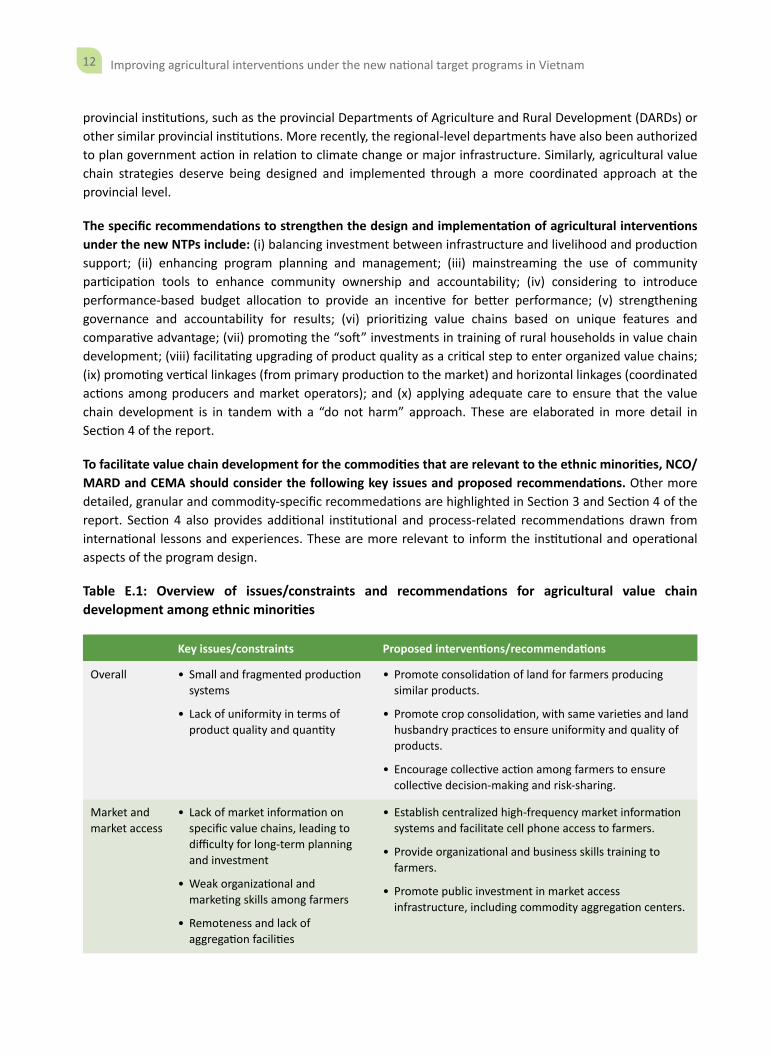
Table E.1: Overview of issues/constraints and recommendations for agricultural value chain development among ethnic minorities
Key issues/constraints Proposed interventions/recommendations
Overall • Small and fragmented production systems
• Lack of uniformity in terms of product quality and quantity
• Promote consolidation of land for farmers producing similar products.
• Promote crop consolidation, with same varieties and land husbandry practices to ensure uniformity and quality of products.
• Encourage collective action among farmers to ensure collective decision-making and risk-sharing.
Market and market access
• Lack of market information on specific value chains, leading to difficulty for long-term planning and investment
• Weak organizational and marketing skills among farmers
• Remoteness and lack of aggregation facilities
• Establish centralized high-frequency market information systems and facilitate cell phone access to farmers.
• Provide organizational and business skills training to farmers.
• Promote public investment in market access infrastructure, including commodity aggregation centers.
13Improving agricultural interventions under the new national target programs in Vietnam
Key issues/constraints Proposed interventions/recommendations
Value chain structure
• Noncompetitive structure leading to manipulation of small ethnic minority producers.
• Ethnic minority producers or other small players left behind in modern trade channels due the lack of capacity
• Untapped opportunities for value chain development
• Government policy on supply base management to ensure fair competition and effective enforcement of productive alliances with buyers and traders/exporters.
• Provide training on new developments of market opportunities to target ethnic minority producers.
• NTP management to invest in regular value chain studies to provide timely information to farmers on market developments and requirements.
Value creation
• Product and service development
• Limited portfolio of products, mainly traditional niche products
• Special certified products too costly for small players.
• Lack of knowledge of niche products and niche markets in the local, regional, and international markets
• Promote product research and training of farmers on how to meet product quality standards.
• Build up indigenous knowledge base for unique products, which can be branded for specific ethnic minority communes/districts/provinces.
• Support farmers with certification process, on a cost-recovery basis.
• Overuse of inputs (fertilizers and pesticides)
• Unprofessional technical advice by input distribution agents
• Provide training on Integrated Pest Management and Nutrition Soil Management (for input agents and producers).
• Strengthen government regulation over pesticides/herbicides market.
Technical training
• Inadequate and irrelevant knowledge among training providers, especially on value chain development
• Capacity building mostly supply-driven
• Intensify on-the-job training and refresher courses for extension service providers that serve the ethnic minorities, on key technical skills, including aspects of agricultural value chain development.
• Encourage demand-driven approach to farmers’ training to ensure timely and relevant training of farmers.
Access to finance
• Limited access to finance, inputs, and technical assistance among farmers and farmers’ groups
• Lack of consultation on assessment and management of risks.
• Costly credit provided to local factories or input material suppliers; prohibitively high repayment arrangements for farmers.
• Promote productive alliance models, such as contract farming which may help farmers pre-finance inputs and other operational costs.
• Provide advice to target producers on assessment of risk and management of loans.
• Promote group lending to, as opposed to individual household lending, to spread the loan risk and increase the power of producers through collective negotiation and market access.

14 Improving agricultural interventions under the new national target programs in Vietnam
Key issues/constraints Proposed interventions/recommendations
Value chain link
• Weak, limited, or nonexistent vertical and/or horizontal links among players in the value chain.
• Promote ethnic minority producer collaboration groups—formulation and capacity building.
• Support establishment and development of collaborative arrangements between all actors in the value chains.
• Support models that enhance links between actors, for example, traceability system, certified production and processing system, or information sharing platforms, e.g. well-planned study tours.
Sharing value created through the supply chains
• Unfair sharing of value, leading to non-contract compliance including side selling of commodities, with primary producers mostly being on the receiving end
• Unethical behavior among both suppliers and buyers
• Strengthen contract compliance and ethical behavior among primary producers and buyers and other value chain stakeholders, through establishment of mechanisms for legal contract enforcement and close monitoring.
15Improving agricultural interventions under the new national target programs in Vietnam
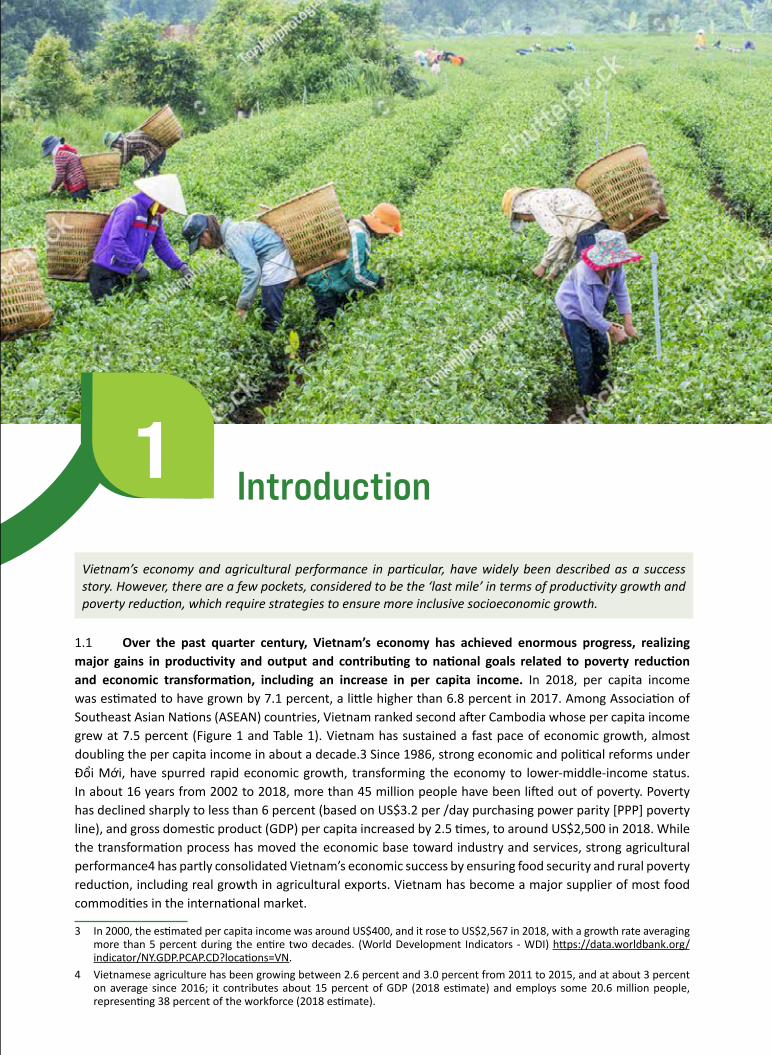
Vietnam’s economy and agricultural performance in particular, have widely been described as a success story. However, there are a few pockets, considered to be the ‘last mile’ in terms of productivity growth and poverty reduction, which require strategies to ensure more inclusive socioeconomic growth.
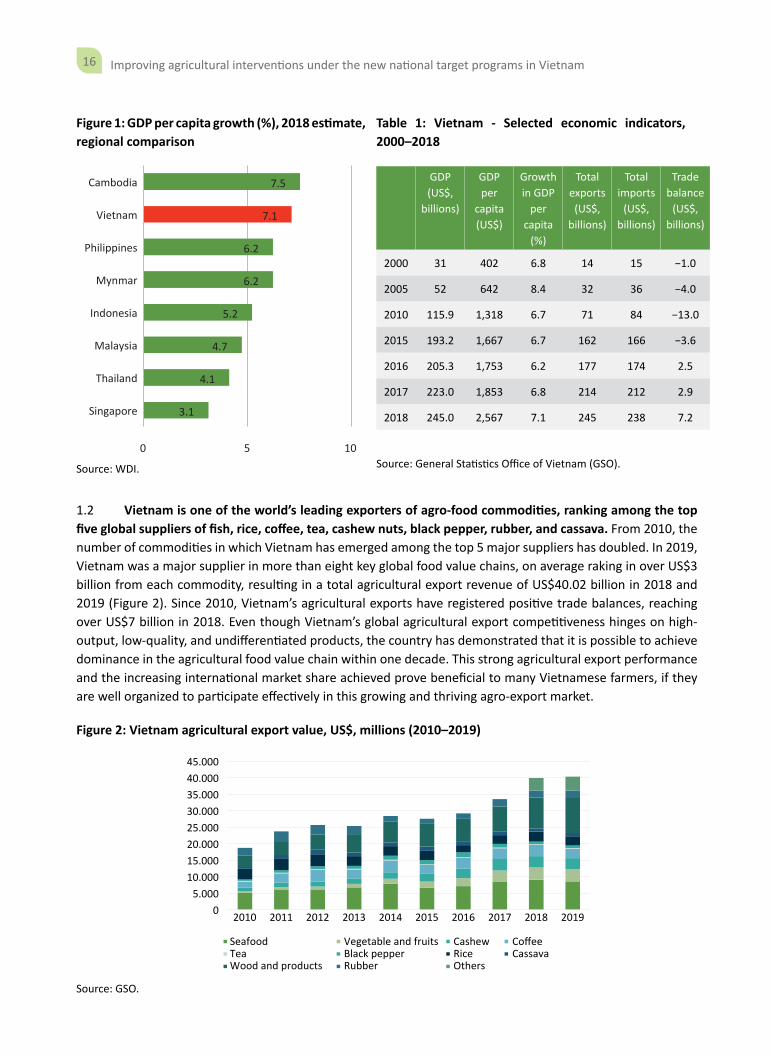
1.1 Over the past quarter century, Vietnam’s economy has achieved enormous progress, realizing major gains in productivity and output and contributing to national goals related to poverty reduction and economic transformation, including an increase in per capita income. In 2018, per capita income was estimated to have grown by 7.1 percent, a little higher than 6.8 percent in 2017. Among Association of Southeast Asian Nations (ASEAN) countries, Vietnam ranked second after Cambodia whose per capita income grew at 7.5 percent (Figure 1 and Table 1). Vietnam has sustained a fast pace of economic growth, almost doubling the per capita income in about a decade.3 Since 1986, strong economic and political reforms under Đổi Mới, have spurred rapid economic growth, transforming the economy to lower-middle-income status. In about 16 years from 2002 to 2018, more than 45 million people have been lifted out of poverty. Poverty has declined sharply to less than 6 percent (based on US$3.2 per /day purchasing power parity [PPP] poverty line), and gross domestic product (GDP) per capita increased by 2.5 times, to around US$2,500 in 2018. While the transformation process has moved the economic base toward industry and services, strong agricultural performance4 has partly consolidated Vietnam’s economic success by ensuring food security and rural poverty reduction, including real growth in agricultural exports. Vietnam has become a major supplier of most food commodities in the international market.
3 In 2000, the estimated per capita income was around US$400, and it rose to US$2,567 in 2018, with a growth rate averaging more than 5 percent during the entire two decades. (World Development Indicators - WDI) https://data.worldbank.org/indicator/NY.GDP.PCAP.CD?locations=VN.
4 Vietnamese agriculture has been growing between 2.6 percent and 3.0 percent from 2011 to 2015, and at about 3 percent on average since 2016; it contributes about 15 percent of GDP (2018 estimate) and employs some 20.6 million people, representing 38 percent of the workforce (2018 estimate).
1 Introduction
16 Improving agricultural interventions under the new national target programs in Vietnam
Figure 1: GDP per capita growth (%), 2018 estimate, regional comparison
3.1
4.1
4.7
5.2
6.2
6.2
7.1
7.5
0 5 10
Singapore
Thailand
Malaysia
Indonesia
Mynmar
Philippines
Vietnam
Cambodia
Source: WDI.
Table 1: Vietnam - Selected economic indicators, 2000–2018
GDP(US$,
billions)
GDP per
capita (US$)
Growth in GDP
per capita
(%)
Total exports(US$,
billions)
Total imports
(US$, billions)
Trade balance
(US$, billions)
2000 31 402 6.8 14 15 −1.0
2005 52 642 8.4 32 36 −4.0
2010 115.9 1,318 6.7 71 84 −13.0
2015 193.2 1,667 6.7 162 166 −3.6
2016 205.3 1,753 6.2 177 174 2.5
2017 223.0 1,853 6.8 214 212 2.9
2018 245.0 2,567 7.1 245 238 7.2
Source: General Statistics Office of Vietnam (GSO).
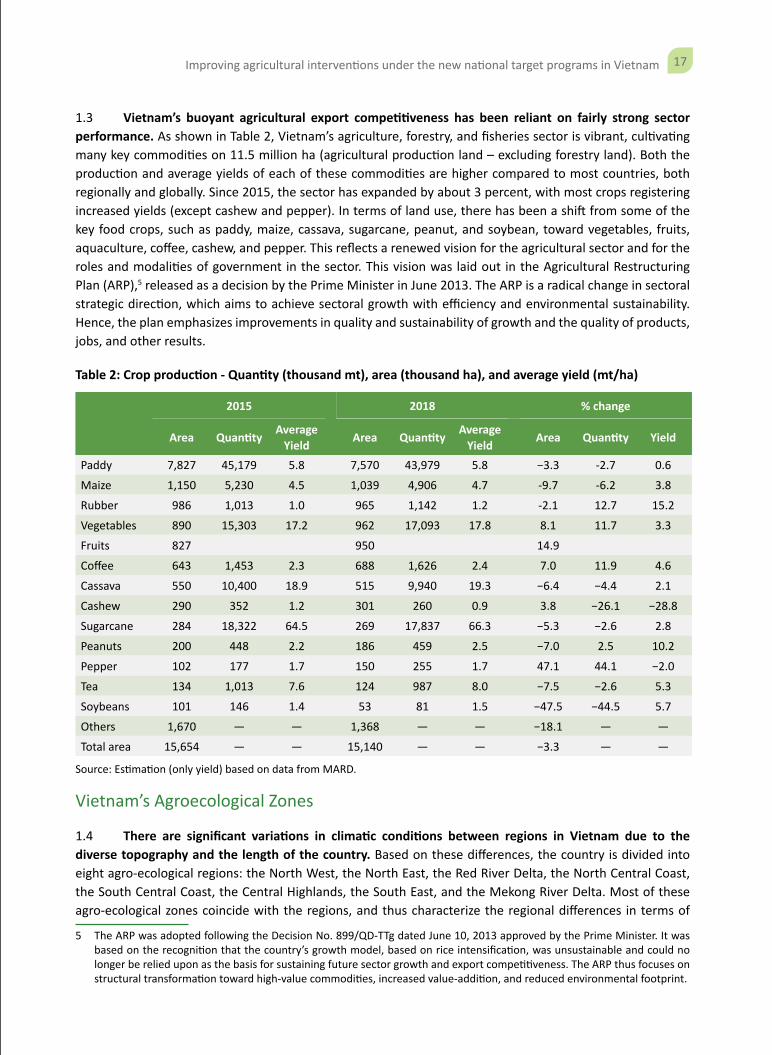
1.2 Vietnam is one of the world’s leading exporters of agro-food commodities, ranking among the top five global suppliers of fish, rice, coffee, tea, cashew nuts, black pepper, rubber, and cassava. From 2010, the number of commodities in which Vietnam has emerged among the top 5 major suppliers has doubled. In 2019, Vietnam was a major supplier in more than eight key global food value chains, on average raking in over US$3 billion from each commodity, resulting in a total agricultural export revenue of US$40.02 billion in 2018 and 2019 (Figure 2). Since 2010, Vietnam’s agricultural exports have registered positive trade balances, reaching over US$7 billion in 2018. Even though Vietnam’s global agricultural export competitiveness hinges on high-output, low-quality, and undifferentiated products, the country has demonstrated that it is possible to achieve dominance in the agricultural food value chain within one decade. This strong agricultural export performance and the increasing international market share achieved prove beneficial to many Vietnamese farmers, if they are well organized to participate effectively in this growing and thriving agro-export market.
Figure 2: Vietnam agricultural export value, US$, millions (2010–2019)
45.00040.00035.00030.00025.00020.00015.00010.000
5.0000 2010
SeafoodTeaWood and products
Vegetable and fruitsBlack pepperRubber
CashewRice
CoffeeCassava
Others
2011 2012 2013 2014 2015 2016 2017 2018 2019
Source: GSO.
17Improving agricultural interventions under the new national target programs in Vietnam
1.3 Vietnam’s buoyant agricultural export competitiveness has been reliant on fairly strong sector performance. As shown in Table 2, Vietnam’s agriculture, forestry, and fisheries sector is vibrant, cultivating many key commodities on 11.5 million ha (agricultural production land – excluding forestry land). Both the production and average yields of each of these commodities are higher compared to most countries, both regionally and globally. Since 2015, the sector has expanded by about 3 percent, with most crops registering increased yields (except cashew and pepper). In terms of land use, there has been a shift from some of the key food crops, such as paddy, maize, cassava, sugarcane, peanut, and soybean, toward vegetables, fruits, aquaculture, coffee, cashew, and pepper. This reflects a renewed vision for the agricultural sector and for the roles and modalities of government in the sector. This vision was laid out in the Agricultural Restructuring Plan (ARP),5 released as a decision by the Prime Minister in June 2013. The ARP is a radical change in sectoral strategic direction, which aims to achieve sectoral growth with efficiency and environmental sustainability. Hence, the plan emphasizes improvements in quality and sustainability of growth and the quality of products, jobs, and other results.
Table 2: Crop production - Quantity (thousand mt), area (thousand ha), and average yield (mt/ha)
2015 2018 % change
Area Quantity Average Yield Area Quantity Average
Yield Area Quantity Yield
Paddy 7,827 45,179 5.8 7,570 43,979 5.8 −3.3 -2.7 0.6
Maize 1,150 5,230 4.5 1,039 4,906 4.7 -9.7 -6.2 3.8
Rubber 986 1,013 1.0 965 1,142 1.2 -2.1 12.7 15.2
Vegetables 890 15,303 17.2 962 17,093 17.8 8.1 11.7 3.3
Fruits 827 950 14.9
Coffee 643 1,453 2.3 688 1,626 2.4 7.0 11.9 4.6
Cassava 550 10,400 18.9 515 9,940 19.3 −6.4 −4.4 2.1
Cashew 290 352 1.2 301 260 0.9 3.8 −26.1 −28.8
Sugarcane 284 18,322 64.5 269 17,837 66.3 −5.3 −2.6 2.8
Peanuts 200 448 2.2 186 459 2.5 −7.0 2.5 10.2
Pepper 102 177 1.7 150 255 1.7 47.1 44.1 −2.0
Tea 134 1,013 7.6 124 987 8.0 −7.5 −2.6 5.3
Soybeans 101 146 1.4 53 81 1.5 −47.5 −44.5 5.7
Others 1,670 — — 1,368 — — −18.1 — —
Total area 15,654 — — 15,140 — — −3.3 — —
Source: Estimation (only yield) based on data from MARD.
Vietnam’s Agroecological Zones
1.4 There are significant variations in climatic conditions between regions in Vietnam due to the diverse topography and the length of the country. Based on these differences, the country is divided into eight agro-ecological regions: the North West, the North East, the Red River Delta, the North Central Coast, the South Central Coast, the Central Highlands, the South East, and the Mekong River Delta. Most of these agro-ecological zones coincide with the regions, and thus characterize the regional differences in terms of
5 The ARP was adopted following the Decision No. 899/QD-TTg dated June 10, 2013 approved by the Prime Minister. It was based on the recognition that the country’s growth model, based on rice intensification, was unsustainable and could no longer be relied upon as the basis for sustaining future sector growth and export competitiveness. The ARP thus focuses on structural transformation toward high-value commodities, increased value-addition, and reduced environmental footprint.
18 Improving agricultural interventions under the new national target programs in Vietnam
agricultural production, crop systems and seasons and crop yields. Market access is also different, with road networks a bit sparser in northern mountainous regions than in the other regions.
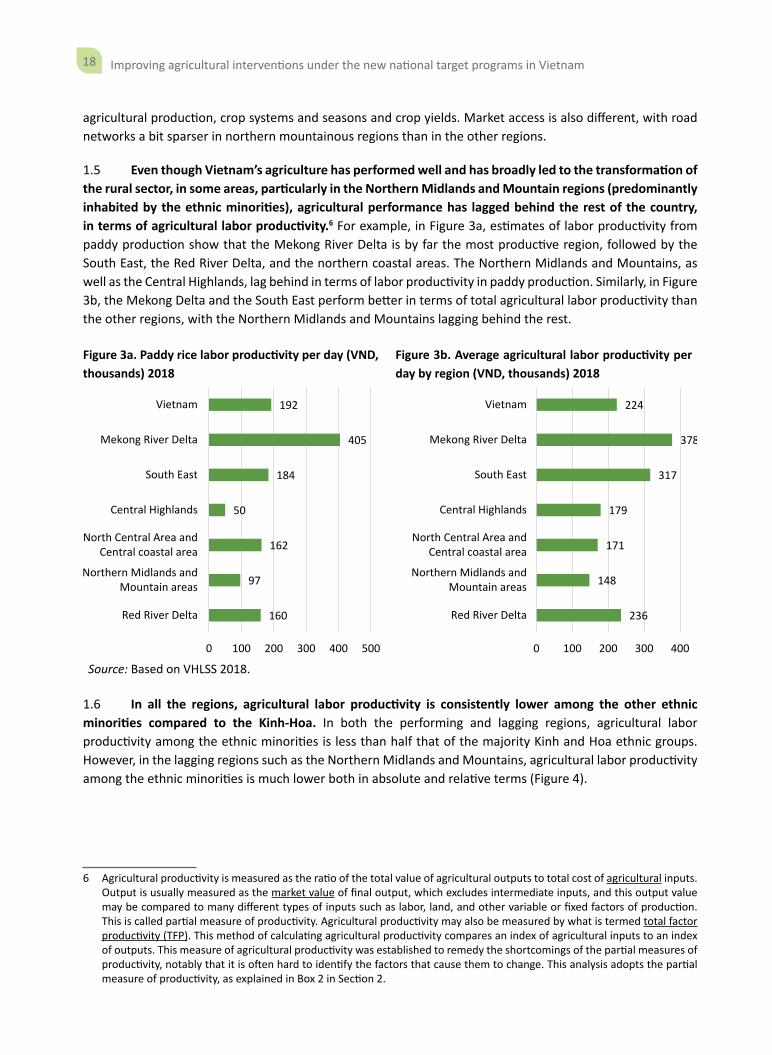
1.5 Even though Vietnam’s agriculture has performed well and has broadly led to the transformation of the rural sector, in some areas, particularly in the Northern Midlands and Mountain regions (predominantly inhabited by the ethnic minorities), agricultural performance has lagged behind the rest of the country, in terms of agricultural labor productivity.6 For example, in Figure 3a, estimates of labor productivity from paddy production show that the Mekong River Delta is by far the most productive region, followed by the South East, the Red River Delta, and the northern coastal areas. The Northern Midlands and Mountains, as well as the Central Highlands, lag behind in terms of labor productivity in paddy production. Similarly, in Figure 3b, the Mekong Delta and the South East perform better in terms of total agricultural labor productivity than the other regions, with the Northern Midlands and Mountains lagging behind the rest.
Figure 3a. Paddy rice labor productivity per day (VND, thousands) 2018
Figure 3b. Average agricultural labor productivity per day by region (VND, thousands) 2018
160
97
162
50
184
405
192
0 100 200 300 400 500
Red River Delta
Northern Midlands andMountain areas
North Central Area andCentral coastal area
Central Highlands
South East
Mekong River Delta
Vietnam
236
148
171
179
317
378
224
0 100 200 300 400
Red River Delta
Northern Midlands andMountain areas
North Central Area andCentral coastal area
Central Highlands
South East
Mekong River Delta
Vietnam
Source: Based on VHLSS 2018.
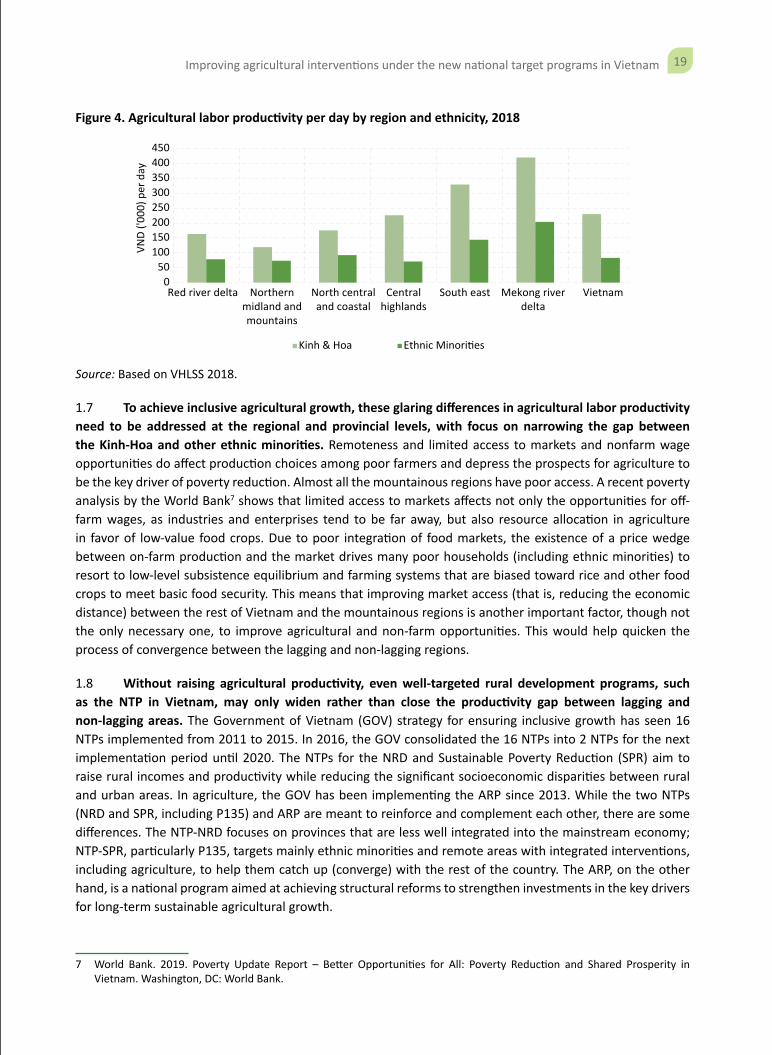
1.6 In all the regions, agricultural labor productivity is consistently lower among the other ethnic minorities compared to the Kinh-Hoa. In both the performing and lagging regions, agricultural labor productivity among the ethnic minorities is less than half that of the majority Kinh and Hoa ethnic groups. However, in the lagging regions such as the Northern Midlands and Mountains, agricultural labor productivity among the ethnic minorities is much lower both in absolute and relative terms (Figure 4).
6 Agricultural productivity is measured as the ratio of the total value of agricultural outputs to total cost of agricultural inputs. Output is usually measured as the market value of final output, which excludes intermediate inputs, and this output value may be compared to many different types of inputs such as labor, land, and other variable or fixed factors of production. This is called partial measure of productivity. Agricultural productivity may also be measured by what is termed total factor productivity (TFP). This method of calculating agricultural productivity compares an index of agricultural inputs to an index of outputs. This measure of agricultural productivity was established to remedy the shortcomings of the partial measures of productivity, notably that it is often hard to identify the factors that cause them to change. This analysis adopts the partial measure of productivity, as explained in Box 2 in Section 2.
19Improving agricultural interventions under the new national target programs in Vietnam
Figure 4. Agricultural labor productivity per day by region and ethnicity, 2018
Red river delta Northernmidland andmountains
North centraland coastal
Centralhighlands
South east Mekong riverdelta
Vietnam0
50100150200250300350400450
VND
('000
) per
day
Kinh & Hoa Ethnic Minori�es
Source: Based on VHLSS 2018.
1.7 To achieve inclusive agricultural growth, these glaring differences in agricultural labor productivity need to be addressed at the regional and provincial levels, with focus on narrowing the gap between the Kinh-Hoa and other ethnic minorities. Remoteness and limited access to markets and nonfarm wage opportunities do affect production choices among poor farmers and depress the prospects for agriculture to be the key driver of poverty reduction. Almost all the mountainous regions have poor access. A recent poverty analysis by the World Bank7 shows that limited access to markets affects not only the opportunities for off-farm wages, as industries and enterprises tend to be far away, but also resource allocation in agriculture in favor of low-value food crops. Due to poor integration of food markets, the existence of a price wedge between on-farm production and the market drives many poor households (including ethnic minorities) to resort to low-level subsistence equilibrium and farming systems that are biased toward rice and other food crops to meet basic food security. This means that improving market access (that is, reducing the economic distance) between the rest of Vietnam and the mountainous regions is another important factor, though not the only necessary one, to improve agricultural and non-farm opportunities. This would help quicken the process of convergence between the lagging and non-lagging regions.
1.8 Without raising agricultural productivity, even well-targeted rural development programs, such as the NTP in Vietnam, may only widen rather than close the productivity gap between lagging and non-lagging areas. The Government of Vietnam (GOV) strategy for ensuring inclusive growth has seen 16 NTPs implemented from 2011 to 2015. In 2016, the GOV consolidated the 16 NTPs into 2 NTPs for the next implementation period until 2020. The NTPs for the NRD and Sustainable Poverty Reduction (SPR) aim to raise rural incomes and productivity while reducing the significant socioeconomic disparities between rural and urban areas. In agriculture, the GOV has been implementing the ARP since 2013. While the two NTPs (NRD and SPR, including P135) and ARP are meant to reinforce and complement each other, there are some differences. The NTP-NRD focuses on provinces that are less well integrated into the mainstream economy; NTP-SPR, particularly P135, targets mainly ethnic minorities and remote areas with integrated interventions, including agriculture, to help them catch up (converge) with the rest of the country. The ARP, on the other hand, is a national program aimed at achieving structural reforms to strengthen investments in the key drivers for long-term sustainable agricultural growth.
7 World Bank. 2019. Poverty Update Report – Better Opportunities for All: Poverty Reduction and Shared Prosperity in Vietnam. Washington, DC: World Bank.
20 Improving agricultural interventions under the new national target programs in Vietnam
1.9 The results of the recent review of the ten-year implementation of the NTPs (NRD and SPR) show that they have led to significant improvements across the board. However, most of the poor living in the northern and central mountainous regions, particularly the extremely poor ethnic minorities, are still lagging compared to other regions (and non-ethnic groups).8 As the GOV is now considering developing NTPs for 2021–25 (Box 1), there is a need to explore how to improve the effectiveness and quality of interventions required to narrow the productivity gap between the lagging and non-lagging regions of the country. There is also a need to consolidate the evidence base on whether and how agriculture can be a significant determinant of poverty reduction in the lagging regions and among ethnic minorities, under what circumstances, and specific investment options with the potential to help achieve program objectives.
Box 1: The Proposed NTP on SEDEMA, 2021–2030
Following the Vietnam National Assembly Resolution on the new NTP to support ethnic minorities in the northern mountainous regions, CEMA has formulated the NTP on SEDEMA to be implemented over 2021–2030.
The objective of the program is to improve living standards of people in ethnic minority and mountainous areas, develop a livelihood model based on stable jobs, and ensure that the per capita income of ethnic minority people doubles in 2025 compared to per capita income at the end of 2020.
Some of the key program areas are to develop agricultural and forestry production, promote regional potential, and strengthen production in value chains. As part of this program, the key areas of investment will include (a) developing agricultural production (including agriculture, fishery and salt production), promoting regional potential and strengths to raise incomes and living standards and produce commodities in value chains; and (b) investing in and developing models of raising cattle and poultry along the value chain, planting areas of Ngoc Linh ginseng and precious medicinal herbs, promoting startups and entrepreneurship, and attracting investment in ethnic minority and mountainous areas. The key areas of support include (a) providing productive land to 90% of poor ethnic minority households living on agriculture, forestry, and fishery and (b) providing credit and other forms of public sector services.
The estimated total budget for the program implementation is VND 604,051.49 billion, of which VND 344,700.82 billion is for 2021–25 and VND 259,350.56 billion for 2026–2030. For the agriculture support program, the total budget required for 2021–2030 is VND 16,325 billion. For 2021–2025, the estimated budget for implementation is VND 4,175 billion, of which VND 1,500 billion is expected to be from domestic loans, and VND 1,350 billion is expected to be raised from the community, businesses, and international donors.
This analytical work’s recommendations are expected to inform the technical design and implementation planning for the agricultural elements of SEDEMA.
1.10 Through analysis of the agricultural labor productivity and the factors causing it, informed by analysis of pro-poor value chains, and the lessons and experiences drawn from other countries’ inclusive agricultural development programs, this report provides recommendations for improving the quality and relevance of agricultural interventions in the new NTPs, particularly focusing on the NTP for ethnic minorities and NRD. This analytical work is meant to help the GOV make informed decisions and/or adjustments required to improve agricultural interventions under the NTPs. The analysis draws mainly from VHLSS data for 2016 and 2018 to explore how to improve the design and implementation of agricultural interventions under the new NTPs, especially the NRD and the new NTP focusing on ethnic minority groups.9 The analysis also draws from
8 The results are based on the reports from the recent 10 Year Implementation Review of the NTP. 9 The new NTP focusing on ethnic minority groups is being designed by CEMA in coordination with other sectoral ministries
such as MARD. The new NTP on NRD is being designed by the NCO under MARD. Some of the preliminary sections of this report have been informally discussed with the NCO and other members of the design teams from MARD and CEMA. The final report of this work will also be presented to the NCO and CEMA as they are the key audience for this work. The findings and recommendations highlighted in this report are expected to inform the detailed technical designs and implementation plans of several subprograms under both the new NTP on ethnic minorities and the new NRD.
21Improving agricultural interventions under the new national target programs in Vietnam
a pro-poor value chain analysis as well as the lessons and experiences from other countries which have faced similar challenges, to manage the transition of agriculture in their lagging regions.
1.11 This report is arranged as follows: Section I presents a brief overview of Vietnam’s agricultural success story, as well the limitations in reaching out to the lagging regions. Section 2 focuses on a detailed analysis of Vietnamese agricultural performance from a regional perspective, concentrating on the gaps between regions, within regions, and between different ethnic groups. This section also discusses the key factors causing productivity gaps. It highlights areas needing attention to achieve some level of convergence over time. Section 3 explores how to narrow the productivity gaps by promoting strong market integration of the ethnic minorities based on the findings from the analysis of some of the pro-poor value chains, some of which are already prevalent among the ethnic minorities. Finally, section 4 draws key conclusions and highlights the recommendations to inform program design and implementation based on the analysis and the lessons and experiences from other countries which have implemented similar national poverty reduction programs. Section 4 also highlights the specific commodity-value chain issues, constraints, and recommendations.

22 Improving agricultural interventions under the new national target programs in Vietnam
Key issues/constraints Proposed interventions/recommendations
Value chain link
• Weak, limited, or nonexistent vertical and/or horizontal links among players in the value chain.
• Promote ethnic minority producer collaboration groups—formulation and capacity building.
• Support establishment and development of collaborative arrangements between all actors in the value chains.
• Support models that enhance links between actors, for example, traceability system, certified production and processing system, or information sharing platforms, e.g. well-planned study tours.
Sharing value created through the supply chains
• Unfair sharing of value, leading to non-contract compliance including side selling of commodities, with primary producers mostly being on the receiving end
• Unethical behavior among both suppliers and buyers
• Strengthen contract compliance and ethical behavior among primary producers and buyers and other value chain stakeholders, through establishment of mechanisms for legal contract enforcement and close monitoring.
23Improving agricultural interventions under the new national target programs in Vietnam
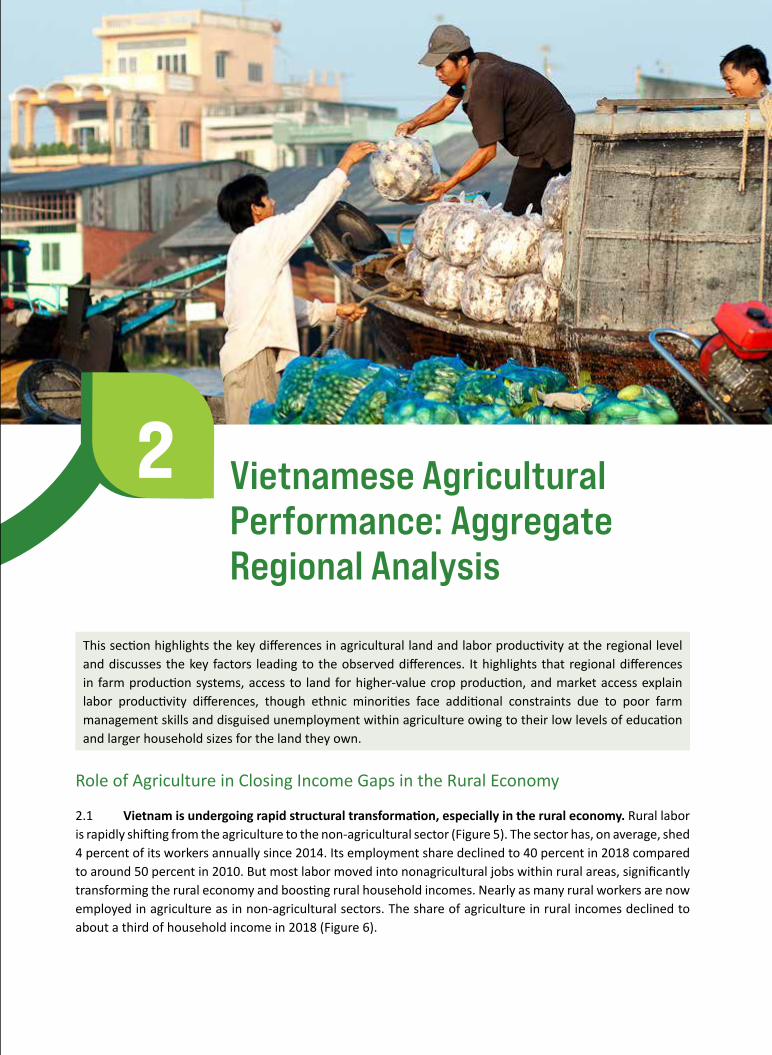
This section highlights the key differences in agricultural land and labor productivity at the regional level and discusses the key factors leading to the observed differences. It highlights that regional differences in farm production systems, access to land for higher-value crop production, and market access explain labor productivity differences, though ethnic minorities face additional constraints due to poor farm management skills and disguised unemployment within agriculture owing to their low levels of education and larger household sizes for the land they own.
Role of Agriculture in Closing Income Gaps in the Rural Economy
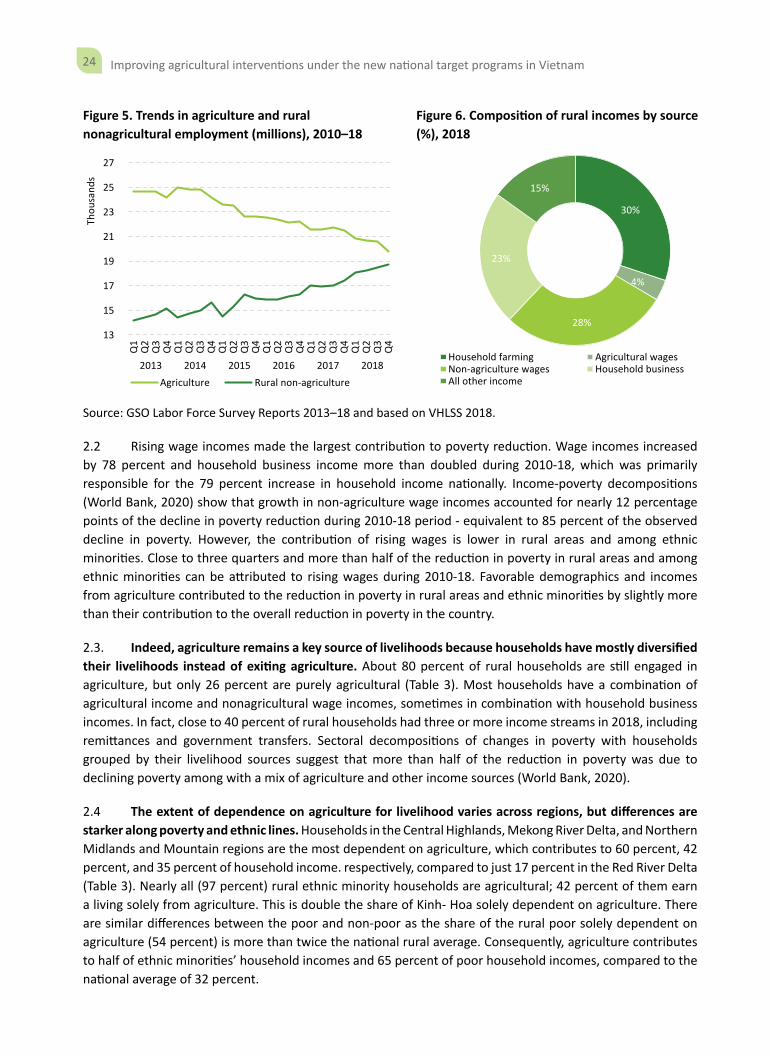
2.1 Vietnam is undergoing rapid structural transformation, especially in the rural economy. Rural labor is rapidly shifting from the agriculture to the non-agricultural sector (Figure 5). The sector has, on average, shed 4 percent of its workers annually since 2014. Its employment share declined to 40 percent in 2018 compared to around 50 percent in 2010. But most labor moved into nonagricultural jobs within rural areas, significantly transforming the rural economy and boosting rural household incomes. Nearly as many rural workers are now employed in agriculture as in non-agricultural sectors. The share of agriculture in rural incomes declined to about a third of household income in 2018 (Figure 6).
2 Vietnamese Agricultural Performance: Aggregate Regional Analysis
24 Improving agricultural interventions under the new national target programs in Vietnam
Figure 5. Trends in agriculture and rural nonagricultural employment (millions), 2010–18
Figure 6. Composition of rural incomes by source (%), 2018
13
15
17
19
21
23
25
27
Q1
Q2
Q3
Q4
Q1
Q2
Q3
Q4
Q1
Q2
Q3
Q4
Q1
Q2
Q3
Q4
Q1
Q2
Q3
Q4
Q1
Q2
Q3
Q4
2013 2014 2015 2016 2017 2018
Thou
sand
s
Agriculture Rural non-agriculture
30%
4%
28%
23%
15%
Household farming Agricultural wagesNon-agriculture wages Household businessAll other income
Source: GSO Labor Force Survey Reports 2013–18 and based on VHLSS 2018.
2.2 Rising wage incomes made the largest contribution to poverty reduction. Wage incomes increased by 78 percent and household business income more than doubled during 2010-18, which was primarily responsible for the 79 percent increase in household income nationally. Income-poverty decompositions (World Bank, 2020) show that growth in non-agriculture wage incomes accounted for nearly 12 percentage points of the decline in poverty reduction during 2010-18 period - equivalent to 85 percent of the observed decline in poverty. However, the contribution of rising wages is lower in rural areas and among ethnic minorities. Close to three quarters and more than half of the reduction in poverty in rural areas and among ethnic minorities can be attributed to rising wages during 2010-18. Favorable demographics and incomes from agriculture contributed to the reduction in poverty in rural areas and ethnic minorities by slightly more than their contribution to the overall reduction in poverty in the country.
2.3. Indeed, agriculture remains a key source of livelihoods because households have mostly diversified their livelihoods instead of exiting agriculture. About 80 percent of rural households are still engaged in agriculture, but only 26 percent are purely agricultural (Table 3). Most households have a combination of agricultural income and nonagricultural wage incomes, sometimes in combination with household business incomes. In fact, close to 40 percent of rural households had three or more income streams in 2018, including remittances and government transfers. Sectoral decompositions of changes in poverty with households grouped by their livelihood sources suggest that more than half of the reduction in poverty was due to declining poverty among with a mix of agriculture and other income sources (World Bank, 2020).
2.4 The extent of dependence on agriculture for livelihood varies across regions, but differences are starker along poverty and ethnic lines. Households in the Central Highlands, Mekong River Delta, and Northern Midlands and Mountain regions are the most dependent on agriculture, which contributes to 60 percent, 42 percent, and 35 percent of household income. respectively, compared to just 17 percent in the Red River Delta (Table 3). Nearly all (97 percent) rural ethnic minority households are agricultural; 42 percent of them earn a living solely from agriculture. This is double the share of Kinh- Hoa solely dependent on agriculture. There are similar differences between the poor and non-poor as the share of the rural poor solely dependent on agriculture (54 percent) is more than twice the national rural average. Consequently, agriculture contributes to half of ethnic minorities’ household incomes and 65 percent of poor household incomes, compared to the national average of 32 percent.
25Improving agricultural interventions under the new national target programs in Vietnam
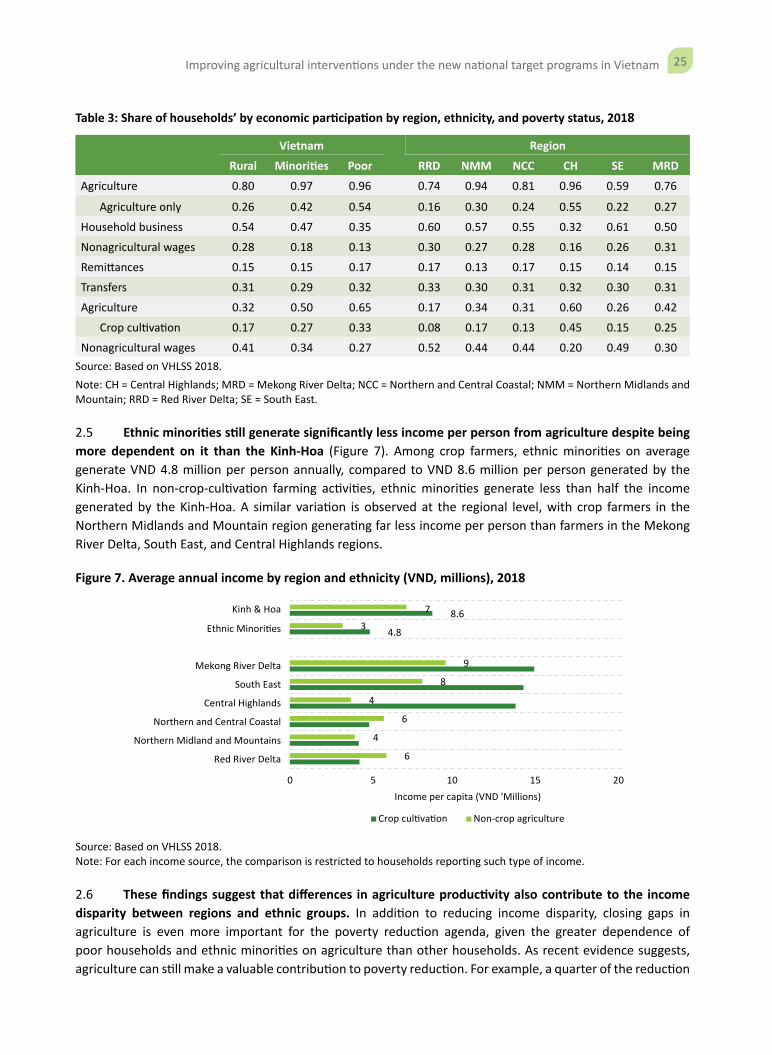
Table 3: Share of households’ by economic participation by region, ethnicity, and poverty status, 2018
Vietnam Region
Rural Minorities Poor RRD NMM NCC CH SE MRD
Agriculture 0.80 0.97 0.96 0.74 0.94 0.81 0.96 0.59 0.76
Agriculture only 0.26 0.42 0.54 0.16 0.30 0.24 0.55 0.22 0.27
Household business 0.54 0.47 0.35 0.60 0.57 0.55 0.32 0.61 0.50
Nonagricultural wages 0.28 0.18 0.13 0.30 0.27 0.28 0.16 0.26 0.31
Remittances 0.15 0.15 0.17 0.17 0.13 0.17 0.15 0.14 0.15
Transfers 0.31 0.29 0.32 0.33 0.30 0.31 0.32 0.30 0.31
Agriculture 0.32 0.50 0.65 0.17 0.34 0.31 0.60 0.26 0.42
Crop cultivation 0.17 0.27 0.33 0.08 0.17 0.13 0.45 0.15 0.25
Nonagricultural wages 0.41 0.34 0.27 0.52 0.44 0.44 0.20 0.49 0.30Source: Based on VHLSS 2018. Note: CH = Central Highlands; MRD = Mekong River Delta; NCC = Northern and Central Coastal; NMM = Northern Midlands and Mountain; RRD = Red River Delta; SE = South East.
2.5 Ethnic minorities still generate significantly less income per person from agriculture despite being more dependent on it than the Kinh-Hoa (Figure 7). Among crop farmers, ethnic minorities on average generate VND 4.8 million per person annually, compared to VND 8.6 million per person generated by the Kinh-Hoa. In non-crop-cultivation farming activities, ethnic minorities generate less than half the income generated by the Kinh-Hoa. A similar variation is observed at the regional level, with crop farmers in the Northern Midlands and Mountain region generating far less income per person than farmers in the Mekong River Delta, South East, and Central Highlands regions.
Figure 7. Average annual income by region and ethnicity (VND, millions), 2018
4.8
8.6
6
4
6
4
8
9
3
7
0 5 10 15 20Income per capita (VND 'Millions)
Kinh & Hoa
Ethnic Minori�es
Mekong River Delta
South East
Central Highlands
Northern and Central Coastal
Northern Midland and Mountains
Red River Delta
Non-crop agricultureCrop cul�va�on
Source: Based on VHLSS 2018. Note: For each income source, the comparison is restricted to households reporting such type of income.
2.6 These findings suggest that differences in agriculture productivity also contribute to the income disparity between regions and ethnic groups. In addition to reducing income disparity, closing gaps in agriculture is even more important for the poverty reduction agenda, given the greater dependence of poor households and ethnic minorities on agriculture than other households. As recent evidence suggests, agriculture can still make a valuable contribution to poverty reduction. For example, a quarter of the reduction
26 Improving agricultural interventions under the new national target programs in Vietnam
in poverty was due to declining poverty among purely agricultural households, while agriculture’s contribution to poverty reduction was found to be particularly pronounced among ethnic minorities (World Bank, 2020). Moreover, the labor market is increasingly fragmented, with less educated and older workers mostly remaining agriculture as they face limited off-farm opportunities (World Bank, 2019). That leaves boosting agriculture incomes as the most viable pathway out of poverty for a considerable share of the population. The analysis presented below unpacks the determinants of agriculture productivity, to better understand key challenges of increasing agriculture incomes among lagging groups in Vietnam.
Closing Agriculture Labor Productivity Gaps in Vietnam
2.7 Many researchers in agricultural development (for example, Christiansen, Demery, Kuhl 2011; Johnston and Mellor 1961; Mellor 1995; Timmer 1988) have shown that raising agricultural labor productivity can play multiple roles in wider development processes. Higher agricultural labor productivity raises agricultural workers’ budget surpluses after food expenditure and hence, increases their real incomes and stimulates demand for nonfood goods and services. At the same time, higher agricultural labor productivity releases agricultural labor from food production to production of other goods and services as fewer workers are needed to produce the food that society requires. Agricultural labor productivity growth in poor agrarian economies thus simultaneously raises productivity of poor people’s abundant and critical resources (agricultural labor and land), raises their real incomes, and stimulates both supply and demand of nonfood goods and services (Dorward 2013). This simultaneous creation of supply and demand is critical for structural transformation (Alexiadis 2005, Farole, Goga, and Ionescu-Heroiu). This trend is consistent with what drove structural transformation in Europe and most of the developed world, including emerging countries such as Brazil, China, and India in the early stages of their development process.
2.8 The analysis uses household level data from the 2018 VHLSS. Agricultural labor productivity is calculated as agricultural value added per workday, based on the value of agricultural commodities produced minus the value of intermediate inputs applied by the household in the production of agricultural commodities. The analysis identifies the differences in value added and average labor productivity across regions, commodities, landholding size, and farmers’ ethnic grouping. Furthermore, the analysis uses a multivariate regression analysis to identify the key factors affecting the labor productivity. Such factors include production factors (land, labor and inputs); yield shifters (irrigation, extension and machinery); crop production systems (that is, crop choices); farmers’ management skills and knowledge; household characteristics; and other control variables at the provincial level (share of urban population, agricultural enterprises, access to agricultural credit, and distance to markets for agricultural commodities) including regional dummies. Estimation of the agricultural value-added and agricultural labor and land productivity is summarized in Box 2. Detailed statistics of the variables used in the regression analysis are presented in Annex 2.
27Improving agricultural interventions under the new national target programs in Vietnam
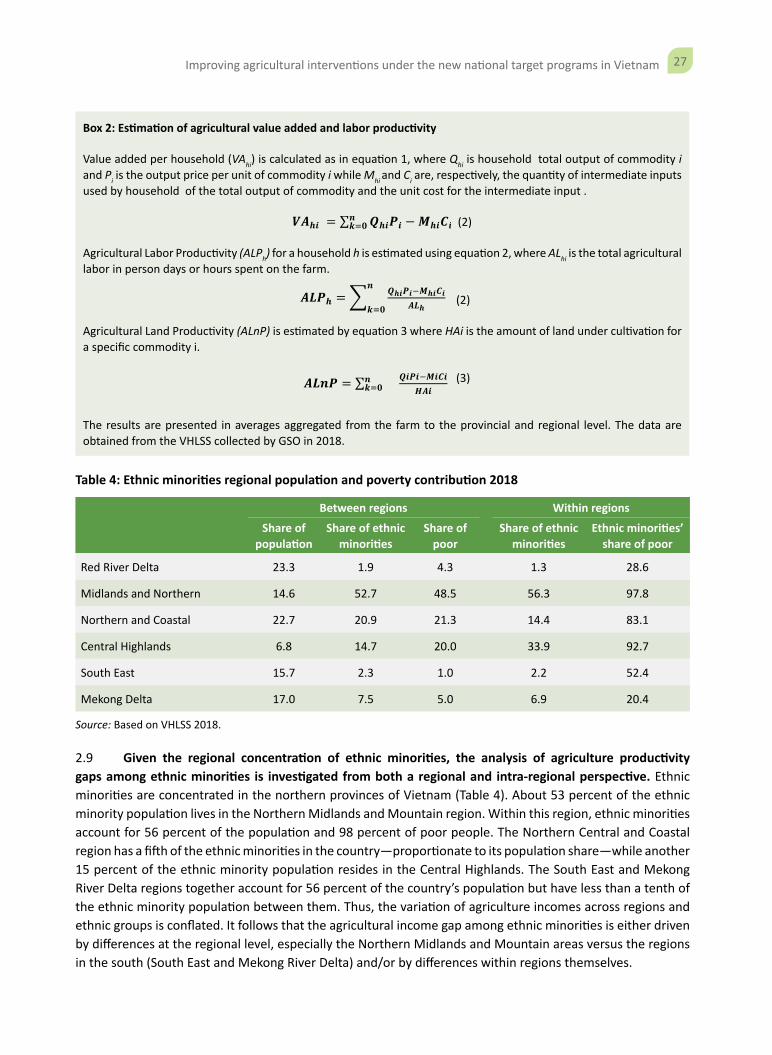
Box 2: Estimation of agricultural value added and labor productivity
Value added per household (VAhi) is calculated as in equation 1, where Qhi is household total output of commodity i and Pi is the output price per unit of commodity i while Mhi and Ci are, respectively, the quantity of intermediate inputs used by household of the total output of commodity and the unit cost for the intermediate input .
(2)
Agricultural Labor Productivity (ALPh) for a household h is estimated using equation 2, where ALhi is the total agricultural labor in person days or hours spent on the farm.
(2)
Agricultural Land Productivity (ALnP) is estimated by equation 3 where HAi is the amount of land under cultivation for a specific commodity i.
(3)
The results are presented in averages aggregated from the farm to the provincial and regional level. The data are obtained from the VHLSS collected by GSO in 2018.
Table 4: Ethnic minorities regional population and poverty contribution 2018
Between regions Within regions
Share of population
Share of ethnic minorities
Share of poor
Share of ethnic minorities
Ethnic minorities’ share of poor
Red River Delta 23.3 1.9 4.3 1.3 28.6
Midlands and Northern 14.6 52.7 48.5 56.3 97.8
Northern and Coastal 22.7 20.9 21.3 14.4 83.1
Central Highlands 6.8 14.7 20.0 33.9 92.7
South East 15.7 2.3 1.0 2.2 52.4
Mekong Delta 17.0 7.5 5.0 6.9 20.4
Source: Based on VHLSS 2018.
2.9 Given the regional concentration of ethnic minorities, the analysis of agriculture productivity gaps among ethnic minorities is investigated from both a regional and intra-regional perspective. Ethnic minorities are concentrated in the northern provinces of Vietnam (Table 4). About 53 percent of the ethnic minority population lives in the Northern Midlands and Mountain region. Within this region, ethnic minorities account for 56 percent of the population and 98 percent of poor people. The Northern Central and Coastal region has a fifth of the ethnic minorities in the country—proportionate to its population share—while another 15 percent of the ethnic minority population resides in the Central Highlands. The South East and Mekong River Delta regions together account for 56 percent of the country’s population but have less than a tenth of the ethnic minority population between them. Thus, the variation of agriculture incomes across regions and ethnic groups is conflated. It follows that the agricultural income gap among ethnic minorities is either driven by differences at the regional level, especially the Northern Midlands and Mountain areas versus the regions in the south (South East and Mekong River Delta) and/or by differences within regions themselves.
28 Improving agricultural interventions under the new national target programs in Vietnam
Regional Differences in Agricultural Productivity
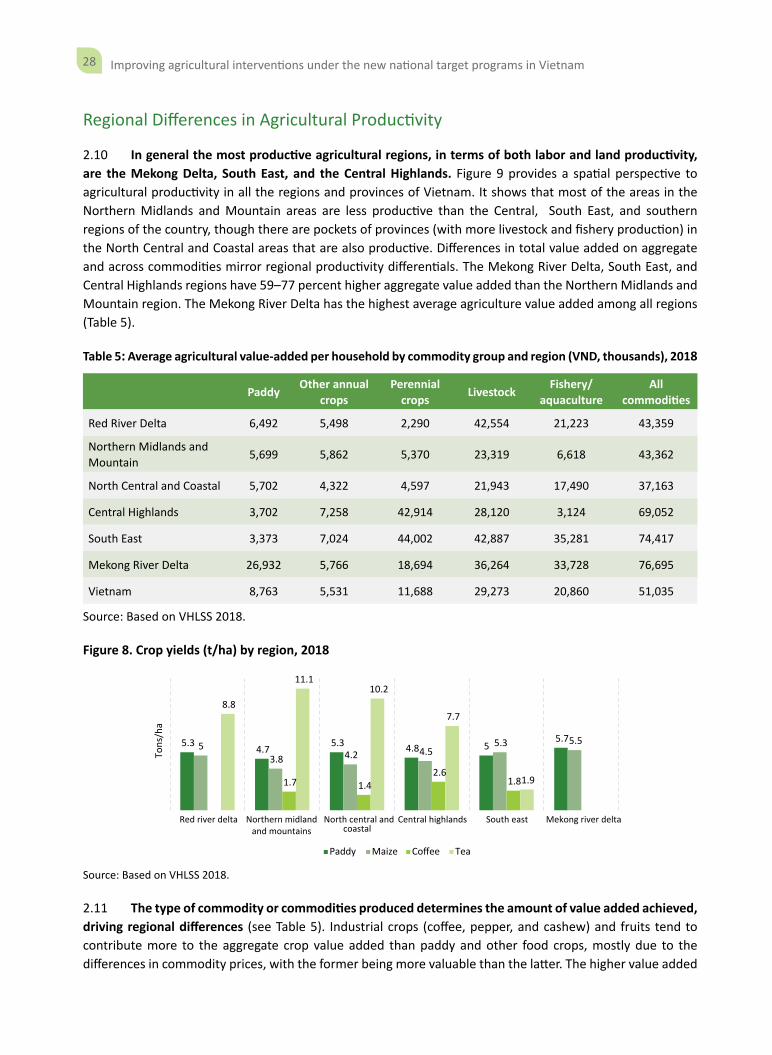
2.10 In general the most productive agricultural regions, in terms of both labor and land productivity, are the Mekong Delta, South East, and the Central Highlands. Figure 9 provides a spatial perspective to agricultural productivity in all the regions and provinces of Vietnam. It shows that most of the areas in the Northern Midlands and Mountain areas are less productive than the Central, South East, and southern regions of the country, though there are pockets of provinces (with more livestock and fishery production) in the North Central and Coastal areas that are also productive. Differences in total value added on aggregate and across commodities mirror regional productivity differentials. The Mekong River Delta, South East, and Central Highlands regions have 59–77 percent higher aggregate value added than the Northern Midlands and Mountain region. The Mekong River Delta has the highest average agriculture value added among all regions (Table 5).
Table 5: Average agricultural value-added per household by commodity group and region (VND, thousands), 2018
Paddy Other annual crops
Perennial crops Livestock Fishery/
aquacultureAll
commodities
Red River Delta 6,492 5,498 2,290 42,554 21,223 43,359
Northern Midlands and Mountain 5,699 5,862 5,370 23,319 6,618 43,362
North Central and Coastal 5,702 4,322 4,597 21,943 17,490 37,163
Central Highlands 3,702 7,258 42,914 28,120 3,124 69,052
South East 3,373 7,024 44,002 42,887 35,281 74,417
Mekong River Delta 26,932 5,766 18,694 36,264 33,728 76,695
Vietnam 8,763 5,531 11,688 29,273 20,860 51,035
Source: Based on VHLSS 2018.
Figure 8. Crop yields (t/ha) by region, 2018
5.3 4.7 5.3 4.8 55.7
53.8 4.2 4.5
5.3 5.5
1.7 1.42.6
1.8
8.8
11.110.2
7.7
1.9
Red river delta Northern midlandand mountains
North central andcoastal
Central highlands South east Mekong river delta
Tons
/ha
Paddy Maize Coffee Tea
Source: Based on VHLSS 2018.
2.11 The type of commodity or commodities produced determines the amount of value added achieved, driving regional differences (see Table 5). Industrial crops (coffee, pepper, and cashew) and fruits tend to contribute more to the aggregate crop value added than paddy and other food crops, mostly due to the differences in commodity prices, with the former being more valuable than the latter. The higher value added
29Improving agricultural interventions under the new national target programs in Vietnam
in the Central Highlands and the South East is largely due to the higher proportion of production of industrial crops, while for the Mekong River Delta, the higher aggregate value added is due to a combination of paddy, fruits, and aquaculture. Yields suggest that land suitability for commodities vary across the regions (Figure 8). Output per hectare for coffee is highest in Central Highlands. Tea yields are higher in the Northern Midlands and Mountain as well as the Northern and Central Coastal regions, while paddy and annual crop yields are generally higher in the Mekong River Delta, where tea and coffee are rarely produced.
2.12 However, prices or value of commodities and access to land also contribute to the observed differences in value added as well. The paddy yield differential across regions is much lower compared to the differences in value added. The paddy output is 5.7 tons per ha and 4.7 tons per ha, for the Mekong River Delta and Northern Midlands and Mountain regions, respectively (Figure 8), yet the average value added for paddy in the Mekong River Delta is seven times higher. A similar comparison can be made between the Northern Midlands and Mountain areas and South East region for coffee. This implies that, controlling for variety and quality, commodity prices or inputs costs and landholdings explain the greater part of the value-added differential than differences in yields across crop commodities.
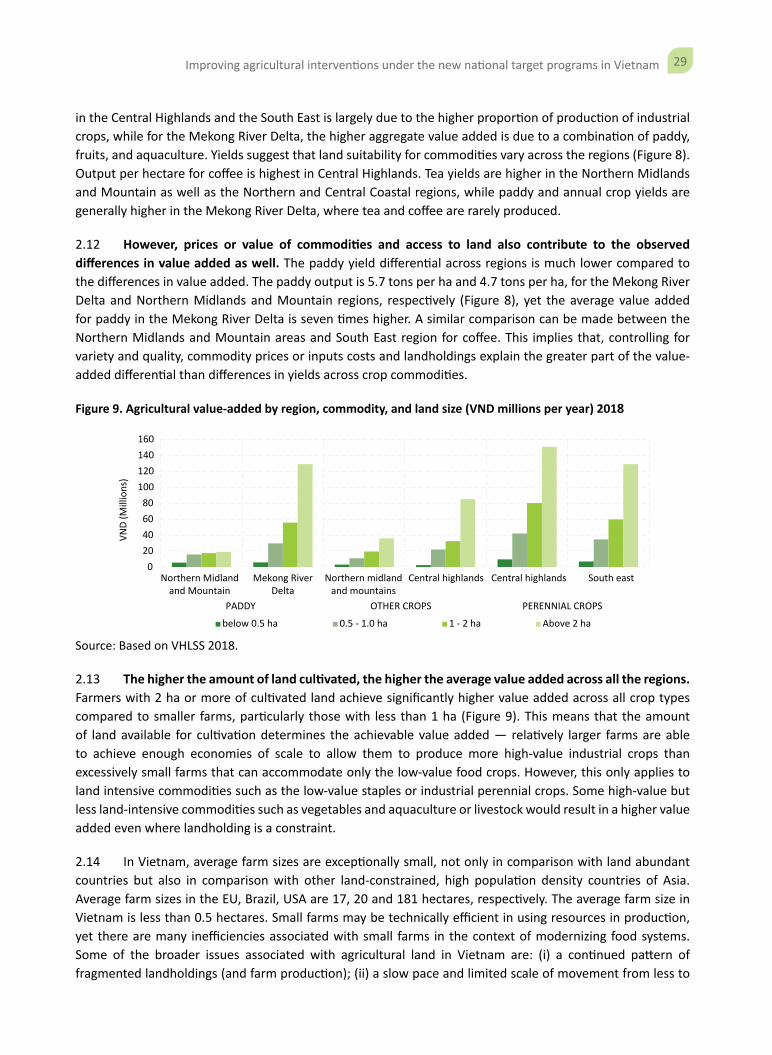
Figure 9. Agricultural value-added by region, commodity, and land size (VND millions per year) 2018
020406080
100120140160
Northern Midlandand Mountain
Mekong RiverDelta
Northern midlandand mountains
Central highlands Central highlands South east
PADDY OTHER CROPS PERENNIAL CROPS
VND
(Mill
ions
)
below 0.5 ha 0.5 - 1.0 ha 1 - 2 ha Above 2 ha
Source: Based on VHLSS 2018.
2.13 The higher the amount of land cultivated, the higher the average value added across all the regions. Farmers with 2 ha or more of cultivated land achieve significantly higher value added across all crop types compared to smaller farms, particularly those with less than 1 ha (Figure 9). This means that the amount of land available for cultivation determines the achievable value added — relatively larger farms are able to achieve enough economies of scale to allow them to produce more high-value industrial crops than excessively small farms that can accommodate only the low-value food crops. However, this only applies to land intensive commodities such as the low-value staples or industrial perennial crops. Some high-value but less land-intensive commodities such as vegetables and aquaculture or livestock would result in a higher value added even where landholding is a constraint.
2.14 In Vietnam, average farm sizes are exceptionally small, not only in comparison with land abundant countries but also in comparison with other land-constrained, high population density countries of Asia. Average farm sizes in the EU, Brazil, USA are 17, 20 and 181 hectares, respectively. The average farm size in Vietnam is less than 0.5 hectares. Small farms may be technically efficient in using resources in production, yet there are many inefficiencies associated with small farms in the context of modernizing food systems. Some of the broader issues associated with agricultural land in Vietnam are: (i) a continued pattern of fragmented landholdings (and farm production); (ii) a slow pace and limited scale of movement from less to
30 Improving agricultural interventions under the new national target programs in Vietnam
more efficient farmers (or investors) through agricultural rentals or sales; and (ii) much land is not allocated to the most profitable and productive uses (e.g., a large share of arable land is used for paddy production only). These conditions or patterns inhibit investment in agriculture, the pace of agricultural diversification and the realization of economies of scale in farm production and downstream value chain operations.
2.15 The challenges related to land size and tenure are likely to be more complex among the ethnic minorities in the northern mountainous regions. These challenges arise from rugged topography and variable quality of arable land, as well as the significant amount of forest land which is under Government conservation. The Vietnamese Government has implemented a lot of strategies to improve access to land and tenure security among EMs through a number of Decisions and Decrees.10 For example, by 2018, the forest area allocated to EM communities was over 805,000 ha (about 71.4 percent of the total forest land allocated to the community nationwide); the area allocated for land use had reached 345,700 (about 42.9 percent of the total area allocated to EM people).11 While this has improved the management of forests by reducing illegal logging and unsustainable forest exploitation on a large scale, there is still need for specific legislation to recognize EM customary land rights, protect land owned by EMs from other development pressures from within and outside their communities, as has happened in other countries such as the Phillipines.12
Factors Explaining the Differences in Agricultural Productivity across Regions
2.16 The determinants of regional variation in agriculture productivity are varied, including farm systems, landholdings, prices, and yield shifters. Multivariate regression analysis reveals which of these are strongly related to agricultural productivity. The analysis is performed both on aggregate labor productivity combining crop cultivation and aquaculture and on labor productivity for crop cultivation only, since some of the factors are more specific to crop cultivation.
2.17 Labor productivity is highest among industrial or perennial crop-based and aquaculture-based farm systems. Compared with annual crop-based farm systems, labor productivity is 74 percent higher among aquaculture-based farm systems and 57 percent higher for household industrial or perennial crop-based farm systems. Other than in the Mekong River Delta, there are small, often negligible, differences between paddy and other annual crop farm systems. In the Northern Midlands and Mountain region, labor productivity is between 43 percent and 47 percent higher among households with forestry, perennial or industrial crop, and aquaculture-based systems. However, only perennial or industrial crop-based farm systems have higher labor productivity than annual crop-based production systems. Thus, while labor productivity is high in paddy-based farm systems in the Mekong River Delta, everywhere else, productivity is higher in industrial or perennial crops-based or aquaculture-based farm systems.
10 For example, Decree No. 45/2014/ND-CP which stipulated for exemption and reduction of land user fees and land rents in order to maximize access to land, particularly among those who would be deterred by high fees and rents, including most of the EMs.
11 According to CEMA, 2018.12 Philippines Indigenous Peoples Rights Act (1997).
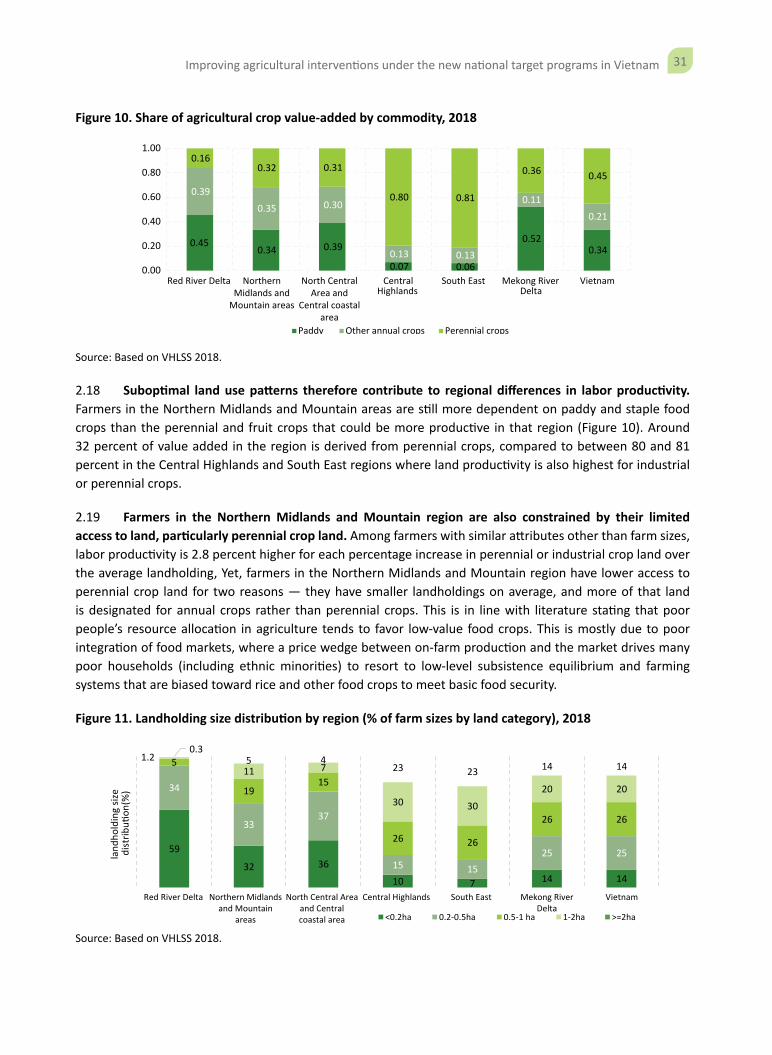
31Improving agricultural interventions under the new national target programs in Vietnam
Figure 10. Share of agricultural crop value-added by commodity, 2018
0.450.34 0.39
0.07 0.06
0.520.34
0.39
0.35 0.30
0.13 0.13
0.110.21
0.160.32 0.31
0.80 0.81
0.36 0.45
0.00
0.20
0.40
0.60
0.80
1.00
Red River Delta NorthernMidlands and
Mountain areas
North CentralArea and
Central coastalarea
CentralHighlands
South East Mekong RiverDelta
Vietnam
Paddy Other annual crops Perennial crops
Source: Based on VHLSS 2018.
2.18 Suboptimal land use patterns therefore contribute to regional differences in labor productivity. Farmers in the Northern Midlands and Mountain areas are still more dependent on paddy and staple food crops than the perennial and fruit crops that could be more productive in that region (Figure 10). Around 32 percent of value added in the region is derived from perennial crops, compared to between 80 and 81 percent in the Central Highlands and South East regions where land productivity is also highest for industrial or perennial crops.
2.19 Farmers in the Northern Midlands and Mountain region are also constrained by their limited access to land, particularly perennial crop land. Among farmers with similar attributes other than farm sizes, labor productivity is 2.8 percent higher for each percentage increase in perennial or industrial crop land over the average landholding, Yet, farmers in the Northern Midlands and Mountain region have lower access to perennial crop land for two reasons — they have smaller landholdings on average, and more of that land is designated for annual crops rather than perennial crops. This is in line with literature stating that poor people’s resource allocation in agriculture tends to favor low-value food crops. This is mostly due to poor integration of food markets, where a price wedge between on-farm production and the market drives many poor households (including ethnic minorities) to resort to low-level subsistence equilibrium and farming systems that are biased toward rice and other food crops to meet basic food security.
Figure 11. Landholding size distribution by region (% of farm sizes by land category), 2018
59
32 36
10 7 14 14
34
3337
15 1525 25
5
1915
26 26
26 26
1.211 7
30 30
20 20
0.35 4
23 23 14 14
Red River Delta Northern Midlandsand Mountain
areas
North Central Areaand Centralcoastal area
Central Highlands South East Mekong RiverDelta
Vietnam
land
hold
ing
size
distrib
u�on
(%)
<0.2ha 0.2-0.5ha 0.5-1 ha 1-2ha >=2ha
Source: Based on VHLSS 2018.
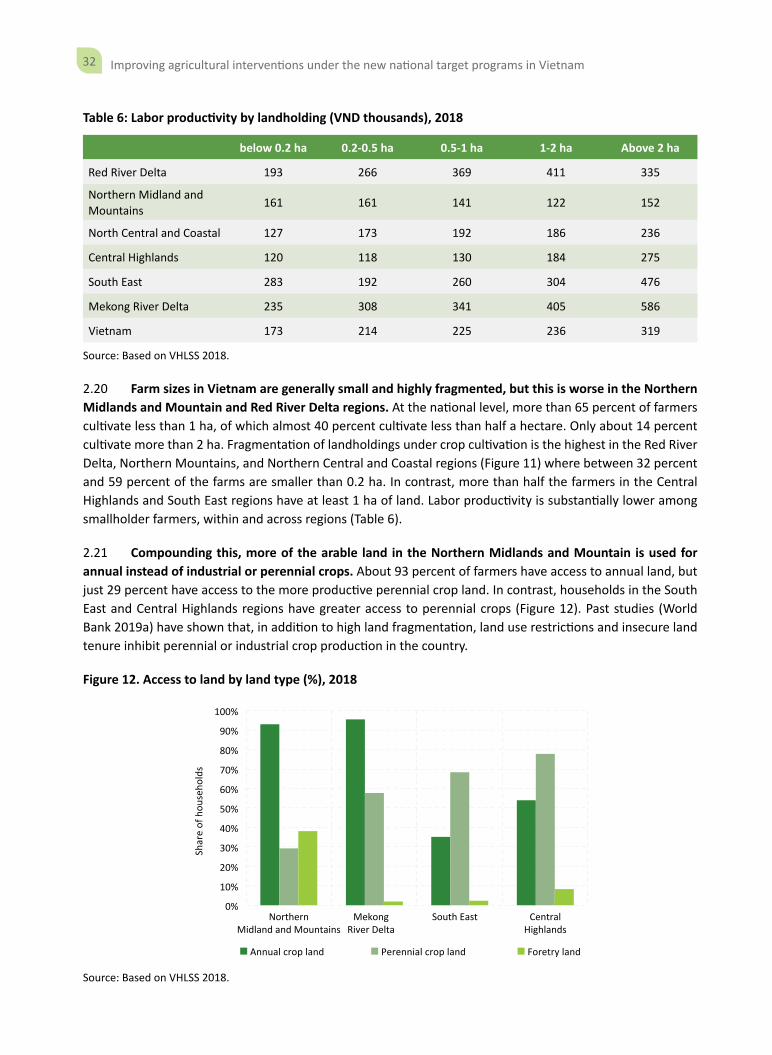
32 Improving agricultural interventions under the new national target programs in Vietnam
Table 6: Labor productivity by landholding (VND thousands), 2018
below 0.2 ha 0.2-0.5 ha 0.5-1 ha 1-2 ha Above 2 ha
Red River Delta 193 266 369 411 335
Northern Midland and Mountains
161 161 141 122 152
North Central and Coastal 127 173 192 186 236
Central Highlands 120 118 130 184 275
South East 283 192 260 304 476
Mekong River Delta 235 308 341 405 586
Vietnam 173 214 225 236 319
Source: Based on VHLSS 2018.
2.20 Farm sizes in Vietnam are generally small and highly fragmented, but this is worse in the Northern Midlands and Mountain and Red River Delta regions. At the national level, more than 65 percent of farmers cultivate less than 1 ha, of which almost 40 percent cultivate less than half a hectare. Only about 14 percent cultivate more than 2 ha. Fragmentation of landholdings under crop cultivation is the highest in the Red River Delta, Northern Mountains, and Northern Central and Coastal regions (Figure 11) where between 32 percent and 59 percent of the farms are smaller than 0.2 ha. In contrast, more than half the farmers in the Central Highlands and South East regions have at least 1 ha of land. Labor productivity is substantially lower among smallholder farmers, within and across regions (Table 6).
2.21 Compounding this, more of the arable land in the Northern Midlands and Mountain is used for annual instead of industrial or perennial crops. About 93 percent of farmers have access to annual land, but just 29 percent have access to the more productive perennial crop land. In contrast, households in the South East and Central Highlands regions have greater access to perennial crops (Figure 12). Past studies (World Bank 2019a) have shown that, in addition to high land fragmentation, land use restrictions and insecure land tenure inhibit perennial or industrial crop production in the country.
Figure 12. Access to land by land type (%), 2018
0%
10%
20%
30%
40%
50%
60%
70%
80%
90%
100%
NorthernMidland and Mountains
MekongRiver Delta
South East CentralHighlands
Shar
e of
hou
seho
lds
Annual crop land Perennial crop land Foretry land
Source: Based on VHLSS 2018.
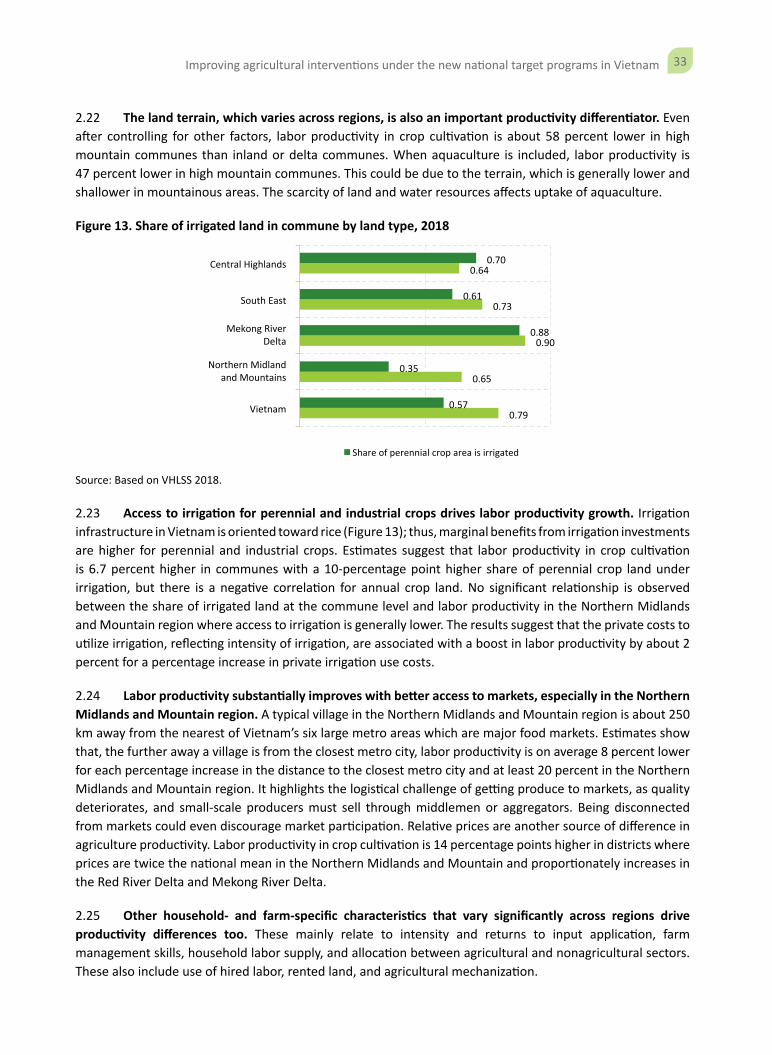
33Improving agricultural interventions under the new national target programs in Vietnam
2.22 The land terrain, which varies across regions, is also an important productivity differentiator. Even after controlling for other factors, labor productivity in crop cultivation is about 58 percent lower in high mountain communes than inland or delta communes. When aquaculture is included, labor productivity is 47 percent lower in high mountain communes. This could be due to the terrain, which is generally lower and shallower in mountainous areas. The scarcity of land and water resources affects uptake of aquaculture.
Figure 13. Share of irrigated land in commune by land type, 2018
0.79
0.65
0.90
0.73
0.64
0.57
0.35
0.88
0.61
0.70
Vietnam
Northern Midlandand Mountains
Mekong RiverDelta
South East
Central Highlands
Share of perennial crop area is irrigated
Source: Based on VHLSS 2018.
2.23 Access to irrigation for perennial and industrial crops drives labor productivity growth. Irrigation infrastructure in Vietnam is oriented toward rice (Figure 13); thus, marginal benefits from irrigation investments are higher for perennial and industrial crops. Estimates suggest that labor productivity in crop cultivation is 6.7 percent higher in communes with a 10-percentage point higher share of perennial crop land under irrigation, but there is a negative correlation for annual crop land. No significant relationship is observed between the share of irrigated land at the commune level and labor productivity in the Northern Midlands and Mountain region where access to irrigation is generally lower. The results suggest that the private costs to utilize irrigation, reflecting intensity of irrigation, are associated with a boost in labor productivity by about 2 percent for a percentage increase in private irrigation use costs.
2.24 Labor productivity substantially improves with better access to markets, especially in the Northern Midlands and Mountain region. A typical village in the Northern Midlands and Mountain region is about 250 km away from the nearest of Vietnam’s six large metro areas which are major food markets. Estimates show that, the further away a village is from the closest metro city, labor productivity is on average 8 percent lower for each percentage increase in the distance to the closest metro city and at least 20 percent in the Northern Midlands and Mountain region. It highlights the logistical challenge of getting produce to markets, as quality deteriorates, and small-scale producers must sell through middlemen or aggregators. Being disconnected from markets could even discourage market participation. Relative prices are another source of difference in agriculture productivity. Labor productivity in crop cultivation is 14 percentage points higher in districts where prices are twice the national mean in the Northern Midlands and Mountain and proportionately increases in the Red River Delta and Mekong River Delta.
2.25 Other household- and farm-specific characteristics that vary significantly across regions drive productivity differences too. These mainly relate to intensity and returns to input application, farm management skills, household labor supply, and allocation between agricultural and nonagricultural sectors. These also include use of hired labor, rented land, and agricultural mechanization.
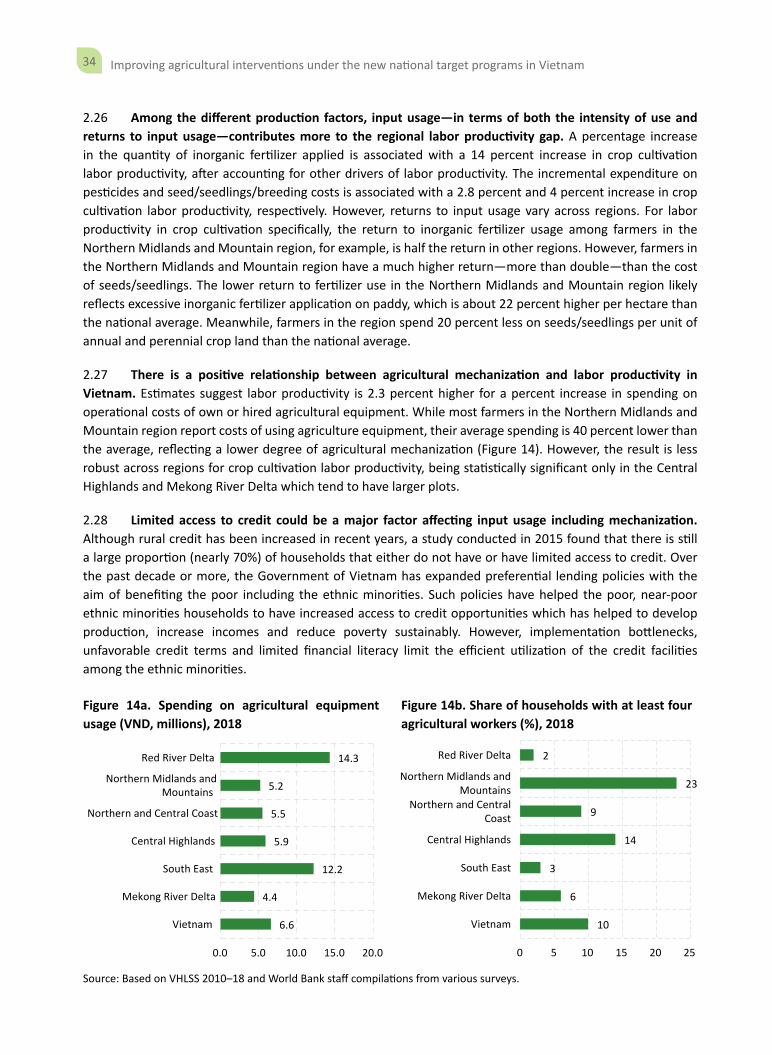
34 Improving agricultural interventions under the new national target programs in Vietnam
2.26 Among the different production factors, input usage—in terms of both the intensity of use and returns to input usage—contributes more to the regional labor productivity gap. A percentage increase in the quantity of inorganic fertilizer applied is associated with a 14 percent increase in crop cultivation labor productivity, after accounting for other drivers of labor productivity. The incremental expenditure on pesticides and seed/seedlings/breeding costs is associated with a 2.8 percent and 4 percent increase in crop cultivation labor productivity, respectively. However, returns to input usage vary across regions. For labor productivity in crop cultivation specifically, the return to inorganic fertilizer usage among farmers in the Northern Midlands and Mountain region, for example, is half the return in other regions. However, farmers in the Northern Midlands and Mountain region have a much higher return—more than double—than the cost of seeds/seedlings. The lower return to fertilizer use in the Northern Midlands and Mountain region likely reflects excessive inorganic fertilizer application on paddy, which is about 22 percent higher per hectare than the national average. Meanwhile, farmers in the region spend 20 percent less on seeds/seedlings per unit of annual and perennial crop land than the national average.
2.27 There is a positive relationship between agricultural mechanization and labor productivity in Vietnam. Estimates suggest labor productivity is 2.3 percent higher for a percent increase in spending on operational costs of own or hired agricultural equipment. While most farmers in the Northern Midlands and Mountain region report costs of using agriculture equipment, their average spending is 40 percent lower than the average, reflecting a lower degree of agricultural mechanization (Figure 14). However, the result is less robust across regions for crop cultivation labor productivity, being statistically significant only in the Central Highlands and Mekong River Delta which tend to have larger plots.
2.28 Limited access to credit could be a major factor affecting input usage including mechanization. Although rural credit has been increased in recent years, a study conducted in 2015 found that there is still a large proportion (nearly 70%) of households that either do not have or have limited access to credit. Over the past decade or more, the Government of Vietnam has expanded preferential lending policies with the aim of benefiting the poor including the ethnic minorities. Such policies have helped the poor, near-poor ethnic minorities households to have increased access to credit opportunities which has helped to develop production, increase incomes and reduce poverty sustainably. However, implementation bottlenecks, unfavorable credit terms and limited financial literacy limit the efficient utilization of the credit facilities among the ethnic minorities.
Figure 14a. Spending on agricultural equipment usage (VND, millions), 2018
Figure 14b. Share of households with at least four agricultural workers (%), 2018
6.6
4.4
12.2
5.9
5.5
5.2
14.3
0.0 5.0 10.0 15.0 20.0
Vietnam
Mekong River Delta
South East
Central Highlands
Northern and Central Coast
Northern Midlands andMountains
Red River Delta
10
6
3
14
9
23
2
0 5 10 15 20 25
Vietnam
Mekong River Delta
South East
Central Highlands
Northern and CentralCoast
Northern Midlands andMountains
Red River Delta
Source: Based on VHLSS 2010–18 and World Bank staff compilations from various surveys.
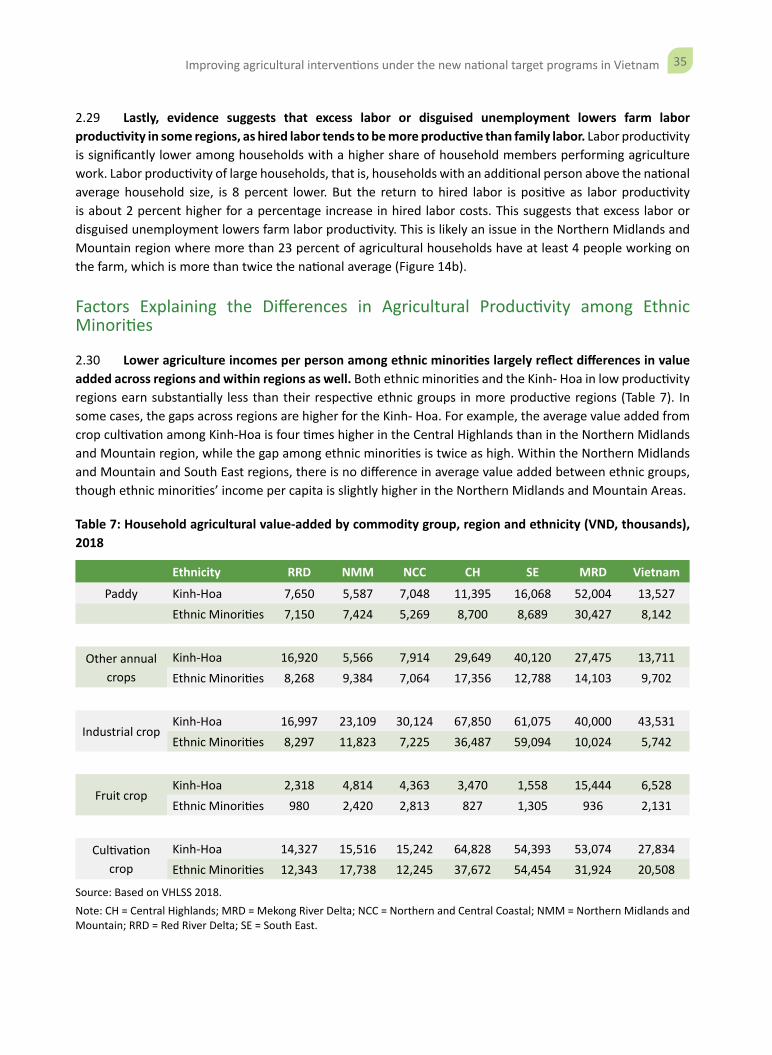
35Improving agricultural interventions under the new national target programs in Vietnam
2.29 Lastly, evidence suggests that excess labor or disguised unemployment lowers farm labor productivity in some regions, as hired labor tends to be more productive than family labor. Labor productivity is significantly lower among households with a higher share of household members performing agriculture work. Labor productivity of large households, that is, households with an additional person above the national average household size, is 8 percent lower. But the return to hired labor is positive as labor productivity is about 2 percent higher for a percentage increase in hired labor costs. This suggests that excess labor or disguised unemployment lowers farm labor productivity. This is likely an issue in the Northern Midlands and Mountain region where more than 23 percent of agricultural households have at least 4 people working on the farm, which is more than twice the national average (Figure 14b).
Factors Explaining the Differences in Agricultural Productivity among Ethnic Minorities
2.30 Lower agriculture incomes per person among ethnic minorities largely reflect differences in value added across regions and within regions as well. Both ethnic minorities and the Kinh- Hoa in low productivity regions earn substantially less than their respective ethnic groups in more productive regions (Table 7). In some cases, the gaps across regions are higher for the Kinh- Hoa. For example, the average value added from crop cultivation among Kinh-Hoa is four times higher in the Central Highlands than in the Northern Midlands and Mountain region, while the gap among ethnic minorities is twice as high. Within the Northern Midlands and Mountain and South East regions, there is no difference in average value added between ethnic groups, though ethnic minorities’ income per capita is slightly higher in the Northern Midlands and Mountain Areas.
Table 7: Household agricultural value-added by commodity group, region and ethnicity (VND, thousands), 2018
Ethnicity RRD NMM NCC CH SE MRD Vietnam
Paddy Kinh-Hoa 7,650 5,587 7,048 11,395 16,068 52,004 13,527Ethnic Minorities 7,150 7,424 5,269 8,700 8,689 30,427 8,142
Other annual crops
Kinh-Hoa 16,920 5,566 7,914 29,649 40,120 27,475 13,711Ethnic Minorities 8,268 9,384 7,064 17,356 12,788 14,103 9,702
Industrial cropKinh-Hoa 16,997 23,109 30,124 67,850 61,075 40,000 43,531Ethnic Minorities 8,297 11,823 7,225 36,487 59,094 10,024 5,742
Fruit cropKinh-Hoa 2,318 4,814 4,363 3,470 1,558 15,444 6,528Ethnic Minorities 980 2,420 2,813 827 1,305 936 2,131
Cultivation crop
Kinh-Hoa 14,327 15,516 15,242 64,828 54,393 53,074 27,834Ethnic Minorities 12,343 17,738 12,245 37,672 54,454 31,924 20,508
Source: Based on VHLSS 2018. Note: CH = Central Highlands; MRD = Mekong River Delta; NCC = Northern and Central Coastal; NMM = Northern Midlands and Mountain; RRD = Red River Delta; SE = South East.
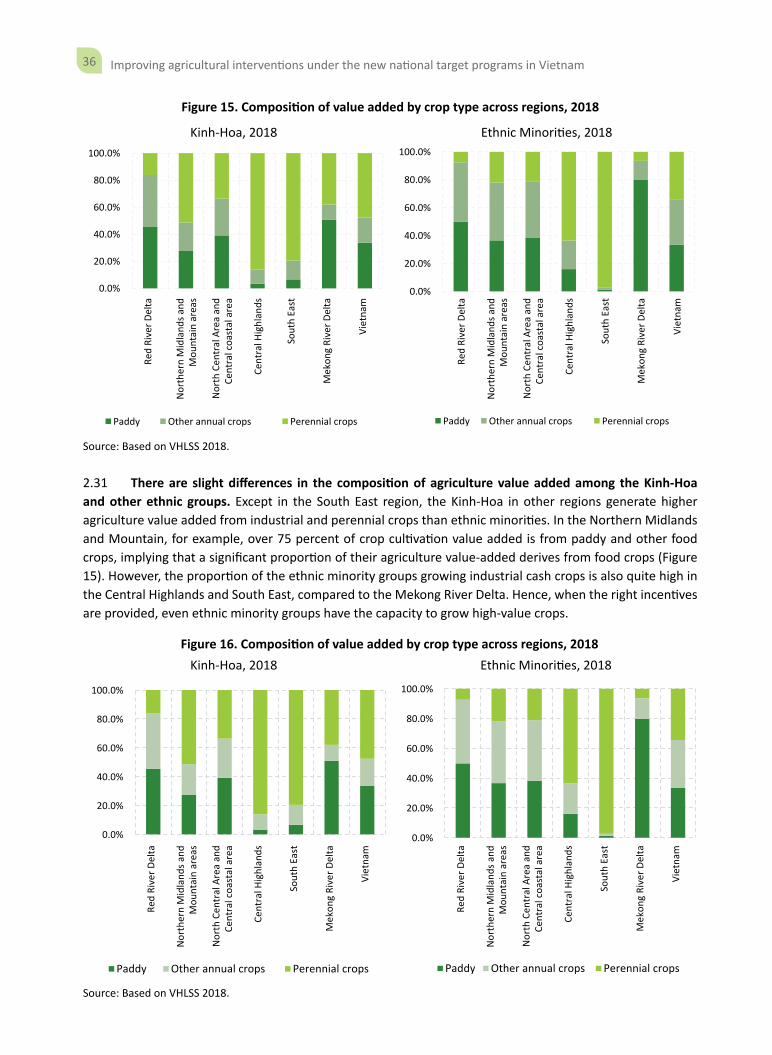
36 Improving agricultural interventions under the new national target programs in Vietnam
Figure 15. Composition of value added by crop type across regions, 2018
Kinh-Hoa, 2018 Ethnic Minorities, 2018
0.0%
20.0%
40.0%
60.0%
80.0%
100.0%Re
d Ri
ver D
elta
Nor
ther
n M
idla
nds a
ndM
ount
ain
area
s
Nor
th C
entr
al A
rea
and
Cent
ral c
oast
al a
rea
Cent
ral H
ighl
ands
Sout
h Ea
st
Mek
ong
Rive
r Del
ta
Viet
nam
Paddy Other annual crops Perennial crops
0.0%
20.0%
40.0%
60.0%
80.0%
100.0%
Red
Rive
r Del
ta
Nor
ther
n M
idla
nds a
ndM
ount
ain
area
s
Nor
th C
entr
al A
rea
and
Cent
ral c
oast
al a
rea
Cent
ral H
ighl
ands
Sout
h Ea
st
Mek
ong
Rive
r Del
ta
Viet
nam
Paddy Other annual crops Perennial crops
Source: Based on VHLSS 2018.
2.31 There are slight differences in the composition of agriculture value added among the Kinh-Hoa and other ethnic groups. Except in the South East region, the Kinh-Hoa in other regions generate higher agriculture value added from industrial and perennial crops than ethnic minorities. In the Northern Midlands and Mountain, for example, over 75 percent of crop cultivation value added is from paddy and other food crops, implying that a significant proportion of their agriculture value-added derives from food crops (Figure 15). However, the proportion of the ethnic minority groups growing industrial cash crops is also quite high in the Central Highlands and South East, compared to the Mekong River Delta. Hence, when the right incentives are provided, even ethnic minority groups have the capacity to grow high-value crops.
Figure 16. Composition of value added by crop type across regions, 2018Kinh-Hoa, 2018 Ethnic Minorities, 2018
0.0%
20.0%
40.0%
60.0%
80.0%
100.0%
Red
Rive
r Del
ta
Nor
ther
n M
idla
nds a
ndM
ount
ain
area
s
Nor
th C
entr
al A
rea
and
Cent
ral c
oast
al a
rea
Cent
ral H
ighl
ands
Sout
h Ea
st
Mek
ong
Rive
r Del
ta
Viet
nam
Paddy Other annual crops Perennial crops
0.0%
20.0%
40.0%
60.0%
80.0%
100.0%
Red
Rive
r Del
ta
Nor
ther
n M
idla
nds a
ndM
ount
ain
area
s
Nor
th C
entr
al A
rea
and
Cent
ral c
oast
al a
rea
Cent
ral H
ighl
ands
Sout
h Ea
st
Mek
ong
Rive
r Del
ta
Viet
nam
Paddy Other annual crops Perennial crops
Source: Based on VHLSS 2018.
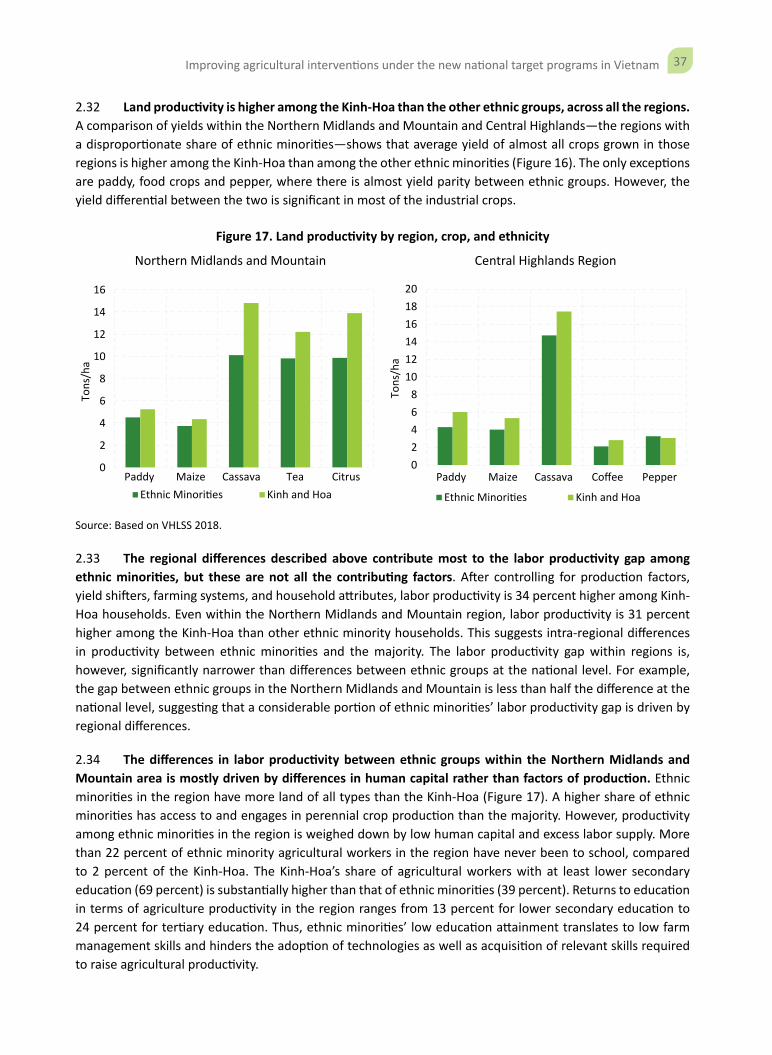
37Improving agricultural interventions under the new national target programs in Vietnam
2.32 Land productivity is higher among the Kinh-Hoa than the other ethnic groups, across all the regions. A comparison of yields within the Northern Midlands and Mountain and Central Highlands—the regions with a disproportionate share of ethnic minorities—shows that average yield of almost all crops grown in those regions is higher among the Kinh-Hoa than among the other ethnic minorities (Figure 16). The only exceptions are paddy, food crops and pepper, where there is almost yield parity between ethnic groups. However, the yield differential between the two is significant in most of the industrial crops.
Figure 17. Land productivity by region, crop, and ethnicity
Northern Midlands and Mountain Central Highlands Region
0
2
4
6
8
10
12
14
16
Paddy Maize Cassava Tea Citrus
Tons
/ha
Ethnic Minori�es Kinh and Hoa
02468
101214161820
Paddy Maize Cassava Coffee Pepper
Tons
/ha
Ethnic Minori�es Kinh and Hoa
Source: Based on VHLSS 2018.
2.33 The regional differences described above contribute most to the labor productivity gap among ethnic minorities, but these are not all the contributing factors. After controlling for production factors, yield shifters, farming systems, and household attributes, labor productivity is 34 percent higher among Kinh-Hoa households. Even within the Northern Midlands and Mountain region, labor productivity is 31 percent higher among the Kinh-Hoa than other ethnic minority households. This suggests intra-regional differences in productivity between ethnic minorities and the majority. The labor productivity gap within regions is, however, significantly narrower than differences between ethnic groups at the national level. For example, the gap between ethnic groups in the Northern Midlands and Mountain is less than half the difference at the national level, suggesting that a considerable portion of ethnic minorities’ labor productivity gap is driven by regional differences.
2.34 The differences in labor productivity between ethnic groups within the Northern Midlands and Mountain area is mostly driven by differences in human capital rather than factors of production. Ethnic minorities in the region have more land of all types than the Kinh-Hoa (Figure 17). A higher share of ethnic minorities has access to and engages in perennial crop production than the majority. However, productivity among ethnic minorities in the region is weighed down by low human capital and excess labor supply. More than 22 percent of ethnic minority agricultural workers in the region have never been to school, compared to 2 percent of the Kinh-Hoa. The Kinh-Hoa’s share of agricultural workers with at least lower secondary education (69 percent) is substantially higher than that of ethnic minorities (39 percent). Returns to education in terms of agriculture productivity in the region ranges from 13 percent for lower secondary education to 24 percent for tertiary education. Thus, ethnic minorities’ low education attainment translates to low farm management skills and hinders the adoption of technologies as well as acquisition of relevant skills required to raise agricultural productivity.
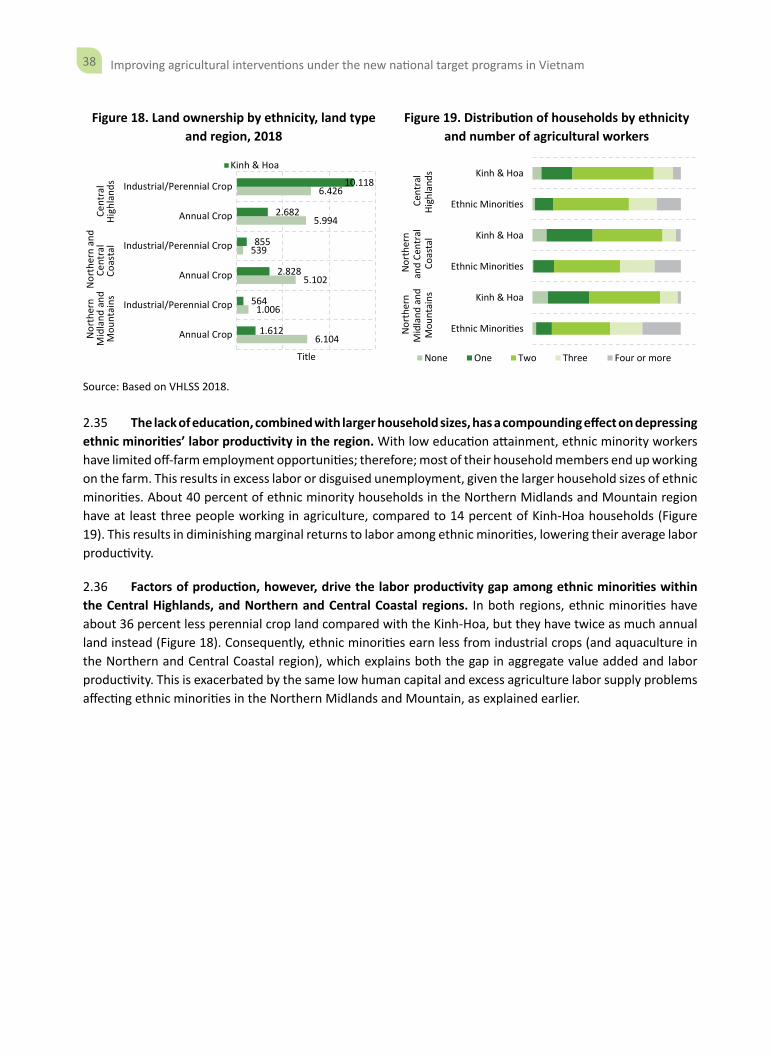
38 Improving agricultural interventions under the new national target programs in Vietnam
Figure 18. Land ownership by ethnicity, land type and region, 2018
Figure 19. Distribution of households by ethnicity and number of agricultural workers
6.104
1.006
5.102
539
5.994
6.426
1.612
564
2.828
855
2.682
10.118
Annual Crop
Industrial/Perennial Crop
Annual Crop
Industrial/Perennial Crop
Annual Crop
Industrial/Perennial Crop
Nor
ther
nM
idla
nd a
ndM
ount
ains
Nor
ther
n an
dCe
ntra
lCo
asta
lCe
ntra
lHi
ghla
nds
Title
Kinh & Hoa
Ethnic Minori�es
Kinh & Hoa
Ethnic Minori�es
Kinh & Hoa
Ethnic Minori�es
Kinh & Hoa
Nor
ther
nM
idla
nd a
ndM
ount
ains
Nor
ther
nan
d Ce
ntra
lCo
asta
lCe
ntra
lHi
ghla
nds
None One Two Three Four or more
Source: Based on VHLSS 2018.
2.35 The lack of education, combined with larger household sizes, has a compounding effect on depressing ethnic minorities’ labor productivity in the region. With low education attainment, ethnic minority workers have limited off-farm employment opportunities; therefore; most of their household members end up working on the farm. This results in excess labor or disguised unemployment, given the larger household sizes of ethnic minorities. About 40 percent of ethnic minority households in the Northern Midlands and Mountain region have at least three people working in agriculture, compared to 14 percent of Kinh-Hoa households (Figure 19). This results in diminishing marginal returns to labor among ethnic minorities, lowering their average labor productivity.
2.36 Factors of production, however, drive the labor productivity gap among ethnic minorities within the Central Highlands, and Northern and Central Coastal regions. In both regions, ethnic minorities have about 36 percent less perennial crop land compared with the Kinh-Hoa, but they have twice as much annual land instead (Figure 18). Consequently, ethnic minorities earn less from industrial crops (and aquaculture in the Northern and Central Coastal region), which explains both the gap in aggregate value added and labor productivity. This is exacerbated by the same low human capital and excess agriculture labor supply problems affecting ethnic minorities in the Northern Midlands and Mountain, as explained earlier.

39Improving agricultural interventions under the new national target programs in Vietnam

40 Improving agricultural interventions under the new national target programs in Vietnam
Key issues/constraints Proposed interventions/recommendations
Value chain link
• Weak, limited, or nonexistent vertical and/or horizontal links among players in the value chain.
• Promote ethnic minority producer collaboration groups—formulation and capacity building.
• Support establishment and development of collaborative arrangements between all actors in the value chains.
• Support models that enhance links between actors, for example, traceability system, certified production and processing system, or information sharing platforms, e.g. well-planned study tours.
Sharing value created through the supply chains
• Unfair sharing of value, leading to non-contract compliance including side selling of commodities, with primary producers mostly being on the receiving end
• Unethical behavior among both suppliers and buyers
• Strengthen contract compliance and ethical behavior among primary producers and buyers and other value chain stakeholders, through establishment of mechanisms for legal contract enforcement and close monitoring.
41Improving agricultural interventions under the new national target programs in Vietnam
3 Narrowing the Agricultural Productivity Gaps—Analysis of Potential Pro-poor Value Chains
One of the viable approaches to narrow the productivity gaps between regions and ethnic groups is to promote the development of pro-poor value chains. Assessing the potential for specific value chains and strengthening the links with the national, regional and international markets is one option to enhance agricultural productivity in lagging regions. This section analyses some of the pro-poor value chains which have the potential to raise agricultural productivity in lagging regions, including benefiting the ethnic minority groups.
3.1 Given the productivity differences highlighted in Section 2, value chain development has the potential to narrow the productivity gaps between regions, particularly among the ethnic minorities.13 To promote value chain development and provide better access to favorable markets among farmers in the regions where productivity is lower, this study included the analysis of potential value chains to identify areas where specific interventions could be done to promote value addition, as a means to achieve higher productivity. Several value chains were selected based on their potential among the ethnic minority groups
13 The concept of value-chain development implies a mind-set change towards market-oriented agricultural production practices. It requires taking a systematic view of the entire value chain from producer to end-market. It seeks to identify and tackle bottlenecks that restrict the flow of value from the end-markets to producers in a comprehensive series of activities (IFAD, 2009). It is therefore a relatively resource intensive approach, requires mind-set change among all players including producers and takes time to develop.
42 Improving agricultural interventions under the new national target programs in Vietnam
and were subjected to detailed analysis.14 These value chains include the traditional commodities (that is, rice), commodities with specific niche markets such as spices (cinnamon), medicinal plants/herbs (that is, turmeric/curcumin, coriander, lemon grass, and so on), and others with potential for small-scale processing (that is, vegetables, tea, and small livestock). For each of these commodities, the analysis examined the detailed cost and benefit buildup along the value chain for each commodity. The representative costs and benefit levels were compared against relevant parity prices in the local, regional, and international markets to identify potential access to each of these markets. The key findings are presented by commodity value chain in the following subsections.
Traditional Value Chains: Rice
3.2 Vietnam has exceptional comparative advantage15 in rice production and has capitalized on this advantage over the years to become one of the remarkably successful rice-producing and exporting countries in the world. Rice is one of the most important sectors of Vietnam’s agriculture, contributing significantly to agricultural growth. The production value of the rice sector grew 3 percent per year on average between 2009 and 2018, of which it reached VND 275,594 billion (equivalent to US$12 billion) in 2018, accounting for 16 percent of the total production value of the entire agriculture, forestry, and fishery sector. It accounted for 5 percent of Vietnam’s agricultural GDP in 2018 (GSO). For the past several decades, Vietnam has been cultivating a total of 7.5 million ha of paddy. This started declining during the last few years due to urbanization and switching to other crops in line with the ARP.16 Paddy yield has also improved remarkably from 4.2 tons per ha in 2000 to 5.8 tons per ha in 2018, almost 30 percent higher than the world’s average yield of 4.5 tons per ha.17 In 2018, Vietnam recorded its highest production of paddy, estimated at over 43 million tons of paddy and 27 million tons of milled rice; it was the third highest exporter of rice, with almost 7 million tons sold on the international market (Figure 20).
14 Primary and secondary data collection was undertaken mainly by CRED and IPSARD, supported by several consultants through the Investment Center of the Food and Agriculture Organization (FAO).
Based on the value chain study conducted by CRED, these value chains are closely linked to ethnic minority communities who lead the upstream part of the value chain, including cultivation, collection, and preprocessing. The selection of these commodity value-chains was undertaken through the Value-Chain Idea Contest (VCIC) with support under the Second Australia World Bank Partnership (ABP2). The analysis used value chain and market system approaches to gain a comprehensive overview of the selected sectors. The findings of this analysis offer recommendations to efficiently support ethnic minority people and improve their livelihood. This report provides a summary of the findings. Detailed findings and recommendations for each of the value-chains are provided in a separate report prepared by CRED.
15 Comparative advantage refers to the ability of Vietnam to produce rice at a social opportunity cost which is lower than the border price of rice.
16 According to MARD 2019, paddy land has been reducing by 70,000–100.000 ha per year since 2015/16.17 Vietnam’s paddy yield is currently higher than some of the leading rice exporters such as Thailand (3.3), India (3.4), and
Pakistan (4.0).
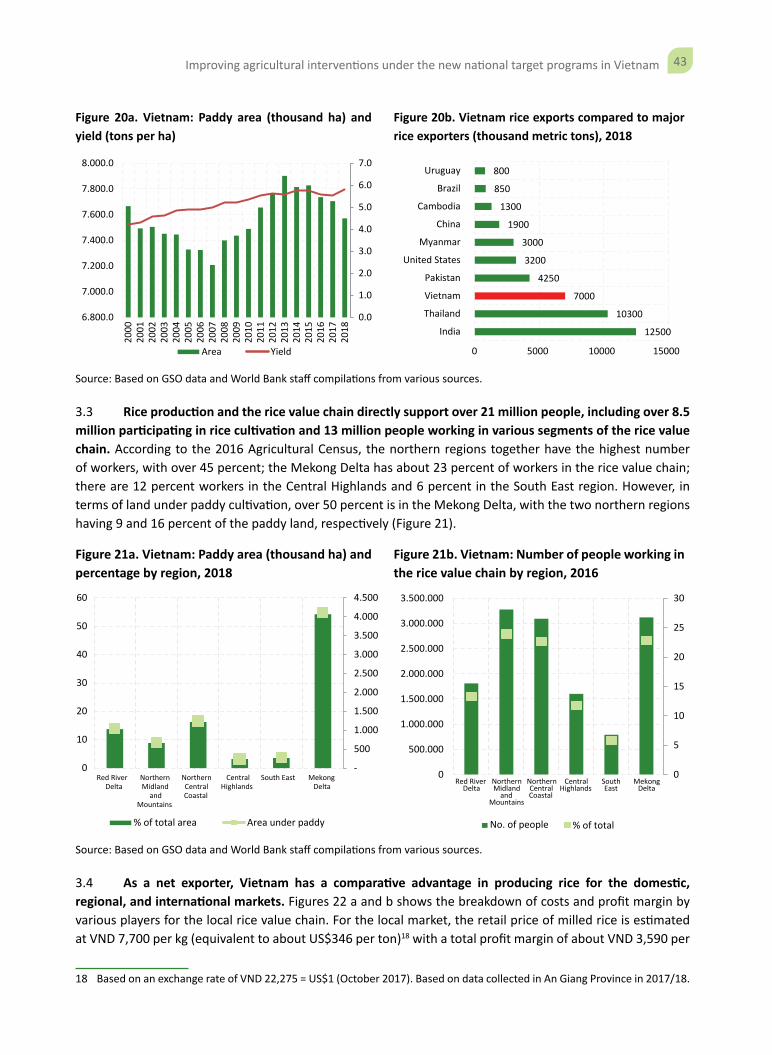
43Improving agricultural interventions under the new national target programs in Vietnam
Figure 20a. Vietnam: Paddy area (thousand ha) and yield (tons per ha)
Figure 20b. Vietnam rice exports compared to major rice exporters (thousand metric tons), 2018
0.0
1.0
2.0
3.0
4.0
5.0
6.0
7.0
6.800.0
7.000.0
7.200.0
7.400.0
7.600.0
7.800.0
8.000.0
2000
2001
2002
2003
2004
2005
2006
2007
2008
2009
2010
2011
2012
2013
2014
2015
2016
2017
2018
Area Yield
12500
10300
7000
4250
3200
3000
1900
1300
850
800
0 5000 10000 15000
India
Thailand
Vietnam
Pakistan
United States
Myanmar
China
Cambodia
Brazil
Uruguay
Source: Based on GSO data and World Bank staff compilations from various sources.
3.3 Rice production and the rice value chain directly support over 21 million people, including over 8.5 million participating in rice cultivation and 13 million people working in various segments of the rice value chain. According to the 2016 Agricultural Census, the northern regions together have the highest number of workers, with over 45 percent; the Mekong Delta has about 23 percent of workers in the rice value chain; there are 12 percent workers in the Central Highlands and 6 percent in the South East region. However, in terms of land under paddy cultivation, over 50 percent is in the Mekong Delta, with the two northern regions having 9 and 16 percent of the paddy land, respectively (Figure 21).
Figure 21a. Vietnam: Paddy area (thousand ha) and percentage by region, 2018
Figure 21b. Vietnam: Number of people working in the rice value chain by region, 2016
-
500
1.000
1.500
2.000
2.500
3.000
3.500
4.000
4.500
0
10
20
30
40
50
60
Red RiverDelta
NorthernMidland
andMountains
NorthernCentralCoastal
CentralHighlands
South East MekongDelta
% of total area Area under paddy
0
5
10
15
20
25
30
0
500.000
1.000.000
1.500.000
2.000.000
2.500.000
3.000.000
3.500.000
Red RiverDelta
NorthernMidland
andMountains
NorthernCentralCoastal
CentralHighlands
SouthEast
MekongDelta
No. of people % of total
Source: Based on GSO data and World Bank staff compilations from various sources.
3.4 As a net exporter, Vietnam has a comparative advantage in producing rice for the domestic, regional, and international markets. Figures 22 a and b shows the breakdown of costs and profit margin by various players for the local rice value chain. For the local market, the retail price of milled rice is estimated at VND 7,700 per kg (equivalent to about US$346 per ton)18 with a total profit margin of about VND 3,590 per
18 Based on an exchange rate of VND 22,275 = US$1 (October 2017). Based on data collected in An Giang Province in 2017/18.
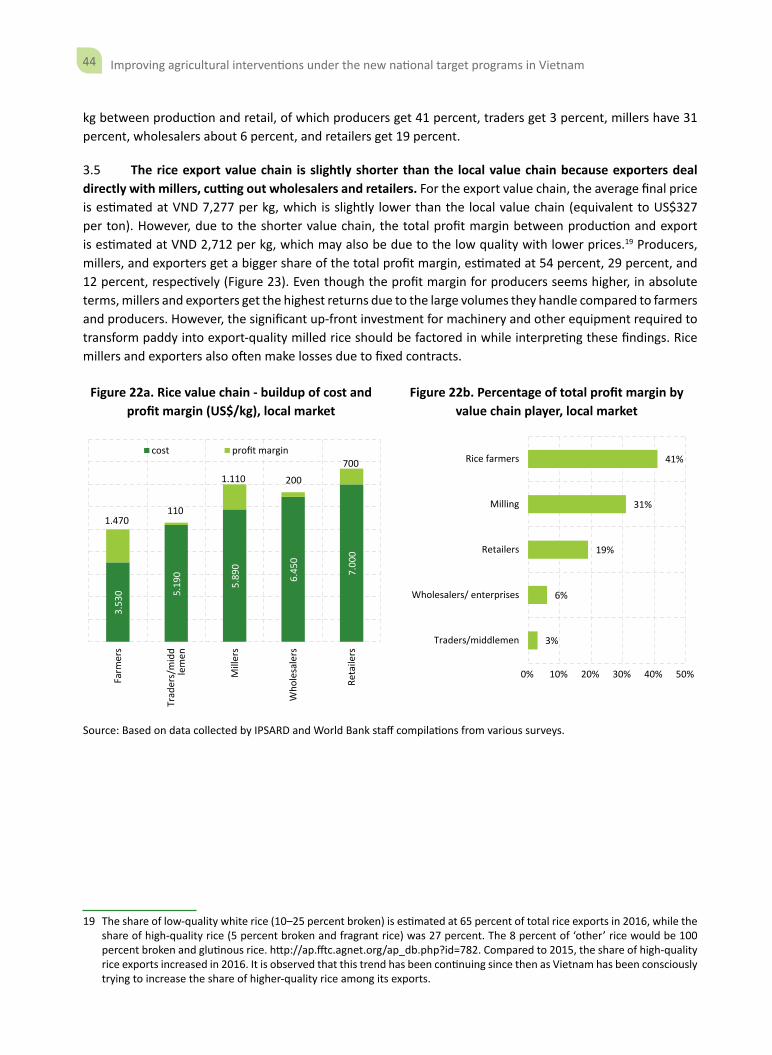
44 Improving agricultural interventions under the new national target programs in Vietnam
kg between production and retail, of which producers get 41 percent, traders get 3 percent, millers have 31 percent, wholesalers about 6 percent, and retailers get 19 percent.
3.5 The rice export value chain is slightly shorter than the local value chain because exporters deal directly with millers, cutting out wholesalers and retailers. For the export value chain, the average final price is estimated at VND 7,277 per kg, which is slightly lower than the local value chain (equivalent to US$327 per ton). However, due to the shorter value chain, the total profit margin between production and export is estimated at VND 2,712 per kg, which may also be due to the low quality with lower prices.19 Producers, millers, and exporters get a bigger share of the total profit margin, estimated at 54 percent, 29 percent, and 12 percent, respectively (Figure 23). Even though the profit margin for producers seems higher, in absolute terms, millers and exporters get the highest returns due to the large volumes they handle compared to farmers and producers. However, the significant up-front investment for machinery and other equipment required to transform paddy into export-quality milled rice should be factored in while interpreting these findings. Rice millers and exporters also often make losses due to fixed contracts.
Figure 22a. Rice value chain - buildup of cost and profit margin (US$/kg), local market
Figure 22b. Percentage of total profit margin by value chain player, local market
3.53
0 5.19
0
5.89
0
6.45
0
7.00
0
1.470110
1.110 200
700
Farm
ers
Trad
ers/
mid
dle
men
Mill
ers
Who
lesa
lers
Reta
ilers
cost profit margin
3%
6%
19%
31%
41%
0% 10% 20% 30% 40% 50%
Traders/middlemen
Wholesalers/ enterprises
Retailers
Milling
Rice farmers
Source: Based on data collected by IPSARD and World Bank staff compilations from various surveys.
19 The share of low-quality white rice (10–25 percent broken) is estimated at 65 percent of total rice exports in 2016, while the share of high-quality rice (5 percent broken and fragrant rice) was 27 percent. The 8 percent of ‘other’ rice would be 100 percent broken and glutinous rice. http://ap.fftc.agnet.org/ap_db.php?id=782. Compared to 2015, the share of high-quality rice exports increased in 2016. It is observed that this trend has been continuing since then as Vietnam has been consciously trying to increase the share of higher-quality rice among its exports.
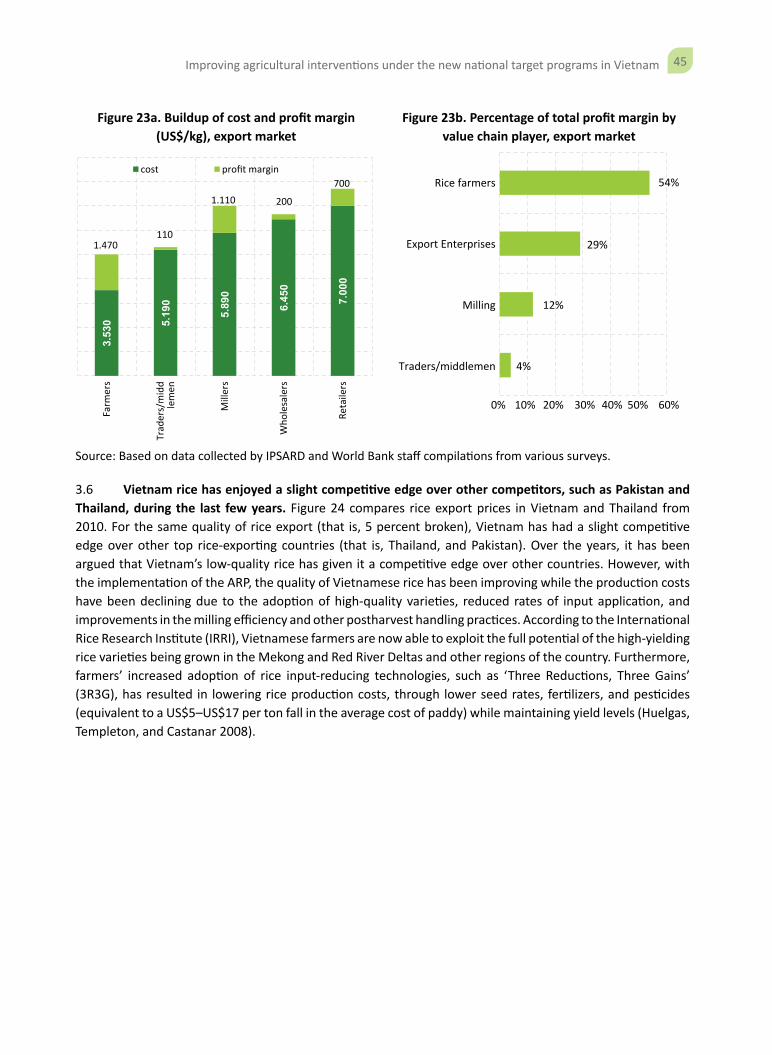
45Improving agricultural interventions under the new national target programs in Vietnam
Figure 23a. Buildup of cost and profit margin (US$/kg), export market
Figure 23b. Percentage of total profit margin by value chain player, export market
3.53
0 5.19
0
5.89
0
6.45
0
7.00
0
1.470110
1.110 200
700
Farm
ers
Trad
ers/
mid
dle
men
Mill
ers
Who
lesa
lers
Reta
ilers
cost profit margin
0% 10% 20% 30% 40% 50% 60%
Traders/middlemen
Milling
Export Enterprises
Rice farmers 54%
29%
12%
4%
Source: Based on data collected by IPSARD and World Bank staff compilations from various surveys.
3.6 Vietnam rice has enjoyed a slight competitive edge over other competitors, such as Pakistan and Thailand, during the last few years. Figure 24 compares rice export prices in Vietnam and Thailand from 2010. For the same quality of rice export (that is, 5 percent broken), Vietnam has had a slight competitive edge over other top rice-exporting countries (that is, Thailand, and Pakistan). Over the years, it has been argued that Vietnam’s low-quality rice has given it a competitive edge over other countries. However, with the implementation of the ARP, the quality of Vietnamese rice has been improving while the production costs have been declining due to the adoption of high-quality varieties, reduced rates of input application, and improvements in the milling efficiency and other postharvest handling practices. According to the International Rice Research Institute (IRRI), Vietnamese farmers are now able to exploit the full potential of the high-yielding rice varieties being grown in the Mekong and Red River Deltas and other regions of the country. Furthermore, farmers’ increased adoption of rice input-reducing technologies, such as ‘Three Reductions, Three Gains’ (3R3G), has resulted in lowering rice production costs, through lower seed rates, fertilizers, and pesticides (equivalent to a US$5–US$17 per ton fall in the average cost of paddy) while maintaining yield levels (Huelgas, Templeton, and Castanar 2008).
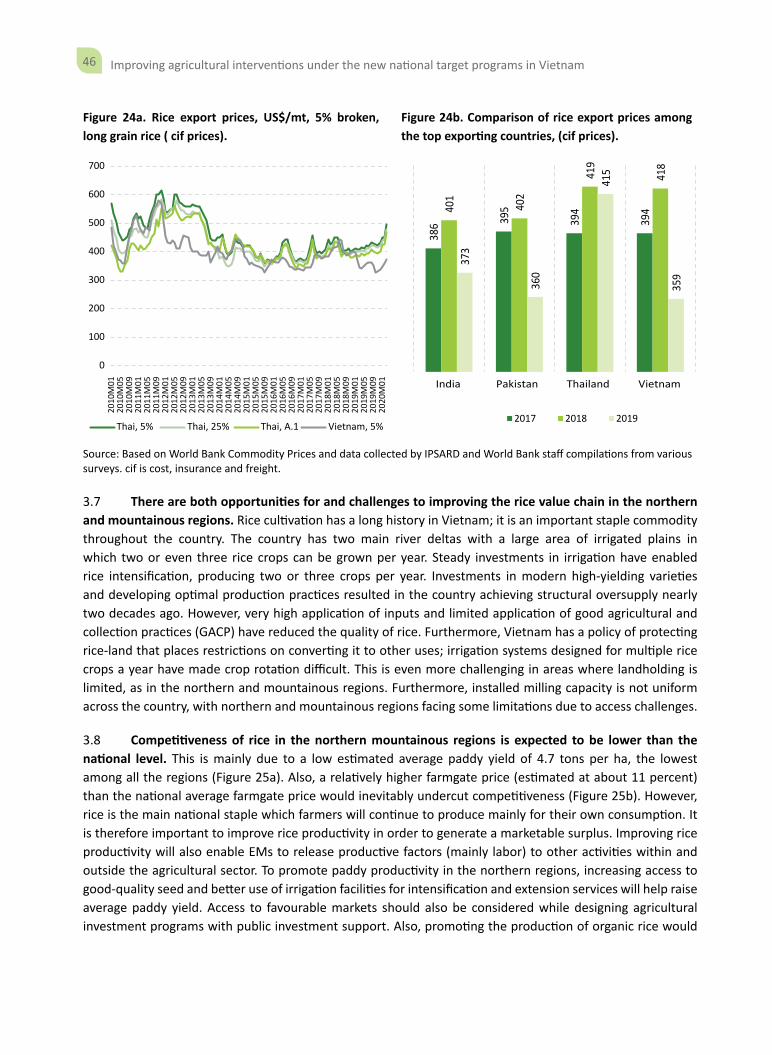
46 Improving agricultural interventions under the new national target programs in Vietnam
Figure 24a. Rice export prices, US$/mt, 5% broken, long grain rice ( cif prices).
Figure 24b. Comparison of rice export prices among the top exporting countries, (cif prices).
0
100
200
300
400
500
600
700
2010
M01
2010
M05
2010
M09
2011
M01
2011
M05
2011
M09
2012
M01
2012
M05
2012
M09
2013
M01
2013
M05
2013
M09
2014
M01
2014
M05
2014
M09
2015
M01
2015
M05
2015
M09
2016
M01
2016
M05
2016
M09
2017
M01
2017
M05
2017
M09
2018
M01
2018
M05
2018
M09
2019
M01
2019
M05
2019
M09
2020
M01
Thai, 5% Thai, 25% Thai, A.1 Vietnam, 5%38
6 395
394
39440
1
402
419
418
373
360
415
359
India Pakistan Thailand Vietnam
2017 2018 2019
Source: Based on World Bank Commodity Prices and data collected by IPSARD and World Bank staff compilations from various surveys. cif is cost, insurance and freight.
3.7 There are both opportunities for and challenges to improving the rice value chain in the northern and mountainous regions. Rice cultivation has a long history in Vietnam; it is an important staple commodity throughout the country. The country has two main river deltas with a large area of irrigated plains in which two or even three rice crops can be grown per year. Steady investments in irrigation have enabled rice intensification, producing two or three crops per year. Investments in modern high-yielding varieties and developing optimal production practices resulted in the country achieving structural oversupply nearly two decades ago. However, very high application of inputs and limited application of good agricultural and collection practices (GACP) have reduced the quality of rice. Furthermore, Vietnam has a policy of protecting rice-land that places restrictions on converting it to other uses; irrigation systems designed for multiple rice crops a year have made crop rotation difficult. This is even more challenging in areas where landholding is limited, as in the northern and mountainous regions. Furthermore, installed milling capacity is not uniform across the country, with northern and mountainous regions facing some limitations due to access challenges.
3.8 Competitiveness of rice in the northern mountainous regions is expected to be lower than the national level. This is mainly due to a low estimated average paddy yield of 4.7 tons per ha, the lowest among all the regions (Figure 25a). Also, a relatively higher farmgate price (estimated at about 11 percent) than the national average farmgate price would inevitably undercut competitiveness (Figure 25b). However, rice is the main national staple which farmers will continue to produce mainly for their own consumption. It is therefore important to improve rice productivity in order to generate a marketable surplus. Improving rice productivity will also enable EMs to release productive factors (mainly labor) to other activities within and outside the agricultural sector. To promote paddy productivity in the northern regions, increasing access to good-quality seed and better use of irrigation facilities for intensification and extension services will help raise average paddy yield. Access to favourable markets should also be considered while designing agricultural investment programs with public investment support. Also, promoting the production of organic rice would
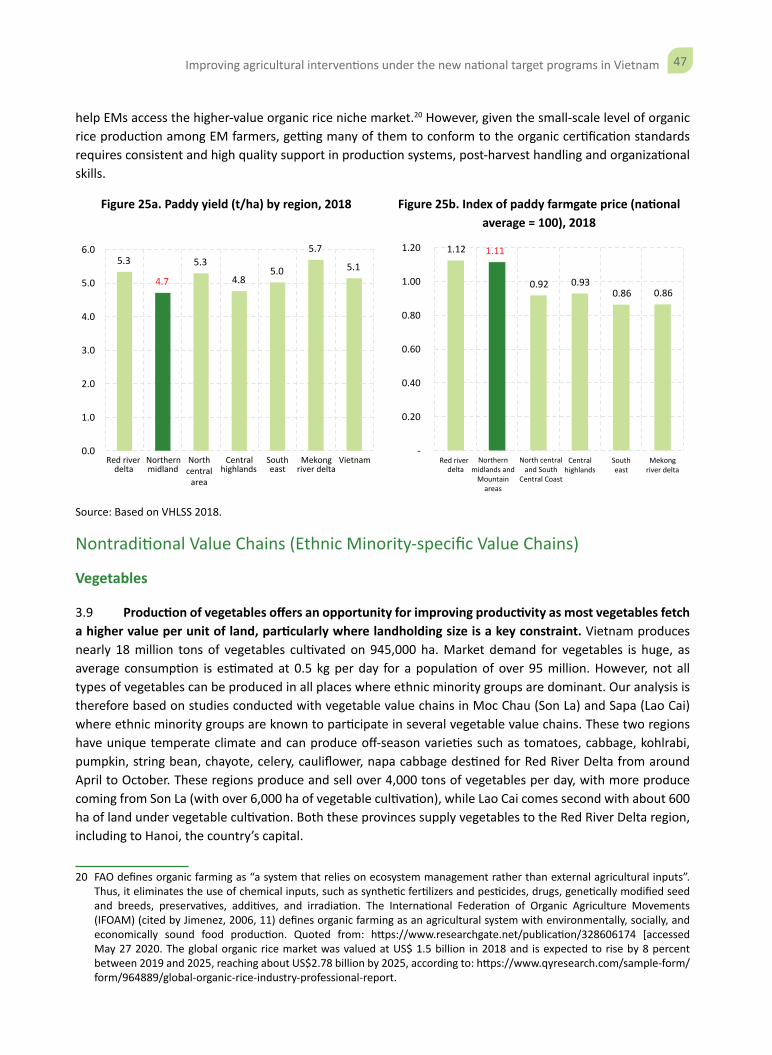
47Improving agricultural interventions under the new national target programs in Vietnam
help EMs access the higher-value organic rice niche market.20 However, given the small-scale level of organic rice production among EM farmers, getting many of them to conform to the organic certification standards requires consistent and high quality support in production systems, post-harvest handling and organizational skills.
Figure 25a. Paddy yield (t/ha) by region, 2018 Figure 25b. Index of paddy farmgate price (national average = 100), 2018
5.3
4.7
5.3
4.85.0
5.7
5.1
0.0
1.0
2.0
3.0
4.0
5.0
6.0
Red riverdelta
Red riverdelta
Northernmidland
Northernmidlands and
Mountainareas
Northcentral
area
North centraland South
Central Coast
Centralhighlands
Centralhighlands
Southeast
Mekongriver delta
Southeast
Mekongriver delta
Vietnam
1.12 1.11
0.92 0.93 0.86 0.86
-
0.20
0.40
0.60
0.80
1.00
1.20
Source: Based on VHLSS 2018.
Nontraditional Value Chains (Ethnic Minority-specific Value Chains)
Vegetables
3.9 Production of vegetables offers an opportunity for improving productivity as most vegetables fetch a higher value per unit of land, particularly where landholding size is a key constraint. Vietnam produces nearly 18 million tons of vegetables cultivated on 945,000 ha. Market demand for vegetables is huge, as average consumption is estimated at 0.5 kg per day for a population of over 95 million. However, not all types of vegetables can be produced in all places where ethnic minority groups are dominant. Our analysis is therefore based on studies conducted with vegetable value chains in Moc Chau (Son La) and Sapa (Lao Cai) where ethnic minority groups are known to participate in several vegetable value chains. These two regions have unique temperate climate and can produce off-season varieties such as tomatoes, cabbage, kohlrabi, pumpkin, string bean, chayote, celery, cauliflower, napa cabbage destined for Red River Delta from around April to October. These regions produce and sell over 4,000 tons of vegetables per day, with more produce coming from Son La (with over 6,000 ha of vegetable cultivation), while Lao Cai comes second with about 600 ha of land under vegetable cultivation. Both these provinces supply vegetables to the Red River Delta region, including to Hanoi, the country’s capital.
20 FAO defines organic farming as “a system that relies on ecosystem management rather than external agricultural inputs”. Thus, it eliminates the use of chemical inputs, such as synthetic fertilizers and pesticides, drugs, genetically modified seed and breeds, preservatives, additives, and irradiation. The International Federation of Organic Agriculture Movements (IFOAM) (cited by Jimenez, 2006, 11) defines organic farming as an agricultural system with environmentally, socially, and economically sound food production. Quoted from: https://www.researchgate.net/publication/328606174 [accessed May 27 2020. The global organic rice market was valued at US$ 1.5 billion in 2018 and is expected to rise by 8 percent between 2019 and 2025, reaching about US$2.78 billion by 2025, according to: https://www.qyresearch.com/sample-form/form/964889/global-organic-rice-industry-professional-report.
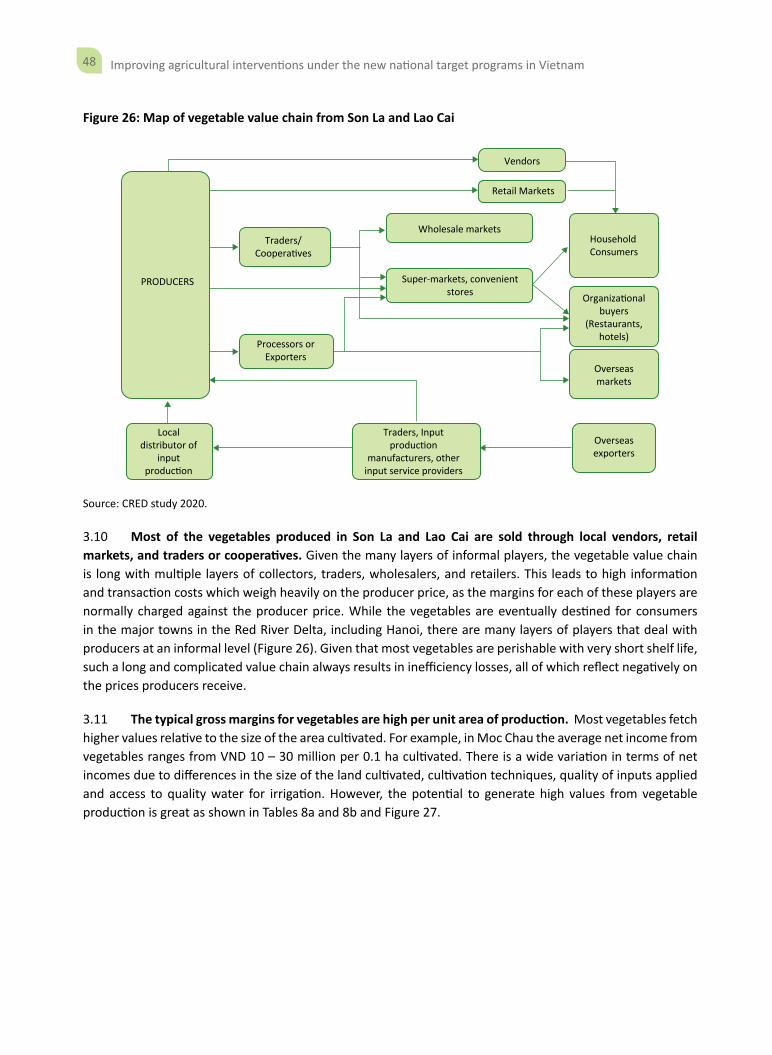
48 Improving agricultural interventions under the new national target programs in Vietnam
Figure 26: Map of vegetable value chain from Son La and Lao Cai
PRODUCERS
Retail Markets
Wholesale marketsTraders/
Coopera�ves
Super-markets, convenientstores
Processors orExporters
Localdistributor of
inputproduc�on
Traders, Inputproduc�on
manufacturers, otherinput service providers
HouseholdConsumers
Organiza�onalbuyers
(Restaurants,hotels)
Overseasmarkets
Overseasexporters
Vendors
Source: CRED study 2020.
3.10 Most of the vegetables produced in Son La and Lao Cai are sold through local vendors, retail markets, and traders or cooperatives. Given the many layers of informal players, the vegetable value chain is long with multiple layers of collectors, traders, wholesalers, and retailers. This leads to high information and transaction costs which weigh heavily on the producer price, as the margins for each of these players are normally charged against the producer price. While the vegetables are eventually destined for consumers in the major towns in the Red River Delta, including Hanoi, there are many layers of players that deal with producers at an informal level (Figure 26). Given that most vegetables are perishable with very short shelf life, such a long and complicated value chain always results in inefficiency losses, all of which reflect negatively on the prices producers receive.
3.11 The typical gross margins for vegetables are high per unit area of production. Most vegetables fetch higher values relative to the size of the area cultivated. For example, in Moc Chau the average net income from vegetables ranges from VND 10 – 30 million per 0.1 ha cultivated. There is a wide variation in terms of net incomes due to differences in the size of the land cultivated, cultivation techniques, quality of inputs applied and access to quality water for irrigation. However, the potential to generate high values from vegetable production is great as shown in Tables 8a and 8b and Figure 27.
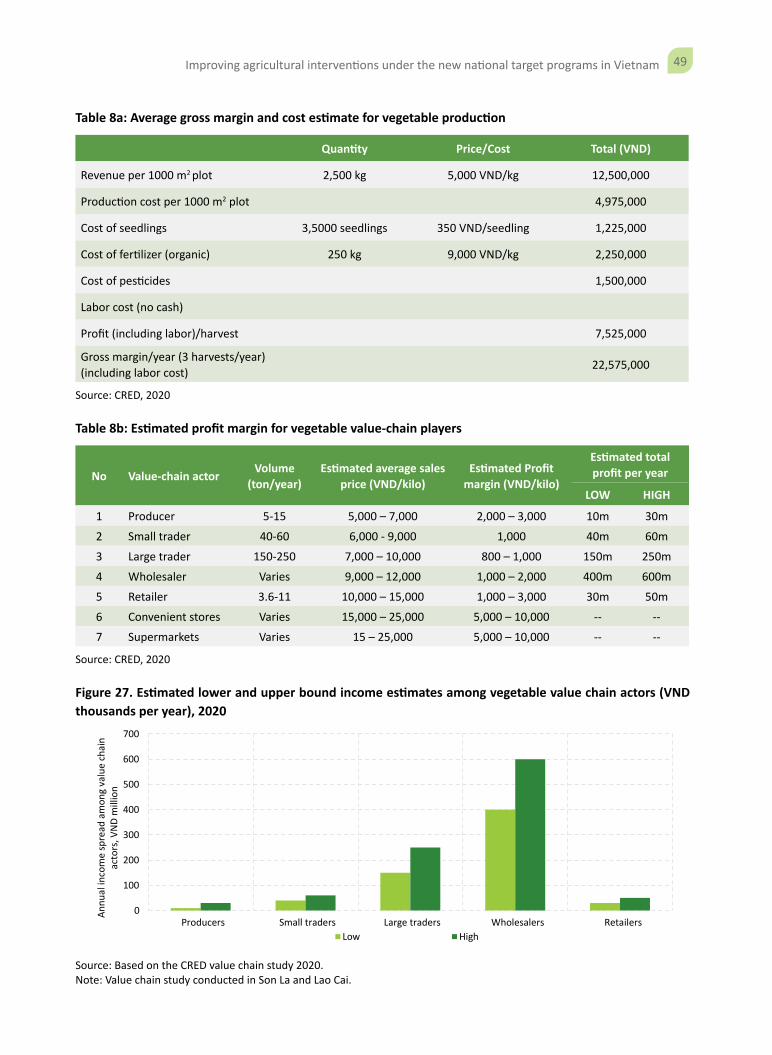
49Improving agricultural interventions under the new national target programs in Vietnam
Table 8a: Average gross margin and cost estimate for vegetable production
Quantity Price/Cost Total (VND)
Revenue per 1000 m2 plot 2,500 kg 5,000 VND/kg 12,500,000
Production cost per 1000 m2 plot 4,975,000
Cost of seedlings 3,5000 seedlings 350 VND/seedling 1,225,000
Cost of fertilizer (organic) 250 kg 9,000 VND/kg 2,250,000
Cost of pesticides 1,500,000
Labor cost (no cash)
Profit (including labor)/harvest 7,525,000
Gross margin/year (3 harvests/year) (including labor cost) 22,575,000
Source: CRED, 2020
Table 8b: Estimated profit margin for vegetable value-chain players
No Value-chain actor Volume (ton/year)
Estimated average sales price (VND/kilo)
Estimated Profit margin (VND/kilo)
Estimated total profit per year
LOW HIGH
1 Producer 5-15 5,000 – 7,000 2,000 – 3,000 10m 30m
2 Small trader 40-60 6,000 - 9,000 1,000 40m 60m
3 Large trader 150-250 7,000 – 10,000 800 – 1,000 150m 250m
4 Wholesaler Varies 9,000 – 12,000 1,000 – 2,000 400m 600m
5 Retailer 3.6-11 10,000 – 15,000 1,000 – 3,000 30m 50m
6 Convenient stores Varies 15,000 – 25,000 5,000 – 10,000 -- --
7 Supermarkets Varies 15 – 25,000 5,000 – 10,000 -- --
Source: CRED, 2020
Figure 27. Estimated lower and upper bound income estimates among vegetable value chain actors (VND thousands per year), 2020
0
100
200
300
400
500
600
700
Producers Small traders Large traders Wholesalers RetailersLow High
Annu
al in
com
e sp
read
am
ong
valu
e ch
ain
acto
rs, V
ND
mill
ion
Source: Based on the CRED value chain study 2020. Note: Value chain study conducted in Son La and Lao Cai.
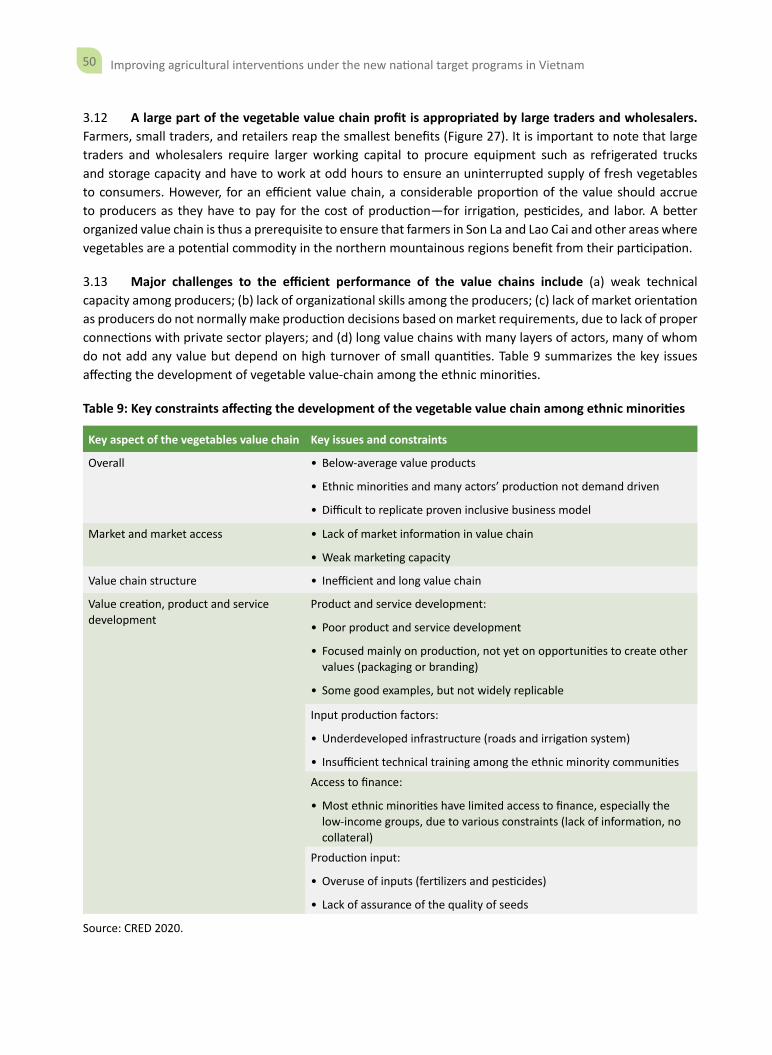
50 Improving agricultural interventions under the new national target programs in Vietnam
3.12 A large part of the vegetable value chain profit is appropriated by large traders and wholesalers. Farmers, small traders, and retailers reap the smallest benefits (Figure 27). It is important to note that large traders and wholesalers require larger working capital to procure equipment such as refrigerated trucks and storage capacity and have to work at odd hours to ensure an uninterrupted supply of fresh vegetables to consumers. However, for an efficient value chain, a considerable proportion of the value should accrue to producers as they have to pay for the cost of production—for irrigation, pesticides, and labor. A better organized value chain is thus a prerequisite to ensure that farmers in Son La and Lao Cai and other areas where vegetables are a potential commodity in the northern mountainous regions benefit from their participation.
3.13 Major challenges to the efficient performance of the value chains include (a) weak technical capacity among producers; (b) lack of organizational skills among the producers; (c) lack of market orientation as producers do not normally make production decisions based on market requirements, due to lack of proper connections with private sector players; and (d) long value chains with many layers of actors, many of whom do not add any value but depend on high turnover of small quantities. Table 9 summarizes the key issues affecting the development of vegetable value-chain among the ethnic minorities.
Table 9: Key constraints affecting the development of the vegetable value chain among ethnic minorities
Key aspect of the vegetables value chain Key issues and constraints
Overall • Below-average value products
• Ethnic minorities and many actors’ production not demand driven
• Difficult to replicate proven inclusive business model
Market and market access • Lack of market information in value chain
• Weak marketing capacity
Value chain structure • Inefficient and long value chain
Value creation, product and service development
Product and service development:
• Poor product and service development
• Focused mainly on production, not yet on opportunities to create other values (packaging or branding)
• Some good examples, but not widely replicable
Input production factors:
• Underdeveloped infrastructure (roads and irrigation system)
• Insufficient technical training among the ethnic minority communities
Access to finance:
• Most ethnic minorities have limited access to finance, especially the low-income groups, due to various constraints (lack of information, no collateral)
Production input:
• Overuse of inputs (fertilizers and pesticides)
• Lack of assurance of the quality of seeds
Source: CRED 2020.
51Improving agricultural interventions under the new national target programs in Vietnam
3.14 To help build an efficient vegetable value chain that will benefit producers and other actors, there is a need to consider (a) promoting the establishment of an inclusive model that produces high-value products (organic, off-season varieties); (b) developing a shorter and more efficient value chain by ensuring that only trained actors, and those adding value to the chain are involved; (c) providing training on organizational and marketing skills to producer groups, based on a clear understanding of market requirements and standards; (d) adopting or establishing special vegetable production zones with appropriate investments in infrastructure and logistics, including better access roads and cold storage facilities; (e) providing support for drilling wells and encouraging investments in water-saving models (drip irrigation systems) by providing financial incentives or sharing investment costs; (f) providing training in safe vegetable production, including integrated pest management, and appropriate use of fertilizers and chemicals; and (g) helping farmers with capacity to engage in organic production systems, and obtain certification to access niche organic markets. Above the primary level, there is a need to improve horizontal links between farmers’ groups, processors, and supermarkets. This can be achieved by training these stakeholders on standardized production and primary processes of various certification regimes such as VietGAP, Organic, and HACCP21. This will enable producers to establish regular and reliable supply chains. Branding at the regional level is also an important step to deal effectively with large organized supply chains, some of which have strong links with national, regional, and international organized supply chains.
Tea
3.15 Tea is one of the commodities which offers high potential to improve productivity among ethnic minority groups in the northern mountainous regions. Total tea production in Vietnam is estimated at 160,000–170,000 tons annually. Of this, about 30,000 tons is consumed domestically, while a significant volume is destined for export markets. Land area under tea cultivation in Vietnam is estimated at 130,000 ha, of which about 30,000 ha is highland tea produced in Ha Giang, Lao Cai, Lai Chau, Yen Bai, Son La, and Dien Bien in the northern mountainous regions of the country. The Vietnamese highlands have a long history of tea production, and the producers and the majority of the labor belong to ethnic minority groups.
3.16 Green tea from primary producers is entirely sold to processors who transform the green leaf into various product categories.22 Local tea processors either purchase fresh tea leaves directly from producers or from collectors. Some choose to buy only from collectors to simplify supply relationship management (dealing with a limited number of collectors is much more relaxing than having to get supply from hundreds of households). This practice is common in Moc Chau, Son La. Local processors are normally called tea factories. Unlike the vegetable value chain, most primary producers sell to collectors, who in turn supply to processors, who then ferment, dry, and develop various product categories for sale to domestic wholesalers, retailers; some engage directly on the export market. Exporting to overseas markets may be direct from processors or via exporters. Not all processors and exporters depend entirely on oversea markets. Some are also selling into domestic market through retail agents and/or supermarkets. Retails market may be grocery shops or tea specialized outlets. A few households conduct traditional processing on their own to sell to buyers in local markets. Figure 29 shows the value-chain map which pertains to tea producers in the northern mountainous region of Vietnam.
21 Hazard Analysis & Critical Control Points (HACCP) is a science-based system that identifies specific hazards and measures for their control, to ensure food safety. Certification is mandatory in several countries including the US and throughout the EU. HACCP provides a systematic approach to food safety identifies critical risks, helping you establish preventative and corrective production processes.
22 Well-known tea product categories in Vietnam include green tea, red tea, black tea, matcha, and oolong.
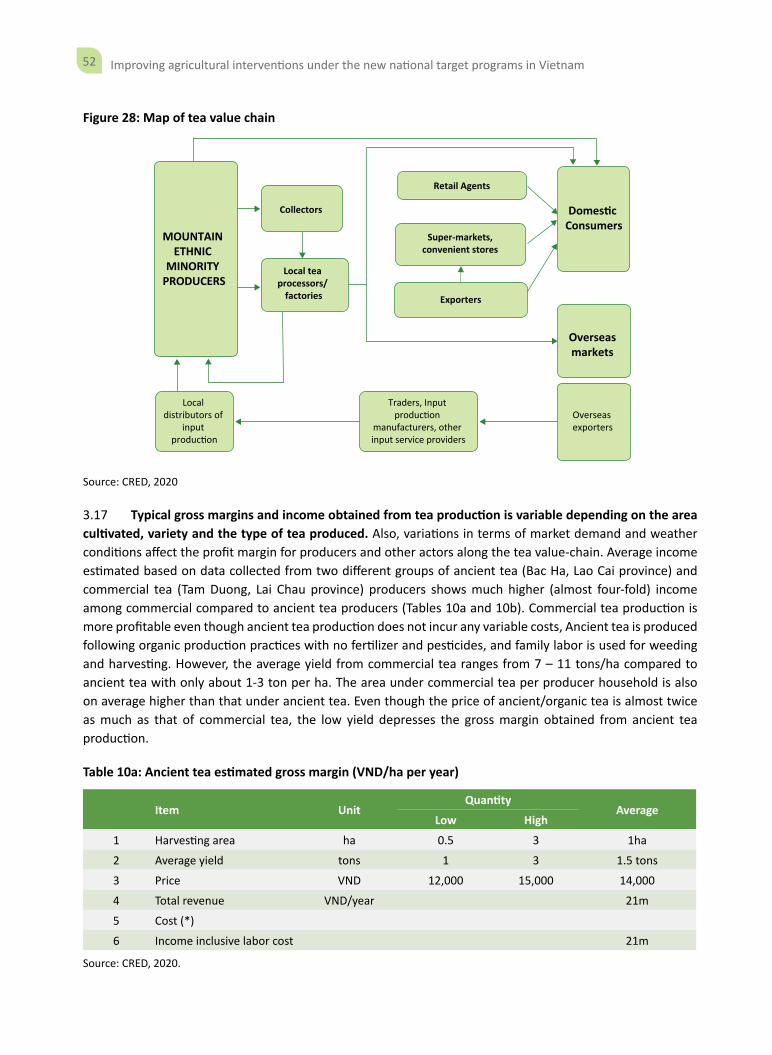
52 Improving agricultural interventions under the new national target programs in Vietnam
Figure 28: Map of tea value chain
MOUNTAIN ETHNIC
MINORITY PRODUCERS
Retail Agents
Collectors
Local tea processors/
factories
Super-markets, convenient stores
Overseas markets
Domes�c Consumers
Exporters
Local distributors of
input produc�on
Traders, Input
produc�on manufacturers, other input service providers
Overseas exporters
Source: CRED, 2020
3.17 Typical gross margins and income obtained from tea production is variable depending on the area cultivated, variety and the type of tea produced. Also, variations in terms of market demand and weather conditions affect the profit margin for producers and other actors along the tea value-chain. Average income estimated based on data collected from two different groups of ancient tea (Bac Ha, Lao Cai province) and commercial tea (Tam Duong, Lai Chau province) producers shows much higher (almost four-fold) income among commercial compared to ancient tea producers (Tables 10a and 10b). Commercial tea production is more profitable even though ancient tea production does not incur any variable costs, Ancient tea is produced following organic production practices with no fertilizer and pesticides, and family labor is used for weeding and harvesting. However, the average yield from commercial tea ranges from 7 – 11 tons/ha compared to ancient tea with only about 1-3 ton per ha. The area under commercial tea per producer household is also on average higher than that under ancient tea. Even though the price of ancient/organic tea is almost twice as much as that of commercial tea, the low yield depresses the gross margin obtained from ancient tea production.
Table 10a: Ancient tea estimated gross margin (VND/ha per year)
Item UnitQuantity
AverageLow High
1 Harvesting area ha 0.5 3 1ha
2 Average yield tons 1 3 1.5 tons
3 Price VND 12,000 15,000 14,000
4 Total revenue VND/year 21m
5 Cost (*)
6 Income inclusive labor cost 21m
Source: CRED, 2020.
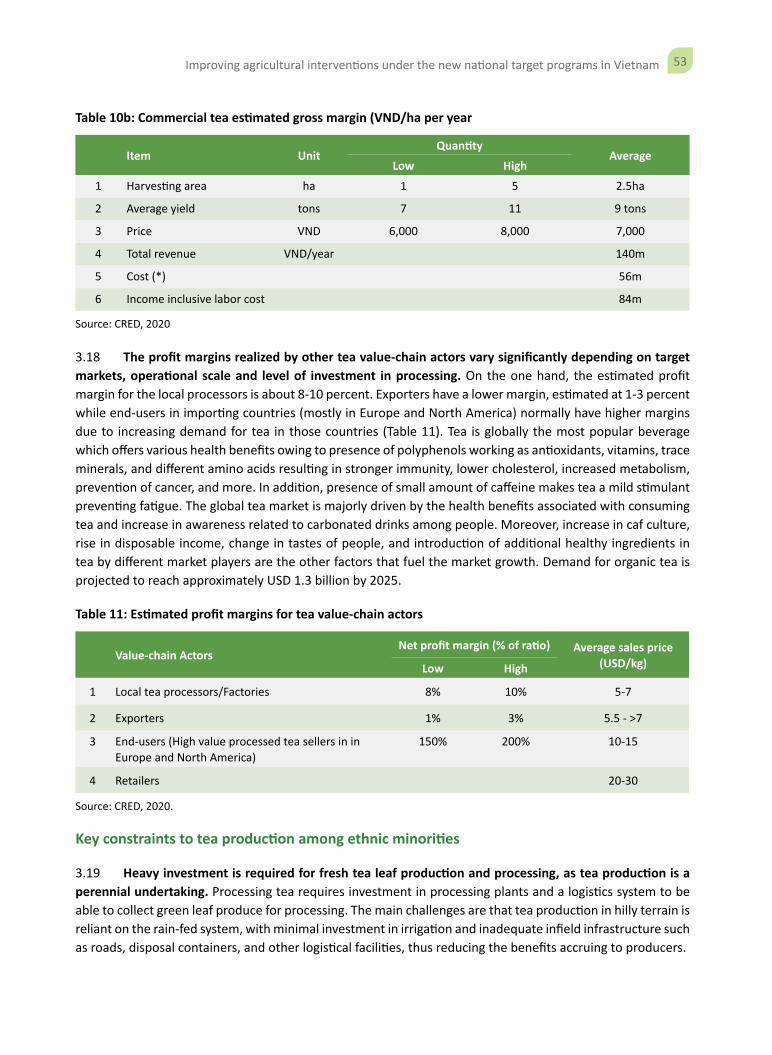
53Improving agricultural interventions under the new national target programs in Vietnam
Table 10b: Commercial tea estimated gross margin (VND/ha per year
Item UnitQuantity
AverageLow High
1 Harvesting area ha 1 5 2.5ha
2 Average yield tons 7 11 9 tons
3 Price VND 6,000 8,000 7,000
4 Total revenue VND/year 140m
5 Cost (*) 56m
6 Income inclusive labor cost 84m
Source: CRED, 2020
3.18 The profit margins realized by other tea value-chain actors vary significantly depending on target markets, operational scale and level of investment in processing. On the one hand, the estimated profit margin for the local processors is about 8-10 percent. Exporters have a lower margin, estimated at 1-3 percent while end-users in importing countries (mostly in Europe and North America) normally have higher margins due to increasing demand for tea in those countries (Table 11). Tea is globally the most popular beverage which offers various health benefits owing to presence of polyphenols working as antioxidants, vitamins, trace minerals, and different amino acids resulting in stronger immunity, lower cholesterol, increased metabolism, prevention of cancer, and more. In addition, presence of small amount of caffeine makes tea a mild stimulant preventing fatigue. The global tea market is majorly driven by the health benefits associated with consuming tea and increase in awareness related to carbonated drinks among people. Moreover, increase in caf culture, rise in disposable income, change in tastes of people, and introduction of additional healthy ingredients in tea by different market players are the other factors that fuel the market growth. Demand for organic tea is projected to reach approximately USD 1.3 billion by 2025.
Table 11: Estimated profit margins for tea value-chain actors
Value-chain ActorsNet profit margin (% of ratio) Average sales price
(USD/kg)Low High
1 Local tea processors/Factories 8% 10% 5-7
2 Exporters 1% 3% 5.5 - >7
3 End-users (High value processed tea sellers in in Europe and North America)
150% 200% 10-15
4 Retailers 20-30
Source: CRED, 2020.
Key constraints to tea production among ethnic minorities
3.19 Heavy investment is required for fresh tea leaf production and processing, as tea production is a perennial undertaking. Processing tea requires investment in processing plants and a logistics system to be able to collect green leaf produce for processing. The main challenges are that tea production in hilly terrain is reliant on the rain-fed system, with minimal investment in irrigation and inadequate infield infrastructure such as roads, disposal containers, and other logistical facilities, thus reducing the benefits accruing to producers.
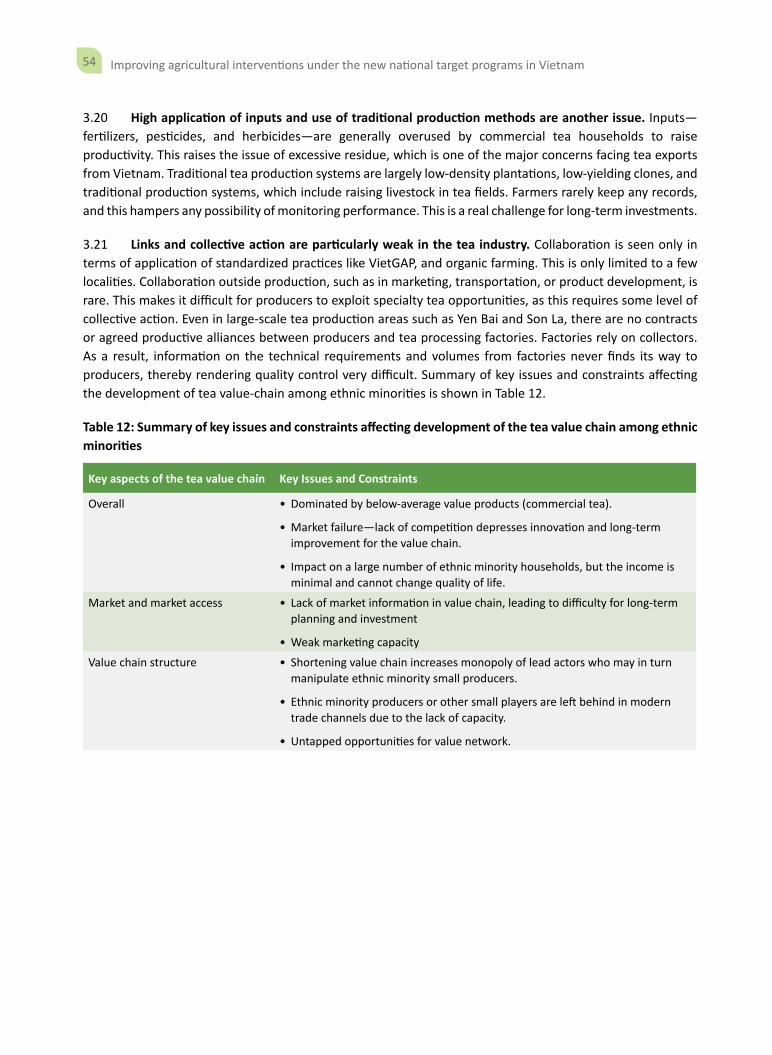
54 Improving agricultural interventions under the new national target programs in Vietnam
3.20 High application of inputs and use of traditional production methods are another issue. Inputs—fertilizers, pesticides, and herbicides—are generally overused by commercial tea households to raise productivity. This raises the issue of excessive residue, which is one of the major concerns facing tea exports from Vietnam. Traditional tea production systems are largely low-density plantations, low-yielding clones, and traditional production systems, which include raising livestock in tea fields. Farmers rarely keep any records, and this hampers any possibility of monitoring performance. This is a real challenge for long-term investments.
3.21 Links and collective action are particularly weak in the tea industry. Collaboration is seen only in terms of application of standardized practices like VietGAP, and organic farming. This is only limited to a few localities. Collaboration outside production, such as in marketing, transportation, or product development, is rare. This makes it difficult for producers to exploit specialty tea opportunities, as this requires some level of collective action. Even in large-scale tea production areas such as Yen Bai and Son La, there are no contracts or agreed productive alliances between producers and tea processing factories. Factories rely on collectors. As a result, information on the technical requirements and volumes from factories never finds its way to producers, thereby rendering quality control very difficult. Summary of key issues and constraints affecting the development of tea value-chain among ethnic minorities is shown in Table 12.
Table 12: Summary of key issues and constraints affecting development of the tea value chain among ethnic minorities
Key aspects of the tea value chain Key Issues and Constraints
Overall • Dominated by below-average value products (commercial tea).
• Market failure—lack of competition depresses innovation and long-term improvement for the value chain.
• Impact on a large number of ethnic minority households, but the income is minimal and cannot change quality of life.
Market and market access • Lack of market information in value chain, leading to difficulty for long-term planning and investment
• Weak marketing capacity
Value chain structure • Shortening value chain increases monopoly of lead actors who may in turn manipulate ethnic minority small producers.
• Ethnic minority producers or other small players are left behind in modern trade channels due to the lack of capacity.
• Untapped opportunities for value network.
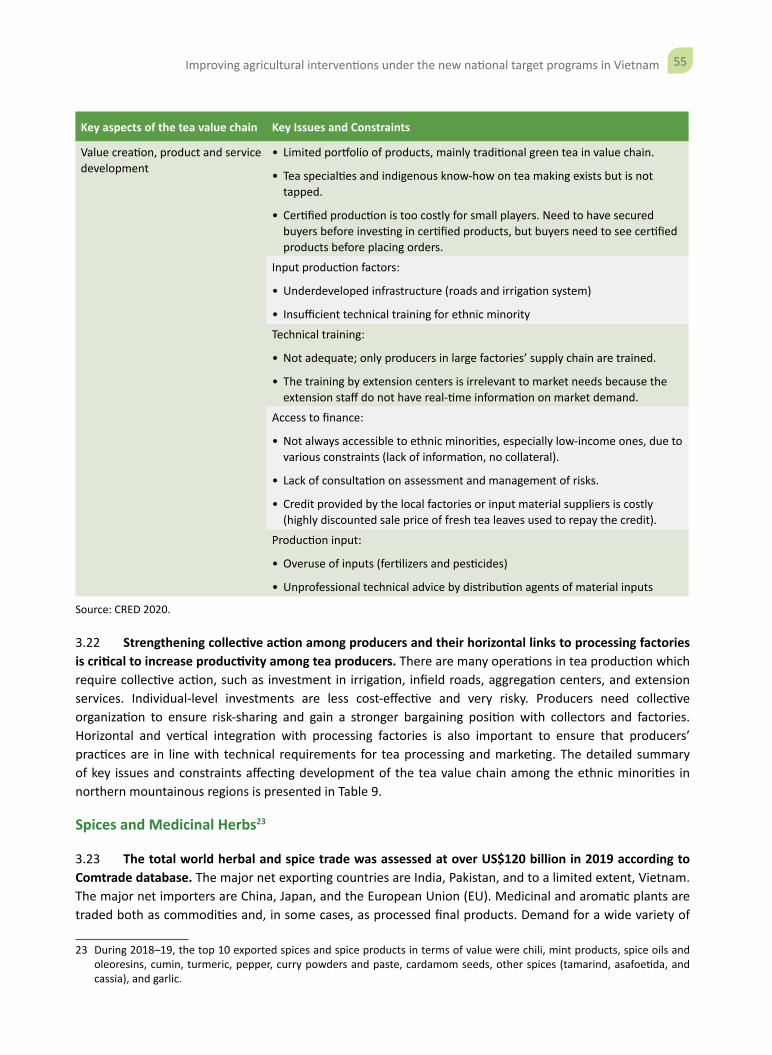
55Improving agricultural interventions under the new national target programs in Vietnam
Key aspects of the tea value chain Key Issues and Constraints
Value creation, product and service development
• Limited portfolio of products, mainly traditional green tea in value chain.
• Tea specialties and indigenous know-how on tea making exists but is not tapped.
• Certified production is too costly for small players. Need to have secured buyers before investing in certified products, but buyers need to see certified products before placing orders.
Input production factors:
• Underdeveloped infrastructure (roads and irrigation system)
• Insufficient technical training for ethnic minority
Technical training:
• Not adequate; only producers in large factories’ supply chain are trained.
• The training by extension centers is irrelevant to market needs because the extension staff do not have real-time information on market demand.
Access to finance:
• Not always accessible to ethnic minorities, especially low-income ones, due to various constraints (lack of information, no collateral).
• Lack of consultation on assessment and management of risks.
• Credit provided by the local factories or input material suppliers is costly (highly discounted sale price of fresh tea leaves used to repay the credit).
Production input:
• Overuse of inputs (fertilizers and pesticides)
• Unprofessional technical advice by distribution agents of material inputs
Source: CRED 2020.
3.22 Strengthening collective action among producers and their horizontal links to processing factories is critical to increase productivity among tea producers. There are many operations in tea production which require collective action, such as investment in irrigation, infield roads, aggregation centers, and extension services. Individual-level investments are less cost-effective and very risky. Producers need collective organization to ensure risk-sharing and gain a stronger bargaining position with collectors and factories. Horizontal and vertical integration with processing factories is also important to ensure that producers’ practices are in line with technical requirements for tea processing and marketing. The detailed summary of key issues and constraints affecting development of the tea value chain among the ethnic minorities in northern mountainous regions is presented in Table 9.
Spices and Medicinal Herbs23
3.23 The total world herbal and spice trade was assessed at over US$120 billion in 2019 according to Comtrade database. The major net exporting countries are India, Pakistan, and to a limited extent, Vietnam. The major net importers are China, Japan, and the European Union (EU). Medicinal and aromatic plants are traded both as commodities and, in some cases, as processed final products. Demand for a wide variety of
23 During 2018–19, the top 10 exported spices and spice products in terms of value were chili, mint products, spice oils and oleoresins, cumin, turmeric, pepper, curry powders and paste, cardamom seeds, other spices (tamarind, asafoetida, and cassia), and garlic.
56 Improving agricultural interventions under the new national target programs in Vietnam
spices is increasing as these markets expand and new end uses are developed. According to the FAO, medicinal and aromatic plants play a significant role in meeting the demands of the traditional medicine markets which are found both domestically in the production sector and in overseas markets. Traditional medicine, which is related to traditional Chinese medicine, Indian Ayurveda, Arabic Unani medicine, and various forms of indigenous medicine, as well as the complementary or alternative medicine utilized in industrialized countries, is gaining credibility in many parts of the world. The percentage of people using traditional medicines is large, particularly in China, India, Japan, the EU, and most developing countries.
3.24 Vietnam produces more than 4,000 species of spices and medicinal herbs with unique pharmaceutical properties. As a result, the country has one of the most developed cultures of exploiting traditional medicine.24 Almost all medicinal herbs are produced by ethnic minority groups, largely through collection from the wild (90 percent) and cultivation (10 percent). Due to forest cover, the mountainous provinces are home to many species of medicinal herbs used in traditional medicines which have thrived through indigenous knowledge. In addition to plants collected from the forest, there are hundreds of thousands of hectares of cultivated medicinal plants that produce more than 20,000 tons of raw materials for the pharmacy industry every year.
3.25 Cinnamon is one of the commonly used spices with high growth potential in the mountainous regions of the north. It is planted in Yen Bai, Lao Cai, and Quang Nam provinces by the ethnic minority groups. The cinnamon value chain is largely linked to the export market. Domestic consumption of its oil and bark-related products is very limited. According to International Trade Center, the global import demand of cinnamon products has increased to 181,199 tons in 2018, from about 157,408 tons in 2016. The largest importers by value are the United States, Mexico, India, Netherlands, and Bangladesh. Total production area for cinnamon in Vietnam is estimated at 80,000 ha. Of this, more than 50,000 ha is in Yen Bai, 20,000 ha in Lao Cai, and about 8,000 ha in Quang Nam. Average productivity is estimated at 1 ton per ha. Vietnam exports about 40,000 tons per year with an estimated total value of US$116.8 million in 2018. Vietnam is the fourth largest exporter of cinnamon globally.
3.26 The cinnamon value-chain is quite complicated, given the many products which can be extracted from the cinnamon tree. From cinnamon tree, several products can be extracted. Barks in different sizes and shapes are used as a spice or for decoration. Cinnamon oil is distilled from the leaves and small branches while the wood can be used as timber, usually for furniture and handicrafts. Each of these products goes through different processes with different parties involved. This makes the value-chain overly complicated compared to other commodities (Figure 29).
3.27 Most of the cinnamon produced in Vietnam is from three main areas. In the northern regions, cinnamon is produced in Yen Bai, Lao Cai, Cao Bang, Bac Kan, Thai Nguyen, Tuyen Quang, and Quang Ninh while in the northern central provinces, it is produced in Thanh Hoa, Nghe An, Ha Tinh and Quang Binh. In the southern central provinces, it is produced in Quang Nam and Quang Ngai. The value-chain analysis focused on the actors in Yen Bai and Lao Cai because these areas together have more than 40,00025 hectares of cinnamon. Also, cinnamon produced from these provinces is considered of good quality, second to cinnamon from Quang Nam and Quang Ngai - which is internationally known as Saigon cinnamon.
24 Vietnam has 53 traditional medicine hospitals, 10,740 traditional clinics, 60,700 traditional doctors, and over 100 phytopharmaceutical enterprises. Global demand for medicinal, nutritional, and cosmetic applications of medicinal herbs is increasing, given that they contain natural ingredients derived from natural sources, including exotic food and flavors, antibiotic- and hormone-free ingredients, and organic foods.
25 Vien, C. & Bui, T. (2016). In-depth gender sensitive analysis of cinnamon value chain in Lao Cai province, Vietnam. SNV Vietnam.
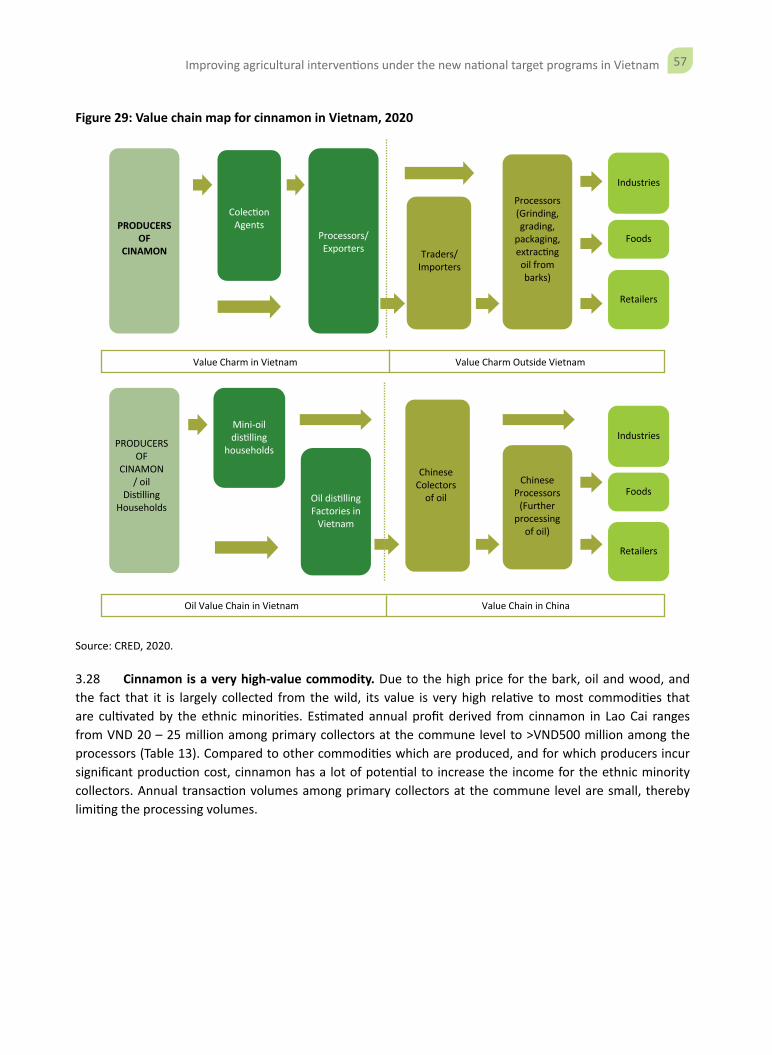
57Improving agricultural interventions under the new national target programs in Vietnam
Figure 29: Value chain map for cinnamon in Vietnam, 2020
PRODUCERSOF
CINAMON
PRODUCERSOF
CINAMON/ oil
Dis�llingHouseholds
Oil Value Chain in Vietnam Value Chain in China
Mini-oildis�lling
households
Oil dis�llingFactories in
Vietnam
ChineseColectors
of oil
ChineseProcessors
(Furtherprocessing
of oil)
Colec�onAgents
Processors/Exporters Traders/
Importers
Processors(Grinding,grading,
packaging,extrac�ngoil frombarks)
Industries
Foods
Retailers
Industries
Foods
Retailers
Value Charm in Vietnam Value Charm Outside Vietnam
Source: CRED, 2020.
3.28 Cinnamon is a very high-value commodity. Due to the high price for the bark, oil and wood, and the fact that it is largely collected from the wild, its value is very high relative to most commodities that are cultivated by the ethnic minorities. Estimated annual profit derived from cinnamon in Lao Cai ranges from VND 20 – 25 million among primary collectors at the commune level to >VND500 million among the processors (Table 13). Compared to other commodities which are produced, and for which producers incur significant production cost, cinnamon has a lot of potential to increase the income for the ethnic minority collectors. Annual transaction volumes among primary collectors at the commune level are small, thereby limiting the processing volumes.
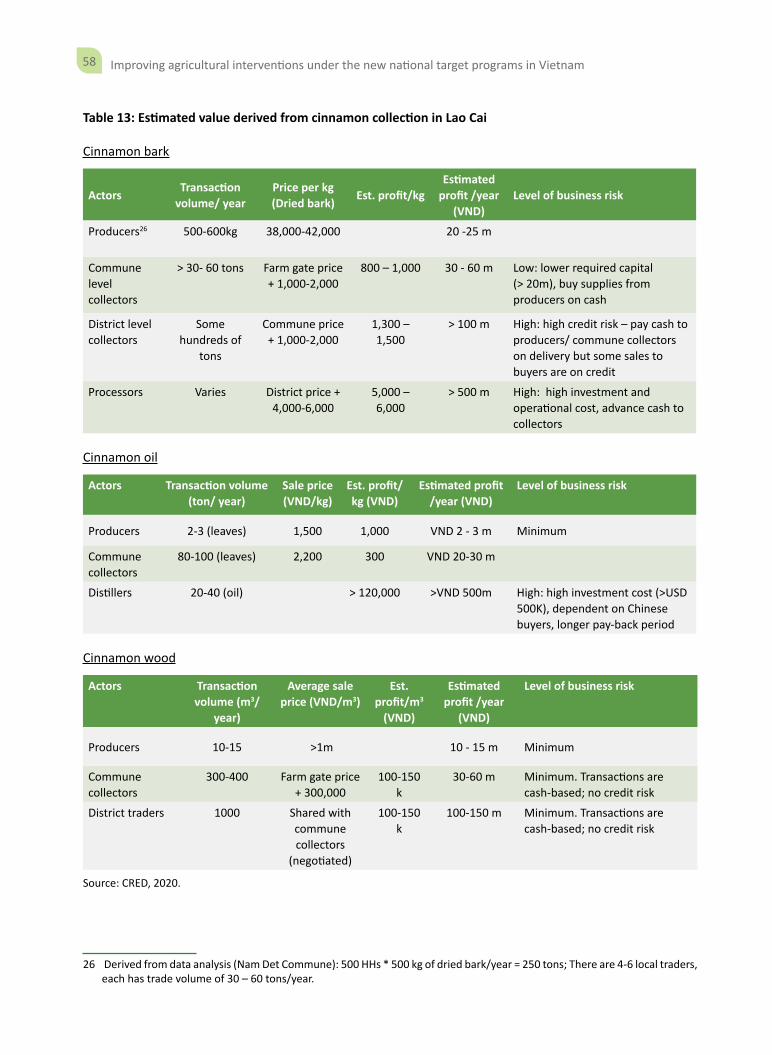
58 Improving agricultural interventions under the new national target programs in Vietnam
Table 13: Estimated value derived from cinnamon collection in Lao Cai
Cinnamon bark
ActorsTransaction
volume/ yearPrice per kg (Dried bark)
Est. profit/kgEstimated
profit /year (VND)
Level of business risk
Producers26 500-600kg 38,000-42,000 20 -25 m
Commune level collectors
> 30- 60 tons Farm gate price + 1,000-2,000
800 – 1,000 30 - 60 m Low: lower required capital (> 20m), buy supplies from producers on cash
District level collectors
Some hundreds of
tons
Commune price + 1,000-2,000
1,300 – 1,500
> 100 m High: high credit risk – pay cash to producers/ commune collectors on delivery but some sales to buyers are on credit
Processors Varies District price + 4,000-6,000
5,000 – 6,000
> 500 m High: high investment and operational cost, advance cash to collectors
Cinnamon oil
Actors Transaction volume (ton/ year)
Sale price (VND/kg)
Est. profit/kg (VND)
Estimated profit /year (VND)
Level of business risk
Producers 2-3 (leaves) 1,500 1,000 VND 2 - 3 m Minimum
Commune collectors
80-100 (leaves) 2,200 300 VND 20-30 m
Distillers 20-40 (oil) > 120,000 >VND 500m High: high investment cost (>USD 500K), dependent on Chinese buyers, longer pay-back period
Cinnamon wood
Actors Transaction volume (m3/
year)
Average sale price (VND/m3)
Est. profit/m3
(VND)
Estimated profit /year
(VND)
Level of business risk
Producers 10-15 >1m 10 - 15 m Minimum
Commune collectors
300-400 Farm gate price + 300,000
100-150 k
30-60 m Minimum. Transactions are cash-based; no credit risk
District traders 1000 Shared with commune collectors
(negotiated)
100-150 k
100-150 m Minimum. Transactions are cash-based; no credit risk
Source: CRED, 2020.
26 Derived from data analysis (Nam Det Commune): 500 HHs * 500 kg of dried bark/year = 250 tons; There are 4-6 local traders, each has trade volume of 30 – 60 tons/year.
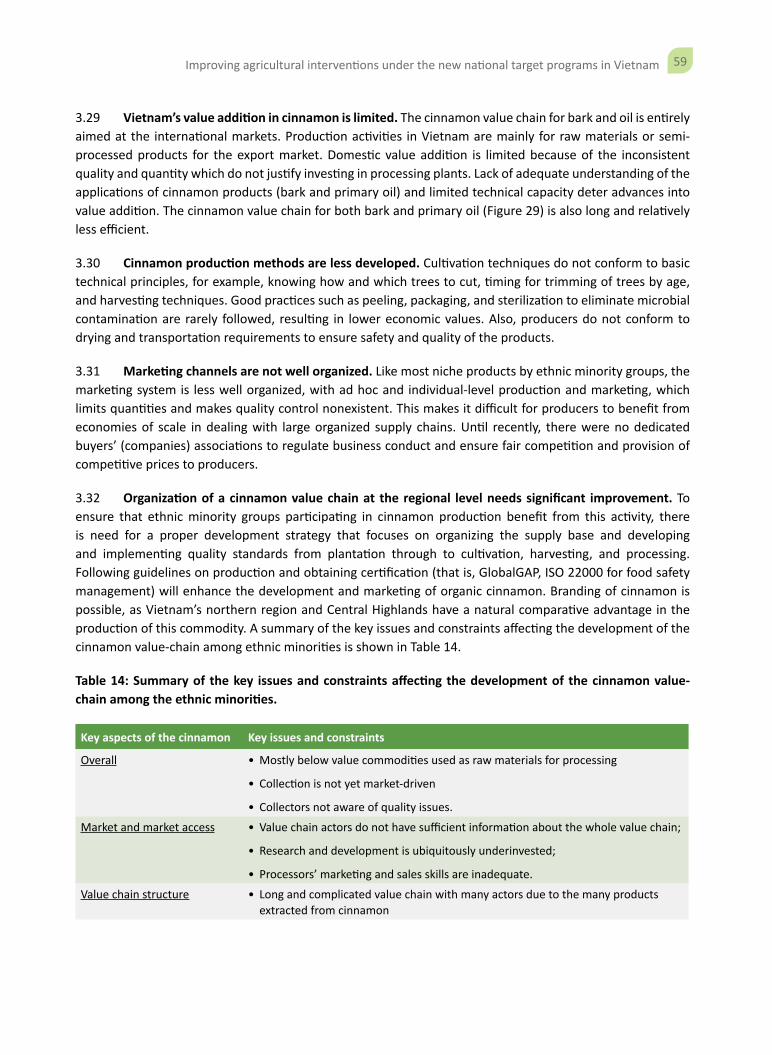
59Improving agricultural interventions under the new national target programs in Vietnam
3.29 Vietnam’s value addition in cinnamon is limited. The cinnamon value chain for bark and oil is entirely aimed at the international markets. Production activities in Vietnam are mainly for raw materials or semi-processed products for the export market. Domestic value addition is limited because of the inconsistent quality and quantity which do not justify investing in processing plants. Lack of adequate understanding of the applications of cinnamon products (bark and primary oil) and limited technical capacity deter advances into value addition. The cinnamon value chain for both bark and primary oil (Figure 29) is also long and relatively less efficient.
3.30 Cinnamon production methods are less developed. Cultivation techniques do not conform to basic technical principles, for example, knowing how and which trees to cut, timing for trimming of trees by age, and harvesting techniques. Good practices such as peeling, packaging, and sterilization to eliminate microbial contamination are rarely followed, resulting in lower economic values. Also, producers do not conform to drying and transportation requirements to ensure safety and quality of the products.
3.31 Marketing channels are not well organized. Like most niche products by ethnic minority groups, the marketing system is less well organized, with ad hoc and individual-level production and marketing, which limits quantities and makes quality control nonexistent. This makes it difficult for producers to benefit from economies of scale in dealing with large organized supply chains. Until recently, there were no dedicated buyers’ (companies) associations to regulate business conduct and ensure fair competition and provision of competitive prices to producers.
3.32 Organization of a cinnamon value chain at the regional level needs significant improvement. To ensure that ethnic minority groups participating in cinnamon production benefit from this activity, there is need for a proper development strategy that focuses on organizing the supply base and developing and implementing quality standards from plantation through to cultivation, harvesting, and processing. Following guidelines on production and obtaining certification (that is, GlobalGAP, ISO 22000 for food safety management) will enhance the development and marketing of organic cinnamon. Branding of cinnamon is possible, as Vietnam’s northern region and Central Highlands have a natural comparative advantage in the production of this commodity. A summary of the key issues and constraints affecting the development of the cinnamon value-chain among ethnic minorities is shown in Table 14.
Table 14: Summary of the key issues and constraints affecting the development of the cinnamon value-chain among the ethnic minorities.
Key aspects of the cinnamon Key issues and constraints
Overall • Mostly below value commodities used as raw materials for processing
• Collection is not yet market-driven
• Collectors not aware of quality issues.
Market and market access • Value chain actors do not have sufficient information about the whole value chain;
• Research and development is ubiquitously underinvested;
• Processors’ marketing and sales skills are inadequate.
Value chain structure • Long and complicated value chain with many actors due to the many products extracted from cinnamon
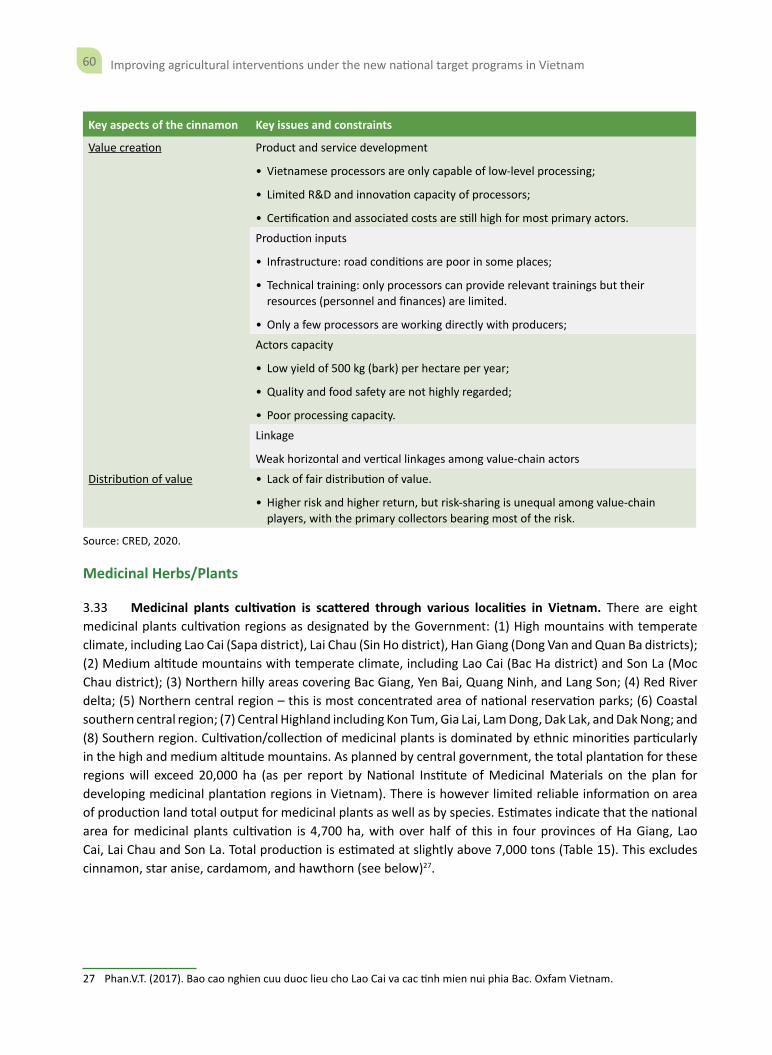
60 Improving agricultural interventions under the new national target programs in Vietnam
Key aspects of the cinnamon Key issues and constraints
Value creation Product and service development
• Vietnamese processors are only capable of low-level processing;
• Limited R&D and innovation capacity of processors;
• Certification and associated costs are still high for most primary actors.
Production inputs
• Infrastructure: road conditions are poor in some places;
• Technical training: only processors can provide relevant trainings but their resources (personnel and finances) are limited.
• Only a few processors are working directly with producers;
Actors capacity
• Low yield of 500 kg (bark) per hectare per year;
• Quality and food safety are not highly regarded;
• Poor processing capacity.
Linkage
Weak horizontal and vertical linkages among value-chain actors
Distribution of value • Lack of fair distribution of value.
• Higher risk and higher return, but risk-sharing is unequal among value-chain players, with the primary collectors bearing most of the risk.
Source: CRED, 2020.
Medicinal Herbs/Plants
3.33 Medicinal plants cultivation is scattered through various localities in Vietnam. There are eight medicinal plants cultivation regions as designated by the Government: (1) High mountains with temperate climate, including Lao Cai (Sapa district), Lai Chau (Sin Ho district), Han Giang (Dong Van and Quan Ba districts); (2) Medium altitude mountains with temperate climate, including Lao Cai (Bac Ha district) and Son La (Moc Chau district); (3) Northern hilly areas covering Bac Giang, Yen Bai, Quang Ninh, and Lang Son; (4) Red River delta; (5) Northern central region – this is most concentrated area of national reservation parks; (6) Coastal southern central region; (7) Central Highland including Kon Tum, Gia Lai, Lam Dong, Dak Lak, and Dak Nong; and (8) Southern region. Cultivation/collection of medicinal plants is dominated by ethnic minorities particularly in the high and medium altitude mountains. As planned by central government, the total plantation for these regions will exceed 20,000 ha (as per report by National Institute of Medicinal Materials on the plan for developing medicinal plantation regions in Vietnam). There is however limited reliable information on area of production land total output for medicinal plants as well as by species. Estimates indicate that the national area for medicinal plants cultivation is 4,700 ha, with over half of this in four provinces of Ha Giang, Lao Cai, Lai Chau and Son La. Total production is estimated at slightly above 7,000 tons (Table 15). This excludes cinnamon, star anise, cardamom, and hawthorn (see below)27.
27 Phan.V.T. (2017). Bao cao nghien cuu duoc lieu cho Lao Cai va cac tinh mien nui phia Bac. Oxfam Vietnam.
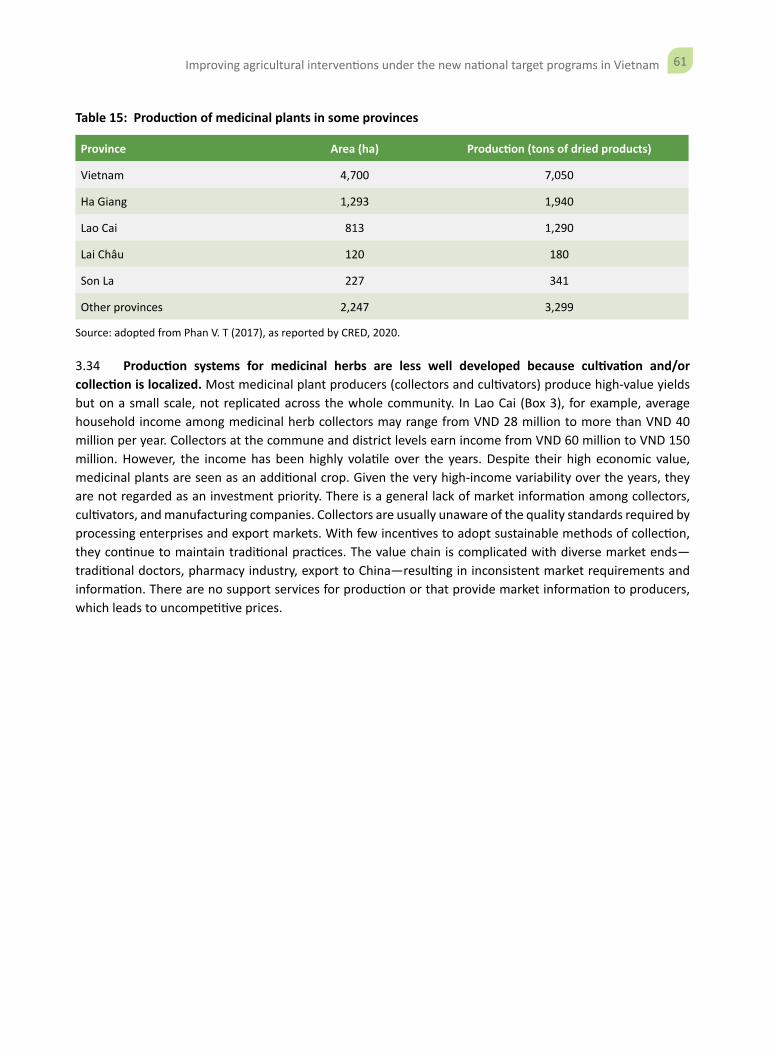
61Improving agricultural interventions under the new national target programs in Vietnam
Table 15: Production of medicinal plants in some provinces
Province Area (ha) Production (tons of dried products)
Vietnam 4,700 7,050
Ha Giang 1,293 1,940
Lao Cai 813 1,290
Lai Châu 120 180
Son La 227 341
Other provinces 2,247 3,299
Source: adopted from Phan V. T (2017), as reported by CRED, 2020.
3.34 Production systems for medicinal herbs are less well developed because cultivation and/or collection is localized. Most medicinal plant producers (collectors and cultivators) produce high-value yields but on a small scale, not replicated across the whole community. In Lao Cai (Box 3), for example, average household income among medicinal herb collectors may range from VND 28 million to more than VND 40 million per year. Collectors at the commune and district levels earn income from VND 60 million to VND 150 million. However, the income has been highly volatile over the years. Despite their high economic value, medicinal plants are seen as an additional crop. Given the very high-income variability over the years, they are not regarded as an investment priority. There is a general lack of market information among collectors, cultivators, and manufacturing companies. Collectors are usually unaware of the quality standards required by processing enterprises and export markets. With few incentives to adopt sustainable methods of collection, they continue to maintain traditional practices. The value chain is complicated with diverse market ends—traditional doctors, pharmacy industry, export to China—resulting in inconsistent market requirements and information. There are no support services for production or that provide market information to producers, which leads to uncompetitive prices.
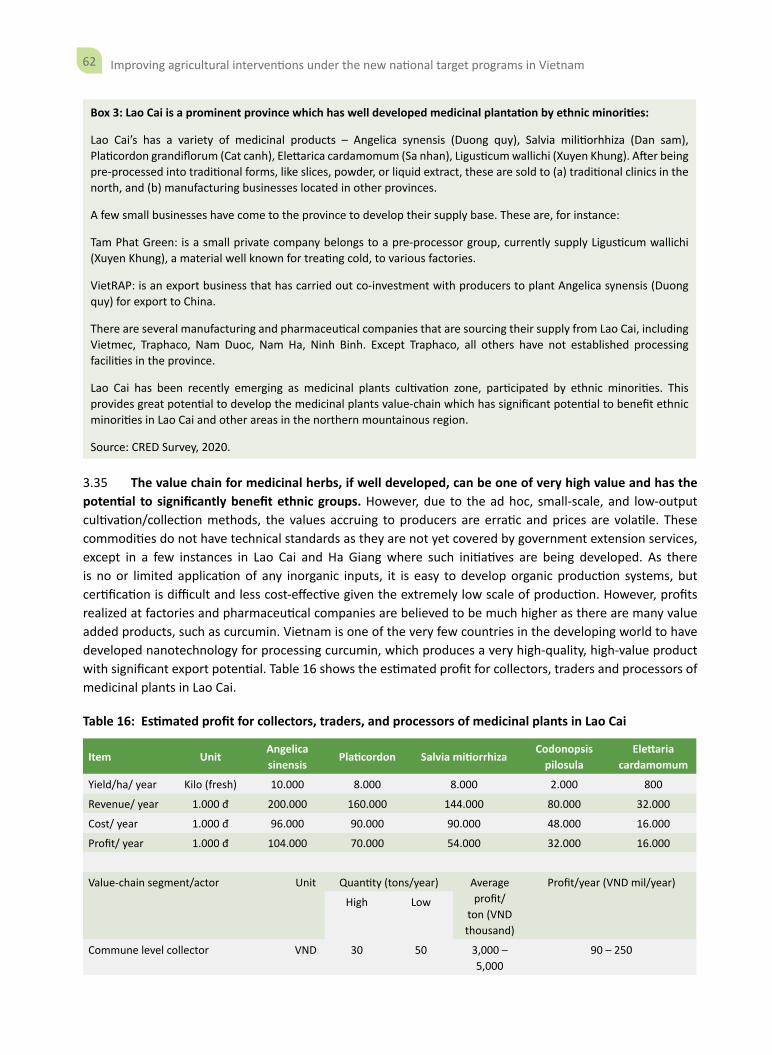
62 Improving agricultural interventions under the new national target programs in Vietnam
Box 3: Lao Cai is a prominent province which has well developed medicinal plantation by ethnic minorities:
Lao Cai’s has a variety of medicinal products – Angelica synensis (Duong quy), Salvia militiorhhiza (Dan sam), Platicordon grandiflorum (Cat canh), Elettarica cardamomum (Sa nhan), Ligusticum wallichi (Xuyen Khung). After being pre-processed into traditional forms, like slices, powder, or liquid extract, these are sold to (a) traditional clinics in the north, and (b) manufacturing businesses located in other provinces.
A few small businesses have come to the province to develop their supply base. These are, for instance:
Tam Phat Green: is a small private company belongs to a pre-processor group, currently supply Ligusticum wallichi (Xuyen Khung), a material well known for treating cold, to various factories.
VietRAP: is an export business that has carried out co-investment with producers to plant Angelica synensis (Duong quy) for export to China.
There are several manufacturing and pharmaceutical companies that are sourcing their supply from Lao Cai, including Vietmec, Traphaco, Nam Duoc, Nam Ha, Ninh Binh. Except Traphaco, all others have not established processing facilities in the province.
Lao Cai has been recently emerging as medicinal plants cultivation zone, participated by ethnic minorities. This provides great potential to develop the medicinal plants value-chain which has significant potential to benefit ethnic minorities in Lao Cai and other areas in the northern mountainous region.
Source: CRED Survey, 2020.
3.35 The value chain for medicinal herbs, if well developed, can be one of very high value and has the potential to significantly benefit ethnic groups. However, due to the ad hoc, small-scale, and low-output cultivation/collection methods, the values accruing to producers are erratic and prices are volatile. These commodities do not have technical standards as they are not yet covered by government extension services, except in a few instances in Lao Cai and Ha Giang where such initiatives are being developed. As there is no or limited application of any inorganic inputs, it is easy to develop organic production systems, but certification is difficult and less cost-effective given the extremely low scale of production. However, profits realized at factories and pharmaceutical companies are believed to be much higher as there are many value added products, such as curcumin. Vietnam is one of the very few countries in the developing world to have developed nanotechnology for processing curcumin, which produces a very high-quality, high-value product with significant export potential. Table 16 shows the estimated profit for collectors, traders and processors of medicinal plants in Lao Cai.
Table 16: Estimated profit for collectors, traders, and processors of medicinal plants in Lao Cai
Item UnitAngelica sinensis
Platicordon Salvia mitiorrhizaCodonopsis
pilosulaElettaria
cardamomum
Yield/ha/ year Kilo (fresh) 10.000 8.000 8.000 2.000 800
Revenue/ year 1.000 đ 200.000 160.000 144.000 80.000 32.000
Cost/ year 1.000 đ 96.000 90.000 90.000 48.000 16.000
Profit/ year 1.000 đ 104.000 70.000 54.000 32.000 16.000
Value-chain segment/actor Unit Quantity (tons/year) Average profit/
ton (VND thousand)
Profit/year (VND mil/year)
High Low
Commune level collector VND 30 50 3,000 – 5,000
90 – 250
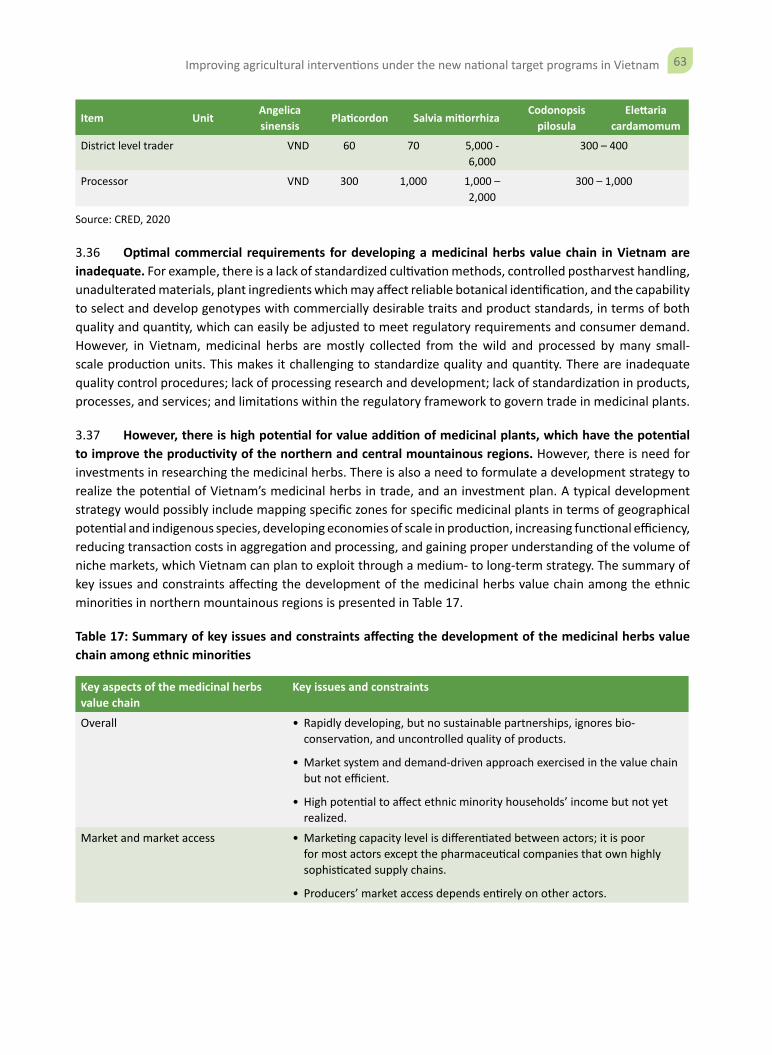
63Improving agricultural interventions under the new national target programs in Vietnam
Item UnitAngelica sinensis
Platicordon Salvia mitiorrhizaCodonopsis
pilosulaElettaria
cardamomum
District level trader VND 60 70 5,000 - 6,000
300 – 400
Processor VND 300 1,000 1,000 – 2,000
300 – 1,000
Source: CRED, 2020
3.36 Optimal commercial requirements for developing a medicinal herbs value chain in Vietnam are inadequate. For example, there is a lack of standardized cultivation methods, controlled postharvest handling, unadulterated materials, plant ingredients which may affect reliable botanical identification, and the capability to select and develop genotypes with commercially desirable traits and product standards, in terms of both quality and quantity, which can easily be adjusted to meet regulatory requirements and consumer demand. However, in Vietnam, medicinal herbs are mostly collected from the wild and processed by many small-scale production units. This makes it challenging to standardize quality and quantity. There are inadequate quality control procedures; lack of processing research and development; lack of standardization in products, processes, and services; and limitations within the regulatory framework to govern trade in medicinal plants.
3.37 However, there is high potential for value addition of medicinal plants, which have the potential to improve the productivity of the northern and central mountainous regions. However, there is need for investments in researching the medicinal herbs. There is also a need to formulate a development strategy to realize the potential of Vietnam’s medicinal herbs in trade, and an investment plan. A typical development strategy would possibly include mapping specific zones for specific medicinal plants in terms of geographical potential and indigenous species, developing economies of scale in production, increasing functional efficiency, reducing transaction costs in aggregation and processing, and gaining proper understanding of the volume of niche markets, which Vietnam can plan to exploit through a medium- to long-term strategy. The summary of key issues and constraints affecting the development of the medicinal herbs value chain among the ethnic minorities in northern mountainous regions is presented in Table 17.
Table 17: Summary of key issues and constraints affecting the development of the medicinal herbs value chain among ethnic minorities
Key aspects of the medicinal herbs value chain
Key issues and constraints
Overall • Rapidly developing, but no sustainable partnerships, ignores bio-conservation, and uncontrolled quality of products.
• Market system and demand-driven approach exercised in the value chain but not efficient.
• High potential to affect ethnic minority households’ income but not yet realized.
Market and market access • Marketing capacity level is differentiated between actors; it is poor for most actors except the pharmaceutical companies that own highly sophisticated supply chains.
• Producers’ market access depends entirely on other actors.
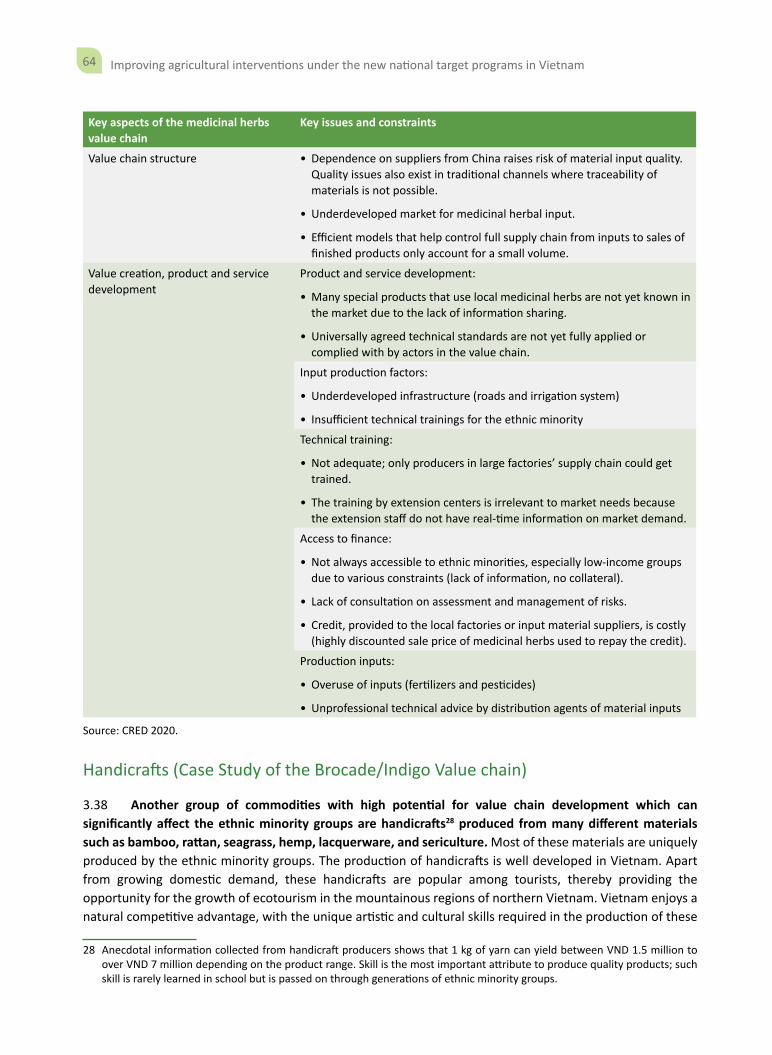
64 Improving agricultural interventions under the new national target programs in Vietnam
Key aspects of the medicinal herbs value chain
Key issues and constraints
Value chain structure • Dependence on suppliers from China raises risk of material input quality. Quality issues also exist in traditional channels where traceability of materials is not possible.
• Underdeveloped market for medicinal herbal input.
• Efficient models that help control full supply chain from inputs to sales of finished products only account for a small volume.
Value creation, product and service development
Product and service development:
• Many special products that use local medicinal herbs are not yet known in the market due to the lack of information sharing.
• Universally agreed technical standards are not yet fully applied or complied with by actors in the value chain.
Input production factors:
• Underdeveloped infrastructure (roads and irrigation system)
• Insufficient technical trainings for the ethnic minority
Technical training:
• Not adequate; only producers in large factories’ supply chain could get trained.
• The training by extension centers is irrelevant to market needs because the extension staff do not have real-time information on market demand.
Access to finance:
• Not always accessible to ethnic minorities, especially low-income groups due to various constraints (lack of information, no collateral).
• Lack of consultation on assessment and management of risks.
• Credit, provided to the local factories or input material suppliers, is costly (highly discounted sale price of medicinal herbs used to repay the credit).
Production inputs:
• Overuse of inputs (fertilizers and pesticides)
• Unprofessional technical advice by distribution agents of material inputs
Source: CRED 2020.
Handicrafts (Case Study of the Brocade/Indigo Value chain)
3.38 Another group of commodities with high potential for value chain development which can significantly affect the ethnic minority groups are handicrafts28 produced from many different materials such as bamboo, rattan, seagrass, hemp, lacquerware, and sericulture. Most of these materials are uniquely produced by the ethnic minority groups. The production of handicrafts is well developed in Vietnam. Apart from growing domestic demand, these handicrafts are popular among tourists, thereby providing the opportunity for the growth of ecotourism in the mountainous regions of northern Vietnam. Vietnam enjoys a natural competitive advantage, with the unique artistic and cultural skills required in the production of these
28 Anecdotal information collected from handicraft producers shows that 1 kg of yarn can yield between VND 1.5 million to over VND 7 million depending on the product range. Skill is the most important attribute to produce quality products; such skill is rarely learned in school but is passed on through generations of ethnic minority groups.
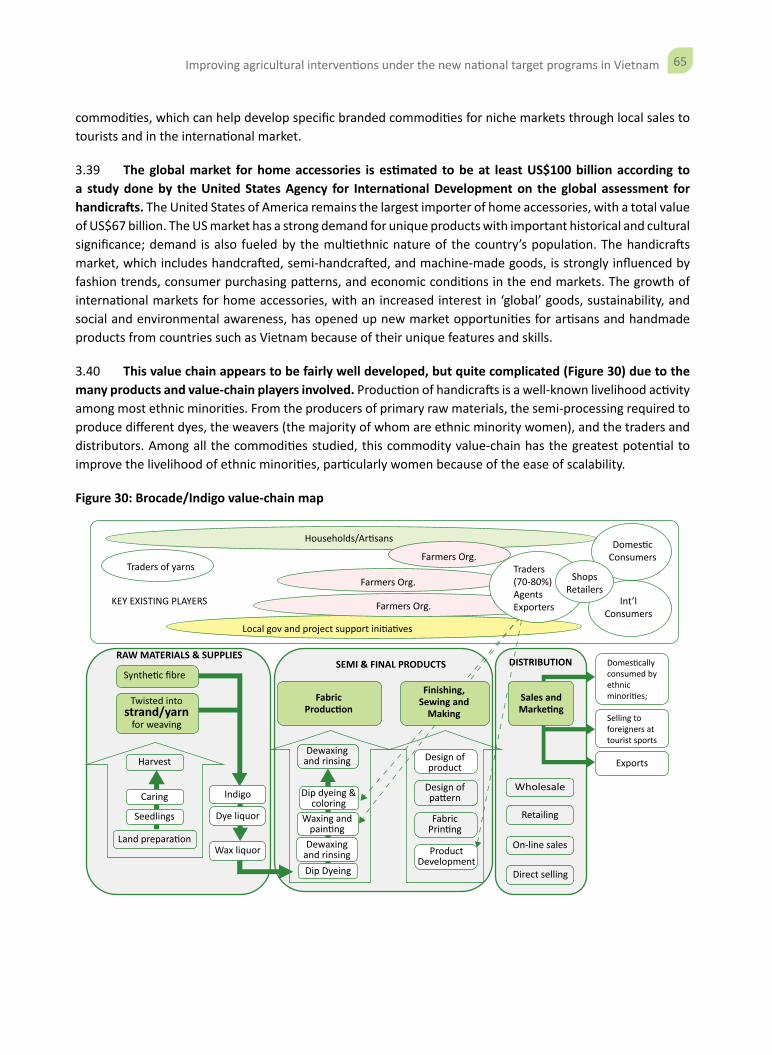
65Improving agricultural interventions under the new national target programs in Vietnam
commodities, which can help develop specific branded commodities for niche markets through local sales to tourists and in the international market.
3.39 The global market for home accessories is estimated to be at least US$100 billion according to a study done by the United States Agency for International Development on the global assessment for handicrafts. The United States of America remains the largest importer of home accessories, with a total value of US$67 billion. The US market has a strong demand for unique products with important historical and cultural significance; demand is also fueled by the multiethnic nature of the country’s population. The handicrafts market, which includes handcrafted, semi-handcrafted, and machine-made goods, is strongly influenced by fashion trends, consumer purchasing patterns, and economic conditions in the end markets. The growth of international markets for home accessories, with an increased interest in ‘global’ goods, sustainability, and social and environmental awareness, has opened up new market opportunities for artisans and handmade products from countries such as Vietnam because of their unique features and skills.
3.40 This value chain appears to be fairly well developed, but quite complicated (Figure 30) due to the many products and value-chain players involved. Production of handicrafts is a well-known livelihood activity among most ethnic minorities. From the producers of primary raw materials, the semi-processing required to produce different dyes, the weavers (the majority of whom are ethnic minority women), and the traders and distributors. Among all the commodities studied, this commodity value-chain has the greatest potential to improve the livelihood of ethnic minorities, particularly women because of the ease of scalability.
Figure 30: Brocade/Indigo value-chain map
Local gov and project support ini�a�ves
Traders of yarns
KEY EXISTING PLAYERS
Domes�callyconsumed byethnicminori�es;
Selling toforeigners attourist sports
Exports
Design ofpa�ern
FabricPrin�ng
Dewaxingand rinsingHarvest
RAW MATERIALS & SUPPLIESSEMI & FINAL PRODUCTS DISTRIBUTION
Farmers Org.
Farmers Org.
Direct selling
On-line sales
Retailing
Wholesale
FabricProduc�on
Finishing,Sewing and
MakingTwisted into
strand/yarnfor weaving
Synthe�c fibre
Land prepara�on
Indigo
Dye liquor
Dip dyeing &coloring
Waxing andpain�ng
Dewaxingand rinsingDip Dyeing
Caring
Seedlings
Wax liquor
Design ofproduct
ProductDevelopment
Domes�cConsumers
Int’lConsumers
Traders(70-80%)AgentsExporters
Households/Ar�sans
Farmers Org.
ShopsRetailers
Sales andMarke�ng
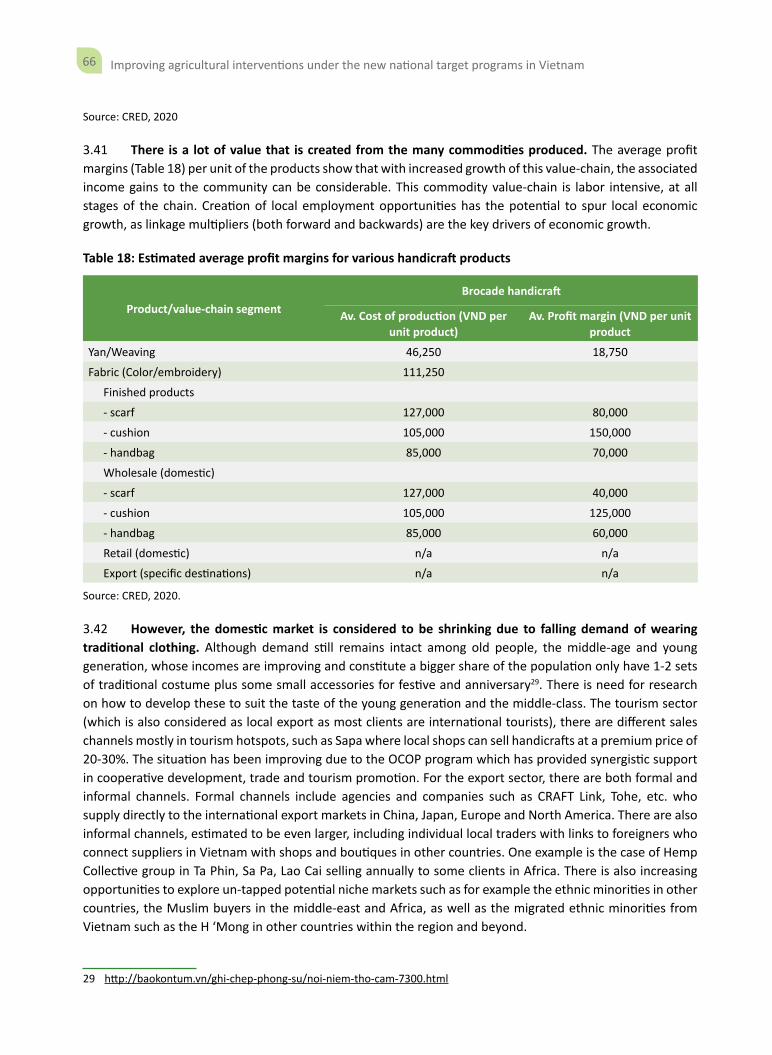
66 Improving agricultural interventions under the new national target programs in Vietnam
Source: CRED, 2020
3.41 There is a lot of value that is created from the many commodities produced. The average profit margins (Table 18) per unit of the products show that with increased growth of this value-chain, the associated income gains to the community can be considerable. This commodity value-chain is labor intensive, at all stages of the chain. Creation of local employment opportunities has the potential to spur local economic growth, as linkage multipliers (both forward and backwards) are the key drivers of economic growth.
Table 18: Estimated average profit margins for various handicraft products
Product/value-chain segment Brocade handicraft
Av. Cost of production (VND per unit product)
Av. Profit margin (VND per unit product
Yan/Weaving 46,250 18,750
Fabric (Color/embroidery) 111,250
Finished products
- scarf 127,000 80,000
- cushion 105,000 150,000
- handbag 85,000 70,000
Wholesale (domestic)
- scarf 127,000 40,000
- cushion 105,000 125,000
- handbag 85,000 60,000
Retail (domestic) n/a n/a
Export (specific destinations) n/a n/a
Source: CRED, 2020.
3.42 However, the domestic market is considered to be shrinking due to falling demand of wearing traditional clothing. Although demand still remains intact among old people, the middle-age and young generation, whose incomes are improving and constitute a bigger share of the population only have 1-2 sets of traditional costume plus some small accessories for festive and anniversary29. There is need for research on how to develop these to suit the taste of the young generation and the middle-class. The tourism sector (which is also considered as local export as most clients are international tourists), there are different sales channels mostly in tourism hotspots, such as Sapa where local shops can sell handicrafts at a premium price of 20-30%. The situation has been improving due to the OCOP program which has provided synergistic support in cooperative development, trade and tourism promotion. For the export sector, there are both formal and informal channels. Formal channels include agencies and companies such as CRAFT Link, Tohe, etc. who supply directly to the international export markets in China, Japan, Europe and North America. There are also informal channels, estimated to be even larger, including individual local traders with links to foreigners who connect suppliers in Vietnam with shops and boutiques in other countries. One example is the case of Hemp Collective group in Ta Phin, Sa Pa, Lao Cai selling annually to some clients in Africa. There is also increasing opportunities to explore un-tapped potential niche markets such as for example the ethnic minorities in other countries, the Muslim buyers in the middle-east and Africa, as well as the migrated ethnic minorities from Vietnam such as the H ‘Mong in other countries within the region and beyond.
29 http://baokontum.vn/ghi-chep-phong-su/noi-niem-tho-cam-7300.html
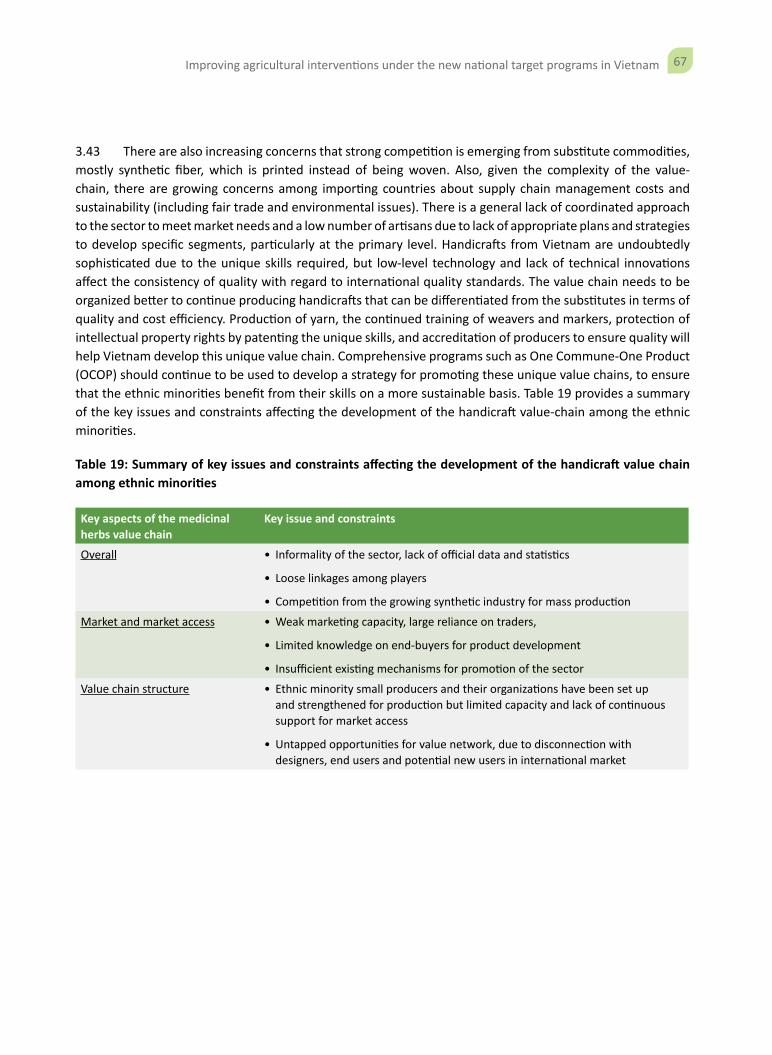
67Improving agricultural interventions under the new national target programs in Vietnam
3.43 There are also increasing concerns that strong competition is emerging from substitute commodities, mostly synthetic fiber, which is printed instead of being woven. Also, given the complexity of the value-chain, there are growing concerns among importing countries about supply chain management costs and sustainability (including fair trade and environmental issues). There is a general lack of coordinated approach to the sector to meet market needs and a low number of artisans due to lack of appropriate plans and strategies to develop specific segments, particularly at the primary level. Handicrafts from Vietnam are undoubtedly sophisticated due to the unique skills required, but low-level technology and lack of technical innovations affect the consistency of quality with regard to international quality standards. The value chain needs to be organized better to continue producing handicrafts that can be differentiated from the substitutes in terms of quality and cost efficiency. Production of yarn, the continued training of weavers and markers, protection of intellectual property rights by patenting the unique skills, and accreditation of producers to ensure quality will help Vietnam develop this unique value chain. Comprehensive programs such as One Commune-One Product (OCOP) should continue to be used to develop a strategy for promoting these unique value chains, to ensure that the ethnic minorities benefit from their skills on a more sustainable basis. Table 19 provides a summary of the key issues and constraints affecting the development of the handicraft value-chain among the ethnic minorities.
Table 19: Summary of key issues and constraints affecting the development of the handicraft value chain among ethnic minorities
Key aspects of the medicinal herbs value chain
Key issue and constraints
Overall • Informality of the sector, lack of official data and statistics
• Loose linkages among players
• Competition from the growing synthetic industry for mass production
Market and market access • Weak marketing capacity, large reliance on traders,
• Limited knowledge on end-buyers for product development
• Insufficient existing mechanisms for promotion of the sector
Value chain structure • Ethnic minority small producers and their organizations have been set up and strengthened for production but limited capacity and lack of continuous support for market access
• Untapped opportunities for value network, due to disconnection with designers, end users and potential new users in international market
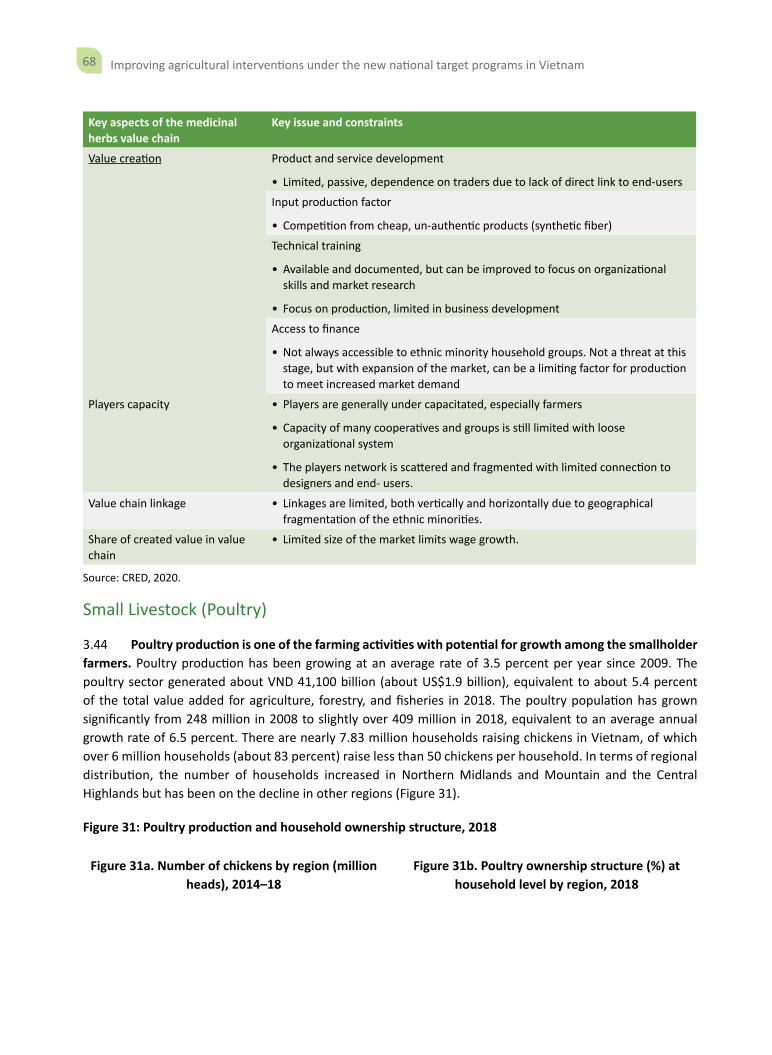
68 Improving agricultural interventions under the new national target programs in Vietnam
Key aspects of the medicinal herbs value chain
Key issue and constraints
Value creation Product and service development
• Limited, passive, dependence on traders due to lack of direct link to end-users
Input production factor
• Competition from cheap, un-authentic products (synthetic fiber)
Technical training
• Available and documented, but can be improved to focus on organizational skills and market research
• Focus on production, limited in business development
Access to finance
• Not always accessible to ethnic minority household groups. Not a threat at this stage, but with expansion of the market, can be a limiting factor for production to meet increased market demand
Players capacity • Players are generally under capacitated, especially farmers
• Capacity of many cooperatives and groups is still limited with loose organizational system
• The players network is scattered and fragmented with limited connection to designers and end- users.
Value chain linkage • Linkages are limited, both vertically and horizontally due to geographical fragmentation of the ethnic minorities.
Share of created value in value chain
• Limited size of the market limits wage growth.
Source: CRED, 2020.
Small Livestock (Poultry)
3.44 Poultry production is one of the farming activities with potential for growth among the smallholder farmers. Poultry production has been growing at an average rate of 3.5 percent per year since 2009. The poultry sector generated about VND 41,100 billion (about US$1.9 billion), equivalent to about 5.4 percent of the total value added for agriculture, forestry, and fisheries in 2018. The poultry population has grown significantly from 248 million in 2008 to slightly over 409 million in 2018, equivalent to an average annual growth rate of 6.5 percent. There are nearly 7.83 million households raising chickens in Vietnam, of which over 6 million households (about 83 percent) raise less than 50 chickens per household. In terms of regional distribution, the number of households increased in Northern Midlands and Mountain and the Central Highlands but has been on the decline in other regions (Figure 31).
Figure 31: Poultry production and household ownership structure, 2018
Figure 31a. Number of chickens by region (million heads), 2014–18
Figure 31b. Poultry ownership structure (%) at household level by region, 2018
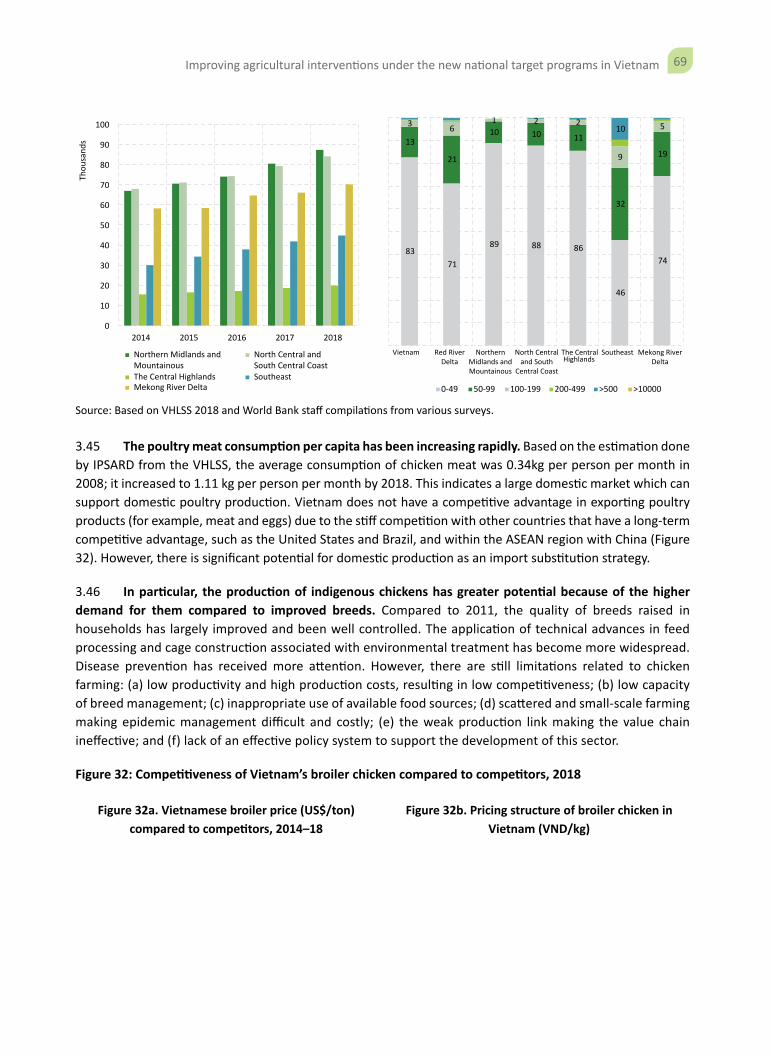
69Improving agricultural interventions under the new national target programs in Vietnam
0
10
20
30
40
50
60
70
80
90
100
2014 2015 2016 2017 2018
Thou
sand
s
Northern Midlands andMountainous
North Central andSouth Central Coast
The Central Highlands SoutheastMekong River Delta
8371
89 88 86
46
74
13
21
10 10 11
32
19
3 61 2 2
9
510
Vietnam Red RiverDelta
NorthernMidlands andMountainous
North Centraland South
Central Coast
The CentralHighlands
Southeast Mekong RiverDelta
0-49 50-99 100-199 200-499 >500 >10000
Source: Based on VHLSS 2018 and World Bank staff compilations from various surveys.
3.45 The poultry meat consumption per capita has been increasing rapidly. Based on the estimation done by IPSARD from the VHLSS, the average consumption of chicken meat was 0.34kg per person per month in 2008; it increased to 1.11 kg per person per month by 2018. This indicates a large domestic market which can support domestic poultry production. Vietnam does not have a competitive advantage in exporting poultry products (for example, meat and eggs) due to the stiff competition with other countries that have a long-term competitive advantage, such as the United States and Brazil, and within the ASEAN region with China (Figure 32). However, there is significant potential for domestic production as an import substitution strategy.
3.46 In particular, the production of indigenous chickens has greater potential because of the higher demand for them compared to improved breeds. Compared to 2011, the quality of breeds raised in households has largely improved and been well controlled. The application of technical advances in feed processing and cage construction associated with environmental treatment has become more widespread. Disease prevention has received more attention. However, there are still limitations related to chicken farming: (a) low productivity and high production costs, resulting in low competitiveness; (b) low capacity of breed management; (c) inappropriate use of available food sources; (d) scattered and small-scale farming making epidemic management difficult and costly; (e) the weak production link making the value chain ineffective; and (f) lack of an effective policy system to support the development of this sector.
Figure 32: Competitiveness of Vietnam’s broiler chicken compared to competitors, 2018
Figure 32a. Vietnamese broiler price (US$/ton) compared to competitors, 2014–18
Figure 32b. Pricing structure of broiler chicken in Vietnam (VND/kg)
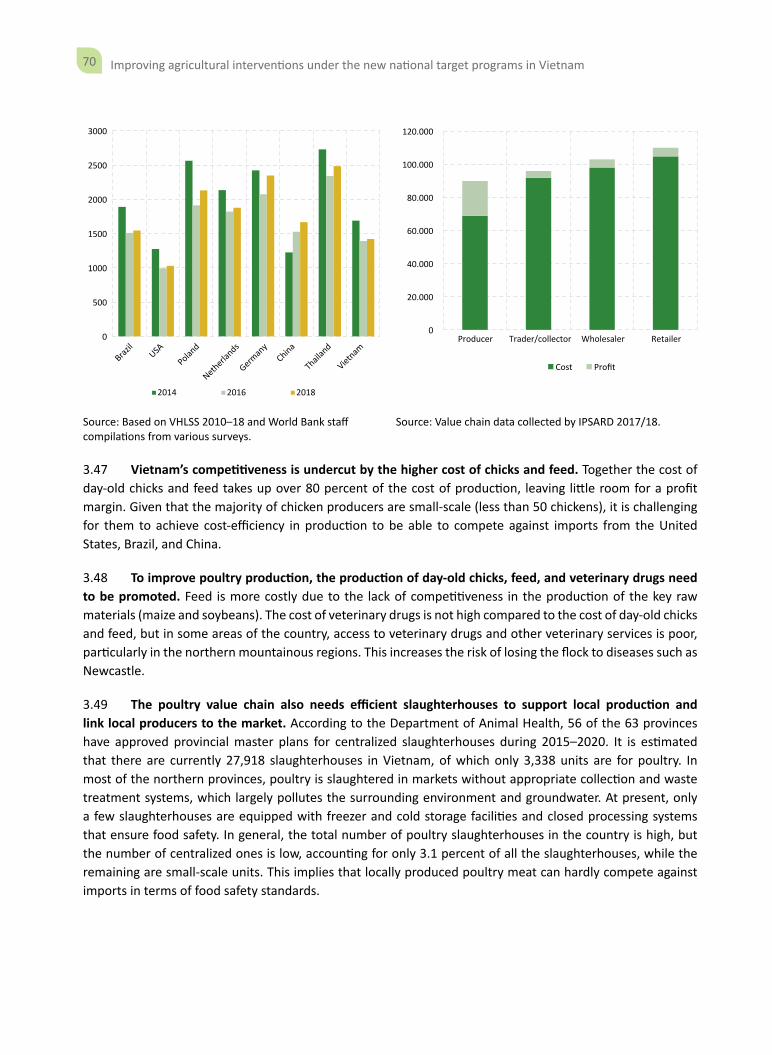
70 Improving agricultural interventions under the new national target programs in Vietnam
0
500
1000
1500
2000
2500
3000
2014 2016 2018
0
20.000
40.000
60.000
80.000
100.000
120.000
Producer
Brazil
USAPolan
d
Netherlands
German
yChina
Thailan
d
VietnamTrader/collector Wholesaler Retailer
Cost Profit
Source: Based on VHLSS 2010–18 and World Bank staff compilations from various surveys.
Source: Value chain data collected by IPSARD 2017/18.
3.47 Vietnam’s competitiveness is undercut by the higher cost of chicks and feed. Together the cost of day-old chicks and feed takes up over 80 percent of the cost of production, leaving little room for a profit margin. Given that the majority of chicken producers are small-scale (less than 50 chickens), it is challenging for them to achieve cost-efficiency in production to be able to compete against imports from the United States, Brazil, and China.
3.48 To improve poultry production, the production of day-old chicks, feed, and veterinary drugs need to be promoted. Feed is more costly due to the lack of competitiveness in the production of the key raw materials (maize and soybeans). The cost of veterinary drugs is not high compared to the cost of day-old chicks and feed, but in some areas of the country, access to veterinary drugs and other veterinary services is poor, particularly in the northern mountainous regions. This increases the risk of losing the flock to diseases such as Newcastle.
3.49 The poultry value chain also needs efficient slaughterhouses to support local production and link local producers to the market. According to the Department of Animal Health, 56 of the 63 provinces have approved provincial master plans for centralized slaughterhouses during 2015–2020. It is estimated that there are currently 27,918 slaughterhouses in Vietnam, of which only 3,338 units are for poultry. In most of the northern provinces, poultry is slaughtered in markets without appropriate collection and waste treatment systems, which largely pollutes the surrounding environment and groundwater. At present, only a few slaughterhouses are equipped with freezer and cold storage facilities and closed processing systems that ensure food safety. In general, the total number of poultry slaughterhouses in the country is high, but the number of centralized ones is low, accounting for only 3.1 percent of all the slaughterhouses, while the remaining are small-scale units. This implies that locally produced poultry meat can hardly compete against imports in terms of food safety standards.
71Improving agricultural interventions under the new national target programs in Vietnam
Box 4: Synthesis summary of some of the key issues affecting value chain development(details are provided in Section 4)
The analysis of these selected value chains aims to demonstrate the pro-poor commodities with significant potential to improve the productivity of the people in the northern regions, particularly among the ethnic minorities, given their unique skills and capabilities in producing most of these non-traditional commodities. Most of these commodities attract significant demand both within Vietnam and in the international market. Some of these, such as medicinal herbs, have the potential to access niche markets due to their unique medicinal, nutritional, and cosmetic applications, particularly as they contain natural ingredients derived from natural sources, including exotic food and flavors, antibiotic- and hormone-free ingredients, and organic foods. Most of these also have the potential to develop organic niches, which, upon certification, can allow farmers to benefit from the growing organic market within Vietnam and internationally.
However, as the analysis shows, a lot needs to be done to develop these into organized supply chains capable of competing in the regional and international markets. Investments in infrastructure and logistics are required to promote the vegetable, tea, and poultry value chains. Organization and production standards are required to improve the tea, medicinal herbs, and cinnamon value chains. For all these commodities, strengthening collective action is important to improve economies of scale and risk-sharing to encourage innovation beyond the traditional systems. Both horizontal and vertical links need to be improved to create access to favorable markets, which would drive investment and innovation.
Most of these value-chains offer greater potential for improving the participation of women. Women play fundamental roles in agriculture and related value-chains, estimated to contribute over 40 percent of its labor force worldwide. Sector-wide women’s labor force participation differs across and within countries and regions, from 20 percent in Latin America to 50 percent in parts of Africa and Asia (IFC, 2016). In Vietnam, a study conducted by the United Nations estimated that between 65-80 percent of the small holder agricultural producers are women (UN, 2013). In some value-chains, such as for example handicrafts weaving, production and collection of medicinal herbs and spices, women participation is predominantly high, but women traditionally participate in value chain nodes with lower economic return than men. As such, opportunities for women to start and expand successful agribusiness value-chains are still limited. Women face obstacles to obtain technical and managerial skills due to their limited access to education and technical training. Although training programmes on starting or improving agribusinesses are available in Viet Nam, most of them are designed for those with a certain degree of formal education, and they are less suitable for low-income women. Moreover, access to finance is very limited for poor people, especially women. Furthermore, women tend to work significantly longer hours than men, being responsible for a variety of tasks, including agricultural work, managing small businesses and being the primary caretaker of the family household and in the communities. Gender gaps therefore remain a persistent barrier to growth, profitability, and sustainability for most agro-based value-chains. Gender gaps in inputs and production can reduce the quantity and quality of the harvest; gender gaps in post-harvest processing and storage can lead to post-harvest losses; and gender gaps in transportation, marketing, and sales can result in fragmented and inefficient markets. It is therefore important for the design of agricultural production support under the new NTPs to apply gender-smart solutions based on detailed gender gap analysis.

72 Improving agricultural interventions under the new national target programs in Vietnam
Key issues/constraints Proposed interventions/recommendations
Value chain link
• Weak, limited, or nonexistent vertical and/or horizontal links among players in the value chain.
• Promote ethnic minority producer collaboration groups—formulation and capacity building.
• Support establishment and development of collaborative arrangements between all actors in the value chains.
• Support models that enhance links between actors, for example, traceability system, certified production and processing system, or information sharing platforms, e.g. well-planned study tours.
Sharing value created through the supply chains
• Unfair sharing of value, leading to non-contract compliance including side selling of commodities, with primary producers mostly being on the receiving end
• Unethical behavior among both suppliers and buyers
• Strengthen contract compliance and ethical behavior among primary producers and buyers and other value chain stakeholders, through establishment of mechanisms for legal contract enforcement and close monitoring.
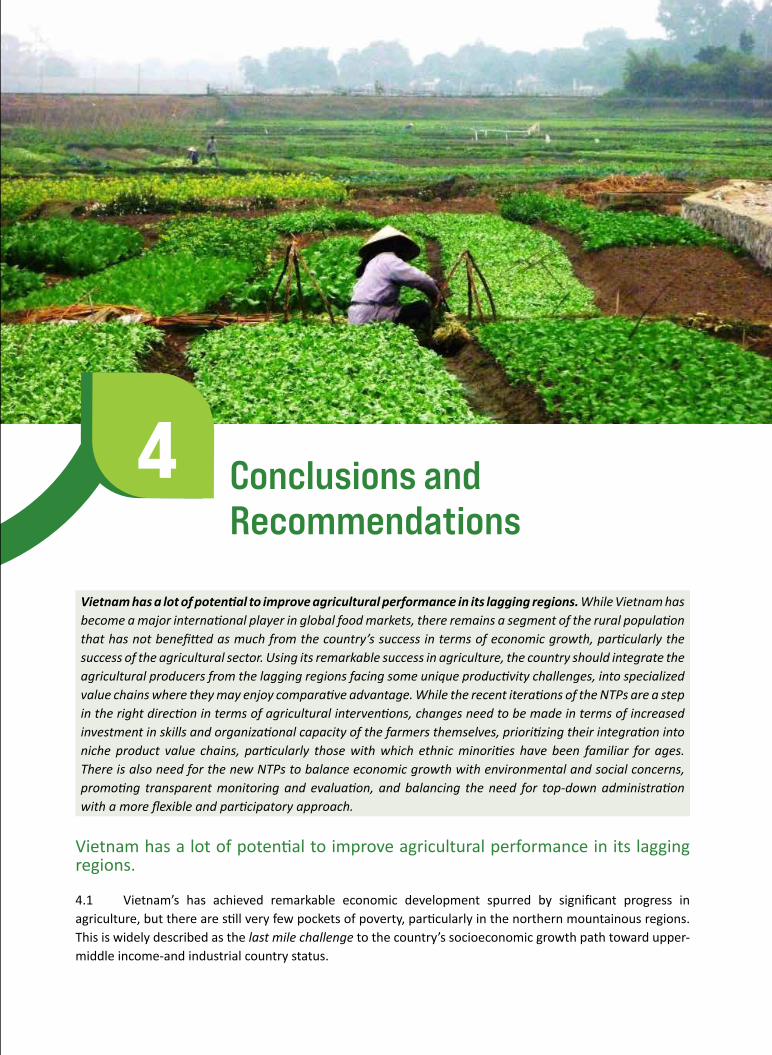
73Improving agricultural interventions under the new national target programs in Vietnam
4 Conclusions and Recommendations
Vietnam has a lot of potential to improve agricultural performance in its lagging regions. While Vietnam has become a major international player in global food markets, there remains a segment of the rural population that has not benefitted as much from the country’s success in terms of economic growth, particularly the success of the agricultural sector. Using its remarkable success in agriculture, the country should integrate the agricultural producers from the lagging regions facing some unique productivity challenges, into specialized value chains where they may enjoy comparative advantage. While the recent iterations of the NTPs are a step in the right direction in terms of agricultural interventions, changes need to be made in terms of increased investment in skills and organizational capacity of the farmers themselves, prioritizing their integration into niche product value chains, particularly those with which ethnic minorities have been familiar for ages. There is also need for the new NTPs to balance economic growth with environmental and social concerns, promoting transparent monitoring and evaluation, and balancing the need for top-down administration with a more flexible and participatory approach.
Vietnam has a lot of potential to improve agricultural performance in its lagging regions.
4.1 Vietnam’s has achieved remarkable economic development spurred by significant progress in agriculture, but there are still very few pockets of poverty, particularly in the northern mountainous regions. This is widely described as the last mile challenge to the country’s socioeconomic growth path toward upper-middle income-and industrial country status.
74 Improving agricultural interventions under the new national target programs in Vietnam
4.2 To address this last mile challenge, the GOV has resolved to formulate and implement the new NTP which will focus on the poor regions, targeting the poor, and more specifically the poor ethnic minorities in the northern mountainous regions. To achieve considerable poverty reduction, it is important to enhance the quality and relevance of agricultural interventions, given the heavy dependence of the majority on agriculture for their livelihoods. This report focuses on improving agricultural incomes as a pathway out of poverty for Vietnam’s lagging areas. Even though access to off-farm opportunities and non-farm wage incomes are becoming key drivers of poverty reduction, reflecting the remarkable structural transformation the country has been going through over the years, there are also significant gaps in agriculture incomes between the between regions, and between the poor and non-poor within the region. This suggests that agriculture transformation is yet to be fully completed, and there are untapped opportunities to further increase agricultural incomes of the poor. This report thus focuses on closing this gap in agriculture, as one of the viable pathways out of poverty for lagging regions, particularly among the poorest.
4.3 Vietnam’s agricultural success story over the last few decades provides a lot of potential to improve agricultural performance of its lagging regions. Since the early 1990s, Vietnam has been progressively becoming a major force on the global food market. The country has emerged as one of the world’s leading exporters of agro-food commodities, ranking among the top five global suppliers of fish, rice, coffee, tea, cashew nuts, black pepper, rubber, and cassava. From 2010, the number of commodities, over which Vietnam has emerged among the top 5 major suppliers, has doubled. In 2019, Vietnam was a major supplier in more than eight key global food value chains, raking in on average over US$3 billion from each commodity, resulting in a total agricultural export revenue of US$40.02 billion in 2018 and 2019. Since 2010, Vietnam’s agricultural exports have registered positive trade balances, reaching over US$7 billion in 2018. Vietnam’s buoyant agricultural export competitiveness is being consolidated through a renewed restructuring plan of the sector. Since 2013, a new vision for the agricultural sector and for the roles and modalities of government in the sector, as laid out in the ARP released in a decision by the Prime Minister in June 2013, has given the sector a renewed lease of life. The ARP is a radical change in sectoral strategic direction, which aims to achieve sectoral growth with efficiency and environmental sustainability. The plan thus emphasizes improvements in quality and sustainability of growth, and the quality of products, jobs, and other results.
4.4 However, maximizing agricultural productivity and consolidating sectoral transformation is not fully inclusive of and compatible with the lagging regions, and the poorest within them due to the unique characteristics and challenges affecting some of the lagging regions. As the analysis in Section II shows, the Northern Midlands and Mountain areas are less productive than the central, south east, and southern regions of the country. There are differences in the types of agriculture activities which account for the differences in agricultural income between the poor and non-poor rural farmers within regions. The analysis also shows that poor farmers in the mountainous areas generate less income from perennial and industrial crops which are more profitable there. Thus, there are unexploited opportunities for poor farmers in the region to increase agriculture incomes.
Scaling-up of value chain development through the new NTPs offers potential to narrow productivity differences
4.5 Boosting agricultural income is an important pathway out of poverty for households in the northern mountainous region, in addition to expanding off-farm income generating opportunities. Given that the country has made significant in-roads into global food value-chains, a viable agricultural development strategy for the lagging regions is to significantly scale-up the integration of these poorer producers and regions, who face major productivity challenges, into specialized value chains where they may have a comparative
75Improving agricultural interventions under the new national target programs in Vietnam
advantage.
4.6 The analysis of the selected value chains demonstrates some commodities with significant potential to improve the productivity of the people in the northern regions, particularly among the ethnic minority groups, given the unique skills and capabilities they have in the production of most of these nontraditional commodities. Most of these commodities command significant demand both within Vietnam and in the international market. Some of these, such as medicinal herbs, have the potential to access niche markets due to their unique medicinal, nutritional, and cosmetic applications, particularly as they contain natural ingredients derived from natural sources, including exotic food and flavors, antibiotic- and hormone-free ingredients, and organic foods. Most of these also have the potential to develop organic niches, which upon certification, can allow farmers to benefit from the growing organic market within Vietnam and internationally.
4.7 However, as the analysis shows, a lot needs to be done to develop these into organized supply chains capable of competing in the regional and international markets. Investments in infrastructure and logistics are required to promote the vegetable, tea, and poultry value chains. Organization and production standards are required to improve the tea, medicinal herbs, and cinnamon value chains. For all these commodities, strengthening collective action is important to improve economies of scale and risk-sharing to encourage innovation beyond the traditional systems. Both horizontal and vertical links need to be improved to create access to favorable markets, which would drive investment and innovation.
Recommendation for agricultural value-chain development
4.8 The value chain study offers detailed recommendations based on the analysis of key issues and constraints affecting the development of the value chains. Table 20 highlights the detailed issues, constraints, and proposed recommendations to help address the key identified constraints. The NCO of MARD and CEMA can further examine these when preparing the technical designs and implementation plans aimed at value chain development for the ethnic minorities. When examining these, there is also a need to consider some of the relevant international lessons and experiences. Also, in the COVID-19 context, flexibility must be maintained in these plans.
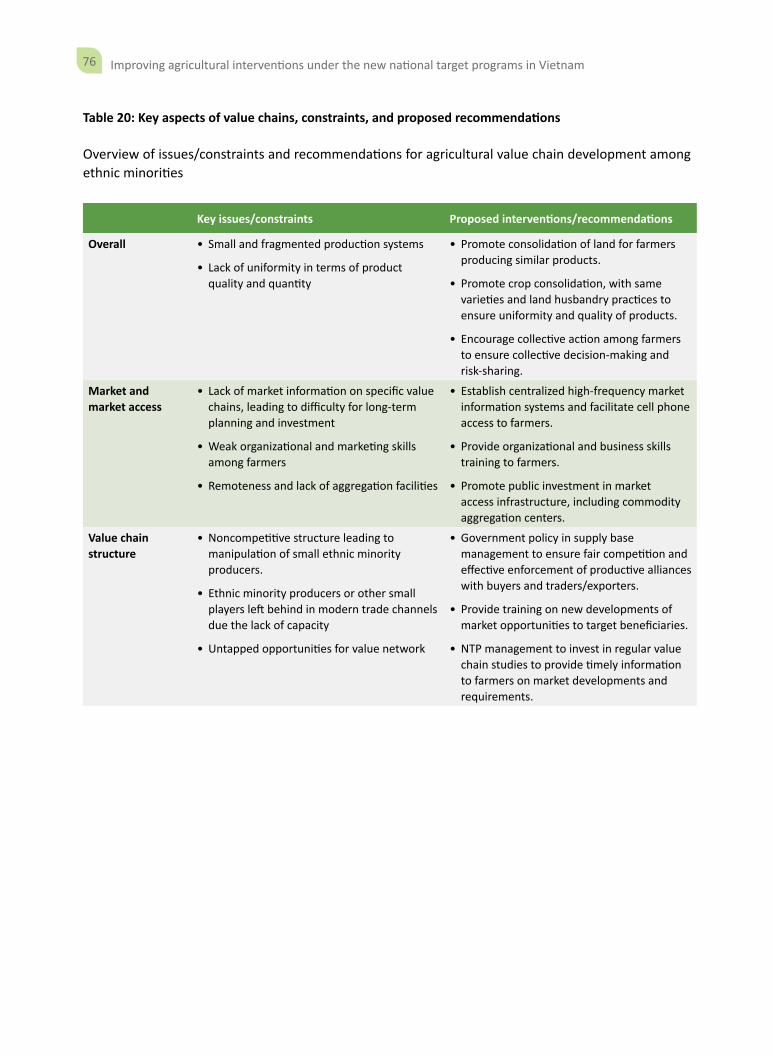
76 Improving agricultural interventions under the new national target programs in Vietnam
Table 20: Key aspects of value chains, constraints, and proposed recommendations
Overview of issues/constraints and recommendations for agricultural value chain development among ethnic minorities
Key issues/constraints Proposed interventions/recommendations
Overall • Small and fragmented production systems
• Lack of uniformity in terms of product quality and quantity
• Promote consolidation of land for farmers producing similar products.
• Promote crop consolidation, with same varieties and land husbandry practices to ensure uniformity and quality of products.
• Encourage collective action among farmers to ensure collective decision-making and risk-sharing.
Market and market access
• Lack of market information on specific value chains, leading to difficulty for long-term planning and investment
• Weak organizational and marketing skills among farmers
• Remoteness and lack of aggregation facilities
• Establish centralized high-frequency market information systems and facilitate cell phone access to farmers.
• Provide organizational and business skills training to farmers.
• Promote public investment in market access infrastructure, including commodity aggregation centers.
Value chain structure
• Noncompetitive structure leading to manipulation of small ethnic minority producers.
• Ethnic minority producers or other small players left behind in modern trade channels due the lack of capacity
• Untapped opportunities for value network
• Government policy in supply base management to ensure fair competition and effective enforcement of productive alliances with buyers and traders/exporters.
• Provide training on new developments of market opportunities to target beneficiaries.
• NTP management to invest in regular value chain studies to provide timely information to farmers on market developments and requirements.
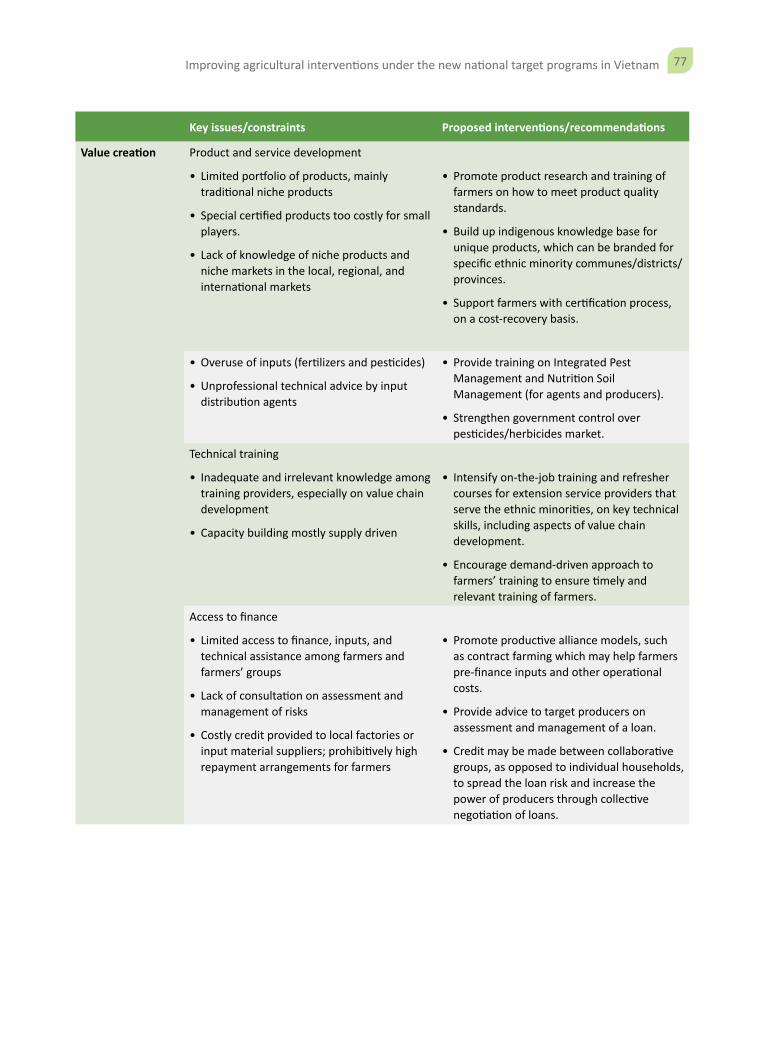
77Improving agricultural interventions under the new national target programs in Vietnam
Key issues/constraints Proposed interventions/recommendations
Value creation Product and service development
• Limited portfolio of products, mainly traditional niche products
• Special certified products too costly for small players.
• Lack of knowledge of niche products and niche markets in the local, regional, and international markets
• Promote product research and training of farmers on how to meet product quality standards.
• Build up indigenous knowledge base for unique products, which can be branded for specific ethnic minority communes/districts/provinces.
• Support farmers with certification process, on a cost-recovery basis.
• Overuse of inputs (fertilizers and pesticides)
• Unprofessional technical advice by input distribution agents
• Provide training on Integrated Pest Management and Nutrition Soil Management (for agents and producers).
• Strengthen government control over pesticides/herbicides market.
Technical training
• Inadequate and irrelevant knowledge among training providers, especially on value chain development
• Capacity building mostly supply driven
• Intensify on-the-job training and refresher courses for extension service providers that serve the ethnic minorities, on key technical skills, including aspects of value chain development.
• Encourage demand-driven approach to farmers’ training to ensure timely and relevant training of farmers.
Access to finance
• Limited access to finance, inputs, and technical assistance among farmers and farmers’ groups
• Lack of consultation on assessment and management of risks
• Costly credit provided to local factories or input material suppliers; prohibitively high repayment arrangements for farmers
• Promote productive alliance models, such as contract farming which may help farmers pre-finance inputs and other operational costs.
• Provide advice to target producers on assessment and management of a loan.
• Credit may be made between collaborative groups, as opposed to individual households, to spread the loan risk and increase the power of producers through collective negotiation of loans.
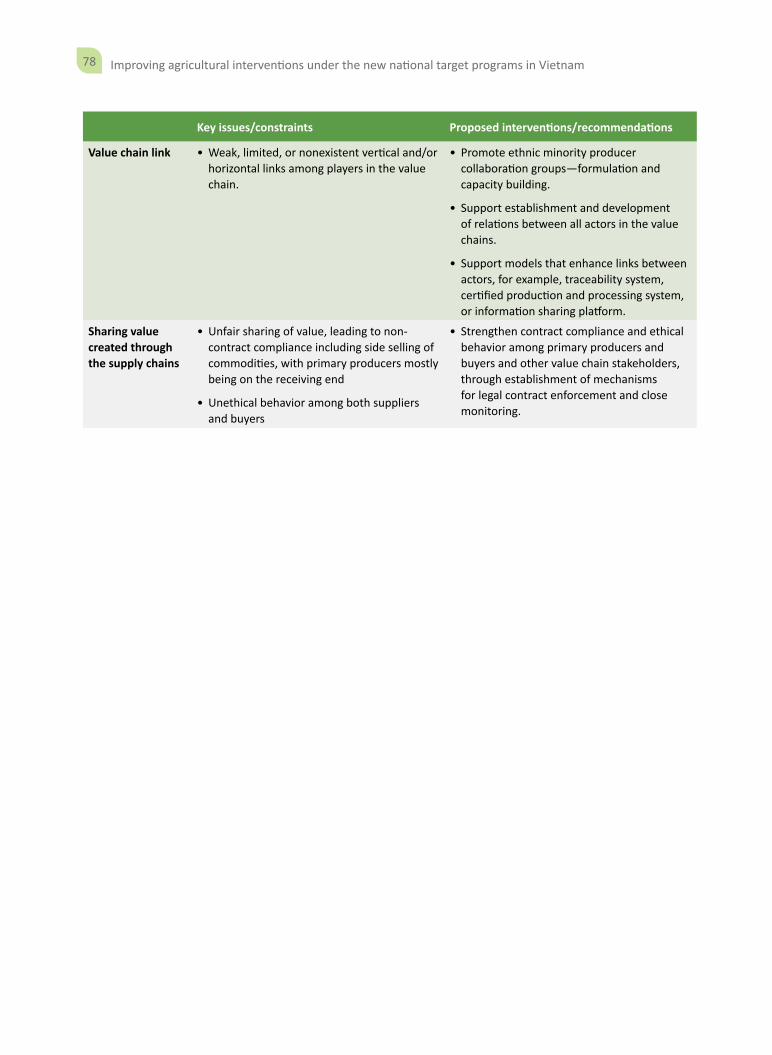
78 Improving agricultural interventions under the new national target programs in Vietnam
Key issues/constraints Proposed interventions/recommendations
Value chain link • Weak, limited, or nonexistent vertical and/or horizontal links among players in the value chain.
• Promote ethnic minority producer collaboration groups—formulation and capacity building.
• Support establishment and development of relations between all actors in the value chains.
• Support models that enhance links between actors, for example, traceability system, certified production and processing system, or information sharing platform.
Sharing value created through the supply chains
• Unfair sharing of value, leading to non-contract compliance including side selling of commodities, with primary producers mostly being on the receiving end
• Unethical behavior among both suppliers and buyers
• Strengthen contract compliance and ethical behavior among primary producers and buyers and other value chain stakeholders, through establishment of mechanisms for legal contract enforcement and close monitoring.
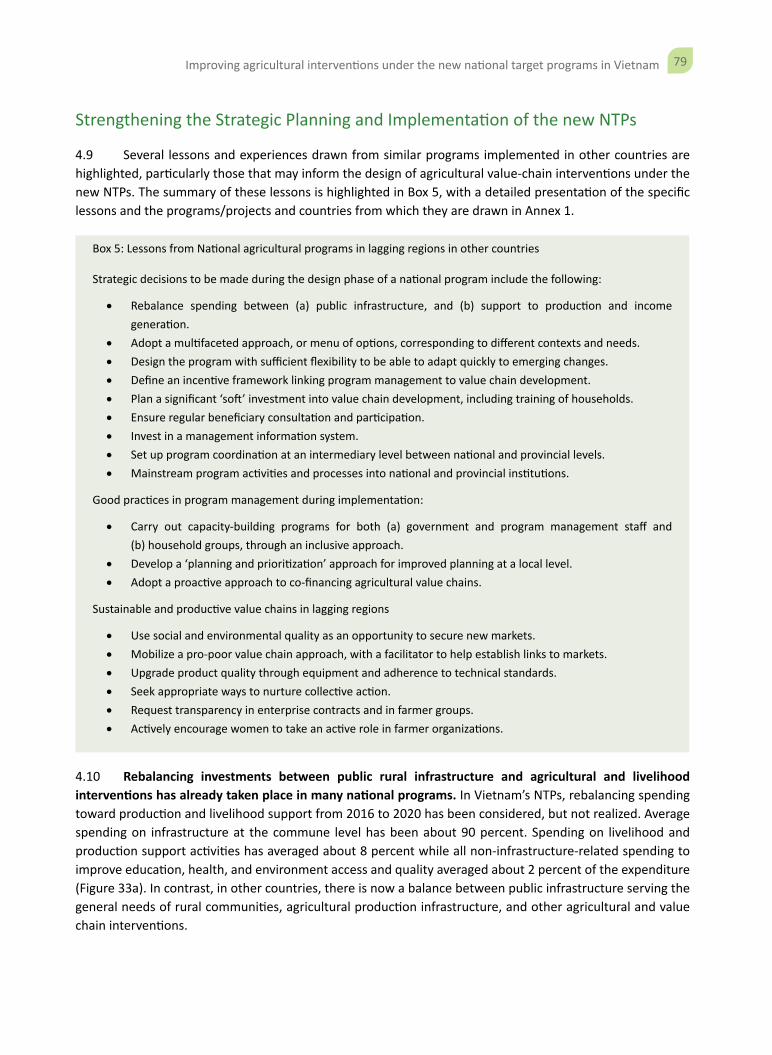
79Improving agricultural interventions under the new national target programs in Vietnam
Strengthening the Strategic Planning and Implementation of the new NTPs
4.9 Several lessons and experiences drawn from similar programs implemented in other countries are highlighted, particularly those that may inform the design of agricultural value-chain interventions under the new NTPs. The summary of these lessons is highlighted in Box 5, with a detailed presentation of the specific lessons and the programs/projects and countries from which they are drawn in Annex 1.
Box 5: Lessons from National agricultural programs in lagging regions in other countries
Strategic decisions to be made during the design phase of a national program include the following:
• Rebalance spending between (a) public infrastructure, and (b) support to production and income generation.
• Adopt a multifaceted approach, or menu of options, corresponding to different contexts and needs.• Design the program with sufficient flexibility to be able to adapt quickly to emerging changes.• Define an incentive framework linking program management to value chain development.• Plan a significant ‘soft’ investment into value chain development, including training of households.• Ensure regular beneficiary consultation and participation.• Invest in a management information system. • Set up program coordination at an intermediary level between national and provincial levels.• Mainstream program activities and processes into national and provincial institutions.
Good practices in program management during implementation:
• Carry out capacity-building programs for both (a) government and program management staff and (b) household groups, through an inclusive approach.
• Develop a ‘planning and prioritization’ approach for improved planning at a local level.• Adopt a proactive approach to co-financing agricultural value chains.
Sustainable and productive value chains in lagging regions
• Use social and environmental quality as an opportunity to secure new markets.• Mobilize a pro-poor value chain approach, with a facilitator to help establish links to markets.• Upgrade product quality through equipment and adherence to technical standards.• Seek appropriate ways to nurture collective action.• Request transparency in enterprise contracts and in farmer groups.• Actively encourage women to take an active role in farmer organizations.
4.10 Rebalancing investments between public rural infrastructure and agricultural and livelihood interventions has already taken place in many national programs. In Vietnam’s NTPs, rebalancing spending toward production and livelihood support from 2016 to 2020 has been considered, but not realized. Average spending on infrastructure at the commune level has been about 90 percent. Spending on livelihood and production support activities has averaged about 8 percent while all non-infrastructure-related spending to improve education, health, and environment access and quality averaged about 2 percent of the expenditure (Figure 33a). In contrast, in other countries, there is now a balance between public infrastructure serving the general needs of rural communities, agricultural production infrastructure, and other agricultural and value chain interventions.
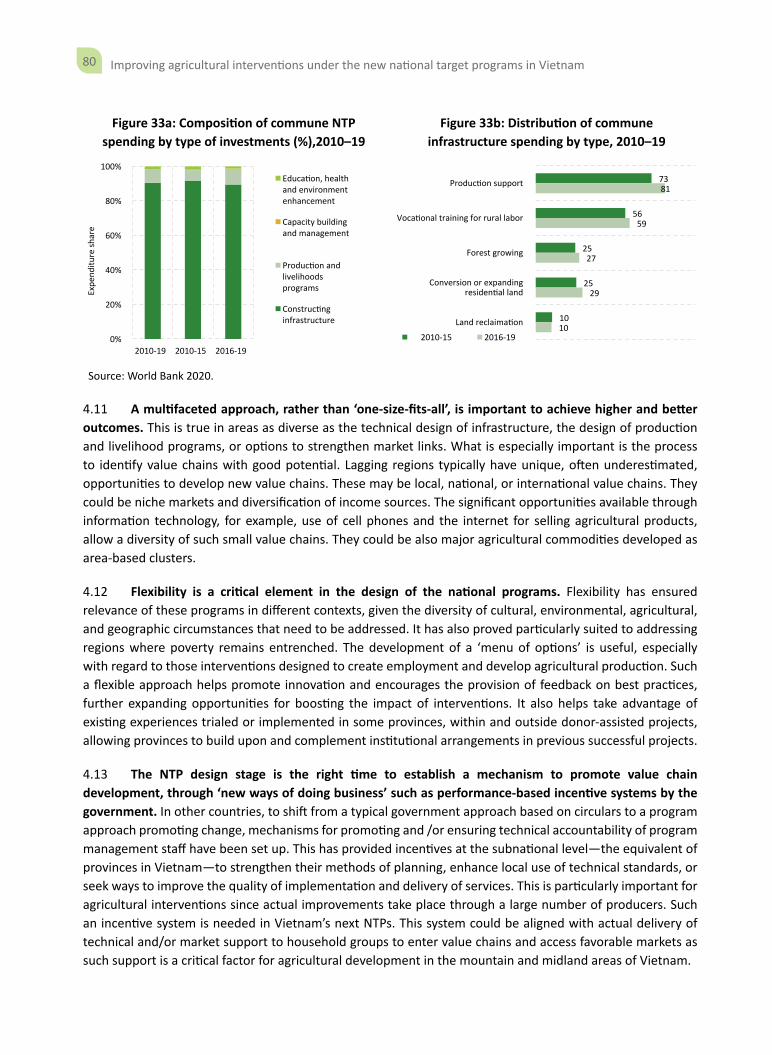
80 Improving agricultural interventions under the new national target programs in Vietnam
Figure 33a: Composition of commune NTP spending by type of investments (%),2010–19
Figure 33b: Distribution of commune infrastructure spending by type, 2010–19
0%
20%
40%
60%
80%
100%
2010-19 2010-15 2016-19
Expe
nditu
re sh
are
Educa�on, healthand environmentenhancement
Capacity buildingand management
Produc�on andlivelihoodsprograms
Construc�nginfrastructure
73
56
25
25
10
81
59
27
29
10
Produc�on support
Voca�onal training for rural labor
Forest growing
Conversion or expandingresiden�al land
Land reclaima�on
2010-15 2016-19
Source: World Bank 2020.
4.11 A multifaceted approach, rather than ‘one-size-fits-all’, is important to achieve higher and better outcomes. This is true in areas as diverse as the technical design of infrastructure, the design of production and livelihood programs, or options to strengthen market links. What is especially important is the process to identify value chains with good potential. Lagging regions typically have unique, often underestimated, opportunities to develop new value chains. These may be local, national, or international value chains. They could be niche markets and diversification of income sources. The significant opportunities available through information technology, for example, use of cell phones and the internet for selling agricultural products, allow a diversity of such small value chains. They could be also major agricultural commodities developed as area-based clusters.
4.12 Flexibility is a critical element in the design of the national programs. Flexibility has ensured relevance of these programs in different contexts, given the diversity of cultural, environmental, agricultural, and geographic circumstances that need to be addressed. It has also proved particularly suited to addressing regions where poverty remains entrenched. The development of a ‘menu of options’ is useful, especially with regard to those interventions designed to create employment and develop agricultural production. Such a flexible approach helps promote innovation and encourages the provision of feedback on best practices, further expanding opportunities for boosting the impact of interventions. It also helps take advantage of existing experiences trialed or implemented in some provinces, within and outside donor-assisted projects, allowing provinces to build upon and complement institutional arrangements in previous successful projects.
4.13 The NTP design stage is the right time to establish a mechanism to promote value chain development, through ‘new ways of doing business’ such as performance-based incentive systems by the government. In other countries, to shift from a typical government approach based on circulars to a program approach promoting change, mechanisms for promoting and /or ensuring technical accountability of program management staff have been set up. This has provided incentives at the subnational level—the equivalent of provinces in Vietnam—to strengthen their methods of planning, enhance local use of technical standards, or seek ways to improve the quality of implementation and delivery of services. This is particularly important for agricultural interventions since actual improvements take place through a large number of producers. Such an incentive system is needed in Vietnam’s next NTPs. This system could be aligned with actual delivery of technical and/or market support to household groups to enter value chains and access favorable markets as such support is a critical factor for agricultural development in the mountain and midland areas of Vietnam.
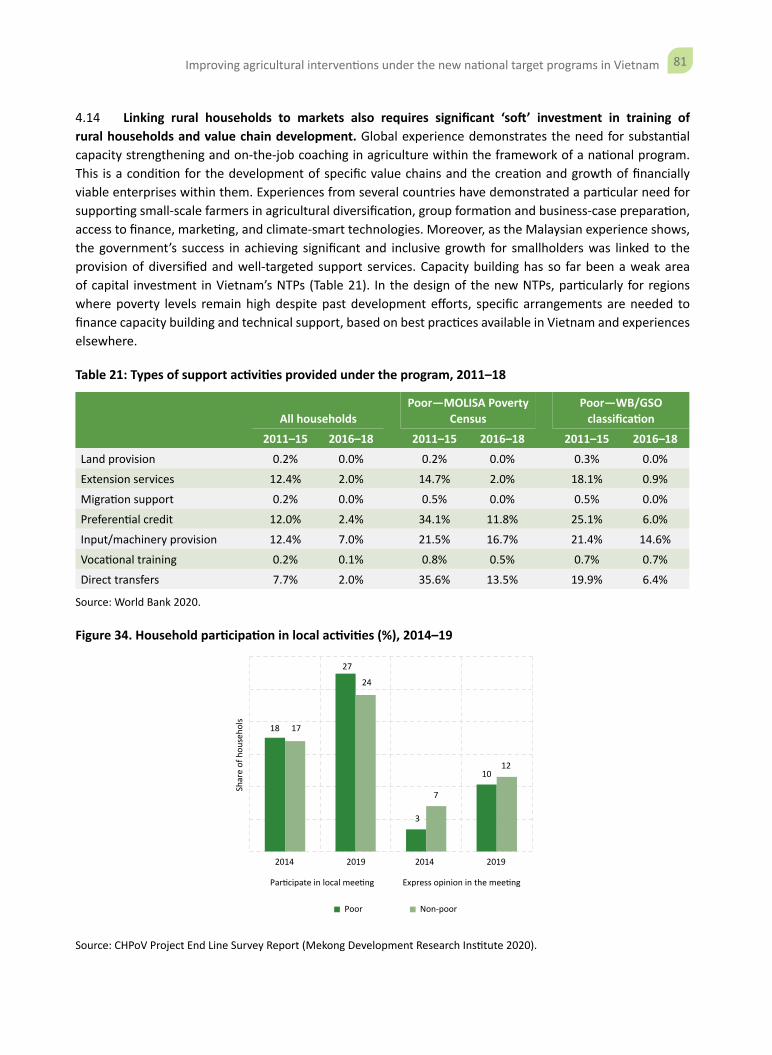
81Improving agricultural interventions under the new national target programs in Vietnam
4.14 Linking rural households to markets also requires significant ‘soft’ investment in training of rural households and value chain development. Global experience demonstrates the need for substantial capacity strengthening and on-the-job coaching in agriculture within the framework of a national program. This is a condition for the development of specific value chains and the creation and growth of financially viable enterprises within them. Experiences from several countries have demonstrated a particular need for supporting small-scale farmers in agricultural diversification, group formation and business-case preparation, access to finance, marketing, and climate-smart technologies. Moreover, as the Malaysian experience shows, the government’s success in achieving significant and inclusive growth for smallholders was linked to the provision of diversified and well-targeted support services. Capacity building has so far been a weak area of capital investment in Vietnam’s NTPs (Table 21). In the design of the new NTPs, particularly for regions where poverty levels remain high despite past development efforts, specific arrangements are needed to finance capacity building and technical support, based on best practices available in Vietnam and experiences elsewhere.
Table 21: Types of support activities provided under the program, 2011–18
All householdsPoor—MOLISA Poverty
CensusPoor—WB/GSO
classification
2011–15 2016–18 2011–15 2016–18 2011–15 2016–18
Land provision 0.2% 0.0% 0.2% 0.0% 0.3% 0.0%
Extension services 12.4% 2.0% 14.7% 2.0% 18.1% 0.9%
Migration support 0.2% 0.0% 0.5% 0.0% 0.5% 0.0%
Preferential credit 12.0% 2.4% 34.1% 11.8% 25.1% 6.0%
Input/machinery provision 12.4% 7.0% 21.5% 16.7% 21.4% 14.6%
Vocational training 0.2% 0.1% 0.8% 0.5% 0.7% 0.7%
Direct transfers 7.7% 2.0% 35.6% 13.5% 19.9% 6.4%
Source: World Bank 2020.
Figure 34. Household participation in local activities (%), 2014–19
Shar
e of
hou
seho
ls
Par�cipate in local mee�ng
2014 2019 2014 2019
18 17
27
24
7
1012
Express opinion in the mee�ng
Poor Non-poor
3
Source: CHPoV Project End Line Survey Report (Mekong Development Research Institute 2020).
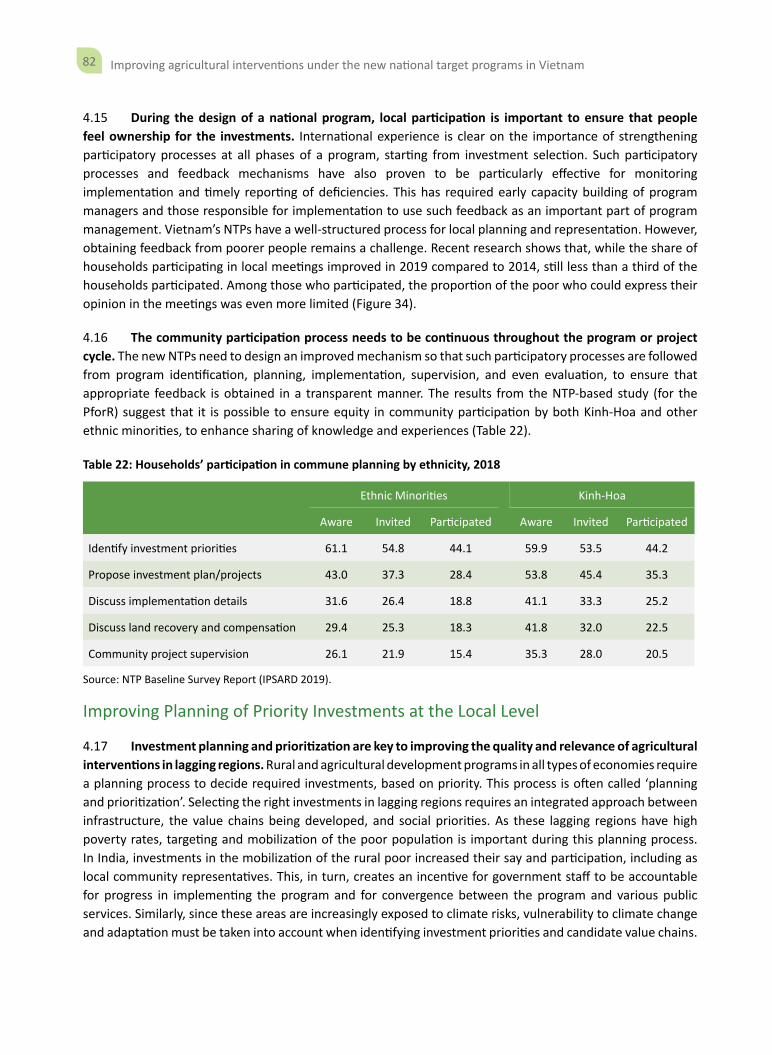
82 Improving agricultural interventions under the new national target programs in Vietnam
4.15 During the design of a national program, local participation is important to ensure that people feel ownership for the investments. International experience is clear on the importance of strengthening participatory processes at all phases of a program, starting from investment selection. Such participatory processes and feedback mechanisms have also proven to be particularly effective for monitoring implementation and timely reporting of deficiencies. This has required early capacity building of program managers and those responsible for implementation to use such feedback as an important part of program management. Vietnam’s NTPs have a well-structured process for local planning and representation. However, obtaining feedback from poorer people remains a challenge. Recent research shows that, while the share of households participating in local meetings improved in 2019 compared to 2014, still less than a third of the households participated. Among those who participated, the proportion of the poor who could express their opinion in the meetings was even more limited (Figure 34).
4.16 The community participation process needs to be continuous throughout the program or project cycle. The new NTPs need to design an improved mechanism so that such participatory processes are followed from program identification, planning, implementation, supervision, and even evaluation, to ensure that appropriate feedback is obtained in a transparent manner. The results from the NTP-based study (for the PforR) suggest that it is possible to ensure equity in community participation by both Kinh-Hoa and other ethnic minorities, to enhance sharing of knowledge and experiences (Table 22).
Table 22: Households’ participation in commune planning by ethnicity, 2018
Ethnic Minorities Kinh-Hoa
Aware Invited Participated Aware Invited Participated
Identify investment priorities 61.1 54.8 44.1 59.9 53.5 44.2
Propose investment plan/projects 43.0 37.3 28.4 53.8 45.4 35.3
Discuss implementation details 31.6 26.4 18.8 41.1 33.3 25.2
Discuss land recovery and compensation 29.4 25.3 18.3 41.8 32.0 22.5
Community project supervision 26.1 21.9 15.4 35.3 28.0 20.5
Source: NTP Baseline Survey Report (IPSARD 2019).
Improving Planning of Priority Investments at the Local Level
4.17 Investment planning and prioritization are key to improving the quality and relevance of agricultural interventions in lagging regions. Rural and agricultural development programs in all types of economies require a planning process to decide required investments, based on priority. This process is often called ‘planning and prioritization’. Selecting the right investments in lagging regions requires an integrated approach between infrastructure, the value chains being developed, and social priorities. As these lagging regions have high poverty rates, targeting and mobilization of the poor population is important during this planning process. In India, investments in the mobilization of the rural poor increased their say and participation, including as local community representatives. This, in turn, creates an incentive for government staff to be accountable for progress in implementing the program and for convergence between the program and various public services. Similarly, since these areas are increasingly exposed to climate risks, vulnerability to climate change and adaptation must be taken into account when identifying investment priorities and candidate value chains.
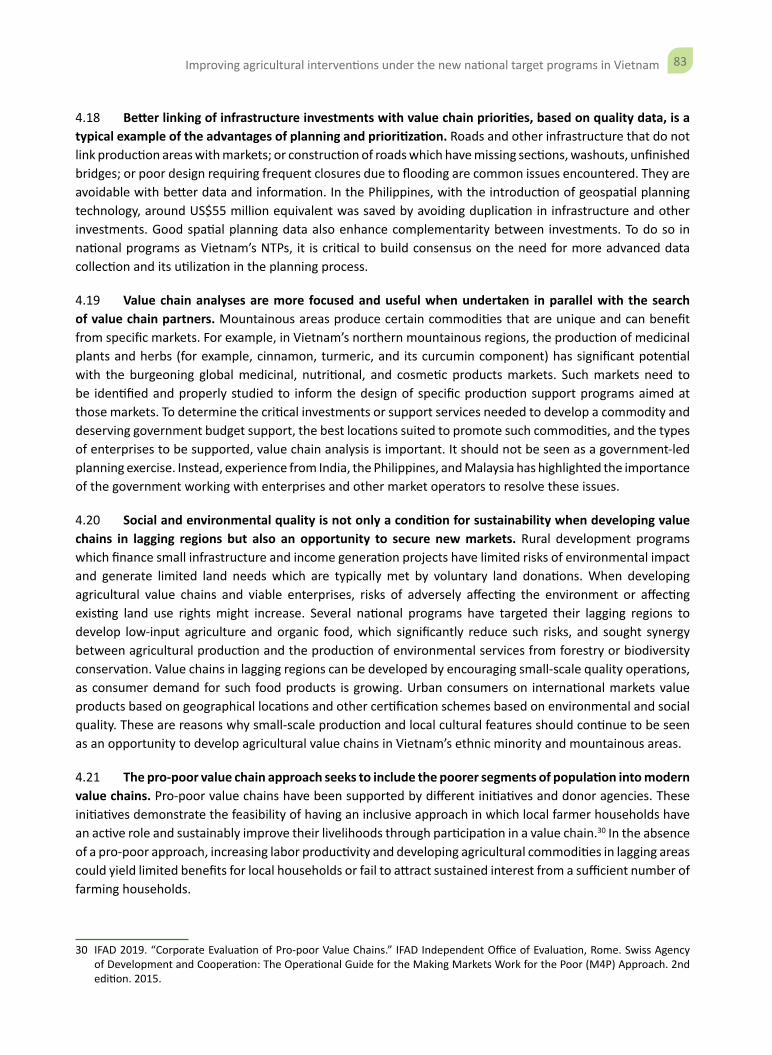
83Improving agricultural interventions under the new national target programs in Vietnam
4.18 Better linking of infrastructure investments with value chain priorities, based on quality data, is a typical example of the advantages of planning and prioritization. Roads and other infrastructure that do not link production areas with markets; or construction of roads which have missing sections, washouts, unfinished bridges; or poor design requiring frequent closures due to flooding are common issues encountered. They are avoidable with better data and information. In the Philippines, with the introduction of geospatial planning technology, around US$55 million equivalent was saved by avoiding duplication in infrastructure and other investments. Good spatial planning data also enhance complementarity between investments. To do so in national programs as Vietnam’s NTPs, it is critical to build consensus on the need for more advanced data collection and its utilization in the planning process.
4.19 Value chain analyses are more focused and useful when undertaken in parallel with the search of value chain partners. Mountainous areas produce certain commodities that are unique and can benefit from specific markets. For example, in Vietnam’s northern mountainous regions, the production of medicinal plants and herbs (for example, cinnamon, turmeric, and its curcumin component) has significant potential with the burgeoning global medicinal, nutritional, and cosmetic products markets. Such markets need to be identified and properly studied to inform the design of specific production support programs aimed at those markets. To determine the critical investments or support services needed to develop a commodity and deserving government budget support, the best locations suited to promote such commodities, and the types of enterprises to be supported, value chain analysis is important. It should not be seen as a government-led planning exercise. Instead, experience from India, the Philippines, and Malaysia has highlighted the importance of the government working with enterprises and other market operators to resolve these issues.
4.20 Social and environmental quality is not only a condition for sustainability when developing value chains in lagging regions but also an opportunity to secure new markets. Rural development programs which finance small infrastructure and income generation projects have limited risks of environmental impact and generate limited land needs which are typically met by voluntary land donations. When developing agricultural value chains and viable enterprises, risks of adversely affecting the environment or affecting existing land use rights might increase. Several national programs have targeted their lagging regions to develop low-input agriculture and organic food, which significantly reduce such risks, and sought synergy between agricultural production and the production of environmental services from forestry or biodiversity conservation. Value chains in lagging regions can be developed by encouraging small-scale quality operations, as consumer demand for such food products is growing. Urban consumers on international markets value products based on geographical locations and other certification schemes based on environmental and social quality. These are reasons why small-scale production and local cultural features should continue to be seen as an opportunity to develop agricultural value chains in Vietnam’s ethnic minority and mountainous areas.
4.21 The pro-poor value chain approach seeks to include the poorer segments of population into modern value chains. Pro-poor value chains have been supported by different initiatives and donor agencies. These initiatives demonstrate the feasibility of having an inclusive approach in which local farmer households have an active role and sustainably improve their livelihoods through participation in a value chain.30 In the absence of a pro-poor approach, increasing labor productivity and developing agricultural commodities in lagging areas could yield limited benefits for local households or fail to attract sustained interest from a sufficient number of farming households.
30 IFAD 2019. “Corporate Evaluation of Pro-poor Value Chains.” IFAD Independent Office of Evaluation, Rome. Swiss Agency of Development and Cooperation: The Operational Guide for the Making Markets Work for the Poor (M4P) Approach. 2nd edition. 2015.
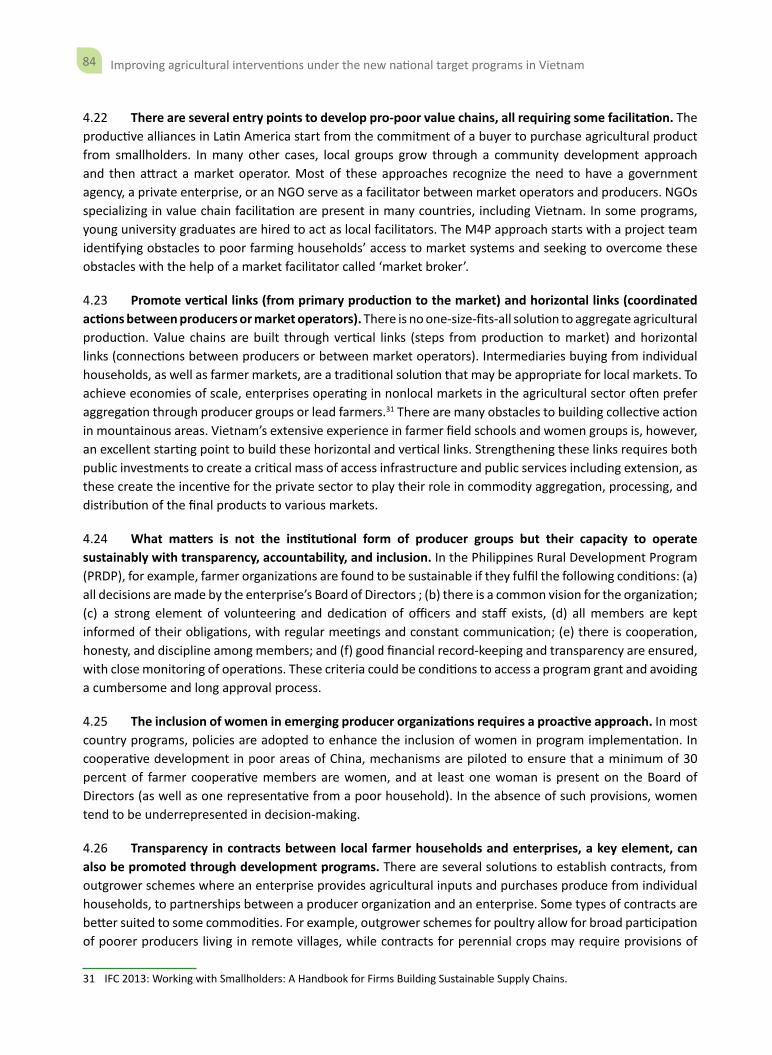
84 Improving agricultural interventions under the new national target programs in Vietnam
4.22 There are several entry points to develop pro-poor value chains, all requiring some facilitation. The productive alliances in Latin America start from the commitment of a buyer to purchase agricultural product from smallholders. In many other cases, local groups grow through a community development approach and then attract a market operator. Most of these approaches recognize the need to have a government agency, a private enterprise, or an NGO serve as a facilitator between market operators and producers. NGOs specializing in value chain facilitation are present in many countries, including Vietnam. In some programs, young university graduates are hired to act as local facilitators. The M4P approach starts with a project team identifying obstacles to poor farming households’ access to market systems and seeking to overcome these obstacles with the help of a market facilitator called ‘market broker’.
4.23 Promote vertical links (from primary production to the market) and horizontal links (coordinated actions between producers or market operators). There is no one-size-fits-all solution to aggregate agricultural production. Value chains are built through vertical links (steps from production to market) and horizontal links (connections between producers or between market operators). Intermediaries buying from individual households, as well as farmer markets, are a traditional solution that may be appropriate for local markets. To achieve economies of scale, enterprises operating in nonlocal markets in the agricultural sector often prefer aggregation through producer groups or lead farmers.31 There are many obstacles to building collective action in mountainous areas. Vietnam’s extensive experience in farmer field schools and women groups is, however, an excellent starting point to build these horizontal and vertical links. Strengthening these links requires both public investments to create a critical mass of access infrastructure and public services including extension, as these create the incentive for the private sector to play their role in commodity aggregation, processing, and distribution of the final products to various markets.
4.24 What matters is not the institutional form of producer groups but their capacity to operate sustainably with transparency, accountability, and inclusion. In the Philippines Rural Development Program (PRDP), for example, farmer organizations are found to be sustainable if they fulfil the following conditions: (a) all decisions are made by the enterprise’s Board of Directors ; (b) there is a common vision for the organization; (c) a strong element of volunteering and dedication of officers and staff exists, (d) all members are kept informed of their obligations, with regular meetings and constant communication; (e) there is cooperation, honesty, and discipline among members; and (f) good financial record-keeping and transparency are ensured, with close monitoring of operations. These criteria could be conditions to access a program grant and avoiding a cumbersome and long approval process.
4.25 The inclusion of women in emerging producer organizations requires a proactive approach. In most country programs, policies are adopted to enhance the inclusion of women in program implementation. In cooperative development in poor areas of China, mechanisms are piloted to ensure that a minimum of 30 percent of farmer cooperative members are women, and at least one woman is present on the Board of Directors (as well as one representative from a poor household). In the absence of such provisions, women tend to be underrepresented in decision-making.
4.26 Transparency in contracts between local farmer households and enterprises, a key element, can also be promoted through development programs. There are several solutions to establish contracts, from outgrower schemes where an enterprise provides agricultural inputs and purchases produce from individual households, to partnerships between a producer organization and an enterprise. Some types of contracts are better suited to some commodities. For example, outgrower schemes for poultry allow for broad participation of poorer producers living in remote villages, while contracts for perennial crops may require provisions of
31 IFC 2013: Working with Smallholders: A Handbook for Firms Building Sustainable Supply Chains.
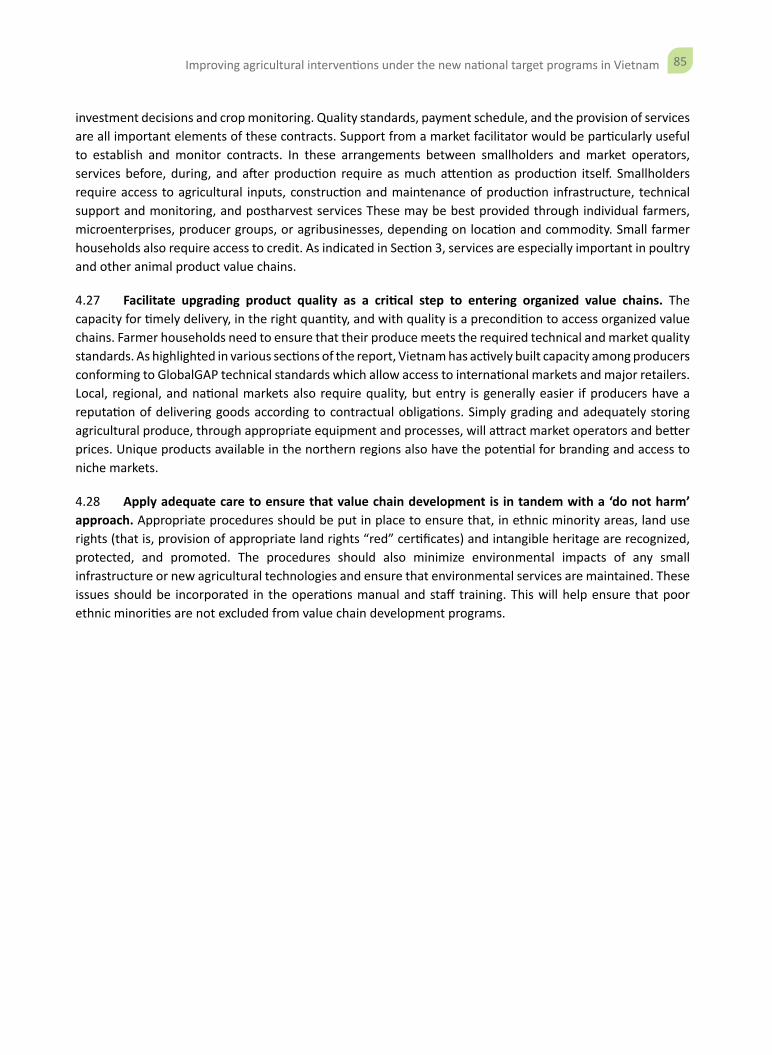
85Improving agricultural interventions under the new national target programs in Vietnam
investment decisions and crop monitoring. Quality standards, payment schedule, and the provision of services are all important elements of these contracts. Support from a market facilitator would be particularly useful to establish and monitor contracts. In these arrangements between smallholders and market operators, services before, during, and after production require as much attention as production itself. Smallholders require access to agricultural inputs, construction and maintenance of production infrastructure, technical support and monitoring, and postharvest services These may be best provided through individual farmers, microenterprises, producer groups, or agribusinesses, depending on location and commodity. Small farmer households also require access to credit. As indicated in Section 3, services are especially important in poultry and other animal product value chains.
4.27 Facilitate upgrading product quality as a critical step to entering organized value chains. The capacity for timely delivery, in the right quantity, and with quality is a precondition to access organized value chains. Farmer households need to ensure that their produce meets the required technical and market quality standards. As highlighted in various sections of the report, Vietnam has actively built capacity among producers conforming to GlobalGAP technical standards which allow access to international markets and major retailers. Local, regional, and national markets also require quality, but entry is generally easier if producers have a reputation of delivering goods according to contractual obligations. Simply grading and adequately storing agricultural produce, through appropriate equipment and processes, will attract market operators and better prices. Unique products available in the northern regions also have the potential for branding and access to niche markets.
4.28 Apply adequate care to ensure that value chain development is in tandem with a ‘do not harm’ approach. Appropriate procedures should be put in place to ensure that, in ethnic minority areas, land use rights (that is, provision of appropriate land rights “red” certificates) and intangible heritage are recognized, protected, and promoted. The procedures should also minimize environmental impacts of any small infrastructure or new agricultural technologies and ensure that environmental services are maintained. These issues should be incorporated in the operations manual and staff training. This will help ensure that poor ethnic minorities are not excluded from value chain development programs.
86 Improving agricultural interventions under the new national target programs in Vietnam
References
Alexiadis, Stilianos. 2005. “Convergence in Agriculture. Evidence from the European Regions.” Agricultural Economics Review 84–96.
Christiansen, L., L. Demery, and J. Kuhl. 2011. “The (Evolving) Role of Agriculture in Poverty Reduction—An Empirical Perspective.” Journal of Development Economics 96: 239–254.
Dorward, A., 2013. Agricultural labor productivity, food prices and sustainable development impacts and indicators. Food Policy. Vol. 39, April 2013. Elsevier.
Farole, Thomas, Soraya Goga, and Marcel Ionescu-Heroiu. 2018. Rethinking Lagging Regions: Using Cohesion Policy to Deliver on the Potential of Europe’s Regions. World Bank Report on the European Union.
Huelgas, Zeny, Deborah Templeton, and Pamela Castanar. 2008. 3R3G (Three Reductions, Three Gains Technology) in South Vietnam: Searching for Evidence of Economic Impact. IRRI, DAPO Box 7777, Metro Manila, Philippines.
IFAD 2019. “Corporate Evaluation of Pro-poor Value Chains.” IFAD Independent Office of Evaluation, Rome. Swiss Agency of Development and Cooperation: The Operational Guide for the Making Markets Work for the Poor (M4P) Approach. 2nd edition. 2015.
IFC 2013: Working with Smallholders: A Handbook for Firms Building Sustainable Supply Chains. World Bank Group, Washington D.C., USA.
Johnston, B. F., and J. W. Mellor. 1961. “The Role of Agriculture in Economic Development.” The American Economic Review 51: 566–593.
Kumar, Shiv, Ankush Lala Kamble, and Khyali Ram Chaudhary. 2014. “Agricultural Growth and Economic Convergence in Indian Agriculture.” Indian J. of Agr. Econ. 69 (April–June).
Mellor, J. W., ed. 1995. Agriculture on the Road to Industrialization. IFPRI: John Hopkins Press.
Nguyen-Trung, Kien, and Bui Minh. 2015. “Nation Target Programme on New Rural Development. The Evolution of Concepts in Historical Perspective.” Vietnam Social Sciences 6 (170).
OECD (Organisation of Economic Co-operation and Development). 2019. Perspectives on Global Development. Rethinking Development Strategies. OECD.
Phan.V.T. (2017). Bao cao nghien cuu duoc lieu cho Lao Cai va cac tinh mien nui phia Bac. Oxfam Vietnam.
Timmer, C. P. 1988. “The Agricultural Transformation.” In “The Handbook of Development Economics,” edited by H. Chenery and T. N. Srinivasan, vol. I: 275–331. North Holland, Amsterdam.
Vien, C. & Bui, T. 2016. In-depth gender sensitive analysis of cinnamon value chain in Lao Cai province, Vietnam. SNV Vietnam.
87Improving agricultural interventions under the new national target programs in Vietnam
World Bank. 2011. National Rural Livelihood Project. World Bank Report No. 59393-IN.
World Bank. 2014. Philippine Rural Development Project. World Bank Report No. 74097-PH.
World Bank. 2018. Integrated Irrigation and Agriculture Transformation, Andhra Pradesh, India. World Bank Report no. PAD2488.
World Bank. 2019a. Agribusiness and Rural Transformation Project, Maharashtra, India. World Bank Report No. PAD3371.
World Bank. 2019b. Poverty Update Report – Better Opportunities for All: Poverty Reduction and Shared Prosperity in Vietnam. Washington, DC: World Bank.
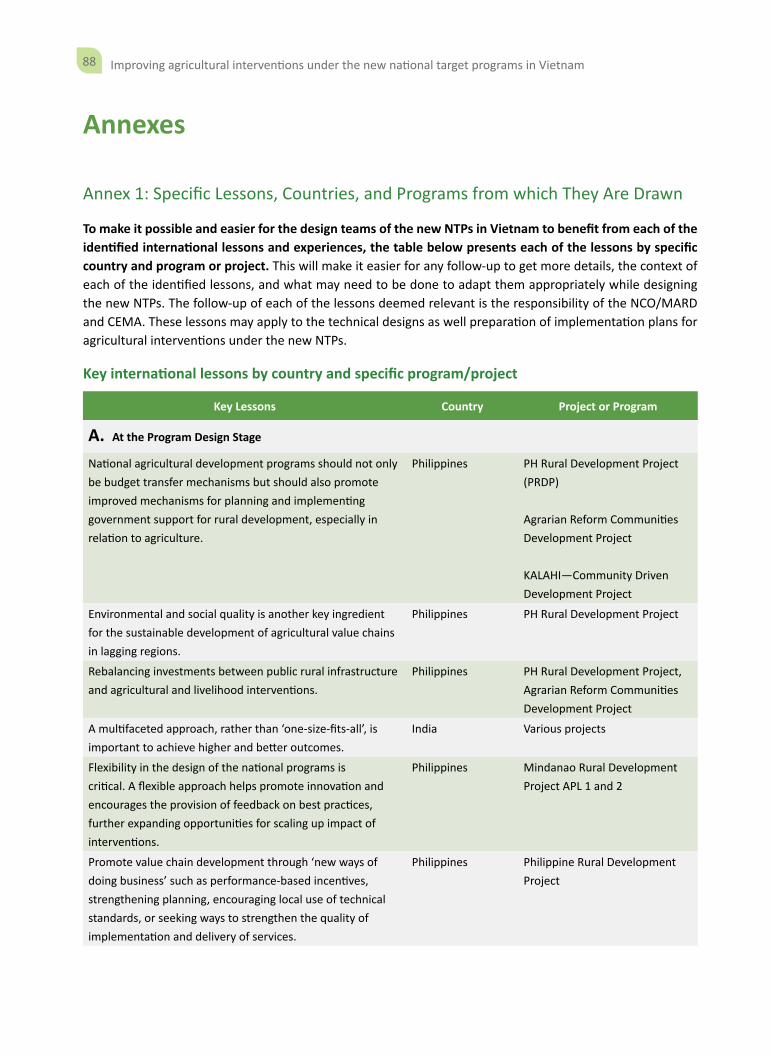
88 Improving agricultural interventions under the new national target programs in Vietnam
Annexes
Annex 1: Specific Lessons, Countries, and Programs from which They Are Drawn
To make it possible and easier for the design teams of the new NTPs in Vietnam to benefit from each of the identified international lessons and experiences, the table below presents each of the lessons by specific country and program or project. This will make it easier for any follow-up to get more details, the context of each of the identified lessons, and what may need to be done to adapt them appropriately while designing the new NTPs. The follow-up of each of the lessons deemed relevant is the responsibility of the NCO/MARD and CEMA. These lessons may apply to the technical designs as well preparation of implementation plans for agricultural interventions under the new NTPs.
Key international lessons by country and specific program/project
Key Lessons Country Project or Program
A. At the Program Design Stage
National agricultural development programs should not only be budget transfer mechanisms but should also promote improved mechanisms for planning and implementing government support for rural development, especially in relation to agriculture.
Philippines PH Rural Development Project (PRDP)
Agrarian Reform Communities Development Project
KALAHI—Community Driven Development Project
Environmental and social quality is another key ingredient for the sustainable development of agricultural value chains in lagging regions.
Philippines PH Rural Development Project
Rebalancing investments between public rural infrastructure and agricultural and livelihood interventions.
Philippines PH Rural Development Project, Agrarian Reform Communities Development Project
A multifaceted approach, rather than ‘one-size-fits-all’, is important to achieve higher and better outcomes.
India Various projects
Flexibility in the design of the national programs is critical. A flexible approach helps promote innovation and encourages the provision of feedback on best practices, further expanding opportunities for scaling up impact of interventions.
Philippines Mindanao Rural Development Project APL 1 and 2
Promote value chain development through ‘new ways of doing business’ such as performance-based incentives, strengthening planning, encouraging local use of technical standards, or seeking ways to strengthen the quality of implementation and delivery of services.
Philippines Philippine Rural Development Project
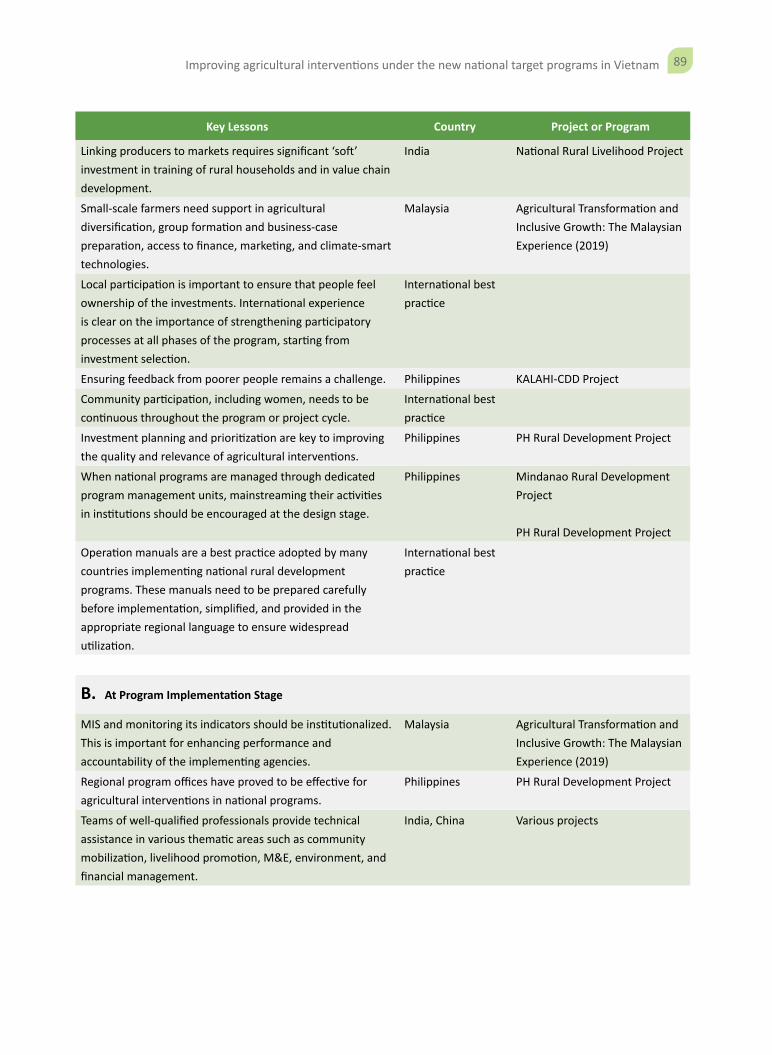
89Improving agricultural interventions under the new national target programs in Vietnam
Key Lessons Country Project or Program
Linking producers to markets requires significant ‘soft’ investment in training of rural households and in value chain development.
India National Rural Livelihood Project
Small-scale farmers need support in agricultural diversification, group formation and business-case preparation, access to finance, marketing, and climate-smart technologies.
Malaysia Agricultural Transformation and Inclusive Growth: The Malaysian Experience (2019)
Local participation is important to ensure that people feel ownership of the investments. International experience is clear on the importance of strengthening participatory processes at all phases of the program, starting from investment selection.
International best practice
Ensuring feedback from poorer people remains a challenge. Philippines KALAHI-CDD Project
Community participation, including women, needs to be continuous throughout the program or project cycle.
International best practice
Investment planning and prioritization are key to improving the quality and relevance of agricultural interventions.
Philippines PH Rural Development Project
When national programs are managed through dedicated program management units, mainstreaming their activities in institutions should be encouraged at the design stage.
Philippines Mindanao Rural Development Project
PH Rural Development Project
Operation manuals are a best practice adopted by many countries implementing national rural development programs. These manuals need to be prepared carefully before implementation, simplified, and provided in the appropriate regional language to ensure widespread utilization.
International best practice
B. At Program Implementation Stage
MIS and monitoring its indicators should be institutionalized. This is important for enhancing performance and accountability of the implementing agencies.
Malaysia Agricultural Transformation and Inclusive Growth: The Malaysian Experience (2019)
Regional program offices have proved to be effective for agricultural interventions in national programs.
Philippines PH Rural Development Project
Teams of well-qualified professionals provide technical assistance in various thematic areas such as community mobilization, livelihood promotion, M&E, environment, and financial management.
India, China Various projects
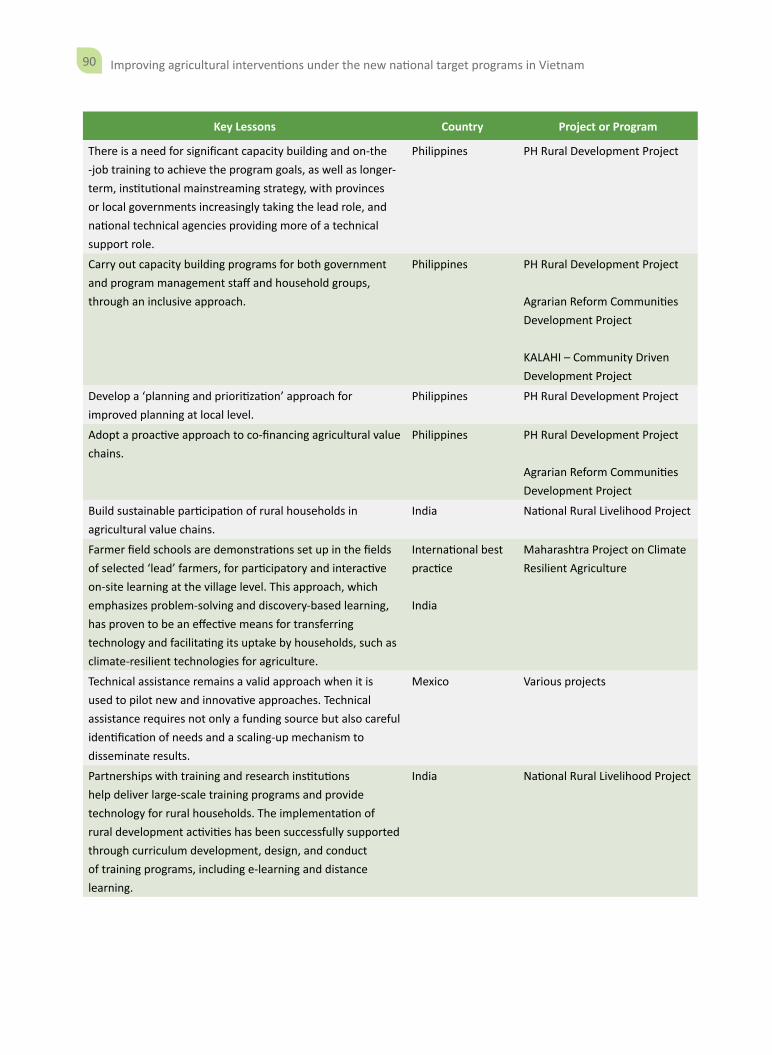
90 Improving agricultural interventions under the new national target programs in Vietnam
Key Lessons Country Project or Program
There is a need for significant capacity building and on-the -job training to achieve the program goals, as well as longer-term, institutional mainstreaming strategy, with provinces or local governments increasingly taking the lead role, and national technical agencies providing more of a technical support role.
Philippines PH Rural Development Project
Carry out capacity building programs for both government and program management staff and household groups, through an inclusive approach.
Philippines PH Rural Development Project
Agrarian Reform Communities Development Project
KALAHI – Community Driven Development Project
Develop a ‘planning and prioritization’ approach for improved planning at local level.
Philippines PH Rural Development Project
Adopt a proactive approach to co-financing agricultural value chains.
Philippines PH Rural Development Project
Agrarian Reform Communities Development Project
Build sustainable participation of rural households in agricultural value chains.
India National Rural Livelihood Project
Farmer field schools are demonstrations set up in the fields of selected ‘lead’ farmers, for participatory and interactive on-site learning at the village level. This approach, which emphasizes problem-solving and discovery-based learning, has proven to be an effective means for transferring technology and facilitating its uptake by households, such as climate-resilient technologies for agriculture.
International best practice
India
Maharashtra Project on Climate Resilient Agriculture
Technical assistance remains a valid approach when it is used to pilot new and innovative approaches. Technical assistance requires not only a funding source but also careful identification of needs and a scaling-up mechanism to disseminate results.
Mexico Various projects
Partnerships with training and research institutions help deliver large-scale training programs and provide technology for rural households. The implementation of rural development activities has been successfully supported through curriculum development, design, and conduct of training programs, including e-learning and distance learning.
India National Rural Livelihood Project
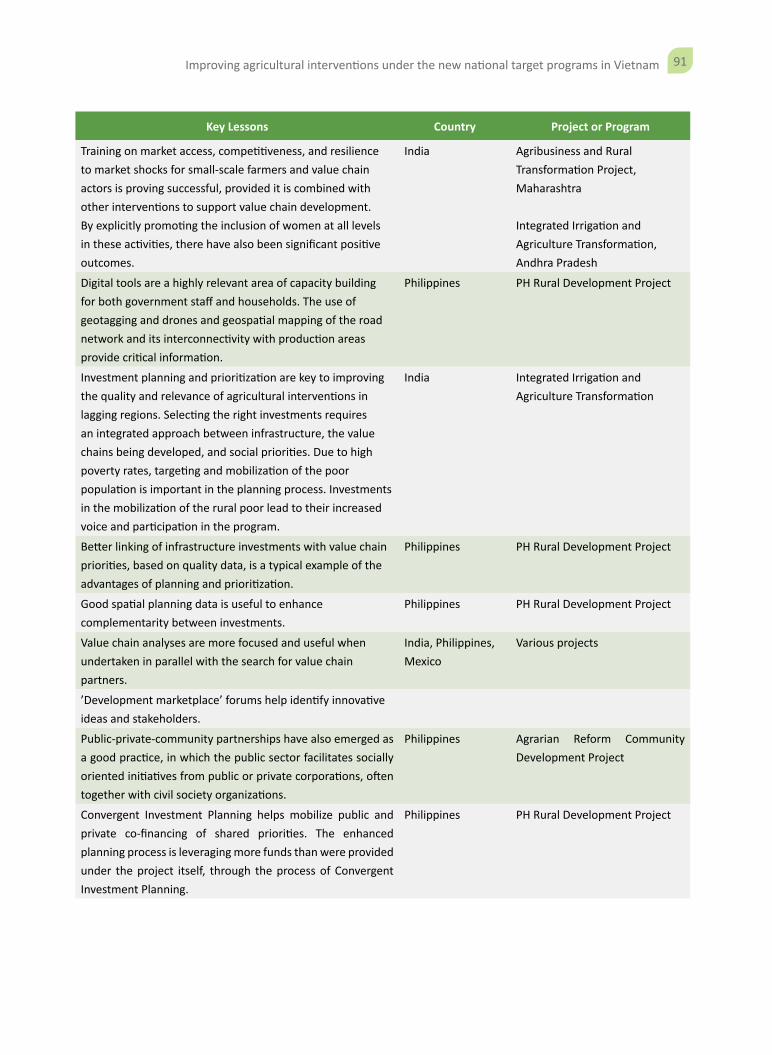
91Improving agricultural interventions under the new national target programs in Vietnam
Key Lessons Country Project or Program
Training on market access, competitiveness, and resilience to market shocks for small-scale farmers and value chain actors is proving successful, provided it is combined with other interventions to support value chain development. By explicitly promoting the inclusion of women at all levels in these activities, there have also been significant positive outcomes.
India Agribusiness and Rural Transformation Project, Maharashtra
Integrated Irrigation and Agriculture Transformation, Andhra Pradesh
Digital tools are a highly relevant area of capacity building for both government staff and households. The use of geotagging and drones and geospatial mapping of the road network and its interconnectivity with production areas provide critical information.
Philippines PH Rural Development Project
Investment planning and prioritization are key to improving the quality and relevance of agricultural interventions in lagging regions. Selecting the right investments requires an integrated approach between infrastructure, the value chains being developed, and social priorities. Due to high poverty rates, targeting and mobilization of the poor population is important in the planning process. Investments in the mobilization of the rural poor lead to their increased voice and participation in the program.
India Integrated Irrigation and Agriculture Transformation
Better linking of infrastructure investments with value chain priorities, based on quality data, is a typical example of the advantages of planning and prioritization.
Philippines PH Rural Development Project
Good spatial planning data is useful to enhance complementarity between investments.
Philippines PH Rural Development Project
Value chain analyses are more focused and useful when undertaken in parallel with the search for value chain partners.
India, Philippines, Mexico
Various projects
’Development marketplace’ forums help identify innovative ideas and stakeholders.
Public-private-community partnerships have also emerged as a good practice, in which the public sector facilitates socially oriented initiatives from public or private corporations, often together with civil society organizations.
Philippines Agrarian Reform Community Development Project
Convergent Investment Planning helps mobilize public and private co-financing of shared priorities. The enhanced planning process is leveraging more funds than were provided under the project itself, through the process of Convergent Investment Planning.
Philippines PH Rural Development Project

92 Improving agricultural interventions under the new national target programs in Vietnam
Key Lessons Country Project or Program
Competitive grants can be designed to support enterprises and organized farmer household groups. Grant funding is an initial investment to facilitate the start-up or expansion of an enterprise or a livelihood activity, coupled with various amounts of cash or in-kind inputs from the recipients. When such grant funding supports agricultural products with potential, they promote further investments in a value chain, with a catalytic effect.
Vietnam Commercial Smallholder Support Project
Productive alliances strengthen the links between small-scale producers, buyers, and the public sector within agricultural value chains.
Latin America Various productive alliances projects
The inclusion of women is an important aspect in the development of sustainable organizations.
China Shaanxi Poor Rural Areas Community Development Project
What matters is not the institutional form of an organization but its capacity to operate sustainably on the basis of transparency, accountability, and inclusion.
Philippines PH Rural Development Project
Agrarian reform Communities Development Project
Environmental and social quality is not only a condition for sustainability when developing value chains in lagging regions but also an opportunity to secure market access.
Vietnam National Rural Development NTP
To establish sustainable organizations, there is a need for sizeable financial contributions. The focus should be on supporting organizations with the potential to operate sustainably, as opposed to past practices of providing small amounts for more welfare-type, livelihood subprojects for which sustainability was not a key objective.
Philippines PH Rural Development Project
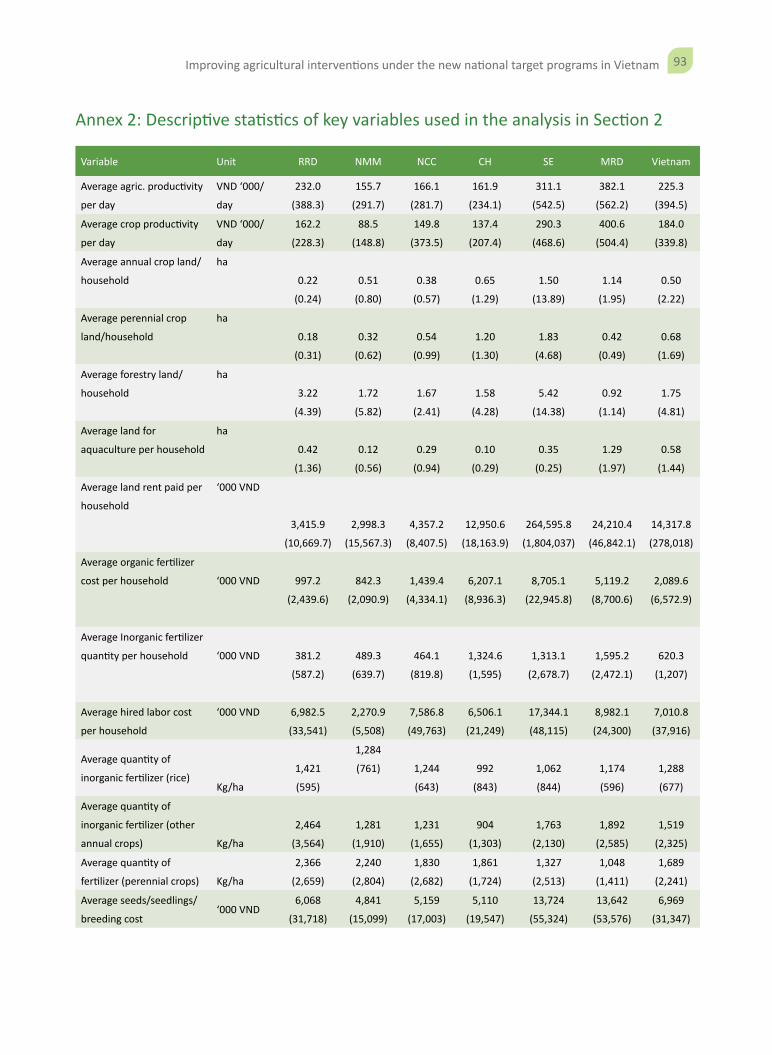
93Improving agricultural interventions under the new national target programs in Vietnam
Annex 2: Descriptive statistics of key variables used in the analysis in Section 2
Variable Unit RRD NMM NCC CH SE MRD Vietnam
Average agric. productivity
per day
VND ‘000/
day
232.0
(388.3)
155.7
(291.7)
166.1
(281.7)
161.9
(234.1)
311.1
(542.5)
382.1
(562.2)
225.3
(394.5)
Average crop productivity
per day
VND ‘000/
day
162.2
(228.3)
88.5
(148.8)
149.8
(373.5)
137.4
(207.4)
290.3
(468.6)
400.6
(504.4)
184.0
(339.8)
Average annual crop land/
household
ha
0.22
(0.24)
0.51
(0.80)
0.38
(0.57)
0.65
(1.29)
1.50
(13.89)
1.14
(1.95)
0.50
(2.22)
Average perennial crop
land/household
ha
0.18
(0.31)
0.32
(0.62)
0.54
(0.99)
1.20
(1.30)
1.83
(4.68)
0.42
(0.49)
0.68
(1.69)
Average forestry land/
household
ha
3.22
(4.39)
1.72
(5.82)
1.67
(2.41)
1.58
(4.28)
5.42
(14.38)
0.92
(1.14)
1.75
(4.81)
Average land for
aquaculture per household
ha
0.42
(1.36)
0.12
(0.56)
0.29
(0.94)
0.10
(0.29)
0.35
(0.25)
1.29
(1.97)
0.58
(1.44)
Average land rent paid per
household
‘000 VND
3,415.9
(10,669.7)
2,998.3
(15,567.3)
4,357.2
(8,407.5)
12,950.6
(18,163.9)
264,595.8
(1,804,037)
24,210.4
(46,842.1)
14,317.8
(278,018)
Average organic fertilizer
cost per household ‘000 VND 997.2
(2,439.6)
842.3
(2,090.9)
1,439.4
(4,334.1)
6,207.1
(8,936.3)
8,705.1
(22,945.8)
5,119.2
(8,700.6)
2,089.6
(6,572.9)
Average Inorganic fertilizer
quantity per household ‘000 VND 381.2
(587.2)
489.3
(639.7)
464.1
(819.8)
1,324.6
(1,595)
1,313.1
(2,678.7)
1,595.2
(2,472.1)
620.3
(1,207)
Average hired labor cost
per household
‘000 VND 6,982.5
(33,541)
2,270.9
(5,508)
7,586.8
(49,763)
6,506.1
(21,249)
17,344.1
(48,115)
8,982.1
(24,300)
7,010.8
(37,916)
Average quantity of
inorganic fertilizer (rice)Kg/ha
1,421
(595)
1,284
(761) 1,244
(643)
992
(843)
1,062
(844)
1,174
(596)
1,288
(677)
Average quantity of
inorganic fertilizer (other
annual crops) Kg/ha
2,464
(3,564)
1,281
(1,910)
1,231
(1,655)
904
(1,303)
1,763
(2,130)
1,892
(2,585)
1,519
(2,325)
Average quantity of
fertilizer (perennial crops) Kg/ha
2,366
(2,659)
2,240
(2,804)
1,830
(2,682)
1,861
(1,724)
1,327
(2,513)
1,048
(1,411)
1,689
(2,241)
Average seeds/seedlings/
breeding cost‘000 VND
6,068
(31,718)
4,841
(15,099)
5,159
(17,003)
5,110
(19,547)
13,724
(55,324)
13,642
(53,576)
6,969
(31,347)
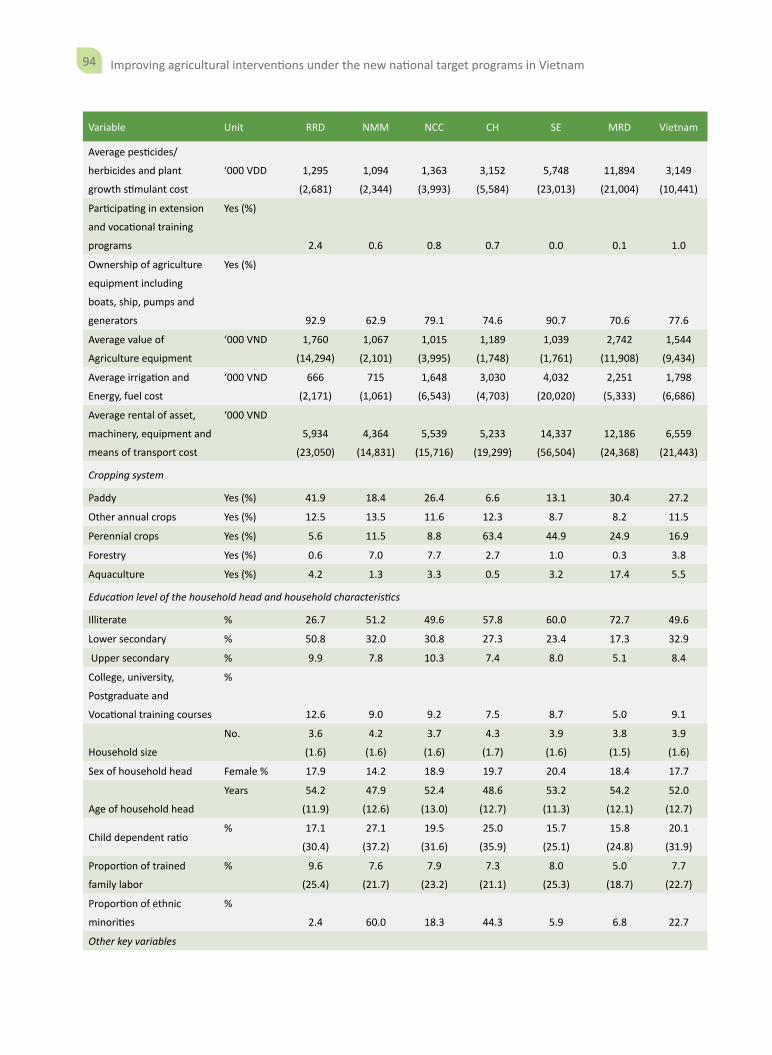
94 Improving agricultural interventions under the new national target programs in Vietnam
Variable Unit RRD NMM NCC CH SE MRD Vietnam
Average pesticides/
herbicides and plant
growth stimulant cost
‘000 VDD 1,295
(2,681)
1,094
(2,344)
1,363
(3,993)
3,152
(5,584)
5,748
(23,013)
11,894
(21,004)
3,149
(10,441)
Participating in extension
and vocational training
programs
Yes (%)
2.4 0.6 0.8 0.7 0.0 0.1 1.0
Ownership of agriculture
equipment including
boats, ship, pumps and
generators
Yes (%)
92.9 62.9 79.1 74.6 90.7 70.6 77.6
Average value of
Agriculture equipment
‘000 VND 1,760
(14,294)
1,067
(2,101)
1,015
(3,995)
1,189
(1,748)
1,039
(1,761)
2,742
(11,908)
1,544
(9,434)
Average irrigation and
Energy, fuel cost
‘000 VND 666
(2,171)
715
(1,061)
1,648
(6,543)
3,030
(4,703)
4,032
(20,020)
2,251
(5,333)
1,798
(6,686)
Average rental of asset,
machinery, equipment and
means of transport cost
‘000 VND
5,934
(23,050)
4,364
(14,831)
5,539
(15,716)
5,233
(19,299)
14,337
(56,504)
12,186
(24,368)
6,559
(21,443)
Cropping system
Paddy Yes (%) 41.9 18.4 26.4 6.6 13.1 30.4 27.2
Other annual crops Yes (%) 12.5 13.5 11.6 12.3 8.7 8.2 11.5
Perennial crops Yes (%) 5.6 11.5 8.8 63.4 44.9 24.9 16.9
Forestry Yes (%) 0.6 7.0 7.7 2.7 1.0 0.3 3.8
Aquaculture Yes (%) 4.2 1.3 3.3 0.5 3.2 17.4 5.5
Education level of the household head and household characteristics
Illiterate % 26.7 51.2 49.6 57.8 60.0 72.7 49.6
Lower secondary % 50.8 32.0 30.8 27.3 23.4 17.3 32.9
Upper secondary % 9.9 7.8 10.3 7.4 8.0 5.1 8.4
College, university,
Postgraduate and
Vocational training courses
%
12.6 9.0 9.2 7.5 8.7 5.0 9.1
Household size
No. 3.6
(1.6)
4.2
(1.6)
3.7
(1.6)
4.3
(1.7)
3.9
(1.6)
3.8
(1.5)
3.9
(1.6)
Sex of household head Female % 17.9 14.2 18.9 19.7 20.4 18.4 17.7
Age of household head
Years 54.2
(11.9)
47.9
(12.6)
52.4
(13.0)
48.6
(12.7)
53.2
(11.3)
54.2
(12.1)
52.0
(12.7)
Child dependent ratio % 17.1
(30.4)
27.1
(37.2)
19.5
(31.6)
25.0
(35.9)
15.7
(25.1)
15.8
(24.8)
20.1
(31.9)
Proportion of trained
family labor
% 9.6
(25.4)
7.6
(21.7)
7.9
(23.2)
7.3
(21.1)
8.0
(25.3)
5.0
(18.7)
7.7
(22.7)
Proportion of ethnic
minorities
%
2.4 60.0 18.3 44.3 5.9 6.8 22.7
Other key variables
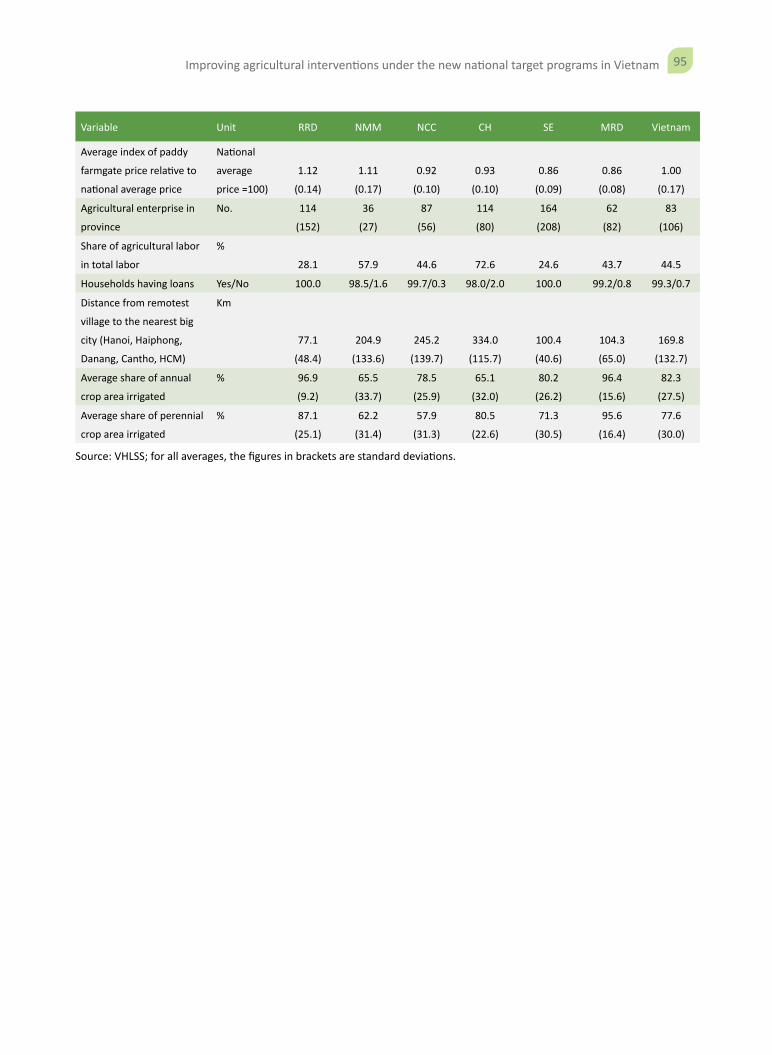
95Improving agricultural interventions under the new national target programs in Vietnam
Variable Unit RRD NMM NCC CH SE MRD Vietnam
Average index of paddy
farmgate price relative to
national average price
National
average
price =100)
1.12
(0.14)
1.11
(0.17)
0.92
(0.10)
0.93
(0.10)
0.86
(0.09)
0.86
(0.08)
1.00
(0.17)
Agricultural enterprise in
province
No. 114
(152)
36
(27)
87
(56)
114
(80)
164
(208)
62
(82)
83
(106)
Share of agricultural labor
in total labor
%
28.1 57.9 44.6 72.6 24.6 43.7 44.5
Households having loans Yes/No 100.0 98.5/1.6 99.7/0.3 98.0/2.0 100.0 99.2/0.8 99.3/0.7
Distance from remotest
village to the nearest big
city (Hanoi, Haiphong,
Danang, Cantho, HCM)
Km
77.1
(48.4)
204.9
(133.6)
245.2
(139.7)
334.0
(115.7)
100.4
(40.6)
104.3
(65.0)
169.8
(132.7)
Average share of annual
crop area irrigated
% 96.9
(9.2)
65.5
(33.7)
78.5
(25.9)
65.1
(32.0)
80.2
(26.2)
96.4
(15.6)
82.3
(27.5)
Average share of perennial
crop area irrigated
% 87.1
(25.1)
62.2
(31.4)
57.9
(31.3)
80.5
(22.6)
71.3
(30.5)
95.6
(16.4)
77.6
(30.0)
Source: VHLSS; for all averages, the figures in brackets are standard deviations.
96 Improving agricultural interventions under the new national target programs in Vietnam
8 Dao Tan Street, Ba Dinh District, Hanoi, Vietnam Telephone: +84 24 37740100 Facsimile: +84 24 37740111 Website: www.dfat.gov.au
8th Floor, 63 Ly Thai To Street, Hoan Kiem District, Hanoi, Vietnam Telephone: +84 24 39346600 Facsimile: +84 24 39346597 Website: www.worldbank.org/en/country/vietnam
With support from: