Improving Sustainability of Agricultural Landscapes Through ...
168
University of Tennessee, Knoxville University of Tennessee, Knoxville TRACE: Tennessee Research and Creative TRACE: Tennessee Research and Creative Exchange Exchange Doctoral Dissertations Graduate School 8-2018 Improving Sustainability of Agricultural Landscapes Through Improving Sustainability of Agricultural Landscapes Through Assessment and Adaptive Management Assessment and Adaptive Management Sarah Elizabeth Eichler Inwood University of Tennessee, [email protected] Follow this and additional works at: https://trace.tennessee.edu/utk_graddiss Recommended Citation Recommended Citation Eichler Inwood, Sarah Elizabeth, "Improving Sustainability of Agricultural Landscapes Through Assessment and Adaptive Management. " PhD diss., University of Tennessee, 2018. https://trace.tennessee.edu/utk_graddiss/5059 This Dissertation is brought to you for free and open access by the Graduate School at TRACE: Tennessee Research and Creative Exchange. It has been accepted for inclusion in Doctoral Dissertations by an authorized administrator of TRACE: Tennessee Research and Creative Exchange. For more information, please contact [email protected].
-
Upload
khangminh22 -
Category
Documents
-
view
3 -
download
0
Transcript of Improving Sustainability of Agricultural Landscapes Through ...

University of Tennessee, Knoxville University of Tennessee, Knoxville
TRACE: Tennessee Research and Creative TRACE: Tennessee Research and Creative
Exchange Exchange
Doctoral Dissertations Graduate School
8-2018
Improving Sustainability of Agricultural Landscapes Through Improving Sustainability of Agricultural Landscapes Through
Assessment and Adaptive Management Assessment and Adaptive Management
Sarah Elizabeth Eichler Inwood University of Tennessee, [email protected]
Follow this and additional works at: https://trace.tennessee.edu/utk_graddiss
Recommended Citation Recommended Citation Eichler Inwood, Sarah Elizabeth, "Improving Sustainability of Agricultural Landscapes Through Assessment and Adaptive Management. " PhD diss., University of Tennessee, 2018. https://trace.tennessee.edu/utk_graddiss/5059
This Dissertation is brought to you for free and open access by the Graduate School at TRACE: Tennessee Research and Creative Exchange. It has been accepted for inclusion in Doctoral Dissertations by an authorized administrator of TRACE: Tennessee Research and Creative Exchange. For more information, please contact [email protected].

To the Graduate Council:
I am submitting herewith a dissertation written by Sarah Elizabeth Eichler Inwood entitled
"Improving Sustainability of Agricultural Landscapes Through Assessment and Adaptive
Management." I have examined the final electronic copy of this dissertation for form and
content and recommend that it be accepted in partial fulfillment of the requirements for the
degree of Doctor of Philosophy, with a major in Energy Science and Engineering.
Virginia H. Dale, Major Professor
We have read this dissertation and recommend its acceptance:
David M. Butler, Donald G. Hodges, Keith L. Kline
Accepted for the Council:
Dixie L. Thompson
Vice Provost and Dean of the Graduate School
(Original signatures are on file with official student records.)

Improving Sustainability of Agricultural Landscapes Through Assessment and Adaptive
Management
A Dissertation Presented for the
Doctor of Philosophy Degree
The University of Tennessee, Knoxville
Sarah Elizabeth Eichler Inwood August 2018

ii
Copyright © 2018 by Sarah Eichler Inwood. All rights reserved.

iii
DEDICATION To my family – Joshua, Nicholas, Leura, and Malcolm who have given me
encouragement and perspective on what matters most. To the Eichler and Inwood clans and the dear friends who have given
moral and logistical support through the moves, childcare needs, and even chocolate emergencies.
To Helen Jane Eichler, Dolores Eichler, and Jane Drennan, intelligent and strong women: “never say I can’t, always say I’ll try.”

iv
ACKNOWLEDGEMENTS I wish to thank my advisor Virginia Dale for her dedicated guidance on this
dissertation and especially for inviting me to participate early in the process of developing an exciting research project with international collaborators. I appreciate her willingness to adjust to remote advising which allowed me to complete the dissertation. I am grateful for the input of my Dissertation Committee: David Butler, Donald Hodges, and Keith Kline who, as a key member of the research project at Oak Ridge National Laboratory (ORNL), has been instrumental in improving the manuscripts presented here. Many thanks to our collaborators at the International Maize and Wheat Improvement Center (CIMMYT): Bruno Gérard, Santiago López Ridaura, Ivan Ortiz-Monasterio, Bram Govaerts, Andrea Gardeazabal Monsalue, Kai Sonder, and Jon Hellin for providing enlightening discussions regarding the unique agricultural challenges of sustainable development, as well as valuable insight during trips to sites in Mexico and Guatemala. A joint CIMMYT - ORNL project: From Sustainable Intensification of Cropping Systems to Sustainable Farming Systems and Landscapes provided key funds for the research, resulting in manuscripts for Chapters 1-3. I am grateful for the opportunity to participate in CIMMYT’s Systems Analysis Workshop which provided an exceptional introduction to cutting edge science for sustainable intensification. I greatly appreciate the University of Tennessee’s Institute for a Secure and Sustainable Environment (ISSE) Seed-fund grant for Evaluating sustainability and resilience in agricultural systems using an integrated, web-based App for on-farm self-assessment and resource discovery with Virginia Dale and Don Hodges, that culminated in the manuscript for Chapter 4.
Thank you to Dr. Lee Riedinger, Wanda, Jessica, Tracey, and the entire Bredesen Center for creating a welcoming and supportive atmosphere while at the same time challenging students to excel – it has been a truly unique and enjoyable experience. I am grateful for the financial support provided by the Bredesen Center Fellowship, which allowed me to dedicate full attention to coursework and participate in valuable extra-curricular projects.

v
ABSTRACT Greater sustainability in agricultural landscapes can be achieved if
appropriate farm management practices are adopted in response to evolving socio-economic and environmental concerns identified by stakeholders. Development agencies, policy makers, and other stakeholders need data to support informed decisions that can improve the sustainability of agricultural landscapes. Chapter 1 reviews agricultural sustainability assessment frameworks to identify features to monitor progress towards goals for agricultural landscapes. Goals for improving sustainability vary depending on the context including local biophysical constraints on the system, social values, and economic relationships locally and globally. Chapter 2 details a process to identify themes and individual indicators for assessing sustainability in agricultural landscapes and applies the approach in a case study of Yaqui Valley, Mexico. After defining selection criteria, a set of indicators was developed in consultation with stakeholder groups. Access to data for selected indicators was a major obstacle to completing an assessment. Hence, Chapter 3 includes an analysis of selected indicators for which data were available.
Better digital tools may allow farmers and other resource managers to gather site-specific information and access global databases to characterize and monitor farms and landscapes. Chapter 4 reviews apps that can support sustainable agricultural landscapes and identifies gaps in information provisioning tools to connect decision-makers to knowledge. Many apps link farmers to specific products for single solutions, such as GPS-guided farm implements or sensors within internet-of-things connectivity. Mobile apps to improve multidirectional agriculture knowledge exchange are extremely limited and poorly documented. There remains a need for apps emphasizing knowledge exchange and resource discovery to help farmers identify science-based practices that improve sustainability of agricultural landscapes. Development of a digital decision support tool requires ongoing interactions with targeted end users to clarify app performance objectives and social networking preferences, ensure reliability of scientific input and business management plans, and optimize the user experience. Together these four chapters provide recommendations and conclusions that help stakeholders work toward more sustainable agricultural landscapes through adaptive management and iterative assessment of progress.

vi
TABLE OF CONTENTS
INTRODUCTION .................................................................................................. 1 Premise .................................................................................................. 2 Background ............................................................................................ 2
Agriculture, energy, and climate change ............................................. 2 Agricultural sustainability ..................................................................... 4
Indicators of sustainability in agricultural landscapes .......................... 5 Research goal ..................................................................................... 5
References ............................................................................................. 8 CHAPTER I ASSESSING SUSTAINABILITY IN AGRICULTURAL LANDSCAPES: A REVIEW OF APPROACHES................................................. 12
Abstract ................................................................................................ 13 Introduction ........................................................................................... 14
Review objectives ................................................................................. 19
Assessment frameworks ....................................................................... 20 Assessment purpose and stakeholders ............................................ 20 Boundaries of space, time, and system components ........................ 21
Indicators .......................................................................................... 22 Approach .............................................................................................. 25
Findings ................................................................................................ 26 Goals, stakeholders, and end-users ................................................. 26 Spatial and temporal boundaries ...................................................... 27
Dimensions, themes, and indicators ................................................. 29
Methodological approaches .............................................................. 30
Opportunities and challenges in addressing landscape concepts in agriculture ASAF .............................................................................. 30
Modeling in ASAF ............................................................................. 33 Recommendations ................................................................................ 34 Conclusion ............................................................................................ 39
Acknowledgements .............................................................................. 40 References ........................................................................................... 41
Appendix I.A ......................................................................................... 51 Appendix I.B ......................................................................................... 53
CHAPTER II SELECTING INDICATORS FOR ASSESSING PROGRESS TOWARD MORE SUSTAINABLE AGRICULTURAL LANDSCAPES: YAQUI VALLEY, MEXICO, CASE STUDY ..................................................................... 56
Abstract ................................................................................................ 57 Introduction ........................................................................................... 58
Background on the Yaqui Valley ........................................................... 60 Methods ................................................................................................ 62
Indicator themes ............................................................................... 64 Selecting indicators ........................................................................... 64
Results and discussion ......................................................................... 68

vii
Indicator themes ............................................................................... 68
Indicators .......................................................................................... 71
Challenges and lessons learned ....................................................... 71 Next steps ......................................................................................... 75
Conclusions .......................................................................................... 75 References ........................................................................................... 76 Appendix II ............................................................................................ 82
CHAPTER III ANALYSIS OF INDICATORS OF SUSTAINABILITY FOR YAQUI VALLEY, MEXICO, CASE STUDY ..................................................................... 87
Abstract ................................................................................................ 88 Introduction ........................................................................................... 89
Agricultural Landscapes .................................................................... 89
Objective ........................................................................................... 91
Methods ................................................................................................ 91
Case Study: Yaqui Valley, Mexico .................................................... 91 Objective 1: Collect information to select indicators available for assessment ...................................................................................... 94 Objective 2: Calculate assessed value of selected indicators ........... 95
Soil Quality ........................................................................................ 95 Productivity ....................................................................................... 95 Biodiversity ........................................................................................ 96
Vulnerability ...................................................................................... 97 Poverty .............................................................................................. 97
Transparency .................................................................................... 98 Economic Risk and Crop Diversity .................................................... 98
Objective 3: Identify baseline and target values for indicators .......... 99 Objective 4: Compare assessed indicator values with baseline and target values where available ........................................................... 99
Assessment Results and Discussion .................................................... 99 Soil quality: area of soils at risk for compaction or salinization ........ 102
Productivity: seasonal peak NDVI ................................................... 105 Biodiversity: legally protected habitat areas .................................... 108
Vulnerability: government index of vulnerability .............................. 110 Poverty: government index of social lag.......................................... 110 Transparency: Corruption Perceptions Index .................................. 113 Economic indicator: diversity of market crop yields ......................... 114
Conclusions ........................................................................................ 119
References ......................................................................................... 122
CHAPTER IV STATE OF APPS TARGETING MANAGEMENT FOR SUSTAINABLE AGRICULTURAL LANDSCAPES ............................................ 126
Abstract .............................................................................................. 127 Introduction ......................................................................................... 127 Approach ............................................................................................ 130
State of the art: Apps for sustainability in agriculture .......................... 132

viii
Opportunities and challenges for apps supporting sustainability in agricultural landscapes ...................................................................... 138
Conclusion .......................................................................................... 141 Acknowledgements ............................................................................ 143 References ......................................................................................... 144 Appendix IV ........................................................................................ 148
CONCLUSION .................................................................................................. 150
Summary ......................................................................................... 150 Lessons learned .............................................................................. 150
VITA .................................................................................................................. 153

ix
LIST OF TABLES
Table 1. Terminology .......................................................................................... 15 Table 2. Examples of agricultural landscape patterns and processes that should
be considered in order to develop, implement, and monitor adaptive management decisions to achieve progress toward context-specific, agricultural landscape goals. ....................................................................... 18
Table 3. Agricultural sustainability dimensions and themes typically found in assessment frameworks that could be used to monitor changes in agricultural landscapes. Indicator themes may relate to multiple services, and services affect aspects of all sustainability dimensions. ....................... 23
Table 4. Recommended features for a sustainability assessment framework applied to agricultural landscapes. ............................................................... 35
Table 5. Preliminary list of themes and indicators for which meeting participants were asked to identify top issues in the three dimensions of sustainable agricultural landscapes. The list was derived from McBride et al. (2011), Dale et al. (2013), and Eichler Inwood et al. (under review; see Chapter 1). ..................................................................................................................... 65
Table 6. Criteria for selection of indicators for use in agricultural sustainability assessments and explanation of rating method for applying the selection criteria. ......................................................................................................... 67
Table 7. Endorsed indicators, identified through an iterative compilation of stakeholder priorities and expert opinion, that can be used to assess progress toward sustainability within the agricultural landscape of Yaqui Valley, Mexico, are listed with preferred units of measurement. .................. 72
Table 8. Selected indicators, units, available data resources, and methodological approach for assessing sustainability of the Yaqui Valley, Mexico agricultural landscape. ................................................................................................. 100
Table 9. Transparency International Corruption Perceptions Index and ranking for Mexico (on a scale of 0-100, where 0 is highly corrupt whereas 100 is very clean) relative to 180 countries. ................................................................. 113
Table 10. Agricultural production from the top 25 crops for 2016 by area, and market values for the Yaqui Valley (based on data available from Mexico’s Servicio de Información Agroalimentaria y Pesquera). Reported totals apply to entire municipalities of Bácum, Benito Juárez, Cajeme, Etchojoa, Navojoa, and San Ignacio Río Muerto, including some areas outside of DRRY. Average (and standard deviations) of municipality yields and market values are list by crop. Scientific names were added according to FAO (2005). ....................................................................................................... 115
Table 11. Assessed values for indicators of sustainability in the Yaqui Valley landscape are shown relative to baseline and target values, where available. ................................................................................................................... 120
Table 12. Common categories of software tools for agriculture including example programs.................................................................................................... 133

x
Table 13. Software for information provisioning in support of improved sustainability across agricultural landscapes. ............................................ 137

xi
LIST OF FIGURES
Figure 1. Ecosystem services are the benefits humans receive from ecosystem functioning and are important to agricultural landscapes (based on categories listed in Millennium Ecosystem Assessment 2005). ..................... 1
Figure 2. Elements of patterns and processes of a landscape perspective: in the near-term, both biophysical and socio-economic settings of a landscape drive (or constrain) material and energy transfers that are also influenced by the presence, variety, and arrangement of landscape components. Each component may be linked to internal or external processes that change over time. ............................................................................................................. 17
Figure 3. Typical organization of sustainability assessment levels, using SAFA terminology (FAO 2013; de Olde et al. 2016) and showing example agricultural landscape themes and indicators under each of the three dimensions................................................................................................... 23
Figure 4. Six-step framework for sustainability assessment of agricultural landscapes using a transparent process with ongoing stakeholder involvement as organized by the coordinator of the assessment. Built upon López Ridaura (2005); Dale et al. (2015); and De Olde et al. (2017a). ........ 37
Figure 5. Locational map of the Yaqui River and watershed (gray shading) primarily in Sonora, Mexico. The expanded view shows the Yaqui Valley Irrigation District canal system (blue lines) overlying the multiple municipalities it serves, which covers primarily Cajame including Ciudad Obregón, as well as Navojoa, Benito Juarez, Etchojoa, Bácum, and San Ignacio Río Muerto. ..................................................................................... 61
Figure 6. Terminology used in this paper to describe the sets of indicators identified in each step of the process followed in the Yaqui Valley case study to identify indicators that are context specific, relevant to stakeholders and can be measured using available sources of information. ........................... 63
Figure 7. Visualization of local stakeholder priorities for indicator themes or categories within social, environmental, and economic dimensions for Yaqui Valley, Mexico. The size of each segment is proportional to the number of stakeholders who prioritized that indicator theme relative to others within the same dimension. Conservation of non-renewables includes soil and water conservation issues per stakeholder input. Water has been combined into one segment that includes water quality and quantity. Quality of life includes health, food security, and unspecified concerns. ......................................... 69
Figure 8. The “Distrito de Riego del Rio Yaqui” (DRRY) supplies irrigation water through a system of canals (blue lines) in several municipalities (white boundaries) in southern Sonora, Mexico. The Yaqui River watershed (pink boundary) stretches far north into southern Arizona, USA. Very little natural habitat is legally protected in the region (yellow hatched areas) and includes a few small islands and coastal wetlands in the Sea of Cortez. Geographic

xii
layers were applied by the author to ESRI DigitalGlobe Basemap satellite true-color imagery. ....................................................................................... 93
Figure 9. Eight soil types are found within the irrigation district, of which half is owned by ejido communities (hatched areas) and mostly rented to large-scale industrial farm businesses. Soil types that have a high risk for compaction or saltation require specific management in order to remain productive. ................................................................................................. 103
Figure 10. Total area of each type of soil is shown for the DRRY and compared to the area under ejido ownership. ............................................................. 104
Figure 11. Regional NDVI for cropped areas (using the GLAMS tool) peaks for winter crops during mid-February to mid-March and for summer crops in late August to late September in the Yaqui Valley, after applying the VISNAV-LULC crop mask to the regional time series for MODIS satellite data. ...... 106
Figure 12. NDVI on March 5, 2016 shows crops at near-peak growth stage throughout the Yaqui Valley municipalities (black lines) as indicated by dark green pixels (based on MODIS satellite imagery available at https://glam1.gsfc.nasa.gov/). Non-cropped areas are shown as white. .... 107
Figure 13. The fields within DRRY are primarily flood-irrigated through a system of canals that are periodically removed of vegetation. Very little perennial shrub or tree cover is found in the district. (Photo by S. Eichler Inwood). .. 109
Figure 14. Rural residents of the DRRY are primarily within Cajeme and Bacum municipal boundaries. ................................................................................ 111
Figure 15. Mexican government classification for indices of vulnerability and social lag according to municipality are shown by percent of the rural DRRY residents. ................................................................................................... 112
Figure 16. Two-thirds of crop production by area in the Yaqui valley is dominated by winter wheat, but several other crops are grown in the DRRY. ............. 117
Figure 17. According to records obtained from a local crop health agency (Junta Local de Sanidad Vegetal del Valle del Yaqui), many types of crops were grown in DRRY during 2017 though as a very small proportion relative to wheat in terms of hectares. Crops grown on less than 20 ha are not shown. ................................................................................................................... 118
Figure 18. Milpa-- the ancient system of intercropping maize, bean, and other vegetables --grows beneath modern cellular towers on steep slopes in the Guatemala highland town of Todos Santos. Digital decision support tools could help development workers and farmers address environmental, social, and economic concerns in the landscape through knowledge sharing on locally effective practices that, for example, increase soil organic matter and prevent erosion, improve educational equity by reducing labor burdens on women and youth, diversify marketable products to local, national, and international consumers, and reduce post-harvest storage losses. ........... 129
Figure 19. An overwhelming number of digital tools are available for a variety of farm management needs however they are generally poorly documented and often do not interface readily with existing digital or analog resources.

xiii
Apps do not take an integrated approach to addressing environmental, social and economic issues surrounding agricultural sustainability goals; instead supporting individual commercial equipment or specific farm management objectives. ............................................................................ 131
Figure 20. Design of a digital decision support tool for improved sustainability in agricultural landscapes should consider performance, reliability and user experience at the earliest development stages to enhance uptake by farmers and land managers. Summarized from Rose et al. (2016), Hochman and Carberry (2011), and Ochala and Kerkides (2004). ................................... 139
Figure 21. Software design features recommended for a broadly applicable knowledge sharing system for improving sustainability of agricultural landscapes are illustrated: provision of a fully documented web portal linking digital cloud databases, geographic information systems including volunteered and crowd-sourced data, private sensors and social networking platforms may improve performance, reliability, user experience, and thus uptake by development workers and farmers. ........................................... 142

1
INTRODUCTION
Adopting practices to achieve more sustainable agriculture may influence
not only food security but also energy systems, global climate change, and social stability. Though sustainability has been variously defined, "systems high in sustainability can be taken as those that aim to make the best use of environmental goods and services while not damaging these assets" (Pretty 2008) while supporting economically viable agriculture and healthy, secure societies. Agriculture provides a diversity of services to the world by producing food, feed, fiber, and fuel. Agricultural practices affect a wide range of ecosystem services (Figure 1), including water quality, pollination, nutrient cycling, soil retention, carbon sequestration, and biodiversity conservation as well as social and economic conditions of the farm systems, agricultural landscapes, and regions in which they occur (Millennium Ecosystem Assessment, 2005). Determining appropriate indicators for documenting more or less sustainable systems depends on one's definition of "sustainable" as well as the goals of the assessment (Gasparatos and Scolobig 2012; Marchand et al. 2014).
Figure 1. Ecosystem services are the benefits humans receive from ecosystem functioning and are important to agricultural landscapes (based on categories listed in Millennium Ecosystem Assessment 2005).

2
Premise
The major premise underlying this dissertation is that progress toward sustainability in agricultural landscapes can be achieved by adopting farm management practices in in response to evolving socio-economic and environmental concerns identified by stakeholders. Agricultural landscapes refer to a perspective that considers the patterns and processes relevant to functioning of agro-ecosystems. Importantly, this perspective views the arrangement and distribution of farm systems that interact via shared social, economic, and bio-physical resources. In order to determine which management practices are helping or hindering progress toward sustainability goals, stakeholders need a methodical approach for assessing baseline and target conditions among environmental, social, and economic issues important to their agricultural system. Then communities, farmers, and other stakeholders can make informed decisions on which alternative practices will address priority issues.
Background
Agriculture, energy, and climate change
Agriculture is an energy intensive activity. In 2014, US on-farm energy consumption (direct and indirect energy embodied by fertilizer and pesticide inputs) corresponds to about 1.8 billion GJ, which is approximately 1.7% of total US primary energy consumption (Hitaj and Suttles 2016). Comparisons of national or continental energy consumption in agriculture are extremely limited. However, one estimate shows that, per hectare of arable land, developing countries use less than 1/3 of the energy used by industrialized countries (Food and Agriculture Organization (FAO), 2000). Diesel and fertilizer inputs make up the majority of energy consumption on industrialized farms, but the relative amounts depend on crop type and management practices (Beckman, Borchers, and Jones 2013). Energy inputs ranges from 8-690 GJ/ha for 12 key crops across hand-cultivated and mechanized systems (Pimentel 2009). Irrigation can be a major energy input: for example, Grassini and Cassman (2012) reported 30 GJ per hectare of direct and indirect fossil fuel inputs for high-yielding irrigated US maize, in which over 40% was attributed to irrigation pumping. Food-related energy accounts for over 15% of US energy consumption (Canning et al. 2010). Edible Energy Efficiency (Edible Energy Return on Energy Invested; EEROI) for the top 15 US agricultural products was 2.5:1 (Hamilton et al. 2013), excluding crops intended for bioenergy. The EEROI also varies dramatically by crop and cultivation method, for example hand-cultivated corn in Indonesia yields 1.08 per unit input, while intensive mechanized corn in the US yields 4.1 per unit input (includes human labor; Pimentel, 2009).
Agriculture also produces energy. In 2012, only about 3.5% of US farms produced some type of renewable energy on-farm (solar, geothermal, wind, small-hydro, methane digesters, biodiesel or bioethanol; Hitaj and Suttles, 2016). The biomass-for-bioenergy industry (including biofuel feedstocks, wood, and

3
waste) is expanding and represented about 5% of US energy consumption in 2013 (Joyce 2014).
Energy markets and agricultural production are tightly linked. Fuel prices directly affect tillage and fertilizer costs and indirectly impact prices through the supply chain to the consumer (Woods et al. 2010). Worldwide food and energy price indexes are highly correlated (0.94; Ringler, Bhaduri, & Lawford, 2013).
Energy and water limitations often influence agriculture decisions and impact food security. Integrated approaches to examining food, energy, and water security recognize there are inseparable relationships between ecosystem services related to water, energy, and agriculture resources that support human well-being (Hoff 2011). Integrated approaches use a whole-system perspective to identify ways to increase efficiencies and synergies across sectors (Bazilian et al. 2011; Giampietro et al. 2014; Hoff 2011; Ringler, Bhaduri, and Lawford 2013). Such integrated approaches to agriculture seek to provide food, fiber, feed and fuel by balanced use of water, energy, and nutrients while addressing climate change mitigation and adaptation.
Agriculture, forestry, and land use contributions to net greenhouse gas emissions globally represent about 24% of total anthropogenic emissions (~10 Gt CO2-eg/yr; Smith et al., 2014). The Intergovernmental Panel on Climate Change (IPCC) calculates that direct contributions from crop and livestock production are 13.5% of global GHG, [excluding fossil energy inputs, post farm-gate uses, and land-use change and deforestation] (IPCC, 2007) as cited in (FAO 2013), as well as 58% of N2O, and 37% CH4 emissions globally (FAO 2013). Affordable reductions in emissions and mitigation potential due to sequestration and fuel-substitution from agriculture are possible (Smith et al. 2014) and changes in agricultural policy have already resulted in decreases to net GHG emissions. For example, the European Union reported that combined agricultural emissions of CH4, N2O and CO2 in 2014 accounted for 436 MT CO2-eq in 2014, which represents large reductions (22, 18, and 26% respectively) in emissions since 1990 due to fertilizer and manure management and reduced cattle numbers resulting from changes to market support mechanisms (European Commission DG Climate Action 2016).
More resilient agricultural production in the face of a changing and uncertain climate offers advantages to support stable socio-economic functioning, in addition to greenhouse gas emissions mitigation potential. Thus, indicators of sustainable agricultural landscapes should take into account regional and local climate change vulnerabilities through a framework of coupled human-natural systems (Matson, Luers, and McCullough 2012). One key concern is disruption to water resources available for agriculture resulting from drought, flooding, and economic development pressures. Sea level rise and resulting changes to storm-surges and salt-water intrusion put at-risk large agricultural areas like Bangladesh (Ruane et al. 2013). Unseasonably hot nighttime temperatures are associated with significant yield reductions in rice (Peng et al. 2004) and wheat (Prasad et al. 2008; Ortiz et al. 2008).

4
Understanding these risks and potential adaptation strategies are important areas of research for agriculture and development organizations. A growing field of sustainability science is helping to addresses these challenging issues.
Agricultural sustainability
The concept of sustainability has been in discourse for millennia (see review in Pretty & Bharucha, 2014) and, perhaps because of this long history, is difficult to define. Agricultural sustainability encompasses aspirational goals that challenges practitioners and researchers to consider farming effects on ecosystems and communities while also advancing food and energy security, clean abundant water, healthy productive soils, and other benefits to socioeconomic and environmental systems. Creating more sustainable agriculture systems requires practices that are socially just, environmentally sound, and economically profitable (Dale, Kline, et al. 2013). Because agriculture inherently requires a broad array of ecosystem services, agricultural sustainability often addresses practices that "(1) do not have adverse effects on the environment […] (2) are accessible to and effective for farmers, and (3) lead to both improvements in productivity and […] environmental goods and services" (Pretty 2008).
In many regions, sustainable intensification (Pretty 2008) is the focus of agricultural improvements, especially in developing countries where maize and wheat yields are furthest from yield potential. Intensification of certain agriculture systems has resulted in increased productivity and better food security (for some) but may be causing local and regional degradation of agricultural land, air, and water resources or instabilities to social and economic functioning. Recent literature recognizes that a series of sustainable development choices must be made in an iterative, dynamic fashion that balances the tradeoffs associated with each alternative (Crews and Peoples 2004; Pretty 2008; Norgaard 2010; Foley et al. 2011). Decision-making can be improved by using a robust process for systematically incorporating scientific knowledge, contextual details and stakeholder priorities.
To properly assess relative sustainability of possible alternative practices, particularly in energy and agriculture sectors, it is necessary to examine the tradeoffs at multiple scales and with appropriate context (Dale, Kline, et al. 2013). Many local decisions have far-reaching biophysical consequences: for example, the timing and rate of fertilizer application across the Upper Midwestern US can affect fisheries in the Gulf of Mexico, or the movement of infested camp-firewood can leapfrog diseases in forest trees. Valuation of tradeoffs is difficult: what is beneficial on the local scale may be detrimental at a larger scale, or even what one decides is 'beneficial' depends on a range of social, cultural, environmental, economic, and political decisions as well as the system in which one operates. Thus, efforts to understand and define sustainability are often contested and must balance the needs of stakeholders with technological changes and environmental protection.

5
Indicators of sustainability in agricultural landscapes
Common indicators of sustainability are needed to compare different agricultural systems or changes to an individual system over time within environmental, social, and economic dimensions. While no particular consensus has yet been reached, McBride and co-authors (2011) offer a suite of environmental indicators (soil quality, water quality and quantity, greenhouse gas emissions, biodiversity, air quality, and productivity), and Dale, Efroymson, and others (2013) describe social and economic indicator themes (social well-being, energy security, external trade, profitability, resource conservation, and social acceptability) for bioenergy; all of which could be applied in assessing agricultural systems.
Choosing the indicators needed to gauge progress toward sustainability at a certain location for a specific type of system requires contextual information. Regardless of which indicators are chosen, they should be practical, sensitive, unambiguous, anticipatory, predictive of manageable changes, able to be estimated, and sufficient (Dale and Beyeler 2001; Dale, Efroymson, et al. 2013). In some instances, this may mean limiting options and creating a standardized group of indicators and methodologies that facilitates comparisons across assessments and is grounded in strong science. Determining appropriate indicators for documenting practices that support more sustainable systems depends on the goals of the assessment.
Collectively, all agriculturally managed systems comprise a large portion of land globally (about 40% of the earth’s ice-free land surface; Ramankutty et al. 2008), and they influence ecological, social, and economic system processes far beyond the farm itself. Consequently, agricultural landscape assessments should link spatial scales (e.g., field to farm to watershed) and encompass dynamic patterns and processes.
Agricultural sustainability assessment frameworks, and the specific protocols that are derived from them, are useful to identify changes resulting from implementing alternative management practices or policies. Integration of diverse information (e.g., from indicators representing all three pillars of sustainability) is a crucial step in assessing sustainability of agro-ecosystems. Stakeholders need better methods for incorporating landscape patterns and processes into agricultural assessments. For example, sustainable management practices can be improved by knowing where in the landscape specific practices would be most effectively implemented to positively affect targeted ecosystem services.
Research goal
The goal of the dissertation research presented here was to develop and test an indicator-based approach for assessing progress toward sustainability in agricultural landscapes. Questions that guided this research included: (1) Which features of existing frameworks or protocols are useful for assessing agricultural sustainability from a landscape perspective? (2) What themes and indicators are broadly applicable but sufficiently customizable to be relevant for assessing

6
sustainability across diverse agro-ecosystem and socio-economic landscapes under both climate uncertainties and varying stakeholder values? (3) What existing information can be used to identify baseline and target indicator values? (4) Which information technologies and resource linkages can help farmers, extension agents, and other stakeholders contextualize and prioritize decision-making regarding practical farm management alternatives? To address these questions, I completed qualitative and quantitative research described in the following chapters.
In Chapter I, I review existing agricultural sustainability assessment frameworks (ASAF) and recommend features suitable for landscape assessment that emphasizes stakeholder engagement and site context. This literature review of integrated agricultural sustainability assessments that are applicable to diverse farm systems and locations provides valuable context and background required for development of a landscape assessment framework. Furthermore, it offers an opportunity to clarify important terminology. The review considers ways to perform a landscape assessment of agricultural systems.
In Chapter II, I present the process for selection of suitable indicators for testing the recommended assessment framework in a case study of Yaqui Valley, Mexico. Case studies are needed to develop a framework that is flexible and useful for efforts to promote sustainable farming systems worldwide. A case study also provides an opportunity to test the approach proposed for the assessment framework and obtain feedback from stakeholders. The Yaqui Valley was selected because research collaborators at the International Maize and Wheat Improvement Center (CIMMYT) have an established presence there with motivated local partners, leading to lower cost and ease of logistics relative to alternative sites. The case study presents an opportunity to extend the bi-directional communication between the community and researchers which CIMMYT has developed. Criteria for the selection of indicators have been proposed (Dale and Beyeler 2001; Dale, Efroymson, et al. 2013). A framework for selecting indicators for assessing sustainability of bioenergy systems is detailed in Dale et al. (2015). Those recommendations provide the basis of the list of criteria for selecting indicators to assess sustainability in agricultural landscapes. Application of the indicator selection criteria to the Yaqui Valley case study via an iterative, semi-quantitative ranking system of potential indicators is described. Potential indicators for the Yaqui Valley case study are developed based on the selection criteria in conjunction with discussions involving knowledgeable collaborators and stakeholders, as well as an ongoing examination of possible data resources.
The case study assessment is continued in Chapter III, in which I examine some indicators of sustainability for the Yaqui Valley agricultural landscape. A subset of presently available indicator data are analyzed relative to priorities identified through the stakeholder engagement. Implications for management decisions are discussed.

7
Farm systems of all types and sizes can incorporate better management practices that enhance sustainability, including food security and resilience towards impacts of climate change. Farmer goals, preferences and concerns must be prioritized in order to achieve long-term environmental and food security improvements. Farmers or extension agents could employ a user-friendly smart-phone or web-based application to determine strengths, weaknesses, and opportunities for more sustainable farm management practices within their major crop types, region, and climate. Chapter IV reviews existing mobile applications intended to facilitate management of agricultural landscapes for sustainability and recommends several features that could contribute to a successful digital platform for sustainable agriculture knowledge exchange.
Together these four chapters provide recommendations and conclusions that can be used by stakeholders to improve agricultural sustainability through assessments to inform adaptive management decisions for landscapes. The recommended assessment framework is applicable to diverse landscapes and socio-economic contexts. The set of indicators developed in the case study provides an example of the selection procedure and highlights the iterative and flexible approach needed for a landscape assessment. Likewise, the indicators, baseline, and targets used for an assessment of the Yaqui Valley landscape illustrate potential information sources that could be employed under limited time and funds. The results of the limited assessment should be shared with stakeholders, along with a mechanism to collect feedback on the lessons learned from the assessment process.

8
References
Bazilian, Morgan, Holger Rogner, Mark Howells, Sebastian Hermann, Douglas Arent, Dolf Gielen, Pasquale Steduto, et al. 2011. “Considering the Energy, Water and Food Nexus: Towards an Integrated Modelling Approach.” Energy Policy 39: 7896–7906. doi:10.1016/j.enpol.2011.09.039.
Beckman, Jayson, Allison Borchers, and Carol A Jones. 2013. “Agriculture’s Supply and Demand for Energy and Energy Products.” US Department of Agriculture, Economic Research Service. doi:10.2139/ssrn.2267323.
Canning, Patrick, Ainsley Charles, Sonya Huang, Karen R Polenske, and Arnold Waters. 2010. “Energy Use in the U.S. Food System. USDA Economic Research Service Economic Research Report No. 94.”
Crews, T.E, and M.B Peoples. 2004. “Legume versus Fertilizer Sources of Nitrogen: Ecological Tradeoffs and Human Needs.” Agriculture, Ecosystems & Environment 102 (3): 279–97. doi:10.1016/j.agee.2003.09.018.
Dale, Virginia H, and Suzanne C Beyeler. 2001. “Challenges in the Development and Use of Ecological Indicators.” Ecological Indicators 1: 3–10.
Dale, Virginia H., Rebecca A. Efroymson, Keith L. Kline, Matthew H. Langholtz, Paul N. Leiby, Gbadebo a. Oladosu, Maggie R. Davis, Mark E. Downing, and Michael R. Hilliard. 2013. “Indicators for Assessing Socioeconomic Sustainability of Bioenergy Systems: A Short List of Practical Measures.” Ecological Indicators 26: 87–102. doi:10.1016/j.ecolind.2012.10.014.
Dale, Virginia H., Keith L. Kline, Stephen R. Kaffka, and J. W. A. Langeveld. 2013. “A Landscape Perspective on Sustainability of Agricultural Systems.” Landscape Ecology 28 (6): 1111–23. doi:10.1007/s10980-012-9814-4.
Dale, Virginia H., Rebecca A. Efroymson, Keith L. Kline, and Marcia S. Davitt. 2015. “A Framework for Selecting Indicators of Bioenergy Sustainability.” Biofuels, Bioproducts and Biorefining 9: 435–46. doi:10.1002/bbb.1562.
European Commission DG Climate Action. 2016. “Technical Report No 15/2016 Annual European Union Greenhouse Gas Inventory 1990 – 2014 and Inventory Report 2016.” Brussels.
Foley, Jonathan A, Navin Ramankutty, Kate A Brauman, Emily S Cassidy, James S Gerber, Matt Johnston, Nathaniel D Mueller, et al. 2011. “Solutions for a Cultivated Planet.” Nature 478: 337–42. doi:10.1038/nature10452.
Food and Agriculture Organization (FAO). 2000. “The Energy and Agriculture Nexus.” 4. Environment and Natural Resources Working Paper. Rome, Italy.
———. 2013. Climate-Smart Agriculture Sourcebook. Sourcebook on Climate-Smart Agriculture, Forestry and Fisheries.
Gasparatos, A., and A. Scolobig. 2012. “Choosing the Most Appropriate Sustainability Assessment Tool.” Ecological Economics 80. Elsevier B.V.: 1–7. doi:10.1016/j.ecolecon.2012.05.005.

9
Giampietro, Mario, Richard J. Aspinall, Jesus Ramos-Martin, and Sandra G.F. Bukkens, eds. 2014. Resource Accounting for Sustainability Assessment: The Nexus between Energy, Food, Water and Land Use. New York: Routledge.
Grassini, Patricio, and Kenneth G Cassman. 2012. “High-Yield Maize with Large Net Energy Yield and Small Global Warming Intensity.” Proceedings of the National Academy of Sciences of the United States of America 109 (4): 1074–79. doi:10.1073/pnas.1116364109.
Hamilton, Abbe, Stephen B. Balogh, Adrienna Maxwell, and Charles A S Hall. 2013. “Efficiency of Edible Agriculture in Canada and the U.S. Over the Past Three and Four Decades.” Energies 6 (3): 1764–93. doi:10.3390/en6031764.
Hitaj, Claudia, and Shellye Suttles. 2016. “Trends in U. S. Agriculture’s Consumption and Production of Energy: Renewable Power, Shale Energy, and Cellulosic Biomass, EIB-159.”
Hoff, Holger. 2011. “Understanding the Nexus. Background Paper for the Bonn2011 Nexus Conference:” Stockholm Environment Institute, no. November: 1–52.
Intergovernmental Panel on Climate Change, (IPCC). 2007. Climate Change 2007: Mitigation of Climate Change. Edited by R. Dave & L.A. Meyer B. Metz, O.R. Davidson, P.R. Bosch. Contributi. Cambridge, UK: Cambridge University Press.
Joyce, Mary. 2014. “Biofuels Production Drives Growth in Overall Biomass Energy Use over Past Decade.” Today in Energy; March 18, 2014.
Marchand, Fleur, Lies Debruyne, Laure Triste, Catherine Gerrard, Susanne Padel, and Ludwig Lauwers. 2014. “Key Characteristics for Tool Choice in Indicator-Based Sustainability Assessment at Farm Level.” Ecology and Society 19 (3). doi:10.5751/ES-06876-190346.
Matson, Pamela A., Amy L. Luers, and Ellen McCullough. 2012. “Examining Vulnerability in the Yaqui Valley Human-Environment System.” In Seeds of Sutstainability: Lessons from the Birthplace of the Green Revolution, edited by Pamela A. Matson, 1st ed., 83–92. Washington, D.C.: Island Press.
McBride, Allen C., Virginia H. Dale, Latha M. Baskaran, Mark E. Downing, Laurence M. Eaton, Rebecca A. Efroymson, Charles T. Garten, et al. 2011. “Indicators to Support Environmental Sustainability of Bioenergy Systems.” Ecological Indicators 11 (5). Elsevier Ltd: 1277–89. doi:10.1016/j.ecolind.2011.01.010.
Millennium Ecosystem Assessment. 2005. “Ecosystems and Human Well-Being: Synthesis.” In Ecosystems, edited by Anantha Kumar Duraiappah, Shahid Naeem, Tundi Agardy, Neville J. Ash, H. David Cooper, Sandra Díaz, Daniel P. Faith, et al., 5:1–100. Washington DC: Island Press. doi:10.1196/annals.1439.003.

10
Norgaard, Richard B. 2010. “Ecosystem Services: From Eye-Opening Metaphor to Complexity Blinder.” Ecological Economics 69 (6). Elsevier B.V.: 1219–27. doi:10.1016/j.ecolecon.2009.11.009.
Ortiz, Rodomiro, Kenneth D. Sayre, Bram Govaerts, Raj Gupta, G. V. Subbarao, Tomohiro Ban, David Hodson, John M. Dixon, J. Iván Ortiz-Monasterio, and Matthew Reynolds. 2008. “Climate Change: Can Wheat Beat the Heat?” Agriculture, Ecosystems and Environment 126 (1–2): 46–58. doi:10.1016/j.agee.2008.01.019.
Peng, Shaobing, Jianliang Huang, John E Sheehy, Rebecca C Laza, Romeo M Visperas, Xuhua Zhong, Grace S Centeno, Gurdev S Khush, and Kenneth G Cassman. 2004. “Rice Yields Decline with Higher Night Temperature from Global Warming.” Proceedings of the National Academy of Sciences of the United States of America 101 (27): 9971–75. doi:10.1073/pnas.0403720101.
Pimentel, David. 2009. “Energy Inputs in Food Crop Production in Developing and Developed Nations.” Energies 2 (1): 1–24. doi:10.3390/en20100001.
Prasad, P V V, S R Pisipati, Z Ristic, U Bukovnik, and A K Fritz. 2008. “Impact of Nighttime Temperature on Physiology and Growth of Spring Wheat All Rights Reserved. No Part of This Periodical May Be Reproduced or Transmitted in Any Form or by Any Means, Electronic or Mechanical, Including Photocopying, Recording, or Any Info.” Crop Science 48. Madison, WI: Crop Science Society of America: 2372–80. doi:10.2135/cropsci2007.12.0717.
Pretty, Jules. 2008. “Agricultural Sustainability: Concepts, Principles and Evidence.” Philosophical Transactions of the Royal Society of London. Series B, Biological Sciences 363 (1491): 447–65. doi:10.1098/rstb.2007.2163.
Pretty, Jules, and Zareen Pervez Bharucha. 2014. “Sustainable Intensification in Agricultural Systems.” Annals of Botany 114 (8). Oxford University Press: 1571–96. doi:10.1093/aob/mcu205.
Ramankutty, Navin, Amato T. Evan, Chad Monfreda, and Jonathan A. Foley. 2008. “Farming the Planet: 1. Geographic Distribution of Global Agricultural Lands in the Year 2000.” Global Biogeochemical Cycles 22 (1): 1–19. doi:10.1029/2007GB002952.
Ringler, Claudia, Anik Bhaduri, and Richard Lawford. 2013. “The Nexus across Water, Energy, Land and Food (WELF): Potential for Improved Resource Use Efficiency?” Current Opinion in Environmental Sustainability 5 (6): 617–24. doi:10.1016/j.cosust.2013.11.002.
Ruane, Alex C., David C. Major, Winston H. Yu, Mozaharul Alam, Sk Ghulam Hussain, Abu Saleh Khan, Ahmadul Hassan, et al. 2013. “Multi-Factor Impact Analysis of Agricultural Production in Bangladesh with Climate Change.” Global Environmental Change 23 (1). Elsevier Ltd: 338–50. doi:10.1016/j.gloenvcha.2012.09.001.

11
Smith, Pete, Mercedes Bustamante, H. Ahammad, H. Clark, H. Dong, E. A. Elsiddig, H. Haberl, et al. 2014. “Ch 11, Agriculture, Forestry and Other Land Use (AFOLU).” In Climate Change 2014: Mitigation of Climate Change, Contribution of Working Group III to the Fifth Assessment Report of the Intergovernmental Panel on Climate Change, edited by T. Zwickel and J.C. Minx (eds.) Edenhofer, O., R. Pichs-Madruga, Y. Sokona, E. Farahani, S. Kadner, K. Seyboth, A. Adler, I. Baum, S. Brunner, P. Eickemeier, B. Kriemann, J. Savolainen, S. Schlömer, C. von Stechow, 811–922. Cambridge, UK: Cambridge University Press.
USDA, and Economic Research Service. 2014. “Bioenergy Findings.” Amber Waves ERS E-Zine. http://www.ers.usda.gov/topics/farm-economy/bioenergy/findings.aspx.
Woods, Jeremy, Adrian Williams, John K Hughes, Mairi Black, and Richard Murphy. 2010. “Energy and the Food System.” Philosophical Transactions of the Royal Society B Biological Sciences 365 (1554): 2991–3006. doi:10.1098/rstb.2010.0172.

12
CHAPTER I ASSESSING SUSTAINABILITY IN AGRICULTURAL
LANDSCAPES: A REVIEW OF APPROACHES

13
A version of this chapter was originally submitted for publication by Sarah Eichler Inwood and others:
Eichler Inwood, Sarah E., Santiago López Ridaura, Keith L. Kline, Bruno Gerard, Andrea Gardeazabal Monsalue, Bram Govaerts, and Virginia H. Dale. (under revision). “Assessing Sustainability in Agricultural Landscapes: A Review of Approaches.” Environmental Reviews.
Sarah Eichler Inwood completed the primary review of literature, prepared
the initial manuscript and coordinated revisions by co-authors. Virginia Dale and Keith Kline provided significant text and organizational edits, and all authors provided discussion, comments, and textual edits. Comments from reviewers for the journal helped improve this manuscript. It has been revised from the journal submission in order to fit formatting requirements.
Abstract
Research and development agencies as well as policy makers and agri-food enterprises have a need for reliable data to support informed decisions that can improve the sustainability of agricultural landscapes. We present a review of agricultural sustainability assessment frameworks (ASAF) to identify the features that are most relevant to monitoring progress towards sustainability goals for agricultural landscapes. This qualitative review considers a variety of approaches for defining goals, engaging stakeholders, identifying spatial and temporal boundaries, indicators, and analytical approaches. We focused on assessment frameworks that 1) include environmental, social, and economic implications of agriculture, 2) take a systems view applicable to multiple, non-specified farm system types, 3) are described in an English language, peer-reviewed publication, 4) have been developed for use at a farm system to regional spatial scale, 5) engage stakeholders, 6) provide case studies, and 7) could be used in a variety of contexts and farm system types across the globe. Based on the review, we provide recommendations for further development and use of assessment frameworks to better address the needs of agricultural research, extension, and development organizations. We recommend an agro-ecosystem rather than business or product-focused approach to help stakeholders identify appropriate indicators for their situation. Assessment approaches need to be transparent and flexible enough for adaptation to a spectrum of agricultural landscapes and remain relevant as farmers and other stakeholders acquire new information, resources, and different management techniques. Information gaps across different scales, from farm to region, require novel approaches to fill—including some reliance on local knowledge systems. Assessment results should communicate relationships among ecosystem services and socio-economic activities related to agricultural landscapes, and visualization tools can facilitate

14
understanding of trade-offs and synergies among sustainability goals as reflected by individual indicators.
Introduction
Agriculture provides a diversity of services by producing food, feed, fiber, and fuel. Ecosystem services were defined by the Millennium Ecosystem Assessment (2005) to be the ecological benefits people obtain from ecosystems (see bolded terminology in Table 1). Agricultural practices affect a wide range of ecosystem services, including water quality, pollination, nutrient cycling, soil retention, carbon sequestration, biodiversity conservation, and climate regulation, as well as social and economic conditions of the farm systems and the landscapes and regions in which they occur. Relationships between agriculture and ecosystem services include beneficial services generated and received by agriculture, as well as negative impacts upon services that result from farm activities (Dale and Polasky 2007). Adaptive management of agricultural practices is needed to respond to changing environmental conditions and socio-economic priorities.
Agricultural sustainability is an aspirational goal that challenges stakeholders to consider farming effects on ecosystems and communities while also advancing food and energy security, clean abundant water, healthy productive soils, and other goals such as the United Nations’ Sustainable Development Goals (SDGs; United Nations 2015). Although sustainability has been variously defined, it focuses on practices "that aim to make the best use of environmental goods and services while not damaging these assets" (Pretty 2008). Alternative management practices have been generated by farmers, researchers, and development institutions with the aim of producing efficient, profitable agricultural products with fewer negative environmental or human health impacts. Such practices have been mainly developed for application to fields (e.g., improved crop varieties or breeds, cropping systems, soil fertility management, plant protection methods) or to farms (e.g., crop-livestock integration, manure management, crop rotations, integrated pest management; National Research Council 1989). However, agricultural practices affect and are influenced by environmental, social, and economic conditions not only on individual fields and farms but also for the collection of farms and communities that make up an agricultural landscape (National Research Council 2010).
Quantifying and monitoring socio-economic and biophysical processes for areas larger than individual farms— within a watershed, for example —is necessary to reveal benefits or impacts (National Research Council 2010; Allain et al. 2017). Developing agricultural sustainability assessment frameworks (ASAF) that bridge farm system to landscape scales is important because, in the absence of sweeping policy or technology changes, practices that promote sustainable agricultural landscapes generally will be adopted by farmers within the farm gate or within local community governance (Graymore et al. 2008). Human well-being relies on nature’s benefits to people, and sustainability

15
Table 1. Terminology
Term Definition
Ecosystem services
Ecological functions and processes that contribute to human well-being; often categorized as provisioning, regulating, cultural and supporting functions (Dale and Polasky 2007; de Groot et al. 2002; Millennium Ecosystem Assessment 2005).
Farm system The mix of crops and/or animals on a farm, their spatial and temporal arrangement, as well as their relationships with socio-economic and ecological environments within which the farm operates including community links, markets, labor, and other influencing factors (National Research Council 2010) and the households, their resources and resource flows (Dixon et al. 2001).
Adaptive management
Learning by doing; iterative process of monitoring and evaluation guides practices to better fit changing conditions and needs and respond to new information, to identify and apply corrective measures where warranted (e.g., Kline et al. 2017; Dale et al. 2016; Walters 1986).
Agricultural sustainability
Production of food, feed, fiber and fuel that aims to support and conserve ecosystem services in order to support present and future healthy environments, societies and economies through a process of adaptive management (Brundtland 1987; Tilman et al. 2002; Pretty 2008).
Agricultural landscapes
The patterns and processes relevant to functioning of agro-ecosystems and encompassing the pertinent spatial and temporal scales of the arrangement and distribution of farm systems, their interactions and environmental and socio-economic factors that influence them.
Frameworks The set of ideas, principles, guidelines, or approaches that provides the basis for an assessment.
Participatory frameworks
Frameworks that seek stakeholder participation and incorporate stakeholder opinions throughout the assessment process, often in an iterative fashion that creates a learning environment for all participants, allowing for more comprehensive integration of values (Lopes and Videira 2013; Van Meensel et al. 2012).
Stakeholder Any person or group with a direct or indirect interest, involvement, or investment in the process under consideration, which for agriculture includes assessors, farmers, farm laborers, extension agencies, production units, legislators, agricultural decision makers, nongovernmental organizations (NGOs), and consumers.
Indicators Summary measures that describe system properties and inform decision-making; based on observations, or metrics (aggregated data) that gauge conditions or trends (ISPC 2014).
Protocols Techniques for analyzing data. Note: protocols to operationalize a sustainability assessment framework include steps to define the purpose (for example, to evaluate soil quality improvements), realm of application (such as agricultural production regions in western Mexico), and guidelines for selecting indicators.

16
assessments can be used to express shared values as well as conflicts among stakeholders’ goals (Dale et al. 2013a; Diaz et al. 2015; Griggs et al. 2017; Allain et al. 2017).
Assessment frameworks with capabilities to consider broad-scale patterns and processes can support progress toward more sustainable agricultural landscapes. For example, understanding how farm and landscape processes interact can help identify where specific practices are most needed (Bonner et al. 2014; Muth et al. 2013; National Research Council 2010). In order to achieve desired improvements to environmental and socio-economic conditions, practices may be required on multiple farms across the landscape. For example, for water quality goals to be met, practices such as reforestation or soil and water conservation structures such as canals or hedgerows need to be considered at scales larger than single farms. Similar situations arise with invasive species control, communal grazing, and access to equipment or markets (e.g., Foley et al. 2011; Hellin and Schrader 2003). Coordination of efforts generally requires formal or informal multi-stakeholder partnerships for common resource management plans that can generate synergies related to socio-economic sustainability – a topic of broad importance examined by Nobel prize winner Elinor Ostrom among others (Dietz et al. 2003; Ostrom 2009; Griggs et al. 2017).
We focus on landscapes by considering the patterns and processes relevant to agro-ecosystem services and functions. Importantly, this perspective highlights how farm systems may interact via shared communities and bio-physical resources at multiple scales, in contrast to assessment studies that focus on a single farm or business enterprise. For example, one could identify multiple geographic domains to which a farm might belong, such as its watershed, aquifer, and airshed; as well as discrete inputs and outputs (labor, feed, fertilizer, fuel, water, crops, soil) and temporally variable energy and material transfers (plant productivity, animal productivity, biogeochemical and nutrient cycles). Figure 2 shows elements of patterns and processes included in a landscape perspective: in the near-term, both biophysical and socio-economic settings of a landscape drive material and energy transfers that are also influenced by the presence, variety, and arrangement of landscape components (Turner 2005, Wu 2013). Transformations may occur between components within a landscape, or externally with other systems or landscapes. Examples for agricultural landscapes are listed in Table 2. We acknowledge that measuring multiple landscape processes is technically challenging and therefore methods to select and monitor specific indicators of status are often used to assess change. At regional spatial scales, forests, agricultural fields, reservoirs, rivers, wetlands, and urban areas are among the common land classes that can affect and be affected by agricultural practices. Agricultural landscapes vary in diversity from monocultures to complex mosaics of managed and unmanaged ecosystems and may include specific elements such as orchards, lemon gardens, etc. (Cooper et al. 2009; as cited in Gerrard et al. 2012). Landscape processes that determine

17
Figure 2. Elements of patterns and processes of a landscape perspective: in the near-term, both biophysical and socio-economic settings of a landscape drive (or constrain) material and energy transfers that are also influenced by the presence, variety, and arrangement of landscape components. Each component may be linked to internal or external processes that change over time.

18
Table 2. Examples of agricultural landscape patterns and processes that should be considered in order to develop, implement, and monitor adaptive management decisions to achieve progress toward context-specific, agricultural landscape goals.
Elements of landscapes: Examples for agricultural landscapes:
Settings (context of place and time)
Slope, erosion, elevation, exposure, salinity
Soil quality, retention, management (drainage, tillage)
Growing conditions: solar maximum, moisture, season
Traditions, values, adaptations
Subsistence, micro, local, and global markets
Risk of extreme events
Landscape Components (identifiable features or unique processes contributing to heterogeneity of the area of interest)
Ecosystems: crops, pastures, waterways, uncultivated areas
Land cover: Critical host habitat: pollinators, pests, pest control
Land use: Annual, fallow, perennial, abandoned
Water resources: rain, irrigation reserves
Energy resources: Solar, wind, hydropower, biomass, fossil
Pollution sources: Fertilizer, pesticide, manure, residues, waste
Infrastructure: Housing, storage, irrigation, roads, power, communication, industry
Variety and Arrangement (the relationships and relative diversity of the features and processes contributing to landscape functionality at the scale of interest)
Landscape components
Farm types and intensity
Cultural systems and decision-makers: gender, age, ethnic equity
Functional groups: perennials, annuals, forages, grains, legumes, feeds, foods, macro- and micro-nutrients, livestock, wild harvests
Species: cultivated, native; symbionts, pathogens, pests, fungi, bacteria, plants, animals
Genetic resources: wild types, breeds, varieties, landraces
Material and Energy Flows (transfers or transformations within the area of interest or across hierarchical levels)
Monetary capital: cash, credit
Human capital: knowledge to derive mechanical work, management
Trade or exchange of products, labor, information
Produced: yield of feed, food, fiber, fuel
Consumed: feed, fertilizer, traction, refrigeration, processing, household
Intensity: yield/area, yield/ input
Nutrients: soil, plant, animal, water, particulates, gases

19
functionality such as biogeochemical regulation, pollination, and food production are affected by farm-system and landscape-management decisions (de Groot et al. 2002).
Review objectives
The purpose of this paper is to review agricultural sustainability assessment frameworks in order to identify what features and approaches are helpful to monitoring progress towards sustainability goals in agricultural landscapes. We present a qualitative analysis of assessment purposes, stakeholders, spatial and temporal boundaries, indicators, and methodological approaches. Based on this review, we provide recommendations for further development and use of ASAF to better address the needs of agricultural research, extension, and development organizations in consideration of the UN SDGs (United Nations 2015).
Monitoring progress towards more resilient and sustainable agricultural landscapes requires a systematic assessment that integrates environmental and socio-economic indicators in order to document effectiveness of changing agricultural management practices at multiple spatial and temporal scales. A variety of assessments are available for food, agriculture, and bioenergy enterprises where the goal is certification of compliance with a specific standard, for example, Fairtrade Certified (fairtradecertified.org), and USDA Certified Organic (ams.kusda.gov/rules-regulations/organic). However, these approaches are not appropriate for assessing effects and interactions across different landscape elements. Determining appropriate indicators for documenting the effects of practices that support more sustainable systems depends on one's definition of sustainability as well as the goals of the assessment (Gasparatos and Scolobig 2012; Marchand et al. 2014).
Prior reviews of assessment frameworks use various typologies. These include the use of reference indicator values (Acosta-Alba and van der Werf 2011), types based on the method of aggregation to a single index (Singh et al. 2012), and the emphasis on valuation (monetary, biophysical or indicator; Gasparatos and Scolobig 2012). Marchand et al. (2014) reviewed assessments based on the categorization as a rapid versus full farm-level sustainability assessment which was related to the number and specificity of indicators. Schader et al. (2014) focused on the purpose and scope of assessments in their review. An inventory of assessment frameworks including a detailed classification and analysis of 53 ASAF for temperate systems pertinent to a variety of spatial and temporal levels is provided by Wustenberghs et al. (2015). Ease of practical application for specific farm-level agricultural assessments was discussed in De Olde et al. (2016). Some consensus on employing landscape approaches to development exists (Sayer et al. 2013) and efforts have been made to include landscape indicators in sustainability assessment frameworks (e.g., Renetzeder et al. 2010; Musumba et al. 2017). However, we did not find a review focusing on how sustainability assessment frameworks address the composition and

20
functionality of agricultural landscapes. Such patterns and processes help frame the constraints and opportunities that farmers and other stakeholders should consider in working towards contextualized agricultural sustainability goals through an adaptive management strategy. Landscapes host a diversity of ecosystem services, which provide significant assets to agriculture (Pretty 2008), and many of these services are threatened or in decline (Millennium Ecosystem Assessment 2005). This paper complements prior work by discussing how ASAF may accommodate a landscape perspective by assessing patterns and processes occurring within agricultural landscapes.
Assessment frameworks
Assessment frameworks can be deployed in several ways. They may be used to compare indicators of environmental, social, and economic conditions within specific production systems (e.g. coffee; COSA 2013) or within a single theme of sustainability-- such as soil quality (Jokela et al. 2011). Indicator values used in an assessment may be compared to reference points, such as earlier baseline values for the same system, relative to a similar system’s values, science or policy derived values, targets, or thresholds (Acosta-Alba and van der Werf 2011). These comparisons may take the form of ex post analyses of survey data (e.g., of farm practices; Rigby et al. 2001). In contrast, some frameworks are designed for ex ante comparison of possible future alternative scenarios and are often used as a tool in agriculture planning or policy development (e.g., Smith et al. 2000; Helming et al. 2008; Sadok et al. 2009). Generally, the results of an assessment are intended to guide decisions about management options and may be used to monitor progress toward goals after management changes occur. Assessment results are communicated in different ways, for example, by mathematically derived aggregation of multiple indicators to an index or visual summaries (Reed et al. 2006; Ness et al. 2007). Some frameworks provide guidance on compiling and simplifying the indicator data to reduce complexity and summarize themes (Pollesch 2016).
Assessment purpose and stakeholders
Assessments serve a wide variety of purposes including research, monitoring, certification, policy development, farm advising, self-assessment, consumer information, and landscape planning (Schader et al. 2014, Wustenberghs et al. 2015). Ultimately landscape assessments should inform stakeholders to make better decisions. Stakeholders have unique roles within assessments for agricultural landscapes because of their diverse concerns as well as varying degrees of input (or lack of input) regarding farm management decision. Reed and co-workers (2006) categorize assessment frameworks for sustainable development as top-down or bottom-up, based in larger part on the engagement and role of local stakeholders in selecting indicators. In farm or business focused assessments, stakeholders may be limited to the landowner/household, workers, and perhaps a government unit. In contrast, for

21
agricultural landscapes stakeholders represent a larger population whose well-being is affected by landscape conditions and include community members, suppliers and retailers, consumers, educators, natural resource managers, governments and non-government organizations, in addition to farm households and employees. Farm extension or outreach organizations often play a critical stakeholder role by interfacing research programs with potential beneficiaries in practical, non-formal educational settings. Extension agents may be involved in collection of indicator data and act as interpreters of assessment outputs, and, as such, they must establish and maintain credibility for providing useful information with a robust grounding in science. The differing values of each stakeholder group influence how a sustainability assessment framework is applied, as choices are made regarding which indicators to include or exclude, which procedures to use to obtain indicator values, and the relative importance of each indicator in the assessment result or output.
Stakeholders include development organizations that work to reduce poverty, improve food security and nutrition, or restore natural resources and ecosystem services (CGIAR 2015). These organizations need an effective sustainability assessment framework that encompasses farm system to regional indicators, provides sufficient flexibility for application to differing farm systems and contexts, and takes a societal/landscape perspective rather than a business/product/supply-chain approach. Research and extension agencies working toward sustainability goals prioritize farmer engagement and often emphasize social justice considerations in their outreach (Smyth and Dumanski 1993). For example, targets are set for gender and youth equity (CGIAR 2016; Food and Agriculture Organization (FAO) and SAFA 2013b), and farmer preferences towards alternative methods or markets are examined (Hellin et al. 2017). Subsequently, a sustainability assessment framework should facilitate evaluating, monitoring, and obtaining feedback regarding development program activities. It should allow efficient, cost-effective documentation of baseline conditions as well as changes associated with interventions for improved livelihoods on farms and across communities and landscapes.
Boundaries of space, time, and system components
Agricultural landscape sustainability assessment should consider broad spatial scales beyond a field or farm and take into account dynamic patterns and processes. There is a large diversity of agricultural landscapes that vary by the products, production system, financial, information, market access, and settings of topography, climate, and soils. Goals for agriculture and means of achieving goals are therefore specific to each context. Relationships between sustainability goals and management practices are important. Some relationships are reinforcing (synergistic) to multiple goals while others are neutral, or negative (trade-offs). Interactions among synergies and trade-offs result from changing management practices to address landscape sustainability goals and should be reflected in selected indicators (Kanter et al. 2016a; López Ridaura 2005).

22
Agricultural practices that focus solely on increasing production, for example, do not necessarily improve social equity and economic profitability. Synergies and trade-offs related to achieving the SDSs are beginning to be examined (Griggs et al. 2017) and influence which agricultural practices are promoted for improving sustainability in a local context. However, many of the existing ASAF are designed for a narrow agricultural context (Schader et al. 2014, Wustenberghs et al. 2015), emphasize one dimension of sustainability (e.g., economics), or have limited relevance to agricultural managers (De Olde et al. 2016) and thus are not capable of addressing trade-offs and synergies among management practices.
Indicators
The indicators recommended for integrated ASAF typically fall under different themes and dimensions of environmental, economic, and social effects (Figure 3 and Table 3). The indicators generally relate to the following services: food and materials for human consumption, water quality and quantity, soil quality, greenhouse gas emissions, pollination, seed dispersal, pest mitigation, biodiversity, habitat, and protection from disturbance (Dale and Polasky 2007). Spatially explicit socio-economic patterns and processes such as access to markets, pricing, employment, migration, education, access to credit, and land tenure are also important in agro-ecosystems. These phenomena can affect agricultural practices such as crop or product choices, fertilizer and irrigation use, labor decisions, and market participation among others, which, in turn, drive changes in ecosystem services (Anjichi et al. 2007; and see Chapter 3 in National Research Council 2010). Themes or categories of indicators for assessing social equity and economic profitability could include social well-being and acceptability, energy security, and external trade (Dale et al. 2013b). Additionally, research on sustainable intensification in agriculture has acknowledged the importance of including measures of distributional and procedural justice and equity (e.g., equitable access, food sovereignty) in ASAF (Loos et al. 2014). As modes of agricultural production differ along a shifting rural to urban gradient (Lawson 2016; Thebo et al. 2014), other indicator themes may become relevant (Haase et al. 2014). De Olde and co-workers (2017a) used a quantitative comparison of four ASAF applied to farms to show that assessments yield different results (i.e., better or worse scores of sustainability) despite similarities of dimensions and themes, as well as scope and purpose.
Assessment frameworks sometimes provide guidelines for selecting unique indicators. A method for selecting indicators for multi-scale evaluation of small holdings based on stakeholder objectives is described in López Ridaura et al. (2005a). The indicator selection process occurs within the systems analysis phase of an ASAF, in which the study area is contextualized, impact scales are identified in consultation with stakeholders, and specific indicators are derived relative to objectives for each impact scale (López Ridaura et al. 2005a). Dale and co-authors (2015) describe a systematic approach to selecting indicators for bioenergy sustainability assessment by first identifying sustainability goals,

23
Figure 3. Typical organization of sustainability assessment levels, using SAFA terminology (FAO 2013; de Olde et al. 2016) and showing example agricultural landscape themes and indicators under each of the three dimensions.
Table 3. Agricultural sustainability dimensions and themes typically found in assessment frameworks that could be used to monitor changes in agricultural landscapes. Indicator themes may relate to multiple services, and services affect aspects of all sustainability dimensions.
Sustainability dimensions and some underlying themes
Environmental Economic Social
Productivity* Access to markets Social well-being
Energy Employment Social acceptability
Water quality and quantity Pricing Energy security
Soil quality Income Youth and gender equity
Air quality Profit Fair access to production*
Pollination Access to credit Food sovereignty
Seed dispersal Land tenure Education
Biodiversity External trade Migration
Pest mitigation
Protection from disturbances
Greenhouse gas emissions
Habitat conservation
* food, feed, fiber, fuel

24
defining system context, and consulting stakeholders. These steps occur prior to identifying objectives for analyses, selecting indicators, defining baseline and target indicator values, highlighting potential trade-offs, and conducting the assessment. Some ASAF do not provide flexibility in selecting indicators, (e.g., Public Goods assessment discussed below; Gerrard et al. 2012) and instead focus on comparing the same indicator suite across sites. Multi-criteria decision-aiding methods (MCDA) have been reviewed for application to ASAF (e.g., Sadok et al. 2008) and often require explicitly constrained indicator data in order to facilitate mathematical or if/then decision rules. MCDA are not explicitly reviewed here for applicability to landscapes (see Allain et al. 2017).
Synthesizing diverse information from indicators representing all three dimensions of sustainability is a crucial step in assessments. The process of summarizing information should be transparent to stakeholders, regardless of stakeholder priorities or systematic analytical biases that may occur, for example during aggregation. Creating a balanced synthesis of information from all dimensions of the agricultural landscape is a difficult and subjective task that is influenced by the biases within the themes and selected indicators, as well as the mathematical procedures used to summarize information (Pollesch 2016). Aggregation functions applied to indicator values, as well as how the indicators are grouped and weighted, influence the way the information is communicated (Pollesch and Dale 2015, Wustenberghs et al. 2015). Aggregation choice affects how trade-offs or compensation among indicators may be addressed (Mori and Christodoulou 2012). If non-aggregated indicator values are lost during the assessment, it is difficult to determine key indicators, and thus, what management practices should be adapted to make progress toward sustainability goals (López Ridaura et al. 2005a). Ultimately both what types of information an assessment integrates, as well as how that information is analyzed, synthesized, and presented, influence assessment results and usefulness to stakeholders.
Gathering appropriate and high-quality indicator data can be a challenge to sustainability assessments, irrespective of the scale to which the data applies. Whether international, government, farmer-generated, or based on empirical measures, models, or expert opinion-- the source of the information influences the quality, quantity, and resolution of data available for indicators, and subsequently the level of trust with which stakeholders regard the assessment process. Regardless of which indicators and methods for obtaining indicator data are chosen, they should be practical, sensitive, unambiguous, anticipatory, predictive of manageable changes, and sufficient (Dale and Beyeler 2001; Dale et al. 2013b). In some instances, these requirements may mean limiting options and creating a standardized group of indicators and methodologies that facilitates comparisons across sites and is grounded in strong science (Rosenstock et al. 2017). Under some time or resource limitations, proxies for preferred indicators may be developed: for example, pesticide use may be a key indicator, but pesticide sales by municipality or region may be the only realistically obtainable data that becomes useful to decision-makers due to documented linkages

25
between use, sales, and ultimately human-health, or environmental risks (OECD 2001). Below we review example indicator-based integrated ASAF.
Approach
Of the dozens of ASAF available (Wustenberghs et al. 2015), few are stakeholder-friendly and broadly applicable for agricultural landscapes. Therefore, we examined features of assessments that contribute to evaluating conditions, patterns, and processes towards developing sustainability assessment frameworks for agricultural landscapes. Our selection of assessment approaches for review was initiated from the classification scheme and extensive list of 48 ASAF provided by De Olde and others (2016). Additional ASAF were discovered by investigation of frameworks citing that literature, as well as Web of Science and Google Scholar searches. We did not attempt an exhaustive inventory or comprehensive review here (see Wustenberghs et al. 2015). Rather, we looked for a diverse sampling of published ASAF that related to integrated assessment (i.e., that include environmental, social, and economic implications) of agricultural systems independent of the specific production system. We selected for further review only frameworks that meet the following seven criteria: 1) include environmental, social, and economic dimensions, 2) take a systems view applicable to multiple, non-specified farm system types (e.g., maize, wheat, or other crop and livestock; mechanized or non-mechanized) rather than a single product or component, 3) are described in an English language, peer-reviewed publication, 4) have been developed for use at a farm system to regional spatial scale; 5) engage stakeholders in a participatory process to obtain indicator data as described by the published framework, 6) provide an example of its application to case studies, and 7) could be used to monitor outcomes from alternative agricultural practices in a variety of contexts. The resulting nine ASAF are listed in Appendix I.A and further described in Appendix I.B.
Relative to the De Olde et al. (2016) appendix list, we (A) eliminated tools that did not cover environmental, social and economic dimensions (20) based on both the De Olde et al. 2016 description and a review of the reference abstracts; then (B) those that were sector-specific (9 more); then (C) those that were neither peer-reviewed nor otherwise available with detailed English descriptions (8 more) leaving 11 tools. We searched for English descriptions of the tools eliminated in this step to confirm lack of fit for our analysis. References for these 11 tools were examined, and we made further eliminations: (D) FARMSMART (Tzilivakis and Lewis, 2004) is a useful software tool to disaggregate national statistical data within England for presentation and discussion with farmers; however, it is not an ex post assessment tool that engages stakeholders with site-specific indicator data. While updated recently, SeeBalance (Saling et al. 2005) remains focused on product/ supply chain assessment for use within BASF commercial entities; SMART-Farm tool (Schader et al. 2016) is a tool for implementing SAFA (retained). We excluded frameworks that are limited to a single agricultural sector (e.g., MOTIFS (Monitoring Tool for Integrated Farm

26
Sustainability) applies only to dairy farms; de Mey et al. 2011), emphasize one dimension (e.g., EFA (Ecological Focus Area) Calculator; Tzilivakis et al. 2016), or are limited to the regional or higher spatial extent (e.g., Dantsis et al. 2010). ASAF that rely exclusively on modeled indicator data to develop ex ante scenarios are not reviewed here (e.g., SEAMLESS-Integrated Framework, Ewert et al. 2009; MODAM, Sattler et al. 2010).
We present a qualitative review of several ASAF based on initial published description and updated versions where applicable. A comparison of applications of these frameworks in a given case study (as in De Olde et al. 2017a; De Olde et al. 2016; Graymore et al. 2008) or examination of publications following a framework’s application to separate case studies (e.g., MESMIS reviewed by Astier and Garcia-Barrios (2012); SMART-Farm tool reviewed by Schader et al. (2016)) was beyond the scope of the present research and not strictly necessary to explore useful features for assessment of agricultural landscapes. We describe nine ASAF (listed in Appendix I.A) representing different combinations of approaches to the assessment process. To varying degrees, the frameworks reviewed here address agricultural sustainability concerns related to landscape patterns and processes that can be important for making decisions regarding agricultural management practices, and for monitoring progress toward better socio-economic and environmental conditions. In the following sections we compare features of the selected frameworks: APOIA-NovoRural (Rodrigues et al. 2010), BioSTAR (Bioenergy Sustainability Target Assessment Resource: Parish et al. 2016; Pollesch 2016), IDEA (Indicateurs de Durabilité des Exploitations Agricoles: Zahm et al. 2008), MESMIS (which derives its acronym in Spanish: Framework for Assessing the Sustainability of Natural Resource Management Systems: Astier et al. 2011; López Ridaura et al. 2002), MMF (Multi-scale Methodological Framework (López Ridaura et al. 2005a; Astier et al.,2011), PG (Public Goods: Gerrard et al. 2012), RISE (Response-Inducing Sustainability Evaluation: Hani et al. 2003; Grenz et al. 2011; RISE 3.0, 2017), SAFA (Sustainability Assessment of Food and Agriculture: FAO and SAFA 2013a,b; 2014), and SAFE (Sustainability Assessment of Farming and the Environment: Sauvenier et al. 2005; Van Cauwenbergh et al. 2007).
Findings
Goals, stakeholders, and end-users
The objectives, priorities, and resources of stakeholders vary considerably, and any single framework satisfies these diverse needs to different degrees (Schader et al. 2014). The frameworks we examined have a variety of goals within the realm of evaluating sustainability of agricultural systems. For example, MESMIS, SAFE, and SAFA entail methods for describing management entities such as a farm, business, or public resource, and for selecting appropriate indicator suites from extensive lists of indicators. In contrast, IDEA, PG, and BioSTAR have more specific assessment objectives and are somewhat

27
less flexible for adapting to multiple farm system types. IDEA focuses on farms/farm families in the European Union with a fixed list of indicators. PG was developed for farms in a stewardship program with policy-defined regional targets, while BioSTAR can be applied in a variety of contexts with an indicator suite focused on effects of bioenergy production within a specified fuel shed. APOIA-NovoRural focuses on rural activities rather than farm systems per se. The MMF focuses on peasant systems, emphasizing site- and scale-specific indicators.
Some of the frameworks are explicitly designed for the goal of self-assessment, internal communication, or self-improvement of sustainability within agricultural entities (IDEA, SAFA, MESMIS, RISE). However, with the exception of SAFA, the listed frameworks are not specifically intended for a farmer to use for self-assessment without the assistance of one or more trained assessors. The designers of SMART (Sustainability Monitoring and Assessment Routine: Schader et al. 2016) -- a protocol for SAFA-- go as far as stating that it is not recommended for “extension” purposes. Some frameworks are operationalized in protocols geared for specific policy development, monitoring, or compliance. IDEA references requirements of the EU Common Agriculture Policy, while PG assesses provisioning of public goods from farms enrolled in England’s Organic Entry Level Stewardship program.
Although stakeholder contribution to assessment decisions (which could include indicator data from farmers or managers) was a criterion for inclusion in the review, the ASAF approach the role of stakeholders differently. BioSTAR and MMF explicitly aim to engage stakeholders in the community, beyond farm owners/managers, whereas generally the other assessments reviewed here do not. ASAF emphasize the presentation and usefulness of the assessment results for farmers and resource managers to different degrees. APOIA-NovoRural, RISE and SAFA produce reports for individual farmer/operators specifically. Most assessments focus on comparing a farm’s conditions to policy targets, and do not prioritize monitoring of progress to the manager’s (farm system) goals. The assessor is generally a third party such as a research group, certification company, extension agent, or government that could then share and interpret results for the farmer, policy makers, or other stakeholders.
Spatial and temporal boundaries
We are especially interested in ASAF that are relevant to the farm system as a component within the broader context of agricultural landscapes. Several frameworks are explicitly applicable to multiple spatial extents (SAFA, MESMIS, MMF, SAFE, BioSTAR), which include farm systems. In contrast IDEA, RISE, and PG are specifically applicable to a farm system but would be difficult to expand to broader levels of organization because of the methods of obtaining indicator data emphasize farmer records that are not likely to encompass landscape parameters. RISE has reported assessments of groups of farm systems (RISE 3.0, 2017) but does not extend this to a synthesis of landscape

28
sustainability characteristics explicitly. SAFA provides specific guidelines on determining system boundaries through inclusion/exclusion recommendations from a supply chain perspective. SAFE and BioSTAR highlight the need to establish system boundaries beyond the farm system such as watersheds, communities, and/or fuel sheds, based on a product’s life cycle. Developers of APOIA-NovoRural describe the target system as a farm or rural establishment (that may include a collection of farms) and have applied it at different spatial scales in an effort to assess linkages beyond individual farm or business entities (Rodrigues et al. 2010). MMF is designed explicitly for multi-scale analysis from smallholdings to regions, however, unique indicators are derived for each scale.
Indicators selected for use within a sustainability assessment relate to how system boundaries are defined both generally (i.e., an area of interest) and specifically for each indicator. Inclusion or exclusion of components of an agricultural landscape must be made explicit for each assessment. Indicators that document patterns and transformations across landscapes (e.g., local land use/ land cover change, employment patterns) have received less attention than static observations for assessment indicators, likely because such indicator values are more difficult to obtain. The challenge of including patterns and processes within indicator-based ASAF has been recognized and is partially addressed in later version of MESMIS (Astier and García-Barrios 2012). APOIA-NovoRural addresses spatial patterns within the landscape-ecology dimension by using satellite imagery for land-use categorization and calculation of diversity indices. An emphasis on landscape patterns and processes requires a flexible approach to defining system boundaries since the scope of each indicator may be unique. For example, soil organic matter (SOM, e.g., as % carbon) varies among fields and management practices, thus a single status “snapshot” value is minimally informative of the farm system or landscape. Instead the difference in SOM through time or between management regimes is more useful. If the value stabilizes or increases, one may infer maintenance or even improvement of soil quality in that location over the specified time. Additionally, neither the single SOM value, nor the change in value depends on the spatial extent of the system—the units are non-areal. In contrast, if we wish to monitor soil carbon sequestration potential of a farm system, agricultural landscape, or alternative management practice, then we must define the spatial extent of farm system boundaries since the metric is sensitive to areal units. Similarly, economic indicators might require explicitly defined system boundaries (e.g., a municipality, county, or state government) in order to monitor cash or credit flows, and this boundary may be independent of the bio-physical farm system or landscape boundary.
In order to gauge the sustainability of trends, flows, or processes of an agricultural landscape, some temporal scope must be defined. Of the protocols we reviewed in detail, few recommend using data from multiple cropping seasons (with the exception of MESMIS and BioSTAR). Others recognize the need to aggregate certain types of primary data to an annual average. It is not always

29
clear what temporal boundaries are established by the assessment, but generally only one year is covered by a given procedure. Snapshot data of farm production practices (for example, arrangement of fallow plots, age and distribution of perennial patches, crop rotations, and livestock density) can provide contextual information for assessments but are more useful if a farm is monitored for several years so that trends in specific land-use changes and their functions can be examined (e.g., Hiernaux et al. 2009). Frameworks that help identify changes in indicator values through time are needed if the objective is to capture landscape patterns and processes. BioSTAR has been designed to take on this challenge (Pollesch 2016) by addressing aggregation methods explicitly and providing a means to robustly combine information when appropriate and to compare conditions against baselines and targets.
Dimensions, themes, and indicators
Environment, social, and economic dimensions are defined similarly in each of the frameworks we reviewed. SAFA recognizes governance as a separate dimension. APOIA-NovoRural distinguishes landscape ecology and environmental quality dimensions and further defines a management/ administration dimension instead of governance. Although different terminologies exist, there are similar themes and subthemes across frameworks generally representing air, soil, water, energy, (bio)diversity, productivity, profitability, employment, food security, and social acceptability. However, each of the reviewed frameworks recommends unique indicator sets to the extent that information is available for the particular case, and groups the subthemes and indicators somewhat differently. Depending on the framework, the suite of indicators may be modified to varying degrees based on the context of the system being assessed. MESMIS, MMF, and SAFA assessments rely on a customized set of indicators based on farm or company characteristics. BioSTAR provides a checklist of indicators to be considered for each case. De Olde et al. (2017a) provide a detailed analysis of the degree to which some farm-level assessment tools overlap after aligning terminology and demonstrate that the differences in thematic coverage and indicators influence the overall conclusion of the ASAF.
Irrespective of differences in terminology and thematic categorization, the reviewed ASAF obtain indicator values via a mix of census information, observations, sampling, model estimates, farmer records, and farmer or other stakeholder declarations in surveys or interviews. Thus, there is a need to synthesize diverse types of data (Pollesch and Dale 2015). Some indicators rely on yes/no responses to a stated condition (e.g., formal involvement in any agri-environmental programs (PG), or existence of a mission statement (SAFA)), others rely on classifying inputs or outputs on a relative scale. For example, a RISE assessor converts primary indicator values to fit a 0-100 scale for each indicator. Within the reviewed set, a few frameworks require indicators that are on-site measurements of physical conditions, and some protocols try to avoid this

30
requirement (e.g., PG). Others emphasize high-quality quantitative information as primary data (especially measured and estimated physical data, as in BioSTAR and APOIA-NovoRural) thus improving accuracy when ranking scenarios or scoring indicators during the aggregation procedure. Such data are advantageous for analysis of landscape patterns and processes in which spatial scaling (up or down) is facilitated by quantitative and areal units. In some protocols the assessor is given significant responsibility for making judgements regarding data input, including rating or ranking the primary data and determining the direction of the impacts (e.g., RISE) or obtaining data from modeling tools (e.g., MESMIS, BioSTAR).
Methodological approaches
We intentionally reviewed ASAF that each use a somewhat different combination of methodological and analytical approaches to complete an assessment. MESMIS emphasizes a whole-system approach that is focused on informing management decisions, while SAFA highlights strengths and weakness in sustainability of product life cycles. SAFE offers a multi-criteria component-based approach in contrast to MESMIS’ multi-criteria systems approach and relies on fuzzy logic models rather than a qualitative ranking as in BioSTAR. Yet each framework strives to be holistic and multi-dimensional. RISE uses a driving force-state-response approach applied to direct measures of many indicators, a method that originated in sustainable development research efforts (OECD 2001). Likewise, APOIA-NovoRural emphasizes biophysical sampling and remote sensed indicators, which are normalized and combined via utility functions into composite indices. MESMIS, SAFE, SAFA, and BioSTAR emphasize the importance of contextualizing the system being assessed in order to choose appropriate indicators. With the exception of MESMIS, the frameworks we examined use unique, hierarchical, aggregation techniques to remove indicator-specific units and visualize sustainability at the thematic or dimensional level—most often as radar plots. Generally, the frameworks do not provide specific management recommendations that would improve an indicator’s ‘score’ for a given farm system. This sometimes falls within the purview of the assessor but most frequently is not made explicit in the assessment. Exceptions are illustrated by APOIA-NovoRural, which formulates an environmental management report highlighting technology options for abatement of environmental impacts, and RISE in which a trained assessor discusses indicator scores and potential solutions to poor scores with the farmer.
Opportunities and challenges in addressing landscape concepts in agriculture ASAF
Most ASAF we reviewed represent the concept of agro-ecosystem services by including, for example, indicators of biodiversity, soil and water quality, and to a lesser extent, greenhouse gas emissions. SAFE offers an indicator suite based on agro-ecosystem functions defined in de Groot et al.

31
(2002) that can be expanded from the parcel or farm to the watershed. MESMIS additionally addresses seven sustainability attributes of Natural Resource Management Systems that are applicable to ecosystems (productivity, stability, reliability, resilience, adaptability, equity, and self-reliance) but does not recommend specific indicators for landscape patterns. Generally, these ASAF fall short of encompassing many sustainability concerns related to agricultural landscape patterns and processes, which is an admittedly difficult task. IDEA (Zahm et al. 2008) explicitly excludes what the authors term “territorial functions [or] services rendered to landscape[s],” yet the protocol addresses biodiversity, spatial organization, and human development with indicators that other assessments use to imply ecosystem processes. In contrast, APOIA-NovoRural explicitly examines “landscape ecology” as a theme, but the implications on understanding pattern and process are not clear in that the aggregation approach taken may negate the spatial relevance of landscape indicators. A key challenge is to develop indicators that represent landscape characteristics and adequately capture the changes of those characteristics that occur as a result of agricultural management practices. One way to document trends in indicators is to repeat assessments of “status” periodically, in which each farm or case study provides its own baseline. However, for assessing landscapes in which key components, processes and even boundaries may be variable through time, an alternative approach may be needed. For example, baselines and target values for indicators could be identified in the literature or historical records so that trends towards or away from goals may be highlighted even within a single assessment cycle. Sustainability assessment designers should acknowledge that it is possible to have improvements in agro-ecosystem indicators that do not reflect improvement in landscape function. For example, an increase to a diversity index based on remote sensed land-use/land-cover change could reflect significant ecosystem disruption that is neither environmentally beneficial nor reflective of stable agricultural productivity or resilient markets – as may be illustrated by conversion of shrubland to rangeland, or abandonment of cropland due to salt intrusion or subsidized fallowing. Such complexities require expert interpretation, especially by stakeholders with deep local knowledge. Experts may be formally trained or may rely on acquired, informal knowledge systems. Reliance on expert interpretations on a case-by-case basis necessitates a larger investment in time (and likely money) than may be available for an assessment, a consideration that must be balanced against the intended purpose of the assessment.
Some progress in assessing agriculture-related changes to landscapes could be made by inclusion of specific types of indicators. For example, indicators that monitor rates (material and energy flows; e.g. denitrification, water table depletion, soil loss or gain, nutrient input relative to production) are relevant to farm management decisions and the underlying data may be available from empirical measurements or modeling techniques. Including data about landscape patterns and ecosystem processes would add complexity to ASAF, thus tools that facilitate data collection, management, and visualization are important.

32
Trained assessors and software support may help accommodate additional levels of data complexity that may be required for landscape assessment, though at some additional expense of time and cost. Some attributes of landscapes such as patchiness and degree of heterogeneity can be quantified or estimated to the appropriate resolution through GIS modeling and remote sensing, use of indicator-species assessments, and even qualitatively from farmer records and crowd-sourced information. Important socio-economic processes can also impact agro-ecosystem patterns, including migration, governance of natural and manmade resources (e.g., irrigation and other infrastructure), local exchanges of agricultural products and sub-products, human welfare, and security among others (Saqalli et al. 2011).
There is often a major gap between farm-level and regional indicator data. For example, government census data that applies to a county or municipality (i.e. on the order of thousands of square kilometers) are inadequate to address stakeholder concerns related to water resource access at farm, community, or local watershed scales (on the order of hundreds of hectares) but may be useful in providing context for the landscape and revealing potential resource constraints and opportunities. On the other hand, sampling a sufficient number of farm households and community representatives to understand drivers of priority water resource concerns is likely to be time-consuming and expensive and raises data reliability and reproducibility issues. Thus, further research is needed to develop realistic indicators of relevant processes for agricultural landscapes that include multiple farm systems, natural resources, and non-agricultural activities. In contrast to predicted or modeled data that can often be scaled, pre-existing observational data (such as census data) may be aggregated to the regional or broader spatial scale. Time and costs required for making new, protocol-specific observations will certainly limit options for indicator data. Significant research is required to determine proxies for difficult to obtain indicators in assessment of agricultural landscapes including defining the level of resolution necessary to adequately inform farm and landscape management decisions, or modeling approaches that allow reliable estimates of indicators. Citizen science may play a role in filling this data gap (Wallace et al. 2016; Yu et al. 2017). It is worthwhile to note that comprehensive coverage of landscape components within selected indicators is not the goal because such extensive data can inhibit interpretation by stakeholders (De Olde et al. 2018). Rather, sufficient indicators for making decisions regarding identified stakeholder priorities should be the focus.
If decision support for agriculture practices is a key objective of the ASAF, it is imperative to provide a synthesis of the results to the stakeholders and decision makers. Some ASAF produce outputs that illustrate a sustainability status through simplified graphics or maps while others require users to have substantial training in order to interpret the results and relate them to management practices. In some instances, multiple frameworks may be needed to communicate progress toward landscape objectives. Another option is provided by scenario-based assessment that can demonstrate potential

33
outcomes of policy or practices to stakeholders facing agricultural management decisions.
Modeling in ASAF
Models used to project or explore a wide array of environmental management decisions are available. Scenario-based assessments often employ modeling techniques and emphasize policy impacts and risk analysis in management of, for example, invasive species (Keller et al. 2007), protected sites (Marnika et al. 2015), regions (Gutzler et al. 2015), and continents (Helming et al. 2011). Scenarios can be developed through various methods based on actual or target conditions and modeled outcomes in which specific parameters have been systematically manipulated. ASAF that allow for ex ante exploration (if not predictions per se) of possible management scenarios can be made compatible with ex post analysis through careful selection of indicators, as in MMF and BioSTAR. Musumba and co-workers (2017) provide a further example of combining observed and predicted data in an indicator-based assessment for multiple scales, as applied to research for sustainable development. This combined functionality in ASAF could help stakeholders envision practical agricultural options by illustrating how management choices influence indicators. Under such an application, scenarios could demonstrate the degree to which management choices facilitate progress toward specific indicator targets for agricultural landscapes. Trade-offs between competing objectives that influence management decisions can be simplified and illustrated (Tittonell et al. 2015) relative to multi-dimensional sustainability goals with the help of scenario comparisons. Care must be taken to present scenario procedures in an understandable, transparent way so that diverse stakeholders with informal training maintain trust in the assessment.
Some efforts have been directed towards developing modeling approaches that can be used for assessments at different bio-physical extents through the quantification of indicators across various spatial scales, notably field, farm, and landscape. For example, Landscape IMAGES (Interactive Multi-goal Agricultural Landscape Generation and Evaluation System) uses a genetic algorithm to search for large numbers of alternative, acceptable landscape configurations and allows the quantification of agronomic, economic and environmental indicators and their trade-offs (Groot et al. 2007a; Groot et al. 2007b). Delmotte et al. (2016a; 2016b) developed a suite of modelling techniques (linear programming, multi-agent models, land-use change models) to conduct participatory assessment of scenarios of agricultural change in order to quantify indicators at different spatial scales. Baudron et al. (2015) used soft-coupling of several scale-specific models including simple agent- and multi-agent-based models to assess trade-offs at different spatial scales (plot, farm, territory) within a region in relation to crop biomass management and regional productivity responses to management patterns. Saqalli et al. (2011) applied the Common Resources Management Agent-based System to simulate likely agro-

34
ecological and socio-economic outcomes of agricultural intensification interventions at the farm to village level. The benefits of cover crop use for managing fertilizer costs and nutrient export in an agricultural watershed were estimated by a simple land-use change and farmer implementation rate model (Eichler Inwood 2016).
Methodological approaches and tools used to develop scenarios can also inform the selection of specific indicators for sustainability assessment of agricultural landscapes. Approaches include optimization and simulation models at different scales as well as soft-coupling scale-specific models in which landscape processes and patterns can be explicitly addressed. Simulations within ex ante analyses for ASAF could be used to identify sustainability indicators that are sensitive to context-specific farm and landscape management options early on in an assessment process, thus streamlining a complex agricultural landscape assessment.
Recommendations
Several recommendations for agricultural assessment frameworks are provided below based on this review (Table 4). Principles of the landscape approach include continual learning and adaptive management; consideration of multiple spatial scales, temporal scales, stakeholders and functions; participatory frameworks for monitoring change; resilience; and increased stakeholder capacity, which pertain broadly to many development processes (Sayer et al. 2013). Recognizing the relationships between sustainability goals, landscape components, and indicators can help identify potential co-benefits and trade-offs between management choices that affect agricultural landscapes (Gerdessen and Pascucci 2013; López Ridaura et al. 2002; 2005a; 2005b). The science of landscape ecology provides methods for addressing complexities such as spatial heterogeneity (Dale et al. 2013a) as a part of assessing sustainability. Furthermore, a landscape approach is well-suited to addressing diverse stakeholder needs because it includes an “iterative, flexible, ongoing process of negotiations, decision-making and reevaluation, informed by science but shaped by human values and aspirations” (Sayer et al. 2013). Such approaches generally recognize the need to evaluate dynamic conditions including rates of change, trends, and thresholds or tipping points in indicators.
A flexible ASAF that can be adapted to a broad spectrum of agricultural landscapes is useful for monitoring changes through time and comparing progress toward sustainability across a variety of systems. Shifts in agricultural management such as adding perennial crops or livestock, accessing an alternative market, or using different tillage equipment as it affects system functioning may be difficult to predict. The ASAF should be relevant as stakeholders acquire new information, use new technology or crop varieties, and consider different management options since a key objective is to support decision making. Thus, sustainability assessment designed for a highly specific context or product would not capture the inherent heterogeneity and variability of

35
Table 4. Recommended features for a sustainability assessment framework applied to agricultural landscapes.
Framework feature Description
Agricultural landscape perspective
Identifies indicators of patterns and processes beyond the boundaries of a single farm or field; intended for repeat applications at multi-year intervals to monitor trends in several indicators within each of the social, economic and environment dimensions
Systems approach for integrated assessment
Farm and landscape system based, rather than product life-cycle or business enterprise focused; across environmental, social and economic dimensions
Participatory and iterative
Early and regular involvement of many stakeholders via a transparent and collaborative process to select indicators and embed feedback to improve use for repeat assessments; easy-to-understand summaries and assessment results for diverse audiences while retaining individual indicator information and links to management practices
Flexible indicator suite Guidance to select a core set of indicator themes containing site-specific indicators which can accommodate additional indicators as systems evolve and/or data availability changes
Adaptable Relevant to a variety of farm system types and landscapes in any socio-economic and bio-physical locale; becoming context-specific as stakeholder goals are addressed

36
farm systems and agricultural landscapes. A major challenge remains balancing contextual specificity of individual farms with the generally applicable concerns of agricultural landscapes. An ideal framework would be capable of documenting trends in individual indicators as the agricultural landscape changes. The use of the same framework would therefore result in potentially different lists of indicators depending on the context (López-Ridaura et al. 2002; FAO and SAFA 2013a). The framework and potential indicators should be developed, tested, and adapted through case studies.
Frameworks should be suitable for the system under assessment. Gasparatos and Scolobig (2012) list priorities for choosing assessment tools based on the desired perspective or features of the tool, the reference or target indicator values, and stakeholder values. Other important factors include the needs and objective for performing the assessment, context of the system being assessed, and early stakeholder input on protocol choice (Coteur et al. 2016; Dale et al. 2015; De Olde 2017a; 2017b). In our view, it is essential to have both existing working relationships between extension or research organizations and other stakeholders to facilitate incorporation of farmers’ interests, capacity, and cooperation. In addition, a fluid mechanism for communication in the inhabitants’ native language and expert translations into the language of the framework or protocol may be an important component to obtain useful data for assessing farm systems within agricultural landscapes and to transmit learnings back to stakeholders. We expect varying levels of quality with different types of social, economic, and environmental indicator data, but a minimum amount of standardized information is needed at the appropriate resolution, including farm household data. Additionally, having a sense of farm and landscape improvement goals and management records provides useful context for selecting an appropriate assessment framework and subsequently, useful indicators.
Research on the derivation of relevant indicators has generally concluded that sustainability assessment requires characterizing a farm system and stakeholder concerns prior to developing indicator lists or weighting factors and aggregation techniques (Dale et al. 2015; FAO and SAFA 2013b; López Ridaura et al. 2002). However, in the realm of sustainable intensification of agriculture, there may be sufficient overlap in the particular objectives of the ASAF (baseline and monitoring of progress toward target values related to SDGs) and stakeholder concerns (welfare and profitability, practicality) so that a general framework can be designed for multiple contexts and may include a checklist of broadly relevant indicators a priori. A framework that provides guidance on identifying indicators of patterns and processes that occur at farm system to community and landscape levels, in addition to the socio-economic and bio-physical distinctions of farms, households or communities, would apply to a wide array of systems. An example general framework for sustainability assessment of agricultural landscapes is illustrated in Figure 4, which builds from López Ridaura (2005), Dale et al. (2015), and De Olde et al. (2017a).

37
Figure 4. Six-step framework for sustainability assessment of agricultural landscapes using a transparent process with ongoing stakeholder involvement as organized by the coordinator of the assessment. Built upon López Ridaura (2005); Dale et al. (2015); and De Olde et al. (2017a).

38
We recommend an assessment framework that is system-based, rather than focusing on a product or single component, and reflects a transparent process involving early and continuous input by stakeholders (Figure 4). Ideally, embedding a framework in the decision-making processes of stakeholders from field to landscape makes such an approach more effective by increasing knowledge exchange and trust between stakeholder groups. A coordinator initiates an assessment process in which landscape goals and context (Step 1) are determined via interactions with diverse stakeholders. The goals and context then provide guidance on identifying those indicators stakeholders find informative, often based on checklist of recommended indicators (Step 2). The baseline and target values (or preferred trends when endpoints are unknown) of the selected indicators are determined in order to follow progress over multiple iterations of the assessment process. Indicators may be based on empirical, secondary or modelling data, expert opinion, sampling, or surveys, and may include some combination of bio-physical observations, census data, remote-sensing, and digital modeling resources, and farmer and other stakeholder declarations and records. The indicators should be widely recognized and broadly applicable (i.e., highly specialized or uncommon equipment, analyses, or expertise as a requirement for establishing indicator values are discouraged) and somewhat customizable to the context of each farm system and agricultural landscape. Information requirements for the indicator values should optimize use of existing data and incorporate knowledge exchange and local knowledge systems (see Fazey et al. 2013; Buytaert et al. 2014) when possible. We suggest including some indicators that could serve as proxies for functional relationships within farm systems and landscapes only when a thorough understanding of the system components is available. The goal of the selected indicator suite should be sufficient rather than exhaustive coverage of agricultural landscape components in order to illustrate important and manageable interactions.
The indicator data should be assembled (Step 3 of Figure 4), and then requirements for further data collection should be identified in consultation with stakeholders (Step 4). Progress toward goals can be evaluated relative to baseline and target values that are established based on stakeholder input and published references (Step 5). In the evaluation step, indicators are often summarized within themes, and several aggregation techniques are available for this step (Pollesch and Dale 2015). Outputs from the evaluation step should provide intuitive visualizations of dimension- and theme-level aggregations where appropriate. The assessment results should enable review of individual indicator values such that practical management alternatives can be linked to specific indicator improvements. Based on the evaluation, better management practices can be proposed through discussion among stakeholders (Step 6). Once alternative practices have been implemented, the framework can be applied again so that progress toward indicator targets and sustainability objectives is monitored. These recommendations have been applied to a case study

39
sustainability assessment of the Yaqui Valley, Mexico agricultural landscape (Chapter 2).
An important role of an agricultural landscape sustainability assessment is communicating the complexity of functions and services related to agricultural landscapes in the form of assessment output and results that are easy to interpret. Avoiding assessment results in the form of composite indices alone – which may be useful for high level overviews—and instead striving for transparent, individual indicators helps maintain relevance to actual management practices. Ratings or rankings of indicators on an intuitive unit (such as percentages, as in IDEA) and with minimal assessor influence could help maintain transparency in the farm system assessment process and at the same time improve capabilities for self-assessment. Similarly, limiting indicators to those that can in fact be affected by farm or resource (e.g. watershed) management decisions improves relevance of the framework. By re-applying the same set of customized indicators through time --as in MESMIS-- stakeholders could visualize progress towards sustainability goals, using their system’s baseline status as well as similar local systems as references. The ability to add indicators as systems or priorities change, as provided by the SAFA procedure, would increase the long-term usefulness of a framework. Such a framework would reduce effort and maximize information transferability – two important considerations for research and extension agencies targeting sustainability improvements.
Conclusion
Continued research is needed to bridge gaps in information between farm systems, ecosystem processes, and agricultural landscapes in which experimental or case study-specific data may be available, with regional or national governance units—the spatial resolution at which general indicator data are often available. This paper presents an overview and qualitative analysis of various agricultural sustainability assessment frameworks that may provide useful techniques for tackling issues of landscape sustainability. Our work does not attempt to quantify differences in these approaches as applied to specific landscapes – an exercise that may help identify the relative advantages of the different ASAF reviewed and the specific indicators they employ. Development of effective indicators for characteristics and processes important to agricultural landscapes may be facilitated by linking publicly available geo-referenced databases to software and modeling tools in order to streamline the contextualization process and provide capability for scenario building. Such linkages could support more reliable, affordable, and transparent assessments. For example, linking existing models of soil loss, water-nutrient transport, and greenhouse gas emissions with socio-economic data on markets, migration, land-use change, and information about dynamic social networks could help identify improved practices for production and transport of agricultural goods. Synthesis of stakeholder input, observed indicator values, and location and rates

40
of adoption of improved practices, should result in a dynamic assessment process that improves with each use by including regular communication and feedback amongst participating stakeholders. The knowledge exchange occurring within a participatory assessment process itself is likely to improve awareness of management actions that affect landscapes in addition to outputs and recommendations resulting from application of any given assessment framework. This awareness can be incorporated into strategies for adaptive management of agricultural landscapes. Continued collaboration among assessment developers will help identify operationally effective procedures to capture changing patterns and processes as indicators of progress toward sustainability in farm systems and agricultural landscapes.
Acknowledgements
This publication was made possible through support provided by the Office of U.S. Agency for International Development Bureau for Food Security, U.S. Agency for International Development, under the terms of Contract No. MTO 069018 “The multi-donor trust fund for the CGIAR” as well as through the financial support from the CGIAR Research Programs (CRPs) on Wheat Agri-Food Systems (WHEAT) and Maize Agri-Food Systems (MAIZE). The opinions expressed herein are those of the authors and do not necessarily reflect the views of the U.S. Agency for International Development. Review of an earlier version of the manuscript by Bhavna Sharma was helpful. Suggestions from anonymous journal reviewers substantially improved the focus and clarity of the manuscript. Oak Ridge National Laboratory (ORNL) is managed by the UT-Battelle, LLC, for DOE under contract DE-AC05-00OR22725.

41
References
Acosta-Alba, I., and van der Werf, H. M. G. 2011. The use of reference values in indicator-based methods for the environmental assessment of agricultural systems. Sustainability, 3(2), 424–442. doi.org/10.3390/su3020424
Allain, S., Plumecocq, G., and Leenhardt, D. 2017. How Do Multi-criteria Assessments Address Landscape-level Problems? A Review of Studies and Practices. Ecol. Econ., 136, 282–295. doi.org/10.1016/j.ecolecon.2017.02.011
Anjichi, V. E., Mauyo, L. W., and Kipsat, M. J. 2007. The Effect of Socio-Economic Factors on a Farmer’s Decision to Adopt Farm Soil Conservation Measures. An Application of Multivariate Logistic Analysis in Butere/Mumias District, Kenya. In A. Bationo, B. Waswa, J. Kihara, and J. Kimetu (Eds.), Advances in Integrated Soil Fertility Management in sub-Saharan Africa: Challenges and Opportunities (pp. 915–920). Dordrecht: Springer Netherlands. doi.org/10.1007/978-1-4020-5760-1_87
Astier, M., and García-Barrios, L. 2012. Assessing the Sustainability of Small Farmer Natural Resource Management Systems. A Critical Analysis of the MESMIS Program. Ecol. Soc., 17(3). doi.org/10.5751/ES-04910-170325
Astier, M., Speelman, E. N., López Ridaura, S., Omar, R., and Gonzalez-Esquivel, C. E. 2011. Sustainability indicators, alternative strategies and trade-offs in peasant agroecosystems: analysing 15 case studies from Latin America. Int. J. Agric. Sustain., 9(September), 37–41. doi.org/10.1080/14735903.2011.583481
Baudron, F., Delmotte, S., Corbeels, M., Herrera, J. M., and Tittonell, P. 2015. Multi-scale trade-off analysis of cereal residue use for livestock feeding vs. soil mulching in the Mid-Zambezi Valley, Zimbabwe. Agric. Syst., 134, 97–106. doi.org/10.1016/j.agsy.2014.03.002
Bern University of Applied Sciences. (2017). Response-Inducing Sustainability Evaluation (RISE Version 3.0). Retrieved from https://www.hafl.bfh.ch/fileadmin/docs/Forschung_Dienstleistungen/Agrarwissenschaften/Nachhaltigkeitsbeurteilung/RISE/What_is_RISE.pdf
Bonner, I. J., Muth, D. J., Koch, J. B., and Karlen, D. L. 2014. Modeled Impacts of Cover Crops and Vegetative Barriers on Corn Stover Availability and Soil Quality. Bioenergy Res., 7(2), 576–589. doi.org/10.1007/s12155-014-9423-y
Brundtland, G. H. (1987). Our Common Future: Report of the World Commission on Environment and Development (Vol. 4). doi.org/10.1080/07488008808408783
Buytaert, W., Zulkafli, Z., Grainger, S., Acosta, L., Alemie, T. C., Bastiaensen, J., … Zhumanova, M. 2014. Citizen science in hydrology and water resources: opportunities for knowledge generation, ecosystem service management, and sustainable development. Front. Earth Sci., 2(October), 1–21. doi.org/10.3389/feart.2014.00026
CGIAR. 2015. CGIAR Strategy and Results Framework 2016-2030: Redefining

42
how CGIAR Does Business. http://www.cgiar.org/our-strategy/ CGIAR. 2016. MAIZE agri-food systems Proposal 2017-2022. Cooper, T., Baldock, D., Hart, K., and Baldock, D. 2009. Provision of Public
Goods through Agriculture in the European Union, 351p. COSA. 2013. The COSA Measuring Sustainability Report. Coffee and Cocoa in
12 Countries, 100p. Philadelphia, PA. http://thecosa.org/wp-content/uploads/2014/01/The-COSA-Measuring-Sustainability-Report.pdf
Coteur, I., Marchand, F., Debruyne, L., Dalemans, F., and Lauwers, L. 2016. A framework for guiding sustainability assessment and on-farm strategic decision making. Environ. Impact Assess. Rev., 60, 16–23. doi.org/10.1016/j.eiar.2016.04.003
Dale, V. H., and Beyeler, S. C. 2001. Challenges in the development and use of ecological indicators. Ecol. Indic., 1, 3–10.
Dale, V. H., Efroymson, R. A., Kline, K. L., and Davitt, M. S. 2015. A framework for selecting indicators of bioenergy sustainability. Biofuels, Bioprod. Biorefin., 9, 435–446. doi.org/10.1002/bbb.1562
Dale, V. H., Kline, K. L., Kaffka, S. R., and Langeveld, J. W. A. 2013a. A landscape perspective on sustainability of agricultural systems. Landsc. Ecol., 28(6), 1111–1123. doi.org/10.1007/s10980-012-9814-4
Dale, V. H., Efroymson, R. A., Kline, K. L., Langholtz, M. H., Leiby, P. N., Oladosu, G. A., Davis, M.R., Downing, M.E., and Hilliard, M. R. 2013b. Indicators for assessing socioeconomic sustainability of bioenergy systems: A short list of practical measures. Ecol. Indic., 26, 87–102. doi.org/10.1016/j.ecolind.2012.10.014
Dale, V. H., and Polasky, S. 2007. Measures of the effects of agricultural practices on ecosystem services. Ecol. Econ., 64(2), 286–296. doi.org/10.1016/j.ecolecon.2007.05.009
Dantsis, T., Douma, C., Giourga, C., Loumou, A., and Polychronaki, E. A. 2010. A methodological approach to assess and compare the sustainability level of agricultural plant production systems. Ecol. Indic., 10(2), 256–263. doi.org/10.1016/j.ecolind.2009.05.007
de Groot, R. S., Wilson, M. A., and Boumans, R. M. J. 2002. A typology for the classification, description and valuation of ecosystem functions, goods and services. Ecol. Econ., 41(3), 393–408. doi.org/10.1016/S0921-8009(02)00089-7
de Mey, K., D’Haene, K., Marchand, F., Meul, M., and Lauwers, L. 2011. Learning through stakeholder involvement in the implementation of MOTIFS: an integrated assessment model for sustainable farming in Flanders. Int. J. Agric. Sustain., 9(2), 350–363. doi.org/10.1080/14735903.2011.582355
De Olde, E. M., Oudshoorn, F. W., Sørensen, C. A. G., Bokkers, E. A. M., and De Boer, I. J. M. 2016. Assessing sustainability at farm-level: Lessons learned from a comparison of tools in practice. Ecol. Indic., 66, 391–404. doi.org/10.1016/j.ecolind.2016.01.047

43
De Olde, E. M., Bokkers, E. A. M., and de Boer, I. J. M. 2017a. The Choice of the Sustainability Assessment Tool Matters: Differences in Thematic Scope and Assessment Results. Ecol. Econ., 136, 77–85. doi.org/10.1016/j.ecolecon.2017.02.015
De Olde, E. M., Moller, H., Marchand, F., McDowell, R. W., MacLeod, C. J., Sautier, M., … Manhire, J. 2017b. When experts disagree: the need to rethink indicator selection for assessing sustainability of agriculture. Environment, Development and Sustainability, 19(4). https://doi.org/10.1007/s10668-016-9803-x
De Olde, E. M., Sautier, M., and Whitehead, J. 2018. Comprehensiveness or implementation: Challenges in translating farm-level sustainability assessments into action for sustainable development. Ecol. Indic., 85, 1107–1112. doi.org/10.1016/j.ecolind.2017.11.058
Delmotte, S., Barbier, J.-M., Mouret, J.-C., Le Page, C., Wery, J., Chauvelon, P., Sandoz, A., López-Ridaura, S. 2016a. Participatory integrated assessment of scenarios for organic farming at different scales in Camargue, France. Agric. Syst., 143, 147–158. doi.org/10.1016/j.agsy.2015.12.009
Delmotte, S., Couderc, V., Mouret, J.-C., López Ridaura, S., Barbier, J.-M., and Hossard, L. 2016b. From stakeholders narratives to modelling plausible future agricultural systems. Integrated assessment of scenarios for Camargue, Southern France. Eur. J. Agron. doi.org/10.1016/j.eja.2016.09.009
Diaz, S., Demissew, S., Carabias, J., Joly, C., Lonsdale, M., Ash, N., … Zlatanova, D. 2015. The IPBES Conceptual Framework - connecting nature and people. Curr. Opin. Environ. Sustain., 14, 1–16. doi.org/10.1016/j.cosust.2014.11.002
Dietz, T., Ostrom, E., and Stern, P. C. 2003. Struggle to Govern the Commons. Science 302(5652), 1907–1912. doi.org/10.1126/science.1091015
Dixon, J. A., Gibbon, D. P., and Gulliver, A. 2001. Farming Systems and Poverty. Rome: Food and Agriculture Organization. doi.org/10.1017/S0014479702211059
Eichler Inwood, S. E. 2016. Cover crops reduce agricultural nutrient export in a simplified model of land-use change in the Upper Beaver Creek Catchment, Ohio. In US-International Association of Landscape Ecology 2016 Annual Meeting: Landscape Change. Asheville, North Carolina, USA.
Eichler Inwood, S.E., I. Ortiz-Monasterio, S. López Ridaura, K.L. Kline, and V.H. Dale. (in preparation) Selecting indicators for assessing progress toward more sustainable agricultural landscapes: Yaqui Valley, Mexico, case study.
Ewert, F., van Ittersum, M. K., Bezlepkina, I., Therond, O., Andersen, E., Belhouchette, H., … Wolf, J. 2009. A methodology for enhanced flexibility of integrated assessment in agriculture. Environ. Sci. Policy, 12(5), 546–
44
561. doi.org/10.1016/j.envsci.2009.02.005 Fazey, I., Evely, A. C., Reed, M. S., Stringer, L. C., Kruijsen, J., White, P. C. L.,
… Trevitt, C. 2013. Knowledge exchange: a review and research agenda for environmental management. Environ. Conserv., 40(1), 19–36. doi.org/10.1017/S037689291200029X
Foley, J. A., Ramankutty, N., Brauman, K. A., Cassidy, E. S., Gerber, J. S., Johnston, M., … Zaks, D. P. M. 2011. Solutions for a cultivated planet. Nature, 478, 337–342. doi.org/10.1038/nature10452
Food and Agriculture Organization (FAO), and SAFA. 2013a. Sustainability Assessment of Food and Agricultural System: indicators. Food and Agriculture Organization of the United Nations - Rome 2013.
Food and Agriculture Organization (FAO), and SAFA. 2013b. Sustainability assessment of food and agriculture systems - Smallholders APP.
Food and Agriculture Organization (FAO), and SAFA. 2014. Sustainability Assessment of Food and Agriculture systems: Tool. Rome.
Gasparatos, A., and Scolobig, A. 2012. Choosing the most appropriate sustainability assessment tool. Ecol. Econ., 80, 1–7. doi.org/10.1016/j.ecolecon.2012.05.005
Gerdessen, J. C., and Pascucci, S. 2013. Data envelopment analysis of sustainability indicators of european agricultural systems at regional level. Agric. Sys., 118. doi.org/10.1016/j.agsy.2013.03.004
Gerrard, C. L., Smith, L. G., Pearce, B., Padel, S., Hitchings, R., Measures, M., and Cooper, N. 2012. Public goods and farming. In Farming for Food and Water Security, Sustainable agriculture Reviews 10. (pp. 1–22). doi.org/10.1007/978-94-007-4500-1
Graymore, M. L. M., Sipe, N. G., and Rickson, R. E. 2008. Regional sustainability: How useful are current tools of sustainability assessment at the regional scale? Ecol. Econ., 67(3), 362–372. doi.org/10.1016/j.ecolecon.2008.06.002
Grenz, J., Thalmann, C., Schoch, M., and Stämpfli, A. 2011. RISE 2.0 field manual. Bern University of Applied Sciences, School of Agricultural, Forest and Food Sciences.
Griggs, D. J., Nilsson, M., Stevance, A., McCollum, D., and (eds.). 2017. A guide to SDG interactions: From science to implementation. Paris, France. doi.org/10.24948/2017.01
Groot, J.C.J.; Jellema A; Rossing, W. A. H. 2007a. Exploring Trade-offs Among Environmental Services to Support Landscape Planning. In Modsim 2007: International Congress on Modelling and Simulation: Land, Water and Environmental Management: Integrated Systems for Sustainability (pp. 2203–2208).
Groot, J.C.J., Rossing, W. A. H., Jellema, A., Stobbelaar, D. J., Renting, H., and Van Ittersum, M. K. 2007b. Exploring multi-scale trade-offs between nature conservation, agricultural profits and landscape quality-A methodology to support discussions on land-use perspectives. Agric.

45
Ecosyst. Environ., 120(1), 58–69. doi.org/10.1016/j.agee.2006.03.037 Gutzler, C., Helming, K., Balla, D., Dannowski, R., Deumlich, D., Glemnitz, M., …
Zander, P. 2015. Agricultural land use changes - A scenario-based sustainability impact assessment for Brandenburg, Germany. Ecol. Indic., 48, 505–517. doi.org/10.1016/j.ecolind.2014.09.004
Haase, D., Larondelle, N., Andersson, E., Artmann, M., Borgström, S., Breuste, J., … Elmqvist, T. 2014. A Quantitative Review of Urban Ecosystem Service Assessments: Concepts, Models, and Implementation. Ambio, 43(4), 413–433. doi.org/10.1007/s13280-014-0504-0
Hani, F., Braga, F., Stampfli, A., Keller, T., Fischer, M., and Porsche, H. 2003. RISE, a tool for holistic sustainability assessment at the farm level. Int. Food Agribus. Manag. Rev., 6(4).
Hellin, J., Cox, R., and López-Ridaura, S. 2017. Maize Diversity, Market Access, and Poverty Reduction in the Western Highlands of Guatemala. Mt. Res. Dev., 37(2), 188–197. doi.org/10.1659/MRD-JOURNAL-D-16-00065.1
Hellin, J., and Schrader, K. 2003. The case against direct incentives and the search for alternative approaches to better land management in Central America. Agric. Ecosyst. Environ., 99(1–3), 61–81. doi.org/10.1016/S0167-8809(03)00149-X
Helming, K., Tscherning, K., König, B., Sieber, S., Wiggering, H., Kuhlman, T., Wascher, D., Perez-Soba, M., Smeets, P., Tabbush, P. and Dilly, O. 2008. Ex ante impact assessment of land use changes in European regions — the SENSOR approach. In: Helming K., Pérez-Soba M., Tabbush P. (eds) Sustainability Impact Assessment of Land Use Changes. Springer, Berlin, Heidelberg doi.org/10.1007/978-3-540-78648-1_6
Helming, K., Diehl, K., Kuhlman, T., Jansson, T., Verburg, P., Bakker, M., … Morris, J. 2011. Ex ante impact assessment of policies affecting land use, part B: application of the analytical framework. Ecol. Soc., 16(1) 29.
Hiernaux, P., Ayantunde, A., Kalilou, A., Mougin, E., Gerard, B., Baup, F., … Djaby, B. 2009. Trends in productivity of crops, fallow and rangelands in Southwest Niger: Impact of land use, management and variable rainfall. J. Hydrol., 375(1–2), 65–77. doi.org/10.1016/j.jhydrol.2009.01.032
ISPC (Independent Science and Partnership Council). 2014. Data, metrics and monitoring in CGIAR – a strategic study. Rome, Italy. ispc.cgiar.org/sites/default/files/ISPC_StrategyTrends_Metrics.pdf
Jokela, W., Posner, J., Hedtcke, J., Balser, T., and Read, H. 2011. Midwest cropping system effects on soil properties and on a soil quality index. Agron. J., 103(5), 1552–1562. doi.org/10.2134/agronj2010.0454
Kanter, D. R., Musumba, M., Wood, S. L. R., Palm, C., Antle, J., Balvanera, P., … Andelman, S. 2016. Evaluating agricultural trade-offs in the age of sustainable development. Agric. Syst. doi.org/10.1016/j.agsy.2016.09.010
Keller, R. P., Frang, K., and Lodge, D. M. 2008. Preventing the Spread of Invasive Species: Economic Benefits of Intervention Guided by Ecological Predictions. Conserv. Biol., 22(1), 80–88. doi.org/10.1111/j.1523-

46
1739.2007.00811.x Lawson, L. 2016. Agriculture: Sowing the city. Nature, 540(7634), 522–524.
doi.org/10.1038/540522a Loos, J., Abson, D. J., Chappell, M. J., Hanspach, J., Mikulcak, F., Tichit, M., and
Fischer, J. 2014. Putting meaning back into “sustainable intensification.” Front. Ecol. Environ., 12(6), 356–361. doi.org/10.1890/130157
Lopes, R., and Videira, N. 2013. Valuing marine and coastal ecosystem services: An integrated participatory framework. Ocean Coast. Manag., 84, 153–162. doi.org/10.1016/j.ocecoaman.2013.08.001
López Ridaura, S., Masera, O., and Astier, M. 2002. Evaluating the sustainability of integrated peasantry systems - The MESMIS Framework. Ecol. Indic., 2, 135–148.
López Ridaura, S., Van Keulen, H., Van Ittersum, M. K., and Leffelaar, P. A. 2005a. Multiscale methodological framework to derive criteria and indicators for sustainability evaluation of peasant natural resource management systems. Environment, Development and Sustainability, 7(1), 51–69. doi.org/10.1007/s10668-003-6976-x
López-Ridaura S., van Keulen, H., van Ittersum, M.K. and Leffelaar, P.A. 2005b. Multi-scale sustainability evaluation of natural resource management systems. Quantifying indicators for different scales of analysis and their trade-offs using linear programming. Int. J. Sustain. Dev. World Ecol. 1:81-97.
López Ridaura, S. 2005. Multi-scale sustainability Evaluation. A framework for the derivation and quantification of indicators for natural resource management systems. Wageningen University.
Marchand, F., Debruyne, L., Triste, L., Gerrard, C., Padel, S., and Lauwers, L. 2014. Key characteristics for tool choice in indicator-based sustainability assessment at farm level. Ecol. Soc., 19(3). doi.org/10.5751/ES-06876-190346
Marnika, E., Christodoulou, E., and Xenidis, A. 2015. Sustainable development indicators for mining sites in protected areas: tool development, ranking and scoring of potential environmental impacts and assessment of management scenarios. J. Clean. Prod., 101(Supplement C), 59–70. doi.org/10.1016/j.jclepro.2015.03.098
Millennium Ecosystem Assessment. 2005. Ecosystems and human well-being: Synthesis. Island Press, Washington DC.
Mori, K., and Christodoulou, A. 2012. Review of sustainability indices and indicators: Towards a new City Sustainability Index (CSI). Environ. Impact Assess. Rev., 32(1), 94–106. doi.org/10.1016/j.eiar.2011.06.001
Musumba, M., Grabowski, P., Palm, C., Snapp, S., Iita, N., Ksu, V. P., Ilri, P.T. and B.V. Iita. (2017). Guide for the Sustainable Intensification Assessment Framework. http://www.k-state.edu/siil/documents/docs_siframework/Guide for SI Assessment Framework - 10.24.17.pdf

47
Muth, D. J., Bryden, K. M., and Nelson, R. G. 2013. Sustainable agricultural residue removal for bioenergy: A spatially comprehensive US national assessment. Appl. Energy, 102, 403–417. doi.org/10.1016/j.apenergy.2012.07.028
National Research Council. 2010. Toward Sustainable Agricultural Systems in the 21st Century. Agricultural Systems. Washington DC: The National Academies Press. doi.org/10.17226/12832
National Research Council. 1989. Alternative Agriculture. Washington DC: The National Academies Press. doi.org/10.17226/1208
Ness B, Urbel-Piirsalu E, Anderberg S, and Olsson L. 2007. Categorising tools for sustainability assessment. Ecol Econ, 60, 498–508. doi: 10.1016/j.ecolecon.2006.07.023
OECD. 2001. Environmental indicators for agriculture. OECD Obs., 3(203), 11–12. doi.org/10.1787/9789264188556-en
Ostrom, E. 2009. A General Framework for Analyzing Sustainability of Social-Ecological Systems. Science (80) 325(July), 419–423. doi.org/10.1126/science.1172133
Parish, E. S., Dale, V. H., English, B. C., Jackson, S. W., and Tyler, D. D. 2016. Assessing multimetric aspects of sustainability: Application to a bioenergy crop production system in East Tennessee. Ecosphere, 7(2), 1–18. doi.org/10.1002/ecs2.1206
Pollesch, N., and Dale, V. H. 2015. Applications of aggregation theory to sustainability assessment. Ecol. Econ., 114, 117–127. doi.org/10.1016/j.ecolecon.2015.03.011
Pollesch, N. L. 2016. Mathematical Approaches to Sustainability Assessment and Protocol Development for the Bioenergy Sustainability Target Assessment Resource (Bio-STAR). University of Tennessee.
Pretty, J. 2008. Agricultural sustainability: concepts, principles and evidence. Philos. Trans. R. Soc. Lond. B. Biol. Sci., 363(1491), 447–65. doi.org/10.1098/rstb.2007.2163
Renetzeder, C., Schindler, S., Peterseil, J., Prinz, M. A., Mücher, S., and Wrbka, T. 2010. Can we measure ecological sustainability? Landscape pattern as an indicator for naturalness and land use intensity at regional, national and European level. Ecol. Indic., 10(1), 39–48. doi.org/10.1016/j.ecolind.2009.03.017
Reed M.S., Fraser E.D.G., and Dougill A.J. 2006. An adaptive learning process for developing and applying sustainability indicators with local communities. Ecol. Econ. 59:406–418. doi: 10.1016/j.ecolecon.2005.11.008
Rigby, D., Woodhouse, P., Young, T., and Burton, M. 2001. Constructing a farm level indicator of sustainable agricultural practice. Ecol. Econ., 39(3), 463–478. doi.org/10.1016/S0921-8009(01)00245-2
Rodrigues, G. S., Rodrigues, I. A., Buschinelli, C. C. de A., and de Barros, I. (2010). Integrated farm sustainability assessment for the environmental

48
management of rural activities. Environ. Impact Assess. Rev., 30(4), 229–239. doi.org/10.1016/j.eiar.2009.10.002
Rosenstock, T. S., Lamanna, C., Chesterman, S., Hammond, J., Kadiyala, S., Luedeling, E., … Wijk, M. T. Van. 2017. When less is more: innovations for tracking progress toward global targets. Curr. Opin. Environ. Sustain., 26–27, 54–61. doi.org/10.1016/j.cosust.2017.02.010
Sadok, W., Angevin, F., Bergez, J.-É., Bockstaller, C., Colomb, B., Guichard, L., … Doré, T. 2008. Ex ante Assessment of the Sustainability of Alternative Cropping Systems: Implications for Using Multi-criteria Decision-Aid Methods - A Review. Agron. Sustain. Dev., 28(1), 163–174. doi.org/10.1007/978-90-481-2666-8_46
Sadok, W., Angevin, F., Bergez, J.-E., Bockstaller, C., Colomb, B., Guichard, L., … Doré, T. 2009. MASC, a qualitative multi-attribute decision model for ex ante assessment of the sustainability of cropping systems. Agron. Sustain. Dev., 29(3), 447–461. doi.org/10.1051/agro/2009006
Saling P., Maisch R., Silvani M., König N. 2005. Assessing the Environmental-Hazard Potential for Life Cycle Assessment, Eco-Efficiency and SEEbalance. Int. J. Life Cycle Assess. 10, 364–371. doi: 10.1065/lca2005.08.220
Saqalli, M., Gérard, B., Bielders, C. L., and Defourny, P. 2011. Targeting rural development interventions: Empirical agent-based modeling in Nigerien villages. Agric. Syst., 104(4), 354–364. doi.org/10.1016/j.agsy.2010.12.007
Sattler, C., Nagel, U. J., Werner, A., and Zander, P. 2010. Integrated assessment of agricultural production practices to enhance sustainable development in agricultural landscapes. Ecol. Indic., 10(1), 49–61. doi.org/10.1016/j.ecolind.2009.02.014
Sauvenier, X., Valckx, J., Van Cauwenbergh, N., Wauters, E., Bachev, H., Biala, K., … Peeters, A. 2005. Framework for assessing sustainability levels in Belgian agricultural systems (SAFE). Scientific Support Plan for a Sustainable Development Policy.
Sayer, J., Sunderland, T., Ghazoul, J., Pfund, J.-L., Sheil, D., Meijaard, E., … Buck, L. E. 2013. Ten principles for a landscape approach to reconciling agriculture, conservation, and other competing land uses. Proc. Natl. Acad. Sci., 110(21), 8349–8356. doi.org/10.1073/pnas.1210595110
Schader, C., Baumgart, L., Landert, J., Muller, A., Ssebunya, B., Blockeel, J., … Stolze, M. 2016. Using the Sustainability Monitoring and Assessment Routine (SMART) for the systematic analysis of trade-offs and synergies between sustainability dimensions and themes at farm level. Sustain., 8(3). doi.org/10.3390/su8030274
Schader, C., Grenz, J., Meier, M. S., and Stolze, M. 2014. Scope and precision of sustainability assessment approaches to food systems. Ecol. Soc., 19(3). doi.org/10.5751/ES-06866-190342
Singh, R. K., Murty, H. R., Gupta, S. K., and Dikshit, A. K. 2012. An overview of

49
sustainability assessment methodologies. Ecol. Indic., 15(1), 281–299. doi.org/10.1016/j.ecolind.2011.01.007
Smyth, A., and Dumanski, J. 1993. FESLM: an international framework for evaluating sustainable land management. World Soil Resour. Rep., 74.
Smith, C. S., McDonald, G. T., and Thwaites, R. N. 2000. TIM: Assessing the sustainability of agricultural land management. J. Environ. Manag., 60(4), 267–288. doi.org/10.1006/jema.2000.0384
Thebo, A. L., Drechsel, P., and Lambin, E. F. 2014. Global assessment of urban and peri-urban agriculture: irrigated and rainfed croplands. Environ. Res. Lett., 9(11), 114002. doi.org/10.1088/1748-9326/9/11/114002
Tilman, D., Cassman, K. G., Matson, P. A., Naylor, R., & Polasky, S. (2002). Agricultural sustainability and intensive production practices. Nature, 418(6898), 671–7. doi.org/10.1038/nature01014
Tittonell, P., Gérard, B., and Erenstein, O. 2015. Trade-offs around crop residue biomass in smallholder crop-livestock systems - What’s next? Agric. Syst., 134, 119–128. doi.org/10.1016/j.agsy.2015.02.003
Turner, M.G. 2005. Landscape Ecology: What Is the State of the Science? Annu. Rev. Ecol. Evol. Syst. 36,319–344. doi: 10.1146/annurev.ecolsys.36.102003.152614
Tzilivakis J., and Lewis K.A. 2004. The development and use of farm-level indicators in England. Sustain. Dev. 12, 107–120. doi: 10.1002/sd.233
Tzilivakis, J., Warner, D. J., Green, A., Lewis, K. A., and Angileri, V. 2016. An indicator framework to help maximise potential benefits for ecosystem services and biodiversity from ecological focus areas. Ecol. Indic., 69, 859–872. doi.org/10.1016/j.ecolind.2016.04.045
United Nations. 2015. Transforming our world: the 2030 Agenda for Sustainable Development. General Assembly 70 session (Vol. 16301). doi.org/10.1007/s13398-014-0173-7.2
Van Cauwenbergh, N., Biala, K., Bielders, C., Brouckaert, V., Franchois, L., Garcia Cidad, V., … Peeters, A. 2007. SAFE-A hierarchical framework for assessing the sustainability of agricultural systems. Agric. Ecosyst. Environ., 120(2–4), 229–242. doi.org/10.1016/j.agee.2006.09.006
Van Meensel, J., Lauwers, L., Kempen, I., Dessein, J., and Van Huylenbroeck, G. 2012. Effect of a participatory approach on the successful development of agricultural decision support systems: The case of Pigs2win. Decis. Support Syst., 54(1), 164–172. doi.org/10.1016/j.dss.2012.05.002
Wallace, R. D., Bargeron, C. T., Moorhead, D. J., Laforest, J. H., Wallace, R. D., Bargeron, C. T., & Moorhead, D. J. (2016). IveGot1: Reporting and Tracking Invasive Species in Florida. Southeastern Nat., 15(sp8), 51–62. doi.org/10.1656/058.015.sp805
Walters, C. J. 1986. Adaptive management of renewable resources. New York: International Institute for Applied Systems Analysis by Macmillan Publishers Ltd.
Wu, J. 2013. Landscape sustainability science: ecosystem services and human

50
well-being in changing landscapes. Landsc. Ecol., 28(6), 999–1023. doi.org/10.1007/s10980-013-9894-9
Wustenberghs, H., Coteur, I., Marchand, F., and Debruyne, L. 2015. TempAg Pilot Activity 1.1.1: Survey of Sustainability Assessment Methods. http://tempag.net/documents/survey-of-sustainability-assessment-methods/
Yu, Q., Shi, Y., Tang, H., Yang, P., Xie, A., Liu, B., and Wu, W. 2017. eFarm: A tool for better observing agricultural land systems. Sensors (Switzerland), 17(3). doi.org/10.3390/s17030453
Zahm, F., Viaux, P., Vilain, L., Girardin, P., and Mouchet, C. 2008. Assessing farm sustainability with IDEA Method- from the concept of agriculture sustainability to case studies on farms. Sustain. Dev., 16, 271–281. doi.org/978-1-894784-05-4

51
Appendix I.A
A comparison of sustainability assessments for agriculture according to the criteria that the framework 1) include environmental, social, and economic dimensions, 2) take a systems view applicable to multiple, non-specified farm system types rather than a single product or component, 3) are described in an English language, peer-reviewed publication, 4) have been developed for use at a farm system to regional spatial scale, 5) engage stakeholders in a participatory process to obtain indicator data, 6) provide an example of its application to case studies, and 7) could be used to monitor outcomes from alternative agricultural practices in a variety of contexts.
Acronym, name and reference Description: Goals/ objective Intended audience
APOIA-NovoRural (Rodrigues et al. 2010)
A protocol for environmental impact assessment of ag and non-ag activities with 62 indicators within 5 dimensions: landscape ecology, environmental quality, sociocultural values, economic values, and management/administration pertaining to sustainable development; provides sustainability index relative to target values
To promote the environmental management of rural activities toward local sustainable development
Farmers, entrepreneurs, decision makers
Bioenergy Sustainability Target Assessment Resource (BioSTAR) (Pollesch 2016; Parish et al. 2016)
Framework for assessment using environmental, social and economic dimensions with 12 themes and customizable subthemes and indicators; comparison of indicator values for business-as-usual relative to alternative scenarios
To assess bioenergy sustainability for farming systems to regional level
Farmers, extension agents, industry, scientists, and policy makers
Indicateurs de Durabilité des Exploitations Agricoles (IDEA) (Zahm et al. 2008)
Protocol related to European Union Common Agriculture Policy, based on sustainable development literature, and accommodates trade-offs in agro-ecological, socio-territorial and economic dimensions using 10 subthemes and 41 indicators
To support sustainable agriculture on farms using self-assessment by farmers
Policy makers, farmers
Framework for Assessing the Sustainability of Natural Resource Management Systems (MESMIS) (López-Ridaura, et al. 2002; Astier et al. 2011)
Framework for assessing smallholder agriculture; research teams work with farm households to select indicators and strategize alternative practices with expert input to achieve sustainability goals using a local (field or resource) management focus
To derive, measure, and monitor sustainability indicators via a framework that is flexible and adaptable to local data and current conditions
Evaluation teams along with smallholder farmers, research institutions, NGOs, and producer associations

52
Multi-scale Methodological Framework (MMF) (Lopez Ridaura et al. 2005a,2005b; Lopez Ridaura 2005)
Framework to evaluate sustainability of peasant systems at multiple impact scales within attributes of productivity, stability, resilience, reliability, adaptability; includes derivation of site and scale-specific indicators
To build a multi-stakeholder and objective-driven evaluation process with useful indicators that reflect aspirations and constraints of stakeholders at farm, community, municipality, regional scales
Research and development organizations along with peasant land managers
Public Goods (PG) (Gerrard et al. 2012)
Protocol for assessing provisioning of public goods (agro-ecosystem services) across social, economic, environmental dimensions and 11 themes, developed with stakeholder input
To assess provisioning of public goods from England’s "Organic Entry Level Stewardship" program farms
Policy makers, farmers
Response-Inducing Sustainability Evaluation (RISE) (Hani et al. 2003; Grenz et al. 2011; Bern University of Applied Sciences, 2017)
Protocol for assessing economic, societal and ecological dimensions with 10-12 themes using 42-46 indicators; version 3.0 has flexibility to add indicators
To provide practical indications of the changes necessary to improve sustainable farming; to show strengths and weaknesses in system stability, risk management, grey energy, and animal welfare
Farm entrepreneur
Sustainability Assessment of Food and Agriculture (SAFA) (FAO 2013a, b, 2014)
Framework for assessment along food and agricultural (F&A) value chains – focused on supply chain enterprises; governance, environmental, economic, and social dimensions with 21 themes and 58 sub-themes encompassing 118 indicators; global applicability
To provide a common language for sustainability; to harmonize sustainability approaches within F&A value chain through a focus on indicators in an easy-to-use standardized scoring system
Companies, organizations and stakeholders; governments; expert input not required
Sustainability Assessment of Farming and the Environment (SAFE) (Van Cauwenbergh et al. 2007; Sauvenier et al. 2005)
Protocol for assessment that defines dimensions, themes, subthemes, using 97 indicators related to multiple spatial scales of agro-ecosystems, relative to target or reference values
To evaluate sustainability in agriculture by identifying goals, principles (functionality), criteria (component objectives or target states), and indicators (PC&I theory)
Scientists as intermediary to policy makers and farmers

53
Appendix I.B
The approaches within the reviewed agricultural sustainability assessment frameworks (ASAF) address agricultural sustainability concerns differently through diverse information sources. They identify landscape patterns and ecosystem processes to varying degrees across similar spatial and temporal extents. Name Sources of
information Approach Efforts to identify
agro-ecosystem processes or patterns
Spatial and temporal scales
Type of guidance provided
Locations of application
APOIA-Novo-Rural
Biophysical sampling, farm records with farmer consultation, GPS/satellite imagery
Calculation of impact indices through weighted transformation factors; then converted to utility values by best fit equation; relative to pre-determined targets (normalized on 0-1 scale); aggregation within dimensions, and overall sustainability index resulting from averaging each dimensional index
Landscape ecology dimension contains indicators of spatial characteristics; impact indices intended to synthesize status and trend for each indicator
Farm / rural establishment and higher (landscape, region)
Assessor enters data with farmer(s); computer aggregates standard list of indicators; highlights management alternatives to correct low values
South America (primarily Brazil); adaptable
BioSTAR Data from models, GIS, biophysical sampling, surveys, government records, and scientific literature
Systems-based, hierarchical characterization of indicators into subtheme scores; can use aggregation of indicators or multi-criteria analysis or spatial optimization to compare alternative scenarios based on Multi-Attribute Decision Support; non-dynamical; ratio-normalized indicators
Scenarios of feedstock production and management practices across fuelsheds to determine effects on environmental, social and economic conditions
Farming systems, fuel shed, culmination of 5-yr experiment for case study, repetition of assessment encouraged
Information on 7-step framework; context-based suite of indicators can be used to compare management practices
Tennessee and Iowa, USA; adaptable

54
IDEA Farm records, farmer declarations, interviews
Each indicator has a max score, adding up to 100 in each subtheme; key constraints identified; lowest of theme score used as final score, allows trade-offs/ compensation of indicators
Indicator themes include crop and animal diversity, spatial organization, resource protection, accessibility of space; recognizes lack of simple indicators for socio-territorial functions
Farm /farm family
Assessor completes evaluation and describes results; indicators not flexible
Case study in France, many assessments completed; intended for EU, adaptable
MESMIS Biophysical sampling, socio-economic surveys, farm records, census data, modelling
Systematic, holistic, participatory; mixed multi-criteria analysis; iterative application to monitor progress relative to reference/baseline
System attributes apply to ecosystems: productivity, stability, reliability, resilience, adaptability, equity, self-reliance
Field/ farm/ village over two or more cropping cycles
Selection of site specific indicators with stakeholder input
Central and South America, adaptable
MMF Sampling, surveys, census data, GIS, modeling
indicators derived in analysis phase, quantified using multiple goal linear programing nested by the scale of analysis; alternative policy or management options evaluated via scenario that show optimizing or constraining specific indicators
System attributes apply to ecosystems: productivity, stability, reliability, resilience, adaptability;
Farm household, community, (sub)region
Selection of site and scale specific indicators with stakeholder input
Case studies in Mexico, Mali, adaptable
PG Farm records, via interview questions about “key activities” (indicators)
Each indicator receives a score 1-5 or n/a; sub-theme score calculated by averaging the indicator scores
Services (public goods) from landscape aesthetic; biodiversity, soil functionality and other themes
Farm Assessor conducts interview with farmer to develop scores for indicators; indicators not flexible
England

55
RISE Farm records, farmer interview, regional data, assessor observations and scoring of indicator values
System-oriented, holistic; each indicator is a driving force/state (on opposing scales of 0-100), influenced by life cycle assessment methods
Focused on status and monitoring of changes to status; parameters broadly address stocks and flows of resources
Farm, 1 year Assessor determines suitable measurement from list of core indicators and preferred data
Global, adaptable
SAFA Primary, secondary, proxy and estimated data; company records, biophysical sampling, inspection, interviews
Hierarchical indicator aggregation; 5 step rating system, indicators are weighted depending on number of indicators per sub-theme and the indicator type
Focused on status relative to pre-stated ideals
Adaptable to all F&A enterprise contexts and sizes, 1 year generally
Flexible indicator suite from default list, based on context and entity type; flexible assessor roles
Global application promoted
SAFE Standardized logbooks of farm records, questionnaire, regional models, biophysical sampling, indicator species, GIS
Content-based (multi-component), multi-criteria, holistic; relative and absolute targets; integration at each hierarchical level using fuzzy models; weighted average of normalized indicators within each subtheme gives a sustainability index for theme, dimension, and overall
Supply and buffer function of agro-ecosystems, based on stocks and flows of resources; services, ecosystem integrity; land use pattern
Parcel, farm, and higher (landscape, region, state); case specific temporal scale generally 1 year
Systematic procedure for selection of core indicators, temporal and spatial scales and reference values
Belgium; adaptable

56
CHAPTER II SELECTING INDICATORS FOR ASSESSING PROGRESS
TOWARD MORE SUSTAINABLE AGRICULTURAL LANDSCAPES: YAQUI VALLEY, MEXICO, CASE STUDY

57
A version of this chapter is being prepared for publication by Sarah Eichler
Inwood and others:
Eichler Inwood, Sarah E., Ivan Ortiz-Monasterio, Santiago López Ridaura, Keith L. Kline, and Virginia H. Dale. (in preparation for submission to Ecological Indicators). “Selecting indicators for assessing progress toward more sustainable agricultural landscapes: Yaqui Valley, Mexico, case study.”
Sarah Eichler Inwood completed the primary review of literature, completed initial analysis of results, prepared the first draft manuscript and coordinated revisions by co-authors. Virginia Dale and Keith Kline provided significant text and organizational edits, assisted with analysis and figure development; all authors provided discussion, comments, and textual edits. It has been revised from the journal submission in order to fit formatting requirements.
Abstract
Agricultural landscape assessments help decision makers view the arrangement and distribution of farm systems as interacting via shared communities and biophysical resources. The objective of our study is to identify themes and individual indicators for assessing sustainability in agricultural landscapes using a process that could be applicable to diverse systems and test the approach in a case study. We assess the sustainability of an agricultural landscape in terms of the maintenance or improvement of ecosystem services in conjunction with productive and economically viable agriculture for resilient and secure societies. A set of indicators for the Yaqui Valley, Mexico, is developed by (A) determining site-specific concerns and objectives in consultation with stakeholder groups, (B) defining indicator selection criteria and means of prioritizing indicators, and (C) identifying and ranking the candidate indicators according to selection criteria through a modified Delphi method. The indicator selection approach requires input from local counterparts to facilitate understandings of contextual processes and patterns within the agro-ecosystem and socioeconomic landscape. Stakeholders generally agree that quality of life, water, and conservation of non-renewable resources including soil and water, are priorities for more sustainable agro-ecosystem services in the Yaqui Valley landscape. However, reaching agreement on the best indicators to monitor these conditions is more challenging and requires extended discussions with stakeholders about their perspectives on opportunities, concerns, and availability of information. The next steps for developing indicators for more sustainable agricultural landscapes in the Yaqui Valley requires assimilation and analysis of pertinent data for each indicator. The applicability of our approach to other sites and conditions merits further testing.

58
Introduction
Agricultural sustainability is an aspiration that challenges practitioners and researchers to consider farming effects on ecosystems and communities while also advancing food and energy security, clean abundant water, healthy productive soils, and other benefits to socioeconomic and environmental systems (Pretty 2008; Pretty and Bharucha 2014; Brundtland 1987; Wu 2013). Agricultural practices affect a wide range of ecosystem services, including water quality, pollination, nutrient cycling, soil retention, and carbon sequestration as well as social and economic conditions of the farm systems, agricultural landscapes, and regions in which they occur (Millennium Ecosystem Assessment, Duraiappah et al., 2005).
The sustainability of an agricultural landscape can be assessed by examining the degree to which management practices maintain or improve the ecosystem services that support productive and economically profitable agriculture (including forestry and fisheries) and resilient and just societies (Dale, Kline, et al. 2013; Kumaraswamy and Kunte 2013). Sustainability reflects a set of diverse aspirational goals which are likely to change over time with changing conditions and stakeholder perceptions (Dale et al. 2015). Thus, no single theoretical optimum can be described for sustainable landscapes (Firbank 2005). Instead, the bio-physical and socio-economic conditions that suggest progress toward sustainable agricultural landscapes fall along continuums of being more, or less, favorable for achieving a defined set of goals for a given system. Thus, working toward sustainability requires a process to identify and implement options that improve conditions relative to the status quo.
Practices intended to improve the sustainability of farm systems often focus on more efficient use of water, fuel, and nutrient inputs; reduced soil and nutrient losses; and less reliance on non-renewable resources, while enabling stable provision of services including crop yields. Practices that have been identified as supporting more sustainable, agricultural landscapes include: polyculture, crop-livestock integration, cover cropping, perennial crop production (National Research Council 2010), agro-forestry, waste recycling, and urban agriculture (Pretty 2008). Typically such practices are focused on the farm or production unit and emphasize economics or environmental outcomes – as evidenced for example by projects funded by Sustainable Agriculture Research and Education grants (SARE 2017), National Center for Appropriate Technology (NCAT, 2017), and Organic Farming Research Foundation (OFRF 2017). Applying a landscape perspective to assessment of agricultural systems can highlight co-benefits and tradeoffs between management choices within social, economic, and environmental dimensions of agro-ecosystems at spatial and temporal scales that are relevant to farms and regions (Gerdessen and Pascucci, 2013; López-Ridaura, Masera, and Astier, 2002; Schader et al., 2016; Eichler Inwood et al. under review).
Assessing progress toward sustainability often involves determining and quantifying indicators (e.g, Dale and Beyeler, 2001; López-Ridaura, Van Keulen,

59
Van Ittersum, and Leffelaar, 2005). Determining appropriate indicators for documenting more or less sustainable systems depends on one's definition of "sustainable" and the particular context as well as the goals of the assessment (Gasparatos and Scolobig 2012; Marchand et al. 2014). Many efforts have identified practices for more sustainable agriculture (Millennium Ecosystem Assessment 2005; Earles and Williams 2005; Dale and Polasky 2007; Tilman et al. 2002) , forestry (e.g., fsc.org; FAO, 2017), bioenergy feedstock production (e.g. Dale et al., 2013; FAO, 2012; Mata, Martins, Sikdar, and Costa, 2011; Mcbride et al., 2011) and economic development (e.g., United Nations, 2015; USAID, 1998). While numerous indicators have been proposed to assess sustainability in agriculture (e.g., Musumba et al. 2017, FAO and SAFA, 2013; Gerrard et al., 2012; Hani et al., 2003; Schader et al., 2016; Van Cauwenbergh et al., 2007), researchers familiar with field applications caution against being too ambitious. Indicators are more useful to decision makers if they are cost effective, easy to apply, technically effective, and understood by the majority of stakeholders (Dale and Beyeler 2001; Dale et al. 2015). Indicators employed to assess multiple dimensions of sustainability have been identified largely for specific agricultural products such as coffee (reviewed in Giovannucci and Koekoek 2003) and palm oil (Roundtable on Sustainable Palm Oil 2007), supply chains (FAO and SAFA 2013a), or farm systems (Hani et al. 2003; Zahm et al. 2008; Gerrard et al. 2012). However, there are few methods for selecting contextually explicit indicators that apply to assessments of agricultural landscapes: Van Cauwenbergh et al. (2007) describe a method for selecting indicators based on identifying goals, principles and criteria at the farm level that can be scaled up to watersheds or regions, and a process for selecting indicators for assessing sustainability in bioenergy production is presented in (Dale et al. 2015) and applied to fuelsheds (Parish et al. 2016).
The objective of the study is to document an approach for identifying indicators for assessing progress toward environmental, social and economic goals in agricultural landscapes that could be applicable to diverse contexts at scales ranging from farm to region. The approach builds on Dale et al. 2015, applied broadly to agro-ecosystems with a landscape perspective (Chapter I). We aim to test and refine the approach so that it can be replicated to support informed decision-making in a wide variety of biophysical and socioeconomic agricultural systems. In this paper, we document application of the approach for indicator selection and lessons learned using a case study of Yaqui Valley, Sonora, Mexico. The underlying premise is that the selected suite of indicators can inform adaptive management decisions (Lin 2011; Tilman et al. 2002; Roling and Wagemakers 2000) by stakeholders such as farmers, community members, research and development organizations, and local and national policy-makers. Adaptive management, or learning by doing, is an iterative process of monitoring and evaluation designed to guide adjustments in practices to better fit changing conditions and needs and respond to new information (e.g., Kline et al. 2017; Dale et al. 2016; Walters 1986). Analysis of indicator data should guide adaptive

60
management, an essential tool to realize continuous improvement in management practices and policies that reinforce beneficial effects or identify and apply corrective measures where warranted.
A variety of farm management practices have been generated by farmers, researchers, and development institutions with the aim of efficiently producing agricultural products in ways that maintain or improve agro-ecosystem services. Quantifying and monitoring socioeconomic and biophysical conditions for agricultural landscapes help reveal the costs and benefits associated with different agricultural management practices. In Chapter I, I recommend that assessments use an integrated systems approach to develop a flexible indicator suite that is adaptable to specific agricultural landscape contexts. This approach allows stakeholders to identify better management practices to achieve site-specific goals. Once those practices have been implemented and indicators are monitored, the framework can be reapplied in an iterative fashion to evaluate progress toward agricultural landscape objectives. Agricultural landscapes reflect a dynamic set of conditions related to the environmental, social, and economic priorities of diverse stakeholder groups. Thus, choosing appropriate indicators requires contextual information and iterative reviews to support adaptive management.
Background on the Yaqui Valley
The Yaqui Valley is located in the southern Sonoran Desert in the northwest Mexican State of Sonora, east of the Sea of Cortez (Figure 5). Ciudad Obregón, the urban and industrial center for Yaqui Valley, lies about 525 km (326 mi) south of the U.S. State of Arizona. A detailed synthesis of the social, economic, and environment processes is provided in Seeds of Sustainability (Matson 2012). This wheat- (Triticum aestivum) dominated region of over 230,000 hectares also produces corn (Zea mays), chickpea (Cicer arietinum), safflower (Carthamus tinctorius), alfalfa (Medicago sativa) and other crops as well as farmed shrimp (Litopenaeus sp.), beef (Bos taurus) and hogs (Sus domesticus). Its highly productive agricultural systems depend on waters from the Yaqui River Basin. Yaqui Valley became the birthplace of the green revolution of the 1950s by hosting major research efforts toward improving wheat yields for developing countries (Matson 2012).
Since 1966, the International Maize and Wheat Improvement Center (CIMMYT) has continued research and outreach begun by Norman Borlaug’s group, which was established by the Mexican government and the Rockefeller Foundation. CIMMYT now acts as a key stakeholder in the Yaqui Valley, along with local and government organizations that promote intensive, commercial agriculture. About half of the cultivated area is owned by ejidos (communal farm systems), but most of that land is rented back to private landowners who manage multiple individual fields of 20-50 hectares (Matson 2012), largely for commercial export. A farmer-owned irrigation district manages all irrigation water,

61
Figure 5. Locational map of the Yaqui River and watershed (gray shading) primarily in Sonora, Mexico. The expanded view shows the Yaqui Valley Irrigation District canal system (blue lines) overlying the multiple municipalities it serves, which covers primarily Cajame including Ciudad Obregón, as well as Navojoa, Benito Juarez, Etchojoa, Bácum, and San Ignacio Río Muerto.

62
which includes reservoirs, open canals, and to a lesser extent, groundwater wells that drain to the Sea of Cortez via surface flooding irrigation. Growing urban populations in Ciudad Obregon and Hermosillo place further demands on water resources, which now includes an inter-basin aqueduct. A series of economic and biophysical perturbations --including major drought and pest arrivals-- have shifted agricultural practice over the last three decades (Matson 2012).
One of CIMMYT’s goals is to promote sustainable intensification (SI) practices that lead to more efficient use of inputs, improved food security and wellbeing, and conservation of soil and water resources to enhance ecosystem services across the landscape. To do so, theories of change are used by CIMMYT to identify the target population, their needs, and strategies that will enable them to meet those goals while establishing a context to consider connections between a system’s mission, strategies, and actual outcomes (CIMMYT 2017). Theories of change describe assumptions of cause-and-effect in pathways from development activity to intended impact and facilitate monitoring of intervention activities (Mayne and Johnson 2015). Our premise is that an indicator-based assessment of the Yaqui Valley landscape could facilitate measurement of progress toward stakeholders’ goals and the practices that support them. The indicator-based assessment approach is meant to help CIMMYT and other organizations document environmental, social, and economic effects of agricultural development programs.
Methods
We adopted a general approach for selecting indicators appropriate for agricultural landscapes, originally developed with a focus on biomass production (Dale et al. 2015). Within the three dimensions of sustainability – environmental, social, economic – several themes or categories are proposed for which indicators are selected (Figure 6). We identified a generic checklist of indicators for each theme based on those suggested by Dale et al. (2013) and McBride et al. (2011) following a review of indicator-based agricultural assessment frameworks (Chapter 1) Additional indicators were proposed to address topics that were emphasized during discussions with stakeholder groups. These candidate indicators for the Yaqui Valley are listed in the Appendix II. Using a Delphi approach (described below), we further refined the candidate indicators into a list of endorsed indicators. Practical considerations of cost and likely data availability resulted in the list of selected indicators for the Yaqui Valley assessment, using terminology at each selection stage, as described in Figure 6.
We progressed from a generic list of indicators to a list of selected indicators by (A) determining site-specific concerns, goals, and context in consultation with stakeholder groups for the case study to develop a list of candidate indicators, (B) defining indicator selection criteria and means of prioritizing candidate indicators with multiple stakeholders, and (C) identifying and ranking the indicators that meet those criteria thus resulting in a set of

63
Figure 6. Terminology used in this paper to describe the sets of indicators identified in each step of the process followed in the Yaqui Valley case study to identify indicators that are context specific, relevant to stakeholders and can be measured using available sources of information.

64
endorsed indicators. This approach was tested and refined by applying it to agricultural landscapes in the Yaqui Valley, Sonora, Mexico.
Initially, concerns, goals, and context for the Yaqui Valley agricultural landscape were identified for Step A based on published syntheses of ecological studies in the region (Matson 2012; Matson, Clark, and Andersson 2016). These goals were cross-referenced with agricultural development targets listed in the CGIAR Research Program (CRP) on Wheat (2017-2022) (CGIAR 2016), especially their Flagship Programs (FP), which are linked to United Nations Sustainable Development Goals (SDGs) (United Nations 2015) and the related CGIAR Strategy and Results Framework (SRF) (CGIAR 2015). Further context was provided by a literature review (Chapter II) as well as by the expertise of CIMMYT collaborators having long-term association with the Yaqui Valley.
Indicator themes
Themes for indicators within environmental, social, and economic dimensions of sustainability were derived from Dale, Efroymson, et al., (2013) and Mcbride et al. (2011) and amended for agricultural landscapes based on a review of other published assessment frameworks (Eichler Inwood et al., under review; Chapter II). The resulting set of themes was presented and used as a basis for discussions with stakeholder groups in the Yaqui Valley (Table 5).
Stakeholders were asked to share their perspectives on environmental, social, and economic opportunities and concerns related to Yaqui Valley agricultural landscape. Stakeholder groups included representatives from agriculture industries, commodity organizations, farmers’ unions, local environmental research faculty, international researchers (including some of the authors), farm owners, irrigation managers, plant pest and disease control specialists, agricultural outreach agents, and community members. In March 2017, local Yaqui organizations hosted meetings of up to two dozen participants, at which we briefly introduced the project aims and the candidate indicator themes and facilitated group discussion. Participants were asked to identify two themes having the highest priority for them or the groups they represented in each of the three dimensions – environment, social, economic – as displayed on posters (see English summary in Table 5). Participants were also encouraged to suggest other indicators or themes that were not listed on the posters. We documented the results of each meeting, including the tallies on priorities and comments about the proposed themes (data not shown). In the subsequent steps, we considered indicators and themes that reflect the priorities expressed by participating stakeholders.
Selecting indicators
We identified four criteria for selecting indicators for agricultural landscapes based on Dale et al. (2015) that could be replicated in a variety of bio-physical and socio-economic conditions. The criteria are that indicators should be (i) useful to diverse stakeholders, (ii) technically effective for the site,

65
Table 5. Preliminary list of themes and indicators for which meeting participants were asked to identify top issues in the three dimensions of sustainable agricultural landscapes. The list was derived from McBride et al. (2011), Dale et al. (2013), and Eichler Inwood et al. (under review; see Chapter 1).
Themes that fall within the three dimensions of sustainable agricultural landscapes
Environmental Social Economic
• Soil Quality
• Water quality
• Water quantity
• Climate impacts
including greenhouse
gas emissions
• Biodiversity
• Air quality
• Productivity
• Other
• None
• Quality of life − Food security − Health
• Work days lost
− Due to injury
− Other causes
• Social and gender equity
• Effective stakeholder participation
• Risk of catastrophe
• Transparency
• Social acceptance (political and civil society support)
• Other
• None
• Trade & exports
• Conservation of non-renewable resources
• Jobs
• Household income
• Profit
• Energy security
• Price volatility
− Food
− Energy
− Inputs
− Products
• Other
• None

66
(iii) practical in terms of obtaining indicator values and (iv) sufficient but not exhaustive. A rating system relative to the selection criteria was developed. The basis for rating differs somewhat for each criterion as explained in Table 6. Having numerical values allows for aggregating ratings from multiple collaborators to develop a list of endorsed indicators that is salient to local conditions and stakeholder priorities. Indicators with the highest rating, “1,” are those that stakeholders recognized as a priority, are technically effective and easily measured or estimated at reasonable cost.
In order to narrow the list of candidate indicators that meet selection criteria, we adopted the Delphi approach (Dalkey and Helmer 1962; Linstone and Turoff 1975; Taylor and Ryder 2003). Delphi involves iterative evaluation by experts to make progress toward consensus by allowing for learning and re-evaluation to occur. This process has been recommended for selecting sustainability indicators (Wolfe et al. 2017; Dale et al. 2016; Sauvenier et al. 2005; Kampichler et al. 2010). Due to the small group size and uncontentious attitude, participants were not asked to remain anonymous in digital questionnaires and later in conference calls to discuss the responses. The experts in this case were members of the CIMMYT and ORNL researcher team (B. Gerard, S. Lopez-Ridaura, I. Ortiz-Monasterio, A. Gardeazabal Monsalue, V. Dale, K. Kline, S. Eichler Inwood). Research team members scored candidate indicators in terms of each of the four criteria based on their perspective and understanding of stakeholder priorities. For example, the team rated each indicator on a scale of 1 to 3 for “usefulness to diverse stakeholders” based on their interpretation of literature, agency targets, and stakeholder group discussion. Similarly, each indicator was rated on a scale of 1 to 3 for technical effectiveness, practicality, and sufficiency based on criteria presented in Table 6. The CIMMYT and ORNL team members then further examined the ratings to determine which indicators lacked agreement under a given selection criterion. As the Delphi method suggests, when ratings did not align, experts could choose to alter their score based on discussion, additional references, or new information. The average score for each indicator and criteria is summed so that the best possible score was 4 (i.e., receiving the highest score of “1” under all four criteria). Higher-rated candidate indicators remain in the list of indicators for discussion, while those with undisputed poor scores are excluded.
Further discussion of the merits of each indicator –individually and in view of the suite of indicators—resulted in changes or exclusions relative to the initial list of candidate indicators. These modifications included clarification of verbiage, measurement methods, and/or the assumed units to be quantified. For example, in the soil quality theme, candidate indicators included soil organic matter (SOM), soil loss, and soil fauna; whereas the indicators endorsed following further review were SOM and area of soil compaction. This change resulted from discussion about likely availability of information, data resolution, and applicability of the data to the broader landscape assessment based on our collective

67
Table 6. Criteria for selection of indicators for use in agricultural sustainability assessments and explanation of rating method for applying the selection criteria.
Criteria for selection of indicators Rating score
Explanation of rating score
Useful to diverse stakeholders
Meaningful in landscape applications
Understandable
1 Recognized by stakeholders as a priority
2 An indicator that is often useful but not a priority for this case
3 Not a current concern for this case
Technically effective
Sensitive to stresses on ecosystem services and social concerns
Anticipatory: signify impending change in patterns or processes
Of known variability in response to stress
1 A technically effective indicator for this case
2 Of uncertain effectiveness under the context of this case study
3 Not technically effective in the context of this case study
Practical
Easily measured
Of reasonable cost
Broadly applicable
Able to predict changes that can be averted by management actions
1 Information that is easily obtained at reasonable cost and that is relevant to this context
2 Information that is obtainable, but a high cost or level of expertise is required
3 Information that is difficult or impossible to acquire at this time for this context
Sufficient (This criterion applies to how each indicator contributes to the comprehensiveness of the collection of indicators)
Necessary to address project goals
Not exhaustive
A measure of a priority concern
1 A measure of a high-priority concern that would not be covered otherwise
2 A measure of low priority
3 A measure that does not add to the completeness of the suite of indicators

68
understanding of the indicators relative to agro-ecosystem processes in the context of Yaqui Valley. In themes for which multiple indicators received high ratings, one or two were retained for the endorsed list of indicators based on contribution to the sufficiency and comprehensiveness of the suite of indicators, not strictly based on cumulative rating score.
We searched for indicator values in published literature, internet accessible databases, state and national statistical repositories, and by direct and ongoing queries to stakeholder groups. While there is abundant information for some indicators based on the years of work in Yaqui Valley done by CIMMYT, Stanford University and other institutions (Matson 2012), information that is both accessible and in the units required for landscape assessment, is limited. Consequently, some initially endorsed indicators for which no information was known to be available were modified to reflect proxy indicators that could take advantage of the best available information.
Results and discussion
Stakeholder groups were willing to share perspectives and priorities for environmental, social, and economic opportunities and concerns related to agricultural landscapes in the Yaqui Valley. Concerns and goals identified by researchers in consultation with stakeholders for improvements of Yaqui Valley agricultural systems include the following. Secure and sufficient water from the reservoir is necessary for irrigation, drinking and household use, and salt intrusion management; thus, water is a primary concern for all in the community. Agriculture is the main business of the Yaqui Valley. Therefore, improvements to environmental and social conditions must also consider agricultural profit and continued business. A desire to compete in a variety of export markets influences many farmers’ management decisions; given the growth of specialty markets for socially and environmentally responsible production, this may provide an opportunity for co-benefits related to environmental protection and social responsibility. Adaptation to risks related to climate change, such as high nighttime temperatures which decrease wheat yields, is a widely recognized priority that encourages crop diversification. Greater access to effective technical assistance related to agricultural production, human well-being, and environmental protection measures could help stakeholders make progress toward local development goals.
Indicator themes
The priorities expressed by consulted stakeholder are reflected in the size of each of the themes shown in Figure 7. The choice of each indicator theme as a first or second priority is shown relative to the total number of participating attendees from all meetings. The opinions and perceptions of different individuals and groups, and the descriptions stakeholders offered regarding their interpretation of the indicator themes are not displayed. A summary tally of

69
Figure 7. Visualization of local stakeholder priorities for indicator themes or categories within social, environmental, and economic dimensions for Yaqui Valley, Mexico. The size of each segment is proportional to the number of stakeholders who prioritized that indicator theme relative to others within the same dimension. Conservation of non-renewables includes soil and water conservation issues per stakeholder input. Water has been combined into one segment that includes water quality and quantity. Quality of life includes health, food security, and unspecified concerns.

70
priorities as identified by meeting participants was considered while rating candidate indicators under the “usefulness” criteria.
Top environmental concerns revolved around water supply for irrigation --upon which virtually all crops rely in this desert agro-ecosystem. Additionally, the impact of climate change on temperature extremes, disease or pest pressures and thus risk for crop loss, as well as productivity in general were considered very important to Yaqui Valley stakeholder groups. The top economic issues were conservation of both water and soil resources, profit, and price volatility associated with inputs and products. Under “employment,” an adequate and consistent labor force was considered an on-going need. However, household income was not selected as a priority. Access to fair and competitive international commercial markets was identified as an objective by some stakeholders. These economic and environmental factors are primary determinants of farm business viability.
Priority social themes focused on quality of life and equity. Because most crop production is exported from the Yaqui Valley, food security is related to sustaining profitable farms, value-added processing and related businesses that provide employment and household incomes. The ability to access healthy and diverse foods in local markets was identified as an issue related health and food security. Neither workdays lost nor effective stakeholder participation was flagged as a concern. There was broad-based awareness of human health hazards related to contact with pesticides or residues as documented in previous published case studies related to cognitive assessments (Guillette et al. 1998) and blood-toxin levels (Meza-Montenegro et al. 2013). Furthermore, participants expressed concern about a lack of training for, or effective regulation of, pesticide applications. Transparency was highlighted in several discussions that focused on government funds intended for agricultural improvements being poorly managed and a perception that government programs involved favoritism and that agricultural development policies lacked proper implementation. Equity, as it relates to personal security, gender, and community services, is important for many participants.
The priorities illustrated in Figure 7 are inter-related. Water and climate change influence productivity and profit, which in turn impact quality of life. In terms of CIMMYT program goals and local priorities, there is an opportunity to help producers reduce risk through crop diversification. Farmers are interested in learning which cropping systems could be deployed to reduce the costs of inputs including water and chemicals (fertilizer, pesticides). Technical assistance needs include both agronomic and market intelligence for additional crops that can be profitably grown in rotation with conventional wheat and maize. Understanding linkages among the priority issues is essential to addressing concerns and realizing objectives for diverse stakeholders within the landscape.

71
Indicators
While it was relatively easy to agree on important indicator themes, selecting specific indicators within each theme was challenging. We applied the criteria and rating system (Table 6) for selection of indicators for the Yaqui Valley.
We developed a checklist of indicators for the Yaqui Valley based on site conditions, development agency targets, literature research, and initial community-member responses regarding local priorities (Appendix II.), which resulted in the candidate list of indicators for the case study. Candidate indicators in each theme were considered relative to the selection criteria described in Table 6, including knowledge regarding the likely availability of data resources to provide indicator values. The application of selection criteria involved an iterative process in which discussions led to increasing convergence of expert opinion about the suitability of indicators.
The 25 endorsed indicators for Yaqui Valley (Table 7) are more focused and 19 fewer than the initial list of 44 generic indicators. We recognize that suitable information may not be available for some of the endorsed indicators and that alternate (proxy) indicators and/or modeling may be required to conduct e assessments. Furthermore, new information may become available over time as technology develops, new studies are conducted, and new monitoring systems are implemented. The list of selected indicators is subject to further refinement and improvement.
The endorsed indicators for assessing progress toward sustainability in the Yaqui Valley agricultural landscape emphasize system-wide metrics which are not necessarily based on the field or farm management unit. The selected indicators rely on information that stakeholders believed likely to be available from prior research efforts or common business record-keeping, and not on new data collection. The selected indicators apply to the Yaqui agricultural landscape and are distinct from approaches that focus on farm systems (e.g. dairy farms as in de Mey et al. 2011) or management techniques at the farm or field scale (Zahm et al. 2008; Gerrard et al. 2012; Hani et al. 2003).
Challenges and lessons learned
It must be recognized that the Yaqui Valley is unique relative to other agricultural landscapes in terms of past research and established working relationships among researchers and producers. It has been the focus of wheat research for decades, and books have been written about its agricultural systems. The annual Wheat Visitors Week brings together hundreds of researchers from around the world to learn about CIMMYT’s renowned field research program. The farmers and others in the Valley are accustomed to interacting openly with researchers and visitors. Additionally, author Ivan Ortiz-Monasterio has spent much of his career living in and building an understanding of the agricultural landscape in the Yaqui Valley as well as the practices that are commonly used by producers there. Thus, working in other areas and nations will

72
Table 7. Endorsed indicators, identified through an iterative compilation of stakeholder priorities and expert opinion, that can be used to assess progress toward sustainability within the agricultural landscape of Yaqui Valley, Mexico, are listed with preferred units of measurement.
Dimension Theme Endorsed Indicator Preferred Units
Enviro
nm
ent
1. Soil Quality Soil organic matter kg/hectare (ha) or % soil organic matter
Area of compaction ha
2. Water Nitrate concentration or export (in or from drainage canals)*
Concentration: mg/L; export: kg/ha/year
Minimum reservoir volume needed to ensure valley-wide single crop
m3
Quality of drinking water Contaminates monitored and levels remain below thresholds of impact on human health
3. Climate Impacts
CO2 equivalent emissions (CO2, N2O, CH4)
ton CO2 eq/year relative to total harvested yield estimates
4. Biodiversity Habitat areas for taxa of concern
ha
5. Air Quality Total particulate matter less than 2.5μm diameter (PM2.5) or 10μm diameter (PM10)
µg/m3
Tropospheric ozone ppb
6. Productivity Yield g C/m2/year (relative to total ha harvested)
Nitrogen use efficiency or Nutrient use efficiency
Percent of fertilizer recovered in grain
Socia
l
7. Social Well-being
Employment # of full-time-equivalent jobs related to agriculture; unemployment rate
Household income $/day; on-farm and off-farm generated if available
8. Social acceptability
Transparency Corruption Perceptions Index (Transparency International)
Vulnerability Climate Vulnerability Monitor (DARA and the Climate Vulnerable Forum. 2012.)

73
Table 7. Continued.
Dimension Theme Endorsed Indicator Preferred Units
9. Health Pesticide use Liters (or $ spent) per ha per year or per kg of production
10. Risk of catastrophe
Crop diversification to reduce risk from extreme events
% area planted in wheat; % of crop area planted to resilient varieties (to be defined through discussion with local stakeholders)
Econo
mic
11. Energy security
Fuel price volatility* Standard deviation of monthly percent price changes over one year (e.g. diesel fuel)
Energy security for vital operations
Percent of water needs supplied by local power
12. External trade
Trade volume $ (net exports or balance of payments)
13. Profit Return on investment (ROI)
% (net investment/initial investment)
Net present value $ (present value of benefits minus present value of costs)
14. Fossil energy dependence
Edible Energy Return on Investment
Ratio of fossil energy input to food energy harvested
15. Conservation of non-renewable resources
Area managed with soil tests that support agriculture decisions
Number of ha, number of farmers
water productivity Ratio of grain yield (kg/ha) to seasonal water use (m3 /ha)

74
likely bring a different set of challenges than those encountered in the Yaqui Valley case.
Despite being relatively well-studied, information is not readily available to support analysis of several indicators within a landscape perspective. Fuel price volatility in Yaqui is not documented but it may be possible to estimate this value based on reported diesel fuel prices in the State of Sonora. Obtaining an estimate or proxy for energy security for vital operations may require additional discussions with stakeholders regarding perceptions on energy security and thresholds to determine which operations are vital to the broader community. Edible energy return on investment has not been described for Yaqui Valley commodities, though it may be possible to estimate this value based on estimates of fuel use and yield data as compared to published values for similar cropping systems. We have not yet identified criteria for defining which crop varieties would be considered “resilient to extreme events.” However, data are available for crop diversity including a list of over 50 different crops, area for each, number of producers, number of plots, and whether the crop is planted as a first season, or as a second crop within the cropping cycle. Increasing the diversification away from a predominant single crop and variety of wheat inherently increases resilience to many extreme events in the Yaqui Valley.
The time and cost demands for conducting full participatory processes are greater than the resources available. The selection of indicators and the ratings relied largely on the opinions of the authors and CIMMYT collaborators. More local participation and ownership is highly desired but difficult to achieve in practice. In the future, interactive smartphone-based apps could facilitate greater participation.
Cross-cultural communications create potential for misunderstanding. The interpretation of terminology among local stakeholders was sometimes different from that assumed by researchers. For example, the indicator theme for “conservation of non-renewable resources” was understood by researchers as primarily representing fossil fuels and minerals that are mined and not reused or recycled. However, local stakeholders indicated that they were not thinking of fossil fuels when they voted for this as a priority concern, but rather considered soil and water to be “non-renewable resources” in their context.
In applying the indicator selection process for a case study of the Yaqui Valley agricultural landscape, we observed that i) consensus was relatively easy to reach on broad categories representing thematic areas of concern regarding sustainability in the agro-ecosystem; ii) the details of how indicators will be precisely defined, measured and interpreted is challenging; iii) knowledge regarding availability of indicator values is a constraint to finalizing a set of practical indicators; and iv) the Delphi process helped participants learn from each other about different facets and complications regarding operational indicators. Uncertainties were sometimes high regarding questions of how well candidate indicators fulfill the selection criteria and one source of uncertainty grew from lack of specificity in indicator definitions and protocols for

75
measurement and interpretation. A persistent challenge of the landscape approach to assessments relates to cause-and-effect relationships and the ability to attribute changes in indicator values to particular management practices and their prevalence and distribution through the landscape.
Next steps
The next step in the agricultural landscape assessment approach is to identify appropriate sources from which to collect or derive values for the selected indicators. We are currently examining a variety of local, national, and international databases, in addition to several key research publications and records from stakeholder organizations. Based on the availability of information encompassing a suitable timeframe to determine baseline and target values, the research team will review options and may further adjust the list of selected indicators.
Priorities change with changing environmental, social and economic conditions, and thus the list of indicators should be revisited periodically. Ideally, stakeholders will be engaged in future iterations of the assessment process and will modify the list of indicators to best fit their needs and access to new information. For example, there may be additional information on air quality indicators such as particulate matter concentration (PM2.5 or PM10), visibility for dust and smog, or odor. The documentation of indicator baseline and target values, steps to ensure consistent monitoring of actual values over times, and analytical methods to interpret and apply findings for improving management practices, are topics for future study.
Conclusions
Working toward more sustainable agricultural landscapes is an iterative process requiring adaptive management and assessment of progress. The costs and benefits of applying the indicator selection approach described here to other regions and landscapes merit further testing. Its general applicability will depend largely on the interest and ability of local counterparts to work on systematic collection of data to inform decisions about resource management to achieve specific agro-ecosystem and socio-economic outcomes in their communities. In this paper we discuss a process applied to select indicators for assessing sustainability in the Yaqui Valley, Mexico, agricultural landscape. Collectively, the suite of indicators is designed to be useful, practical, technically effective, and sufficient for monitoring conditions prioritized by stakeholders in the Yaqui Valley, and to facilitate decisions that improve agricultural practices over time to achieve stakeholders’ environmental and socio-economic objectives. The selection process itself is likely to be valuable to stakeholders for ascertaining priorities and concerns related to sustainability, regardless of available indicator data or assessment outcomes.

76
References
Aguilar, J., Gramig, G. G., Hendrickson, J. R., Archer, D. W., Forcella, F., & Liebig, M. A. (2015). Crop species diversity changes in the United States: 1978-2012. PLoS ONE, 10(8), 1–14. https://doi.org/10.1371/journal.pone.0136580
Brundtland, G. H. (1987). Our Common Future: Report of the World Commission on Environment and Development (Vol. 4). https://doi.org/10.1080/07488008808408783
CGIAR. (2015). CGIAR Strategy and Results Framework 2016-2030: Redefining how CGIAR Does Business.
CGIAR. (2016). WHEAT agri-food systems Full Proposal Draft 1.93 2017-2022.
Christensen, L., Riley, W. J., & Ortiz-Monasterio, I. (2006). Nitrogen cycling in an irrigated wheat system in Sonora, Mexico: Measurements and modeling. Nutrient Cycling in Agroecosystems, 75(1–3), 175–186. https://doi.org/10.1007/s10705-006-9025-y
CIMMYT. (2017). Theory of Change. Retrieved May 8, 2017, from http://maize.org/theory-of-change/
Dale, V. H., & Beyeler, S. C. (2001). Challenges in the development and use of ecological indicators. Ecological Indicators, 1, 3–10.
Dale, V. H., Efroymson, R. A., Kline, K. L., & Davitt, M. S. (2015). A framework for selecting indicators of bioenergy sustainability. Biofuels, Bioproducts and Biorefining, 9, 435–446. https://doi.org/10.1002/bbb.1562
Dale, V. H., Efroymson, R. a., Kline, K. L., Langholtz, M. H., Leiby, P. N., Oladosu, G. a., … Hilliard, M. R. (2013). Indicators for assessing socioeconomic sustainability of bioenergy systems: A short list of practical measures. Ecological Indicators, 26, 87–102. https://doi.org/10.1016/j.ecolind.2012.10.014
Dale, V. H., Kline, K. L., Buford, M. A., Volk, T. A., Tattersall Smith, C., & Stupak, I. (2016). Incorporating bioenergy into sustainable landscape designs. Renewable and Sustainable Energy Reviews, 56, 1158–1171. https://doi.org/10.1016/j.rser.2015.12.038
Dale, V. H., Kline, K. L., Kaffka, S. R., & Langeveld, J. W. A. (2013). A landscape perspective on sustainability of agricultural systems. Landscape Ecology, 28(6), 1111–1123. https://doi.org/10.1007/s10980-012-9814-4
Dale, V. H., & Polasky, S. (2007). Measures of the effects of agricultural practices on ecosystem services. Ecological Economics, 64(2), 286–296. https://doi.org/10.1016/j.ecolecon.2007.05.009

77
Dalkey, N., & Helmer, O. (1962). An Experimental Application of the DELPHI Method to the Use of Experts. Management Science, 9(3), 458–467.
de Mey, K., D’Haene, K., Marchand, F., Meul, M., & Lauwers, L. (2011). Learning through stakeholder involvement in the implementation of MOTIFS: an integrated assessment model for sustainable farming in Flanders. International Journal of Agricultural Sustainability, 9(2), 350–363. https://doi.org/10.1080/14735903.2011.582355
Earles, R., & Williams, P. (2005). Sustainable agriculture: an introduction. ATTRA - National Sustainable Agriculture Information Service. https://doi.org/10.1007/s10806-005-1490-9
Eichler Inwood, S. E., López Ridaura, S., Kline, K. L., Gerard, B., Gardeazabal Monsalue, A., Govaerts, B., & Dale, V. H. (n.d.). Assessing sustainability in agricultural landscapes: a review of approaches. Environmental Reviews.
FAO. (2012). Good environmental practices in bioenergy feedstock production. Rome, Italy.
FAO. (2017). Voluntary Guidelines on National Forest Monitoring. Rome, Italy.
Food and Agriculture Organization (FAO), & SAFA. (2013a). Sustainability Assessment of Food and Agricultural System: indicators. Food and Agriculture Organization of the United Nations - Rome 2013.
Food and Agriculture Organization (FAO), & SAFA. (2013b). SUSTAINABILITY ASSESSMENT OF FOOD AND AGRICULTURE SYSTEMS - Smallholders APP (Vol. 0).
Gasparatos, A., & Scolobig, A. (2012). Choosing the most appropriate sustainability assessment tool. Ecological Economics, 80, 1–7. https://doi.org/10.1016/j.ecolecon.2012.05.005
Gerdessen, J. C., & Pascucci, S. (2013). Data envelopment analysis of sustainability indicators of european agricultural systems at regional level. Agricultural Systems, 118, 78–90. https://doi.org/10.1016/j.agsy.2013.03.004
Gerrard, C. L., Smith, L. G., Pearce, B., Padel, S., Hitchings, R., Measures, M., & Cooper, N. (2012). Public goods and farming. In E. Lichtfouse (Ed.), Farming for Food and Water Security, Sustainable agriculture Reviews 10. (pp. 1–22). https://doi.org/10.1007/978-94-007-4500-1
Giovannucci, D., & Koekoek, F. J. (2003). State of sustainable coffee. A study of twelve major markets. London and Winnipeg. Cenicafé, Cali, Colombia.
Guillette, E. A., Meza, M. M., Aquilar, M. G., Soto, A. D., & Garcia, I. E. (1998). An anthropological approach to the evaluation of preschool children exposed to pesticides in Mexico. Environmental Health Perspectives, 106(6), 347–53. https://doi.org/10.1289/ehp.98106347

78
Hani, F., Braga, F., Stampfli, A., Keller, T., Fischer, M., & Porsche, H. (2003). RISE, a tool for holistic sustainability assessment at the farm level. International Food and Agribusiness Management Review, 6(4).
Kampichler, C., Hernández-Daumás, S., Ochoa-Gaona, S., Geissen, V., Huerta, E., & de Jong, B. (2010). Indicators of environmentally sound land use in the humid tropics: The potential roles of expert opinion, knowledge engineering and knowledge discovery. Ecological Indicators, 10(2), 320–329. https://doi.org/10.1016/j.ecolind.2009.06.010
Kline, K. L., Msangi, S., Dale, V. H., Woods, J., Souza, G. M., Osseweijer, P., … Mugera, H. K. (2017). Reconciling food security and bioenergy: priorities for action. GCB Bioenergy, 9, 1–20. https://doi.org/10.1111/gcbb.12366
Kumaraswamy, K., & Kunte, S. (2013). Integrating biodiversity and conservation with modern agricultural landscapes. Biodiversity Conservation, 22, 2735–2750. https://doi.org/10.1007/s10531-013-0562-9
Lin, B. B. (2011). Resilience in Agriculture through Crop Diversification: Adaptive Management for Environmental Change. BioScience, 61(3), 183–193. https://doi.org/10.1525/bio.2011.61.3.4
Linstone, H. A., & Turoff, M. (Eds.). (1975). The Delphi Method: techniques and applications. Reading: Addison-Wesley.
López Ridaura, S., Masera, O., & Astier, M. (2002). Evaluating the sustainability of integrated peasantry systems - The MESMIS Framework. Ecological Indicators, December 2, 135–148.
López Ridaura, S., Van Keulen, H., Van Ittersum, M. K., & Leffelaar, P. A. (2005). Multiscale methodological framework to derive criteria and indicators for sustainability evaluation of peasant natural resource management systems. Environment, Development and Sustainability, 7(1), 51–69. https://doi.org/10.1007/s10668-003-6976-x
Luers, A. L., Lobell, D. B., Sklar, L. S., Addams, C. L., & Matson, P. A. (2003). A method for quantifying vulnerability, applied to the agricultural system of the Yaqui Valley, Mexico. Global Environmental Change, 13(4), 255–267. https://doi.org/10.1016/S0959-3780(03)00054-2
Marchand, F., Debruyne, L., Triste, L., Gerrard, C., Padel, S., & Lauwers, L. (2014). Key characteristics for tool choice in indicator-based sustainability assessment at farm level. Ecology and Society, 19(3). https://doi.org/10.5751/ES-06876-190346
Mata, T., Martins, A., Sikdar, S., & Costa, C. (2011). Sustainability considerations of biodiesel based on supply chain analysis. Clean Technologies and Environmental Policy, 13(5), 655–671. https://doi.org/10.1007/s10098-010-0346-9

79
Matson, P. A. (2012). Seeds of sustainability: lessons from the birthplace of the Green Revolution. (P. A. Matson, Ed.) (1st ed. .). Washington, D.C.: Island Press.
Matson, P. A., Clark, W. C., & Andersson, K. (2016). Pursuing Sustainability. (P. A. Matson, W. C. Clark, & K. Andersson, Eds.) (1st ed.). Princeton, New Jersey: Princeton University Press.
Mayne, J., & Johnson, N. (2015). Using theories of change in the CGIAR Research Program on Agriculture for Nutrition and Health. Evaluation, 21(4), 407–428. https://doi.org/10.1177/1356389015605198
Mcbride, A. C., Dale, V. H., Baskaran, L. M., Downing, M. E., Eaton, L. M., Efroymson, R. A., … Storey, J. M. (2011). Indicators to support environmental sustainability of bioenergy systems. Ecological Indicators, 11(5), 1277–1289. https://doi.org/10.1016/j.ecolind.2011.01.010
Meza-Montenegro, M. M., Valenzuela-Quintanar, A. I., Balderas-Cortés, J. J., Yañez-Estrada, L., Gutiérrez-Coronado, M. L., Cuevas-Robles, A., & Gandolfi, A. J. (2013). Exposure assessment of organochlorine pesticides, arsenic, and lead in children from the major agricultural areas in Sonora, Mexico. Archives of Environmental Contamination and Toxicology, 64(3), 519–527. https://doi.org/10.1007/s00244-012-9846-4
Millennium Ecosystem Assessment. (2005). Ecosystems and human well-being: Synthesis. In A. K. Duraiappah, S. Naeem, T. Agardy, N. J. Ash, H. D. Cooper, S. Díaz, … A. Van Jaarsve (Eds.), Ecosystems (Vol. 5, pp. 1–100). Washington DC: Island Press. https://doi.org/10.1196/annals.1439.003
Musumba, M., Grabowski, P., Palm, C., Snapp, S., Iita, N., Ksu, V. P., … Iita, B. V. (2017). Guide for the Sustainable Intensification Assessment Framework.
National Research Council, C. O. T.-F. C. S. A. (2010). Toward Sustainable Agricultural Systems in the 21st Century. Agricultural Systems. Washington DC: The National Academies Press. https://doi.org/10.17226/12832
NCAT, & National Center for Appropriate Technology. (2017). Publications. Retrieved January 10, 2017, from https://attra.ncat.org/publication.html
OFRF. (2017). Resource Database. Retrieved January 10, 2017, from http://ofrf.org/research/database
Parish, E. S., Dale, V. H., English, B. C., Jackson, S. W., & Tyler, D. D. (2016). Assessing multimetric aspects of sustainability: Application to a bioenergy crop production system in East Tennessee. Ecosphere, 7(2), 1–18. https://doi.org/10.1002/ecs2.1206
Pretty, J. (2008). Agricultural sustainability: concepts, principles and evidence. Philosophical Transactions of the Royal Society of London. Series B,

80
Biological Sciences, 363(1491), 447–65. https://doi.org/10.1098/rstb.2007.2163
Pretty, J., & Bharucha, Z. P. (2014). Sustainable intensification in agricultural systems. Annals of Botany, 114(8), 1571–96. https://doi.org/10.1093/aob/mcu205
Roling, N. G., & Wagemakers, M. A. E. (2000). Facilitating sustainable agriculture: participatory learning and adaptive management in times of environmental uncertainty. (N. G. Roling & M. A. E. Wagemakers, Eds.). Cambridge University Press.
Roundtable on Sustainable Palm Oil. (2007). RSPO Certification System.
SARE. (2017). Grants Funded. Retrieved January 10, 2017, from http://www.sare.org/Grants/Funded-Grants-in-Your-State
Sauvenier, X., Valckx, J., Van Cauwenbergh, N., Wauters, E., Bachev, H., Biala, K., … Peeters, A. (2005). Framework for assessing sustainability levels in Belgian agricultural systems (SAFE). Scientific Support Plan for a Sustainable Development Policy.
Schader, C., Baumgart, L., Landert, J., Muller, A., Ssebunya, B., Blockeel, J., … Stolze, M. (2016). Using the Sustainability Monitoring and Assessment Routine (SMART) for the systematic analysis of trade-offs and synergies between sustainability dimensions and themes at farm level. Sustainability (Switzerland), 8(3), 274. https://doi.org/10.3390/su8030274
Taylor, J. G., & Ryder, S. D. (2003). Use of the Delphi method in resolving complex water resources issues. Journal of the American Water Resources Association, 39(1), 183–189. https://doi.org/10.1111/j.1752-1688.2003.tb01570.x
Tilman, D., Cassman, K. G., Matson, P. A., Naylor, R., & Polasky, S. (2002). Agricultural sustainability and intensive production practices. Nature, 418(6898), 671–7. https://doi.org/10.1038/nature01014
United Nations. (2015). Transforming our world: the 2030 Agenda for Sustainable Development.
USAID. (1998). Guidelines for indicator and data quality. Performance monitoring and evalution TIPS Number 12. Washington, D.C.
Van Cauwenbergh, N., Biala, K., Bielders, C., Brouckaert, V., Franchois, L., Garcia Cidad, V., … Peeters, A. (2007). SAFE-A hierarchical framework for assessing the sustainability of agricultural systems. Agriculture, Ecosystems and Environment, 120(2–4), 229–242. https://doi.org/10.1016/j.agee.2006.09.006
Walters, C. J. (1986). Adaptive management of renewable resources. New York:

81
International Institute for Applied Systems Analysis by Macmillan Publishers Ltd.
Wolfe, A. K., Dale, V. H., Arthur, T., & Baskaran, L. (2017). Ensuring that Ecological Science Contributes to Natural Resource Management Using a Delphi-Derived Approach. In S. Gray, M. Paolisso, R. Jordan, & S. Gray (Eds.), Environmental Modeling with Stakeholders (pp. 103–124). https://doi.org/10.1007/978-3-319-25053-3
Wu, J. (2013). Landscape sustainability science: ecosystem services and human well-being in changing landscapes. Landscape Ecology, 28(6), 999–1023. https://doi.org/10.1007/s10980-013-9894-9
Zahm, F., Viaux, P., Vilain, L., Girardin, P., & Mouchet, C. (2008). Assessing farm sustainability with IDEA Method- from the concept of agriculture sustainability to case studies on farms. Sustainable Development, 16, 271–281. https://doi.org/978-1-894784-05-4
Zwart, S. J., & Bastiaanssen, W. G. M. (2007). SEBAL for detecting spatial variation of water productivity and scope for improvement in eight irrigated wheat systems. Agricultural Water Management, 89(3), 287–296. https://doi.org/10.1016/j.agwat.2007.02.002

82
Appendix II
Checklist of generic indicators including candidate indicators for the Yaqui Valley, Mexico (in bold). Generic indicators are cross-referenced to related development goals. This list was further modified in the selection process. Theme or Category
Indicator Possible Units Related information
CGIAR Research Program (CGIAR
2016b)1
CGIAR SRF (CGIAR 2015) and United Nations SDGs (UN 2015)
1. Soil Quality 1.1 Soil organic matter
kg/ha or % soil organic carbon
FP-2, 3, 4; arresting soil degradation
Climate mitigation (reduce GHG emissions), reverse land degradation
1.2 Total soil nitrogen (N)
kg/ha Sub-IDOs, see pg 14
More efficient inputs use
1.3 Extractable soil P
kg/ha
More efficient inputs use
1.4 Bulk density g/cm3
1.5 Soil loss kg/ha FP-2, 3, 4 (%
change in erosion/ soil losses); see table FP1-1 pg 45
Reverse land degradation; relates to Grand Challenges in SRF; p 104
1.6 Soil faunal species
count/cm3 FP-4 recommended
2. Water quality and quantity
2.1 Nitrate concentration (in streams, export)
Concentration: mg/L; export: kg/ha/year
FP-2, 3, 4 (% change in nitrate losses)
2.2 Total phosphorus (P) concentration (in streams; export)
Concentration: mg/L; export: kg/ha/year
FP-2, 3, 4 (% change in P losses)
2.3 Suspended sediment concentration (in streams; export)
Concentration: mg/L; export: kg/ha/year
FP-2, 3, 4 (% change in erosion/ soil losses)
1 Codes refer to Table 5 on page 11 and Table FP4-1 on page 104 of CGIAR (2016b); FP - Flagship Program of CGIAR; IDO –intermediate development outcomes that are numerical targets set by CGIAR.

83
2.4 Peak storm flow
L/s
2.5 Minimum base flow
L/s
2.6 Quality of drinking water
Contaminate level below threshold of impact on human health
3. Contribution to climate change
3.1 CO2 equivalent emissions (CO2, N2O, CH4)
ton CO2 eq/year (or per unit Edible Energy or other)
FP-2, 3, 4 Reduced agriculture-related GHG emission intensities
4. Biodiversity 4.1 Presence of taxa of special concern
Presence, population size
FP-4; Biodiversity and ecosystem services
SDG 15; sub-IDO 3.2.2; related to Grand Challenge Climate Change
4.2 Habitat areas for taxa of concern
Area designated to protect taxa of concern relative to their habitat needs
5. Air Quality 5.1 Tropospheric ozone
ppb
5.2 Total particulate matter less than 10 micron diameter (PM10)
µg/m3
5.3 Odor European odor units (OUE/m3)
6. Productivity 6.1 Yield g C/m2/year FP-4 (net productivity)
Sub-IDO 3.2.2
6.2 Nitrogen use efficiency or Nutrient use efficiency
Percent of fertilizer recovered in grain; unit of yield increase per unit of nutrient applied
FP-2, 3, 4 (% change in nitrate losses)
More efficient inputs use
7. Social Well-being
7.1 Employment
# of FTE jobs related to agriculture; unemployment rate
Emphasizing youth and gender equity
IDO 1.3
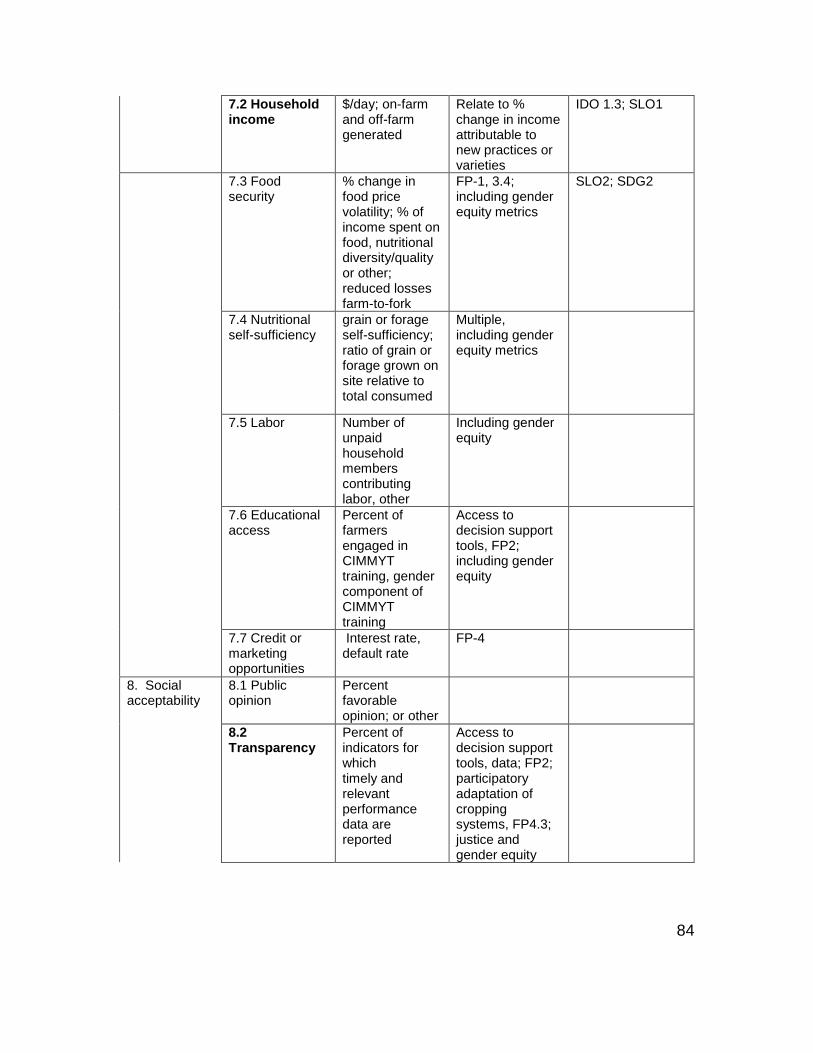
84
7.2 Household income
$/day; on-farm and off-farm generated
Relate to % change in income attributable to new practices or varieties
IDO 1.3; SLO1
7.3 Food security
% change in food price volatility; % of income spent on food, nutritional diversity/quality or other; reduced losses farm-to-fork
FP-1, 3.4; including gender equity metrics
SLO2; SDG2
7.4 Nutritional self-sufficiency
grain or forage self-sufficiency; ratio of grain or forage grown on site relative to total consumed
Multiple, including gender equity metrics
7.5 Labor Number of
unpaid household members contributing labor, other
Including gender equity
7.6 Educational access
Percent of farmers engaged in CIMMYT training, gender component of CIMMYT training
Access to decision support tools, FP2; including gender equity
7.7 Credit or marketing opportunities
Interest rate, default rate
FP-4
8. Social acceptability
8.1 Public opinion
Percent favorable opinion; or other
8.2 Transparency
Percent of indicators for which timely and relevant performance data are reported
Access to decision support tools, data; FP2; participatory adaptation of cropping systems, FP4.3; justice and gender equity

85
8.3 Risk of catastrophe
Annual probability of catastrophic event, based on modeled climatic risks and current management
FP-2, 3, 4
8.4 Risk or recovery from crop loss
Years required to recover from catastrophic event; modeled reduction in crop loss due to improved variety
FP-1, 3; reduce crop losses
Sub-IDOs 1.1.2, 1.4.1
9. Energy security
9.1 Fuel price volatility
Standard deviation of monthly percent price changes over one year
FP-4
9.2 Energy security for vital operations
Percent of water needs supplied by local power
10. External trade
10.1 Terms of trade
Ratio (price of exports/price of imports)
10.2 Trade volume
$ (net exports or balance of payments)
11. Profitability 11.1 Return on investment (ROI)
% (net investment/initial investment)
FP-3; profitability
11.2 Net present value
Dollars (present value of benefits minus present value of costs)
Relate to % change in income attributable to new practices or varieties
11.3 Product sold at market
kg FP-1, 3; losses avoided due to improved varieties
Sub-IDOs 1.1.2, 1.4.1
11.4 Economic return to labor (ERTL)
$/day FP-1.4; improve smallholder productivity and returns, including gender equity; FP-4
Sub-IDO B.1.2

86
12. Fossil energy dependence
12.1 Ratio of fossil energy input to food energy harvested
Ratio; Edible Energy Return on Investment
FP-4; relates to climate-smart and conservation agriculture practices/ adoptions
Climate mitigation, sustainable agriculture; more efficient use of inputs
13. Management practices
13.1 Area with soil tests that support precision agriculture
Number of ha or number of farmers
13.2 Pesticide use per hectare year and per $ production
Liters or dollars spend per hectare
FP-2, 3, 4 (% change in herbicide/pesticide use per unit of production)
If documenting herb/pesticide intensity (not just water concentration), then relates to System Level Outcomes
13.3 Use of irrigation water per hectare-year and per $ production
M3 of water per ha or per dollar value of product
FP-2, 3, 4 (crop water productivity for irrigated crops)
13.4 Cover crop usage
% of total farm; ha
FP-4 Reduction in soil loss
13.5 Crop diversification to reduce risk from extreme events
% area planted in wheat; % of crop production resilience to high temperatures and drought
FP-4; regions at risk of heat stress

87
CHAPTER III ANALYSIS OF INDICATORS OF SUSTAINABILITY FOR YAQUI
VALLEY, MEXICO, CASE STUDY

88
Abstract
Analysis combining data from environmental, economic, and social dimensions can reveal relationships in agro-ecosystem patterns and processes over time and thus inform management decisions toward sustainability goals. Selecting indicators needed to assess and monitor sustainability within a specific landscape requires contextual information including identifying priorities for improving sustainability with input from multiple stakeholders. To further apply our ASAF to the Yaqui Valley, Sonora, Mexico, case study in view of limited information, we selected indicators for which data were at hand. The purpose of this chapter is to (1) identify available information for indicators; (2) determine or calculate an assessment value for each selected indicator or its proxy; (3) identify baseline and target values for indicators, when possible; and (4) compare assessed indicator values with baseline and target values. The analysis of indicators relies on data accessed through archived sources. Seven indicators were selected to assess sustainability in the Yaqui Valley agricultural landscape covering soil quality (area of at-risk soils), productivity (as NDVI), biodiversity (protected area), vulnerability (government indices related to climate change), poverty (government index), transparency (Corruption Perceptions Index), and economic implications of crop diversity (Shannon diversity index by area and value of crops). The assessed indicator values focused on annual or seasonal data from 2015-2017 and are discussed relative to baseline or target indicator values. Results of this analysis suggest that there is an opportunity for improvement of soils through conservation agriculture techniques especially on soils at risk for compaction and salinization. Productivity has been maintained at a high level, so future efforts toward sustainability should focus on water and nutrient efficiency improvements for maintaining yields. Conserved habitat is absent, and natural, perennial habitat is extremely low. Perennial areas could be incorporated into field and irrigation margins to improve potential habitat for organisms that are beneficial to agriculture. Analyses of vulnerability indices suggest that reducing environmental vulnerability should be a priority valley-wide. Social and economic vulnerability is lower than environmental vulnerability and can be maintained for most, or improved for some, of the rural Yaqui Valley population. Rural residents face challenges related to poverty, although poverty is severe for only a small part of the population. Transparency has deteriorated for Mexico as a whole. Economic sustainability may be at risk from potential crop failure, especially of wheat under drought or high temperature conditions. This risk could be reduced by increasing cropping diversity. To continue the assessment process, stakeholder workshops could be organized to obtain feedback on these preliminary results, identify resources to fill gaps in indicator data, and agree upon target values for several indicators.

89
Introduction
Agricultural Landscapes
Achieving progress toward sustainability of agricultural landscapes requires farmers, consumers, and other stakeholders to consider agriculture’s effects on ecosystems and communities while also advancing food and energy security. Improving sustainability of agricultural landscapes involves implementing practices that increase social justice, support ecosystem services, prevent environmental degradation, and maintain economic feasibility. Agricultural landscapes encompass patterns and processes of agro-ecosystems as well as the environmental and socio-economic factors that influence them. A landscape view of agricultural systems often requires consideration of multiple spatial and temporal boundaries. For example, fields in which crops are grown have a distinct boundary relative to watershed resources that facilitate crop production, and the growing season may not coincide with precipitation events that supply the watershed with necessary water for crops. Landscape analysis combining spatially and temporally explicit data from environmental, economic, and social dimensions can reveal relationships in agro-ecosystem patterns and processes over time such as material and energy flows, genetic diversity, natural and human-made resources, as well as climatological and cultural settings (R. S. de Groot, Wilson, & Boumans, 2002; J. C. J. Groot, Jellema, & Rossing, 2007; Renetzeder et al., 2010). Understanding those relationships can facilitate better informed decision making surrounding agro-ecosystem and socio-economic management practices needed to achieve landscape-level improvement goals (Kienast et al., 2009; Ness, Urbel-Piirsalu, Anderberg, & Olsson, 2007; Sattler, Nagel, Werner, & Zander, 2010; van Zanten et al., 2014). Factors influencing patterns and processes important to sustainability of the Yaqui Valley agricultural landscape include biological productivity, market exchange of products, irrigation and storage infrastructure, pollutants, growing conditions, and risk of extreme events.
Determining appropriate indicators for documenting more or less sustainable landscapes depends on one's definition of "sustainable" as well as the goals of the assessment (Gasparatos & Scolobig, 2012; Marchand et al., 2014). Sustainability assessments are complex because they are based on indicators from several themes or categories within environmental, social, and economic dimensions. Indicators are summary measures that describe system properties and inform decision-making through observations or other metrics that gauge conditions or trends (ISPC, 2014). The priorities of stakeholders should determine which of those themes and indicators are most important. By understanding how indicators are impacted by agricultural management, stakeholders can make better-informed decisions in order to achieve goals for their system. Quantitative or qualitative analysis of indicator values relative to baseline and target conditions should be linked to specific management practices. Using a set of indicators relating to the key concerns identified with

90
stakeholder input, rather than a long list of indicators, can enable a transparent, non-reductionist approach to assessing agricultural landscape conditions as a first step to identifying practices that are needed in order to change those conditions.
We recommended an agricultural sustainability assessment framework (ASAF) for landscapes that applies a systems approach for integrated assessment of environmental, social, and economic concerns; encourages continued stakeholder participation; accommodates a flexible, stakeholder-informed indicator suite; and is adaptable to multiple sites and stakeholder goals (Chapter 1; Eichler Inwood et al., under review). Selecting indicators needed to assess and monitor sustainability within a specific landscape requires contextual information including identifying priorities for improving sustainability with input from multiple stakeholders. This dissertation applies this ASAF using the irrigated, commercial agricultural production region of Yaqui Valley in Sonora, Mexico as a case study in order to document an approach for identifying indicators for assessing agricultural landscapes that could be applied to diverse contexts at scales ranging from farm to region. Our recommended ASAF is intended to support sustainable intensification efforts of organizations like the International Maize and Wheat Improvement Center (CIMMYT) at diverse sites in developing nations.
A process for identifying priority themes and individual indicators for assessing sustainability in the Yaqui Valley landscape is described in Chapter 2. During workshops in the Yaqui Valley in 2017, stakeholders discussed key concerns related to sustainability in the Yaqui Valley landscape. Stakeholder groups included representatives from agriculture industries, commodity organizations, farmers’ unions, local environmental research faculty, international researchers, farm owners, irrigation managers, plant pest and disease control specialists, agricultural outreach agents, and community members. Stakeholders designated priority themes for indicators using interactive posters and group discussion in Spanish, facilitated by CIMMYT colleagues who live and work in the Yaqui Valley. Those workshop participants generally agreed that quality of life, water, and conservation of non-renewable resources (including soil and water according to stakeholder perspectives) are priorities for more sustainable agricultural systems in the Yaqui Valley landscape. Subsequently, we refined a list of candidate indicators by determining landscape-specific concerns and goals in consultation with stakeholder groups, defining criteria for appropriate indicators, and ranking candidate indicators according to criteria through a Delphi process for compiling multiple expert opinions, thus resulting in a set of twenty-five endorsed indicators detailed in (Table 7, Chapter 2). These endorsed indicators cover topics of soil quality, water, climate impacts, biodiversity, air quality, productivity, social well-being and acceptability, health, risk of catastrophe, energy security, trade, profit, fossil energy dependence, and conservation of non-renewable resources. However, the data required to understand this full suite of indicators are not all readily available. Funding and

91
other resources required to collect new indicator data specific for this assessment are also not available. Yet it is useful to examine the best available data related to Yaqui Valley sustainability priorities in order to make progress toward landscape goals. The present work (Chapter 3) describes how we selected and analyzed a subset of the endorsed indicators or suitable thematic alternative metrics (proxies) for a landscape sustainability assessment of the Yaqui Valley using data that were accessible.
Objective
In order to further apply our ASAF to the Yaqui Valley case study in view of limited information, we selected indicators from the endorsed list for which data were at hand. This effort builds upon the assessment framework (Chapter 1) and indicator selection process described previously and tested in Yaqui Valley case study (Chapter 2). The purpose of this chapter is to (1) identify available information for endorsed indicators within environmental, social, and economic dimensions of sustainability; (2) determine or calculate an assessment value for each selected indicator or its proxy; (3) identify baseline and target values for indicators, when possible; and (4) compare assessed indicator values with baseline and target values where available.
Analyses of available indicator data contribute to a limited assessment of sustainability of the Yaqui Valley landscape. The assessment provides the basis for discussion of opportunities for progress toward stakeholder-identified goals for the landscape. We address the implications of proceeding with an assessment using available, limited information rather than waiting for complete data. While information gaps are likely in any context, a paucity of indicator data can influence interpretation of assessment outcomes, as well as the ability of stakeholders to use assessment results in decision-making, a key purpose of conducting an assessment.
The remainder of this chapter is organized as follows: first we establish the context for the case study and then describe the approach used to determine availability of indicator data and quantitative or qualitative method to identify current indicator values, as well as baselines or targets for indicators. We summarize results of the limited assessment within environmental, social, and economic dimensions and a discuss the potential influence of using a limited data set rather than the full list endorsed indicators. We conclude with suggested topics for future discussions among Yaqui Valley stakeholders to identify management practices that may help achieve indicator targets.
Methods
Case Study: Yaqui Valley, Mexico
The agricultural landscape of the Yaqui Valley was identified as a suitable case study because our CIMMYT research collaborators have an established presence there with motivated local partners, leading to lower cost and ease of

92
logistics relative to alternative sites. The case study presents an opportunity to extend the bi-directional communication between the community and researchers, which CIMMYT has developed. The Yaqui Valley is located in the southern region of the state of Sonora, Mexico, in flat desert land east of the Sea of Cortez, south of the Yaqui River (Figure 5, Chapter 2). Three large reservoirs form the foundation of the present Yaqui Valley society, economy, and environment, typically providing over two billion cubic meters of water storage (Matson, 2012). The lower dam of the nearest reservoir is situated upstream and northeast of the organized irrigation district No. 41: “Distrito de Riego del Rio Yaqui” (henceforth, DRRY) which is a cooperative organization that manages reservoir withdrawals for irrigation in the Yaqui Valley. All valley farmers who wish to use reservoir water must submit an application to the DRRY with the intended crop species and number of hectares requiring irrigation. A small proportion of the fields are irrigated from private wells. The Yaqui River watershed stretches far north, through Sonora, and into southern Arizona, US. Thus, competing water needs are spread across a large spatial extent and include forest/shrub land, diverse land use practices, and resulting impacts to water quality and habitat.
Identifying boundaries of landscape indicators requires consideration of each indicator independently. Because of the desert environment, the vast majority of Yaqui Valley agricultural crop production was established within the DRRY. Thus, for many of the indicators, the extent of land irrigated by DRRY provides a suitable boundary for the agricultural landscape (Figure 8). The DRRY boundary is particularly applicable to agricultural land management activities that may affect landscape indicator values and, thus, is useful for informing decisions toward improved sustainability. However, in the context of some ecosystem functions and socio-economic processes operating to support the Yaqui Valley agricultural landscape, the DRRY boundary is too limited because it excludes Ciudad Obregon is a city of about 400,000 residents and is an economic and social hub of the valley and other potentially influential subsystems. Information related to social and economic indicators, for example, are typically summarized according to each municipality. Therefore, some indicators are analyzed based on administrative boundaries that overlap with DRRY functions, including the municipalities of Bácum, Benito Juárez, Cajeme, Etchojoa, Navojoa, and San Ignacio Río Muerto within the Mexican state of Sonora. Other landscape boundaries could be important depending on the specific indicator desired.
Several important factors contribute to Yaqui’s highly productive, commercial agricultural landscape (Matson, 2012). Understanding the major flows of materials and energy is necessary in order to assess influences on the agricultural landscape and determine the appropriate context. Ciudad Obregon relies on the reservoir to provide water to residents and industries though it is located outside of the DRRY. From reservoir to coast, the water reaching the Sea of Cortez—an important and historically diverse fishery— has been affected by

93
Figure 8. The “Distrito de Riego del Rio Yaqui” (DRRY) supplies irrigation water through a system of canals (blue lines) in several municipalities (white boundaries) in southern Sonora, Mexico. The Yaqui River watershed (pink boundary) stretches far north into southern Arizona, USA. Very little natural habitat is legally protected in the region (yellow hatched areas) and includes a few small islands and coastal wetlands in the Sea of Cortez. Geographic layers were applied by the author to ESRI DigitalGlobe Basemap satellite true-color imagery.

94
landscape (Matson, 2012). Farms within the DDRY import nutrients, fuel, seeds, pesticides, and biocontrol organisms to the Yaqui landscape. They produce large amounts of (primarily) grain for export and in the process affect greenhouse gases (GHG), air particulates, dissolved nutrients and chemicals, as well as soil (via wind and water). Both the intentional and unintentional exports are important material and energy transfers of interest to stakeholders throughout the landscape– those operating within the DDRY as well as those affected by upstream or downstream impacts.
Components of the Yaqui Valley agricultural landscape have been the subject of a variety of research efforts in recent decades. Various aspects of the system have been described in publications ranging from wheat (Triticum aestivum) breeding by Norman Borlaug (begun in the 1950s and continuing today) through to current conservation agriculture trials and nutrient management research. Seeds of Sustainability (Matson, 2012) cites many of those publications and discusses key sustainability issues in the region. Several Stanford University dissertations highlight research questions focused on individual subcomponents of agriculture in Yaqui Valley (Addams, 2004; Ahrens, 2009; Avalos, 1997; Beman, 2006; Harrison, 2003; Luers, 2003). While those studies provide detailed information on several subcomponents of the endorsed indicators, that body of work does not emphasize a holistic, system-wide perspective on indicators of sustainability of the agricultural landscape. Therefore, our research takes an integrated landscape approach for assessing agricultural sustainability.
Objective 1: Collect information to select indicators available for assessment
The analysis of indicators for this limited assessment relies on data accessed through archived sources such as census data, agricultural records, and public satellite imagery. To obtain the desired indicator data, we searched for existing information related to each endorsed indicator in resources such as Seeds of Sustainability (Matson, 2012) and the Stanford dissertations listed above, in addition to using Google and Google Scholar to find information mentioning the Yaqui Valley in peer-reviewed publications, the CIMMYT research data repository (https://data.cimmyt.org/dataverse/root/search), and Mexican government databases and reports (https://datos.gob.mx/). We examined available information for relevance to the Yaqui Valley landscape assessment including spatial and geographic coverage (hectares or square kilometers that is reasonable to apply to the Yaqui Valley landscapes), temporal coverage (annual or seasonal records from the past few years emphasizing 2015, 2016, and 2017), resolution or aggregation level (e.g., resolved to the municipality administrative unit or finer resolution was preferred), reliability of the data source and adequacy of its meta-data, and cohesion with endorsed indicators and priority themes identified with stakeholders (described in Chapter 2). Information that could contribute to identifying baseline (e.g., prior year records) or target values for

95
indicators was also retained. Further information was sought from research collaborators and stakeholders to determine potential available proxies for those indicators for which data were sparse or unavailable.
Despite the significant amount of past research performed in Yaqui, little indicator data were readily accessible or applicable for a landscape sustainability assessment. Therefore, we selected a subset of indicators for which data were accessible to proceed with testing the ASAF (see Chapters 1 and 2). This process resulted in seven selected indicators for assessing sustainability in the Yaqui Valley agricultural landscape covering soil quality, productivity, biodiversity, vulnerability, poverty, transparency, and economic implications of crop diversity.
Objective 2: Calculate assessed value of selected indicators
Some indicators were best examined using geographic information system (GIS) tools. ArcGIS® software by Esri (version 10.5) was used to analyze spatially referenced data and prepare maps in this work, unless otherwise noted.
Soil Quality
An indicator for soil quality may be available by identifying soils at risk for deterioration from agricultural activities due to soil type and management history. In the Yaqui Valley landscape there are concerns related to management of certain soil types due to tendencies to compact or retain salt (i.e., possess high salinity) and thus reduce crop productivity. The arability of those soils may be maintained through conservation agriculture (CA) as well as specific irrigation tactics. However, land tenure may influence adoption of CA techniques that improve soil quality because such management often requires some investment of time or money to achieve benefits (Soule, Tegene, & Wiebe, 2000). Because much of the ejido (co-operative ownership) land is rented to private farmers on an annual basis, there is low incentive to invest in soil-preserving tactics relative to privately owned and managed land. Therefore, we examined the relative extent of soils at risk for compaction or salinization, and the land tenure regime (private versus co-operative ownership) managing these at-risk soils for areas irrigated by DRRY.
Information on soils across southern Sonora was available as a digitized map (https://datos.gob.mx/busca/dataset/mapas-de-uso-del-suelo-y-vegetacion-escala-1-250-000-serie-v-sonora1) of major soil types. The soil map was clipped to a polygon map layer delineating DRRY irrigated cropland (excludes highways, canals and other infrastructure). The relative area of each major soil type within the DRRY and within ejido-owned land was calculated from spatial data layers (https://datos.gob.mx/busca/dataset/tierra-de-uso-comun--formato-shape).
Productivity
The productivity of crop systems is typically represented in terms of the yield of harvested product per area (e.g. grain tonnage per hectare), which is

96
often tightly correlated to aboveground biomass and related to the health of crops. Several indices are available for analyzing vegetation cover and crop health, providing a proxy for aboveground biomass at scales of hectares to square kilometers (Silleos, Alexandridis, Gitas, & Perakis, 2006). The normalized difference vegetation index (NDVI) has several advantages as an indicator for landscapes, including ready access to seasonal global data coverage from multiple satellite sources such as MODIS, LANDSAT, and Sentinel 2 data, ensuring future monitoring capability, as well as spatial scalability. NDVI is calculated as (Lobell, Asner, Ortiz-Monasterio, & Benning, 2003):
Equation 1
(𝑁𝐼𝑅 − 𝑅𝑒𝑑)
(𝑁𝐼𝑅 + 𝑅𝑒𝑑)= 𝑁𝐷𝑉𝐼
resulting in a range of -1 to 1, where NIR is the near-infrared spectral reflectance (wavelength peak about 842 nm) and Red is the spectral reflectance of the red band (wavelength peak 665 nm).
For the purpose of a landscape assessment for the Yaqui Valley, we used NDVI as a straightforward proxy for productivity of winter-cropped land (primarily wheat and some safflower) for the Yaqui Valley. Pre-calculated NDVI products were accessed for MODIS time series data (2003-2018; 250 m resolution) using the VISNAV-LULC 2010 general crop mask available in the interactive Global Agricultural Monitoring System toolset (https://glam1.gsfc.nasa.gov/) in order to examine NDVI for 2016 and 2017, as well as seasonal trends in NDVI over the past 15 years.
Biodiversity
Biodiversity was identified as an important theme for sustainability in the Yaqui landscape during stakeholder workshops (Chapter 2). Some stakeholders discussed the goal of increasing biodiversity, especially of native macro-flora and -fauna associated with the local desert landscape. Assessing biodiversity with direct sampling of sites sufficiently representative of the case study landscape is not feasible for the sustainability assessment framework employed here. Nevertheless, legally protected area often supports native genetic resources and therefore was selected for the Yaqui Valley assessment. To assess potential biodiversity across the Yaqui landscape we examined proximity of legally protected habitat areas to the DRRY by overlaying DRRY boundaries and Comision Nacional de Areas Naturales Protegidas maps (available from http://www.conanp.gob.mx/datos_abiertos/DES/Geomatica/2016/ANPS.kmz), as well as 2010 land cover data layer for the region (30m resolution; CONABIO 2010).

97
Vulnerability
In the absence of surveying a representative sample of Yaqui community members, wellbeing themes are assessed through proxy measures. The Intergovernmental Panel on Climate Change (IPCC) approach (Parry & IPCC, 2007) to estimate vulnerability is based on “the degree to which a system is susceptible to, or unable to cope with, adverse effects of climate change, including climate variability and extremes” (Preston et al., 2007) and takes into account exposure (presence of a climate hazard), sensitivity (responsiveness of a system to the hazard), and adaptive capacity (ability to manage exposure and/or sensitivity, or cope with adverse impacts; Preston et al., 2007). These vulnerability ratings provide a summary measure of how exposure and sensitivity create a potential impact, which may be ameliorated by the communities’ adaptive capacity. The Mexican government database contained ratings of economic, social, and environmental vulnerability by municipality, which we used for assessing the Yaqui Valley.
Vulnerability was assessed using two steps. First we summarized geo-referenced household population data for residents within the DRRY. Then Mexican government census mapping information for 2015 that includes ratings of social, environmental, and economic vulnerability related to a changing climate (Parry & Intergovernmental Panel on Climate Change Working Group II, 2007 methodology) by municipality (available at https://datos.gob.mx/busca/dataset/vulnerabilidad-social-economica-y-ambiental-por-municipio) was applied to the DRRY population data. However, specific calculations and data used by the map’s developers were not accessible.
The DRRY population shapefile excludes areas that are not irrigated cropland, such as highways, the canals that transport water for irrigation, and many households not immediately adjacent to irrigated fields; therefore population data were clipped to DRRY polygons that were buffered to include all households or villages within 300 meters of irrigated land (excluding Ciudad Obregon). Then we summed the total number of DRRY residents living within the DRRY under each level of vulnerability, ranging from very low to very high vulnerability.
Poverty
A proxy for household income or poverty is available from the Mexican government statistics database as the rezago social index, which is the “degree of social backwardness” (or social lag; CONEVAL, 2016). This index compiles statistics about access to water, sanitation, healthcare, electricity, and education among others and is useful for examining social and economic aspects of sustainability of the Yaqui Valley landscape in the absence of household economic data. Following the process used for the vulnerability indices, we determined the proportion of DRRY residents living at each social lag classification by application of the government rating (by municipality) to households within DRRY for census years 2015 and 2010.

98
Transparency
Transparency of institutional and financial transactions was a concern for stakeholders in Yaqui Valley (Chapter 2). Information on transparency for Mexico as a whole was available from Transparency International (www.transparency.org) as the Corruption Perceptions Index, which “ranks 180 countries and territories by their perceived levels of public sector corruption according to experts and businesspeople” (Transparency International, 2017). A proxy for transparency within the Yaqui Valley landscape is assessed here because of the low resolution of the available data. We used the Corruptions Perception Index scores (on a scale of 0-100) for Mexico and national rankings from 2012-2017 (available from www.transparency.org).
Economic Risk and Crop Diversity
Because just a few crops-- wheat and to a lesser extent, maize, chickpea (Cicer arietinum), and safflower (Carthamus tinctorius)-- dominate commercial agriculture in Yaqui landscapes, stakeholders acknowledged the potential social and economic risk related to catastrophic crop loss from drought, pest, disease, and climatic events (Chapter 2). For a proxy of economic risk related to crop diversity, we selected a common expression of diversity, the Shannon diversity index (H’) calculated as:
Equation 2
𝐻ℎ𝑎′ = − ∑(𝑝𝑖 × 𝑙𝑛 𝑝𝑖)
𝑠
𝑖=1
where p is the proportion of hectares planted in the ith crop species, and s is the number of crop species (Gotelli & Chao, 2013). The H’ was expressed as the effective number of crop species (ENCS, Aguilar et al., 2015) using:
Equation 3 𝐸𝑁𝐶𝑆ℎ𝑎 = 𝑒𝐻′
where e is the exponential constant approximated at 2.718 (Gotelli & Chao, 2013). ENCS indicates the number of crop species at equal areas that would give the equivalent H’. Diversity of agricultural market value can be calculated likewise using the same equations but replacing hectares with pesos, resulting in H’$ and ENCS$ that can help contextualize the markets’ dependence on the diversity of crop species.
We summarized the crop production data and analyzed crop diversity using equation 1, as the relative proportion of the Yaqui Valley planted to each major crop. The 2016 harvest year information is from municipal records and applies to the six entire municipalities of the valley, including areas outside of the DRRY (available at http://infosiap.siap.gob.mx). These values were compared to

99
data from 2005. In contrast, 2017 data are from DRRY irrigation applications (records obtained from Junta Local de Sanidad Vegetal del Valle del Yaqui) and therefore applies to production from DRRY irrigated lands only. Market values associated with each crop species harvest were available for the 2016 production year and we ranked these values in order to investigate the relative value-per-hectare for valley crop types as well as variability in value across municipalities. These were compared to records of 2005 production areas and market value. Yield and market value data by crop were not available for 2017.
Objective 3: Identify baseline and target values for indicators
Identification of baseline and target values can require significant research efforts that are beyond the scope of the current work. In some cases, prior year records could be used to calculate a baseline. Alternatively, we could assume baseline and target levels based on the qualitative or quantitative units of indices that were used in the landscape assessment. Consequently, we discuss the assessed values relative to reference values for some indicators for which clear baselines and obvious target values were available from historical records or literature.
Objective 4: Compare assessed indicator values with baseline and target values where available
Wherever data were available, we describe values for indicators based on archived data from the last five to 15 years, using the same calculation approach that was applied to the assessed indicator value. We identified baselines and targets (described below) for indicators based on literature, knowledge of the landscape, and priorities discussed with stakeholders (Chapter 2). Indicators that use indices have built-in minimum and maximum value that provide baseline and targets. We present a qualitative comparison of assessed values relative to baseline and target values.
Assessment Results and Discussion
Table 8 lists the available indicators and units, as well data source and the analytical method used for each indicator. Indicators that represent the list of endorsed indicators or reasonable proxies for indicators in each thematic areawere selected based on limited data available. Assessed values were established and compared to baseline or historical values as well as target values, where available. We discuss results of assessing each indicator and implications for the approach and data employed.

100
Table 8. Selected indicators, units, available data resources, and methodological approach for assessing sustainability of the Yaqui Valley, Mexico agricultural landscape.
Dimension, Theme
Detail
Environment: Soil Quality
Indicator, units
Area at risk for compaction or saltation by soil type, by tenure regime; hectare (ha)
Data Resource
Digital soil map (https://datos.gob.mx/busca/dataset/conjunto-de-datos-vectoriales-de-la-carta-edafologica-1-250-000-serie-l-sonora) Map of DRRY irrigated fields (https://datos.gob.mx/busca/dataset/cuencas-de-inecc/resource/48dbec30-c836-44e4-a60b-4330c1f71a70) map map of ejidos (https://datos.gob.mx/busca/dataset/tierra-de-uso-comun--formato-shape)
Approach Clip soil map to DRRY map; sum area by soil type, calculate % total for each soil type; and % located in ejido lands (cooperative-owned)
Environment: Biodiversity
Indicator, units
Protected or Conservation habitat, ha
Data Resource
Map: CONANP 2016 (includes IUCN protected areas, 2017): http://www.conanp.gob.mx/datos_abiertos/DES/Geomatica/2016/ANPS.kmz; CONABIO NALC 2010 landcover 30m resolution
Approach Overlay protected areas and municipalities composing the DRRY
Environment: Productivity
Indicator, units
Normalized Difference Vegetation Index (NDVI), unitless
Data Resource
Aqua/Terra MODIS time series 2000-2018 (250m resolution) and tools available at (https://glam1.gsfc.nasa.gov/)
Approach Calculate mean peak NDVI for winter cropped areas, summarize NDVI by municipality. Note: NDVI is limited to values between -1.0 to 1.0.; growing plants exhibit NDVI in the range 0.2-0.9.
Social: Well-being
Indicator, units
Social Lag (poverty) Index, unitless classification
Data Resource
Government table of social lag index by municipality: classification (very high to very low, 5 classes) CONEVAL 2016 report
Approach Create social lag by municipalities map and clip to DRRY, use population data (household level, CIMMYT 2015) to identify intensity of social lag; calculate % of DRRY population in each class

101
Table 8, continued.
Dimension, Theme
Detail
Social: Transparency
Indicator, units
Corruption Perceptions Index, percent
Data Resource
Transparency International, national score (https://www.transparency.org/news/feature/corruption_perceptions_index_2017#table)
Approach Mexico score and rank 2012-2017
Social: Acceptability
Indicator, units
Vulnerability Index (social, economic, or environmental), unitless rating
Data Resource
Government table of vulnerability by municipality: theme and classification of vulnerability (very high to very low, 5 classes; using Parry & Intergovernmental Panel on Climate Change Working Group II, 2007 methodology) https://datos.gob.mx/busca/dataset/vulnerabilidad-social-economica-y-ambiental-por-municipio http://201.116.60.46/DatosAbiertos/Diccionario_de_datos_Mapas_de_Vulnerabilidad_ante_la_Sequ%C3%ADa.csv
Approach Create vulnerability by municipalities map and clip to DRRY, use population data (household level) to identify intensity of vulnerability; calculate % of DRRY population in each class
Economic: Risk of Catastrophe
Indicator, units
Production by crop, % area, pesos/ha Effective Number of Crop Species (ENCS) via Shannon Diversity Index, unitless
Data Resource
2017: List of crops by area (Junta Local de Sanidad Vegetal del Valle del Yaqui) 2016: List of crop production by area and municipality, market value (Servicio de Información Agroalimentaria y Pesquera: http://infosiap.siap.gob.mx/gobmx/datosAbiertos/ProduccionAgricola/Cierre_agricola_mun_2016.csv) Historical data: https://datos.gob.mx/busca/dataset/estadistica-de-la-produccion-agricola
Approach Calculate proportion of DRRY area devoted to each crop for 2016, 2017 Calculate Shannon Diversity Index for 2016, 2017, for DRRY Summarize market value and production levels for 2016 by municipality

102
Soil quality: area of soils at risk for compaction or salinization
A little over half of the DRRY area (excluding roads, canals and other non-irrigated surfaces) contains the three most desirable soils for agriculture: Alluvion ligero (silt loam, 19%), Alluvion pesado (clayey silt, 7%), and Barrial profundo (deep clay, 30%), while five additional types make up the remainder of irrigated cropland (Figure 9). Specific agricultural management may improve productive potential of certain soils especially soils con sales (“with salts”) and compacted soils (compactado) which are considered to be poorer soils for agriculture (Lobell, 2005). Soils con sales represent about 22% of the irrigated land (Figure 10). These soils are more productive under management with larger irrigation water volume relative to soils without salts, in addition to careful application of agronomic nutrients. Agricultural decisions over multiple seasons and in response to low water availability need to consider a crop’s sensitivity to increased soil salt content: for example, almond (Prunus dulcis) and citrus tree (Citrus spp.) crops are sensitive, maize and alfalfa (Medicago sativa) are moderately sensitive, whereas wheat and safflower are moderately tolerant of some salts (USDA ARS, 2015). Barrial compactado soils represent 10.8% of the DRRY and have a high risk for compaction. Compacted soils may benefit from CA techniques that reduce tillage and increase soil organic matter (Hamza & Anderson, 2005). In total, about one-third of the DRRY contains at-risk soils that may benefit from specialized management.
About half (51.4%) of the DRRY is ejido land (Figure 9). Soil types within ejidos are representative of the DRRY as a whole (Figure 10). CA techniques such as residue retention and reduced tillage have been used regularly only on a very small portion of the DRRY area despite improving long-term yield gains (Ortiz et al., 2008), in part due to land tenure patterns. Thus policy changes and programs that assist with costs associated with CA could improve CA adoption, and may be particularly useful if focused on areas with at-risk soils, especially those within ejidos.
High soil quality in agricultural systems relates to maintenance of high productivity without soil or environmental degradation and may be assessed through chemical, physical, and biological metrics (Govaerts, Sayre, & Deckers, 2006). Biophysical sampling of soil properties provides the best information on soil quality, but in its absence, some alternative indicators may be available. For example, certain agricultural techniques are known to maintain or improve soil quality, especially the reduced tillage and increased residue retention practices promoted through a collection of methods known generally as conservation agriculture (CA). Since CA affects soil physical properties such organic matter content, moisture penetration and retention, aggregate structure, and vegetative material retained on the soil surface (Fuentes et al., 2012; Govaerts et al., 2006; Verhulst et al., 2011) as well as arthropods (Rivers, Barbercheck, Govaerts, & Verhulst, 2016), efforts have been made to identify areas of CA through satellite

103
Figure 9. Eight soil types are found within the irrigation district, of which half is owned by ejido communities (hatched areas) and mostly rented to large-scale industrial farm businesses. Soil types that have a high risk for compaction or saltation require specific management in order to remain productive.

104
Figure 10. Total area of each type of soil is shown for the DRRY and compared to the area under ejido ownership.

105
spectral imagery (e.g., Daughtry et al., 2006) as an indicator of soil quality (Watts, Lawrence, Miller, & Montagne, 2009). For sustainability assessment of agricultural landscapes, the proportion of land under CA management may be a useful indicator because of its relationship to soil quality. However, methods for remote sensing of CA areas are not well-calibrated (Watts et al., 2009) and still under development for the Yaqui Valley (K. Sonder, personal communication). Future landscape sustainability assessments would benefit from methods to identify areas of CA through remote sensing.
The concepts of baseline and target value are not applicable to soil type, for soil type will not change with management, whereas soil quality may. Ideally, baseline information would include soil characteristics from the early years of irrigated and mechanized agriculture, such as soil organic matter content, pH, conductivity, and texture, which are often documented during government soil mapping efforts. Then, current soil characteristics from high and low-yielding fields could be related to baselines to help prioritize indicators for monitoring soil quality at a finer spatial resolution. Realistically however, focusing on developing remote sensing techniques for determining soil quality may be more useful and cost effective than an extensive physical sampling regime. In that case, areal extent and specific locations of high- and low-quality soils could be identified and management techniques adjusted to conserve or improve soil in those areas, since prior work has shown that poor soils can be highly productive under good management (Lobell, Ortiz-Monasterio, Addams, & Asner, 2002).
Productivity: seasonal peak NDVI
NDVI provides well-documented utility for agriculture for monitoring crop conditions and forecasting yields (Becker-Reshef, Vermote, Lindeman, & Justice, 2010). NDVI is highly linearly correlated to modest levels of grain production (e.g. below about 4 ton/hectare of wheat grain; Skakun, Vermote, Roger, & Franch, 2017) but becomes saturated for crops under high-input and high-yielding conditions found in the Yaqui Valley. While other remote sensing-based crop simulation methods are available for estimating yield that can overcome saturation issues (Lobell et al., 2003; Lobell, Thau, Seifert, Engle, & Little, 2015), those methods require ground control points and detailed geo-referenced yield data resources for model calibration, which were not available for our study. NDVI indicates stage of crop growth and thus the planting season and areas under differing crop type such as winter wheat, fall maize (Zea mays), or summer soybean (Glycine max) (Lobell et al., 2003).
Peak NDVI for winter crops in Yaqui occurs late-February to mid-March based on MODIS data (Figure 11). Mean peak NDVI for 2016 (0.733; Figure 12) and 2017 (0.709) trend very near to the mean winter peak for regional NDVI over the period 2003-2015 (0.653). A comparison of reported 2016 average wheat yield to mean peak-season NDVI by municipality showed a weak positive linear correlation (R2 = 0.329, data not shown), indicating the high-yielding fields in

106
Figure 11. Regional NDVI for cropped areas (using the GLAMS tool) peaks for winter crops during mid-February to mid-March and for summer crops in late August to late September in the Yaqui Valley, after applying the VISNAV-LULC crop mask to the regional time series for MODIS satellite data.

107
Figure 12. NDVI on March 5, 2016 shows crops at near-peak growth stage throughout the Yaqui Valley municipalities (black lines) as indicated by dark green pixels (based on MODIS satellite imagery available at https://glam1.gsfc.nasa.gov/). Non-cropped areas are shown as white.

108
DRRY were reaching NDVI saturation. Similar yields could be expected for 2017 in the absence of late season crop losses, however data were not available.
In the case of productivity as indicated by NDVI, a reasonable baseline is mean peak NDVI for each season, averaged over several growing seasons. A hypothetical crop yield maximum would exhibit peak NDVI of about 0.8 for 250 m resolution (Becker-Reshef et al. 2010), which provides a target value for the context of Yaqui Valley production practices. That is, maintaining the indicator value for productivity between the historical mean and the hypothetical maximum may be considered the goal on a seasonal and annual basis. In the context of the Yaqui landscape’s generally high productivity, an alternative indicator could be to calculate the total area that achieves seasonal mean to maximum NDVI during a growing season. Additional stakeholder input is needed to determine whether NDVI as a proxy for landscape productivity remains a useful indicator or if it requires modification.
Biodiversity: legally protected habitat areas
Not surprisingly for an area devoted to agriculture, the DRRY contained no formally protected conservation habitat (Figure 8). Some of the coastal wetlands and shrub islands in the Sea of Cortez, are reserved as migratory bird and forest animal habitat within municipalities overlapping DRRY. The amount of perennial vegetation that could provide refugia for beneficial macro-organisms in the DRRY is also very limited. There is a growing body of literature describing positive effects and tradeoffs of perennializing agricultural landscapes around and even within fields (reviewed in Asbjornsen et al., 2014). In some contexts benefits of perennial vegetation are significant when >20% of the landscape is non-crop species and this can occur even when there are fragmented habitats (Tscharntke, Steffan-Dewenter, Kruess, & Thies, 2002). Aside from young walnut (Juglans spp.) and citrus tree groves, perennial cover adjacent to cropland in DRRY is difficult to detect by remote sensing because trees occur along roadways or adjacent to households. Shrub or groundcover is very limited and almost exclusively arranged in a narrow band along field margins and canals in the DRRY (Figure 13). Land cover data shows virtually no forest or shrub cover within the DRRY (data not shown; 30m land cover, CONABIO NALC 2010). That is, the abundance of perennial vegetation in the DRRY is not generally sufficient to be captured and quantified with 10-30 m resolution imagery, although some can be observed directly.
Area of protected habitat may provide a reasonable indicator of potential biodiversity which assumes there is a link between protected habitat and actual biodiversity even though that relationship is not always well-documented (Chape, Harrison, Spalding, & Lysenko, 2005; Geldmann et al., 2013). Conservation lands rarely represent ideal habitat for maintaining native biodiversity because they are often located in areas that were less desirable for development (agriculture or otherwise) and likely differ from pre-development habitat in the landscape (Scott et al., 2001).

109
The current conditions (zero conservation ha) may be considered a baseline value for the assessment, and additional stakeholder input is needed to determine a target value. Though not formally protected, a target of 20% of the agricultural landscape containing perennial habitat in and around fields means approximately 44,000 hectares of new perennial land cover would need to be added. That would be the equivalent of planting 100 m buffers along the major canal grid perimeters (2 km x 2 km). In contrast, a 10 m buffer would result in 4,400 ha of new vegetation or 2% of the landscape, perhaps a more realistic interim goal. The advantage of using national or international databases for identifying conservation areas are the low cost and ready access, despite the course spatial resolution of data and the need for assumptions regarding conserved habitat and links to species diversity.
Figure 13. The fields within DRRY are primarily flood-irrigated through a system of canals that are periodically removed of vegetation. Very little perennial shrub or tree cover is found in the district. (Photo by S. Eichler Inwood).

110
Vulnerability: government index of vulnerability
The rural population within the DRRY in 2015 is about 55,000 people who reside in portions of six municipalities (Figure 14), primarily Cajeme and Bácum. Using the Mexican government’s census-based indices (based on IPCC 2007 approach to estimating vulnerability related to climate change), the social vulnerability of this population is classified as low (43%) or very low (37%) (Figure 15). Over two-thirds of the rural population reside within municipalities considered to have very low economic vulnerability, while 17% and 12% are categorized as having low to medium economic vulnerability. In contrast, environmental vulnerability is medium, high, or very high for the area (57%, <1%, and 43% respectively). Ideally the goal is to achieve ‘very low’ status for the entire population for each of these indices. Continued input from local stakeholders including government, agri-industry representatives and residents is needed to identify programmatic changes to help address environmental vulnerability.
Use of national census data for the social indicators provides two potential advantages to the assessment. First, baseline and target values are plainly defined by five rating categories. Secondly, as basic census information, there is a high likelihood of having access to data for monitoring changes to this indicator. Other methods for determining vulnerability related to climate change have been used. For example, Luers and others (2003) calculated vulnerability for DRRY farmers based on the sensitivity of wheat yields to temperature stressors, soil type, and market fluctuations associated with dependence on wheat production. Because of its specificity to a site, such data intensive methods for estimating vulnerability may not translate well to other parts of Mexico or landscapes globally. Thus, an index based on widely applicable procedures is more useful for the ASAF presented here.
Poverty: government index of social lag
The degree of social lag (an estimate of poverty) is very low or low for the DRRY population based on 2015 data (Figure 15). To put the index in perspective, municipalities with very low, low, and medium poverty correspond to 5, 12, and 25% of the population without refrigeration; and 2, 4 and 4% of persons over age 15 who are illiterate—two of several statistics contributing to the index. It is important to note that social and economic ratings are likely skewed by Ciudad Obregon statistics being within the municipality of Cajeme’s data, which affect the overall municipality rating, but not part of the DRRY rural population calculations. Some historical data are available for this poverty index, which can be used as the baseline. An advantage of using an index is the obvious target value, which in this case is to expand the ‘very low’ poverty level classification to all residents of the Yaqui Valley.

111
Figure 14. Rural residents of the DRRY are primarily within Cajeme and Bacum municipal boundaries.

112
Figure 15. Mexican government classification for indices of vulnerability and social lag according to municipality are shown by percent of the rural DRRY residents.

113
Transparency: Corruption Perceptions Index
Transparency is shown as the annual Corruption Perceptions Index scores and rankings for 2012-2017 (Table 9). The index is based on a compilation of multiple surveys and sources that capture attitudes toward public sector corruption including bribery, diversion of public funds, integrity in the public sector, nepotism in government, effective prosecution of corruption, adequacy and enforcement of anti-corruption laws, and legal protection for journalists and whistleblowers. The national chapter (Transparency Mexico) maintains some information on transparency by state as well as legislation related to addressed corruption, but an estimate of transparency was not available by municipality. Perception of corruption in Mexico has deteriorated in the last five years, falling from a high of 35 to 2017’s score of 29. This trend supports some of the comments recorded during stakeholder workshops regarding increased concern over a lack of transparency in the Yaqui Valley (Chapter 2). Stakeholders expressed pessimism that government officials would be effective at improving delivery of agriculture support services.
The theoretical baseline for the Corruption index is 0 with a target of 100, for those are the minimum and maximum indicator values. The goal is movement toward the maximum value for the indicator. The status for 2017 (29) reflects a worsening value from 2012, moving away from the target value. A reasonable interim goal should be at least 50, or as otherwise determined in future stakeholder discussions. For comparison, top ranking nations New Zealand and Denmark achieved scores of 89 and 88 respectively, whereas the US received a score of 75 for 2017. Table 9. Transparency International Corruption Perceptions Index and ranking for Mexico (on a scale of 0-100, where 0 is highly corrupt whereas 100 is very clean) relative to 180 countries.
2012 2013 2014 2015 2016 2017
Score 34 34 35 31 30 29 Rank 105 106 103 111 123 135

114
Economic indicator: diversity of market crop yields
In 2016 crops were harvested from 353,974 ha in six municipalities of the Yaqui Valley (includes areas outside of DRRY), at a total value of 10.8 billion pesos (about 573 million US dollars using February 26, 2018 exchange rate of 18.61:1). Of this, 62% of the area and 48.5% of value was attributed to wheat grain production (Table 10). Similarly in 2017, requests for irrigation allocations were primarily for wheat (67.8% of DRRY, Figure 16) with maize secondary (10.4%) and the remaining 21.8% divided among 53 crops (Figure 17) excluding double cropped fields (about 4500 ha, data not shown).
The calculated Shannon diversity index for crops by area was nearly identical at 1.42 and 1.43 for 2016 and 2017, respectively, despite different information sources. These values correspond to ENCSha of 4.19 and 4.15 for 2016 and 2017, respectively. This ENCSha for the Yaqui Valley can be visualized as having just 4 crop species planted at equal acreage. The ENCSha baseline for Yaqui Valley municipalities was 3.8 for 2006 (data not shown). The comparison shows that ENCS has improved slightly over the course of a decade. This lack of spatial diversity is due to the predominance of wheat within the DRRY and is much lower than the ENCS in southern California (9-12), for example, and similar to that of the grain belt in Illinois (Aguilar et al., 2015). An alternative perspective is given by calculating diversity of the market value (rather than spatial diversity using hectares), which results in greater diversity (ENCSvalue = 7.00 for 2016).
Wheat production had a relatively low market value of about 23,800 pesos per hectare compared to other crops in the valley for 2016 and ranks 26th in value per hectare of production (Table 10). However, the variability in value among municipalities is also low (standard deviation = 1.14), implying that the risks and markets for production of wheat are more stable (Harwood, Heifner, Coble, Perry, & Somwaru, 1999). In contrast, potatoes (Solanum tuberosum) are ranked 5th in value per hectare, but with larger variability (standard deviation = 42.05). Value per hectare is highest among fresh vegetable and specialty crops (including potatoes), which also had greater value variability, perhaps because these crops often require higher overhead (e.g. maintenance of screen-houses), and greater risks (Popp & Rudstrom, 2000). Additional research and stakeholder discussion are needed to identify target levels of crop diversity that achieve acceptable risk while improving economic resilience throughout the landscape.
In the Yaqui Valley, risk of catastrophe can be interpreted as risk to agricultural productivity, which is related to high temperatures during the early growing season that can dramatically reduce wheat yields (Prasad, Pisipati, Ristic, Bukovnik, & Fritz, 2008). Therefore, local trends in global warming could destabilize wheat production, which is the economic basis of the DRRY agriculture. The advantage of using crop diversity as a proxy for crop-related economic risk is that data on production and value by crop are likely to exist at local and regional scales as a matter of course, although this information may not be archived in a national or international repository; so accessibility may rely on local contacts.

115
Table 10. Agricultural production from the top 25 crops for 2016 by area, and market values for the Yaqui Valley (based on data available from Mexico’s Servicio de Información Agroalimentaria y Pesquera). Reported totals apply to entire municipalities of Bácum, Benito Juárez, Cajeme, Etchojoa, Navojoa, and San Ignacio Río Muerto, including some areas outside of DRRY. Average (and standard deviations) of municipality yields and market values are list by crop. Scientific names were added according to FAO (2005).
2016 Crop Total harvest (ha)
Average yield
(ton/ha) ^
Average value (pesos/ha) ^
Rank by
harvest area
Rank by
value
Wheat (Triticum aestivum), grain
221022 6.6 0.4 23833 1.1 1 26
Soybean (Glycine max), grain
48957 2.2 0.2 15100 1.2 2 33
Safflower (Carthamus tinctorius)
24797 2.6 0.2 17144 2.2 3 31
Corn (Zea mays), grain 20061 7.5 1.0 24040 3.9 4 25
Potato (Solanum tuberosum)
7783 33.1 1.8 218271 42.0 5 4
Wheat, seed 6229 6.3 0.2 39073 3.1 6 22
Bean (Phaseolus vulgaris) 5100 1.4 0.3 19563 2.9 7 29
Sorghum (Sorghum bicolor), grain
4352 5.6 0.8 21110 3.1 8 28
Chickpea (Cicer arietinum), grain
3370 2.4 0.1 32776 3.7 9 24
Soybean, seed 3300 2.3 . 22475 . 10 27
Green chile (Capsicum spp. (annuum))
1974 28.8 16.4 201492 134.1 11 6
Zucchini (Curcurbita spp.) 1526 17.1 3.9 120797 33.0 12 13
Red tomato (Lycopersicon esculentum)
1185 82.6 30.0 494484 195.1 13 2
Green tomato (Lycopersicon esculentum)
827 18.7 3.4 80287 34.2 14 16
Corn, cob 575 11.9 2.1 41307 14.4 15 21
Watermelon (Citrullus lanatus)
556 42.2 0.3 118657 3.4 16 14
Cotton (Gossypium spp.), on the seed
420 4.0 0.5 46498 8.9 17 20
Onion (Allium cepa) 393 37.1 5.2 150755 8.6 18 8
Cucumber (Cucumis sativus)
363 132.6 44.3 610828 233.1 19 1
Broccoli (Brassica oleracea var. italica)
292 19.3 . 160875 . 20 7

116
Table 10, Continued.
2016 Crop Total harvest
(ha)
Average yield
(ton/ha) ^
Average value (pesos/ha) ^
Rank by harvest
area
Rank by
value
Lettuce (Lactuca sativa) 282 28.6 3.3 138472 19.3 21 11
Sorghum, seed 155 5.0 . 17820 . 22 30
Pastures and grasslands 130 17.9 11.4 11888 7.3 23 35
Brussels sprouts (Brassica oleracea var. gemmifera)
89 18.0 . 206600 . 24 5
Sunflower (Helianthus annuus)
80 1.9 . 15620 . 25 32
^ standard deviation of up to six reporting municipal subunits of the DRRY; not available for crops reported from only one municipality.

117
Figure 16. Two-thirds of crop production by area in the Yaqui valley is dominated by winter wheat, but several other crops are grown in the DRRY.

118
Figure 17. According to records obtained from a local crop health agency (Junta Local de Sanidad Vegetal del Valle del Yaqui), many types of crops were grown in DRRY during 2017 though as a very small proportion relative to wheat in terms of hectares. Crops grown on less than 20 ha are not shown.

119
Conclusions
This study identified accessible information that can be used for assessment of several sustainability themes for the Yaqui Valley, Mexico, within environmental, social, and economic dimensions. These themes and dimensions are important for an integrated landscape perspective of agricultural sustainability (described in Chapter 1) that relates to key concerns of participating stakeholders (Chapter 2). The assessed indicator values focused on annual or seasonal data from 2015-2017 and are discussed relative to baseline (historical) or target (desired future) indicator values (Table 11).
Information available and analyzed for environmental indicators of sustainability in the Yaqui Valley landscape assessment includes soil type, productivity, and conserved habitat. Results of this analysis suggest that there is an opportunity for improvement of soils through conservation agriculture techniques especially on soils at risk for compaction and salinization. Productivity throughout the DRRY, as indicated by NDVI, has been maintained at a high level during the past 18 years with a few exceptions during drought years. Future efforts toward sustainability should focus on water and nutrient efficiency improvements for maintaining yields. Conserved habitat is absent, and natural, perennial habitat within the DRRY is extremely low. Beyond the increased aesthetic value from native flora desired by stakeholders, the lack of perennial vegetation could limit efforts to support organisms that are beneficial to crops (e.g., animals such as arthropods, pollinators, pest predators, and plants that provide habitat or refugia to those animals). There may be an opportunity to develop corridors of native plants along certain types of field margins and canals, although concerns of water flow management and water use must be addressed.
Indicators of social sustainability considered in this study include indices for environmental, social, and economic vulnerability related to climate change, as well as poverty, and transparency. Analysis of these indices suggests that reducing environmental vulnerability should be a priority valley-wide. Social and economic vulnerability is lower and can be maintained for most, or improved for some, of the DRRY population. Rural residents of the valley face challenges related to poverty, although poverty is severe for only a small part of the population. It is likely that the index used here may underestimate rural poverty because it is taken from municipal data, which include wealthier city residents.
Information and thus analysis for indicators in the economic dimension was limited. Economic sustainability for the Yaqui Valley may be at considerable risk from potential crop failure, especially of wheat under drought or high temperature conditions. This risk could be reduced by increasing cropping diversity, in particular, by focusing on planting more fields to high value-per-hectare crops, and crops that are tolerant to soil salinity, drought, and warmer temperatures. Making sure that crop insurance is available for wheat as well as high-value specialty crops may encourage farmers to increase diversity of the cropping system and reduce the economic risk associated with catastrophic crop loss.

120
Table 11. Assessed values for indicators of sustainability in the Yaqui Valley landscape are shown relative to baseline and target values, where available.
Indicator Baseline (year)
Assessed Value (year)
Target
Soils at risk for compaction or salinization (ha)
n/a 71,992 ha* 34,897 in ejido land
n/a
Mean peak winter-crop NDVI (unitless)
0.653 (mean 2003-2015)
0.733 (2016) 0.8
Protected habitat (ha) unknown 0 (2016) > 1; unknown^
Social Vulnerability (% of population at best rating)
unknown 57.3 (2015) 100
Environmental Vulnerability (% of population at best rating)
unknown 0 (2015) 100
Economic Vulnerability (% of population at best rating)
unknown 71.2 (2015) 100
Social lag (poverty) (% of population at best rating)
80.9 (2000) 42.7 (2015) 100
Transparency (%) 35 (2014) 29 (2017) 100
ECNSha (unitless) 3.8 (2006) 4.1 (2017) > 4.1#
ECNS: Effective number of crop species by ha * equivalent to about 33% of DRRY ^ 4,400 ha is equivalent to 2% of the DRRY # For example, similar climate and irrigation regime of southern California has ENCS of 12

121
Additional data are needed to more fully address sustainability concerns identified with Yaqui Valley stakeholders (Chapter 2). We were unable to access data on reservoir volume and irrigation releases, a key issue in this desert landscape. The Valley’s contribution to, and effects from, global climate change are concerns recognized by farmers, business people, local researchers, and other Yaqui Valley stakeholders. A model for determining GHG emission potential at a suitable scale for Yaqui Valley was not identified, though field- and canal-focused research has been completed in Yaqui (Matson, 2012). Likewise, no suitable information was available to estimate fossil energy dependence, which is linked to social, environmental, and economic priority themes including air quality and health, GHG emissions, and crop production costs. Data related to pesticide use via a container collection program were not yet available but could help address priorities related to reducing negative health impacts associated with pesticide exposure. The proxies used for assessing social sustainability in the Yaqui Valley do not effectively address goals related to improving gender and educational equity that were discussed during stakeholder workshops (Chapter 2).
To continue the assessment process, stakeholder workshops could be organized to obtain feedback on these preliminary results, identify resources to fill gaps in indicator data, and agree upon target values for several indicators. Ideally, local agricultural outreach professionals would help stakeholders identify management practices that address areas of continued concern. With further discussion, it is likely that additional or different indicators will be deemed appropriate. Regardless of changes to data availability and assessment results, the process of engaging with sustainability issues throughout the Yaqui Valley landscape is likely to lead to greater capacity for decision-making to achieve sustainability goals for the landscape, which is an important purpose of assessments.
This assessment illustrates the potential usefulness of accessible information as indicators of sustainability for agricultural landscapes. The advantage of this approach is that it can be generalized to diverse landscapes in a variety of development contexts. The assessment process generated information and discussion that may help stakeholders consider agricultural management decisions in view of broader community and landscape goals. An assessment involving additional indicators, finer resolution of data, or site-specific measurements would have increased costs and time requirements. It would be helpful to further test the assessment process in a landscape having limited historical or national statistical data in order to identify whether or not the reliance on public data prohibits application of the agricultural sustainability assessment framework in diverse development contexts.

122
References
Addams, C. L. (2004). Water resource policy evaluation using a combined hydrologic-economic-agronomic modeling framework: Yaqui Valley, Sonora, Mexico. Stanford University.
Aguilar, J., Gramig, G. G., Hendrickson, J. R., Archer, D. W., Forcella, F., & Liebig, M. A. (2015). Crop species diversity changes in the United States: 1978-2012. PLoS ONE, 10(8), 1–14. https://doi.org/10.1371/journal.pone.0136580
Ahrens, T. D. (2009). Improving regional nitrogen use efficiency: Opportunities and constraints. Stanford University.
Asbjornsen, H., Hernandez-Santana, V., Liebman, M., Bayala, J., Chen, J., Helmers, M., … Schulte, L. A. (2014). Targeting perennial vegetation in agricultural landscapes for enhancing ecosystem services. Renewable Agriculture and Food Systems, 29(2), 101–125. https://doi.org/10.1017/S1742170512000385
Avalos, S. B. (1997). Modeling nitrogen fertilization practices of wheat farmers in Mexico’s Yaqui Valley. Stanford University.
Becker-Reshef, I., Vermote, E., Lindeman, M., & Justice, C. (2010). Remote Sensing of Environment A generalized regression-based model for forecasting winter wheat yields in Kansas and Ukraine using MODIS data. Remote Sensing of Environment, 114(6), 1312–1323. https://doi.org/10.1016/j.rse.2010.01.010
Beman, M. J. (2006). The microbial biogeochemistry of nitrogen in the coastal ocean: Interactions at the interface of the Yaqui valley-gulf of California, Mexico. Stanford University.
CONEVAL. (2016). Índice de Rezago Social 2015: Presentación de resultados. Daughtry, C. S. T., Doraiswamy, P. C., Hunt, E. R., Stern, A. J., McMurtrey, J. E.,
& Prueger, J. H. (2006). Remote sensing of crop residue cover and soil tillage intensity. Soil and Tillage Research, 91(1–2), 101–108. https://doi.org/10.1016/J.STILL.2005.11.013
de Groot, R. S., Wilson, M. A., & Boumans, R. M. J. (2002). A typology for the classification, description and valuation of ecosystem functions, goods and services. Ecological Economics, 41(3), 393–408. https://doi.org/10.1016/S0921-8009(02)00089-7
FAO. (2005). A system of integrated agricultural censuses and surveys Volume 1 -Revised reprint. Appendix 4. Alphabetical list of crops with botanical name and crop code. World Programme for the Census of Agriculture 2010.
Fuentes, M., Hidalgo, C., Etchevers, J., de León, F., Guerrero, A., Dendooven, L., … Govaerts, B. (2012). Conservation agriculture, increased organic carbon in the top-soil macro-aggregates and reduced soil CO 2 emissions. Plant and Soil, 355(1–2), 183–197. https://doi.org/10.1007/s11104-011-1092-4
Gasparatos, A., & Scolobig, A. (2012). Choosing the most appropriate sustainability assessment tool. Ecological Economics, 80, 1–7.

123
https://doi.org/10.1016/j.ecolecon.2012.05.005 Gotelli, N. J., & Chao, A. (2013). Measuring and Estimating Species Richness,
Species Diversity, and Biotic Similarity from Sampling Data. Encyclopedia of Biodiversity (Vol. 5). Elsevier Ltd. https://doi.org/10.1016/B978-0-12-384719-5.00424-X
Govaerts, B., Sayre, K. D., & Deckers, J. (2006). A minimum data set for soil quality assessment of wheat and maize cropping in the highlands of Mexico. Soil and Tillage Research, 87(2), 163–174. https://doi.org/10.1016/j.still.2005.03.005
Groot, J. C. J., Jellema, A., & Rossing, W. A. H. (2007). Exploring Trade-offs Among Environmental Services to Support Landscape Planning. In Modsim 2007: International Congress on Modelling and Simulation: Land, Water and Environmental Management: Integrated Systems for Sustainability (pp. 2203–2208).
Hamza, M. A., & Anderson, W. K. (2005). Soil compaction in cropping systems: A review of the nature, causes and possible solutions. Soil and Tillage Research, 82(2), 121–145. https://doi.org/https://doi.org/10.1016/j.still.2004.08.009
Harrison, J. A. (2003). Nitrogen dynamics and greenhouse gas production in Yaqui Valley surface drainage waters. Stanford University.
Harwood, J., Heifner, R., Coble, K., Perry, J., & Somwaru, A. (1999). Measuring price and yield risk. In Managing risk in farming: concepts, research, and analysis. Agricultural Economics Report No. 774. Washington DC: USDA, Economic Reserach Service.
ISPC: Independent Science and Partnership Council. (2014). Data , metrics and monitoring in CGIAR – a strategic study. Rome, Italy.
Kienast, F., Bolliger, J., Potschin, M., De Groot, R. S., Verburg, P. H., Heller, I., … Haines-Young, R. (2009). Assessing landscape functions with broad-scale environmental data: Insights gained from a prototype development for Europe. Environmental Management, 44(6), 1099–1120. https://doi.org/10.1007/s00267-009-9384-7
Lobell, D. B. (2005). A remote sensing approach to understand controls on cropland productivity. Stanford University.
Lobell, D. B., Asner, G. P., Ortiz-Monasterio, J. I., & Benning, T. L. (2003). Remote sensing of regional crop production in the Yaqui Valley, Mexico: Estimates and uncertainties. Agriculture, Ecosystems and Environment, 94(2), 205–220. https://doi.org/10.1016/S0167-8809(02)00021-X
Lobell, D. B., Ortiz-Monasterio, J. I., Addams, C. L., & Asner, G. P. (2002). Soil, climate, and management impacts on regional wheat productivity in Mexico from remote sensing. Agricultural and Forest Meteorology, 114(1–2), 31–43. https://doi.org/10.1016/S0168-1923(02)00138-7
Lobell, D. B., Thau, D., Seifert, C., Engle, E., & Little, B. (2015). A scalable satellite-based crop yield mapper. Remote Sensing of Environment, 164, 324–333. https://doi.org/10.1016/j.rse.2015.04.021

124
Luers, A. L. (2003). From theory to practice: Vulnerability analysis in the Yaqui Valley region of Southern Sonora, Mexico. Stanford University.
Luers, A. L., Lobell, D. B., Sklar, L. S., Addams, C. L., & Matson, P. A. (2003). A method for quantifying vulnerability, applied to the agricultural system of the Yaqui Valley, Mexico. Global Environmental Change, 13(4), 255–267. https://doi.org/10.1016/S0959-3780(03)00054-2
Marchand, F., Debruyne, L., Triste, L., Gerrard, C., Padel, S., & Lauwers, L. (2014). Key characteristics for tool choice in indicator-based sustainability assessment at farm level. Ecology and Society, 19(3). https://doi.org/10.5751/ES-06876-190346
Matson, P. A. (2012). Seeds of sustainability: lessons from the birthplace of the Green Revolution. (P. A. Matson, Ed.) (1st ed. .). Washington, D.C.: Island Press.
Ness, B., Urbel-Piirsalu, E., Anderberg, S., & Olsson, L. (2007). Categorising tools for sustainability assessment. Ecological Economics, 60(3), 498–508. https://doi.org/10.1016/j.ecolecon.2006.07.023
Ortiz, R., Sayre, K. D., Govaerts, B., Gupta, R., Subbarao, G. V., Ban, T., … Reynolds, M. (2008). Climate change: Can wheat beat the heat? Agriculture, Ecosystems and Environment, 126(1–2), 46–58. https://doi.org/10.1016/j.agee.2008.01.019
Parry, M. L., & Intergovernmental Panel on Climate Change Working Group II. (2007). Climate Change 2007: impacts, adaptation and vulnerability: contribution of Working Group II to the Fourth Assessment Report of the Intergovernmental Panel on Climate Change. Cambridge, U.K. ; New York: Cambridge, U.K. ; New York : Cambridge University Press.
Popp, M., & Rudstrom, M. (2000). Crop enterprise diversification and specialty crops. Agricultural Finance Review, 60(May 2000), 85–98. https://doi.org/10.1108/00214710080001112
Prasad, P. V. V, Pisipati, S. R., Ristic, Z., Bukovnik, U., & Fritz, A. K. (2008). Impact of Nighttime Temperature on Physiology and Growth of Spring Wheat. Crop Science, 48, 2372–2380. https://doi.org/10.2135/cropsci2007.12.0717
Preston, B. L., Abbs, D., Beveridge, B., Brooke, C., Gorddard, R., Hunt, G., … McInnes, K. (2007). Spatial approaches for assessing vulnerability and consequences in climate change assessments. In In Proceedings of MODSIM 2007: International Congress on Modelling and Simulation. Christchurch, NZ: Modelling and Simulation Society of Australia and New Zealand.
Renetzeder, C., Schindler, S., Peterseil, J., Prinz, M. A., Mücher, S., & Wrbka, T. (2010). Can we measure ecological sustainability? Landscape pattern as an indicator for naturalness and land use intensity at regional, national and European level. Ecological Indicators, 10(1), 39–48. https://doi.org/10.1016/j.ecolind.2009.03.017
Rivers, A., Barbercheck, M., Govaerts, B., & Verhulst, N. (2016). Conservation

125
agriculture affects arthropod community composition in a rainfed maize-wheat system in central Mexico. Applied Soil Ecology, 100, 81–90. https://doi.org/10.1016/j.apsoil.2015.12.004
Sattler, C., Nagel, U. J., Werner, A., & Zander, P. (2010). Integrated assessment of agricultural production practices to enhance sustainable development in agricultural landscapes. Ecological Indicators, 10(1), 49–61. https://doi.org/10.1016/j.ecolind.2009.02.014
Scott, J. M., Davis, F. W., McGhie, R. G., Wright, R. G., Groves, C., & Estes, J. (2001). Nature reserves: Do they capture the full range of America’s biological diversity? Ecological Applications, 11(4), 999–1007. https://doi.org/10.1890/1051-0761(2001)011[0999:NRDTCT]2.0.CO;2
Silleos, N. G., Alexandridis, T. K., Gitas, I. Z., & Perakis, K. (2006). Vegetation indices: Advances made in biomass estimation and vegetation monitoring in the last 30 years. Geocarto International, 21(4), 21–28. https://doi.org/10.1080/10106040608542399
Skakun, S., Vermote, E., Roger, J.-C., & Franch, B. (2017). Combined Use of Landsat-8 and Sentinel-2A Images for Winter Crop Mapping and Winter Wheat Yield Assessment at Regional Scale. AIMS Geosciences, 3(2), 163–186. https://doi.org/10.3934/geosci.2017.2.163
Soule, M. J., Tegene, A., & Wiebe, K. D. (2000). Agricultural & Applied Economics Association Land Tenure and the Adoption of Conservation Practices. American Journal of Agricultural Economics, 82(4), 993–1005.
Transparency International. (2017). Corruption Perceptions Index. Retrieved February 1, 2018, from www.transparency.org
Tscharntke, T., Steffan-Dewenter, I., Kruess, A., & Thies, C. (2002). Contribution of small habitat fragments to conservation of insect communities of grassland–cropland landscapes. Ecological Applications, 12(2), 354–363.
USDA ARS. (2015). Relative salt tolerance of herbaceous crops. Retrieved February 17, 2018, from www.ussl.ars.usda.gov/saltt42.aspx
van Zanten, B. T., Verburg, P. H., Espinosa, M., Gomez-y-Paloma, S., Galimberti, G., Kantelhardt, J., … Viaggi, D. (2014). European agricultural landscapes, common agricultural policy and ecosystem services: a review. Agronomy for Sustainable Development, 34(2), 309–325. https://doi.org/10.1007/s13593-013-0183-4
Verhulst, N., Kienle, F., Sayre, K. D., Deckers, J., Raes, D., Limon-Ortega, A., … Govaerts, B. (2011). Soil quality as affected by tillage-residue management in a wheat-maize irrigated bed planting system. Plant and Soil, 340(1), 453–466. https://doi.org/10.1007/s11104-010-0618-5
Watts, J. D., Lawrence, R. L., Miller, P. R., & Montagne, C. (2009). Monitoring of cropland practices for carbon sequestration purposes in north central Montana by Landsat remote sensing. Remote Sensing of Environment, 113(9), 1843–1852. https://doi.org/10.1016/J.RSE.2009.04.015

126
CHAPTER IV STATE OF APPS TARGETING MANAGEMENT FOR
SUSTAINABLE AGRICULTURAL LANDSCAPES

127
A version of this chapter was originally prepared for submission for publication by Sarah Eichler Inwood and others:
Eichler Inwood, Sarah E. and Virginia H. Dale. (submitted March 2018). “State of apps targeting management for sustainable agricultural landscapes.” Agronomy for Sustainable Development.
Sarah Eichler Inwood completed the primary review of literature and analysis of results, created figures and tables, prepared the initial manuscript and coordinated revisions. Virginia Dale contributed to design of the research objective as well as significant text and organizational edits. It has been revised from the journal submission in order to fit formatting requirements.
Abstract
The triple-bottom-line approach to sustainability in agriculture requires multi- and inter-disciplinary expertise and remains a major design and implementation challenge. Tools are needed to link extension agents, development workers, farmers, and other agriculture decision-makers to information related to practices that improve sustainability across agricultural landscapes. The digital age has brought many new cloud-based and mobile device accessible software applications (apps) targeted at farmers and others in the agriculture sector, however the effectiveness of these tools for advancing sustainability goals is unknown. Here we review apps for agriculture in order to identify gaps in information provisioning in tools to connect decision-makers to knowledge in support of sustainable agricultural landscapes. The major findings are 1) Agricultural apps can be categorized as supporting regulatory compliance, equipment optimization, farming simulator games, information management, agronomic reference information, product tracking, pest identification, emissions accounting, or benchmarks for marketing claims. 2) Many apps are developed to link specific products for single solutions, such as GPS-guided crop implementation or sensors within internet-of-things connectivity. 3) While pilots, prototypes, and case studies are available in both Apple and Android digital markets, public mobile apps to improve multidirectional agriculture knowledge exchange are limited and poorly documented. 4) There remains a need for apps emphasizing knowledge exchange and resource discovery rather than simply information delivery, to help farmers identify evidence-based practices that improve indicators of sustainability. 5) Development of a digital decision support tool requires early interactions with targeted end users to clarify app performance objectives and social networking preferences, ensure reliability of scientific input and business management plans, and optimize the user experience.
Introduction
Agricultural sustainability is an aspiration that challenges practitioners and researchers to consider farming effects on ecosystems and communities while also advancing food and energy security, clean abundant water, healthy

128
productive soils, and other benefits to socioeconomic and environmental systems (Brundtland 1987; Pretty 2008; Wu 2013; Pretty and Bharucha 2014). Sustainable agricultural landscapes can be defined as those areas that provide ecosystem services supporting productive and economically profitable agriculture (including forestry and fisheries) and resilient, healthy, and just societies (Dale et al. 2013; Kumaraswamy and Kunte 2013). Goals for achieving greater sustainability should be identified by stakeholders through an iterative and engaged process that addresses needs in key thematic areas such as water, soil, and air quality; biodiversity, climate change, social well-being, equity, education, energy security, trade, employment, profit, and land tenure (Eichler Inwood, López Ridaura, et al. under review). Contextual goals therefore will differ depending on stakeholders’ values and resources. Applying a landscape perspective when assessing agricultural systems can highlight co-benefits and tradeoffs between management choices within social, economic, and environmental goals for agro-ecosystems at spatial and temporal scales that are relevant to farms and regions (Gerdessen and Pascucci, 2013; López-Ridaura, Masera, and Astier, 2002; Schader et al., 2016; Eichler Inwood, López Ridaura et al., under review). This so called “triple-bottom-line” approach gives equal importance to people, profit, and planet (Elkington 1997), and requires multi- and inter-disciplinary expertise. Thus it remains a major challenge in sustainability science.
Tools are needed to link extension agents, development workers, farmers, and other agriculture decision-makers to information related to practices that improve sustainability across landscapes in an adaptive management strategy. The digital age has brought many cloud-based and mobile device accessible software applications (apps) targeted at farmers and others in the agriculture sector. These apps span from equipment use guidelines, to satellite navigation support for machinery, and pest or nutrient management to business recordkeeping tools, and are available in diverse locations (Figure 18). Specific examples are discussed below.
Farmers with internet access face an information overload from digital decision support systems or tools (henceforth referred to as decision support tool) that could support on-farm management decisions (Rose et al. 2016; Schröer-Merker et al. 2016). Limited reviews of agriculture mobile tools are available (Karetsos et al. 2014; Costopoulou et al. 2016; Patel and Patel 2016; Schröer-Merker et al. 2016; Xin and Zazueta 2016) but generally focus on a specific geographic region, farm system, and/or agronomic issue. Any list of apps is everchanging as new products are released or updated, while others become obsolete. Many apps are tools for reference and record-keeping and are not explicitly decision support tools. Data that are relevant to agriculture may be available for large geographic areas and must be filtered for local relevance, for example precipitation forecasts by state or region. Other tools may supply information related to individual crops, such as commodity prices and pest

129
Figure 18. Milpa-- the ancient system of intercropping maize, bean, and other vegetables --grows beneath modern cellular towers on steep slopes in the Guatemala highland town of Todos Santos. Digital decision support tools could help development workers and farmers address environmental, social, and economic concerns in the landscape through knowledge sharing on locally effective practices that, for example, increase soil organic matter and prevent erosion, improve educational equity by reducing labor burdens on women and youth, diversify marketable products to local, national, and international consumers, and reduce post-harvest storage losses.

130
reports for grain corn. Many apps are focused on internet-of-things connectivity which refers to the network of physical objects—devices, vehicles, buildings and other items—embedded with electronics, software, sensors, and network connectivity that enables these objects to collect and exchange data. Much of the mobile-accessible agricultural information is directed toward field- or farm-level diagnostics and decisions, while very little information is provided that explicitly links farms to broader landscape and community knowledge bases (Figure 19). It is difficult to address the spatial variability of agricultural landscapes, in part, because applications designed for field-level management are not easily expanded to broader spatial scales. Key crop management decisions are often made just a few times per cropping cycle, so farmers need tools that can help them collect and process up-to-date, contextually appropriate information on both bio-physical conditions (such as what to plant, when to fertilize) as well as local socio-economic concerns (e.g., determining if an activity is profitable and thereby facilitates employee management and marketing).
There is an opportunity for community learning through low-cost apps that incorporate geo-physical databases with crowd-sourced agricultural information and social-networking (Bruce 2016). New technology alone is insufficient for successful adaptation in agriculture (Hellin and López Ridaura 2016), but an app could facilitate connecting people to knowledge that leads to greater capacity for decision making. A decision support tool that shows regionally-appropriate methods for soil improvement and relative costs, for example, could link farmers to local extension personnel as a means to enhance training and material resources. Such a ‘bottom-up’ approach could encourage farmers’ ownership of technology decisions and increase successful adoption of practices that improve sustainability.
The purpose of this paper is to examine the state of smartphone or mobile device accessible apps for agriculture in order to identify gaps in information provisioning in decision support tools that connect policy-makers, extension agents, farmers, and other decision-makers to local, regional, and global knowledge in support of sustainable agricultural landscapes. We present categories of functionality for agriculture-targeted apps and review a sampling of decision support tools that provide information for farm management related to sustainability knowledge sharing. We discuss opportunities for apps that supply integrated data that are relevant to decisions affecting landscape sustainability within environmental, social, and economic dimensions of agriculture.
Approach
This analysis is based on a review of published literature pertaining to apps for enhancing sustainability of agricultural landscapes. We searched the Web of Science for peer-reviewed publications related to apps for improving sustainability in agriculture using the following terms: smartphone or mobile application and agriculture or sustainability or ecosystem; smartphone and sustainable agriculture or ecology; smart farming and sustainability; agriculture
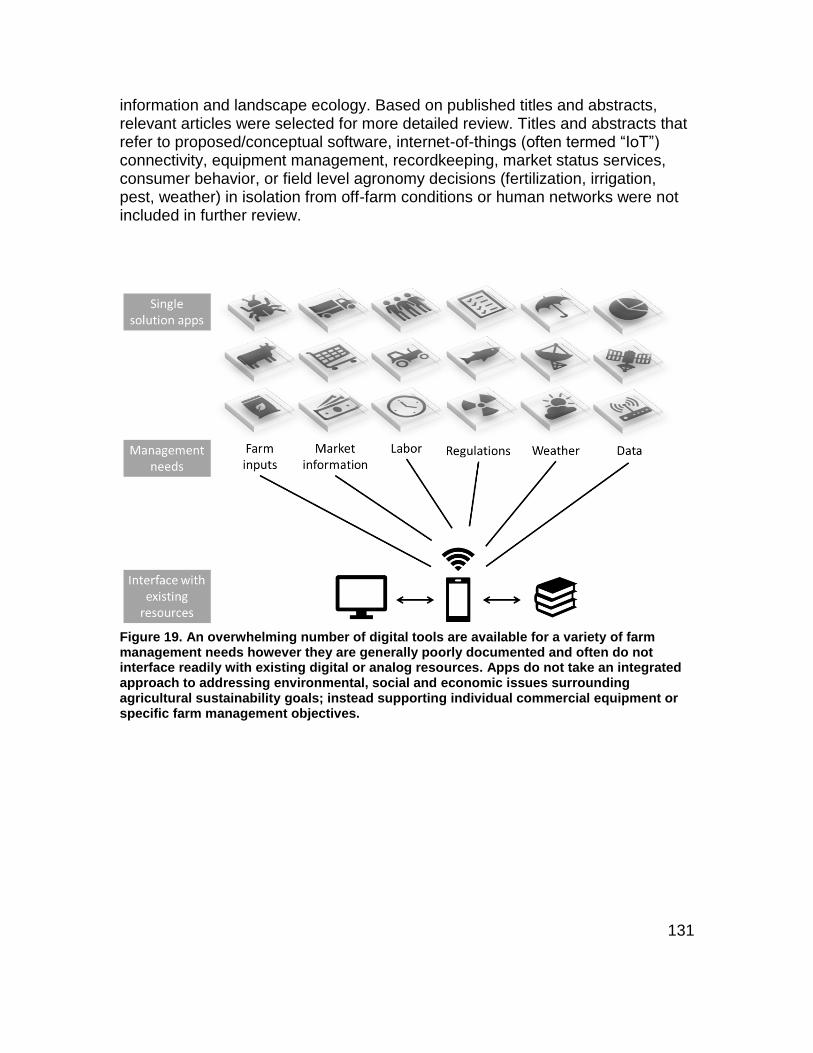
131
information and landscape ecology. Based on published titles and abstracts, relevant articles were selected for more detailed review. Titles and abstracts that refer to proposed/conceptual software, internet-of-things (often termed “IoT”) connectivity, equipment management, recordkeeping, market status services, consumer behavior, or field level agronomy decisions (fertilization, irrigation, pest, weather) in isolation from off-farm conditions or human networks were not included in further review.
Figure 19. An overwhelming number of digital tools are available for a variety of farm management needs however they are generally poorly documented and often do not interface readily with existing digital or analog resources. Apps do not take an integrated approach to addressing environmental, social and economic issues surrounding agricultural sustainability goals; instead supporting individual commercial equipment or specific farm management objectives.

132
Additional English language apps were identified by searching the iOS Apps Store (available at itunes.apple.com) and the Android Apps on Google Play (available at play.google.com/store) for products related to sustainable agriculture, agriculture sustainability, landscape sustainability, or sustainable food. These searches were repeated within a third-party website for Apple app searches (theappstore.org). A detailed search within Android products was not reproducible, therefore when multiple apps by the same name were found in Android, a cross-reference to iOS apps was sought. If no further information for the app was available through a web or developer link, we dismissed the app from further analysis. We surveyed the app’s title, tags, and public-facing English description of functionality to broadly categorize the apps and select specific apps that potentially relate to agricultural landscape sustainability improvement efforts. The following types of apps were excluded from detailed review: games or farming simulators, record keeping or business management tools, equipment management/optimization, Global Positioning System (GPS) guidance, sensor connectivity for internet-of-things, retail product information, agriculture product tracking, digital reference tools including pest identification and spray calculators, home landscape design, and consumer food sourcing. Relevant publications and publicly available apps were reviewed to examine the current state of apps for agriculture that can provide information supporting management for sustainable landscapes.
State of the art: Apps for sustainability in agriculture
Agricultural apps can be categorized generally as those software applications that support regulatory compliance, equipment optimization, farming simulator games, information management, agronomy references, product tracking, pest identification, emissions accounting, or benchmarks for marketing compliance claims (Table 12). Many apps are developed to link specific products such as GPS-guided crop implements or soil moisture sensors within internet-of-things (e.g. AgSense, Fasal), oftentimes to web, cloud, or desktop software tools. Others are geared at food product security, for example individual animal (The Cattle Tags App, SmartOysters) or produce batch (CropTracker) tracking devices. Some of these programs are designed for field or farm-level agronomy reference or decision support, especially for nutrient (The Nitrogen Index, AgPhD, Crop Nutrient Calculator), pest (Plantwise, Plantix, Smart Scout, Veg Pest ID), spray applications (Pocket Spray Smart), and water management (SmartRain, CropX, FarmConnect, IrriFresa). There are a growing number of mobile networking tools that connect farmers to equipment (e.g. Trringo, HelloTractor), markets (e.g. FarmFutures, AgriMarket, Agri Marketplace), or agronomic resources (iCow, Digital Inputs Financing Toolkit by AGRA). Potential exists for apps related to ethical and sustainable consumption (Seafood Watch, Seasonal Food Guide) which may influence producer decisions (Nghiem and Carrasco 2016), but these approaches do not explicitly involve farmer to farmer knowledge exchange.

133
Table 12. Common categories of software tools for agriculture including example programs.
Tool purpose Example tool (developer)
Theme Platform Target audience
Regulatory compliance
MMP360 (AgSolver)
Water resource protection, manure management
Web Farm manager (livestock), Iowa, USA
Equipment optimization
John Deere App Center (John Deere)
Manufacturer to consumer instruction
Mobile Equipment operators, global
Information management
Agriculture Survey App (Fulcrum)
Digital recordkeeping, data collection, sharing
Web, Mobile Farm manager, assessors, global
Agronomy, profitability
Profit Zone Manager (AgSolver)
Scenario comparisons; field management, profitability calculator
Cloud-based data processing
Farm manager, crops integrating GPS based precision systems, USA
Agronomy, information
Climate FieldView (The Climate Corporation, Monsanto)
Data management; climate/ weather, field management
Mobile Farm manager, yield prediction and fertilization timing for crops, USA, Canada, Brazil
Agronomy, sensed data
GreenSeeker (Trimble)
remote or micro sensed biological data for crop management
Web Farm manager (crops), global
Product tracking
The Cattle Tags App (Cattlesoft, Inc.)
RFID management of livestock
Mobile (iOS) Farm manager (livestock), global
Pest identification
Plantix (PEAT) Diagnosis and treatments for plants using machine learning
Mobile (Android)
Gardeners, farmers, extension agents, global
Emissions accounting
Farm Carbon Calculator (Farm Carbon Cutting Toolkit)
Life cycle analysis approach for farm practices to cut costs and carbon footprint
Web Farmers, UK
Benchmark, marketing compliance claims
FieldPrint Calculator (Field to Market)
Supply chain sustainability assessment, field/ farm/ watershed; downstream manufacturing
Web Production manager, marketing, (commodity crops) USA

134
Nearly all of the apps we found can be characterized as “single solution” approaches that provide limited data to improve one specific aspect of efficiency – and often sustainability—but they are not effectively designed to integrate sustainability concerns from multiple dimensions or themes of indicators for sustainable agricultural landscapes (Eichler Inwood, López Ridaura, et al., under review). The few “sustainability”-tagged apps uncovered in our search generally emphasize environmental or economic issues in agriculture using a farm business management or consumer perspective. We did not identify an app that links end-users such as farmers, extension personnel, resource managers, or policy-makers with information that relates to landscape sustainability concerns across environmental, social, and economic dimensions although below we discuss other types of software that attempt to do so.
Many of the peer-reviewed reports on apps related to sustainable agriculture or agricultural efficiency consist of technical descriptions and case studies for individual software programs, primarily for sensors (Wu, Zhou, Wang, & Cai, 2016), internet-of-things (Jayaraman et al. 2016; Krintz et al. 2016; González Perea et al. 2017), GPS and/or GIS (De Filippis et al. 2013; Yu et al. 2017), marketing (Sevenster et al. 2014; Aker 2016; Nghiem and Carrasco 2016), or agronomic reference (Delgado et al. 2013; Schröer-Merker et al. 2016). Many Web of Science citations are from conference proceedings and present concepts for use of apps in agriculture rather than available and functioning apps, indicating that the topic of apps in agriculture is both recent and of broadly growing interest. We identified additional references for sustainability-related software –mobile and web-based– for example, invasive species reporting (Wallace et al. 2016), resource management (Ochola and Kerkides 2004; Fegraus et al. 2012; De Sousa et al. 2015; Quaranta and Salvia 2017), residential property management (Wickliffe et al. 2016), and remote sensing (Tripicchio et al. 2015; Xin and Zazueta 2016).
The iOS apps (largely in English language) returned from the search were categorized as farming simulators (games), equipment operation tools including GPS and irrigation management, agriculture news or market subscriptions, interactive reference documents, or recordkeeping or business management tools. We identified several iOS programs for agronomic decision making, and these were often related to nutrient or water management for fields. A much larger, similarly-categorized selection of programs was found in the Android Apps store, though a wider variety of languages was available than in the Apple Store. It is important to note that apps within the virtual stores are not cataloged and thus cannot be searched with the same reproducibility as a reference library. Therefore, we do not consider this an exhaustive review, and it is possible that some apps escaped our notice despite multiple searches, keyword combinations, and use of third-party app listing tools. Furthermore, it is not possible to determine if an app is still being updated or supported, or if a new name or developer has taken over. The vast majority of apps we found do not have a

135
peer-reviewed publication, and many do not have an operational developer web link.
Although we did not uncover literature or app store items that explicitly describe integrated mobile apps related for agricultural landscape sustainability issues, there are some software tools (mostly web-based) related to information provisioning and community knowledge exchange in agriculture. Efforts to coordinate knowledge sharing around agricultural techniques are not new but are not yet a major presence in mobile-specific tools. For example, eXtension.org offers a web platform for sharing US Cooperative Extension Service products including live and recorded webinars on a wide variety of topics related to farms, energy, family, and environment but does not yet have a mobile app. WOCAT Knowledge for Sustainable Land Management (WOCAT SLM, iOS app) is a recent educational app that acts as a unidirectional digital reference. Its web portal however (wocat.net) is an established network that provides opportunities for interaction between academics, development agents, and land managers. WOCAT focuses on soil and water conservation, encompassing ecosystem issues from local to regional and national levels with a limited ability to address social and economic sustainability concerns for farmers. LandPKS consists of a web portal for sharing knowledge focused on soil, climate, and productivity expectations with modules being developed as individual apps that connect farmers facing similar land management opportunities and challenges (Herrick et al. 2016). Land PKS is working toward building a digitally linked network of users.
In contrast, Plantwise Knowledge Bank connects trained crop plant health extension workers with farmers through in-person, web, and tablet-based training systems for knowledge sharing. Although its outreach program is farm-focused, preliminary efforts are underway to explore how Plantwise farmer information requests (e.g., focused on a specific pest in a particular location) can be used to predict regional or landscape crop threats (Powell 2017). Plantwise is included with Global Open Data for Agriculture and Nutrition (GODAN), an effort launched in 2013 to address the lack of access to agriculture and nutrition across all actors in the food system (Powell 2017). A suite of Crop Specific Mobile Apps using Bluetooth technology among low-literacy rural smallholders in India shows high potential for new extension/outreach methods that train more farmers with lower costs (Castillo and Vosloo 2015). However its application to broader landscape sustainability concerns -- beyond improving regional average yields and thus farm household food security—is not clear and individual apps were not available for review. Camacho-Villa and others (2016) discuss the need for adaptive information systems such as Mexico’s MasAgro Hub framework in order to foster agriculture innovation in heterogeneous agro-environments via evolving, demand-driven, advisory services, including the use of Short Message Service (SMS) text alerts. Agroportal provides Greek farmers with a single access point for agriculture government and extension services and its in-development Android mobile platform facilitates chat and email communication between users and service providers (Karetsos et al. 2014). While pilots, prototypes, and case

136
studies are available, public mobile apps to improve multidirectional (i.e. information that can transfer both to and from the app) agriculture knowledge exchange are extremely limited, we describe five such programs in Table 13.
Social networking platforms have transformed the way we communicate. Not surprisingly we found some apps that provide social networking for agriculture, but these are focused on data sharing for business/project management (e.g., Agworld for iPhone) or food marketing (e.g. Foodshed) rather than on integrating environmental and socio-economic dimensions of sustainable agriculture. Bruce (2016) highlights the need for systems that combine formal scientific reporting and informal farmer knowledge networks based on social networking so that farmers can share “what works.” The CROPROTECT project is being developed to facilitate farmer and research information exchange through a web and mobile based digital extension network. There are apps that explicitly address social well-being related to food and agriculture through social networking. We categorized these as consumer education apps (LoGOFF, MilkCrate for Communities, DoneGood: Ethical Shopping App) rather than farmer or land manager knowledge sharing tools. We did not identify an app for social networking geared at exchanging knowledge about farmers’ resource discovery or practical agricultural techniques for improving sustainability indicators.
Furthermore, we did not find mobile apps that support integrated triple-bottom-line sustainability assessment support. It is possible that desktop or web-based assessment tools such as SAFA (Food and Agriculture Organization (FAO) and SAFA 2013), MESMIS (Speelman et al. 2007; Astier et al. 2011), SMART-Farm Tool (Schader et al. 2016) could be transferred to mobile platforms, but these tools are geared toward professional, trained assessors, rather than mobile users in general, and do not emphasize knowledge exchange per se. Ochala and Kerkides (2004) designed a spatial decision support tool within Microsoft Windows based on land quality indicators in Kenya, called Land Quality Manager. Farmers were involved in developing the prototype tool, which emphasized assessment and classification of landscape quality, and identification of potential management solutions (Ochola and Kerkides 2004). The Environmental Sustainability Dashboard is a web-based decision support tool that combines GIS, field, remote sensing, and household survey data to compute metrics and visualize levels of ecosystem stress for a pilot Tanzanian agriculture assessment project (Fegraus et al. 2012). We identified apps that facilitate agriculture environmental assessments (EnviroWalk, GDA Nursery Assessment) or compliance-related inspections (organicgirl mobile assessments) but these fail to integrate farmer knowledge or practical land management solutions.
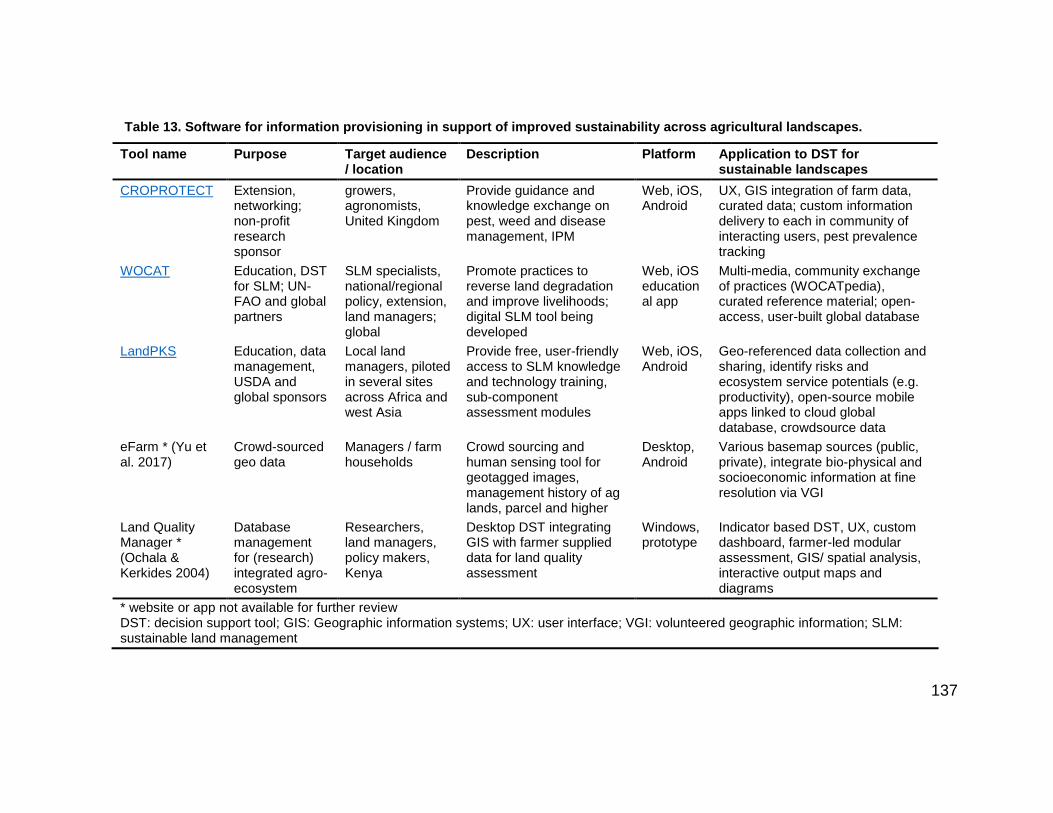
137
Table 13. Software for information provisioning in support of improved sustainability across agricultural landscapes.
Tool name Purpose Target audience / location
Description Platform Application to DST for sustainable landscapes
CROPROTECT Extension, networking; non-profit research sponsor
growers, agronomists, United Kingdom
Provide guidance and knowledge exchange on pest, weed and disease management, IPM
Web, iOS, Android
UX, GIS integration of farm data, curated data; custom information delivery to each in community of interacting users, pest prevalence tracking
WOCAT Education, DST for SLM; UN-FAO and global partners
SLM specialists, national/regional policy, extension, land managers; global
Promote practices to reverse land degradation and improve livelihoods; digital SLM tool being developed
Web, iOS educational app
Multi-media, community exchange of practices (WOCATpedia), curated reference material; open-access, user-built global database
LandPKS Education, data management, USDA and global sponsors
Local land managers, piloted in several sites across Africa and west Asia
Provide free, user-friendly access to SLM knowledge and technology training, sub-component assessment modules
Web, iOS, Android
Geo-referenced data collection and sharing, identify risks and ecosystem service potentials (e.g. productivity), open-source mobile apps linked to cloud global database, crowdsource data
eFarm * (Yu et al. 2017)
Crowd-sourced geo data
Managers / farm households
Crowd sourcing and human sensing tool for geotagged images, management history of ag lands, parcel and higher
Desktop, Android
Various basemap sources (public, private), integrate bio-physical and socioeconomic information at fine resolution via VGI
Land Quality Manager * (Ochala & Kerkides 2004)
Database management for (research) integrated agro-ecosystem
Researchers, land managers, policy makers, Kenya
Desktop DST integrating GIS with farmer supplied data for land quality assessment
Windows, prototype
Indicator based DST, UX, custom dashboard, farmer-led modular assessment, GIS/ spatial analysis, interactive output maps and diagrams
* website or app not available for further review DST: decision support tool; GIS: Geographic information systems; UX: user interface; VGI: volunteered geographic information; SLM: sustainable land management

138
Opportunities and challenges for apps supporting sustainability in agricultural landscapes
Significant technical challenges involved in digitally connecting diverse sources and outputs of information have been identified. For example, Jayaraman and others (2016) compare internet-of-things management software in the context of smart farming and created SmartFarmNet in a free, open source platform called OpenIoT to include features that permit bring-your-own-sensors as well as big data analytics. Other hybrid-cloud architectures that combine private user data input with cloud-based databases have been conceived for sustainable agriculture (Xin and Zazueta 2016) and landscape management (LandPKS, Herrick et al., 2016; Environmental Sustainability Dashboard for Tanzania, Fegraus et al., 2012). These programming architectures are optimized for bio-physical and environmental data and do not adequately address potential socio-economic data resources or data ownership/security issues.
Beyond technical problems, which are solvable given sufficient resources, there are socio-behavioral considerations. Rose and others (2016) offer a checklist of features that can improve uptake of digital agriculture decision support tool based on an extensive survey of United Kingdom farmers and consultants. Lessons learned from implementation (or lack of implementation) for decision support tools related to agricultural climate risk management are described (Hochman and Carberry 2011) and include suggestions for conditions needed prior to undertaking design of decision support tool. Ochala and Kerkides (2004) report feedback from testers of a prototype decision support tool and suggest areas for improving a full release version. The lessons learned fall into performance, reliability, and user experience concerns, summarized in Figure 20. Decision support tools should be not only useful and effective, but also flexible to farmers’ enormously varied situations, in which compliance concerns often instigate change in practice. Tailoring the tool for a specific target (age, experience, farm type) can improve uptake. Users often try new tools based on peers’ experiences, which reflects trust in both the science and the community of stakeholders including developers, researchers, extension agents, and marketers. Developers must be prepared to assure the sustained usefulness of the tool so as to warrant users’ investment in time and money. Users appear skeptical of strictly commercial decision support tools. Developers should consider the user experience and user-interface at the outset of tool design. Users seem to prefer a decision support tool that offers information to assist decision-making, rather than a prescription that replaces user knowledge and agency. Further research is needed regarding what types of information would be honestly shared between farmers and other decision support tool users who may also be competing for limited resources in marginal markets.

139
Figure 20. Design of a digital decision support tool for improved sustainability in agricultural landscapes should consider performance, reliability and user experience at the earliest development stages to enhance uptake by farmers and land managers. Summarized from Rose et al. (2016), Hochman and Carberry (2011), and Ochala and Kerkides (2004).

140
Provisions that balance transparency with personal security need to be carefully constructed to encourage dispersal of information and knowledge resources. Xin and Zazueta (2016) propose a hybrid multi-cloud architecture for smart farming that allows both virtual and physical compartmentalization of privately-derived data. Krintz and co-workers (2016) argue that data security and ownership concerns inhibit broader adoption of existing agriculture decision support tools, which often require farmers to relinquish rights to the data, and instead propose an on-farm “data appliance” called SMARTFARM to integrate farmer-generated data with cloud databases. On the other end of the spectrum are tools that rely heavily on Volunteered Geographic Information, crowd-sourcing, and “human sensors” to acquire bio-physical (e.g., IveGot1, Wallace et al., 2016) and/or socio-economic data (e.g., eFarm, Yu et al., 2017).
Agricultural landscapes are not always readily defined geographically: the system boundary depends on the process of interest. For example, water quality decisions within an agricultural landscape should consider the watershed in which agricultural production occurs and account for upstream and downstream activities. Likewise, marketing information may encompass a different set of geographic boundaries. This complexity creates challenges in identifying, finding, and visualizing contextual information (Schader et al. 2016). Furthermore, information needs of farmers and other agricultural actors are highly context specific to location, crop type, season, markets, production system, and equipment access. These information needs relate to goals for improving sustainability as well as boundaries within which stakeholders may operate. Designing software that automatically and correctly identifies those multiple system boundaries of agricultural landscapes is difficult to engineer and requires that users input contextual information. Thus, digital computing methods that incorporate GPS and Earth observation systems databases, as well as capacity for dynamic “smart” forms or questionnaires for user input, can reduce information overload by passing data through user-defined filters to quickly yield relevant information. Apps should provide a clear indication of current capabilities as well as the objective behind the app functionality.
We identified several agriculture apps that have a resource discovery component in the sense that users can digitally search for information themes (e.g., Agroportal, WOCAT SLM, Plantwise). LandPKS is being updated and expanded to include capacity for networking users to each other for peer-to-peer learning and to site-specific resources based on user-input of farm contextual information and resource needs. However, it is focused primarily on soil bio-geophysical properties for climate change adaptation and mitigation. The idea could be further developed for improving sustainable agricultural landscapes. For example, if a farmer queries information on cover crops, it would be useful to return information on the varieties suitable for their plant hardiness zone and link to information regarding planting methods of those varieties – including neighboring farmers or extension offices and local seed suppliers.

141
We summarize key features for an app that supports management decisions toward sustainable agricultural landscapes (Figure 21). Clearly, compilation of GPS, GIS, remotely-sensed, and geo-tagged micro-sensor data are necessary for successful agriculture landscape knowledge exchange. A hybrid multi-cloud server architecture can address the resulting big data processing needs. Less obvious perhaps is the method by which this compilation should be accomplished. A broadly applicable and adaptive knowledge sharing system based on robust science requires open source, infinite sensor integration with open data standards such as OpenIoT (e.g., as in SmartFarmNet, Jayaraman, Yavari, Georgakopoulos, Morshed, & Zaslavsky, 2016). Furthermore a ‘deep’ web portal linked to a mobile app allows for better documentation of a committed network of stakeholders and facilitates maintaining user/farmer ownership and access to uploaded data (Krintz et al. 2016; Xin and Zazueta 2016), relative to a stand-alone app. Ease of use issues may be addressed through an intuitive, farmer-centered, user interface (UX) with icon-based customizable ‘dashboard’ display so that even low-literacy users can quickly access their priority information themes (Castillo and Vosloo 2015; Herrick et al. 2016; Rose et al. 2016; Xin and Zazueta 2016). Effective social networking for knowledge exchange in agriculture relies on establishing an adequate level of transparency with an emphasis on interpersonal relationships (Wood et al. 2014). Therefore, incorporating existing social media platforms (e.g., Twitter) and other direct communication capabilities (chat, text) within an app would be important for widespread adoption of a tool supporting sustainable landscape management.
An extensive, interconnected information provisioning system that includes environmental as well as social and economic aspects of agricultural sustainability requires multiple public and private institutional partners (e.g., as in LandPKS) and thus an innovative funding mechanism to ensure usefulness over the long term. In order to build a unified and broadly beneficial agricultural knowledge sharing app, it is important for software developers to understand the lessons learned from pilot projects and studies examined in this paper.
Conclusion
This review highlights the lack of mobile device or web-based applications that address sustainability across agricultural landscapes. Sustainability goals vary by stakeholder values and resources, and also influence the selection of a mobile decision support tool for use. There have been efforts to connect “big data” to farm management decisions, but these generally focus on agronomic or environmental compliance concerns within a single topic. Apps that connect farmers, extension agents, and other agricultural actors to information relevant to the ways in which farm management decisions affect landscape sustainability are still needed. Such an app should be capable of filtering cloud-based information using GPS inputs cross-referenced to GIS resources, generic internet-of-things sensors, volunteered geographic information, crowd-sourced data, and social

142
Figure 21. Software design features recommended for a broadly applicable knowledge sharing system for improving sustainability of agricultural landscapes are illustrated: provision of a fully documented web portal linking digital cloud databases, geographic information systems including volunteered and crowd-sourced data, private sensors and social networking platforms may improve performance, reliability, user experience, and thus uptake by development workers and farmers.

143
networking for broad knowledge exchange and peer-to-peer learning. Furthermore, a useful app can provide a straightforward user-interface with dynamic smart forms for user data input and customizable data visualization.
Transparency regarding information ownership and use, as well as personal/ cyber security, is essential. Developing an app that is targeted initially to agriculture outreach professionals and policy makers may lay a foundation for later participation by a broader collection of agricultural landscape decision makers including farmers, retailers, and government resources. Given a target end-user of extension/ outreach and policy personnel, app developers need to consider how the information can best be delivered, used, and exchanged with extension clients especially farmers. Because there are millions of apps available, and they are difficult to search or document systematically, it is useful to have an external website that can be easily shared with target audiences through a variety of outlets, rather than only through an app store. Without a web link, a niche app for agriculture is likely to get lost in the constantly evolving field of apps, and reliability and trust by potential users may be compromised.
By emphasizing knowledge exchange and resource discovery rather than internet-of-things connectivity, an integrated sustainability app could help farmers identify practices that improve environmental, social, and economic indicators of sustainability on their farms within the context of the broader agricultural landscape in which they operate. While an app with these features presents technical engineering and design challenges, the rapid pace of innovation in cloud-based data and open source mobile applications suggests those barriers can be overcome. Major research efforts are needed to identify end-user information requirements, social networking preferences, and the usefulness of sensed data within unique agro-ecosystems in order to design a broadly relevant mobile app supporting adaptive management for improving social, economic, and environmental conditions throughout agricultural landscapes.
Acknowledgements
This work was funded by the University of Tennessee’s Institute for a Secure and Sustainable Environment Seed Grant 2016. The authors thank Don Hodges and Keith Kline for comments on the manuscript and app concept.

144
References
Aker, J. C. (2016). Information from Markets Near and Far: Mobile Phones and Agricultural Markets in Niger Published by: American Economic Association Information from Markets Near and Far: Mobile Phones and Agricultural Markets in Niger1 Economic theory often relies the. American Economic Association, 2(3), 46–59.
Astier, M., Speelman, E. N., López-Ridaura, S., Omar, R., & Gonzalez-esquivel, C. E. (2011). Sustainability indicators , alternative strategies and trade-offs in peasant agroecosystems : analysing 15 case studies from Latin America. International Journal of Agricultural Sustainability, 9(September), 37–41. https://doi.org/http://dx.doi.org/10.1080/14735903.2011.583481
Bruce, T. J. A. (2016). The CROPROTECT project and wider opportunities to improve farm productivity through web-based knowledge exchange. Food and Energy Security, 5(2), 89–96. https://doi.org/10.1002/fes3.80
Brundtland, G. H. (1987). Our Common Future: Report of the World Commission on Environment and Development (Vol. 4). https://doi.org/10.1080/07488008808408783
Camacho-Villa, T. C., Almekinders, C., Hellin, J., Martinez-Cruz, T. E., Rendon-Medel, R., Guevara-Hernández, F., … Govaerts, B. (2016). The evolution of the MasAgro hubs: responsiveness and serendipity as drivers of agricultural innovation in a dynamic and heterogeneous context. The Journal of Agricultural Education and Extension, 22(5), 455–470. https://doi.org/10.1080/1389224X.2016.1227091
Costopoulou, C., Ntaliani, M., & Karetsos, S. (2016). Studying Mobile Apps for Agriculture. IOSR Journal of Mobile Computing & Application, 3(6), 2394–42. https://doi.org/10.9790/0050-03064449
Dale, V. H., Kline, K. L., Kaffka, S. R., & Langeveld, J. W. A. (2013). A landscape perspective on sustainability of agricultural systems. Landscape Ecology, 28(6), 1111–1123. https://doi.org/10.1007/s10980-012-9814-4
De Filippis, T., Rocchi, L., Fiorillo, E., Matese, A., Di Gennaro, F., & Genesio, L. (2013). Smart vineyard: An open source web-GIS application for precision viticulture. Acta Horticulturae, 978, 107–116.
De Sousa, K., Detlefsen, G., Rivera, O., Melo, E. de, Tobar, D., Castaño-Quintero, M. E., … Casanoves, F. (2015). Using a smartphone app to support participatory agroforestry planning in Central America. XIV World Forestry Congress, (SEPTEMBER). https://doi.org/10.13140/RG.2.1.1520.6887/1
Delgado, J. A., Kowalski, K., & Tebbe, C. (2013). The first Nitrogen Index app for mobile devices: Using portable technology for smart agricultural management. Computers and Electronics in Agriculture, 91, 121–123. https://doi.org/10.1016/j.compag.2012.12.008
Eichler Inwood, S. E., Lopez Ridaura, S., Kline, K. L., Gerard, B., Gardeazabal Monsalue, A., Govaerts, B., & Dale, V. H. (under review). Assessing

145
sustainability in agricultural landscapes: a review of approaches. Environmental Reviews.
Elkington, J. (1997). Cannibals with Forks: The triple bottom line of 21st century business (1999 ed.). Capstone Puplishing Ltd.
Fegraus, E. H., Zaslavsky, I., Whitenack, T., Dempewolf, J., Ahumada, J. A., Lin, K., & Andelman, S. J. (2012). Interdisciplinary decision support dashboard: A new framework for a tanzanian agricultural and ecosystem service monitoring system pilot. IEEE Journal of Selected Topics in Applied Earth Observations and Remote Sensing, 5(6), 1700–1708. https://doi.org/10.1109/JSTARS.2012.2204864
Food and Agriculture Organization (FAO), & SAFA. (2013). SUSTAINABILITY ASSESSMENT OF FOOD AND AGRICULTURE SYSTEMS - Smallholders APP (Vol. 0).
Gerdessen, J. C., & Pascucci, S. (2013). Data envelopment analysis of sustainability indicators of european agricultural systems at regional level. Agricultural Systems, 118. https://doi.org/10.1016/j.agsy.2013.03.004
González Perea, R., Fernández García, I., Martin Arroyo, M., Rodríguez Díaz, J. A., Camacho Poyato, E., & Montesinos, P. (2017). Multiplatform application for precision irrigation scheduling in strawberries. Agricultural Water Management, 183, 194–201. https://doi.org/10.1016/j.agwat.2016.07.017
Hellin, J., & López Ridaura, S. (2016). Soil and water conservation on Central American hillsides: if more technologies is the answer, what is the question? AIMS Agriculture and Food, 1(2), 194–207. https://doi.org/10.3934/agrfood.2016.2.194
Herrick, J. E., Beh, A., Barrios, E., Bouvier, I., Coetzee, M., Dent, D., … Webb, N. P. (2016). The Land-Potential Knowledge System (LandPKS): mobile apps and collaboration for optimizing climate change investments. Ecosystem Health and Sustainability, 2(3). https://doi.org/10.1002/ehs2.1209
Hochman, Z., & Carberry, P. S. (2011). Emerging consensus on desirable characteristics of tools to support farmers’ management of climate risk in Australia. Agricultural Systems, 104(6), 441–450. https://doi.org/10.1016/j.agsy.2011.03.001
Jayaraman, P. P., Yavari, A., Georgakopoulos, D., Morshed, A., & Zaslavsky, A. (2016). Internet of things platform for smart farming: Experiences and lessons learnt. Sensors (Switzerland), 16(11), 1–17. https://doi.org/10.3390/s16111884
Karetsos, S., Costopoulou, C., & Sideridis, A. (2014). Developing a smartphone app for m-government in agriculture. Journal of Agricultural Informatic, 5(1), 1–8. https://doi.org/10.17700/jai.2014.5.1.129
Krintz, C., Wolski, R., Golubovic, N., Lampel, B., Hulkarni, V., Sethuramasamyraja, B., … Liu, B. (2016). SmartFarm: Improving

146
agriculture sustainability using modern information technology. https://doi.org/10.1145/1235
Kumaraswamy, K., & Kunte, S. (2013). Integrating biodiversity and conservation with modern agricultural landscapes. Biodiversity Conservation, 22, 2735–2750. https://doi.org/10.1007/s10531-013-0562-9
López-Ridaura, S., Masera, O., & Astier, M. (2002). Evaluating the sustainability of integrated peasantry systems - The MESMIS Framework. Ecological Indicators, December 2, 135–148.
Nghiem, T. P. L., & Carrasco, L. R. (2016). Mobile Applications to Link Sustainable Consumption with Impacts on the Environment and Biodiversity. BioScience, 66(5), 384–392. https://doi.org/10.1093/biosci/biw016
Ochola, W. O., & Kerkides, P. (2004). An integrated indicator-based spatial decision support system for land quality assessment in Kenya. Computers and Electronics in Agriculture, 45(1–3), 3–26. https://doi.org/10.1016/j.compag.2004.05.005
Patel, H., & Patel, D. (2016). Survey of android apps for agriculture sector. International Journal of Information Sciences and Techniques, 6(1), 61–67. https://doi.org/10.5121/ijist.2016.6207
Powell, A. (2017). CABI’s innovative use of technology, data, and knowledge transfer to reduce crop losses in the developing world. Food and Energy Security, 6(3), 94–97. https://doi.org/10.1002/fes3.113
Pretty, J. (2008). Agricultural sustainability: concepts, principles and evidence. Philosophical Transactions of the Royal Society of London. Series B, Biological Sciences, 363(1491), 447–65. https://doi.org/10.1098/rstb.2007.2163
Pretty, J., & Bharucha, Z. P. (2014). Sustainable intensification in agricultural systems. Annals of Botany, 114(8), 1571–96. https://doi.org/10.1093/aob/mcu205
Quaranta, G., & Salvia, R. (2017). PARTICIPATORY APPROACH TO A PLACE-BASED SUSTAINABLE RURAL DEVELOPMENT: E-MARKET PLATFORM FOR A RESILIENT AGRI-FOOD CHAIN. JOURNAL OF ENVIRONMENTAL PROTECTION AND ECOLOGY, 18(2), 616–622.
Rose, D. C., Sutherland, W. J., Parker, C., Lobley, M., Winter, M., Morris, C., … Dicks, L. V. (2016). Decision support tools for agriculture: Towards effective design and delivery. Agricultural Systems, 149, 165–174. https://doi.org/10.1016/j.agsy.2016.09.009
Schader, C., Baumgart, L., Landert, J., Muller, A., Ssebunya, B., Blockeel, J., … Stolze, M. (2016). Using the Sustainability Monitoring and Assessment Routine (SMART) for the systematic analysis of trade-offs and synergies between sustainability dimensions and themes at farm level. Sustainability (Switzerland), 8(3). https://doi.org/10.3390/su8030274
Schröer-Merker, E., Bowie, N., & Hammond, H. (2016). Status and future perspectives of smart tools and apps in nutrient and water management.

147
Integrated Nutrient and Water Management for Sustainable Farming., (29), 1–5.
Sevenster, M., Odegard, I., Krutwagen, B., Croezen, H., Head, M., & Bergsma, G. (2014). Life cycle impacts of protein-rich foods: creating robust yet extensive life cycle models for use in a consumer app. Journal of Cleaner Production., 73, 165–174.
Speelman, E. N., López-Ridaura, S., Colomer, N. A., Astier, M., & Masera, O. R. (2007). Ten years of sustainability evaluation using the MESMIS framework: Lessons learned from its application in 28 Latin American case studies. International Journal of Sustainable Development {&} World Ecology, 14, 345–361. https://doi.org/10.1080/13504500709469735
Tripicchio, P., Satler, M., Dabisias, G., Ruffaldi, E., & Avizzano, C. A. (2015). Towards smart farming and sustainable agriculture with drones. In Intelligent Environments (IE), 2015 International Conference on (pp. 140–143).
UNESCO-Pearson Initiative for Literacy. (2015). Crop Specific Mobile Apps. Wallace, R. D., Bargeron, C. T., Moorhead, D. J., Laforest, J. H., Wallace, R. D.,
Bargeron, C. T., & Moorhead, D. J. (2016). IveGot1: Reporting and Tracking Invasive Species in Florida. Southeastern Naturalist, 15(sp8), 51–62. https://doi.org/10.1656/058.015.sp805
Wickliffe, L. C., Porter, D. E., Hibbert, J. D., Scott, G. I., & March, C. (2016). Development of a geospatial guide for responsible residential pesticide application within the South Carolina Coastal Zone. Southeastern Geographer, 56(2), 152–170.
Wood, B. A., Blair, H. T., Gray, D. I., Kemp, P. D., Kenyon, P. R., Morris, S. T., & Sewell, A. M. (2014). Agricultural Science in the Wild: A Social Network Analysis of Farmer Knowledge Exchange. PLOS ONE, 9(8), e105203.
Wu, C. C., Zhou, L., Wang, J., & Cai, Y. P. (2016). Smartphone based precise monitoring method for farm operation. International Journal of Agricultural and Biological Engineering, 9(3), 111–121. https://doi.org/10.3965/j.ijabe.20160903.2154
Wu, J. (2013). Landscape sustainability science: ecosystem services and human well-being in changing landscapes. Landscape Ecology, 28(6), 999–1023. https://doi.org/10.1007/s10980-013-9894-9
Xin, J., & Zazueta, F. (2016). Technology trends in ICT – towards data-driven, farmer-centered and knowledge-based hybrid cloud architectures for smart farming. CIGR Journal, 18(4), 275–279.
Yu, Q., Shi, Y., Tang, H., Yang, P., Xie, A., Liu, B., & Wu, W. (2017). eFarm: A tool for better observing agricultural land systems. Sensors (Switzerland), 17(3). https://doi.org/10.3390/s17030453

148
Appendix IV
Website or developer links for apps noted in text: note that some of the links are dead ends or contact info only.
1.1. AgPhD (Ag PhD TV/IFA Productions; several corporate sponsors)
http://www.agphd.com/resources/ag-phd-mobile-apps/ 1.2. Agri Marketplace https://agrimp.com/ 1.3. Agriculture Survey App (Fulcrum)
http://www.fulcrumapp.com/apps/agricultural-survey/ 1.4. AgriMarket https://www.cdac.in/ 1.5. Agroportal (meli.aua.gr/aproportal/) Greece 1.6. AgSense http://www.agsense.net/agsense-farm/agsense-app/ 1.7. Agworld for iPhone https://agworld.co/product/agworld-apps 1.8. Climate FieldView (The Climate Corporation, Monsanto)
https://www.climate.com/ 1.9. Crop Nutrient Calculator
https://www.extension.umn.edu/agriculture/nutrient-management/crop-calculators/crop-nutrient-calculator-app/
1.10. Crop Specific Mobile Apps (India) http://www.jayalaxmiagrotech.com/ 1.11. CROPROTECT Rothamsted Research https://croprotect.com/ 1.12. CropTracker https://www.croptracker.com/ 1.13. CropX https://www.cropx.com/ 1.14. Digital Inputs Financing Toolkit by AGRA https://agra.org/news/digital-
toolkit-to-give-tanzania-smallholder-farmers-access-to-finance-farm-supplies-and-training/
1.15. DoneGood: Ethical Shopping App https://donegood.co/ 1.16. Environmental Sustainability Dashboard for Tanzania (Fegraus et al. 2012)
teamnetwork.org/agriculture-nature-livelihoods 1.17. Envirowalk https://www.dairynz.co.nz/environment/envirowalk 1.18. eXtension.org (US Cooperative Extension group) 1.19. Farm Carbon Calculator (Farm Carbon Cutting Toolkit)
http://www.farmcarbontoolkit.org.uk/carbon-calculator 1.20. Farm Futures http://marketing.farmprogress.com/brands/crop/farm-futures 1.21. FarmConnect https://www.rubiconwater.com/usa-farmconnect 1.22. Fasal http://fasal.co/ 1.23. FieldPrint Calculator (Field to Market)
https://calculator.fieldtomarket.org/fieldprint-calculator/ 1.24. Foodshed https://www.foodshed.io/ 1.25. GDA Nursery Assessment https://apps.bugwood.org/apps/ 1.26. Geospatial Guide for Residential Pesticide Application
www.sccoastalpesticides.com (Wickliffe 2016) 1.27. GreenSeeker (Trimble) http://www.dasnr.okstate.edu/apps [to be used with
N Rate Calculator, same site] 1.28. HelloTractor http://www.hellotractor.com/

149
1.29. iCow http://www.icow.co.ke/ 1.30. IrriFresa : González Perea, et al. (2017).
https://doi.org/10.1016/j.agwat.2016.07.017 https://www.innocentdrinks.co.uk/blog/2016/july/we-won-an-award
1.31. IveGot1 (Wallace 2016) https://apps.bugwood.org/ 1.32. John Deere App Center (John Deere)
http://www.deere.com/en_US/services_and_support/technology-solutions/technology-solutions.page?
1.33. LandPKS (USAID, USDA) https://www.landpotential.org/landpks.html 1.34. LoGOFF http://www.nycurbanproject.com/logoff-movement/ 1.35. MilkCrate for Communities http://mymilkcrate.com/ 1.36. MMP360 (AgSolver)
http://www.efcsystems.com/index.php/agronomicplanningandsustainability/ 1.37. OpenIoT http://www.openiot.eu/ 1.38. Organicgirl mobile assessments https://www.iloveorganicgirl.com/ 1.39. Plantix (PEAT) https://plantix.net/ 1.40. Plantwise Knowledge Bank https://www.plantwise.org/ 1.41. Pocket Spray Smart http://www.agrible.com/ 1.42. Profit Zone Manager (AgSolver)
http://www.efcsystems.com/index.php/agronomicplanningandsustainability/ 1.43. Seafood Watch http://www.seafoodwatch.org/ 1.44. Seasonal Food Guide https://www.seasonalfoodguide.org/ 1.45. Smart Scout http://www.taranis.ag/ 1.46. SmartOysters https://www.thundermaps.com/ 1.47. SmartRain BAUER GmbH https://www.bauer-at.com/en/ 1.48. The Cattle Tags App; (Cattlesoft, Inc.) https://www.cattletags.com/cattle-
tags-app 1.49. The Nitrogen Index
https://www.ars.usda.gov/research/software/download/?softwareid=426 1.50. Trringo https://www.trringo.com/ 1.51. Twitter https://twitter.com/ 1.52. Veg Pest ID http://ahr.com.au/news/pest-and-disease-identifier-released/ 1.53. WOCAT SLM (Knowledge for Sustainable Land Management) wocat.net

150
CONCLUSION
Summary
This dissertation includes four chapters that contribute to the field of sustainability science – notably with a perspective focused on agricultural landscapes. A literature review of agriculture assessment frameworks provides a basis for recommending features of an agricultural assessment framework to monitor progress towards sustainability of agricultural landscapes. Indicator themes for a landscape assessment and a process for selecting context-specific indicators are developed using Yaqui Valley, Sonora, Mexico, as a case study. Analysis of available indicator data helps determine baseline and target values for an initial assessment of sustainability priorities across the Yaqui Valley landscape. An examination of mobile digital decision-support tools for agriculture highlights a need for tools that facilitate agriculture and sustainability knowledge exchange. Preliminary research on the usefulness of software that links data and resources to facilitate on-farm management decisions provides groundwork for development of an application with mobile interface and geo-referencing capabilities. Taken together, this dissertation research contributes to our understanding of agricultural landscapes and the socio-economic structures in which they are embedded by describing a flexible, indicator-based assessment framework that supports decision-making for management of more sustainable landscapes.
Agricultural landscapes face increasing pressure to remain productive, profitable, and socially acceptable despite diverse stressors such as global climate change and international markets. Thus, methods to assess progress toward desired conditions are an important tool for stakeholders to appropriately adapt management techniques to achieve sustainability goals.
Lessons learned
Agricultural sustainability assessments for landscapes require a flexible approach to identifying useful information that spans spatial and temporal scales of farm systems, ecosystem processes, and regional administrative units. This means that an assessment framework should provide guidelines and examples for a process that supports adaptive management of agricultural systems, while firm physical boundaries, timeframes, or explicit indicators towards assessing sustainability should be avoided. All preferred data may not be available. It is likely that a limited assessment with even one indicator for each dimension yields knowledge useful to decision-making for agricultural landscapes. Therefore, proceeding with imperfect information within a flexible assessment framework is sometimes better than conducting no assessment because ideal data were lacking. The lack of information for preferred indicators meant that some key areas of concern could not be addressed in the assessment. However, identifying the lack of information may allow stakeholders to develop data

151
collection efforts to address areas of concern. It would be helpful to develop a good understanding of the types of data that are --or are not-- available for use in an assessment in the earliest stages of the assessment process.
Adaptive management of agricultural systems uses the best available information and iterative efforts to obtain and apply that information in management decisions. The framework we recommend encourages re-assessment as management and other conditions change, so that later assessments are built on the initial process and participants.
Flexibility is also necessary because each site has different context including stakeholder values. Diverse stakeholders should be engaged in articulating landscape goals and identifying suitable indicators. Groups with key stakes in an agricultural landscape assessment include for example, farmers and farm households, local residents, workers, agri-business owners, government officials, agriculture researchers and extension personnel, and consumer representatives. This list of stakeholders must be modified based on the biophysical extent of the landscape in question, the timeline of the goals, as well as the type of management system and markets involved. Other participants should be invited as the assessment proceeds and priorities, constraints, and opportunities emerge. Bias in identifying stakeholder priorities occurs based on who participates in the assessment process and emphasizes the status quo. Therefore, working toward an inclusive and extensive participant base can help reduce bias in the assessment. Non-local researchers may provide information that can broaden the focus from that of the status quo during the assessment. Continued research is needed to develop methods that engage more stakeholders with a variety of views.
Having an example of application of the assessment approach, indicator selection process, and identification of available indicator data helps create realistic expectations for all participants. The example presented in this dissertation illustrates how meaningful indicator information can be gleaned from existing data when regional administrative records are publicly accessible and geo-referenced. Linking stakeholders that have thorough local knowledge to people with an understanding of national or international information archives can reduce the time needed for preparing a practical list of indicators. In the Yaqui Valley case study, national and international agencies (such as NASA and Transparency International) played a key role in providing useful data through open-access, high quality archives. The participatory process can improve stakeholders’ awareness of agricultural decisions that affect the landscape despite use of only a few of the endorsed indicators in a limited assessment. Future research would benefit from including mechanisms to analyze the perceived impact of the assessment process (e.g. a pre- and post- assessment survey of participants). Involvement of experts in social and qualitative studies may also help increase the number of women and youth participants in stakeholder workshops.

152
There are a variety of mobile apps related to agriculture, however, they are lacking strong support for adaptive management towards sustainability of agricultural landscapes. Apps can provide a platform for networking farmers and other resource managers to the contextual knowledge that is needed for adaptive management for improved sustainability in agriculture. Such an app should optimize users’ ability to find geo-referenced data, linking GIS resources, internet-of-things sensors, and crowd-sourced or other volunteered information in order to facilitate peer-to-peer networking and knowledge exchange. Transparency of app functionality, funding, data ownership and use, as well as security of private information are important considerations for designing a knowledge exchange app for agriculture.
Hopefully, improving stakeholder involvement and knowledge exchange through assessment processes and digital tools can expand the capacity for decision-making in adaptive management toward more sustainable agricultural landscapes.

153
VITA
Sarah Eichler Inwood was raised in Randolph, Ohio. She graduated with
honors from Kent State University with a Bachelor of Science in Biological Sciences following an honors thesis entitled “Usefulness of ELF-97 in the detection of alkaline phosphatase activity on individual algal cells and in natural freshwater plankton assemblages,” supervised by Robert T. Heath. Sarah completed a Master of Science in Biological Sciences with advisor Jennifer L. Tank at University of Notre Dame, examining “The influence of land use on denitrification in headwater streams in the Kalamazoo River Watershed, Michigan.” Subsequently at the University of Georgia, Sarah was a resource coordinator and research assistant in the plant cell biochemistry lab of Debra Mohnen in which she worked on projects related to complex carbohydrate characterizations for a number of cellular systems. Sarah returned to environmental work in Auburn, Alabama at the consulting firm BioResources, LLC, in which she assisted with delineating streams, wetlands, and habitat, and preparation of permit applications and mitigation plans. Sarah moved to Knoxville, Tennessee with her family in 2010, joining the research program of David M. Butler in the Department of Plant Sciences in the UT Institute of Agriculture. There Sarah worked on a variety of research projects related to sustainable and USDA organic crop production, focusing on soil and plant nutrients, crop rotation, cover crops, soil pathogens, variety trials and tillage practices. Sarah joined the Bredesen Center as a Ph.D. Fellow in 2015. Sarah now lives with her family in State College, Pennsylvania.