Improvement of the European thermodynamic database NUCLEA
25
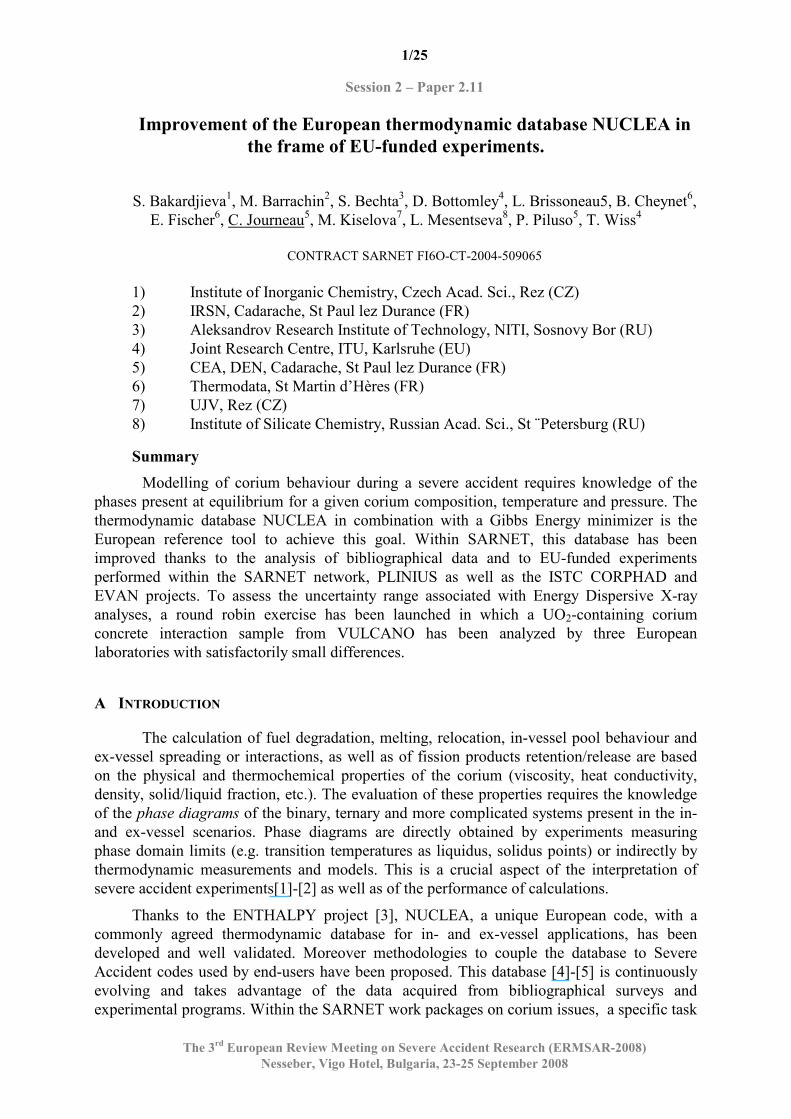
1/25 Session 2 – Paper 2.11 The 3 rd European Review Meeting on Severe Accident Research (ERMSAR-2008) Nesseber, Vigo Hotel, Bulgaria, 23-25 September 2008 Improvement of the European thermodynamic database NUCLEA in the frame of EU-funded experiments. S. Bakardjieva 1 , M. Barrachin 2 , S. Bechta 3 , D. Bottomley 4 , L. Brissoneau5, B. Cheynet 6 , E. Fischer 6 , C. Journeau 5 , M. Kiselova 7 , L. Mesentseva 8 , P. Piluso 5 , T. Wiss 4 CONTRACT SARNET FI6O-CT-2004-509065 1) Institute of Inorganic Chemistry, Czech Acad. Sci., Rez (CZ) 2) IRSN, Cadarache, St Paul lez Durance (FR) 3) Aleksandrov Research Institute of Technology, NITI, Sosnovy Bor (RU) 4) Joint Research Centre, ITU, Karlsruhe (EU) 5) CEA, DEN, Cadarache, St Paul lez Durance (FR) 6) Thermodata, St Martin d’Hères (FR) 7) UJV, Rez (CZ) 8) Institute of Silicate Chemistry, Russian Acad. Sci., St ¨Petersburg (RU) Summary Modelling of corium behaviour during a severe accident requires knowledge of the phases present at equilibrium for a given corium composition, temperature and pressure. The thermodynamic database NUCLEA in combination with a Gibbs Energy minimizer is the European reference tool to achieve this goal. Within SARNET, this database has been improved thanks to the analysis of bibliographical data and to EU-funded experiments performed within the SARNET network, PLINIUS as well as the ISTC CORPHAD and EVAN projects. To assess the uncertainty range associated with Energy Dispersive X-ray analyses, a round robin exercise has been launched in which a UO 2 -containing corium concrete interaction sample from VULCANO has been analyzed by three European laboratories with satisfactorily small differences. A INTRODUCTION The calculation of fuel degradation, melting, relocation, in-vessel pool behaviour and ex-vessel spreading or interactions, as well as of fission products retention/release are based on the physical and thermochemical properties of the corium (viscosity, heat conductivity, density, solid/liquid fraction, etc.). The evaluation of these properties requires the knowledge of the phase diagrams of the binary, ternary and more complicated systems present in the in- and ex-vessel scenarios. Phase diagrams are directly obtained by experiments measuring phase domain limits (e.g. transition temperatures as liquidus, solidus points) or indirectly by thermodynamic measurements and models. This is a crucial aspect of the interpretation of severe accident experiments[1]-[2] as well as of the performance of calculations. Thanks to the ENTHALPY project [3], NUCLEA, a unique European code, with a commonly agreed thermodynamic database for in- and ex-vessel applications, has been developed and well validated. Moreover methodologies to couple the database to Severe Accident codes used by end-users have been proposed. This database [4]-[5] is continuously evolving and takes advantage of the data acquired from bibliographical surveys and experimental programs. Within the SARNET work packages on corium issues, a specific task
Transcript of Improvement of the European thermodynamic database NUCLEA
1/25
Session 2 – Paper 2.11
The 3rd European Review Meeting on Severe Accident Research (ERMSAR-2008)
Nesseber, Vigo Hotel, Bulgaria, 23-25 September 2008
Improvement of the European thermodynamic database NUCLEA in
the frame of EU-funded experiments.
S. Bakardjieva1, M. Barrachin2, S. Bechta3, D. Bottomley4, L. Brissoneau5, B. Cheynet6, E. Fischer6, C. Journeau5, M. Kiselova7, L. Mesentseva8, P. Piluso5, T. Wiss4
CONTRACT SARNET FI6O-CT-2004-509065
1) Institute of Inorganic Chemistry, Czech Acad. Sci., Rez (CZ) 2) IRSN, Cadarache, St Paul lez Durance (FR) 3) Aleksandrov Research Institute of Technology, NITI, Sosnovy Bor (RU) 4) Joint Research Centre, ITU, Karlsruhe (EU) 5) CEA, DEN, Cadarache, St Paul lez Durance (FR) 6) Thermodata, St Martin d’Hères (FR) 7) UJV, Rez (CZ) 8) Institute of Silicate Chemistry, Russian Acad. Sci., St ¨Petersburg (RU) Summary
Modelling of corium behaviour during a severe accident requires knowledge of the phases present at equilibrium for a given corium composition, temperature and pressure. The thermodynamic database NUCLEA in combination with a Gibbs Energy minimizer is the European reference tool to achieve this goal. Within SARNET, this database has been improved thanks to the analysis of bibliographical data and to EU-funded experiments performed within the SARNET network, PLINIUS as well as the ISTC CORPHAD and EVAN projects. To assess the uncertainty range associated with Energy Dispersive X-ray analyses, a round robin exercise has been launched in which a UO2-containing corium concrete interaction sample from VULCANO has been analyzed by three European laboratories with satisfactorily small differences.
A INTRODUCTION
The calculation of fuel degradation, melting, relocation, in-vessel pool behaviour and ex-vessel spreading or interactions, as well as of fission products retention/release are based on the physical and thermochemical properties of the corium (viscosity, heat conductivity, density, solid/liquid fraction, etc.). The evaluation of these properties requires the knowledge of the phase diagrams of the binary, ternary and more complicated systems present in the in- and ex-vessel scenarios. Phase diagrams are directly obtained by experiments measuring phase domain limits (e.g. transition temperatures as liquidus, solidus points) or indirectly by thermodynamic measurements and models. This is a crucial aspect of the interpretation of severe accident experiments[1]-[2] as well as of the performance of calculations.
Thanks to the ENTHALPY project [3], NUCLEA, a unique European code, with a commonly agreed thermodynamic database for in- and ex-vessel applications, has been developed and well validated. Moreover methodologies to couple the database to Severe Accident codes used by end-users have been proposed. This database [4]-[5] is continuously evolving and takes advantage of the data acquired from bibliographical surveys and experimental programs. Within the SARNET work packages on corium issues, a specific task

2/25
Session 2 – Paper 2.11
The 3rd European Review Meeting on Severe Accident Research (ERMSAR-2008)
Nesseber, Vigo Hotel, Bulgaria, 23-25 September 2008
has been dedicated to corium thermochemistry databases and in particular to the research and improvement of the NUCLEA database.
In a first section, the NUCLEA database is described. Then the comparison between thermodynamic calculations and experimental results obtained in the framework of the different projects is presented. These results arise either from specific experiments or from experiments performed mainly for other goals within SARNET or EC-funded ISTC projects. These new data were used to improve the NUCLEA database during the 4½ years of the SARNET project or will serve for future improvements. Finally, since the uncertainty on the experimental results used to validate and improve the thermodynamic database varied, a round-robin exercise has been conducted in order to compare the analyses made by three different European laboratories on the same corium sample.
B THE NUCLEA DATABASE
Since 1990 experts were interested in the assessment of thermodynamic data for a number of compounds of reactor materials and fission products based on the recommendations of a specialists meeting held in JRC Ispra [6]. Critical assessments have been made on a very large number of compounds and systems. NUCLEA is a Thermodynamic Data Base built for collecting all this knowledge.
From a general point of view, NUCLEA is a self-consistent database designed for thermochemical equilibria calculation codes and is specially developed for in-and ex-vessel nuclear applications related to LWR severe accident scenarios. It contains 18 + 2 elements: O-U-Zr-Ag-In-B-C-Fe-Cr-Ni-Ba-La-Sr-Ru-Al-Ca-Mg-Si + Ar-H and includes the following 15 oxide systems : :UO2-ZrO2-In2O3-B2O3-FeO-Fe2O3-Cr2O3-NiO-BaO-La2O3-OSr-Al2O3-CaO-MgO-SiO2. This database covers the entire field from metal to oxide domains. It allows the user to calculate the thermochemical equilibrium state at any step of a severe accident and to use the results to improve the predictions of core degradation codes. A complete description of the database can be found in [5].
The binary and ternary Gibbs energy parameters were critically assessed by means of sophisticated optimisation procedures. These thermodynamic parameters provide a consistent analytical description of the phase diagrams, chemical potentials, enthalpies of mixing, heat capacities, etc.
Applications of a global thermodynamic approach, i.e. the simultaneous use of a high-quality thermodynamic database and an equilibrium calculation code, are numerous:
� condensed state phase diagrams, transitions, liquidus/solidus, compositions and proportions,
� coupling of thermodynamics and thermo-hydraulics, viscosity, segregation, residual power distribution,
� gaseous fission products release in any external conditions. Such a database is much more than a compilation of thermodynamic data from various sources, its constitution needs considerable analysis for self-consistency, to ensure that all the available experimental information is satisfactorily reproduced. The condensed solutions (48 non-stoichiometric phases, based on 281 reference substances) were deduced from the analysis of the assessed sub-systems (binary, ternary, etc.) ; some of them present possible miscibility gaps. 511 condensed stoichiometric compounds were added with more than 200 gaseous species as an ideal mixture. Hydrogen was added because it is a major component of the system, but the dissolution of hydrogen in condensed solid and liquid solutions is not taken into account at this time.
3/25
Session 2 – Paper 2.11
The 3rd European Review Meeting on Severe Accident Research (ERMSAR-2008)
Nesseber, Vigo Hotel, Bulgaria, 23-25 September 2008
A validated thermodynamic database is characterised by the good agreement between calculated and available experimental results (phase diagrams and thermodynamic properties) and the appropriate basic sub-systems or large integral experiments, made in similar conditions and at thermodynamic equilibrium. A set of 153 (18*17/2) metal-metal or metal-oxygen binary systems based on pure elements and 105 (15*14/2) oxide pseudo-binary systems based on pure oxides are integrated in NUCLEA. Due to the very high number of possible ternary (18*17*16/3*2 = 816) and pseudo-ternary (15*14*13/3*2 = 455) systems, it is completely unimaginable to assess all of them in the current timescale. For that reason it was decided to assess only the most important ternary systems for practical applications.
For each assessed system, the order number, source and a provisional quality criterion was given. This criterion was based on comparison between calculation and available experimental data, and has been established as follows: � Estimated No experimental data available; �� Perfectible Some domains need more experimental information (phase diagram or thermodynamic properties) ; ��� Acceptable The system is well known and satisfactorily modelled ; ���� High quality The system is quite known and modelled. It must be stressed that this criterion takes into account both phase diagram and thermodynamic properties, and thus cannot be indicated on a phase diagram. This point is fundamental for the modelling of multi-component systems. Moreover, it must be kept in mind that the quality criteria remain somewhere subjective, and the improvement of existing sub-systems with newly available experimental results is a continuous task, which is an important part of the database management and updating.
C VALIDATION ON EXPERIMENTS
C.1 Experiments at ITU
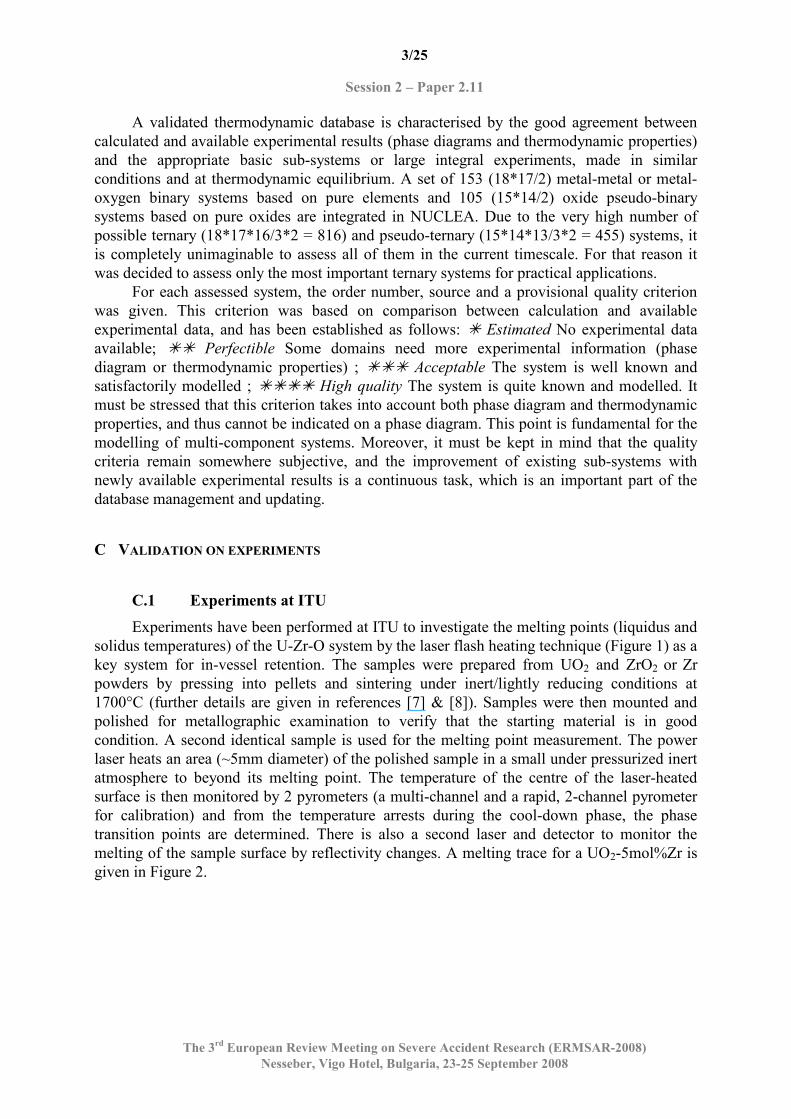
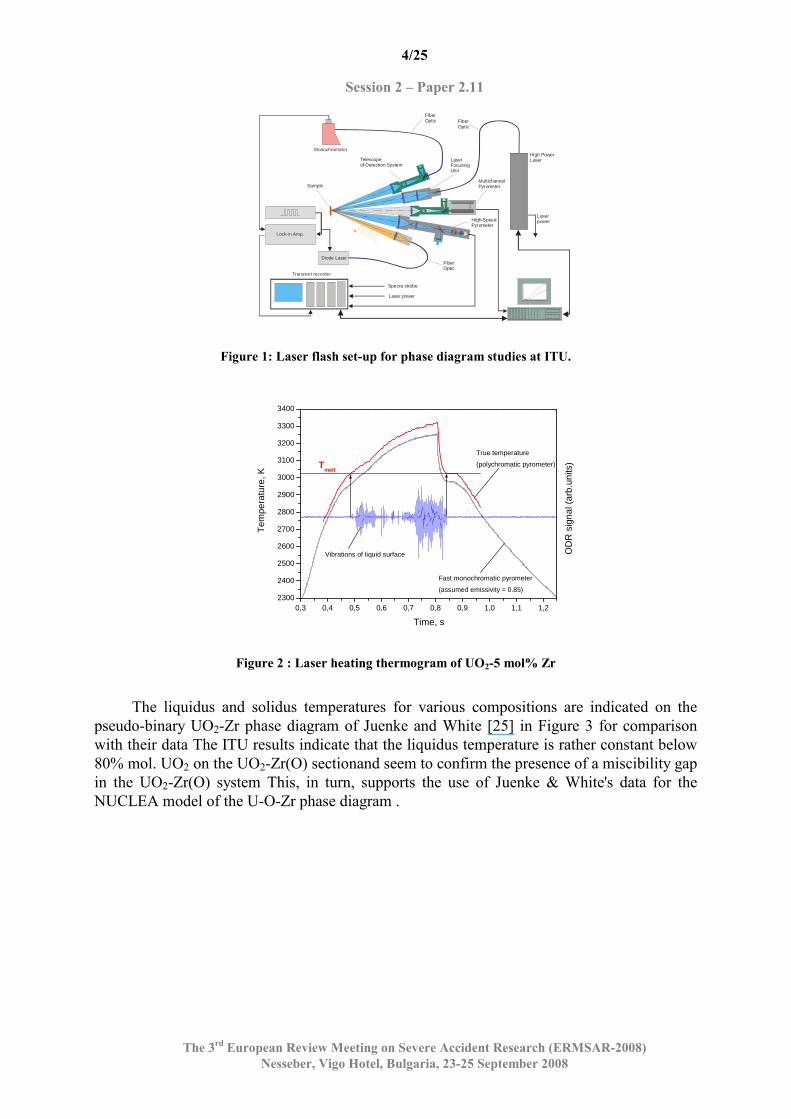
Experiments have been performed at ITU to investigate the melting points (liquidus and solidus temperatures) of the U-Zr-O system by the laser flash heating technique (Figure 1) as a key system for in-vessel retention. The samples were prepared from UO2 and ZrO2 or Zr powders by pressing into pellets and sintering under inert/lightly reducing conditions at 1700°C (further details are given in references [7] & [8]). Samples were then mounted and polished for metallographic examination to verify that the starting material is in good condition. A second identical sample is used for the melting point measurement. The power laser heats an area (~5mm diameter) of the polished sample in a small under pressurized inert atmosphere to beyond its melting point. The temperature of the centre of the laser-heated surface is then monitored by 2 pyrometers (a multi-channel and a rapid, 2-channel pyrometer for calibration) and from the temperature arrests during the cool-down phase, the phase transition points are determined. There is also a second laser and detector to monitor the melting of the sample surface by reflectivity changes. A melting trace for a UO2-5mol%Zr is given in Figure 2.
4/25
Session 2 – Paper 2.11
The 3rd European Review Meeting on Severe Accident Research (ERMSAR-2008)
Nesseber, Vigo Hotel, Bulgaria, 23-25 September 2008
FiberOptic
FiberOptic
Sample
LaserFocusing Unit
MultichannelPyrometer
High-Speed Pyrometer
Transient recorder
Lock-in Amp.
Laser power
Laser power
Specra strobe
High Power Laser
Diode Laser
FiberOptic
Monochromator
Telescope of Detection System
Figure 1: Laser flash set-up for phase diagram studies at ITU.
0,3 0,4 0,5 0,6 0,7 0,8 0,9 1,0 1,1 1,22300
2400
2500
2600
2700
2800
2900
3000
3100
3200
3300
3400
OD
R s
igna
l (ar
b.un
its)
Tem
pera
ture
, K
Time, s
True temperature
(polychromatic pyrometer)
Fast monochromatic pyrometer
(assumed emissivity = 0.85)
Vibrations of liquid surface
Tmelt
Figure 2 : Laser heating thermogram of UO2-5 mol% Zr
The liquidus and solidus temperatures for various compositions are indicated on the
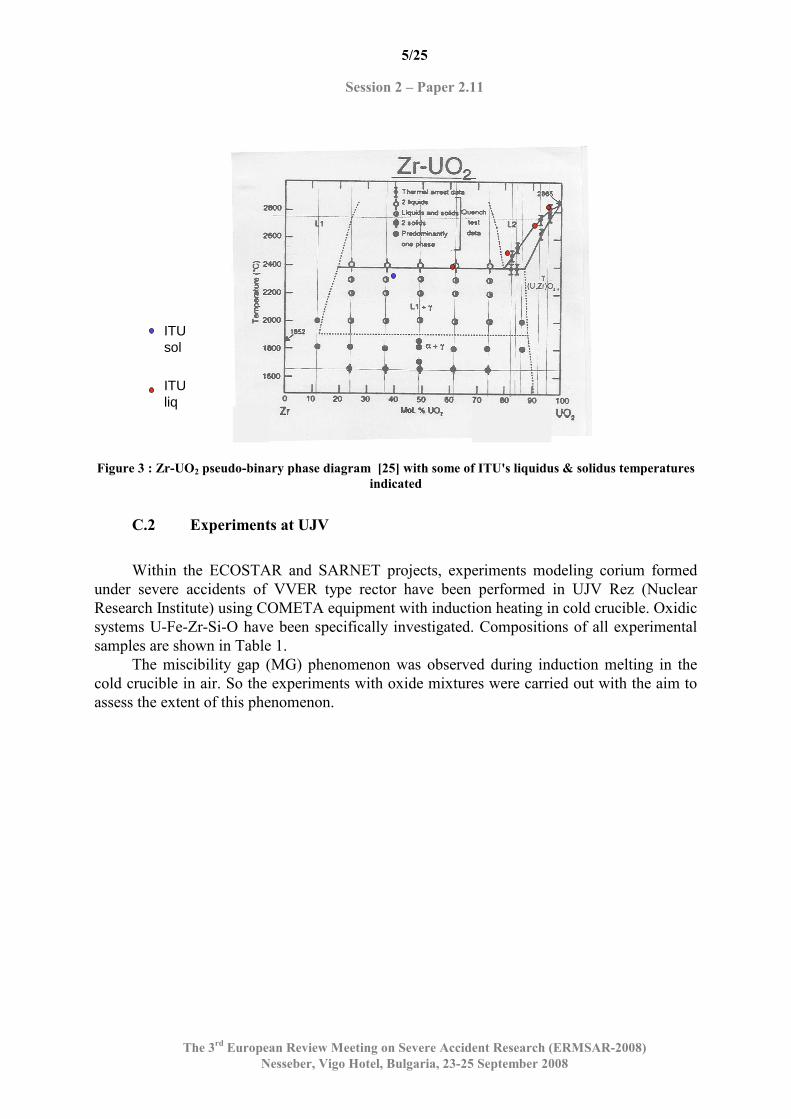
pseudo-binary UO2-Zr phase diagram of Juenke and White [25] in Figure 3 for comparison with their data The ITU results indicate that the liquidus temperature is rather constant below 80% mol. UO2 on the UO2-Zr(O) sectionand seem to confirm the presence of a miscibility gap in the UO2-Zr(O) system This, in turn, supports the use of Juenke & White's data for the NUCLEA model of the U-O-Zr phase diagram .
5/25
Session 2 – Paper 2.11
The 3rd European Review Meeting on Severe Accident Research (ERMSAR-2008)
Nesseber, Vigo Hotel, Bulgaria, 23-25 September 2008
Figure 3 : Zr-UO2 pseudo-binary phase diagram [25] with some of ITU's liquidus & solidus temperatures
indicated
C.2 Experiments at UJV
Within the ECOSTAR and SARNET projects, experiments modeling corium formed
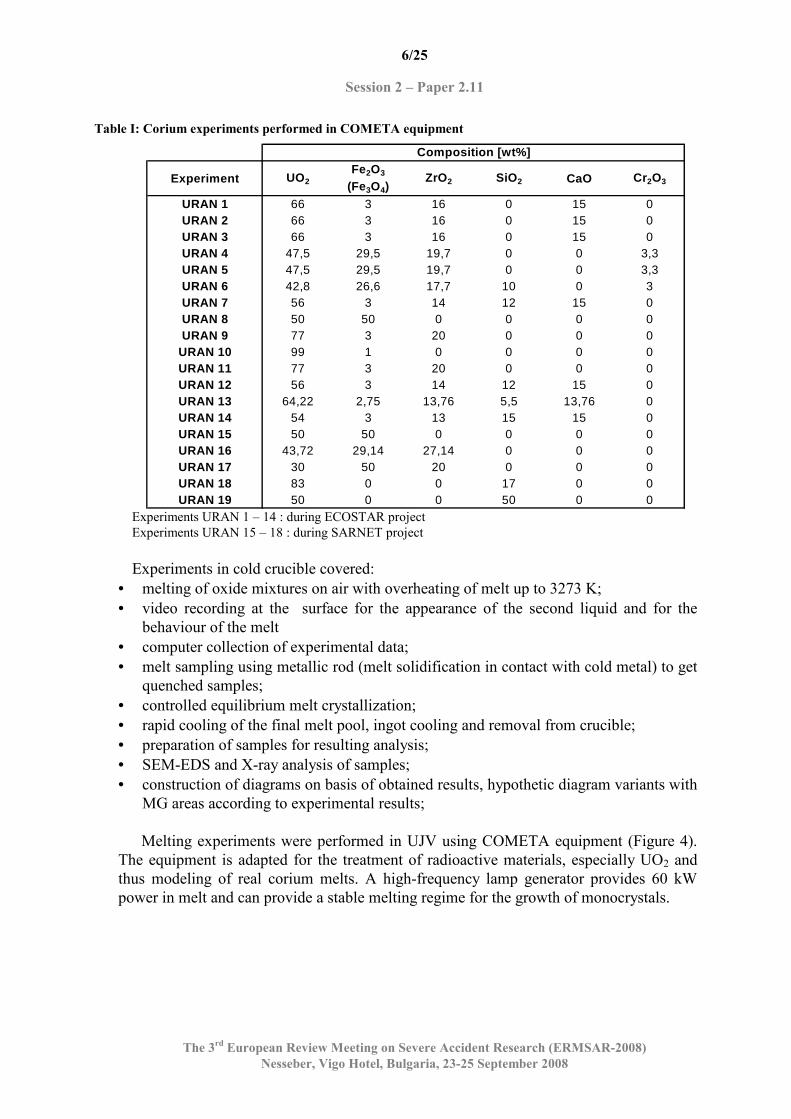
under severe accidents of VVER type rector have been performed in UJV Rez (Nuclear Research Institute) using COMETA equipment with induction heating in cold crucible. Oxidic systems U-Fe-Zr-Si-O have been specifically investigated. Compositions of all experimental samples are shown in Table 1.
The miscibility gap (MG) phenomenon was observed during induction melting in the cold crucible in air. So the experiments with oxide mixtures were carried out with the aim to assess the extent of this phenomenon.
ITU liq
ITU sol
6/25
Session 2 – Paper 2.11
The 3rd European Review Meeting on Severe Accident Research (ERMSAR-2008)
Nesseber, Vigo Hotel, Bulgaria, 23-25 September 2008
Table I: Corium experiments performed in COMETA equipment
Experiment UO2Fe2O3
(Fe3O4)ZrO2 SiO2 CaO Cr2O3
URAN 1 66 3 16 0 15 0URAN 2 66 3 16 0 15 0URAN 3 66 3 16 0 15 0URAN 4 47,5 29,5 19,7 0 0 3,3URAN 5 47,5 29,5 19,7 0 0 3,3URAN 6 42,8 26,6 17,7 10 0 3URAN 7 56 3 14 12 15 0URAN 8 50 50 0 0 0 0URAN 9 77 3 20 0 0 0
URAN 10 99 1 0 0 0 0URAN 11 77 3 20 0 0 0URAN 12 56 3 14 12 15 0URAN 13 64,22 2,75 13,76 5,5 13,76 0URAN 14 54 3 13 15 15 0URAN 15 50 50 0 0 0 0URAN 16 43,72 29,14 27,14 0 0 0URAN 17 30 50 20 0 0 0URAN 18 83 0 0 17 0 0URAN 19 50 0 0 50 0 0
Composition [wt%]
Experiments URAN 1 – 14 : during ECOSTAR project Experiments URAN 15 – 18 : during SARNET project
Experiments in cold crucible covered:
• melting of oxide mixtures on air with overheating of melt up to 3273 K; • video recording at the surface for the appearance of the second liquid and for the
behaviour of the melt • computer collection of experimental data; • melt sampling using metallic rod (melt solidification in contact with cold metal) to get
quenched samples; • controlled equilibrium melt crystallization; • rapid cooling of the final melt pool, ingot cooling and removal from crucible; • preparation of samples for resulting analysis; • SEM-EDS and X-ray analysis of samples; • construction of diagrams on basis of obtained results, hypothetic diagram variants with
MG areas according to experimental results;
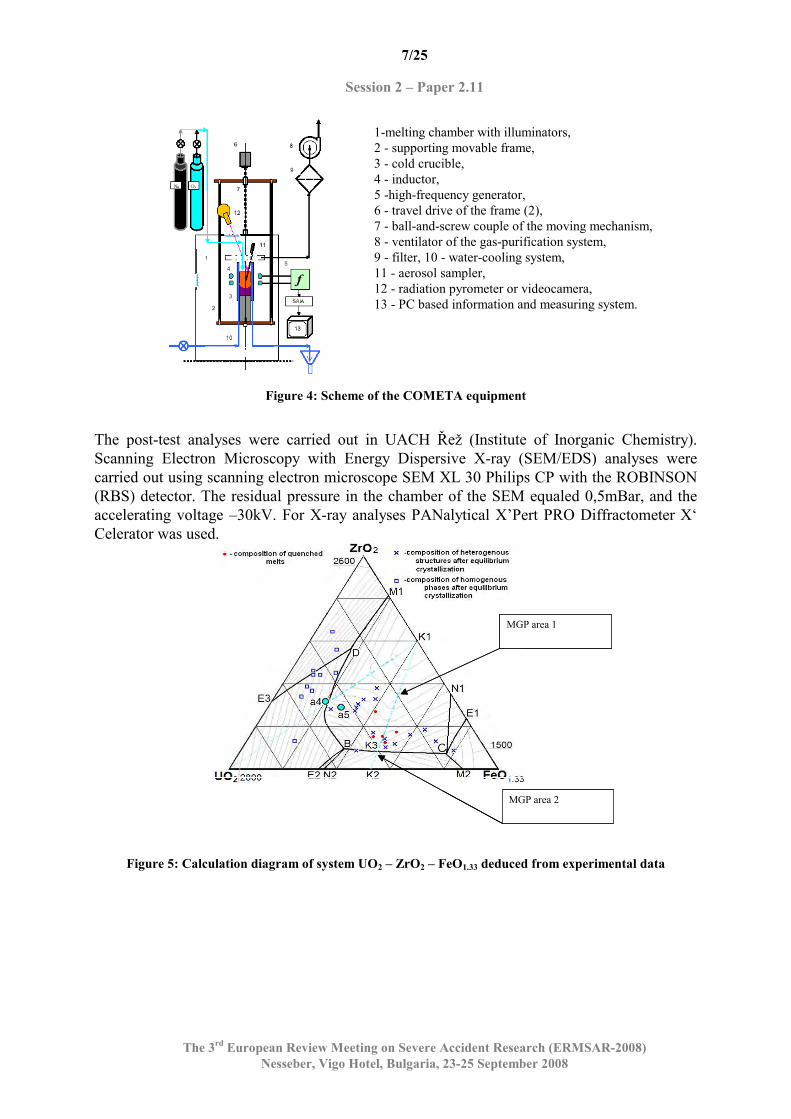
Melting experiments were performed in UJV using COMETA equipment (Figure 4). The equipment is adapted for the treatment of radioactive materials, especially UO2 and thus modeling of real corium melts. A high-frequency lamp generator provides 60 kW power in melt and can provide a stable melting regime for the growth of monocrystals.
7/25
Session 2 – Paper 2.11
The 3rd European Review Meeting on Severe Accident Research (ERMSAR-2008)
Nesseber, Vigo Hotel, Bulgaria, 23-25 September 2008
Figure 4: Scheme of the COMETA equipment
The post-test analyses were carried out in UACH Řež (Institute of Inorganic Chemistry). Scanning Electron Microscopy with Energy Dispersive X-ray (SEM/EDS) analyses were carried out using scanning electron microscope SEM XL 30 Philips CP with the ROBINSON (RBS) detector. The residual pressure in the chamber of the SEM equaled 0,5mBar, and the accelerating voltage –30kV. For X-ray analyses PANalytical X’Pert PRO Diffractometer X‘ Celerator was used.
MGP area 1
MGP area 2
MGP area 1MGP area 1
MGP area 2MGP area 2
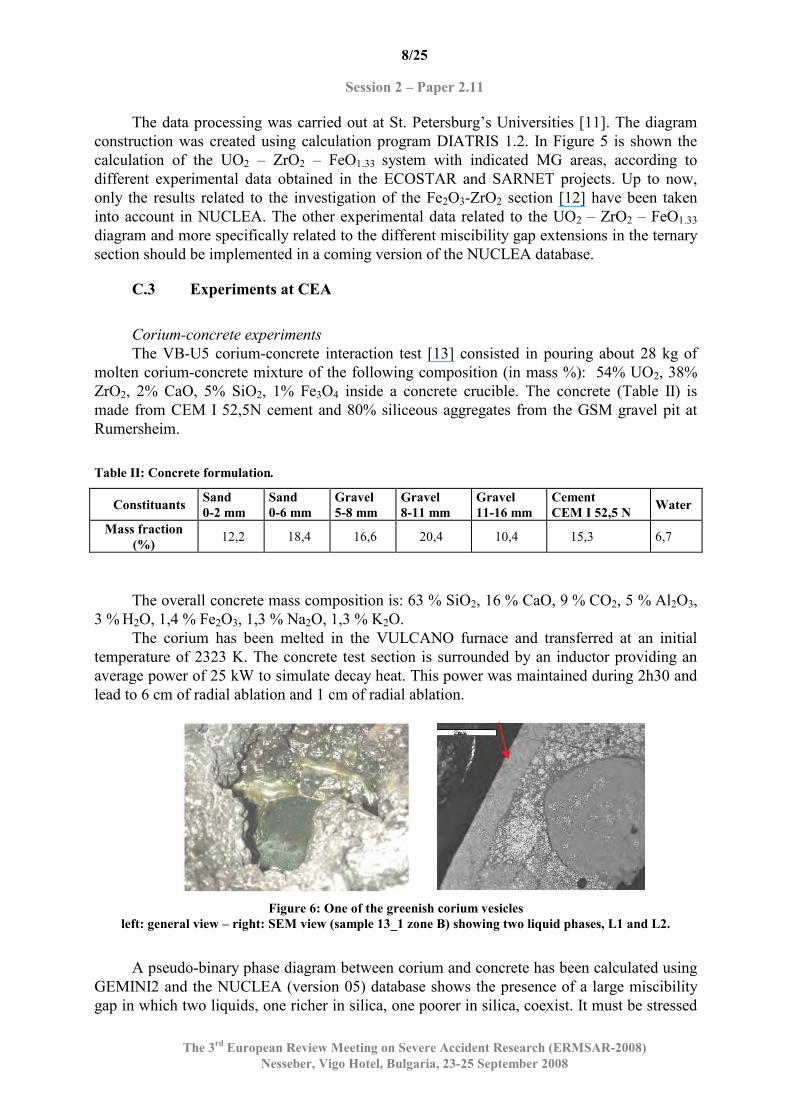
Figure 5: Calculation diagram of system UO2 – ZrO2 – FeO1.33 deduced from experimental data
1-melting chamber with illuminators, 2 - supporting movable frame, 3 - cold crucible, 4 - inductor, 5 -high-frequency generator, 6 - travel drive of the frame (2), 7 - ball-and-screw couple of the moving mechanism, 8 - ventilator of the gas-purification system, 9 - filter, 10 - water-cooling system, 11 - aerosol sampler, 12 - radiation pyrometer or videocamera, 13 - PC based information and measuring system.
8/25
Session 2 – Paper 2.11
The 3rd European Review Meeting on Severe Accident Research (ERMSAR-2008)
Nesseber, Vigo Hotel, Bulgaria, 23-25 September 2008
The data processing was carried out at St. Petersburg’s Universities [11]. The diagram construction was created using calculation program DIATRIS 1.2. In Figure 5 is shown the calculation of the UO2 – ZrO2 – FeO1.33 system with indicated MG areas, according to different experimental data obtained in the ECOSTAR and SARNET projects. Up to now, only the results related to the investigation of the Fe2O3-ZrO2 section [12] have been taken into account in NUCLEA. The other experimental data related to the UO2 – ZrO2 – FeO1.33 diagram and more specifically related to the different miscibility gap extensions in the ternary section should be implemented in a coming version of the NUCLEA database.
C.3 Experiments at CEA
Corium-concrete experiments
The VB-U5 corium-concrete interaction test [13] consisted in pouring about 28 kg of molten corium-concrete mixture of the following composition (in mass %): 54% UO2, 38% ZrO2, 2% CaO, 5% SiO2, 1% Fe3O4 inside a concrete crucible. The concrete (Table II) is made from CEM I 52,5N cement and 80% siliceous aggregates from the GSM gravel pit at Rumersheim.
Table II: Concrete formulation.
Constituants Sand
0-2 mm
Sand
0-6 mm
Gravel
5-8 mm
Gravel
8-11 mm
Gravel
11-16 mm
Cement
CEM I 52,5 N Water
Mass fraction
(%) 12,2 18,4 16,6 20,4 10,4 15,3 6,7
The overall concrete mass composition is: 63 % SiO2, 16 % CaO, 9 % CO2, 5 % Al2O3,
3 % H2O, 1,4 % Fe2O3, 1,3 % Na2O, 1,3 % K2O. The corium has been melted in the VULCANO furnace and transferred at an initial temperature of 2323 K. The concrete test section is surrounded by an inductor providing an average power of 25 kW to simulate decay heat. This power was maintained during 2h30 and lead to 6 cm of radial ablation and 1 cm of radial ablation.
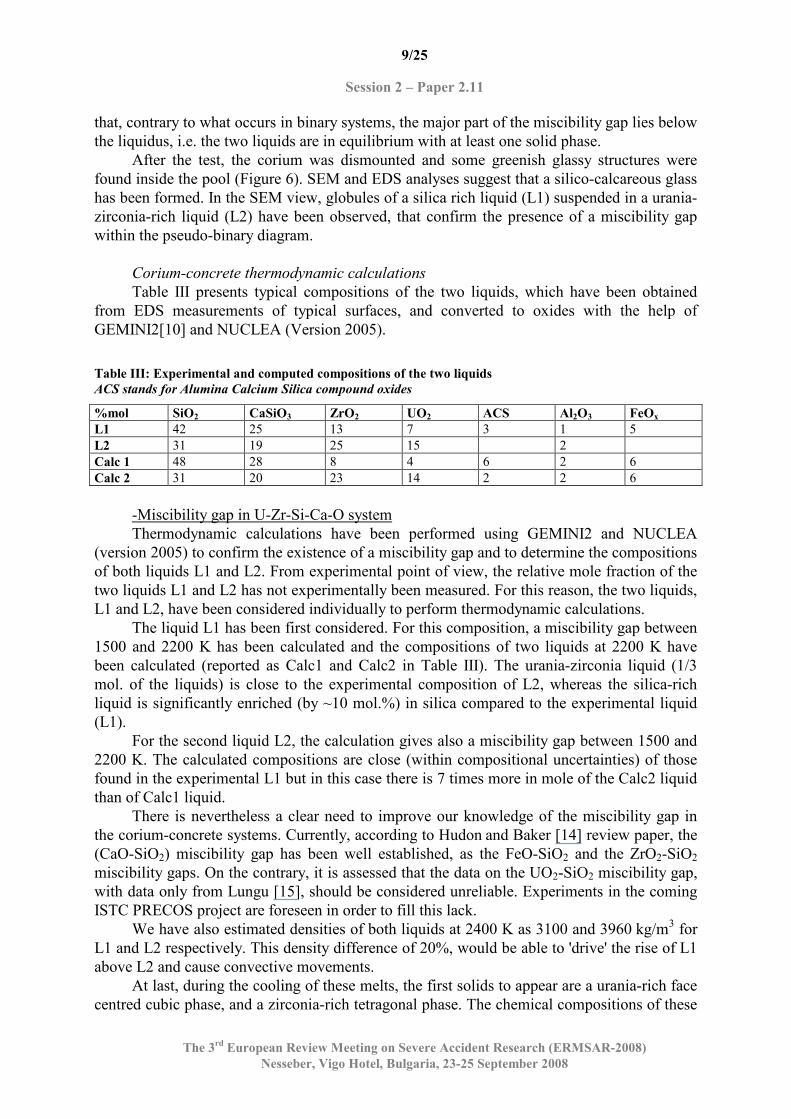
Figure 6: One of the greenish corium vesicles
left: general view – right: SEM view (sample 13_1 zone B) showing two liquid phases, L1 and L2.
A pseudo-binary phase diagram between corium and concrete has been calculated using
GEMINI2 and the NUCLEA (version 05) database shows the presence of a large miscibility gap in which two liquids, one richer in silica, one poorer in silica, coexist. It must be stressed
9/25
Session 2 – Paper 2.11
The 3rd European Review Meeting on Severe Accident Research (ERMSAR-2008)
Nesseber, Vigo Hotel, Bulgaria, 23-25 September 2008
that, contrary to what occurs in binary systems, the major part of the miscibility gap lies below the liquidus, i.e. the two liquids are in equilibrium with at least one solid phase.
After the test, the corium was dismounted and some greenish glassy structures were found inside the pool (Figure 6). SEM and EDS analyses suggest that a silico-calcareous glass has been formed. In the SEM view, globules of a silica rich liquid (L1) suspended in a urania-zirconia-rich liquid (L2) have been observed, that confirm the presence of a miscibility gap within the pseudo-binary diagram.
Corium-concrete thermodynamic calculations
Table III presents typical compositions of the two liquids, which have been obtained from EDS measurements of typical surfaces, and converted to oxides with the help of GEMINI2[10] and NUCLEA (Version 2005).
Table III: Experimental and computed compositions of the two liquids
ACS stands for Alumina Calcium Silica compound oxides
%mol SiO2 CaSiO3 ZrO2 UO2 ACS Al2O3 FeOx
L1 42 25 13 7 3 1 5 L2 31 19 25 15 2 Calc 1 48 28 8 4 6 2 6 Calc 2 31 20 23 14 2 2 6
-Miscibility gap in U-Zr-Si-Ca-O system Thermodynamic calculations have been performed using GEMINI2 and NUCLEA
(version 2005) to confirm the existence of a miscibility gap and to determine the compositions of both liquids L1 and L2. From experimental point of view, the relative mole fraction of the two liquids L1 and L2 has not experimentally been measured. For this reason, the two liquids, L1 and L2, have been considered individually to perform thermodynamic calculations.
The liquid L1 has been first considered. For this composition, a miscibility gap between 1500 and 2200 K has been calculated and the compositions of two liquids at 2200 K have been calculated (reported as Calc1 and Calc2 in Table III). The urania-zirconia liquid (1/3 mol. of the liquids) is close to the experimental composition of L2, whereas the silica-rich liquid is significantly enriched (by ~10 mol.%) in silica compared to the experimental liquid (L1).
For the second liquid L2, the calculation gives also a miscibility gap between 1500 and 2200 K. The calculated compositions are close (within compositional uncertainties) of those found in the experimental L1 but in this case there is 7 times more in mole of the Calc2 liquid than of Calc1 liquid.
There is nevertheless a clear need to improve our knowledge of the miscibility gap in the corium-concrete systems. Currently, according to Hudon and Baker [14] review paper, the (CaO-SiO2) miscibility gap has been well established, as the FeO-SiO2 and the ZrO2-SiO2 miscibility gaps. On the contrary, it is assessed that the data on the UO2-SiO2 miscibility gap, with data only from Lungu [15], should be considered unreliable. Experiments in the coming ISTC PRECOS project are foreseen in order to fill this lack.
We have also estimated densities of both liquids at 2400 K as 3100 and 3960 kg/m3 for L1 and L2 respectively. This density difference of 20%, would be able to 'drive' the rise of L1 above L2 and cause convective movements.
At last, during the cooling of these melts, the first solids to appear are a urania-rich face centred cubic phase, and a zirconia-rich tetragonal phase. The chemical compositions of these

10/25
Session 2 – Paper 2.11
The 3rd European Review Meeting on Severe Accident Research (ERMSAR-2008)
Nesseber, Vigo Hotel, Bulgaria, 23-25 September 2008
phases have been experimentally observed by SEM/EDS analyses. There is a satisfactory fit for the deposited solids, nevertheless we will continue to study this aspect for the bulk of VB-U5 corium pool.
- Solubility limit of Ca in U-Zr-O phases- The central part of the pool consisted of one liquid phase. A composition of this region
is the following (in mol.%): 14.7 % Zr, 9.8% U, 2.9% Si, 2.2 % Ca, 0.5% Fe, 0.2% Mg, 0.1% Al, 69.4% O
The GEMINI2 calculation with NUCLEA (version 2005) provides a liquidus temperature of 2640 K and a solidus of 1410 K. The first phase to appear is a zirconia-rich face-centred cubic phase with a U0.36Zr0.61Ca0.01O2.02 composition. It is close to an EDS measurement of U0.36Zr0.56Ca0.05O2.21 (major U-Zr phase). The main discrepancy between experiment and model lies with the solubility limit of calcium in zirconia-urania, which seems much larger than the 1% calculated solubility.
The second phase to appear, at 2200 K, is a second face-centred cubic solid solution with a composition of U0.7Zr0.1O2.1. It is close to another experimentally measured composition: U0.58Zr0.13Ca0.17Si0.1O2.17. If it is not an artefact due to the vicinity with the Si,Ca-rich matrix, there seems also to have a larger solubility of calcium (and also of silicon) in the solid solution compared to the calculated result.
Then, at 2100 K, a tetragonal phase, Zr0.87U0.13O2 appears, which is similar to the observed Zr0.75U0.18Ca0.04O2.11 phase (stars-like of about 5 µm), which has been solidified from the boundaries of the large FCC phase nodules. .
-U3O8 Some U3O8 has also been computed but not been observed in the SEM micrographs. A
first explanation could be the following: this could be due to a partly wrong evaluation of the oxygen activity for the oxides in the U,Zr,Ca,O system. A second explanation could be the bad detection of U3O8 phase: XRD analyses could provide information on the effective presence of U3O8 in the corium if there are at least 2% vol. of this phase present in the corium sample.
At this stage, most of the refractory materials is in the form of a mixed oxide with an
U/Zr ratio close to the calculations for the Scheil [16]-Gulliver[17] solidification path (infinite diffusion in liquids, no diffusion in solids) which supports the fact that the cooling was out of equilibrium.
In conclusion, the GEMINI2 calculations with NUCLEA (version 2005) provide useful information on the solidification of the VB-U5 central pool.
C.4 Experiments at NITI (CORPHAD - PRECOS)
From 2003, NITI and ISC RAS have implemented the ISTC CORPHAD (Corium phase
diagrams) project funded by European Commission. One of CORPHAD's objectives was to investigate phase equilibria in the binary and ternary oxidized and suboxidized systems: ZrO2–FeO, UO2–FeO, FeOx–SiO2, and U–O, U–Zr–O, Fe–Zr–O, U–Fe–O depending on oxygen partial pressure. Some of the CORPHAD data on ternary systems are then relevant for the phase equilibrium investigation in the miscibility gap domain of the U–Zr–Fe(Cr,Ni,Mn)–O system. The phase diagram study of several systems, particularly UO2–SiO2 and U–Zr–Fe–O has been continued in the frame of the recently started ISTC PRECOS (Phase relations in corium systems) project also funded by EU. Some of the CORPHAD results are listed hereunder.
11/25
Session 2 – Paper 2.11
The 3rd European Review Meeting on Severe Accident Research (ERMSAR-2008)
Nesseber, Vigo Hotel, Bulgaria, 23-25 September 2008
C.4.1 ZrO2–FeO and UO2–FeO systems
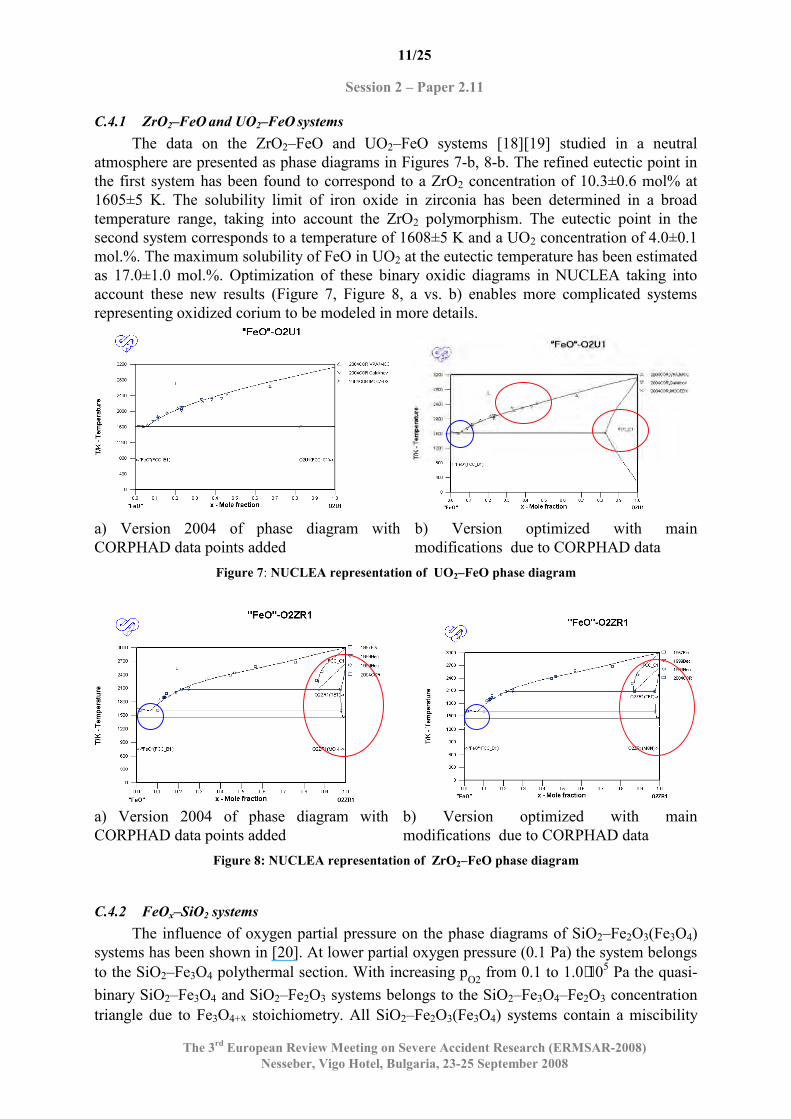
The data on the ZrO2–FeO and UO2–FeO systems [18][19] studied in a neutral atmosphere are presented as phase diagrams in Figures 7-b, 8-b. The refined eutectic point in the first system has been found to correspond to a ZrO2 concentration of 10.3±0.6 mol% at 1605±5 K. The solubility limit of iron oxide in zirconia has been determined in a broad temperature range, taking into account the ZrO2 polymorphism. The eutectic point in the second system corresponds to a temperature of 1608±5 K and a UO2 concentration of 4.0±0.1 mol.%. The maximum solubility of FeO in UO2 at the eutectic temperature has been estimated as 17.0±1.0 mol.%. Optimization of these binary oxidic diagrams in NUCLEA taking into account these new results (Figure 7, Figure 8, a vs. b) enables more complicated systems representing oxidized corium to be modeled in more details.
a) Version 2004 of phase diagram with CORPHAD data points added
b) Version optimized with main modifications due to CORPHAD data
Figure 7: NUCLEA representation of UO2–FeO phase diagram
a) Version 2004 of phase diagram with CORPHAD data points added
b) Version optimized with main modifications due to CORPHAD data
Figure 8: NUCLEA representation of ZrO2–FeO phase diagram
C.4.2 FeOx–SiO2 systems
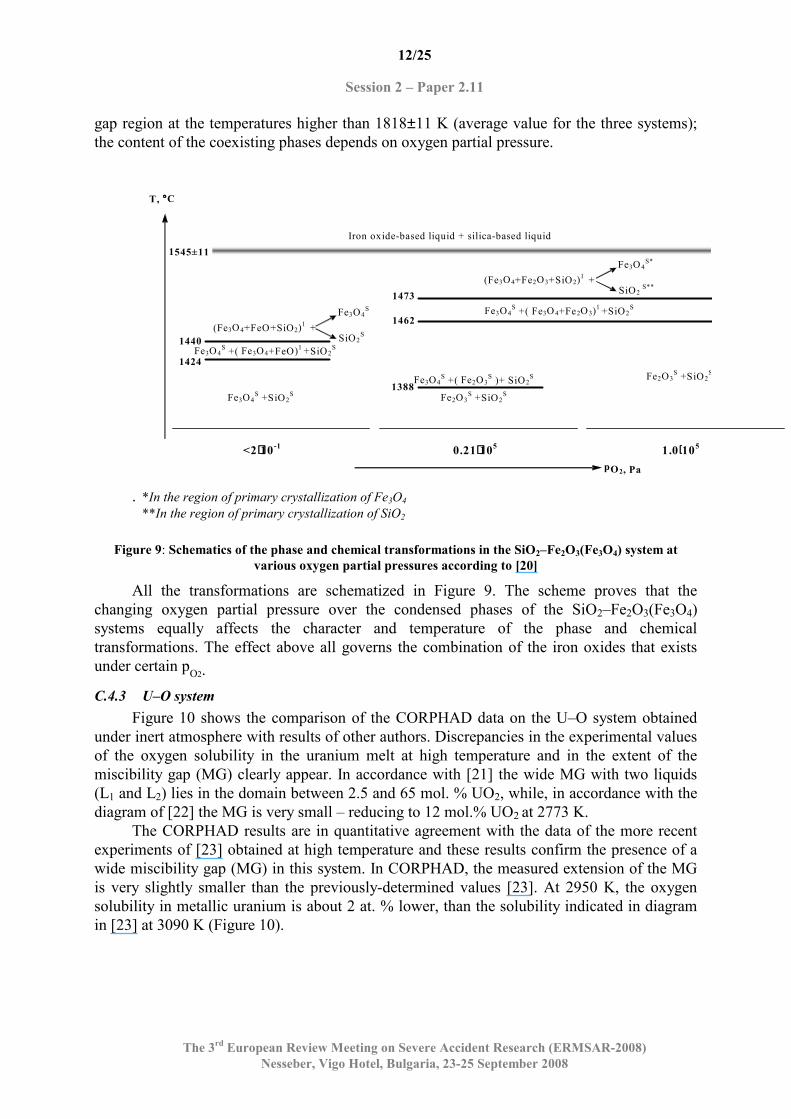
The influence of oxygen partial pressure on the phase diagrams of SiO2–Fe2O3(Fe3O4) systems has been shown in [20]. At lower partial oxygen pressure (0.1 Pa) the system belongs to the SiO2–Fe3O4 polythermal section. With increasing pO2 from 0.1 to 1.0⋅105 Pa the quasi-binary SiO2–Fe3O4 and SiO2–Fe2O3 systems belongs to the SiO2–Fe3O4–Fe2O3 concentration triangle due to Fe3O4+x stoichiometry. All SiO2–Fe2O3(Fe3O4) systems contain a miscibility
12/25
Session 2 – Paper 2.11
The 3rd European Review Meeting on Severe Accident Research (ERMSAR-2008)
Nesseber, Vigo Hotel, Bulgaria, 23-25 September 2008
gap region at the temperatures higher than 1818±11 K (average value for the three systems); the content of the coexisting phases depends on oxygen partial pressure.
°°°°
1388
0.21 ⋅⋅⋅⋅ 10 5
Fe 2 O 3 S + SiO 2
S
Fe 3 O 4 S +( Fe 2 O 3
S )+ SiO 2 S
Fe 3 O 4 S +( Fe 3 O 4 +Fe 2 O 3 )
1 +SiO 2 S
1 462
1 47 3
(Fe 3 O 4 +Fe 2 O 3 +SiO 2 ) 1 +
Fe 3 O 4 S*
SiO 2 S**
1. 0 ⋅⋅⋅⋅ 10 5
Fe 2 O 3 S + SiO 2
S
1 4 2 4 Fe 3 O 4
S +( Fe 3 O 4 +FeO ) 1 + SiO 2
S
< 2 ⋅⋅⋅⋅ 10 - 1
Fe 3 O 4 S + SiO 2
S
1 440 (Fe 3 O 4 +FeO+SiO 2 )
1 +
Fe 3 O 4 S
SiO 2 S
T, C
p O 2 , Pa
1 545±11
Iron oxide-based liquid + silica-based liquid
. *In the region of primary crystallization of Fe3O4
**In the region of primary crystallization of SiO2
Figure 9: Schematics of the phase and chemical transformations in the SiO2–Fe2O3(Fe3O4) system at
various oxygen partial pressures according to [20]
All the transformations are schematized in Figure 9. The scheme proves that the changing oxygen partial pressure over the condensed phases of the SiO2–Fe2O3(Fe3O4) systems equally affects the character and temperature of the phase and chemical transformations. The effect above all governs the combination of the iron oxides that exists under certain p
O2.
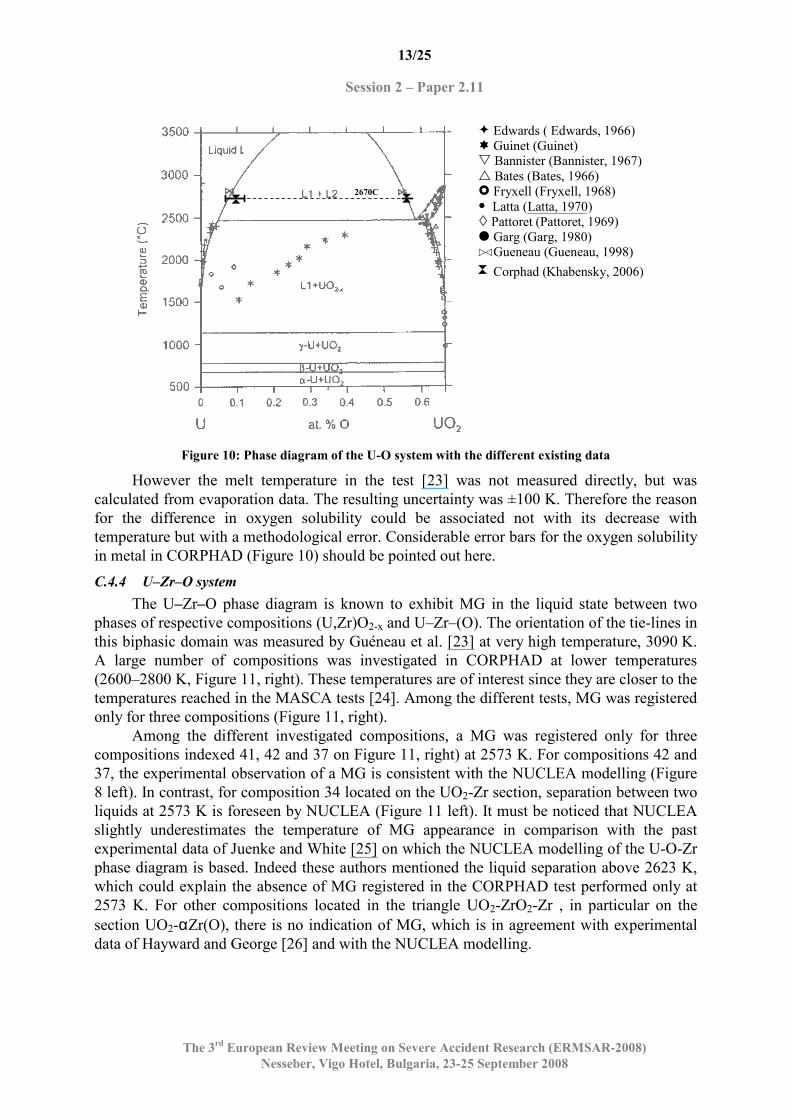
C.4.3 U–O system
Figure 10 shows the comparison of the CORPHAD data on the U–O system obtained under inert atmosphere with results of other authors. Discrepancies in the experimental values of the oxygen solubility in the uranium melt at high temperature and in the extent of the miscibility gap (MG) clearly appear. In accordance with [21] the wide MG with two liquids (L1 and L2) lies in the domain between 2.5 and 65 mol. % UO2, while, in accordance with the diagram of [22] the MG is very small – reducing to 12 mol.% UO2 at 2773 K.
The CORPHAD results are in quantitative agreement with the data of the more recent experiments of [23] obtained at high temperature and these results confirm the presence of a wide miscibility gap (MG) in this system. In CORPHAD, the measured extension of the MG is very slightly smaller than the previously-determined values [23]. At 2950 K, the oxygen solubility in metallic uranium is about 2 at. % lower, than the solubility indicated in diagram in [23] at 3090 K (Figure 10).
13/25
Session 2 – Paper 2.11
The 3rd European Review Meeting on Severe Accident Research (ERMSAR-2008)
Nesseber, Vigo Hotel, Bulgaria, 23-25 September 2008
� Edwards ( Edwards, 1966) � Guinet (Guinet) � Bannister (Bannister, 1967) � Bates (Bates, 1966) � Fryxell (Fryxell, 1968) � Latta (Latta, 1970) � Pattoret ( Pattoret , 1969) � Garg (Garg, 1980) � � Gueneau (Gueneau, 1998)
Corphad ( Khabensky, 2006)
2670С
Figure 10: Phase diagram of the U-O system with the different existing data
However the melt temperature in the test [23] was not measured directly, but was calculated from evaporation data. The resulting uncertainty was ±100 K. Therefore the reason for the difference in oxygen solubility could be associated not with its decrease with temperature but with a methodological error. Considerable error bars for the oxygen solubility in metal in CORPHAD (Figure 10) should be pointed out here.
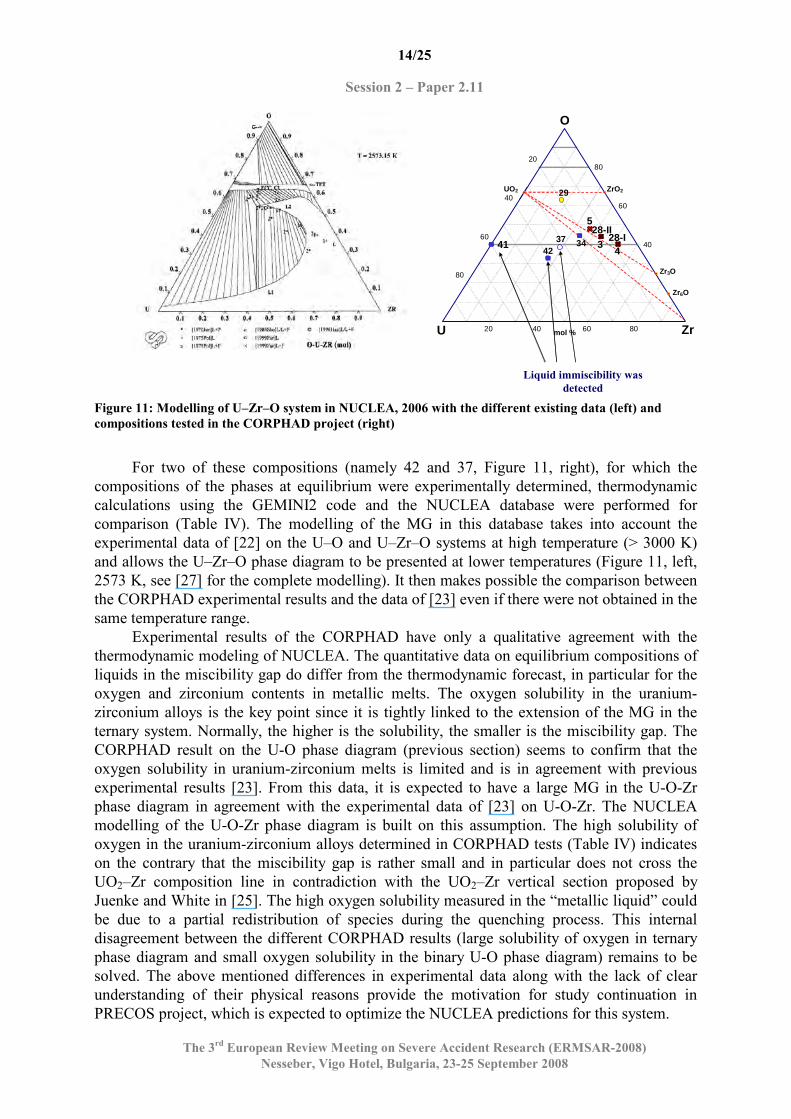
C.4.4 U–Zr–O system
The U–Zr–O phase diagram is known to exhibit MG in the liquid state between two phases of respective compositions (U,Zr)O2-x and U–Zr–(O). The orientation of the tie-lines in this biphasic domain was measured by Guéneau et al. [23] at very high temperature, 3090 K. A large number of compositions was investigated in CORPHAD at lower temperatures (2600–2800 K, Figure 11, right). These temperatures are of interest since they are closer to the temperatures reached in the MASCA tests [24]. Among the different tests, MG was registered only for three compositions (Figure 11, right).
Among the different investigated compositions, a MG was registered only for three compositions indexed 41, 42 and 37 on Figure 11, right) at 2573 K. For compositions 42 and 37, the experimental observation of a MG is consistent with the NUCLEA modelling (Figure 8 left). In contrast, for composition 34 located on the UO2-Zr section, separation between two liquids at 2573 K is foreseen by NUCLEA (Figure 11 left). It must be noticed that NUCLEA slightly underestimates the temperature of MG appearance in comparison with the past experimental data of Juenke and White [25] on which the NUCLEA modelling of the U-O-Zr phase diagram is based. Indeed these authors mentioned the liquid separation above 2623 K, which could explain the absence of MG registered in the CORPHAD test performed only at 2573 K. For other compositions located in the triangle UO2-ZrO2-Zr , in particular on the section UO2-αZr(O), there is no indication of MG, which is in agreement with experimental data of Hayward and George [26] and with the NUCLEA modelling.
14/25
Session 2 – Paper 2.11
The 3rd European Review Meeting on Severe Accident Research (ERMSAR-2008)
Nesseber, Vigo Hotel, Bulgaria, 23-25 September 2008
Figure 11: Modelling of U–Zr–O system in NUCLEA, 2006 with the different existing data (left) and
compositions tested in the CORPHAD project (right)
For two of these compositions (namely 42 and 37, Figure 11, right), for which the
compositions of the phases at equilibrium were experimentally determined, thermodynamic calculations using the GEMINI2 code and the NUCLEA database were performed for comparison (Table IV). The modelling of the MG in this database takes into account the experimental data of [22] on the U–O and U–Zr–O systems at high temperature (> 3000 K) and allows the U–Zr–O phase diagram to be presented at lower temperatures (Figure 11, left, 2573 K, see [27] for the complete modelling). It then makes possible the comparison between the CORPHAD experimental results and the data of [23] even if there were not obtained in the same temperature range.
Experimental results of the CORPHAD have only a qualitative agreement with the thermodynamic modeling of NUCLEA. The quantitative data on equilibrium compositions of liquids in the miscibility gap do differ from the thermodynamic forecast, in particular for the oxygen and zirconium contents in metallic melts. The oxygen solubility in the uranium-zirconium alloys is the key point since it is tightly linked to the extension of the MG in the ternary system. Normally, the higher is the solubility, the smaller is the miscibility gap. The CORPHAD result on the U-O phase diagram (previous section) seems to confirm that the oxygen solubility in uranium-zirconium melts is limited and is in agreement with previous experimental results [23]. From this data, it is expected to have a large MG in the U-O-Zr phase diagram in agreement with the experimental data of [23] on U-O-Zr. The NUCLEA modelling of the U-O-Zr phase diagram is built on this assumption. The high solubility of oxygen in the uranium-zirconium alloys determined in CORPHAD tests (Table IV) indicates on the contrary that the miscibility gap is rather small and in particular does not cross the UO2–Zr composition line in contradiction with the UO2–Zr vertical section proposed by Juenke and White in [25]. The high oxygen solubility measured in the “metallic liquid” could be due to a partial redistribution of species during the quenching process. This internal disagreement between the different CORPHAD results (large solubility of oxygen in ternary phase diagram and small oxygen solubility in the binary U-O phase diagram) remains to be solved. The above mentioned differences in experimental data along with the lack of clear understanding of their physical reasons provide the motivation for study continuation in PRECOS project, which is expected to optimize the NUCLEA predictions for this system.
Liquid immiscibility was
detected
20
40
60
80
40
60
80
20 40 60 80
O
U Zr
ZrO2 UO2
Zr6O
Zr3O
mol %
28-I 28-II
29
34 37 42
41 4
3
5
15/25
Session 2 – Paper 2.11
The 3rd European Review Meeting on Severe Accident Research (ERMSAR-2008)
Nesseber, Vigo Hotel, Bulgaria, 23-25 September 2008
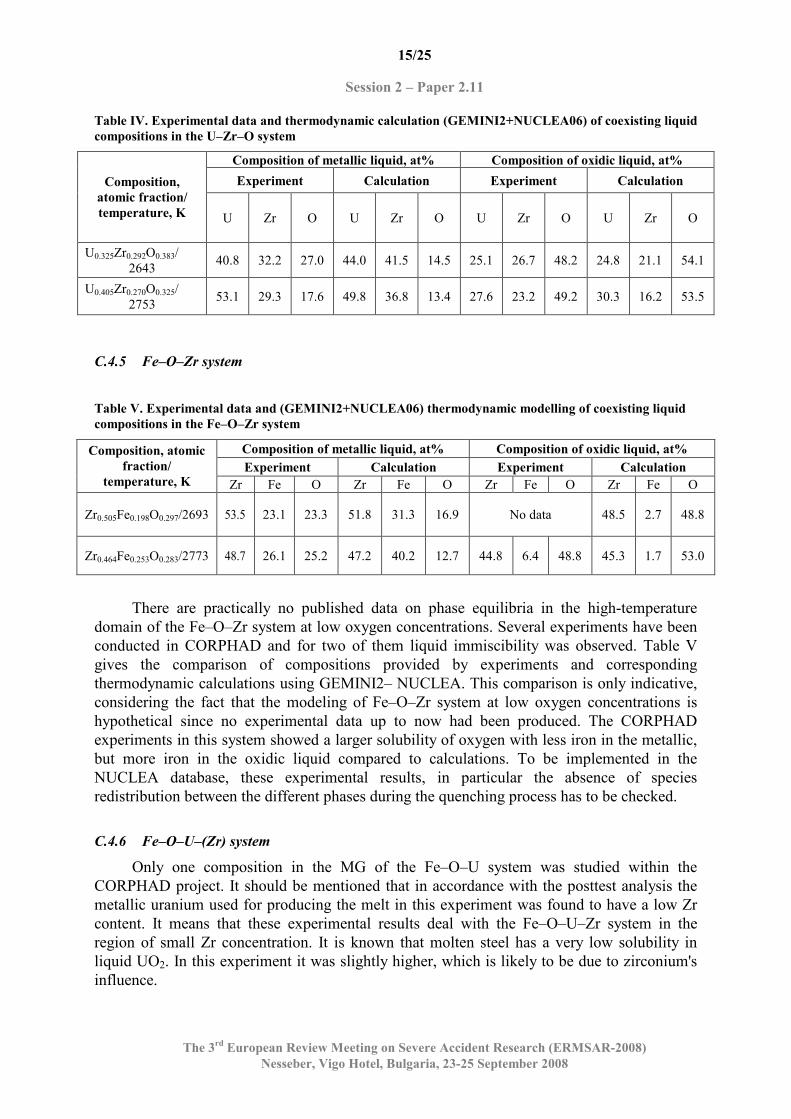
Table IV. Experimental data and thermodynamic calculation (GEMINI2+NUCLEA06) of coexisting liquid
compositions in the U–Zr–O system
Composition of metallic liquid, at% Composition of oxidic liquid, at%
Experiment Calculation Experiment Calculation Composition,
atomic fraction/
temperature, K U Zr O U Zr O U Zr O U Zr O
U0.325Zr0.292O0.383/ 2643
40.8 32.2 27.0 44.0 41.5 14.5 25.1 26.7 48.2 24.8 21.1 54.1
U0.405Zr0.270O0.325/ 2753
53.1 29.3 17.6 49.8 36.8 13.4 27.6 23.2 49.2 30.3 16.2 53.5
C.4.5 Fe–O–Zr system
Table V. Experimental data and (GEMINI2+NUCLEA06) thermodynamic modelling of coexisting liquid
compositions in the Fe–O–Zr system
Composition of metallic liquid, at% Composition of oxidic liquid, at%
Experiment Calculation Experiment Calculation
Composition, atomic
fraction/
temperature, K Zr Fe O Zr Fe O Zr Fe O Zr Fe O
Zr0.505Fe0.198O0.297/2693 53.5 23.1 23.3 51.8 31.3 16.9 No data 48.5 2.7 48.8
Zr0.464Fe0.253O0.283/2773 48.7 26.1 25.2 47.2 40.2 12.7 44.8 6.4 48.8 45.3 1.7 53.0
There are practically no published data on phase equilibria in the high-temperature domain of the Fe–O–Zr system at low oxygen concentrations. Several experiments have been conducted in CORPHAD and for two of them liquid immiscibility was observed. Table V gives the comparison of compositions provided by experiments and corresponding thermodynamic calculations using GEMINI2– NUCLEA. This comparison is only indicative, considering the fact that the modeling of Fe–O–Zr system at low oxygen concentrations is hypothetical since no experimental data up to now had been produced. The CORPHAD experiments in this system showed a larger solubility of oxygen with less iron in the metallic, but more iron in the oxidic liquid compared to calculations. To be implemented in the NUCLEA database, these experimental results, in particular the absence of species redistribution between the different phases during the quenching process has to be checked.
C.4.6 Fe–O–U–(Zr) system
Only one composition in the MG of the Fe–O–U system was studied within the CORPHAD project. It should be mentioned that in accordance with the posttest analysis the metallic uranium used for producing the melt in this experiment was found to have a low Zr content. It means that these experimental results deal with the Fe–O–U–Zr system in the region of small Zr concentration. It is known that molten steel has a very low solubility in liquid UO2. In this experiment it was slightly higher, which is likely to be due to zirconium's influence.
16/25
Session 2 – Paper 2.11
The 3rd European Review Meeting on Severe Accident Research (ERMSAR-2008)
Nesseber, Vigo Hotel, Bulgaria, 23-25 September 2008
Table VI gives the comparison of experimental and calculated data on the composition of liquids in the MG. In contrast to the calculations, experimental data showed a larger solubility of oxygen in the metallic liquid and iron in the oxidic liquid. This is consistent with the results of the Fe–O–Zr system.
Table VI: Experimental data and thermodynamic modelling of coexisting liquid compositions in the Fe–
O–U–Zr system
Composition of liquids, at%
Experiment Calculation
Composition,
atomic fraction/
temperature, K
Element
Oxidic Metallic Oxidic Metallic
U 41.0 64.0 40.0 65.6 Fe 2.0 23.5 0.0 27.5 Zr 2.3 3.9 1.3 4.8
U0.600Fe0.216Zr0.400O0.144 2873
O 54.8 8.5 58.7 2.0
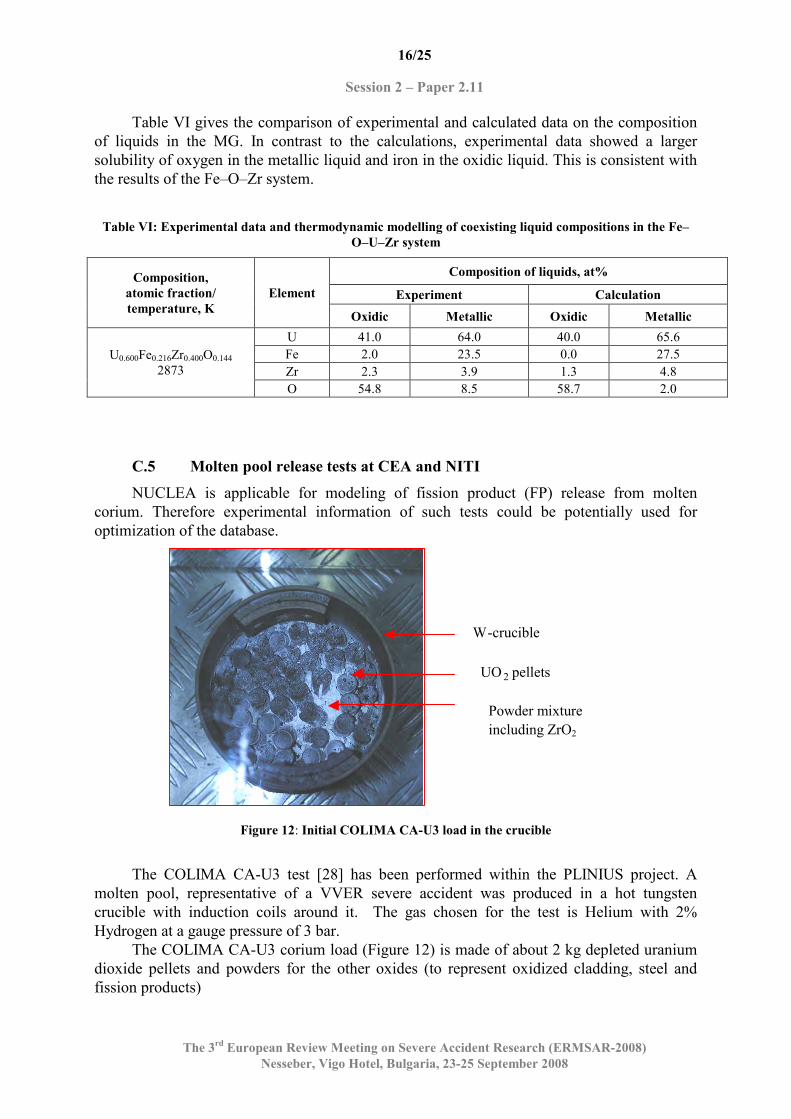
C.5 Molten pool release tests at CEA and NITI
NUCLEA is applicable for modeling of fission product (FP) release from molten corium. Therefore experimental information of such tests could be potentially used for optimization of the database.
W - crucible
UO 2 pellets
Powder mixture including ZrO2
Figure 12: Initial COLIMA CA-U3 load in the crucible
The COLIMA CA-U3 test [28] has been performed within the PLINIUS project. A
molten pool, representative of a VVER severe accident was produced in a hot tungsten crucible with induction coils around it. The gas chosen for the test is Helium with 2% Hydrogen at a gauge pressure of 3 bar.
The COLIMA CA-U3 corium load (Figure 12) is made of about 2 kg depleted uranium dioxide pellets and powders for the other oxides (to represent oxidized cladding, steel and fission products)

17/25
Session 2 – Paper 2.11
The 3rd European Review Meeting on Severe Accident Research (ERMSAR-2008)
Nesseber, Vigo Hotel, Bulgaria, 23-25 September 2008
The test sequence can basically be divided into three different phases: a heating-up phase, a heating plateau phase and a fission product release phase. After the heating-up phase, a long high temperature plateau is maintained in order to get aerosol sampling. A corium melt temperature of 2760°C is reached and kept for more than 50 minutes. The test ends with melt through of the crucible wall and a large flow of the liquid corium outside the crucible.
Even if the test terminated due to a crucible melt through, the corium that stayed in the crucible was analyzed. First of all, it is estimated that the equivalent of 25 pellets did not melt. The EDS (Energy Dispersion Spectrometry) analysis shows two distinct phases in the melted corium: one main phase, 95% in volume, enriched in uranium, and, one minor phase, 5% in volume, depleted in uranium. The aerosols collected in a thermal gradient tube, filters and impactors have also been analyzed.
CA-U3 Effect of gas flow on calculation at 3033 K
0.001%
0.010%
0.100%
1.000%
10.000%
100.000%
AG BA CR FE LA O SR U ZR
Vol
atile
frac
tion
1/20 of gas flow in contact with pool
all gas flow in contact with pool
no aerosol detected
traces of La, Ce ,Nd aerosols;
No Y aerosol
low releases
most Sr released
~1% releases
50% Fe released
~all Cr released
~100% Te released
Figure 13: GEMINI2 posttest calculations of COLIMA CA-U3
A thermodynamic modeling of the release has been made with GEMINI2 with the NUCLEA database (version 2005). Post test calculations are reported in Figure 13 for two cases considering that the pool was in contact with 5% of the gas flow (fraction estimated by CFD calculations before the test) or with all the gas flow, for equilibrium calculations at 3033 K. Most of the strontium has been released from the melt (contrary to the assessement value of 10% [29]). This release must have occurred during the last phase of the test. Very small aerosols (geometric diameter around 0.3µm) have been collected in the impactor. The discrepancy between this high release rate and the lower rate observed during FPT1 [30] suggests the role of molybdates (Mo was absent of CA-U3 in order to avoid interaction with tungsten) in stabilizing strontium oxides. Except for strontium, all the tendencies for the elements in the database (Ag represents Te, La represents all the lanthanides) are satisfactorily fitted. The effect of pool temperature uncertainties has been verified that it does not modify the calculation results qualitatively. For steel components (Fe, Cr), the high release rates seem to indicate that, assuming correct modeling, most of the gas flow was in thermodynamic equilibrium with the corium pool.
Tests on low volatile FP release from molten corium pool having different oxidation indexes were recently carried out in NITI in the frames of EVAN ISTC project. In [31],
18/25
Session 2 – Paper 2.11
The 3rd European Review Meeting on Severe Accident Research (ERMSAR-2008)
Nesseber, Vigo Hotel, Bulgaria, 23-25 September 2008
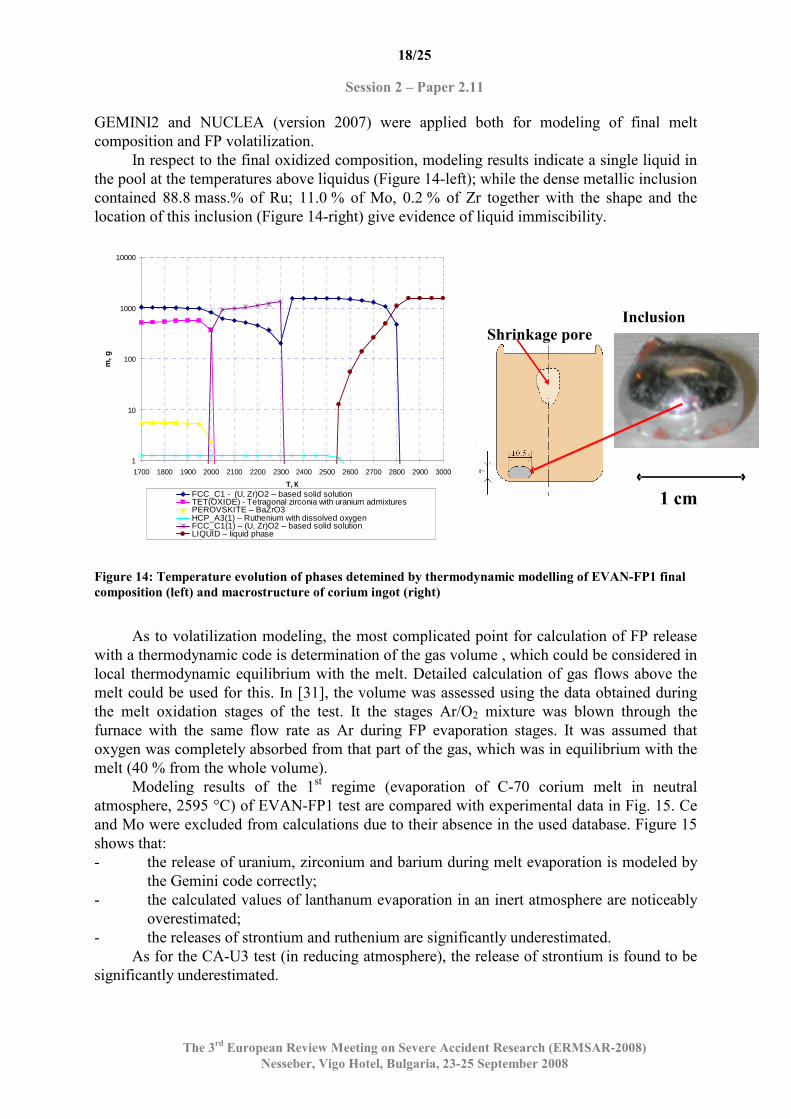
GEMINI2 and NUCLEA (version 2007) were applied both for modeling of final melt composition and FP volatilization.
In respect to the final oxidized composition, modeling results indicate a single liquid in the pool at the temperatures above liquidus (Figure 14-left); while the dense metallic inclusion contained 88.8 mass.% of Ru; 11.0 % of Mo, 0.2 % of Zr together with the shape and the location of this inclusion (Figure 14-right) give evidence of liquid immiscibility.
1
10
100
1000
10000
1700 1800 1900 2000 2100 2200 2300 2400 2500 2600 2700 2800 2900 3000
Т, К
m, g
FCC_C1 - (U, Zr)O2 – based solid solutionTET(OXIDE) - Tetragonal zirconia with uranium admixturesPEROVSKITE – BaZrO3HCP_A3(1) – Ruthenium with dissolved oxygenFCC_C1(1) – (U, Zr)O2 – based solid solutionLIQUID – liquid phase
Inclusion
Figure 14: Temperature evolution of phases detemined by thermodynamic modelling of EVAN-FP1 final
composition (left) and macrostructure of corium ingot (right)
As to volatilization modeling, the most complicated point for calculation of FP release
with a thermodynamic code is determination of the gas volume , which could be considered in local thermodynamic equilibrium with the melt. Detailed calculation of gas flows above the melt could be used for this. In [31], the volume was assessed using the data obtained during the melt oxidation stages of the test. It the stages Ar/O2 mixture was blown through the furnace with the same flow rate as Ar during FP evaporation stages. It was assumed that oxygen was completely absorbed from that part of the gas, which was in equilibrium with the melt (40 % from the whole volume).
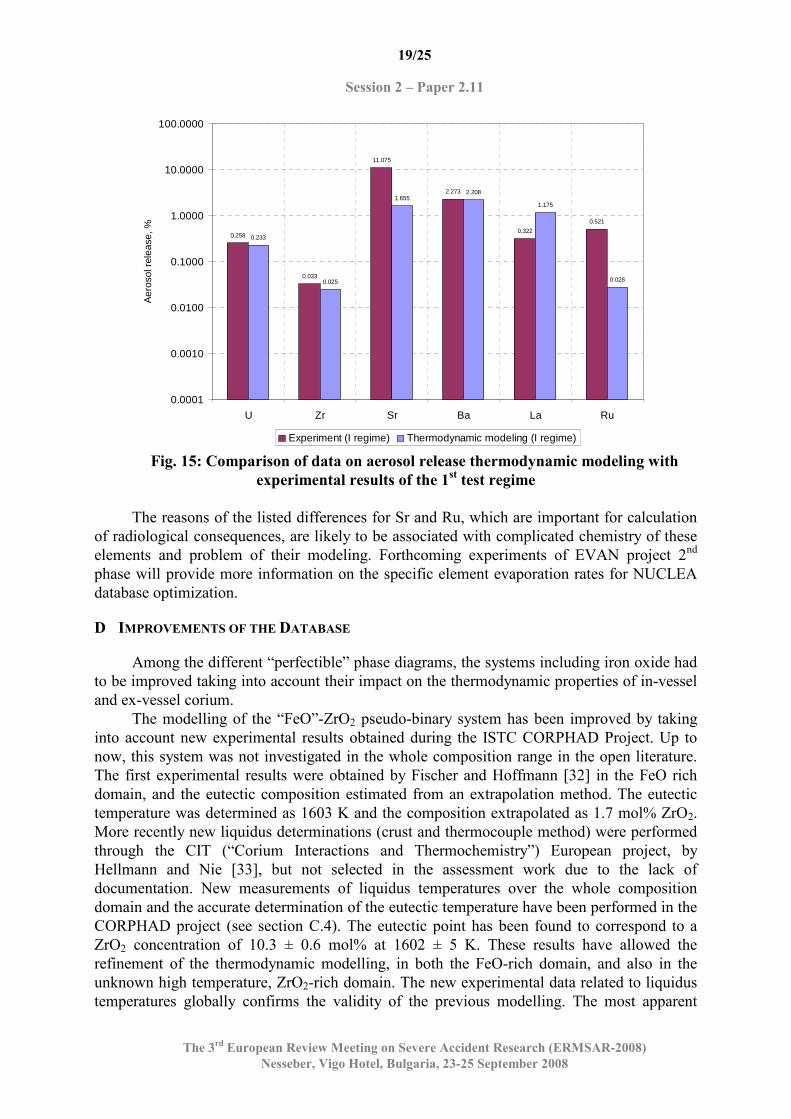
Modeling results of the 1st regime (evaporation of C-70 corium melt in neutral atmosphere, 2595 °C) of EVAN-FP1 test are compared with experimental data in Fig. 15. Се and Мо were excluded from calculations due to their absence in the used database. Figure 15 shows that: - the release of uranium, zirconium and barium during melt evaporation is modeled by
the Gemini code correctly; - the calculated values of lanthanum evaporation in an inert atmosphere are noticeably
overestimated; - the releases of strontium and ruthenium are significantly underestimated.
As for the CA-U3 test (in reducing atmosphere), the release of strontium is found to be significantly underestimated.
Shrinkage pore
1 cm
19/25
Session 2 – Paper 2.11
The 3rd European Review Meeting on Severe Accident Research (ERMSAR-2008)
Nesseber, Vigo Hotel, Bulgaria, 23-25 September 2008
0.258
0.033
11.075
2.273
0.322
0.521
0.233
0.025
1.6552.208
1.175
0.028
0.0001
0.0010
0.0100
0.1000
1.0000
10.0000
100.0000
U Zr Sr Ba La Ru
Aer
osol
rel
ease
, %
Experiment (I regime) Thermodynamic modeling (I regime)
Fig. 15: Comparison of data on aerosol release thermodynamic modeling with
experimental results of the 1st test regime
The reasons of the listed differences for Sr and Ru, which are important for calculation
of radiological consequences, are likely to be associated with complicated chemistry of these elements and problem of their modeling. Forthcoming experiments of EVAN project 2nd phase will provide more information on the specific element evaporation rates for NUCLEA database optimization.
D IMPROVEMENTS OF THE DATABASE
Among the different “perfectible” phase diagrams, the systems including iron oxide had to be improved taking into account their impact on the thermodynamic properties of in-vessel and ex-vessel corium.
The modelling of the “FeO”-ZrO2 pseudo-binary system has been improved by taking into account new experimental results obtained during the ISTC CORPHAD Project. Up to now, this system was not investigated in the whole composition range in the open literature. The first experimental results were obtained by Fischer and Hoffmann [32] in the FeO rich domain, and the eutectic composition estimated from an extrapolation method. The eutectic temperature was determined as 1603 K and the composition extrapolated as 1.7 mol% ZrO2. More recently new liquidus determinations (crust and thermocouple method) were performed through the CIT (“Corium Interactions and Thermochemistry”) European project, by Hellmann and Nie [33], but not selected in the assessment work due to the lack of documentation. New measurements of liquidus temperatures over the whole composition domain and the accurate determination of the eutectic temperature have been performed in the CORPHAD project (see section C.4). The eutectic point has been found to correspond to a ZrO2 concentration of 10.3 ± 0.6 mol% at 1602 ± 5 K. These results have allowed the refinement of the thermodynamic modelling, in both the FeO-rich domain, and also in the unknown high temperature, ZrO2-rich domain. The new experimental data related to liquidus temperatures globally confirms the validity of the previous modelling. The most apparent
20/25
Session 2 – Paper 2.11
The 3rd European Review Meeting on Severe Accident Research (ERMSAR-2008)
Nesseber, Vigo Hotel, Bulgaria, 23-25 September 2008
evolution is the modelling of a limited solubility of iron oxide in the cubic ZrO2-rich solid solution which might be important in calculations of multicomponent systems including the Fe-O-Zr ternary system.
The FeO-UO2 pseudo-binary system has been also re-assessed by taking into account the experimental results obtained in the framework of the ISTC CORPHAD Project. This system was, up to now, not available in the open literature. Experimental data were only obtained by Hellmann and Nie [33], that gave an approximate eutectic temperature and composition. The new liquidus values and the determination of the eutectic temperature and composition obtained in the CORPHAD project have confirmed the phase diagram shape in the FeO-rich domain. The eutectic point corresponds to a temperature of 1608 ± 5 K and a UO2 concentration of 4.0 ± 0.1 mol.%. The new experimental data has been also used to refine the liquidus in the UO2-rich domain (Figure 7). A significant modification is finally the modelling of a limited solubility of iron oxide in the UO2 solid solution.
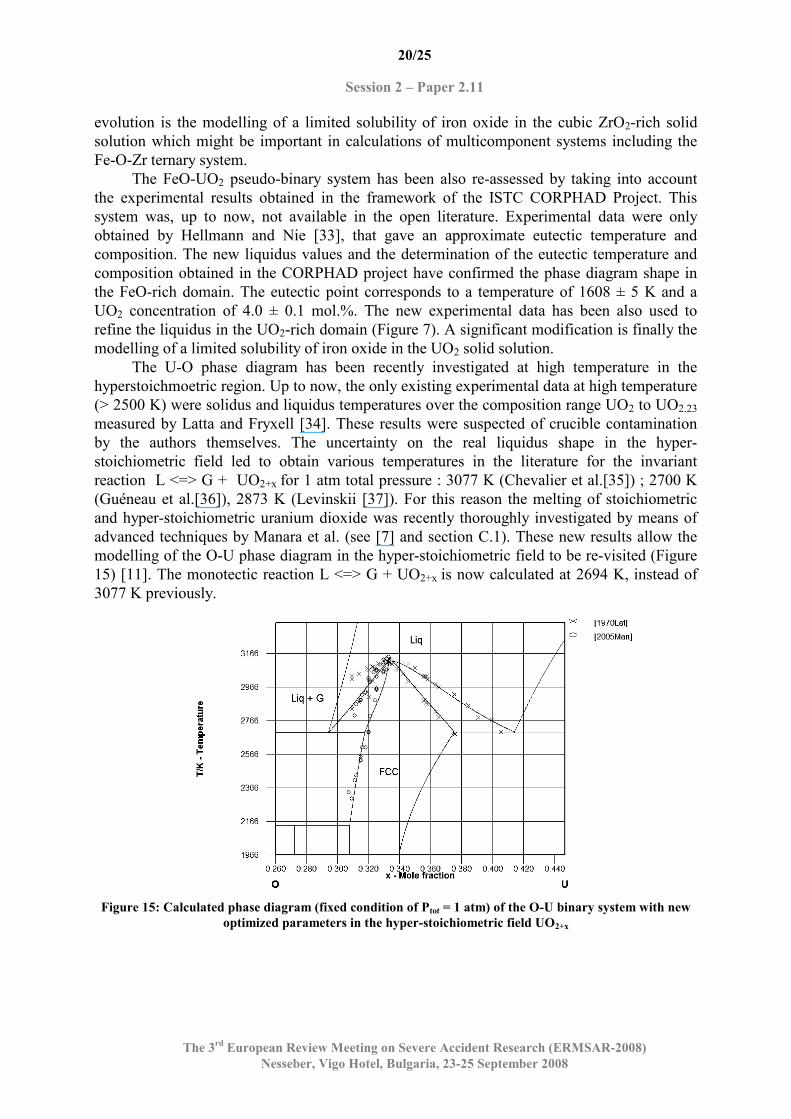
The U-O phase diagram has been recently investigated at high temperature in the hyperstoichmoetric region. Up to now, the only existing experimental data at high temperature (> 2500 K) were solidus and liquidus temperatures over the composition range UO2 to UO2.23 measured by Latta and Fryxell [34]. These results were suspected of crucible contamination by the authors themselves. The uncertainty on the real liquidus shape in the hyper-stoichiometric field led to obtain various temperatures in the literature for the invariant reaction L <=> G + UO2+x for 1 atm total pressure : 3077 K (Chevalier et al.[35]) ; 2700 K (Guéneau et al.[36]), 2873 K (Levinskii [37]). For this reason the melting of stoichiometric and hyper-stoichiometric uranium dioxide was recently thoroughly investigated by means of advanced techniques by Manara et al. (see [7] and section C.1). These new results allow the modelling of the O-U phase diagram in the hyper-stoichiometric field to be re-visited (Figure 15) [11]. The monotectic reaction L <=> G + UO2+x is now calculated at 2694 K, instead of 3077 K previously.
Figure 15: Calculated phase diagram (fixed condition of Ptot = 1 atm) of the O-U binary system with new
optimized parameters in the hyper-stoichiometric field UO2+x
21/25
Session 2 – Paper 2.11
The 3rd European Review Meeting on Severe Accident Research (ERMSAR-2008)
Nesseber, Vigo Hotel, Bulgaria, 23-25 September 2008
E ROUND ROBIN EXERCISE
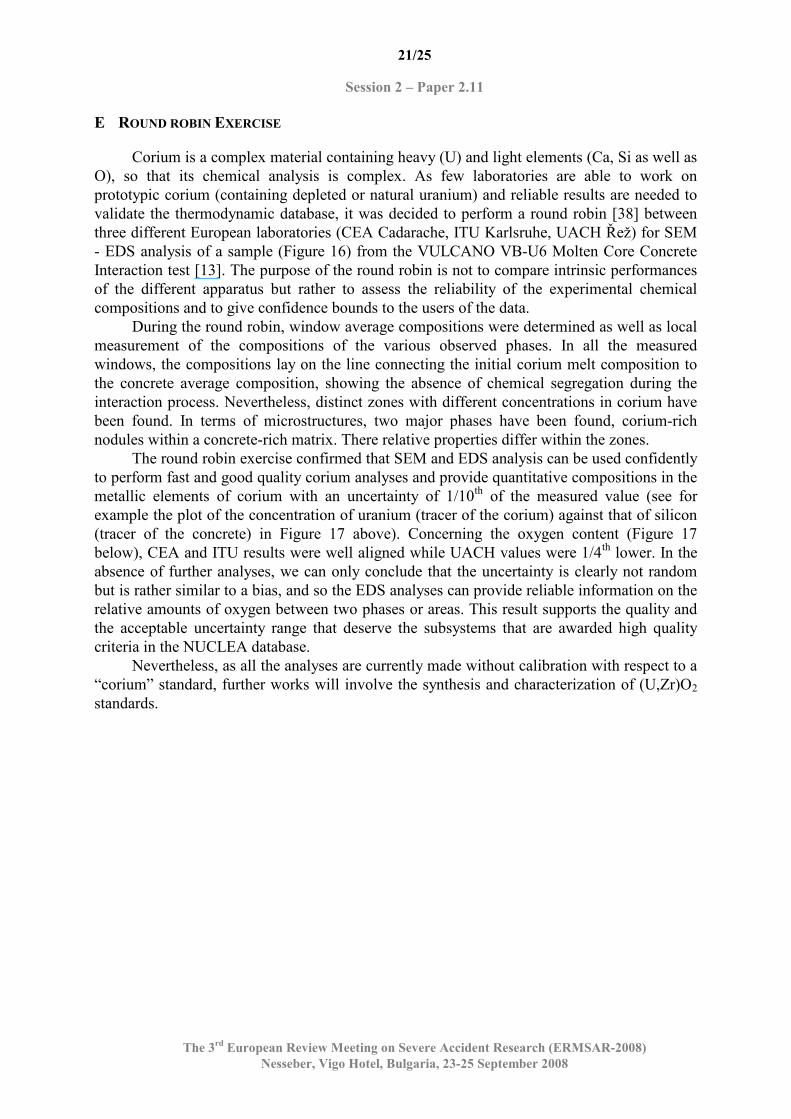
Corium is a complex material containing heavy (U) and light elements (Ca, Si as well as O), so that its chemical analysis is complex. As few laboratories are able to work on prototypic corium (containing depleted or natural uranium) and reliable results are needed to validate the thermodynamic database, it was decided to perform a round robin [38] between three different European laboratories (CEA Cadarache, ITU Karlsruhe, UACH Řež) for SEM - EDS analysis of a sample (Figure 16) from the VULCANO VB-U6 Molten Core Concrete Interaction test [13]. The purpose of the round robin is not to compare intrinsic performances of the different apparatus but rather to assess the reliability of the experimental chemical compositions and to give confidence bounds to the users of the data.
During the round robin, window average compositions were determined as well as local measurement of the compositions of the various observed phases. In all the measured windows, the compositions lay on the line connecting the initial corium melt composition to the concrete average composition, showing the absence of chemical segregation during the interaction process. Nevertheless, distinct zones with different concentrations in corium have been found. In terms of microstructures, two major phases have been found, corium-rich nodules within a concrete-rich matrix. There relative properties differ within the zones.
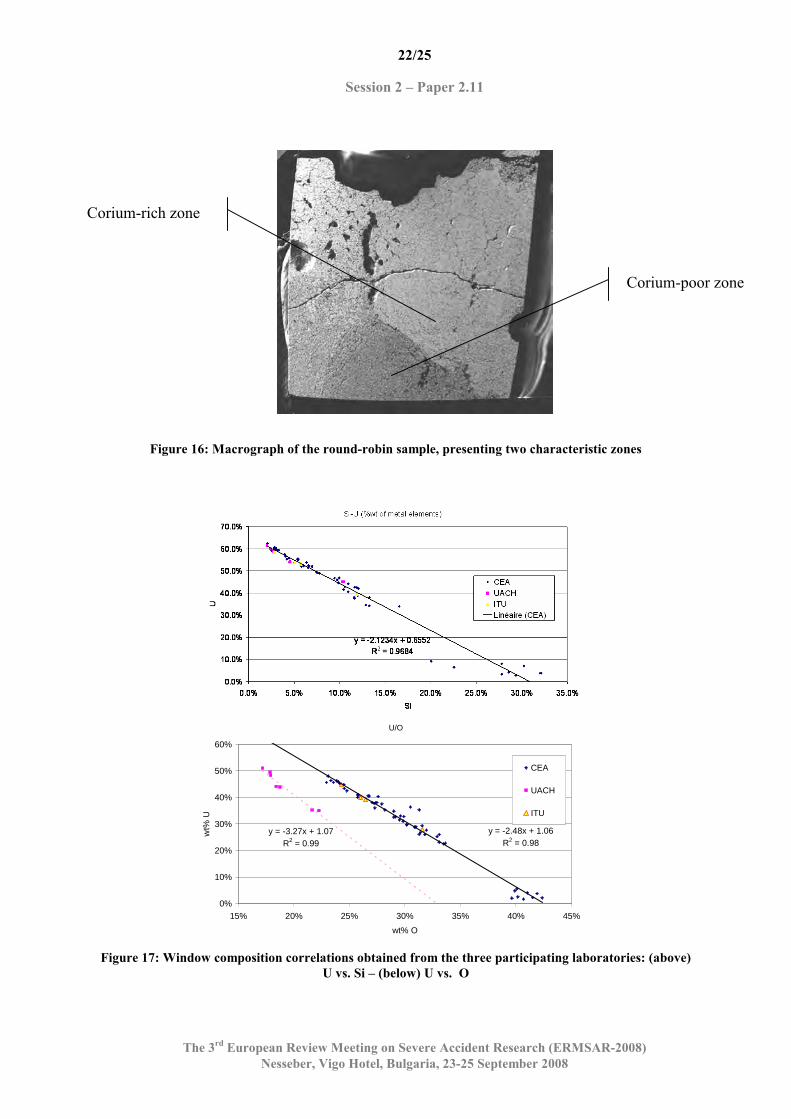
The round robin exercise confirmed that SEM and EDS analysis can be used confidently to perform fast and good quality corium analyses and provide quantitative compositions in the metallic elements of corium with an uncertainty of 1/10th of the measured value (see for example the plot of the concentration of uranium (tracer of the corium) against that of silicon (tracer of the concrete) in Figure 17 above). Concerning the oxygen content (Figure 17 below), CEA and ITU results were well aligned while UACH values were 1/4th lower. In the absence of further analyses, we can only conclude that the uncertainty is clearly not random but is rather similar to a bias, and so the EDS analyses can provide reliable information on the relative amounts of oxygen between two phases or areas. This result supports the quality and the acceptable uncertainty range that deserve the subsystems that are awarded high quality criteria in the NUCLEA database.
Nevertheless, as all the analyses are currently made without calibration with respect to a “corium” standard, further works will involve the synthesis and characterization of (U,Zr)O2 standards.
22/25
Session 2 – Paper 2.11
The 3rd European Review Meeting on Severe Accident Research (ERMSAR-2008)
Nesseber, Vigo Hotel, Bulgaria, 23-25 September 2008
Figure 16: Macrograph of the round-robin sample, presenting two characteristic zones
U/O
y = -2.48x + 1.06R2 = 0.98
y = -3.27x + 1.07R2 = 0.99
0%
10%
20%
30%
40%
50%
60%
15% 20% 25% 30% 35% 40% 45%
wt% O
wt%
U
CEA
UACH
ITU
Figure 17: Window composition correlations obtained from the three participating laboratories: (above)
U vs. Si – (below) U vs. O
5 mm
Corium-poor zone
Corium-rich zone
23/25
Session 2 – Paper 2.11
The 3rd European Review Meeting on Severe Accident Research (ERMSAR-2008)
Nesseber, Vigo Hotel, Bulgaria, 23-25 September 2008
F CONCLUSIONS
Thanks to the works and efforts of the SARNET partners and of related ISTC projects, a large number of new data relative to the corium phase diagrams has been acquired. They concern the main subsystems of the NUCLEA database (subsystems of the U-Zr-Fe-Si-O quinary system) as well as validations on more global experiments dealing with corium-concrete interaction or molten pool fission product releases. The results of the corium SEM-EDS analyses have shown, thanks to a round robin exercise on a corium sample, their quality and reliability. These results have served to the continuing improvement of the European reference thermodynamic database for LWR severe accidents, NUCLEA. Further improvements are still necessary, in particular regarding phase diagrams of U-Zr-Fe-O system at low oxygen potential (including more simple subsystems, like Zr-Fe-O and U-Fe-O), the modelling of FP evaporation (first of all of strontium) and the modelling of the corium-concrete interactions (including phase diagrams of subsystems of ex-vessel corium). This shall be pursued within the proposed SARNET2 project, as well as in ISTC projects in the coming years.
ACKNOWLEDGEMENTS
Most of the work presented in this paper has been part of the SARNET joint program of activities. The ECOSTAR and PLINIUS Projects were co-funded by the European Commission within the EURATOM 5th Framework Programme.
The CORPHAD, PRECOS and EVAN projects are funded by the European Commission through the International Scientific and Technical Centre.
The round robin exercise was partly supported in 2006-2007 by the French-Czech Barrande project n°10783UH and the French Foreign Ministry ECO-NET project number 18555VE in 2008.
REFERENCES
[1] C. Journeau, F. Sudreau, S. Magne, G. Cognet, Physico-chemical analyses and solidification path reconstruction of multi-component oxidic melt spreads, Mater. Sci. Eng., 299A, pp. 249-266 (2001).
[2] M. Barrachin, FPT0 and FPT1 PHEBUS Tests: Post-mortem Examination Interpretation, Proc. ANS 2008 Annual Mtg., Anaheim (CA, USA), 8-12 June 2008.
[3] A. De Bremaecker, M. Barrachin, F. Jacq, F. Defoort, M. Mignanelli, P.Y. Chevalier, B. Cheynet, S. Hellmann, F. Funke, C. Journeau, P. Piluso, S. Marguet, Z. Hózer, V. Vrtilkova, L. Belovsky, L. Sannen, M. Verwerft, P-H. Duvigneaud, K. Mwamba, H. Bouchama, C. Ronneau, European Thermodynamical Database for In and Ex-Vessel Applications, FISA 2003, Luxembourg (Luxembourg), 10-13 November 2003.
[4] B. Cheynet, P. Chaud, P.Y. Chevalier, E. Fisher, P. Masson, M. Mignanelli, NUCLEA propriétés dynamiques et équilibres de phases dans les systèmes d’intérêt nucléaire. Journal de Physique IV, 113, pp. 61-64 (2004).
[5] http://hal.archives-ouvertes.fr/hal-00165418/fr/ [6] A.L. Nichols, ed., Fission Product Chemistry in Severe Nuclear Reactor Accidents,
Specialist’s Meeting at JRC-Ispra, 15-17 January 1990, EUR 12989 EN (1990). [7] D. Manara, C. Ronchi, M. Sheindlin, M. Lewis, M. Brykin, Melting of stoichiometric
and hyperstoichiometric uranium dioxide J. Nucl. Mater., 342, pp. 148-163 (2005).
24/25
Session 2 – Paper 2.11
The 3rd European Review Meeting on Severe Accident Research (ERMSAR-2008)
Nesseber, Vigo Hotel, Bulgaria, 23-25 September 2008
[8] M. Sheindlin, W. Heinz, D. Bottomley, D. Knoche, B. Cremer and J. Somers, 11th Symposium on Thermodynamics of Nuclear Materials (11 STNM), Karlsruhe, 6-9 Sept 2004
[9] C. Politis, Untersuchungen im Dreistoffsystem Uran-zirconSauerstoff. Forschungszentrum Karlsruhe Report No. KfK 2167 (1975).
[10] B. Cheynet et al., Calphad, 26(2), 167 (2002). [11] Yu. Petrov, Yu. Udalov, J. Subrt, S. Bakardjieva, P. Savazsky, M. Kiselova, P.
Selucky, P. Bezdicka, C. Journeau, P. Piluso, Phase Equilibrium in melts of the syetem uranium oxide-iron oxide in air, submitted to Phys. Chem. Glass (2008).
[12] Yu. Petrov, Yu. Udalov, K. Jurek, P. Savazsky, M. Kiselova, P. Selucky, C. Journeau, P. Piluso, New miscibility gap for ex-vessel corium oxide compositions, Proceeding of ICAPP’04, Pittsburgh, PA USA, June 13-17, 2004, Paper 4077.
[13] C. Journeau, P. Piluso, J.F. Haquet, E. Boccaccio, V. Saldo, J.M. Bonnet, S. Malaval, L. Carenini, L. Brissonneau, Two-dimensional Interaction of Corium with Concretes: The VULCANO VB Test Series, submitted to Ann. Nucl. Ener. (2008).
[14] P. Hudon, D.R. Baker, The nature of phase separation in binary oxide melts and glasses. I. Silicate systems, J. Non-cryst. Solids, 303, pp. 299-345 (2002).
[15] S. Lungu, Etude des courbes de liquidus et des propriétés thermodynamiques des systèmes SiO2-ThO2 et SiO2-ThO2-UO2, J. Nucl. Mater., 19, pp.155-159 (1966).
[16] E. Scheil, Bemerkungen zur Schichtkristallbildung, Z. Metallk., 34, pp.70-73 (1942). [17] G.M., Gulliver, Metallic Alloys, Griffiths, London (1922). [18] S.V. Bechta, E.V. Krushinov, V.I. Almjashev, S.A. Vitol, L.P. Mezentseva, Yu.B.
Petrov, D.B. Lopukh, V.B. Khabensky, M. Barrachin, S. Hellmann, K. Froment, M. Fischer, W. Tromm, D. Bottomley, F. Defoort, V.V. Gusarov, Phase Diagram of the ZrO2–FeO System, J. Nucl. Mater.,. 348, pp. 114–121 (2006).
[19] S.V. Bechta, E.V. Krushinov, V.I. Almjashev, S.A. Vitol, L.P. Mezentseva, Yu.B. Petrov, D.B. Lopukh, V.B. Khabensky, M. Barrachin, S. Hellmann, K. Froment, M. Fischer, W. Tromm, D. Bottomley, F. Defoort, V.V. Gusarov, Phase Diagram of the UO2–FeO1+x System, J. Nucl. Mater., 362, pp. 46–52 (2007).
[20] L.P. Mezentseva, V.F. Popova, V.I. Al’myashev, N.A. Lomanova, V.L. Ugolkov, S.V. Beshta, V.B. Khabenskii, V.V. Gusarov, Phase and Chemical Transformations in the SiO2–Fe2O3(Fe3O4) system at Various Oxygen Partial Pressures, Russian J. Inorgan. Chem.,. 51, pp. 118–125 (2006).
[21] R.K. Edwards, A.E. Martin, Phase Relation in the Uranium–Uranium Dioxide System at High temperature. Thermodynamics. V. 2. IAEA, Vienna,. p. 423 (1966).
[22] P. Guinet, H. Vaugoyeau, P.L. Blum, Le Système Uranium-Dioxyde d’Uranium au-dessus de 1130°C, C.R. Acad. Sci. Paris. Série C.,. 263, pp. 17–20 (1966).
[23] C. Guéneau, V. Dauvois, P. Pérodeaud, C. Gonella, O. Dugne “Liquid Immiscibility in a (U,Zr,O) Model Corium”, J. Nucl. Mater. , 254, pp. 158–174 (1998).
[24] V. Asmolov, D. Tsurikov, MASCA Project: Main Activities and Results, OECD/NEA MASCA Seminar, Aix en Provence, France, June 10-11, 2004.
[25] E.F. Juenke, J.F. White, Physical-chemical Studies of Clad under Reactor Accident Conditions, Report GEMP–731 (1970).
[26] P.J. Hayward and I.M. George, J. Nucl. Mater. , 232, pp. 1 (1996). [27] P.Y. Chevalier, E. Fischer, B. Cheynet, Progress in the Thermodynamic Modeling of
the O–U–Zr Ternary System, Calphad, 28, pp. 15–40, 2004.
25/25
Session 2 – Paper 2.11
The 3rd European Review Meeting on Severe Accident Research (ERMSAR-2008)
Nesseber, Vigo Hotel, Bulgaria, 23-25 September 2008
[28] C. Journeau, P. Piluso, P. Correggio, L. Godin-Jacqmin, The PLINIUS/COLIMA CA-U3 Test on Fission-Product Aerosol Release over a VVER type Corium Pool, Report CEA-R-6160, Saclay, France, 2007.
[29] M. Baichi, Contribution à l’étude du corium d’un réacteur nucléaire accidenté: aspects puissance résiduelle et thermodynamique des systèmes U-UO2 et UO2-ZrO2, PhD Thesis, INPG Grenoble, 2001.
[30] R. Dubourg, H. Faure-Geors, G. Nicaise, M. Barrachin, Fission Product Release in the first two PHEBUS tests FPT0 and FPT1, Nucl. Eng. Des., 235, pp. 2183-2208, (2005).
[31] S. Bechta et al., Ex-vessel Source Term Analysis. Task 2 Final Report. ISTC Project # 3345 (EVAN). NITI, December 2007.
[32] W.A. Fischer, H. Hoffman, Equilibrium Studies in the System Iron(II) Oxide–Zirconium Oxide, Arch.Eisenhutten, 28, pp. 739–743 (1957).
[33] S.Helmann, M.Nie, Proceedings of the 4th CIT Project Meeting, Pisa, Italy(10-11/6/1998).
[34] R.E. Latta, R.E. Fryxell, Determination of solidus-liquidus temperatures in the UO2+x system (-0.5<x<0.2), J. Nucl. Mater. 35, pp. 195-210 (1970).
[35] P.Y. Chevalier, E. Fischer, B. Cheynet, Progress in the thermodynamic modelling of the O–U–Zr ternary system, Calphad, 28, pp. 15-40 (2004).
[36] C. Guéneau, M. Baichi, D. Labroche, C. Chatillon, B. Sundman, Thermodynamic assessment of the uranium-oxygen system, J. Nucl. Mater. 304, pp. 161-175 (2002).
[37] Yu.V. Levinskii, p versus T phase diagram of the uranium-oxygen system, Atom. Ener., 37, pp. 1075-1076 (1974).
[38] L. Brissonneau, C. Journeau, P. Piluso, M. Kiselova, S. Bakardjieva, T. Wiss, D. Bottomley, H. Thiel, Prototypic corium analysis: a round robin for SEM and EDS characterisation, submitted to Material Characterization (2008).