Improvement of the competitiveness of the sugar beet crop in ...
144
Improvement of the competitiveness of the sugar beet crop in the Netherlands Dissertation to obtain the Ph. D. degree in the Faculty of Agricultural Sciences, Georg-August-University Göttingen, Germany presented by Bram Hanse born in Noordoostpolder (NL) Göttingen, May 2011
-
Upload
khangminh22 -
Category
Documents
-
view
0 -
download
0
Transcript of Improvement of the competitiveness of the sugar beet crop in ...

Improvement of the competitiveness of the sugar beet crop in the Netherlands
Dissertation to obtain the Ph. D. degree
in the Faculty of Agricultural Sciences, Georg-August-University Göttingen, Germany
presented by
Bram Hanse
born in Noordoostpolder (NL)
Göttingen, May 2011

D7 1. Name of referee: Prof. Dr. B. Märländer 2. Name of co-referee: Prof. Dr. O. Mußhoff 3. Name of second co-referee: Dr. ir. F.G.J. Tijink Date of dissertation: May 12, 2011

This dissertation contains four published, accepted or submitted for publication in
scientific journals and conference proceedings:
Hanse, B., Tijink, F.G.J., Mußhoff, O. and Märländer, B., 2010. Comparison of costs and
yields of 'type top' and 'type average' growers in Dutch sugar beet growing.
Sugar Industry. 135, 550-560.
Hanse, B., Schneider, J.H.M., Termorshuizen, A.J. and Varrelmann, M., 2011. Pests and
diseases contribute to sugar beet yield difference between top and averagely
managed farms. Crop Protection 30, 671-678.
Hanse, B., Vermeulen, G.D., Tijink, F.G.J., Koch, H.-J., and Märländer, B., Analysis of soil
characteristics, soil management and sugar yield on top and averagely managed
farms in sugar beet (Beta vulgaris L.) production in the Netherlands, Soil & Tillage
Research, submitted.
Hanse, A.C., Tijink, F.G.J., 2010. Harvesting losses ... How to yield this hidden financial
potential. In: Proceedings of the 72nd IIRB Congress, 22-24 June 2010, Copenhagen,
DK.
The author is grateful to the publishers for the possibility to print the journal articles in this
dissertation


Improvement of the competitiveness of the sugar beet crop in the Netherlands
Table of contents
1 Prologue ....................................................................................................................... 9
2 Comparison of costs and yields of 'type top' and 'type average' growers in Dutch
sugar beet growing ................................................................................................................. 19
2.1 Summary ............................................................................................................ 20
2.2 Introduction ......................................................................................................... 21
2.3 Materials and Methods ....................................................................................... 22
2.3.1 Data source .................................................................................................... 22
2.3.2 Calculation of total variable costs ................................................................... 24
2.3.3 Yield and beet price ........................................................................................ 26
2.3.4 Statistical analysis .......................................................................................... 27
2.4 Results ................................................................................................................ 27
2.4.1 Effect of grower and interactions with site and year ....................................... 27
2.4.2 Difference between grower types ................................................................... 30
2.4.3 Regression analysis ........................................................................................ 37
2.5 Discussion .......................................................................................................... 40
2.6 References ......................................................................................................... 46
3 Pests and diseases contribute to sugar beet yield difference between top and
averagely managed farms ...................................................................................................... 49
3.1 Abstract ............................................................................................................... 50
3.2 Introduction ......................................................................................................... 51
3.3 Materials and Methods ....................................................................................... 52
3.3.1 Pair study ........................................................................................................ 52
3.3.2 Soil samples ................................................................................................... 53
3.3.3 Detection of Beet Necrotic Yellow Vein Virus ................................................. 53
3.3.4 Bioassay of soil suppression against Rhizoctonia solani Kühn ...................... 54
3.3.5 Bioassay for determination field infestation by Aphanomyces cochlioides ..... 55

Improvement of the competitiveness of the sugar beet crop in the Netherlands
3.3.6 Quantification of nematodes ........................................................................... 55
3.3.7 Scoring of foliar symptoms ............................................................................. 56
3.3.8 Determination of sugar yield ........................................................................... 57
3.3.9 Statistical analysis .......................................................................................... 57
3.4 Results ................................................................................................................ 58
3.5 Discussion .......................................................................................................... 65
3.6 References ......................................................................................................... 70
4 Analysis of soil characteristics, soil management and sugar yield on top and
averagely managed farms in sugar beet (Beta vulgaris L.) production in the Netherlands ... 75
4.1 Abstract ............................................................................................................... 76
4.2 Introduction ......................................................................................................... 77
4.3 Materials and methods ....................................................................................... 78
4.3.1 Selection of grower pairs and plots ................................................................. 78
4.3.2 Soil management observations and soil measurements ................................ 79
4.3.3 Crop measurements ....................................................................................... 80
4.3.4 Analysis of the data ........................................................................................ 80
4.4 Results ................................................................................................................ 81
4.4.1 Soil characteristics of sugar beet fields in the Netherlands ............................ 81
4.4.2 Differences between ‘type top’ and ‘type average’ growers............................ 84
4.4.3 Effects of soil type and management on soil structure and subsequent crop
growth 85
4.5 Discussion .......................................................................................................... 89
4.6 Conclusions ........................................................................................................ 93
4.7. References ......................................................................................................... 94
5 Harvesting losses ... How to yield this hidden financial potential ............................... 99
5.1 Abstract ............................................................................................................. 100
5.2 Introduction ....................................................................................................... 101
5.3 Materials and methods ..................................................................................... 101

Improvement of the competitiveness of the sugar beet crop in the Netherlands
5.4 Results and discussion ..................................................................................... 102
5.5 Conclusions ...................................................................................................... 104
5.6 References ....................................................................................................... 105
6 Epilogue .................................................................................................................... 107
6.1 Introduction ....................................................................................................... 108
6.2 Fertilization with main and trace elements ........................................................ 109
6.2.1 Materials and methods ................................................................................. 109
6.2.2 Results .......................................................................................................... 111
6.2.3 Discussion .................................................................................................... 115
6.3 Sugar beet sowing ............................................................................................ 117
6.3.1 Materials and methods ................................................................................. 117
6.3.2 Results .......................................................................................................... 118
6.3.3 Discussion .................................................................................................... 119
6.4 Weed control ..................................................................................................... 121
6.4.1 Materials and methods ................................................................................. 121
6.4.2 Results .......................................................................................................... 122
6.4.3 Discussion .................................................................................................... 125
6.5 References ....................................................................................................... 127
7 Outlook ..................................................................................................................... 131
8 Summary .................................................................................................................. 135
9 Curriculum Vitae ....................................................................................................... 141
10 Acknowledgements .................................................................................................. 143

Improvement of the competitiveness of the sugar beet crop in the Netherlands

Improvement of the competitiveness of the sugar beet crop in the Netherlands
9
1 Prologue

Improvement of the competitiveness of the sugar beet crop in the Netherlands
10
1 Prologue
This dissertation focuses on the competitiveness of the sugar beet (Beta vulgaris L.) crop in
the Netherlands. Basically the income of the farmer is the product of yield and product price
(revenues) minus total costs, as a sum for all crops. For a number of crops but especially
sugar beet the product price is dependent on product quality. For many years, the sugar beet
crop had a relatively high share in farmers income (Berkhout and Berkum, 2005). Due to the
sugar regime of the European Union (EU), minimum sugar beet prices for quota beet were
guaranteed for the growers and thus causing a more or less stable income compared to
other crops like onions, potatoes and carrots, whose prices are fluctuating within and
between years (Berkhout and Bruchem, 2005; Vrolijk et al., 2009; Berkhout and Bruchem,
2010). As a result of the World Trade Organisation (WTO) negotiations the EU had to open
their market for sugar outside the EU. Consequently the EU sugar market regime had to be
adapted, with a lower guaranteed price for farmers. The guaranteed price for quota beet fell
from € 43.63 t sugar beet-1 (EC, 2001; Zeddies, 2006) to € 26.29 t-1 from 2009 onwards (EC,
2006), implying a 39.7% decrease. With the costs on a similar level this causes a dramatic
drop in farmers’ income. At present it is not known if and how the EU sugar market regime
will continue when it ends after the harvest and the processing of the 2014 cultivated sugar
beet (EC, 2006).
The study LISSY (Low Input Sustainable Sugar Yield) identified possibilities to save up to
20% of the total variable costs in Dutch sugar beet production (Pauwels, 2006). However,
this could not compensate for the price drop of quota sugar beet (figure 1.1). In order to keep
the profitability of the sugar beet crop on the same level as before 2006, a raise in yield is
needed. The potential sugar yield in the Netherlands was previously estimated at 23 t sugar
ha-1 (De Wit, 1953). The average sugar yield realised by growers in the period 2002-2006
was 10.6 t ha-1 (Swaaij, 2007), only 46% of the theoretical potential. In the meanwhile, large
differences between growers in the same region, encountering almost the same production
circumstances like soil and climate, are reported (Agrarische Dienst, 2007). This

1. Prologue
11
phenomenon is not restricted to sugar beet production in the Netherlands, its found in
Sweden, Germany and the United Kingdom (Blomquist et al., 2003; Fuchs et al., 2008; Limb
and Atkin, 2010) and for other crops, as well (Lobell et al., 2009). However, it seems that in
many cases the other crops’ average yield is more close to 80% of the crops potential in that
region, although large differences exist (Lobell et al., 2009). Therefore, there is an
unexploited yield gap in sugar beet cultivation.
Figure 1.1. Graphical impression to the effect, for an average sugar yield (a), of the quota sugar beet guarantee price before 2006 (b) and after 2009 (c) on farmers gross margin (f, g and h) when the total variable costs are on average (d) or on a 20% reduced level (e). In response to the lower quota sugar beet guarantee price, growers have to raise yield (y/y′) to an level were the margin i/i′ equals f to keep profitability on the level before the reform of the EU sugar regime.
Considering the above mentioned, the IRS (Institute of Sugar Beet Research, The
Netherlands) formulated the 3 x 15 target. In 2015 the present EU sugar market regime ends
and then the target for sugar beet cultivation is a national average sugar yield of 15 t ha-1
(equivalent to 60% of the sugar beet potential) and 15 Euro t-1 sugar beet of total variable
costs. This implies that, next to the savings on total variable costs, a steep raise in sugar
yield is needed (figure 1.2).

Improvement of the competitiveness of the sugar beet crop in the Netherlands
12
The study SUSY (Speeding Up Sugar Yield) was aimed to identify possibilities to raise sugar
yield by comparing 26 pairs of growers, the idea adapted from a pair study in Sweden
(Berglund et al., 2002). Each pair consisted of a high yielding ‘type top’ and average yielding
‘type average’ grower in the same region, based on the 2000-2004 sugar yields. More details
about the selection are given by Hanse et al. (2010a).
Figure 1.2. Average sugar yield (t ha-1
) in the Netherlands from 1950 to 2006. Sugar yield is raised on average by 1.7% a year. To reach the 15 t sugar hectare
-1 target, sugar yield raise has to break this
trend and should increase steeply (dashed arrow).
A large part of the data obtained from the SUSY-project is analysed and published in four
publications, compiled in this dissertation.
The first publication analyses the data concerning the differences in costs and sugar yields
between the type top and type average growers and is published in the journal Sugar

1. Prologue
13
Industry (Hanse et al., 2010a). A German translation is published in the Special Edition of
Sugar Industry for the purpose of the 9th Göttinger Zuckerrübentagung on September 2nd,
2010 (Hanse et al., 2010b). In this publication it is shown that the type top growers did not
have higher total variable costs, although their yields were significantly higher compared to
the type average growers. It was concluded that the differences in sugar yield were not
caused by economical constraints. Sugar yield proved independent of total variable costs.
In the second publication the influence of pests and diseases on sugar yield is published
(Hanse et al., 2011a). The occurrence of pathogens differed for the soil types clay and sand.
The type top growers on clay soil had significantly lower infestation levels of Heterodera
schachtii, Beet necrotic yellow vein virus (BNYVV) and other foliar diseases (Pseudomonas,
Phoma betae and Verticillium spp. combined). On sandy soils, infestation levels of
Meloidogyne spp., Cercospora beticola and Erysiphe betae were significantly lower for type
top growers. The insecticides on seed pellets provided sufficient control. In the fields no
insect pests causing sugar yield loss were observed. On clay soils, differences in the sugar
yield could be explained by the H. schachtii and BNYVV infestation levels. On sandy soils,
the infestation levels of H. betae and Aphanomyces cochlioides, number of fungicide
sprayings and sowing date explained differences in sugar yield.
Despite crop protection measures, the calculated sugar yield losses due to pests and
diseases ranged from 13.1 to 37.1% (24% average for all growers). Thus, it was concluded
that the infestation levels of pests and diseases are among the explanations of the sugar
yield differences between type top and type average growers.
The third publication shows the influence of soil management and intrinsic soil structure on
temporal soil structure and its influence on sugar yield (Hanse et al., 2011b). Subsoil
compaction, measured by the saturated hydraulic conductivity, Ks, and air-filled porosity, AP,
explained 24.9% of the variance in sugar yield, although in dependency of subsoil sand
content and sowing date. The Ks was explained by the content of 50-105 μm sand fraction in
the subsoil and the depth of primary tillage. AP was found strongly dependent on clay
content of the top soil. There was no difference between type top and type average growers
Improvement of the competitiveness of the sugar beet crop in the Netherlands
14
for top soil AP. The type top growers’ fields had a significantly higher Ks compared to the
type average growers’ fields. On 9% of the fields Ks was approximately 0.00 m day-1 and on
31% of the fields below the damage threshold of 0.10 m day-1. Below this threshold, crop
yield can be adversely influenced by soil structure (Lebert et al., 2004). AP below 10% was
found on 25% of the type top growers' fields and 35% of the type average growers' fields.
The type top growers used lower tractors tyre inflation pressure and less passes to prepare
the seedbed, with the same equipment as the type average growers.
The fourth article is published in the proceedings based on a presentation at the 72nd IIRB
Congress in Copenhagen concerning losses while harvesting sugar beets in the SUSY-
project (Hanse and Tijink, 2010). On average, 3 t sugar beet ha-1 are left on the fields,
ranging from 0.45 to 9.1 t ha-1. The losses due to overtopping and whole beet losses were
significantly lower for type top growers. The losses due to root tip breakages did not differ
between type top and type average growers. Total harvest losses (sum of losses by
overtopping, whole beet and root tip breakage) did not differ between type top and type
average growers. Options to point out the important harvest losses to both growers and
harvester driver are presented.
This dissertation closes with the epilogue on the agronomical issues not yet published, as
there are: fertilisation, sowing, and weed control of the sugar beet crop and the management
influence of the growers.

1. Prologue
15
1.1 References
Agrarische Dienst, 2007. Unitip 2006 - Algemeen verslag. Suiker Unie, Dinteloord, The
Netherlands, pp. 38.
Berglund, K., Blomquist, J., Christensson, B., Gerhardson, B., Hellgren, O., Larsson, H.,
Rydberg, T., Wildt-Persson, T., 2002. 4T - The Ten Ton Target. SBU, Borgeby, pp.
16.
Berkhout, P., Berkum, S. van, 2005. Hervorming suikermarktordening - Gevolgen voor de
suikerproducenten, de suikerverwerkers en de (sucro)chemische industrie. LEI, Den
Haag, The Netherlands, pp. 63.
Berkhout, P., Bruchem, C. van, 2005. Landbouw-Economsich bericht 2005. LEI, Den Haag,
The Netherlands, pp. 224.
Berkhout, P., Bruchem, C. van, 2010. Landbouw-Economischbericht 2010. LEI Wageningen
UR, Den Haag, The Netherlands, pp. 244.
Blomquist, J., Hellgren, O., Larsson, H., 2003. Limiting and Promoting Factors for High Sugar
Yield in Sweden. In: Advances in Sugar Beet Research, 5. IIRB, Brussels, pp. 3-17.
De Wit, C.T., 1953. A physical theory on placement of fertilizers. Dissertation. Verslagen
Landbouwkundige Onderzoekingen (59-4), Dissertation, Landbouwhogeschool
Wageningen, The Netherlands.
EC, 2001. Council Regulation (EC) No 1260/2001 of 19 June 2001 on the common
organisation of the markets in the sugar sector. Official Journal of the European
Communities L. 178, 1-45.
EC, 2006. Council Regulation (EC) No 318/2006 of 20 February 2006 on the common
organisation of the markets in the sugar sector. Official Journal of the European
Communities L. 58, 1-31.
Fuchs, J., Stockfisch, N., Märländer, B., 2008. Entwicklung und Variation der Leistung von
Zuckerrüben (Beta vulgaris L.) in Deutschland unter besonderer Berücksichtigung
von Anbaumanagement und Sorte. Pflanzenbauwissenschaften 12, 69-77.

Improvement of the competitiveness of the sugar beet crop in the Netherlands
16
Hanse, A.C., Tijink, F.G.J., 2010. Harvesting losses ... How to yield this hidden financial
potential. In: Proceedings of the 72nd IIRB Congress, 22-24 June 2010, Copenhagen,
DK.
Hanse, B., Tijink, F.G.J., Mußhoff, O., Märländer, B., 2010a. Comparison of costs and yields
of 'type top' and 'type average' growers in Dutch sugar beet growing. Sugar Industry
135, 550-560.
Hanse, B., Tijink, F.G.J., Mußhoff, O., Märländer, B., 2010b. Vergleich von Kosten und
Zuckerertrag landwirtschaftlicher Betriebe in den Niederlanden. Zuckerindustrie,
Sonderheft Zuckerrübentagung 135, 41-52.
Hanse, B., Schneider, J.H.M., Termorshuizen, A.A.J., Varrelmann, M., 2011a. Pests and
diseases contribute to sugar beet yield difference between top and averagely
managed farms. Crop Protection 30, 671-678.
Hanse, B., Vermeulen, G.D., Tijink, F.G.J., Koch, H.J., Märländer, B., 2011b. Analysis of soil
characteristics, soil management and sugar yield on 'type top' and 'type average'
managed farms in sugar beet (Beta vulgaris L.) production in The Netherlands. Soil &
Tillage Research. in press.
Lebert, M., Brunotte, J., Sommer, C., 2004. Ableitung von Kriterien zur Charakterisierung
einer schädlichen Bodenveränderung, entstanden durch nutzungsbedingte
Verdichtung von Böden / Regelungen zur Gefahrenabwehr. Texte 46-04.
Umweltbundesamt, Berlin, pp. Pages.
Limb, R., Atkin, S.-A., 2010. Ton-up growers' success. British Sugar Beet Review 78, 18-21.
Lobell, D.B., Cassman, K.G., Field, C.B., 2009. Crop Yield Gaps: Their Importance,
Magnitudes, and Causes. Annual Review of Environment and Resources 34, 179-
204.
Pauwels, J.B., 2006. Teeltkosten kunnen 20 procent lager. IRS Informatie. In: Cosun
Magazine nr 8, pp. 14-15 and CSM Informatie nr 555, pp. 14-15.
Swaaij, A.C.P.M. van, 2007. Opbrengstprognose. In: Betatip, 7. IRS, Bergen op Zoom, The
Netherlands, pp. 11-13.

1. Prologue
17
Vrolijk, H.C.J., Bont, C.J.A.M.D., Veen, H.B. v.d., Wisman, J.H., Poppe, K.J., 2009. Volatility
of farm incomes, prices and yields in the European Union. LEI Wageningen UR, Den
Haag, The Netherlands, pp. 223.
Zeddies, J., 2006. Die neue EU-Zuckermarktordnung - Beschlüsse, Auswirkungen und
Bewertung. Agrarwirtschaft 55, 97-99.

Improvement of the competitiveness of the sugar beet crop in the Netherlands
18

Improvement of the competitiveness of the sugar beet crop in the Netherlands
19
2 Comparison of costs and yields of 'type top' and 'type average' growers in Dutch sugar beet growing
Bram Hanse , Frans Tijink, Oliver Mußhoff and Bernward Märländer
Sugar Industry, 2010, 135, 550-560

Improvement of the competitiveness of the sugar beet crop in the Netherlands
20
2 Comparison of costs and yields
2.1 Summary
The Dutch sugar industry and sugar beet research initiated the project SUSY (Speeding Up
Sugar Yield) as a reaction to the reform of the European Union sugar regime. The project
was aimed at softening the reform’s impact on growers income by improving their knowledge
on raising sugar yield and identifying possible cost savings. From each sugar beet growing
region in The Netherlands, 26 pairs of ‘type top’ (high yielding) and ‘type average’ (average
yielding) farmers were selected, based on their yield levels in 2000-2004. During three years,
all aspects of sugar beet production were investigated on 75 fields of ‘type top’ and 74 fields
of ‘type average’ growers. Based on grower’s crop management record, cost variables were
calculated and analysed in relation to yield and quality variables. The factors year and
grower caused most of the significant effects on yield, quality and cost variables. The grower
can compensate for the year effect of biotic and abiotic variables on yield. The ‘type top’
growers had significantly higher sugar yields in each year compared to ‘type average’
growers, but the total variable costs did not differ. This makes the ‘type top’ growers more
efficient in resource use. Costs for manure and fertiliser, ‘other’ and irrigation significantly
increased the total variable costs. With higher fungicide costs, sugar yield significantly
increased. There was no significant relation between the intensity of sugar beet production
and sugar yield. Based on this study, it can be concluded that the most profitable strategy for
the growers is maximising sugar yield and optimising costs. The observed differences in
sugar yield were not caused by economical constraints.

2. Comparison of costs and yields
21
2.2 Introduction
Sugar beet growers in Europe as well as in The Netherlands face the challenge to keep up
their financial yields. Due to the reform of the European Union sugar regime, the EU
minimum price for quota beet fell from € 43.63 t sugar beets-1 (CR (EC) 1260/2001, 2001;
Zeddies, 2006) to € 26.29 t-1 from 2009 onwards (CR (EC) 318/2006, 2006), implying a
39.7% decrease. Growers have to raise their yield by the same percentage to compensate
this price drop, if the costs remain on the level of 2006. Another strategy is to reduce costs.
Possibilities to save up to 20% of the costs without yield loss in Dutch sugar beet production
were identified by a previous study (Pauwels, 2006b). However, to compensate the beet
price drop by cost savings, costs should decrease much more to keep the absolute
difference between costs and payment the same. Therefore, cost saving still leaves a need
for raising sugar yield. A combination of both raising yield and saving costs would be
profitable for the growers, too.
The potential sugar yield in The Netherlands was calculated at a maximum of 23 t ha-1 (De
Wit, 1953), more recent research found 24 t sugar ha-1 for Germany (Kenter et al., 2006).
However, the average sugar yield achieved by Dutch growers was 10.6 t ha-1 in the period
2002-2006 (Van Swaaij, 2007). There is an enormous difference in sugar yield between
growers, even when the fields are located in the same region (Agrarische Dienst, 2007). That
is to say, there is an enormous, unexploited gap in sugar yield by a large group of growers.
The aforementioned changed circumstances and the presence of a yield gap urge for
knowledge how the sugar beet growers in The Netherlands can improve sugar yields and
make possible savings on their costs. The causes and costs of the difference in yield were
studied in the project Speeding Up Sugar Yield (SUSY) (Pauwels, 2006a) in a pairwise
comparison of neighbouring growers with high yields ('type top') and average yields ('type
average'), encountering the same production prerequisites: soil and climate.
The aim of this paper is to analyse the yield, quality and costs of the different ‘type top’ and
‘type average’ growers in order to identify rules for improving the economic success of Dutch

Improvement of the competitiveness of the sugar beet crop in the Netherlands
22
sugar beet production. Therefore, the growers recorded all agronomic measures in sugar
beet production, which formed the basis for calculations on the performance of ‘type top’ and
‘type average’ growers.
2.3 Materials and Methods
2.3.1 Data source
The data were obtained from the project ‘Improvement of the competitiveness of the sugar
beet crop’ of the Dutch Institute of Sugar beet Research, IRS, Bergen op Zoom.
The pairwise comparison comprised 26 pairs (52 growers) in both 2006 and 2007. In 2008,
data of 23 ‘type top’ and 22 ‘type average’ growers were available for costs calculation. This
was due to the exclusion of 2 pairs from which the ‘type average’ sold the sugar quota and of
3 growers which did not fully complete the questionnaire in 2008.
A grower was considered ‘type top’ when the sugar yield on his farm in the period 2000-2004
was on average and in each single year among the 25% of the highest sugar yields in the
region where the farm was situated. A grower was considered ‘type average’ when the sugar
yields in the same period were among the 50% of average sugar yields in the region. Pairs
were formed out of a ‘type top’ and a ‘type average’ grower, with at least 1.5 t ha-1 difference
in sugar yield based on the 5 years average between those two growers. The location of the
pairs in the different regions in The Netherlands is shown in figure 2.1.
Data were collected on parameters of soil physics, soil fertility, soil health, rainfall, drilling
(date, depth, distance), field establishment, canopy closure, pests and diseases, nutrient
uptake, yield and quality, harvest losses and exact field size (GPS). All parameters were
measured following the IRS internal protocols or the standard available protocols (Pauwels,
2006a). From these variables, yield, quality and field size are presented in this publication.
Additionally, the growers recorded all agronomic measures, including application dates,
prices, type and amounts of consumables etc. All data obtained were fed into a specially built

2. Comparison of costs and yields
23
Microsoft Access® database called ‘Betapaar’. This database facilitates the calculation of the
total variable costs based on the single cost components. Total machinery and contracting
costs were calculated from the single cost components related to machinery use and
contracting. Total direct growing costs were calculated from the single cost components for
consumables. Root yield and sugar yield were used to calculate unit costs for root yield and
sugar yield based on the total variable costs. The revenues were calculated from the yield
and quality parameters and the beet price.
Figure 2.1. The regions and location of the SUSY-pairs in The Netherlands, each spot represents the location of a pair consisting of a ‘type top’ and a ‘type average’ grower; SUSY-project 2006-2008. Open dots indicate two pairs of which the ‘type average’ grower sold the sugar reference in winter 2007/2008, therefore these pairs were not included in the study in 2008.

Improvement of the competitiveness of the sugar beet crop in the Netherlands
24
2.3.2 Calculation of total variable costs
Costs for chemicals, fertilisers, manure and contracting were taken from the growers’
records. Costs for farmers’ own machinery used, including labour, were calculated based on
standard prices per hectare and only assigned to the farm for the measures carried out (table
2.1). This harmonised the costs for growers’ own equipment, which are difficult to assess in
practice as a lot of diverse types and brands of equipment with an enormous variation in age
were used. If measures were carried out by a contractor, the actual price paid to the
contractor was obtained from the growers.
The basis was to value all inputs in growing sugar beet and assess the total variable costs
enclosing labour, base materials, all machinery costs and contracting fees. The total variable
costs exclude the fixed costs e.g. tenancy for the field and the overhead of the farm. The
overhead encloses profit margin, costs of sugar quota, assurances for crop and grower,
buildings, maintenance of fields, field and ditch edges, etc. The reason to compare only the
total variable costs was that the fixed costs are very farm specific and depend on a lot of
parameters which are not determined by the growing of sugar beets. Above all, the level of
the fixed costs is almost independent of the grown crop. Unit costs were calculated based on
the net root and sugar yield per hectare, without harvest losses, since the harvest losses
remain in the field, unpaid.
The sum of the costs of the use of growers’ own machinery and the contractor costs makes
up the total contracting and machinery costs. This cost component enclosed all the costs
related to the machinery used in sugar beet growing. This implies that also the fixed machine
costs like storage, depreciation, interest, maintenance (including the labour for maintenance)
and assurance costs are included in the machinery costs per hectare (table 2.1).
2. Comparison of costs and yields
25
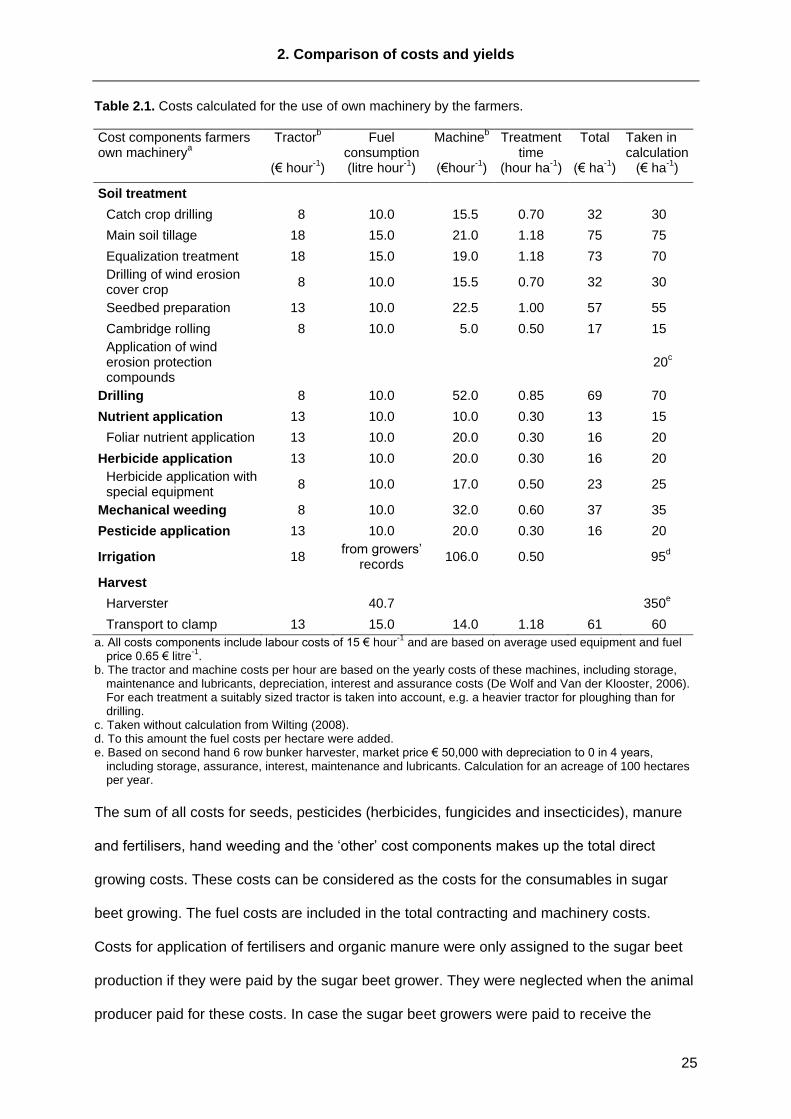
Table 2.1. Costs calculated for the use of own machinery by the farmers.
Cost components farmers own machinery
a Tractor
b Fuel
consumption Machine
b Treatment
time Total Taken in
calculation (€ hour
-1) (litre hour
-1) (€hour
-1) (hour ha
-1) (€ ha
-1) (€ ha
-1)
Soil treatment
Catch crop drilling 8 10.0 15.5 0.70 32 30
Main soil tillage 18 15.0 21.0 1.18 75 75
Equalization treatment 18 15.0 19.0 1.18 73 70
Drilling of wind erosion cover crop
8 10.0 15.5 0.70 32 30
Seedbed preparation 13 10.0 22.5 1.00 57 55
Cambridge rolling 8 10.0 5.0 0.50 17 15
Application of wind erosion protection compounds
20c
Drilling 8 10.0 52.0 0.85 69 70
Nutrient application 13 10.0 10.0 0.30 13 15
Foliar nutrient application 13 10.0 20.0 0.30 16 20
Herbicide application 13 10.0 20.0 0.30 16 20
Herbicide application with special equipment
8 10.0 17.0 0.50 23 25
Mechanical weeding 8 10.0 32.0 0.60 37 35
Pesticide application 13 10.0 20.0 0.30 16 20
Irrigation 18 from growers’
records 106.0 0.50 95
d
Harvest
Harverster 40.7 350e
Transport to clamp 13 15.0 14.0 1.18 61 60
a. All costs components include labour costs of 15 € hour-1
and are based on average used equipment and fuel price 0.65 € litre
-1.
b. The tractor and machine costs per hour are based on the yearly costs of these machines, including storage, maintenance and lubricants, depreciation, interest and assurance costs (De Wolf and Van der Klooster, 2006). For each treatment a suitably sized tractor is taken into account, e.g. a heavier tractor for ploughing than for drilling.
c. Taken without calculation from Wilting (2008). d. To this amount the fuel costs per hectare were added. e. Based on second hand 6 row bunker harvester, market price € 50,000 with depreciation to 0 in 4 years,
including storage, assurance, interest, maintenance and lubricants. Calculation for an acreage of 100 hectares per year.
The sum of all costs for seeds, pesticides (herbicides, fungicides and insecticides), manure
and fertilisers, hand weeding and the ‘other’ cost components makes up the total direct
growing costs. These costs can be considered as the costs for the consumables in sugar
beet growing. The fuel costs are included in the total contracting and machinery costs.
Costs for application of fertilisers and organic manure were only assigned to the sugar beet
production if they were paid by the sugar beet grower. They were neglected when the animal
producer paid for these costs. In case the sugar beet growers were paid to receive the

Improvement of the competitiveness of the sugar beet crop in the Netherlands
26
manure, this payment is taken into the cost calculation as additional payments for the sugar
beets (Van den Ham et al., 2007).
‘Other’ costs include the costs for the seed of green manure crops, costs for covering the
beet clamps, costs for wind and water erosion prevention. The costs for wind erosion
prevention are the costs for the seed of barley (sown just before the sugar beets), paper pulp
or manure (both sprayed after drilling).
Total variable costs are obtained by the summation of the total costs of contracting and own
machinery and the total direct growing costs. All cost components are calculated in € ha-1.
2.3.3 Yield and beet price
The total sugar beet quantity delivered to the sugar factory, including the quality parameters,
was derived from the growers’ records. Root yield, sugar yield as well as sugar beet prices,
based on the quality components, were calculated with the Betapaar database, taking into
account the exact field size.
Root yield (t ha-1) was corrected for top and soil tare and the basis for the revenues (€ ha-1),
calculated by the sugar beet price (€ t-1). Sugar beet quality parameters formed the basis of
the sugar beet price (Huijbregts and Tijink, 2008). Sugar beet quality parameters are: sugar
content (SC), potassium, sodium and α-amino nitrogen content (mmol kg-1) of the sugar
beets, which determine the amount of sugar which remains in the molasses (MS). The Dutch
sugar industry uses a formula to calculate the sugar recovery (WIN, Winbaarheidsindex
Nederland or beet quality index) based on quality parameters and the calculated quantity of
sugar in molasses. The WIN is expressed as a percentage (Huijbregts, 1999):
WIN = 100 - 100 • (MS/SC) (1)
The white sugar yield was not considered in the present study, since the growers only
consider the sugar yield and beet quality. Sugar yield (SY) is calculated as the product of
root yield (RY) and sugar content (SC). Standardised prices were taken for quota beets (35 €
t-1) and for surplus beets (15 € t-1), both at 16% sugar and WIN = 87. Sugar content and beet

2. Comparison of costs and yields
27
quality were fined with -8.40 € t-1 at 14% sugar and with -4.19 € t-1 at WIN = 80 and paid with
6.30 € t-1 at 18% and with 2.68 € t-1 at WIN = 92 per ton root yield (Huijbregts and Tijink,
2008).
Since top tare is not fined (nor paid) by the Dutch sugar industry (Huijbregts and Tijink,
2008), the amount of top tare has no influence on sugar beet payments. Soil and other
(stones, wood pieces, weeds and rotten beets) tare is fined with 12.50 € t-1 (Huijbregts and
Tijink, 2008). In the Betapaar database the fine was calculated per ton root yield and
subtracted from the sugar beet price.
In this publication, all sugar beets were considered being paid as quota beets for a
transparent comparison of both grower types.
2.3.4 Statistical analysis
Data were analysed using the statistical package GenStat, 11th edition (VSN International
Ltd.). Linear mixed models were used to analyse the effect of year, grower, site and their
interactions in the fixed model. The given pair number, region and their interaction were used
as random terms to analyse the ‘type top’ and ‘type average’ within a pair directly with each
other (Thissen, 2009).
Linear regressions were calculated to estimate the effect of single variables on sugar yield
and total variable costs.
2.4 Results
2.4.1 Effect of grower and interactions with site and year
Sugar yield was not related to sugar beet acreage per farm. The relation between total
variable costs and sugar beet acreage (on average 11.5 ha; range 2 - 40 ha) per farm was
significant, but the coefficient of correlation was very low. Therefore, the sugar beet acreage
is not presented in the following.
Improvement of the competitiveness of the sugar beet crop in the Netherlands
28
The effect of site (S) was only significant for soil treatment and harvest costs (table 2.2).
Except for root yield, the effect of year (Y) was significant for all yield and quality parameters
including beet price and revenues. Concerning the total direct growing costs, the significant
effect of year was influenced by the significant effect of year on costs of fungicides and
manure and fertiliser. The effect of year on total contracting and machinery costs was not
significant, although it was significant for costs of soil treatment, irrigation and pesticide
application. The year had a significant effect on the total variable costs and unit costs of
sugar yield (excluding fixed costs), but not on unit costs of root yield.
The effect of grower (G) on yield and quality was significant for root yield, sugar content,
sugar yield and consequently for revenues, but neither for the beet quality index nor top or
soil tare (table 2.2). The effect of grower was significant for fungicide, pesticide and nutrient
application costs as well as for total contracting and machinery costs and both unit costs.
Compared to the main effects, there were only a few significant interactions: a year x site
interaction for root yield, a year x grower and year x site interaction for soil tare, a grower x
site interaction for seed costs, a threefold interaction of year x grower x site for hand weeding
costs, a year x site interaction for ‘other’ costs, and interactions between grower and site
respectively year and site for total contracting and machinery costs. Irrigation as well as all
total costs and unit costs were significantly influenced by an interaction year x site (table 2.2).
No significant relation was found between root yield and sugar content (Figure 2.2). The
relation of beet quality index and sugar content was highly significant. The influence of sugar
content on beet price was highly significant while its influence on beet quality index was less
strong (data not shown).

2. Comparison of costs and yields
29
Table 2.2. Significance of the effect of year (Y), grower (G), site (S) and their interactions on yield, quality and cost variables in Dutch sugar beet production; SUSY-project, 2006 - 2008. Grower ‘type top' n = 75; grower ‘type average’ n = 74.
Variable
a Site (S)
Year (Y)
Grower (G)
Y.S Y.G G.S Y.G.S
Root yield (t ha-1
) n.s. n.s. *** * n.s. n.s. n.s.
Sugar content (%) n.s. *** * n.s. n.s. n.s. n.s.
Sugar yield (t ha-1
) n.s. * *** n.s. n.s. n.s. n.s.
WIN (beet quality index) n.s. *** n.s. n.s. n.s. n.s. n.s.
Soil tare (%) n.s. * n.s. * * n.s. n.s.
Top tare (%) n.s. * n.s. n.s. n.s. n.s. n.s.
Beet price (€ t-1
) n.s. *** n.s. n.s. n.s. n.s. n.s.
Revenues (€ ha-1
) n.s. *** *** n.s. n.s. n.s. n.s.
Seed (€ ha-1
) n.s. n.s. n.s. n.s. n.s. *** n.s.
Herbicides (€ ha-1
) n.s. n.s. n.s. n.s. n.s. n.s. n.s.
Hand weeding (€ ha-1
) n.s. n.s. n.s. n.s. n.s. n.s. *
Fungicides (€ ha-1
) n.s. *** *** n.s. n.s. n.s. n.s.
Insecticides (€ ha-1
) n.s. n.s. n.s. n.s. n.s. n.s. n.s.
Manure and fertiliser (€ ha-1
) n.s. *** n.s. n.s. n.s. n.s. n.s.
Other (€ ha-1
) n.s. n.s. n.s. * n.s. n.s. n.s.
Total direct growing costs (€ ha
-1)
n.s. ** n.s. * n.s. n.s. n.s.
Soil treatment (€ ha-1
) * ** n.s. n.s. n.s. n.s. n.s.
Drilling (€ ha-1
) n.s. n.s. n.s. n.s. n.s. n.s. n.s.
Herbicide application (€ ha-1
) n.s. n.s. n.s. n.s. n.s. n.s. n.s.
Mechanical weeding (€ ha-1
) n.s. n.s. n.s. n.s. n.s. n.s. n.s.
Nutrient application (€ ha-1
) n.s. n.s. * n.s. n.s. n.s. n.s.
Irrigation (€ ha-1
) n.s. *** n.s. *** n.s. n.s. n.s.
Pesticide application (€ ha-1
) n.s. ** *** n.s. n.s. n.s. n.s.
Harvest (€ ha-1
) * n.s. n.s. n.s. n.s. n.s. n.s.
Total contracting and machinery costs (€ ha
-1)
n.s. n.s. * *** n.s. * n.s.
Total variable costs (€ ha-1
)b
n.s. ** n.s. *** n.s. n.s. n.s.
Unit costs root yield (€ t-1
)b
n.s. n.s. *** *** n.s. n.s. n.s.
Unit costs sugar yield (€ t-1
)b
n.s. * *** *** n.s. n.s. n.s.
a. n.s. = not significant; *, **, *** = significant at p ≤ 0.05, ≤ 0.01, ≤ 0.001. b. Costs mentioned exclude the fixed costs e.g. tenancy for the field and the overhead of the farm. The
overhead encloses profit margin, costs of sugar quota, assurances for crop and grower, buildings, maintenance of fields, field and ditch edges.

Improvement of the competitiveness of the sugar beet crop in the Netherlands
30
Figure 2.2. Relation of root yield to sugar content in Dutch sugar beet production; SUSY-project, 2006-2008. n.s. = not significant.
2.4.2 Difference between grower types
The growers ‘type top’ had significantly higher root and sugar yield, resulting in significantly
higher revenues (481 € ha-1 difference) compared to ‘type average’, although the difference
in beet price was not significant (table 2.3). The ‘type top’ growers had significantly higher
costs for fungicides, nutrient application and pesticide application, the latter two causing
significantly higher total contracting and machinery costs for ‘type top’ growers compared to
‘type average’ growers. Both unit costs of root and sugar yield differed significantly between
growers ‘type top’ and ‘type average’. The total direct growing costs and total variable costs
were not significantly different between growers ‘type top’ and ‘type average’. For all
variables considerably influenced by grower, the differences between ‘type average’ and
‘type top’ growers were significant, except for the difference in sugar content.

2. Comparison of costs and yields
31
Table 2.3. Influence of grower type on yield, quality and cost components in Dutch sugar beet production; SUSY-project, 2006 - 2008. Grower ‘type top' n = 75; grower ‘type average’ n = 74.
Component Grower
Significance effect
a ‘Type
average’ ‘Type top’ lsd 5%
Root yield (t ha-1
) *** 66.7 78.1 2.89
Sugar content (%) * 17.01 17.21 0.22
Sugar yield (t ha-1
) *** 11.4 13.4 0.51
WIN (beet quality index) n.s. 91.1 91.1 0.29
Soil tare (%) n.s. 8.8 8.6 0.87
Top tare (%) n.s. 5.2 5.2 0.20
Beet price (€ t-1
) n.s. 39.08 39.75 0.86
Revenues (€ ha-1
) *** 2618 3099 128.80
Seed (€ ha-1
) n.s. 217 213 6.53
Herbicides (€ ha-1
) n.s. 199 190 17.72
Hand weeding (€ ha-1
) n.s. 48 48 15.41
Fungicides (€ ha-1
) *** 36 52 6.65
Insecticides (€ ha-1
) n.s. 1 2 1.66
Manure and fertiliser (€ ha-1
) n.s. 42 47 51.32
Other (€ ha-1
) n.s. 43 53 20.84
Total direct growing costs (€ ha-1
) n.s. 543 564 59.19
Soil treatment (€ ha-1
) n.s. 150 145 9.54
Drilling (€ ha-1
) n.s. 68 68 3.27
Herbicide application (€ ha-1
) n.s. 90 97 8.28
Mechanical weeding (€ ha-1
) n.s. 17 19 6.33
Nutrient application (€ ha-1
) * 44 56 9.56
Irrigation (€ ha-1
) n.s. 29 46 19.36
Pesticide application (€ ha-1
) *** 26 36 5.04
Harvest (€ ha-1
) n.s. 345 342 10.73
Total Contracting and Machinery costs (€ ha
-1)
* 816 855 32.88
Total variable costs (€ ha-1
)b
n.s. 1356 1416 73.35
Unit costs root yield (€ t-1
)b
*** 21.13 18.26 1.69
Unit costs sugar yield (€ t-1
)b
*** 125.1 106.8 9.92
a. n.s. = not significant; *, **, *** = significant at p ≤ 0.05, ≤0.01, ≤ 0.001. b. Costs mentioned exclude the fixed costs e.g. tenancy for the field and the overhead of the farm. The
overhead encloses profit margin, costs of sugar quota, assurances for crop and grower, buildings, maintenance of fields, field and ditch edges.
Improvement of the competitiveness of the sugar beet crop in the Netherlands
32
In the following, only data with significant main effects of grower and significant interactions
of year and site (table 2.2) are presented. However, if the main effect of grower was
significant, the year x grower interaction is shown for these variables as well.
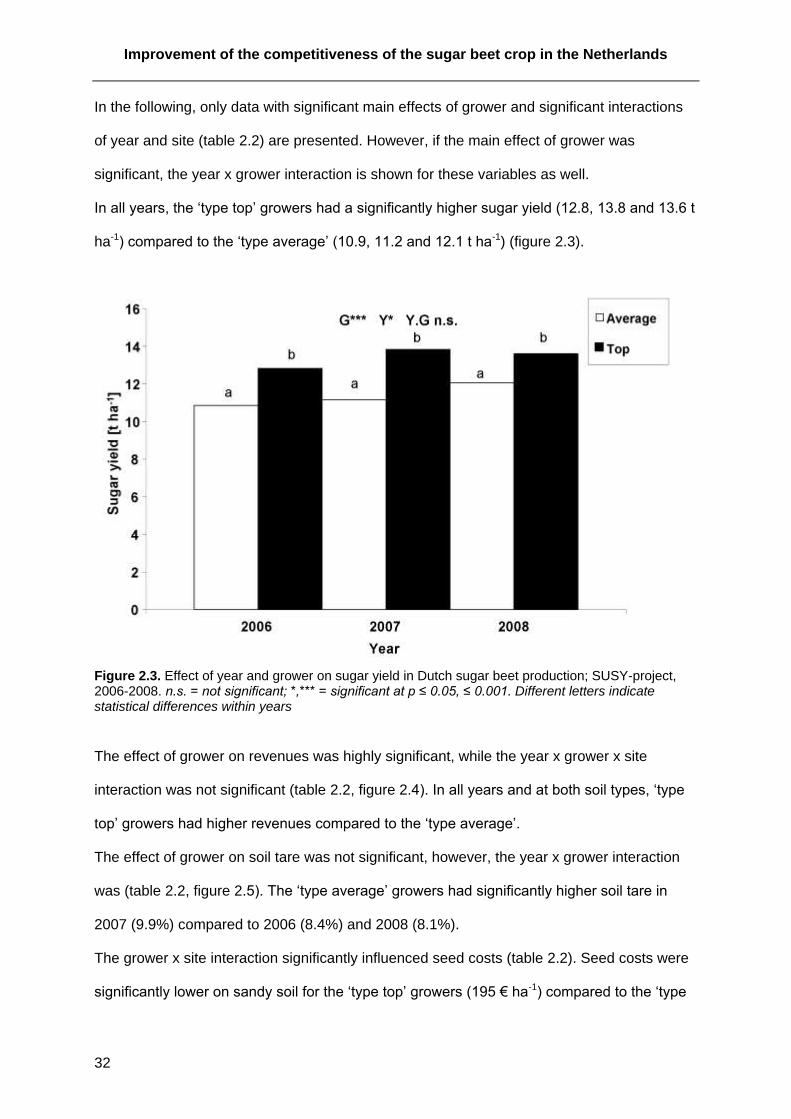
In all years, the ‘type top’ growers had a significantly higher sugar yield (12.8, 13.8 and 13.6 t
ha-1) compared to the ‘type average’ (10.9, 11.2 and 12.1 t ha-1) (figure 2.3).
Figure 2.3. Effect of year and grower on sugar yield in Dutch sugar beet production; SUSY-project, 2006-2008. n.s. = not significant; *,*** = significant at p ≤ 0.05, ≤ 0.001. Different letters indicate statistical differences within years
The effect of grower on revenues was highly significant, while the year x grower x site
interaction was not significant (table 2.2, figure 2.4). In all years and at both soil types, ‘type
top’ growers had higher revenues compared to the ‘type average’.
The effect of grower on soil tare was not significant, however, the year x grower interaction
was (table 2.2, figure 2.5). The ‘type average’ growers had significantly higher soil tare in
2007 (9.9%) compared to 2006 (8.4%) and 2008 (8.1%).
The grower x site interaction significantly influenced seed costs (table 2.2). Seed costs were
significantly lower on sandy soil for the ‘type top’ growers (195 € ha-1) compared to the ‘type

2. Comparison of costs and yields
33
average’ (211 € ha-1). The seed costs of ‘type top’ growers on clay soil (232 € ha-1) did not
differ significantly from those of ‘type average’ growers on clay soil (223 € ha-1). The year x
grower x site interaction had a significant influence on hand weeding costs (table 2.2).
Fungicide and application costs of nutrients and pesticides were significantly higher for ‘type
top’ growers in all years compared to ‘type average’ growers (figure 2.6). The differences
between ‘type top’ and ‘type average’ growers for irrigation costs were not significant, but the
year significantly influenced irrigation costs.
Figure 2.4. Effect of year, grower and site on revenues in Dutch sugar beet production; SUSY-project, 2006-2008. n.s. = not significant; *** = highly significant at p ≤ 0.001. Different letters indicate statistical differences between grower types within years.
The ‘type top’ growers had significantly higher (49 € ha-1) total contracting and machinery
costs compared to ‘type average’ (table 2.3, figure 2.7), the interaction grower x site being
significant, too. On sandy soil, the total contracting and machinery costs were significantly
higher for ‘type top’ (864 € ha-1) compared to ‘type average’ growers (788 € ha-1), while the
effect was not significant on clay soil (847 and 844 € ha-1) (figure 2.7).

Improvement of the competitiveness of the sugar beet crop in the Netherlands
34
Figure 2.5. Effect of year and grower on soil tare in Dutch sugar beet production; SUSY-project, 2006-2008. n.s. = not significant; * = significant at p ≤ 0.05. Different letters indicate statistical differences between years.
Figure 2.6. Effect of year (Y) and grower (G) on costs of fungicide, nutrient application, irrigation and pesticide application in Dutch sugar beet production; SUSY-project, 2006-2008. n.s. = not significant; *, **, *** = significant at p ≤ 0.05, ≤ 0.01, ≤ 0.001. Different letters indicate statistical differences within each cost component and year.

2. Comparison of costs and yields
35
Neither grower nor the interaction year x grower x site had a significant effect on the total
variable costs, although the non-significant differences were up to 200 € ha-1 (figure 2.8 A,
table 2.3). However, the grower main effect significantly influenced both unit costs root and
sugar yield. The ‘type top’ growers had lower unit costs compared to the ‘type average’
growers in each of the three years (figure 2.8 B-C, table 2.3).
Figure 2.7. Effect of grower and site (A) and year and grower (B) on total contracting and machinery costs in Dutch sugar beet production; SUSY-project, 2006-2008. n.s. = not significant; * = significant at p ≤ 0.05. Different letters indicate statistical differences between grower types.
Improvement of the competitiveness of the sugar beet crop in the Netherlands
36
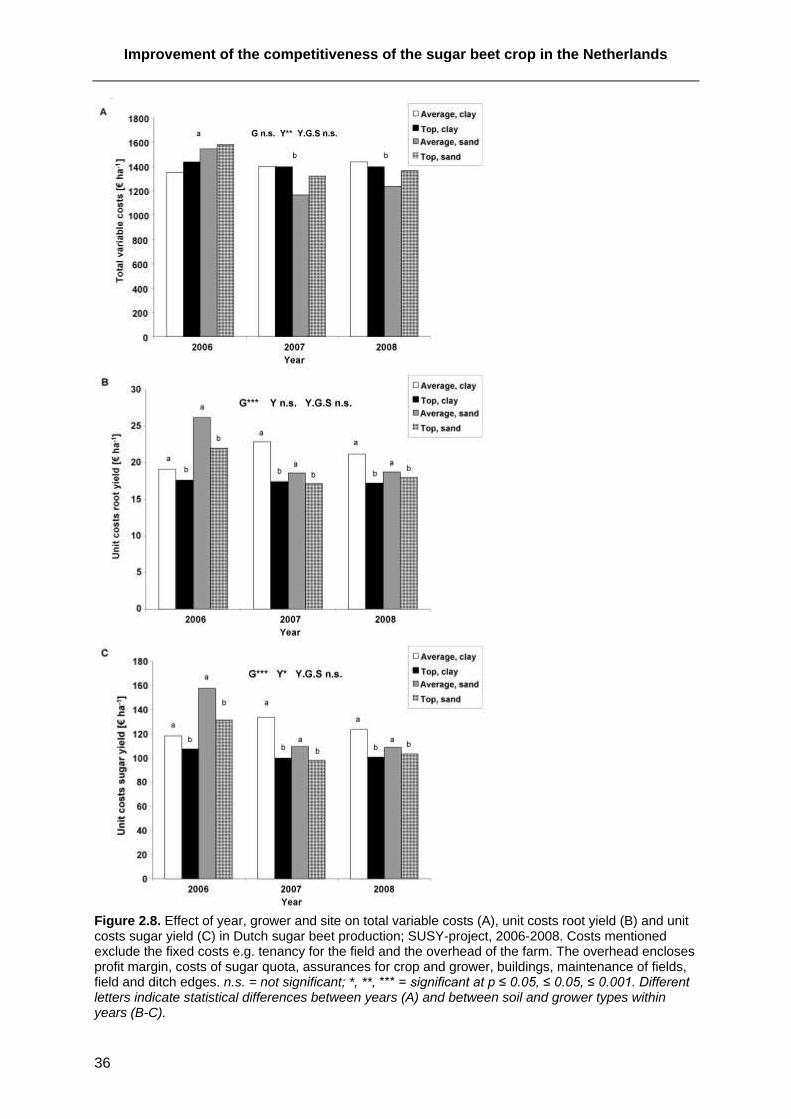
Figure 2.8. Effect of year, grower and site on total variable costs (A), unit costs root yield (B) and unit costs sugar yield (C) in Dutch sugar beet production; SUSY-project, 2006-2008. Costs mentioned exclude the fixed costs e.g. tenancy for the field and the overhead of the farm. The overhead encloses profit margin, costs of sugar quota, assurances for crop and grower, buildings, maintenance of fields, field and ditch edges. n.s. = not significant; *, **, *** = significant at p ≤ 0.05, ≤ 0.05, ≤ 0.001. Different letters indicate statistical differences between years (A) and between soil and grower types within years (B-C).

2. Comparison of costs and yields
37
2.4.3 Regression analysis
The relation of total variable costs to costs of herbicide, hand weeding, insecticide, manure
and fertiliser, ‘other’ costs, nutrient application and irrigation costs was significant (table 2.4).
However, the strength (R2) was considerable only for the costs for manure and fertiliser,
‘other’ and irrigation costs. The total variable costs were significantly related to the total direct
growing and the total contracting and machinery costs.
Sugar yield had a significant relation only to seed, fungicide, drilling, and herbicide and
pesticide application costs but with a very low R2, except for fungicide costs. Finally, none of
the cost components showing a significant correlation to sugar yield was significantly
correlated to total variable costs and vice versa (table 2.4).
The non-relevant relation of sugar yield to cost and cultivation intensity in sugar beet is
graphically demonstrated by two examples, the total variable costs and the fertilizing costs
(figure 2.9 A-C).

Improvement of the competitiveness of the sugar beet crop in the Netherlands
38
Table 2.4. Regression analysis for cost components to total variable costs and sugar yield in Dutch sugar beet production; SUSY-project, 2006-2008 (n=149).
Cost component Total variable costsa
Sugar yielda
Slope R2 Slope R
2
Seed (€ ha-1
) 0.14 0.00 n.s. 0.02 0.06 **
Herbicides (€ ha-1
) 0.79 0.04 ** 0.00 0.01 n.s.
Hand weeding (€ ha-1
) 1.20 0.06 ** 0.01 0.02 n.s.
Fungicides (€ ha-1
) 1.40 0.02 n.s. 0.03 0.13 ***
Insecticides (€ ha-1
) 8.60 0.03 * 0.05 0.02 n.s.
Manure and fertiliser (€ ha-1
) 1.00 0.52 *** 0.00 0.02 n.s.
Other (€ ha-1
) 1.56 0.20 *** 0.00 0.00 n.s.
Total direct growing costs (€ ha-1
) 1.10 0.79 *** 0.00 0.00 n.s.
Soil treatment (€ ha-1
) 0.44 0.01 n.s. 0.00 0.00 n.s.
Drilling (€ ha-1
) 1.75 0.01 n.s. 0.04 0.05 **
Herbicide application (€ ha-1
) 0.08 0.00 n.s. -0.01 0.03 *
Mechanical weeding (€ ha-1
) -0.39 0.00 n.s. -0.01 0.01 n.s.
Nutrient application (€ ha-1
) 1.44 0.05 ** -0.01 0.01 n.s.
Irrigation (€ ha-1
) 1.39 0.23 *** 0.00 0.01 n.s.
Pesticide application (€ ha-1
) 1.43 0.01 n.s. 0.03 0.08 ***
Harvest (€ ha-1
) -0.07 0.00 n.s. 0.00 0.00 n.s.
Total Contracting and Machinery costs (€ ha-1
) 1.30 0.36 *** 0.00 0.00 n.s.
Total variable costs (€ ha-1
)b
- - 0.00 0.00 n.s.
a. n.s. = not significant; *, **, *** = significant at p ≤ 0.05, ≤ 0.01, ≤ 0.001. b. The costs mentioned exclude the fixed costs e.g. tenancy for the field and the overhead of the farm. The
overhead encloses profit margin, costs of sugar reference, assurances for crop and grower, buildings, maintenance of fields, field and ditch edges.

2. Comparison of costs and yields
39
Figure 2.9. Relation of sugar yield to total variable costs (A), costs for nutrient application (B) and manure and fertiliser (C) in Dutch sugar beet production; SUSY-project, 2006-2008. n.s. = not significant.

Improvement of the competitiveness of the sugar beet crop in the Netherlands
40
2.5 Discussion
Many times in the history of Dutch agriculture, growers had to adapt to changing
circumstances often initiated by economical impulses (Bieleman, 1992). For sugar beet
growers, the reform of the EU sugar regime was a recent economical pulse (CR (EC)
1260/2001, 2001) forcing them to decisions concerning the cost and yield level of sugar beet
production and even to decisions on continuing sugar beet production or not. The SUSY
(Speeding Up Sugar Yield) project aimed to provide growers with knowledge on how to
handle the price drop in sugar beet production. It investigated the causes and the costs of
the differences in sugar yield, or growers’ performance, in a pair-wise comparison. Farms in
a pair were closely located to each other in all major sugar beet producing regions in The
Netherlands. The selection based on yields in 2000-2004 caused the ‘type top’ (high yielding)
growers having higher yields compared to the ‘type average’ (average yielding) during the
project. However, it should be noticed that in each region at least one ‘type average’ grower
was able to increase yield during the project, mainly due to a change in attitude towards
sugar beet production, not being pleased called ‘type average’. On the other hand, not all
‘type top’ growers were excellent growers and had opportunities to raise their yields, too.
In the project, growers with large sugar beet acreage had no higher sugar yields compared
with sugar beet growers having a small acreage. Therefore, size of crop acreage can not be
used to measure growers’ performance. In this study, there was no influence of sugar beet
acreage on the costs, either, since the costs were calculated for the treatments the farmers
conducted themselves. These cost calculations were based on efficient equipment use in
order to be able to compare farms with high and low contracting use. This methodology
ignores the cost advantage of increasing farm size but enables the comparison of the ‘type
top’ and ‘type average’ growers on an equal basis.
Most of the significant effects on yield, quality and cost variables were found for year and
grower. Year effects on yield are well known in agriculture (Lobell et al., 2009) and in sugar
beet production mainly determined by the weather (e.g. Märländer, 1991). However, since

2. Comparison of costs and yields
41
the weather is a given fact, the management by the grower becomes very important for crop
performance. Independent of the year, the ‘type top’ growers harvested more sugar per
hectare compared to the ‘type average’. These results imply that the influence of the grower
can compensate for yield losses by biotic and abiotic variance. This effect was also observed
for growers with arable farms equal in size, similar in soil and with equal start of cultivation on
newly reclaimed farmland in the Noordoostpolder (NL). Here the factor grower was also
responsible for the difference in yield (Zachariasse, 1974). Recent research found the same
importance of growers’ management in Germany (Fuchs et al., 2008) and its importance
under the circumstances provided by the weather (Märländer, 1991).
The grower probably also influenced plant development. In breeding, a negative correlation
between sugar content and root yield was observed on trial fields (Hoffmann, 2006), while no
relation was found in this study. The sugar content, although significantly influenced by
grower, did not differ significantly between ‘type top’ and ‘type average’ growers. This implies
that the ‘type top’ tend to achieve higher sugar content, but on average, the absolute
difference between both grower types is not significant. So the general production
management irrespective of grower type influences the relation of sugar content and root
yield. Next to this, the high yielding effect of ‘type top’ growers is mainly due to a higher root
yield. This confirms the results of yield increase over 20 years, on the same farm, found to be
mainly dependent on an increase in root yield (Märländer, 1991).
Sugar content is important in the sugar beet payment and closely linked to beet quality
(Huijbregts, 1999). Both sugar content and beet quality are positively rewarded by the Dutch
sugar industry (Huijbregts and Tijink, 2008). Because the sugar content, although
significantly influenced by grower, did not differ significantly between ‘type top’ and ‘type
average’ growers, the beet price and the beet quality index did not differ, either. Since sugar
content is a key factor for the calculation of the beet price, growers might focus on the sugar
content. This could explain why there was a significant effect of grower type but no significant
difference between grower types based on the least significant difference. This needs to be

Improvement of the competitiveness of the sugar beet crop in the Netherlands
42
further investigated, because it is also possible that the sample size was too small to
distinguish between a random or significant grower effect.
Due to their much higher sugar yield, the revenues of the ‘type top’ growers were 481 € ha-1
higher compared to ‘type average’ growers, while the total variable costs were equal for both
grower types. This leaves a higher margin for ‘type top’ growers to cover fixed costs (which
are not considered in this study) and might result in a higher income. A study on the total
costs of 109 farms in Germany revealed the 25% highest yielding growers having lower costs
compared to the 25% lowest yielding farms (Starcke and Bahrs, 2009). This difference can
be due to the experimental set up. The German study selected the growers for an inquiry and
divided them afterwards into high or low yielding groups irrespective of the region. In the
SUSY project, the ‘type top’ and ‘type average’ grower of a pair were selected in the same
region. As a consequence, both grower types encountered the same cost components
specific for the region (e.g. extra soil treatment, irrigation and wind erosion prevention costs).
The costs for soil treatment, irrigation and pesticide application were significantly influenced
by year, however, this did not influence the total contracting and machinery costs. Likely, the
variation in the machinery cost components (costs for drilling, herbicide and nutrient
application, mechanical weeding and harvest) eliminated the year effect, because the total
contracting and machinery cost contains all those cost components. The year effect on
irrigation can be explained by the dry summer of 2006 and the year effect on soil treatment
by the drought in spring 2007 which caused a need for extra seedbed preparations on clay
soil. Fungicide costs and pesticide application costs, which are linked, were significantly
influenced by year. This is due to the supervised control of foliar diseases resulting in year-
dependent amounts of fungicides applied (Vereijssen, 2004). Contrary to the effect of year,
the significant effect of grower on application costs of both nutrients and pesticides also
caused a significant effect of grower on the total contracting and machinery costs.
With the total variable costs reflecting the input rate per hectare of sugar beet growing, the
higher yields made the ‘type top’ growers more efficient in the production process, because
their unit costs both for root and sugar yield were lower compared to the ‘type average’
2. Comparison of costs and yields
43
growers. The same effect was observed for the nitrogen use efficiency. To produce one ton
sugar, the ‘type top’ growers used on average 11.8 kg N while the ‘type average’ growers
used 12.9 kg N. The nitrogen application rate varied for all growers from 36 to 1.5 kg N t
sugar-1 (data not shown), which is in line with results of the study by Fuchs and Stockfisch
(2009) for Germany. Higher yields provide ‘type top’ growers with a more efficient resource
use, which is profitable for both the grower and the environment. For sugar beet production
in the United Kingdom, Tzilivakis et al. (2005) also found, that a high yield could be obtained
whilst minimising the environmental impact. A study on Dutch sugar beet production
confirmed this and found ‘a persistent farmer’s management influence on efficiency’ (De
Koeijer et al., 2002). The findings of the SUSY-project confirm that in sugar beet production
the grower has a profound influence on economic and environmental sustainability.
The manure and fertiliser costs were low on average, but varied between years. This can be
explained by an unique situation in The Netherlands. Due to a high intensity of animal
production, combined with none or small sized arable activities of the cattle-breeders (CBS,
2008) and a strict legislation on nutrient supply on agricultural fields (Meststoffenwet, 2006;
2009), arable farmers are paid by cattle-breeders to apply manure to their crops (Van den
Ham et al., 2007). It is not always possible to totally meet the sugar beet nutrient demand by
manure, due to application time and uncertainty of mineral content of the manure at
application time (Wilting, 2009b). However, with the use of the highest possible amounts of
manure the grower can save on nutrition costs of sugar beet production, or even earn with
the use of manure. This directly lowers the total variable costs. On the other hand, the use of
manure saves the use of mineral nitrogen, a nutrient with a high energy density (Jensen and
Kongshaug, 2003). Thus, the use of manure instead of mineral fertilisers contributes to a
sustainable development of sugar beet production, both economically and environmentally.
The total variable costs for growers on sandy soils were higher in 2006 compared to the
other two years on sandy soils. This cost increase is due to the irrigation costs in the dry
summer. On the clay soils, where irrigation is not common, the total variable costs were more
stable over the years. For the unit costs, the same pattern was observed, raising the

Improvement of the competitiveness of the sugar beet crop in the Netherlands
44
question whether the high irrigation costs were paid back by a raise in yield or not. The
regression analysis showed the irrigation costs significantly raising the total variable costs,
while they did not influence the sugar yield. From this data set it is difficult to distinguish
whether the irrigation costs are stabilizing the sugar yield in dry periods or are unnecessary
costs, because there were no differences in irrigation between ‘type top’ and ‘type average’
growers. The sugar beet root growth in July and August was found to be dependent on the
available water in the soil (Kenter et al., 2006) pleading for irrigation in dry periods. Dutch
research also found an increase in root yield by irrigation, but there remains a risk that
irrigation costs are not fully covered by the yield increase (Wilting, 2009a).
The costs components which significantly raised the total variable costs in the regression
analysis had no influence on sugar yield, and vice versa. Thus, savings can be made on
those costs which raise the total variable costs, like the above discussed irrigation and
manure and fertiliser costs and the ‘other’ costs. The latter is a summation of minor cost
components, like the costs for covering the beet clamp and growing green manure crops.
The significant effect of this cost component on total variable costs was most likely due to the
increased length of the campaign and frost period in 2008, which triggered some growers on
the sandy soils to invest in beet clamp covering materials.
The best cost strategy in sugar beet production would be to reduce costs as much as
possible, while maximising sugar yield. At this point, the growers’ management is crucial
again. They can obtain a higher yield by optimizing the same level of inputs (Märländer,
1991) resulting in a more efficient production (De Koeijer et al., 2002).
In this study, the only savings which would obviously put the sugar yield at risk would be
savings on fungicides costs. To handle these costs sustainably from both an economical and
environmental point of view, an integrated pest management system was developed
(Vereijssen, 2004).
Finally, there was no relation between the intensity of production measured by the total
variable costs and the result of the costs that were made, the yield. Compared to other crops,
like wheat and maize, this is a very sustainable characteristic of the sugar beet crop. The

2. Comparison of costs and yields
45
yield of wheat and maize is strongly linked to the intensity of production (Charles et al., 2006;
Pingali and Rajaram, 1999). For those crops, the yield level is often determined by the
maximum profit, when the additional costs are not paid back by the increased financial yield
(Lobell et al., 2009). However, this study clearly shows that maximising sugar yield is the
most profitable strategy for the growers, with optimising costs simultaneously. The
differences in sugar yield observed were not caused by economical constraints. The best
preparation of sugar beet growers for future uncertainties, like the end of the present EU
sugar regime in 2015 (CR (EC) 318/2006, 2006) and presumably increasing demands of the
society for environmental friendly production, is to raise the sugar yields.

Improvement of the competitiveness of the sugar beet crop in the Netherlands
46
2.6 References
Agrarische Dienst, 2007. Unitip 2006 Algemeen verslag. Suiker Unie, Dinteloord
Bieleman, J., 1992. Geschiedenis van de landbouw in Nederland 1500-1950. Boom,
Meppel/Amsterdam
CBS, 2008. Dierlijke mest en mineralen 1990-2008. Centraal Bureau voor de Statistiek, Den
Haag
Charles, R., Jolliet, O., Gaillard, G., Pellet, D., 2006. Environmental analysis of intensity level
in wheat crop production using life cycle assessment. Agriculture Ecosystems &
Environment. 113, 216-225.
CR (EC) 1260/2001, 2001. Council Regulation (EC) No 1260/2001 of 19 June 2001 on the
common organisation of the markets in the sugar sector. Official Journal of the
European Communities L. 178, 1-45.
CR (EC) 318/2006, 2006. Council Regulation (EC) No 318/2006 of 20 February 2006 on the
common organisation of the markets in the sugar sector. Official Journal of the
European Communities L. 58, 1-31.
De Koeijer, T. J., Wossink, G. A. A., Struik, P. C., Renkema, J. A., 2002. Measuring
agricultural sustainability in terms of efficiency: the case of Dutch sugar beet growers.
Journal of Environmental Management. 66, 9-17.
De Wit, C.T., 1953. A physical theory on placement of fertilizers. Dissertation. Verslagen
Landbouwkundige Onderzoekingen (59-4), Dissertation, Landbouwhogeschool
Wageningen, The Netherlands.
De Wolf, M., Van der Klooster, A., 2006. Kwantitatieve Informatie Akkerbouw en
Vollegrondsgroententeelt. Praktijkonderzoek Plant & Omgeving B.V., Wageningen
Fuchs, J., Stockfisch, N., 2009. Effizienzentwicklung im Zuckerrübenanbau am Beispiel der
N-Düngung. Zuckerindustrie. 134, 33-41.

2. Comparison of costs and yields
47
Fuchs, J., Stockfisch, N., Märländer, B., 2008. Entwicklung und Variation der Leistung von
Zuckerrüben (Beta vulgaris L.) in Deutschland unter besonderer Berücksichtung von
Anbaumanagement und Sorte. Pflanzenbauwissenschaften. 12, 69-77.
Hoffmann, C., 2006. Zuckerrüben als Rohstoff - Die technische Qualität als Voraussetzung
für eine effiziente Verarbeitung. Weender Druckerei, Göttingen
Huijbregts, A. W. M., Tijink, F. G. J., 2008. Kwaliteit, Oogst (-mechanisatie) en Bewaring, in:
Betatip. IRS, Bergen op Zoom, 3-30
Huijbregts, T., 1999. New Dutch sugar recovery formula for sugar beet. Zuckerindustrie. 124,
698-701.
Jensen, T. K., Kongshaug, G., 2003. Energy Consumption and Greenhouse Gas Emissions
in Fertilizer Production. Proceedings of The International Fertilizer Society. No. 509
Kenter, C., Hoffmann, C. M., Märländer, B., 2006. Effects of weather variables on sugar beet
yield development. European Journal of Agronomy. 24, 62-69.
Lobell, D. B., Cassman, K. G., Field, C. B., 2009. Crop Yield Gaps: Their Importance,
Magnitudes, and Causes. Annual Review of Environment and Resources. 34, 179-
204.
Lyman Ott, R., Longnecker, M. T., 2001. An Introduction to Statistical Methods and Data
Analysis. Duxbury Press, Pacific Grove, CA
Märländer, B., 1991. Zuckerrüben: Produktionssteigerung bei Zuckerrüben als Ergebnis der
Optimierung von Anbauverfahren und Sortenwahl sowie durch Züchtungsfortschritt -
Versuch einer Analyse anhand langjähriger Feldversuche in Nordwestdeutschland.
Ute Bernhardt-Pätzold Druckerei & Verlag, Stadthagen
Meststoffenwet, 2006. Meststoffenwet 1 januari 2006. Staatsblad van het Koninkrijk der
Nederlanden. 64, 1-30.
Meststoffenwet, 2009. Wet van 26 november 2009 tot wijziging van de Meststoffenwet.
Staatsblad van het Koninkrijk der Nederlanden. 551, 1-4.
Pauwels, J. B., 2006a. Project No. 07-06 Verbetering rendement suikerbietenteelt, in: IRS
Jaarverslag 2005. IRS, Bergen op Zoom, 33-36

Improvement of the competitiveness of the sugar beet crop in the Netherlands
48
Pauwels, J. B., 2006b. Teeltkosten kunnen 20 procent lager. IRS Informatie in Cosun
Magazine nr 8 and CSM Informatie nr 555, 14-15.
Pingali, P. L., Rajaram, S., 1999. Global Wheat Research in a Changing World: Options for
Sustaining Growth in Wheat Productivity, in: CIMMYT 1998-99 World Wheat Facts
and Trends. P. L. Pingali. CIMMYT, Mexico, D.F.
Starcke, J. U., Bahrs, E., 2009. Leistungen und Kosten bei Zuckerrüben und Ackerbau vor
und nach den jüngsten Agrarreformen. Zuckerindustrie. 134, 101-108.
Thissen, J.T.N.M., 2009. Mixed model suikerbieten (SUSY project). Personal
Communication.
Tzilivakis, J., Warner, D. J., May, M., Lewis, K. A., Jaggard, K. W., 2005. An assessment of
the energy inputs and greenhouse gas emissions in sugar beet (Beta vulgaris)
production in the UK. Agricultural Systems. 85, 101-109.
Van den Ham, A., Daatselaar, C. H. G., Doornewaard, G. J., De Hoop, D. W., 2007. Eerste
ervaringen met het Gebruiksnormenstelsel. Studie in het kader van de Evaluatie
Meststoffenwet 2007. LEI, Den Haag.
Van Swaaij, A. C. P. M., 2007. Opbrengstprognose, in: Betatip. IRS, Bergen op Zoom, 11-13.
Vereijssen, J., 2004. Cercospora leaf spot in sugar beet. Epidemiology, life cycle
components and disease management. Dissertation, Wageningen University, the
Netherlands.
Wilting, P., 2008. Preventie schade door winderosie, in: Betatip. IRS, Bergen op Zoom, 39-
42.
Wilting, P., 2009a. Beregening, in: Betatip. IRS, Bergen op Zoom, 36-38.
Wilting, P., 2009b. Stikstofbemesting, in: Betatip. IRS, Bergen op Zoom, 5-12.
Zachariasse, L.C., 1974. Boer en Bedrijfsresultaat - Analyse van de uiteenlopende
rentabiliteit van vergelijkbare akkerbouwbedrijven in de Noord-Oost-Polder.
Dissertation. Agrarische Bedrijfseconomie, Landbouwhogeschool Wageningen.
Zeddies, J., 2006. Die neue EU-Zuckermarktordnung - Beschlüsse, Auswirkungen und
Bewertung. Agrarwirtschaft. 55, 97-99.

Improvement of the competitiveness of the sugar beet crop in the Netherlands
49
3 Pests and diseases contribute to sugar beet yield difference between top and averagely managed farms
B. Hanse, J.H.M. Schneider, A.J. Termorshuizen and M. Varrelmann
Crop Protection, 2011, 30, 671-678

Improvement of the competitiveness of the sugar beet crop in the Netherlands
50
3 Pests and diseases contribute to sugar beet yield difference
3.1 Abstract
Crop yield has to increase to meet the expanding demand for food, feed and bio-energy,
caused by world population growth and increasing wealth. Raising sugar yield is also the key
to sustaining the profitability of the sugar beet crop. This paper describes the factors that
impacted on yield differences between 26 ‘top’ and 26 ‘average’ growers based on four years
yield data (2000-2004). In 2006 and 2007, the top growers had 20% higher sugar yields
compared to their neighbouring average growers. Heterodera schachtii and Beet necrotic
yellow vein virus (BNYVV) were mainly found on clay soils. Top growers on clay soil had
significantly lower infestation levels of H. schachtii (4.4x lower, P = 0.008), BNYVV (2.7x
lower, P = 0.016) and other foliar symptoms (Pseudomonas, Phoma betae and Verticillium
spp. combined) (1.5x lower, P<0.001), than the average growers, respectively. On sandy
soils, infestation levels of Meloidogyne spp. (P = 0.016), Cercospora beticola (P = 0.005) and
Erysiphe betae (P = 0.027) were significantly lower (5x, 1.4x and 1.8x, respectively) for the
top growers. The top growers on clay or sand sowed 5 and 6 days earlier respectively, and
made more fungicide applications and thus used more fungicides than the average growers.
Insect pests were not observed at levels damaging for sugar yield: Insecticidal seed
treatments provided sufficient control of insect pests. In multiple regression, 35% of the
variance in sugar yield on clay soils was explained by H. schachtii and BNYVV infestation
levels and by sowing date. On sandy soils, the infestation levels of Heterodera betae and
Aphanomyces cochlioides, number of fungicide applications and sowing date explained 71%
of the variance in sugar yield. Despite crop protection measures, the calculated yield losses
due to pests and diseases for the top growers were 30.2 and 13.1% and for average growers
were 37.1 and 16.7% on sandy and clay soils, respectively. Therefore, pest and disease
infestation levels partly explained the differences in sugar yield between top and average
growers analysed. The skills and knowledge of the grower are important to reducing damage
by pests and diseases. Communication of knowledge, obtained by research, towards

3. Pests and diseases contribute to sugar beet yield difference
51
growers is vital for the long-term raising of yield and increasing of productivity in sugar beet,
as well as in other crops.
3.2 Introduction
The world population is expected to grow to a level of 9 billion people by 2050 (UN-DESA,
2009). Both population growth and increasing wealth cause an increase in the global
demand for food, feed and bio-energy (FAO, 2002; FAO, 2009). Theoretically, agriculture in
the world can produce enough to meet this future demand in a sustainable way, although it
requires efficiency and, among others, a raise in yield (Godfray et al., 2010; Jaggard et al.,
2010).
In each region in the world and for each crop, yield gaps or difference in yield levels occur
with growers’ management as a dominant factor (Lobell et al., 2009). Even on similar farms
with an equal starting point in time on fresh reclaimed soil, growers’ management was found
the major key for farm profitability (Zachariasse, 1974). The recent reform of the European
Union’s Common Agricultural Policy (CAP) implied a 39.7% decrease in sugar beet price for
growers (Zeddies, 2006). With the same yields the impact on farmers’ income would be
substantial. For this reason the Dutch sugar industry and the Institute of Sugar Beet
Research (IRS) initiated a project on the competitiveness of the sugar beet crop in the
Netherlands. Our SUSY (Speeding Up Sugar Yield) project aimed to find ways to increase
sugar yield and to identify cost savings. Data gathered from high yielding (‘top’) growers were
compared with data from neighbouring average yielding (‘average’) growers.
Analysis of the costs and yields in the SUSY-project revealed no difference in total variable
costs (financial input levels) between both grower types, concluding that raising sugar yield is
possible with identical inputs. The only significant factors influencing sugar yield, which were
significantly higher for top growers, were fungicide and their application costs, indicating the
importance of pests and diseases (Hanse et al., 2010). The attainable sugar yield is the
sugar yield limited by the natural physical environment (e.g. temperature, available water and

Improvement of the competitiveness of the sugar beet crop in the Netherlands
52
light) of the crop (Cook, 2000). Under Dutch climate conditions the attainable sugar yield was
estimated at a maximum of 23 Mg per hectare (De Wit, 1953). More recent research
calculated 24 Mg sugar per hectare for Germany (Kenter et al., 2006). Despite this
tremendous potential, the Dutch sugar beet growers achieved only an average of 10.6 Mg
sugar per hectare in the period 2002-2006 (Van Swaaij, 2007). Yield losses in sugar beet
due to plant pathogens and pests are estimated in general to be 26% with, and more than
80% without, crop protection (Oerke and Dehne, 2004). Therefore pests and diseases may
explain the yield gap in Dutch sugar beet production.
The objective of this study was to identify the differences between top and average growers
and to estimate the importance of pathogens and pests in Dutch sugar beet production. This
was performed with data collected from the commercial fields of selected growers, where all
important variables in growing sugar beet come together. Therefore, data were collected on
the parameters of soil physics, soil fertility, soil health, rainfall, sowing (date, depth, distance),
field establishment, canopy closure, pests and diseases, nutrient uptake, yield and quality,
harvest losses and exact field size (GPS). From these variables, those related to crop
protection were evaluated and presented here.
3.3 Materials and Methods
3.3.1 Pair study
The data were obtained within the framework of the study ‘Speeding Up Sugar Yield’ (SUSY)
of the Dutch Institute of Sugar beet Research, IRS, Bergen op Zoom. The pair-wise
comparison comprised 26 pairs of growers in both 2006 and 2007. Each pair was formed by
a top and an average grower, based on historic sugar yields of the period 2000-2004. Farms
of the growers within a pair were located closely together on the same soil type (average
distance between fields of a pair was 5.5 km, with a maximum of 29.6 and minimum of 0.19

3. Pests and diseases contribute to sugar beet yield difference
53
km). Pairs were located throughout the Netherlands on both sandy (<5% clay) and clay soils
(>5% clay) in sugar beet producing regions.
A grower was considered to belong to the top group when the sugar yield in the period 2000-
2004 was on average and in each single year among the 25% of the highest sugar yields in
the region where the farm was situated. A grower was considered to belong to the average
group when the sugar yields in the same period were among the mid 50% of average sugar
yields in the region. Pairs of top and average farmers were formed if there was at least an
arbitrarily chosen difference of 1.5 Mg ha-1 sugar yield based on the 5 years average
between those two growers. For each grower one field per year was included in the study.
The data of the number of fungicide applications and the amount of fungicide used, sowing
and harvesting date were given by the growers participating in the study.
3.3.2 Soil samples
From each field, 2.5 kg soil per 2 ha (0-25 cm) was collected by sub-sampling 60-70
randomly distributed cores with a 1.5 cm diam. auger in February – March before sugar beet
was sown. Soil from each field was air-dried, ground when necessary, homogenised, divided
into 5 lots and stored at room temperature for further analysis. This procedure was followed
for all the analyses done, except for the bioassay for Aphanomyces cochlioides Drechs. and
the quantification of free living nematodes. These latter soil samples were not dried, but were
stored at 4 °C and analysed shortly after sampling.
3.3.3 Detection of Beet Necrotic Yellow Vein Virus
To determine the presence of rhizomania (Beet necrotic yellow vein virus, BNYVV) in the
soils taken in 2007, 3 pots (7 x 7 x 6.2 cm l×w×h; 0.21 l) were filled with the sampled soil and
nutrients were added (slow release Osmocote; NPK 16-8-11 + trace elements). Sugar beet
seedlings (10-14-days-old, grown in trays with pasteurised sand) of susceptible variety

Improvement of the competitiveness of the sugar beet crop in the Netherlands
54
Blenheim (VanderHave Sugar Beet Seed B.V.) were grown in the pots in a climate room at
23 oC for 16 h in light conditions (20,000 lux) and 16 oC for 8 h in the dark. Watering was
done via individual dishes under the pots to prevent cross-contamination. After 10 wk, the
bioassay was terminated.
Soils tested positive for rhizomania (in 2007 and all soils in 2006) were used in dilution series
to estimate the viral inoculum concentration in the soil sample. Pots (7x7x6.2 cm; 0.21 l)
were filled with soils diluted with pasteurised sand (1/10; 1/100; 1/1000, dried soils mixed in
an inflated plastic bag, and nutrients were added (slow release Osmocote; NPK 16-8-11 +
trace elements). Plants were grown in pots in the same way as in the test for the presence of
rhizomania. After 6 wk individual pots were sampled.
When pots were sampled, leaves were removed and the roots rinsed with tap water to
remove soil particles. All roots of individual plants were pressed (hand press NIFA
Instruments) and 1:10 diluted with extraction buffer (LOEWE Biochemica GmbH) as
described by Tuitert (1990).
Presence of Beet necrotic yellow vein virus (BNYVV) in roots was detected with double
antibody sandwich ELISA exactly following the manufacturer’s instructions (LOEWE
Biochemica GmbH). After adding of a substrate (4-Nitrophenylphosphate Na2-salt), the
extinction was measured at 405 nm after 1 h and 2 h at room temperature. Absorption values
(OD) above 0.050 OD were considered as positive for rhizomania. Root sap of highly and
non-infected sugar beet plants served as controls. The most probable number (MPN) was
calculated with the statistical package GenStat (Payne et al., 2009) following Tuitert (1990).
3.3.4 Bioassay of soil suppression against Rhizoctonia solani Kühn
One percent (w/w) of a 21-days-old oat meal culture (OMC) of R. solani AG 2-2IIIB, IRS code
02-337, prepared according the method described by Bakker et al. (2005), was mixed with
the soil samples to be tested for infestation in an inflated plastic bag (clay soils rolled to fine
particles). Twelve PVC tubes (diam. 2 cm, height 15 cm) were filled with 75 g of the soil to be

3. Pests and diseases contribute to sugar beet yield difference
55
tested. Non- and naturally R. solani-infested soil samples and non-infested soil from each
sample served as controls. In each tube one seed (pelleted with hymexazol, 14.7 g active
ingredient and thiram, 4 g active ingredient per 100,000 seeds to control infection by seed
and soil borne fungi) of variety Aligator (SES Europe N.V./S.A.) was sown. Seed emergence
and R. solani-diseased plants were scored 2 and 4 wk after sowing on a scale 0 = healthy to
3 = dead. A disease-suppressive soil was defined as a soil in which disease-development
was suppressed after four weeks of growing sugar beet in an artificial infested soil. Plants
were grown in a climate room at 23 oC for 16 h in light (20,000 lux) and 16 oC for 8 h in dark.
Soil was kept moist during the bioassay.
3.3.5 Bioassay for determination field infestation by Aphanomyces cochlioides
Field soil was used to fill 10 pots (7x7x6.5 cm; 0.19 l) on each pot 4 seeds (pelleted without
hymexazol (active against Aphanomyces spp.) and with thiram, 4 g active ingredient per
100,000 seeds; for protection against Pythium spp. and seed borne fungi) of variety Aligator
(SES Europe N.V./S.A.) were sown and emerged in the pots. Plants were grown in a climate
room at 23 oC for 16 h in light (20,000 lux) and 16 oC for 8 h in the dark. The soil was kept
humid to stimulate infection by A. cochlioides. Diseased plants were counted each week and
the percentage of seedlings infected by A. cochlioides was calculated. Plants were scored
under the microscope for infection. After 5 wk the experiment was terminated.
3.3.6 Quantification of nematodes
3.3.6.1 Free-living nematodes
After homogenizing the soil, sub-samples of 100 ml and 1000 ml soil were taken for
extraction of free-living nematodes. Nematodes were extracted from the soil according to
(Oostenbrink, 1960) and placed on a cotton wool filter with the organic fraction at room
temperature for 1 (the 1000 ml sub-sample) and 3 d (100 ml sub-sample) at room

Improvement of the competitiveness of the sugar beet crop in the Netherlands
56
temperature. The 1000 ml sub-sample was investigated for the presence of Ditylenchus spp.
From the 100 ml sub-sample nematodes were identified following Bongers (1994) and
counted in duplicate under a microscope, using 2× 10 ml aliquot portions. The cotton wool
filters were stored for another 11 d at room temperature and investigated again for
nematodes, examining 2× 10 ml aliquot portions (Bezooijen, 2006).
3.3.6.2 Beet cyst nematodes
For the extraction of Heterodera schachtii Schmidt and Heterodera betae Wouts,
Rumpenhorst & Sturhan soil samples were dried (14 h at 40 oC). Samples were ground,
homogenised and 2 subsamples of 100 ml were taken, sieved wetted and centrifuged with
kaolin powder for 5 min. at 1,800 g. The supernatant was poured onto a cotton filter.
Subsequently a saturated MgSO4-solution was added to the subsamples, it was
homogenised and the suspension was centrifuged again for 3 min. at 1800 g. The
supernatant was poured again on the cotton filter; cysts were collected on the filter and were
counted under a binocular microscope at 12.5× magnification and subsequently crushed
(Bühler crusher) in 10 ml water. Eggs and larvae in 1 ml water (if <1000 eggs and larvae) or
0.1 ml (if >1000 eggs and larvae) were counted in duplicate under a microscope (Bezooijen,
2006). All samples from one field were averaged to the infestation level for the whole field
expressed in eggs and larvae per 100 ml soil (e+l/100 ml soil).
3.3.7 Scoring of foliar symptoms
Scoring of fungal leaf symptoms was carried out at least three times during the season at 3-
4-wk-intervals or directly after fungicide application, starting at the end of July. For each field,
100 randomly selected plants were assessed for fungal leaf infestations of Cercospora
beticola Sacc., Ramularia beticola Faut. & Lamb., Erysiphe betae (Vañha) Weltz. and
Uromyces beticola (Bell.) Boerema, Loer. & Hamers. All four fungi were assessed on the
same plant. Scoring started directly after the first fungicide application of the farmer, at the

3. Pests and diseases contribute to sugar beet yield difference
57
same date the field of the other farmer in the pair was scored, irrespective of fungicide
application. The last scoring occurred within 7-14 d before harvest. Per field the maximum
severity was taken in the analysis.
For the disease assessment of C. beticola the Agronomica whole plant diagram or field key
from Italy was used with a 0-5 scale (Battilani et al., 1990; Vereijssen et al., 2003). The same
assessment scale was also used for the assessment of R. beticola and U. beticola.
The disease assessment, for E. betae were on a 0-2.5 scale using an adapted Agronomica
whole plant diagram.
Other foliar disease symptoms including Pseudomonas, Phoma betae Fr. and Verticillium
spp. were estimated whole field in classes 1 (few) to 3 (many). Verticillium dahliae Kleb. was
found the causal agent of the severe yellowing necrotising leaves called ‘yellow necrosis’ in
the Netherlands (Schneider, 2010; Schneider et al., 2010).
3.3.8 Determination of sugar yield
Sugar content multiplied with the net sugar beet yield results in the sugar yield in Mg per
hectare. Since harvest losses occur during the mechanical harvest of sugar beet, sugar yield
based on factory delivered sugar beet do not represent the total grown sugar yield (Hanse
and Tijink, 2010). Therefore, sugar yield was combined with the total harvest losses to obtain
the total sugar yield. Losses are due to the breakage of taproots, losses of whole beets and
losses due over topping. The harvest losses were measured using the protocol for harvest
losses (Brinkmann, 1982), adapted to 400 sugar beets.
3.3.9 Statistical analysis
If variables were not normally distributed they were transformed using:

Improvement of the competitiveness of the sugar beet crop in the Netherlands
58
1) )1ln(xy : Trichodoridae, Pratylenchus, Meloidogyne, E. betae, R. beticola and
difenoconazole on both soil types, H. schachtii, BNYVV, U. beticola cyproconazole and
trifloxystrobin on clay soil, H. betae and C. beticola on sandy soils.
2) )100
arcsin(x
y : A. cochlioides and other foliar symptoms;
3) Box-Cox transformation with λ = 2.5: Rhizoctonia index on sandy soils;
4) no transformation: sugar yield, Rhizoctonia index on clay soil, C. beticola on clay soil, U.
beticola on sandy soils, cyproconazole and trifloxystrobin on sandy soils, pH, number of
fungicide applications and date of first application, epoxiconazole, fenpropimorph, previous
sugar beet crop, sowing and harvest date on both soil types.
Differences between top and average growers were analysed by a Mixed Models approach.
Grower type was a fixed effect and pair number and year random effects.
The effect of pathogens was estimated using multiple regression. General Linear Regression
was used and variables were added to the model stepwise. A variable was only left in the
model if the model had improved significantly and the effect of the variable on the dependent
variable was significant. All statistical analyses were done separately for both soil types, as a
result of initial statistical analysis. For the statistical analysis the GenStat package (12th
edition) was used (Payne et al., 2009).
3.4 Results
The pairs of top and average growers differed on average by 2.3 and 2.4 Mg ha-1 in average
sugar yield (2000-2004) for clay and sandy soils, respectively (Table 3.1). During 2006-2007,
the top growers had significant higher sugar yields on both clay and sandy soils (2.6 and 2.3
Mg ha-1, respectively) than average growers.

3. Pests and diseases contribute to sugar beet yield difference
59
Table 3.1. The average sugar yield for four years (2000-2004) applied for selection of top and average growers compared to the sugar yield realised during the SUSY-project (2006-2007) on clay versus sandy soils.
Clay Sand
2000-2004 2006-2007a
2000-2004 2006-2007a
Average (Mg ha-1
) 10.0 11.3 8.8 10.5
Top (Mg ha-1
) 12.3 13.9 11.2 12.8
LSD 5% 0.41 0.95 0.55 0.77
F-probability <0.001 <0.001 <0.001 <0.001
a. Sugar yield delivered to the sugar factory, without harvest losses.
The top growers used a cruciferous catch crop more often [oil radish (Raphanus sativus L.
subsp. oleiformis Pers.) or white mustard (Sinapsis alba L.) sown between seasons of
regular planting] compared to the average growers (Table 3.2). Catch crops were used more
often on clay soils, although a large proportion of the growers (53% on clay and 68% on
sandy soils) did not sow any catch crop.
Only two growers on clay soil sowed a partially nematode-resistant sugar beet variety while
one top grower sowed a sugar beet variety without specific resistance in 2006. On sandy
soils all varieties sown were partially rhizomania-resistant, and both top and average grower
of four pairs used varieties partially resistant to R. solani.
On all fields C. beticola was present with an infestation level of 1.37 (on a 0-5 scale; Table
3.3). At least one of the other foliar symptoms (Pseudomonas, P. betae and Verticillium spp.
combined) was also found on all fields. U. beticola and E. betae were present on 86% and
81% of the fields with a mean infestation level of 0.32 and 0.30, respectively (both on 0-5
scales; Table 3.3). R. beticola was found in 54% of the fields. For all leaf-infecting diseases
there were almost no differences in incidence between sandy and clay soils. H. schachtii and
Rhizomania (BNYVV) were mainly found on clay soils, while H. betae, Trichodoridae and A.
cochlioides were mainly found on sandy soils. BNYVV was detected in only 10% of the
sandy soils fields but the infestation level was too low for quantification. Pratylenchus spp.
were abundant on both soil types and present in 93% of the fields investigated. Meloidogyne
spp. were present in 57% of the fields with varying levels of infestation. No infestation with
Ditylenchus spp. or damage by insects was found in the fields investigated.
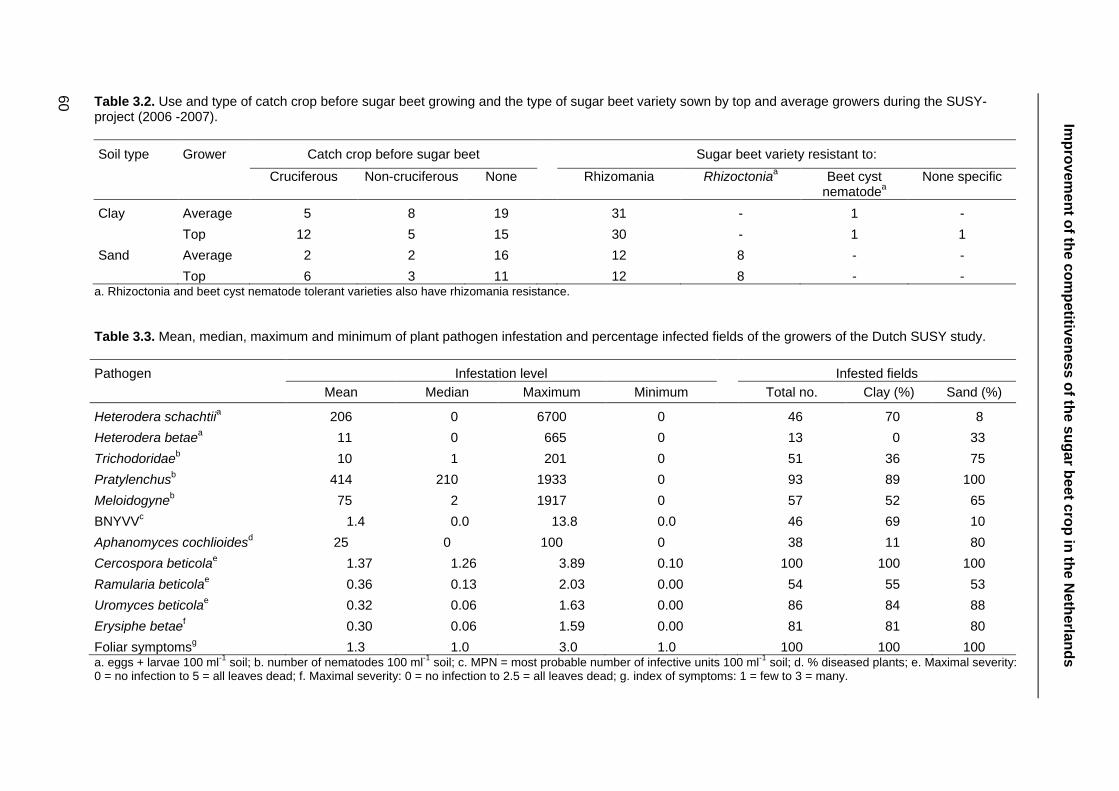
Table 3.2. Use and type of catch crop before sugar beet growing and the type of sugar beet variety sown by top and average growers during the SUSY-project (2006 -2007).
Soil type Grower Catch crop before sugar beet Sugar beet variety resistant to:
Cruciferous Non-cruciferous None Rhizomania Rhizoctoniaa
Beet cyst nematode
a None specific
Clay Average 5 8 19 31 - 1 -
Top 12 5 15 30 - 1 1
Sand Average 2 2 16 12 8 - -
Top 6 3 11 12 8 - - a. Rhizoctonia and beet cyst nematode tolerant varieties also have rhizomania resistance.
Table 3.3. Mean, median, maximum and minimum of plant pathogen infestation and percentage infected fields of the growers of the Dutch SUSY study.
Pathogen Infestation level Infested fields
Mean Median Maximum Minimum Total no. Clay (%) Sand (%)
Heterodera schachtiia 206 0 6700 0 46 70 8
Heterodera betaea 11 0 665 0 13 0 33
Trichodoridaeb 10 1 201 0 51 36 75
Pratylenchusb 414 210 1933 0 93 89 100
Meloidogyneb
75 2 1917 0 57 52 65
BNYVVc
1.4 0.0 13.8 0.0 46 69 10
Aphanomyces cochlioidesd
25 0 100 0 38 11 80
Cercospora beticolae
1.37 1.26 3.89 0.10 100 100 100
Ramularia beticolae
0.36 0.13 2.03 0.00 54 55 53
Uromyces beticolae
0.32 0.06 1.63 0.00 86 84 88
Erysiphe betaef
0.30 0.06 1.59 0.00 81 81 80
Foliar symptomsg
1.3 1.0 3.0 1.0 100 100 100 a. eggs + larvae 100 ml
-1 soil; b. number of nematodes 100 ml
-1 soil; c. MPN = most probable number of infective units 100 ml
-1 soil; d. % diseased plants; e. Maximal severity:
0 = no infection to 5 = all leaves dead; f. Maximal severity: 0 = no infection to 2.5 = all leaves dead; g. index of symptoms: 1 = few to 3 = many.
60
Imp
rovem
en
t of th
e c
om
petitiv
en
ess
of th
e s
ug
ar b
eet c
rop
in th
e N
eth
erla
nd
s

3. Pests and diseases contribute to sugar beet yield difference
61
Natural infestation in the bio-assay of R. solani was found in 1.6% and 15% of clay and
sandy soils, respectively. Soil of all fields proved conducive to R. solani infection, however
with a large variation in degree of suppressiveness (Table 3.4). A high degree of
suppressiveness (low disease index, max = 1) was found in 17% of the samples, although it
could not protect all seedlings from R. solani infection. The level of soil suppressiveness in
clay soils was higher than in sandy soils (P = 0.017).
On clay soils, the top growers produced higher yields compared to average growers (Table
3.5). Top growers had significantly lower infestation levels of H. schachtii (P = 0.008),
BNYVV (P = 0.016) and other foliar symptoms (Pseudomonas, P. betae and Verticillium spp.
combined; P <0.001) by factors of 4.4x, 2.7x and 1.5x, than the average growers,
respectively. For the other pathogens, the infestation levels did not differ significantly
between grower types. The top growers sowed sugar beet 5 days earlier (P = 0.035) and had
1.4x more fungicide applications (P = 0.003) and thus used also 1.4x more epoxiconazole (P
= 0.033) and 1.5x more fenpropimorph (P = 0.025) fungicide applications.
On sandy soils the top growers had a higher yield compared to the average (Table 3.5).
Infestation levels of Meloidogyne spp. (P = 0.016), C. beticola (P = 0.005) and E. betae (P =
0.027) were significantly lower (5x, 1.4x and 1.8x, respectively) for the top growers. No
significant differences in infestation levels were observed for the other pathogens. The top
sowed 6 days earlier (P = 0.008) and made 1.7x more fungicide applications (P<0.001) and
used 1.7x more epoxiconazole and fenpropimorph (P = 0.022) than the average growers.
The first fungicide application by top growers was 10 days (P = 0.035) earlier compared than
average growers.

Improvement of the competitiveness of the sugar beet crop in the Netherlands
62
Table 3.4. Bioassay results of soil suppression against Rhizoctonia solani and natural infestation of R. solani in soils of sugar beet production fields in the SUSY-project (2006-2007).
Soil type Infestation Meana
Mediana
Maximuma
Minimuma
Infested fields (%)
Clay Natural 0.00 0.00 0.25 0.00 1.56
Artificial 1.52 1.52 2.73 0.17 -
Sand Natural 0.04 0.00 0.50 0.00 15.0
Artificial 2.28 2.43 3.00 0.42 -
a. index: 0 = healthy to 3 = dead. Positive controls showed no suppression and a disease index 2.0 and 2.1 in 2006 and 2007, respectively.
On sandy soils, the best multiple regression model revealed significant influences of H.
betae, fungicide applications, A. cochlioides infestation and sowing date on sugar yield
(Table 3.6). This model explained 71% of the variance in sugar yield on sandy soils.
Additional parameters did not change the model significantly. By selecting the H. betae
infestation as the first model term, the explained variance of sugar yield remained 71% and
the significance of the individual model terms did not change. When sowing date was left out
of the model the explained variance dropped to 68%.
On clay soils, multiple regression explained 35% of the sugar yield variance (Table 3.6). The
model showed the significant influence of BNYVV, H. schachtii and sowing date on sugar
yield. Further addition of variables to the model caused no significant changes of the model.
The coefficient of determination was 0.22 when sowing date was omitted from the model. On
clay soil, a variety without resistance to rhizomania was grown on one field (Table 3.2). To
estimate the effect of the data from this field (MPN 100 ml-1 soil = 1.03; sugar content at
harvest 14.4%), all data from this field was left out of a next multiple regression model.
However, the result of multiple regression did not change (Table 3.6).

Table 3.5. Probability of difference between and (back) transformed means of sugar yield and sugar beet pathogen infestation levels in fields of top and average growers of the Dutch SUSY study on sand and clay soils.
Variable Sand Clay
Average Top F-probability Average Top F-probability
Sugar yield (Mg ha-1
)a
11.0 13.2 <0.001 12.0 14.4 <0.001
Heterodera schachtii (eggs + larvae 100 ml-1
soil) - - - 70 16 0.008
Heterodera betae (eggs + larvae 100 ml-1
soil) 3 1 0.167 - - -
Trichodoridae (# 100 ml-1
soil) 4 3 0.357 1 2 0.080
Pratylenchus (# 100 ml-1
soil) 438 472 0.862 72 55 0.447
Meloidogyne (# 100 ml-1
soil) 10 2 0.016 5 5 0.935
BNYVV (MPN 100 ml-1
soil)
- - - 0.72 0.27 0.016
Aphanomyces cochlioides (% diseased plants) 71 53 0.220 - - -
Rhizoctonia index (index 0-3) 2.40 2.37 0.821 1.59 1.46 0.376
Cercospora beticola (Max. severity 0-5) 1.81 1.29 0.005 1.29 1.15 0.257
Ramularia beticola (Max. severity 0-5) 0.27 0.23 0.503 0.31 0.34 0.540
Uromyces beticola (Max. severity 0-5) 0.42 0.26 0.166 0.32 0.18 0.072
Erysiphe betae (Max. severity 0-2.5) 0.32 0.13 0.027 0.34 0.20 0.079
Foliar symptoms (1-3) 1.1 1.0 0.573 1.6 1.1 <0.001
Sowing date 11-4 5-4 0.008 4-4 30-3 0.035
Harvest date 31-10 3-11 0.301 21-10 24-10 0.419
Previous sugar beet crop (years ago) 4.7 5.0 0.683 4.9 5.4 0.220
Fungicide applications (#) 1.1 1.9 <0.001 1.2 1.7 0.003
First fungicide application (date) 17-8 7-8 0.035 14-8 8-8 0.134
cyproconazole (g ha-1
) 5 5 0.972 0.5 0.5 0.931
difenoconazole (g ha-1
) 2 3 0.411 0.8 2 0.226
epoxiconazole (g ha-1
) 62 104 0.022 74 105 0.033
fenpropimorph (g ha-1
) 186 308 0.022 213 311 0.025
trifloxystrobin (g ha-1
) 12 12 0.972 0.6 0.6 0.942
pH KCl 5.3 5.1 0.291 7.3 7.3 0.522
a. Sugar yield corrected for harvest losses.
.
63
3. P
ests
an
d d
isea
ses
co
ntrib
ute
to s
ug
ar b
eet y
ield
diffe
ren
ce

Table 3.6. Multiple regression equations and parameter estimates of sugar yield to pest and disease variables on sand and clay soils in Dutch sugar beet production. Data SUSY-project 2006-2007.
Soil type Regression equationa Model C
m n p
q
Sugar yield = P R2 Mean SE P
b Mean SE P
b Mean SE P
b Mean SE P
b Mean SE P
b
Clay
C - m(H. schachtii) - n(BNYVV) - p(Sowing date)
<0.001 0.35 21.57 2.11 *** 0.29 0.08 *** 1.25 0.33 *** 0.07 0.02 ***
C - m(H. schachtii) - n(BNYVV)
<0.001 0.22 14.43 0.41 *** 0.24 0.09 ** 1.02 0.35 **
Clayc
C - m(H. schachtii) - n(BNYVV) - p(Sowing date)
<0.001 0.35 21.54 2.15 *** 0.29 0.08 *** 1.25 0.33 *** 0.07 0.02 ***
C - m(H. schachtii) - n(BNYVV)
<0.001 0.23 14.44 0.41 *** 0.25 0.09 ** 1.03 0.35 **
Sand
C + m(Fungicide applications) - n(H. betae) - p(A. cochlioides) - q(Sowing date)
<0.001 0.71 15.97 2.15 *** 1.20 0.28 *** 0.41 0.12 ** 1.01 0.38 * 0.04 0.02 *
C - m(H. betae) + n(Fungicide applications) - p(A. cochlioides) - q(Sowing date)
<0.001 0.71 15.97 2.15 *** 0.41 0.12 ** 1.20 0.28 *** 1.01 0.38 * 0.04 0.02 *
C + m(Fungicide applications) - n(H. betae) - p(A. cochlioides)
<0.001 0.68 11.56 0.67 *** 1.38 0.28 *** 0.34 0.12 ** 1.26 0.38 **
a. Data of variables H. schachtii, H. betae and BNYVV (ln x + 1)-transformed, A. cochlioides arcsin- transformed and sowing date non-transformed. b. Significance: *** = p ≤ 0.001; ** = p ≤ 0.01; * = p≤ 0.05. c. Data of the only field no rhizomania-resistant variety was sown, left out of analysis.
64
Imp
rovem
en
t of th
e c
om
petitiv
en
ess
of th
e s
ug
ar b
eet c
rop
in th
e N
eth
erla
nd
s

3. Pests and diseases contribute to sugar beet yield difference
65
3.5 Discussion
The higher yield of the top growers is inherent to the selection criterion of at least 1.5 Mg
sugar ha-1 difference in average sugar yield (2000-2004) between the top and average
grower within a pair. This high-yielding effect of top growers clearly continued in both years
that the SUSY-project was conducted. The top growers had higher yields under similar
production circumstances (soil, climate and region) and the same levels of total inputs
expressed monetarily (Hanse et al., 2010). We supply evidence that part of the yield
difference between the two types of growers can be attributed to pests and diseases.
Relatively more fields on sandy soils were naturally infested with R. solani than on clay soils
where the level of soil suppressiveness was higher (P = 0.017). On both soil types soil
suppressiveness against R. solani was found independent of grower type. The occurrence
and extent of soil suppressiveness against R. solani in sugar beet fields was measured in
this project. The occurrence of soil suppressiveness (17% of the field samples),
demonstrated its existence in sugar beet fields. However, further research is needed to
determine its usefulness as a tool for control of R. solani in the field. To date control of R.
solani depends mainly on agronomical measures and the use of partially resistant varieties
(Buttner et al., 2002). This also explains why both top and average growers used partially
resistant varieties in the regions were R. solani crown and root rot occurs.
Insect pests were not observed at levels damaging to sugar beet in the fields studied. This
can be ascribed to the insecticide treatment of the seeds in those areas where insect pests
can cause yield losses (Heijbroek and Huijbregts, 1995b). When the insecticides in seed
pellets are no longer available, severe yield losses by the Pygmy beetle (Atomaria linearis
Steph.) (Kuethe, 1998) or Beet yellows virus and Beet mild yellowing virus, both mainly
transmitted by Myzus persicae Sulz., can occur (Stevens et al., 2004).
Although a large proportion of the growers did not use a catch crop before growing sugar
beet, the top growers used a cruciferous catch crop more often. These catch crops can be
used as an agronomical measure to decrease the population densities of H. schachtii (Niere,

Improvement of the competitiveness of the sugar beet crop in the Netherlands
66
2009) and H. betae (Raaijmakers, 2009) if resistant varieties are used. The benefits in
economical terms can vary from small to substantial, depending on initial infestation levels.
The costs compared to the total variable costs in sugar beet production are negligible. On
clay soils H. schachtii infestation levels in the top growers’ fields were significantly lower.
Long-term use of cruciferous catch crops could explain this. On both soil types multiple
regression showed a significant negative influence of beet cyst nematode infestation level on
sugar yield. Reducing the infestation level of beet cyst nematodes in general (by e.g. growing
resistant catch crops) and growing varieties partially resistant to beet cyst nematode is a
possibility for raising sugar yields on both soil types.
On clay soils BNYVV inoculum concentrations were lower for the top growers. Except for one
field in 2006, rhizomania-resistant varieties were grown on all clay soil fields. Plants of
partially rhizomania-resistant varieties can still be infected by BNYVV (Scholten et al., 1994;
Heijbroek et al., 1999), which might lead to an increase of inoculum potential in the soil.
Although the BNYVV infestation levels found in this study were low, they were found to be
negatively correlated with sugar yield in the multiple regression on clay soils. The multiple
regression model did not change when the data from the field without a rhizomania-resistant
variety was left out of the analysis. The finding of a negative influence of BNYVV infestation
on clay soil sugar yield, even when resistant varieties were grown, causes concern. It may be
supposed that the continuous growing of partially resistant varieties has selected for
resistance breaking strains (Liu et al., 2005) and requires further investigation. On sandy
soils the rhizomania infestation level had no influence on sugar yield, since on only 10% of
the fields BNYVV was detected, but the infestation level was too low for quantification. The
BNYVV vector (Polymyxa betae Keskin) is favoured by warm and humid conditions. Sand
warms faster than clay but also dries out much faster. This would prevent infection by
zoospores and explains the low MPN values detected.
The multiple regression explained up to 35% of the variation in sugar yield on clay soils, with
H. schachtii and BNYVV as the most important pathogens.

3. Pests and diseases contribute to sugar beet yield difference
67
In addition to the already mentioned negative effect of H. betae, the number of fungicide
applications increased, and the infestation with A. cochlioides and sowing date decreased,
sugar yield on sandy soils. The top growers had significantly more fungicide applications and
were more effective controlling C. beticola and E. betae. This explains the significant effect of
the number of fungicide applications on sugar yield. In the Netherlands a system of
supervised control was developed to assure sugar yield and prevent unnecessary or untimed
fungicide applications (Vereijssen et al., 2007). Since the top growers sprayed 10 days
earlier, it seems that they pick up this extension message earlier.
The infestation levels of A. cochlioides obtained from the climate room test showed a
negative relation with sugar yield, while in the field no severe A. cochlioides symptoms were
observed. Earlier research showed that the fungicides on the seed pellet were sufficient to
control A. cochlioides damage to seedlings on conducive soils, but in severely infested trial
fields plant losses occurred later in the season (Heijbroek and Huijbregts, 1995a). More
research is needed on A. cochlioides on sandy soils to clarify the relation between the
measurements in the climate room and the reduced yield, which occurs without hardly any
symptoms in the field.
In total the multiple regression explained 71% of the variance in sugar yield on sandy soils
and 68% when the sowing date was left out.
On both soil types early sowing is profitable for sugar yield. The earlier sowed sugar beet
fields had higher yields, which may be due to an increased interception of the yearly
available radiation due to earlier canopy closing (Werker and Jaggard, 1998; Kenter et al.,
2006), but also to a partial escape from BNYVV and H. schachtii damage (Webb et al., 2000;
Stevens et al., 2006) on clay soils. On sandy soils, the effect of early sowing might be
explained by the optimised radiation uptake. An other explanation could be the development
of resistance by the seedlings, before A. cochlioides and R. solani activity is enhanced by the
warming of the soil (Asher and Hanson, 2006).
Reducing the impact of pathogens is important for speeding up sugar yields. The variance in
sugar yield explained by pests and diseases is lower on clay soils than on sandy soils. On

Improvement of the competitiveness of the sugar beet crop in the Netherlands
68
both soil types, but especially on clay soils also the soil structure is important for sugar yield
formation. On both soil types, other agronomy factors such as sowing performance and
harvest losses, influence sugar yield, in addition to the continuous reduction of yield by pests
and diseases.
The achieved yields, including crop protection measures, of top and average growers on
sandy and soils were 57.4 and 47.8% and on clay soils 62.6 and 52.2% respectively, of the
attainable sugar yield in the Netherlands, being 23 t ha-1 (De Wit, 1953). The yield loss due to
pests and diseases can be estimated from the explained variance in sugar yield on sandy
and clay soils (71 and 35%; Table 3.6). Thus, in spite of the crop protection measures
already taken, yield losses to pests and diseases for top growers are still 30.2 and 13.1%
and for average growers 37.1 and 16.7% on sandy and clay soils respectively. The average
yield losses (24%) due to pest and diseases in sugar beets when crop protection measures
are conducted, found in this study are quite similar to the estimated 26% yield losses world
wide (Oerke and Dehne, 2004). However, a huge difference exists between soil types and
grower types. Optimizing crop protection can increase sugar yield (3.6% on clay and 6.9% on
sandy soils) in the Netherlands, when the average growers improve towards the level of the
top growers. Even the top growers can improve their efforts in crop protection (e.g. growing a
beet cyst nematode partial resistant variety, which is also omitted by most top growers with
high nematode infestation), their figures (30.2 and 13.1%) are still very high. From other
studies on increasing yield and comparing farmers in sugar beet in Sweden (Berglund et al.,
2002) and starch potato in the Netherlands (Wustman, 2003) it was stressed that pests and
diseases were important. However, a clear figure of yield loss compared to attainable yield
could not be deduced, except for sugar beet in Sweden where 1%-point of fungal attack was
reported to lower sugar yield by 0.4 Mg per hectare. Other studies mainly focused on the
inputs made by the growers to use those in estimating the cost (Starcke and Bahrs, 2009) or
efficiency of production (Fuchs and Stockfisch, 2009), and did not determine field variables.
By comparing similar farms with an equal starting point in time on soils freshly reclaimed
3. Pests and diseases contribute to sugar beet yield difference
69
from the sea (so without soil borne plant pathogens), agronomical variables were measured
in addition the inputs, but no data on pests and diseases were collected (Zachariasse, 1974).
Clearly there is an influence of the grower on the infestation levels of pests and diseases in
sugar beet production, which contributes to the difference in sugar yield between the top and
average growers in the SUSY-project. The skills and knowledge of the growers, or grower
performance is crucial to achieve high yields. Recently in animal science the importance of
attitude was stressed (Jansen et al., 2009). This effect was also noticed in the SUSY-project,
where some of the average growers were able to increase yield during the project, mainly
due to a change in attitude towards sugar beet production (Hanse et al., 2010). The
pathogen infestation levels in the fields of those growers could not explain their lower yields
in the past and several of them started fungicide applications when they joined the project.
The possibility of raising yields suddenly by a change in attitude is an intriguing point of
agricultural production. It raises the question whether the average sugar beet growers are
average performing for all the crops on their farms or excellent growers of e.g. potatoes. This
calls for a total farm approach in stead of a single crop approach like the SUSY-project. This
project yielded much information on yield reducing factors of sugar beet production,
suggesting that it is worthwhile to conduct pair-wise comparisons of growers with
measurements in the fields for other crops as well. To provide sufficient food for the expected
9 billion people in 2050, crop yields have to be raised. Grower performance is worth attention
because getting average (or even below-average) growers to the level of top growers will
have a ‘large and inexpensive effect on productivity’ (Jaggard et al., 2010). Supporting
evidence is clearly shown in this publication. Higher yields, with the same costs, also
increase the profitability for the grower (Hanse et al., 2010).
The communication of knowledge to growers about how and when to conduct the right crop
protection measures remains vital in raising yields and safeguarding food, feed and bio-
energy production.
Improvement of the competitiveness of the sugar beet crop in the Netherlands
70
3.6 References
Asher, M.J.C., Hanson, L.E., 2006. Fungal and Bacterial Diseases. In: Draycott, A.P., (Ed.)
Sugar Beet, Blackwell Publishing, Oxford, pp. 286-315.
Bakker, Y., Van Loon, F.M.J., Schneider, J.H.M., 2005. Soil suppressiveness to Rhizoctonia
solani and microbial diversity. Comm. Agr. Appl. Biol. Sci. 70, 29-33.
Battilani, P., Beltrami, G., Meriggi, P., Ponti, I., Rossi, V., Rosso, F., Tugnoli, V.,
Zocca, A., 1990. Nuovi indrizzi di difesa anticercosporica. L'Informatore Agrario. 46,
53-70.
Berglund, K., Blomquist, J., Christensson, B., Gerhardson, B., Hellgren, O., Larsson, H.,
Rydberg, T., Wildt-Persson, T., 2002. 4T - The Ten Ton Target. SBU, Borgeby, pp. 16
Bezooijen, J., van, 2006. Methods and techniques for nematology. Department of
Nematology, Wageningen University, Wageningen.
Bongers, T., 1994. De nematoden van Nederland. Koninklijke Nederlandse Natuurhistorische
Vereniging, Utrecht, p. 408.
Brinkmann, W., 1982. Methode und zusammenfassende Ergebnisse der Untersuchungen
zur Arbeitsqualität von Zuckerrüben-Erntemaschinen. Die Zuckerrübe. 31, 223-228
and 258-259.
Buttner, G., Ithurrart, M.E.F., Buddemeyer, J., 2002. Root and crown rot Rhizoctonia solani -
distribution, economic importance and concepts of integrated control. Zuckerindustrie.
127, 856-866.
Cook, R.J., 2000. Advances in plant health management in the twentieth century. Annu. Rev.
Phytopathol. 38, 95-116.
De Wit, C.T., 1953. A physical theory on placement of fertilizers. Dissertation. Verslagen
Landbouwkundige Onderzoekingen (59-4), Dissertation, Landbouwhogeschool
Wageningen.
FAO, 2002. World agriculture: towards 2015/2030 - Summary report. FAO, Rome.

3. Pests and diseases contribute to sugar beet yield difference
71
FAO, 2009. Global agriculture towards 2050. http://www.fao.org/fileadmin/templates/wsfs/-
docs/Issues_papers/HLEF2050_Global_Agriculture.pdf.
Fuchs, J., Stockfisch, N., 2009. Development of efficiency in sugarbeet cultivation as
illustrated by N-fertilizer application. Zuckerindustrie. 134, 33-41.
Godfray, H.C.J., Beddington, J.R., Crute, I.R., Haddad, L., Lawrence, D., Muir, J.F., Pretty,
J., Robinson, S., Thomas, S.M., Toulmin, C., 2010. Food Security: The Challenge of
Feeding 9 Billion People. Science. 327, 812-818.
Hanse, A.C., Tijink, F.G.J., 2010. Harvesting losses ... How to yield this hidden financial
potential. In: Proceedings of the 72nd IIRB Congress, 22-24 June 2010, Copenhagen,
DK.
Hanse, B., Tijink, F.G.J., Mußhoff, O., Märländer, B., 2010. Comparison of costs and yields
of 'type top' and 'type average' growers in Dutch sugar beet growing. Zuckerindustrie.
135, 550-560.
Heijbroek, W., Huijbregts, A.W.M., 1995a. Fungicides and Insecticides Applied to Pelleted
Sugar-Beet Seeds .2. Control of Pathogenic Fungi in Soil. Crop Prot. 14, 363-366.
Heijbroek, W., Huijbregts, A.W.M., 1995b. Fungicides and Insecticides Applied to Pelleted
Sugar-Beet Seeds .3. Control of Insects in Soil. Crop Prot. 14, 367-373.
Heijbroek, W., Musters, P.M.S., Schoone, A.H.L., 1999. Variation in pathogenicity and
multiplication of beet necrotic yellow vein virus (BNYVV) in relation to the resistance
of sugar-beet cultivars. Eur. J. Plant Pathol. 105, 397-405.
Jaggard, K.W., Qi, A.M., Ober, E.S., 2010. Possible changes to arable crop yields by 2050.
Philos. Trans. R. Soc. B-Biol. Sci. 365, 2835-2851.
Jansen, J., van den Borne, B.H.P., Renes, R.J., van Schaik, G., Lam, T., Leeuwis, C., 2009.
Explaining mastitis incidence in Dutch dairy farming: The influence of farmers'
attitudes and behaviour. Prev. Vet. Med. 92, 210-223.
Kenter, C., Hoffmann, C.M., Märländer, B., 2006. Effects of weather variables on sugar beet
yield development (Beta vulgaris L.). Eur. J. Agron. 24, 62-69.
Improvement of the competitiveness of the sugar beet crop in the Netherlands
72
Kuethe, K., 1998. Further experience with the effects of pygmy mangold beetle (Atomaria
linearis Steph.) infestation on emergence and yield of sugar beet. Mitt. a.d. Biol.
Bundesanst. H. 357.
Liu, H.Y., Sears, J.L., Lewellen, R.T., 2005. Occurrence of resistance-breaking Beet necrotic
yellow vein virus of sugar beet. Plant Dis. 89, 464-468.
Lobell, D.B., Cassman, K.G., Field, C.B., 2009. Crop Yield Gaps: Their Importance,
Magnitudes, and Causes. Annu. Rev. Environ. Resour. 34, 179-204.
Niere, B., 2009. Principles of beet cyst nematode management. Zuckerindustrie. 134, 186-
192.
Oerke, E.C., Dehne, H.W., 2004. Safeguarding production - losses in major crops and the
role of crop protection. Crop Prot. 23, 275-285.
Oostenbrink, M., 1960. Estimating nematode populations by some selected methods. In:
Sasser, J.N., Jenkins, W.R., (Eds.), Nematology, The University of North Carolina
Press, Chapel Hill, pp. 85-102.
Payne, R.W., Murray, D.A., Harding, S.A., Baird, D.B., Soutar, D.M., 2009. GenStat for
Windows (12th Edition) Introduction. VSN International, Hemel Hempstead.
Raaijmakers, E.E.M., 2009. Waardplantrelaties geel bietencysteaaltje voor groenbemesters.
IRS, Bergen op Zoom, p. 23.
Schneider, J.H.M., 2010. Karakterisering van verticilliumisolaten uit suikerbieten. In:
Jaarverslag 2009, IRS, Bergen op Zoom, pp. 53-55.
Schneider, J.H.M., Van Oorschot, P.M.S., Schoone, A.H.L., 2010. Verticillium, the causal
agent of 'yellow necrosis' of sugar beet in the Netherlands. IIRB, Copenhagen, DK.
Scholten, O.E., Paul, H., Peters, D., Vanlent, J.W.M., Goldbach, R.W., 1994. In-Situ
Localization of Beet Necrotic Yellow Vein Virus (Bnyvv) in Rootlets of Susceptible and
Resistant Beet Plants. Arch. Virol. 136, 349-361.
Starcke, J.U., Bahrs, E., 2009. Returns and costs in sugar beet production and crop
enterprise before and after recent CAP reforms. Zuckerindustrie. 134, 101-108.
3. Pests and diseases contribute to sugar beet yield difference
73
Stevens, M., Hallsworth, P.B., Smith, H.G., 2004. The effects of Beet mild yellowing virus
and Beet chlorosis virus on the yield of UK field-grown sugar beet in 1997, 1999 and
2000. Ann. Appl. Biol. 144, 113-119.
Stevens, M., Hsing-Yeh, L., Lemaire, O., 2006. Virus Diseases. In: Draycott, A.P., (Ed.)
Sugar Beet, Blackwell Publishing, Oxford, pp. 256-278.
Tuitert, G., 1990. Assessment of the inoculum potential of Polymyxa betae and beet necrotic
yellow vein virus (BNYVV) in soil using the most probable number method. Neth. J.
Plant Pathol. 96, 331-341.
UN-DESA, 2009. World population to exceed 9 billion by 2050. Press release 11 March
2009. See http://www.un.org/esa/population/publications/wpp2008/pressrelease.pdf.
Van Swaaij, A.C.P.M., 2007. Opbrengstprognose. In: Betatip, IRS, Bergen op Zoom, pp. 11-
13.
Vereijssen, J., Schneider, J.H.M., Termorshuizen, A.J., Jeger, M.J., 2003. Comparison of two
disease assessment methods for assessing Cercospora leaf spot in sugar beet. Crop
Prot. 22, 201-209.
Vereijssen, J., Schneider, J.H.M., Jeger, M.J., 2007. Supervised control of Cercospora leaf
spot in sugar beet. Crop Prot. 26, 19-28.
Webb, C.R., Gilligan, C.A., Asher, M.J.C., 2000. Modelling the effect of temperature on the
development of Polymyxa betae. Plant Pathol. 49, 600-607.
Werker, A.R., Jaggard, K.W., 1998. Dependence of sugar beet yield on light interception and
evapotranspiration. Agric. For. Meteorol. 89, 229-240.
Wustman, R., 2003. Onderzoek naar de mogelijkheden van rendementsverbetering in de
zetmeelaardappelteelt in Noordoost Nederland. Praktijkonderzoek Plant en
Omgeving, Wageningen, p. 37.
Zachariasse, L.C., 1974. Boer en Bedrijfsresultaat - Analyse van de uiteenlopende
rentabiliteit van vergelijkbare akkerbouwbedrijven in de Noord-Oost-Polder.
Dissertation. Agrarische Bedrijfseconomie, Landbouwhogeschool Wageningen.

Improvement of the competitiveness of the sugar beet crop in the Netherlands
74
Zeddies, J., 2006. Die neue EU-Zuckermarktordnung - Beschlüsse, Auswirkungen und
Bewertung. Agrarwirtschaft. 55, 97-99.

Improvement of the competitiveness of the sugar beet crop in the Netherlands
75
4 Analysis of soil characteristics, soil management and sugar yield on top and averagely managed farms in
sugar beet (Beta vulgaris L.) production in the Netherlands
B. Hanse, G.D. Vermeulen, F.G.J. Tijink, H.-J. Koch and B. Märländer
Soil & Tillage research, submitted
Improvement of the competitiveness of the sugar beet crop in the Netherlands
76
4 Analysis of soil characteristics, soil management and sugar yield
4.1 Abstract
Within the Speeding Up Sugar Yield (SUSY) – project soil management and soil
characteristics were investigated as possible causes of yield difference between 26 ‘type top’
and 26 ‘type average’ growers, top and average performance being based on past yield data.
Growers were pair-wise selected so that pairs were located at close distance and had the
same soil type. In the project years 2006 and 2007 the top growers had 20% (P < 0.001)
higher sugar yields than the average growers.
Mean saturated hydraulic conductivity in the subsoil (Ks) was significantly higher for ‘type
top’ growers than for ‘type average’ growers, 0.49 and 0.31 m day-1, respectively. Mean Ks
was below a damage threshold level of 0.10 m day-1 on 34% of the average growers’ fields
and on 27% of the top growers’ fields. Ks was 0.00 m day-1 on 9% of all fields. The relative
importance of this figure is discussed in this paper. In multiple regression analysis without the
factor grower type, 15.3% of the variability of Ks was explained by a model with the terms
fine sand fraction (50-105 μm) in the subsoil and depth of primary tillage (Dpt; m).
‘Type top’ growers basically made use of comparable equipment, but applied lower tyre
inflation pressures and a lower number of field operations for seedbed preparation and their
drilling date was earlier in time compared with ‘type average’ growers. This did not result in a
significant difference in mean air-filled porosity at field capacity in the topsoil (AP) between
grower types although the number of fields with an topsoil AP in the 10-15 cm layer below
10% was lower in the group of top growers (13 fields) than in the group of average growers
(18 fields).
Direct effects of soil management on AP could be established in statistical analysis without
the factor grower type, but may have been influenced because both management
characteristics and AP appeared to be strongly related to top soil clay content.
A statistical model with AP of the topsoil and Ks of the subsoil could explain 24.9% of the
variation in sugar yield in Dutch sugar beet production. Therefore under the given conditions

4. Analysis of soil characteristics, soil management and sugar yield
77
of soil type (clay content), a better soil structure can be influenced by the grower, resulting in
a higher sugar yield.
4.2 Introduction
The recent reform of the EU sugar market caused a 39.7% price drop of sugar beet in 2009
compared to 2006 (EC, 2001; Zeddies, 2006). Studies on the total variable costs in Dutch
sugar beet production proved that potential costs reduction is possible up to of 20%
(Pauwels, 2006), and that sugar yield was independent of the costs made by growers (Hanse
et al., 2010). Thus it was concluded that improvement of competiveness should be found in
maximisation of sugar yield and in optimizing costs.
The potential sugar yield in The Netherlands is 23 Mg ha-1 (De Wit, 1953) and in Germany 24
Mg ha-1 (Kenter et al., 2006). As the average sugar yield achieved by Dutch growers was
10.6 Mg ha-1 in the period 2002-2006, there is great potential for further improvement.
Additionally, a large variation in average yields of growers in the same area exists, according
to records of the sugar industry (Agricultural Service, 2007). The pair study ‘Speeding Up
Sugar Yield’ (SUSY) was conducted to improve the average yield in the Netherlands by
studying possible causes of sugar yield differences in a pair-wise comparison of
neighbouring growers that had high yields (‘type top’) and average yields (‘type average’)
under the same conditions of soil type and climate. In this study top growers had 20% higher
yields compared with the average growers in the same region (Hanse et al., 2010).
The sugar beet crop requires high-quality seedbeds (Hakansson et al., 2006), is susceptible
for top soil compaction (Koch et al., 2009) and benefits from a profile enabling rooting to
deep soil layers (Windt, 1995). Therefore diverse temporal soil structure parameters were
measured in the SUSY pair study, providing data about the actual status of the soil structure
on 104 sugar beet fields in the Netherlands.
The effects of soil compaction on yield and quality varies in crops and are related to depth
and severity at which it occurs, as well as to seasonal effects and crop stage (Batey, 2009).

Improvement of the competitiveness of the sugar beet crop in the Netherlands
78
For topsoil air-filled porosity at field capacity (AP) a damage threshold of 10% (v/v) is often
reported (Bakker and Hidding, 1970; Grable, 1971; Boone et al., 1986). For the saturated
hydraulic conductivity (Ks) of the subsoil, a damage threshold of 0.10 m day-1 was
established (Lebert et al., 2004). Below those damage thresholds crop yield levels can be
adversely influenced by soil structure.
The aim of this paper is to present: a) the soil characteristics of sugar beet production fields
in the Netherlands; b the differences in management aspects, soil characteristics and crop
characteristics on farms managed by ‘type top’ and ‘type average’ growers; and c) the
relationships between observed soil management, soil characteristics and subsequent sugar
yield.
4.3 Materials and methods
4.3.1 Selection of grower pairs and plots
Two types of growers were selected for the study, ‘type top’ and ‘type average’ growers. A
grower was considered ‘type top’ when his sugar yields in the period 2000-2004, were
consistently greater than the 75th percentile of the sugar yields in the region. Likewise, a
grower was considered ‘type average’ when his sugar yields were consistently between the
25th and 75th percentile of the sugar yields. Pairs were formed by one ‘type top’ and one ‘type
average’ grower, with a difference in sugar yield of at least 1.5 Mg ha-1 based on the mean
yield in the period 2000-2004.
For the study 26 pairs (52 growers) were selected who participated both in 2006 and in 2007.
Growers were pair-wise selected so that pairs were located close together (average distance
was 5.5 km) and had similar soil and field characteristics. Pairs were located all over The
Netherlands on various soil types in sugar beet producing regions. Per grower three
representative plots on one field per year were selected, on which all measurements and

4. Analysis of soil characteristics, soil management and sugar yield
79
observations were done. Plots did not include headlands, field sides, crop nursery tramlines
and field parts, recognisable as deviant shortly after sowing.
4.3.2 Soil management observations and soil measurements
To explain possible differences found in soil structure characteristics, a survey on various soil
management parameters was conducted under ‘type top’ and ‘type average’ growers.
Recorded were: rear tyre inflation pressure during primary tillage (Ppt), depth (Dpt) of primary
soil tillage, width (TWst front and TWst rear) and inflation pressure (Pst front and Pst rear) of front and
rear tyres and number of passes for seedbed preparation (nst).
Intrinsic soil characteristics that influence soil structure and yield, such as pH, CaCO3
content, organic matter content, clay content, silt and sand content were determined from
samples taken from the topsoil (0-30 cm) and the subsoil (30-45 cm) to be used as
covariates in the statistical analysis of the effect of soil structure on sugar yield.
Soil structure was characterised by the penetration resistance in spring, the total porosity and
the air-filled porosity in the topsoil, and the saturated hydraulic conductivity in the ploughpan
area. Penetration resistance (PR) was measured by taking 6 penetrations up to 80 cm depth
per plot, using an Eijkelkamp electronic penetrometer (cone top angle 60 degrees; base area
1.0 cm2) in spring, soon after drilling. Total porosity (P) and air-filled porosity at -10 kPa soil
water matric pressure (AP) were determined according to Kuipers (1961). The soil was
sampled in the 10 – 15 cm depth layer early in the growing season (April-June). In all
sampling, on each plot 8, cores of 100 cm3 were taken at random.
The saturated hydraulic conductivity (Ks) was determined according to Klute and Dirksen
(1986), using an Eijkelkamp soil water permeameter. The measuring time was chosen to be
maximal 24 hours. Sampling was done in the layer with highest penetration resistance (PRks)
observed in the soil profile up to 60 cm depth (2006) or 45 cm depth (2007), assuming Ks to
be lowest in that layer. On each plot 7 cores of 100 cm3 were collected for the determination
of Ks. In some plots, where high penetration resistance was clearly not caused by

Improvement of the competitiveness of the sugar beet crop in the Netherlands
80
compaction but by a layer of different soil texture (sand), the measured Ks was excluded
from statistical analysis (in 2006) or the Ks samples were taken just above the layer with
different soil texture (in 2007).
4.3.3 Crop measurements
Sowing date (Ds) and subsequent canopy closure date usually have a large effect on sugar
yield were recorded to be used as a covariate in yield analysis. The canopy closure date
(Dcc) was devined as the first date on which sugar beet leaves of adjacent rows touched each
other and was assessed 5-6 times in May-June.
Maximum rooting depth (RD) was determined in summer, once on each plot, by visual
assessment of the soil profile up to 120 cm depth, in an excavated pit.
Sugar yield (SYharvest) was obtained by multiplying the mean sugar content with the mean root
yield of the total field under investigation. SYharvest was positively corrected for the total
harvest losses, resulting in the total sugar yield (SY). Harvest losses, due to the breakage of
taproots, losses of whole beets and deep topping, occur during the mechanical harvest of
sugar beets and were measured using the protocol for harvest losses (Brinkmann, 1982;
Vandergeten et al., 2004), adapted to a sample size of 400 sugar beet.
4.3.4 Analysis of the data
To reveal the general situation of the soil characteristics found on Dutch sugar beet
production fields, Ks and AP data for each soil type were compared with the threshold values
for soil compaction that are suggested in literature and the relationship with soil texture was
evaluated.
Statistical analysis was used to evaluate the differences between ‘type top’ and ‘type
average’ growers and the more generalized relationships between soil management, soil
characteristics, crop characteristics and crop growth

4. Analysis of soil characteristics, soil management and sugar yield
81
For all statistical analysis the statistical package GenStat (Payne et al., 2008) was used.
Non-normally distributed variables were transformed to variables with a normal distribution
using logarithmic transformation (pH, Ppt, Dpt , clay content, silt content and CaCO3 content).
Box-Cox transformation was used for organic matter content (λ=-0.8 for organic matter
content of the topsoil and λ=-0.2 for organic matter content in the subsoil), and arcsin
transformation after an initial ln (x+1) transformation for Ks.
The differences in characteristics of soil management, soil type, soil structure and crop
growth between ‘type top’ and ‘type average’ growers were analysed using the Mixed Models
procedure (REML) separately for each characteristic. In these analyses the fixed factor was
grower type and the random factor was chosen to be region + year + pair number to keep the
‘type top’ and ‘type average’ growers belonging to the same pair together and correct for
region and year influences.
In an effort to confirm relationships between soil management and the resulting soil and crop
characteristics found between ‘type top’ and ‘type average’ growers, multiple regression was
used without the factor grower type. By excluding grower type in the analysis interference of
differences between grower types in other management such as nutrients and crop
protection, with the effects of soil were avoided. Some intrinsic soil characteristics, such as
pH, CaCO3 content, organic matter content and soil texture, and the crop characteristic
sowing date, were investigated as covariates in the statistical analysis.
4.4 Results
4.4.1 Soil characteristics of sugar beet fields in the Netherlands
On 9% of all fields covering all soil types, Ks was found 0.00 m day-1 (Figure 4.1). The mean
Ks per field was for 43% of loam, 17% of loamy sand, 53% of sandy loam, 44% of silt loam
and all silty loam fields below 0.10 m day-1. Similarly, 31% of all the fields, 34% of ‘type
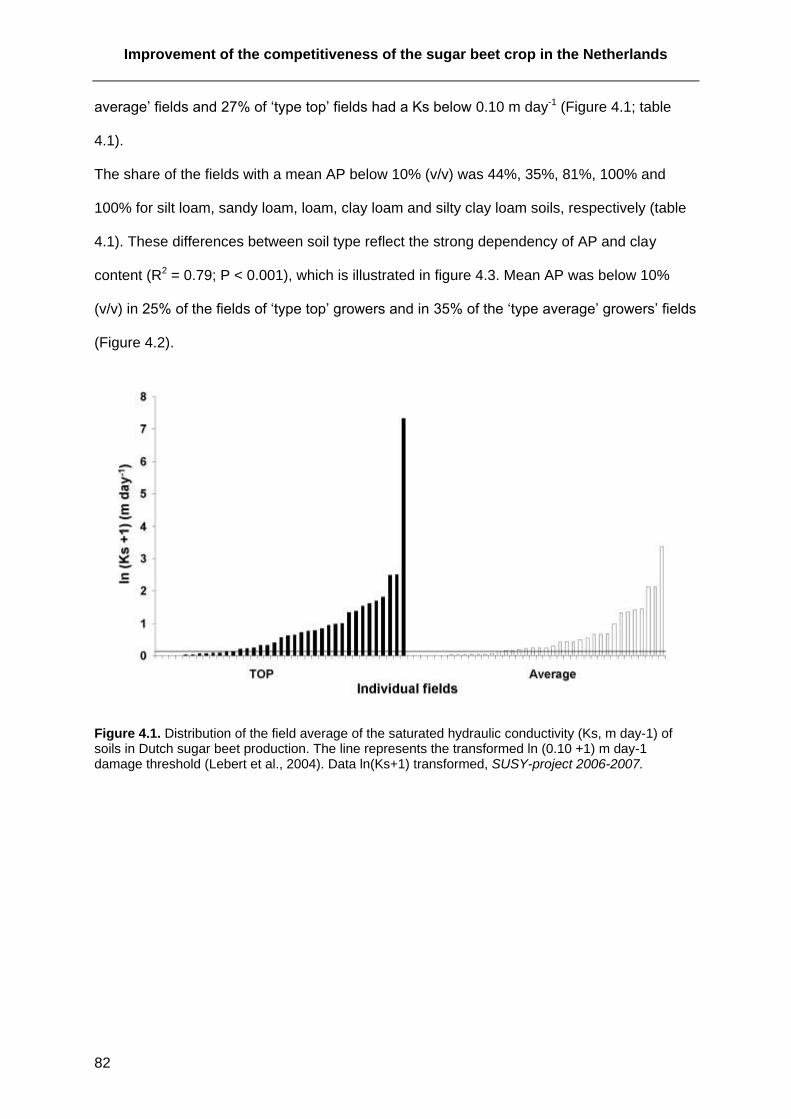
Improvement of the competitiveness of the sugar beet crop in the Netherlands
82
average’ fields and 27% of ‘type top’ fields had a Ks below 0.10 m day-1 (Figure 4.1; table
4.1).
The share of the fields with a mean AP below 10% (v/v) was 44%, 35%, 81%, 100% and
100% for silt loam, sandy loam, loam, clay loam and silty clay loam soils, respectively (table
4.1). These differences between soil type reflect the strong dependency of AP and clay
content (R2 = 0.79; P < 0.001), which is illustrated in figure 4.3. Mean AP was below 10%
(v/v) in 25% of the fields of ‘type top’ growers and in 35% of the ‘type average’ growers’ fields
(Figure 4.2).
Figure 4.1. Distribution of the field average of the saturated hydraulic conductivity (Ks, m day-1) of soils in Dutch sugar beet production. The line represents the transformed ln (0.10 +1) m day-1 damage threshold (Lebert et al., 2004). Data ln(Ks+1) transformed, SUSY-project 2006-2007.

4. Analysis of soil characteristics, soil management and sugar yield
83
Figure 4.2. Distribution of the field average of the air-filled porosity (AP, %) of soils in Dutch sugar beet production. The line represent the 10% (v/v) damage threshold (Bakker and Hidding, 1970; Boone, 1986 and Grable, 1971). Data SUSY-project 2006-2007.
Figure 4.3. Relation of air-filled porosity (%) to natural log transformed clay content (%, w/w) on fields (n=104) in the SUSY-project (2006-2007).

Improvement of the competitiveness of the sugar beet crop in the Netherlands
84
Table 4.1. Topsoil (0-30 cm) analytical data of the fields (n=104) in the SUSY-project (2006-2007).
Soil typea Fields Organic
material CaCO3 pH Arithmetic mean AP
b Arithmetic mean Ks
b
(#) (%, w/w) (%, w/w) (%) (m day-1
)
Sand 27 8.0 0.1 5.1 26.7 (18.1 - 34.1) 2.85 (0.00 - 78.2)
Loamy sand 17 5.0 0.8 6.0 21.3 (13.9 - 30.6) 2.06 (0.00 - 21.9)
Sandy loam 31 2.9 4.6 7.4 11.8 (3.5 - 23.9) 0.80 (0.00 - 32.5)
Silt loam 10 5.1 2.3 6.8 10.4 (2.7 - 17.1) 168.7 (0.00 - 4508)
Loam 16 4.0 5.1 7.3 8.0 (1.0 - 16.7) 1.50 (0.00 - 16.2)
Clay Loam 1 4.7 9.4 7.4 6.5 (4.8 - 7.8) 0.56 (0.00 - 1.65)
Silty clay loam 2 7.7 4.8 7.3 5.9 (4.9 - 7.1) 0.01(0.00 – 0.01)
a. Soil textural classes according to the USDA system (Soil Survey Staff, 1993). b. Minimum and maximum of all measured values between brackets.
4.4.2 Differences between ‘type top’ and ‘type average’ growers
The only significant difference in intrinsic soil characteristics between ‘type top’ and ‘type
average’ growers was a small difference in pH (table 4.2), indicating that the objective to
compare these grower types on the same soil type has been achieved.
Soil and crop management differed between grower type. While tractor weight and tyres
used (TMst, TWst front and TWst rear) were equal, top type growers used lower tyre inflation
pressures (Ppt, Pst front and Pst rear), needed less passes for seedbed preparation (nst) and were
earlier with sowing (Ds) than average type growers.
Statistically significant differences (P < 0.05) in soil structure between grower types were
observed only for the total porosity of the top soil, P, and the saturated hydaulic conductivity
in the subsoil, Ks. The difference in P was relatively small, but P was significantly higher for
‘type top’ growers compared with ‘type average’ growers, respectively 49.0 and 48.2% (table
4.2). The air filled porosity at field capacity, AP, showed a trend to be higher for ‘type top’
growers than for ‘type average’ growers. However, as AP is generally considered to have a
closer relationship with yield than P, AP was also considered in the analysis of factors that
could be responsible for yield differences (section 4.3.3). Ks was significantly higher for ‘type
top’ compared with to ‘type average’ growers’ fields, respectively 0.49 and 0.31 m day-1
4. Analysis of soil characteristics, soil management and sugar yield
85
(table 4.2). The depth of highest penetration resistance and the penetration resistance at Ks
sampling depth were equal for both grower types.
Crops of ‘type top’ growers showed earlier canopy closure (Dcc), deeper rooting (RD), and
higher sugar yield than crops of ‘type average’ growers. All crop growth variables were
significantly different between both grower types: SY and RD were higher, while sowing date
and canopy closure date were significantly earlier for ‘type top’ growers.
4.4.3 Effects of soil type and management on soil structure and subsequent crop growth
Statistical models could be established in which soil management aspects explained up to
33% of the variance of AP (table 4.3). However, just as AP (Figure 4.3), also the
management characteristics of seedbed preparation appeared to be strongly related to the
clay content of the top soil. With increasing clay content of the topsoil, tyre inflation pressures
(Pst front and Pst rear) decreased, the width of the tractor tyres (TWst front and TWst rear) increased,
the tractor weight (TMst) decreased and the number of passes for seedbed preparation (nst)
increased (table 4.3). When both topsoil clay content and the management variables were
taken together into multiple regression models, all of the soil management variables (Pst front,
Pst rear, TWst front,TWst rear, TMst and nst) did not add more than 1% extra to the explained
variance of AP by topsoil clay content (79.5%).
Ks increased with decreasing fine sand fraction (50-105 μm) and with increasing depth of
primary tillage (mainly ploughing). A statistical model with the parameters could explain
15.3% of the variance of Ks (table 4.4). Model calculation with a fine sand content of 37%
(mean in the experiments) suggest that Ks increased by 58% when Dpt increased from 0.27
m (mean of average growers) to 0.29 m (mean of top growers).
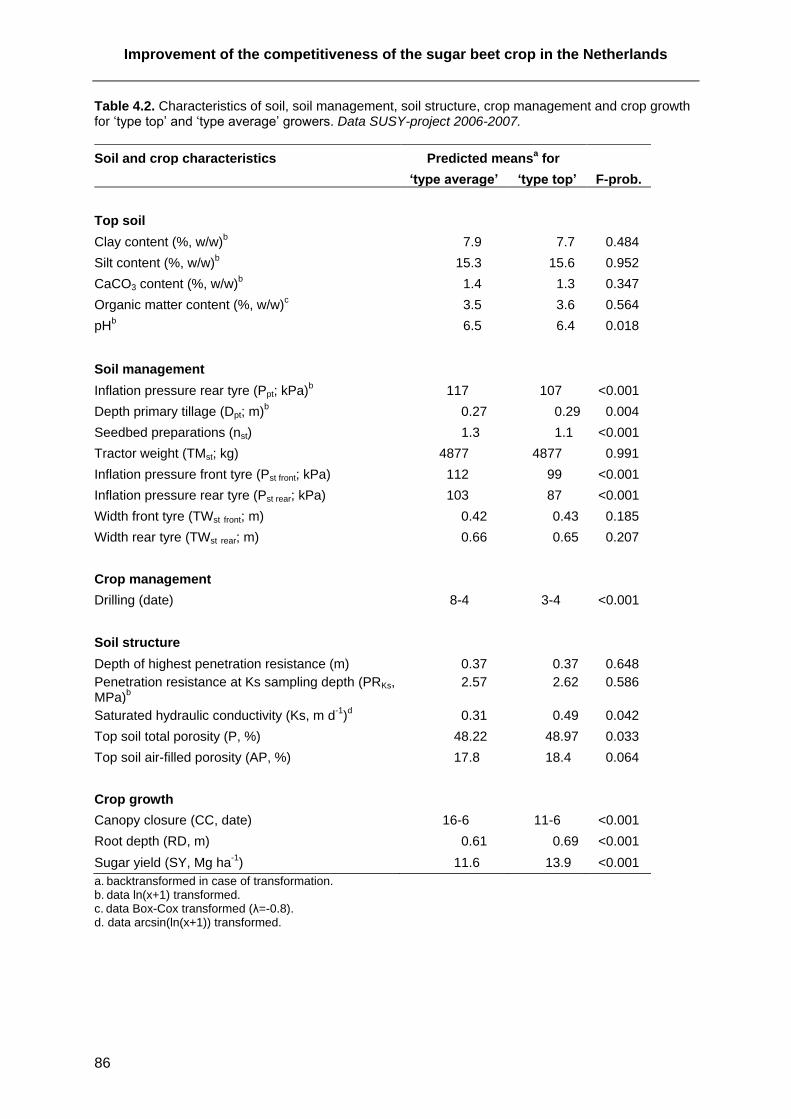
Improvement of the competitiveness of the sugar beet crop in the Netherlands
86
Table 4.2. Characteristics of soil, soil management, soil structure, crop management and crop growth for ‘type top’ and ‘type average’ growers. Data SUSY-project 2006-2007.
Soil and crop characteristics Predicted meansa for
‘type average’ ‘type top’ F-prob.
Top soil
Clay content (%, w/w)b 7.9 7.7 0.484
Silt content (%, w/w)b 15.3 15.6 0.952
CaCO3 content (%, w/w)b 1.4 1.3 0.347
Organic matter content (%, w/w)c 3.5 3.6 0.564
pHb 6.5 6.4 0.018
Soil management
Inflation pressure rear tyre (Ppt; kPa)b 117 107 <0.001
Depth primary tillage (Dpt; m)b 0.27 0.29 0.004
Seedbed preparations (nst) 1.3 1.1 <0.001
Tractor weight (TMst; kg) 4877 4877 0.991
Inflation pressure front tyre (Pst front; kPa) 112 99 <0.001
Inflation pressure rear tyre (Pst rear; kPa) 103 87 <0.001
Width front tyre (TWst front; m) 0.42 0.43 0.185
Width rear tyre (TWst rear; m) 0.66 0.65 0.207
Crop management
Drilling (date) 8-4 3-4 <0.001
Soil structure
Depth of highest penetration resistance (m) 0.37 0.37 0.648
Penetration resistance at Ks sampling depth (PRKs, MPa)
b
2.57 2.62 0.586
Saturated hydraulic conductivity (Ks, m d-1
)d 0.31 0.49 0.042
Top soil total porosity (P, %) 48.22 48.97 0.033
Top soil air-filled porosity (AP, %) 17.8 18.4 0.064
Crop growth
Canopy closure (CC, date) 16-6 11-6 <0.001
Root depth (RD, m) 0.61 0.69 <0.001
Sugar yield (SY, Mg ha-1
) 11.6 13.9 <0.001
a. backtransformed in case of transformation.
b. data ln(x+1) transformed.
c. data Box-Cox transformed (λ=-0.8).
d. data arcsin(ln(x+1)) transformed.

Table 4.3. Parameter estimates and summary statistics of linear regression relating the seedbed preparation management variables to clay content (%, w/w) and Air-filled porosity to seedbed preparation management variables of the top soil in Dutch sugar beet production fields. Data SUSY-project 2006-2007.
variate
ln(clay content (%, w/w) +1) a Air-filled porosity
b
Constant Explained variance
P Constant Explained variance
P
Estimate s.e.c
Estimate s.e.c
% Estimate s.e.c
Estimate s.e.c
%
Pressure front tyre (Pst front; kPa)
-0.29
0.03 1.66 0.06 29.9 <0.001 10.24 0.92 5.68 1.04 28.3 <0.001
Width front tyre (TWst front; m)
0.02
0.01 0.37 0.02 1.3 0.023 -3.94 3.44 17.97 1.51 0.1 0.253
Pressure rear tyre (Pst rear; kPa)
-0.29 0.02 1.54 0.05 35.3 <0.001 12.29 0.99 4.90 1.00 33.2 <0.001
Width rear tyre (TWst rear; m)
0.10 0.01 0.45 0.03 14.0 <0.001 -14.97 2.10 26.08 1.44 13.8 <0.001
Tractor weight (TMst; kg)
-288.5 77.3 5416 176 4.0 <0.001 0.00 0.00 6.87 1.98 6.9 <0.001
Seedbed preparations (nst)
0.27 0.03 0.64 0.08 17.0 <0.001 -6.84 0.82 24.59 1.08 18.2 <0.001
a. Model: y = b0 + b1 x ln(clay content (%, w/w) +1). b. Model: Air-filled porosity = b0 + b1 x variate. c. s.e. is the standard error of parameter estimates.
87
4. A
naly
sis
of s
oil c
ha
racte
ristic
s, s
oil m
an
ag
em
en
t an
d s
ug
ar y
ield

Improvement of the competitiveness of the sugar beet crop in the Netherlands
88
Table 4.4. Description, estimated values and standard errors for the parameters in multiple linear regression
a for the saturated hydraulic conductivity (Ks) of the subsoil in Dutch sugar beet production
b.
Data SUSY-project 2006-2007.
Parameter Description Estimate s.e. Probability
b0 Constant -0.1386 0.0541 0.011 b1
Coëfficient for 50-105 μm subsoil sand content (%, w/w) (X1)
-0.0008
0.0002
<0.001
b2
Coëfficient for ln (Depth primary tillage (Dpt; m) + 1) (X2)
0.0662
0.0163
<0.001
a. Model: arcsin(ln (Ks+1)/100) = b0 + b1 x X1 +b2 x X2. b. Explained variance 15.3%.
The effect of soil structure on sugar yield was best described by a statistical model with the
terms AP, the interaction of AP and sowing date and the interaction of Ks and fine sand
fraction in the subsoil. Such a model explained 24.9% of the variation of the sugar yield
(table 4.5). A model with only sowing date explained 13.4%, a model with only AP explained
2.0% and a model with only Ks explained 4.6% of the variance in sugar yield (data not
shown). Penetration resistance did not explain any of the variance in sugar yield.
Table 4.5. Description, estimated values and standard errors for soil structure parameters in multiple linear regression
a for the sugar yield (SY) in Dutch sugar beet production
b. Data SUSY-project 2006-
2007.
Parameter Description Estimate s.e. Probability
b0 Constant 12.54 0.28 <0.001 b1 Coëfficient for air-filled porosity (AP, %) (X1) 0.4829 0.0710 <0.001 b2
Coëfficient for air-filled porosity (AP, %) x sowing date (X2)
-0.0051
0.0007
<0.001
b3
Coëfficient for arcsin(ln (Ks+1)/100) x subsoil 50-105 μm sand content (%, w/w) (X3)
0.3299
0.0880
<0.001
a. Model: SY = b0 + b1 x X1 + … + b3 x X3. b. Explained variance 24.9%.

4. Analysis of soil characteristics, soil management and sugar yield
89
4.5 Discussion
The pair study ‘Speeding Up Sugar Yield’ (SUSY) studied possible causes of sugar yield
differences in a pair-wise comparison of neighbouring ‘type top’ and ‘type average’ growers.
The ‘type top’ growers yielded 2.3 Mg ha-1 more sugar compared to the ‘type average’
growers, while the intrinsic soil properties did not differ for both grower types. Thus the ‘type
top’ growers performed better under the same environmental conditions and Hanse et al.
(2010) showed that they had comparable costs to the ‘type average’ growers too. Part of the
difference in sugar yield can be attributed to soil structure. The soil structure, topsoil AP and
subsoil Ks, explained (although in interaction with sowing date and subsoil sand content)
24.9% of the total sugar yield in Dutch sugar beet production. Thus the effect of soil structure
is interwoven with the positive effect of early sowing date on sugar yield. The latter is due to
an increased interception of the yearly available radiation due to earlier canopy closing
(Werker and Jaggard, 1998; Kenter et al., 2006). A better soil structure thus might facilitate
early sowing.
A better use of equipment by the ‘type top’ growers was observed at seedbed preparation,
were the used equipment (TMst, TWst front and TWst rear) was comparable but the inflation
pressure (TPst front and TPst rear) and the number of passes (nst) to prepare the seedbed were
significant lower for the ‘type top’ growers. However, this did not result in significant higher
AP for the ‘type top’ growers. For AP, values below 10% are considered restricting crop
growth (Bakker and Hidding, 1970; Grable, 1971; Boone et al., 1986). In this study 30% of
the fields had a topsoil AP below this damage threshold, all of these soils had a clay content
of 8.6% or more indicating also the strong relationship of AP with clay content. The strong
relationship of both soil management characteristics and AP with clay content may have
hindered discovery of the effects of soil management on AP.
On the clay soils with low AP the sugar yields are already on a high level, but could be
improved when the aeration is optimised by soil saving traffic (Lamers et al., 1986;
Vermeulen and Klooster, 1992; Vermeulen and Mosquera, 2008). On the other hand the

Improvement of the competitiveness of the sugar beet crop in the Netherlands
90
sugar beet crop requires a slight compression of the topsoil for improved plant establishment
and soil root contact (Tijink and Märländer, 1998). Growers on clay soil interact already to the
relation of AP and clay content, which is shown by the reduction of tyre inflation pressure
with increasing clay content in the topsoil. The results of this study show that future research
on AP and pair wise comparison of farmers for soil structure should use clay content as a
covariate in the analysis of the data.
Contrary to AP, ‘type top’ growers had a significantly higher Ks (subsoil structure) compared
to ‘type average’ growers. Since the Dpt and subsoil sand content explain limited amount
(15%) of the variance in Ks, it is likely that not all causes of the variance in Ks are revealed in
this study. The influence of tyre inflation pressure on soil compaction is found in research all
over the world (Davies et al., 1973; Soane et al., 1982; Van den Akker, 1998). Rear tyre
inflation pressure at primary tillage (Ppt), mainly ploughing, was significant lower for the ‘type
top’ growers, too. Although Ppt had no significant effect on the Ks in this study, the higher
values for Ks of the ‘type top’ growers might be influenced by their equipment use. However,
not only equipment use (low tyre inflation pressure and tillage depth) is important, also the
soil conditions, mainly water content, under which the operations take place (Arvidsson and
Hakansson, 1996; Batey, 2009). This factor was not included in this study for impossibility to
measure soil conditions at 52 fields at the time operations take place, but for some grower
pairs astonishing differences between top and average growers in soil conditions could be
observed by eye.
Ks measured in the subsoil can be used as a indicator of subsoil compaction (Dawidowski
and Koolen, 1987; Arvidsson, 2001). Subsoil compaction is of major concern in the present
policymaking of the EU in developing the new soil directive (EC, 2006). The data on the Ks
found in this study provide information on the extent of subsoil compaction in sugar beet
growing in the Netherlands to feed policymaking. Ks was found below the damage threshold
of 0.10 m day-1 (Lebert et al., 2004) on 31% of the fields, all located on clayey soils, while on
9% of all fields Ks was found 0.00 m day-1. These figures seem to indicate severe subsoil
compaction. However, a study in Lower Saxony (Germany) found 17% of the fields in the

4. Analysis of soil characteristics, soil management and sugar yield
91
range of harmful soil compaction, all of them with subsoil Ks below the 0.10 m day-1 damage
threshold (Brunotte et al., 2008). However visual structure analysis of these fields’ profile
revealed normal soil functioning. Only on tramlines and headlands harmful soil compaction
was found. Similar results were obtained in Nordrhein-Westfalen (Germany) were visual
structure analyses reduced the harmful subsoil compacted fields from 37% to 24% (Weyer,
2007). Thus laboratory analyses of soil samples might indicate agricultural fields under risk of
harmful soil compaction, but they likely overestimate the amount of fields actually suffering
harmful soil compaction. In this study, on all soil types, fields were found where one or more
of the 3 plots had a Ks of 0.00 m day-1, indicating spatial variability in local Ks and subsoil
compaction on fields. Spatial variability on investigated fields is often reported (Strudley et
al., 2008). The effect of this patchiness probably explains the rather low effect of Ks on sugar
yield (4.6%). The effect of subsoil compaction on yield was reported 3-5% in other studies as
well (Chamen et al., 2003). Although the effect of subsoil compaction on yield is rather small,
it has a long lasting nature (Hakansson and Reeder, 1994). Therefore, subsoil compaction
can also influence yield of other crops, grown in rotation with sugar beet. Crops differ
susceptibility to soil compaction and the average yearly yield loss is estimated 11.4%
(Arvidsson and Hakansson, 1996). It can be expected that the effect of Ks in the subsoil will
affect yields more severe in seasons with excessive rainfall. In those seasons the ‘type top’
growers are in a better position to escape the negative effect of too much water in sugar beet
production.
Ks in this study could be partially explained by the nature of the subsoil (50-105 μm subsoil
sand content (%, w/w)) and the depth of primary tillage (Dpt). Ks and Dpt were both significant
higher for ‘type top’ growers. Soil compaction can be alleviated by tillage operations (Spoor
et al., 2003; Hamza and Anderson, 2005; Batey, 2009). However for those operations
loosening is at depths through or just below the compacted zone. In this study the Ks was
measured below the depths of the farmers’ tillage operations. This leaves the question
whether tillage treatments just above the compacted zone, effects biological or physical

Improvement of the competitiveness of the sugar beet crop in the Netherlands
92
processes increasing Ks. The predicted effect (58%) of 0.02 m increased tillage depth on
subsoil Ks is substantial.
Whereas other authors found a significant effect of top soil penetration resistance on sugar
yield (Koch et al., 2009), penetration resistance of the top soil had no effect on sugar yield in
this study. This is most likely due to the deeper primary tillage operation, alleviating too high
top soil penetration resistance on fields in this study. Fields were mainly ploughed, with
primary tillage depths ranging from 0.19 – 0.43 m. Other researchers also found a significant
effect of ploughing on sugar yield (Koch et al., 2008; Bollman and Sprague, 2009; Koch et
al., 2009).
Finally, next to a good soil structure, other variables, like the management of pests and
diseases, have proven important in the SUSY pair study for improving sugar yield too (Hanse
et al., 2011). For future pair studies of growers next to the already mentioned clay content,
research should find a way to exclude these other yield influencing variables. Then the effect
of growers management on soil structure, and of soil structure on yield can be estimated
without bias.

4. Analysis of soil characteristics, soil management and sugar yield
93
4.6 Conclusions
- The fields of higher yielding ‘type top’ growers had higher Ks and thus less subsoil
compaction compared to the ‘type average’ growers.
- Ks influenced sugar yield. Low Ks values were found on about one third of the fields in
this study indicating the extent of the subsoil compaction in Dutch sugar beet production.
- Depth of primary tillage and the nature of the soil (sand content subsoil) explained the Ks.
- ‘Type top’ growers made better use of the same equipment at seedbed preparation,
although the AP in topsoil of ‘type top’ growers was not different from average growers.
- AP depended strongly on clay content in the topsoil. Clay content explained also tyre
inflation pressure at seedbed preparation. Thus the growers interacted with the soil type.
- In dependency of subsoil sand content and sowing date, Ks and AP explained 24.9% of
variance in sugar yield.

Improvement of the competitiveness of the sugar beet crop in the Netherlands
94
4.7. References
Agricultural Service, 2007. Unitip 2006 - Algemeen verslag. Suiker Unie, Dinteloord, The
Netherlands, p. 38.
Arvidsson, J., Hakansson, I., 1996. Do effects of soil compaction persist after ploughing?
Results from 21 long-term field experiments in Sweden. Soil Tillage Res. 39, 175-197.
Arvidsson, J., 2001. Subsoil compaction caused by heavy sugarbeet harvesters in southern
Sweden: I. Soil physical properties and crop yield in six field experiments. Soil Tillage
Res. 60, 67-78.
Bakker, J.W., Hidding, A.P., 1970. The influence of soil structure and air content on gas
diffusion in soils. Netherlands Journal of Agricultural Science. 18, 37-48.
Batey, T., 2009. Soil compaction and soil management - a review. Soil Use Manage. 25,
335-345.
Bollman, S.L., Sprague, C.L., 2009. Effect of Tillage and Soil-Applied Herbicides with Micro-
Rate Herbicide Programs on Weed Control and Sugarbeet Growth. Weed Technol.
23, 264-269.
Boone, F.R., Van der Werf, H.M.G., Kroesbergen, B., Ten Hag, B.A., Boers, A., 1986. The
effect of compaction of the arable layer in sandy soils on the growth of maize for
silage. 1. Critical matric water potentials in relation to soil aeration and mechanical
impedance. Netherlands Journal of Agricultural Science. 34, 155-171.
Brinkmann, W., 1982. Methode und zusammenfassende Ergebnisse der Untersuchungen
zur Arbeitsqualität von Zuckerrüben-Erntemaschinen. Die Zuckerrübe. 31, 223-228
and 258-259.
Brunotte, J., Lorenz, M., Sommer, C., Harrach, T., Schäfer, W., 2008. Verbreitung von
Bodenschadverdichtungen in Südniedersachsen. Berichte über Landwirtschaft. 86,
262-284.

4. Analysis of soil characteristics, soil management and sugar yield
95
Chamen, T., Alakukku, L., Pires, S., Sommer, C., Spoor, G., Tijink, F.G.J., Weisskopf, P.,
2003. Prevention strategies for field traffic-induced subsoil compaction: a review -
Part 2. Equipment and field practices. Soil Tillage Res. 73, 161-174.
Davies, D.B., Finney, J.B., Richards. S.J., 1973. Relative Effects of Tractor Weight and
Wheel Slip in Causing Soil Compaction. Journal of Soil Science. 24, 399-409.
Dawidowski, J.B., Koolen, A.J., 1987. Changes of soil water suction, conductivity and dry
strength during deformation of wet undisturbed samples. Soil Tillage Res. 9, 169-180.
De Wit, C.T., 1953. A physical theory on placement of fertilizers. Dissertation. Verslagen
Landbouwkundige Onderzoekingen (59-4), Dissertation, Landbouwhogeschool
Wageningen, The Netherlands.
EC, 2001. Council Regulation (EC) No 1260/2001 of 19 June 2001 on the common
organisation of the markets in the sugar sector. Official Journal of the European
Communities L. 178, 1-45.
EC, 2006. COM 232 - Proposal for a directive of the European Parliament and of the council
establishing a framework for the protection of soil and amending Directive
2004/35/EC.
Grable, A.R., 1971. Effects of compaction on content and transmission of air in soils. In:
Barnes, K.K., Carleton, W.M., Taylor, H.M., Throckmorton, R.I., Vanden Berg, G.E.,
(Eds.), Compaction of Agricultural Soils, American Society of Agricultural Engineers,
St. Joseph, MI, U.S.A., pp. 51-69.
Hakansson, I., Reeder, R.C., 1994. Subsoil Compaction by Vehicles with High Axle Load
Extent, Persistence and Crop Response. Soil Tillage Res. 29, 277-304.
Hakansson, I., Henriksson, L., Blomquist, J.E., 2006. Soil Tillage and Crop Establishment. In:
Draycott, A.P., (Ed.) Sugar Beet, Blackwell Publishing, Oxford, pp. 114-133.
Hamza, M.A., Anderson, W.K., 2005. Soil compaction in cropping systems - A review of the
nature, causes and possible solutions. Soil Tillage Res. 82, 121-145.

Improvement of the competitiveness of the sugar beet crop in the Netherlands
96
Hanse, B., Tijink, F.G.J., Mußhoff, O., Märländer, B., 2010. Comparison of costs and yields
of 'type top' and 'type average' growers in Dutch sugar beet growing. Sugar Industry.
135, 550-560.
Hanse, B., Schneider, J.H.M., Termorshuizen, A.A.J., Varrelmann, M., 2011. Pests and
diseases contribute to sugar beet yield difference between top and averagely
managed farms. Crop Prot. 30, 671-678.
Kenter, C., Hoffmann, C.M., Marlander, B., 2006. Effects of weather variables on sugar beet
yield development (Beta vulgaris L.). Eur. J. Agron. 24, 62-69.
Klute, A., Dirksen, C., 1986. Hydraulic Conductivity and Diffusivity: Laboratory Methods. In:
Klute, A., (Ed.) Methods of Soil Analysis. Part 1. Physical and Mineralogical Methods,
SSSA Book Series No. 5. Soil Science Society of America, Madison, USA, pp. 687-
734.
Koch, H.J., Heuer, H., Tomanova, O., Marlander, B., 2008. Cumulative effect of annually
repeated passes of heavy agricultural machinery on soil structural properties and
sugar beet yield under two tillage systems. Soil Tillage Res. 101, 69-77.
Koch, H.J., Dieckmann, J., Buchse, A., Marlander, B., 2009. Yield decrease in sugar beet
caused by reduced tillage and direct drilling. Eur. J. Agron. 30, 101-109.
Kuipers, H., 1961. Water content at pF2 as a characteristic in soil cultivation research in the
Netherlands. Netherlands Journal of Agricultural Science. 9, 27-35.
Lamers, J.G., Perdok, U.D., Lumkes, L.H., Klooster, J.J., 1986. Controlled traffic farming
systems in The Netherlands. Soil Tillage Res. 8, 65-76.
Lebert, M., Brunotte, J., Sommer, C., 2004. Ableitung von Kriterien zur Charakterisierung
einer schädlichen Bodenveränderung, entstanden durch nutzungsbedingte
Verdichtung von Böden / Regelungen zur Gefahrenabwehr. Texte 46-04.
Umweltbundesamt, Berlin, p. 128.
Pauwels, J.B., 2006. Teeltkosten kunnen 20 procent lager. IRS Informatie. In: Cosun
Magazine nr 8, pp. 14-15 and CSM Informatie nr 555. pp. 14-15.

4. Analysis of soil characteristics, soil management and sugar yield
97
Payne, R.W., Murray, D.A., Harding, S.A., Baird, D.B., Soutar, D.M., 2008. GenStat for
Windows (11th Edition) Introduction. 11th ed. VSN International, Hemel Hempstead.
Soane, B.D., Dickson, J.W., Campbell, D.J., 1982. Compaction by Agricultural Vehicles - a
Review .3. Incidence and Control of Compaction in Crop Production. Soil Tillage Res.
2, 3-36.
Spoor, G., Tijink, F.G.J., Weisskopf, P., 2003. Subsoil compaction: risk, avoidance,
identification and alleviation. Soil Tillage Res. 73, 175-182.
Staff, S.S.D., 1993. Soil survey manual. Soil Conservation Service U.S., Department of
Agriculture.
Strudley, M.W., Green, T.R., Ascough II, J.C., 2008. Tillage effects on soil hydraulic
properties in space and time: State of the science. Soil Tillage Res. 99, 4-48
Tijink, F.G.J., Märländer, B., 1998. Soil compaction and compression in relation to sugar beet
production. In: Märländer, B., Tijink, F.G.J., Hoffmann, C., Beckers, R., (Eds.),
Advances in Sugar Beet Research, 1. International Institute for Beet Research,
Brussels, pp. 3-5.
Van den Akker, J.J.H., 1998. Prevention of subsoil compaction by defining a maximum wheel
load bearing capacity. In: Märländer, B., Tijink, F.G.J., Hoffmann, C., Beckers, R.,
(Eds.), Soil compaction and compression in relation to sugar beet production, 1.
Advances in Sugar Beet Research, IIRB, Brussels, pp. 43-54.
Vandergeten, J.-P., Van der Linden, J.P., Jarvis, P., Leveque, E., Guiraud De Willot, D.,
Kromer, K.-H., 2004. Test Procedures for Measuring the Quality in Sugar Beet
Production - Seed Drillability, Precision Seeders, Harvesters, Cleaner Loaders. IIRB,
Bruxelles, p. 52.
Vermeulen, G.D., Klooster, J.J., 1992. The potential of a low ground pressure traffic system
to reduce soil compaction on a clayey loam soil. Soil Tillage Res. 24, 337-358.

Improvement of the competitiveness of the sugar beet crop in the Netherlands
98
Vermeulen, G.D., Mosquera, J., 2008. Soil, crop and emission responses to seasonal-
controlled traffic in organic vegetable farming on loam soil. Soil Tillage Res. 102, 126-
134.
Werker, A.R., Jaggard, K.W., 1998. Dependence of sugar beet yield on light interception and
evapotranspiration. Agric. For. Meteorol. 89, 229-240.
Weyer, T., 2007. Status der Bodenverdichtung in Nordrhein-Westfalen. In: Proceedings of
the Strategien zum Bodenschutz - Sachstand und Handlungsbedarf,
Fachveranstaltung von ilu, GKB und KTBL, 5-6 December 2007, Bonn, D.
Windt, A., 1995. Entwicklung des Faserwurzelsystems der Zuckerrübe sowie dessen
Beziehung zum Wachstum der Gesamtpflanze und der Nährstoffaufnahme.
Dissertation. University Göttingen.
Zeddies, J., 2006. Die neue EU-Zuckermarktordnung - Beschlüsse, Auswirkungen und
Bewertung. Agrarwirtschaft. 55, 97-99.

Improvement of the competitiveness of the sugar beet crop in the Netherlands
99
5 Harvesting losses ... How to yield this hidden financial potential
A.C. Hanse, F.G.J. Tijink
Proceedings of the 72nd IIRB Congress, 22-24 June 2010, Copenhagen, DK

Improvement of the competitiveness of the sugar beet crop in the Netherlands
100
5 Harvesting losses … How to yield this hidden financial potential
5.1 Abstract
As part of the pair study SUSY (Speeding Up Sugar Yield) harvest yield losses were
measured during 3 years (2006, 2007, and 2008) on in total 150 sugar beet fields in the
Netherlands. Losses by overtopping, root breakages, and of whole beet were measured
according the IIRB standard measuring method. Average losses (3 t ha-1) were on a similar
level as in an earlier study in 1976. The same holds for the maximum losses (up to 10 t ha-1).
Results will be presented and ways to help practise to yield this hidden financial potential.

5. Harvesting losses ... How to yield this hidden financial potential
101
5.2 Introduction
Within the SUSY (Speeding Up Sugar Yield) pair study sugar beet growers with a high
yielding history (‘type top’) were compared with neighbouring average yielding growers (‘type
average’) (Hanse, et al., 2010). During the three years of the SUSY-project (2006-2008)
harvest losses were measured to correct the yield data and to obtain updated data of harvest
performance on fields. The last available data on harvest losses in Dutch sugar beet
production originated from 1976. Then average harvest losses were 3 t ha-1 ranging from 0.3
to 10.1 t ha-1 with mainly 6 row harvesters (Andringa and Bouma, 1977).
Mechanical harvest of sugar beets implies to find an optimum between harvesting the grown
crop without losses, meeting high quality standards: undamaged and low tare in a cost
efficient way (Tijink, 2007). Sugar beets in the Netherlands are mainly lifted by 6 row tanker
harvesters owned by contractors.
In theory, reducing harvest losses could easily raises the amount of paid sugar beets and
thus reduce unit costs sugar beet, due to the fact that more of the grown sugar beets are
delivered to the factory and not left in the field. Therefore it should be known how large the
harvest losses are and whether progress is made over the last 30 years or not.
5.3 Materials and methods
Harvest losses were measured on 150 fields during the SUSY-project (2006-2008). Each
year on 52 fields (both 26 fields of ‘type top’ and ‘type average’ growers) measurements
were done, except for 2008 when on 46 fields harvest losses were collected. Harvest losses
were measured according the IIRB standard measuring method, adapted to 400 beets
(Brinkmann, 1982; Vandergeten et al., 2004). Measurements were done at or shortly after
harvest time.
In the SUSY-project, costs of growing sugar beets were recorded, including harvest costs
(Hanse et al., 2010).

Improvement of the competitiveness of the sugar beet crop in the Netherlands
102
Data were analysed using the statistical package GenStat, 12th edition (VSN International
Ltd.). Linear mixed models were used to analyse the effect of year, grower, soil type and
their interactions in the fixed model. The given pair number, region and their interaction were
used as random terms to analyse the ‘type top’ and ‘type average’ within a pair directly with
each other.
5.4 Results and discussion
During the SUSY-project at 93% of the fields sugar beets were lifted by contractor owned
machines, while only a few growers harvested the sugar beets with own equipement. On
average the cost for sugar beet lifting were 347 € ha-1 (range: 249-410 € ha-1), including
transportation from the field to the storage clamp. Harvest costs were with 25% a
considerable part of the total variable growing costs in Dutch sugar beet production (Hanse
et al., 2010).
Average harvest losses of the 2006-2008 period are shown in figure 5.1. The results indicate
that 2.9 t ha-1 sugar beets was left in the Dutch sugar beet fields. The minimum total losses
found were 0.45 t ha-1, the maximum 9.1 t ha-1. Those results are in line with the losses found
30 years ago (Andringa and Bouma, 1977). Despite an era of engineering and steadily
increasing sugar yield, the absolute level of harvest losses stayed the same.
With an acreage of about 70,000 ha only reducing the 0.56 t ha-1 of whole beet losses, may
result in nearly 40,000 tons of extra sugar beets to be processed in the Netherlands. The
maximum of whole beet losses was found 4.62 t ha-1, which is a financial loss of 162 € ha-1,
about half the harvest costs.
The same holds for the 0.68 t ha-1 of losses due to overtopping. Since 2006 the top tare is
not fined (nor paid) by the Dutch sugar industry, making those losses unnecessary. Reducing
the losses due to root breakages might be the hardest of all three. Those losses depends,
besides good machine adjustment, also on the conditions under which the sugar beets are
harvested.

5. Harvesting losses ... How to yield this hidden financial potential
103
Figure 5.1. Average harvest losses in Dutch sugar beet growing. Average total losses were 2.9 t ha-1
. Data SUSY-project 2006-2008 (n=150).
The total harvest losses and losses due to root breakage did not differ significantly between
‘type top’ and ‘type average’ growers (table 5.1). The losses due to overtopping and whole
beet losses did differ significantly between grower types, both were lower at the fields of ‘type
top’ growers. This might be due to a more even or less gappy stand of the sugar beets.
Table 5.1. Harvest losses on the fields of ‘type top’ and ‘type average’ growers in Dutch sugar beet production. Data SUSY-project 2006-2008.
Grower type Harvest losses by:
Overtopping (t ha-1
) Breakages (t ha-1
) Whole beet (t ha-1
) Total (t ha-1
)
Top 0.55 1.71 0.34 2.72
Average 0.70 1.60 0.57 3.03
P 0.007 0.121 <0.001 0.088
lsd 5% 0.08 0.19 0.09 0.35
Improvement of the competitiveness of the sugar beet crop in the Netherlands
104
The considerable amount of yield left in the fields urged for improvement of the awareness of
the growers and harvester drivers about the harvest losses. The IRS initiated in cooperation
with the Dutch sugar industry a series of field days and an harvester driver instruction day.
On these days the central theme was how to reduce harvest losses and what is the allowed
quality concerning top tare. During the field days the effect of machine adjustment was
demonstrated by small clamps of sugar beet, harvested with the same machine with different
adjustments. In addition those different adjustments were demonstrated with that machine in
the field.
The instruction day of harvester drivers was also organised in cooperation with three
harvester manufacturers, and the union of contractors. From each brand one machine was
present in the field and 32 drivers got the challenge to reduce, all together, the harvest
losses with the machine of their own brand assisted by technicians of the manufacturer. Thus
they were not only in the role of student but were also able to share and exchange their skills
and experience with their colleagues.
The idea behind creating awareness of both growers and drivers for the harvest losses was
that they can cooperatively reduce the harvest losses to the minimum possible under the
given circumstances. Both the field days and the harvester drivers’ instruction day were
highly appreciated by the participants.
5.5 Conclusions
With on average 2.9 t ha-1 a considerable amount of yield was left in the fields of Dutch sugar
beet growers. The harvest losses in the SUSY-project were as high as they were 30 years
ago. The ‘type top’ growers did not have lower total harvest losses as had the ‘type average’
growers. Reducing the harvest losses is a relatively easy and efficient way to improve
harvested yields and profitability of the sugar beet crop. It takes both grower and driver of the
harvester to reduce harvest losses.
5. Harvesting losses ... How to yield this hidden financial potential
105
Demonstrations, training and extention service was aimed to reduce harvest losses in the
Netherlands.
5.6 References
Andringa, J.T. and Bouma, J., 1977. Verliezen bij de oogst van suikerbieten. Verslag van een
onderzoek naar bietverliezen bij gebruik van overwegend zesrijige oogstmachines.
Consulentschap voor Landbouwwerktuigen en Arbeid, Wageningen; Instituut voor
Mechanisatie, Arbeid en Gebouwen, Wageningen; Instituut voor Rationele
Suikerproductie, Bergen op Zoom; Proefstation voor de Akkerbouw en Groenteteelt in
de Vollegrond, Lelystad, 64 p.
Brinkmann, W., 1982. Methode und zusammenfassende Ergebnisse der Untersuchungen
zur Arbeitsqualität von Zuckerrüben-Erntemaschinen. Die Zuckerrübe, 31, 223-228
and 258-259.
Hanse, B., Tijink, F.G.J., Mußhoff, O. and Märländer, B., 2010. Comparison of costs and
yields of ‘type top’ and ‘type average’ growers in Dutch sugar beet growing. Sugar
Industry, 135, 550-560.
Tijink, F.G.J., 2007. Evenwicht tussen tarra en bietverliezen. In: Betatip, 8, pp. 14-21, IRS,
Bergen op Zoom.
Vandergeten, J.-P., Van der Linden, J.P., Jarvis, P., Leveque, E., Guiraud de Willot, D. and
Kromer, K.-H., 2004 Test Procedures for Measuring the Quality in Sugar Beet
Production – Seed Drillability, Precision Seeders, Harvesters, Cleaner Loaders. IIRB,
Bruxelles, 52 p.

Improvement of the competitiveness of the sugar beet crop in the Netherlands
106

Improvement of the competitiveness of the sugar beet crop in the Netherlands
107
6 Epilogue

Improvement of the competitiveness of the sugar beet crop in the Netherlands
108
6 Epilogue
6.1 Introduction
The recent reform of the European Union’s Common Agricultural Policy (CAP) implied an
39.7% decrease in sugar beet price for growers (Zeddies, 2006) and cause a substantial
impact on farmers’ income. Therefore, the Dutch sugar industry and sugar beet research
initiated a project on the competitiveness of the sugar beet crop in the Netherlands. This
SUSY (Speeding Up Sugar Yield) project from 2006-2008 aimed at finding options to
increase sugar yield and to identify cost savings. Data gathered from type top (high yield)
growers were compared with data from neighbouring type average (average yield) growers.
The analysis revealed no difference of total variable costs (input levels) between the crops of
both grower types, while the type top growers had 2 t ha-1 higher sugar yields for all years of
the study, concluding that raising sugar yield is possible with identical input (Hanse et al.,
2010).
The analysis of differences in yield unexpectedly showed a 24% reduction of sugar yield by
pests and diseases, despite crop protection measures (Hanse et al., 2011a). Another
important, but rather elastic, factor turned out to be the temporal soil structure, explaining
24.9% of the variation in sugar yield. The saturated hydraulic conductivity of the subsoil was
below the damage threshold in 31% of the fields and the air-filled porosity in 30% of the
fields. The type top growers’ fields had a significant better temporal subsoil structure
compared to those of the type average grower (Hanse et al., 2011b). Finally, at harvest 3 t
ha-1 of sugar beets remained on the fields of both type top and type average growers with no
significant difference between both grower types for the total losses (Hanse and Tijink,
2010).
The respective results have been compiled in three articles (one published, one accepted,
one submitted).

6. Epilogue
109
This epilogue deals with the not yet published agronomical variables and the management
influence of the grower on those variables. Those agronomical factors concern fertilization
(chapter 6.2), sowing (chapter 6.3) and weed control (chapter 6.4) of the sugar beet crop.
The aim is to (1) differentiate between type top growers and type average growers and (2) to
analyse the potential influence of agronomical factors on the sugar yield.
6.2 Fertilization with main and trace elements
6.2.1 Materials and methods
The data were obtained within the project ‘Speeding Up Sugar Yield’ (SUSY) of the Dutch
Institute of Sugar Beet Research, IRS, Bergen op Zoom comparing pair-wise fields with
different yield capacity. In both 2006 and 2007, 26 pairs (52 growers) were available. In
2008, data of 23 ‘type top’ and 22 ‘type average’ growers were available. This was due to the
exclusion of 2 pairs from which the ‘type average’ sold the sugar quota and of 3 growers
which did not fully complete the questionnaire.
Each pair was formed by a field of a type top and a type average grower, based on the sugar
yields of 2000-2004. Farms of the growers within a pair were located closely together on the
same soil type (average distance between fields of a pair was 5.5 km, with a maximum 29.6
and minimum 0.19 km). Pairs were located throughout The Netherlands on both sandy (<5%
lutum) and clay soils (>5% lutum) in sugar beet producing regions.
A grower was considered to belong to the type top group when the sugar yields were on
average during 2000-2004 and in each single year consistently greater than the 75th
percentile of the sugar yields in the region the farm was situated. Likewise, a grower was
considered ‘type average’ when the sugar yields were consistently between the 25th and 75th
percentile of the sugar yields. Pairs of type top and type average farmers were formed based
on a difference in sugar yield of at least 1.5 tons ha-1 (5 years average). Regions were
defined as agricultural area’s with 4,000 – 10,000 ha of sugar beet production (6-10% of the

Improvement of the competitiveness of the sugar beet crop in the Netherlands
110
total sugar beet production area) on a comparable soil type. For each grower one field per
year was included in the study. For more details, see the material and methods section of the
publication on costs and yields in chapter 2 for more details (Hanse et al., 2010).
Data on fertilizer application were recorded by the growers. At maximum expansion of leaf
canopy (BBCH 46), all leaves of 5 randomly chosen successive plants were sampled in four
replicates. Leaves were washed, air dried and analysed for mineral content. At harvest, 20
sugar beets were randomly collected from the clamp and washed, air dried and analysed for
mineral content. Both, leaf and root content of Na, K, Mg, Ca, P, Mn, Zn, Fe, Cu, B was
determined in dry matter using Inductively Coupled Plasma Atomic Emission Spectroscopy
(ICP-AES) and of Co, Mo using Inductively Coupled Plasma Mass Spectrometry (ICP-MS).
Soils were sampled in February-March and early June and analysed for mineral availability
with CaCl2-extraction and near infrared spectroscopy (NIRS). The leaf, root and soil content
data is only available for 2006 and 2007 and based on 104 fields, in total. All chemical
analyses for leaf, root and soil content of main and trace elements were done at Blgg
AgroXpertus (Oosterbeek, The Netherlands). The sugar beet quality components, sugar
content, Na, K and amino-N in roots were analysed in the sugar factory’s tare house,
according to the standardized method in the Netherlands (De Bruin et al., 2006).
Non normal distributed data (Soil N February-March, Available N April, Soil N June, Soil K2O
February-March and soil K2O and leaf Ca, Co, Fe, Mg, Mn, S, Zn and dry matter content and
root Ca, Co, Fe, Mg, Mn, S and N-total) were ln(x+1) or ln(x+280) (Mineralised N)
transformed in order to obtain normalised variables. Presented means and estimated
constants are all back transformed.
Data were analysed using the statistical package GenStat, 12th edition (VSN International
Ltd.). Linear mixed models were used to analyse the effect of year, grower, site and their
interactions in the fixed model. The given pair number, region and their interaction were used
as random terms to analyse the type top and type average growers’ effect within a pair
directly with each other (Thissen, 2009).
Linear regressions were calculated to estimate the effect of single variables on sugar yield.

6. Epilogue
111
6.2.2 Results
Both type top and type average growers applied the same amount of B, K2O, MgO, Na2O, N,
P2O5 and SO3 to sugar beet (Table 6.1). The only significant difference was found for Mn,
however the type top growers applied only 0.05 kg Mn ha-1 more. Linear regression showed
that none of the elements applied had a significant effect on sugar yield, except for K2O.
However, the slope equals zero and the coefficient of correlation (R2) was very low. Applied
K2O had no influence on root yield and sugar content, too and was thus estimated as non-
relevant (data not shown).
Table 6.1 Application of elements from mineral and organic fertilizer by type top and type average growers and effect on sugar yield, linear regression (y = ax + b). SUSY-project, the Netherlands, 2006-2008.
Element Grower type Effect on sugar yield
Average Top Significancea
a R2 Significance
a
B (kg ha-1
)b
0.24 0.26 n.s. -0.28 0.00 n.s.
K2O (kg ha-1
) 177 166 n.s. 0.00 0.03 *
MgO (kg ha-1
)
30 42 n.s. -0.10 0.00 n.s.
Mn (kg ha-1
) 0.02 0.07 * 1.72 0.00 n.s.
Na2O (kg ha-1
)c 20 24 n.s. -0.14 0.02 n.s.
N (kg ha-1
) 128 123 n.s. -0.26 0.01 n.s.
P2O5 (kg ha-1
)d
51 36 n.s. 0.00 0.02 n.s.
SO3 (kg ha-1
) 20 24 n.s. -0.16 0.02 n.s. a. n.s. = not significant; * = significant at p ≤ 0.05.
b. significant soil type effect (p ≤ 0.05; clay 0.10 and sand 0.39 kg ha-1
). c. significant soil type effect (p ≤ 0.01; clay 3.5 and sand 118.1 kg ha
-1).
d. significant soil type effect (p ≤ 0.01; clay 22.2 and sand 81.4 kg ha-1
).
Table 6.2 Soil N and K2O contents in February-March and June (0-60 cm) on fields of type top and type average growers. SUSY-project, the Netherlands, 2006-2007.
Grower type Significancea
average top
Mineral N February-March (kg ha-1
) 36 36 n.s.
Available N April (kg ha-1
)b
176 192 n.s.
Mineral N June (kg ha-1
) 180 174 n.s.
Mineralised N (kg ha-1
)c
12 -18 n.s.
K2O February-March (kg ha-1
) 207 235 n.s.
Available K2O April (kg ha-1
)b
440 445 n.s.
K2O June (kg ha-1
) 243 270 n.s.
a. n.s. = not significant.
b. Applied (see Table 6.1.1) plus mineral N respectively K2O February-March. c. Mineral N in June minus Available N April.

Improvement of the competitiveness of the sugar beet crop in the Netherlands
112
There were no differences between the fields of both grower types for crop available N and
K2O at all sampling dates (Table 6.2) and none of the variables had influence on linear
regression, too (data not shown).
At the end of August, the crops of type top growers had taken up significant more Mg and Zn,
and less Fe in the leaves compared to the type average growers (Table 6.3). Although the
dry matter content of the leaves was the same for both grower types. For all growers
participating, leaf dry matter yield varied between 2.0 and 8.0 t ha-1, with an average of 4.9 t
ha-1 and were significantly higher for type top growers. Linear regression showed a
significant effect of leaf dry matter yield, Ca, K, Mg and Mn content on sugar yield. However,
only the leaf K content had a positive slope and thus a positive effect on sugar yield.
Only the root Ca content at harvest was significantly lower in the crops of type top growers
compared to type average growers (Table 6.4). Contents of all other elements were on
similar levels in the crops of both grower types. The root dry matter content did not differ
between both grower types. However, due to the higher root yield of the type top growers’
crop, the root dry matter yield was significantly higher, too. Zn, Na and Mn were the only
elements in the root having a significant effect on sugar yield, although the coefficients of
correlation were very low.
The amino-N content in freshly harvested sugar beet was closely positive related to the total-
N content in the sugar beets (figure 6.1). The average root yield (including tops, excluding
harvest losses) for the crops of all fields was 76.7 t ha-1 causing a nitrogen removal of 110 kg
N ha-1 (Table 6.5). The leaves (on average 42.5 t ha-1) removed 118 kg N ha-1. Due to the
same total N and dry matter content in both leaves and roots (Tables 6.3 and 6.4) the crops
of the type top growers had a removal of 129 and 123 kg N ha-1 and the crops of the type
average growers 108 and 98 kg N ha-1, respectively for leaves and roots.

6. Epilogue
113
Table 6.3 Content of mineral elements in dry matter of sugar beet leaves harvested at maximum expansion of leaf canopy (end of August; BBCH 46) on fields of type top and type average growers. SUSY-project, the Netherlands, 2006-2007.
Element Mean Grower type Effect on sugar yield
(max – min) Average Top Significancea a R
2 Significance
a
B (mg kg-1
) 38.3 (61 – 24)
37.3 38.7 n.s. 0.01 0.00 n.s.
Ca (g kg-1
) 11.2 (19 – 5)
11.2 10.7 n.s. -2.06 0.05 *
Co (μg kg-1
) 100.1 (584 – 42)
99.4 91.4 n.s. -0.36 0.01 n.s.
Cu (mg kg-1
) 7.6 (13 – 4)
7.89 7.76 n.s. -0.04 0.00 n.s.
Fe (mg kg-1
) 237.1 (1173 – 82)
235 198 ** 0.13 0.00 n.s.
K (g kg-1
) 42.0 (61 – 23)
41.4 42.3 n.s. 0.05 0.04 *
Mg (g kg-1
) 4.7 (11 – 1)
4.84
5.25 * -1.71 0.07 **
Mn (mg kg-1
) 48.5 (365 – 12)
53.8 58.8 n.s. -0.97 0.12 ***
Mo (mg kg-1
) 1.0 (2.5 – 0.3)
0.97 0.97 n.s. 0.67 0.02 n.s.
Na (g kg-1
) 17.1 (31 – 6)
16.3 18.1 n.s. -0.02 0.00 n.s.
N-total (g kg-1
) 24.2 (35 – 15)
24.4 25.0 n.s. -0.10 0.04 n.s.
P (g kg-1
) 2.7 (5 – 1)
2.77 2.78 n.s. 0.14 0.00 n.s.
S (g kg-1
) 2.8 (5 – 2)
2.72 2.81 n.s. 0.23 0.00 n.s.
Zn (mg kg-1
) 52.5 (308 – 18)
58.9 69.3 * -0.49 0.04 n.s.
Dry matter (%) 11.8 (20.9 – 9.4)
11.7 11.7 n.s. -2.30 0.02 n.s.
Dry matter (t ha
-1)
4.9 (8.0 – 2.0)
4.5 5.2 *** 0.97 0.33 ***
a. n.s. = not significant; *,**,*** = significant at p ≤ 0.05, ≤ 0.01, ≤ 0.001.

Improvement of the competitiveness of the sugar beet crop in the Netherlands
114
Table 6.4 Content of mineral elements in dry matter of sugar beet roots at harvest on fields of type top and type average growers. SUSY-project, the Netherlands, 2006-2007.
Element Mean Grower type Effect on sugar yield
(max – min) Avera
ge Top Significance
a a R
2 Significance
a
B (mg kg-1
) 10.2 (14 – 7)
10.2 10.0 n.s. 0.16 0.01 n.s.
Ca (g kg-1
) 1.8 (5 – 1)
1.7 1.6 * -0.24 0.00 n.s.
Co (μg kg-1
) 82.4 (460 – 38)
73.6 75.2 n.s. 0.29 0.01 n.s.
Cu (mg kg-1
) 3.3 (5 – 1)
3.3 3.2 n.s. 0.02 0.00 n.s.
Fe (mg kg-1
) 218.9 (1844 – 41)
173.2 189.6 n.s. 0.39 0.03 n.s.
K (g kg-1
) 7.6 (12 – 5)
7.5 7.6 n.s. 0.09 0.00 n.s.
Mg (g kg-1
) 1.2 (2 – 0.8)
1.2 1.2 n.s. -3.88 0.03 n.s.
Mn (mg kg-1
) 23.7 (169 – 7)
25.3 25.8 n.s. -1.13 0.08 **
Mo (mg kg-1
) 0.2 (1.6 – 0.2)
0.2 0.2 n.s. -0.01 0.00 n.s.
N total (g kg-1
) 5.8 (10 – 4)
5.8 6.0 n.s. -1.07 0.01 n.s.
Na (g kg-1
) 0.5 (1.4 – 0.1)
0.5 0.5 n.s. -2.33 0.08 **
P (g kg-1
) 1.2 (1.9 – 0.8)
1.2 1.2 n.s. 0.19 0.00 n.s.
S (g kg-1
) 0.4 (0.6 – 0.2)
0.4 0.4 n.s. -2.07 0.00 n.s.
Zn (mg kg-1
) 21.6 (80 – 8)
24.0 26.3 n.s. -0.73 0.04 *
Dry matter (%) 24.4 (28.5 – 19.4)
24.1 24.4 n.s. 0.26 0.04 *
Dry matter (t ha-1
)b
18.7 (25.6 – 9.6)
16.7 20.2 *** 0.61 0.90 ***
a. n.s. = not significant; *,**,*** = significant at p ≤ 0.05, ≤ 0.01, ≤ 0.001. b. Net root yield including top, excluding harvest losses.

6. Epilogue
115
Table 6.5 Leaf and root fresh weight and N-removal on fields of type top and type average growers. SUSY-project, the Netherlands, 2006-2007.
Mean Grower type Significancea
Average Top
Fresh leaf weight (t ha-1
) 42.5 38.5 45.0 ***
N-removal with leaf (kg ha-1
) 118 108 129 ***
Fresh root weight (t ha-1
)b 76.7 69.1 82.8 ***
N-removal root (kg ha-1
) 110 98 123 ***
a. *** = significant at p ≤ 0.001. b. Net root yield including top, excluding harvest losses.
Figure 6.1 Relation of amino-N to total N in the dry matter of freshly harvested sugar beet roots. *** = significant at p ≤ 0.001. Data SUSY-project, The Netherlands, 2006-2007.
6.2.3 Discussion
Only a few significant effects were found for the mineral content of leaves and roots. The
negative effect of leaf Mg and Mn and root Mn and Zn content can be explained by higher
levels in leaves and roots on sandy soils. Although the soil effect was not significant for each
element, the levels were respectively 1.7x, 2.7x, 1.5x and 3.1x higher on sandy soils. The
sandy soils had lower yield levels compared to clay soils (Hanse et al., 2010) so that the

Improvement of the competitiveness of the sugar beet crop in the Netherlands
116
effect can be physiologically explained by concentration. Na is one of the elements
determining the technical quality of sugar beet roots, explaining the negative effect of root Na
content on white sugar yield, while Na interferes with the extractability of sugar from the
molasses (Huijbregts, 1999).
Fertilization of sugar beets did not differ between the type top and type average growers in
this project. No substantial effects of applied elements on sugar yield were found, since all
were already in the optimal range for a high sugar yield (Wilting, 2010), i.e. fertilization did
not restrict sugar yield. A likely explanation is the strict legal regulation on fertilisation in the
Netherlands (Meststoffenwet, 2006; Meststoffenwet, 2009). This regulation causes a lot of
farmers’ attention for fertilisation (Ham et al., 2007). There is no need to change factors
already optimised to increase yields. In order to increase yields, farmers’ attention should go
to the factors restricting yield, like pests and diseases (Hanse et al., 2011a), soil structure
(Hanse et al., 2011b), harvest losses (Hanse and Tijink, 2010), sowing quality (chapter 6.3)
and weed control (section 6.4).
Average root yield in the Netherlands increased from 57 t ha-1 in 2001 to 72 t ha-1 in 2008
and 79 t ha-1 in 2009, with sugar yields respectively 9.1, 12.3 and 14.0 t ha-1 (Van Swaaij,
2007; IRS, 2010). With the above mentioned growers’ attention for fertilisation, growers
express often their concern that due to recent years’ yield increase, the nitrogen supply
becomes limiting. Based on data from the SUSY project, the amino-N content in sugar beet
roots was found a predictor of the removal of total-N from the fields (R2 = 0.66). In 2001,
2008 and 2009, respectively, amino-N content decreased from 15.1 mmol kg-1 to 11.3 and
11.1 mmol kg-1(IRS, 2010), implying a removal of 95, 98 and 106 kg N ha-1 with sugar beet
roots. Due to the increased quality of the sugar beet during the years as a result of breeding
efforts (Loel et al., 2010) the N demand stays on similar levels. There is a clear link between
sugar beet yield level and sustainable production (Koeijer et al., 2002; Tzilivakis et al., 2005;
Fuchs and Stockfisch, 2009). The data from the SUSY project is in line with the findings of
those authors and show that breeding efforts for improved quality are not only profitable but
also sustainable.

6. Epilogue
117
6.3 Sugar beet sowing
6.3.1 Materials and methods
Sowing and harvest date were taken from the registration of the growers joining the SUSY-
project (see section 6.3.1). Canopy closure date was determined by the staff of the
agricultural department of the sugar industry by visiting the fields 5 to 6 times in the period
from May to June. Directly after sowing, sowing depth and seed placement in compressed
(below the loose seedbed) and in humid (not dried by the weather) soil was recorded from 10
randomly chosen sites on each field. On each field four plots were randomly chosen, not
disturbed by other measurements, 15 m long and 6, 12 or 18 rows wide, depending on the
width of the sowing machine. During two months after sowing, plots were visited 4 times.
Plants were counted after emergence in 2-4 leaf stage. At the fourth visit the drilling distance
was recorded by measuring the cumulative distance from plant to plant on 4 times 10 m in
the plots. From the data obtained, the average sowing distance and missing plants and field
emergence rate were calculated. For comparison purposes data on sowing depth and
distance were recorded by the growers. In 2006-2007, data of 104 fields were obtained. Non
normal distributed data (missing seeds, seed in compressed soil, seed in humid soil and
plant density) were ln(x+1) transformed in order to obtain normalised variables. Presented
means and estimated constants were all back transformed. Data were analysed using the
statistical package GenStat, 12th edition (VSN International Ltd.). Linear mixed models were
used to analyse the effect of year, grower, site and their interactions in the fixed model. The
given pair number, region and their interaction were used as random terms to analyse the
type top and type average growers effect within a pair directly with each other (Thissen,
2009).
Linear regressions were calculated to estimate the effect of single variables on sugar yield.
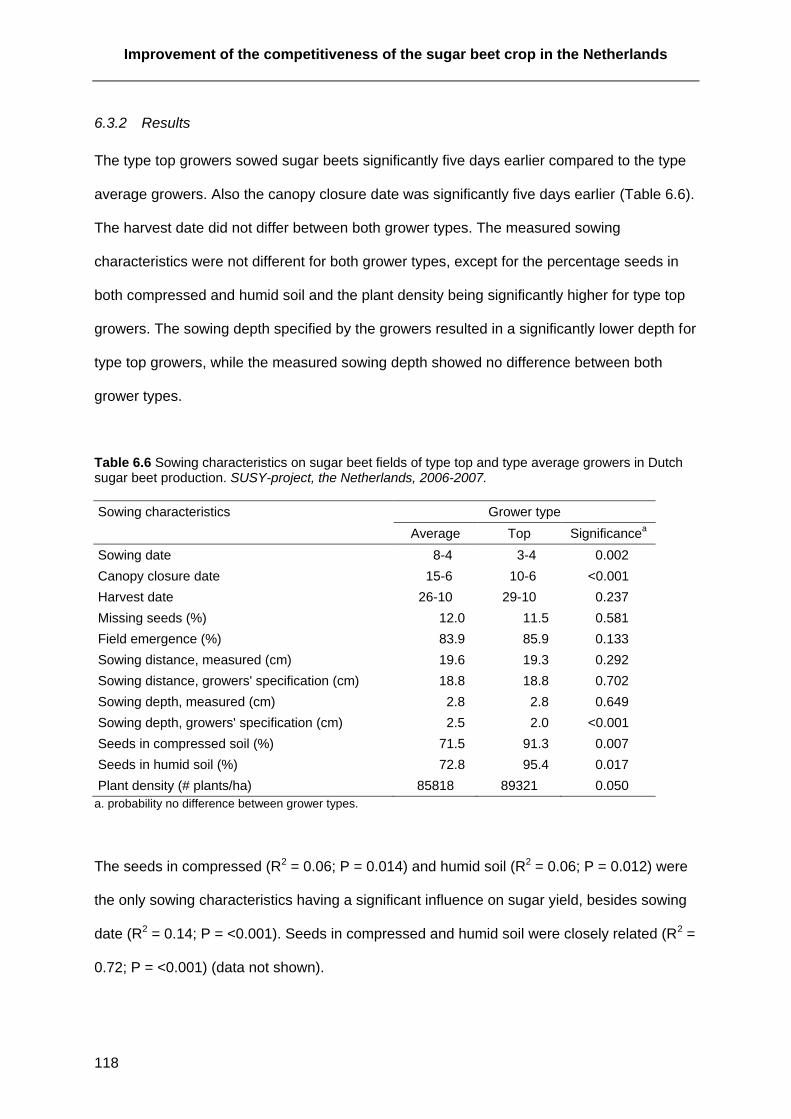
Improvement of the competitiveness of the sugar beet crop in the Netherlands
118
6.3.2 Results
The type top growers sowed sugar beets significantly five days earlier compared to the type
average growers. Also the canopy closure date was significantly five days earlier (Table 6.6).
The harvest date did not differ between both grower types. The measured sowing
characteristics were not different for both grower types, except for the percentage seeds in
both compressed and humid soil and the plant density being significantly higher for type top
growers. The sowing depth specified by the growers resulted in a significantly lower depth for
type top growers, while the measured sowing depth showed no difference between both
grower types.
Table 6.6 Sowing characteristics on sugar beet fields of type top and type average growers in Dutch sugar beet production. SUSY-project, the Netherlands, 2006-2007.
Sowing characteristics Grower type
Average Top Significancea
Sowing date 8-4 3-4 0.002
Canopy closure date 15-6 10-6 <0.001
Harvest date 26-10 29-10 0.237
Missing seeds (%) 12.0 11.5 0.581
Field emergence (%) 83.9 85.9 0.133
Sowing distance, measured (cm) 19.6 19.3 0.292
Sowing distance, growers' specification (cm) 18.8 18.8 0.702
Sowing depth, measured (cm) 2.8 2.8 0.649
Sowing depth, growers' specification (cm) 2.5 2.0 <0.001
Seeds in compressed soil (%) 71.5 91.3 0.007
Seeds in humid soil (%) 72.8 95.4 0.017
Plant density (# plants/ha) 85818 89321 0.050
a. probability no difference between grower types.
The seeds in compressed (R2 = 0.06; P = 0.014) and humid soil (R2 = 0.06; P = 0.012) were
the only sowing characteristics having a significant influence on sugar yield, besides sowing
date (R2 = 0.14; P = <0.001). Seeds in compressed and humid soil were closely related (R2 =
0.72; P = <0.001) (data not shown).

6. Epilogue
119
6.3.3 Discussion
An optimal plant density is important for affecting sugar beet yield and quality. A population
density exceeding 70,000 plant ha-1 is required to obtain high sugar yields (Märländer, 1990;
Van Swaaij, 2008). Both type top and type average growers had (on average) plant densities
above 70,000 plants ha-1. On only 3 fields (out of 104; 1 top and 2 average) plant density was
below 70,000 plants ha-1, but higher as 57,000 plants ha-1. However, the crops of the type top
growers had significant more plants per hectare compared to those of the type average
growers. The above mentioned data are final plant densities and those figures do not reflect
differences in emergence, which were observed more often and more severe at fields of type
average growers. A delay in emergence has an influence on sugar yield, since the delayed
plants accumulate less dry matter, due to increased intraspecific competition for light caused
by shading of the earlier emerged plants (Stibbe and Märländer, 2002). The delay in
emergence on type average growers’ fields can be explained by sowing quality and sowing
date. In this project, sowing quality comes to seed placement in compressed (below the
loose seedbed) and in humid (not dried by the weather) soil, which are closely related. The
type top growers place significantly more seeds in humid soil, providing more optimal
circumstances for the seeds to germinate and being less dependent on rainfall after sowing.
The earlier sowing date of the type top grower also facilitates sowing of the seeds in humid
soil. Quality of sowing was recorded independent of sowing machines’ maintenance status,
which can have an high impact on sowing performance (Wilting, 2008). Here, the grower’s
management is of major importance, he has to check the seed placement in the soil during
sowing, even when a proper maintained sowing machine is used. However, the seedbed
quality should allow for seed placement in the humid soil. Here, too, the growers’
management in preparing the seedbed plays an important role. So, the very best results will
still be obtained when the sowing machine is properly maintained, the seedbed is of high
quality and the grower checks whether the seeds are placed below the loose seedbed in the
humid soil.

Improvement of the competitiveness of the sugar beet crop in the Netherlands
120
Type top growers sowed their sugar beets significantly five days earlier. Earlier sowing does
not influence the development rate until establishment (Stibbe and Märländer, 2002), but it
explains the significant earlier canopy closure (five days) on the type top growers’ fields. The
advantage of earlier sowing of the type top growers’ crop is an earlier closure of canopy,
followed by a significant increase, not only of the radiation interception, but of the yield, too
(Werker and Jaggard, 1998; Kenter et al., 2006). Next to that, earlier sowing can lead to a
partial escape from pathogens (Webb et al., 2000; Asher and Hanson, 2006; Stevens et al.,
2006; Hanse et al., 2011a).
The harvest date was not different for both grower types, consequently, the gain has to be
set at seasons’ start.

6. Epilogue
121
6.4 Weed control
6.4.1 Materials and methods
Data on weed control, herbicide, active ingredient and amounts used, applications and
application date were taken from the SUSY-growers’ registration (see section 6.2.1).
During the season, after canopy closure (June) and before harvest (September) the result of
weed control efforts were evaluated by a scale 1 to 10 (1 = very poor; 10 = excellent weed
control) on 50 randomly chosen sites of the field. Also the amount of bolters and weed beet
was recorded on 50 sites of 400 m2 each, randomly chosen on the field. For small fields (< 3
ha) total number of bolters and weed beet were counted on field level. In total, data of 104
fields were available for analysis in 2006 and 2007.
All data were non-normal and ln (x+1) transformed in order to obtain normalised variables,
except for total pre-sowing and pre-emergence applications (ln (x+24) transformed) and the
fifth post-emergence application, total applications and total post-emergence applications,
which were proved to be normally distributed. The result of weed control in September was
arcsin (x/10) transformed in order to obtain a normal distribution. Presented means and
estimated constants are all back transformed. Data were analysed using the statistical
package GenStat, 12th edition (VSN International Ltd.). Linear mixed models were used to
analyse the effect of year, grower, site and their interactions in the fixed model. The given
pair number, region and their interaction were used as random terms to analyse the ‘type top’
and ‘type average’ within a pair directly with each other (Thissen, 2009). Linear regressions
were calculated to estimate the effect of single variables on weed control in September and
sugar yield.

Improvement of the competitiveness of the sugar beet crop in the Netherlands
122
6.4.2 Results
Data of weed control efforts did not differ between type top and type average growers' crops
(Table 6.7). The total dosage of herbicides and number of herbicide sprayings was
comparable for both grower types. The same holds for the application time in days after
sowing of the first six applications, except for the pre-sowing and pre-emergence
applications, were the type top growers apply one day significantly earlier before sowing.
This variable contained the herbicide applications before sowing (glyphosate) and the
application of soil active herbicides after sowing, before emergence of the sugar beets, like
metamitron, clomazone and chloridazone (only on clay soils). The applications before sowing
can be conducted before or after seedbed preparation (clay soils) or before the main soil
tillage (sandy soils). The pre-sowing and pre-emergence applications were taken together
because both variables separately resulted in two, too small data sets for a reliable statistical
analysis.
Linear regression showed only for the pre-sowing and pre-emergence application a
significant effect on the result of weed control (September), with a R2 of 0.14, while all other
parameters did not show a significant effect (Table 6.7). The amounts of none of the used
active ingredients could explain the variation in the result of weed control in June and
September for more than 10% calculated by linear regression (data not shown).
When the efforts in weed control were financially weighted the costs of herbicides, herbicide
application, manual and mechanical weed control were not different between both grower
types, too. However the result of the weed control differed after canopy closure (June) and
before harvest (September), being significantly better for the type top growers (Table 6.7).

6. Epilogue
123
Table 6.7 Difference between type top and type average growers for herbicide applications and their effect on the result of weed control in September. Data SUSY-project, the Netherlands, 2006-2007.
a. n.s. = not significant; *,*** = significant at p ≤ 0.05, ≤ 0.001.
Weed control Grower type Effect weed control (September)
Average Top Significancea
R2 Significancea
Costs
Herbicide (€ ha-1
) 201 190 n.s. 0.02 n.s.
Application (€ ha-1
) 92 98 n.s. 0.01 n.s.
Manual weed control (€ ha-1
) 44 55 n.s. 0.03 n.s.
Mechanical weed control (€ ha-1
) 19 18 n.s. 0.05 *
Herbicide application interval
Post-sowing 9 9 n.s. 0.00 n.s.
Post-emergence 10 10 n.s. 0.00 n.s.
Herbicide applications (days after sowing)
Total pre-sowing and pre-emergence -4 -5 * 0.14 *
First post-emergence 19 18 n.s. 0.00 n.s.
Second post-emergence 29 27 n.s. 0.00 n.s.
Third post-emergence 38 35 n.s. 0.00 n.s.
Fourth post-emergence 47 45 n.s. 0.00 n.s.
fifth post-emergence 56 53 n.s. 0.00 n.s.
Sixth post-emergence 59 64 n.s. 0.01 n.s.
Total applications (#) 5 5 n.s. 0.01 n.s.
Total pre-emergence applications (#) 0.3 0.4 n.s. 0.02 n.s.
Total post-emergence applications (#) 4 4 n.s. 0.02 n.s.
Active ingredients herbicides (kg ha-1
) 4.2 4.0 n.s. 0.00 n.s.
Results
Bolters and weed beet June (# ha-1
) 21.1 4.5 n.s. - -
Bolters and weed beet September (# ha-1
) 4.2 3.2 n.s. - -
Result weed control June (0 = very poor; 10 = excellent)
7.7 8.5 *** - -
Result weed control September (0 = very poor; 10 = excellent)
8.3 9.4 *** - -
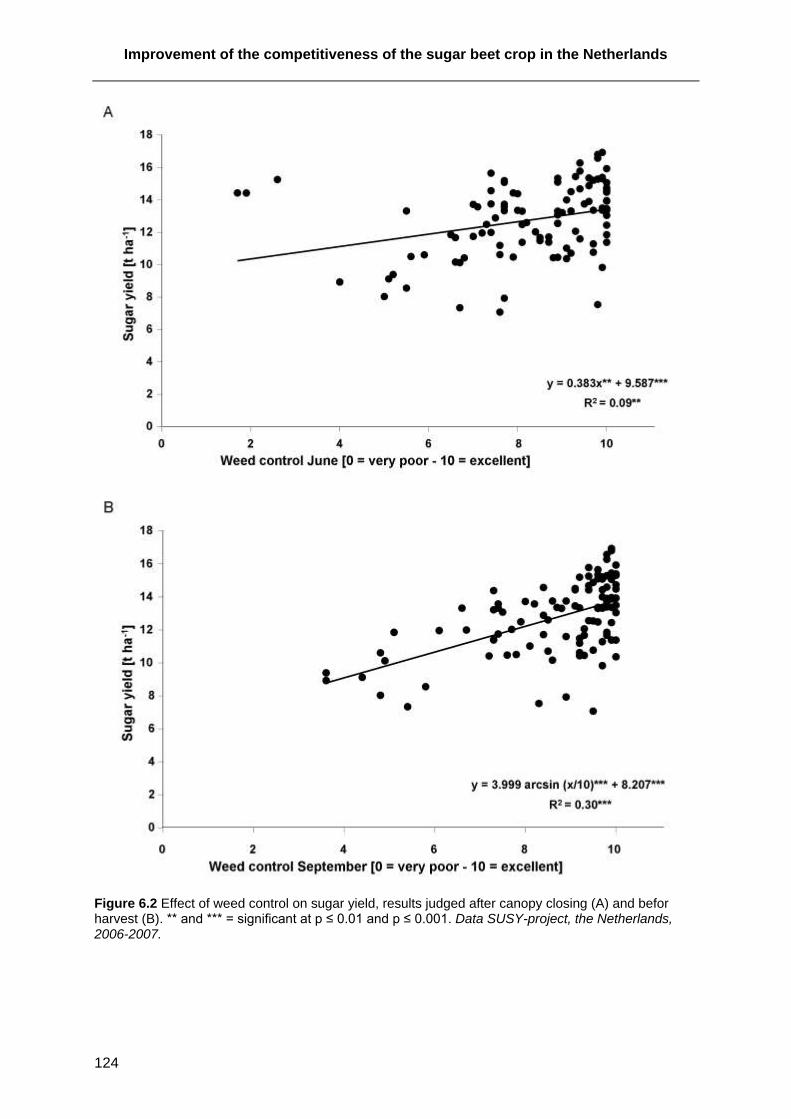
Improvement of the competitiveness of the sugar beet crop in the Netherlands
124
Figure 6.2 Effect of weed control on sugar yield, results judged after canopy closing (A) and befor harvest (B). ** and *** = significant at p ≤ 0.01 and p ≤ 0.001. Data SUSY-project, the Netherlands, 2006-2007.

6. Epilogue
125
The result of the weed control both after canopy closure and before harvest had a significant
effect on sugar yield and explained 9% and 30% of the variation, respectively (figure 6.2).
Applied total dosages of triallate, clomazone, clopyralid, desmedipham, S-metolachlor,
ethofumesate, phenmedipham, dimethenamide-P, metamitron, chloridazone, triflusulfuron-
methyl, and graminicides did not differ for type top and type average growers. Except for a
small negative effect of clopyralid (R2 = 0.016; P = 0.016), none of the active ingredients had
an effect on sugar yield calculated by linear regression (data not shown).
According to the growers’ registrations, many of the applications by growers were at normal
dates with normal dosages, except for 6 growers (5 type average on clay and 1 type top on
sand soil) which used a very high dosage in an early stage after drilling and 3 growers which
used a rather soft dosage. In total, 3 applications had a non-usual composition (metamitron
and S-metolachlor mixture).
6.4.3 Discussion
The weed control measurements in the sugar beet crops recorded in the SUSY-project are
another clear example of growers’ management influence. The costs of weed control are
comparable between type top and type average growers (Hanse et al., 2010). Next, all the
recorded inputs, like number of applications, type and amount of compounds used and
interval of applications are similar for both type top and type average growers, except the
pre-sowing and pre-emergence applications. Being the only variable significantly different
between both grower types, the pre-sowing and pre-emergence applications also have a
significant effect on result of the weed control efforts. Early in the season the difference in
weed control between type top and type average is made.
By linear regression 30% of the variation in sugar yield was explained by the result of the
weed control in September, this is despite the weed control efforts. Without weed control,
yield losses in sugar beet due to competition with simultaneously emerging weeds can be
66% to more than 80% (Jursik et al., 2008; Kemp et al., 2009). However, in the fields of the

Improvement of the competitiveness of the sugar beet crop in the Netherlands
126
SUSY-project the amount of weeds in September do not only reflect the quality of the weed
control. There is an effect of gappy stand and retarded growth due to pests and diseases,
causing less competition of the sugar beet crop towards weeds (Hanse et al., 2011a). In
those crops, weeds have more chances to develop later in the season. Despite the crop
protection measures, the yield loss due to weed competition in arable farming was estimated
3% for Europe (Oerke and Dehne, 2004). Leaving out the estimated yield loss due to pests
and diseases of sugar beet in the SUSY-project (24%) the yield loss due to weed competition
is roughly about 6%.
For sugar beet, herbicide tolerant-varieties have been developed. With the use of these
varieties growers could save on the costs of weed control, depending on the assumed
technology fee and the costs of the conventional weed control (May, 2003; Märländer, 2005).
Aside from a, theoretical, costs benefit, the use of those varieties facilitate the weed control,
although it still requires management (Kemp et al., 2009). With the above described
importance of growers’ management and the influence of pests and diseases on the late
emergence of weeds, the challenge remains whether to control weeds successfully and to
avoid weed competition after canopy closure.

6. Epilogue
127
6.5 References
Asher, M.J.C., Hanson, L.E., 2006. Fungal and Bacterial Diseases. In: Draycott, A.P., (Ed.)
Sugar Beet, Blackwell Publishing, Oxford, pp. 286-315.
De Bruin, J.M., Moens, C.J., Timmermans, A.P.G., Sikken, G.W., Huijbregts, A.W.M.,
Elands, L.J.W.A.M., 2006. Uniforme methode voor gewichtsbepaling, monstername
en monsteronderzoek van suikerbieten in Nederland. Nederlandse Suikerindustrie,
Bergen op Zoom.
Fuchs, J., Stockfisch, N., 2009. Development of efficiency in sugarbeet cultivation as
illustrated by N-fertilizer application. Zuckerindustrie 134, 33-41.
Ham, A. van de, Daatselaar, C.H.G., Doornewaard, G.J., Hoop, D.W.D., 2007. Eerste
ervaringen met het Gebruiksnormenstelsel. Studie in het kader van de Evaluatie
Meststoffenwet 2007. LEI, Den Haag, pp. 68 pp.
Hanse, A.C., Tijink, F.G.J., 2010. Harvesting losses ... How to yield this hidden financial
potential. In: Proceedings of the 72nd IIRB Congress, 22-24 June 2010, Copenhagen,
DK.
Hanse, B., Tijink, F.G.J., Mußhoff, O., Märländer, B., 2010. Comparison of costs and yields
of 'type top' and 'type average' growers in Dutch sugar beet growing. Sugar Industry
135, 550-560.
Hanse, B., Schneider, J.H.M., Termorshuizen, A.J., Varrelmann, M., 2011a. Pests and
diseases contribute to sugar beet yield difference between top and averagely
managed farms. Crop Protection 30, 671-678.
Hanse, B., Vermeulen, G.D., Tijink, F.G.J., Koch, H.J., Märländer, B., 2011b. Analysis of soil
characteristics, soil management and sugar yield on 'type top' and 'type average'
managed farms in sugar beet (Beta vulgaris L.) production in The Netherlands. Soil &
Tillage Research. in press.
Huijbregts, T., 1999. New Dutch sugar recovery formula for sugar beet. Zuckerindustrie 124,
698-701.

Improvement of the competitiveness of the sugar beet crop in the Netherlands
128
IRS, 2010. Bietenstatistiek. In: www.bietenstatistiek.nl, IRS, Bergen op Zoom.
Jursik, M., Holec, J., Soukup, J., Venclova, V., 2008. Competitive relationships between
sugar beet and weeds in dependence on time of weed control. Plant Soil and
Environment 54, 108-116.
Kemp, N.J., Taylor, E.C., Renner, K.A., 2009. Weed Management in Glyphosate- and
Glufosinate-Resistant Sugar Beet. Weed Technology 23, 416-424.
Kenter, C., Hoffmann, C.M., Märländer, B., 2006. Effects of weather variables on sugar beet
yield development (Beta vulgaris L.). European Journal of Agronomy 24, 62-69.
Koeijer, T.J.D., Wossink, G.A.A., Struik, P.C., Renkema, J.A., 2002. Measuring agricultural
sustainability in terms of efficiency: the case of Dutch sugar beet growers. Journal of
Environmental Management 66, 9-17.
Loel, J., Kenter, C., Hoffmann, C., 2010. Analysis of breeding progress of sugarbeet.
Zuckerindustrie, Sonderheft Zuckerrübentagung 2010, 135, 53-62.
Märländer, B., 1990. Influence of Plant-Density on Yield and Quality and Possible Causes of
Competition in Sugar-Beet Crops. Journal of Agronomy and Crop Science-Zeitschrift
Fur Acker Und Pflanzenbau 164, 120-130.
Märländer, B., 2005. Weed control in sugar beet using genetically modified herbicide-tolerant
varieties - A review of the economics for cultivation in Europe. Journal of Agronomy
and Crop Science 191, 64-74.
May, M.J., 2003. Economic consequences for UK farmers of growing GM herbicide tolerant
sugar beet. Annals of Applied Biology 142, 41-48.
Meststoffenwet, 2006. Meststoffenwet 1 januari 2006. Staatsblad van het Koninkrijk der
Nederlanden. 64, 1-30.
Meststoffenwet, 2009. Wet van 26 november 2009 tot wijziging van de Meststoffenwet.
Staatsblad van het Koninkrijk der Nederlanden. 551, 1-4.
Oerke, E.C., Dehne, H.W., 2004. Safeguarding production - losses in major crops and the
role of crop protection. Crop Protection 23, 275-285.
6. Epilogue
129
Stevens, M., Hsing-Yeh, L., Lemaire, O., 2006. Virus Diseases. In: Draycott, A.P., (Ed.)
Sugar Beet, Blackwell Publishing, Oxford, pp. 256-278.
Stibbe, C., Märländer, B., 2002. Field emergence dynamics significance to intraspecific
competition and growth efficiency in sugar beet (Beta vulgaris L.). European Journal
of Agronomy 17, 161-171.
Thissen, J.T.N.M., 2009. Mixed model suikerbieten (SUSY project). Personal
Communication.
Tzilivakis, J., Warner, D.J., May, M., Lewis, K.A., Jaggard, K., 2005. An assessment of the
energy inputs and greenhouse gas emissions in sugar beet (Beta vulgaris) production
in the UK. Agricultural Systems 85, 101-119.
Van Swaaij, A.C.P.M., 2007. Opbrengstprognose. In: Betatip, 7. IRS, Bergen op Zoom, The
Netherlands, pp. 11-13.
Van Swaaij, A.C.P.M., 2008. Zaaiafstand en standdichtheid. In: Betatip, 3. IRS, Bergen op
Zoom, The Netherlands, pp. 14-15.
Webb, C.R., Gilligan, C.A., Asher, M.J.C., 2000. Modelling the effect of temperature on the
development of Polymyxa betae. Plant Pathology 49, 600-607.
Werker, A.R., Jaggard, K.W., 1998. Dependence of sugar beet yield on light interception and
evapotranspiration. Agricultural and Forest Meteorology 89, 229-240.
Wilting, P., 2008. Zaaimachines. In: Betatip, 3. IRS, Bergen op Zoom, pp. 3-12.
Wilting, P., 2010. Bemesting. In: Betatip, 4. IRS, Bergen op Zoom, pp. 38 pp.
Zeddies, J., 2006. Die neue EU-Zuckermarktordnung - Beschlüsse, Auswirkungen und
Bewertung. Agrarwirtschaft 55, 97-99.

Improvement of the competitiveness of the sugar beet crop in the Netherlands
130

Improvement of the competitiveness of the sugar beet crop in the Netherlands
131
7 Outlook

Improvement of the competitiveness of the sugar beet crop in the Netherlands
132
7 Outlook
Growing a crop is managing components of variance. The soil and weather (environment),
agronomical and phytopathological aspects, and product prices, all add a part to the total
variance of yield formation during the growing season. How well this variance can be
managed, determines, within the crops’ physiological limits, the obtained yield level. Before
the start of a growing season, yield can be expected on certain levels, but no one can predict
those with high accuracy. Even the best guess growers can make, is taking the average yield
of the last few years.
The weather, although a given fact during the season, has a high influence on yield level.
This often results in the significant effect of ‘year’ in studies on yield levels and agronomy. It
is not possible to manage the weather. However the effects of the weather can be managed,
since part of the weathers’ influence comes indirectly via phytopathological, agronomical,
and soil effects. Minimizing the effect of pests and diseases and optimizing soil and
agronomical measures are the ways growers can minimize the effect of the weather.
The backbone of the presented research was comparing growers with a top yield and an
average yield history, cultivating sugar beet under the same environmental conditions. The
yield difference continued during the project. Surprisingly, the yield difference was not
caused by economic constraints: both the type top and type average growers had
comparable total variable costs. This very important finding implies that sugar beet
production in a given environment or region has similar costs, independent of sugar yield.
Furthermore, raising sugar yield is possible at the current cost level. Apparently, not the
costs themselves influence sugar yield, but the details how and when measures are
conducted make the difference. For a grower producing higher yield at the same cost level,
more profit is made.
In contrast to costs, several factors were identified, which had an influence on yield level.
When having identified the yield limiting factor(s) of a field, there might be an additional
investment to elevate this factor. Growers better focus on these factors rather than on the
7. Outlook
133
level of costs. On the other hand, saving costs might be possible for cultivation factors being
already optimized concerning yield level.
This study shows the importance of soil conditions, phytopathological and agronomical
effects raising yield by a better cultivation management. The type top growers had a better
soil structure, lower infestation of pathogens, and a better performance in agronomical
measures differing among soil types, and individual fields thus having an unique fingerprint in
their management.
Climate is predicted to change in North-West Europe. In sugar beet it can have a profitable
effect on yield by increasing average temperature and CO2 partial pressure. However, this
effect depends on how the other sources of variance are managed. Higher temperatures
might also cause an increased pressure of pests and diseases, and more periods with
excessive rainfall demanding a better management of soil structure.
The climate change is pushing societies towards sustainable plant production of the whole
crop rotation for which sugar beet is important in terms of economy. This PhD-thesis proves
that for sugar beet the yield level is independent from the total variable costs of growing the
crop. Therefore, the demand for economic sustainability can be met by raising yield and
optimizing costs. If ecological factors are expressed per unit of product, raising yield can
have a positive effect on environmental sustainability, too.
The profit is the difference of the total variable and fixed costs, and the revenues being the
product of yield and product prices. In case of constant costs, a high yield is extremely
important, to compensate low product prices in order to maximise the profit. Compared to
many other crops, prices of sugar beet in the European Union are rather stable as a result of
the sugar regime. For a grower, this causes less variance of profit, which is the highest at
high yield level. At present it is unknown, whether the current European Union (EU) sugar
regime will continue or change. In case the EU will opt for a free market, product prices will
become highly volatile, urging much more than today for constant high yield level in each
year.

Improvement of the competitiveness of the sugar beet crop in the Netherlands
134
In science, it is often thought that results without significant differences are not worth to
publish. However, it is the interpretation of results which should be the basis of the decision
to publish or not. The very important finding of this research project is that total variance
costs are not significantly different between type top and type average growers demonstrates
the impact of such "minor" findings. From it, the interpretation is that in sugar beet growers’
management has to maximise yield. Therefore, a basis is needed to make the right
decisions. Research should provide knowledge on how the quality of cultivation measures
could be improved and optimized. In order to increase yield, breeding progress can develop
specific solutions of integrated plant protection with the goal to minimize the use of
pesticides. The yield and quality increase caused by breeding progress provides the grower
additional tools to maximise yields in a sustainable way, too.
Finally, each field has its own history and thus its own set of yield reducing factors. The
grower has to keep an overview to all these factors. Quality and timing are often the main
growers’ management tools to set the difference between a high or an average yield.
Therefore, there is a future for the sugar beet: the grower can make it sweet by implementing
the latest knowledge from science, and managing yield restricting variables.

Improvement of the competitiveness of the sugar beet crop in the Netherlands
135
8 Summary

Improvement of the competitiveness of the sugar beet crop in the Netherlands
136
8 Summary
The Dutch sugar industry and sugar beet research institute initiated the project SUSY
(Speeding Up Sugar Yield) as a reaction to decreasing beet prices in relation to the reform of
the European Unions sugar regime. The project was aimed at softening the reform’s impact
on growers income by improving their knowledge on raising sugar yield and identifying
possible cost savings. From each sugar beet growing region in The Netherlands, 26 pairs of
‘type top’ (high yielding) and ‘type average’ (average yielding) farmers were selected, based
on the average yield of the farm in 2000-2004. All measures of sugar beet cultivation, costs
calculation and phytopathological, agronomical and soil characteristics were investigated
from 2006 and 2007 on 75 fields of ‘type top’ and 74 fields of ‘type average’ growers
in relation to yield and quality. The factors year and grower caused most of the significant
effects on yield, quality and cost variables. The ‘type top’ growers had significantly 20%
higher sugar yield in each year compared to ‘type average’ growers, but the total variable
costs did not differ. This makes the ‘type top’ growers more efficient in resource use. Costs
for manure and fertiliser, ‘other’ and irrigation significantly increased the total variable costs.
With higher fungicide costs, sugar yield significantly increased. However, there was no
significant relation between the intensity of sugar beet production and sugar yield so that the
observed differences in sugar yield were not caused by economical constraints. Based on
this study, it can be concluded that the most profitable strategy for the growers is maximising
sugar yield and optimising costs.
Heterodera schachtii and Beet necrotic yellow vein virus (BNYVV) were mainly found on clay
soils. Type top growers on clay soil had significantly lower infestation levels of H. schachtii
(4.4x lower, P = 0.008), BNYVV (2.7x lower, P = 0.016) and other foliar symptoms
(Pseudomonas, Phoma betae and Verticillium spp. combined) (1.5x lower, P<0.001) than the
type average growers, respectively. On sandy soils, infestation levels of Meloidogyne spp. (P
= 0.016), Cercospora beticola (P = 0.005) and Erysiphe betae (P = 0.027) were significantly
lower (5x, 1.4x and 1.8x, respectively) for the type top growers. Type top growers on clay or

8. Summary
137
sand soils sowed 5 and 6 days earlier respectively, and made more fungicide applications
than the type average growers. Insect pests were not observed at levels damaging for sugar
yield: Insecticidal seed treatments provided sufficient control of insect pests. By multiple
regression, 35% of the variance in sugar yield on clay soils was explained by H. schachtii
and BNYVV infestation levels and by sowing date. On sandy soils, the infestation levels of H.
betae and Aphanomyces cochlioides, number of fungicide applications and sowing date
explained 71% of the variance in sugar yield.
Despite crop protection measures, the calculated yield losses due to pests and diseases
were for the type top growers 30.2 and 13.1% and for type average growers 37.1 and 16.7%
on sandy and on clay soils, respectively. Therefore, pest and disease infestation level partly
explained the differences in sugar yield between type top and type average growers
analysed. The skills and management of the grower are important to reducing damage by
pests and diseases.
Mean saturated hydraulic conductivity in the subsoil (Ks) was significantly higher on fields of
type top growers than of type average growers, 0.49 and 0.31 m day-1, respectively. Mean Ks
was below a damage threshold level of 0.10 m day-1 on 34% of the type average growers’
fields and on 27% of the type top growers’ fields. Ks was found 0.00 m day-1 on 9% of all
fields. By multiple regression analysis without the factor grower type, 15.3% of the variability
of Ks was explained by a model with the terms fine sand fraction (50-105 μm) in the subsoil
and depth of primary tillage (Dpt; m).
Type top growers basically made use of comparable technical equipment, but applied lower
tractor tyre inflation pressure and a lower number of field operations for seedbed preparation
compared with type average growers. This did not result in a significant difference in mean
air-filled porosity (AP) at field capacity in the topsoil between grower types although the
number of fields with an topsoil AP in the 10-15 cm layer below 10% was lower in fields of
top growers (13 fields) than of average growers (18 fields).

Improvement of the competitiveness of the sugar beet crop in the Netherlands
138
Direct effects of soil management on AP could be established by statistical analysis without
the factor grower type, but may have been influenced because both management
characteristics and AP appeared to be strongly related to top soil clay content.
AP of the topsoil and Ks of the subsoil explained 24.9% of the variation in sugar yield.
Therefore, under the given conditions of soil type (clay content), a better soil structure can be
influenced by the grower, resulting in a higher sugar yield.
Harvest losses were measured in 2006, 2007, and 2008 on 150 sugar beet fields in the
Netherlands. Losses by overtopping, root breakages, and of whole beet were on average 2.9
t ha-1 and ranged from 0.45 t ha-1 to 9.1 t ha-1. Although the type top growers had significant
lower losses due to overtopping and whole beet losses, they did not have lower total harvest
losses compared to the type average growers. Reducing the harvest losses is a relatively
easy and efficient way to improve yield and profitability of the sugar beet crop.
Fertilization of sugar beet did not differ between the type top and type average growers in
this project. No substantial effects of applied elements on sugar yield were found, since all
were already in the optimal range for a high sugar yield. The amino-N content of sugar beet
was found predicting the removal of total-N from the fields (R2 = 0.66). Due to the increased
quality of the sugar beet during the years as a result of breeding efforts, the N demand stays
on similar level.
The type top growers had significant higher plant population per hectare compared to the
type average growers. The delay in emergence on type average growers’ fields can be
explained by sowing quality and sowing date. Sowing quality from this project comes to seed
placement in compressed (below the loose seedbed) and in humid soil (not dried by the
weather), which are closely related. The type top growers place significantly more seeds in
humid soil, providing more optimal circumstances for the seeds to germinate and being less
dependent on rainfall after sowing. Here, the grower’s management is of major importance,
for using a properly maintained sowing machine, for preparing a high quality seedbed and for
checking the seed placement in the soil during sowing.

8. Summary
139
Type top growers sowed their sugar beets significantly five days earlier. This resulted in an
earlier closure of canopy with positive influence on yield and reducing the effect of
pathogens. The harvest date was not different for both grower types, consequently, the gain
has to be set at seasons’ start.
The costs of weed control were comparable between type top and type average growers.
Next, all the recorded inputs, like number of applications, type and amount of compounds
used and interval of applications were similar for both type top and type average growers,
except the pre-sowing and pre-emergence applications. Thus, difference in weed control
between type top and type average growers is set early in the season. The yield loss due to
weed competition was estimated to be about 6%. With the importance of growers’
management on the late emergence of weeds, the challenge remains whether to control
weeds successfully and to avoid weed competition after canopy closure.
This study clearly shows that there is no general key issue attention should be paid to but
raising sugar yield demands a continuous dedication to the crop, an optimised grower's
management, and a specific guidance by new knowledge generated by scientific research.

Improvement of the competitiveness of the sugar beet crop in the Netherlands
140

Improvement of the competitiveness of the sugar beet crop in the Netherlands
141
9 Curriculum Vitae
Abraham Cornelis (Bram) Hanse
* 28 July 1982 in Noordoostpolder (NL)
Education
1986-1994 Primary school ‘Eben-Haëzer’, Emmeloord
1994-2000 Pre-university education, ‘Pieter Zandt’, Kampen. Examination
in: Dutch, English, Biology, Chemistry, Mathematics, History
and Geology.
2000-2006 Plant Science at Wageningen University; specialised in Crop
Protection, major and minor in Nematology.
Experience
2006-2007 Process engineer at VDL Cultivit BV, Breda.
2007-2011 Project manager / Research agronomist at the IRS, Bergen op
Zoom. Responsible for the project “Improving competitiveness
of sugar beet cultivation”.
2009-2011 External PhD-student at the Institut für Zuckerrübenforschung (IfZ),
associate institute of the Georg August-University, Göttingen (D), on
improving competitiveness of sugar beet cultivation in the Netherlands.
Current position
Since January 2011 Project manager / Research agronomist sugar beet pathology and
pests at IRS, Bergen op Zoom.

Improvement of the competitiveness of the sugar beet crop in the Netherlands
142
Improvement of the competitiveness of the sugar beet crop in the Netherlands
143
10 Acknowledgements
What started in 2008 with a remark, during a discussion on the results of the SUSY-project,
ended up in this dissertation. And indeed, the amount of data generated by the SUSY-project
was more than sufficient for a PhD-study. Therefore, I would like to thank Aad
Termorshuizen for making this initial remark which resulted in an increased added value for
the SUSY-project, sugar beet research, sugar beet growers, but also for my personal life.
Next to this, I am grateful for his contribution and many useful suggestions as co-author of
the article on pests and diseases.
I would like to thank Professor Bernward Märländer for the scientific supervision with many
useful discussions and constructive suggestions. The friendly and pleasant atmosphere
during the discussions acted as a stimulus for the work and brought a lot of motivation.
Also towards the other two referees of my PhD, Professor Oliver Mußhoff and Frans Tijink, I
am very grateful for their support and guidance during discussions, colloquia and writing.
A lot of thanks go to the institute IRS, making it possible to conduct a PhD study on and
during my daily work, providing room for professional and personal development. Special
thanks go to my colleagues at the IRS for all the work with which they contributed to the
SUSY-project, direct or indirect during discussions on plans and methods or on distant sugar
beet fields across the Netherlands during measurements and observations. All this work was
an essential contribution to the success of the SUSY-project.
The Institut für Zuckerrübenforschung deserves my thanks for providing the infrastructure for
a graduation at the Georg August University in Göttingen and its employees and PhD
students for helping to find my way through the required documents, giving practical
assistance, translating a manuscript and presentations into proper German, but also for
causing a pleasant stay in Göttingen. I wish to thank Mark Varrelmann and Heinz-Josef Koch
for being cooperative co-authors with good suggestions and useful remarks on the respective
manuscripts.

Improvement of the competitiveness of the sugar beet crop in the Netherlands
144
Bert Vermeulen deserves a lot of thanks for his dedicated work on measuring and analysing
the soil structure, as well as for his contributions to the manuscript as a co-author. I would
like to thank Jos Pauwels for his work on the SUSY-project, setting up the study, selecting
the growers and handing me over a well organised, smoothly running project.
Finally, I would like to thank all the 52 participating growers which provided us the basis for
the collection of this enormous amount of data. Without their dedicated contribution, their
patient and willingness to give insight in their fields and farms, the whole SUSY-project could
not exist.
Bram Hanse
Oudenbosch, March 2011