Improvement in Isometric Strength of the Quadriceps Femoris ...
11
Improvement in Isometric Strength of the Quadriceps Femoris Muscle After Training with Electrical Stimulation DAVID M. SELKOWITZ The purpose of this investigation was to determine if training isometrically with electrical stimulation (ES) alone would significantly increase isometric strength of the quadriceps femoris muscle. The relationships between the strength changes and the relative force and duration of training contractions were also studied. An experimental group (Group 1) and a control group (Group 2), 12 subjects in each, underwent pretesting and posttesting to obtain their maximum voluntary isometric contractions (MVICs). Group 1 trained with maximally tolerable isometric contractions induced by ES, three days a week for four weeks. Results showed that although both groups demonstrated increases in isometric strength of their quadriceps femoris muscles, training isometrically with ES produced a significantly greater increase (p < .01) than not training with ES. The relative strength improvement in Group 1 was positively and significantly correlated with training-contraction intensity and duration. The relative increase in isometric strength, using only ES, may be determined by the ability of the subjects to tolerate longer and more forceful contractions. Suggestions for further research and implications for the clinical use of ES for strength-training are discussed. Key Words: Electric stimulation, Muscle contraction, Physical therapy. Exogenous electrical stimulation (ES) of nerve and muscle is used for muscle reeducation, 1 delay of atrophy, 2,3 temporary reduction of spasticity, 4,5 and reduction of contractures 6 and edema. 7 The use of ES for muscle strengthening in research and clinical practice has become increasingly popular in re- cent years. Training isometrically with ES is reported to increase isometric 8-11 and isokinetic 9, 12 quadriceps femoris muscle strength in healthy subjects. Patients recovering from knee ligament surgery 2 and patients with chondromalacia patellae 13 have also shown increases in isometric strength of the quadriceps femoris muscle after ES training. Experimental procedures have been based in part on ES research of isomet- ric strength increases in the quadriceps femoris muscle of athletes by investigators in the Soviet Union (to date unpub- lished in the United States). 8 Several investigators have dem- onstrated the effects of ES training on muscle physiology. 2, 14, 15 Munsat et al demonstrated significant increases in muscle fiber size and changes infibertype composition in the rectus femoris muscle of patients with contractured hamstrings after the use of chronic stimulation with implanted electrodes. 6 Stanish et al reported that ES training prevented a reduction in myofibrillar adenosine triphosphatase (ATPase) activity (associated with contractile force and speed) in the quadriceps femoris muscle of patients who had their knees immobilized after surgery. 3 Laughman et al, 10 Currier and Mann, 11 Currier et al, 16 and Massey et al 17 demonstrated no significant differ- ences in strength gains between groups training with ES and those training with only voluntary contractions. Comparing studies and drawing valid conclusions concern- ing the use of ES is difficult because of inadequate standard- ization of experimental procedures. Procedures involving an experimental group training with ES in addition to other forms of exercise, 2,3 an experimental group receiving ES su- perimposed on voluntary contractions, 11, 16 or an experimental group receiving ES as the only method of exercise 8-13, 17, 18 are reported. Recent studies have compared groups training with ES with groups training with only voluntary contractions (VC), 10,11 and with groups training with ES superimposed on voluntary contractions (ESVC). 11 Romero et al applied ES to the quadriceps femoris muscle bilaterally (simultaneously) and tested strength isometrically and isokinetically. 9 Halbach and Straus 12 and Massey et al 17 used dynamic testing modes to compare groups training isometrically with ES with those training dynamically without ES. Kots's notes, 8 Johnson et al, 13 and Halbach and Straus 12 did not report a control group for comparison with an ES group. In the literature on ES strength training, ES contractions have always been isometric. Of the previously mentioned studies, only Massey et al 17 applied ES to a muscle group other than the quadriceps femoris muscle. Other varying training factors include the frequency and period of training sessions and the duration and intensity (relative force) of training contractions. Electri- cal stimulation factors of frequency, amplitude, pulse width, and waveform have also varied. Characteristics of the ES and the training protocol have not always been reported thor- oughly nor have either been well-controlled. 19 Mr. Selkowitz is Staff Physical Therapist, Sports Health and Preseason Evaluation Center, Merritt/Peralta Medical Center, 2935 Telegraph Ave, Oak- land, CA 94609 (USA). He was a graduate student in the program for a Master of Science in Physical Therapy at Sargent College of Allied Health Professions, Boston University, Boston, MA, at the time this study was conducted. This project was supported in part with a grant from the Dudley Allen Sargent Research Fund. This article was submitted March 28, 1983; was with the author for revision 37 weeks; and was accepted August 1, 1984. 186 PHYSICAL THERAPY
-
Upload
khangminh22 -
Category
Documents
-
view
1 -
download
0
Transcript of Improvement in Isometric Strength of the Quadriceps Femoris ...
Improvement in Isometric Strength of the Quadriceps Femoris Muscle After Training with Electrical Stimulation
DAVID M. SELKOWITZ
The purpose of this investigation was to determine if training isometrically with electrical stimulation (ES) alone would significantly increase isometric strength of the quadriceps femoris muscle. The relationships between the strength changes and the relative force and duration of training contractions were also studied. An experimental group (Group 1) and a control group (Group 2), 12 subjects in each, underwent pretesting and posttesting to obtain their maximum voluntary isometric contractions (MVICs). Group 1 trained with maximally tolerable isometric contractions induced by ES, three days a week for four weeks. Results showed that although both groups demonstrated increases in isometric strength of their quadriceps femoris muscles, training isometrically with ES produced a significantly greater increase (p < .01) than not training with ES. The relative strength improvement in Group 1 was positively and significantly correlated with training-contraction intensity and duration. The relative increase in isometric strength, using only ES, may be determined by the ability of the subjects to tolerate longer and more forceful contractions. Suggestions for further research and implications for the clinical use of ES for strength-training are discussed.
Key Words: Electric stimulation, Muscle contraction, Physical therapy.
Exogenous electrical stimulation (ES) of nerve and muscle is used for muscle reeducation,1 delay of atrophy,2,3 temporary reduction of spasticity,4,5 and reduction of contractures6 and edema.7 The use of ES for muscle strengthening in research and clinical practice has become increasingly popular in recent years. Training isometrically with ES is reported to increase isometric8-11 and isokinetic9, 12 quadriceps femoris muscle strength in healthy subjects. Patients recovering from knee ligament surgery2 and patients with chondromalacia patellae13 have also shown increases in isometric strength of the quadriceps femoris muscle after ES training. Experimental procedures have been based in part on ES research of isometric strength increases in the quadriceps femoris muscle of athletes by investigators in the Soviet Union (to date unpublished in the United States).8 Several investigators have demonstrated the effects of ES training on muscle physiology.2, 14, 15
Munsat et al demonstrated significant increases in muscle fiber size and changes in fiber type composition in the rectus femoris muscle of patients with contractured hamstrings after the use of chronic stimulation with implanted electrodes.6
Stanish et al reported that ES training prevented a reduction in myofibrillar adenosine triphosphatase (ATPase) activity (associated with contractile force and speed) in the quadriceps femoris muscle of patients who had their knees immobilized
after surgery.3 Laughman et al,10 Currier and Mann,11 Currier et al,16 and Massey et al17 demonstrated no significant differences in strength gains between groups training with ES and those training with only voluntary contractions.
Comparing studies and drawing valid conclusions concerning the use of ES is difficult because of inadequate standardization of experimental procedures. Procedures involving an experimental group training with ES in addition to other forms of exercise,2,3 an experimental group receiving ES superimposed on voluntary contractions,11, 16 or an experimental group receiving ES as the only method of exercise8-13, 17, 18 are reported. Recent studies have compared groups training with ES with groups training with only voluntary contractions (VC),10,11 and with groups training with ES superimposed on voluntary contractions (ESVC).11 Romero et al applied ES to the quadriceps femoris muscle bilaterally (simultaneously) and tested strength isometrically and isokinetically.9 Halbach and Straus12 and Massey et al17 used dynamic testing modes to compare groups training isometrically with ES with those training dynamically without ES. Kots's notes,8 Johnson et al,13 and Halbach and Straus12 did not report a control group for comparison with an ES group. In the literature on ES strength training, ES contractions have always been isometric. Of the previously mentioned studies, only Massey et al17
applied ES to a muscle group other than the quadriceps femoris muscle. Other varying training factors include the frequency and period of training sessions and the duration and intensity (relative force) of training contractions. Electrical stimulation factors of frequency, amplitude, pulse width, and waveform have also varied. Characteristics of the ES and the training protocol have not always been reported thoroughly nor have either been well-controlled.19
Mr. Selkowitz is Staff Physical Therapist, Sports Health and Preseason Evaluation Center, Merritt/Peralta Medical Center, 2935 Telegraph Ave, Oakland, CA 94609 (USA). He was a graduate student in the program for a Master of Science in Physical Therapy at Sargent College of Allied Health Professions, Boston University, Boston, MA, at the time this study was conducted.
This project was supported in part with a grant from the Dudley Allen Sargent Research Fund.
This article was submitted March 28, 1983; was with the author for revision 37 weeks; and was accepted August 1, 1984.
186 PHYSICAL THERAPY

RESEARCH
The purposes of this study were 1) to determine if isometric training with ES alone would significantly improve isometric quadriceps femoris muscle strength; 2) to determine the correlation between strength changes and the intensity (relative force) and duration of training contractions; 3) to discuss the rationale for, and the possible effects of, the training protocol used; 4) to note observations and subjective reports regarding the use and effects of an electrical stimulator in a strengthening regimen, which may not be easily submitted to statistical analyses; and 5) to determine if sex differences introduced a confounding variable.
This study was completed in thesis form in the spring of 1982. At that time, no published study had 1) included a control group to be statistically compared by an isometric strength test with a group training with only isometric ES contractions, 2) reported intensity of training contractions, or 3) trained the ES group at near maximum intensities. Also, no study had demonstrated that a group training with only isometric ES contractions could increase in isometric strength significantly more than a control group. In studies published since 1982, Romero et al,9 Laughman et al,10 and Currier and Mann11 included a control group in the manner described above and showed significantly greater increases in the ES training group in comparison with the control group. In addition, Laughman et al,10 Currier and Mann,11 and Owens and Malone18 reported the training contraction intensity. No research published to date, however, has had a group train with only ES contractions that approached the maximum voluntary isometric contraction in intensity. Furthermore, no reports have investigated the relationships between strength changes and the intensity and duration of training contractions.
METHOD
Subjects Twenty-four volunteers, 8 men and 16 women, were se
lected from Boston University students and faculty. Ages ranged from 18 to 32 years (. = 24.6). Criteria for selection included 1) absence of neurological and orthopedic impairments and 2) no strength training for at least four weeks before the investigation.
Design
The experimental design included a pretest, a training program, and a posttest of subjects in an experimental group (Group 1) and a control group (Group 2).
Pretest Procedure
Isometric torque, used as an index of knee extensor (quadriceps femoris muscle) strength, was measured with a Cybex®
II isokinetic dynamometer.* All subjects participated in the pretest procedure to determine their maximum voluntary isometric contraction (MVIC). Subjects were positioned on the Cybex® chair with stabilization supports across the pelvis and distally over the thigh (Fig. 1). For additional stabilization, the subjects gripped the sides of the chair and leaned back against the backrest, which was inclined posteriorly to
an angle of 70 degrees above horizontal. The axis of rotation of the Cybex® lever arm was aligned with the axis of the knee joint. The knee was fixed at 60 degrees of flexion, and the Cybex® speed-selector was set at 0º /sec. Williams and Stutz-man found that isometric knee extensor torque was greatest at this angle.20 The distal end of the lever arm was securely fastened proximal to the malleoli. Subjects were instructed (without verbal encouragement) to extend the knee with as much force as possible and to maintain the contraction until instructed to relax (10 seconds). Three trial contractions were performed, with a two-minute rest interval between contractions. The mean torque value of the three pretest trials was chosen as the MVIC.
Training Procedure
Subjects were randomly assigned to Group 1 or Group 2. Each group consisted of four men and eight women. Group 1 engaged in an isometric strength-training regimen of electrically stimulated isometric contractions of the quadriceps femoris muscle. The subjects were instructed not to add a voluntary component to the electrically stimulated contrac-
Fig. 1. Subject positioning on the Cybex® chair during testing and training.
* Cybex, Division of Lumex, Inc, 2100 Smithtown Ave, Ronkonkoma, NY 11779.
Volume 65 / Number 2, February 1985 187

TABLE 1 Contraction Durations, Current Intensities (Amplitudes), and Torque Productions for Each Repetition During Sessions 11 and 12 of Subject 11 and Session 12 of Subject 1
Repa
1 2 3 4 5 6 7 8 9
10
Subject 11, Session 11
Durb
(sec)
9.6 8.8 9.0 9.4 8.2 9.2 8.6 9.2 7.6 8.6
Ampc
(mA)
66.0 69.5 71.5 72.5 73.5 75.5 76.5 78.0 79.0 80.0
Torqued
(N. m)
153.90 172.80 172.80 172.80 180.90 172.80 179.55 175.50 179.55 175.50
Subject 11, Session 12
Durb
(sec) 10.4 10.2 10.4 8.8
10.2 10.2 10.0 9.4 9.2 9.8
Ampc
(mA)
66.0 68.5 67.5 71.0 77.0 75.5 80.0 81.5 82.0 84.0
Torqued
(N. m)
167.40 186.30 187.65 194.40 187.65 190.35 194.40 190.35 190.35 189.00
Subject 1, Session 12
Durb
(sec)
11.0 10.8 9.8
10.2 11.0 10.8 10.6 10.2 10.2 10.4
Ampc
(mA)
52.0 54.5 55.5 56.0 57.0 54.0 57.0 57.5 56.5 58.0
Torqued
(N . m)
176.85 187.65 189.00 193.05 186.30 174.15 180.90 184.95 197.10 199.80
tions. The training protocol included ten 10-second tetanic, maximally tolerable isometric contractions, with a two-minute rest interval between contractions. The training took place three days a week for four weeks. I maintained daily training logs and noted torque generated, current amplitudes, and contraction durations (not including current rise and fall times) for each repetition (Tab. 1). Positioning during training was the same as that described for the pretest.
The electrical stimulus was provided by the Electrostim 180-2† (Fig. 2). This unit delivers a current with an unalterable frequency, pulse width, and waveform. An oscilloscope analysis‡ revealed an alternating current with a frequency of 2200 cycles/sec (Hz), and a 0.45-msec pulse width. The waveform has been reported as sinusoidal.3, 10, 11 Sinusoidal waves at such high frequencies, however, take on the characteristics of a pulse wave (Fig. 3).21 These characteristics are automatically delivered in "packages" of 50 a second, with a 10-msec "on" time followed by a 10-msec "off'' time. Because it was necessary to give the subjects a two-minute rest interval between contractions to maintain maximum contraction level and to regulate current amplitude according to subject tolerance, I controlled the current amplitude rather than relying on the automatic mode of the unit (see Discussion). The amplitude delivered was to subject tolerance (as verbally indicated by each subject) and varied from 28 to 90 mA. The unit automatically shut off when the amplitude was increased above 90 mA. The time for the current to rise to peak amplitude, "rise time," also varied according to subject tolerance, from 0.6 to 3 seconds. These values were obtained by measuring the time to peak torque, as recorded by a Cybex®
dual-channel recorder. The measurement of contraction duration did not include the times of current rise and fall from peak. I used a monopolar electrode technique with one electrode placed at the femoral triangle and the second electrode placed distally on the thigh (Fig. 4).21 The electrodes were secured to the thigh with an elastic wrap and two elastic straps.
Each carbon electrode was mounted on a sponge 7.6 by 12.7 cm, which was soaked in water.
Group 2 did not participate in any strength-training activities of the lower extremities during this time. Group 1 did not participate in any other strength-training activities during the course of this study.
Fig. 2. Electrostim 180-2 electrical stimulation unit set up for training.
Fig. 3. Reproduction of oscilloscope analysis of current delivered by the Electrostim 180-2.
a Repetition. b Contraction duration. c Amplitude. d Changes in amplitude delivered vs changes in torque produced within a session, between consecutive sessions for a given subject (Subject
11), and between subjects for a given session (Session 12).
† Nu-Med Surgical Supply, 333 Hammes Ave, Joliet, IL 60435. ‡ TE4 Electromyograph, TECA, White Plains, NY 10603.
188 PHYSICAL THERAPY

RESEARCH
Posttest Procedure
All subjects participated in the posttest on the third day after the last training session, which was approximately five-and-a-half weeks after the pretest. The posttest procedure was identical to the pretest procedure.
Measurement
Torque output and contraction duration were recorded with a Cybex® dual-channel recorder; contraction duration was timed using this instrument. The dual-channel recorder was calibrated for each torque scale on each day of the study before its use.22 The damping was set at "3."
Data Analysis
A three-way analysis of variance (ANOVA) with one repeated measure on the three pretest MVIC trials for each subject indicated no significant differences among the trials (p > .05). Therefore, I used the mean torque values of the pretest and posttest trials as MVICs for the statistical comparisons between- and within-groups.23 A three-way ANOVA with one repeated measure was used to compare the mean pretest and posttest MVICs within- and between-groups and sexes, and a Newman-Keulspart hoc analysis was used to test the results.
Pearson product-moment correlations were used to compare the percentage difference between pretest and posttest MVICs of Group 1 (the absolute difference expressed as a percentage of the pretest measurement) and 1) the mean training-contraction intensity (torque expressed as a percentage of the pretest MVIC) and 2) the mean training-contraction duration. Training-contraction duration was not intended as a variable, but it became one. All statistical analyses were based on null hypotheses; the level of probability was .05.
RESULTS
Table 2 presents a three-way ANOVA with one repeated measure, comparing the mean pretest and posttest MVICs within- and between-groups and sexes. The interaction of group by sex by test was not significant. Also, there was no statistically significant interaction of sex by test. Therefore, because the MVICs of the sexes were not significantly different at the outset of the investigation, no significant confounding variable was introduced by combining the sexes within the groups. The interaction of group by test was significant. The Newman-Keuls post hoc analysis revealed the posttest MVIC was significantly greater than the pretest MVIC for each group (Tab. 3). The posttest MVIC for Group 1 was also significantly greater than that for Group 2. The mean percentage increase in MVIC from pretest to posttest was 44 for Group 1 and 18 for Group 2; this was also a significant difference (p < .05). There was no significant difference between groups for the pretest values. The pretest and posttest MVICs and their percentage difference (the absolute difference between pretest and posttest measurements, expressed as a percentage of the pretest) are presented for each subject in Table 4. Table 5 presents the means, standard deviations, standard errors, maxima, and minima for the pretest and posttest MVICs and the percentage differences for both groups.
Table 6 shows the following for each individual in Group 1: 1) the mean training-contraction intensity (torque ex
Fig. 4. Electrode placement on subjects.
pressed as a percentage of the pretest MVIC) over all training sessions and the mean of the maximum and minimum sessions, and 2) the mean training-contraction duration over all sessions. The descriptive statistics for mean training-contraction intensity and mean training-contraction duration are also included in Table 6. Pearson product-moment correlations between the percentage difference between tests and the mean training-contraction intensity (r = .61) and the percentage difference between tests and the mean training-contraction duration (r = .59) were statistically significant (p < .05).
DISCUSSION
Group 1 (experimental group) and Group 2 (control group) began the study at similar strength levels, as indicated by the absence of a significant difference between pretest MVICs. No subjects in either group had performed lower extremity strength-training for at least a month before testing. Mean MVIC from pretest to posttest significantly increased for each group. The increase in MVIC for Group 2 was not due to a training stimulus. The increase may be due to a motor-learning effect induced by the pretest.24 Moffroid and Whipple demonstrated a similar isometric strength increase by a control group.25 The increase for Group 2 might not have oc-
Volume 65 / Number 2, February 1985 189

TABLE 2 Three-Way Analysis of Variance with One Repeated Measure Comparing the Mean Pretest and Posttest MVICs Within and Between Groups and Sexes
Source Group by test Sex by test Group by sex by test Error
SS
2223.11 25.97
8.60 3225.86
df 1 1 1
20
MS
2223.11 25.97
8.60 161.29
F
13.78 0.16 0.05
P .001a
.692
.820
TABLE 3 Newman-Keuls Post Hoc Analysis of the Pretest and Posttest Mean MVICs of Group 1 and Group 2
Group by Test Comparisons
Group 1 Pretest vs
Group 2 Pretest
Group 2 Posttest vs
Group 2 Pretest
Group 1 Posttest vs
Group 1 Pretest
Group 1 Posttest vs
Group 2 Posttest
MVICs (N.m) 148.58
147.23
168.86
147.23
208.39
148.58
208.39
168.86
Calculated Statistic
1.00
16.03a
44.30b
29.28b
curred had the method included practice sessions before the pretest. In studies that have included practice sessions, the protocols reported for familiarity,9 practice sessions,11, 16 and submaximal warm-up contractions11 may have introduced a confounding variable in the form of unqualified strengthening stimuli. Group 1 demonstrated a significant increase in mean MVIC from pretest to posttest because of training with ES. Although Group 2 also demonstrated a significant increase, training with ES produced a significantly greater post-test MVIC for Group 1 than did no training for Group 2. This finding is in accord with that of other studies, which used statistical tests to compare the effects on strengthening of isometric training with only ES with those of performing no training for groups of healthy individuals.9-11 Additional studies with similar findings did not report the use of a control group or statistical analyses to evaluate their data.8, 12, 13 One had a small sample size.12 Other investigators found no significant differences between an ES group and a control group.17, 18 In the Owens and Malone study,18 this may have been due in part to a small sample size. Massey et al did not hold the characteristics of the electrical stimulus constant for the training period; these characteristics may not have been optimal for producing a strengthening effect.17 One difficulty in comparing studies has been the variety of electrical stimulus characteristics and equipment. This research project, and those by Laughman et al,10 Currier and Mann,11 and Owens
and Malone18 used the same electrical stimulator—the Elec-trostim 180-2. The current delivered by this unit has an unalterable waveform, frequency, and pulse width.
The percentage difference between pretest and posttest MVICs for Group 1 correlated positively with mean training-contraction intensity and with mean training-contraction duration. These results indicate that the longer and more intense the training contraction, the greater the percentage increase in isometric strength of the quadriceps femoris muscle because of isometric ES training. Berger and Hardage, using voluntary contractions, found greater increases in strength with higher training intensities.26 Knuttgen stated that greater and faster increases in strength occur by training closer to 100 percent of maximum.27 Kots reported that a maximum ES contraction may be 10 to 30 percent greater than a maximum voluntary contraction.8 The mean training-contraction intensity (torque) in the present study was 91 percent of the mean pretest MVIC (Group 1). Several subjects averaged greater than 100 percent, and most of the subjects were training at contraction intensities greater than 100 percent by the end of the training period (Tab. 6). I am not certain whether the lower training intensities (below 100 % MVIC) were due to lower tolerances of some subjects or nonideal stimulus characteristics, or both. No ES studies to date have reported training-contraction intensities as high as those achieved in this study. Although researchers in most reports in the literature have calculated training intensities (% MVIC) based on the pretest MVIC, the instantaneous training intensity may actually be lower than what is typically calculated because the MVIC is probably increasing during the course of the study; this factor was demonstrated, although not discussed in the study by Laughman et al.10
Training Intensities
Only a few other investigators have reported quantified training intensities (percentage of pretest MVIC): Owens and Malone (60% for one ES group and 39% for a second ES group training on consecutive days and on every other day over a 10-day period),18 Laughman et al (33% for an ES group and 78% for a group training with only voluntary contractions five days a week for five weeks),10 and Currier and Mann (67% for an ES group, 88% for an ESVC group, and 119% for a VC group training three days a week for five weeks).11
Some of these figures, however, were based on torque values recorded only on a particular day18 or for a particular contraction in a sequence throughout the study.10 Only my study and that of Currier and Mann11 calculated the training intensities using the torque values recorded for each training contraction of the study. Figure 5a shows data from my study; Figure 5b is a graph from the article by Currier and Mann.11
The training intensity of the ES Group 1 in my study increased each week for the four weeks of the study and was higher than the Currier and Mann ES group for each week. Group 1 started lower, but ended with and averaged a higher training intensity than the training intensity of the ESVC Group in Currier and Mann's study.11 Group 1 was lower in training intensity than the VC Group in Currier and Mann's study for each week. Figure 5c shows the training intensity for Group 1 for each training session. Decreases in training intensity occurred only from sessions 1 to 2, 8 to 9, and 10 to 11, and were slight.
a Statistically significant at p < .05.
a Significant at p = .05 level. b Significant at p = .01 level.
190 PHYSICAL THERAPY

RESEARCH
TABLE 4 Pretest and Posttest MVICs and their Percentage Differencea for Each Subject
Subject
1 2 3 4 5 6 7 8 9
10 11 12
Pretestb
150.75 146.70 100.35 166.50 80.55 82.80
126.90 113.85 186.75 195.30 168.30 264.15
Group 1
Posttestb
248.85 178.20 175.05 236.25 113.40 130.05 184.95 162.45 238.05 294.30 263.25 275.84
%Diffa
65.08 21.47 74.44 41.90 40.77 57.07 45.74 42.69 27.47 50.69 56.41 4.43
Pretestb
121.05 187.65 112.95 91.80 66.15
149.40 92.25
144.45 241.20 217.35 169.20 173.25
Group 2
Posttestb
132.75 176.85 135.45 113.85 98.10
171.45 136.35 169.20 283.05 222.30 209.70 177.30
% Diffa
9.67 -5.76 19.92 24.01 48.31 14.76 47.83 17.13 17.78 2.28
23.94 2.34
TABLE 5 Descriptive Statisticsa for Pretest and Posttest MVICs and their Percentage Difference6 for Group 1 and Group 2
s SE Maximum Minimum
Pretestc
148.58 52.81 15.24
264.15 80.55
Group 1
Posttestc
208.39 58.83 16.98
294.30 113.40
% Diffb
44.01d
19.32 5.58
74.44 4.43
Pretestc
147.23 53.16 15.35
241.20 66.15
Group 2
Posttestc
168.86 51.54 14.88
283.05 98.10
% Diffb
18.52d
16.56 4.78
48.31 2.34
TABLE 6 Individual and Descriptive Statistics for Training-Contraction Intensity and Duration
Subject
1 2 3 4 5 6 7 8 9
10 11 12
s SE Maximum Minimum
Training-Contraction Intensity (% of Pretest MVIC)
109.50 86.84
129.19 95.91 57.32
113.94 71.19 96.45 99.83 71.98 91.77 68.64 91.05 21.03
6.07 129.19 57.32
Maximum
145.79 108.77 164.81 122.44 88.82
134.52 90.74
123.44 118.92 90.62
111.57 82.95
Minimum
69.34 64.14 82.34 61.70 26.96 56.25 48.83 62.02 64.84 30.97 70.83 29.98
Training-Contraction
Duration (sec)
10.27 8.48 9.17 9.40 9.34 9.14 8.61 8.89 7.83 9.42 8.84 8.60 9.00 0.61 0.18
10.27 7.83
At the reported training intensities, Laughman et al10 and Currier and Mann11 demonstrated strength gains that were significantly greater for training groups than those for control groups. Neither study showed significant differences in strength gains among training groups.10,11 This is somewhat surprising in view of the apparently large differences in training intensity between some groups; VC groups trained at higher intensities than ES groups. The lower training intensities of the ES groups may be explained in part by comparing the present study with that of Currier and Mann.11 They consistently found a reduction in mean training-contraction torque between the 2nd and 10th repetitions (Fig. 6a).11 In their method, the current amplitude for each subject was unchanged for each training contraction of a given session.11
In the present study, the amplitude of the stimulating current was permitted to vary from one contraction to the next to produce contractions that were maximally forceful, yet tolerable. Figure 6b shows that the training-contraction torque increased consistently from the 1st to the 7th contraction and decreased slightly thereafter to the 10th. This varying of amplitude led to the higher mean training-contraction intensity in the present study.
Increases in Strength
If strength gains are directly correlated with training-contraction intensity, as was found to be true in this study, then groups training with ES could have greater strength gains than groups training with VCs only if the ES groups trained at higher intensities. A major advantage of ES would then be an ability to produce contractions with greater force than those produced by volition. This result would be determined in part, however, by the ability of individuals to tolerate a stronger contraction and by the capability of an electrical stimulator to produce a current with appropriate characteristics.
Owens and Malone18 did not find significant strength increases in ES groups training at intensities comparable with those of other studies.10, 11 Although the small sample size in each group was probably an important influence on their results,18 other training variables besides training-contraction intensity must be considered when discussing strength gains.
a The absolute difference between pretest and posttest, expressed as a percentage of the pretest. b Torque in newton meters.
a Based on data for each individual, presented in Table 4. b The absolute difference between pretest and posttest, expressed
as a percentage of the pretest. c Torque in newton meters. d Difference between Group 1 and Group 2 significant at p < .05.
Volume 65 / Number 2, February 1985 191
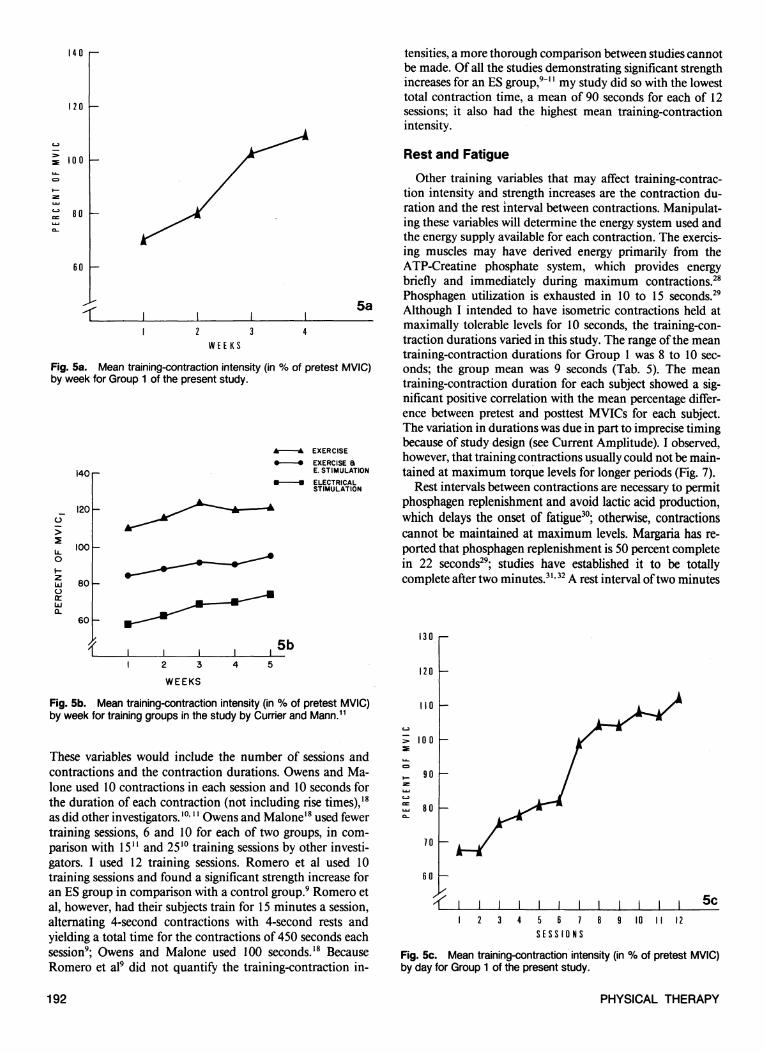
Fig. 5a. Mean training-contraction intensity (in % of pretest MVIC) by week for Group 1 of the present study.
Fig. 5b. Mean training-contraction intensity (in % of pretest MVIC) by week for training groups in the study by Currier and Mann.11
Fig. 5c. Mean training-contraction intensity (in % of pretest MVIC) by day for Group 1 of the present study.
These variables would include the number of sessions and contractions and the contraction durations. Owens and Ma-lone used 10 contractions in each session and 10 seconds for the duration of each contraction (not including rise times),18
as did other investigators.10, 11 Owens and Malone18 used fewer training sessions, 6 and 10 for each of two groups, in comparison with 1511 and 2510 training sessions by other investigators. I used 12 training sessions. Romero et al used 10 training sessions and found a significant strength increase for an ES group in comparison with a control group.9 Romero et al, however, had their subjects train for 15 minutes a session, alternating 4-second contractions with 4-second rests and yielding a total time for the contractions of 450 seconds each session9; Owens and Malone used 100 seconds.18 Because Romero et al9 did not quantify the training-contraction in
tensities, a more thorough comparison between studies cannot be made. Of all the studies demonstrating significant strength increases for an ES group,9-11 my study did so with the lowest total contraction time, a mean of 90 seconds for each of 12 sessions; it also had the highest mean training-contraction intensity.
Rest and Fatigue
Other training variables that may affect training-contraction intensity and strength increases are the contraction duration and the rest interval between contractions. Manipulating these variables will determine the energy system used and the energy supply available for each contraction. The exercising muscles may have derived energy primarily from the ATP-Creatine phosphate system, which provides energy briefly and immediately during maximum contractions.28
Phosphagen utilization is exhausted in 10 to 15 seconds.29
Although I intended to have isometric contractions held at maximally tolerable levels for 10 seconds, the training-contraction durations varied in this study. The range of the mean training-contraction durations for Group 1 was 8 to 10 seconds; the group mean was 9 seconds (Tab. 5). The mean training-contraction duration for each subject showed a significant positive correlation with the mean percentage difference between pretest and posttest MVICs for each subject. The variation in durations was due in part to imprecise timing because of study design (see Current Amplitude). I observed, however, that training contractions usually could not be maintained at maximum torque levels for longer periods (Fig. 7).
Rest intervals between contractions are necessary to permit phosphagen replenishment and avoid lactic acid production, which delays the onset of fatigue30; otherwise, contractions cannot be maintained at maximum levels. Margaria has reported that phosphagen replenishment is 50 percent complete in 22 seconds29; studies have established it to be totally complete after two minutes.31, 32 A rest interval of two minutes
192 PHYSICAL THERAPY

RESEARCH
between all contractions was included in the protocol of this study. Berger used a two-minute rest interval between voluntary isometric contractions.33 Several ES studies3, 10-12, 18 included a 50-second rest interval, which Kots8 reported to be superior to intervals of 10, 20, 30, and 40 seconds for producing 10 contractions in a session that approach maximum (pretest MVIC). Kots did not test longer rest intervals.
The influence of neuromuscular fatigue (eg, involving excitation mechanisms) and muscle-fiber fatigue (eg, involving phosphagen depletion) factors on voluntary strength training has been hypothesized.27 In ES research where strengthening was not studied, neuromuscular mechanisms such as presynaptic failure and decreased sensitivity of the postsynaptic membrane to acetylcholine were concluded to be responsible for fatigue.34 Similar ES studies of fatigue factors have concluded that fatigue is a peripheral phenomenon resulting from decreased blood flow35 and that it is related to muscle fiber type (the white fibers fatigue faster with ES).36 Based on data in the present study of lower training-contraction intensities and shorter training-contraction durations for certain Group 1 subjects, I speculate that there may be upper limits for the duration and torque of maximum isometric ES-contractions, which are related to neuromuscular and muscle-fiber fatigue factors. Electrical stimulation-strengthening studies specifically designed to analyze such physiological factors are necessary to determine what relationships actually exist.
Current Amplitude
The subjects in this study occasionally reported discomfort from the intensity of the contraction but rarely discomfort from the electrical current. During the first week of training, several subjects experienced soreness in the quadriceps fe-moris muscle possibly because of the initiation of intense muscular activity. This soreness was dissipated by the second week.
As was previously stated, I controlled the current amplitude rather than relying on the automatic mode of the Electrostim 180-2. The automatic mode does not allow for two-minute rest intervals between contractions. Manual control permitted the regulation of current rise time and the progression of current amplitude to conform more consistently to the varying tolerance levels within and between subjects. Gradual rises in amplitude caused an uncomfortable "pins and needles" or "buzzing" sensation from the electrical stimulus for some subjects, and others found quick rises disconcerting. Rise times between 1 and 2 seconds were tolerated best by most subjects; the range was approximately 0.6 to 3 seconds.
Interindividual and intraindividual patterns for current amplitude tolerated and the resultant torque production were highly variable in this study. No consistent (ie, proportional) relationship was observed between changes in amplitude tolerated and torque produced during a contraction. This observation is supported by Massey et al, who found that although subjects could endure greater current amplitudes as training progressed, this did not necessarily result in greater contractile force.17 The variability in the present study may be explained by my observations and reports of the subjects. The raw data in Table 1 provide examples of the relationships observed between amplitude tolerated and torque produced. During the training period, a greater amplitude was required to produce a contraction with a given torque as a session progressed.
Fig. 6a. Mean torque production of each training group during a particular repetition over the entire training period, in the study by Currier and Mann.11
Fig. 6b. Mean torque production of Group 1 of the present study during a particular repetition over the entire training period.
This increase in amplitude may have been due to the fatigue factors discussed earlier. Currier and Mann demonstrated an analogous effect: torque values decreasing with successive (from the second to the tenth) training contractions, in a given session, while the current amplitude remained constant.11 A particular amplitude delivered during one session resulted in a contraction with a greater torque when delivered during the following session in a given subject. Different amplitudes, in some instances, produced similar torques in different subjects. Differences in percentage of body fat and other impedance factors may have contributed to this finding. A large increase in amplitude from one repetition to the next did not necessarily produce an increase in torque. Subjects reported resisting an ES-induced contraction when the electrical stimulus or the muscle contraction, or both, were too strong to tolerate. This resistance may have been the manifestation of central
Volume 65 / Number 2, February 1985 193

Fig. 7. Cybex® recording of a torque curve for a maximum electrically-stimulated contraction of the quadriceps femoris muscle of a Group 1 subject. Note that the torque output begins to decrease from a peak level before the ES is turned off and before the contraction duration reaches 10 seconds.
Fig. 8a. Cybex® recording of a torque curve for a maximum voluntary isometric contraction (pretest trial) of the quadriceps femoris muscle of a Group 1 subject.
Fig. 8b. Cybex® recording of a torque curve for a maximum electrically-stimulated contraction of the quadriceps femoris muscle of the same Group 1 subject as in Figure 8a.
nervous system activation of the antagonist hamstring muscles, resulting in their cocontraction with the agonist quadriceps femoris muscle. Laughman et al put forth a similar hypothesis.10 Although Liberson reported that only reciprocal inhibition of the antagonist muscle occurs, his conclusion was based on reports by subjects and his visual observations that most subjects were unable to overcome an ES contraction of the agonist using the antagonist muscle.37 No force output by the agonist was quantified before and after the attempts to overcome the ES contraction voluntarily. In the present study, when the uncomfortably strong contraction was followed by a repetition at a slightly lower current amplitude, the torque usually increased above the level attained during the previous, higher-amplitude contraction. The lower stimulus was reportedly more comfortable and possibly caused the subject to relax (ie, decreasing or eliminating the hamstring muscle contraction) rather than to work against the quadriceps femoris muscle contraction. I also observed that gripping the sides of the Cybex® chair provided the subjects with more efficient stabilization of the pelvis by anchoring the proximal attachments of the rectus femoris muscle arid seemed to prevent a loss in measured torque. Subjects reported that they did not actively (volitionally) contribute to quadriceps femoris muscle tension while the contraction was electrically stimulated. Although this was difficult for me to assess visually, the Cybex® torque recordings show the difference between a maximum voluntary isometric contraction (Fig. 8a) and a maximum electrically stimulated isometric contraction (Fig. 8b) of one subject. The former curve is irregular, but the latter is smooth and of a constant torque. These curve patterns were characteristic of subjects in Group 1. This is in contrast with the quality of the force curve shown by Laughman et al as an example of an electrically-stimulated quadriceps contraction not being superimposed on by a voluntary effort (Fig. 9).10
I and previously mentioned investigators10, 11, 18 used the Electrostim 180-2 and achieved current amplitudes in the range of approximately 26 to 90 mA. Because the electrical characteristics were similar, I am uncertain why the training-contraction intensity (% MVIC) in this study was much higher. In addition to allowing the current amplitude to vary (increase as tolerated) during a training session, the difference may be related to the longer rest interval between training contractions in my study and individual differences in impedance factors and subject tolerance (eg, cocontraction levels).
Neural Factors
In their study on voluntary strength-training, Moritani and DeVries demonstrated that neural factors were the major influence on strength increases during the first two to four weeks; then hypertrophy became more important.38 They hypothesized that with ES training, hypertrophy is primarily responsible for strength increases.38 This finding has not been supported by the results of ES-strengthening studies,9, 11, 18 but these investigators used tape measures to measure girth, rather than analzying muscle biopsies to detect hypertrophy. In the present study, I did not explore whether the increase in isometric strength of the quadriceps femoris muscle after ES training was due to changes in the nervous system (eg, involving motor learning) or changes in the physiology of the muscle, or both.
194 PHYSICAL THERAPY

RESEARCH
Clinical Relevance
Strength training with ES may be useful in decreasing the time for rehabilitation and maximizing the recovery potential of patients with decreased quadriceps femoris muscle strength; it may permit earlier initiation of vigorous strength training while a patient is immobilized in a cast, or if there are precautions to dynamic strengthening techniques.
Further Research
In addition to the suggestions put forth previously in this article concerning further research of strength training with ES, I believe it may be useful to perform EMG studies to determine if the voluntary recruitment pattern of motor units by the CNS (ie, from asynchronous to more synchronous) changes after strength training with ES.
CONCLUSIONS
Conclusions based on the results and observations for the present study are as follows: 1. A group training isometrically with ES alone improved the
isometric strength of their quadriceps femoris muscles by a significantly greater amount than a group performing no training.
2. The percentage difference between pretest and posttest MVICs for Group 1 (experimental group) correlated positively and significantly with mean training-contraction intensity (% pretest MVIC), and with mean training-contraction duration. Therefore, the relative increase in isometric strength (induced by training isometrically with ES) may be determined by the ability of subjects to tolerate a longer and more forceful contraction.
3. No consistent relationship was observed between changes in current amplitude tolerated by the subject and torque produced by a contraction. The variability may be due to CNS interference (related to the sensory and emotional perceptions of the subjects, eg, discomfort and anxiety), fatigue factors, impedance factors, and the ability of the subjects to provide additional stabilization of the pelvis by gripping the sides of the Cybex® chair to hold themselves down.
4. The higher mean training-contraction intensities achieved in this study may be due, in part, to allowing the current amplitude to increase during a given session according to subject tolerance and to having long rest intervals between
contractions; both were necessarily controlled by me rather than by the electrical stimulator.
Acknowledgments. I thank Stephen DiCarlo for his assistance in editing my thesis and Lucia Littlefield and Marianne Wyss for their assistance with the photographs and the line graphs.
Fig. 9. Force recording of an electrically-stimulated quadriceps femoris contraction by a load cell at the ankle, from the study by Laughman et al.10
Volume 65 / Number 2, February 1985 195

REFERENCES 1. Williams JGP, Street M: Sequential faradism in quadriceps rehabilitation.
Physiotherapy 62:252-254,1976 2. Eriksson E, Haggmark T: Comparison of isometric muscle training and
electrical stimulation supplementing isometric muscle training in the recovery after major knee ligament surgery. Am J Sports Med 7:169-171,1979
3. Stanish WD, Valiant GA, Bonen A, et al: The Effects of Immobilization and of Electrical Stimulation on Muscle Glycogen and Myofibrillar ATP-ase. Presented at the American Academy of Orthopedic Surgeons, Las Vegas, NV, 1981
4. Levine MG, Knott M, Kabat H: Relaxation of spasticity by electrical stimulation of antagonist muscles. Arch Phys Med 33:668-673,1952
5. Chase JL, Pollock SF, Morris JM: Elicitation of periods of inhibition in human muscle by stimulation of cutaneous nerves. J Bone Joint Surg [Am] 54:1737-1744,1972
6. Munsat TL, McNeal D, Waters R: Effects of nerve stimulation on human muscle. Arch Neurol 33:608-617,1976
7. Kloth L: Electrophoresis in the management of soft tissue trauma. Stimulus, Publication of the Section on Clinical Electrophysiology of the American Physical Therapy Association 8:7-8,1983
8. Babkin D, Timtsenko N (eds): Electrostimulation: Notes from Dr. YM Kots (USSR) Lectures and Laboratory Periods. Presented at the Canadian-Soviet Exchange Symposium on Electrostimulation of Skeletal Muscles, Concordia University, Montreal, Quebec, Canada, December 6-15, 1977
9. Romero JA, Sanford TL, Schroeder RV, et al: The effects of electrical stimulation of normal quadriceps on strength and girth. Med Sci Sports Exerc 14:194-197, 1982
10. Laughman RK, Youdas JW, Garrett TR, et al: Strength changes in the normal quadriceps femoris muscle as a result of electrical stimulation. Phys Ther 63:494-499, 1983
11. Currier DP, Mann R: Muscular strength development by electrical stimulation in healthy individuals. Phys Ther 63:915-921, 1983
12. Halbach JW, Straus D: Comparison of electro-myo stimulation to isokinetic training in increasing power of the knee extensor mechanism. Journal of Orthopaedic and Sports Physical Therapy 2:20-24, 1980
13. Johnson DH, Thurston P, Ashcroft PJ: The Russian technique of faradism in the treatment of chondromalacia patellae. Physiotherapy Canada 29:266-268,1977
14. Nowakowska A: Influence of experimental training by electric current stimulation on skeletal muscles. Acta Physiol Pol 13:32-38, 1962 (Summary)
15. Salmons S, Vrbova G: The influence of activity on some contractile characteristics of mammalian fast and slow muscles. J Physiol 201:535-549 (Lond), 1969
16. Currier DP, Lehman J, Lightfoot P: Electrical stimulation in exercise of the quadriceps femoris muscle. Phys Ther 59:1508-1512, 1979
17. Massey BH, Nelson RC, Sharkey BC, et al: Effects of high frequency electrical stimulation on the size and strength of skeletal muscle. J Sports Med Phys Fitness 5:136-144, 1965
18. Owens J, Malone T: Treatment parameters of high frequency electrical stimulation as established on the Electro-Stim 180. Journal of Orthopaedic and Sports Physical Therapy 5:162-168,1983
19. Kramer JF, Mendryk SW: Electrical stimulation as a strength improvement technique: A review. Journal of Orthopaedic and Sports Physical Therapy 4:91-98,1982
20. Williams M, Stutzman LM: Strength variation through the range of joint motion. Phys Ther Rev 39:145-152,1959
21. Griffin JE, Karselis TC: Physical Agents for Physical Therapists, ed 2. Springfield, IL, Charles C Thomas, Publisher, 1982, pp 58-59
22. Cybex® II Calibration Instructions and Record Form. Ronkonkoma, NY, Cybex, Division of Lumex, Inc, 1982
23. Kroll W: Reliability theory and research decision in selection of a criterion score. Res Q 38:412-419,1967
24. Kroll W: A reliable method of assessing isometric strength. Res Q 34:350-355, 1963
25. Moffroid MT, Whipple RH: Specificity of speed of exercise. Phys Ther 50:1692-1699,1970
26. Berger RA, Hardage B: Effect of maximum loads for each of ten repetitions on strength improvement. Res Q 38:715-718,1967
27. Knuttgen HG: Development of muscular strength and endurance. In Knutt-gen HG (ed): Neuromuscular Mechanisms for Therapeutic and Conditioning Exercise. Baltimore, MD, University Park Press, 1976, pp 97-118
28. Armstrong RB: Energy release in the extrafusal muscle fiber. In Knuttgen HG (ed): Neuromuscular Mechanisms for Therapeutic and Conditioning Exercise. Baltimore, MD, University Park Press, 1976, pp 55-77
29. Margaria R: Aerobic and anaerobic energy sources in muscular exercise. In Margaria R (ed): Exercise at Altitude. New York, NY, Excerpta Medica Foundation, 1967, pp 15-32
30. Fox EL, Robinson S, Wiegman DL: Metabolic energy sources during continuous and interval running. J Appl Physiol 27:174-178,1969
31. Fox EL, Mathews DK: The Physiological Basis of Physical Education and Athletics, ed 3. Philadelphia, PA, WB Saunders Co, 1981, pp 36-39
32. Hultman E, Bergstrom J, McLennon Anderson N: Breakdown and resyn-thesis of phosphorylcreatine and adenosine triphosphate in connection with muscular work in man. Scand J Clin Lab Invest 19:56-66, 1967
33. Berger RA: Comparison of static and dynamic strength increases. Res Q 33:329-333,1962
34. Krnjevic K, Miledi R: Failure of neuromuscular propagation in rats. J Physiol (Lond) 140:440-461,1958
35. Merton PA: Voluntary strength and fatigue. J Physiol (Lond) 123:553-564, 1954
36. Edstrom L, Kugelberg E: Histochemical composition, distribution of fibers and fatiguability of single motor units (anterior tibial muscle of the rat). J Neurol Neurosurg Psychiatry 31:424-433,1968
37. Liberson WT: Experiment concerning reciprocal inhibition of antagonists elicited by electrical stimulation of agonists in a normal individual. Am J Phys Med 44:306-308,1965
38. Moritani T, DeVries HA: Neural factors versus hypertrophy in the time course of muscle strength gain. Am J Phys Med 58:115-130,1979
196 PHYSICAL THERAPY