Improved prediction of RNA tertiary structure with insights into native state dynamics
10
BIOINFORMATICS Improved prediction of RNA tertiary structure with insights into native state dynamics JOHN PAUL BIDA 1 and L. JAMES MAHER III 2 Department of Biochemistry and Molecular Biology, Mayo Clinic College of Medicine, Rochester, Minnesota 55905, USA ABSTRACT The importance of RNA tertiary structure is evident from the growing number of published high resolution NMR and X-ray crystallographic structures of RNA molecules. These structures provide insights into function and create a knowledge base that is leveraged by programs such as Assemble, ModeRNA, RNABuilder, NAST, FARNA, Mc-Sym, RNA2D3D, and iFoldRNA for tertiary structure prediction and design. While these methods sample native-like RNA structures during simulations, all struggle to capture the native RNA conformation after scoring. We propose RSIM, an improved RNA fragment assembly method that preserves RNA global secondary structure while sampling conformations. This approach enhances the quality of predicted RNA tertiary structure, provides insights into the native state dynamics, and generates a powerful visualization of the RNA conformational space. RSIM is available for download from http://www.github.com/jpbida/rsim. Keywords: conformation; Monte Carlo; RNA tertiary structure prediction; aptamer; noncanonical base-pairing INTRODUCTION Recent studies show that RNA tertiary structure and native dynamics play critical roles in regulating the catalytic ac- tivity, ligand binding, and overall function of RNA. For example, the catalytic core of the hammerhead ribozyme apparently exists as an ensemble of rapidly interconverting structures (Blount and Uhlenbeck 2005; Furtig et al. 2008). This rapid exchange is required for function and allows for coordination of Mg 2+ ions that precisely position certain atoms involved in catalysis. Likewise, the HIV-1 TAR RNA samples a range of conformations that can be selectively stabilized by various small molecule ligands (Bailor et al. 2010). Finally, it has been suggested that the structural flexibility of tRNA directly affects translational efficiency in the ribosome (So ¨ll and RajBhandary 1995; Ledoux et al. 2009). These studies not only emphasize the necessity of an accurate understanding of RNA tertiary structure but also illustrate the importance of native state dynamics (rather than rigidity) in RNA function. This dynamic nature of RNA makes identifying the functional structure of the molecule challenging. Existing RNA tertiary structure pre- diction software programs such as Assemble (Jossinet and Westhof 2005; Jossinet et al. 2010), FARNA (Das and Baker 2007), Mc-Sym (Parisien and Major 2008), ModeRNA (Rother et al. 2011), RNA2D3D (Martinez et al. 2008), and RNAbuilder (Flores et al. 2010) can produce thousands of predictions for a single sequence. Similarly, molecular dynamics programs such as NAST (Jonikas et al. 2009) and iFoldRNA (Ding et al. 2008; Sharma et al. 2008) generate thousands of trajectories. These predictions are usually filtered by score and clustered into groups of similar struc- tures to simplify the interpretation, and in all cases, this final filtering rarely identifies the most native-like conformation. Recently, Das et al. reported an extension of FARNA (Das et al. 2010). Termed fragment assembled RNA with full atom refinement (FARFAR), the method improves the quality of RNA structure prediction for noncanonical regions by introducing an all-atom energy function. This function augments the FARNA approach by including scores based on simple electrostatic considerations and backbone hydrogen bonding. This revision allowed FAR- FAR to identify RNA tertiary structures with heavy atom root-mean-squared deviation (RMSD) within 2 A ˚ of the native conformation for 14 small benchmark RNAs with lengths between 6 and 13 nucleotides (nt). However, the effectiveness of FARFAR declined as the length of the RNA molecules increased, having an average RMSD of 6.5 A ˚ for the 11 benchmarks >13 nt in length. This limitation is, in part, because the sampling method used by both FARNA 1 Present address: Department of Biochemistry, Stanford University, Stanford, CA 94305, USA. 2 Corresponding author. E-mail [email protected]. Article published online ahead of print. Article and publication date are at http://www.rnajournal.org/cgi/doi/10.1261/rna.027201.111. RNA (2012), 18:385–393. Published by Cold Spring Harbor Laboratory Press. Copyright Ó 2012 RNA Society. 385 Cold Spring Harbor Laboratory Press on June 16, 2016 - Published by rnajournal.cshlp.org Downloaded from
-
Upload
johnshopkins -
Category
Documents
-
view
2 -
download
0
Transcript of Improved prediction of RNA tertiary structure with insights into native state dynamics
BIOINFORMATICS
Improved prediction of RNA tertiary structure
with insights into native state dynamics
JOHN PAUL BIDA1 and L. JAMES MAHER III2
Department of Biochemistry and Molecular Biology, Mayo Clinic College of Medicine, Rochester, Minnesota 55905, USA
ABSTRACT
The importance of RNA tertiary structure is evident from the growing number of published high resolution NMR and X-raycrystallographic structures of RNA molecules. These structures provide insights into function and create a knowledge base thatis leveraged by programs such as Assemble, ModeRNA, RNABuilder, NAST, FARNA, Mc-Sym, RNA2D3D, and iFoldRNA fortertiary structure prediction and design. While these methods sample native-like RNA structures during simulations, all struggleto capture the native RNA conformation after scoring. We propose RSIM, an improved RNA fragment assembly method thatpreserves RNA global secondary structure while sampling conformations. This approach enhances the quality of predicted RNAtertiary structure, provides insights into the native state dynamics, and generates a powerful visualization of the RNAconformational space. RSIM is available for download from http://www.github.com/jpbida/rsim.
Keywords: conformation; Monte Carlo; RNA tertiary structure prediction; aptamer; noncanonical base-pairing
INTRODUCTION
Recent studies show that RNA tertiary structure and nativedynamics play critical roles in regulating the catalytic ac-tivity, ligand binding, and overall function of RNA. Forexample, the catalytic core of the hammerhead ribozymeapparently exists as an ensemble of rapidly interconvertingstructures (Blount and Uhlenbeck 2005; Furtig et al. 2008).This rapid exchange is required for function and allows forcoordination of Mg2+ ions that precisely position certainatoms involved in catalysis. Likewise, the HIV-1 TAR RNAsamples a range of conformations that can be selectivelystabilized by various small molecule ligands (Bailor et al.2010). Finally, it has been suggested that the structuralflexibility of tRNA directly affects translational efficiency inthe ribosome (Soll and RajBhandary 1995; Ledoux et al. 2009).
These studies not only emphasize the necessity of anaccurate understanding of RNA tertiary structure but alsoillustrate the importance of native state dynamics (ratherthan rigidity) in RNA function. This dynamic nature ofRNA makes identifying the functional structure of themolecule challenging. Existing RNA tertiary structure pre-
diction software programs such as Assemble (Jossinet andWesthof 2005; Jossinet et al. 2010), FARNA (Das and Baker2007), Mc-Sym (Parisien and Major 2008), ModeRNA(Rother et al. 2011), RNA2D3D (Martinez et al. 2008),and RNAbuilder (Flores et al. 2010) can produce thousandsof predictions for a single sequence. Similarly, moleculardynamics programs such as NAST (Jonikas et al. 2009) andiFoldRNA (Ding et al. 2008; Sharma et al. 2008) generatethousands of trajectories. These predictions are usuallyfiltered by score and clustered into groups of similar struc-tures to simplify the interpretation, and in all cases, this finalfiltering rarely identifies the most native-like conformation.
Recently, Das et al. reported an extension of FARNA(Das et al. 2010). Termed fragment assembled RNA withfull atom refinement (FARFAR), the method improves thequality of RNA structure prediction for noncanonicalregions by introducing an all-atom energy function. Thisfunction augments the FARNA approach by includingscores based on simple electrostatic considerations andbackbone hydrogen bonding. This revision allowed FAR-FAR to identify RNA tertiary structures with heavy atomroot-mean-squared deviation (RMSD) within 2 A of thenative conformation for 14 small benchmark RNAs withlengths between 6 and 13 nucleotides (nt). However, theeffectiveness of FARFAR declined as the length of the RNAmolecules increased, having an average RMSD of 6.5 A forthe 11 benchmarks >13 nt in length. This limitation is, inpart, because the sampling method used by both FARNA
1Present address: Department of Biochemistry, Stanford University,Stanford, CA 94305, USA.
2Corresponding author.E-mail [email protected] published online ahead of print. Article and publication date are
at http://www.rnajournal.org/cgi/doi/10.1261/rna.027201.111.
RNA (2012), 18:385–393. Published by Cold Spring Harbor Laboratory Press. Copyright � 2012 RNA Society. 385
Cold Spring Harbor Laboratory Press on June 16, 2016 - Published by rnajournal.cshlp.orgDownloaded from

and FARFAR prevents stepwise conformational changeswithout disruption of the global secondary structure. Thislimits the ability of the applications to explicitly define thesecondary structure and reduce the size of the conforma-tional space to be sampled.
Here, we report a novel approach to RNA tertiary struc-ture prediction that overcomes limitations inherent in bothFARFAR and FARNA. Our approach, RSIM, is illustratedin Figure 1. RSIM provides a fully automated applicationpredicting RNA tertiary structures from secondary struc-ture constraints using fragment assembly. These tertiarystructures are further refined with Monte Carlo simulationsutilizing a novel sampling method, an expanded statisticalpotential, and a diverse fragment library (SupplementalTable S1). Finally, RSIM tracks simulation paths duringrefinement. This allows representation of the predicted RNAconformational space as a graph with secondary structuresas nodes and simulation paths as edges. Graph theoreticanalysis can then be applied to predict regions in the con-formational space most likely to contain native-like RNAstructures. We present a comparison of our approach withFARNA by analyzing eight challenging benchmark RNAs.
We then use RSIM to provide examples of local dynamicspredictions for the anti-NF-kB-p50 RNA aptamer (Lebruskaand Maher 1999; Cassiday and Maher 2001), whose structurehas been studied at high resolution in bound and free forms(Huang et al. 2003; Reiter et al. 2008).
RESULTS AND DISCUSSION
Identifying secondary structure constraints for initialRNA structures
The number of possible conformations for even small RNAmolecules is immense, requiring sampling methods to ef-ficiently search the conformational space for prediction ofnative-like structures. One strength of Fragment Assem-bly of RNA (FARNA) (Das and Baker 2007) is its ability torestrict the searched conformational space by exploitingcorrelations between torsion angles in RNA fragments ex-tracted from the database of high resolution structures.Even using FARNA, however, conformational samplingremains the computational bottleneck for accurate struc-ture prediction.
To reduce the size of the conformational space sampled,RSIM uses secondary structure constraints to generatea diverse set of initial tertiary structures for refinementwith Monte Carlo simulations. For benchmarking againstFARNA, the top ten suboptimal secondary structures aspredicted by the ViennaRNA thermodynamic foldingalgorithm (Hofacker et al. 1994) were used. However, con-straints can be generated from any secondary structureprediction program. The web server CompaRNA (T Puton,K Rother, q Koz1owski, E Tkalinska, and J Bujnicki, inprep.) provides a continuously updated ranking of RNAsecondary structure prediction programs, with Centroid-Fold (Hamada et al. 2009; Sato et al. 2009), Contrafold (Doet al. 2006), and McQFold (Metzler and Nebel 2008)performing the best in pairwise comparison tests. MC-Fold(Parisien and Major 2008) is not currently evaluated by theCompaRNA server but is also an excellent choice.
Generating tertiary structures with guidedfragment assembly
Programs such as RNA2D3D (Martinez et al. 2008) canrapidly generate a tertiary structure for a given secondarystructure. However, the generated tertiary structure oftenhas steric clashes or unrealistic loop conformations. Addi-tionally, we sought to generate a diverse set of initial tertiarystructures, a goal not currently possible in RNA2D3D.RSIM provides an automated method to convert a second-ary structure into a series of fragment assembly steps toensure that each base-pairing constraint is met.
The process of converting a secondary structure intofragment assembly steps begins with the hairpin loops inthe secondary structure. For each hairpin loop, RSIM
FIGURE 1. RSIM RNA structure prediction workflow. (A) InitialRNA secondary structure constraints are defined from suboptimalsecondary structures predicted using the ViennaRNA folding algo-rithm (Hofacker et al. 1994). (B) Multiple tertiary structures for eachsecondary structure are generated using guided fragment assembly.(C) Monte Carlo simulations using closed moves and a statisticalpotential are performed for each initial tertiary structure. (D) A graphrepresentation is generated of the conformational space with nodesbeing secondary structures, colored by score, and edges being simula-tion paths.
Bida and Maher
386 RNA, Vol. 18, No. 3
Cold Spring Harbor Laboratory Press on June 16, 2016 - Published by rnajournal.cshlp.orgDownloaded from
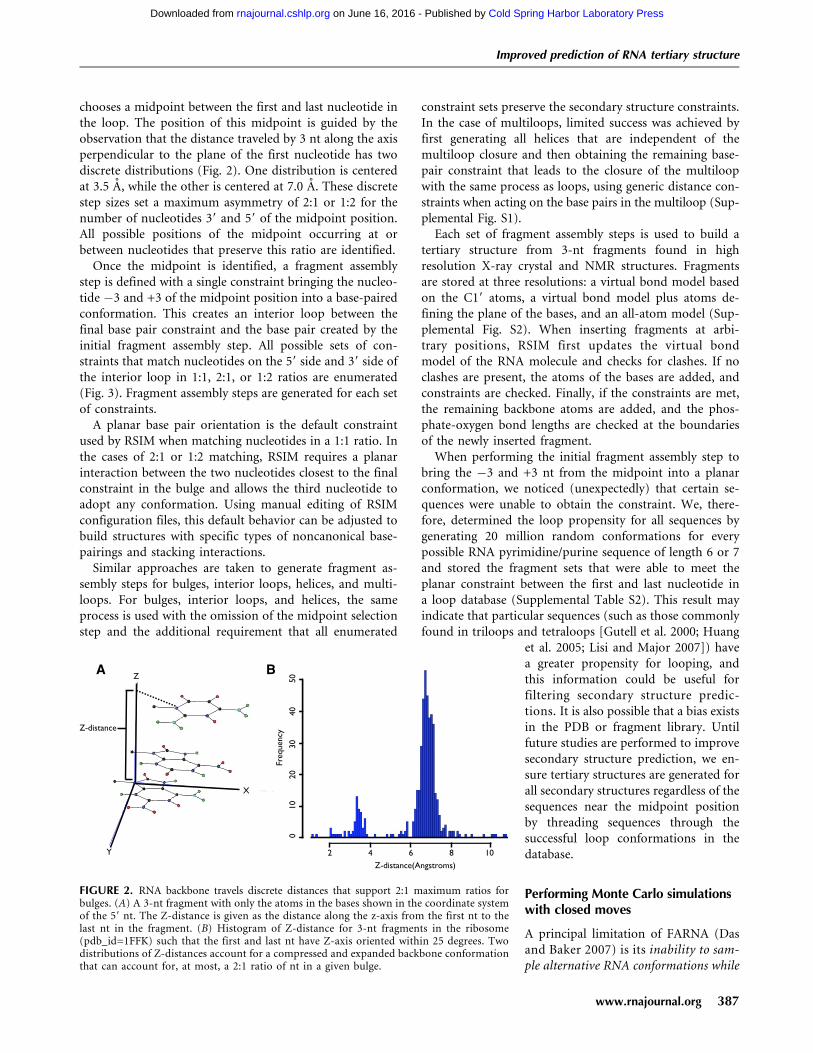
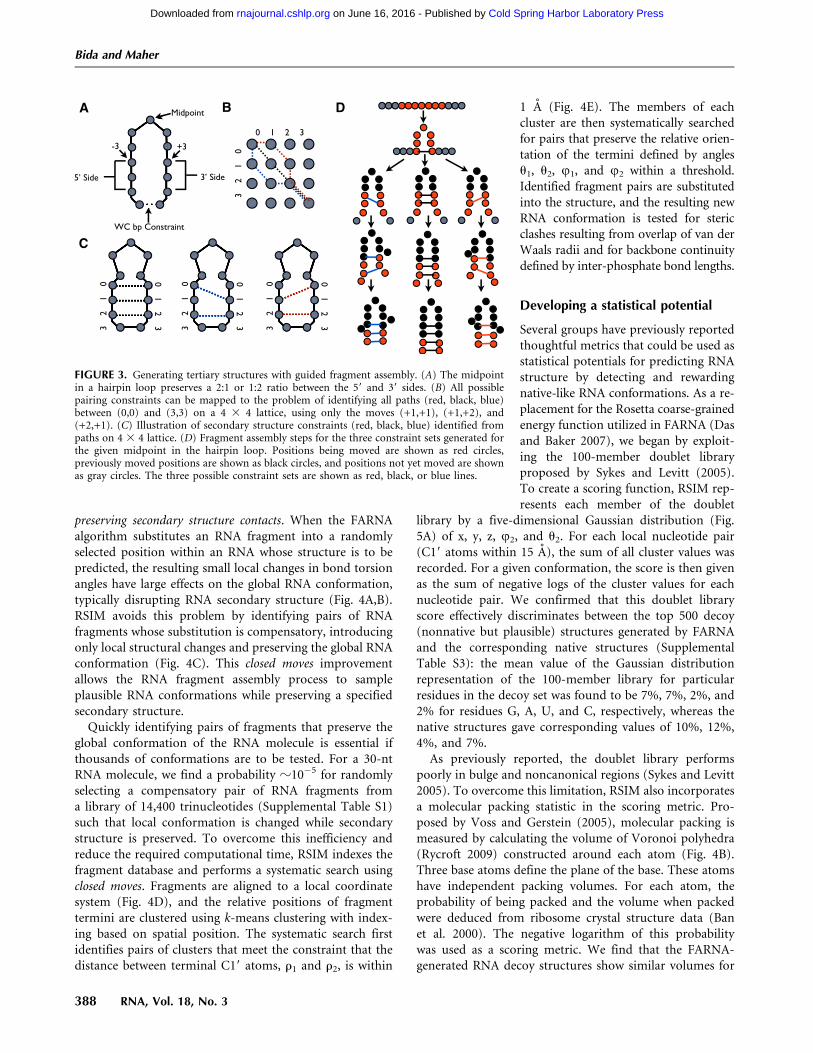
chooses a midpoint between the first and last nucleotide inthe loop. The position of this midpoint is guided by theobservation that the distance traveled by 3 nt along the axisperpendicular to the plane of the first nucleotide has twodiscrete distributions (Fig. 2). One distribution is centeredat 3.5 A, while the other is centered at 7.0 A. These discretestep sizes set a maximum asymmetry of 2:1 or 1:2 for thenumber of nucleotides 39 and 59 of the midpoint position.All possible positions of the midpoint occurring at orbetween nucleotides that preserve this ratio are identified.
Once the midpoint is identified, a fragment assemblystep is defined with a single constraint bringing the nucleo-tide �3 and +3 of the midpoint position into a base-pairedconformation. This creates an interior loop between thefinal base pair constraint and the base pair created by theinitial fragment assembly step. All possible sets of con-straints that match nucleotides on the 59 side and 39 side ofthe interior loop in 1:1, 2:1, or 1:2 ratios are enumerated(Fig. 3). Fragment assembly steps are generated for each setof constraints.
A planar base pair orientation is the default constraintused by RSIM when matching nucleotides in a 1:1 ratio. Inthe cases of 2:1 or 1:2 matching, RSIM requires a planarinteraction between the two nucleotides closest to the finalconstraint in the bulge and allows the third nucleotide toadopt any conformation. Using manual editing of RSIMconfiguration files, this default behavior can be adjusted tobuild structures with specific types of noncanonical base-pairings and stacking interactions.
Similar approaches are taken to generate fragment as-sembly steps for bulges, interior loops, helices, and multi-loops. For bulges, interior loops, and helices, the sameprocess is used with the omission of the midpoint selectionstep and the additional requirement that all enumerated
constraint sets preserve the secondary structure constraints.In the case of multiloops, limited success was achieved byfirst generating all helices that are independent of themultiloop closure and then obtaining the remaining base-pair constraint that leads to the closure of the multiloopwith the same process as loops, using generic distance con-straints when acting on the base pairs in the multiloop (Sup-plemental Fig. S1).
Each set of fragment assembly steps is used to build atertiary structure from 3-nt fragments found in highresolution X-ray crystal and NMR structures. Fragmentsare stored at three resolutions: a virtual bond model basedon the C19 atoms, a virtual bond model plus atoms de-fining the plane of the bases, and an all-atom model (Sup-plemental Fig. S2). When inserting fragments at arbi-trary positions, RSIM first updates the virtual bondmodel of the RNA molecule and checks for clashes. If noclashes are present, the atoms of the bases are added, andconstraints are checked. Finally, if the constraints are met,the remaining backbone atoms are added, and the phos-phate-oxygen bond lengths are checked at the boundariesof the newly inserted fragment.
When performing the initial fragment assembly step tobring the �3 and +3 nt from the midpoint into a planarconformation, we noticed (unexpectedly) that certain se-quences were unable to obtain the constraint. We, there-fore, determined the loop propensity for all sequences bygenerating 20 million random conformations for everypossible RNA pyrimidine/purine sequence of length 6 or 7and stored the fragment sets that were able to meet theplanar constraint between the first and last nucleotide ina loop database (Supplemental Table S2). This result mayindicate that particular sequences (such as those commonlyfound in triloops and tetraloops [Gutell et al. 2000; Huang
et al. 2005; Lisi and Major 2007]) havea greater propensity for looping, andthis information could be useful forfiltering secondary structure predic-tions. It is also possible that a bias existsin the PDB or fragment library. Untilfuture studies are performed to improvesecondary structure prediction, we en-sure tertiary structures are generated forall secondary structures regardless of thesequences near the midpoint positionby threading sequences through thesuccessful loop conformations in thedatabase.
Performing Monte Carlo simulationswith closed moves
A principal limitation of FARNA (Dasand Baker 2007) is its inability to sam-ple alternative RNA conformations while
FIGURE 2. RNA backbone travels discrete distances that support 2:1 maximum ratios forbulges. (A) A 3-nt fragment with only the atoms in the bases shown in the coordinate systemof the 59 nt. The Z-distance is given as the distance along the z-axis from the first nt to thelast nt in the fragment. (B) Histogram of Z-distance for 3-nt fragments in the ribosome(pdb_id=1FFK) such that the first and last nt have Z-axis oriented within 25 degrees. Twodistributions of Z-distances account for a compressed and expanded backbone conformationthat can account for, at most, a 2:1 ratio of nt in a given bulge.
Improved prediction of RNA tertiary structure
www.rnajournal.org 387
Cold Spring Harbor Laboratory Press on June 16, 2016 - Published by rnajournal.cshlp.orgDownloaded from
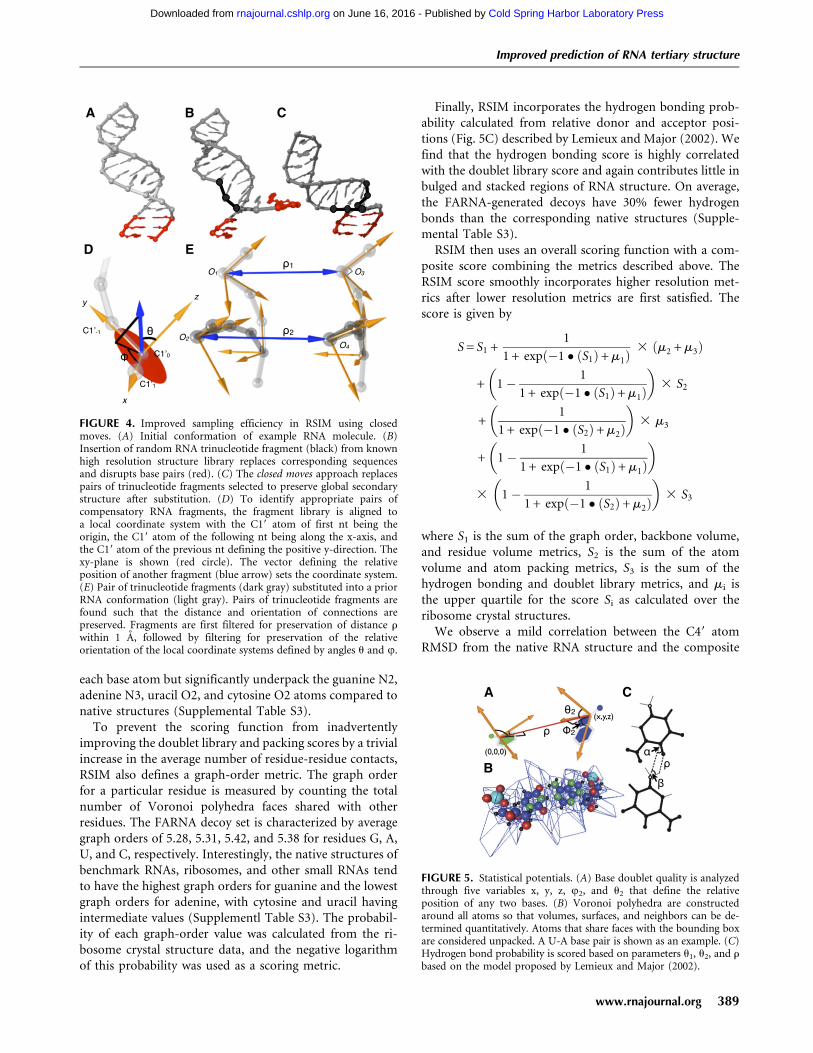
preserving secondary structure contacts. When the FARNAalgorithm substitutes an RNA fragment into a randomlyselected position within an RNA whose structure is to bepredicted, the resulting small local changes in bond torsionangles have large effects on the global RNA conformation,typically disrupting RNA secondary structure (Fig. 4A,B).RSIM avoids this problem by identifying pairs of RNAfragments whose substitution is compensatory, introducingonly local structural changes and preserving the global RNAconformation (Fig. 4C). This closed moves improvementallows the RNA fragment assembly process to sampleplausible RNA conformations while preserving a specifiedsecondary structure.
Quickly identifying pairs of fragments that preserve theglobal conformation of the RNA molecule is essential ifthousands of conformations are to be tested. For a 30-ntRNA molecule, we find a probability z10�5 for randomlyselecting a compensatory pair of RNA fragments froma library of 14,400 trinucleotides (Supplemental Table S1)such that local conformation is changed while secondarystructure is preserved. To overcome this inefficiency andreduce the required computational time, RSIM indexes thefragment database and performs a systematic search usingclosed moves. Fragments are aligned to a local coordinatesystem (Fig. 4D), and the relative positions of fragmenttermini are clustered using k-means clustering with index-ing based on spatial position. The systematic search firstidentifies pairs of clusters that meet the constraint that thedistance between terminal C19 atoms, r1 and r2, is within
1 A (Fig. 4E). The members of eachcluster are then systematically searchedfor pairs that preserve the relative orien-tation of the termini defined by anglesu1, u2, u1, and u2 within a threshold.Identified fragment pairs are substitutedinto the structure, and the resulting newRNA conformation is tested for stericclashes resulting from overlap of van derWaals radii and for backbone continuitydefined by inter-phosphate bond lengths.
Developing a statistical potential
Several groups have previously reportedthoughtful metrics that could be used asstatistical potentials for predicting RNAstructure by detecting and rewardingnative-like RNA conformations. As a re-placement for the Rosetta coarse-grainedenergy function utilized in FARNA (Dasand Baker 2007), we began by exploit-ing the 100-member doublet libraryproposed by Sykes and Levitt (2005).To create a scoring function, RSIM rep-resents each member of the doublet
library by a five-dimensional Gaussian distribution (Fig.5A) of x, y, z, u2, and u2. For each local nucleotide pair(C19 atoms within 15 A), the sum of all cluster values wasrecorded. For a given conformation, the score is then givenas the sum of negative logs of the cluster values for eachnucleotide pair. We confirmed that this doublet libraryscore effectively discriminates between the top 500 decoy(nonnative but plausible) structures generated by FARNAand the corresponding native structures (SupplementalTable S3): the mean value of the Gaussian distributionrepresentation of the 100-member library for particularresidues in the decoy set was found to be 7%, 7%, 2%, and2% for residues G, A, U, and C, respectively, whereas thenative structures gave corresponding values of 10%, 12%,4%, and 7%.
As previously reported, the doublet library performspoorly in bulge and noncanonical regions (Sykes and Levitt2005). To overcome this limitation, RSIM also incorporatesa molecular packing statistic in the scoring metric. Pro-posed by Voss and Gerstein (2005), molecular packing ismeasured by calculating the volume of Voronoi polyhedra(Rycroft 2009) constructed around each atom (Fig. 4B).Three base atoms define the plane of the base. These atomshave independent packing volumes. For each atom, theprobability of being packed and the volume when packedwere deduced from ribosome crystal structure data (Banet al. 2000). The negative logarithm of this probabilitywas used as a scoring metric. We find that the FARNA-generated RNA decoy structures show similar volumes for
FIGURE 3. Generating tertiary structures with guided fragment assembly. (A) The midpointin a hairpin loop preserves a 2:1 or 1:2 ratio between the 59 and 39 sides. (B) All possiblepairing constraints can be mapped to the problem of identifying all paths (red, black, blue)between (0,0) and (3,3) on a 4 3 4 lattice, using only the moves (+1,+1), (+1,+2), and(+2,+1). (C) Illustration of secondary structure constraints (red, black, blue) identified frompaths on 4 3 4 lattice. (D) Fragment assembly steps for the three constraint sets generated forthe given midpoint in the hairpin loop. Positions being moved are shown as red circles,previously moved positions are shown as black circles, and positions not yet moved are shownas gray circles. The three possible constraint sets are shown as red, black, or blue lines.
Bida and Maher
388 RNA, Vol. 18, No. 3
Cold Spring Harbor Laboratory Press on June 16, 2016 - Published by rnajournal.cshlp.orgDownloaded from
each base atom but significantly underpack the guanine N2,adenine N3, uracil O2, and cytosine O2 atoms compared tonative structures (Supplemental Table S3).
To prevent the scoring function from inadvertentlyimproving the doublet library and packing scores by a trivialincrease in the average number of residue-residue contacts,RSIM also defines a graph-order metric. The graph orderfor a particular residue is measured by counting the totalnumber of Voronoi polyhedra faces shared with otherresidues. The FARNA decoy set is characterized by averagegraph orders of 5.28, 5.31, 5.42, and 5.38 for residues G, A,U, and C, respectively. Interestingly, the native structures ofbenchmark RNAs, ribosomes, and other small RNAs tendto have the highest graph orders for guanine and the lowestgraph orders for adenine, with cytosine and uracil havingintermediate values (Supplementl Table S3). The probabil-ity of each graph-order value was calculated from the ri-bosome crystal structure data, and the negative logarithmof this probability was used as a scoring metric.
Finally, RSIM incorporates the hydrogen bonding prob-ability calculated from relative donor and acceptor posi-tions (Fig. 5C) described by Lemieux and Major (2002). Wefind that the hydrogen bonding score is highly correlatedwith the doublet library score and again contributes little inbulged and stacked regions of RNA structure. On average,the FARNA-generated decoys have 30% fewer hydrogenbonds than the corresponding native structures (Supple-mental Table S3).
RSIM then uses an overall scoring function with a com-posite score combining the metrics described above. TheRSIM score smoothly incorporates higher resolution met-rics after lower resolution metrics are first satisfied. Thescore is given by
S = S1 +1
1 + expð�1 � ðS1Þ+ m1Þ3 ðm2 + m3Þ
+ 1� 1
1 + expð�1 � ðS1Þ+ m1Þ
� �3 S2
+1
1 + expð�1 � ðS2Þ+ m2Þ
� �3 m3
+ 1� 1
1 + expð�1 � ðS1Þ+ m1Þ
� �
3 1� 1
1 + expð�1 � ðS2Þ+ m2Þ
� �3 S3
where S1 is the sum of the graph order, backbone volume,and residue volume metrics, S2 is the sum of the atomvolume and atom packing metrics, S3 is the sum of thehydrogen bonding and doublet library metrics, and mi isthe upper quartile for the score Si as calculated over theribosome crystal structures.
We observe a mild correlation between the C49 atomRMSD from the native RNA structure and the composite
FIGURE 4. Improved sampling efficiency in RSIM using closedmoves. (A) Initial conformation of example RNA molecule. (B)Insertion of random RNA trinucleotide fragment (black) from knownhigh resolution structure library replaces corresponding sequencesand disrupts base pairs (red). (C) The closed moves approach replacespairs of trinucleotide fragments selected to preserve global secondarystructure after substitution. (D) To identify appropriate pairs ofcompensatory RNA fragments, the fragment library is aligned toa local coordinate system with the C19 atom of first nt being theorigin, the C19 atom of the following nt being along the x-axis, andthe C19 atom of the previous nt defining the positive y-direction. Thexy-plane is shown (red circle). The vector defining the relativeposition of another fragment (blue arrow) sets the coordinate system.(E) Pair of trinucleotide fragments (dark gray) substituted into a priorRNA conformation (light gray). Pairs of trinucleotide fragments arefound such that the distance and orientation of connections arepreserved. Fragments are first filtered for preservation of distance rwithin 1 A, followed by filtering for preservation of the relativeorientation of the local coordinate systems defined by angles u and u.
FIGURE 5. Statistical potentials. (A) Base doublet quality is analyzedthrough five variables x, y, z, u2, and u2 that define the relativeposition of any two bases. (B) Voronoi polyhedra are constructedaround all atoms so that volumes, surfaces, and neighbors can be de-termined quantitatively. Atoms that share faces with the bounding boxare considered unpacked. A U-A base pair is shown as an example. (C)Hydrogen bond probability is scored based on parameters u1, u2, and rbased on the model proposed by Lemieux and Major (2002).
Improved prediction of RNA tertiary structure
www.rnajournal.org 389
Cold Spring Harbor Laboratory Press on June 16, 2016 - Published by rnajournal.cshlp.orgDownloaded from

score in our benchmark simulations with an averagePearson correlation of 0.31 (Supplemental Fig. S3). Thelow resolution (S1), medium resolution (S2), and high re-solution (S3) scores were characterized by C49 RMSD cor-relations of 0.19, �0.06, and 0.28, respectively.
Generating a conformational spaceusing closed moves
Initial RNA tertiary structures generated by RSIM areminimized using the statistical potential and a Monte Carlomethod with closed move sampling. Throughout thesimulation, RSIM tracks the secondary structure of theconformation using the matching constraints that gener-ated initial tertiary structures. This allows visualization ofthe entire conformational space as a graph with secondarystructures as nodes and closed moves as edges. For RNAscharacterized by a distinct global minimum energy struc-ture, nearby structures in the conformational space arelikely to have native-like structures.
Benchmarking against FARNA
When reporting RNA tertiary structure prediction for aninitial set of benchmark RNAs, the FARNA (Das and Baker2007) analysis used the best of the top five predictedclusters based on matching noncanonical secondary struc-ture informed by the known native RNA structures. Forcomparison, Table 1 reports the best RSIM predicted RNAtertiary structures from the top five clusters (Top RC)
along with the top cluster predicted without any knowledgeof the native structure (Top SC). Table 1 demonstrates thatRSIM outperforms FARNA for all benchmarks, improvingby an average of 1.3 A C49 atom RMSD when using the topcluster approach. Structure prediction is improved in six ofeight cases (average 0.74 A RMSD) when taking the bestcluster based on score alone. It is further important to notethat these results were accomplished with 20-fold fewersimulations, where each simulation has a run time com-parable to that of the FARNA program.
The top 1% of predictions by score for FARNA (n = 500)and RSIM (n = 50) were evaluated for the prevalence of the74 canonical and 27 noncanonical base-pairings that occurin the high resolution structures of the native conforma-tions of the eight benchmarks. Table 2 uses interactionfaces (Parisien et al. 2009) and nucleotide composition tocategorize base-pairings predicted in the benchmarks. Wesee that both RSIM and FARNA struggle to capturenoncanonical base-pairings, with RSIM being superior,predicting 8/27 with an average frequency of 30.3% andFARNA predicting 13/27 with an average frequency of10.8%. For canonical base-pairings, RSIM outperformsFARNA, predicting 70/74 in 36.4% of the top 1% ofpredictions, compared to 60/74 identified in 47.3% of thetop 1% of predictions for FARNA. The best scoringprediction by RSIM for the loop D/loop E arm of theEscherichia coli 5S rRNA molecule (pdb_id 1a4d) captured1/6 noncanonical base-pairings (Fig. 6). Only 2/6 of thepossible noncanonical pairs were observed in the top 1%of all predictions. The limited ability of FARNA and RSIM
TABLE 1. Comparing RSIM and FARNA on a common set of RNA benchmarks
FARNA (RMSD, A) RSIM (RMSD, A)Conformational spaceanalysisa (RMSD, A)
PDBb Methodc Lend(nt) Top RCe Overallf Ng Top RCe Overallf Top SCh Ng Center Degree W. Center
1XJR X-ray 46 9.82 6.25 28949 6.64(1) 4.81 6.64 1200 7.17 8.042 7.921A4D NMR 41 6.48 3.43 69103 4.66(5) 3.20 5.27 1200 5.91 5.69 5.0132F88 NMR 34 3.63 2.41 81492 3.47(1) 2.53 3.47 1200 3.12 5.18 3.1228SP NMR 28 3.20 2.31 48817 2.48(3) 2.22 3.40 1200 3.69 3.54 4.511Q9A X-ray 27 6.11 2.65 65977 4.30(4) 3.67 4.90 1200 5.1 4.57 4.61QWA NMR 21 3.71 2.01 24646 3.42(1) 2.58 3.42 1200 6.28 5.93 5.951ESY NMR 19 3.98 1.44 46034 2.91(3) 2.61 3.89 1200 4.11 4.9 41KKA NMR 17 4.14 2.08 36664 4.06(3) 2.85 4.20 1200 5.81 5.63 6.3
aRMSD values after conformational space analysis performed on the largest connected graph of the 5000 lowest scoring conformations sampledduring all simulations. Closed moves and a 2-A RMSD threshold define the edges. Center is defined as the conformation with the shortestaverage path distance to all other conformations with edge lengths all equal to one. Weighted Center (W. Center) is identical to Center exceptthat the edge lengths are weighted based on the difference in score between the two conformations connected by the edge. Degree is the RNAconformation with the most edges.bProtein Data Bank identifier for the X-ray or NMR structure of the RNA benchmark.cExperimental technique used to solve the structure of the RNA benchmark.dLength of the RNA molecule in nt.eRMSD of the cluster among the top five clusters by score that best matches the noncanonical RNA secondary structure. Value in parenthesesindicates the rank of this cluster by score for RSIM.fRMSD of the best conformation sampled during all simulations regardless of score. This is the lower bound of the 3D sampling and can only becalculated when the native structure is known.gNumber of Monte Carlo simulations performed for each RNA benchmark.hRMSD of the best cluster by score alone.
Bida and Maher
390 RNA, Vol. 18, No. 3
Cold Spring Harbor Laboratory Press on June 16, 2016 - Published by rnajournal.cshlp.orgDownloaded from

to capture noncanonical base-pairings may result from thelow frequency of RNA library fragments that supporthelices containing base-base interactions on the Hoogsteenand sugar faces of bases. Optimization of the fragmentlibrary to include a balanced distribution of fragments fromsuch helices might improve noncanonical base-pairingprediction. However, the frequency of such interactionsin the PDB is extremely low (Supplemental Table S4), andcomputational approaches will be needed to generateadditional sets of fragments.
Applying secondary structure clustering and graphtheoretic analysis to conformational space
The ability to represent the RNA conformational space asa graph is a feature of the RSIM approach. This providesopportunities to leverage graph theoretic metrics to identifyregions most likely to contain native-like RNA conforma-tions and to cluster the graph representations of the con-formational spaces from sequence variants to identify acommon functional tertiary structure.
To explore these ideas, RSIM wasused to predict the structure of the29-nt anti-NF-kB p50 RNA aptamerthat was identified by in vitro selectionin our laboratory and subsequently stud-ied extensively (Lebruska and Maher1999; Cassiday and Maher 2001; Cassidayet al. 2002; Huang et al. 2003; Ghoshet al. 2004). This RNA was selected invitro for the ability to bind to the DNA-binding NF-kB p502 protein homodimerand has been shown to mimic DNA bycreating an unusually wide major groove(Reiter et al. 2008). Interestingly, the topscoring cluster of predicted structures(Fig. 7A, blue) does not feature this widemajor groove (Fig. 7A, black). However,the conformation with the largest numberof edges (hence, the greatest sampling)(Fig. 7A, purple) has an unusually widemajor groove and the correct relativebase orientations. This observation isimportant because it suggests that theanti-NF-kB p50 RNA aptamer dynami-cally samples an ensemble of conforma-tions including the functional structureseen in X-ray and NMR experiments.In this case, the graph theoretic analysisdid not improve the overall ability to pre-dict native-like structures over second-ary structure clustering alone (Table 1).However, these metrics provide uniqueinsights into likely RNA dynamics, high-lighting RNA tertiary structures that are
important for stabilizing or destabilizing certain regions ofthe conformational space.
Extending accurate tertiary RNA structure predictionto longer molecules
The RSIM sampling approach reported here extends thereach of fragment-based RNA tertiary structure predictionto RNA molecules >40 nt in length. We found that, for thelongest benchmark RNA, 1xjr (46 nt), RSIM improved theoverall best-sampled conformation by 1.4 A RMSD (6.25 Ato 4.8 A). As RNA length increases, the accuracy of secondarystructure prediction becomes increasingly important.
Prediction of native state dynamicsand functional structures
As described above, RSIM extends the FARNA approachfor RNA structure prediction while providing insight intothe native state dynamics of the RNA molecules beingsimulated. Obviously, the statistical potential provides noinformation about the time required to move along a given
TABLE 2. Predicted base-pairing details
Native RSIM predictions FARNA predictions
Face1:Face2a Nuc1-Nuc2b Totalc H-Bondsd Total (%)e H-Bondsd Total (%)e H-Bondsd
Noncanonical base-pairingsW:W A-A 1 1.00 1 (20.0) 0.86 1 (1.0) 0.81S:H A-C 1 0.93 — —W:W A-C 1 1.03 1 (32.0) 1.20 —H:W A-U 1 1.86 — 1 (1.4) 0.79H:S A-U 2 1.00 — 1 (8.2) 0.86H:W A-U 2 2.20 1 (6.0) 0.95 2 (1.1) 0.92W:W C-U 1 0.54 1 (30.0) 1.20 1 (18.2) 0.92H:S G-A 2 2.00 — —H:W G-A 1 1.01 — 1 (0.6) 0.67S:H G-A 3 1.35 1 (18.0) 1.03 2 (31.3) 1.12S:W G-A 1 1.95 — —M:M G-C 1 0.22 1 (74.0) 0.02 —W:M G-C 1 1.98 — —M:W G-C 1 1.82 — 1 (0.2) 1.79W:H G-C 1 0.91 — 1 (0.2) 0.98S:S G-C 2 0.95 — —W:H G-G 1 1.83 — 1 (0.4) 1.12W:H G-U 1 1.17 — —S:H G-U 1 1.21 — —W:W G-A 2 2.00 2 (30.0) 1.40 1 (46.0) 1.81
Totals 27 8 (30.3) 13 (10.8)Canonical base-pairingsW:W A-U 17 2.00 17 (30.7) 1.61 13 (42.7) 1.71W:W G-C 49 3.00 45 (36.4) 1.72 41 (48.0) 2.17W:W G-U 8 2.00 8 (48.5) 1.29 6 (52.3) 1.52
Totals 74 70 (36.4) 60 (47.3)
aFaces of the nt where hydrogen bonding occurs; (W) Watson, (H) Hoogsteen, (S) Sugar, (M)Multiple.bNt composition of the base pair.cTotal number of base-pairs with the given nt composition and interaction faces.dHydrogen bonding probability between the two nt.ePercentage of the top 1% of predictions by score that has the given base-pairing present.
Improved prediction of RNA tertiary structure
www.rnajournal.org 391
Cold Spring Harbor Laboratory Press on June 16, 2016 - Published by rnajournal.cshlp.orgDownloaded from

simulation path. However, the coarse-grained conforma-tional space could be used to direct shorter moleculardynamics simulations in order to estimate transition rates.Beyond insight into native dynamics, the RSIM conforma-tional space graph representation reduces the dimension-ality of the simulation data in a way that is amenable tomachine learning and clustering. For example, one possibleapproach to identify functional RNA conformations wouldleverage experimental data to generate graph representa-tions of conformational spaces for both functional andnonfunctional RNA sequence variants. It might then bepossible to identify regions in the conformational spacethat are significantly enriched for functional variants.
Limitations
The described implementation of RSIM does not automatethe prediction of pseudoknotted RNA structures and re-quires hand editing of configuration files for complicatedbranched structures. However, prediction of such structuresis not incompatible with any aspect of the algorithm, andthese capabilities will be implemented in future versions.Interestingly, we have also found that z2% of initial RNAconformations remained ‘‘locked’’ in conformations fromwhich no possible closed moves are identifiable in thecurrent RNA fragment library. This limitation may beovercome by increasing the size of the RNA fragmentlibrary or by reducing constraints until moves are possible.
METHODS
Simulations
The current implementation of RSIM is limited to single-strandedRNA molecules without pseudoknots. To compare its prediction
performance against FARNA, all eight of the single-strandedRNA molecules were chosen from the published set of FARNAbenchmarks (Das and Baker 2007). Initial tertiary structures weregenerated from the top 10 secondary structures by energy, withC19 atoms of the first and last nucleotide of each RNA moleculebeing held within 15 A throughout the simulations. For each RNAsequence, 120 initial structures were generated, 12 from eachsecondary structure. Monte Carlo simulations using the metrop-olis criteria were performed under constant temperature until1000 accepted moves or 50,000 steps were made. After all simu-lations were completed, the clustering methods described abovewere applied to identify native-like conformations.
Constructing the conformational space
The RNA conformational space was constructed by creating nodesrepresenting the top 5000 conformations (by score) sampledduring any of the simulations. Edges between conformations weregenerated from simulation paths or a 2-A pairwise RMSDthreshold within a secondary structure cluster. After graph con-struction, the Center, Weighted Center, and Maximal Degreenodes were identified. The Center is defined as the node that hasthe shortest average distance to all other nodes with edge lengthsall equal to 1, whereas the Weighted Center uses edge lengthsequal to the difference in score. The Maximal Degree node isdefined as the node with the largest number of edges.
Secondary structure clustering
Secondary structure clustering identified all RNA conformationswith identical secondary structures defined by the planar andstacking constraints. The top five secondary structure clusters basedon the lowest scoring structure in each cluster were determined.
FIGURE 6. Predicted noncanonical base-pairings in loop D/loop E armof E. coli 5S rRNA. (A) Comparison of NMR structure (pdb_id 1a4d) ofloop D/loop E arm of E. coli 5S rRNA (black) and the best RSIMprediction by score (gray). (B) Noncanonical base pairs appearing in theNMR structure (black), relative position of same bases in best scoringRSIM prediction (gray), best prediction of base pair occurring in top 1%of RSIM predictions by score (red). Only one of the six noncanonicalbase pairs occurred in the RSIMs best scoring structure, and only twowere present in the top 1% of all RSIM predictions by score.
FIGURE 7. Predicted RNA tertiary structures and graph representa-tion of conformational space. (A) Ribbon diagram through the C49backbone atoms of predicted conformations for the 29-nt anti-NF-kBp50 RNA aptamer based on the secondary structure cluster with thebest overall score (blue), Graph Center (red), Weighted Center (green),Maximal Degree (purple), and RMSD (cyan) compared to the nativeconformation identified experimentally by NMR (black) (Reiter et al.2008). (B) Graph representation of conformational space with simu-lation paths (gray lines) and conformations colored by low (red) tohigh (yellow) score with radius proportional to the RMSD from thenative structure. Colored squares are locations of backbone conforma-tions shown in A with the same coloring scheme. Secondary structurediagrams show the relative base positions with arrows pointing to eachregion of the space, with the native structure illustrated on the bottomright.
Bida and Maher
392 RNA, Vol. 18, No. 3
Cold Spring Harbor Laboratory Press on June 16, 2016 - Published by rnajournal.cshlp.orgDownloaded from
SUPPLEMENTAL MATERIAL
Supplemental material is available for this article.
ACKNOWLEDGMENTS
We acknowledge the helpful assistance of Karen Magee and theMayo Clinic Research Computing Facility and the members ofthe Maher laboratory. This work was supported by the MayoFoundation and by NIH grant GM068128 to L.J.M.
Received March 11, 2011; accepted November 28, 2011.
REFERENCES
Bailor MH, Sun X, Al-Hashimi HM. 2010. Topology links RNAsecondary structure with global conformation, dynamics, andadaptation. Science 327: 202–206.
Ban N, Nissen P, Hansen J, Moore PB, Steitz TA. 2000. The completeatomic structure of the large ribosomal subunit at 2.4 A resolution.Science 289: 905–920.
Blount KF, Uhlenbeck OC. 2005. The structure-function dilemma ofthe hammerhead ribozyme. Annu Rev Biophys Biomol Struct 34:415–440.
Cassiday LA, Maher LJ III. 2001. In vivo recognition of an RNA aptamerby its transcription factor target. Biochemistry 40: 2433–2438.
Cassiday LA, Lebruska LL, Benson LM, Naylor S, Owen WG, MaherLJ III. 2002. Binding stoichiometry of an RNA aptamer and itstranscription factor target. Anal Biochem 306: 290–297.
Das R, Baker D. 2007. Automated de novo prediction of native-likeRNA tertiary structures. Proc Natl Acad Sci 104: 14664–14669.
Das R, Karanicolas J, Baker D. 2010. Atomic accuracy in predictingand designing noncanonical RNA structure. Nat Methods 7: 291–294.
Ding F, Sharma S, Chalasani P, Demidov VV, Broude NE, DokholyanNV. 2008. Ab initio RNA folding by discrete molecular dynamics:From structure prediction to folding mechanisms. RNA 14: 1164–1173.
Do CB, Woods DA, Batzoglou S. 2006. CONTRAfold: RNA secondarystructure prediction without physics-based models. Bioinformatics22: e90–e98.
Flores SC, Wan Y, Russell R, Altman RB. 2010. Predicting RNAstructure by multiple template homology modeling. Pac SympBiocomput 2010: 216–227.
Furtig B, Richter C, Schell P, Wenter P, Pitsch S, Schwalbe H. 2008.NMR-spectroscopic characterization of phosphodiester bondcleavage catalyzed by the minimal hammerhead ribozyme. RNABiol 5: 41–48.
Ghosh G, Huang DB, Huxford T. 2004. Molecular mimicry of theNF-kB DNA target site by a selected RNA aptamer. Curr OpinStruct Biol 14: 21–27.
Gutell RR, Cannone JJ, Shang Z, Du Y, Serra MJ. 2000. A story:Unpaired adenosine bases in ribosomal RNAs. J Mol Biol 304:335–354.
Hamada M, Kiryu H, Sato K, Mituyama T, Asai K. 2009. Prediction ofRNA secondary structure using generalized centroid estimators.Bioinformatics 25: 465–473.
Hofacker IL, Fontana W, Stadler PF, Bonhoeffer LS, Tacker M,Schuster P. 1994. Fast folding and comparison of RNA secondary
structures. Monatshefte fur Chemie / Chemical Monthly 125: 167–188.
Huang DB, Vu D, Cassiday LA, Zimmerman JM, Maher LJ III, GhoshG. 2003. Crystal structure of NF-kB (p50)2 complexed to a high-affinity RNA aptamer. Proc Natl Acad Sci 100: 9268–9273.
Huang HC, Nagaswamy U, Fox GE. 2005. The application of clusteranalysis in the intercomparison of loop structures in RNA. RNA11: 412–423.
Jonikas MA, Radmer RJ, Laederach A, Das R, Pearlman S, HerschlagD, Altman RB. 2009. Coarse-grained modeling of large RNAmolecules with knowledge-based potentials and structural filters.RNA 15: 189–199.
Jossinet F, Westhof E. 2005. Sequence to Structure (S2S): Display,manipulate, and interconnect RNA data from sequence to struc-ture. Bioinformatics 21: 3320–3321.
Jossinet F, Ludwig TE, Westhof E. 2010. Assemble: An interactivegraphical tool to analyze and build RNA architectures at the 2Dand 3D levels. Bioinformatics 26: 2057–2059.
Lebruska LL, Maher LJ III. 1999. Selection and characterization of anRNA decoy for transcription factor NF-kB. Biochemistry 38: 3168–3174.
Ledoux S, Olejniczak M, Uhlenbeck OC. 2009. A sequence elementthat tunes E. coli tRNAAla
GGC to ensure accurate decoding. NatStruct Mol Biol 16: 359–364.
Lemieux S, Major F. 2002. RNA canonical and noncanonical basepairing types: A recognition method and complete repertoire.Nucleic Acids Res 30: 4250–4263.
Lisi V, Major F. 2007. A comparative analysis of the triloops in allhigh-resolution RNA structures reveals sequence structure re-lationships. RNA 13: 1537–1545.
Martinez HM, Maizel JV Jr, Shapiro BA. 2008. RNA2D3D: A programfor generating, viewing, and comparing 3-dimensional models ofRNA. J Biomol Struct Dyn 25: 669–683.
Metzler D, Nebel ME. 2008. Predicting RNA secondary structureswith pseudoknots by MCMC sampling. J Math Biol 56: 161–181.
Parisien M, Major F. 2008. The MC-Fold and MC-Sym pipeline infersRNA structure from sequence data. Nature 452: 51–55.
Parisien M, Cruz JA, Westhof E, Major F. 2009. New metrics forcomparing and assessing discrepancies between RNA 3D struc-tures and models. RNA 15: 1875–1885.
Reiter NJ, Maher LJ III, Butcher SE. 2008. DNA mimicry by a high-affinity anti-NF-kB RNA aptamer. Nucleic Acids Res 36: 1227–1236.
Rother M, Rother K, Puton T, Bujnicki JM. 2011. ModeRNA: A toolfor comparative modeling of RNA 3D structure. Nucleic Acids Res39: 4007–4022.
Rycroft CH. 2009. VORO++: A three-dimensional Voronoi celllibrary in C++. Chaos 19: 041111. doi: 10.1063/1.3215722.
Sato K, Hamada M, Asai K, Mituyama T. 2009. CENTROIDFOLD: Aweb server for RNA secondary structure prediction. Nucleic AcidsRes 37: W277–W280.
Sharma S, Ding F, Dokholyan NV. 2008. iFoldRNA: Three-dimensionalRNA structure prediction and folding. Bioinformatics 24: 1951–1952.
Soll D, RajBhandary U, ed. 1995. tRNA: Structure, biosynthesis, andfunction. American Society for Microbiology, Washington, DC.
Sykes MT, Levitt M. 2005. Describing RNA structure by libraries ofclustered nucleotide doublets. J Mol Biol 351: 26–38.
Voss NR, Gerstein M. 2005. Calculation of standard atomic volumesfor RNA and comparison with proteins: RNA is packed moretightly. J Mol Biol 346: 477–492.
Improved prediction of RNA tertiary structure
www.rnajournal.org 393
Cold Spring Harbor Laboratory Press on June 16, 2016 - Published by rnajournal.cshlp.orgDownloaded from
10.1261/rna.027201.111Access the most recent version at doi: 2012 18: 385-393 originally published online January 25, 2012RNA
John Paul Bida and L. James Maher III state dynamicsImproved prediction of RNA tertiary structure with insights into native
Material
Supplemental
http://rnajournal.cshlp.org/content/suppl/2012/01/10/rna.027201.111.DC1.html
References
http://rnajournal.cshlp.org/content/18/3/385.full.html#ref-list-1
This article cites 35 articles, 18 of which can be accessed free at:
Open Access
Open Access option.RNAFreely available online through the
ServiceEmail Alerting
click here.right corner of the article or
Receive free email alerts when new articles cite this article - sign up in the box at the top
http://rnajournal.cshlp.org/subscriptions go to: RNATo subscribe to
Copyright © 2012 RNA Society
Cold Spring Harbor Laboratory Press on June 16, 2016 - Published by rnajournal.cshlp.orgDownloaded from