Improved Assessment of Ex Vivo Brainstem Neuroanatomy With High-Resolution MRI and DTI at 7 Tesla
10
THE ANATOMICAL RECORD 294:1035–1044 (2011) Improved Assessment of Ex Vivo Brainstem Neuroanatomy with High- Resolution MRI and DTI at 7 Tesla GUADALUPE SORIA, 1,2 * MATTEO DE NOTARIS, 3,4 RAU ´ L TUDELA, 2,5 GERARD BLASCO, 6 JOSEP PUIG, 6 ANNA M. PLANAS, 1,2 SALVADOR PEDRAZA, 6,7 AND ALBERTO PRATS-GALINO 3 1 Department of Brain Ischemia and Neurodegeneration, Institut d’Investigacions Biome `diques de Barcelona (IIBB)-Consejo Superior de Investigaciones Cientı ´ficas (CSIC), Institut d’Investigacions Biome `diques August Pi i Sunyer (IDIBAPS), Rossello ´ 162, Barcelona 08036, Spain 2 Experimental MRI 7T Unit, Institut d’Investigacions Biome `diques August Pi i Sunyer (IDIBAPS), Villarroel 170, Barcelona 08036, Spain 3 Laboratory of Surgical Neuroanatomy (LSNA), Facultat de Medicina, Universitat de Barcelona, Casanova 143, Barcelona 08036, Spain 4 Department of Neurological Sciences, Division of Neurosurgery, Universita ` degli Studi di Napoli Federico II, Via Sergio Pansini 5, Naples 80131, Italy 5 CIBER de Bioingenierı ´a, Biomateriales y Nanomedicina (CIBER-BBN), Group of Biomedical Imaging of the University of Barcelona, Casanova 143, Barcelona 08036, Spain 6 IDI, Radiology Department, Hospital Universitario Dr. Josep Trueta. IDIBGI, Universitat de Girona, Av. Francia s/n, Girona 17007, Spain 7 Programa de Doctorado del Departament de Medicina de la Universitat Auto `noma de Barcelona, Passeig Vall d’Hebron, 119, Barcelona 08035, Spain ABSTRACT The aim of the present work was to provide the topography of the main gray nuclei and white matter tracts of the human brainstem at 7 Tesla (7 T) high-field magnetic resonance imaging (MRI) using structural imaging (T1) and diffusion tensor imaging (DTI). Both imaging techniques represent a new field of increasing interest for its potential neuroanatomic and neuropathologic value. Brainstems were obtained postmortem from human donors, fixated by intracarotid perfusion of 10% neutral buffered formalin, and scanned in a Bruker BioSpec 7 T horizontal scanner. 3D- data sets were acquired using the modified driven equilibrium Fourier transform (MDEFT) sequence and Spin Echo-DTI (SE-DTI) sequence was used for DTI acquisition. High-resolution structural MRI and DTI of the human brainstem acquired postmortem reveals its basic cyto- and myeloar- chitectonic organization, only visualized to this moment by histological techniques and higher magnetic field strengths. Brainstem structures that are usually not observed with lower magnetic fields were now topographi- cally identified at midbrain, pons, and medullar levels. The application of high-resolution structural MRI will contribute to precisely determine the extension and topography of brain lesions. Indeed, the current findings will be useful to interpret future high-resolution in vivo MRI studies in living humans. Anat Rec, 294:1035–1044, 2011. V V C 2011 Wiley-Liss, Inc. Additional Supporting Information may be found in the online version of this article. Grant sponsor: Spanish Government grants by ISCIII, Subdireccio ´n General de Evaluacio ´n y Fomento de la Investigacio ´n; Grant numbers: PS09/00596, PS09/00527. *Correspondence to: Guadalupe Soria, PhD, Institut d’Investi- gacions Biome `diques de Barcelona (IIBB), Consejo Superior de Investigaciones Cientı ´ficas (CSIC), Institut d’Investigacions Bio- me `diques August Pi i Sunyer (IDIBAPS). Fax: þ34-93-3638301. E-mail: [email protected] Received 27 August 2010; Accepted 15 February 2011 DOI 10.1002/ar.21383 Published online 3 May 2011 in Wiley Online Library (wileyonlinelibrary.com). V V C 2011 WILEY-LISS, INC.
Transcript of Improved Assessment of Ex Vivo Brainstem Neuroanatomy With High-Resolution MRI and DTI at 7 Tesla

THE ANATOMICAL RECORD 294:1035–1044 (2011)
Improved Assessment of Ex VivoBrainstem Neuroanatomy with High-Resolution MRI and DTI at 7 TeslaGUADALUPE SORIA,1,2* MATTEO DE NOTARIS,3,4 RAUL TUDELA,2,5
GERARD BLASCO,6 JOSEP PUIG,6 ANNA M. PLANAS,1,2
SALVADOR PEDRAZA,6,7 AND ALBERTO PRATS-GALINO3
1Department of Brain Ischemia and Neurodegeneration, Institut d’InvestigacionsBiomediques de Barcelona (IIBB)-Consejo Superior de Investigaciones Cientıficas (CSIC),
Institut d’Investigacions Biomediques August Pi i Sunyer (IDIBAPS), Rossello 162,Barcelona 08036, Spain
2Experimental MRI 7T Unit, Institut d’Investigacions Biomediques August Pi i Sunyer(IDIBAPS), Villarroel 170, Barcelona 08036, Spain
3Laboratory of Surgical Neuroanatomy (LSNA), Facultat de Medicina,Universitat de Barcelona, Casanova 143, Barcelona 08036, Spain
4Department of Neurological Sciences, Division of Neurosurgery, Universita degli Studi diNapoli Federico II, Via Sergio Pansini 5, Naples 80131, Italy
5CIBER de Bioingenierıa, Biomateriales y Nanomedicina (CIBER-BBN), Group ofBiomedical Imaging of the University of Barcelona, Casanova 143, Barcelona 08036, Spain
6IDI, Radiology Department, Hospital Universitario Dr. Josep Trueta. IDIBGI,Universitat de Girona, Av. Francia s/n, Girona 17007, Spain
7Programa de Doctorado del Departament de Medicina de la Universitat Autonoma deBarcelona, Passeig Vall d’Hebron, 119, Barcelona 08035, Spain
ABSTRACTThe aim of the present work was to provide the topography of the
main gray nuclei and white matter tracts of the human brainstem at 7Tesla (7 T) high-field magnetic resonance imaging (MRI) using structuralimaging (T1) and diffusion tensor imaging (DTI). Both imaging techniquesrepresent a new field of increasing interest for its potential neuroanatomicand neuropathologic value. Brainstems were obtained postmortem fromhuman donors, fixated by intracarotid perfusion of 10% neutral bufferedformalin, and scanned in a Bruker BioSpec 7 T horizontal scanner. 3D-data sets were acquired using the modified driven equilibrium Fouriertransform (MDEFT) sequence and Spin Echo-DTI (SE-DTI) sequence wasused for DTI acquisition. High-resolution structural MRI and DTI of thehuman brainstem acquired postmortem reveals its basic cyto- and myeloar-chitectonic organization, only visualized to this moment by histologicaltechniques and higher magnetic field strengths. Brainstem structures thatare usually not observed with lower magnetic fields were now topographi-cally identified at midbrain, pons, and medullar levels. The application ofhigh-resolution structural MRI will contribute to precisely determine theextension and topography of brain lesions. Indeed, the current findings willbe useful to interpret future high-resolution in vivo MRI studies in livinghumans. Anat Rec, 294:1035–1044, 2011. VVC 2011 Wiley-Liss, Inc.
Additional Supporting Information may be found in the onlineversion of this article.
Grant sponsor: Spanish Government grants by ISCIII,Subdireccion General de Evaluacion y Fomento de laInvestigacion; Grant numbers: PS09/00596, PS09/00527.
*Correspondence to: Guadalupe Soria, PhD, Institut d’Investi-gacions Biomediques de Barcelona (IIBB), Consejo Superior de
Investigaciones Cientıficas (CSIC), Institut d’Investigacions Bio-mediques August Pi i Sunyer (IDIBAPS). Fax: þ34-93-3638301.E-mail: [email protected]
Received 27 August 2010; Accepted 15 February 2011
DOI 10.1002/ar.21383Published online 3 May 2011 in Wiley Online Library(wileyonlinelibrary.com).
VVC 2011 WILEY-LISS, INC.
Keywords: diffusion tensor imaging; high-resolution MRI;neuroanatomy; brainstem; human; 7 Tesla
The brainstem represents an essential structure for theneurotransmission of the whole central nervous system(CNS). It contains ascending sensory pathways whichtransfer information from the peripheral nervous systemand the spinal cord to higher levels. Motor descendingpathways carrying control commands from the brain tothe spinal cord convey in the brainstem, supplying theperipheral nervous system, the muscles, and organs ofthe body. In addition, the brainstem is responsible for keyvital functions (i.e., control of blood pressure, cardiac fre-quency, respiration), as well as consciousness.
The English translation of Ramon y Cajal’s work(1909) remind us that the bases of our actual under-standing of the neuroanatomy of the brainstem wereestablished at the beginning of the last century. Later in1949, Olszewski and Baxter’s cytoarchitectonic studiesintroduced key advances in the structural knowledge ofthe brainstem, which were followed by the application ofhistochemical techniques based on chemical reactions todemonstrate the presence of acetylcholinesterase (Paxi-nos and Huang, 1995), and by immunohistochemicaltechniques for monoamines and other neurotransmitterslocalization (Blessing and Gai, 1997). Altogether, thesestudies have been particularly useful for interpretingMagnetic Resonance Imaging (MRI) of the brainstem,since the level of resolution reached by the latter hasbeen far from that obtained by histological techniques.Nevertheless, the rapid development of MRI techniquesin the last 3 decades has represented a major advance inthe study of the brainstem, whose radiological structurewas systematically described at 0.35 Tesla (T) (Flanni-gan et al., 1985), 1 T (Bradley, 1991), 1.5 T (Tamraz andComair, 2000), and 3 T (Nagae-Poetscher et al., 2004).Mainly applied to the investigation of cortical systems,several studies have demonstrated that high-resolutionMRI (�3 T) is directly comparable with postmortem his-tological staining methods (Walters et al., 2003; Eickhoffet al., 2005; Bridge and Clare, 2006). Although thecapacity for discriminating centers (nuclei) and nervetracts within the brainstem has gradually increasedwith higher magnetic fields, it is still not comparable tohistological techniques and can lead to misinterpreta-tions in the clinical practice.
Neuronal tracer techniques such as transport of differ-ent molecules (HRP-WGA, fluorochromes, PHAL) ortransynaptic viral agents can not be used in humans.Thus, the investigation of the complex connectivitywithin the human brainstem has suffered from the limi-tations of these invasive techniques. Despite the arti-facts that appear in fixed material, Nauta and Gygax(1951) techniques represent the gold standard methodfor the study of human brain connections. In addition,although relatively few studies have been conductedwith silver staining methods of axonal degeneration,they have provided important information about thecourse and termination of the main ascending (Maraniand Schoen, 2005) and descending (Schoen, 1969; seealso for review Kuypers, 1981) tracts that cross thebrainstem, as well as the connections of the cerebellum
and the precerebellar nuclei (Voogd, 2004). In this line,the use of Diffusion Tensor Imaging (DTI) techniques(Basser et al., 1994), based on the direction of water diffu-sion, is opening new perspectives in the analysis of thehuman brainstem connectivity. Although the resolutionobtained is still limited, its application has allowed tocharacterize the topographic organization of the corticospi-nal tract (Wakana et al., 2004; Chen et al., 2007; Habasand Cabanis, 2007; Hong et al., 2010), the corticopontinefibers, transverse fibers of the pons and cerebellarpeduncles (Wakana et al., 2004; Habas and Cabanis,2007), the medial lemniscus (Wakana et al., 2004; Chenet al., 2007; Habas and Cabanis, 2007), the trigeminal sys-tem (Upadhyay et al., 2008), and tentatively, the mediallongitudinal fasciculus (Habas and Cabanis, 2007).
The increase in availability of higher magnetic fieldshas led to several high-resolution DTI studies performedin the ex vivo human brain (Lanyon et al., 2009; McNabet al., 2009; Naidich et al., 2009). Interestingly, studiesthat investigate neuronal diseases in living patients byusing ultra-high magnetic fields, such as 7 T magnets,are increasing their frequency (Hammond et al.,2008a,b; Marques et al., 2010; Metcalf et al., 2010;Zhang et al., 2010). With this in view, high-resolutionMRI and DTI techniques might become a standardmethod for detecting pathological changes in the brainat the earliest possible time (Bridge and Clare, 2006;Vaillancourt et al., 2009), and 7 T magnets will mostlikely be the next generation of MRI systems, not onlyfor human research purposes, but for early diagnosis ofCNS diseases in the clinical practice.
Hence, an exhaustive depiction of the structural neu-roanatomy of the brainstem that can be described at 7 TMRI is necessary to develop new in vivo acquisitiontechniques reaching similar histological resolution in asuitable acquisition time. For multimodal imaging pur-poses it is important to compare the appearance of thesame brainstem structures at both DTI and T1weighted. Thus, the aim of this work was to provide anaccessible and detailed topographic map of the maingray matter (GM) nuclei and white matter (WM) tractsof the human brainstem with postmortem high-resolu-tion MRI and DTI, simultaneously acquired in the samespecimen at 7 T magnetic field strength.
MATERIALS AND METHODSTissue Processing
Brainstems were obtained from donor dead people(N ¼ 3) with no history of neurological diseases. In allcases, informed consent was obtained for using the tis-sues with research purposes at the Donor Service, Unitof Human Anatomy and Embryology, Facultat de Medi-cina, Universitat de Barcelona. Brain fixation was per-formed by intracarotid and vertebral injection of 10%neutral buffered formalin by using a perfusion pump.On the following day, the brain was dissected underoperating microscoping control (Zeiss OPMI 16 and Con-traves, Oberkochen, Germany). Cranial nerves were
1036 SORIA ET AL.

sectioned at the points of perforation of the dura mater.Next, the brainstem was obtained as one whole pieceincluding tissue from the level of the optic chiasm to thefirst cervical segment of the spinal cord. The cerebellumwas removed after sectioning the cerebellar peduncles.The specimens were then immersed in the same fixingsolution during two additional months. For the MRIacquisition, samples were introduced in a plastic tube,filled with the same fixing solution, which had the fol-lowing dimensions: Ø 35 mm, length 125 mm.
MRI
MRI experiments were conducted on a 7.0 T BioSpec70/30 horizontal scanner (Bruker BioSpin, Ettlingen,Germany), equipped with a 12 cm inner diameteractively shielded gradient system (400 mT/m). A trans-mit/receive quadrature volume coil was used for imageacquisition. Specimens were placed horizontally in aPlexiglas holder. Tripilot scans were used for accuratepositioning of the specimens inside the magnet. Thesample was positioned to have the center of the brain-stem approximately located at the magnet’s isocenter. Ingeneral, the parameters were modified to adapt theusual protocol used in clinical settings to this high-resolution study performed in a Bruker system dedicatedto small animal imaging. In particular, three-dimen-sional (3D) T1 anatomical images were acquired usingthe Modified Driven Equilibrium Fourier Transformation(MDEFT) sequence with inverse preparation (alsoknown as magnetization prepared rapid gradient echo orMPRAGE). This sequence with mixed T1 and FLAIRcharacteristics was chosen since it has been demon-strated to achieve images with high signal to noise ratio,enhanced GM/WM contrast, and high resolution in theshortest acquisition time (Kochunov et al., 2010). Theacquisition was performed with the following parame-ters: repetition time (TR) ¼ 4,000 msec, echo time (TE)¼ 3.5 msec, inversion time ¼ 1,100 msec, eight seg-ments, two averages, field of view (FOV) ¼ 38.4 � 38.4� 67.2 mm3, matrix size ¼ 256 � 256 � 112, with aresulting voxel resolution of 0.150 � 0.150 � 0.600 mm3.The acquisition time was 1 hr and 59 min.
For DTI images, taking into account the well knownartifacts associated to Echo Planar Imaging (susceptibil-ity-induced geometric distortions, eddy current effects,etc.), we decided to use the Spin Echo DTI sequence togain image quality to the detriment of short acquisitiontime (Ardekani and Sinha, 2005). Thus DTI acquisitionwas performed using a Spin Echo DTI sequence withTR ¼ 250 sec, TE ¼ 26 sec. Diffusion sensitizing gra-dients were applied along 30 directions with b value ¼1,000 sec/mm2. FOV ¼ 50 � 40 � 67.2 mm3, matrix size¼ 125 � 100 � 112, with a resulting spatial resolution of0.4 � 0.4 � 0.6 mm, with no gaps between slices. Theacquisition time was 8 hr and 40 min. Overall, MRIstudies were performed overnight with a total acquisi-tion time of about 10 hr for specimen.
MRI Data Analysis and Processing
T1 weighted images were directly reconstructed at thescan workstation by using Paravision 5.0 (Bruker Bio-spin, Ettlingen, Germany) and subsequently imported toAmira 4.2 software (Visage Imaging, CA) for visualiza-
tion and processing. A surface rendering of the brainstemspecimen was performed to show the selected levels ofanatomical description (Fig. 1). Except for some bright/dark contrast, no smoothing or other image postprocess-ing techniques were performed in this image modality.For DTI images, brainstem diffusion weighted imagesacquired under 30 different gradient directions, plus oneb0 image, were reconstructed at the scan workstation byusing Paravision 5.0 software (Bruker Biospin, Ettlingen,Germany) and subsequently imported to DTIWeb soft-ware (Prados et al., 2007; available at http://trueta.udg.-edu/DTI/) to calculate fractional anisotropy maps and thecorresponding directional color coded red-green-blue(RGB) maps. After that, the RGB-maps were visualizedand processed by using Amira 4.2 software (Visage Imag-ing, CA). The midline of the brainstem was used to sepa-rate left and right hemispheres and for presentation inthis work the left side of both T1 weighted and DTIimages were selected and are shown in Figs. 2–11. Fullimages are available in Supporting Information. To iden-tify the anatomical structures, two observers with highexperience in the human anatomy analyzed and com-pared the T1 and DTI images with published histologicaland MRI atlases (Tamraz and Comair, 2000; Haines,2004; Mori et al., 2005; Naidich et al., 2009).
RESULTS
Brainstem structures usually not observed at low fieldin vivo MRI T1 and DTI images were now topographi-cally identified at different midbrain, pons, and medullarlevels, as shown in Fig. 1. T1 weighted images acquiredwith the MDEFT sequence showed nuclei appearing asgray structures brighter than tracts. The RGB-mapsshow directionality of fibers by applying red color tomedio-lateral oriented fibers, green color to antero-poste-rior fibers, and blue to superior-inferior fibers, followingconventional coding. Both T1 weighted and DTI imageswere derived from exactly the same specimen. For bettercorrelation and identification of structures both types ofimages are represented in each figure, where the two
Fig. 1. Surface reconstruction from a representative brainstemshowing the levels selected for the posterior description.
HIGH-RESOLUTION MRI OF HUMAN BRAINSTEM 1037
halves correspond to the left side of the brainstem. Afew imaging artifacts were evident at some of the shownlevels. In T1 weighted images, intensity inhomogeneitieswere observed in Figs. 6–8 in the posterior part of themiddle cerebellar peduncle (MCP). In DTI images, therewas a bigger partial volume effect which might be a conse-quence of the lower in-plane resolution used in comparisonto the T1 weighted images. These effects can be wellnoticed along the midline borders, where both images donot perfectly match. Moreover, the partial volume effect ishigher in areas containing population of WM fibers withdifferent orientations like the middle cerebellar peduncle(MCP). This might account to explain the inhomogeneitiesobserved in the green intensity of this structure in Fig. 7,as well as in the boundaries between GM and WM suchas the transverse fibers of the pons (Fig. 9).
The different nuclei and tracts have been identified inthis section following, first, a functional criterion and,second, a caudocranial order. An exception was madewith the descending motor systems which, due to theirfunctional distribution, were described craniocaudally.To simplify the recognition of the structures in thefigures and the comprehension of the description thatfollows, both the complete anatomical names and theircorresponding abbreviations have been used. CompleteT1 weighted images and RGB-maps are available asSupporting Information.
Motor and Sensory Structures Associated toCranial Nerves
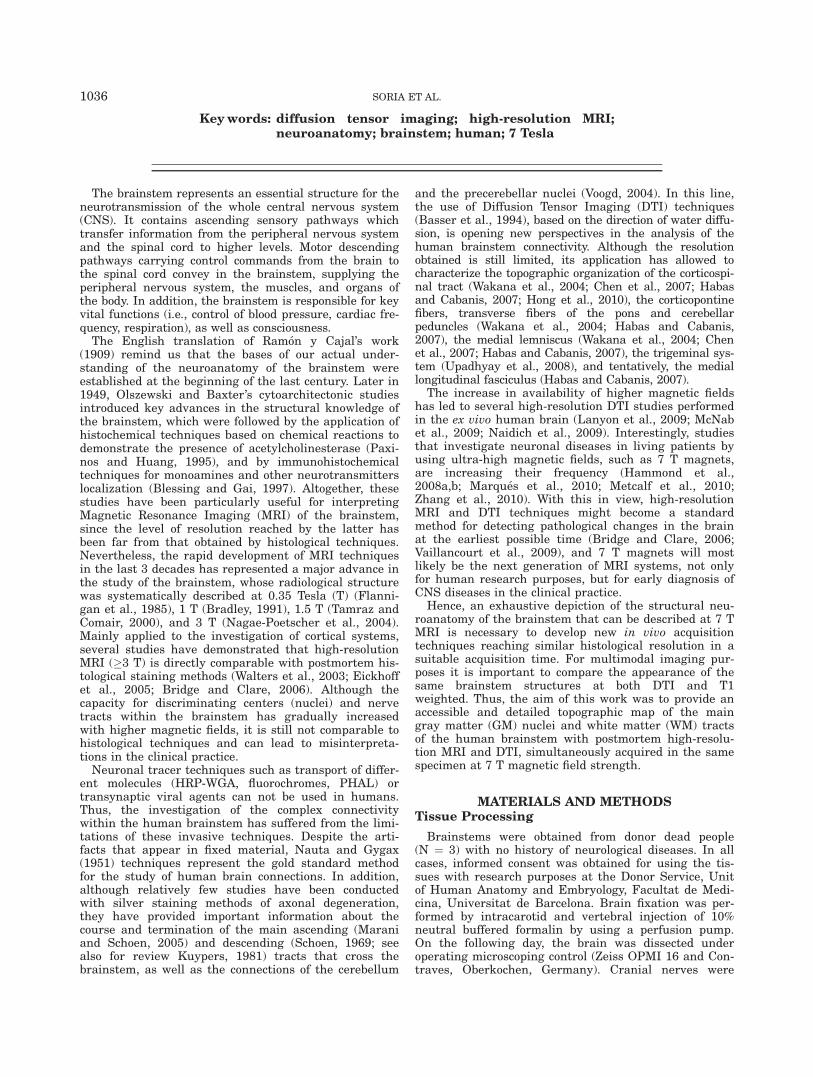
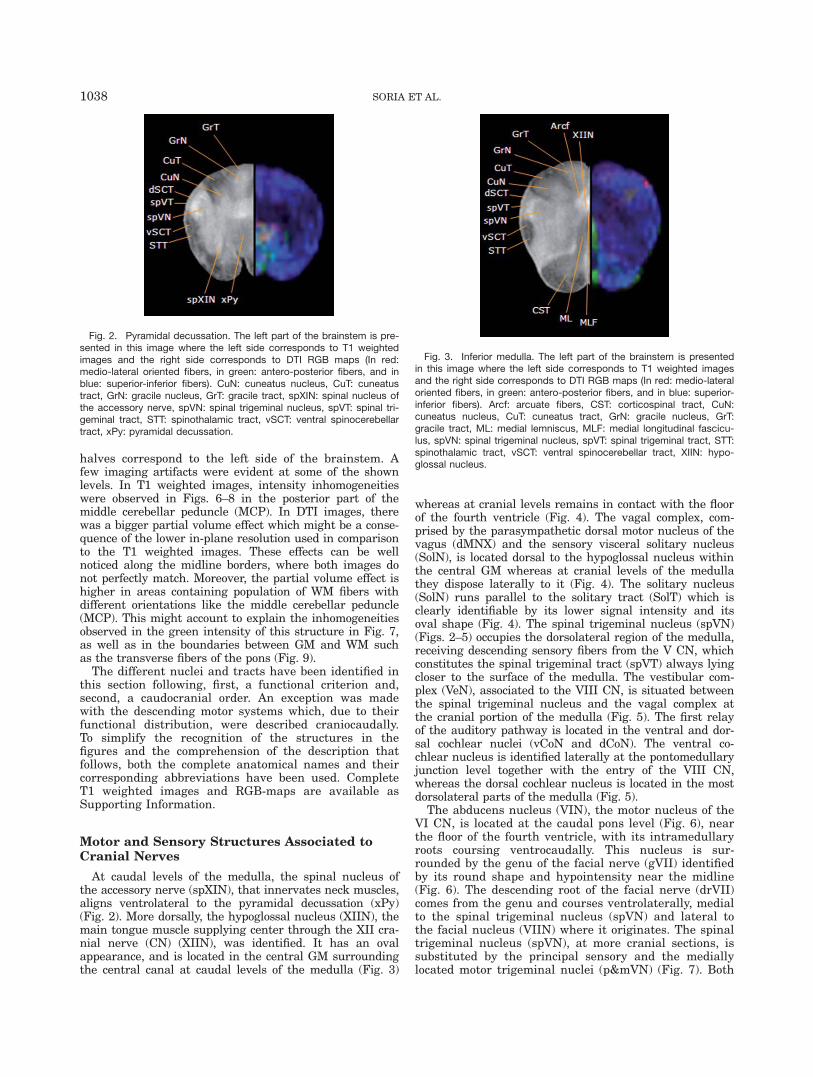
At caudal levels of the medulla, the spinal nucleus ofthe accessory nerve (spXIN), that innervates neck muscles,aligns ventrolateral to the pyramidal decussation (xPy)(Fig. 2). More dorsally, the hypoglossal nucleus (XIIN), themain tongue muscle supplying center through the XII cra-nial nerve (CN) (XIIN), was identified. It has an ovalappearance, and is located in the central GM surroundingthe central canal at caudal levels of the medulla (Fig. 3)
whereas at cranial levels remains in contact with the floorof the fourth ventricle (Fig. 4). The vagal complex, com-prised by the parasympathetic dorsal motor nucleus of thevagus (dMNX) and the sensory visceral solitary nucleus(SolN), is located dorsal to the hypoglossal nucleus withinthe central GM whereas at cranial levels of the medullathey dispose laterally to it (Fig. 4). The solitary nucleus(SolN) runs parallel to the solitary tract (SolT) which isclearly identifiable by its lower signal intensity and itsoval shape (Fig. 4). The spinal trigeminal nucleus (spVN)(Figs. 2–5) occupies the dorsolateral region of the medulla,receiving descending sensory fibers from the V CN, whichconstitutes the spinal trigeminal tract (spVT) always lyingcloser to the surface of the medulla. The vestibular com-plex (VeN), associated to the VIII CN, is situated betweenthe spinal trigeminal nucleus and the vagal complex atthe cranial portion of the medulla (Fig. 5). The first relayof the auditory pathway is located in the ventral and dor-sal cochlear nuclei (vCoN and dCoN). The ventral co-chlear nucleus is identified laterally at the pontomedullaryjunction level together with the entry of the VIII CN,whereas the dorsal cochlear nucleus is located in the mostdorsolateral parts of the medulla (Fig. 5).
The abducens nucleus (VIN), the motor nucleus of theVI CN, is located at the caudal pons level (Fig. 6), nearthe floor of the fourth ventricle, with its intramedullaryroots coursing ventrocaudally. This nucleus is sur-rounded by the genu of the facial nerve (gVII) identifiedby its round shape and hypointensity near the midline(Fig. 6). The descending root of the facial nerve (drVII)comes from the genu and courses ventrolaterally, medialto the spinal trigeminal nucleus (spVN) and lateral tothe facial nucleus (VIIN) where it originates. The spinaltrigeminal nucleus (spVN), at more cranial sections, issubstituted by the principal sensory and the mediallylocated motor trigeminal nuclei (p&mVN) (Fig. 7). Both
Fig. 3. Inferior medulla. The left part of the brainstem is presentedin this image where the left side corresponds to T1 weighted imagesand the right side corresponds to DTI RGB maps (In red: medio-lateraloriented fibers, in green: antero-posterior fibers, and in blue: superior-inferior fibers). Arcf: arcuate fibers, CST: corticospinal tract, CuN:cuneatus nucleus, CuT: cuneatus tract, GrN: gracile nucleus, GrT:gracile tract, ML: medial lemniscus, MLF: medial longitudinal fascicu-lus, spVN: spinal trigeminal nucleus, spVT: spinal trigeminal tract, STT:spinothalamic tract, vSCT: ventral spinocerebellar tract, XIIN: hypo-glossal nucleus.
Fig. 2. Pyramidal decussation. The left part of the brainstem is pre-sented in this image where the left side corresponds to T1 weightedimages and the right side corresponds to DTI RGB maps (In red:medio-lateral oriented fibers, in green: antero-posterior fibers, and inblue: superior-inferior fibers). CuN: cuneatus nucleus, CuT: cuneatustract, GrN: gracile nucleus, GrT: gracile tract, spXIN: spinal nucleus ofthe accessory nerve, spVN: spinal trigeminal nucleus, spVT: spinal tri-geminal tract, STT: spinothalamic tract, vSCT: ventral spinocerebellartract, xPy: pyramidal decussation.
1038 SORIA ET AL.

are partially separated by the root of the trigeminalnerve. Moreover, in its ascending path toward the mid-brain, the mesencephalic tract of the trigeminal nerve(mesVT), carrying propiocetive information from the jaw,is initially identified in a dorsolateral position (Fig. 7),although it is progressively more visible at rostral levelsin the limit of the pontine GM (Fig. 8).
In the midbrain (Figs. 10, 11), the trochlear nucleus(IV CN), seen as a brighter structure, lies ventral to thecerebral aqueduct and is surrounded by the medial lon-gitudinal fasciculus (MLF), which is clearly distinguish-able in the pontomesencephalic junction (Fig. 9). Thisfasciculus contains mainly ascending and descendingsecond order vestibular fibers. Ventral to the periaque-ductal GM and medially located, we found the oculomo-tor nucleus (III CN) (Fig. 11). Indeed, the mediallongitudinal fasciculus (MFL) runs dorsally throughoutthe whole brainstem, at both sides of the midline, inter-connecting the III, IV, and VI CN, being still noticeableat the level of the hypoglossal nucleus (Fig. 3).
Primary Sensory Relay Structures
The main sensory relay structures of the brainstem atthe caudal sections of the medulla are the cuneatus(CuN) and gracile (GrN) nuclei (Figs. 2, 3). The gracilenucleus is medially located and is surrounded by thegracile tract (GrT), which carries ascending informationfrom the ipsilateral lower limb. Lateral to the gracile nu-cleus and medial to the spinal trigeminal nucleus(spVN), appears the cuneatus tract (CuT) characterizedby a dark gray color with a wedge shape. The cuneatustract carries sensory information from the ipsilateralupper limb to the homologous nucleus.
Ascending Sensory Systems
The gracile and cuneatus nuclei (GrN and CuN) arethe centers of origin of the lemniscal system. From thesenuclei emerge the arcuate fibers (Arcf) (Fig. 2) which,laterally surrounding the central GM, cross the midlineto compose the sensory decussation, and ascend
Fig. 6. Inferior pons. The left part of the brainstem is presented inthis image where the left side corresponds to T1 weighted images andthe right side corresponds to DTI RGB maps (In red: medio-lateral ori-ented fibers, in green: antero-posterior fibers, and in blue: superior-in-ferior fibers). CST: corticospinal tract, CTT: central tegmental tract,drVII: descending root of the facial nerve (VII CN), gVII: genu of the fa-cial nerve (VII CN), LL: lateral lemniscus, MCP: middle cerebellarpeduncle, ML: medial lemniscus, MLF: medial longitudinal fasciculus,SON: superior olivary nucleus, spVN: spinal trigeminal nucleus, spVT:spinal trigeminal tract, STT: spinothalamic tract, TPf: transverse pon-tine fibers, VI: abducens nerve, VIN: abducens nucleus (VI CN), VIIN:facial nucleus (VII CN).
Fig. 5. Superior medulla. The left part of the brainstem is presentedin this image where the left side corresponds to T1 weighted imagesand the right side corresponds to DTI RGB maps (In red: medio-lateraloriented fibers, in green: antero-posterior fibers, and in blue: superior-inferior fibers). AmO: amiculum of olive, CST: corticospinal tract,dCoN: dorsal cochlear nucleus, hION: hillium of ION, ICP: inferior cer-ebellar peduncle, ION: inferior olivary nucleus, ML: medial lemniscus,MLF: medial longitudinal fasciculus, OCf: olivocerebellar fibers, spVN:spinal trigeminal nucleus, spVT: spinal trigeminal tract, STT: spinotha-lamic tract, vCoN: ventral cochlear nucleus, VeN: vestibular nuclei.
Fig. 4. Medium medulla. The left part of the brainstem is presentedin this image where the left side corresponds to T1 weighted imagesand the right side corresponds to DTI RGB maps (In red: medio-lateraloriented fibers, in green: antero-posterior fibers, and in blue: superior-in-ferior fibers). AmO: amiculum of olive, CST: corticospinal tract, dAON:dorsal accessory olivary nucleus, dMNX: dorsal motor nucleus of thevagus, hION: hillium of ION, ICP: inferior cerebellar peduncle, ION: infe-rior olivary nucleus, mAON: medial accessory olivary nucleus, ML:medial lemniscus, MLF: medial longitudinal fasciculus, SolN&T: solitarynucleus and tract, spVN: spinal trigeminal nucleus, spVT: spinal trigemi-nal tract, STT: spinothalamic tract, VeN: vestibular nuclei, vSCT: ventralspinocerebellar tract, XIIN: hypoglossal nucleus.
HIGH-RESOLUTION MRI OF HUMAN BRAINSTEM 1039

generating the medial lemniscus (ML) in the contralat-eral side (Figs. 4–6). At cranial sections of the medulla,the medial lemniscus is located at both sides of the ven-tral midline, with an anteroposterior orientation (Figs.3–5). In its ascending course through the pontomedul-lary junction, the medial lemniscus (ML) changes its ori-entation to progressively become horizontal (Figs. 6, 7).At the pons and midbrain levels, the medial lemniscusoccupies a more lateral position neighboring the decussa-tion of the superior cerebellar peduncle (SCP) and thered nucleus (RN) (Fig. 10).
The spinothalamic tract (STT) transmits pain andtemperature information from the spinal cord to thethalamus; therefore, it ascends along the whole brain-stem. From caudal to cranial, this tract locates laterallynear the surface of the medulla (Figs. 2, 3). However, itis better identified at more cranial sections of the me-dulla (Figs. 4, 5), dorsal to the inferior olive (ION). Oncethe medial lemniscus (ML) has become horizontallyorientated, the spinothalamic tract (STT) can be foundadjacent and lateral to this structure (Figs. 6–9). More-over, at the level of the inferior colliculus (IC) the spino-thalamic tract is dorsolaterally located and in closeproximity to the brainstem surface (Figs. 10, 11).
The lateral lemniscus (LL), the main auditory ascend-ing pathway carrying fibers from the cochlear nuclei, isfirst identified at medium levels of the pons (Figs. 6, 7),lateral to the spinothalamic tract (STT). Separating thesetwo structures, the superior olive (SON) appears charac-terized by a small bright area (Fig. 6). On its ascendingcourse, similar to the medial lemniscus (ML), the laterallemniscus (LL) lies laterally and close to the surface, end-ing in the inferior colliculus (IC) (Figs. 8–10).
Descending Motor Systems
The corticospinal tract (CST), the main descendingmotor tract from the cortex, enters the brainstemthrough the central portion of the cerebral crus (Fig. 11).In addition to the CST, through the cerebral peduncledescend the frontopontine tract (FPT), medially located,and laterally the occipito-parieto-temporopontine tract(OPTPT) (Figs. 10, 11). These three tracts compacted atthe superior sections, descend, and disperse at pons lev-els compounding different fiber bundles. In fact, the cor-ticospinal tract (CST) occupies the central region of thebasilar part of the pons whereas the frontopontine tract(FPT) and the occipito-parieto-temporopontine tract(OPTPT) tend to occupy the ventromedial and dorsolat-eral regions, respectively (Figs. 7–9). The last two tractsend at cranial pons levels synapsing with the neurons ofthe pontine nuclei. However, the corticospinal tract(CST) continues its descending course to the medulla,being located at the most ventral pyramids. Finally, atthe most caudal level of the medulla (Fig. 2), a great por-tion of the corticospinal tract (CST) decussates dorsolat-erally (xPy). This decussated portion of the CST willform the lateral corticospinal tract in the lateral funicu-lus of the spinal cord.
Cerebellar System
Somatosensory information from the lower limbs andtrunk travels through the dorsal and ventral spinocere-bellar tracts (dSCT and vSCT), which are located in thelateral parts of the medulla (Figs. 2–4). The dSCTlocates posterior to the spinal trigeminal nucleus (spVN)very close to spinal trigeminal tract (spVT). The ventralportion of the spinocerebellar tract is situated between
Fig. 8. Superior pons. The left part of the brainstem is presented inthis image where the left side corresponds to T1 weighted images andthe right side corresponds to DTI RGB maps (In red: medio-lateral ori-ented fibers, in green: antero-posterior fibers, and in blue: superior-in-ferior fibers). CST: corticospinal tract, CTT: central tegmental tract, FPT:frontopontine tract, LL: lateral lemniscus, MCP: middle cerebellarpeduncle, mesVT: mesencephalic tract of the trigeminal nerve, ML:medial lemniscus, MLF: medial longitudinal fasciculus, OPTPT: occipito-parieto-temporopontine tract, PN: pontine nuclei, SCP: superior cere-bellar peduncle, STT: spinothalamic tract, TPf: transverse pontine fibers.
Fig. 7. Medium pons. The left part of the brainstem is presented inthis image where the left side corresponds to T1 weighted images andthe right side corresponds to DTI RGB maps (In red: medio-lateral ori-ented fibers, in green: antero-posterior fibers, and in blue: superior-in-ferior fibers). CST: corticospinal tract, CTT: central tegmental tract,FPT: frontopontine tract, LL: lateral lemniscus, MCP: middle cerebellarpeduncle, mesVT: mesencephalic tract of the trigeminal nerve, ML:medial lemniscus, MLF: medial longitudinal fasciculus, OPTPT: occi-pito-parieto-temporopontine tract, p&mVN: principal sensory andmotor trigeminal nuclei, PN: pontine nuclei, SCP: superior cerebellarpeduncle, STT: spinothalamic tract, TPf: transverse pontine fibers, V:trigeminal nerve (V CN).
1040 SORIA ET AL.
the dorsal portion and the spinothalamic tract (STT),from which is hard to distinguish. Mainly, the dorsalspinocerebellar tract (dSCT) becomes progressively moredorsal until it converges with the inferior cerebellarpeduncle (ICP) (Figs. 4, 5).
The inferior olivary complex is clearly identified atmediocranial levels of the medulla (Figs. 4, 5). It is com-posed by the principal olivary nucleus (ION), the medialaccessory and the dorsal accessory olivary nuclei (mAONand dAON) (Fig. 4). The principal olivary nucleus (ION)is characterized by its undulating shape, with the hil-lium (hION) that opens medially (Figs. 4, 5). From thehillium emerge the olivocerebellar fibers. The principalolivary nucleus (ION) is surrounded by the capsula oramiculum (AmO), with which the central tegmentaltract (CTT) converges in its dorsal surface (Fig. 6). Fromthis caudal pons level to the cranial sections of the mid-brain (Figs. 6–11), this tract is located in the centralpart of the tegmentum always located dorsal to themedial lemniscus (ML).
At the pons level, the brighter areas surrounding thecorticospinal (CST), the frontopontine (FPT), and theoccipito-parieto-temporopontine (OPTPT) tracts corre-spond to the pontine nuclei (PN) (Figs. 7–9). The charac-teristic transverse pontine fibers (TPf) originate in theseGM regions and course laterally to form the contralat-eral middle cerebellar peduncle (MCP) (Figs. 6–9).
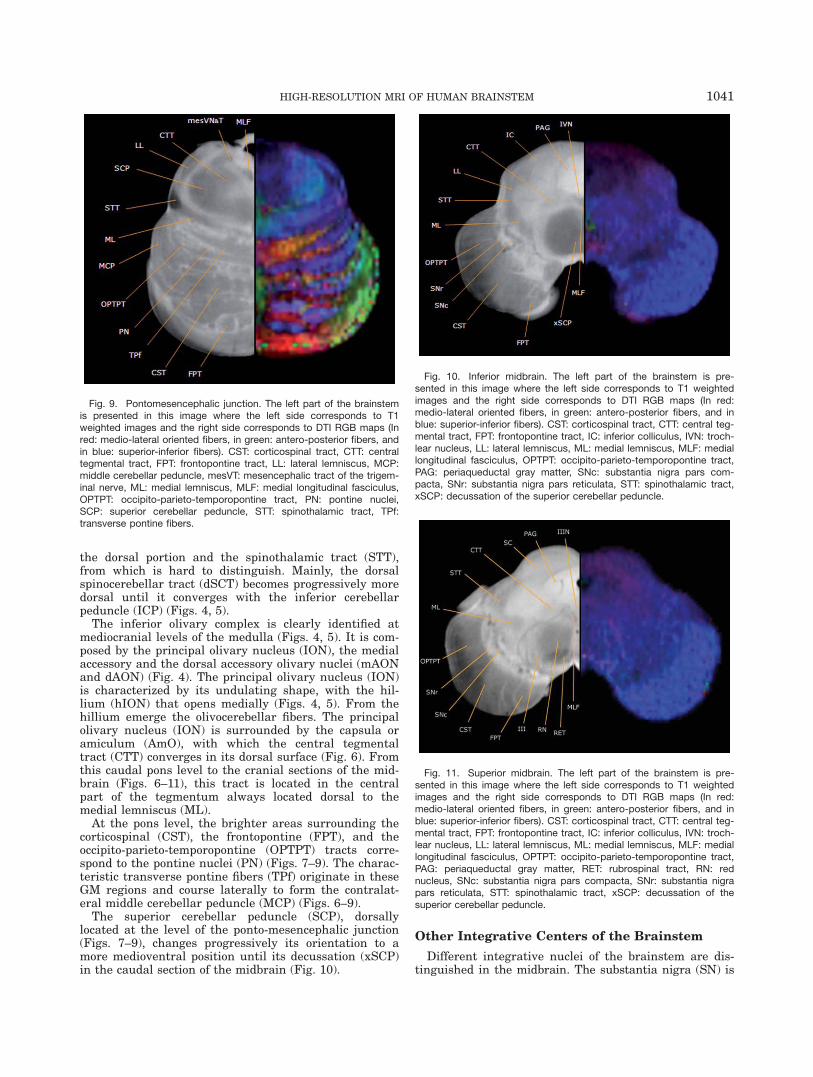
The superior cerebellar peduncle (SCP), dorsallylocated at the level of the ponto-mesencephalic junction(Figs. 7–9), changes progressively its orientation to amore medioventral position until its decussation (xSCP)in the caudal section of the midbrain (Fig. 10).
Other Integrative Centers of the Brainstem
Different integrative nuclei of the brainstem are dis-tinguished in the midbrain. The substantia nigra (SN) is
Fig. 10. Inferior midbrain. The left part of the brainstem is pre-sented in this image where the left side corresponds to T1 weightedimages and the right side corresponds to DTI RGB maps (In red:medio-lateral oriented fibers, in green: antero-posterior fibers, and inblue: superior-inferior fibers). CST: corticospinal tract, CTT: central teg-mental tract, FPT: frontopontine tract, IC: inferior colliculus, IVN: troch-lear nucleus, LL: lateral lemniscus, ML: medial lemniscus, MLF: mediallongitudinal fasciculus, OPTPT: occipito-parieto-temporopontine tract,PAG: periaqueductal gray matter, SNc: substantia nigra pars com-pacta, SNr: substantia nigra pars reticulata, STT: spinothalamic tract,xSCP: decussation of the superior cerebellar peduncle.
Fig. 9. Pontomesencephalic junction. The left part of the brainstemis presented in this image where the left side corresponds to T1weighted images and the right side corresponds to DTI RGB maps (Inred: medio-lateral oriented fibers, in green: antero-posterior fibers, andin blue: superior-inferior fibers). CST: corticospinal tract, CTT: centraltegmental tract, FPT: frontopontine tract, LL: lateral lemniscus, MCP:middle cerebellar peduncle, mesVT: mesencephalic tract of the trigem-inal nerve, ML: medial lemniscus, MLF: medial longitudinal fasciculus,OPTPT: occipito-parieto-temporopontine tract, PN: pontine nuclei,SCP: superior cerebellar peduncle, STT: spinothalamic tract, TPf:transverse pontine fibers.
Fig. 11. Superior midbrain. The left part of the brainstem is pre-sented in this image where the left side corresponds to T1 weightedimages and the right side corresponds to DTI RGB maps (In red:medio-lateral oriented fibers, in green: antero-posterior fibers, and inblue: superior-inferior fibers). CST: corticospinal tract, CTT: central teg-mental tract, FPT: frontopontine tract, IC: inferior colliculus, IVN: troch-lear nucleus, LL: lateral lemniscus, ML: medial lemniscus, MLF: mediallongitudinal fasciculus, OPTPT: occipito-parieto-temporopontine tract,PAG: periaqueductal gray matter, RET: rubrospinal tract, RN: rednucleus, SNc: substantia nigra pars compacta, SNr: substantia nigrapars reticulata, STT: spinothalamic tract, xSCP: decussation of thesuperior cerebellar peduncle.
HIGH-RESOLUTION MRI OF HUMAN BRAINSTEM 1041
ventrally limited by the cerebral peduncle and is clearlyidentified by its laminated and irregular shape (Figs. 10,11). The substantia nigra pars reticulata (SNr) lies ven-trally behind the cerebral peduncle whereas the parscompacta (SNc) is found dorsally, with a characteristicclumped aspect. Medially, the substantia nigra extendsuntil it confounds with the ventral tegmental area (VTA).
The red nucleus (RN) is located dorsal to substantianigra and cranial to the decussation of the superior cere-bellar peduncles (Fig. 11). It is clearly identified by itsround shape and hypointensity. Through the red nucleus(RN) the oculomotor fascicles (IIIN) can be observed.Then, the rubrospinal tract (RET), coursing medial andventral to the red nucleus (RN) is located both sides ofthe midline with a characteristic dark gray appearanceand with an almond shape (RET) (Fig. 11).
The periaqueductal GM (PAG), very bright, surroundsthe cerebral aqueduct at the midbrain level. It limitsdirectly with the III and IV nerve motor nuclei (Figs. 10,11). The laminated structure identified in the most cra-nial section of the midbrain (Fig. 11) corresponds to thesuperior colliculus (SC), dorsally located to the periaque-ductal GM.
DISCUSSION
According to our study, images of high-resolutionstructural MRI and DTI of the human brainstemacquired postmortem at 7 T magnetic field strengthrevealed the basic cyto- and myeloarchitectonic organi-zation of this region, currently visualized only by histo-logical techniques or higher magnetic fields. To the bestof our knowledge, this is the first work showing a mul-timodal study of the human brainstem architecture cor-relating the high-resolution anatomical image of thebrainstem with the directionality of its fibers obtainedfrom the DTI, derived exactly from the samespecimens.
From a general point of view, our study is in agreementwith previous works (Fatterpekar et al., 2002; Naidichet al., 2009; van Rooden et al., 2009) demonstrating that,in contrast to the images acquired in living brains, WMin T1 weighted images of formalin-fixed specimensappears darker than GM. This was important to depictthe most clinically relevant neuronal structures (Table 1)and their topographic organization within the brainstem.Such a description was made based on several histologicaland MRI atlases (Olszewski and Baxter, 1982; Tamrazand Comair, 2000; Haines, 2004; Mori et al., 2005; Nai-dich et al., 2009). In most cases, T1 weighted images pro-vided better structural information than the RGB map.This is the case of the solitary tract (Fig. 4), a pathwaycarrying descending afferent visceral fibers. Anotherexample of the detail level gained with this technique isthe layered organization observed in the superior collicu-lus (Fig. 11). In addition, under our conditions thebrighter area at the caudal spinal trigeminal nucleus wasidentified as the superficial marginal and gelatinouslayers, previously described with histological techniques(Usunoff et al., 1997). In the same way, the small darkaggregations observed in the pars compacta of the sub-stantia nigra (Fig. 11), might correspond to the neurome-lanine deposits in dopaminergic neurons (van Domburgand ten Donkelaar, 1991). Conversely, although not la-beled in the figures, on DTI images we observed struc-
tures which could not be identified in T1 weightedimages. We suggest that at cranial levels of the medullathe green band with anteroposterior orientation along themidline might represent some of the raphe nuclei, includ-ing raphe pallidus, raphe obscurus, and raphe magnusnuclei, which have not been described previously in MRIatlases. At pontine and midbrain levels, the medial greenformations could be more related to midsaggital radialglial system, preserved in the brainstem from develop-mental stages, as suggested in experimental studies(Mori et al., 1990).
Several limitations were found in describing some GMand WM structures. For instance, it was hard to identifythe tectospinal tract classically located ventral to themedial longitudinal fasciculus. This can be explainedsince relatively a small number of tectospinal neurons(in a range of 200) have been demonstrated in primatesfurther suggesting that this tract might be quite smallin humans (Nudo and Masterton, 1989). Similarly, thereticular formation territory, the spinotectal and spinore-ticular fibers (contained in the anterolateral system) andthe corticobulbar fibers (enclosed in the corticospinaltract) were not identified. Similar to what happens withconventional histological techniques, it is highlightingthat some tracts were undoubtedly recognized at somelevels of the brainstem whereas at other levels it wasnot easy to distinguish them. For instance, the cortico-spinal (CST), the occipito-parieto-temporopontine(OPTPT), and frontopontine (FPT) tracts were difficultto separate at the level of the cerebral peduncle, due totheir confluence and homogeneous appearance (Stieltjeset al., 2001). However, we were able to identify the cen-trally located CST from the dorsolateral OPTPT and theventromedial FPT at the midcranial levels of the pons(Figs. 8, 9). In this regard, it has been experimentallydemonstrated that the corticopontine projections have atopographical organization in the pons (Leergaard andBjaalie, 2007). Fibers originating in the frontal cortexcourse ventromedially whereas fibers originating pro-gressively in posterior parts of the cortex course moredorsolaterally. In agreement with our findings, it hasbeen shown in primates that associative descending cor-ticopontine projections mainly end at the cranial levelsof the pons whereas the motor corticopontine and CSTdescending projections continue to more caudal levels(Schmahmann et al., 2004). This might explain why theCST, OPTPT, and FPT were discriminated only at themediocranial levels of the pons (Figs. 8–10).
High-resolution MRI acquired in living patients allowsthe possibility of acquiring narrow brain radiologicalwindows, near to histological resolution, which in combi-nation with neuronavegation systems could help in theaccurate localization of brainstem therapeutical targets.In this line, the electrical stimulation of the pedunculo-pontine nucleus (PPN) represents an emergent therapyfor Parkinsonian patients with intractable akinesia. Thelocalization of this nucleus is based on its topographicalrelation to different brainstem structures (Aravamuthanet al., 2007). Thus, due to the higher contrast obtainedbetween these structures, high-resolution MRI might beapplied for optimizing the surgical targeting of the PPNnucleus. In addition, our study is of great interest forneuroradiologists to better identify structures potentiallyaffected by circumscribed lesions such as arteriovenousmalformations, tumors, demyelinating diseases, or
1042 SORIA ET AL.

posterior circulation infarcts. Hence, the main goal ofthis work was to generate an exhaustive and accessibleguide of the brainstem main gray nuclei and WM tracts,most of them omitted in the current MRI and DTI livinghuman studies. Indeed, the MRI protocol was design toobtain the highest resolution and the maximal GM/WMcontrast, regardless of the long acquisition time. To ac-quire the same image quality in living patients, futurestudies will be necessary to develop new MRI sequencesthat reach such image quality in less acquisition time.
Although an exhaustive brainstem atlas has beenrecently published by using a 9.4 T scanner (Naidichet al., 2009), our work significantly complements it; first,because the description of the structures was performedin parallel between anatomical and DTI images derivedfrom exactly the same specimens; and second, becausethe present atlas was performed at 7 T magnetic fieldstrength. As it happened with the 3 T systems, whichrepresent now a standard diagnostic tool, 7 T magnetsmight be the next generation of MRI scanners.Although higher magnetic fields such as 9.4 T or 11.7 Tare employed for experimental research its use for clini-cal research purposes is far to be frequent. Therefore, aprecise description of the CNS architecture assessed by7 T MRI is needed to be used as a gold standard forwhat these high field magnets are capable to image inpatients.
ACKNOWLEDGEMENTS
The authors thank O. Fuentes, A. Benet, and C. Justi-cia for their technical and scientific collaboration. G.S. issupported by CSIC (JaeDoc). They acknowledge theExperimental MRI 7 T Unit (IDIBAPS). CIBER-BBN isan initiative funded by the VI National R&D&i Plan2008–2011, Iniciativa Ingenio 2010, Consolider Program,CIBER Actions and financed by the Instituto de SaludCarlos III with assistance from the European RegionalDevelopment Fund.
LITERATURE CITED
Aravamuthan BR, Muthusamy KA, Stein JF, Aziz TZ, Johansen-Berg H. 2007. Topography of cortical and subcortical connectionsof the human pedunculopontine and subthalamic nuclei. Neuro-image 37:694–705.
Ardekani S, Sinha U. 2005. Geometric distortion correction of high-resolution 3 T diffusion tensor brain images. Magn Reson Med54:1163–1171.
Basser PJ, Mattiello J, LeBihan D. 1994. MR diffusion tensor spec-troscopy and imaging. Biophys J 66:259–267.
Blessing WW, Gai WP. 1997.Caudal pons and medulla. In: BloomFE, A Blorklund A, Hokfelt T, editors. Handbook of chemical neu-roanatomy. The primate nervous system, Part I. Vol. 13: p 139–186.
Bradley GW. 1991. MR of the brain stem: a practical approach.Radiology 179:319–332.
TABLE 1. List of structures described and their abbreviations
Abbrev Structure Abbrev Structure
AmO amiculum of olive 4, 5 OCf olivocerebellar fibers 5Arcf arcuate fibers 3 OPTPT occipito-parieto-temporopontine tracts
7, 8, 9, 10, 11PAG periaqueductal gray matter 10, 11
CST corticospinal tract 3, 4, 5, 6, 7, 8, 9, 10, 11 PN pontine nuclei 7, 8, 9CTT central tegmental tract 6, 7, 8, 9, 10, 11 p&mVN principal sensory and motor
trigeminal nucleus 7CuN cuneatus nucleus 2, 3 RET rubrospinal tract 11CuT cuneatus tract 2, 3 RN red nucleus 11dAON dorsal accessory olivary nucleus 4 SC superior colliculus 11dCoN dorsal cochlear nucleus 5 SCP superior cerebellar peduncle 7, 8, 9dMNX dorsal motor nucleus of the vagus 4 SNc substantia nigra pars compacta 10, 11drVII descending root of the facial nerve (VII CN) 6 SNr substantia nigra pars reticulata 10, 11dSCT dorsal spinocerebellar tract 2, 3 SolN solitary nucleus 4FPT frontopontine tract 7, 8, 9, 10, 11 SolT solitary tract 4GrN gracile nucleus 2, 3 SON superior olivary nucleus 6GrT gracile tract 2, 3 spVN spinal trigeminal nucleus 2, 3, 4, 5, 6gVII genu of the facial nerve (VII CN) 6 spVT spinal trigeminal tract 2, 3, 4, 5, 6hION hillium of inferior olivary nucleus 4, 5 spXIN spinal nucleus of the accessory nerve 2IC inferior colliculus 10 STT spinothalamic tract 2, 3,
4, 5, 6, 7, 8, 9, 10, 11ICP inferior cerebellar peduncle 4, 5 TPf transverse pontine fibers 6, 7, 8, 9III oculomotor nerve (III CN) 11 vCoN ventral cochlear nucleus 5IIIN oculomotor nucleus 11 VeN vestibular nuclei 5ION inferior olivary nucleus 4, 5 vSCT ventral spinocerebellar tract 2, 3, 4IVN trochlear nucleus 10 V trigeminal nerve (V CN) 7LL lateral lemniscus 6, 7, 8, 9, 10 VI abducens nerve (VI CN) 6mAON medial accessory olivary nucleus 4 VIN abducens nucleus 6MCP middle cerebellar peduncle 6, 7, 8, 9 VIIN facial nucleus (VII CN) 6mesVN&T mesencephalic tract and nucleus of
the trigeminal nerve 7, 8, 9XIIN hypoglossal nucleus (XII CN) 3, 4
ML medial lemniscus 3, 4, 5, 6, 7, 8, 9, 10, 11 xPy pyramidal decussation 2MLF medial longitudinal fasciculus
3, 4, 5, 6, 7, 8, 9, 10, 11xSCP decussation of the superior
cerebellar peduncle 10
Numbers correspond to the figures where the structures are contained.
HIGH-RESOLUTION MRI OF HUMAN BRAINSTEM 1043

Bridge H, Clare S. 2006. High-resolution MRI: in vivo histology?Philos Trans R Soc Lond B Biol Sci 361:137–146.
Chen X, Weigel D, Ganslandt O, Buchfelder M, Nimsky C. 2007.Diffusion tensor imaging and white matter tractography inpatients with brainstem lesions. Acta Neurochir 149:1117–1131.
Eickhoff S, Walters NB, Schleicher A, Kril J, Egan GF, Zilles K,Watson JD, Amunts K. 2005. High-resolution MRI reflects mye-loarchitecture and cytoarchitecture of human cerebral cortex.Hum Brain Mapp 24:206–215.
Fatterpekar GM, Naidich TP, Delman BN, Aguinaldo JG, GultekinSH, Sherwood CC, Hof PR, Drayer BP, Fayad ZA. 2002. Cytoarch-itecture of the human cerebral cortex: MR microscopy of excisedspecimens at 9.4 Tesla. AJNR Am J Neuroradiol 23:1313–1321.
Flannigan BD, Bradley WG Jr, Mazziotta JC, Rauschning W, Bent-son JR, Lufkin RB, Hieshima GB. 1985. Magnetic resonanceimaging of the brainstem: normal structure and basic functionalanatomy. Radiology 154:375–383.
Habas C, Cabanis EA. 2007. Anatomical parcellation of the brain-stem and cerebellar white matter: a preliminary probabilistictractography study at 3 T. Neuroradiology 49:849–863.
Haines DE. 2004. Neuroanatomy. An atlas of structures, sectionsand systems. 6th ed. Baltimore: Lippincott Williams & Wilkins.
Hammond KE, Lupo JM, Xu D, Metcalf M, Kelley DA, Pelletier D,Chang SM, Mukherjee P, Vigneron DB, Nelson SJ. 2008b. Develop-ment of a robust method for generating 7.0 T multichannel phaseimages of the brain with application to normal volunteers andpatients with neurological diseases. Neuroimage 39:1682–1692.
Hammond KE, Metcalf M, Carvajal L, Okuda DT, Srinivasan R,Vigneron D, Nelson SJ, Pelletier D. 2008a. Quantitative in vivomagnetic resonance imaging of multiple sclerosis at 7 Tesla withsensitivity to iron. Ann Neurol 64:707–713.
Hong JH, Son SM, Jang SH. 2010. Somatotopic location of cortico-spinal tract at pons in human brain: a diffusion tensor tractogra-phy study. Neuroimage 51:952–955.
Kochunov P, Glahn DC, Lancaster JL, Winkler AM, Smith S,Thompson PM, Almasy L, Duggirala R, Fox PT, Blangero J. 2010.Genetics of microstructure of cerebral white matter using diffu-sion tensor imaging. Neuroimage 53:1109–1116.
Kuypers HGJM. 1981. Anatomy of the descending pathways. In: Broo-khart JM, Mountcastle VB, Brooks VB, Geiger SR, editors. Handbookof physiology. Section I. The nervous system. Vol II: Motor Control,Part I. Washington: American Physiological Society. p 596–566.
Lanyon LJ, Giaschi D, Young SA, Fitzpatrick K, Diao L, BjornsonBH, Barton JJ. 2009. Combined functional MRI and diffusion ten-sor imaging analysis of visual motion pathways. J Neuroophthal-mol 29:96–103.
Leergaard TB, Bjaalie JG. 2007. Topography of the complete cortic-pontine projection: from experiments to principal maps. FrontNeurosci 1:211–223.
Marani E, Schoen JHR. 2005. Advances in anatomy embryologyand cell biology, Vol. 179: Berlin: Springer-Verlag.
Marques JP, van der Zwaag W, Granziera C, Krueger G, Gruetter R.2010. Cerebellar cortical layers: in vivo visualization with struc-tural high-field-strength MR imaging. Radiology 254:942–948.
Mc Nab JA, Jbabdi S, Deoni SC, Douaud G, Behrens TE, MillerKL. 2009. High resolution diffusion-weighted imaging in fixedhuman brain using diffusion-weighted steady state free preces-sion. Neuroimage 46:775–785.
Metcalf M, Xu D, Okuda DT, Carvajal L, Srinivasan R, Kelley DA,Mukherjee P, Nelson SJ, Vigneron DB, Pelletier D. 2010. High-Resolution Phased-Array MRI of the Human Brain at 7 Tesla: ini-tial experience in multiple sclerosis patients. J Neuroimaging20:141–147
Mori K, Ikeda J, Hayaishi O. 1990. Monoclonal antibody R2D5reveals midsagittal radial glial system in postnatally developingand adult brainstem. Proc Natl Acad Sci USA 87:5489–5493.
Mori S, Wakana S, Nagae-Poetscher LM, van Zijl PCM. 2005. MRIatlas of human white matter. Amsterdam: Elsevier.
Nagae-Poetscher LM, Jiang H, Wakana S, Golay X, van Zijl PCM,Mori S. 2004. High-resolution diffusion tensor imaging of thebrain stem at 3 T. AJNR Am J Neuroradiol 25:1325–1330.
Naidich TP, Duvernoy HM, Delman BN, Sorensen AG, Kollias SS,Haacke EA. 2009. Duvernoy’s atlas of the human brain stem andcerebellum. 1st ed. New-York: Springer, Wien.
Nauta WJ, Gygax PA. 1951. Silver impregnation of degeneratingaxon terminals in the central nervous system. Stain Technol26:5–11.
Nudo RJ, Masterton RB. 1989. Descending pathways to the spinalcord: II. Quantitative study of the tectospinal tract in 23 mam-mals. J Comp Neurol 286:96–119.
Olszewski J, Baxter D. 1982. Cytoarchitecture of the human brainstem. 2nd ed. Basel: Karger.
Paxinos G, Huang XF. 1995. Atlas of the human brainstem. SanDiego: Academic Press.
Prados F, Boada I, Feixas M, Prats A, Blasco G, Pedraza S, Puig J.2007. DTIWeb: a web-based framework for DTI data visualizationand processing. ICCSA 2:727–740
Ramon y Cajal S. 1909. Histology of the nervous system, Vol. I.Oxford: University Press.
Schmahmann JD, Douglas LR, Pandya D. 2004. Motor projectionsto the basis pontis in rhesus monkey. J Comp Neurol 478:248–268.
Schoen JH. 1969. The corticofugal projection on the brain stem andspinal cord in man. Psychiatr Neurol Neurochir 72:121–128.
Stieltjes B, Kaufmann WE, van Zijl PCM, Fredericksen K, Pearl-son GD, Solaiyappan M, Mori S. 2001. Diffusion tensor imagingand axonal tracking in the human brainstem. Neuroimage14:723–735.
Tamraz JC, Comair YG. 2000. Atlas of the regional anatomy ofthe brain using MRI: with functional correlations. Heidelberg:Springer-Verlag Berlin.
Upadhyay J, Knudsen J, Anderson J, Becerra L, Borsook D. 2008.Noninvasive mapping of human trigeminal brainstem pathways.Magn Reson Med 60:1037–1046.
Usunoff K, Marani E, Schoen JHR. 1997. The trigeminal system inman. Advances in anatomy embryology and cell biology, Vol. 136:Berlin: Springer-Verlag.
Vaillancourt DE, Spraker MB, Prodoehl J, Abraham I, Corcos DM,Zhou XJ, Comella CL, Little DM. 2009. High-resolution diffusiontensor imaging in the substantia nigra of de novo Parkinsondisease. Neurology 72:1378–1384.
van Domburg PHMF, ten Donkelaar HJ. 1991. The human Substan-tia nigra and Ventral Tegmental Area: a neuroanatomical studywith notes on ageing and ageing disease. Advances in Anatomy,Embryology and Cell Biology, Vol. 121. Berlin: Springer-Verlag.
van Rooden S, Maat-Schieman ML, Nabuurs RJ, van der Weerd L,van Duijn S, van Duinen SG, Natte R, van Buchem MA, van derGrond J. 2009. Cerebral amyloidosis: postmortem detection withhuman 7.0-T MR imaging system. Radiology 253:788–796.
Voogd J. 2004. Cerebellum and Precerebellar Nuclei. In: Paxinos G,Mai JK, editors. The Human Nervous System. 2nd ed. Amster-dam: Elsevier. p 321–392.
Wakana S, Jiang H, Nagae-Poetscher LM, van Zijl PC, Mori S.2004. Fiber tract-based atlas of human white matter anatomy.Radiology 230:77–87.
Walters NB, Egan GF, Kril JJ, Kean M, Waley P, Jenkinson M,Watson JD. 2003. In vivo identification of human cortical areasusing high-resolution MRI: an approach to cerebral structure-function correlation. Proc Natl Acad Sci USA 100:2981–2986.
Zhang N, Zhu XH, Yacoub E, Ugurbil K, Chen W. 2010. FunctionalMRI mapping neuronal inhibition and excitation at columnarlevel in human visual cortex. Exp Brain Res 204:515–524.
1044 SORIA ET AL.