Implications of Direct and Indirect Range Restriction for Meta-Analysis Methods and Findings
19
Implications of Direct and Indirect Range Restriction for Meta-Analysis Methods and Findings John E. Hunter Michigan State University Frank L. Schmidt Henry B. Tippie College of Business, University of Iowa Huy Le Human Resources Research Organization Range restriction in most data sets is indirect, but the meta-analysis methods used to date have applied the correction for direct range restriction to data in which range restriction is indirect. The authors show that this results in substantial undercorrections for the effects of range restriction, and they present meta-analysis methods for making accurate corrections when range restriction is indirect. Applying these methods to a well-known large-sample empirical database, the authors estimate that previous meta- analyses have underestimated the correlation between general mental ability and job performance by about 25%, indicating that this is potentially an important methodological issue in meta-analysis in general. Keywords: range restriction, indirect range restriction, bias corrections, data analysis In many research situations, such as educational and employ- ment selection, researchers have data only from a restricted pop- ulation and yet must attempt to estimate parameters of the unre- stricted population. For example, the validity of the Graduate Record Examination (GRE) for predicting performance in gradu- ate school can be estimated only with samples of students admitted to the graduate program (the restricted sample). However, the goal is to estimate the validity of the GRE when used in the population of applicants to the graduate program. Because of range restriction, the population of admitted students typically has higher mean GRE scores and a smaller standard deviation (SD) of scores. To estimate the validity in the applicant population from the observed validity in the incumbent population of admitted students, one must correct for the effects of range restriction on GRE scores. In such a situation, if applicants have been selected directly on test scores top down, we have what is called direct or explicit range restric- tion. On the other hand, if students have been selected on some other variable that is correlated with GRE scores (such as a composite of undergraduate grade point and letters of recommen- dation), then the range restriction is said to be indirect. In this article, we show that corrections for both direct and indirect range restriction are more complicated than is generally realized and are often erroneously applied. Building on the earlier work of Pearson (1903), Thorndike (1949) presented corrections for direct and indirect univariate range restriction—that is, equations for correcting for range re- striction when restriction has occurred on only one variable. His Case II correction for direct range restriction is widely used, as described later in the Research Domains With Direct Range Re- striction section. His Case III correction for indirect range restric- tion produced by direct restriction on a third, known variable can rarely be used because its use requires considerable information on the third variable, and in most research, this information is un- known. Later in the Research Domains With Indirect Range Re- striction section, we present a correction method that does not require that information. Corrections for multivariate range restric- tion are also available (Lawley, 1943; Johnson & Ree, 1994; Ree, Caretta, Earles, & Albert, 1994). Multivariate range restriction corrections are straightforward extensions of the univariate correc- tion, and they correct for both the direct and the indirect range restriction simultaneously. However, to use this procedure one must know the intercorrelations of the independent variable mea- sures in both the restricted and unrestricted populations and must know both what tests are used in the selection composite and what the selection ratio is. This information is rarely available outside the military testing context. (For an overview of this and related issues in range restriction, see Sackett & Yang, 2000.) Because the range restriction corrections used in research are almost always univariate corrections, the focus of this article is on univariate range restriction. Developments presented in Mendoza and Mumford’s (1987) article suggested that meta-analysis procedures (Callender & Os- burn, 1980; Hunter & Schmidt, 1990a; Raju, Burke, Normand, & Langlois, 1991; Schmidt & Hunter, 1977) and range correction John E. Hunter, Department of Psychology, Michigan State University; Frank L. Schmidt, Department of Management and Organizations, Henry B. Tippie College of Business, University of Iowa; Huy Le, Human Resources Research Organization, Alexandria, Virginia. We thank In-Sue Oh for his careful reading of earlier versions of this article and his helpful comments. Correspondence concerning this article should be addressed to Frank L. Schmidt, Department of Management and Organizations, Henry B. Tippie College of Business, University of Iowa, Iowa City, IA 52242. E-mail: [email protected] Journal of Applied Psychology Copyright 2006 by the American Psychological Association 2006, Vol. 91, No. 3, 594 – 612 0021-9010/06/$12.00 DOI: 10.1037/0021-9010.91.3.594 594
-
Upload
hocvienquany -
Category
Documents
-
view
0 -
download
0
Transcript of Implications of Direct and Indirect Range Restriction for Meta-Analysis Methods and Findings
Implications of Direct and Indirect Range Restriction for Meta-AnalysisMethods and Findings
John E. HunterMichigan State University
Frank L. SchmidtHenry B. Tippie College of Business, University of Iowa
Huy LeHuman Resources Research Organization
Range restriction in most data sets is indirect, but the meta-analysis methods used to date have appliedthe correction for direct range restriction to data in which range restriction is indirect. The authors showthat this results in substantial undercorrections for the effects of range restriction, and they presentmeta-analysis methods for making accurate corrections when range restriction is indirect. Applying thesemethods to a well-known large-sample empirical database, the authors estimate that previous meta-analyses have underestimated the correlation between general mental ability and job performance byabout 25%, indicating that this is potentially an important methodological issue in meta-analysis ingeneral.
Keywords: range restriction, indirect range restriction, bias corrections, data analysis
In many research situations, such as educational and employ-ment selection, researchers have data only from a restricted pop-ulation and yet must attempt to estimate parameters of the unre-stricted population. For example, the validity of the GraduateRecord Examination (GRE) for predicting performance in gradu-ate school can be estimated only with samples of students admittedto the graduate program (the restricted sample). However, the goalis to estimate the validity of the GRE when used in the populationof applicants to the graduate program. Because of range restriction,the population of admitted students typically has higher mean GREscores and a smaller standard deviation (SD) of scores. To estimatethe validity in the applicant population from the observed validityin the incumbent population of admitted students, one must correctfor the effects of range restriction on GRE scores. In such asituation, if applicants have been selected directly on test scorestop down, we have what is called direct or explicit range restric-tion. On the other hand, if students have been selected on someother variable that is correlated with GRE scores (such as acomposite of undergraduate grade point and letters of recommen-dation), then the range restriction is said to be indirect. In thisarticle, we show that corrections for both direct and indirect range
restriction are more complicated than is generally realized and areoften erroneously applied.
Building on the earlier work of Pearson (1903), Thorndike(1949) presented corrections for direct and indirect univariaterange restriction—that is, equations for correcting for range re-striction when restriction has occurred on only one variable. HisCase II correction for direct range restriction is widely used, asdescribed later in the Research Domains With Direct Range Re-striction section. His Case III correction for indirect range restric-tion produced by direct restriction on a third, known variable canrarely be used because its use requires considerable information onthe third variable, and in most research, this information is un-known. Later in the Research Domains With Indirect Range Re-striction section, we present a correction method that does notrequire that information. Corrections for multivariate range restric-tion are also available (Lawley, 1943; Johnson & Ree, 1994; Ree,Caretta, Earles, & Albert, 1994). Multivariate range restrictioncorrections are straightforward extensions of the univariate correc-tion, and they correct for both the direct and the indirect rangerestriction simultaneously. However, to use this procedure onemust know the intercorrelations of the independent variable mea-sures in both the restricted and unrestricted populations and mustknow both what tests are used in the selection composite and whatthe selection ratio is. This information is rarely available outsidethe military testing context. (For an overview of this and relatedissues in range restriction, see Sackett & Yang, 2000.) Because therange restriction corrections used in research are almost alwaysunivariate corrections, the focus of this article is on univariaterange restriction.
Developments presented in Mendoza and Mumford’s (1987)article suggested that meta-analysis procedures (Callender & Os-burn, 1980; Hunter & Schmidt, 1990a; Raju, Burke, Normand, &Langlois, 1991; Schmidt & Hunter, 1977) and range correction
John E. Hunter, Department of Psychology, Michigan State University;Frank L. Schmidt, Department of Management and Organizations, HenryB. Tippie College of Business, University of Iowa; Huy Le, HumanResources Research Organization, Alexandria, Virginia.
We thank In-Sue Oh for his careful reading of earlier versions of thisarticle and his helpful comments.
Correspondence concerning this article should be addressed to Frank L.Schmidt, Department of Management and Organizations, Henry B. TippieCollege of Business, University of Iowa, Iowa City, IA 52242. E-mail:[email protected]
Journal of Applied Psychology Copyright 2006 by the American Psychological Association2006, Vol. 91, No. 3, 594–612 0021-9010/06/$12.00 DOI: 10.1037/0021-9010.91.3.594
594

methods in general have used suboptimal procedures in correctingfor range restriction when range restriction is indirect (the mostcommon case). As shown later in the Research Domains WithDirect Range Restriction section, corrections for direct range re-striction (where it does exist) have also frequently been suboptimalbecause of issues related to measurement error. Because it ismathematically easier to understand direct range restriction, re-searchers have typically learned to correct for direct restriction andhave then applied the correction equation for direct restriction tocases of both direct and indirect range restriction (Cohen & Cohen,1983, p. 70). However, when the predictor is not perfectly mea-sured (which is virtually always the case), the key equation is notthe same, and much of the underlying rationale is also different.The resulting implications for meta-analysis findings are importantin many areas but are particularly important in the areas of edu-cational and employment selection. For example, it is likely thatthere has been considerable underestimation of the predictivevalidity of selection procedures. The implications are likewiseimportant for other research areas in which range restriction is afactor. For example, the participants in many studies are volun-teers. Volunteering can be a self-selection mechanism that canresult in indirect range restriction on many traits and other char-acteristics relevant to the research. The appropriate correction forsuch indirect range restriction can result in a very different patternof study findings than correction based on the traditional butinappropriate correction for direct range restriction (or that result-ing when no correction for range restriction is made). The methodwe present later in the Research Domains With Indirect RangeRestriction section can be used to correct for such indirect rangerestriction.
Mendoza and Mumford (1987) focused on the differences in themathematics of direct and indirect range restriction at the level ofthe individual study. This article differs from their work in that itexplicates the implications of these differences for meta-analysismethods. To establish the concept of simple statistical artifacts, wefirst briefly discuss meta-analysis in domains with no range re-striction. The next two sections examine the role of the complexstatistical artifacts created by range restriction. The first of theseexamines complex artifacts in domains with direct range restric-tion and shows that accurate corrections require a specific but littleknown sequencing of corrections for range restriction and mea-surement error. This demonstration implies that widely used cur-rent practices should be reconsidered, both in corrections of indi-vidual correlations and in meta-analysis. The final section(Research Domains With Indirect Range Restriction) examinesdomains with indirect range restriction; it presents a new methodfor correcting for indirect range restriction and describes how thismethod can be used in meta-analysis.
In the derivations in this article, it is necessary to presentequations in terms of fully corrected correlations; that is, it isnecessary to include corrections not only for range restriction andfor measurement error in the dependent variable (performancemeasure), but also for measurement error in the independent vari-able (predictor). It becomes apparent, especially in the ResearchDomains With Indirect Range Restriction section, that this isnecessary to explicate structural properties of the correction pro-cesses and to produce correct final estimates. However, we arewell aware that such true score correlations do not estimate oper-
ational validities in applied settings and that the correction formeasurement error in the predictor is not made in such validityestimates. We show in each case how final operational estimatesare obtained, and the results of our empirical analysis are presentedin terms of operational validities, not true score correlations. Wealso note that the methods presented here do not directly addressthe issue of sampling error. Random sampling error effects andcorrections in meta-analysis can be separated from the systematiceffects of the artifacts of range restriction and measurement error,and are so separated in this article to facilitate the presentation.However, it is understood that the final meta-analysis methods doinclude corrections for sampling error (as described in Hunter &Schmidt, 2004).
Recent literature includes numerous articles on the distinctionsbetween, and properties of, fixed effects versus random effectsmodels in meta-analysis (Field, 2001; Hedges & Vevea, 1998; Hall& Brannick, 2002; Hunter & Schmidt, 2000; Schmidt & Hunter,2003; Schmidt, Oh, & Hayes, 2006). In general, random effectsmodels appear to be more appropriate for research data (Field,2001; Hunter & Schmidt, 2000; National Research Council, 1992).The meta-analysis models considered in this article are all randomeffects models. They are also models that correct for statistical andmeasurement artifacts, such as range restriction and measurementerror, that distort study results. These models fall into two classes:(a) those that use statistical methods based on distributions ofartifacts (e.g., reliability coefficients) to make these corrections(e.g., see Callender & Osburn, 1980; Hunter & Schmidt, 2004,chap. 4; Raju & Burke, 1983; Schmidt & Hunter, 1977) and (b)those that correct each study finding (correlation or d value)individually for these artifacts and then perform the meta-analysison the resulting corrected statistics (correlations or d values; e.g.,see Hunter & Schmidt, 2004, chap. 3; Raju, Burke, Normand, &Langlois, 1991).
Research Domains With No Range Restriction
When there is no range restriction, artifacts are simple artifactsand their effects on study correlations are linear; that is, they canbe represented as multipliers. Each artifact multiplier can be com-puted separately from other artifacts, because each artifact dependson a different study imperfection and has a causal structure inde-pendent of that for other artifacts. We show in the two followingsections that this is not true in the case of range restriction.Measurement error is an example of a simple artifact. Measure-ment error is random at the level of individual participant scoresbut has a systematic effect at the level of population statistics. Inparticular, the correlation between measures of two variables isreduced in size to the extent that there is measurement error in theindependent variable and the dependent variable (Lord & Novick,1968; Schmidt & Hunter, 1996, 1999). Other simple artifacts ofthis sort include artificial dichotomization of quantitative variables(Hunter & Schmidt, 1990b; MacCallum, Zhang, Preacher, &Rucker, 2002) and imperfect construct validity (systematic error ofmeasurement; Hunter & Schmidt, 2004).
If several simple artifacts are present in a study, their effectscombine in a simple multiplicative way. The order in which theartifacts are entered does not play a role. The final result is thesame for any order.
595RANGE RESTRICTION AND META-ANALYSIS
Start with no artifacts, and let � � result for a methodologicallyperfect study.
Add Artifact 1: �1 � a1� (e.g., a1 � �rXX , where rXX is theindependent variable reliability).
Add Artifact 2: �2 � a2�1 � a2(a1�) � a1a2� (e.g., a2 � �rYY,where rYY is the dependent variable reliability).
Add Artifact 3: �3 � a3�2 � a3(a1a2�) � a1a2a3� (e.g., a3 �attenuation factor for dichotomization of variable X; Hunter &Schmidt, 1990b).
The final result is as follows:
�o � A�, where A � a1a2a3. (1)
For simple artifacts, the final result is an attenuation formulawith the same form as that for a single artifact. The true effect sizeis multiplied by an overall artifact multiplier, A, which is theproduct of the multipliers for the individual artifacts. The popula-tion correlation can then be estimated by solving Equation 1 for �:
� � �o/A. (2)
When only simple artifacts are present, meta-analysis is quitestraightforward and accurate, whether correlations are correctedindividually or artifact distribution meta-analysis is used (Hunter& Schmidt, 1990a, 2004). This is not the case when there is rangerestriction.
Research Domains With Direct Range Restriction
This section demonstrates the little known fact that when rangerestriction is direct, accurate corrections for range restriction re-quire not only use of the appropriate correction formula(Thorndike’s, 1949, Case II formula), but also the correct sequenc-ing of corrections for measurement error and range restriction.
Direct Range Restriction as a Single Artifact
Suppose that promotion from one level to another within a jobclassification is required to be based solely on a job knowledge test(X), a condition of direct range restriction. That is, people arepromoted top down based solely on their job knowledge testscores. We want to estimate how well the knowledge test predictsjob performance in the population of applicants for promotion, butwe can get job performance data only for those who are actuallypromoted (incumbents), with the result that we get no data onpeople with low test scores. The usefulness of the knowledge testdepends on the correlation between knowledge and performance inthe applicant population, and so that is the correlation we want toestimate. However, our data provides only the correlation for theincumbent population.
The ratio of the observed standard deviations indexes how muchthe incumbent population is restricted in comparison with theapplicant population: SDXa is the standard deviation on X in theapplicant population (unrestricted SD), while SDXi is the standarddeviation on X in the incumbent population (restricted SD). Thecomparison ratio is then uX � SDXi/SDXa. Because the standarddeviation is smaller in the restricted population, uX � 1.00.
The attenuation formula for direct range restriction can bewritten in the same form as that for simple artifacts, but the
multiplier is more complicated than for simple artifacts. Let � �correlation between X and Y in the applicant population, and let�o � correlation between X and Y in the incumbent population. Wethen have the attenuation formula �o � a�, where (Callender &Osburn, 1980)
a �uX
�1 � (uX2 � 1)�2
. (3)
The complication can be seen in the denominator of the multipliera. The presence of � in the denominator means that the multiplierdepends not only on the degree of restriction �uX) but also on thelevel of correlation. This distinguishes range restriction from thesimple artifacts. For a simple artifact, the multiplier is determinedentirely by the extent of the artifact. For range restriction, themultiplier is determined not only by the extent of the artifact butalso by the size of the unrestricted correlation.
Correction for Range Restriction
The simple reversal of the multiplication process that we saw inEquation 2 for simple artifacts works to correct for range restric-tion in principle but not in practice. The problem is that to computethe multiplier a, one must already know �. The conventionalformula for correction for direct range restriction (Thorndike’s,1949, Case II) algebraically reverses the nonlinear algebra of theattenuation formula:
� � ��o, where � �UX
�1 � (UX2 � 1)�o
2 , (4)
where UX � 1/uX. The formula for � is the same in algebraic formas the formula for attenuation due to range restriction; substitutionof the parameter UX for uX makes it correct in the oppositedirection. (Note that � � 1/a, where a is defined in Equation 3).
Meta-Analysis for Range Restrictions as a Single Artifact
Range restriction is not a simple artifact, and thus the meta-analysis methods used for simple artifacts are not perfectly accu-rate for range restriction. The problem is the term with �o in thedenominator of the multiplier � in Equation 4. If that term is small,then the simple artifact methods provide a good approximation. Ifthat term is large, the multiplicative method is less accurate. Theproblem term in Equation 3 is �uX
2 � 1)�2. This term is small ifeither uX is close to 1 or if �2 is small. The ratio uX will be closeto 1 if there is very little range restriction. The squared correlation�2 will be small if � is modest. There are many research domainswhere these two conditions are probably met, but unfortunatelyboth conditions can fail to be met in employment and educationalselection. For example, general mental ability has a substantialcorrelation with job performance (Schmidt & Hunter, 1998), andrange restriction on general mental ability is substantial in mostsamples of job incumbents. There are almost certainly other re-search areas in which these conditions are not met. The Taylorseries methods of Raju and Burke (1983) and the interactivemethod of Schmidt, Gast-Rosenberg, and Hunter (1980) werederived to solve this problem under direct range restriction. Thesemethods have been shown by means of computer simulation to
596 HUNTER, SCHMIDT, AND LE

provide good approximations when range restriction is direct un-less the level of range restriction is very extreme (Law, Schmidt,& Hunter, 1994a, 1994b).
The fact that we have two populations means that for anyparameter (and any estimate of that parameter), there will usuallybe two different values, one for each population. For both vari-ables, the means and standard deviations will differ between thetwo populations. This duality is important for the consideration ofartifacts other than range restriction because the artifact valuesmight differ between the two populations. For example, considerthe reliability of the dependent variable Y. Direct selection on Xwill produce indirect selection on Y. This means that the reliabilityof Y will be smaller in the incumbent population than in theapplicant population. We return to this point later in the ResearchDomains With Indirect Range Restriction section.
Error of Measurement in the Independent Variable inDirect Range Restriction
Because the standard deviation of the predictor differs betweenthe two populations, the reliability of X will differ between the twopopulations. However, there is a more serious problem that iswidely ignored in practice. The substantive nature of the directselection process makes the meaning of reliability unclear for theindependent variable measure in the incumbent data (Mendoza &Mumford, 1987). As we show later, this fact implies that accuracyof range restriction correction requires a specific sequencing ofrange restriction and measurement error corrections. If we analyzeapplicant data, then we can make the usual measurement assump-tion that the true scores and errors are uncorrelated. For theincumbent (restricted) population, this assumption does not holdwhen range restriction is direct. Most researchers would assumethat they could use incumbent data to compute the reliability of theindependent variable in the incumbent group, but there is a prob-lem in doing this: True scores and errors of measurement arenegatively correlated in the incumbent data for the scores that theincumbents were selected on (Mendoza & Mumford, 1987). Usingan example as a vehicle, we demonstrate this fact in Appendix A.In that example, the correlation between true scores and measure-ment errors is �.47. Because of this negative correlation, reliabil-ity cannot be estimated or even defined. For example, the conven-tional definition of reliability as the square of the correlationbetween observed score X and true score T (rXT
2 ) does not hold inthis context.
The solution to the problem created by correlated true and errorscores is to consider attenuation due to measurement error in theindependent variable before considering range restriction (Men-doza & Mumford, 1987; Mendoza, Stafford, & Stauffer, 2000;Stauffer & Mendoza, 2001). That is, because range restriction isnot a simple artifact, it is critical to consider the order in whichrange restriction enters into the attenuation process. As shown laterin this section, this order in turn determines the order in whichcorrections must be made in the disattenuation (correction) processin meta-analysis.
In the following presentation, we use the symbol a to denote theartifact multiplier (effect) of measurement error in the independentvariable, and we use the symbol c to denote the effect of rangerestriction. The subscript a has a different meaning; it denotes the
applicant (i.e., unrestricted) group, while the subscript i denotesthe incumbent (i.e., restricted) group.
In the applicant population, we have the following:
�XPa � a�TPa, (5)
where a � �rXXa and rXXa � the reliability of predictor scores inthe applicant (unrestricted) population; P � the true score under-lying the dependent variable; and T � the true score underlying X.
In the incumbent population, we have the following:
�XPi � c�XPa, (6)
where
c � uX/��1 � �uX2 � 1) �XPa
2 ] (7)
� uX/�[1 � (uX2 � 1) rXXa�TPa
2 ].
The artifact multiplier for range restriction is complicated. Thedenominator contains not only �TPa, but also rXXa. That is, the valueof the artifact multiplier depends not only on the extent of restric-tion �uX) but also on the true effect size ��TPa) and the reliability ofthe independent variable in the unrestricted group (rXXa; Mendoza& Mumford, 1987; Stauffer & Mendoza, 2001).
Error of Measurement in the Dependent Variable inDirect Range Restriction
From a practical standpoint, the key question is how well the testpredicts educational or job performance. No study measures per-formance perfectly. Most studies in the employment area usesupervisor ratings of job performance, which contain considerablemeasurement error. For our discussion, we define performance asthe job performance rating true score.
Job performance ratings have two reliabilities: one for theapplicant population and one for the incumbent population. Inresearch domains other than selection, the reliability is usuallyestimated in the full population. Thus, we would usually know thereliability of the dependent variable in the unrestricted population.If so, then we can compute the attenuation of the correlation byadhering to the order principle for the independent variable: Intro-duce range restriction last. Using the symbol b to denote theartifact multiplier (effect) of measurement error in the dependentvariable, we have the following in the applicant population:
�TYa � b�TPa, where b � �rYYa. (8)
In the incumbent population, we have the following:
�TYi � c�TYa, (9)
where
c � uX/�[1 � (uX2 � 1)�TYa
2 ] (10)
� uX/�[1 � (uX2 � 1)rYYa�TPa
2 ]. (10')
Again, the artifact multiplier for range restriction is compli-cated. The denominator not only has �TPa in it, but it has rYYa, too.That is, the value of the artifact multiplier depends not only on theextent of restriction (uX) but also on the true effect size ��TPa) and
597RANGE RESTRICTION AND META-ANALYSIS

the reliability of the dependent variable in the unrestricted group�rYYa).
Error of Measurement in Both Variables in Direct RangeRestriction
For scientific reasons, we want to know the construct levelcorrelation. Thus, we seek to eliminate the effects of measurementerror in both the predictor and the criterion measure. The key to theattenuation formula is again to consider range restriction last.
In the applicant population, we have the following:
�XYa � ab�TPa, where a � �rXXa and b � �rYYa. (11)
In the incumbent population, we have the following:
�XYi � c�XYa, (12)
where
c � uX/�[1 � (uX2 � 1)�XYa
2 ]
� uX/�[1 � (uX2 � 1)rXXarYYa�TPa
2 ].
The artifact multiplier for range restriction is now even morecomplicated. The denominator not only has �TPa in it, but it hasboth rXXa and rYYa as well. That is, the value of the artifact multiplierdepends not only on the extent of restriction (uX) but also on thetrue effect size ��TPa), the reliability of the independent variable�rXXa), and the reliability of the dependent variable �rYYa).
Meta-Analysis in Direct Range Restriction
Three research teams have contributed methods of meta-analysis that include range restriction: Hunter and Schmidt (1990a)and Schmidt and Hunter (1977); Callender and Osburn (1980); andRaju and Burke (1983). The model for meta-analysis for all threeteams has been the model for direct range restriction. As long ascorrections for range restriction and measurement error are se-quenced in the correct order, there is no problem with that modelif range restriction is indeed direct. In fact, these methods havebeen shown by means of computer simulation to be quite accurateunder conditions of direct range restriction (Law et al., 1994a,1994b). One problem is that corrections are not always appropri-ately sequenced. Another problem is that this model has been usedfor domains where the range restriction is indirect, leading to muchlarger inaccuracies than inappropriate sequencing of corrections.In the Research Domains With Indirect Range Restriction section,we show that attenuation Equations 11 and 12 do not hold forindirect range restriction.
Correction Order in Educational and EmploymentSelection
In educational selection, the dependent variable is usually gradepoint average (often first-year grade point average). In personnelselection, the dependent variable is usually job performance orsome employment behavior such as training performance, acci-dents, theft, or turnover. Consider performance ratings. All re-search on performance ratings has been of necessity conducted on
incumbents. For example, a recent review of interrater reliabilityfindings (Viswesvaran, Ones, & Schmidt, 1996) found the averageinterrater reliability of multiscale rating scales to be .47. This is theincumbent reliability and should not be used in the attenuationformula presented as the attenuation model for meta-analysis. Theapplicant reliability is higher.
Equation 13 can be used to compute rYYa (Brogden, 1968;Schmidt, Hunter, & Urry, 1976):
rYYa � 1 �1 � rYYi
1 � rXYi
2 �1 �SXa
2
SXi
2 �, (13)
where rXYi is the observed correlation between X and Y in the incum-bent sample. (An equivalent formula is given in Callender & Osburn,1980.) Consider a realistic case: Let uX � SDXi/SDXa � .70, rXYi � .25,and rYYi � .47. Equation 13 then yields rYYa � .50. Hence the reliabilityof ratings of job performance would be .03 (6%) higher in the absenceof range restriction. Equation 13 provides an estimate of rYYa, and thismakes possible use of Equation 12. However, it is possible to developa hybrid model that requires only an estimate of rYYi. This model ismore convenient to use and is the one on which corrections inmeta-analysis programs are based under direct range restriction.
In most research domains, the reliabilities in the unrestrictedgroup are known. The conventional method (Equations 11 and 12)above works for these domains. For domains like educational andemployment selection, the dependent variable reliability is knownonly for the incumbent population. In this case, we can analyze thedata using a different model, one that introduces the dependentvariable measurement error after range restriction. This is possiblebecause the random measurement errors in the dependent variable(Y) come into being after the selection process and are not affectedby the direct selection on the independent variable.
In the applicant population, we have the following:
�XPa � a�TPa, where a � �rXXa . (14)
In the incumbent population, we have the following:
�XPi � c�XPa, where c � uX/�[1 � (uX2 � 1)�XPa
2 ], (15)
and
�XYi � b�XPi, where b � �rYYi. (16)
Correction for attenuation in this model proceeds in three steps.We start with �XYi and correct it for dependent variable unreliabilityusing the incumbent reliability �rYYi). The corrected correlation is�XPi. This correlation is then corrected for (direct) range restriction.That correlation is �XPa, which is the estimate of operational (true)validity. If researchers desire to estimate the true score or constructlevel correlation, they then correct this value for predictor unreli-ability using the applicant reliability rXXa. The resulting correlationis the estimate of �TPa in the applicant population. Table 1 sum-marizes the steps in this process. It is important that corrections bemade in this order; this has not always been the case in publishedmeta-analyses. Hence, even when range restriction is direct and theappropriate correction formula for direct range restriction is used,corrections can be inaccurate because of inappropriate sequencing
598 HUNTER, SCHMIDT, AND LE

of range restriction and measurement error corrections or becauseof use of reliabilities estimated on inappropriate populations. Fur-ther, use of rXX computed in the restricted group is an additionaland separate error, as noted earlier.
Meta-Analysis Correcting CorrelationsIndividually—Direct Range Restriction
As noted earlier, in addition to artifact-distribution-based meta-analysis, researchers can also conduct a meta-analysis that correctseach observed correlation individually for measurement error andrange restriction. This procedure is used less frequently becauseprimary studies often do not report uX values and estimates ofreliability for independent and dependent variables for the indi-vidual correlations reported in the study. However, when thesedata are reported, the procedure for correcting each individualstudy correlation is the one described here. With the symbolismdescribed above, this three-step procedure can be combined intoone equation:1
�TPa �UX�XYi
[rXXa(rYYi � UX2�XYi
2 � �XYi
2 )]1⁄2 , (17)
where UX � 1/uX. The meta-analysis is then performed on thecorrected correlations (the �TPa estimates) using the methods de-scribed in Hunter and Schmidt (2004, chap. 3). Schmidt and Le’s(2004) program package includes a program that computes thecorrected values in Equation 17 and performs meta-analysis onthem. For applications in personnel selection, this program has asubroutine that converts the �TPa values (true score correlations) to�XPa values (operational validities).
Artifact Distribution Meta-Analysis—Direct RangeRestriction
Artifact-distribution-based meta-analysis is used when reliabili-ties and range restriction values are only sporadically available for
the correlations in the meta-analysis. Application of these methodsbased on the hybrid model presented here is discussed in Hunterand Schmidt (2004, chap. 4). Again, Schmidt and Le’s (2004)program package includes a program that implements this meta-analysis method.
Research Domains With Indirect Range Restriction
Until recently the formula to correct range restriction that isused in the methods of Callender and Osburn (1980), Hunter andSchmidt (1990a), Hunter, Schmidt, and Jackson (1982), Raju and
1 This can be shown as follows. Working back from Equation 14, wehave the following:
�TPa� �XPa
/�rXXa.
Equation 15, which is Thorndike’s (1949) Case II formula showing �XPias
a function of �XPa, can be rewritten to show the reverse relationship, �XPa
asa function of �XPi:
�XPa � UX�XPi/�[1 � (UX
2 � 1)�XP2
i].
Solving Equation 16 for �XPi, we have the following:
�XPi� �XYi
/�rYYi.
Now replacing the third equation above into the second equation andsummarizing, we obtain the new equation showing �XPa
as a function of�XYi:
�XPa �UX�XYi
�rYYi� UX
2�XY2
i � �XY2
i
.
Replacing the above equation into the first equation relating �TPato �XPa
, wehave the desired equation:
�TPa �UX�XYi
[rXXa(rYYi
� UX2�XY
2i � �XY
2i)]
1⁄2 .
Table 1Steps in Correcting for Direct Range Restriction
Step Purpose Input Output Formula
1 Correcting for measurement errorin Y (measure of construct P)
Correlation between X andY in the restrictedpopulation: �XYi
Correlation between X and P inthe restricted population:�XPi
�XPi � �XYi /�rYYi
Reliability of Y in therestricted population:rYYi
2a Correcting for the effect of directrange restriction on X
Correlation between X andP in the restrictedpopulation: �XPi
Correlation between X and P inthe unrestricted population:�XPa
�XPa �UX�XPi
�1 � (UX2 � 1)�XPi
2
Range restriction on X: uX Note. UX � 1/uX
3 Correcting for measurement errorin the X (measure of constructT)
Correlation between X andP in the unrestrictedpopulation: �XPa
Correlation between T and P inthe unrestricted population:�TPa
�TPa � �XPa /�rXXa
Reliability of X in theunrestricted population:rXXa
a The output for this step (�XPa) is the operational validity of measure X, so depending on research questions, the correction process may end here.
599RANGE RESTRICTION AND META-ANALYSIS
Burke (1983), Raju et al. (1991), and Schmidt and Hunter (1977)has been Thorndike’s (1949) Case II formula (our Equation 4).This formula assumes direct range restriction (truncation) on thepredictor. It has long been known that if range restriction isindirect rather than direct, this formula will undercorrect (e.g., seeLinn, Harnisch, & Dunbar, 1981; Schmidt, Hunter, & Pearlman,1981; Schmidt, Hunter, Pearlman, Hirsh, 1985, p. 751; Schmidt etal., 1993, p. 7). Until recently, no method was available that couldbe used to correct for the most common case of indirect rangerestriction. Hence, Thorndike’s Case II correction formula wasused by default. Although it was known that this formula under-corrected, it was apparently assumed that the undercorrection wasmodest (e.g., 5% or so). As it turns out, it is not.
Historically, a common context for validity studies in appliedpsychology is an organization that is considering moving to the useof a new test for future selection. A concurrent validation study isconducted: The test is given to incumbent workers (or students) atthe same time that job (or academic) performance is measured.Those data are used to estimate the true effect size (operationalvalidity) in the applicant group. Range restriction is indirect in allcases of this sort. In fact, range restriction is indirect in almost allvalidity studies in employment and education (Thorndike, 1949, p.175). For example in the U.S. Department of Labor database on theGeneral Aptitude Test Battery (Hunter, 1983; Hunter & Hunter,1984), all of the 515 validity studies (425 based on job perfor-mance measures and 90 based on training success measures) wereconcurrent in nature, and hence range restriction was indirect in allstudies. Range restriction is often indirect even in predictive stud-ies: The tests to be validated are often given to incumbents, withthe criterion measures being taken months or years later. In ourresearch over the years, we have rarely seen a study (outside ofmilitary selection research) in which there was direct selection onthe predictor(s) being validated. This is the only kind of study forwhich the Case II range correction formula for direct range re-striction would not undercorrect.
If the Case II range correction formula undercorrects, then onemight ask why this undercorrection has not shown up in computersimulation studies. As noted most recently by Hall and Brannick(2002), computer simulation studies have shown that these meth-ods are quite accurate. The answer is that all published computersimulation studies have assumed (and programmed) only directrange restriction. Hence these simulation studies by definitioncannot detect the undercorrection that occurs when range restric-tion is indirect.
In indirect range restriction, selection is based on variables otherthan the predictor itself. For example, suppose the organizationconsiders a high school diploma critical to high job performance.If only high school graduates are hired, then the bottom 20% of theintelligence distribution will be strongly underrepresented, leadingto a smaller standard deviation of intelligence test scores. Mendozaand Mumford (1987) noted that indirect range restriction leads toa reduction in the slope of the regression line of the dependentvariable on test scores. Direct range restriction produces no suchreduction. This is important because the Case II formula for rangerestriction assumes that the regression slope is the same in the twopopulations. If range restriction is indirect, this equality wouldhold only if the independent variable were perfectly measured. Insuch situations, the Case II correction formula would be accurate,
but such a case is hypothetical because variables are never mea-sured perfectly.
When range restriction is direct, people are selected on observedtest scores, and so they are selected partly on their true scores andpartly on their measurement errors. For indirect selection, scoreson the test of interest are not used in selection and so errors ofmeasurement in those test scores have no effect on the selectionprocess. The impact of indirect selection is on the predictor truescore T; there is no effect on the errors of measurement in theobserved scores.
A Model for Indirect Range Restriction
The selection process is a decision process. The organization hascertain information about applicants, and this information is con-verted into a judgment about the suitability of the applicants. Theorganization then hires or admits top down on the basis of thesesuitability judgments. The assumption is that an evaluation vari-able is implicitly constructed by the organization and used to makeselection decisions (Linn, Harnish, & Dunbar, 1981). We call thisvariable suitability and denote it by S. The variables that go into Scan be any combination of explicitly measured variables, subjec-tively assessed unmeasured variables (e.g., interview impressionsand judgments), or any other information. The method used tocombine these variables to produce S can be any linear or nonlin-ear function. For direct range restriction, the selection variable S isidentical to the predictor observed score X, but for indirect rangerestriction, S can be very different from X.
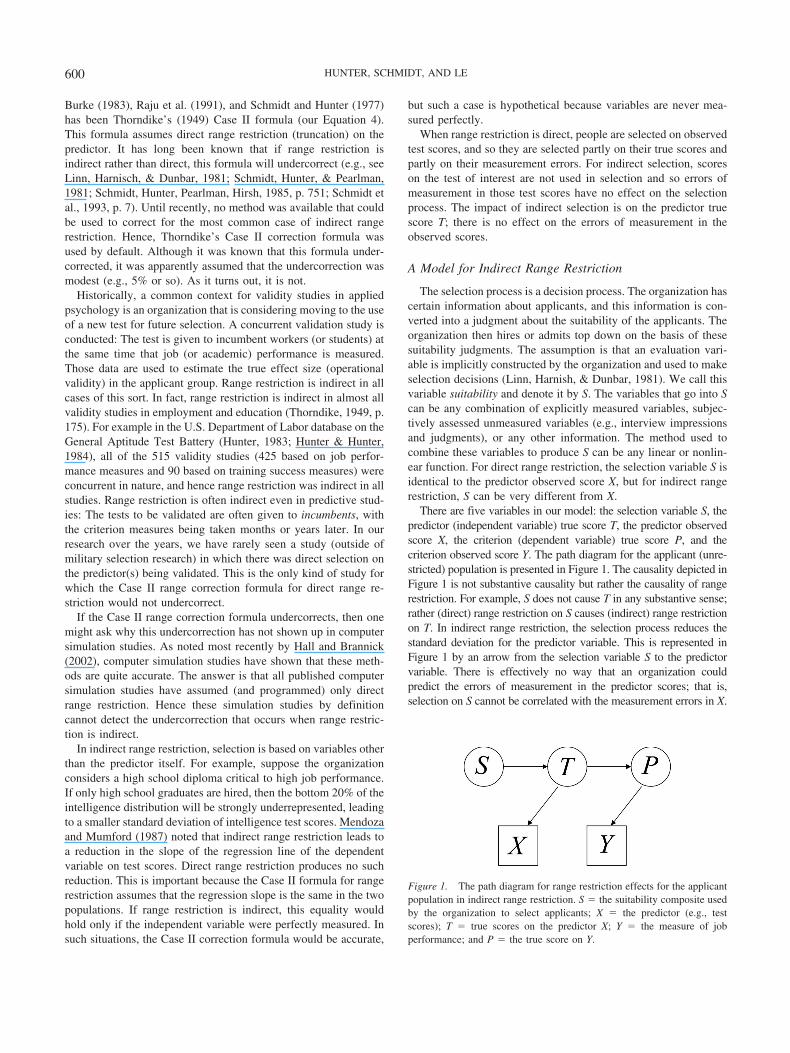
There are five variables in our model: the selection variable S, thepredictor (independent variable) true score T, the predictor observedscore X, the criterion (dependent variable) true score P, and thecriterion observed score Y. The path diagram for the applicant (unre-stricted) population is presented in Figure 1. The causality depicted inFigure 1 is not substantive causality but rather the causality of rangerestriction. For example, S does not cause T in any substantive sense;rather (direct) range restriction on S causes (indirect) range restrictionon T. In indirect range restriction, the selection process reduces thestandard deviation for the predictor variable. This is represented inFigure 1 by an arrow from the selection variable S to the predictorvariable. There is effectively no way that an organization couldpredict the errors of measurement in the predictor scores; that is,selection on S cannot be correlated with the measurement errors in X.
Figure 1. The path diagram for range restriction effects for the applicantpopulation in indirect range restriction. S � the suitability composite usedby the organization to select applicants; X � the predictor (e.g., testscores); T � true scores on the predictor X; Y � the measure of jobperformance; and P � the true score on Y.
600 HUNTER, SCHMIDT, AND LE

Thus, in our model, we make the usual covariance analysis assump-tion that the arrow goes from construct to construct rather than fromobserved score to observed score. Hence there is an arrow from S toT. The arrow from T to X represents the predictor measurementprocess. Because errors of measurement do not enter the selectionprocess, there is no arrow from S to X. The criterion variable is alsorepresented by two variables: the true score P and the observed scoreY. The model for the usual substantive theory represents the effect asan arrow from one true score to the other; that is, from T to P. Themeasurement process is represented by an arrow from P to Y.
Our model has an arrow from S to T and from T to P, so thereis an indirect effect of selection on the criterion variable. Ourmodel makes the assumption that there is no other arrow connect-ing S and P. This corresponds to the assumption that the selectionprocess does not assess any characteristic that would affect thecriterion variable for reasons other than those measured by thecurrent predictor variable X. That is, all effects of selection onrange restriction are assumed to be mediated by their effect on thepredictor. If this assumption is met, our correction for indirectrange restriction is identical to Thorndike’s (1949) Case III cor-rection. If this assumption is violated, our method for correctingfor indirect range restriction will generally undercorrect, as can beseen logically from Figure 1. However, computer simulation stud-ies indicate that the values produced under this condition are stillmore accurate (or less inaccurate) than those produced by the useof the correction for direct range restriction (Le, 2003).(Thorndike’s, 1949, Case III formula does not make this assump-tion and does not undercorrect when there is a direct path from Sto P. However, as discussed earlier, the information needed toapply the Case III formula is rarely available.)
Effects of Range Restriction on S
The most fundamental restriction is on the selection variable S.The organization hires top down on S, creating direct range re-striction on S. The path coefficient from T to P is the correlationbetween T and P, and that is the target of formulas for correctionfor range restriction. This path coefficient is smaller in the incum-bent population than in the applicant population.
Selection reduces the standard deviations of all five variables inthe path diagram. The only comparison ratio computed in tradi-tional research is the u ratio for the observed predictor score X, thatis, uX. Range restriction on the other variables is represented by thecorresponding ratios of their restricted to unrestricted SDs: uS, uT,uP, and uY. The strongest indirect range restriction is on thepredictor true score T. The range restriction on T is caused directlyby the range restriction on S. If the regression of T on S is linear,then we can compute uT from uS. The formulas that relate them canbe derived for either applicant population or incumbent populationand are derived in Appendix B.
The equations for restriction on T are as follows:
Applicant population: uT2 � �STa
2 uS2 � �STa
2 � 1; (18)
Incumbent population: uT2 � uS
2/�uS2 � �STi
2 uS2 � �STi
2 �. (18a)
Similarly, the restriction on X is caused directly by restriction onT. The formulas that relate them are as follows:
Applicant population: uX2 � �TXa
2 uT2 � �TXa
2 � 1; (19)
Incumbent population: uX2 � uT
2/�uT2 � �TXi
2 uT2 � �TXi
2 �. (19a)
The restriction on P is caused directly by restriction on T. Theformulas that relate them are as follows:
Applicant population: uP2 � �TPa
2 uT2 � �TPa
2 � 1; (20)
Incumbent population: uP2 � uT
2/�uT2 � �TPi
2 uT2 � �TPi
2 �. (20a)
The restriction on Y is caused directly by restriction on P. Theformulas that relate them are as follows:
Applicant population: uY2 � �PYa
2 uP2 � �PYa
2 � 1; (21)
Incumbent population: uY2 � uP
2/�uP2 � �PYi
2 uP2 � �PYi
2 �. (21a)
Estimation in Indirect Range Restriction
S is not observed and neither is uS. Fortunately, we do not needthis value for our purposes. The critical value is the restriction ratiofor the predictor true score T. This is not observed, but it can becomputed from the observed value for uX. Equation 19 relating uX
to uT can be rewritten as follows:
Restriction on X: uX2 � rXXauT
2 � rXXa � 1,
where rXXa is the applicant reliability of the predictor variable(rXXa � �TXa
2 ).Solving this equation for uT yields the following:
uT2 � [uX
2 � (1 � rXXa)]/rXXa. (22)
This formula may appear strange at first, but it is important toremember that the smallest possible value for uX is not zero. Althoughin the case of direct range restriction, uX can be as small as zero(because SDXi can be zero and therefore SDXi/SDXa � uX � 0), this isnot true for indirect range restriction. For indirect range restriction,errors of measurement are not included in the selection process, soselection produces no change in the measurement error variance.Thus, the restricted variance of X is always at least as large as themeasurement error variance of X, and the minimum value for uX is�1 � rXXa .
As an example, consider the U.S. Employment Service (USES)database analyzed by Hunter (1983; Hunter & Hunter, 1984). Theaverage value for uX across the 425 studies that used job perfor-mance as the dependent variable was .67. The applicant populationreliability �rXXa) of the General Aptitude Test Battery (Hunter &Hunter, 1984) measure of intelligence used was a constant .81. Theaverage value of uT is therefore as follows:
uT2 � [.672 � (1 � .81)]/.81 � .3196;
uT � �.3196 � .56.
The mean value of uT of .56 is considerably smaller than the meanvalue of uX (uX � .67). This means that taking uX as a measure ofrange restriction leads to a consistent understatement of the extentof actual range restriction and an underestimation of the attenuat-ing effects of range restriction. The finding for the example can begeneralized: The value of uT will always indicate more extreme
601RANGE RESTRICTION AND META-ANALYSIS

range restriction than the value of uX. That is, uT is always smallerthan uX.
The Correlation Between S and T
The correlation between S and T is a measure of the extent towhich the organization indirectly relies on T in their selectionscheme when it selects on S. That correlation can be computedfrom the range restriction values for S and T, that is, from uS anduT. The extent of range restriction on the predictor true scoredepends on the extent of range restriction on S and on the size ofthe correlation between S and T in the applicant population. Equa-tion 18 can be solved for �STa as follows:
�STa
2 � (uT2 � 1)/(uS
2 � 1) � (1 � uT2)/(1 � uS
2). (23)
Consider the USES database example. If an organization selectsthe top 10% from a normal distribution on S, then the rangerestriction on S is uS � .41 (cf. Schmidt et al., 1976). If its averagerange restriction on T is uT � .56, then the correlation between Sand T in the applicant population is
�STa � ��1 � uT2)/(1 � uS
2) � � (1 � .562)/ (1 � .412)
� ��.6864/.8319� � .91.
If the average selection ratio for the organizations studied by theUSES was .10, then �STa � .91 would be the average correlationbetween suitability and intelligence. If the average selection ratiois smaller than 10%, the average correlation would be lower. (Theactual average selection ratio for S in this data set is, of course,unknown.)
The Attenuation Model in Indirect Range Restriction
The easiest context in which to understand the attenuationmodel in indirect range restriction is concurrent validation. In aconcurrent validity study, it is clear that selection precedes mea-surement on both X and Y. Thus, range restriction will be the firstartifact in operation, and measurement errors are added later forthe incumbent population when measures of predictor and criterionare administered.
Starting in the applicant population, range restriction occurs onT:
�TPi � c�TPa, where c � uT /�(uT2�TPa
2 � 1 � �TPa
2 ) . (24)
Then in the incumbent population, measurement error producesattenuation. For measurement error in the predictor (independentvariable),
�XPi � a�TPi, where a � �rXXi .
For measurement error in the criterion (dependent variable),
�XYi � b�XPi, where b � �rYYi.
For educational and employment selection research, this model isfortunate in that the needed dependent variable reliability infor-mation is that for the restricted population, and this reliability
coefficient can be computed from the data on hand (i.e., therestricted data).
Predictor Measurement Error in Indirect RangeRestriction
Our model indicates that incumbent reliability of the indepen-dent variable may be considerably lower than the applicant reli-ability. As shown below, the incumbent predictor reliability can beestimated from either range restriction on uT or range restrictionon uX.
Estimating incumbent reliability from uT. It is useful in deriv-ing a formula to shift from the reliability to the square root of thereliability, which is the correlation �TX. This correlation willchange between populations due to range restriction on T, and theformula for the incumbent �TX is the same range restriction formulaas for the effect size �TP.
In the applicant population, we have �TXa, and range restric-tion on T is indexed by uT. In the incumbent population, wehave �TXi:
�TXi � c�TXa, where c � uT /�(uT2�TXa
2 � 1 � �TXa
2 ). (25)
The resulting reliability equation is as follows:
rXXi � �TXi
2 � c2�TXa
2 � c2rXXa. (26)
In the case of the USES database, the applicant reliability isrXXa � .81, and so �TXa � .90. Range restriction on T causes �TXi todrop to .756, which means the incumbent reliability is only(.756)2 � .57. That is, a test that has a reliability of .81 in theapplicant population has only a modest reliability of .57 in theincumbent population.
Estimating incumbent reliability from uX. This can beachieved with the formula relating reliability in two populations(cf. Nunnally & Bernstein, 1994; Schmidt, Le, & Ilies, 2003):
rXXi � 1 �SXa
2 (1 � rXXa)
SXi
2 � 1 � UX2(1 � rXXa), (27)
where UX � 1/uX. Part 2 of Appendix B demonstrates that Equa-tions 26 and 27 are equivalent. Equation 27 is more convenient touse. In cases in which the independent variable reliability estimatesare from the restricted group, one can skip this step and go straightto Equation 28.
Meta-Analysis Correcting Each Correlation Individually—Indirect Range Restriction
When meta-analysis is performed on study correlations cor-rected individually for the effects of all three artifacts, the proce-dure is as follows: First, convert rXXa to rXXi using Equation 26 or 27above. Second, correct the observed correlation in the restrictedgroup ��XYi) with rXXi and rYYi:
�TPi � �XYi/(rXXirYYi)1⁄2. (28)
Third, correct this value for range restriction using UT � 1/uT inthe equation for direct range restriction correction:
602 HUNTER, SCHMIDT, AND LE

�TPa �UT�TPi
(1 � UT2�TPi
2 � �TPi
2 )1⁄2. (29)
This sequence of corrections is summarized in Table 2. Thisprocedure relies on the fact that in the absence of measurementerror, the formula for correcting for direct range restriction isaccurate in cases in which range restriction is indirect. In thisprocedure, the measurement error is first removed and then theformula for correcting for direct range restriction is applied.After each study correlation is corrected in this manner, themeta-analysis is performed on the corrected correlations withthe methods described in Hunter and Schmidt (2004, chap. 3).Schmidt and Le’s (2004) program package includes a programthat computes the values in Equation 29 and conducts a meta-analysis on these values. In the case of personnel selection, theprogram has a subroutine that converts �TPa values (true scorecorrelations) to �XPa values (operational validities). However,this procedure frequently cannot be used because primary stud-ies often do not include the necessary information on reliabili-ties and range restriction for individual correlations. In suchcases, meta-analysis must be conducted with distributions ofartifacts compiled from the studies that report them (Hunter &Schmidt, 2004, chap. 4).
Artifact Distribution Meta-Analysis: The Model forIndirect Range Restriction
The attenuation equations presented earlier provide a model forartifact distribution meta-analysis in the context of indirect rangerestriction. In the Meta-Analysis for Indirect Range Restrictionsection, we present a method for applying meta-analysis based onthis new model.
The first step is a bare bones meta-analysis (Hunter & Schmidt,1990a, 2004). This meta-analysis converts the mean and standarddeviation of sample correlations �rXYi) into a mean and standarddeviation for incumbent population attenuated correlations ��XYi)by correcting for sampling error. That is, the bare bones meta-analysis provides estimates of the mean and standard deviation ofattenuated population correlations (�XY for the incumbent popula-tions). The purpose of subsequent steps in the meta-analysis is toremove the effects of three artifacts: range restriction, error ofmeasurement in the dependent variable measure, and error ofmeasurement in the independent variable measure.
For indirect range restriction, it is convenient if predictor reli-ability information is applicant data, so it can be used in estimatinguT, on the basis of Equation 22. On the other hand, criterionreliability information is easiest to use if it is incumbent reliability
Table 2Steps in Correcting for Indirect Range Restriction
Step Purpose Input Output Formula
1 Correcting for measurementerror in Y (measure ofconstruct P)
Correlation between X and Y inthe restricted population: �XYi
Correlation between X andP in the restrictedpopulation: �XPi
�XPi� �XYi
/�rYYi
Reliability of Y in the restrictedpopulation: rYYi
2 Estimating reliability of Xin the restrictedpopulation: rXXi
(if rXXiis
already known from thedata, proceed directly toStep 3)
Range restriction on X: uX
Reliability of X in theunrestricted population: rXXa
Reliability of X in therestricted population:rXXi
rXXi� 1 � UX
2(1 � rXXa)
Note. UX � 1/uX
3 Correcting for measurementerror in X (measure ofconstruct T)
Correlation between X and P inthe restricted population:�XPi
Correlation between T andP in the restrictedpopulation: �TPi
�TPi� �XPi
/�rXXi
Reliability of X in the restrictedpopulation: rXXi
4 Estimating reliability of Xin the unrestrictedpopulation: rXXa
(if rXXais already known fromthe data, proceed directlyto Step 5)
Range restriction on X: uX
Reliability of X in the restrictedpopulation: rXXi
Reliability of X in theunrestricted population:rXXa
rXXa� 1 � uX
2(1 � rXXi)
5 Estimating range restrictionon T: uT
Range restriction on X: uX Range restriction on T: uT uT � �[uX2 � (1 � rXXa
)]/rXXaReliability of X in the
unrestricted population: rXXa6 Correcting for the effect of
indirect range restrictionRange restriction on T: uT
Correlation between T and P inthe restricted population: �TPi
Correlation between T andP in the unrestrictedpopulation: �TPa
�TPa �UT�TPi
�1 � (UT2 � 1)�TPi
2
Note. UT � 1/uT
7a Reintroducing measurementerror in T to estimate theoperational validity of X(as a measure of T): �XPa
Correlation between T and P inthe unrestricted population:�TPa
Correlation between X andP in the unrestrictedpopulation: �XPa
�XPa� �TPa�rXXa
Reliability of X in theunrestricted population: rXXa
a The output for this step (�XPa) is the operational validity of measure X, so depending on research questions, the correction process may end at Step 6.
603RANGE RESTRICTION AND META-ANALYSIS

data. Both of these conventions fit the usual data-gathering situa-tion for educational and employment selection. That is, typicallyreliability information is available for the unrestricted populationfor the independent variable and for the restricted population forthe dependent variable. The crucial value for indirect range restric-tion is uT rather than uX. If an empirical estimate of uX is accom-panied by the corresponding estimate of unrestricted predictorreliability in the applicant group, then the corresponding estimateof uT can be computed for that source with Equation 22. (If valuesof uX are given independently from values for the predictor reli-ability, approximate estimates of uT can be obtained with theaverage unrestricted predictor reliability to convert each value ofuX to an estimated value for uT.)
The input artifact data for the multiplicative method of meta-analysis is three sets of means and standard deviations: the meansand standard deviations of (a) square roots of applicant indepen-dent variable reliability ��TXa), (b) square roots of incumbent de-pendent variable reliability ��PYi), and (c) range restriction (uT).Continuing use of our earlier notation, we have
�o � abc�TPa,
where a is the multiplier for predictor measurement error, b is themultiplier for criterion measurement error, and c is a multiplier forrange restriction.
The major problem for the multiplicative model lies in therelationship between the multipliers a and c. For direct rangerestriction, a is the simple quantity �TXa, and there is only a smallcorrelation between a and c. For indirect range restriction, theformula for a is the same range restriction formula as for c, andthere is a high correlation between a and c. This high correlationbetween a and c rules out use of Callender and Osburn’s (1980)multiplicative method of analysis when range restriction is indi-rect—because the violation of the assumption of the independenceof a, b, and c is extreme, as we show next.
For this purpose, we found it useful to express the attenuationequation in a different format from the abc multiplicative format.Let qX � �TX � �rXX, and qY � �PY � �rYY. The incumbent atten-uation formula can be written as
�XYi � qXiqYi�TPi, (30)
whereas the applicant attenuation formula is �XYa � qXaqYa�TPa. Allthree of these component values will be different in these twopopulations. We seek an attenuation formula that relates �TPa to�XYi.
In the attenuation formula for measurement error in the incum-bent population (Equation 30):
qXi �uTqXa
�uT2qXa
2 � 1 � qXa
2
and
�TPi �uT�TPa
�uT2�TPa
2 � 1 � �TPa
2 .
This yields the following attenuation formula:
�XYi � qYi
uTqXa
�uT2qXa
2 � 1 � qXa
2
uT�TPa
�uT2�TPa
2 � 1 � �TPa
2 . (31)
The reader should note the double occurrence of the range restric-tion expression, first for qXi and then for �TPi. As a result of this, thelast two terms are so highly correlated that they rule out use of themultiplicative model.
Meta-Analysis for Indirect Range Restriction
The mean true effect size. Earlier computer simulation tests ofthe meta-analysis model for direct range restriction show that, giventhe correct sequencing of corrections, there is little error in estimatingthe mean effect size (e.g., see Law et al., 1994a, 1994b). The meanstudy population correlation ���XYi) corrected for attenuation with themean values for the artifact values provides an accurate estimate of��TPa. There is no reason why this should not also hold true for indirectrange restriction, and Le (2003) has shown by means of a computersimulation that this is indeed the case. We illustrate this procedure byuse of the USES database originally analyzed by Hunter (1983) andHunter and Hunter (1984). In that database, the mean study popula-tion correlation (pooling all data) is .26, the mean applicant squareroot of the predictor reliability �qXa) is .90, the mean incumbent squareroot of criterion reliability �qYi) is .69, and the mean range restrictionon T is uT � .56.
For indirect range restriction, the correlation is attenuated for rangerestriction before measurement error. Corrections must be applied inthe order opposite to the order in which the artifacts have attenuatedthe correlation. For indirect range restriction, that means that we firstcorrect for measurement error and then correct for range restriction(see Table 2). The correction for criterion (dependent variable) mea-surement error is straightforward. The data on criterion reliability isincumbent data and can thus be used directly. To correct for criterionunreliability, we simply divide the mean study correlation by themean square root of incumbent criterion reliability �qYi), as notedearlier. For example, the mean reliability of performance ratings forincumbents on a multi-item rating instrument is .47 (Viswesvaran etal., 1996). Thus, the mean �qYi) is �.47 � .69. We divide the meanstudy correlation of .26 by .69 to get .38.
The correction for predictor measurement error is more compli-cated. The data on predictor reliability are applicant data. Thus, theapplicant value of �.81 � .90 must be converted to the incumbentvalue with the range restriction formula (i.e., with Equations 26 or27). For the USES data, this reduces the applicant value of .90 toa considerably lower .76. This is the value used to correct the .38obtained by correcting for criterion unreliability. The correlationcorrected for both sources of error is .38/.76 � .50.
After we correct for measurement error, we must correct forrange restriction using the mean value for uT. For the USES data,this means that we correct the .50 using the mean value of uT,which is .56. The correction formula used is Equation 29. Theestimate of mean true score correlation is then .73. The mean true(operational) validity is then �.81 �.73� � .66. Again, the steps inthis process are summarized in Table 2.
Hunter (1983) analyzed the USES data using the direct rangerestriction model, an inappropriate model. The average true validitycorrelation was estimated to be .54, considerably smaller than the .66obtained using the correct model. Other published estimates of the
604 HUNTER, SCHMIDT, AND LE

average true validity of selection procedures for predicting job oracademic performance are likely to be underestimates for the samereason. That is, all other currently published analyses have inappro-priately used the model for direct range restriction and hence haveproduced underestimates of mean operational validities.
The standard deviation of true effect sizes. The major differ-ences between methods for the direct and indirect range restrictionmodels are in the methods for estimating the standard deviation ofeffect sizes �SD�TPa
). As shown earlier, the multiplicative method is notaccurate for the indirect range restriction model because of the highcorrelations among its component terms (see Equation 31). An adap-tation of the interactive meta-analysis model for the direct rangerestriction condition (Law et al., 1994a, 1994b; Schmidt et al., 1980,1993) to indirect range restriction (Schmidt & Le, 2004) has proven toprovide acceptably accurate estimates of �SD�TPa
) for the indirect rangerestriction case (Le, 2003). This procedure is not based on the mul-tiplicative model. In the case of direct range restriction, the interac-tions method (with certain refinements) has proven to be slightly moreaccurate than other methods (Law et al., 1994a, 1994b). Computersimulation results (Le, 2003) suggest it may also be the method ofchoice for artifact-distribution-based meta-analysis when range re-striction is indirect. However, this method is very cumbersome topresent and describe. We have therefore derived an alternative methodbased on the multivariate Taylor’s series approach used by Raju andBurke (1983), and we now present that method.
As a mathematical expression, the attenuation model has fourindependent quantities: qXa, qYi, uT, and �TPa. Mathematically these aretreated as variables, even though in the scientific context we wouldconsider them parameters. As is the case with the other derivationspresented, sampling error is not part of this model. Sampling error isaddressed in a prior step in which it is subtracted out in a bare bonesmeta-analysis (see The USES Database: An Empirical Example sec-tion). The multivariate Taylor’s series approximates the nonlinearfunction with a multivariate polynomial. The first level of approxi-mation, a linear function of the four parameters, is used in this methodof meta-analysis. This approximation has the desirable property that itbreaks the variance of study population correlations into four terms,one for each independent variable. Within the approximation, theseterms can be considered as variance components and approximatepercentages of variance accounted for can be associated with them.(Such percentage breakdowns cannot be obtained for the actual non-linear model.)
The linear approximation uses the deviation score of each pa-rameter from its mean. Suppose we denote the deviation scores asx1 through x4. The linear approximation then takes the form
�XYi � c � b1x1 � b2x2 � b3x3 � b4x4. (32)
The constant term c is the value of the nonlinear function evaluatedat the mean values for all the parameters. To a close approxima-tion, c is �� XYi; that is, the mean population attenuated correlation inthe restricted population.
The four deviation scores x1 through x4 in Equation 32 representqXa, qYi, uT, and �TPa. The multivariate Taylor’s series approximatesthe nonlinear function with a multivariate polynomial (Raju &Burke, 1983). Specifically, variance of the observed (restricted)correlations �XYi can be broken down into four variance compo-nents:
var�XYi� b1
2varqXa� b2
2varqYi � b32varuT � b4
2var�TPa, (33)
where b1 � first order partial derivative of �XYi with respect to qXa;b2 � first order partial derivative of �XYi with respect to qYi; b3 �first order partial derivative of �XYi with respect to uT; and b4 � firstorder partial derivative of �XYi with respect to �TPa.
Again, in connection with sampling error, note that var�XYi
� varrXYi� vare, where varrXYi
is the variance of the observedcorrelations and vare is the sampling error variance. SolvingEquation 33 for var�TPa, we obtain the formula to estimate thedesired variance of true score correlations:
var�TPa � [var�XYi � (b12varqXa � b2
2varqY
i
� b32varuT
)]/b42. (34)
Appendix C presents formulas for the derivatives b1, b2, b3, andb4 and proofs for the derivations. Taking the square root ofEquation 34, we have the standard deviation of the true scorecorrelation:
SD�TPa � �var�TPa
. (35)
The estimated standard deviation of true validities is then
SD�XPa � �rXXaSD�TPa.
Testing of this method through computer simulation shows that itis almost as accurate in estimating SD�TPa as the Taylor’s seriesmethod applied to the direct range restriction model (Le, 2003).The slight drop in accuracy is due to the fact that the effect ofrange restriction is more nonlinear for indirect range restrictionthan for direct range restriction. Computer simulation results showthat this Taylor’s series method and the interactive method de-scribed earlier produce about equally accurate estimates of SD�TPa
for the case of indirect range restriction (Le, 2003).
The USES Database: An Empirical Example
To contrast the models for direct and indirect range restriction,we use the USES database as analyzed by Hunter (1983) andHunter and Hunter (1984). The data to be considered here are thedata for the measure of general mental ability derived from theGeneral Aptitude Test Battery in the prediction of job performanceratings (425 studies). The job families and the methods used toconstruct them are described in Hunter and Hunter. The job fam-ilies are numbered from 1 (most complex) to 5 (least complex) onthe basis of their requirements for information processing.
Table 3 presents results for four analyses. The columns under“Sample values” show the mean and standard deviation of ob-served sample correlations �rXYi) in each family. The columnsunder “Bare bones meta-analysis” present the bare bones meta-analysis on each family. These are the estimated means and stan-dard deviations of study population correlations ��XYi). The stan-dard deviations here are smaller because sampling error variancehas been removed, but mean values are the same. The columnsunder “Hunter’s original meta-analysis” present an update ofHunter’s (1983) full meta-analysis results, with corrections fordirect range restriction. These figures are somewhat different fromthose given in Hunter (1983) and Hunter and Hunter (1984),because in these results, the estimates of SD�XPa
are corrected forvariation across studies in range restriction, whereas Hunter did
605RANGE RESTRICTION AND META-ANALYSIS
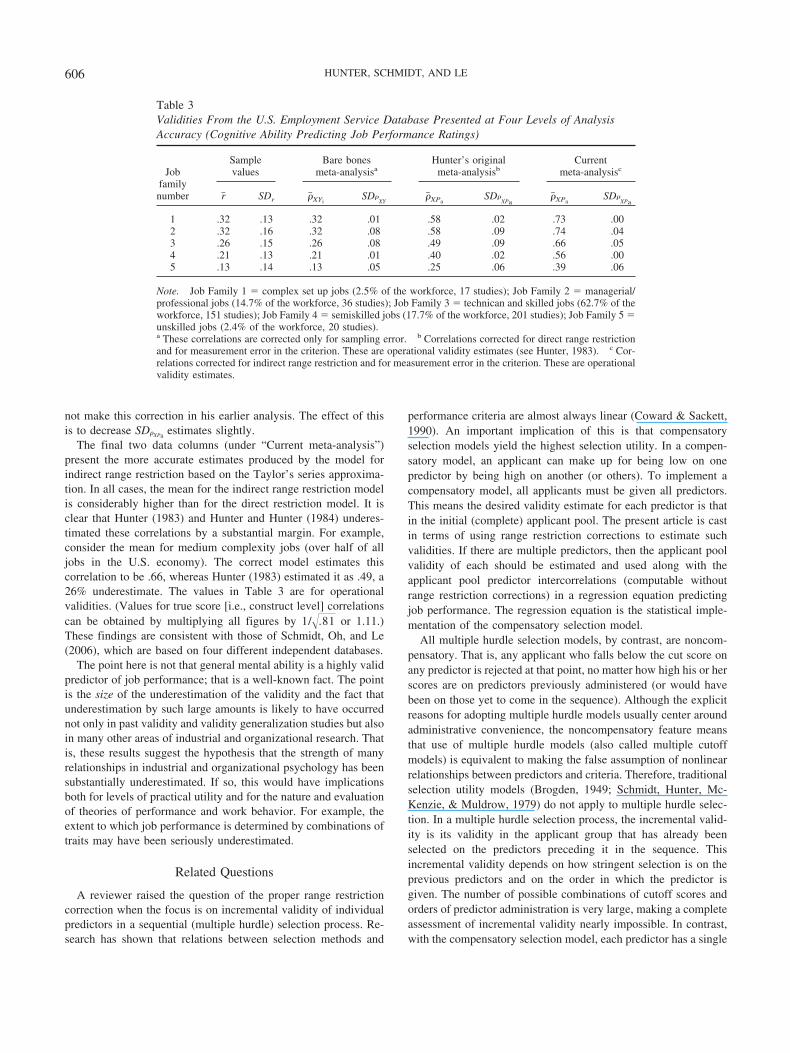
not make this correction in his earlier analysis. The effect of thisis to decrease SD�XPa estimates slightly.
The final two data columns (under “Current meta-analysis”)present the more accurate estimates produced by the model forindirect range restriction based on the Taylor’s series approxima-tion. In all cases, the mean for the indirect range restriction modelis considerably higher than for the direct restriction model. It isclear that Hunter (1983) and Hunter and Hunter (1984) underes-timated these correlations by a substantial margin. For example,consider the mean for medium complexity jobs (over half of alljobs in the U.S. economy). The correct model estimates thiscorrelation to be .66, whereas Hunter (1983) estimated it as .49, a26% underestimate. The values in Table 3 are for operationalvalidities. (Values for true score [i.e., construct level] correlationscan be obtained by multiplying all figures by 1/�.81 or 1.11.)These findings are consistent with those of Schmidt, Oh, and Le(2006), which are based on four different independent databases.
The point here is not that general mental ability is a highly validpredictor of job performance; that is a well-known fact. The pointis the size of the underestimation of the validity and the fact thatunderestimation by such large amounts is likely to have occurrednot only in past validity and validity generalization studies but alsoin many other areas of industrial and organizational research. Thatis, these results suggest the hypothesis that the strength of manyrelationships in industrial and organizational psychology has beensubstantially underestimated. If so, this would have implicationsboth for levels of practical utility and for the nature and evaluationof theories of performance and work behavior. For example, theextent to which job performance is determined by combinations oftraits may have been seriously underestimated.
Related Questions
A reviewer raised the question of the proper range restrictioncorrection when the focus is on incremental validity of individualpredictors in a sequential (multiple hurdle) selection process. Re-search has shown that relations between selection methods and
performance criteria are almost always linear (Coward & Sackett,1990). An important implication of this is that compensatoryselection models yield the highest selection utility. In a compen-satory model, an applicant can make up for being low on onepredictor by being high on another (or others). To implement acompensatory model, all applicants must be given all predictors.This means the desired validity estimate for each predictor is thatin the initial (complete) applicant pool. The present article is castin terms of using range restriction corrections to estimate suchvalidities. If there are multiple predictors, then the applicant poolvalidity of each should be estimated and used along with theapplicant pool predictor intercorrelations (computable withoutrange restriction corrections) in a regression equation predictingjob performance. The regression equation is the statistical imple-mentation of the compensatory selection model.
All multiple hurdle selection models, by contrast, are noncom-pensatory. That is, any applicant who falls below the cut score onany predictor is rejected at that point, no matter how high his or herscores are on predictors previously administered (or would havebeen on those yet to come in the sequence). Although the explicitreasons for adopting multiple hurdle models usually center aroundadministrative convenience, the noncompensatory feature meansthat use of multiple hurdle models (also called multiple cutoffmodels) is equivalent to making the false assumption of nonlinearrelationships between predictors and criteria. Therefore, traditionalselection utility models (Brogden, 1949; Schmidt, Hunter, Mc-Kenzie, & Muldrow, 1979) do not apply to multiple hurdle selec-tion. In a multiple hurdle selection process, the incremental valid-ity is its validity in the applicant group that has already beenselected on the predictors preceding it in the sequence. Thisincremental validity depends on how stringent selection is on theprevious predictors and on the order in which the predictor isgiven. The number of possible combinations of cutoff scores andorders of predictor administration is very large, making a completeassessment of incremental validity nearly impossible. In contrast,with the compensatory selection model, each predictor has a single
Table 3Validities From the U.S. Employment Service Database Presented at Four Levels of AnalysisAccuracy (Cognitive Ability Predicting Job Performance Ratings)
Jobfamilynumber
Samplevalues
Bare bonesmeta-analysisa
Hunter’s originalmeta-analysisb
Currentmeta-analysisc
r� SDr ��XYiSD�
XY��XPa
SD�XPa
��XPaSD�
XPa
1 .32 .13 .32 .01 .58 .02 .73 .002 .32 .16 .32 .08 .58 .09 .74 .043 .26 .15 .26 .08 .49 .09 .66 .054 .21 .13 .21 .01 .40 .02 .56 .005 .13 .14 .13 .05 .25 .06 .39 .06
Note. Job Family 1 � complex set up jobs (2.5% of the workforce, 17 studies); Job Family 2 � managerial/professional jobs (14.7% of the workforce, 36 studies); Job Family 3 � technican and skilled jobs (62.7% of theworkforce, 151 studies); Job Family 4 � semiskilled jobs (17.7% of the workforce, 201 studies); Job Family 5 �unskilled jobs (2.4% of the workforce, 20 studies).a These correlations are corrected only for sampling error. b Correlations corrected for direct range restrictionand for measurement error in the criterion. These are operational validity estimates (see Hunter, 1983). c Cor-relations corrected for indirect range restriction and for measurement error in the criterion. These are operationalvalidity estimates.
606 HUNTER, SCHMIDT, AND LE

zero order validity (the validity in the initial applicant pool), andthe incremental contribution to job performance of each predictorover and above other predictors is represented by its partial re-gression weight in the regression equation. Sequential selectionmodels are often used by employers to save testing time andtesting costs, although the savings are almost always less than theloss in selection utility (Hunter & Schmidt, 1982). If the decisionis made to use a sequential procedure, decisions about the sequenc-ing should be based not only on each predictor’s costs, but also onits initial validity (i.e., its validity in the initial applicant pool).Hence, even when a sequential procedure is used, one needs thevalidity estimates discussed in this article.
Another question concerns the relationship between estimates oftrue score correlations and operational validities. For the presen-tation in this article, we have assumed that the only differencebetween these two is that in the case of operational validity, thereis no correction for measurement error in the independent (predic-tor) variable, whereas this correction is made in the case of the truescore correlation (making it an estimate of the construct levelcorrelation or construct validity). This assumption is correct if bothestimates are assumed to have been made for the applicant popu-lation (as is the case here) or if the applicant population and otherrelevant populations have the same independent variable SD. How-ever, if the operational validity is estimated for the applicantpopulation and the construct level correlation is assumed to beestimated for a more general population (e.g., the U.S. workforceas a whole), the more general population may have a different(presumably larger) unrestricted independent variable SD, requir-ing a larger correction for range restriction. In this case, simplycorrecting the operational validity estimate for measurement errorin the predictor would underestimate the true score correlation inthe broader population. However, research by Sackett and Ost-gaard (1994) has suggested that the underestimation would beminimal. Using a large database on a cognitive ability test and alarge number of jobs, Sackett and Ostgaard compared job-specificapplicant pool predictor SDs to predictor SDs in national norm(general workforce) data. On average, predictor SDs were only 8%larger in the national norm data, suggesting that true score corre-lations estimates on job-specific applicant samples underestimatetrue score correlations in the general workforce only slightly.Likewise, use of national norm SDs as estimates of unrestrictedapplicant pool SDs would lead to only slight overestimates ofoperational validities. It is important to remember that mean pre-dictor scores can vary substantially across applicant pools fordifferent jobs (as was indeed the case in the Sackett & Ostgaard’s,1994, data), while still allowing the mean applicant pool SD to beonly slightly smaller than the overall workforce SD. By a wellknow theorem in analysis of variance, we know that if groupmeans differ, the average within-group SD must be smaller thanthe overall SD. However, it is not well known that this differencein SDs can be quite small even when the subgroup means differconsiderably. A related question concerns the effects of predictorSD differences on estimates of reliability. If reliability is estimatedin a workforce norm group, and the SD in that group is larger thanin the applicant group, the reliability estimate will be at leastslightly overestimated relative to the applicant group (leading toslight undercorrection for measurement error). If the two SDs areknown, Equation 27 can be used to determine the appropriate
reliability in the applicant group. A more detailed discussion of thedependence of reliability values on group SDs can be found inHunter and Schmidt (2004, chap. 3).
In some cases, there may be not only range restriction (direct orindirect) on the independent variable, but also direct range restrictionon the dependent variable. Another possibility is that there is indirectrange restriction on the dependent variable caused by something otherthan the range restriction on the independent variable. In such cases,all standard range correction procedures, including those presented inthis article, will undercorrect. These special cases and proceduresproposed for dealing with them are discussed in Hunter and Schmidt(2004, pp. 39–41). One might also raise the question of whetherrange restriction corrections can be applied to the d statistic (thestandardized difference between mean groups). In some cases, rangecorrection procedures, including those presented in this article, can beapplied to the d statistic. A full discussion of such applications isbeyond the scope of this article. Such a discussion is provided byRoth, Bobko, Switzer, and Dean (2001).
Discussion and Conclusions
When range restriction is direct, accurate corrections for rangerestriction require the correct sequencing of corrections for mea-surement error and range restriction. In particular, because reli-ability of the predictor cannot be determined in the restricted groupdata, any correction for measurement error in the predictor must bemade after the correction for range restriction and must use thereliability in the unrestricted group. One first corrects for measure-ment error in the dependent variable (criterion), then for rangerestriction, and finally for measurement error in the predictor (ifdesired). This little known sequence and the reasons underlying itare explicated in detail in this article and are summarized (alongwith the relevant equations) in Table 1.
However, range restriction is usually indirect rather than direct.A major error in range restriction correction methods, both inindividual studies and in meta-analysis methods, has been gener-alization of the model for direct range restriction to use in contextsof indirect range restriction. We have shown that this practiceresults in substantial negative biases in corrected values. Thisarticle has presented a method for correcting for indirect rangerestriction that can be used when the information needed to applyThorndike’s (1949) Case III correction for indirect range restric-tion is not available. The sequence of corrections is that one firstcorrects for measurement error in both variables using restrictedsample reliability values and then corrects for range restrictionusing the Case II formula but using uT rather than uX as the indexof range restriction. The article presents a detailed analyticalderivation of this procedure. This sequence of corrections and theequations needed for it are summarized in Table 2. This procedureshould be used whenever range restriction is indirect, includingthose cases in which the range restriction results from self-selection. A reviewer noted that some degree of self-selection maybe nearly ubiquitous in research samples and asked how a re-searcher can determine when to apply this correction for indirectrange restriction. This correction should be applied whenever theindependent variable SDs are different in one’s sample and thepopulation of interest.
607RANGE RESTRICTION AND META-ANALYSIS

This method of correcting for indirect range restriction can beapplied in meta-analysis methods as well as to correlations in indi-vidual studies. This article presented a Taylor-series-based method forconducting artifact distribution meta-analysis when range restrictionis indirect. Computer simulations testing the accuracy of this modelindicate that the method produces accurate estimates of SD� (Le,2003). There is also a version of the interactive model (Law et al.,1994a, 1994b; Schmidt et al., 1980; Schmidt & Le, 2004) adapted tothe requirements of data shaped by indirect range restriction, andsimulation tests indicate that this model is as accurate as the Taylor-series-based model (Le, 2003). This article also presented meta-analysis methods for correcting each correlation individually, meth-ods that incorporate the new correction for indirect range restriction.Meta-analysis programs that incorporate both direct and indirect rangerestriction corrections are available (Schmidt & Le, 2004). Meta-analysis results produced when one corrects for indirect range restric-tion produce larger mean ���XPa) values in comparison with thoseproduced by application of the inappropriate correction for directrange restriction. The derivations, equations, and results presented inthis article suggest that the use of the direct range restriction modelmay have led to considerable underestimation of the validity ofmeasures used in educational and employment selection and, byextension, may have led to underestimation of important parametersin other areas of research. In view of the fact that range restriction isindirect in most social and behavioral science research domains sub-ject to range restriction, this issue appears to be an important one, andthe development of accurate estimation models for meta-analysis ofsuch data therefore appears to be important.
References
Brogden, H. E. (1949). When testing pays off. Personnel Psychology, 2,171–184.
Brogden, H. E. (1968). Restriction in range. Unpublished manuscript,Purdue University.
Callender, J. C., & Osburn, H. G. (1980). Development and test of a newmodel for validity generalization. Journal of Applied Psychology, 65,543–558.
Cohen, J., & Cohen, P. (1983). Applied multiple regression/correlationanalysis for the behavioral sciences. Hillsdale, NJ: Erlbaum.
Coward, W. M., & Sackett, P. R. (1990). Linearity of ability–performancerelationships: A re-confirmation. Journal of Applied Psychology, 75,297–300.
Field, A. P. (2001). Meta-analysis of correlation coefficients: A MonteCarlo comparison of fixed- and random-effects methods. PsychologicalMethods, 6, 161–180.
Hall, S. M., & Brannick, M. (2002). Comparison of two random effectsmethods of meta-analysis. Journal of Applied Psychology, 87, 337–389.
Hedges, L. V., & Vevea, J. L. (1998). Fixed- and random-effects models inmeta-analysis. Psychological Methods, 3, 486–504.
Hunter, J. E. (1983). Test validation for 12,000 jobs: An application of jobclassification and validity generalization analysis to the General Apti-tude Test Battery (USES Test Research Report No. 45). Washington,DC: U.S. Employment Service, U.S. Department of Labor.
Hunter, J. E., & Hunter, R. F. (1984). Validity and utility of alternativepredictors of job performance. Psychological Bulletin, 96, 72–98.
Hunter, J. E., & Schmidt, F. L. (1982). Fitting people to jobs: Implicationsof personnel selection for national productivity. In E. A. Fleishman &M. D. Dunnette (Eds.), Human performance and productivity: Vol. 1:Human capability assessment (pp. 233–284). Hillsdale, NJ: Erlbaum.
Hunter, J. E., & Schmidt, F. L. (1990a). Dichotomization of continuous
variables: The implications for meta-analysis. Journal of Applied Psy-chology, 75, 334–349.
Hunter, J. E., & Schmidt, F. L. (1990b). Methods of meta-analysis: Cor-recting error and bias in research findings. Beverly Hills, CA: Sage.
Hunter, J. E., & Schmidt, F. L. (2000). Fixed effects vs. random effectsmeta-analysis models: Implications for cumulative research knowledge.International Journal of Selection and Assessment, 8, 275–292.
Hunter, J. E., & Schmidt, F. L. (2004). Methods of meta-analysis: Cor-recting error and bias in research findings (2nd ed.). Thousand Oaks,CA: Sage.
Hunter, J. E., Schmidt, F. L., & Jackson, G. B. (1982). Meta-analysis:Cumulating research findings across studies. Beverly Hills, CA: Sage.
Johnson, J. T., & Ree, M. J. (1994). RANGEJ: A Pascal program tocompute the multivariate correction for range restriction. Educationaland Psychological Measurement, 54, 693–695.
Law, K. S., Schmidt, F. L., & Hunter, J. E. (1994a). Nonlinearity of rangecorrections in meta-analysis: A test of an improved procedure. Journalof Applied Psychology, 79, 425–438.
Law, K. S., Schmidt, F. L., & Hunter, J. E. (1994b). A test of tworefinements in meta-analysis procedures. Journal of Applied Psychol-ogy, 79, 978–986.
Lawley, D. N. (1943). A note on Karl Pearson’s selection formulae.Proceedings of the Royal Society of Edinburgh, 62(A), 28–30.
Le, H. A. (2003). Correcting for indirect range restriction in meta-analysis: Testing a new meta-analytic method. Unpublished doctoraldissertation, University of Iowa.
Linn, R. L., Harnisch, D. L., & Dunbar, S. B. (1981). Corrections for rangerestriction: An empirical investigation of conditions resulting in conser-vative corrections. Journal of Applied Psychology, 66, 655–663.
Lord, F., & Novick, M. (1968). Statistical theories of mental test scores.Reading, MA: Addison Wesley.
MacCallum, R. C., Zhang, S., Preacher, K. J., & Rucker, D. D. (2002). Onthe practice of dichotomization of quantitative variables. PsychologicalMethods, 7, 19–40.
Mendoza, J. L., & Mumford, M. (1987). Correction for attenuation andrange restriction on the predictor. Journal of Educational Statistics, 12,282–293.
Mendoza, J. L., Stafford, K. L., & Stauffer, J. M. (2000). Large-sampleconfidence intervals for validity and reliability coefficients. Psycholog-ical Methods, 5, 356–369.
National Research Council. (1992). Combining information: Statisticalissues and opportunities for research. Washington, DC: National Acad-emy of Sciences Press.
Nunnally, J. C., & Bernstein, I. H. (1994). Psychometric theory (3rd ed.).New York: McGraw-Hill.
Pearson, K. (1903). Mathematical contributions to the theory of evolution: XI.On the influence of natural selection on the variability and correlation oforgans. Royal Society Philosophical Transactions, Series A, 200, 1–66.
Raju, N. S., & Burke, M. J. (1983). Two new procedures for studyingvalidity generalization. Journal of Applied Psychology, 68, 382–395.
Raju, N. S., Burke, M. J., Normand, J., & Langlois, G. M. (1991). Ameta-analysis approach. Journal of Applied Psychology, 76, 432–446.
Ree, M. J., Caretta, T. R., Earles, J. A., & Albert, W. (1994). Sign changeswhen correcting for range restriction: A note on Pearson’s and Lawley’sselection formulas. Journal of Applied Psychology, 79, 298–301.
Roth, P. L., Bobko, P., Switzer, F. S., III, & Dean, M. A. (2001). Priorselection causes biased estimates of standardized ethnic group differ-ences: Simulation and analysis. Personnel Psychology, 54, 591–617.
Sackett, P. R., & Ostgaard, D. J. (1994). Job-specific applicant pool andnational norms for cognitive ability tests: Implications for range restric-tion corrections in validation research. Journal of Applied Psychology,79, 680–684.
608 HUNTER, SCHMIDT, AND LE
Sackett, P. R., & Yang, H. (2000). Correction for range restriction: Anexpanded typology. Journal of Applied Psychology, 85, 112–118.
Schmidt, F. L., Gast-Rosenberg, I. F., & Hunter, J. E. (1980). Validitygeneralization results for computer programmers. Journal of AppliedPsychology, 65, 643–661.
Schmidt, F. L., & Hunter, J. E. (1977). Development of a general solutionto the problem of validity generalization. Journal of Applied Psychology,62, 529–540.
Schmidt, F. L., & Hunter, J. E. (1996). Measurement error in psychologicalresearch: Lessons from 26 research scenarios. Psychological Methods, 1,199–223.
Schmidt, F. L., & Hunter, J. E. (1998). The validity and utility of selectionmethods in personnel psychology: Practical and theoretical implicationsof 85 years of research findings. Psychological Bulletin, 124, 262–274.
Schmidt, F. L., & Hunter, J. E. (1999). Theory testing and measurementerror. Intelligence, 27, 183–198.
Schmidt, F. L., & Hunter, J. E. (2003). History, development, evolution,and impact of validity generalization and meta-analysis methods, 1975–2001. In K. R. Murphy (Ed.), Validity generalization: A critical review(pp. 31–66). Mahwah, NJ: Erlbaum.
Schmidt, F. L., Hunter, J. E., McKenzie, R. C., & Muldrow, T. W. (1979).The impact of valid selection procedures on work force productivity.Journal of Applied Psychology, 64, 609–626.
Schmidt, F. L., Hunter, J. E., & Pearlman, K. (1981). Task differences andthe validity of aptitude tests in selection: A red herring. Journal ofApplied Psychology, 66, 166–185.
Schmidt, F. L., Hunter, J. E., Pearlman, K., & Hirsh, H. R. (1985). Fortyquestions about validity generalization and meta-analysis (with com-mentary by P. R. Sackett, M. L. Tenopyr, N. Schmitt, J. Kehoe, & S.Zedeck). Personnel Psychology, 38, 697–798.
Schmidt, F. L., Hunter, J. E., & Urry, V. W. (1976). Statistical power incriterion-related validity studies. Journal of Applied Psychology, 61,473–485.
Schmidt, F. L., Law, K., Hunter, J. E., Rothstein, H. R., Pearlman, K., &McDaniel, M. (1993). Refinements in validity generalization proce-dures: Implications for the situational specificity hypothesis. Journal ofApplied Psychology, 78, 3–13.
Schmidt, F. L., & Le, H. (2004). Software for the Hunter–Schmidt meta-analysis methods. Iowa City: Department of Management and Organi-zations, University of Iowa.
Schmidt, F. L., Le, H., & Ilies, R. (2003). Beyond alpha: An empiricalexamination of the effects of different sources of measurement error onreliability estimates for measures of individual differences constructs.Psychological Methods, 8, 206–224.
Schmidt, F. L., Oh, I., & Hayes, T. (2006). Fixed versus random effectsmeta-analyses models in meta-analysis: An empirical investigation ofdifferences in results in the psychological literature. Manuscript sub-mitted for publication.
Schmidt, F. L., Oh, I., & Le, H. (2006). Increasing the accuracy ofcorrections for range restriction: Implications for selection procedurevalidities and other research results. Personnel Psychology, 59, 281–305.
Stauffer, J. M., & Mendoza, J. L. (2001). The proper sequence for correc-tion correlation coefficients for range restriction and unreliability. Psy-chometrika, 66, 63–68.
Thorndike, R. L. (1949). Personnel selection. New York: Wiley.Viswesvaran, C., Ones, D. S., & Schmidt, F. L. (1996). Comparative
analysis of the reliability of job performance ratings. Journal of AppliedPsychology, 81, 557–560.
Appendix A
Demonstration That True Scores and Measurement Errors Are Correlated Under DirectRange Restriction
For simplicity, we consider an applicant reliability of .50. This makes themeasurement error variance �Ve) the same size as the true score variance�VT). That is, if we use the classical equation, X � T � e, for notation, thenVe � VT. Accordingly, we have the following:
VX � VT � Ve � 2VT � 2Ve.
Suppose we set the selection cutoff score at the median of the applicantpopulation. That is, suppose we promote the top half of the applicants. Ifwe delete the bottom half of a normal distribution, then the standarddeviation in the restricted group (top half) is only 60% as large as theoriginal standard deviation (Schmidt et al., 1976). That is, if the applicantstandard deviation is 10 (SD � 10), then the incumbent standard deviationwould be 6 (SD � 6). The variance is smaller by the square of .60 or .36.For example, if the applicant variance is 100, then the incumbent varianceis 36.
At this point, the mathematics is made easier if we introduce a newvariable that has no substantive meaning but is mathematically convenient.Denote it by B. We then compute its variance and its correlation with X:
B � T � e
Applicant population, VB � VT � Ve and rBX � 0.Because the reliability is .50, the new variable B is uncorrelated with theold variable X.A1 In the applicant population, both variables are normallydistributed and independent (because they are uncorrelated).
Consider direct range restriction on X. B is independent of X. Thus, whenwe select on X, there will be no selection on B. Thus, in the incumbentpopulation, the variance of B will be unchanged. We next use a procedurethat allows the computation of the correlation between T and e in theincumbent population. Note that in our example, VT and Ve are equal beforeselection, so selection operates symmetrically on them. That means that thetwo variances will still be equal after selection. In the incumbent popula-tion, we have the following:
Ve � VT
VX � VT � Ve � 2covTe � 36
VB � VT � Ve � 2covTe � 100
Add variances:
VX � VB � 2VT � 2Ve � 36 � 100 � 136
VT � Ve � (1/2)2(VT � Ve) � (1/2)136 � 68
A1 This can be shown as follows:
rBX � r(T�e)(T�e) �covTT � covee
2(ST2 � Se
2)�
ST2 � Se
2
2(ST2 � Se
2)�
0
2(ST2 � Se
2)� 0.
609RANGE RESTRICTION AND META-ANALYSIS
(Appendixes continue)

Because Ve � VT (above), we have VT � VT � Ve � Ve � 68
VT � Ve � 68/2 � 34
Subtract variances:
VX � VB � 4covTe � 36 � 100 � �64
covTe � �16
Compute rTe:
rTe � covTe /(SDTSDe) � �16/(�34�34) � �16/34 � �.47.
To summarize the example, in the whole applicant population, themeasurement errors are uncorrelated with true scores, but in the selectedsubpopulation of incumbents, the true scores and errors are correlated –.47.All procedures for estimating reliability assume that rTe � 0. Hence, it isa problem to estimate or even define reliability in this context (Mendoza &Mumford, 1987).
Appendix B
Estimating Range Restriction in the Dependent Variable From Range Restriction on ItsIndependent Variable
We demonstrate the derivations of formulas to estimate the effect ofrange restriction on an independent variable X (uX) on range restriction ofa dependent variable Y (uY), using correlation between the variables eitherfrom the unrestricted population or from the restricted population.
The notation follows:
� � �XY � correlation between X and Y;
Subscript i � values estimated in the restricted population (e.g., �i �correlation between X and Y in the restricted population); subscript a �values estimated in the unrestricted population (e.g., �a � correlationbetween X and Y in the unrestricted population); SXi and SXa � standarddeviations of variable X in the restricted population and unrestrictedpopulation, respectively; SYi and SYa � standard deviations of variable Y inthe restricted population and unrestricted population, respectively. Wehave the following:
uX � SXi/SXa � range restriction in X; (B1)
uY � SYi/SYa � range restriction in Y. (B2)
The two basic assumptions made by Pearson and Thorndike in derivingthe formulas to correct for range restriction are: (a) the regression weight(for predicting/explaining dependent variable from independent variable)in the restricted population is the same as the regression weight in theunrestricted population, and (b) the standard error of estimate in therestricted population is the same as the standard error of estimate in theunrestricted population (Mendoza & Mumford, 1987). The first assumptioncan be demonstrated as follows:
� iSYi/SXi � �aSYa/SXa. (B3)
The second assumption can be demonstrated as follows:
SYi(1 � �i2)1/2 � SYa(1 � �a
2)1/2 (B4)
Multiply both sides of Equation B3 for SXi/SYa
and simplify:
� iSYi/SYa � �aSXi/SXa. (B5)
From Equations B1, B2, and B5, we have the following:
� iuY � �auX. (B6)
Square both sides of Equation B6 and solve for �i2, and we have the
following:
� i2 � �a
2uX2/uY
2. (B6�)
Divide both sides of Equation B4 by SYa:
�SYi /SYa)(1 � �i2)1/2 � (1 � �a
2)1/2. (B7)
From Equations B2 and B7, we have the following:
uY(1 � �i2)1/2 � (1 � �a
2)1/2 . (B8)
Square both sides of Equation B8, and then solve it for uY2:
uY2 � (1 � �a
2)/(1 � �i2). (B9)
Equations B6� and B9 above now can be used to derive the formulas ofinterest. To estimate uY from uX and �a, complete the following:
Replace Equation B6� into Equation B9:
uY2 � (1 � �a
2)/(1 � �a2uX
2/uY2). (B10)
Expand and simplify Equation B10:
uY2 � �a
2uX2 � 1 � �a
2. (B11)
Solving Equation B11 for uY2, we have the formula of interest:
uY2 � �a
2uX2 � �a
2 � 1. (B12)
To estimate uY from uX and �i, first, solve Equation B6� for �a2:
�a2 � � i
2uY2/uX
2. (B13)
Then replace Equation B13 into Equation B9:
uY2 � (1 � �i
2uY2/uX
2)/(1 � �i2). (B14)
Expand Equation B14:
uX2uY
2 � uX2uY
2�i2 � uX
2 � �i2uY
2. (B15)
Rearrange the components of Equation B15:
uX2uY
2 � uX2uY
2�i2 � �i
2uY2 � uX
2. (B16)
Solving B16 for uY2, we have the formula of interest:
uY2 � uX
2/(uX2 � uX
2�i2 � �i
2). (B17)
610 HUNTER, SCHMIDT, AND LE

Equivalence of Equations Estimating Restricted Reliability FromUnrestricted Reliability
In this part of Appendix B, we show that the two equations introducedin the text to estimate restricted reliability from unrestricted reliability(Equations 26 and 27) are in fact equivalent. To do that, we demonstratethat Equation 27 can be derived from Equation 26 through algebraictransformation. The demonstration makes use of Equation B13 above. Itcan be seen that when Equation B13 is applied to the current situation, �a
2
and �i2 represent the unrestricted rXXa and restricted reliability rXXi, respec-
tively. Similarly, the squared range restriction ratios uY2 and uX
2 reflectsquared range restriction on observed score �uX
2) and true score �uT2),
respectively. Equation B13 can then be rewritten as follows:
rXXa � rXXiuX2/uT
2. (B18)
Solving B18 for uT2, we have the following:
uT2 � uX
2rXXi/rXXa. (B19)
Replacing uT2 in Equation B19 above into Equation 26 in the text, we have
the following:
rXXi �uT
2rXXa
uT2rXXa � 1 � rXXa
�(uX
2rXXi/rXXa)rXXa
(uX2rXXi/rXXa)rXXa � 1 � rXXa
�uX
2rXXi
uX2rXXi � 1 � rXXa. (B20)
Equation B20 can be simplified by multiplying both sides byuX
2rXXi � 1 � rXXa
rXXi:
uX2rXXi � 1 � rXXa � uX
2. (B21)
Solving Equation B21 for rXXi, we obtain Equation 27 in the text:
rXXi � 1 �1 � rXXa
uX2 � 1 � UX
2(1 � rXXa). (B22)
Appendix C
Development of the Taylor’s Series: Approximation Approach
This approach is based on Equation 31 in the text, which shows theobserved correlation �XYi as the function of the following: (a) the squareroot of the unrestricted independent variable reliability (qXa � �rXXa), (b)the square root of the restricted dependent variable reliability (qYi � �rYYi),(c) range restriction on true score T(uT), and (d) the true score correlationin the unrestricted population �TPa:
�XYi � qYi
uTqXa
�uT2qX
2a � 1 � qX
2a
uT�TPa
�uT2�TP
2a � 1 � �TP
2a
. (C1)
As shown in the text, variance of the true score correlation �TPa can beestimated by the following equation:
var�TPa� [var�XYi
� (b12varqXa
� b22varqYi
� b32varuT
� vare)]/b42, (C2)
with b1 � first order partial derivative of �XYi with respect to qXa; b2 � firstorder partial derivative of �XYi with respect to qYi; b3 � first order partialderivative of �XYi with respect to uT; b4 � first order partial derivative of�XYi with respect to �TPa.
To simplify the presentation, the following notation is used:
P � �XYi;
X � qXa;
Y � qYi;
U � uT;
� � �TPa;
A �1
�uT2�TP
2a � �TPa
2� 1
;
B �1
�uT2qX
2a � qX
2a � 1
.
Equation C1 above can be rewritten as follows:
P � XY�U2AB. (C3)
The derivatives in Equation C2 can then be estimated from Equation C3 asfollows.
Estimating b1
The coefficient b1 is the first order partial derivative of P with respect toX:
b1 � dP/dX � Y�U2A[d(XB)/dX] � Y�U2A
d� X
�U2X2 � X2 � 1�dX
. (C4)
Applying the formula for derivatives of the product to Equation C4, wehave the following:
b1 � Y�U2A � 1
�U2X2 � X2 � 1
� X[2X(U2 � 1)]� �1
2�(U2X2 � X2 � 1)3��. (C5)
Simplifying and rearranging Equation C5, we have the needed formula toestimate b1:
b1 � Y�U2A[B � X2(U2 � 1)B3] �P
X� PXB2(U2 � 1). (C6)
Estimating b2
As mentioned above, b2 is first order partial derivative of P with respectto Y:
b2 � dP/dY � X�U2AB � P/Y. (C7)
611RANGE RESTRICTION AND META-ANALYSIS
(Appendixes continue)

Estimating b3
The coefficient b3 is the first order partial derivative of P with respect to U:
b3 � dP/dU � XY��d� U2
�U2X2 � X2 � 1�U2�2 � �2 � 1�dU
. (C8)
Applying formula for derivatives of the product to Equation C8, we havethe following:
b3 � XY��2UAB � U2A(2UX2)� �1
2�(U2X2 � X2 � 1)3� �
U2B(2U�2)� �1
2�(U2�2 � �2 � 1)3��. (C9)
Simplifying and rearranging Equation C9, we have the needed formula toestimate b3:
b3 � XY�(2UAB � U3X2AB3 � U3�2A3B) �2P
U� PUX2B2 � PU�2A2.
(C10)
Estimating b4
The coefficient b4 is the first order partial derivative of P with respectto �:
b4 � dP/d� � XYU2B[d(XA)/d�] � XYU2B
d� �
�U2�2 � �2 � 1�d�
.
(C11)
Applying formula for derivatives of the product to Equation C11, we havethe following:
b4 � XYU2B� 1
�U2�2 � �2 � 1
� �[2�(U2 � 1)]� �1
2�(U2�2 � �2 � 1)3��. (C12)
Simplifying and rearranging Equation C12, we have the needed formula toestimate b4:
b4 � XYU2B[A � �2(U2 � 1)B3] �P
�� P�A2(U2 � 1). (C13)
The variance of true score correlation can then be estimated by EquationC2. The values of b1, b2, b3, and b4 in Equation C2 are estimated byreplacing the means of X, Y, U, and � in their respective distributions intoEquations C6, C7, C10, and C13.
Received October 26, 2004Revision received May 15, 2005
Accepted May 20, 2005 �
612 HUNTER, SCHMIDT, AND LE