Implementation of a Grid Performance Analysis and Tuning Framework using Jade Technology
270
SESSION GRID SERVICES, SCHEDULING, AND RESOURCE MANAGEMENT + RELATED ISSUES Chair(s) TBA Int'l Conf. Grid Computing and Applications | GCA'08 | 1
Transcript of Implementation of a Grid Performance Analysis and Tuning Framework using Jade Technology

SESSION
GRID SERVICES, SCHEDULING, ANDRESOURCE MANAGEMENT + RELATED
ISSUES
Chair(s)
TBA
Int'l Conf. Grid Computing and Applications | GCA'08 | 1

2 Int'l Conf. Grid Computing and Applications | GCA'08 |

Network-aware Peer-to-Peer Based GridInter-Domain Scheduling
Agustın Caminero1,∗, Omer Rana2, Blanca Caminero1, Carmen Carrion1
1Albacete Research Institute of Informatics, University of Castilla La Mancha, Albacete (SPAIN)2Cardiff School of Computer Science, Cardiff University, Cardiff (UK)
∗Corresponding author ([email protected])
Abstract Grid technologies have enabled the aggregationof geographically distributed resources, in the context of aparticular application. The network remains an importantrequirement for any Grid application, as entities involvedin a Grid system (such as users, services, and data) needto communicate with each other over a network. The per-formance of the network must therefore be considered whencarrying out tasks such as scheduling, migration or monitoringof jobs. Moreover, the interactions between different domainsare a key issue in Grid computing, thus their effects should beconsidered when performing the scheduling task. In this paper,we enhance an existing framework that provides scheduling ofjobs to computing resources to allow multi-domain schedulingbased on peer-to-peer techniques.
Keywords: Grid computing, interdomain scheduling, peer-to-peer, network
I. Introduction
Grid computing enables the aggregation of dispersedheterogeneous resources for supporting large-scale par-allel applications in science, engineering and com-merce [12]. Current Grid systems are highly variableenvironments, made of a series of independent organiza-tions that share their resources, creating what is knownas Virtual Organizations (VOs) [13]. This variabilitymakes Quality of Service (QoS) highly desirable, thoughoften very difficult to achieve in practice [21]. One ofthe reasons for this limitation is the lack of control overthe network that connects various components of a Gridsystem. Achieving an end-to-end QoS is often difficult,as without resource reservation any guarantees on QoSare often hard to satisfy. However, for applications thatneed a timely response (such as collaborative visualiza-tion [15]), the Grid must provide users with some kindof assurance about the use of resources – a non-trivialsubject when viewed in the context of network QoS.In a VO, entities communicate with each other usingan interconnection network – resulting in the networkplaying an essential role in Grid systems [21].
As a VO is made of different organizations (ordomains), the interactions between different domainsbecomes important when executing jobs. Hence, a user
Fig. 1. Several administrative domains.
wishing to execute a job with particular QoS constraints(such as response time) may contact a resource brokerto discover suitable resources – which would need tolook across multiple domains if local resources cannotbe found.
Metrics related to network QoS (such as latency,bandwidth, packet loss and packet jitter) are importantwhen performing scheduling of jobs to computing re-sources – in addition to the capabilities of the computingresources themselves. As mentioned above, the lackof suitable local (in the user’s administrative domain)resources requires access to those from a differentdomain to run a job. However, the connectivity betweenthe two domains now becomes important, and is themain emphasis of this work. Figure 1 depicts a numberof administrative domains connected with each otherby means of network connections. Each connectionbetween two peers has an effective bandwidth, whosecalculation will be explained in this paper. Each pair ofneighbor peers may have different network paths linkingeach other, thus we rely on networking protocols, suchas the Border Gateway Protocol (BGP) [20] to decidethe optimal path between two destination networks.
The main contribution of this paper is a proposal forinter-domain scheduling, which makes use of techniquesused in Peer-to-Peer (P2P) systems. Also, an analyticalevaluation has been performed showing the behaviorof our proposal under normal network and computingresource workloads. This paper is structured as follows:Section II explains current proposals on network QoSin Grid computing and the lack of attention paid to
Int'l Conf. Grid Computing and Applications | GCA'08 | 3

inter-domain scheduling. Also, existing proposals forinter-domain scheduling are revised. Section III explainsour proposal of inter-domain scheduling. Section IVprovides an evaluation, demonstrating the usefulness ofour work, and Section V shows some guidelines for ourfuture work.
II. Related work
The proposed architecture supports the effective man-agement of network QoS in a Grid system, and focuseson the interactions between administrative domainswhen performing the scheduling of jobs to computingresources. P2P techniques are used to decide whichneighboring domain a query should be forwarded to,in the absence of suitable local resources. We willfirst provide a brief overview of existing proposals formanaging network QoS in Grids.
General-purpose Architecture for Reservation andAllocation (GARA) [21] provides programmers andusers with convenient access to end-to-end QoS forcomputer applications. It provides mechanisms for mak-ing QoS reservations for different types of resources,including computers, networks, and disks. These uni-form mechanisms are integrated into a modular structurethat permits the development of a range of high-levelservices. Regarding multi-domain reservations, GARAmust exist in all the traversed domains, and the user (ora broker acting on his behalf) has to be authenticatedwith all the domains. This makes GARA difficult toscale.
The Network Resource Scheduling Entity (NRSE) [5]suggests that signalling and per-flow state overheadcan cause end-to-end QoS reservation schemes to scalepoorly to a large number of users and multi-domainoperations – observed when using IntServ and RSVP,as also with GARA [5]. This has been addressed inNRSE by storing the per-flow/per application state onlyat the end-sites that are involved in the communication.Although NRSE has demonstrated its effectiveness inproviding DiffServ QoS, it is not clear how a Gridapplication developer would make use of this capability– especially as the application programming interface isnot clearly defined [3].
Grid Quality of Service Management (G-QoSM) [3]is a framework to support QoS management in compu-tational Grids in the context of the Open Grid ServiceArchitecture (OGSA). G-QoSM is a generic modularsystem that, conceptually, supports various types ofresource QoS, such as computation, network and diskstorage. This framework aims to provide three mainfunctions: 1) support for resource and service discoverybased on QoS properties; 2) provision for QoS guar-antees at application, middleware and network levels,
and the establishment of Service Level Agreements(SLAs) to enforce QoS parameters; and 3) support forQoS management of allocated resources, on three QoSlevels: ‘guaranteed’, ‘controlled load’ and ‘best effort’.G-QoSM also supports adaptation strategies to shareresource capacity between these three user categories.
The Grid Network-aware Resource Broker(GNRB) [2] is an entity that enhances the features ofa Grid Resource Broker with the capabilities providedby a Network Resource Manager. This leads to thedesign and implementation of new mapping/ schedulingmechanisms to take into account both network andcomputational resources. The GNRB, using networkstatus information, can reserve network resourcesto satisfy the QoS requirements of applications.The architecture is centralized, with one GNRB peradministrative domain – potentially leading to theGNRB becoming a bottleneck within the domain.Also, GNRB is a framework, and does not enforce anyparticular algorithms to perform scheduling of jobs toresources.
Many of the above efforts do not take networkcapability into account when scheduling tasks. GARAschedules jobs by using DSRT and PBS, whilst G-QoSM uses DSRT. These schedulers (DSRT and PBS)only pay attention to the workload of the computingresource, thus a powerful unloaded computing resourcewith an overloaded network could be chosen to run jobs,which decreases the performance received by users,especially when the job requires a high network I/O.
Finally, VIOLA [24] provides a meta-schedulingframework that provides co-allocation support for bothcomputational and network resources. It is able to ne-gotiate with the local scheduling systems to find, and toreserve, a common time slot to execute various compo-nents of an application. The meta-scheduling service inVIOLA has been implemented via the UNICORE Gridmiddleware for job submission, monitoring, and control.This allows a user to describe the distribution of the par-allel MetaTrace application and the requested resourcesusing the UNICORE client, while the allocation andreservation of resources are undertaken automatically.A key feature in VIOLA is the network reservationcapability; this allows the network to be treated as aresource within a meta-scheduling application. In thiscontext, VIOLA is somewhat similar to our approach– in that it also considers the network as a key part inthe job allocation process. However, the key differenceis the focus in VIOLA on co-allocation and reservation– which is not always possible if the network is underownership of a different administrator.
Choosing the most useful domain is a key issue whenpropagating a query to another administrative domain.
4 Int'l Conf. Grid Computing and Applications | GCA'08 |

DIANA [4] performs global meta-scheduling in a localenvironment, typically in a LAN, and utilizes meta-schedulers that work in a P2P manner. Each site has ameta-scheduler that communicates with all other meta-schedulers on other sites. DIANA has been developedto make decisions based on global information. Thismakes DIANA unsuitable for realistic Grid testbeds –such as the LHC Computing Grid [1].
The Grid Distribution Manager (GridDM) is part ofthe e-Protein Project [18], a P2P system that performsinter-domain scheduling and load balancing within acluster – utilizing schedulers such as SGE, Condoretc. Similarly, Xu et al. [25] present a frameworkfor the QoS-aware discovery of services, where theQoS is based on feedback from users. Gu et al. [14]propose a scalable aggregation model for P2P systems– to automatically aggregate services into a distributedapplication, to enable the resulting application to meetuser defined QoS criteria.
Our proposal is based on the architecture presentedin [6] and extended in [7]. This architecture providesscheduling of jobs to computing resources within oneor more administrative domains. A key component is theGrid Network Broker (GNB), which provides schedul-ing of jobs to computing resources, taking account ofnetwork characteristics.
III. Inter-domain scheduling
The proposed architecture is shown in Figure 2and has the following entities: Users, each one witha number of jobs; computing resources, e.g. clusters ofcomputers; routers; GNB (Grid Network Broker), a jobscheduler; GIS (Grid Information Service), such as [11],which keeps a list of available resources; resourcemonitor (for example, Ganglia [16]), which providesdetailed information on the status of the resources; BB(Bandwidth Broker) such as [22], which is in chargeof the administrative domain, and has direct access torouters. The BB can be used to support reservation ofnetwork links, and can keep track of the interconnectiontopology between two end points within a network. Amore in-depth description of the functionality of thearchitecture can be found in [7].
We make the following assumption in the architec-ture: (1) each domain must provide the resources itannounces – i.e. when a domain publishes X machineswith Y speed, those machines are physically locatedwithin the domain. The opposite case would be thata domain contains just a pointer to where the ma-chines are. This is used to calculate the number ofhops between the user and the domain providing theresource(s); (2) the resource monitor should provide
Fig. 2. One single administrative domain.
exactly the same measurements in all the domains. Oth-erwise, no comparison can be made between domains.
We use a Routing Indices (RI) [10] to enable nodesto forward queries to neighbors that are more likely tohave suitable resources. A node continues to forwardsthe query to a subset of its neighbors, based on itslocal RI, rather than by selecting neighbors at randomor by flooding the network (i.e. by forwarding the queryto all neighbors). This minimizes the amount of trafficgenerated within a P2P system.
A. Routing Indices
Routing Indices (RI) [10] were initially developed tosupport document discovery in P2P systems, and theyhave also been used to implement a Grid informationservice in [19]. The goal of RIs is to help users finddocuments with content of interest across potential P2Pnodes efficiently. The RI represents the availability ofdata of a specific type in the neighbor’s informationbase. We use a version of RI called Hop-Count RoutingIndex (HRI) [10], which considers the number of hopsneeded to reach a datum. Our implementation of HRIcalculates the aggregate capability of a neighbor do-main, based on the resources it contains and the effectivebandwidth of the link between the two domains. Moreprecisely, Equation (1) is applied.
Ilp =
( num machinesp∑i=0
max num processesi
current num processesi
)× e f f bw(l, p)
(1)
where Ilp is the information that the local
domain l keeps about the neighbor domain p;num machinesp is the number of machines domain phas; current num processesi is the current number ofprocesses running in the machine; max num processes i
is the maximum number of processes that can be runin that machine; e f f bw(l, p) is the effective bandwidthof the network connection between the local domain land the peer domain p, and it is calculated as follows.At every interval, GNBs forward a query along thepath to their neighbor GNBs, asking for the numberof transmitted bytes for each interface the query goes
Int'l Conf. Grid Computing and Applications | GCA'08 | 5
through (the OutOctets parameter of SNMP [17]). Byusing two consecutive measurements (m1 and m2, m1
shows X bytes, and m2 shows Y bytes), and consideringthe moment when they were collected (m1 collected attime t1 seconds and m2 at t2 seconds), and the capacityof the link C, we can calculate the effective bandwidthof each link as follows:
e f f bw(l, p) = C − Y − Xt2 − t1
(2)
The effective bandwidth of the path is the smallesteffective bandwidth of links in that path. Also, pre-dictions on the values of the resource power and theeffective bandwidth can be used, for example, calculatedas pointed out in [7]. As we can see, the networkplays an important role when calculating the qualityof a domain. Because of space limitations, we cannotprovide an in-depth explanation of the formulas, see [8]for details on the terms in equation 1.
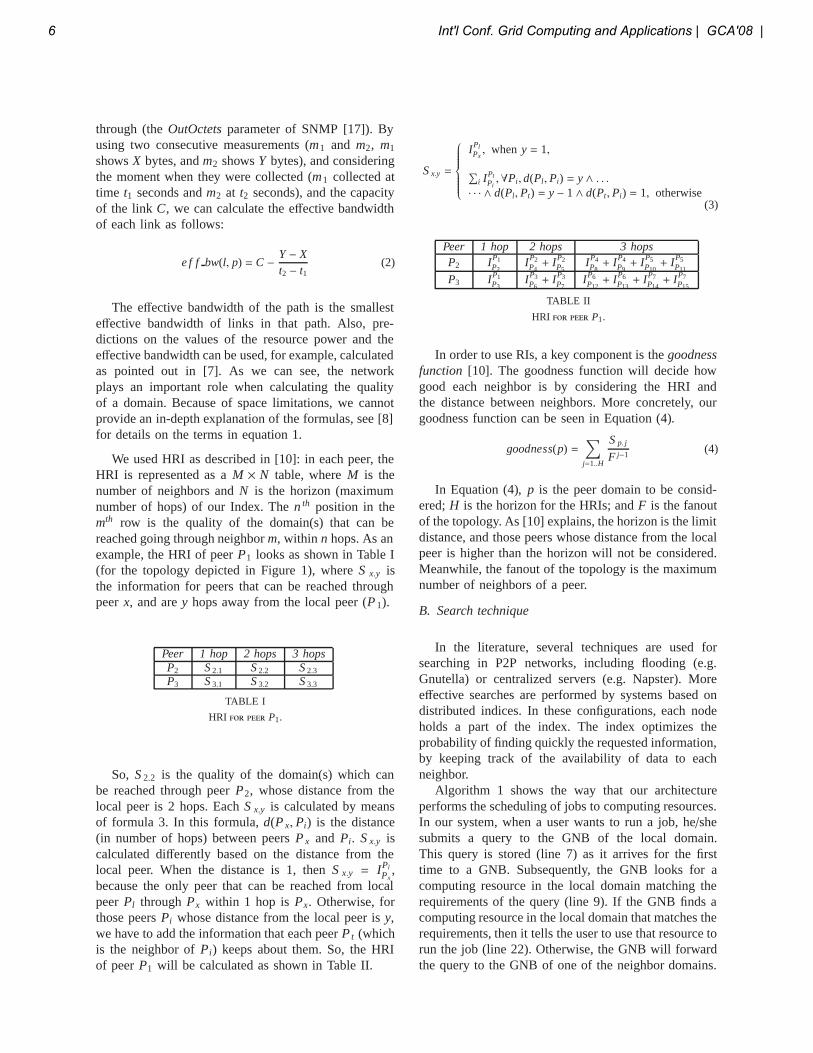
We used HRI as described in [10]: in each peer, theHRI is represented as a M × N table, where M is thenumber of neighbors and N is the horizon (maximumnumber of hops) of our Index. The n th position in themth row is the quality of the domain(s) that can bereached going through neighbor m, within n hops. As anexample, the HRI of peer P1 looks as shown in Table I(for the topology depicted in Figure 1), where S x.y isthe information for peers that can be reached throughpeer x, and are y hops away from the local peer (P 1).
Peer 1 hop 2 hops 3 hopsP2 S 2.1 S 2.2 S 2.3
P3 S 3.1 S 3.2 S 3.3
TABLE I
HRI for peer P1.
So, S 2.2 is the quality of the domain(s) which canbe reached through peer P2, whose distance from thelocal peer is 2 hops. Each S x.y is calculated by meansof formula 3. In this formula, d(P x, Pi) is the distance(in number of hops) between peers P x and Pi. S x.y iscalculated differently based on the distance from thelocal peer. When the distance is 1, then S x.y = IPl
Px,
because the only peer that can be reached from localpeer Pl through Px within 1 hop is Px. Otherwise, forthose peers Pi whose distance from the local peer is y,we have to add the information that each peer Pt (whichis the neighbor of Pi) keeps about them. So, the HRIof peer P1 will be calculated as shown in Table II.
S x.y =
⎧⎪⎪⎪⎪⎪⎪⎨⎪⎪⎪⎪⎪⎪⎩
IPlPx, when y = 1,
∑i IPt
Pi,∀Pi, d(Pl, Pi) = y ∧ . . .
· · · ∧ d(Pl, Pt) = y − 1 ∧ d(Pt, Pi) = 1, otherwise(3)
Peer 1 hop 2 hops 3 hopsP2 IP1
P2IP2P4+ IP2
P5IP4P8+ IP4
P9+ IP5
P10+ IP5
P11
P3 IP1P3
IP3P6+ IP3
P7IP6P12+ IP6
P13+ IP7
P14+ IP7
P15
TABLE II
HRI for peer P1.
In order to use RIs, a key component is the goodnessfunction [10]. The goodness function will decide howgood each neighbor is by considering the HRI andthe distance between neighbors. More concretely, ourgoodness function can be seen in Equation (4).
goodness(p) =∑
j=1..H
S p. j
F j−1(4)
In Equation (4), p is the peer domain to be consid-ered; H is the horizon for the HRIs; and F is the fanoutof the topology. As [10] explains, the horizon is the limitdistance, and those peers whose distance from the localpeer is higher than the horizon will not be considered.Meanwhile, the fanout of the topology is the maximumnumber of neighbors of a peer.
B. Search technique
In the literature, several techniques are used forsearching in P2P networks, including flooding (e.g.Gnutella) or centralized servers (e.g. Napster). Moreeffective searches are performed by systems based ondistributed indices. In these configurations, each nodeholds a part of the index. The index optimizes theprobability of finding quickly the requested information,by keeping track of the availability of data to eachneighbor.
Algorithm 1 shows the way that our architectureperforms the scheduling of jobs to computing resources.In our system, when a user wants to run a job, he/shesubmits a query to the GNB of the local domain.This query is stored (line 7) as it arrives for the firsttime to a GNB. Subsequently, the GNB looks for acomputing resource in the local domain matching therequirements of the query (line 9). If the GNB finds acomputing resource in the local domain that matches therequirements, then it tells the user to use that resource torun the job (line 22). Otherwise, the GNB will forwardthe query to the GNB of one of the neighbor domains.
6 Int'l Conf. Grid Computing and Applications | GCA'08 |
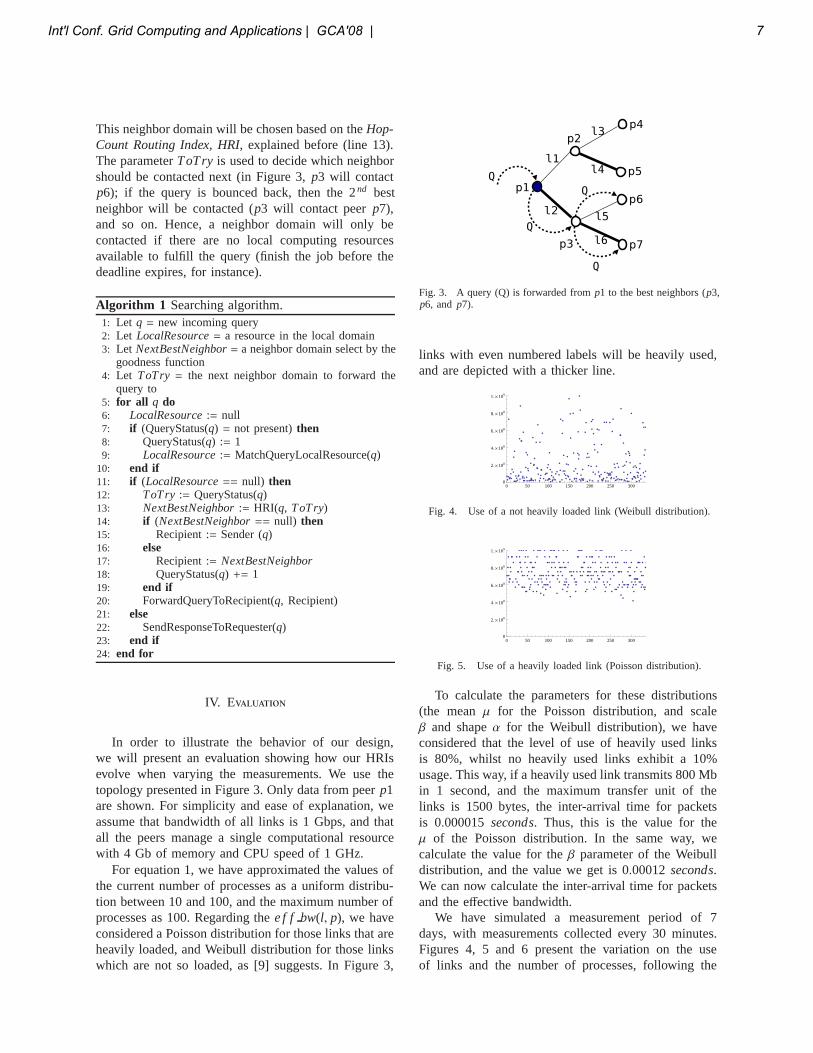
This neighbor domain will be chosen based on the Hop-Count Routing Index, HRI, explained before (line 13).The parameter ToTry is used to decide which neighborshould be contacted next (in Figure 3, p3 will contactp6); if the query is bounced back, then the 2 nd bestneighbor will be contacted (p3 will contact peer p7),and so on. Hence, a neighbor domain will only becontacted if there are no local computing resourcesavailable to fulfill the query (finish the job before thedeadline expires, for instance).
Algorithm 1 Searching algorithm.1: Let q = new incoming query2: Let LocalResource = a resource in the local domain3: Let NextBestNeighbor = a neighbor domain select by the
goodness function4: Let ToTry = the next neighbor domain to forward the
query to5: for all q do6: LocalResource := null7: if (QueryStatus(q) = not present) then8: QueryStatus(q) := 19: LocalResource := MatchQueryLocalResource(q)
10: end if11: if (LocalResource == null) then12: ToTry := QueryStatus(q)13: NextBestNeighbor := HRI(q, ToTry)14: if (NextBestNeighbor == null) then15: Recipient := Sender (q)16: else17: Recipient := NextBestNeighbor18: QueryStatus(q) += 119: end if20: ForwardQueryToRecipient(q, Recipient)21: else22: SendResponseToRequester(q)23: end if24: end for
IV. Evaluation
In order to illustrate the behavior of our design,we will present an evaluation showing how our HRIsevolve when varying the measurements. We use thetopology presented in Figure 3. Only data from peer p1are shown. For simplicity and ease of explanation, weassume that bandwidth of all links is 1 Gbps, and thatall the peers manage a single computational resourcewith 4 Gb of memory and CPU speed of 1 GHz.
For equation 1, we have approximated the values ofthe current number of processes as a uniform distribu-tion between 10 and 100, and the maximum number ofprocesses as 100. Regarding the e f f bw(l, p), we haveconsidered a Poisson distribution for those links that areheavily loaded, and Weibull distribution for those linkswhich are not so loaded, as [9] suggests. In Figure 3,
Fig. 3. A query (Q) is forwarded from p1 to the best neighbors (p3,p6, and p7).
links with even numbered labels will be heavily used,and are depicted with a thicker line.
0 50 100 150 200 250 3000
2.�108
4.�108
6.�108
8.�108
1.�109
Fig. 4. Use of a not heavily loaded link (Weibull distribution).
0 50 100 150 200 250 3000
2.�108
4.�108
6.�108
8.�108
1.�109
Fig. 5. Use of a heavily loaded link (Poisson distribution).
To calculate the parameters for these distributions(the mean μ for the Poisson distribution, and scaleβ and shape α for the Weibull distribution), we haveconsidered that the level of use of heavily used linksis 80%, whilst no heavily used links exhibit a 10%usage. This way, if a heavily used link transmits 800 Mbin 1 second, and the maximum transfer unit of thelinks is 1500 bytes, the inter-arrival time for packetsis 0.000015 seconds. Thus, this is the value for theμ of the Poisson distribution. In the same way, wecalculate the value for the β parameter of the Weibulldistribution, and the value we get is 0.00012 seconds.We can now calculate the inter-arrival time for packetsand the effective bandwidth.
We have simulated a measurement period of 7days, with measurements collected every 30 minutes.Figures 4, 5 and 6 present the variation on the useof links and the number of processes, following the
Int'l Conf. Grid Computing and Applications | GCA'08 | 7

0 50 100 150 200 250 3000
20
40
60
80
100
Fig. 6. Variation of the number of processes (Uniform distribution).
mathematical distributions explained before. Figures 4and 5 represent the level of use of links compared to theactual bandwidth (1 Gbps), per measurement. Heavilyused links get a higher used bandwidth than not heavilyused links. Thus, the data shown in these figures areused for our HRIs in order to decide where to forwarda query.
0 50 100 150 200 250 3000.00000
0.00005
0.00010
0.00015
0.00020
0.00025
0.00030
0.00035
0.00040
Fig. 7. S 2.1 = Ip1p2 (link p1 − p2 is not heavily loaded).
0 50 100 150 200 250 3000.00000
0.00005
0.00010
0.00015
0.00020
0.00025
0.00030
0.00035
0.00040
Fig. 8. S 3.1 = Ip1p3 (link p1 − p3 is heavily loaded).
0 50 100 150 200 250 3000.00000
0.00005
0.00010
0.00015
0.00020
0.00025
0.00030
0.00035
0.00040
Fig. 9. S 2.2 (S 3.2 would also look like this).
Figures 7, 8 and 9 present the variation of the S x.y forboth heavily/ unheavily loaded links. These figures havebeen calculated by means of the formulas explained inSection III-A, and applying them to the mathematicaldistributions mentioned above. As we explained inTables I and II, S 2.1 = Ip1
p2 , and S 3.1 = Ip1p3 . We can
see that the network performance affects the HRI, as
was expected. We must recall that the higher the HRIis, the better, because it means that the peer is powerfuland well connected. Also, we see that when the linkis not heavily loaded, the S has more high values, andvalues are more scattered across the figure. As opposedto it, when the link is heavily loaded, more values aregrouped together at the bottom of the figure. Also, forFigure 9, S 2.2 = IP2
P4+ IP2
P5, and S 3.2 = IP3
P6+ IP3
P7, which
means that to calculate S 2.2 and S 3.2, both heavily andnot heavily used links are used.
Figures 10 and 11 show the variation of the goodnessfunction for both neighbors of peer p1. Recall thatthe link between p1 and p2 is unloaded, and the linkbetween p1 and p3 is loaded. These facts reflect in bothgoodness functions: in the case of p2 it shows highervalues than the goodness function for p3. It can also beseen that the function of p2 has less values grouped nearthe zero axis. To summarize, a job originated in p1 willmore likely be scheduled through peer p2 than throughpeer p3, as expected due to the links conditions.
0 50 100 150 200 250 3000.00000
0.00005
0.00010
0.00015
0.00020
0.00025
0.00030
0.00035
0.00040
Fig. 10. Goodness function for peer p2 (link p1 − p2 unloaded).
0 50 100 150 200 250 3000.00000
0.00005
0.00010
0.00015
0.00020
0.00025
0.00030
0.00035
0.00040
Fig. 11. Goodness function for peer p3 (link p1 − p3 loaded).
V. Conclusions and future work
The network remains an important requirement forany Grid application, as entities involved in a Gridsystem (such as users, services, and data) need tocommunicate with each other over a network. The per-formance of the network must therefore be consideredwhen carrying out tasks such as scheduling, migrationor monitoring of jobs. Also, inter-domain relations arekey in Grid computing.
We propose an extension to an existing schedul-ing framework to allow network-aware multi-domainscheduling based on P2P techniques. More precisely,
8 Int'l Conf. Grid Computing and Applications | GCA'08 |

our proposal is based on Routing Indices (RI). This waywe allow nodes to forward queries to neighbors that aremore likely to have answers. If a node cannot find asuitable computing resource for a user’s job within itsdomain, t forwards the query to a subset of its neighbors,based on its local RI, rather than by selecting neighborsat random or by flooding the network by forwarding thequery to all neighbors.
Our approach will be evaluated further using theGridSim simulation In this way, we will be able tostudy how the proposed technique behaves in complexscenarios, in a repeatable and controlled manner.
Acknowledgement
Work jointly supported by the Spanish MEC and Eu-ropean Commission FEDER funds under grants “Con-solider Ingenio-2010 CSD2006-00046” and “TIN2006-15516-C04-02”; jointly by JCCM and Fondo SocialEuropeo under grant “FSE 2007-2013”; and by JCCMunder grants “PBC-05-007-01”, “PBC-05-005-01”.
References
[1] LCG (LHC Computing Grid) Project. Web Page, 2008. http://lcg.web.cern.ch/LCG.
[2] D. Adami et al. Design and implementation of a grid network-aware resource broker. In Intl. Conf. on Parallel and DistributedComputing and Networks, Innsbruck, Austria, 2006.
[3] R. Al-Ali et al. Network QoS Provision for Distributed GridApplications. Intl. Journal of Simulations Systems, Science andTechnology, Special Issue on Grid Performance and Dependabil-ity, 5(5), December 2004.
[4] A. Anjum, R. McClatchey, H. Stockinger, A. Ali, I. Willers,M. Thomas, M. Sagheer, K. Hasham, and O. Alvi. DIANAscheduling hierarchies for optimizing bulk job scheduling. InSecond Intl. Conference on e-Science and Grid Computing,Amsterdam, Netherlands, 2006.
[5] S. Bhatti, S. Sørensen, P. Clark, and J. Crowcroft. NetworkQoS for Grid Systems. The Intl. Journal of High PerformanceComputing Applications, 17(3), 2003.
[6] A. Caminero, C. Carrion, and B. Caminero. Designing an entityto provide network QoS in a Grid system. In 1st Iberian GridInfrastructure Conference (IberGrid), Santiago de Compostela,Spain, 2007.
[7] A. Caminero, O. Rana, B. Caminero, and C. Carrion. AnAutonomic Network-Aware Scheduling Architecture for GridComputing. In 5th Intl. Workshop on Middleware for GridComputing (MGC), Newport Beach, USA, 2007.
[8] A. Caminero, O. Rana, B. Caminero, and C. Carrion. Providingnetwork QoS support in Grid systems by means of peer-to-peertechniques. Technical Report DIAB-08-01-1, Dept. of ComputingSystems. Univ. of Castilla La Mancha, Spain, January 2008.
[9] J. Cao, W. Cleveland, D. Lin, and D. Sun. Nonlinear Estimationand Classification, chapter Internet traffic tends toward Poissonand independent as the load increases. Springer Verlag, NewYork, USA, 2002.
[10] A. Crespo and H. Garcia-Molina. Routing Indices For Peer-to-Peer Systems. In Intl. Conference on Distributed ComputingSystems (ICDCS), Vienna, Austria, 2002.
[11] S. Fitzgerald, I. Foster, C. Kesselman, G. von Laszewski,W. Smith, and S. Tuecke. A directory service for configuringhigh-performance distributed computations. In 6th Symposiumon High Performance Distributed Computing (HPDC), Portland,USA, 1997.
[12] I. Foster and C. Kesselman. The Grid 2: Blueprint for a NewComputing Infrastructure. Morgan Kaufmann, 2 edition, 2003.
[13] I. T. Foster. The anatomy of the Grid: Enabling scalable virtualorganizations. In 1st Intl. Symposium on Cluster Computing andthe Grid (CCGrid), Brisbane, Australia, 2001.
[14] X. Gu and K. Nahrstedt. A Scalable QoS-Aware ServiceAggregation Model for Peer-to-Peer Computing Grids. In 11thIntl. Symposium on High Performance Distributed Computing(HPDC), Edinburgh, UK, 2002.
[15] F. T. Marchese and N. Brajkovska. Fostering asynchronous col-laborative visualization. In 11th Intl. Conference on InformationVisualization, Washington DC, USA, 2007.
[16] M. L. Massie, B. N. Chun, and D. E. Culler. The Gangliadistributed monitoring system: design, implementation, and ex-perience. Parallel Computing, 30(5-6):817–840, 2004.
[17] K. McCloghrie and M. T. Rose. Management Information Basefor Network Management of TCP/IP-based internets: MIB-II.Internet proposed standard RFC 1213, March 1991.
[18] A. O’Brien, S. Newhouse, and J. Darlington. Mapping ofScientific Workflow within the E-Protein Project to DistributedResources. In UK e-Science All-hands Meeting, Nottingham, UK,2004.
[19] D. Puppin, S. Moncelli, R. Baraglia, N. Tonellotto, and F. Sil-vestri. A Grid Information Service Based on Peer-to-Peer. In11th Intl. Euro-Par Conference, Lisbon, Portugal, 2005.
[20] Y. Rekhter, T. Li, and S. Hares. A Border Gateway Protocol 4(BGP-4). Internet proposed standard RFC 4271, January 2006.
[21] A. Roy. End-to-End Quality of Service for High-End Applica-tions. PhD thesis, Dept. of Computer Science, Univ. of Chicago,2001.
[22] S. Sohail, K. B. Pham, R. Nguyen, and S. Jha. BandwidthBroker Implementation: Circa-Complete and Integrable. Tech-nical report, School of Computer Science and Engineering, TheUniversity of New South Wales, 2003.
[23] A. Sulistio, G. Poduval, R. Buyya, and C.-K. Tham. On in-corporating differentiated levels of network service into GridSim.Future Generation Computer Systems, 23(4), May 2007.
[24] O. Waldrich, P. Wieder, and W. Ziegler. A Meta-schedulingService for Co-allocating Arbitrary Types of Resources. In 6thIntl. Conference on Parallel Processing and Applied Mathematics(PPAM), Poznan, Poland, 2005.
[25] D. Xu, K. Nahrstedt, and D. Wichadakul. QoS-Aware Discoveryof Wide-Area Distributed Services. In 1st Intl. Symp. on ClusterComp. and the Grid (CCGrid), Brisbane, Australia, 2001.
Int'l Conf. Grid Computing and Applications | GCA'08 | 9

Using a Web-based Framework to Manage Grid Deployments.
Georgios Oikonomou1 and Theodore Apostolopoulos1
1Department of Informatics, Athens University of Economics and Business, Athens, Greece
Abstract - WebDMF is a Web-based Framework for the Management of Distributed services. It is based on the Web-based Enterprise Management (WBEM) standards family and introduces a middleware layer of entities called “Representatives”. Details related to the managed application are detached from the representative logic, making the framework suitable for a variety of services. WebDMF can be integrated with existing WBEM infrastructures and is complementary to web service-based management efforts. This paper describes how the framework can be used to manage grids without modifications to existing installations. It compares the proposed solution with other research initiatives. Experiments on an emulated network topology indicate its viability.
Keywords: WebDMF, Grid Management, Distributed Services Management, Web-based Enterprise Management, Common Information Model.
1 Introduction During the past decades the scenery in computing and
networking has undergone revolutionary changes. From the era of single, centralised systems we are steadily moving to an era of highly decentralised, interconnected nodes that share resources in order to provide services transparently to the end user.
Traditionally, legacy management approaches such as the Simple Network Management Protocol (SNMP) [1], targeted single nodes. The current paradigm presents new challenges and increases complexity in the area of network and systems management. There is need for solutions that view a distributed deployment as a whole, instead of as a set of isolated hosts.
The Web-based Distributed Management Framework (WebDMF) is the result of our work detailed in [2]. It is a framework for the management of distributed services and uses standard web technologies. Its core is based on the Web-based Enterprise Management (WBEM) family of specifications [3], [4], [5]. It is not limited to monitoring but is also capable of modifying the run-time parameters of
the managed service. Finally, it has a wide target group. It can perform the management of a variety of distributed systems, such as distributed file systems, computer clusters and computational or data grids. However, multiprocessor, multi-core, parallel computing and similar systems are considered out of the scope of our work, even though they are very often referred to as “distributed”. The main contribution of this paper is three-fold:
• We demonstrate how a WebDMF deployment can be used for the management of a grid, without any modification to existing WBEM management infrastructures.
• We provide indications for the viability of the approach through a preliminary performance evaluation.
• We show that WebDMF is not competitive to emerging Web Service-based grid management initiatives. Instead, it is a step towards the same direction. Section 2 summarizes some recent approaches in the
field of grid management and compares our work with those efforts. In order to familiarize the reader with some basic concepts, section 3 presents a short introduction to the WBEM family of standards. In section 4 we briefly describe WebDMF’s architecture and some implementation details. In the same section we demonstrate how the framework can be used to manage grids. Finally, we discuss the relationship between WebDMF and Web Service-based management and we present some preliminary evaluation results. Section 5 presents our conclusions.
2 Related Work – Motivation In this section we aim to outline some of the research
initiatives in the field of grid management. The brief review is limited to the most recent ones.
2.1 Related Work An important approach is the one proposed by the
Open Grid Forum (OGF). OGF’s Grid Monitoring Architecture (GMA) uses an event producer – event consumer model to monitor grid resources [6]. However, as the name suggests, GMA is limited to monitoring. It lacks active management and configuration capabilities.
10 Int'l Conf. Grid Computing and Applications | GCA'08 |

gLite is a grid computing middleware, developed as part of the Enabling Grids for E-sciencE (EGEE) project. gLite implements an “Information and Monitoring Subsystem”, called R-GMA (Relational GMA), which is a modification of OGF’s GMA. Therefore it also only serves monitoring purposes [7].
The Unified Grid Management and Data Architecture (UGanDA) is an enterprise level workflow and grid management system [8]. It contains a grid infrastructure manager called MAGI. MAGI has many features but is limited to the management of UGanDA deployments.
MRF is a Multi-layer resource Reconfiguration Framework for grid computing [9]. It has been implemented on a grid-enabled Distributed Shared Memory (DSM) system called Teamster-G [10].
MonALISA stands for “Monitoring Agents using a Large Integrated Services Architecture”. It “aims to provide a distributed service architecture which is used to collect and process monitoring information” [11]. Many Globus deployments use MonALISA to support management tasks. Again, the lack of capability to modify the running parameters of the managed resource is notable.
Finally, we should mention emerging Service – Based management initiatives, such as the Web Services Distributed Management (WSDM) [12] standard and the Web Services for Management (WS-Man) specification [13]. Due to their importance, they are discussed in greater detail in section 4 of this paper.
2.2 Motivation Table I compares WebDMF with the solutions that we
presented above. For this comparison we consider three factors:
TABLE I. COMPARING WEBDMF WITH OTHER GRID MANAGEMENT SOLUTIONS.
Name Monitoring Set Target Group OGF’s GMA Y Wide
gLite – R-GMA Y Focused
UGanDA – MAGI Y Y Focused
MRF – Teamster-G Y Y Focused
MonALISA Y Wide
WebDMF Y Y Wide
• The ability to perform monitoring. • Whether the approach can actively modify the grid’s
run-time parameters.
• Whether the approach is generic or focuses on infrastructures implemented using a specific technology. Our motivation to design WebDMF was to provide a
framework that would be generic enough to manage grid deployments regardless of the technology used to implement their infrastructure. At the same time, it should not be limited to monitoring but also provide “set” capabilities. Other advantages are:
• It is based on WBEM. This is a family of open standards.
• WBEM allows easy integration with web service – based management approaches.
• WBEM has been considered adequate for the management of applications, as opposed to other approaches (e.g. SNMP) that focus on the management of devices.
• It provides interoperability with existing WBEM-based management infrastructures.
3 Web-based Enterprise Management Web-Based Enterprise Management (WBEM) is a set
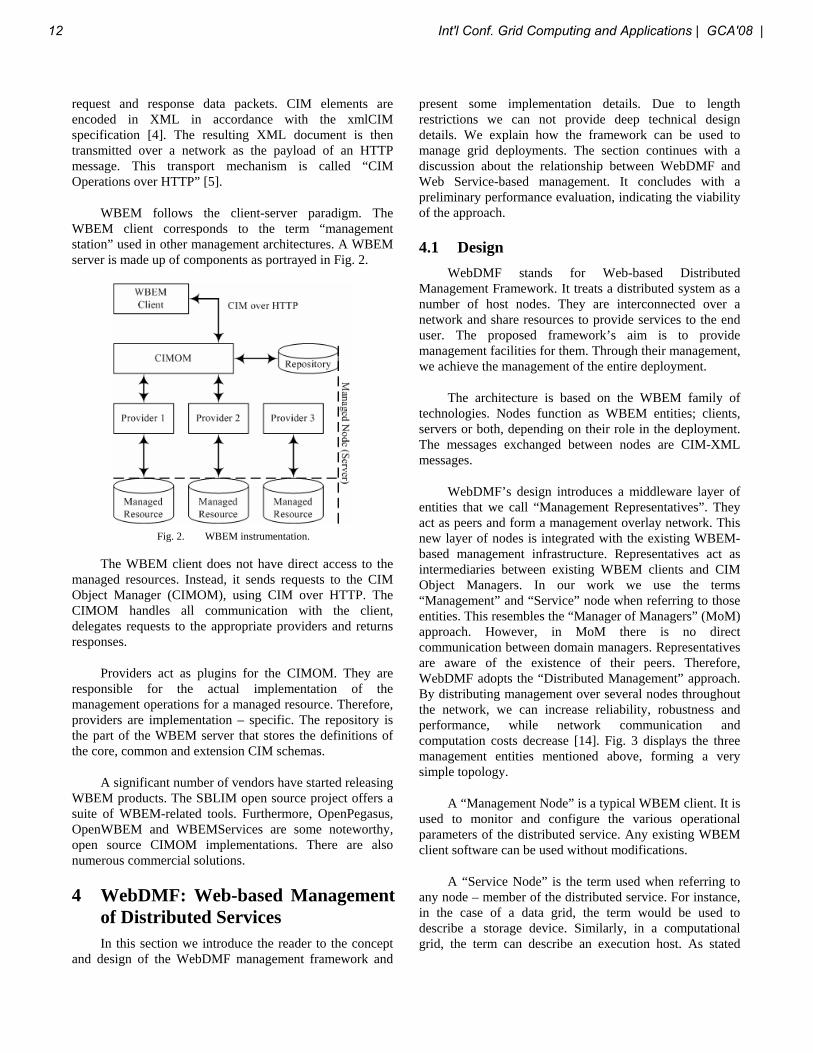
of specifications published by the Distributed Management Task Force (DMTF). A large number of companies are also involved in this ongoing management initiative. This section presents a brief introduction to the WBEM family of standards.
Fig. 1 displays the three core WBEM components. The “Common Information Model” (CIM) is a set of specifications for the modeling of management data [3]. It is an object-oriented, platform-independent model maintained by the DMTF. It includes a “core schema” with definitions that apply to all management areas. It also includes a set of “common models” that represent common management areas, such as networks, hardware, software and services. Finally, the CIM allows manufacturers to define technology-specific “extension schemas” that directly suit the management needs of their implementations.
CIM in XMLEncoding
CIM over HTTPTransport
Data ModelCommon Information Model
CIM-XML Fig. 1. The three core WBEM components.
For the interaction between WBEM entities (clients and managed elements), WBEM uses a set of well-defined
Int'l Conf. Grid Computing and Applications | GCA'08 | 11
request and response data packets. CIM elements are encoded in XML in accordance with the xmlCIM specification [4]. The resulting XML document is then transmitted over a network as the payload of an HTTP message. This transport mechanism is called “CIM Operations over HTTP” [5].
WBEM follows the client-server paradigm. The WBEM client corresponds to the term “management station” used in other management architectures. A WBEM server is made up of components as portrayed in Fig. 2.
Fig. 2. WBEM instrumentation.
The WBEM client does not have direct access to the managed resources. Instead, it sends requests to the CIM Object Manager (CIMOM), using CIM over HTTP. The CIMOM handles all communication with the client, delegates requests to the appropriate providers and returns responses.
Providers act as plugins for the CIMOM. They are responsible for the actual implementation of the management operations for a managed resource. Therefore, providers are implementation – specific. The repository is the part of the WBEM server that stores the definitions of the core, common and extension CIM schemas.
A significant number of vendors have started releasing WBEM products. The SBLIM open source project offers a suite of WBEM-related tools. Furthermore, OpenPegasus, OpenWBEM and WBEMServices are some noteworthy, open source CIMOM implementations. There are also numerous commercial solutions.
4 WebDMF: Web-based Management of Distributed Services In this section we introduce the reader to the concept
and design of the WebDMF management framework and
present some implementation details. Due to length restrictions we can not provide deep technical design details. We explain how the framework can be used to manage grid deployments. The section continues with a discussion about the relationship between WebDMF and Web Service-based management. It concludes with a preliminary performance evaluation, indicating the viability of the approach.
4.1 Design WebDMF stands for Web-based Distributed
Management Framework. It treats a distributed system as a number of host nodes. They are interconnected over a network and share resources to provide services to the end user. The proposed framework’s aim is to provide management facilities for them. Through their management, we achieve the management of the entire deployment.
The architecture is based on the WBEM family of technologies. Nodes function as WBEM entities; clients, servers or both, depending on their role in the deployment. The messages exchanged between nodes are CIM-XML messages.
WebDMF’s design introduces a middleware layer of entities that we call “Management Representatives”. They act as peers and form a management overlay network. This new layer of nodes is integrated with the existing WBEM-based management infrastructure. Representatives act as intermediaries between existing WBEM clients and CIM Object Managers. In our work we use the terms “Management” and “Service” node when referring to those entities. This resembles the “Manager of Managers” (MoM) approach. However, in MoM there is no direct communication between domain managers. Representatives are aware of the existence of their peers. Therefore, WebDMF adopts the “Distributed Management” approach. By distributing management over several nodes throughout the network, we can increase reliability, robustness and performance, while network communication and computation costs decrease [14]. Fig. 3 displays the three management entities mentioned above, forming a very simple topology.
A “Management Node” is a typical WBEM client. It is used to monitor and configure the various operational parameters of the distributed service. Any existing WBEM client software can be used without modifications.
A “Service Node” is the term used when referring to any node – member of the distributed service. For instance, in the case of a data grid, the term would be used to describe a storage device. Similarly, in a computational grid, the term can describe an execution host. As stated
12 Int'l Conf. Grid Computing and Applications | GCA'08 |

previously, the role of a node in a particular grid deployment does not affect the design of our framework.
Fig. 3. Management entities.
Typically, a Service Node executes an instance of the (distributed) managed service. As displayed in Fig. 4 (a), a WBEM request is received by the CIMOM on the Service Node. A provider specifically written for the service handles the execution of the management operation. The existence of such a provider is a requirement. In other words, the distributed service must be manageable through WBEM. Alternatively, a service may be manageable through SNMP, as shown in Fig. 4 (b). In such a case the node may still participate in WebDMF deployments but some functional restrictions will apply.
Fig. 4. Service node.
The framework’s introduces an entity called the “Management Representative”. This entity receives requests from a WBEM client and performs management actions on the relevant service nodes. After a series of message exchanges, it will respond to the initial request. A representative is more than a simple ‘proxy’ that receives and forwards requests. It performs a number of other operations including the following:
• Exchanges messages with other representatives regarding the state of the system as a whole.
• Keeps a record of Service Nodes that participate in the deployment.
• Redirects requests to other representatives. Fig. 5 displays the generic case of a distributed
deployment. Communication between representatives is also performed over WBEM.
Fig. 5. A generic deployment.
The initial requests do not state explicitly which service nodes are involved in the management task. The decision about the destination of the intermediate message exchange is part of the functionality implemented in the representative. The message exchange is transparent to the management node and the end user.
In order to achieve the above functionality, a representative is further split into building blocks, as shown in Fig. 6. It can act as a WBEM server as well as a client. Initial requests are received by the CIMOM on the representative. They are delegated to the WebDMF provider module for further processing. The module performs the following functions:
Fig. 6. WebDMF representative.
• Determines whether the request can be served locally.
Int'l Conf. Grid Computing and Applications | GCA'08 | 13

• If the node can not directly serve the request then it selects the appropriate representative and forwards it.
• If the request can be served locally, the representative creates a list of service nodes that should be contacted and issues intermediate requests.
• It processes intermediate responses and generates the final response.
• Finally, it maintains information about the distributed system’s topology. In some situations, a service node does not support
WBEM but is only manageable through SNMP. In this case, the representative attempts to perform the operation using SNMP methods. This is based on a set of WBEM to SNMP mapping rules. This has limitations since it is not possible to map all methods. However, even under limitations, the legacy service node can still participate in the deployment.
In a WebDMF deployment, a representative is responsible for the management of a group of service nodes. We use the term “Domain” when referring to such groups. Domains are organized in a hierarchical structure. The top level of the hierarchy (root node of the tree) corresponds to the entire deployment. The rationale behind designing the domain hierarchy of each individual deployment can be based on a variety of criteria. For example a system might be separated into domains based on the geographical location of nodes. WebDMF defines two categories of management operations: i) Horizontal (Category A) and ii) Vertical (Category B).
Horizontal Operations enable management of the WebDMF overlay network itself. Those functions can, for example, be used to perform topology changes. The message exchange that takes place does not involve Service Nodes. Therefore, the managed service is not affected in any way.
On the other hand, vertical operations read and modify the CIM schema on the Service Node, thus achieving management of the target application. Typical examples include:
• Setting new values on CIM objects of many service nodes.
• Reading operational parameters from service nodes and reporting an aggregate (e.g. sum or average). In line with the above, we have designed two CIM
Schemas for WebDMF, the core schema (“WebDMF_Core”) and the request factory. They both reside on the representatives’ repositories. The former schema models the deployment’s logical topology, as discussed earlier. It corresponds to horizontal functions.
The latter schema is represented by the class diagram in Fig 7 and corresponds to vertical functions. The users
can call WBEM methods on instances of this schema. In doing so, they can define the management operations that they wish to perform on the target application. Each request towards the distributed deployment is treated as a managed resource itself. For example, a user can create a new request. They can execute it periodically and read the results. They can modify it, re-execute it and finally delete it. Each request is mapped by the representative to intermediate WBEM requests issued to service nodes.
Fig. 7. Request Factory CIM Schema.
Request factory classes are generic. They are not related in any way with the CIM schema of the managed application. This makes WebDMF appropriate for the management of a wide variety of services. Furthermore, it does not need re-configuration when the target schema is modified.
4.2 Implementation The WebDMF representative is implemented as a
single shared object library file (.so). It is comprised of a set of WBEM providers. Each one of them implements the management operations for a class of the WebDMF schemas. The interface between the CIMOM and the providers complies with the Common Manageability Programming Interface (CMPI). Providers themselves are written using C++ coding. This does not break CIMOM independence, as described in [15]. The representative was developed on Linux 2.6.20 machines. We used gcc 4.1.2 and version 2.17.50 of binutils. It has been tested with version 2.7.0 of the Open Pegasus CIMOM.
4.3 Using WebDMF to Manage Grids In a grid environment, a service node can potentially
be an execution host, a scheduler, a meta-scheduler or a
14 Int'l Conf. Grid Computing and Applications | GCA'08 |
resource allocation host. The previous list is non-inclusive. The role of a node does not affect the design of our framework.
What we need is a CIM schema and the relevant providers that can implement WBEM management for the service node. Such schemas and providers do exist. For example, an architecture for flexible monitoring of various WSRF-based grid services is presented in [16]. This architecture uses a WBEM provider that communicates with WSRF hosts and gathers status data. In a WebDMF deployment, we could have many such providers across various domains. Each would reside on a service node and monitor the managed application.
4.4 WebDMF and Web Services The grid community has been working for more than
five years to transform grid computing systems into a group of web service-based building blocks. In line with this effort, management of the resulting infrastructures has also moved towards web service-based approaches. The recent OASIS Web Services Distributed Management (WSDM) [12] standard and the DMTF Web Services for Management (WS-Man) specification [13] have been considered enablers of this vision.
WebDMF adopts a resource – centric approach. This may seem to be a step in the opposite direction. It is not. The authors of this paper consider web service – based approaches to be a very necessary and extremely valuable effort. However, service – oriented management approaches are model – agnostic. They do not define the properties, operations, relationships, and events of managed resources [12]. Two important reasons why we choose WBEM for the resource layer are the following:
• WS-Management exposes CIM resources via web services, as defined in [17]. CIM is an inherent part of WBEM, as explained earlier in this paper.
• DMTF members are working on publishing a standard for the mapping between WS-Man operations and WBEM Generic Operations [18]. Furthermore, in order to implement a WS-Man
operation, a Web Service endpoint needs to delegate requests to instrumentation that can operate on the managed resource. In current, open source WS-Man implementations, management requests are eventually served by a WBEM Server and the appropriate providers. WS-Man and WBEM are related and complementary to each other.
The WebDMF representative has been implemented as a WBEM provider Therefore, if the CIMOM operating on the Representative node provides WS-Man client interfaces, the WebDMF provider will operate normally.
4.5 Performance Evaluation In this section we present a preliminary evaluation of
WebDMF’s performance. Results presented here are not simulation results. They have been obtained from actual code execution and are used as an indication of the solution’s viability.
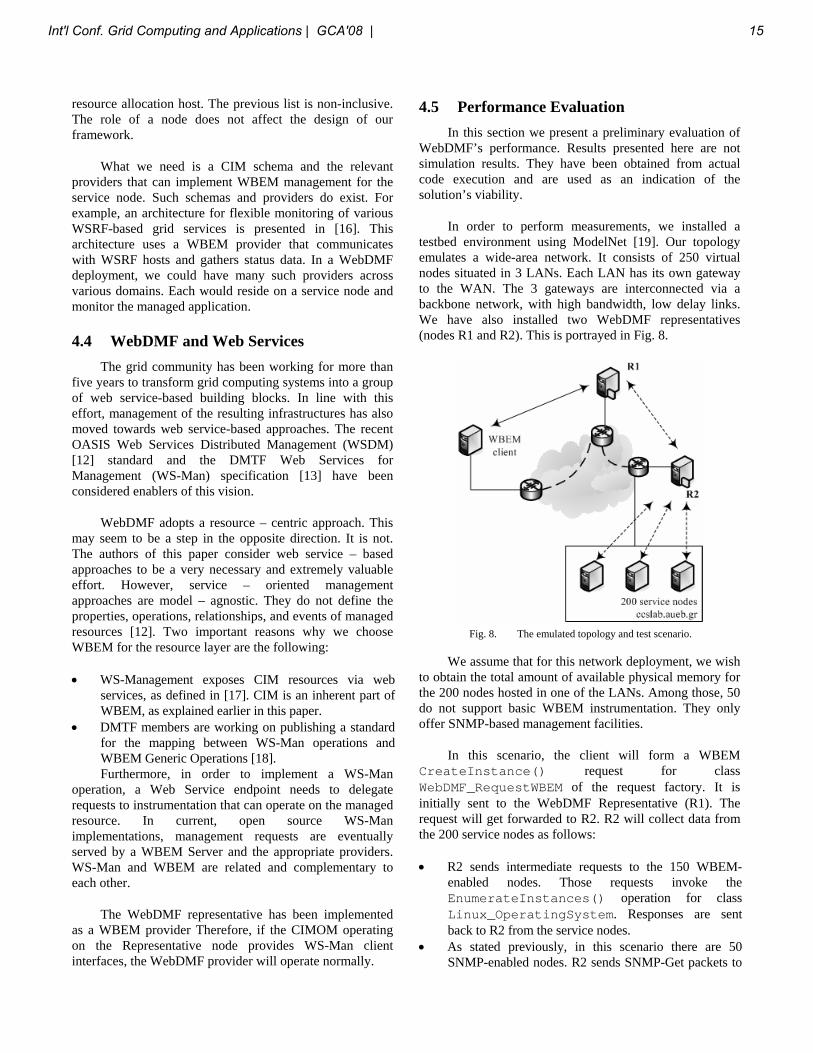
In order to perform measurements, we installed a testbed environment using ModelNet [19]. Our topology emulates a wide-area network. It consists of 250 virtual nodes situated in 3 LANs. Each LAN has its own gateway to the WAN. The 3 gateways are interconnected via a backbone network, with high bandwidth, low delay links. We have also installed two WebDMF representatives (nodes R1 and R2). This is portrayed in Fig. 8.
Fig. 8. The emulated topology and test scenario.
We assume that for this network deployment, we wish to obtain the total amount of available physical memory for the 200 nodes hosted in one of the LANs. Among those, 50 do not support basic WBEM instrumentation. They only offer SNMP-based management facilities.
In this scenario, the client will form a WBEM CreateInstance() request for class WebDMF_RequestWBEM of the request factory. It is initially sent to the WebDMF Representative (R1). The request will get forwarded to R2. R2 will collect data from the 200 service nodes as follows:
• R2 sends intermediate requests to the 150 WBEM-enabled nodes. Those requests invoke the EnumerateInstances() operation for class Linux_OperatingSystem. Responses are sent back to R2 from the service nodes.
• As stated previously, in this scenario there are 50 SNMP-enabled nodes. R2 sends SNMP-Get packets to
Int'l Conf. Grid Computing and Applications | GCA'08 | 15

those hosts, requesting the value of the hrMemorySize object. This object is part of the HOST-RESOURCES-MIB defined in RFC 1514 [20]. The transformation is based on the mapping rules mentioned in a previous section. After collecting the responses, R2 calculates the
aggregate (sum) of the reported values. This value becomes part of the response that is sent to R1. R1 sends the final response to the client.
We repeated the above experiment 200 times. Table II summarizes the results. Times are in seconds. Consider the fact that this scenario involves 204 request-response exchanges among various nodes. Furthermore, consider that the packets crossing the network are of a small size (a few bytes). The total execution time includes the following:
TABLE II. EVALUATION RESULTS.
Metrics Values Repetitions N 200
Arithmetic Mean 6.237139 Central Tendency
Median 6.193212
Variance 0.015187 Dispersion
Standard Deviation 0.123237
95% Confidence Interval for the Mean From 6.220059 To 6.254218
• Communication delays during request-response
exchanges. This includes TCP connection setup for all WBEM message exchanges. This does not apply to the SNMP case. SNMP uses UDP at the transport layer, therefore no connection is used.
• Processing overheads on R1 and R2. This is imposed by WebDMF’s functionality.
• Processing at the service nodes to calculate the requested value and generate a response. The absolute value of the average completion time
may seem rather high. However, in general terms, processing times are minimal compared to TCP connection setup and message exchange. With that in mind, we can see that each of the 204 request-responses completes in 30.57 milliseconds on average. This is normal. After 200 repetitions we observe low statistical dispersion (variance and standard deviation). This indicates that the measured values are not widely spread around the mean. We draw the same conclusion by estimating a 95% confidence interval for the mean. This indicates that the same experiment will complete in the same time under similar network traffic conditions.
5 Conclusions Ideally, a management framework should support grid
deployments without need for major modifications on the
existing infrastructure. It should not be limited by the technology used to implement the grid and be generic in order to support future changes. In this paper we introduce WebDMF, a Web-based Distributed Management Framework and present how it can be used to manage grids. We discuss its generality and demonstrate its viability through performance evaluation. Finally, the paper presents its advantages compared to alternative approaches and shows how it is complementary to emerging Web Service-based management approaches.
6 References [1] W. Stallings, SNMP, SNMPv2, SNMPv3, RMON 1 and 2. Addison
Wesley, 1999. [2] G. Oikonomou, and T. Apostolopoulos, “WebDMF: A Web-based
Management Framework for Distributed Services”, in Proc. The 2008 International Conference of Parallel and Distributed Computing (ICPDC 08) to be published.
[3] CIM Infrastructure Specification, DMTF Standard DSP0004, 2005. [4] Representation of CIM in XML, DMTF Standard DSP0201, 2007. [5] CIM Operations over HTTP, DMTF Standard DSP0200, 2007. [6] A Grid Monitoring Architecture, Open grid Forum GFD.7, 2002. [7] A. W. Cooke, et al, “The Relational Grid Monitoring Architecture:
Mediating Information about the Grid,” Journal of Grid Computing, vol. 2, no. 4, pp. 323-339, 2004.
[8] K. Gor, D. Ra, S. Ali, L. Alves, N. Arurkar, I. Gupta, A. Chakrabarti, A. Sharma, and S. Sengupta, "Scalable enterprise level workflow and infrastructure management in a grid computing environment," in Proc. Fifth IEEE International Symposium on Cluster Computing and the Grid (CCGrid'05), Cardiff, UK, 2005, pp. 661–667.
[9] P.-C. Chen, J.-B. Chang, T.-Y. Liang, C.-K. Shieh, and Y.-C. Zhuang, "A multi-layer resource reconfiguration framework for grid computing," in Proc. 4th international workshop on middleware for grid computing (MGC'06), Melbourne, Australia, 2006, p. 13.
[10] T.-Y. Liang, C.-Y. Wu, J.-B. Chang, and C.-K. Shieh, "Teamster-G: a grid-enabled software DSM system," in Proc. Fifth IEEE International Symposium on Cluster Computing and the Grid (CCGrid'05), Cardiff, UK, 2005, pp. 905–912.
[11] I.C. Legrand, H.B. Newman, R. Voicu, C. Cirstoiu, C. Grigoras, M. Toarta, and C. Dobre, “MonALISA: An Agent based, Dynamic Service System to Monitor, Control and Optimize Grid based Applications,” in Proc. Computing in High Energy and Nuclear Physics (CHEP), Interlaken, Switzerland, 2004.
[12] An Introduction to WSDM, OASIS committee draft, 2006. [13] Web Services for Management (WS Management), DMTF
Preliminary Standard DSP0226, 2006. [14] M. Kahani and P. H. W. Beadle, "Decentralised approaches for
network management," ACM SIGCOMM Computer Communication Review, vol. 27, iss. 3, pp. 36–47, 1997.
[15] Common Manageability Programming Interface, The Open Group, C061, 2006.
[16] L. Peng, M. Koh, J. Song, and S. See, "Performance Monitoring for Distributed Service Oriented Grid Architecture," in Proc. The 6th International Conference on Algorithms and Architectures (ICA3PP-2005), 2005.
[17] WS-CIM Mapping Specification, DMTF Preliminary Standard DSP0230, 2006.
[18] WS-Management CIM Binding Specification, DMTF Preliminary Standard DSP0227, 2006.
[19] A. Vahdat, K. Yocum, K. Walsh, P. Mahadevan, D. Kostic, J. Chase, and D. Becker "Scalability and Accuracy in a Large-Scale Network Emulator," in Proc. 5th Symposium on Operating Systems Design and Implementation (OSDI), December 2002.
[20] Host Resources MIB, IETF Request For Comments 1514, 1993.
16 Int'l Conf. Grid Computing and Applications | GCA'08 |

SEMM: Scalable and Efficient Multi-ResourceManagement in Grids
Haiying ShenDepartment of Computer Science and Computer Engineering
University of Arkansas, Fayetteville, AR 72701
Abstract - Grids connect resources to enable the world-wide collaboration. Conventional centralized or hier-archical approaches to grid resource management areinefficient in large-scale grids. Distributed Hash Table(DHT) middleware overlay has been applied to gridsas a mechanism for providing scalable multi-resourcemanagement. Direct DHT overlay adoption breaks thephysical locality relationship between nodes. This paperpresents a Scalable and Efficient Multi-resource Man-agement mechanism (SEMM). It collects resource infor-mation based on the physical locality relationship amongresource hosts as well as the resource attributes. Simu-lation results demonstrate the effectiveness of SEMM inlocality-awareness and overhead reduction in compari-son with another approach.
Keywords: Resource management, Resource discov-ery, Grid, Peer-to-Peer, Distributed Hash Table
1 Introduction
Grids enable the sharing, selection, and aggregationof a wide variety of resources to enable world-wide col-laboration. Therefore, scalable and efficient resourcemanagement is vital to the performance of grids.
As a successful model that achieves high scalability indistributed systems, Distributed Hash Table (DHT) mid-dleware overlay [1, 2, 3, 4, 5] facilitates the resourcemanagement in large-scale grid environment. However,direct DHT overlay adoption breaks the physical local-ity relationship of nodes in the underlying IP-level topol-ogy. Since resource sharing and communication amongphysically close nodes enhance resource management ef-ficiency, it is desirable that DHT middleware can pre-serve the locality relationship of grid nodes. Most currentDHT-based approaches for resource management are notsufficiently scalable and efficient. They let the resourcesbe shared in a system-wide scale. Thus, a node may need
to ask a node very far away for resources, resulting in in-efficiency. Since a grid may have a very large scale, ne-glecting resource host locality in resource managementprevents the system from achieving higher scalability.
Locality-aware resource management is critical to thescalability and efficiency of a grid system. To meet therequirements, we propose a scalable and efficient multi-resource management mechanism (SEMM), which isbuilt on a DHT structure. SEMM provides locality-awareresource management by mapping physically close re-source requesters and providers. Thus, resources canbe shared between physically close nodes, and the ef-ficiency of resource sharing will be significantly im-proved.
The rest of this paper is structured as follows. Sec-tion 2 presents a concise review of representative re-source management approaches for grids. Section 3 in-troduces SEMM, focusing on its architecture and algo-rithms. Section 4 shows the performance of SEMM incomparison with another approach in terms of a varietyof metrics. Section 5 concludes this paper.
2 Related Work
Over the past years, the immerse popularity of gridshas produced a significant stimulus to grid resourcemanagement approaches such as Condor-G [6], Globustoolkit [7], Condor [8], Entropia [9], AppLes [10],Javelin++ [11]. However, relying on centralized or hier-archical policies, these systems have limitation in a large-scale dynamic multi-domain environment with variationof resource availability.
To cope with these problems, more and more gridsresort to DHT middleware overlay for resource manage-ment. DHT overlays is an important class of the peer-to-peer overlay networks that map keys to the nodes ofa network based on a consistent hashing function [12].Some DHT-based approaches adopt one DHT overlayfor each resource, and process multi-resource queries in
Int'l Conf. Grid Computing and Applications | GCA'08 | 17

parallel in corresponding DHT overlays [13]. However,depending on multiple DHT overlays for multi-resourcemanagement leads to high structure maintenance over-head. Another group of approaches [14, 15, 16, 17] orga-nize all grid resources into one DHT overlay, and assignall information of a type of resource to one node. Such anapproach results in imbalance of load distribution amongnodes caused by information maintenance and resourcescheduling. It also leads to high cost for searching re-source information among a huge volume of informationin a node. Moreover, few of current approaches are ableto deal with the locality feature of grids.
Unlike most existing approaches, SEMM preservesthe physical locality relationship between nodes in net-works and achieves locality-aware resource manage-ment. This feature contributes to the high scalability andefficiency characters of SEMM in grid resource manage-ment.
3 Scalable and Efficient Multi-Resource Management
3.1 Overview
SEMM is developed based on Cycloid DHT over-lay [5]. We first briefly describe Cycloid DHT middle-ware overlay followed by a high-level view of SEMM ar-chitecture. Cycloid is a lookup efficient constant-degreeoverlay with n=d · 2d nodes, where d is dimension. Itachieves a time complexity of O(d) per lookup requestby using O(1) neighbors per node. Each Cycloid nodeis represented by a pair of indices (k, ad−1ad−2 . . . a0),where k is a cyclic index and ad−1ad−2......a0 is a cubi-cal index. The cyclic index is an integer, ranging from0 to d − 1, and the cubical index is a binary number be-tween 0 and 2d − 1. The nodes with the same cubicalindices are ordered by their k mod d on a small cycle,which we call cluster. The node with the largest cyclicindex in a cluster is called the primary node of the nodesat the cluster. All clusters are ordered by their cubicalindices mod 2d on a large cycle. For a given key or anode, its cyclic index is set to the hash value of the keyor IP address modulated by d and the cubical index is setto the hash value divided by d. A key will be assignedto a node whose ID is closest to its ID. Briefly, the cubi-cal index represents the cluster that a node or an objectlocates, and the cyclic index represents its position in acluster. The overlay network provides two main func-tions: Insert(key,object) and Lookup(key)to store an object to a node responsible for the key and toretrieve the object. For more information about Cycloid,please refer to [5].
3.2 Locality-aware Middleware Construc-tion
Before we present the details of SEMM, let’s intro-duce a landmarking method to represent node close-ness on the network by indices. Landmark clusteringhas been widely adopted to generate proximity informa-tion [18, 19, 20, 21]. We assume m landmark nodes thatare randomly scattered in the Internet. Each node mea-sures its physical distances to the m landmarks, and usesthe vector of distances < d1, d2, ..., dm > as its coordi-nate in Cartesian space. Two physically close nodes willhave similar vectors. We use space-filling curves [22],such as Hilbert curve [19], to map m-dimensional land-mark vectors to real numbers, such that the closeness re-lationship among the nodes is preserved. We call thisnumber Hilbert number of the node, denoted by H. Hindicates the physical closeness of nodes on the Internet.
SEMM builds a locality-aware Cycloid architectureon a grid. Specifically, it uses grid node i’s Hilbert num-ber, Hi, as its cubical index, and the consistent hashvalue of node i’s IP address, Hi, as its cyclic index togenerate the node’s ID, denoted by (Hi,Hi). Recall thatin a Cycloid ID, the cubical indices differentiate clus-ters and the cyclic indices differentiate node positionsin a cluster. Therefore, the physically close nodes withthe same H will be in a cluster, and those with similarH will be in nearby clusters in Cycloid. As a result, alocality-aware Cycloid is constructed, in which the log-ical proximity abstraction derived from overlay matchesthe physical proximity information in reality.
3.3 Resource Reporting and Query
We define resource information, represented by Ir, asthe information of available resources and resource re-quests. It includes the information of resource host, re-source ID represented by IDr, and etc.
In DHT overlay networks, the objects with the samekey will be stored in a same node. Based on this princi-ple and node ID determination policy, SEMM lets nodei compute the consistent hash value of its resource r, de-noted by Hr, and use (Hr, Hi) to represent IDr. Thenode uses the DHT overlay function Insert(IDr, Ir)to store resource information to a node in its cluster. Asa result, the information of the same type of resources inphysically close nodes will be stored in a same reposi-tory node, and different nodes in one cluster are respon-sible for different types of resources within the cluster.Furthermore, resources of Ir stored in nearby clusters tonode i are located physically close to node i. A reposi-tory node periodically conducts resource scheduling be-tween resource providers and requesters.
18 Int'l Conf. Grid Computing and Applications | GCA'08 |

0102030405060708090
100
0 5 10 15 20Physical Distance by Hops
Per
cent
age
of re
sour
ce a
mou
nt
assi
gned
(%)
MercurySEMM
0
5000
10000
15000
20000
25000
30000
1 2 3 4 5Resources in each request
Logi
cal c
omm
unic
atio
n co
st fo
r re
ques
ts
SEMMMercury
(a) CDF of allocated resource (b) Logical communication cost
Figure 1. Communication cost of different resource management approaches.
When node i queries for different resources, it sendsout a request Lookup(Hr,Hi) for each resource r.Each request will be forwarded to its repository node innode i’s cluster, which will reply to node i if it has theresource information for the requested resource.
4 Performance Evaluation
We designed and implemented a simulator in Java forevaluation of SEMM. We compared the performance ofSEMM with Mercury [13]. Mercury uses multiple DHToverlays and lets each DHT overlay responsible for oneresource. We used Chord for attribute hub in Mercury.We assumed that there are 11 types of resources, andused Bounded Pareto distribution function to generatethe resource amount owned and requested by a node.This distribution reflects the real world where there areavailable resources that vary by different orders of mag-nitude. In the experiment, we generated 1000 requests,and ranged the number of resources in a resource requestfrom 1 to 5 with step size of 1. We used a transit-stubtopology generated by GT-ITM [23] with approximately5,000 nodes. “ts5k-large” has 5 transit domains, 3 tran-sit nodes per transit domain, 5 stub domains attached toeach transit node, and 60 nodes in each stub domain onaverage. “ts5k-large” is used to represent a situation inwhich a grid consists of nodes from several big stub do-mains.
4.1 Efficiency of Resource Management
In this experiment, we tested the Cumulative distri-bution function (CDF) of the percentage of allocated re-sources. It reflects the effectiveness of a resource man-agement mechanism to map physically close resource re-questers and providers. We randomly generated 5000
resource requests, and recorded the distance betweenthe resource provider and resource requester of each re-source request. Figure 1(a) shows the CDF of the per-centage of allocated resources versus the distances in dif-ferent resource management approaches in “ts5k-large”.We can see that SEMM is able to locate 97% of total re-source requested within 11 hops, while Mercury locatesonly about 15% within 10 hops. Almost all allocatedresources are located within 15 hops from requesters inSEMM, while 19 hops in Mercury. The results showthat SEMM can allocate most resources within short dis-tances from requesters but Mercury allocates most re-source in long distances from the resource requesters.The more resources are located in shorter distances, thehigher locality-aware performance of a resource man-agement mechanism. Using physically close resourcesto itself, a node can achieve higher efficiency in dis-tributed operations such as distributed computing anddata sharing. In addition, communicating with physi-cally close nodes for resources saves cost in node com-munication. The results indicate that the performanceof SEMM mechanism is better than Mercury in termsof locality-aware resource management. Locality-awareresource management helps to achieve higher efficiencyand scalability of a grid system.
A resource node needs to communicate repositorynodes for requested resources. Its request is forwardedby a number of hops based on DHT overlay routing algo-rithm. Thus, communication cost constitutes a main partin the resource management cost. In this test, we evalu-ated the communication cost of resource requesting. Wedefine logical communication cost as the product of mes-sage size and logical path length in hops of the messagetravelled. It represents resource management efficiencyin terms of the numbers of messages and nodes for mes-sage forwarding in resource queries. It is assumed thatthe size of a message is 1 unit. Figure 1(b) plots the log-
Int'l Conf. Grid Computing and Applications | GCA'08 | 19

0
20
40
60
80
100
120
140
100 1100 2100 3100 4100Number of nodes
Ave
rage
mai
ntai
ned
outli
nks
per
node
MercurySEMM
Figure 2. Overhead of different resource management approaches.
ical communication cost versus the types of resources ina request for resource requesting. In the experiment, re-source searching stops once requested resources are dis-covered. We can observe that SEMM incurs less costthan Mercury. The lookup path length is O(log n) inChord, which is longer than lookup path length O(d) inCycloid. A request with m resources needs m lookups,which amplifies the difference of communication costbetween Mercury and SEMM. Hence, relying on the Cy-cloid DHT as the underlying structure for resource man-agement, SEMM greatly reduces the node communica-tion cost in resource management in a grid system.
4.2 Overhead of Resource Management
Since the resource management mechanisms dependon DHT overlays as middlewares for resource manage-ment in grids, the maintenance overhead of the DHToverlays constitute a main part in the overhead in re-source management. In a DHT overlay, a node needsto maintain its neighbors in its routing table. The neigh-bors play an important role in guaranteeing successfulmessage routing. We define the number of outlink of anode is the number of the node’s neighbors in its rout-ing table, i.e., the average routing table size maintainedby the node. In this experiment, we tested the numberof outlinks per node. It represents the overhead to main-tain the DHT resource management middleware archi-tecture. Figure 2(a) plots the average outlinks maintainedby a node in different resource management approaches.The results show that each node in Mercury maintainsdramatically more outlinks than in others. Recall thatMercury has multiple DHTs with each DHT overlay re-sponsible for one resource. Therefore, a node has a rout-ing table for each DHT overlay, and has outlinks equalto the product of routing table size and the number ofDHT overlays. The results show that SEMM leads toless maintenance overhead than Mercury, which impliesthat SEMM has high scalability with less DHT overlay
maintenance cost in a large-scale grid.
5 Conclusions
Rapid development of grids requires a scalable andefficient resource management approach for its high per-formance. This paper presents a Scalable and Effi-cient Multi-resource Management mechanism (SEMM),which is built on a DHT overlay. SEMM maps physicallyresource requesters and providers to achieve locality-aware resource management, in which resource allo-cation and node communication are conducted amongphysically close nodes, leading to higher scalability andefficiency. Simulation results show the superiority ofSEMM in comparison with another resource manage-ment approach in terms of locality-aware resource man-agement, node communication cost, and maintenancecost of the underlying DHT structure.
Acknowledgements
This research was supported in part by the Acxiom Cor-poration.
References
[1] I. Stoica, R. Morris, D. Liben-Nowell, D. R.Karger, M. F. Kaashoek, F. Dabek, and H. Balakr-ishnan. Chord: A scalable peer-to-peer lookup pro-tocol for Internet applications. IEEE/ACM Trans-actions on Networking, 1(1):17–32, 2003.
[2] S. Ratnasamy, P. Francis, M. Handley, R. Karp, andS. Shenker. A scalable content-addressable net-work. In Proc. of ACM SIGCOMM, pages 329–350,2001.
20 Int'l Conf. Grid Computing and Applications | GCA'08 |

[3] A. Rowstron and P. Druschel. Pastry: Scalable,decentralized object location and routing for large-scale peer-to-peer systems. In Proc. of IFIP/ACMInternational Conference on Distributed SystemsPlatforms (Middleware), pages 329–350, 2001.
[4] B. Y. Zhao, L. Huang, J. Stribling, S. C. Rhea, A. D.Joseph, and J. Kubiatowicz. Tapestry: An Infras-tructure for Fault-tolerant wide-area location androuting. IEEE Journal on Selected Areas in Com-munications, 12(1):41–53, 2004.
[5] H. Shen, C. Xu, and G. Chen. Cycloid: A scalableconstant-degree P2P overlay network. PerformanceEvaluation, 63(3):195–216, 2006. An early versionappeared in Proc. of International Parallel and Dis-tributed Processing Symposium (IPDPS), 2004.
[6] J. Frey, T. Tannenbaum, I. Foster, M. Livny, andS. Tuecke. Condor-g: a computation managementagent for multiinstitutional grids. In Proc. 10thIEEE Symposium on High Performance DistributedComputing, 2001.
[7] I. Foster and C. Kesselman. Globus: a metacomput-ing infrastructure toolkit. Int. J. High PerformanceComputing Applications, 2:115–128, 1997.
[8] M. Mutka and M. Livny. Scheduling remote pro-cessing capacity in a workstation-processing bankcomputing system. In Proc. of the 7th Interna-tional Conference of Distributed Computing Sys-tems, September 1987.
[9] A. Chien, B. Calder, S. Elbert, and K. Bhatia. En-tropia: architecture and performance of an enter-prise desktop grid system. Journal of Parallel andDistributed Computing, 63(5), May 2003.
[10] F. Berman, R. Wolski, H. Casanova, W. Cirne,H. Dail, M. Faerman, S. Figueira, J. Hayes,G. Obertelli, J. Schopf, G. Shao, S. Smallen,N. Spring, A. Su, and et al. Adaptive computing onthe grid using apples. IEEE Transactions on Paral-lel and Distributed Systems, 14(4), Apr. 2003.
[11] M. O. Neary, S. P. Brydon, P. Kmiec, S. Rollins,and P. Capello. Javelin++: Scalability issues inglobal computing. Future Generation ComputingSystems Journal, 15(5-6):659–674, 1999.
[12] D. Karger, E. Lehman, T. Leighton, M. Levine,D. Lewin, and Panigrahy R. Consistent hashing andrandom trees: Distributed caching protocols for re-lieving hot spots on the World Wide Web. In Proc.of the 29th Annual ACM Symposium on Theory ofComputing (STOC), pages 654–663, 1997.
[13] A. R. Bharambe, M. Agrawal, and S. Seshan.Mercury: Supporting scalable multi-attribute rangequeries. In Proc. of ACM SIGCOMM, pages 353–366, 2004.
[14] J. Chen M. Cai, M. Frank and P. Szekely. Maan: Amulti-attribute addressable network for grid infor-mation services. Journal of Grid Computing, 2004.An early version appeared in Proc. of GRID’03.
[15] A. Andrzejak and Z. Xu. Scalable, efficient rangequeries for grid information services. In Proc. the2nd Int. Conf. on Peer-to-Peer Computing (P2P),pages 33–40, 2002.
[16] M. Cai and K. Hwang. Distributed aggregationalgorithms with load-balancing for scalable gridresource monitoring. In Proc. of IEEE Interna-tional Parallel and Distributed Processing Sympo-sium (IPDPS), 2007.
[17] S. Suri, C. Toth, and Y. Zhou. Uncoordinated loadbalancing and congestion games in P2P systems. InProc. of the Third International Workshop on Peer-to-Peer Systems, 2004.
[18] S. Ratnasamy, M. Handley, R. Karp, andS. Shenker. Topologically-aware overlay construc-tion and server selection. In Proc. of IEEE Confer-ence on Computer Communications (INFOCOM),2002.
[19] Z. Xu, M. Mahalingam, and M. Karlsson. Turningheterogeneity into an advantage in overlay routing.In Proc. of IEEE Conference on Computer Commu-nications (INFOCOM), 2003.
[20] H. Shen and C.-Z. Xu. Hash-based Proximity Clus-tering for Efficient Load Balancing in Heteroge-neous DHT Networks. Journal of Parallel and Dis-tributed Computing (JPDC), 2008.
[21] H. Shen and C. Xu. Locality-aware and churn-resilient load balancing algorithms in structuredpeer-to-peer networks. IEEE Transactions on Par-allel and Distributed Systems, 2007. An early ver-sion appeared in Proc. of ICPP’05.
[22] T. Asano, D. Ranjan, T. Roos, E. Welzl, and P. Wid-maier. Space filling curves and their use in geomet-ric data structure. Theoretical Computer Science,181(1):3–15, 1997.
[23] E. Zegura, K. Calvert, and S. Bhattacharjee. Howto model an internetwork. In Proc. of IEEE Confer-ence on Computer Communications (INFOCOM),1996.
Int'l Conf. Grid Computing and Applications | GCA'08 | 21

A QoS Guided Workflow Scheduling Algorithm for the Grid
Fangpeng Dong and Selim G. Akl
School of Computing, Queen’s University
Kingston, ON Canada K7L3N6 {dong, akl}@cs.queensu.ca
Abstract - Resource performance in the Computational Grid is not only heterogeneous, but also changing dynamically. However, scheduling algorithms designed for traditional parallel and distributed systems, such as clusters, only consider the heterogeneity of the resources. In this paper, a workflow scheduling algorithm is proposed. This algorithm uses given QoS guidance to allocate tasks to distributed computer resources whose performance is subject to dynamic change and can be described by predefined probability distribution functions. This new algorithm works in an offline way that allows it to be easily set up and run with less cost. Simulations have been done to test its performance with different workflow and resource settings. The new algorithm can also be easily expanded to accommodate Service Level Agreement (SLA) based workflows.
Keywords: Workflow scheduling algorithm, Grid, Quality of Services, stochastic
1 Introduction
The development of Grid infrastructures now enables workflow submission and execution on remote computational resources. To exploit the non-trivial power of Grid resources, effective task scheduling approaches are necessary. In this paper, we consider the scheduling problem of workflows that can be represented by directed acyclic graphs (DAG) in the Grid. The objective function of the scheduling is to minimizing the total completion time of all tasks (also known as makespan) in a workflow.
As the performance of Grid resources fluctuates dynamically, it is difficult to apply scheduling algorithms that were designed for traditional systems and treat the performance as a known static parameter. Therefore, some countermeasures are introduced to capture relevant information about resource performance fluctuation (e.g., performance prediction 0), or try to provide some guaranteed performance to users (e.g., resource reservation, [2]). These approaches make it possible for Grid schedulers to get relatively accurate resource information. In this paper, we assume that resource performance can be described by some
probability mass functions (PMF) which can be derived from task execution records in the past (e.g., log files) [8]. Since the performance information is not deterministic, the proposed algorithm takes an input parameter as a resource selection criterion (QoS). This algorithm is a list heuristic and consists of two phases: the task ranking phase and the task-to-resource mapping phase. In the ranking phase, tasks will be ordered according to their priorities. The rank of a task is determined by the task’s computational demand, the mathematical expectation of resource performance, and the communication cost for data transfer. In the mapping phase, the scheduler will pick up unscheduled tasks in the order their priorities and assign them to resources according to performance objective and the QoS guide.
The rest of this paper is organized as follows: in Section 2, related work is introduced; Section 3 presents the application and resources models used by the proposed algorithm; Section 4 describes the algorithm in detail; Section 5 presents simulation results and analysis; finally, conclusions are given in Section 6.
2 Related Work
The DAG-based task graph scheduling problem in parallel and distributed computing systems is an interesting research area, and algorithms for this problem keep evolving with computational platforms, from the age of homogeneous systems, to heterogeneous systems and today’s computational Grids [6]. Due to its NP-complete nature [7], most of algorithms are heuristic based, such as the widely cited HEFT algorithm [3]. In [9], the authors proposed a list DAG scheduling algorithm, which is based on deterministic resource performance prediction. In [12], a robust resource allocation algorithm is proposed, which uses the same resource performance model as this paper does. However, it only considers the scheduling of independent tasks. In [11], a SLA based workflow scheduling algorithm is proposed. However, that algorithm does not use resource performance modeling explicitly and works in an online manner, which means it has to monitor the execution of tasks in a workflow continuously.
22 Int'l Conf. Grid Computing and Applications | GCA'08 |

3 Models and Definitions The targeted system of this paper consists a group of computational nodes r1, …, rn distributed in a Grid. Two nodes ri and rj can communicate with each other via a network connection wi,j. It is assumed that the available performance of both computational nodes and network connections is stochastic and follows some probability mass functions (PMF). Fig. 1 presents an example of a PMF. The PMF can be obtained by investigating historical application running records using statistical measures. In this paper, it is assumed such functions are already known by the scheduler. The PMF of the performance Pi of a computational node ri is denoted as PPi (x), and the PMF of the performance of a network connection wi,j between ri and rj is denoted as PBi,j(x). It is assumed that for all 1≤ i, j≤ n, random variables Pi and Bi,j are independent.
Fig. 1: Performance probability mass function of a
computational resource in the Grid.
In this paper, a workflow is assumed to be represented by a DAG G. An example DAG is presented in Fig. 2. A circular node ti in G represents a task, where 1≤i≤v, and v is number of tasks in the workflow. The number qi (1≤i≤v) shown below ti represents the computational power consumed to finish ti. For example, in Fig. 2, q1 = 5. An edge e(i, j) from ti to tj means that tj needs an intermediate result from ti, so that tj∈succ(ti), where succ(ti) is the set of all immediate successor tasks of ti. Similarly, we have tj∈pred(ti), where pred(ti) is the set of immediate predecessors of ti. The weight of e(i, j) gives the size of intermediate results (or communication volume, for simplicity) transferred from ti to task tj. For example, the communication volume from t1 to t2 is one in Fig. 2.
Following the above performance and workflow models, the completion time Ci,k of task ti on resource rk and the communication cost Di,j,k,l for data transferring between task ti on resource rk and tasks tj or resource rl are also two random variables that can be denoted as Eq. (1) and Eq. (2) respectively
k
iki P
qC =, (1)
lklkji B
jieD,
,,,),(
= (2)
According to (1) and (2), Ci,k and Di,j,k,l are independent variables as Pk and Bk, l are independent, and the PMF of Ci,k and Di,j,k,l, PCi,k(x) and PDi,j,k,l(x), can be easily obtained from PPi (x) and PBi, j
(x). t15
t75
t85
t68
t510
t45
t310
t28
1
1 1
1
32
1
1
4 3
Fig. 2: A DAG depicting a workflow, in which a node
represents a task and a labelled directed edge represents a precedence order with a certain volume of intermediate result
transportation. 4 The QoS Guided Scheduling Algorithm
The primary objective of the proposed algorithm is to map tasks to proper computational resources such that the makespan of the whole workflow can be as short as possible. As an instance of list heuristics, the proposed algorithm has two phases: the task ranking phase and task-to-resource mapping phase.
In the task ranking phase, the priority of a task ti in a given DAG is computed iteratively from the exiting node of the DAG upwards to the entrance node as Eq. (3) shows.
(3) ))(_),((max_)( ,)( jjitsucctii trankdavgjiecavgtrankij
+×+=∈
))((_ ,ki
ki CEAvgcavg =
))((_ ,,,
,, lkji
lkji DEAvgdavg =
In Eq. (3), avg_ci is the average value of the mathematical expectation of Ci, k (denoted as E(Ci, k)) on each computational resource rk. Similarly, avg_di, j is the average value of the mathematic expectation of Di,j,k,l for every network connection pair rk and rl to which ti and tj could be mapped respectively. According to Eq. (3), the priority value of a task is actually an estimate of time consumption, which is from the start time of ti to the completion time of the whole workflow, based on the average expected performance of computational resources and network connections. Once the priorities of tasks are known, the scheduler will put the tasks in a queue in a non-ascending order (ties are broken randomly).
In the mapping phase, the scheduler will fetch
00.10.20.30.40.50.60.70.80.91
10 15 20 25
Probability
Available Performance
Int'l Conf. Grid Computing and Applications | GCA'08 | 23
unscheduled tasks from the head of the priority queue formed in the ranking phase and map it to a selected resource. Since the priorities are computed upwards, it is guaranteed that a task will always have a higher priority than all of its successors. Therefore, it will be mapped before any of its successors. This ordering eliminates the case that a successor task occupies a resource while its predecessor is waiting for that resource so that deadlocks can be avoided. For tasks that are not related with each other, this approach lets those farther from the exiting task get resource allocation earlier, which will in turn give them a bigger chance of starting earlier and produce a shorter makespan.
If the resource performance is deterministic, a popular and easy way to schedule a task in a heterogeneous environment is choosing the resource that can complete that task the earliest, as the HEFT and PFAS [9] algorithms do. However, in the resource model here, the performance is not deterministic. If only the best performance of a resource is considered, the schedule may suffer a long makespan in the real world due to the small probability of this performance being achieved. To overcome this difficulty, the mathematical expectation of the random performance can be used, just like what we have done in the ranking phase. However, in a non-deterministic system, only providing an estimated mean value might not be sufficient, because the real situation might be quite different. From the users’ point of view, more concerns may be put onto the possibility of achieving a certain performance other than a given static mean value. Therefore, in this paper, a flexible and adaptive way is used which allows the user to provide a QoS requirement to guide the resource selection phase. To simplify the presentation, a binary mapping function M (ti, rk) is defined in Eq. (4):
⎩⎨⎧
= otherwise 0
tomapped is if 1),( ki
ki
rtrtM (4)
In a workflow, the earliest start time EST(ti, rk) of a task ti on a resource rk depends on the data ready time DRT(ti, rk) and the resource ready time RRT(ti, rk):
)),(),,(max(),( kikiki rtRRTrtDRTrtEST = (5) The data ready time DRT(ti, rk) is determined by the time
when ti receives its last input data from its predecessors. It can be expressed by Eq. (6):
)),((max),()( kjtpredtki rtRTrtDRT
ij∈= (6)
1),(|)(),( ,,, =+= ljklijjkj rtMDtCTrtRT (7) RT(tj, rk) is the intermediate data ready time from predecessor tj, which is a predecessor of ti. CT(tj) is the completion time of tj and Dj,i,l,k is the intermediate result transfer time from rl to rk. Here rl is the resource that tj is mapped to.
As all tasks mapped to the same resources will be executed sequentially, the resource ready time RRT(ti, rk) is determined by the completion time of the last task in the job queue of rk. Let t′q be the last task in rk’s job queue currently, then RRT(ti, rk) can be noted as
)'(),( qki tCTrtRRT = (8) Finally, the estimated completion time ECT( ti, rk) of ti on rk is given by
kikiki CrtESTrtECT ,),(),( += (9) To meet a QoS requirement, we need to know the PMF
of ECT(ti, rk), which depends on the PMF of CT(tj), RT(tj) and DRT(ti, rk). Since all predecessors of ti have been scheduled by the time ti is being scheduled, the PMF of CT(tj) is already known (see Eq. (17)), so is the PMF of RRT(ti, rk). According to probability theory, the PMF of the sum of two independent discrete random variables is the discrete convolution of their PMF. Therefore, according to Eq. (7), the PMF of RT(tj, rk) can be expressed as:
)()()( ,,,,
0ixPiPxP klijjkj D
x
iCTRT −=∑
=
(10)
Again, by probability theory, the probability distribution function (also known as the cumulative distribution function (CDF)) of the maximum value of a set of independent variables is the product of the probability distribution functions of these variables. Let FESTi,k, FDRTi,k and FRRTi,k be the CDF of EST(ti, rk) , DRT(ti, rk), RRT(ti, rk) respectively. The following equation can be obtained according to Eq. (5):
)()()( ,,, xFxFxF kikiki RRTDRTEST = (11) Similarly, the FDRTi,k can be obtained from Eq. (12).
)(,...,|)()...()( ''1),(),( ''
1, imptRTptRTDRT tpredttxFxFxF
kmkki ∈=
(12)
For discrete random variable X, its CDF F(x) can be obtained from its PMF P(x) by Eq. (13).
∑≤
=≤=xx
ii
xPxXxF )()Pr()( (13)
On the other hand, if F(x) is known, the PMF P(x) can also be obtained as
)()()( 1−−= iii xFxFxP (14) By Eq. (13) the CDF of RT(tj, rk) can be acquired using the results from Eq. (10), so can the CDF of RRT(ti, rk). The PMF of DRT(ti, rk) can be obtained from Eq. (10), Eq. (12) and Eq. (14). Following the same procedure the PMF of EST(ti, rk) can be obtained, which is denoted as PESTi,k(x). According to Eq. (9), the PMF of ECT(ti, rk) can then be expressed as:
)()()( ,,,
0ixPiPxP kikiki C
x
iESTECT −=∑
=
(15)
Let FECTi,k be the CDF of ECT(ti, rk). FECTi,k can be obtained from the PMF given in Eq. (15).
Now, given a QoS requirement Q as a percentage number, the scheduler will first find a value T in the CDF of ECT whose cumulative probability is greater than Q (Fig. 3). Let ect(ti, rk)l be the lth possible value of ECT and pl be its probability, then the mathematical expectation of values to the left of T (including T itself), which is denoted as R(ti, rk) can be denoted as Eq. (16). By this means, it will cover at least the lower Q percent part of the ECT value distribution.
24 Int'l Conf. Grid Computing and Applications | GCA'08 |

∑≤
=Trtect
lkilkilki
rtectprtR),(
),(),( (16)
Fig. 3: An example of CDF (A) and PMF (B) of EST. Given the QoS requirement Q, the ceiling point is the left end of the
first CDF interval above Q. Only ECT instances and their probabilities left to the ceiling point (shading bars in (B)) are
considered when the scheduler selects a resource for the current task.
Fig. 4: Pseudo code of the QoS guided workflow scheduling
algorithm. The scheduler then chooses the lowest value of all R(ti, rk), say R(ti, rk′), and maps task ti to rk′. At this point, the PMF of CT(ti) can be known as:
)()( ', xPxP kii ECTCT = (17) When the exiting node tv of the whole graph is scheduled, the algorithm will stop. From the PMF PCTv(x), we can tell the probability of different makespans of the workflow. The pseudo code of the above procedures is given in Fig. 4.
5 Experiments In the simulation, the basic resource topology is generated
by a toolkit called GridG1.0 [4], which can generate heterogeneous computational resources and network connections. Based on the basic resource setup, two groups of experiments are run. One assumes the resource performance follows a uniform distribution and the other assumes it follows a discrete normal distribution. The workflow graphs used by the simulation are generated by a program called Task Graph For Free (TGFF) [5]. TGFF has the ability of generating a variety of task graphs according to different configuration parameters, e.g., the number of task nodes of each graph. Two groups of graphs are used in the simulation. One group is randomly generated, and the other is generated to simulate some real workflow applications in the Grid, such as BLAST [10], which has balanced parallel task chains in its DAGs.
The performance of algorithms tested is measured by the scheduled length ratio (SLR), which is a normalized value of the makespan:
LengthPath Critical Minimum EstimatedMakespan RealSLR =
In each experiments, five groups of task graphs are used, which have 40, 80, 160, 320 and 640 tasks nodes, respectively. On each of the task groups, the HEFT algorithm and the QoS guided algorithms are tested. For the HEFT algorithm, the mathematical expectation of the resource performance is applied. For the QoS algorithm, two QoS values are applied: 80% and 50%, which are respectively denoted as QoS 1 and QoS 2 in Fig. 5~Fig. 8.
The results of experiments on randomly generated graphs are presented in Fig. 5 and Fig. 6. In Fig. 5, the resource performance follows a uniform distribution. It can be observed that all algorithms perform worse as the number of tasks in a workflow increases. Due to the nature of these heuristic algorithms, the longer the critical path in a graph is, the more cumulative errors they will make when computing the priorities of tasks, and the higher probability that they will chose sub-optimal mappings.
In Fig. 5, QoS 1 achieves the best performance among the three stategies. The HEFT algorithm yields QoS 1 with a small margin and is closely followed by QoS 2 which uses 50% as the selection criterion. In Fig. 6, the HEFT and QoS 1 almost get the same results while the performance of QoS 2 is significantly degraded. Filtering the 20% worst performance cases out in a uniform distribution, the expected performance can be improved noticeably, and the resources selected by these means will have a good chance (with a possiblity of 80%) to get a better performance than the mean value which is used by the HEFT. This explains why QoS 1 can perform better than HEFT does in Fig. 5. On the other hand, as the QoS 2 set the selection criterion as 50%, it may cut too much of the random domain and therefore suffer a higher possibility of inaccurate estimate in the reality. The
Input: G, Q, PMF of ri and Wi, j, 1≤i≤n. Output: a schedule of G to r1, …, rn. 1. Compute rank of each task in G, using Eq. (3), and order the
tasks into a queue J in non-ascending order of their ranks. 2. while (J is not empty) do 3. Pop the first task t from J; 4. for every resource r 5. Compute PMF of RRT(t, r) ; //Eq. (8) 6. for every t′∈pred(t) 7. Compute PMF of RT(t′, r);//Eq. (10) 8. end for 9. Compute PMF of DRT(t, r);//Use results of Line 7,
Eq. (12) and (14). 10. Compute PMF of ECT(t, r); // Eq. (15) 11. Compute R(t, r), using Q and PMF of ECT(t, r); //Eq. (16) 12. end for 13. Find the resource r′ that R(t, r′) = min(R(ti, rk)) and insert t to
the job queue of r'; 14. end of while
Int'l Conf. Grid Computing and Applications | GCA'08 | 25

shortcoming of a too optimistic criterion (low QoS value) is even more obvious in Fig. 6, where the resource performance follows a normal distribution. In this kind of distribution, the mean value of a PMF happens to be the one that has the highest probability. Therefore, the HEFT algorithm can perform well in this situation.
Fig. 5: Simulation result of uniform performance distribution
and random generated graphs.
Fig. 6: Simulation result of discrete normal distribution of
performance and random generated graphs.
Fig. 7: Simulation result of uniform performance distribution and multi-parallel-way graphs.
Fig. 7 and Fig. 8 show the results of task graphs having
multiple balanced parallel task chains. The three scheduling approaches present similar behaviors as they do in the previous experiments. The performance of the HEFT algorithm is still the best in the normal distribution. QoS 1 performs close to HEFT and QoS 2 suffers from its too optimistic resource selection criterion. It is worth to note that,
in all cases, the SLR is shorter compared with the results in Fig. 5 and Fig. 6. This is due to the balanced structure of the task graphs, which makes the length of all paths from the starting task to the exiting task roughly identical so that the possibility of sub-optimum task ranking decreases.
Fig. 8: Simulation result of discrete normal distribution of performance and multi-parallel-way graphs.
6 Conclusions
In this paper, a QoS guided workflow scheduling algorithm is proposed and tested by simulation. The algorithm can be applied in the Grid computing scenarios, in which resource performance is not deterministic but changes, according to certain random probability mass functions. The contribution of this work is twofold. Firstly, the procedures to obtain the PMF of the makespan of a workflow are presented in detail. As the probabilities of different completion times are known, more sophisticated algorithms can be easily developed (although, this is not covered is this paper). For example, if the deadline to finish a workflow is given by the user, the scheduler will be able to tell the probabilities of meeting the deadline in different schedules and then react accordingly. This is very important, as SLA is becoming a popular way for resource allocation in the Grid. Secondly, the proposed algorithm uses a QoS guidance to find the task-to-resource mapping, and the effects of different QoS settings in different resource performance distributions are tested. Our future work includes developing new algorithms that consider SLA scenarios and testing the QoS guided method with more probability distribution functions.
References:
[1] L. Yang, J. M. Schopf and I. Foster. “Conservative
Scheduling: Using Predicted Variance to Improve Scheduling Decisions in Dynamic Environments”. Proc. of the 2003 Supercomputing, pp:31-46, November 2003.
[2] G. Mateescu. “Quality of Service on the Grid via Metascheduling with Resource Co-Scheduling and Co-Reservation”. International Journal of High Performance Computing Applications, Vol. 17, No. 3, pages: 209-218, 2003.
01020304050607080
40 80 160 320 640
SLR
Number of task nodes
HEFT QoS 1 QoS 2
01020304050607080
40 80 160 320 640
SLR
Number of task nodes
HEFT QoS 1 QoS 2
01020304050
40 80 160 320 640
SLR
Number of task nodes
HEFT QoS 1 QoS 2
01020304050
40 80 160 320 640
SLR
Number of task nodes
HEFT QoS 1 QoS 2
26 Int'l Conf. Grid Computing and Applications | GCA'08 |

[3] H. Topcuoglu, S. Hariri and M.Y. Wu. “Performance- Effective and Low-Complexity Task Scheduling for Heterogeneous Computing”. IEEE Trans. on Parallel and Distributed Systems, Vol. 13, No. 3, pages: 260 - 274, 2002.
[4] D. Lu and P. Dinda. “Synthesizing Realistic Computational Grids”. Proc. of ACM/IEEE Super-computing 2003, Phoenix, AZ, USA, 2003.
[5] R.P. Dick, D.L. Rhodes and W. Wolf. “TGFF Task Graphs for Free”. Proc. of the 6th. International Workshop on Hardware/Software Co-design, 1998.
[6] F. Dong and S. G. Akl. “Grid Application Scheduling Algorithms: State of the Art and Open Problems”. Technical Report No. 2006-504, School of Computing, Queen's University, Canada, Jan 2006.
[7] H. El-Rewini, T. Lewis, and H. Ali. Task Scheduling in Parallel and Distributed Systems, ISBN: 0130992356, PTR Prentice Hall, 1994.
[8] H. Li, D. Groep, L. Wolters. “Mining Performance Data for Metascheduling Decision Support in the Grid”. Future Generation Computer Systems 23. pp 92-99, Elsevier, 2007.
[9] F. Dong, S. Akl. “PFAS: A resource-performance-fluctuation-aware workflow scheduling algorithm for grid computing”. Proc. of the Sixteenth International Heterogeneity in Computing Workshop, International Conference on Parallel and Distributed Systems (IPDPS), Long Beach California, US, March 2007.
[10] D. Sulakhe, A. Rodriguez, et al. “Gnare: an Environment for Grid-Based High-throughput Genome Analysis”. Proc. of CCGrid’05, pp. 455- 462, Cardiff, UK, May 2005.
[11] D.M. Quan and J. Altmann. “Mapping of SLA-based workflows with light communication onto Grid resources”. Proc. of the 4th International Conference on Grid Service Engineering and Management, Leipzig, Germany, Sept. 2007.
[12] V. Shestak, J. Smith, et al. “A stochastic approach to measuring the robustness of resource allocations in distributed systems”. Proc. of International Conference on Parallel Processing, pp. 459–470, Columbus, Ohio, US, Aug. 2006.
Int'l Conf. Grid Computing and Applications | GCA'08 | 27

A Grid Resource Broker with Dynamic Loading Prediction Scheduling Algorithm in Grid Computing
Environment
Yi-Lun Pan 1, Chang-Hsing Wu1, and Weicheng Huang 1 1National Center for High-Performance Computing, Hsinchu, Taiwan
Abstract - In a Grid Computing environment, there are various important issues, including information security, resource management, routing, fault tolerance, and so on. Among these issues, the job scheduling is a major problem since it is a fundamental and crucial step in achieving the high performance. Scheduling in a Grid environment can be regarded as an extension to the scheduling problem on local parallel systems. The NCHC research team developed a resource broker with proposed scheduling algorithm. The scheduling algorithm used the adaptive resource allocation and dynamic loading prediction functions to improve the performance of dynamic scheduling. The resource broker is based on the framework of GridWay which is a meta-scheduler for Grid, so the proposed resource broker can be implemented in real Grid Computing environment. Furthermore, this algorithm also has been considered several properties of the Grid Computing environment, including heterogeneous, dynamic adaptation and the dependent relationship of jobs.
Keywords: Job Scheduling, Resource Broker, Meta-scheduler, Grid Computing.
1 Introduction In the beginning of the 1990’s, there was a brilliant success in Internet technology because of the birth of a new computing environment - Grid, which is composed by huge heterogeneous platforms, geographic distributed resources, and dynamic networked resources [1]. The infrastructure of Grid Computing is the intention to offer a seamless and unified access to geographically distributed resources connected via internet. Thus, the facilities can be utilized more efficiently to help application scientists and engineers in performing their works, such as the so called “grand challenge problems”. These distributed resources involved in the Grid environment are loosely coupled to form a virtual machine and each of these resources is managed by their own local authority independently, instead of centrally controlled. The ultimate target is to provide a mechanism such that once the users specify their requirement of resource. The virtual computing sites will allocate the most appropriate physical computing sites to carry out the execution of the application.
Therefore, the research team developed a Grid Resource Broker (GRB) based on the framework of the GridWay [2] which is a meta-scheduler for Grid. The GridWay then drives the Globus Toolkit [3] to enable the actual Grid Computing. A scheduling algorithm and its implementation, the Scheduling Module, are developed. According to each different required job criteria, the proposed scheduling algorithm used the dynamic loading prediction and adaptive resource allocation functions to meet users’ requirements. The major task of the proposed Grid Resource Broker is to dynamically identify and characterize the available resources, correctly monitor the queue status of local scheduler. Finally, the presented scheduling algorithm helps to select and allocate the most appropriate resources for each given job. The aim of the presented scheduling algorithm is to minimize the total time to delivery for the individual users’ requirements and criteria.
According to the above scenario, those issues encourage the motivation of our development. Specifically, the design and implementation of the proposed resource broker includes the dynamic loading prediction and adaptive resource selection functions. Moreover, the scheduling algorithm has been considered not only the general features of resource broker but also the "dynamic" feature, i.e. the proposed resource broker which monitors the status of each local queue and provides resources as users’ criteria dynamically. Therefore, the proposed resource broker can select resource efficiently and automatically. Further, the effective job scheduling algorithm also can improve the performance and integrate the resources to supply remote user efficiency in the heterogeneous and dynamic Grid Computing environment [4].
2 State of the Art 2.1 Grid computing
The Grid is an infrastructure of computing providing users the ability to dynamically combine the distributed resources as an ensemble to support the execution of applications that need a large scale of resources. As Ian Foster redefined Grid Computing, “Grid Computing is concerned with coordinated resource sharing and problem
28 Int'l Conf. Grid Computing and Applications | GCA'08 |

solving in dynamic, multi-institutional virtual organizations” [5]. The key concept of grid computing is its ability to deal with resource sharing and resource management [6]. This technology can bring powerful computing ability by integrating computing resources from all over the world. The Grid software is not a single, monolithic package, but rather a collection of interoperating software packages. The characteristics of the Grid computing environment are: 1) the environment is heterogeneous. The applications submitted from all kinds of users and web sites can share the resources from the entire Grid computing environment; 2) these resources are dynamic and complex in this environment. This phenomenon makes scheduling a major issue in the environment.
This paper focuses on the scheduling of dependent jobs, which means the jobs may have a reciprocal effect, or correlation, in the order between each other. Because of the scheduling, it can help Grid Computing to increase and integrate the utilization of local and remote computing resources. Therefore, scheduling can improve the performance in the dynamic grid computing environment.
2.2 Existing Resource Broker and Scheduling Algorithm
A general architecture of scheduling for resource broker which is defined as the process of making scheduling decisions involving resources over multiple administrative domains [7]. There are three important features of a grid resource broker which are resource discovery, resource selection, and job execution from the previous research. As we know, a lot of researches of resource broker are on going to provide access resources for different applications, such as Condor – G, EDG Resource Broker, AppLes, and so on [8], [9]. The above resource brokers also can provide the capability of monitoring computing resources information and resource selection. Nevertheless, those researches do not deal with monitoring the dynamic queuing information, either to make precise and effective scheduling policy. On the scheduling algorithm scenario, the dynamic job scheduling is crucial and fundamental issue in Grid Computing environment. The purpose of job scheduling is to find the dynamic and optimal method of resources allocation. Mostly, there researchers are applying the traditional job scheduling strategies to allocate computing resources statically, such as list heuristic and the listing scheduling (LS) [10]. The above algorithms focus on the allocation of machines statically. However, the presented research focuses on dynamic job scheduling for each job from users’ requirements and criteria.
Definition 1: The list heuristic scheduling algorithms have three variants - First-Come-First-Serve (FCFS) - the scheduler starts the jobs in the order of their arrival time; Random - the next job to be scheduled is randomly selected
among all jobs. No jobs are preferred; Backfilling [11] - the scheduling strategy is out-of-order of FCFS scheduling that tries to prevent the unnecessary idle time. Actually, there are two kinds of backfill. One is EASY-backfilling, and the other is conservative-backfilling.
Furthermore, most of the researches are discussed under the assumption that jobs are executed independently and statically [12], [13], [14]. In fact, these assumptions are not appropriate in Grid Computing environment, since these jobs are always dependent and dynamic. In this research, the proposed algorithm is designed for scheduling the dependent jobs dynamically. As the following section, the Performance Evaluation, it will use the dependent jobs which are the Computational Fluid Dynamics (CFD) Message Passing Interface (MPI) programs to test.
3 Proposed Scheduling Algorithm of Grid Resource Broker (GRB)
3.1 Research Object The heterogeneous and dynamic properties are considered when designing the job scheduling algorithm. Therefore, the presented proposed algorithm can make job scheduling to achieve minimum makespan (defined at Definition 2), which is to minimize the total time to delivery for the individual users’ requirements and criteria. That is the main contribution of this work to present a Grid Resource Broker (GRB) with the designed job scheduling algorithm. The GRB can provide the faultless mechanism such that once the users specify users’ requirement of resources. Finally, these virtual computing sites will allocate the most appropriate physical computing sites to carry out the execution of the application.
Definition 2: The completion time is defined as the time from the job being assigned to one machine until the time the job is finished. The complete time is also called makespan time.
3.2 Model and Architecture To simplify Grid Computing, each distributed computing resource can be connected by high speed network. There is one important component of middleware - resource broker which plays essential role in such an environment. The responsibilities of resource brokers are to search where the computing resources locate, store the information, and satisfy the users’ requirements of computing resources. Therefore, the dynamic loading prediction job scheduling algorithm should utilize available computational resources fairly and efficiently in Grid.
This proposed algorithm is designed for resource brokers of whole Grid Computing. The purpose of proposed algorithm is to help improve the performance of job
Int'l Conf. Grid Computing and Applications | GCA'08 | 29

scheduling. As a matter of fact, the proposed scheduling algorithm can preserve the good scheduling sequence of optimal or near-optimal solution, which are generated the best host candidate or better host candidates. And then, the presented Scheduling Module can get rid of the unfit scheduling sequence in the searching process for the scheduling problems. The implementation resource broker architecture is designed as shown in the following FIG. 1 in NCHC.
FIG. 1 System Architecture
The Grid users can submit jobs with using Grid Resource Broker through Grid Portal as the FIG.1 is shown. There are five related functional components and two databases in the System Architecture. The first, Grid Portal serves as an interface to the users. Therefore, the Grid jobs are submitted via the Grid Portal which in turn passes the jobs to the Resource Broker to drive the backend resources. The resource as well as job status are displayed back to the portal for users via either Resource Monitor module or Job Monitor module. Second, Resource Monitor (RM) queries the status of resources from the Information DB and displays the results onto the Grid Portal. Thus, the users’ knowledge about the status of resources is kept up to date. Third, Job Monitor is similar to the Resource Monitor. The Job Monitor component accesses the job information from the JobsDB which maintains the updated information about Grid jobs. The fourth, Grid Resource Broker (GRB) is the core of the system architecture. It takes the requirements from Grid jobs, and then compares with resource information which provided by the Information System. Therefore, the GRB can select the most appropriated resources automatically to meet the requirements from jobs. It will further dispatch jobs to local schedulers for processing. The detailed information about the mechanism of GRB is explained in the later part. The last component, Information System is used to collect the dynamic information of local computing resources periodically and
update the status of the resources in the InformationDB which in turn is queried by the RM to serve the users. The Information System also responses to the query from the GRB and provides the resources status. The dynamical information of local resources, which takes the XML format, is queried from Ganglia, Network Weather Service (NWS), MDS2, MDS4, and so on.
The first database is JobsDB. The JobsDB will be updated by the Job Monitor module with pre-defined time interval. Such information is used by the Job Monitor component to response to the query from the GRB. Finally, the last database is InformationDB which stores all data provided by the Information System.
In order to handle the related processes of job submitting, the GRB adopts the presented Scheduling Module to find the appropriate scheduling sequence, and then dispatches jobs to the local schedulers. Specially, the most important part is the core of resource broker which is the proposed new Scheduling Module which illustrated as the FIG. 2 is shown. The major characteristic of Scheduling Module is the presented scheduling policy, Dynamic Loading Prediction Scheduling (DLPS) algorithm, which provides dynamic loading prediction and adaptive resource allocation functions. The scheduling policy will be described later section.
Grid File Transfer ServicesGrid File Transfer Services Grid Execution ServicesGrid Execution Services Grid Information ServicesGrid Information Services
INPUT
Resource BrokerCore
INPUT
Resource BrokerCore
Resource BrokeCore
OUTPUT
Resource BrokeCore
OUTPUT
FIG. 2 Grid Resource Broker Architecture
3.3 Grid Resource Broker Architecture We will explain the whole Architecture of GRB, and each function of each component, at this section. As the FIG.2 is shown, upon receiving a job request from users, the Request Manager will manage the job submission with
30 Int'l Conf. Grid Computing and Applications | GCA'08 |

proper job attributes. On the other hand, the user maintains the control over the jobs submitted through the Request Manager. Following Request Manager, the Dispatch Manager invokes the Scheduling Module to acquire the resource list. The resource list is based on the criteria posted by the job as well as the resource status. With the suggestion from the Scheduling Module, the job is then dispatched. The Dispatch Manager also provides the ability to reschedule jobs and reporting pending status back to the Request Manager.
In the Scheduling Module, there are three main functions, namely the Job Priority Policy, the Resource Selection, and the Dynamic Resource Selection. The Job Priority Policy is responsible for initialize the selection process with existing policy such as presented scheduling policy - DLPS, FCFS, Round-Robin, Backfill, Small Job First, Big Job First, and so on. The Resource Selection provides resource recommendation based static information such as hardware specification, specific software, and the High-Performance Linpack Benchmark results. The Dynamic Resource Selection issues suggestions based on dynamic information such as the users’ application requirement, network status as well as work load of individual machines. With the combined efforts of the three components, the Scheduling Module provides the features of the automatic scheduling and re-scheduling mechanism. The automatic scheduling chooses the most appropriate resource candidate followed by the second best choice and so on, while the re-scheduling provides the service to compensate the miss-selection of resource by the users. Once the Scheduling Module provides the best selection of resource, the process is passed to the Execution Manager, the Transfer Manager, and the Information Manager that drive Middleware Access Driver (MAD) layer to submit, control and monitor the resource fabric layer of the Grid Computing environment.
3.4 Scheduling Policy - Dynamic Loading Prediction Scheduling Algorithm (DLPS)
The proposed job scheduling algorithm of Scheduling Policy is called Dynamic Loading Prediction Scheduling (DLPS) in the GRB. The objective function of DLPS is achieving the minimized makespan. Thus, we designed the following equation to describe it, as in (1) : )](s)(dMin[=M kk minmax* − (1)
Definition 3: The *M means the minimized makespan. In order to predict precisely, the equation uses
kd andkS . The
kd is the maximum job ending time of the kth job, which means the end time of job completed. And the kS is the minimum job submitting time of the kth job, which means the time stamp when users submit the kth job.
There are some inputs, such as Resource Specification Language (RSL), job template, and the form of Grid Portal from users’ requirements. Therefore, the operations of DLPS are to select, schedule, reschedule, and submit jobs to the most appropriate resources.
The logical flow chart of the DLPS is illustrated as the FIG. 3. First, the DLPS retrieves the resource information from Information System, and then filters out unsuitable resources with the adaptive resource allocation function. After the adaptive resource allocation function, DLPS compares free nodes with requirement nodes. If current free nodes are enough for fulfilling, DLPS will give higher weight (defined at Definition 4). Otherwise, the following step enters the dynamic loading prediction function with EstBacklog and minimum Job Expansion Factor (defined at Definition 5 and Definition 6) methods to predict which computing resources responses and executes job quickly, and then calculates weight. The DLPS finally ranks all available resources and selects the most appropriate resources to dispatch job.
capabilityn
nk M
fR=weight ×
FIG. 3 The Logical Flow Chart of DLPS
The each step of DLPS algorithm is descried as the following. The each step of algorithm thusly - Step 1: Process users’ criteria and job requirements from RSL, job template, or Portal form specification, including the High-Performance Linpack Benchmark, data set, execution programs, and queue type, etc. Step 2: Make communicate with each GRIS of resource for getting the static and dynamic resource information. Step 3: (1) Store the features and status of each cluster into InformationDB through Information System; (2) Filter out unsuitable resource with the adaptive resource allocation function. Step 4: Compare these free nodes with required nodes. If current free nodes
Int'l Conf. Grid Computing and Applications | GCA'08 | 31
are enough for fulfilling, DLPS calls weighted function to calculate aweight and bweight (defined at Definition 4).
Definition 4: When free nodes fulfill required nodes, the
designed weighted function is capabilityn
nk M
fR
=weight × .
Where the nR means required nodes, nf means free nodes
and the capabilityM means the capability of each computing resources.
Step 5: If current free nodes are not enough for fulfilling, DLPS calls dynamic loading prediction function with two methods to calculate cWeight (defined at Definition 7), including EstBacklog and minimum Job Expansion Factor methods.
Definition 5: The EstBacklog means estimated backlog of queued work in hours. The general EstBacklog form is shown as the following equation (2):
=*iEBL ×
× )(ompletedTotalJobsC
yCPUAccuracQueuePS
)Pr
3600Pr(ocHoursDedicated
orcHoursAvailablePocHoursTotal ××
(2) *iEBL , it means the ith EstBacklog time. QueuePS is the
idle time of queued jobs, CPUAccuracy is the actual run time of job, the TotalJobsCompleted is the number of jobs completed, the ToatlPorcHours is the total number of proc-hours required to complete running jobs. The AvailableProcHours is the total proc-hours available to the scheduler, and the last variable, DedicatedProcHours, is the total proc-hours made available to jobs.
The some of above values are from the system historical statistic values of queuing system loading and the others are from real-time queuing situation. The output is divided into two categories, Running and Completed. The Running statistics include information about jobs that are currently running. The Completed statistics are compiled using historical information from both running and completed jobs. Ergo, the *
iEBL can forecast the backlog of each computing site with above information.
Definition 6: The job expansion factor subcomponent has an effect similar to the queue time factor but favors shorter jobs based on their requested wallclock run time. In its canonical form, the job expansion factor metric is calculated by the information from local queuing system which described as the equation (3) :
imitWallClockL
RunTimeQueuedTimeJEFi+
= (3)
Definition 7: After getting EstBacklog and job expansion factor, the cWeight metric is calculated by following equation (4) :
∑∑==
×−+×= n
ii
in
ii
ic
EBL
EBL
JEF
JEFWeight
1
*
*
1
)1( λλ (4)
Where the λ is the system modulated parameter which can be obtained from numerous trials. The EstBacklog more can be respected the dynamic situation of queuing system generally. Therefore, it always uses the higher λ value.
Consequently, the Step 6: Calculated the minimum time of total deliver or response time.
4 Performance Evaluation 4.1 Experimental Environment In order to test the efficiency of the presented GRB with the developed scheduling algorithm, we execute the Computational Fluid Dynamics (CFD) Message Passing Interface (MPI) programs on a heterogeneous research testbed. We adopt the NCHC testbed, including Nacona, Opteron, and Formosa Extension two (Formosa Ext. 2) clusters. Those main environment characteristics are summarized in table 1.
And we also measure the High-Performance Linpack Benchmark of these clusters. The Rmax means the largest performance in Gflop/s for each problem run on a machine, and the Rpeak means the theoretical peak performance Gflop/s for the machine. Hence, users can choose the higher Rmax value or set the criteria of computing power when users submit jobs, according to the information, in table 2.
Table 1 Summary Environment Characteristics of NCHC Grid Resources
Resource CPU Model Memory (GB)
CPU Speed (MHz)
#CPUs Nodes Job Manager
Nacona
Intel(R) Xeon(TM) CPU 3.20GHz
4 3200 16 8 Torque
Opteron
AMD Opteron(tm) Processor 248
4 2200 16 8 Moab
Formosa Ext. 2
Intel(R) Xeon(TM) CPU 3.06GHz
4 3060 22 11 Maui
Table 2 High-Performance Linpack Benchmark of NCHC Grid Resources
32 Int'l Conf. Grid Computing and Applications | GCA'08 |

High-Performance Linpack Benchmark
Nacona Cluster
Opteron Cluster
Formosa Ext.2 Cluster
Rmax(Gflops) 46.791424 34.08 75.447 Rpeak(Gflops) 102 70 134.64 Number of CPUs 16 16 22 The Efficiency of CPU (Gflops/CPU)
2.924 2.13 3.429
4.2 Experimental Scenario The preliminaries of experiment are needed to set up, including the start time of jobs, the convergence of MPI matrix, and the number of required computing CPUs. The above preliminaries are generated by normal distribution. Therefore, we generate several execution MPI programs with 2, 4, and 8 CPUs randomly. The evaluation also has been performed on three clusters with three experiment models, including 4096*4096 matrix which required 2 CPUs to compute, 4096*4096 matrix which required 4 CPUs to compute, and finally the last model is the 8192*8192 matrix which required 8 CPUs to compute.
The following carry on experiment is to compare the performance of DLPS job scheduling algorithm with several algorithms, such as Round-Robin, Short-Job-First (SJF), Big-Job-First (BJF), and First-Come-First-Serve (FCFS). We submitted testing jobs which were generated randomly with the synthetic models as the FIG. 4 is shown. The vertical axle is the value of min makespan (seconds) and the horizontal axle is the number of jobs. The makespan of presented GRB with DLPS job scheduling algorithm is notably less than other algorithms; especially the huge job numbers are submitted. Therefore, the objective function of DLPS approaches the minimized makespan. The dynamic loading prediction characteristic of presented GRB is proved be better under this experiment.
0
100
200
300
400
500
600
700
800
900
1 4 7 10 13 16 19 22 25 28 31 34 37 40 43
# of Jobs
Sec
DLPS
Round-Robin
SJF
BJF
FCFS
FIG. 4 Compare Makespan of DLPS with Other Algorithms
Finally, the last experiment is discussing about the efficiency of all algorithms (defined at Definition 8) in FIG. 5, FIG. 6, FIG. 7, and FIG. 8.
Definition 8: The efficiency of all algorithms is measured by the following equation, as in (5) :
%100lg
lg ×−
orithmA
DLPSorithmA
MakespanMakespanMakespan
(5)
The equation (5) means each algorithm is compared with DLPS. If the efficiency is positive, it means DLPS more efficient. Otherwise, the DLPS is non-efficient.
When the small numbers of jobs are submitted, the efficiency of DLPS may be worse than other algorithms, especially for SJF and FCFS. This situation is reasonable very well, because small jobs are easy consumed by SJF and FCFS. When the number of jobs is increasing, the developed DLPS is absolutely better than SJF and FCFS, because the notable drawback of SJF and FCFS is happened, which the large numbers of jobs are starvation as the FIG. 5 and FIG. 8. Comprehensively discussed the above efficiency figures, the best efficiency of DLPS is occurred extreme full usage of each cluster.
-40
-20
0
20
40
60
1 6 11 16 21 26 31 36 41
# of Jobs
DLPS and SJF
Eff
icie
ncy
(%
)
FIG. 5 Compare the Efficiency of DLPS with SJF
-10
0
10
20
30
40
50
60
1 6 11 16 21 26 31 36 41
# ofJob
DLPS and Round-Robin
Eff
icie
ncy (%
)
FIG. 6 Compare the Efficiency of DLPS with Round-
Robin
0
20
40
60
80
100
1 6 11 16 21 26 31 36 41
#of Jobs
DLPS and BJF
Effic
ienc
y (%
)
FIG. 7 Compare the Efficiency of DLPS with BJF
Int'l Conf. Grid Computing and Applications | GCA'08 | 33

-20
-10
0
10
20
30
40
50
60
1 6 11 16 21 26 31 36 41
# of Jobs
DLPS and FCFS
Eff
icie
ncy
(%
)
FIG. 8 Compare the Efficiency of DLPS with FCFS
5 Conclusions Conclusion and Future Work
The Grid Resource Broker takes a step further in the direction of establishing virtual computing sites for the Computing Grid service. The presented GRB can satisfy the users’ requirements, including the hardware specification, specific software, and the High-Performance Linpack Benchmark results. And then, the presented GRB can automatically select the most appropriate physical computing resource. With the features of automatic scheduling and dynamic loading prediction provided by the Scheduling Module, the Grid users are no longer required to select the execution resource for the computing job. Instead, the Grid Resource Broker will provide an automatic selection mechanism which integrates both static information and dynamic information of resources, to meet the demand from the Grid jobs.
According to the pervious experiments, the dynamic loading prediction job scheduling has better efficiency and performance than other algorithms; especially the huge job numbers are submitted into the Grid Computing sites. Ultimately, we can obtain an important property that the algorithm is appropriated to deal with large amount of jobs in grid computing environment.
6 References [1] R. AI-Khannak, and B. Bitzer, "Load Balancing for Distributed and Integrated Power Systems using Grid Computing," International Conference on Clean Electrical Power (ICCEP), 22-26 May, 2007, pp. 123-127.
[2] http://www.gridway.org/
[3] http://www.globus.org/
[4] V. Hamscher, U. Schwiegelshohn, A. Streit, and R. Yahyapour, "Evaluation of Job-Scheduling Strategies for Grid Computing," Proceedings of 1st IEEE/ACM International Workshop on Grid Computing (Grid 2000) at 7th International Conference on High Performance Computing (HiPC-2000), Bangalore, India, LNCS 1971, 2002, pp. 191-202.
[5] I. Foster and C. Kesselman, The Grid 2: Blueprint for a New Computing Infrastructure, Morgan Kaufmann, San Francisco, CA, 2004 .
[6] Yi-Lun Pan, Yuehching Lee, Fan Wu, "Job Scheduling of Savant for Grid Computing on RFID EPC Network," IEEE International Conference on Services Computing (SCC), July 2005, 75-84.
[7] J. M. Alonso, V. Hernandez, and G. Molto, "Towards On-Demand Ubiquitous Metascheduling on Computational Grids," the 15th Euromicro Conference on Parallel, Distributed and Network-based Processing (PDP), February 2007, pp 5.
[8] J. Schopf, "A General Architecture for Scheduling on the Grid, "Journal of Parallel and Distributed Computing, special issue, April 2002, p. 17.
[9] A. Othman, P. Dew, K. Djemame and I. Gourlay, "Toward an Interactive Grid Adaptive Resource Broker," Proceedings of the UK e-Science All Hands Meeting, Nottingham, UK, September 2003, pp. 4.
[10] M. Grajcar, "Strengths and Weakness of Genetic List Scheduling for Heterogeneous Systems," Application of Concurrency to System Design, 2001. Proceedings. 2001 International Conference, 25-29 June 2001, pp. 123-132.
[11] Barry G. Lawson, and E. Smirni, "Multiple-queue Backfilling Scheduling with Priorities and Reservations for Parallel Systems," ACM SIGMETRICS Performance Evaluation Review, vol. 29, Issue 4, March 2002, pp. 40-47.
[12] N. Fujimoto, and K. Hagihara, "A Comparison among Grid Scheduling Algorithms for Independent Coarse-Grained Tasks," Symposium on Applications and the Internet-Workshops, Tokyo, Japan, 26 – 30, January, 2004, p. 674.
[13] N. Fujimoto, and K. Hagihara, "Near-optimal Dynamic Task Scheduling of Independent Coarse-grained Tasks onto a Computational Grid," In 32nd Annual International Conference on Parallel Processing (ICPP-03), 2003, pp. 107–131.
[14] P. Lampsas, T. Loukopoulos, F. Dimopoulos, and M. Athanasiou, "Scheduling Independent Tasks in Heterogeneous Environments under Communication Constraints," the 7th International Conference on Parallel and Distributed Computing, Applications and Technologies (PDCAT), 4-7 December 2006, Taipei, Taiwan.
34 Int'l Conf. Grid Computing and Applications | GCA'08 |

Resource Consumption in HeterogeneousEnvironments
Niko ZenkerBusiness Informatics
Department of Technical and Business Information SystemsOtto-von-Guericke Universitat Magdeburg
P.O. Box 4120D-39016 Magdeburg GERMANY
+49(0)391 67 [email protected]−magdeburg.de
Martin Kunz, Steffen MenckeSoftware Engineering
Department of Distributed SystemsOtto-von-Guericke Universitat Magdeburg
P.O. Box 4120D-39016 Magdeburg GERMANY
+49(0)391 67 12662[makunz, mencke] @ivs.cs.uni−magdeburg.de
Abstract—Depending on the server, services need differentresources. This paper tries to identify measurable resources andthe dimensions theses resources need to have. Once measurablea guideline to measure and evaluate theses services is given.
Keywords: Resource Heterogenous Environment
I. INTRODUCTION
An international discussion about global warming and CO2
reduction led to a trend called GreenIT. Each individualcomputer center can contribute to this trend, but to do soit is necessary to measure the resource consumption of thecomputer center. The sum of all the services executed inthe computer center are responsible for the overall resourceconsumption. Therefore it is necessary to have a closer lookat each individual service and its resource consumption. Thishelps to redesign the computer center for a resource savingenvironment.
How much CO2 is used by a Google search? In theinternet several figures are discussed. Let us assume that theoverall consumption of the data centers, the human resourcesnecessary for the operation of these data centers, the networkinfrastructure and of course the individual computer used forthe Google search is summed up to 5 grams1 of CO2. Oncethe user hits the “Search” button the Google servers startworking and present a result within seconds. In respect to theindividual bandwidth of each user it is probably not necessaryto get the result as fast as possible. Performing the search ona “slower” node2 in the data center can reduce the overallusage of CO2. The result is presented to the user and due tothe lower bandwidth, the different search method is not evenmentioned.
Many other scenarios are imaginable where a different nodecan reduce the overall consumption of CO2 in the data center.But for all these scenarios it is necessary to measure availableresources. This paper will break down the data center toa place where different services are executed. The authors
1Due to insufficient proof of the numbers presented by http://blogs.sun.com/rolfk/entry/your co2 footprint when using a smaller amount is assumed
2Assuming that a slower node is using less power and therefore consumingless CO2
assume that each node in the data center is able to execute allservices and therefore different results are comparable. Thepaper is structured as followes. At the beginning differentresources are defined and an effort to describe these resourcesin standardized terms is shown. An approach to measure theresources is presented. Once measured all the values haveto be summarized for the whole chain of services executed.Therefore a formula to create a resource-concerned modelis motivated. Finally the outlook presents ideas and projectswhere the service measurement is needed and the conclusionends the paper.
II. RESOURCES
The term resource is used throughout every field of thescientific community. The W3C sees resources as entities3, butthey give no further description. Following the intentions ofthe Resource Description Framework presented by the W3C,resource are websites, or in general information in the internet.In the same manner the Uniform Resource Identifier (URI)is just a description of the place where a single websitecan be found. An economist describes resources as currentassets, a sociologist identifies the social status of a person asa resource, and the psychologist enriches the term resourcewith social skills and talents of a patient. For this paper aresource is defined as a physical entity that is measurable. Inaddition to this only resources in a data center are taken intoconsideration. Human resources are not considered.
Before the measurement can start, it is necessary to redefinethe dimension of each resource. Current attempts to comparedifferent systems and environments like [ZBP06] and [BBS07]deliver only limited information like CPU Time (measured inMIPS) or disk performance (measured in MB/s). Especially[BBS07] suggest an overall resource classification for ITmaking it possible to compare between different environments.The authors assume that a multi-dimensional index filledwith different measurable values is able to compare theseenvironments. Therefore each dimension is described with
3http://www.w3.org/TR/rdf-mt/
Int'l Conf. Grid Computing and Applications | GCA'08 | 35

multiple values. The described dimension points can be usedas basic structure for measurement but also as a base forcomparison of a single service between different servers. Anunexhausted list of values for that index is shown below:
RAMString Name = "RAM"String Type = "RDRAM" | "SDRAM"Int Size = 1024String Unit = "B" | "MB" | "GB"
String Name = "HD"Int Size = 30String Unit = "MB" | "GB"Int Partition = 1String PartitionType = "NTFS" | "EXT3"
String Name = "CPU"String Type = "Pentium4" | "AMD64-X2"Float MHZ = 4.2Int Flops = 54638255Int NumberOfCores = 2Int CurrentCore = 0
After identifying the base-measures (the single values de-rived from each dimension) the goal should be to createa combined metric, or a set of metrics. This is especiallyimportant when this resource metric is used to compare andevaluate services between different server environments. Suchan evaluation also demands thresholds and quality models foran analysis of the measured values. A single metric is mucheasier comparable than several different values derived fromthe single dimension. Nevertheless it is very important to saveall dimensional values to have a closer look at all services ifnecessary.
For the combined metric it is important to assess the base-measures as to their priority for the metric. Such an assessmentshould be transparent, to keep the information entropy andto avoid errors due to wrong priority weighting. Furthermoreresearch has to take a closer look at a run-time based metric,with elements from the list above. It may be possible that thereis also a correlation between source code, design, or structuraldescription and values derived from a metric.
Performance properties are measured and compared in[RKSD07]. This approach can deliver good results, especiallyfor the first way of measurement presented later in this paper.
Besides the definition of metrics and indicators anotherimportant issue is the evaluation and analysis of measuredvalues. Therefore an adaption of web service measurementpresented in [Sch04] is proposed. The values are measured ina distinct time frame. Therefore a diagram of all values can becreated and the quality of the service is directly viewable andactions, like restart or rearrange, of a service can take place.Figure 1 gives an example of service measurement over thisdistinct time frame.
In a service oriented architecture not every service is utilizedin the same way as others. The definition of the time frame
Fig. 1. Diagram of Ping and Invocation Times
is difficult, because it needs a detailed look at each service todetermine its utilization span. Some services are used everyother minute (e.g. sending a document to a printer), but someare just utilized once a year (e.g. the creation of the annualfinancial statements). Both services are vital to the profit ofthe company, but the second is only necessary once a year.The time frame for the measurement has to be adopted toget a informative result, useful for evaluation and comparisonbetween different servers.
Using techniques like BPEL it is easy to define certainservices and transactions in a process. The resources aredirectly connected to each step in the process. After theknowledge about the resources is extracted, a combination ofall resources used in the process is possible. This means that atdesign time the estimated amount of resources is predictable.Using the resource information at run-time several scenariosof rearranging services are imaginable. In this manner theresource information can support virtualisation in a way thatthe virtual environment can be configured precisely accordingto the resource consumption of the service that will run in thatenvironment.
III. MEASUREMENT OF RESOURCES
Identifying a server in a computer center is an easy task.The same applies for measuring the CPU load at this server.The result is a number showing an administrator how wellor poorly the server is utilized. It is also easy to look atthe capacity of the hard disks and to make a prediction howlong the remaining space will last, before maintenance has totake place. Breaking it down to an individual service requiresamore complex measurement scenario. This fact derives notonly from the more detailed view on the services, it is also mo-tivated by the commingling of the services itself. This meansthat a service built up by sub-services, with special resourcedemands, needed for its execution. In order to evaluate thewhole service, all the values have to be considered.
The measurement itself can take place at the underlyingoperating system. But a measurement-service needs to know
36 Int'l Conf. Grid Computing and Applications | GCA'08 |
what services should be measured. Values will be collectedaccording to the demands of the metric. Each individual valuewill then be integrated into the measurement result, providedto the measurement service. Working with interfaces makesit possible to implement different measurement methods; e.g.for different operating systems. The measurement service iscurrently under development, therefore no explicit operatingscheme can be presented. The class diagram, presented infigure 2, is based on [Mar2003] and shows a class diagramfor an ontology for software metrics and indicators. Martinidentifies in his class diagram objects that are measurable,but it also defines how the objects will be measured, whois measuring them and of course the place where the resultsare stored.
The adaption from software metrics toward hardware met-rics is not yet done. For now the authors assume that atransformation process of all hardware metrics is possible.
But before the creation of a metrics it is necessary todefine three stages of service measurement. Each stages hasa different priority. The first is a measurement of the servicewith randomly selected values done by the developer of theservice. The second is a measurement in special testing modeat runtime, and the third is an outside view of the service, atruntime.
Based on the quality of Web-Services these measurementmethods are already discussed and motivated. This approachcan be adopted for the measurement of resources. [SB03]describes all three methods. [Rud05] describes in greaterdetail the testing mode and the outside view. In [RKSD07]the simulation approach is described. All methods producevalues suitable for an estimate of resource consumption, butin order to generate reliable values all three methods haveto be combined in a measurement procedure. This procedureuses the values derived from the initial simulation, done by thedeveloper. In this way a starting value for the service is created.Once installed in the desired computer environment the test-mode will produce new values suitable for a distinguishedproposition. The third method will then refine the simulatedand tested values.
This ensures an acceptable measurement for proper values.The simulation approach is necessary have a starting valuefor a new environment. A developer can influence the resultsof the measurement. Using special values for the simulationphase produce a first estimate of resource consumption, withlittle liability for an environment at runtime. Nevertheless thesevalues are critical for a method to compare actual resourceconsumption and the maximum consumption for a singularservice.
The test-mode in the distinguished environment redefinesthe initial values with detailed immersion of each individualnode existing in the computer center. The test-mode willenumerate all computers in the environment suitable for theservice. The service is computed on each computer underdifferent circumstances, like heavy load of the CPU, or acongested network interface. In the end a detailed map of eachnode and its resource consumption for the service is created.
TABLE IPRIORITIES FOR THE THREE STAGES OF SERVICE MEASUREMENT
Stage PriorityI 0.33II 0.5III 1
This information is also necessary for an estimation method ofresource consumption and current load. The priority, and forthat matter the importance, is higher than the one recoveredin the simulation phase.
Using test-values selected by the developer for the first stageand for the special test-mode in the actual data center canbe dangerous to the output of the measurement process. Wellchosen test-values can create a measurement result suitablefor the service4. These values are of course not desired andthe overall outcome of the measurement process is badlyinfluenced. Therefore another stage of measurement needs tobe considered.
Therefore the authors demand a stage to measure valueswhen the service is in a productive mode at runtime. Themeasurement itself is a collection of needed information fromthe service it self or an outside view on the service. Theoutside view is more complex, because influences of otherservices have to be considered. These influences are welcome,in order to create a complex view on resource consumptioncorrelating with other services. Due to constant changes in theenvironment each value creates an immersion for the resourcemeasurement useful in an adaptive computer center.
In figure 3 all three stages are shown. The values derivedfrom all three stages have to be part of the metric. As describedabove the priority of each stage is not the same. Finding theright coefficient for each stage is a hard task. Depending onthe service these coefficients can vary. Practical research has torefine these coefficient. For now the authors assume that thehighest priority has to be appointed to values derived fromstage III. Values from stage II are better than values fromstage I. Therefore the priority (prior) as shown in table I areassumed.
For the overall value used for the metric the sum of allvalues has to be created. Each value is multiplied by thepriority.
V alueService =∑
prior ∗ V alueStage
This value is now a combination of three values measured withdifferent environments. Each environment is different from theother, therefore heterogeneous systems influence the metric fora service.
All three stages should be used for the measurement, but itis still necessary to integrate the time and other circumstancesinto the values. A service executed on a server with heavy loadreacts different and the performance metric is not as good as
4Service is designed to create a good output in regard of performance. Thiscan be done by special switches inside the source code.
Int'l Conf. Grid Computing and Applications | GCA'08 | 37

Fig. 2. A UML diagram to the ontology for software (and web) metrics and indicators [Mar2003]
on a server with no load. Especially with the third stage ofmeasurement the circumstances are accessible.
IV. AGGREGATION OF SERVICES
In a heterogeneous environment many service are combinedto fulfill the desired goal of the computer system. In order tomeasure and estimate all these services the aggregation of allservices have to be considered. Especially in a service orientedenvironment many heterogeneous services are executed. Eachservices contains sub-services necessary for its execution. De-pending on the orchestration of the (sub-)services the overallconsumption of resources has to be calculated in differentways. Four types of orchestration methods are described by[CDPEV05]. The parameters are used for quality of serviceparameters, suitable for different projects. Shown in table IIand table III these parameters are listed for the different waysof orchestration.
TABLE IIAGGREGATION FUNCTIONS FOR QOS PARAMETERS FOR SEQUENCE AND
SWITCHES [CDPEV05]
QoS Attr. Sequence Switch
Time (T)m∑
i=1
T (ti)n∑
i=1
pai ∗ T (ti)
Cost (C)m∑
i=1
C(ti)n∑
i=1
pai ∗ C(ti)
Availability (A)m∏
i=1
A(ti)n∑
i=1
pai ∗A(ti)
Reliability (R)m∏
i=1
R(ti)n∑
i=1
pai ∗R(ti)
It is of course possible that each individual service isexecuted on a different server. The orchestration is then influ-enced by the delay the network produces. Therefore not only
38 Int'l Conf. Grid Computing and Applications | GCA'08 |

Fig. 3. Three stages of service measurement
TABLE IIIAGGREGATION FUNCTIONS FOR QOS PARAMETERS FOR FLOW AND LOOPS
SERVICES AGGREGATION [CDPEV05]
QoS Attr. Flow LoopTime (T) Max{T (ti)i∈{1..p}} k ∗ T (t)
Cost (C)p∑
i=1
C(ti) k ∗ C(t)
Availability (A)p∏
i=1
A(ti) A(t)k
Reliability (R)p∏
i=1
R(ti) R(t)k
one value has to taken into account as base-measurement. Inthe chapter “Resources” a motivation for a multi-dimensionalindex was given. The inclusion of the network delay is justfor this theory.
The re-arrangment of the services is also possible whenexecuted in a virtual environment. The performance of theservice is then of course influenced by the virtual environmentand it resource consumption. In [MEN05] concepts, problems,and metrics for virtualization are discussed.
V. OUTLOOK
The mightiness of the metric, motivated by figure 2, is stillunclear. Further research will extend the metric with moreresults and of course the correlating influences.
A current project is developing and implementing the infras-tructure to measure services within a SOA. The result of themeasurement will be published to prove the fact that there isa difference in resource consumption, according to the serverused for its execution.
For an automation of service resource management thedescribed approach contains a semantic description of the de-fined metrics. In history ontologys possessed the capability todescribe information in a machine accessible manner. Existingsolutions in this area, for example an ontology for object
oriented metrics presented in [KKSD06] are a framework forontology about resource metrics for services.
Once having the automated resource management a frame-work can be created working in a heterogeneous environment.This environment is equipped with different server, most likelyworking with different operating systems. All services can beexecuted within the environment. The framework can then re-arrange these services to fulfill the desired outcome. One ofthese outcomes is the CO2 reduction, but it is also imaginableto re-arrange the service according to other demands like costsaving, a better performance, or a secure execution accordingto the demands of customer. This leads toward an automaticdata center as motivated in [BEME05].
Furthermore the desired resourcemeasurement should beimplemented in service development process and mainte-nance process standards to ensure low resource consumptionthroughout the service life cycle. An adaption of the mea-surement service to international standards like CMMI or SixSigma is desired.
The desired framework is flexible for all current operatingsystems and no expensive hardware has to be acquired. Theusage of the “old” equipment saves costs and due to a betterdistribution of services the overall performance of the systemwill rise.
REFERENCES
[BBS07] R. Brandl, M. Bichler, and M. Strobel. Cost Accounting for SharedIT Infrastructures - Estimating Resource Utilization in Distributed ITArchitectures. Wirtschaftsinformatik, 49(2):83–94, 2007.
[BEME05] M. Bennani, D. Menasce. Resource Allocation for AutonomicData Centers using Analytic Performance Models. Proceedings of the2005 IEEE International Conference on Autonomic Computing, 2005.
[CDPEV05] G. Canfora, M. Di Penta, R. Esposito, and M.L. Villani. Anapproach for QoS-aware service composition based on genetic algorithms.Proceedings of the 2005 conference on Genetic and evolutionary compu-tation, pages 1069–1075, 2005.
[Mar03] Maria de los Angeles Martin, Luis Olsina. Towards an Ontologyfor Software Metrics and Indicators as the Foundation for a CatalogingWeb System. Proceedings of the First Latin American Web Congress(LA-Web03), pages 103-113, 2003.
[MEN05] D.A. Menasce. Virtualization: Concepts, applications, and perfor-mance modeling. Proceedings of the 31th Int. Computer MeasurementGroup Conf, pages 407-414, 2005.
[KKDS06] M. Kunz, S. Kernchen, R. Dumke, A. Schmietendorf. Ontology-based web-service for object-oriented metrics. Proceedings of theInternational Workshop on Software Measurement and DASMA SoftwareMetrik Konkress , pages 99-106, 2006.
[RKSD07] D. Rud, M. Kunz, A. Schmietendorf, R. Dumke. PerformanceAnalysis in WS-BPEL-Based Infastructures. Proceedings of the 23rdAnnual UK Performance Engineering Workshop (UKPEW 2007), pages130-141, 2003.
[Rud05] D. Rud. Qualitaet von Web Services. VDM Verlag, 2005.[SB03] S. Battle. Boxes: black, white, grey and glass box views of web-
services. Technical Report HPL-2003-30. HP Laboratories Bristol, 2003.[Sch04] A. Schmietendorf, R. Dumke, D. Rud. Ein Measurement Service zur
Bewertung der Qualitatseigenschaften von im Internet angeboteten WebServices. MMB-Mitteilungen Nr. 45, pages 6-16, 2004.
[ZBP06] Rudiger Zarnekow, Walter Brenner, and Uwe Pilgram. IntegratedInformation Management - Applying Successful Industrial Concepts inIT. Springer Berlin Heidelberg, 2006.
Int'l Conf. Grid Computing and Applications | GCA'08 | 39

Experience in testing the Grid based Workload
Management System of a LHC experimentV. Miccioa b c, A. Fanfani c d, D. Spigae b, M. Cinquillie, G. Codispotid, F. Fanzagob c, F. Farinaf b, S.
Lacaprarag, E. Vaanderingh, A. Sciabab S. Belfortei
aCorresponding/Contact AuthorCERN, BAT.28-1-019, 1211 Geneve 23, [email protected] Office: +41 (0)22 76 77215 − Fax:+41 (0)22 76 79330
bCERN, Geneva, Switzerland
cINFN/CNAF, Bologna, Italy
dUniversity Bologna, Italy
eUniversity and INFN, Perugia
fINFN, Milano-Bicocca, Italy
gINFN Legnaro,Italy
hFNAL, Batavia, Illinois, USA
iINFN, Trieste, Italy
The computational problem of a large-scale distributed collaborative scientific simulation and analysis of ex-periments is one of the many challenges represented by the construction of the Large Hadron Collider (LHC) atthe European Laboratory for Particle Physics (CERN). The main motivation for LHC to use the Grid is thatCERN alone can supply only part of the needed computational resources, while they have to be provided by tensof institutions and sites. The key issue of coordinating and integrating such spread resources leads the buildingof the largest computing Grid on the planet.
Within such a complex infrastructure, testing activities represent one of the major critical factor for deployingthe whole system. Here we will focus on the computing model of the Compact Muon Solenoid (CMS) experiment,one of the four main experiments that will run on the LHC, and will give an account of our testing experience forwhat concerns the analysis job workflow.
Keywords: Grid Computing, Distributed Computing, Grid Application Deployment, High Energy PhysicsComputing
Conference: GCA’08 − The 2008 International Conference on Grid Computing and Applications
1. Introduction
CMS represents one of the four particle physicsexperiments that will collect data at LHC start-ing in 2008 at CERN, and one of the two largestcollaborations. The outstanding amount of pro-duced data − something like 2 PB per year −should be available for analysis to world-wide dis-tributed physicists.
The CMS computing system itself relies on geo-graphically distributed resources, interconnectedvia high throughput networks and controlled bymeans of Grid services and toolkits, whose build-ing blocks are provided by the Worldwide LHCComputing Grid (WLCG, [1]). CMS builds ap-plication layers able to interface with several dif-ferent Grid flavors (LCG-2, Grid-3, EGEE, Nor-
40 Int'l Conf. Grid Computing and Applications | GCA'08 |
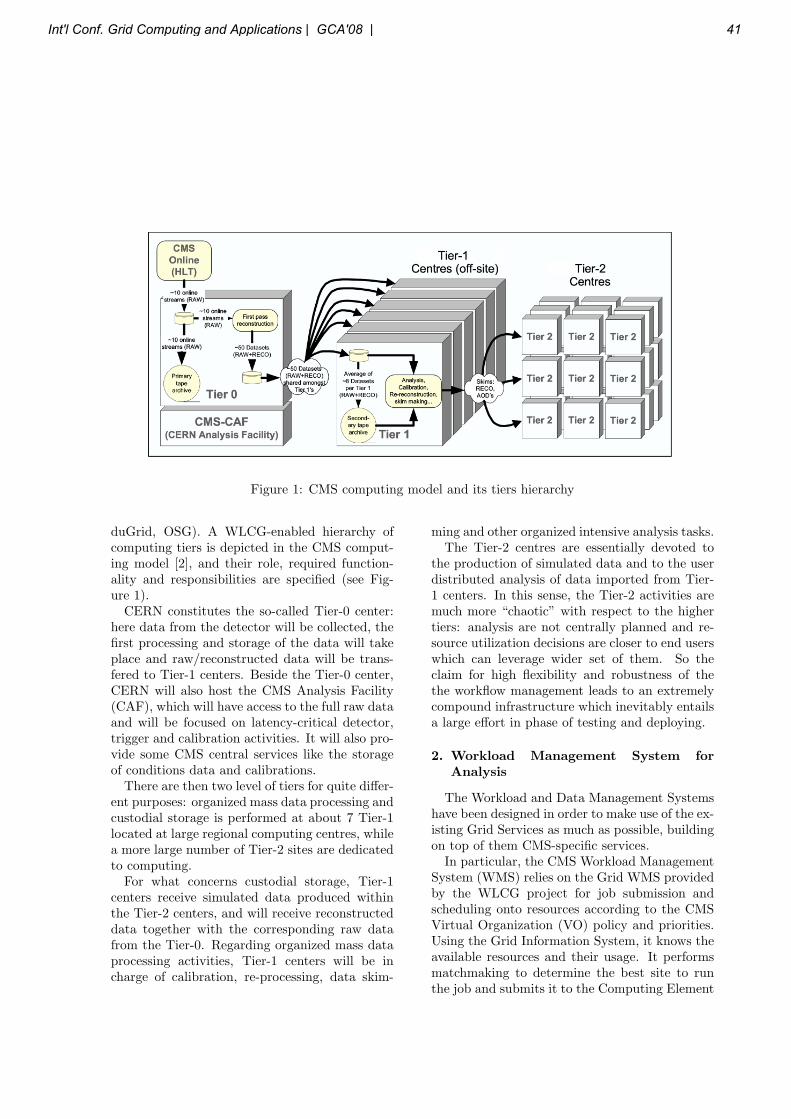
Figure 1: CMS computing model and its tiers hierarchy
duGrid, OSG). A WLCG-enabled hierarchy ofcomputing tiers is depicted in the CMS comput-ing model [2], and their role, required function-ality and responsibilities are specified (see Fig-ure 1).
CERN constitutes the so-called Tier-0 center:here data from the detector will be collected, thefirst processing and storage of the data will takeplace and raw/reconstructed data will be trans-fered to Tier-1 centers. Beside the Tier-0 center,CERN will also host the CMS Analysis Facility(CAF), which will have access to the full raw dataand will be focused on latency-critical detector,trigger and calibration activities. It will also pro-vide some CMS central services like the storageof conditions data and calibrations.
There are then two level of tiers for quite differ-ent purposes: organized mass data processing andcustodial storage is performed at about 7 Tier-1located at large regional computing centres, whilea more large number of Tier-2 sites are dedicatedto computing.
For what concerns custodial storage, Tier-1centers receive simulated data produced withinthe Tier-2 centers, and will receive reconstructeddata together with the corresponding raw datafrom the Tier-0. Regarding organized mass dataprocessing activities, Tier-1 centers will be incharge of calibration, re-processing, data skim-
ming and other organized intensive analysis tasks.The Tier-2 centres are essentially devoted to
the production of simulated data and to the userdistributed analysis of data imported from Tier-1 centers. In this sense, the Tier-2 activities aremuch more “chaotic” with respect to the highertiers: analysis are not centrally planned and re-source utilization decisions are closer to end userswhich can leverage wider set of them. So theclaim for high flexibility and robustness of thethe workflow management leads to an extremelycompound infrastructure which inevitably entailsa large effort in phase of testing and deploying.
2. Workload Management System forAnalysis
The Workload and Data Management Systemshave been designed in order to make use of the ex-isting Grid Services as much as possible, buildingon top of them CMS-specific services.
In particular, the CMS Workload ManagementSystem (WMS) relies on the Grid WMS providedby the WLCG project for job submission andscheduling onto resources according to the CMSVirtual Organization (VO) policy and priorities.Using the Grid Information System, it knows theavailable resources and their usage. It performsmatchmaking to determine the best site to runthe job and submits it to the Computing Element
Int'l Conf. Grid Computing and Applications | GCA'08 | 41

(CE) of the selected site which in turn schedulesit in the local batch system. The Worker Node(WN) machines where jobs run have POSIX-IO-like access to the data stored in the local StorageElement (SE).
On top of the Grid WMS, CMS has built theCMS Remote Analysis Builder (CRAB, [3–5]),an advanced client-server architecture for specificCMS-software (CMSSW) analysis jobs workflowmanagement. It is based on independent com-ponents communicating through an asynchronousand persistent message service, which can providefor the strong requirement of extreme flexibility.Such a server is placed between the user and theGrid to perform a set of actions in user behalfthrough a delegation service which handles usersproxy certificates. The main goal of such an in-termediate server is to automate as much as pos-sible the whole distributed analysis workflow andto improve the scalability of the system in orderto fullfill the target requirement rate of more than100 thousands jobs handled per days when LHCwill be full operational.
Anyway, the client-server implementation istransparent to the end users. From this pointof view CRAB simply looks like a dedicated frontend for specific CMSSW analysis jobs. It enablesthe user to process datasets and Monte Carlo(MC) samples taking care of CMSSW specific fea-tures and requirements, provides the user with asimple and easy to use interface, hides to the userthe direct interaction with the Grid and reducesthe user load by automating most of the actionand looking after error handling and resubmis-sions.
CRAB’s own functionalities and its integratedinteraction with the underlying Grid environmentneeds a dedicated test and deployment activity.
3. Test Experiences
The CMS experiment is getting ready to thereal LHC data handling by building and test-ing its Computing Model through daily experi-ence on production-quality operations as well asin challenges of increasing complexity. The capa-bility to simultaneously address both these com-plex tasks relies on the quality of the developed
tools and related know-how, and on their capabil-ity to manage switches between testbed-like andproduction-like infrastructures.
Such intermediate activities between develop-ing and production are crucial due to the largenumber of different services running on differentlayers using different technologies within multipleoperational scenarios that will operate when LHCwill work at full. Past experience [6,7] has shownthat such training activity practice is one of thebiggest challenges of such a system.
Main issues concern both functionality tests aswell as the scalability of the whole infrastructureto maintain the needed performance and robust-ness both up to the expected full job flows ratesand under realistic usage conditions.
Work flow tests was performed on both on Gridlevel and on more CMS specific CRAB level.
3.1. Grid WorkflowWMS testing was aimed at probing the load
limits of the service both from the hardware andfrom the software point of view. A quasi auto-mated test-suite was set up to steadily submitjobs at adjustable rate. Some very controlled in-stances of WMS have been used and was contin-uously tested, patched and re-deployed, with atight feedback between testers and developers.
The tests involved the submission of large num-bers of jobs to the WLCG production infrastruc-
Figure 2: The Grid WMS is capable to sustain arate of about 20kJ/d for several days
42 Int'l Conf. Grid Computing and Applications | GCA'08 |
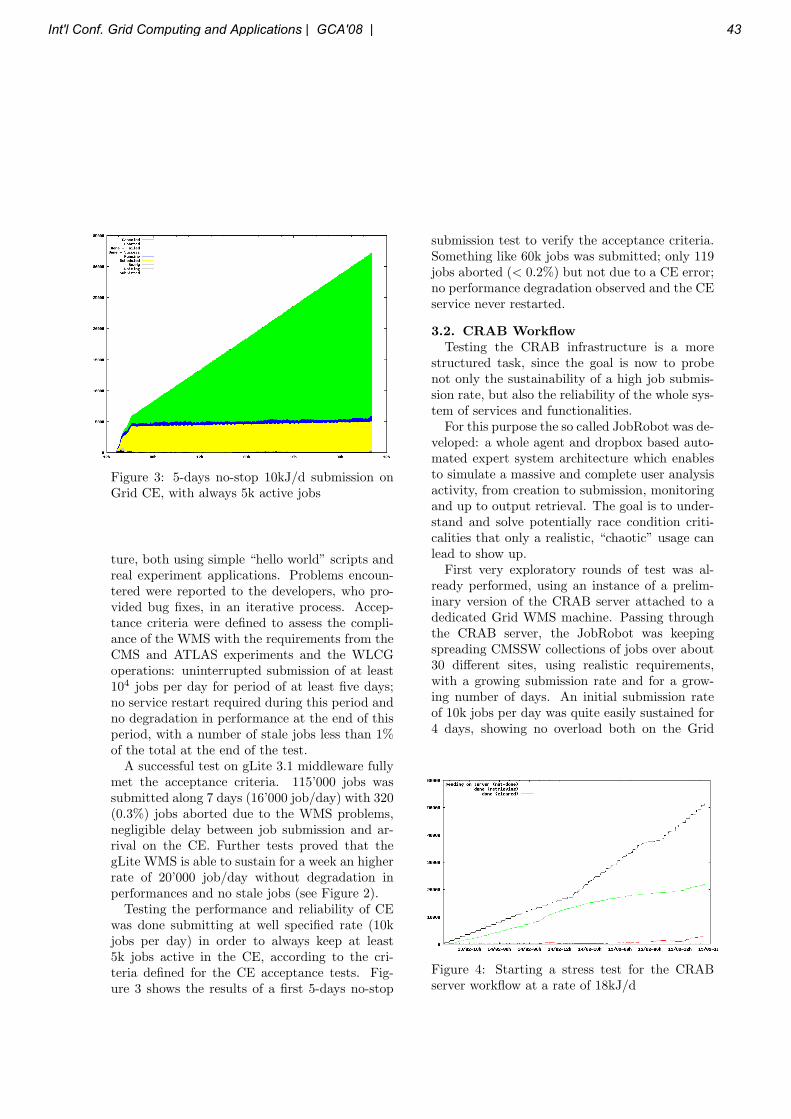
Figure 3: 5-days no-stop 10kJ/d submission onGrid CE, with always 5k active jobs
ture, both using simple “hello world” scripts andreal experiment applications. Problems encoun-tered were reported to the developers, who pro-vided bug fixes, in an iterative process. Accep-tance criteria were defined to assess the compli-ance of the WMS with the requirements from theCMS and ATLAS experiments and the WLCGoperations: uninterrupted submission of at least104 jobs per day for period of at least five days;no service restart required during this period andno degradation in performance at the end of thisperiod, with a number of stale jobs less than 1%of the total at the end of the test.
A successful test on gLite 3.1 middleware fullymet the acceptance criteria. 115’000 jobs wassubmitted along 7 days (16’000 job/day) with 320(0.3%) jobs aborted due to the WMS problems,negligible delay between job submission and ar-rival on the CE. Further tests proved that thegLite WMS is able to sustain for a week an higherrate of 20’000 job/day without degradation inperformances and no stale jobs (see Figure 2).
Testing the performance and reliability of CEwas done submitting at well specified rate (10kjobs per day) in order to always keep at least5k jobs active in the CE, according to the cri-teria defined for the CE acceptance tests. Fig-ure 3 shows the results of a first 5-days no-stop
submission test to verify the acceptance criteria.Something like 60k jobs was submitted; only 119jobs aborted (< 0.2%) but not due to a CE error;no performance degradation observed and the CEservice never restarted.
3.2. CRAB WorkflowTesting the CRAB infrastructure is a more
structured task, since the goal is now to probenot only the sustainability of a high job submis-sion rate, but also the reliability of the whole sys-tem of services and functionalities.
For this purpose the so called JobRobot was de-veloped: a whole agent and dropbox based auto-mated expert system architecture which enablesto simulate a massive and complete user analysisactivity, from creation to submission, monitoringand up to output retrieval. The goal is to under-stand and solve potentially race condition criti-calities that only a realistic, “chaotic” usage canlead to show up.
First very exploratory rounds of test was al-ready performed, using an instance of a prelim-inary version of the CRAB server attached to adedicated Grid WMS machine. Passing throughthe CRAB server, the JobRobot was keepingspreading CMSSW collections of jobs over about30 different sites, using realistic requirements,with a growing submission rate and for a grow-ing number of days. An initial submission rateof 10k jobs per day was quite easily sustained for4 days, showing no overload both on the Grid
Figure 4: Starting a stress test for the CRABserver workflow at a rate of 18kJ/d
Int'l Conf. Grid Computing and Applications | GCA'08 | 43

Figure 5: The bottleneck of having only one GridWMS
WMS side as well as on the CRAB server side.In a more stress-oriented test a rate of 18k jobsper day was maintained for the first 24 hours andthen raised to 30k jobs per day for the succeed-ing 24 hours. As Figure 4 shows, within the lowerrate jobs complete their workflow (green line) atthe same rate they are submitted (black line).
The high submission rate was overstretched foreven more time (see Figure 5), but the single GridWMS instance was not able to efficiently handlethe overall job flow generated in this way: jobwas dispatched more and more slowly to sites,piling up in WMS queues and bringing a to arapid degradation of its performace, and as aconsequence of the performance of the whole sys-tem (e.g. the lowering of the black curve in Fig-ure 5). The expected message was that to furtherincrease the scale requires additional dedicatedWMSs.
On the contrary the load on the CRAB servermachine was very reasonable, proving the a sin-gle server can still fairly well handle such a highsubmission rate. Moreover such first tests wasalready capable of giving valuable feedback con-cerning improvements in some CRAB server com-ponents and precious feedback was provided todevelopers about that. As a matter of fact, italso shows that the server could represent a fur-ther testing instrument for the underlying GridWMS services, allowing a fine tuning of its config-uration parameters in a much more CMS specificuse cases tailored way.
Already planned next steps involve the set up ofthe next forthcoming major release of the CRABserver: it includes important development up-grades (a client-server reengineering and a refac-tory of the Grid interaction framework) and needsan early test of the overall functionalities. A newscale test with the server pointing at more thanone single Grid WMS is then scheduled.
4. Conclusion
The Grid infrastructure is already really work-ing at production level and actually the every dayCMS activity can not do without it. So far test-ing and integration activities represented a cen-tral part of the work needed to bring the work-load management infrastructure to to a qualitylevel which let users take full advantage of it in aproduction context.
Anyway there are still challenges, to be readyfor when the LHC will be fully operative. Thistesting process is still ongoing and the improve-ments achieved during these months have alreadyhad a big impact on the amount of effort requiredto run the work flow services in production activ-ities.
REFERENCES
1. LHC Computing Grid project:http://lcg.web.cern.ch/LCG/
2. CMS Computing Technical Design Report,CERN-LHCC-2005-023, June 2005
3. D. Spiga, S. Lacaprara, W. Bacchi, M. Cin-quilli, G.Codispoti, M. corvo, A. Dorigo,F. Fanzago, F. Farina, O. Gutsche, C.Kavka, M. Merlo, L. Servoli, A. Fan-fani. (2007). CRAB: the CMS distributedanalysis tool development and design, NU-CLEAR PHYSICS B-PROCEEDINGS SUP-PLEMENTS. Hadron Collider Physics Sym-posium 2007. La Biodola, Isola d’Elba, Italy.20-26 Maggio 2007. vol. 177-178C, pp. 267 -268.
4. A. Fanfani, D. Spiga, S. Lacaprara, W. Bac-chi, M.Cinquilli, G. Codispoti, M. Corvo,A. Dorigo, F. Fanzago, A. Fanfani, F. Fa-rina, M. Merlo, O. Gutsche, L. Servoli,
44 Int'l Conf. Grid Computing and Applications | GCA'08 |

C. Kavka(2007). The CMS Remote Analy-sis Builder (CRAB). LECTURE NOTES INCOMPUTER SCIENCE. High PerformanceComputing -HiPC 2007 14th InternationalConference. Goa, India. 18-21 Dicembre 2007.vol. 4873, pp. 580 - 586.
5. F. Farina , S. Lacaprara, W. Bacchi, M. Cin-quilli, G. Codispoti, M. Corvo, A. Dorigo,A.Fanfani, F. Fanzago, O. Gutsche, C. Kavka,M. Merlo, L. Servoli, D.Spiga. (2007). Sta-tus and evolution of CRAB. POS PROCEED-INGS OF SCIENCE. XI International Work-shopon Advanced Computing and AnalysisTechniques in Physics Research (ACAT07).Amsterdam. 23-27 April 2007. vol. ACAT20,pp. ACAT020.
6. Andra Sciaba, S. Campana, A. Di Girolamo,E. Lanciotti, N. Magini, P. M. Lorenzo, V.Miccio, R. Santinelli, Testing and integrat-ing the WLCG/EGEE middleware in theLHC computing, International Conferenceon Computing in High Energy and NuclearPhysics (CHEP07), Victoria BC, Canada, 2-7 September 2007
7. V. Miccio, S. Campana, A. Sciaba, Experi-ence in testing the gLite workload manage-ment system and the CREAM computing ele-ment, EGEE’07 International Conference. 1-5October 2007
Int'l Conf. Grid Computing and Applications | GCA'08 | 45
A Rate Based Auction Algorithm for Optimum Resource Allocation using Grouping of Gridlets
G. T. Dhadiwal1, G. P. Bhole1, S. A. Patekar 2
1 Computer Technology Department, VJTI, Mumbai-19, India. 2Vidyalankar Institute of Technology, Mumbai-37, India.
Abstract - The Problem of allocating resources to a set of independent subtasks (gridlets) with constraints of time and cost has attracted a great deal of attention in a grid environment. This paper proposes the criteria for resource allocation based on its rate (cost by MIPS) and grouping of the gridlets. The rate minimizes the cost and the grouping reduces the communication overheads by fully utilizing the resource in one go. A comprehensive balance is thus achieved between the cost and time within the framework of grid economy model. Comparison of proposed algorithm is made with the single round First-price sealed and Classified algorithms in the literature. The results obtained using Gridsim Toolkit 4.0 demonstrates that the proposed algorithm has a merit over them.
Keywords: Rate based algorithm, Auction algorithm, Gridlets, Gridsim.
1 Introduction and Related Work Allocating independent subtasks (gridlets) in grid environment to the resources which are geographically distributed, heterogeneous, dynamic and owned by various agencies and thus having different costs and capabilities is one of the key problem addressed by various researchers [1- 4].
Grid Classified algorithm [5] and the First-priced sealed algorithm [1, 3] which are based on market mechanism focus on single round auction. The objective of later algorithm is to obtain the smallest Makespan (time require to complete the task) but has neglected the user grade of service demand. The Classified algorithm [5] proposes optimized scheduling algorithm under the limitation of time and cost. However it attempts to complete the task as quickly as possible, up till the granularity time (user expected completion time) and then after its laps resorts to cost minimization, looking at these aspects independently.
The proposed algorithm allocates resources based on rate i.e. Cost by MIPS ratio and identifies a group of gridlets which are submitted as a single bunch which keeps
the allocated resource engage up till the granularity time, resulting in reduced communication overhead. Thus the proposed algorithm balances time and cost comprehensively.
2 The Basis of the Proposed Rate Based Algorithm The Rate based algorithm considers the rate of resource i.e. the ratio of cost of the resource to the MIPS of the resource. Resources are then sorted in increasing order of rates. From sorted list the resource with the least rate and which is within the user budget is selected. For the specified granularity time million instruction performed by the selected resource is computed. Now a group of gridlet (assumed to be independent of each other) is identified such that it’s computing requirements matches with the selected resource, and is allocated to it. By doing this we do not revisit the allocated resource within the granularity time there by substantially reducing in the communication overhead. Now next resource with minimum rate from the sorted list is considered and above procedure is repeated. If during the process all resources are exhausted and still some gridlets are remains to be processed then we resort to a trade off by allocating all the remaining gridlets to the resource with the minimum rate.
2.1 Algorithmic Steps
Let n be the total number of gridlets termed as a task, MI i are the Million Instruction (MI) of gridleti, GranTime is the user expected time to complete processing of all gridlet in seconds, overhead is the communication time for each allocation of the resources to the gridlets, budget of user in Indian Rupees (INR) for the task, m be the total number of resources. Rj is the resource j, RMIPSj indicate the number of MI processed by the resource j in one second, RCostj is the cost in INR which resource charges on per second basis.
Step 1: Read resource information For each resource Rj j < m Get the following data of the available resources Rj, RMIPSj, RCostj. End for
46 Int'l Conf. Grid Computing and Applications | GCA'08 |

Step 2: Selection of resources based on rate and budget For Each Resource R find Rratej = RCostj / RMIPSj
End for sort Rratej in increasing order. //Find the require MIPS for the entire task.
For Each gridleti Req_MIPS = Req_MIPS + MIi
End for
While Req_MIPS > 0 and budget > 0 Let j be the next resource from sorted list. (j=1, 2,…, m) Req_time = (Req_MIPS /RMIPSj) round to next integer if (Req_time <GranTime and budget > (Req_time * RCostj)) select resource j. add j to selected_resource_list budget = budget – (Req_time * RCostj ) Req_MIPS = Req_MIPS – (Req_time * RMIPSj ) end if else if (budget > (GranTime * Rcostj)) select resource j add j to selected_resource_list. budget = budget – (GranTime * RCostj ) Req_MIPS = Req_MIPS – ( GranTime * RMIPSj ) end else if End While At end of step 2 a list of selected resources has been formed. Step 3: Grouping of gridlets For each gridleti , i < n Gridlet_sent[i] = false; End for While (all gridlet are not sent) Let k be the group number. (k=1, 2, ---) if Flag_GranTime_over = false select the next resource j from selected_resource_list. else // grantime over and hence select the least rate resource select the first resource (j = 1) from selected_resource _list. End if Total_MIj =RMIPSj * GranTime MIofGroupk = 0; For each Gridleti , i < n If (Gridlet_sent[i] == false and (Total_MIPSj > MIofGroupk +MIi)) MIofGroupk = MIofGroupk+MIi
Add gridleti to group k Gridlet_sent[i] = true
End if End For Send group k to resource j. k = k+1 j = j+1 // When all gridlets are not executed within granularity time the remaining gridlets are allocated to least rate resource. if resource list exhausted Flag_GranTime_over =True End if End while
3 Illustrative Example - Comparison of the Proposed Algorithm with the others [1, 5]
The problem is to execute say Task1, in grid environment using Gridsim toolkit 4.0 [6, 7], consisting of 5 gridlets each requiring 200 MI. The communication overhead is 0.2 sec, the budget is 7000 INR and granularity time is 5 sec. The information regarding resources used is listed in Table 1.
Table 1: Detailed Information of Resources Name MIPS Operating
System Cost (INR)
R1 42 UNIX 100 R2 180 LINUX 200 R3 256 LINUX 300 R4 225 WINDOWS 250 R5 384 LINUX 400 R6 39 WINDOWS 50 R7 66 LINUX 60 R8 450 WINDOWS 500
Similarly Task2 to Task8 are considered for execution. The proposed rate based algorithm, the First-price sealed and the Classified algorithm are employed to solve the problem. The results are tabulated in Table 2 and graphically represented in Fig 1 and Fig 2. Resources are allocated during the execution of algorithm. Table 3 shows final allocation of resources to the gridlets for all three algorithms. Grouping of gridlets is also seen in the said Table for the proposed algorithm. For brevity only Task4 is considered.
Int'l Conf. Grid Computing and Applications | GCA'08 | 47

Table 2: Comparison of Proposed algorithm with First-price and Classified Algorithm
Proposed Rate
Based Classified First Prices
Tas
k
Grid
let
Make span (sec)
Cost (INR)
Make span (sec)
Cost (INR)
Make span (sec)
Cost (INR)
1 5 3.23 1440 1.09 1950 3.22 1500 2 10 4.89 2240 1.96 3950 6.44 5000 3 15 6.46 3480 3.92 4990 9.67 7500 4 20 5.73 4740 8.83 5480 12.89 10000 5 25 4.89 5990 18.51 6350 16.11 12500 6 30 5.09 6990 159.85 9000 19.33 15000 7 35 12.16 8710 196.49 10500 22.56 17500 8 40 16.78 10040 217.13 12000 25.78 20000
0
50
100
150
200
250
Task1 Task2 Task3 Task4 Task5 Task6 Task7 Task8
Task
Mak
esp
an (s
ec)
Rate Based
Classified
First
Fig 1: Comparison of time required for task
completion by all three algorithms
0
5000
10000
15000
20000
25000
Task1 Task2 Task3 Task4 Task5 Task6 Task7 Task8
Task
Co
st (I
NR
)
Rate Based
Classified
First
Fig 2 Comparison of cost required for task completion
by all three algorithms
Table 3: Allocation of resources for Task4
Res
ourc
e
R1
R2
R3
R4
R5
R6
R7
R8
R9
Firs
t
- - - - - - - - 1, 2, 3, … 19 20
Cla
ssifi
ed - - 1,
3, 5, 8, 10
2, 4, 7, 9
- 11, 12, 13, … 19, 20
6 - -
Rat
e B
ased
- 16-19 - 1-5, 20-20
7-15 - 6-6
- -
Remarks – following are the observation made with reasoning on the results obtained in Table 2.
1) Irrespective of magnitude of the task the cost required for the proposed algorithm is minimum because rate based selection of resource is employed.
2) As the magnitude of task increases (see after task 3 in table 2) the time required to complete the task also reduces. This is due to reduced communication overhead because of grouping of gridlets
The superiority of the proposed method is thus apparent.
4 Conclusion The paper proposes an algorithm for resource allocation in grid environment with single round auction. The proposed algorithm considers the ratio of cost by MIPS i.e. the rate of the resource in its allocation and also it incorporates appropriate grouping of gridlet to minimize the transition time of each gridlet to the resource, thus balancing time and cost comprehensively. The comparison of the rate based algorithm is made with the First-price and Classified algorithms in the literature using Gridsim Toolkit 4.0 and the result demonstrates that proposed algorithm has a merit.
48 Int'l Conf. Grid Computing and Applications | GCA'08 |

5 References [1] Daniel Grosu and Anubhav Das. Auction-Based Resource Allocation Protocols in Grids,In proc. Of the 16th IASTED international Conference on Parallel and Distributed Computing and System (PDCS 2004), November 9-11, 2004, MIT, Cambridge, Massachusetts, USA, pp. 20-27. [2] Mathias Dalheimer, Frans-Josef Pfreundt and Peter Merz. “Agent-based Grid Scheduling with Calana”, In Parllel Procedding and Applied Mathematices (PPAM 2005), vol. 3911, Lecture Notes in Computer Science, Springer, pp. 741-750, 2005. [3] Marcos Dias de Assunção and Rajkumar Buyya. An Evaluation of Communication Demand of Auction Protocols in Grid Environments, Proceedings of the 3rd International Workshop on Grid Economics & Business (GECON 2006), World Scientific Press, May 16, 2006, Singapore. [4] Task Scheduling for Coarse-Grained Grid Application Nithiapidary Muthuvelu, Junyang Liu and Nay Lin Soe Grid Computing and,, Distributed Systems Laboratory Department of Computer Science and Software Engineering The University of Melbourne, Australia. [5] Li Kenli, Tang xiaoyong, Zhaohuan. Grid Classified Optimization Scheduling Algorithm under the Limitation of Cost and Time. In (ICESS’05) IEEE Proceedings of the Second International Conference on Embedded Software and Systems. Dec2005. pp. 496-500. [6] URL of Gridsim simulator
http://sourceforge.net/projects/gridsim [7] Anthony Sulistio, Uros Cibej, Srikumar Venugopal, Borut Robic and Rajkumar Buyya A Toolkit for Modeling and Simulating Data Grids : An Extension to Gridsim, Concurrency and Computation : Practice and Experience (CCPE), Wiley Press, New York, USA (in press, accepted on Dec. 3, 2007).
Appendix Gridsim toolkit 4.0 is used. The First-price sealed, Classified and the proposed rate based algorithm are implemented using the flow chart given in Fig 3.
Fig 3: Process Flow of used in GridSim Simulation for implementing algorithms used.
Int'l Conf. Grid Computing and Applications | GCA'08 | 49

A Coordination Framework for Sharing Grid Resources
D. R. Aremu1, M. O. Adigun2, 1Department of Computer Science, University of Zululand, KwaDlangezwa, KwaZulu-Natal, South
Africa
1. Introduction
ABSTRACT: Distributed market based models are
frequently used for resource allocation on the
computational grid. But, as the grid size grows, it
becomes more difficult for a customer to directly
negotiate with all the grid resource providers. Middle
agents are introduced to mediate between the providers
and customers so as to facilitate effective resource
allocation process. This paper presents a new market
based model called Cooperative Modeler for mediating
resource negotiation. By pooling resources together in
a cooperative manner, the resource providers can
combine sales returns, operating expenses and
distribute sales efficiently among members in
proportion to the volume of contribution over a
specified time. The paper discussed the designed
framework for implementing the Cooperative Modeler.
1. Introduction
Utility Grid Computing is emerging as a new
paradigm for solving large-scale problems in science,
engineering, and commerce [1][2][3]. The Grid
technologies enable the creation of Virtual Enterprises
(VE) for resource sharing by logically coupling
millions of geographically distributed resources across
multiple organizations, administrative domains, and
policies. The Grid technology comprises heterogeneous
resources (PCs, work-stations, clusters, and
supercomputers), fabric management systems (single
system image OS, queuing systems, etc.) and policies,
and applications (scientific, engineering, and
commercial) with varied CPU, I/O, memory, and/or
network intensive requirements. The users, producers
also called resource owners and consumers have
different goals, objectives, strategies, and demand
patterns. More importantly both resources and end-
users are geographically distributed with different time
zones [3]. These essentially lead to complex control and
coordination problem, which is frequently solved with
economic model based on real or virtual currency. The
nature of economic models, which imply self-interested
participants with some level of autonomy makes an
agent based approach the preferred choice for this
study. This paper presents a new middleware agent
called Cooperative Modeler, for mediating resource
negotiation in the grid computing environments, and
discussed the architecture designed for its
implementation. The presented model, enabled by the
Utility Grid Computing Infrastructure allowed the
providers of resources to come together in a cooperative
50 Int'l Conf. Grid Computing and Applications | GCA'08 |

relationship to do business. A cooperative is an
autonomous association of agents united voluntarily to
meet their common economic, social, and cultural
needs and aspirations through a joint owned and
democratically controlled enterprise. Cooperative
business is a business owned and controlled by the
people who use its services. By pooling resources
together in a cooperative manner, providers of
resources combine sales returns, and operating
expenses, and pro-rating or distributing sales among
members in proportion to volume each provides
through the cooperative over a specified time. A
cooperative may operate a single resource pool or a
multiple resource pool. In a pool operation, members
bear the risk and gains of changes in market prices. So,
the advantages of pooling are: (i) it spreads market
risks; (ii) it permits management to merchandise
resources according to a program it deems most
desirable and to one that can be planned with
considerable precision in advance; and (iii) it also
permits management to use caution in placing and
timing shipments to market demands and in developing
new markets i.e., orderly marketing; and it helps
finance the cooperative. The rest of the paper is
organized as follows; section 2 discussed the related
work, while section 3 present the Cooperative Modeler,
and the architecture designed for its implementation.
Section 4 presents the Software Specification/
Requirement and Design used for implementing the
Cooperative Modeler. Section 5 concludes the paper.
2.0 Related Work
Economics-based model has been used for
coordinating grid resource allocation in the grid
computing environment. The economic based approach
provides a fair basis in successfully coordinating
decentralization and heterogeneity that is present in the
grid economies. The models investigated are classified
based on auctions, bilateral negotiation, and other
negotiation models.
2.1 Auction Models
Auctions are highly structured forms of negotiation
between several agents. An auction is a market
institution with an explicit set of rules determining
resource allocation and prices on the basis of bids from
the market participants. Auctions enable the sales of
resources without a fixed price or a standard value. The
typical purpose of an auction is for the seller to obtain a
price, which lies as close as possible to the highest
valuation among potential buyers. The auction model
supports one to many negotiations, between a grid
resource provider (seller) and many grid resource
consumers (buyers), and reduces negotiation to a single
value (i.e. price). The three key players involved in an
auction are: the grid resource owners, the auctioneer
(mediator) and the buyers. In a Grid environment,
providers can use an auction protocol for deciding
service value/price. The steps involved in the auction
process are: (i) a Grid Service Provider announces its
services and invites bids; (ii) brokers offer their bids
and they can see what other consumers offer depending
on whether the auction protocol is open or closed; (iii)
the broker and Grid Service provider communicate
privately and use the resource (R). The contents of the
deal template used for work announcements in an
auction include the addresses of the users, the eligibility
requirements specifications, the task/service
abstraction, an optional price that user is willing to
invest, the bid specification (what should the offer
contain) and the expiration time (the deadline for
receiving bids). From a Grid Service Provider�s
perspective, the process in an auction is: (i) receive
tender announcements/advertisements (in Grid market
Int'l Conf. Grid Computing and Applications | GCA'08 | 51

Directory); (ii) evaluate the service capability; (iii)
respond with a bid; (iv) deliver service if a bid is
accepted; (v) report result and bills the user as per the
usage and agreed bid.
2.2 Bilateral Negotiation Model
Unlike the auction models which supports one to
many negotiations, between a grid service provider
(seller) and many grid service consumers (buyers), and
reduces negotiation to a single issue value (i.e. price),
we also investigated the bilateral negotiation model
which involves two parties, multiple issues value
scoring model as discussed in [4]. In a two party
negotiation sequence called negotiation thread, offers
and counter-offers are generated by linear combinations
of simple functions called tactics. Tactics generate an
offer and counter-offer considering multi criterions
such as price, quantity, quality of service, delivery time,
etc. To achieve flexibility in negotiation, agents may
wish to change their ratings of the importance of the
different criteria, and their tactics may vary over time.
Strategy is the term used to denote the way in which an
agent changes the weights of tactics over time. Through
strategy an agent changes the weight of tactics over
time. Strategy combines tactics depending on the
negotiation history.
2.3 Tender/Contract�Net Model
Tender/Contract-net model is one of the most widely
used models for service negotiation in a distributed
problem solving environments [5]. Tender/Contract-net
is modeled on the contracting mechanism used by
businesses to govern the exchange of goods and
services. It helps in finding an appropriate service
provider to work on a given task. A user/resource
broker asking for a task to be solved is called the
manager and the resource that might be able to solve
the task is called the potential contractor. From a
manager�s perspective, the process in a Tender/Contract
� Net Model is: (i) the consumer (broker) announces its
requirement (using a deal template) and invites bids
from Grid Service Providers; (ii) interested Grid
Service Providers evaluate the announcement and
respond by submitting their bids; (iii) the brokers
evaluates and awards the contract to the most
appropriate Grid Service Provider(s); (iv) step (ii) goes
on until one is willing to bid a higher price or the
auctioneer stops if the mini price line is not met; (v) the
Grid Service Provider offers the service to the one who
wins; (vi) the consumer uses the resource.
2.4 Bid-Based Proportional Resource Sharing
Market-based proportional sharing systems are quite
popular in cooperative problem-solving environments
such as clusters (in a single administrative domain). In
this model, the percentage of resource shared allocated
to the user application is proportional to the bid value in
comparison to other users� bids. The user allocated
credits or tokens, which they can use to have access to
resources. The value of each credit depends on the
resource demand and the value that other users place on
the resource at the time of usage. Two users wishing to
access a resource with similar requirements for
instance, the first user is willing to spend 2 tokens and
the second user is willing to spend 4 tokens. In this case
the first user gets one third of the resource share
whereas the second user gets twice the first the first
user (i.e. two third of the resource share), which is
proportional to the value that both users place on the
resource for executing their applications. This strategy
is a good way of managing a large share resource in an
52 Int'l Conf. Grid Computing and Applications | GCA'08 |
organization or resource owned by multiple individuals
can have a credit allocation mechanism depending on
the investment they made. They can specify how much
credit they are willing to offer for running their
application on the resource.
2.5.3 Monopoly/Oligopoly
Unlike the previously discussed auction models which
assumed a competitive market where several Grid
Service Providers and brokers/consumers determine the
market price, there exist cases, where a single Grid
Service Provider dominates the market and is therefore
the single provider of a particular service. In economic
theory this model is known as monopoly. Users cannot
influence prices of services and have to choose the
service at the price given by the single Grid Service
Provider who monopolizes the Grid marketplace. An
example is where a single site puts the prices into the
Grid Market Directory or information services and
brokers consult it without any possibility of negotiating
prices. A monopoly�s offer of resources is usually
decoupled from the price at which it acquired the
resource. The classical problem of a monopoly is that it
sets higher price than marginal cost and this distorts the
trade-off in the grid economy, and moves it away from
Pareto efficiency. The fact that a monopoly does not
face the discipline of competition means that a
monopoly may operate inefficiently without being
corrected by the grid marketplace. The competitive
markets are one extreme and monopolies are the other
extreme. In most of the cases, the market situation is an
oligopoly which is in between these two extreme cases:
a small number of Grid Service Providers dominate the
market and set the prices.
3.0 Proposed Cooperative Middleware for Resource Negotiation
This section discussed the Cooperative Modeler, and
the architecture designed for its implementation. The
Cooperative Modeler adopts the concept of Utility grid
computing, which is tied to utility computing where
users can request for resources when ever needed (i.e.
on-demand) and only be charged for the amount being
used. Individual members of a Cooperative group need
not own or purchase expensive grid resources for a
specific project but can instead choose to �rent� or
share among trusted parties, members of the
cooperative. The Cooperative Modeler is a dynamic
alliance of autonomous resource providers distributed
across organizations and administrative domains that
bring in their complementary competencies and
resources that are collectively available to each other
through a virtualized pool called Cooperative Market,
with the objective to deliver products or services to the
market as a collective effort. The Cooperative Modeler
adopt bilateral negotiation model to enable the
consumers of services to negotiate for services in real
time.
3.1 Architecture of the Cooperative Modeler
The architecture of the Cooperative Modeller is made
up of three components namely: the Client component,
the Cooperative Middleware component, and the
Providers component. The architecture promotes a
business situation involving three stakeholders with
three major business roles: (i) End-user - The End-user
role is played by a stakeholder (client) who consumes
services, (ii) Mediator - The Mediator role is the key
player and this role is played by the Cooperative
Middleware agents, (iii) Service Provider - The service
Provider role is played by a service owner who offers
Int'l Conf. Grid Computing and Applications | GCA'08 | 53

his services to the end user (the client). The Client
Component is made up of a set of n clients. Each client
has at least one task of various length and resource
requirement to execute. The Provider Component is
composed of a set of m Providers, who formed the
cooperative group. The dynamic nature of this model
makes it possible for a provider of resources to be a
client requesting for resources at the same time. The
Cooperative Middleware Components is made up of
five interacting agents saddled with the responsibility of
coordinating resource sharing negotiation at the grid
resource pool. These agents are: the Liaising-Agent, the
Information-Agent, the Marketing-Agent, the Resource-
Control-Agent, and the Execution-Agent. Table I gives
the description of these agents.
Table I: Description of the Agents at the Cooperative resource pool
Name of Agent Responsibility of the agent
Client-Agent This agent is acting on behalf of the Clients (the end user) to negotiate for resources
Liaising-Agent This agent is acting as the controller, manager of managers to the other agents at the
resource pool. Request for resources is always directed to it. It liaises between the
clients, the providers and the agents at the resource pool.
Information-Agent This agent is the manager in charge of the resource pool. It maintains knowledge base
of the resources at the pool. It interacts closely with the pool and the Marketing-Agent.
Marketing-Agent The Marketing-Agent is the expert (manager) in charge of resource negotiation. It is
equipped with all kinds of negotiation tactics so as to optimize the objectives of the
resource providers.
Resource-Control-Agent This agent is responsible for sales recording/documentation, and issuance of resource
id. It is the manager (accountant) in charge of record keeping at the resource pool.
Execution-Agent This agent is responsible for the execution of the clients� tasks.
4. Implementation Design for the Proposed Cooperative Modeler
Table II gives the specification of the negotiation
protocol between the Marketing-Agent and the Client-
Agent of the Cooperative modeler. The role players in
this protocol are the Client-Agent who plays the role of a
buyer of resources, while the Marketing-Agent plays the
role of a seller of resources. The communication
between the two agents consist of exchange of messages
in form of buyers querying sellers for available resource
to meet their task requirements, query for prices of the
available resources, exchanges of proposals followed by
proposal-accepted or counter-proposals. If the two
agents agree over a deal, sales accepted must be reported
followed by sales confirmed. The execution protocol
(Table III) also consists of exchange of
requests/responses between the Client and the
Execution-Agent over task execution. The Execution-
Agent is acting the role of task executor. The protocol
allows the Client to request for the status of the task
execution, during the execution period. End of task
execution is reported immediately after execution is
finished.
54 Int'l Conf. Grid Computing and Applications | GCA'08 |
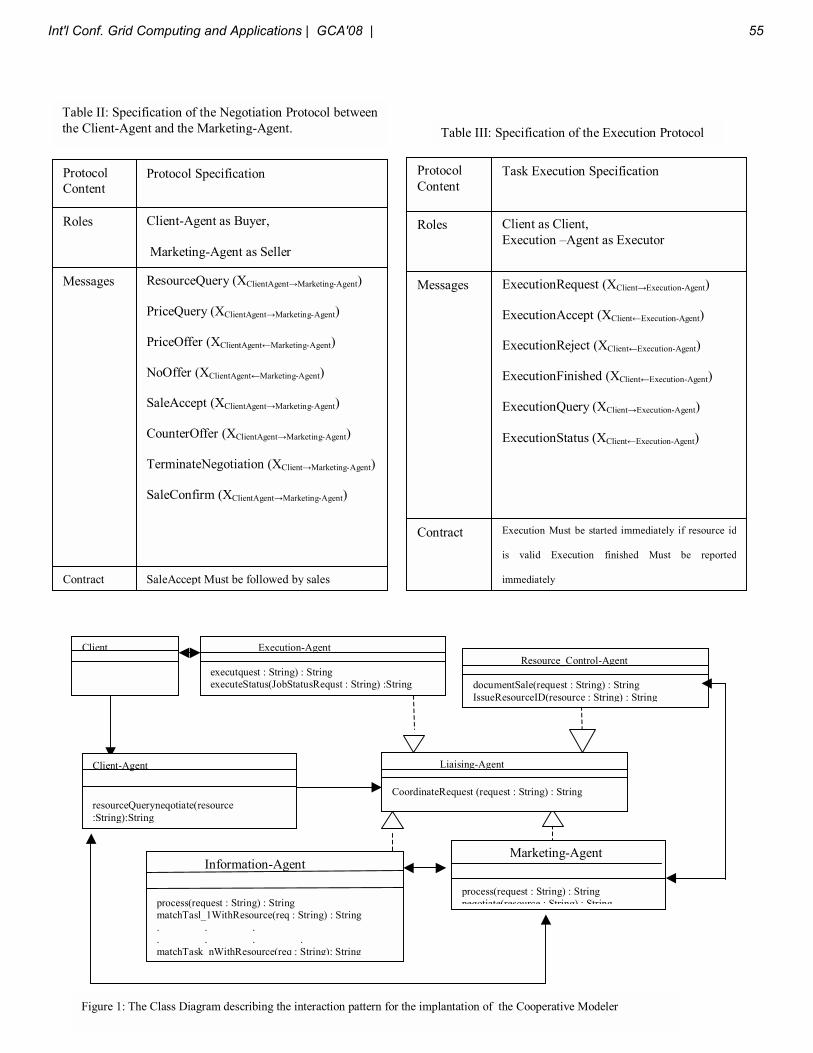
Task Execution SpecificationProtocol Content
Client as Client, Execution �Agent as Executor
Roles
ExecutionRequest (XClient→Execution-Agent)
ExecutionAccept (XClient←Execution-Agent)
ExecutionReject (XClient←Execution-Agent)
ExecutionFinished (XClient←Execution-Agent)
ExecutionQuery (XClient→Execution-Agent)
ExecutionStatus (XClient←Execution-Agent)
Messages
Execution Must be started immediately if resource id
is valid Execution finished Must be reported
immediately
Contract
Table III: Specification of the Execution Protocol
Protocol Specification Protocol Content
Client-Agent as Buyer,
Marketing-Agent as Seller
Roles
ResourceQuery (XClientAgent→Marketing-Agent)
PriceQuery (XClientAgent→Marketing-Agent)
PriceOffer (XClientAgent←Marketing-Agent)
NoOffer (XClientAgent←Marketing-Agent)
SaleAccept (XClientAgent→Marketing-Agent)
CounterOffer (XClientAgent→Marketing-Agent)
TerminateNegotiation (XClient→Marketing-Agent)
SaleConfirm (XClientAgent→Marketing-Agent)
Messages
SaleAccept Must be followed by sales Contract
Table II: Specification of the Negotiation Protocol between the Client-Agent and the Marketing-Agent.
Resource_Control-Agent
documentSale(request : String) : String IssueResourceID(resource : String) : String
Client
Execution-Agent
executquest : String) : String executeStatus(JobStatusRequst : String) :String
Liaising-Agent
CoordinateRequest (request : String) : String
Client-Agent resourceQueryneqotiate(resource :String):String
Marketing-Agent process(request : String) : String negotiate(resource : String) : String
Information-Agent process(request : String) : String matchTasl_1WithResource(req : String) : String . . . . . . . matchTask nWithResource(req : String): String
Figure 1: The Class Diagram describing the interaction pattern for the implantation of the Cooperative Modeler
Int'l Conf. Grid Computing and Applications | GCA'08 | 55

5.0 Conclusion
In this paper, a survey of economic models for
negotiating grid resource was carried out. The paper
discussed the architecture of a new middleware called
Cooperative Modeler. The purpose of creating the
Cooperative Modeler was for mediating resource
negotiation between providers and consumers of
resources. The paper also presented the design
framework for the implementation of the Cooperative
Modeler. The presented model, enabled by the Utility
Grid Computing Infrastructure, allows the providers of
grid resources to collaborate by coming together in a
cooperative relationship, and to contribute their core
competences and share resources such as information,
knowledge, and market access in order to exploit fast �
changing market opportunities..
Reference
[1] Rajkumar Buyya and Srikumar Venugopal,
�The Gridbus Toolkit for Service Oriented
Grid and Utility Computing: An Overview and
Status Report�, Proceedings of
the First IEEE International Workshop on Grid
Economics and Business Models (GECON
2004, April 23, 2004, Seoul, Korea), 19-36pp,
ISBN 0-7803-8525-X, IEEE Press, New
Jersey, USA.
[2] D. Abramson, J. Giddy, and L. Kotler, High
Performance Parametric Modeling with
Nimrod/G: Killer Application for the Global
Grid?, IPDPS�2000, Mexico, IEEE CS Press,
USA, 2000.
[3] Klaus Krauter, Rajkumar Buyya, and Muthucumaru
Maheswaran, �A taxonomy and survey of grid resource
management systems for distributed computing,�
Software: Practice and Experience, vol. 32, no. 2,
February 2002, pp. 135-164.
[4] H. Raiffa. The Art and Science of Negotiation, Harvard
University Press, Cambridge, USA, 1982
[5] Smith R, David R. �The Contract Net protocol: High level
communication and control in a distributed problem
solver,� IEEE Transaction on Computers 1980; 29(12):
1104 � 1113.
56 Int'l Conf. Grid Computing and Applications | GCA'08 |

A Scheduling Algorithm Using Static Information of Grid
Resources
Oh-Han Kang1, Sang-Seong Kang
2
1Dept. of Computer Education, Andong National University, Andong, Kyungbuk, Korea
2Dept. of Educational Technology, Andong National University, Andong, Kyungbuk, Korea
Abstract - In this paper, we propose a new algorithm,
which is revised to reflect static information in the logic of
WQR(Workqueue Replication) algorithms and show that it
provides better performance than the one used in the
existing method through simulation.
Keywords: Grid, Scheduling, Static information,
Workqueue replication
1 Introduction
The scheduling algorithm for a grid system can be
classified into a number of groups according to the
characteristics of resources and tasks, scheduling time, and
intended goal. But we focused our study on the algorithms
which can obtain minimum completion time for mutually
independent tasks in batch mode. With this goal, the tasks
were assorted by the type of information of our interest and
related works were studied further.
1.1 Algorithm using the information for performance-
evaluation
The studies on algorithms, which utilize information
concerning the length of assigned tasks, the preparation time
of resources, and processing capacity, are dated back to
most conventional parallel and distributed environment.
These typical algorithms range from Min-Min to Max-min.
Out of unassigned tasks, Min(Max)-Min algorithm selects
those with the minimum(maximum) completion time, and
assign these tasks to the resources, which is expected to have
the minimum completion time.
Since Min(Max)-Min algorithm can be simply
implemented, application of such algorithms can be easily
found from other situation. He[6] suggested the modification
of Min-Min algorithm to complete tasks (those that require
QOS in grid computing) in shortest amount of time.
Furthermore, Wu[7] separated sorted tasks into segments
and applied it to Min-Min algorithm,
In contrast to Min(Max)-Min, some algorithms are
introduced by Buyya[1] and Muthuvelu[2] to be developed
specifically for the grid system. Buyya suggested an
algorithm model to search the optimal combination of
resources within the budget, as it is important to consider the
financial costs of resources in a grid system. Because his
model includes cost-optimization, time-optimization, and
cost-time optimization, appropriate algorithm can be chosen
for particular significance of tasks and specific budget of
grid users. Moreover, Muthuvelu proposed a strategy, in
which he gathered tasks composed of a number of small
fragments and, in turn, distributed resource in specific
amount.
1.2 Algorithm not using the information for
performance-evaluation
Evaluating measured capacity and the exact length of a
task to be allocated in consideration of the current load is
not an easy problem. Especially due to the characteristics of
the grid system both the capability to maintain capacity and
status considering load information of the resource and the
power to maintain these in real time and subsequent
difficulty in predicting the completion time, results from
evaluation are virtually ineffectual. Even though it may be
possible to evaluate with complete precision, relatively long
processing time of tasks in utilizing the grid system leads to
continual change in the load of resources, and the scope of
its application consequently remains limited. For these
reasons, a grid scheduling algorithm without information for
performance evaluation is suggested. [3, 4]
The simplest algorithm independent of information for
performance-evaluation is Workqueue. Workqueue allocates
every task to every resource one by one in order, and, in turn,
assigns other tasks immediately to resources, which have
come up with the results. As a result of letting more number
of tasks be allocated to fast resources and less to slow
resources, this algorithm enables minimal amount of task-
completion time. Subramani[4] allocated specific tasks to a
number of resources repeatedly, and called off the
processing of other remaining tasks in other resources when
the task is completed in one of resources. In this case,
because task waiting queue is located in each resource, not
only the utilization of resources enhances and but the total
completion-time is decreased as well.
Two algorithms mentioned above are programs, which
are simple to implement. However, since factors such as
Int'l Conf. Grid Computing and Applications | GCA'08 | 57

either excessively time-consuming resources or unfeasible
resources from several reasons, extremely lengthy total
completion-time could arise frequently. To solve this
problem, WQR (Workqueue Replication) [3] algorithm is
suggested. WQR algorithm is similar to Workqueue in its
basic distribution method, but does not stop at distributing
tasks once. Until all tasks are completed, WQR algorithm
distributes incomplete tasks repeatedly within certain limit.
Therefore, it can secure stability from excessive load or fault
of certain resources. However, for users who utilize the same
scheduling strategy and use the grid system as well,
overhead could arise from using the same overlapping task
in a number of resources.
2 Simulation environment
WGridSP[4] - a tool for the performance evaluation
and comparison of algorithms, which employs GridSim (the
java-based simulation tool) as an engine - selects its target
randomly from the range of distribution limited within the
features of these resources and hence constitutes the grid.
The maximum load of a resource can be designated by
a user. The minimum load is 0%; the processing capacity
can be utilized 100 %. Also the weighting factor using time
sequence can be changed in each time period.
For simulation, the number of resources is assigned to
be 50, and the minimum load of each resource is chosen to
be 0 %. Also, the maximum load is authorized to shift from
10%, 30%, 50%, 70%, to 90%. Likewise, the reason for
comparing capacity of algorithms according to load is that
the load is considered to be the most critical factor in
turnaround time in the grid system. In case of the load of a
resource remaining excessively high, the resource is either
used in local system or a considerable number of tasks are
concentrated on the resource; sometimes, it can be viewed as
a temporarily unusable case. The load of each resource is
made to alter from minimum to maximum and the maximum
load is multiplied by the weighting factor using time
sequence, which will change the current load of each
resource. Also to prevent every resource from
simultaneously retaining the same load, the GMT based time
period of a resource is randomly assigned in uniform
distribution of [0, 23].
To analyze the efficacy of information used in each
algorithm, two types of simulation are performed. The first
simulation fixed CPU processing capacity to 300, and the
number of CPU to 1. The number expressing CPU
processing capacity means the number of instruction
processing in one second. For example, the task with the
length of 1200 can be processed in 4 seconds with the
resource with 1 CPU of 300 processing capacity. As the
other simulation arbitrarily selected the CPU processing
capacity and the number, each resource is made to retain
different CPU capacity and the number. The CPU
processing capacity is selected randomly within the uniform
distribution of [100, 500], and the number of CPU within the
uniform distribution of [1, 8].
The tasks composing application to be processed
consists of total 200, and the length of tasks is arbitrarily
chosen from the uniform distribution of [1,000,000,
5,000,000]. As a result, when the resource with 0% load is
assumed to be assigned, processing time of a single task
ranges from 2,000 seconds to 5,000 seconds. So as to ignore
the communication time used to distribute a resource to a
task and return the result, input and output data of each
resource is all set to 0. Every simulation is performed 10
times in the same condition and the arithmetic mean is used
as the total makespan.
3 Suggesting new algorithm
3.1 Points to improve for existing algorithm
According to the type of information and the
distribution of resources that are used in a grid scheduling,
the points to improve for existing algorithms are deduced.
Avoidance of excessive load or incapability resources
Inferred from the results from performance evaluation
of four algorithms, an increase in task completion-time when
the maximum load is over 70% is the smallest for WQR.
This advantage is mostly derived from a task duplication
strategy. The scheduling algorithm for the grid system
should include a strategy, which could evade resources that
are either of extremely low capacity or unusable status.
The exclusion of the utility of dynamic information
Min-Min algorithm, a type which utilizes real-time
dynamic information, showed the worst quality in resource
set where static information is equally applied. This defect is
attributed to time difference being unable to cope with the
change in usage rate of resources. In other words, dynamic
information, real time information of resources, seems to be
no help in task scheduling of a grid system. Also, when real
time information is renewed in distributing each task,
overhead additionally decreases the performance of an
algorithm. Therefore, unless there exists a device that can
constantly oversee dynamic information and cancel or
replace tasks on operation according to dynamic information,
the application of dynamic information should be restrained.
The application of static information
Unlike how WQR algorithm showed good capacity in
the grid system with resources with the same static
information, it showed worse performance than WQR
algorithm in the condition of maximum load being less than
70%, set by the system with multiprocessor. Ultimately, the
inability to detect the number of processors and the
processing capacity of resources including static information
leads to inefficient use of resources. Since it is unlikely for
the static information to alter when time passes, an active
application in a scheduling algorithm can help reduce the
completion time.
58 Int'l Conf. Grid Computing and Applications | GCA'08 |

3.2 New algorithm
In this paper, we have developed WQRuSI
(Workqueue-Replication using Static Information) that
includes three factors to improve the avoidance of excessive
load or incapability resources, the exclusion of the utility of
dynamic information such as real time load information, and
the application of unchanging static information.
To take account of three factors, each resource is
initially aligned in the order of CPU processing ability,
which is basic static information. When tasks are distributed,
the number of CPU retained by a resource should be the
number to be distributed. Because the basic allocation
strategy is based on repetitively assigning the same task to
more than two resources, WQR method that prevents
disorder or the slowing of a resource is applied. The detailed
logic of WQRuSI algorithm is described in [Figure 1].
Sort the available resources to descending order according to
processor capacity;
Duplicate all tasks which have the same number as
MaxReplication;
Save the duplicated tasks to TaskManager;
for i:=1 to ResourceList.size do
for j:=1 to ResourceList[i].PEList.size do
Take out a task from TaskManager under the condition
that a task is not allocated to the same resource;
Allocate the selected task to ResourceList[i];
if TaskManager is empty break all for;
end for
end for
while TaskManager is not empty do
Wait for the completed task from resources;
if completed task exists another resources then
Cancel the tasks;
Take out tasks as the same number of canceled tasks
from TaskManager under the condition that a task is
not allocated to the same resource;
Allocate the selected task to the canceled resource.;
end if
Take out a task from TaskManager under the condition
that a task is not allocated to the same resource;
Allocate the selected task to the previously returned
resource;
end while
Wait for the de-allocation of tasks;
[Figure 1] WQRuSI Algorithm using Static Information of
Grid Resources
3.3 Performance of the Algorithm
To evaluate the performance of the suggested algorithm,
WQRuSI algorithm went through simulation with WQR and
Min-Min algorithm that showed competence in two
situations. Simulation environment was set in the same way
as the usual setting for analysis. The results from the
analysis is shown in [Figure 2] and [Figure 3].
[Figure 2] Performance of WQRuSI-Consistent Static
Information
[Figure 3] Performance of WQRuSI-Variable Static
Information
In contrast to how WQRuSI algorithm showed a similar
performance with WQR in the setting that consists of
consistent static information, WQRuSI algorithm showed the
best performance in the environment where static
information for resources is selected randomly. When the
static information is set in the same way, the algorithm that
accounts for static information of resources did not show
much improvement. However, in the environment where the
number of processors and the processing ability is set in
various ways, the improvement in performance was clear
4 Conclusion
In this paper, we proposed the WQRuSI algorithm.
When it went through the simulation with the same
environment with preceding simulation, WQRuSI showed
similar performance with WQR in the status where static
information of resources is fixed. In contrast, when there
was variation in static information, WQRuSI demonstrated
× 1,000
× 1,000
Int'l Conf. Grid Computing and Applications | GCA'08 | 59

much improvement than ordinary algorithms. Because there
are diverse capacity of resources and the number of
processors in the actual grid setting, WQRuSI is expected to
contribute much to reducing the task completion-time.
5 References
[1] R. Buyya, "Economic-based distributed Resource
Management and Scheduling for Grid Computing", Ph. D,
Thesis, Monash University, Melbourne, Austrailia, 2002.
[2] N. Muthuvelu, J. Liu, N. L. Soe, S. Venugopal, A.
Sulistio and R. Buyya, "A Dynamic Job Grouping-Based
Scheduling for Deploying applications with Fine-Grained
Tasks on Global Grids", AusGrid2005, Vol.44, 2005.
[3] D. P. Silva, W. Cirne and F. V. Brasileiro, "Trading
Cycles for Informations: Using Replication to Scheduling
Bag-of-Tasks Applications on Computational Grids", in
Proc of Euro-Par 2003, pp.169~180, 2003.
[4] V. subramani, r. Ketimuthu, S. Srinivasan and P.
Sadayappan, "Distributed Job Scheduling on Computational
Grids using Multiple Simultaneous Requests", in Proc. of
11th IEEE Symposium on HPDC, pp. 359~366, 2002.
[5] O. H. Kang, S. S. Kang, "Web-based Dynamic
Scheduling Platform for Grid Computing“, IJCSNS
International Journal of Computer Science and Network
Security, VOL.6 No.5B, May 2006
[6] X. He, X. sun and G. Laszewski, "A Qos Guided Min-
Min Heuristic for Grid Task Scheduling", in J. of Computer
Science and Technology, Special Issue on Grid Computing,
vol. 18, No.4, pp. 442~451, July 2003.
[7] M. Wu, W. Shu and H. Zhang, "Segmented Min-Min:
A Static Mapping Algorithm for Meta-Tasks on
Heterogeneous Computing Systems", in Proc. of the 9th
HCW, pp. 375~385, 2000.
60 Int'l Conf. Grid Computing and Applications | GCA'08 |

e-Science Models and the Research Life Cycle
How will it affect the Philippine Community?
Junseok Hwang*
International Information Technology Policy
Program (ITPP)
Seoul National University
Seoul, South Korea
Emilie Sales Capellan*; Roy Rayel Consulta
*
International Information Technology Policy
Program (ITPP)
Seoul National University
Seoul, South Korea
{capellan, roycons2001}@tepp.snu.ac.kr
Abstract - In a digital information processes, the replica of
life cycle are shaping the method and the way the learners’
study. In a bigger system, part of the things that will be
represented in the life course is the Model, like the research
process, through a chain of sequentially interconnected
stages or phases in which information is manipulated or
produced. This paper presents and discusses methods and
ways in which the life cycle approach offers insight into the
relationships among the stages and activities in research,
especially in the field of technology evolution, like e-
Science. And this paper will also present an idea and
concept how this research life cycle in e-Science will affect
the Philippine community. An understanding of this
viewpoint may contribute further insight into the function of
e-science in the larger picture of methodical and scientific
research.
Keywords: e-Science, Life Cycle, Grid Computing,
Philippines
* Corresponding Authors
1 Introduction
Utilization of computers generates many challenges as it
expands and develops the field of the possible in methodical
and scientific research and many of these challenges are
usual to researchers in diverse areas. The insights achieved
in one area may catalyze change and accelerate discovery in
many others. It is absolutely true in the statement that it is no
longer possible to do science without doing computing [1].
Computing in the sciences and humanities has developed a
great deal over the past decades. The life cycle method turns
us to a more sensitive possible information loss in the gaps
between stages. The transition and the evolution points in the
life cycle are essential junctions for further important
activities in the research field, such as e-Science. Many
issues and streams of activity flow throughout the life cycle
of research, including project administration, grant
procurement, data management, knowledge creation, ethical
judgments, intellectual property supervision and technology
management as a way e-Science is being implemented.
Linking activities across stages requires harmonization and
coordination and a sense of continuity in the overall process
[2]. In the Philippines, the research undertaken in the
Sustainable Technologies Group of the De La Salle
University makes use of a highly interdisciplinary approach
to providing effective solutions to environmental problems
[3]. These problems require an intelligent, integrated
approach to yield solutions that are beneficial on a life cycle
basis. Also in the Philippines, it makes use of the life cycle
framework in most of the projects. Therefore, it makes use of
advanced computing techniques such as:
• Knowledge-based and rule-based decision support
systems
• Monte Carlo and fuzzy sets
• Pinch analysis
• Artificial neural networks
• Swarm intelligence
To be open and responsive to e-science, researchers
must evaluate and assess the services it provided for both
research outcomes and data. Given the stages of the life
cycle associated with e-science, it needs to determine the
services to be provided by research libraries and the
partnerships required to implement and sustain these
services. There is barely a scientist or scholar remaining who
does not use a computer for research purposes. There are
distinctive terms in use to point out the fields that are
particularly oriented to computing in specific disciplines. In
the instinctive and technical sciences, the term “e-Science”
has recently become popular, where the “e” of course stands
for “electronic” [4]. Science ever more done through
distributed and dispersed worldwide collaborations enabled
by the Internet, using very large data collections, tera-scale
computing resources and high performance visualization.
With the technology today, a very powerful
infrastructure is required to support and sustain e-Science.
The Grid is an architecture projected to produce all the
issues together and make a reality of such a vision for e-
Science. In the field of technology, such as Grid computing,
Int'l Conf. Grid Computing and Applications | GCA'08 | 61

architecture examines Grid technology as a standard and
generic integration mechanism assembled from Grid
Services (GS), which are an extension of Web Services (WS)
to comply with additional Grid requirements. The principal
extensions from WS to GS are the management of state,
identification, sessions and life cycles and the introduction of
a notification mechanism in conjunction with Grid service
data elements [5]. The e-Science term is intended to confine
an idea of the future for scientific research-based on
distributed resources especially data-gathering instruments
and group researches.
E-Science is scientific investigation performed through
distributed global collaborations between scientists and their
resources, and the computing infrastructure that enables this.
Scientific progress increasingly depends on pooling know-
how and results; making connections between ideas, people,
and data; and finding and interpreting knowledge generated
by strangers in new ways other than that intended at its time
of collection. E-Science offers a promising vision of how
computer and communication technology can support and
enhance the scientific process. It does this by enabling
scientists to generate, analyze, share and discuss their
insights, experiments and results in a more effective manner.
In the Philippines, as the technology evolved, the agency
called ASTI1 being mandated to conduct scientific research
and development in the advanced fields of Information and
Communications Technology and Microelectronics,
undertake projects committed to the development of its
people and country as a whole. ASTI has its project called
PSIGrid program, which will initiate the establishment of the
necessary infrastructure and community linkages to operate
throughout the country its grid facility. [6]. ASTI will
deploy a reliable and secure grid management system for
managing users, nodes and software to ensure the reliability
and security of the entire grid.
2 Life Cycle Model of Research
The information that will be presented in this section
consists of the variety of methods used in communicating
and coordinating research outcomes. The research outcomes
and data upon which these outcomes are based collectively
document the knowledge for an area of study. The life cycle
model helps monitor both the digital objects bound within a
stage and those objects that flow across stages. This is
represented above in the lightly shaded box around Data and
Research Outcomes [7]. Figure 1 show how the life cycle
model of research knowledge is being created.
1 Advanced Science and Technology Institute, R & D agency
forearm of Department of Science and Technology (DOST)
in the Philippines
Figure 1. Life cycle model of reseach knowledge Source: Humphrey, Charles; e-Science and the Life Cycle of
Research, IASSIST Communiqué, 2006
Every chevron in the above model symbolizes a stage in
the life cycle of research knowledge creation. The spaces
between chevrons indicate the transitions between stages.
These transitions tend to be vulnerable points in the
documentation of a project’s life cycle. When a stage is
completed, its information may not get systematically
preserved and instead end up dead-ended (most often on
someone’s hard drive.) Shifts in the responsibility for the
objects of research also tend to occur at these points of
transition. For example, the data collection stage passes
along completed interviews or questionnaires to the data
processing stage; the data processing stage passes one or
more clean data files to the data access and dissemination
stage. In each transition, someone else usually becomes
responsible for the outcomes of the previous stage. These
transition points become important areas in negotiating the
digital duration plan for a project as partners in the life cycle
of research identify who is responsible for the digital objects
created at each stage.
Now in e-Science, the knowledge life cycle can be
observed as a set of challenges as well as a sequence of
stages. Each stage has variously been seen as a blockage.
The attempt of acquiring knowledge was one bottleneck
recognized early [8]. But so too are modeling, retrieval,
reuse publication and maintenance. In this section, we
examine the nature of the challenges at each stage in the
knowledge life cycle and review the various methods and
techniques at our disposal. Although it is often suffer from a
deluge of data and too much information, all too often what
we have is still insufficient or too poorly specified to address
our problems, goals, and objectives. In short, we have
insufficient knowledge. Knowledge acquisition sets the
challenge of getting hold of the information that is around,
and turning it into knowledge by making it functional. This
might involve, for instance, making implied knowledge
explicit, identifying gaps in the knowledge already held,
acquiring and integrating knowledge from multiple sources
(e.g. different experts, or distributed sources on the Web), or
Study Concept
& Design
Data Collect
ion
Data Proces
sing
Data Access & Dissemin
ation
Analy
sis
Research
Outcomes
K
T
Cy
cle
Data
Data Discove
ry
Data Repurposing
62 Int'l Conf. Grid Computing and Applications | GCA'08 |

acquiring knowledge from unstructured media (e.g. natural
language or diagrams).
A variety of techniques and methods has been developed
ever since to facilitate knowledge acquisition. Much of this
work has been carried out in the context of attempts to build
knowledge-based or expert systems. Techniques include
varieties of interview, different forms of observation of
expert problem-solving, methods of building conceptual
maps with experts, various forms of document and text
analysis, and a range of machine learning methods [9]. Each
of these techniques has been found to be suited to the
elicitation of different forms of knowledge and to have
different consequences in terms of the effort required to
capture and model the knowledge [10, 11]. Specific software
tools have also been developed to support these various
techniques [12] and increasingly these are now Web enabled
[13]. However, the process of explicit knowledge acquisition
from human experts remains a costly and resource intensive
exercise. Hence, the increasing interests in methods that can
(semi-) automatically elicit and acquire knowledge that is
often implicit or else distributed on the Web [14].
A variety of information extraction tools and methods
are being applied to the huge body of textual documents that
are now available [15]. Another style of automated
acquisition consists of systems that observe user behavior
and assumed knowledge from that behavior. Examples
include recommender systems that might look at the papers
downloaded by a researcher and then detect themes by
analyzing the papers using methods such as term frequency
analysis [16]. The recommender system then searches other
literature sources and suggests papers that might be relevant
or else of interest to the user. Methods that can engage in the
sort of background knowledge acquisition described above
are still in their infancy but with the proven success of
pattern directed methods in areas such as data mining, they
are likely to assume a greater prominence in our attempts to
overcome the knowledge acquisition blockage.
3 Research trends – e-Science in a
transparency
The fascinating e-Science concept illustrates changes
that information technology is bringing to the methodology
of scientific research [17]. e-Science is a relatively new
expression that has become particularly accepted after the
launch of the major United Kingdom initiative [18].
e-Science describes the new approach to science involving
distributed global and international collaborations enabled
by the Internet and using very large data collections,
terascale computing resources and high-performance
visualizations. e-Science is about global collaboration in key
areas of science, and the next generation of infrastructure,
namely the Grid, that will enable it. Figure 2 summarizes the
e-Scientific method.
Fig. 2. Computational science and information technology
merge in e-Science
In a simplest manner, it can illustrate and characterize
the last decade as directing simulation and its integration
with science and engineering – this is computational science.
e-Science builds on this adding data from all sources with the
needed information technology to analyze and incorporate
the data into the simulations.
Fifty years ago, scientific performance has evolved to
reflect the growing power of communication and the
importance of collective wisdom in scientific discovery.
Originally scientists collaborated by sailing ships and carrier
pigeons. At the present aircraft, phone, e-mail and the Web
have greatly enhanced communication and therefore the
quality and real-time nature of scientific collaboration. The
cooperation can be both “real” and enabled electronically
[19,20] early influential work on the scientific collaboration.
e-Science and hence the Grid is the infrastructure that
enables collaborative science. The Grid can provide the
basic building blocks to support real-time distance
interaction, which has been exploited in distance education.
Particularly important is the infrastructure to support shared
resources – this includes many key services including
security, scheduling and management, registration and search
services and the message-based interfaces of Web services to
allow powerful sharing (collaboration) mechanisms. All of
the basic Grid services and infrastructure provide a critical
venue for collaboration and will be highly important to the
community.
In Philippine perspective, researchers created what they
say are the first generic system for Grid Computing that
utilizes an industry-standard Web service infrastructure. The
system, called Bayanihan Computing .NET [21] is a generic
Grid computing framework based on Microsoft .NET that
uses Web services to harness computing resources through
“volunteer” computing similar to projects such as
SETI@Home [22], and to make the computing resources
easily accessible through easy-to-use and interoperable
computational Web services. As mentioned in the preceding
section that ASTI agency from the Philippines is managing a
project called Philippine e-Science Grid Program (PSiGrid).
Int'l Conf. Grid Computing and Applications | GCA'08 | 63

This emerging computing model provides the ability to
perform higher throughput computing by taking advantage
of many networked computers to model a virtual computer
architecture that is able to distribute process execution
across a parallel infrastructure. The establishment and
planning of this PSiGrid is expected to foster collaboration
among local research groups as they share computing
resources to further their research efforts. This is also
expected to enable efficient utilization of local computing
resources.
4 e-Science Practical Model
Application
With the global advancement of technology, new
advances in networking and computing technology have
produced an explosive growth in networked applications and
information services. Applications are getting more complex,
heterogeneous and dynamic. In the recently concluded forum
regarding national e-Science development strategy, held on
August 24 at the Westin Chosun Seoul under the supervision
of KISTI and under the joint auspices of the Ministry of
Science and Technology (MOST) and the Korea e-Science
Forum, has reported significance of R&D activity changing
into e-Science system.
The necessity of national e-Science is becoming more &
more important because of its new research method which
challenges huge applications and research in limited
environments, improvement in research productivity which
enables us to utilize research resource at remote places and
collaborate between researchers, education learning trait
which enables diverse learning equipment's utilization with
networked studying environment, and finally economic
development's new growth engine with cutting-edge
technology innovation. [23]
One major impact that it had made contributed was on
the medical field, for instance on reduction on the period for
drug development; enabling global research projects in
fields of aerospace development, nuclear fusion research,
tsunami and SARS prevention; boosting national science
technology competitiveness by developing a new
methodology model in which IT and science technologies are
converged by securing convergence research's core
technology and cooperation and collaboration among
nations, regions and fields in that the researchers can have
access to cutting edge equipment, data and research
manpower. By means of cutting-edge technology
innovation, this national e-Science can serve as a new growth
engine of economic development, provoking astronomical
economic ripple effect.
Aside from the R&D applications, e-Science has also
proven its importance by its introduction to classroom. In
UK, a pilot project has begun to explore the potential
benefits of collecting and sharing scientific data within and
across schools and closer collaborations between schools and
research scientists with a view to running a national project
involving multiple schools. [24 ]. This pilot project has
begun to reveal the educational potential through the
collaboration of teachers and students, in a way they input,
manipulate their collected data and share this Grid-like
technologies, such activities can provide and a larger scale
project would have the potential to begin to feed schools-
sampled local pollution data into a more significant GRID-
based data set which scientists could use to build up a picture
of pollution levels across the country.
Another major contribution that UK, being the first
country to develop a national e-Science Grid, developed was
used in the diagnosis and treatment of breast cancer as in one
of the pilot projects, they developed a digital mammographic
archive together with an intelligent medical decision support
system which an individual hospital without supercomputing
facilities could access through the use of grid. This project
is called e-DiaMoND and Integrative Biology. [25 ]
In Australia, they have introduced the world’s first
degrees in e-Science. Two Australian computer science
departments namely Australian National University and
RMIT have worked together, established a program called
“Science Lectureships Initiative” designed to foster linkages
between academia and industry with the idea of attracting
students into science-related areas which would then benefit
emerging industries. [ 26] At RMIT, the eScience Graduate
Diploma started with only 10 students in the first year, but
thereafter struggled to gain enough extra students to become
self sustaining as a separate program while at ANU there was
a large influx of overseas students particularly from Indian
subcontinent and from East Asia. With these initiatives, this
can provide guidance and attract other universities to set up
similar education programs.
5 Definition and Relevance of
e-Science in the Philippine
Perspective
As noted by many different studies and researches that
been done by the different authors in all parts of the world,
we can say that e-Science have its own role, function, and
relevance in this modern society. Many developed countries
have gone far in this field. However in the Philippines, it is
just on the introduction phase. Thus, e-Science could be
defined as a solution that can guarantee the Philippines,
through international collaboration, improve its
technological innovation in researches and discoveries within
the applied technological approach.
This paper serves as the driving force in addressing the
issue on three most important application of ICT which is
education, health and governance. With its direct
connectivity to a number of international research and
64 Int'l Conf. Grid Computing and Applications | GCA'08 |
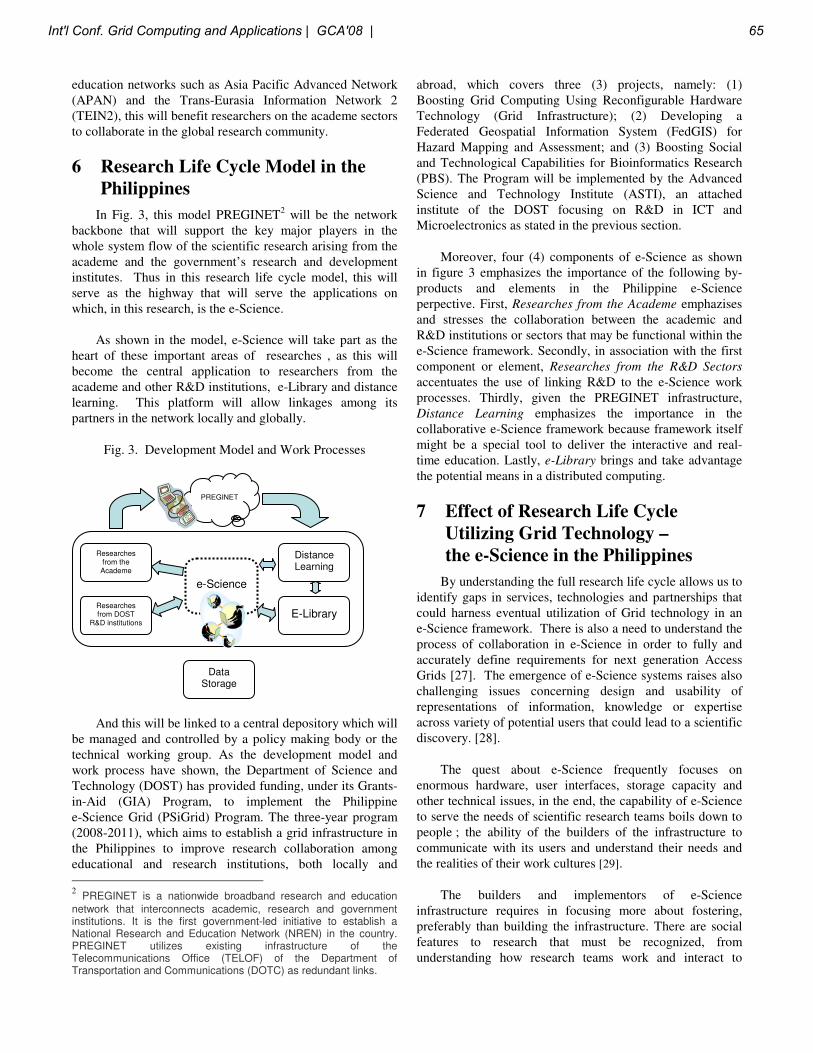
education networks such as Asia Pacific Advanced Network
(APAN) and the Trans-Eurasia Information Network 2
(TEIN2), this will benefit researchers on the academe sectors
to collaborate in the global research community.
6 Research Life Cycle Model in the
Philippines
In Fig. 3, this model PREGINET2 will be the network
backbone that will support the key major players in the
whole system flow of the scientific research arising from the
academe and the government’s research and development
institutes. Thus in this research life cycle model, this will
serve as the highway that will serve the applications on
which, in this research, is the e-Science.
As shown in the model, e-Science will take part as the
heart of these important areas of researches , as this will
become the central application to researchers from the
academe and other R&D institutions, e-Library and distance
learning. This platform will allow linkages among its
partners in the network locally and globally.
Fig. 3. Development Model and Work Processes
And this will be linked to a central depository which will
be managed and controlled by a policy making body or the
technical working group. As the development model and
work process have shown, the Department of Science and
Technology (DOST) has provided funding, under its Grants-
in-Aid (GIA) Program, to implement the Philippine
e-Science Grid (PSiGrid) Program. The three-year program
(2008-2011), which aims to establish a grid infrastructure in
the Philippines to improve research collaboration among
educational and research institutions, both locally and
2 PREGINET is a nationwide broadband research and education
network that interconnects academic, research and government institutions. It is the first government-led initiative to establish a National Research and Education Network (NREN) in the country. PREGINET utilizes existing infrastructure of the Telecommunications Office (TELOF) of the Department of Transportation and Communications (DOTC) as redundant links.
abroad, which covers three (3) projects, namely: (1)
Boosting Grid Computing Using Reconfigurable Hardware
Technology (Grid Infrastructure); (2) Developing a
Federated Geospatial Information System (FedGIS) for
Hazard Mapping and Assessment; and (3) Boosting Social
and Technological Capabilities for Bioinformatics Research
(PBS). The Program will be implemented by the Advanced
Science and Technology Institute (ASTI), an attached
institute of the DOST focusing on R&D in ICT and
Microelectronics as stated in the previous section.
Moreover, four (4) components of e-Science as shown
in figure 3 emphasizes the importance of the following by-
products and elements in the Philippine e-Science
perpective. First, Researches from the Academe emphazises
and stresses the collaboration between the academic and
R&D institutions or sectors that may be functional within the
e-Science framework. Secondly, in association with the first
component or element, Researches from the R&D Sectors
accentuates the use of linking R&D to the e-Science work
processes. Thirdly, given the PREGINET infrastructure,
Distance Learning emphasizes the importance in the
collaborative e-Science framework because framework itself
might be a special tool to deliver the interactive and real-
time education. Lastly, e-Library brings and take advantage
the potential means in a distributed computing.
7 Effect of Research Life Cycle
Utilizing Grid Technology –
the e-Science in the Philippines
By understanding the full research life cycle allows us to
identify gaps in services, technologies and partnerships that
could harness eventual utilization of Grid technology in an
e-Science framework. There is also a need to understand the
process of collaboration in e-Science in order to fully and
accurately define requirements for next generation Access
Grids [27]. The emergence of e-Science systems raises also
challenging issues concerning design and usability of
representations of information, knowledge or expertise
across variety of potential users that could lead to a scientific
discovery. [28].
The quest about e-Science frequently focuses on
enormous hardware, user interfaces, storage capacity and
other technical issues, in the end, the capability of e-Science
to serve the needs of scientific research teams boils down to
people ; the ability of the builders of the infrastructure to
communicate with its users and understand their needs and
the realities of their work cultures [29].
The builders and implementors of e-Science
infrastructure requires in focusing more about fostering,
preferably than building the infrastructure. There are social
features to research that must be recognized, from
understanding how research teams work and interact to
Researches from DOST
R&D institutions
Researches from the Academe
Distance Learning
E-Library
Data Storage
e-Science
e-
PREGINET
Int'l Conf. Grid Computing and Applications | GCA'08 | 65
realizing that research often does not involve the kinds of
large, interdisciplinary projects engaged in by virtual
organizations, but rather individual work and unplanned or
ad-hoc, flexible forms of collaboration within wider
communities.
The grid is transforming science, business which in
effect, e-Science research, business and commerce will
significantly benefit from grid based technologies which will
potential increase abilities, efficiency and effectiveness
through leading edge technology applications and solving
large scientific and business computing problems. Although
on the part of socio-economic aspects, this will demand
investigation to address issues such as ethics, privacy,
liability, risk and responsibility for future public policies. In
addition, for the envisaged new forms of business models,
economic and legal issues are also at stake which will require
interdisciplinary research.
In the long run, the lasting and permanent effects of
high-speed networks, data stores, computing systems, sensor
networks, and collaborative technologies that make e-
Science possible will be up to the people who create it and
use it.
For e-science projects like PSiGrid program in the
Philippines, the majority (if not all) of the funding is from
government sources of all types. For this cooperation to be
sustainable, however, especially in commercial or
government settings, participants need to have an economic
incentive. Thus, as it is stated in the preceding sections,
PSIGrid aims to establish a grid infrastructure in the
Philippines that will be needed to maximize and improve the
potential of research collaboration among educational and
research institutions, both locally and abroad. For this start
and with the promising vision that e-Science have, there is a
great chance for the PSiGrid program to also participate on
the global world and thus come up with technologies that
would be beneficial to its citizens.
8 Conclusion
To conclude, given the above viewpoints on lifecycle
and e-Science models, there have been important changes
how technology especially on scientific researches can be
successfully managed.
The trend in technology goes towards increasingly
global collaborations for scientific research. In every
country that initiated implementing its vision for e-Science, it
can be seen that each had its own strategy to face the
challenges not only with regards to technical issues such as
dependability, interoperability, resource management, etc.
but also more on people-centric relating to its collaboration
and sharing of its resources and data. For example in the
case of United Kingdom (UK), they had established nine
e-Science centers and eight other regional centers covering
most of UK which primarily aimed to allocate substantial
computing and data resources and run standard set of Grid
middleware to form the basis for the construction of UK
Grid testbed, to generate portfolio industrial Grid
middleware and tools and lastly to disseminate information
and experience of Grid. [30]
The ideas presented on this paper on both the e-Science
models and lifecycle approach will have impact in giving
insights, directions and encouragement for policy makers
along with valuable contribution to serving the Filipino
people especially those scientists and researchers in coming
up with technological breakthrough. To further the studies
and research, evaluation of the life cycle that co-exist in the
Global trends and in the Philippine perpective, e-Science
tools must be more intuitive for the biomedical community
not only use them in a collaborative R&D.
7 References
[1] The 2007 Microsoft e-Science Workshop at RENCI,
https://www.mses07.net/main.aspx
[2] Conceptualizing the Digital Life Cycle,
http://iassistblog.org/?p=26
[3] Sustainable Technologies Research Group,
http://www.dlsu.edu.ph/research/centers/cesdr/strg.asp
[4] Boonstra, O; Breure, L; Doorn, P; Past, Present and
Future of Historical Information Science, Netherlands
Institute for Scientific Information Royal Netherlands
Academy of Arts and Sciences, 2004.
[5] Berman, F; Hey, A. J. G; Fox, G. C; Grid Computing –
Making the Global Infrastructure a Reality, Wiley
Series of Communications Networking & Distributed
Systems, 2003
[6] http://www.psigrid.gov.ph/index.php
[7] Humphrey, Charles; e-Science and the Life Cycle of
Research, IASSIST Communiqué, 2006
[8] Hayes-Roth, F.; Waterman, D. A; Lenat, D. B; Building
Expert Systems, Reading, Addison-Wesley, 1983
[9] Shadbolt, N. R; Burton, M, Knowledge elicitation: A
systematic approach, in evaluation of human work, and
Wilson, J. R; Corlett, E. N. (eds) A Practical
Ergonomics Methodology, London, UK: Taylor &
Francis, 1995
[10] Hoffman, R.; Shadbolt, N. R.; Burton, A. M; Klein, G.,
Eliciting knowledge from experts: A methodological
66 Int'l Conf. Grid Computing and Applications | GCA'08 |

analysis. Organizational Behavior and Decision
Processes, 1995
[11] Shadbolt, N. R.; O’Hara, K.; Crow, L., The
experimental evaluation of knowledge acquisition
techniques and methods: history, problems and new
directions, International Journal of Human Computer
Studies, 1999
[12] Milton, N.; Shadbolt, N.; Cottam, H.; Hammersley, M.;
Towards a knowledge technology for knowledge
management. International Journal of Human Computer
Studies, 1999
[13] Shaw, M. L. G.; Gaines, B. R., WebGrid-II: Developing
hierarchical knowledge structures from flat grids.
Proceedings of the 11th Knowledge Acquisition
Workshop (KAW ’98), 1998 Banff, Canada, April,
1998, http://repgrid.com/reports/KBS/WG/.
[14] Crow, L.; Shadbolt, N. R., Extracting focused
knowledge from the semantic web. International Journal
of Human Computer Studies, 2001
[15] Ciravegna, F.; Adaptive information extraction from text
by rule induction and generalization, Proceedings of
17th International Joint Conference on Artificial
Intelligence (IJCAI2001), Seattle, 2001
[16] Middleton, S. E.; De Roure, D.; Shadbolt, N. R.,
Capturing knowledge of user preferences: Ontologies in
recommender systems, Proceedings of the First
International Conference on Knowledge Capture, K-
CAP2001. New York: ACM Press, 2001
[17] Fox, G; e-Science meets computational science and
information technology. Computing in Science and
Engineering, 2002,
http://www.computer.org/cise/cs2002/c4toc.htm.
[18] Taylor, J. M. and e-Science, http://www.e-
science.clrc.ac.uk and http://www.escience-grid.org.uk/
[19] W. Wulf; The National Collaboratory – A White Paper
in Towards a National Collaboratory, Unpublished
report of a NSF workshop, Rockefeller University, New
York, 1989
[20] Kouzes, R. T.; Myers, J. D.; Wulf, W. A.;
Collaboratories: Doing science on the Internet, IEEE
Computer August 1996, IEEE Fifth Workshops on
Enabling Technology: Infrastructure for Collaborative
Enterprises (WET ICE ’96), 1996,
http://www.emsl.pnl.gov:2080/docs/collab/presentations
/papers/IEEECollaboratories.html.
[21] Sarmenta, L. F. G; Bayanihan Computing .NET: Grid
Computing with XML Web Services, 2002,
http://bayanihancomputing.net/
[22] Search for Extraterrestrial Intelligence,
http://setiathome.berkeley.edu/sah_about.php
[23] Survival Strategy for Securing International
Competitiveness, Korea IT Times, 2007
[24] Ella Tallyn, et.al. Introducing e-Science to the
Classroom,
http://www.equator.ac.uk/var/uploads/Ella2004.pdf
[25] Prof. Iversen, Oxford University e-Science Open Day,
2004
[26] Henry Gardner, et. al, eScience curricula at two
Australian universities, Australian National University
and RMIT, Melbourne, Australia, 2004
[27] David De Roure, et. al; A Future e-Science
Infrastructure, 2001
[28] Usability Research Challenges in e-Science, UK e-
Science Usability Task Force
[29]Voss, Alex; Features: e-Science It’s Really About
People, HPCWire – High Productivity Computing
website, RENCI, 2007
[30] Tony Hey and Anne E. Trefethen, The UK e-Science
Core Programme and the Grid, ICCS, Springer-Verlag
Berlin Heidelberg, 2002
Int'l Conf. Grid Computing and Applications | GCA'08 | 67
An Agent-based Service Discovery Algorithm Using Agent Directors for Grid Computing
Leila Khatibzadeh1, Hossein Deldari2 1Computer Department, Azad University, Mashhad, Iran
2Computer Department, Ferdowsi University, Mashhad, Iran
Abstract - Grid computing has emerged as a viable method to solve computational and data-intensive problems which are executable in various domains from business computing to scientific research. However, grid environments are largely heterogeneous, distributed and dynamic, all of which increase the complexities involved in developing grid applications. Several software has been developed to provide programming environments hiding these complexities and also simplifying grid application development. Since agent technologies are more than a ten-year study and also because of the flexibility and the complexity of the grid software infrastructure, multi-agent systems are one of the ways to overcome the challenges in the grid development. In this paper, we have considered the needs for programs running in grid, so a three-layer agent-based parallel programming model for grid computing is presented. This model is based on interactions among the agents and we have also implemented a service discovery algorithm for the application layer. To support agent-based programs we have extended GridSim toolkit and implemented our model in it.
Keywords: Agents, Grid, Java, Parallel Programming, Service Discovery Algorithm
1 Introduction Grid applications are the next-generation network
applications for solving the world’s computational and data-intensive problems. Grid applications support the integrated and secure use of a variety of shared and distributed resources, such as high-performance computers, workstations, data repositories, instruments, etc. The heterogeneous and dynamic nature of the grid requires its applications’ high performance and also needs to be robust and fault-tolerant [1]. Grid applications run on different types of resources whose configurations may change during run-time. These dynamic configurations could be motivated by changes in the environment, e.g., performance changes, hardware failures, or the need to flexibly compose virtual organizations from available grid resources [2]. Grids are also used for large-scale, high-performance computing. High performance requires a balance of computation and communication among all resources involved. Currently this
is achieved through managing computation, communication and data locality by using message-passing or remote method invocation [3]. Designing and implementing applications that possess such features is often difficult from the ground up. As such, several programming models have been presented.
In this paper, we have proposed a new programming model for Grid. Numerous research projects have already introduced class libraries or language extensions for Java to enable parallel and distributed high-level programming. There are many advantages of using Java for Grid Computing including portability, easy deployment of Java’s bytecode, component architecture provided through JavaBeans, a wide variety of class libraries that include additional functionality such as secure socket communication or complex message passing. Because of these, Java has been chosen for this model. As agent technology will be of great help in pervasive computing, Multi-Agent systems in aforementioned environments pose important challenges, thus, the use of agents has become a necessity. In agent-based software engineering, programs are written as software agents communicating with each other by exchanging messages through a communication language [4]. How the agents communicate with each other differs in each method. In this paper, a three-layer agent-based model is presented based on interactions between the agents and a service discovery algorithm is implemented in this model.
The rest of the paper is organized as follows: In Section 2, a brief review of related works on programming models in Grid and a review of service discovery algorithms are given. Section 3 presents the proposed three-layer agent-based parallel programming model in details. The model in which the service discovery algorithm has been presented is shown. Simulation results are presented in Section 4. Finally, the paper is concluded in Section 5.
2 Related works There are different kinds of programming models, each
of which have been implemented in different environments. The summary of these programming models are briefly explained below.
68 Int'l Conf. Grid Computing and Applications | GCA'08 |

Superscalar is a common concept in parallel computing [5]. Sequential applications composed of the tasks of a certain granularity are automatically converted into a parallel application. There the tasks are executed in different servers of a computational Grid.
MPICH-G2 is a Grid-enabled implementation of the Message Passing Interface (MPI) [6]. MPI defines standard functions for communication between processes and groups of processes. Using the Globus Toolkit, MPICH-G2 provides extensions to MPICH. This gives users familiar with MPI an easy way of Grid enabling their MPI applications. The following services are provided by the MPICH-G2 system: co-allocation, security, executable staging and results collection, communication and monitoring [5].
Grid–enabled RPC is a Remote Procedure Call (RPC) model and an API for Grids [5]. Besides providing standard RPC semantics, it offers a convenient, high-level abstraction whereby many interactions with a Grid environment can be hidden. GridRPC seeks to combine the standard RPC programming model with asynchronous course-grained parallel tasking.
Gridbus Broker is a software resource that transparently permits users access to heterogeneous Grid resources [5]. The Gridbus Broker Application Program Interface (API) provides a straightforward means to users to Grid-enable their applications with minimal extra programming. Implemented in Java, the Gridbus Broker provides a variety of services including resource discovery, transparent access to computational resources, job scheduling and job monitoring. The Gridbus broker transforms user requirements into a set of jobs that are scheduled on the appropriate resources. It manages them and collects the results.
ProActive is a Java-based library that provides an API for the creation, execution and management of distributed active objects [7]. Proactive is composed of only standard Java classes and requires no changes to the Java Virtual Machine (JVM). This allows Grid applications to be developed using standard Java code. In addition, ProActive features group communication, object-oriented Single Program Multiple Data (OO SPMD), distributed and hierarchical components, security, fault tolerance, a peer-to-peer infrastructure, a graphical user interface and a powerful XML-based deployment model.
Alchemi is a Microsoft .NET Grid computing framework, consisting of service-oriented middleware and an application program interface (API) [8,9]. Alchemi features a simple and familiar multithreaded programming model. Alchemi is based on the master-worker parallel programming paradigm and implements the concept of Grid threads.
Grid Thread Programming Environment (GTPE) is a programming environment, implemented in Java, utilizing the Gridbus Broker API [1]. GTPE further abstracts the task of Grid application development and automates Grid management while providing a finer level of logical program control through the use of distributed threads. The GTPE is architected with the following primary design objectives: usability and portability, flexibility, performance, fault tolerance and security. GTPE provides additional functionality to minimize the effort necessary to work with grid threads [1].
Open Grid Services Architecture (OGSA) is an ongoing project that aims to enable interoperability among heterogeneous resources by aligning Grid technologies with established Web services technology [5]. The concept of a Grid service is likened to a Web service that provides a set of well-defined interfaces that follow specific conventions. These Grid services can be composed into more sophisticated services to meet the needs of users. The OGSA is an architecture specification defining the semantics and mechanisms governing the creation, access, use, maintenance and destruction of Grid services. The following specifications are provided: Grid service instances, upgradability and communication, service discovery, notification, service lifetime management and higher level capabilities.
Dynamic service discovery is not a new issue. There are several solutions proposed for fixed networks, all with different levels of acceptance [10]. We will now briefly review some of them: SLP, Jini, Salutation and UPnP’s SSDP.
The Service Location Protocol (SLP) is an Internet Engineering Task Force standard for enabling IP network-based applications to automatically discover the location of a required service [11]. The SLP defines three “agents”, User Agents (UA) that perform service discovery on behalf of client software, Service Agents (SA) that advertise the location and attributes on behalf of services, and Directory Agents (DA) that store information about the services announced in the network. SLP has two different modes of operation. When a DA is present, it collects all service information advertised by SAs. The UAs unicast their requests to the DA, and when there is no DA, the UAs repeatedly multicast these requests. SAs listen to these multicast requests and unicast their responses to the UAs [10].
Jini is a technology developed by Sun Microsystems [12]. Its goal is to enable truly distributed computing by representing hardware and software as Java objects that can adapt themselves to communities and allow objects to access services on a network in a flexible way. Similar to the Directory Agent in SLP, service discovery in Jini is
Int'l Conf. Grid Computing and Applications | GCA'08 | 69

based on a directory service, named the Jini Lookup Service (JLS). As Jini allows clients to always discover services, JLS is necessary for its functioning.
Salutation is an architecture for searching, discovering, and accessing services and information [13]. Its goal is to solve the problems of service discovery and utilization among a broad set of applications and equipment in an environment of widespread connectivity and mobility. Salutation architecture defines an entity called the Salutation Manager (SLM). This functions as a directory of applications, services and devices, generically called Networked Entities. The SLM allows networked entities to discover and use the capabilities of other networked entities [10].
Simple Service Discovery Protocol (SSDP) was created as a lightweight discovery protocol for the Universal Plug-and-Play (UPnP) initiative [14]. It defines a minimal protocol for multicast-based discovery. SSDP can work with or without its central directory service, called the Service Directory. When a service intends to join the network, it first sends an announcement message to notify its presence to the rest of the devices. This announcement may be sent by multicast, so that all other devices will see it, and the Service Directory, if present, will record the announcement. Alternatively, the announcement may be sent by unicast directly to the Service Directory. When a client wishes to discover a service, it may ask the Service Directory about it or it may send a multicast message asking for it [10].
In this paper, according to the models presented, we have integrated the benefits of message passing through explicit communication. In addition, we have made use of the Java-based model because of the similarity of portability to that of the distributed object method. Agents that act like distributed threads were also utilized. Playing the role of the third layer of this model, the service discovery algorithm was also implemented.
3 The three-layer agent-based parallel programming model
In this section, a three-layer agent-based parallel programming model for grid is presented and the communications among agents classified into three layers:
The lower level is the transfer layer which defines the way of passing messages among agents. In this layer, the sending and receiving of messages among agents are based on the UDP protocol. A port number is assigned to each agent which, in turn, sends and receives messages.
The middle level is the communication layer which defines the manner of communicating among agents. There are different communication methods.
Direct communication, such as contract-net and specification sharing, has some disadvantages [4]. One of the problems with this form of communication is the cost. If the agent community is as large as grid, then the overhead in broadcasting messages among agents is quite high. Another problem is the complexity of implementation. Therefore, an indirect communication method using Agent Directors (ADs) has been considered. An AD is a manager agent which directs inter-communication among its own agents as well as communication between these agents and other agents through other ADs. Figure 1 shows the scheme of this communication. Message passing and transfer rate are reduced in this model. Depending on the agent’s behavior (requester/replier), two AMS (Agent Management System) are considered in each AD. In each AMS, there is information about other agents and their ADs which directs the request to the desired AD as necessary. As for the two AMS, time spent seeking in the agent platform decreases.
Based on the AD’s needs and the type of request, the AD’s table of information on other agents in other ADs is updated in order to produce a proper decision. This update reduces the amount of transactions among ADs.
Figure 1. The scheme of communication among agents in the presented model
The following parameters are considered for each AMS when being stored in the AMS table:
• AID: Is a unique name for each agent which is composed of an ID of the name of the machine where the agent was created.
AD
agent agentagentagent
agent
agent
AD
AD AD
AD
agent agent
agent
agent
agent
agent agent
agent agent
agent
70 Int'l Conf. Grid Computing and Applications | GCA'08 |

• State: Shows the state of the agent. Three states are possible in our model:
I. Active State: When the agent is fully initiated and ready to use.
II. Waiting State: When the agent is blocked and waiting for a reply from other agents.
III. Dead State: When the agent has completed its job. In this state, information about this agent is removed from AMS.
• Address: Shows the location of an agent. If an agent has migrated to other machines, this is announced to the AD.
• AD name: Shows the name of the AD associated with the agent. This parameter is essential as communication among agents is performed through ADs.
• Message: Shows the message sent from an agent to the AD. According to the agent’s behavior, different kinds of messages are generated. The content of the message shows the interaction that is formed between the AD and the agent. Based on FIPA [15], we have considered ACL (Agent Communication Language) with some revisions. Below is the list of the different message types:
If the agent acts as a requester, then the content of the message, based on the program running on grid, explains the content of the request, e.g., a required service in the service discovery algorithm.
As the agent is created, the message content includes the agent’s specifications for registering in AMS.
If the agent acts as a replier, the message content, based on the program which is running on grid, explains the content of the reply for that request.
When the job that is related to the agent is completed, the message content informs AD to remove this record from AMS.
While a program is running, if an error occurs, the message content informs AD.
We have considered a history table which keeps information about agents which have completed their jobs. The jobs done through AD are reported to the user.
In this model, AD decides to send the request to its own agents or to other agents in other platforms. This decision is made according to the information that is stored in the replier AMS and the condition of agents.
The higher level is the user application layer, which defines the application running through software agents. The application used in this model for testing is a service discovery algorithm. The algorithm
implemented is based on SLP and Jini. We have considered three kinds of agents similar to those of SLP:
1- User Agents (UA) that run service discovery on behalf of client software.
2- Service Agents (SA) that announce location and attributes on behalf of services. In the implemented algorithm, each SA may have different kinds of services. The creation and termination of services are dynamic and the list of services that each SA owns dynamically changes. The root of action of SAs in our model is similar to that of process groups in MPI.
Directory Agents (DA) that store information about services informed in the network are similar to JLS in Jini. In this model, each AD contains one DA. Because the structure of ADs includes histories of the processes that each agent performs, this model is effective for algorithms such as the service discovery. With two different histories implemented for each AD, the way of searching services in grid has been facilitated.
4 Simulation Results This model has been implemented in Java by using the
GridSim toolkit [16]. We extended the GridSim toolkit to implement agent-based programs with this simulator. The gridsim.agent package has also been added, and three different models have been implemented. The three-layer agent-based parallel programming model presented in this paper has been compared with these models through a service discovery algorithm.
The first model involves message passing among nodes that form the service discovery algorithm. The second, called Blackboard, is a simple model for communication among agents [4]. In this communication model, information is made available to all agents in the system through an agent named “Blackboard”. The Blackboard agent acts like a central server. The third model is our own and was fully explained in Section 3.
In order to evaluate our model, we measured the number of messages which were sent by agents until the time all user agents obtained their services. Three different methods were considered for this algorithm:
1- Message passing: In this method, there is no difference between the types of agents. All agents act like nodes in the message passing method.
2- Blackboard: In this method, the Blackboard agent acts like a Directory Agent.
3- Agent Director: In this method, each AD acts like a DA.
Int'l Conf. Grid Computing and Applications | GCA'08 | 71

Figure 2. The comparison of the average number of messages received by agents
In Figure 2, the vertical axis represents the average number of messages and the horizontal axis represents the number of agents. In the first method, the number of agents means the number of nodes. In the other methods, the number of agents is the sum of the three types of agents earlier explained.
Figure 3. Cost Vs. Number of Agents
The results show that the average number of messages increase as the number of agents increase. This is quite obvious, because as the number of agents increase, the communication among agents also increases.
It is observed from Figure 3 that if the number of agents (nodes in message passing) exceeds 40, the cost of the communication in message passing implementation rises suddenly. As the number of nodes increases, the number of messages performing service discovery grows, along with the cost of communication. In other words, due to the lack of a database which could store the specifications of nodes having services, the cost of message passing rises suddenly when the number of agents exceeds 40. However, AD performs better than Blackboard. We estimate the cost of each method as follows:
- In message passing, the cost is estimated to be between 10 and 100.
- In Blackboard, the cost between agents and the Blackboard agent is estimated to be between 10 and 50.
- In AD, because of the two existing types of communications, two different costs were calculated. One is for ADs and is estimated to be between 50 and 100. The other is between AD and agents, which is estimated to be between 10 and 20.
These estimations are derived according to the method’s actions.
Figure 4. Time for different service discovery algorithms Vs. number of agents
It is obvious from Figure 4 that with an increase in the number of agents, execution time also increases. Due to the agent-based nature of Blackboard and AD, the time in which all user agents reach their services is shorter.
5 Conclusion and Future Work In this paper, we have studied different programming models that had been previously presented for grid. Because of the Java advantages for Grid Computing, among others, portability, easy deployment of Java’s bytecode, component architecture and a wide variety of class libraries, it has been chosen in this research. As agent technology is very effective in pervasive computing, the use of Multi-Agent systems in pervasive environments poses great challenges, thus, making the use of agents a necessity. In agent-based software engineering, programs are written as software agents that communicate with each other by exchanging messages through a communication language. How the agents communicate with each other differs in each method. In this paper a three layer agent-based programming model has been presented that is based on
72 Int'l Conf. Grid Computing and Applications | GCA'08 |

interactions among agents. We have integrated the benefits of message passing through explicit communication and made use of a Java-based model because its portability is similar to that of the distributed object method. In addition, agents acting like distributed threads were utilized and so formed a three-layered programming model for Grid based on agents. We have extended the GridSim toolkit simulator and added the gridsim.agent package for agent-based parallel programming. A service discovery algorithm has been implemented as the third layer of the model. Using our model, measured parameters, such as the number of messages, cost and execution time, resulted in a better operation compared to that of the other methods.
6 References [1] H. Soh, S. Haque,W. Liao, K. Nadiminti, and R. Buyya, “GTPE: A Thread Programming Environment for the Grid”, Proceedings of the 13th International Conference on Advanced Computing and Communications, Coimbatore, India, 2005
[2] I. Foster, C. Kesselman, and S. Tuecke. “The anatomy of the grid: Enabling scalable virtual organizations”. Intl. J. Supercomputer Applications, 2001.
[3] D. Talia, C. Lee, “Grid Programming Models: Current Tools, Issues and Directions”, Grid Computing, G. F. Fran Berman, Tony Hey, Ed., pp. 555–578, Wiley Press, USA, 2003.
[4] C. F. Ngolah, “A tutorial on agent communication and knowledge sharing”, University of Calgary, SENG609.22 Agent-based software engineering, 2003.
[5] H. Soh, S. Haque, W. Liao and R. Buyya, “Grid programming models and environments”, In: Advanced Parallel and Distributed Computing ISBN 1-60021-202-6
[6] N. T. Karonis, B. Toonen, and I. Foster, “MPICH-G2: A Grid-Enabled Implementation of the Message Passing Interface”, Journal of Parallel and Distrbuted Computing (JPDC), vol. 63, pp. 551-563, 2002.
[7] ProactiveTeam, “Proactive Manual REVISED 2.2”, Proactive, INRIA April 2005.
[8] A. Luther, R. Buyya, R. Ranjan, and S. Venugopal, “Alchemi: A .NET-Based Enterprise Grid Computing System”, Proceedings of the 6th International Conference on Internet Computing (ICOMP’05), June 27-30, 2005, Las Vegas, USA.
[9] A. Luther, R. Buyya, R. Ranjan, and S. Venugopal, “Peer-to-Peer Grid Computing and a .NET-based Alchemi Framework”, High Performance Computing: Paradigm and Infrastructure, L. Y. a. M. Guo, Ed.: Wiley Press, 2005.
[10] Celeste Campo, “Service Discovery in Pervasive MultiAgent Systems”, pdp_aamas2002, Workshop on Ubiquitous Agents on embedded, wearable, and mobile devices 2002 Bolonia, Italy.
[11] IETF Network Working Group. “Service Location Protocol”, 1997.
[12] S. Microsystems. “Jini architectural overview”. White paper. Technical report, 1999.
[13] I. Salutation Consortium. “Salutation architecture overview”. Technical report, 1998.
[14] Y. Y. Goland, T. Cai, P. Leach, and Y. Gu. “Simple service discovery protocol/1.0”. Technical report, 1999.
[15] http://www.fipa.org/
[16] R. Buyya, and M. Murshed, GridSim: “A Toolkit for the Modeling, and Simulation of Distributed Resource Management, and Scheduling for Grid Computing”, The Journal of Concurrency, and Computation: Practice, and Experience (CCPE), Volume 14, Issue 13-15, Pages: 1175-1220, Wiley Press, USA, November - December 2002.
Int'l Conf. Grid Computing and Applications | GCA'08 | 73

Optimization of Job Super Scheduler Architecture in Computational Grid
Environments M. Shiraz.+
M. A. Ansari*. + Allama Iqbal Open University Islamabad.
*Federal Urdu University of Arts, Sciences & Technology Islamabad [email protected]. +920339016430
* [email protected]. +9203215285504 Conference GCA’08. Abstract - Distributed applications running over distributed system communicate through inter process communication mechanisms. These mechanisms may be either with in a system or between two different systems. The complexities of IPC adversely affect the performance of the system. Load balancing is an important feature of distributed system. This research work is focused on the optimization of the Superscheduler architecture. It is a load balancing algorithm designed for sharing work load on computational grid. It has two perspectives i.e. Local Scheduling and Grid Scheduling. Some unnecessary inter process communication has been identified in the local scheduling mechanism of the job Superscheduler architecture. The critical part of this research work is the interaction between grid scheduler and autonomous local scheduler. In this paper an optimized Superscheduler architecture has been proposed with optimal local scheduling mechanism. Performance comparisons with earlier architecture of workloads are conducted in a simulation environment. Several key metrics demonstrate that substantial performance gains can be achieved in local scheduling via proposed Superscheduling architecture in distributed computation environment. Keywords: Inter Process Communication (IPC), Distributed Computing, Grid Scheduler, Local Scheduler, Grid Middleware, Grid Queue, Local Queue, Superscheduler (SSCH).
I. INTRODUCTION
Distributed computing has been defined in a number of different ways [1] Different types distributed systems are deployed worldwide e.g. Internet, Intranet, Mobile Computing etc. Distributed applications run over distributed system. These applications are the main communicating entities at the application layer of the distributed system. E.g. video conferencing, web application, Email application, chatting software etc. Each application has its own architecture and requires
specific protocol for its implementation. All the distributed applications run over middleware, and use its services for IPC. Cluster computing [1] and Grid computing [8] [10] are two different forms of distributed system. Load balancing is a challenging feature in distributed computing environment. Objective is to find the under loaded system and share the processing work load dynamically so that to efficiently utilize network resources and increase throughput. A job Superscheduler architecture for load balancing in grid environment has been proposed earlier [9]. This architecture has two schedulers i.e. autonomous local scheduler and grid scheduler. Job scheduling has two perspectives in this architecture. I.e. local scheduling and grid scheduling. Local scheduling is used to schedule jobs on local hosts, while grid scheduling is used to schedule the jobs for remote hosts for sharing work load. This research work is based on the optimization of a specific aspect of Superscheduler architecture i.e. in local scheduling different components of the Superscheduler get involved. I.e. Grid Scheduler, Grid Middleware, Grid Queue, Local Scheduler, and Local Queue. Interaction between different components involve inter process communication (IPC). IPC involves the complexities of context switching and domain transition.[7][3] Therefore large number of IPC adversely affect the performance of the system. [2]. Some unnecessary IPC has been identified in the local scheduling of job Superscheduler architecture. This research work is focused on this specific context of Superscheduler architecture. An optimized architecture has been proposed with minimum possible IPC. Processing workload in simulation environment evaluates performances of both architectures.
74 Int'l Conf. Grid Computing and Applications | GCA'08 |

Several key metrics demonstrate that substantial performance gains in local scheduling can be achieved via proposed Superscheduling in distributed computing environment.
II. RELATED WORK
There are different policies available for job scheduling on distributed grid environment [4][5][6][11]. Superscheduler architecture [9] is a load balancing technique for sharing work load on distributed grid environment. There are three major processes and two data structures used in this architecture: The processes include Grid Middleware (GM), Grid Scheduler (GS) and Local Scheduler (LS). Data Structures Include Grid Queue (GQ), and Local Queue (LQ). The architecture is illustrated below.
Fig. I.Distributed Architecture of the Grid Superscheduler [9]
During grid Superscheduling interaction between different components of the architecture occurs as follows: A newly coming job enters Grid Queue; Grid Scheduler computes its resource utilization requirements and queries Local Scheduler through Grid Middleware for Approximate Waiting Time (AWT) on local system for that job. The job waits in the Grid Queue before beginning execution on the local system. Local Scheduler computes AWT based on local scheduling policy and Local Queue status. If the local resources cannot fulfill the requirements of the job AWT of infinity is returned. If AWT is below a threshold value job is moved directly from Grid Queue to Local Queue without any external network communication. If the value of AWT is greater than threshold or infinity, then one of the three migration policies [9] is invoked for the selection of appropriate under loaded remote host and job migration. Processor always processes job from local queue (whether on local system or remote system i.e.
grid partner). Once job enters the Local Queue; Local Scheduler (independent of Grid Scheduler) monitors its execution. Grid Scheduler has no control over Local Scheduler. Analysis of the flow among different components of the architecture shows some unnecessary inter process communication. It is expected that by minimizing the communication among different components of the architecture performance may be improved. This work is focused on performance optimization on the local scheduling policy. In earlier scheduling process bi-directional communication among Grid Scheduler, Grid Middleware, and Local Scheduler is identified as unnecessary for the case of local job processing. An optimized Superscheduler architecture with minimum IPC has been proposed in this paper. In the modified architecture it has been focused to minimize inter process communication as much as possible so that the Superscheduler algorithm could be optimized.
III. PROPOSED ARCHITECTURE
The proposed architecture contains the same number of components and in the same positions. In this architecture the main focus is the change of sequence of flow in the initial process of job scheduling. The proposed sequence of flow is such that a newly arrived job should enter Local Queue (Instead of Grid Queue), Local Scheduler should compute the processing requirements for the newly entered process (instead of Grid Scheduler). If the Average Waiting Time (AWT) on the local system is less than a thresholdφ, then the Local Scheduler should schedule the job by using local scheduling policy. It would not involve Grid Queue, Grid Scheduler, and Grid Middleware at all. None of these components are needed in local scheduling. These components are needed in those situations only when the local system is overloaded, and it could not execute the task as much efficiently as other system of the grid environment. In that situation Local Scheduler would communicate with the Grid Scheduler through Grid Middleware, it would send processing requirements of the newly arrived process. Then the job will be moved from Local Queue to Grid Queue. Grid Scheduler would then initiate any of the job migration policies [9] as in earlier architecture, and would migrate the job to the best available host on the grid
Int'l Conf. Grid Computing and Applications | GCA'08 | 75

environment. Proposed architecture is shown in the following figure.
Fig. II Proposed Architecture.
IV. RESULTS AND DISCUSSION
The work load has been processed in simulation environment. Table 1 show the workload processed through simulator.
TABLE I Workload Processed through Simulator
Table 1 is composed of the following attributes.
1. Job Number: A counter field, starting from1. 2. Input Time: in seconds. It represents the
time at which the gridlet (a single job) is submitted for processing. The earliest time the log refers to is zero, and is the submittal time the of the first job. The lines in the log are sorted by ascending submittal times.
3. Run Time: in seconds. The time for which the gridlet will use a single processing element of CPU.
4. Number of Allocated Processors: an integer. In most cases this is also the number of processors the job uses. A job may require more than one PE’s.
TABLE II
Comparison of simulation output of Superscheduler Architecture vs. Proposed Optimized Superscheduler
Architecture.
GridletId
Input
Time
Local Queue Arrival Time in SSCH
Local Queue Arrival Time in OSCH
IPC Delay
in SSCH
IPC Delay
in OSCH
Total Cost in SSCH
Total Cost in OSCH
1 5 7.25 6.25 1 0 124 123
2 8 11.25 9.25 2 0 185 183
3 10 14.25 11.25 3 0 216 213
4 12 17.25 13.25 4 0 247 243
5 15 21.25 16.25 5 0 278 273
6 18 25.25 19.25 6 0 307 303
7 20 28.25 21.25 7 0 337 333
8 23 32.25 24.25 8 0 367 363
9 27 37.25 28.25 9 0 400 393
10 29 40.25 30.25 10 0 429 423
11 33 45.25 34.25 11 0 462.75 453
12 34 47.25 35.5 11.75 0 490 483
13 39 48.5 40.25 8.25 0 519.25 513
14 41 53.25 42.25 11 0 552.75 543
15 42 56.25 43.5 12.75 0 584.5 573
16 43 58.25 44.75 13.5 0 615.25 603
17 44 60.25 46 14.25 0 644 633
18 48 62.25 49.25 13 0 674.75 663
19 49 69.25 50.5 18.75 0 710.5 693
20 50 71.25 51.75 19.5 0 741.25 723
21 51 73.25 53 20.25 0 772 753
22 52 75.25 54.25 21 0 802.75 783
23 53 77.25 55.5 21.75 0 833.5 813
24 54 79.25 56.75 22.5 0 864.25 843
25 55 81.25 58 23.25 0 896.25 873
Job ID
Input Time
Run Time
Number of PE Required
1 5 20 2 2 8 30 2 3 10 35 2 4 12 40 2 5 15 45 2 6 18 50 2 7 20 55 2 8 23 60 2 9 27 65 2
10 29 70 2 11 33 75 2 12 34 80 2 13 39 85 2 14 41 90 2 15 42 95 2 16 43 100 2 17 44 105 2 18 48 110 2 19 49 115 2 20 50 120 2 21 51 125 2
22 52 130 2 23 53 135 2 24 54 140 2 25 55 145 2
76 Int'l Conf. Grid Computing and Applications | GCA'08 |
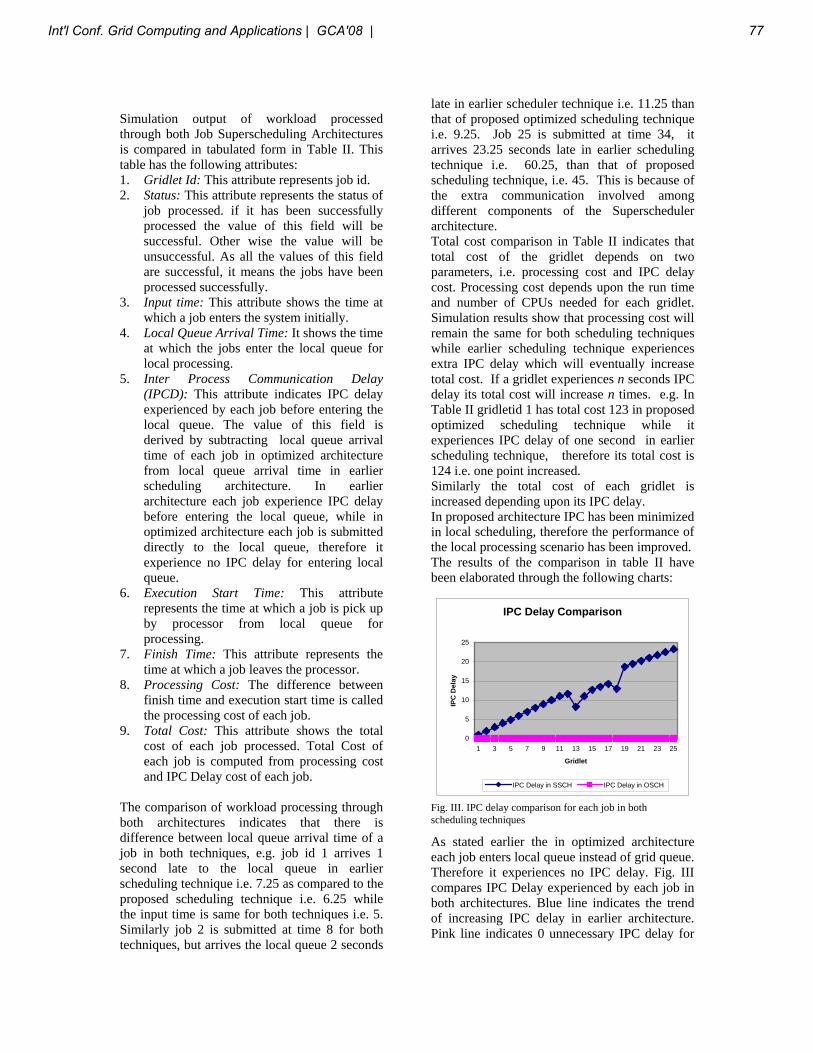
Simulation output of workload processed through both Job Superscheduling Architectures is compared in tabulated form in Table II. This table has the following attributes: 1. Gridlet Id: This attribute represents job id. 2. Status: This attribute represents the status of
job processed. if it has been successfully processed the value of this field will be successful. Other wise the value will be unsuccessful. As all the values of this field are successful, it means the jobs have been processed successfully.
3. Input time: This attribute shows the time at which a job enters the system initially.
4. Local Queue Arrival Time: It shows the time at which the jobs enter the local queue for local processing.
5. Inter Process Communication Delay (IPCD): This attribute indicates IPC delay experienced by each job before entering the local queue. The value of this field is derived by subtracting local queue arrival time of each job in optimized architecture from local queue arrival time in earlier scheduling architecture. In earlier architecture each job experience IPC delay before entering the local queue, while in optimized architecture each job is submitted directly to the local queue, therefore it experience no IPC delay for entering local queue.
6. Execution Start Time: This attribute represents the time at which a job is pick up by processor from local queue for processing.
7. Finish Time: This attribute represents the time at which a job leaves the processor.
8. Processing Cost: The difference between finish time and execution start time is called the processing cost of each job.
9. Total Cost: This attribute shows the total cost of each job processed. Total Cost of each job is computed from processing cost and IPC Delay cost of each job.
The comparison of workload processing through both architectures indicates that there is difference between local queue arrival time of a job in both techniques, e.g. job id 1 arrives 1 second late to the local queue in earlier scheduling technique i.e. 7.25 as compared to the proposed scheduling technique i.e. 6.25 while the input time is same for both techniques i.e. 5. Similarly job 2 is submitted at time 8 for both techniques, but arrives the local queue 2 seconds
late in earlier scheduler technique i.e. 11.25 than that of proposed optimized scheduling technique i.e. 9.25. Job 25 is submitted at time 34, it arrives 23.25 seconds late in earlier scheduling technique i.e. 60.25, than that of proposed scheduling technique, i.e. 45. This is because of the extra communication involved among different components of the Superscheduler architecture. Total cost comparison in Table II indicates that total cost of the gridlet depends on two parameters, i.e. processing cost and IPC delay cost. Processing cost depends upon the run time and number of CPUs needed for each gridlet. Simulation results show that processing cost will remain the same for both scheduling techniques while earlier scheduling technique experiences extra IPC delay which will eventually increase total cost. If a gridlet experiences n seconds IPC delay its total cost will increase n times. e.g. In Table II gridletid 1 has total cost 123 in proposed optimized scheduling technique while it experiences IPC delay of one second in earlier scheduling technique, therefore its total cost is 124 i.e. one point increased. Similarly the total cost of each gridlet is increased depending upon its IPC delay. In proposed architecture IPC has been minimized in local scheduling, therefore the performance of the local processing scenario has been improved. The results of the comparison in table II have been elaborated through the following charts:
IPC Delay Comparison
0
5
10
15
20
25
1 3 5 7 9 11 13 15 17 19 21 23 25
Gridlet
IPC
Del
ay
IPC Delay in SSCH IPC Delay in OSCH
Fig. III. IPC delay comparison for each job in both scheduling techniques
As stated earlier the in optimized architecture each job enters local queue instead of grid queue. Therefore it experiences no IPC delay. Fig. III compares IPC Delay experienced by each job in both architectures. Blue line indicates the trend of increasing IPC delay in earlier architecture. Pink line indicates 0 unnecessary IPC delay for
Int'l Conf. Grid Computing and Applications | GCA'08 | 77

each job. The graph is based on output of simulation.
Comparison of SuperScheduler Gridlet Local Queue Local Queue Arrival Time with Optimized
Scheduler Arrival Time
0102030405060708090
1 3 5 7 9 11 13 15 17 19 21 23 25
Gridlet
Loca
l Que
ue A
rriv
al T
ime
Local Queue Arrival Time in SSCH Local Queue Arrival Time In OSCH Fig. IV: Comparison of local queue arrival time in both architectures.
Fig. IV compares local queue arrival time of each job in both architectures. Purple lines indicate local queue arrival time in earlier architecture. Red lines indicate local queue arrival time in optimized architecture. It clearly shows that in earlier architecture jobs take more time to enter the local queue as compared to the optimized architecture. This is because in earlier architecture a job is first entered the grid queue, then it experience IPC delay because of inter process communication among different components of the architecture before it enters the local queue. While in optimized architecture each job enters the local queue directly for processing. Thus there is no unnecessary inter process communication, and therefore it experience no IPC delay.
Total Cost Comparison
0
500
1000
1 3 5 7 9 11 13 15 17 19 21 23 25
Gridlet
Tota
lCos
t= P
C +
IPC
DC
TotalCost in SSCH TotalCost in OSCH
Fig V. Comparison of Superscheduler Architecture with Optimized Scheduler Architecture
Fig.5 compares total cost of each job processed through both architectures. Blue lines indicate total cost of each job processed through earlier architecture. Red lines indicate total of each job in optimized architecture. Total cost of each job is computed from processing cost and IPC Delay
cost. Each job has the same processing cost in both architectures. But in earlier architecture there is a factor of IPC delay cost for each job. Therefore the total cost of job will differ in both architectures. There is a trend of increasing total cost for each job in earlier architecture because of unnecessary IPC delay.
V. CONCLUSION
Simulation results add to the conclusion of the research work performed. It is concluded that extra inter process communication involved in the earlier Superscheduler architecture in local job processing adversely affected the performance of local system. Large number of IPC means large number of domain transitions and context switching. Therefore each job will experience unnecessary IPC delay before reaching the local queue. This unnecessary communication has been eradicated from the proposed architecture. Therefore the results show a substantial performance improvement.
VI. FUTURE WORK
This research work does not consider grid scheduling which is another perspective of the Superscheduler architecture. This work may be extended to external scheduling as well to further improve total system performance. Future work may consider job migration policies for external job migration, as the current job migration policies do not consider many complexities involved in network communication therefore it is expected to come up with more optimized architecture.
VII. REFERENCES [1].Cluster Computing,
http://www.cisco.com/application/pdf/en/us/. Accessed 20th march 2007.
[2].Colulouris. G., Dollimore. J., Kindberg. T. (2001) [3].Context_switch.html(2006) The Linux Information
Project, http://www.bellevuelinux.org/context_switch.html accessed on August 2, 2007.
[4].Feitelson. G. D., Rudolph. L, Schwiegelshohn. U, Sevcik. C. K, & Wong. P. (1997) Theory And Practice In Parallel Job Scheduling, In 3rd Workshop on Job Scheduling Strategies for Parallel Processing, volume LNCS 1291, pp. 1–34.
[5].Feitelson. G. D. & Weil. M. A. (1996) “Packing schemes for gang scheduling” In 2nd Workshop on Job Scheduling Strategies for Parallel Processing, volume LNCS 1162, pp. 89–100.
[6].Franke. H, Jann. J, Moreira. E. J., Pattnaik. P, and Jette. A.M. (1999) An evaluation of parallel job scheduling for ASCI Blue-Pacific. In Proc. SC99.
[7].Fromm. R, Treuhaft. N, (ud) Revisiting the Cache Interference Costs Of Context Switching, .
78 Int'l Conf. Grid Computing and Applications | GCA'08 |

http://citeseer.ist.psu.edu/252861.html. [8].Global Grid Forum. http://www.gridforum.org [9].Hongzhang. S., Leonid. O., Rupak. B. (2003) “Job
Superscheduler Architecture and Performance in Computational Grid Environments”, Proceedings of the ACM/IEEE SC2003 Conference
[10].McCarthy. B. M. (2006) “Building Scalable, High Performance Cluster and Grid Networks: The Role of Ethernet”, Force10 Networks, Inc.
[11].Nelson. D. R, Towsley. F. D, and Tantawi. N. A.(ud) Performance Analysis Of Parallel Processing Systems, IEEE Transactions on Software Engineering, 14(4): pp. 532–540.
Int'l Conf. Grid Computing and Applications | GCA'08 | 79

80 Int'l Conf. Grid Computing and Applications | GCA'08 |

SESSION
GRID COMPUTING APPLICATIONS +ALGORITHMS
Chair(s)
TBA
Int'l Conf. Grid Computing and Applications | GCA'08 | 81

82 Int'l Conf. Grid Computing and Applications | GCA'08 |

Rapid Prototyping Capabilities for Conducting Research of Sun-Earth System
T. Haupt, A. Kalyanasundaram, I. Zhuk
High Performance Computing Collaboratory, Mississippi State University, USA
Abstract - This paper describes the requirements, design and implementation progress of an e-Science environment to enable rapid evaluation of potential uses of NASA research products and technologies to improve future operational systems for societal benefits. This project is intended to be a low-cost effort focused on integrating existing open source, public domain, and/or community developed software components and tools. Critical for success is a carefully designed implementation plan allowing for incremental enhancement of the scale and functionality of the system while maintaining an operational the system and hardening its implementation. This has been achieved by rigorously following the principles of separation of concerns, loose coupling, and service oriented architectures employing Portlet (GridSphere), Service Bus (ServiceMix), and Grid (Globus) technologies, as well as introducing a new layer on top of the THREDDS data server. At the current phase, the system provide data access through a data explorer allowing the user to view the metadata and provenance of the datasets, invoke data transformations such as subsampling, reprojections, format translations, and de-clouding of selected data sest or collections, as well as generate simulated data sets approximating data feed from future NASA missions.
Keywords: Science Portals, Grid Computing, Rich Interfaces, Data Repository, Online tools
1 Introduction 1.1 Objectives of Rapid Prototyping Capability
The overall goal of the National Aeronautic and Space Administration’s (NASA) initiative to create a Rapid Prototyping Capability (RPC) is to speed the evaluation of potential uses of NASA research products and technologies to improve future operational systems by reducing the time to access, configure, and assess the effectiveness of NASA products and technologies. The developed RPC infrastructure will accomplish this goal and contribute to NASA's Strategic Objective to advance scientific knowledge of the Earth system through space-based observation, assimilation of new observations, and development and deployment of enabling technologies, systems and capabilities including those with potential to improve future operational systems.
Figure 1: The RPC concept as an integration platform for composing, executing, and analyzing numerical experiments for Earth-Sun System Science supporting the location transparency of resources.
The infrastructure to support Rapid Prototyping Capabilities (RPC) is thus expected to provide the capability to rapidly evaluate innovative methods of linking science observations. To this end, the RPC should provide the capability to integrate the tools needed to evaluate the use of a wide variety of current and future NASA sensors and research results, model outputs, and knowledge, collectively referred to as “resources”. It is assumed that the resources are geographically distributed and thus RPC will provide the support for the location transparency of the resources.
This paper describes a particular implementation of a RPC system under development by the Mississippi Research Consortium, in particular Mississippi State University, under a NASA/SSC contract as part of the NASA Applied Sciences Program. This is a work in progress, about one year from the inception of this project.
1.2 RPC experiments
Results of NASA research (including NASA partners) provide the basis for candidate solutions that demonstrate the capacity to improve future operational systems through activities administered by NASA’s Applied Sciences Program. Successfully extending NASA research results to operational organizations requires science rigor and capacity throughout the pathways from research to operations. A framework for the extension of applied sciences activities involves a Rapid Prototyping Capability (RPC) to accelerate
Figure 1: The RPC concept as an integration
Int'l Conf. Grid Computing and Applications | GCA'08 | 83

Figure2: Two major categories of experiments and subsequent analysis to be supported by RPC.
the evaluation of research results in an effort to identify candidate configurations for future benchmarking efforts. The results from the evaluation activity are verified and validated in candidate operational configurations through RPC experiments. The products of RPC studies will be archived and will be made accessible to all customers, users and stakeholders via the internet with a purpose of being utilized in competitively selected experiments proposed by the applied sciences community through NASA’s “Decisions” solicitation process [1].
Examples of currently funded RPC experiments (through the NASA grant to the Mississippi Research Consortium (MRC)) include: Rapid Prototyping of new NASA sensor data into the SEVIR system, Rapid prototyping of hyperspectral image analysis algorithms for improved invasive species decision support tools, an RPC evaluation of the watershed modeling program HSPF to NASA existing data, simulated future data streams, and model (LIS) data products, and Evaluation of the NASA Land Information System (LIS) using rapid prototyping capabilities.
2 System Requirements The requirements for the infrastructure to support RPC experiments fall into two categories: (1) a computational platform seamlessly integrating geographically distributed resources into a single system to perform RPC experiments and (2) collaborative environment for dissemination of research results enabling a peer-review process.
2.1 Enabling RPC Experiments
The RPC is expected to support at least two major categories of experiments (and subsequent analysis): comparing results of a particular model as fed with data coming from different sources, and comparing different models using the data coming from the same source, as depicted in Fig. 2.
In spite of being conceptually simple, two use cases defined in Fig. 2 in fact entail a significant technical challenge. The barriers currently faced by the researchers include inadequate data access mechanisms, lack of simulated data approximating feeds from sensors to be deployed by future NASA missions, a plethora of data formats and metadata systems, complex multi-step data pre-processing, and rigorous statistical analysis of results (comparisons between results obtained using different models and/or data).
The data from NASA and other satellite missions are distributed by Data Active Archive Centers (DAAC) operated by NASA and its partners. The primary focus of DAACs is to feed post-processed data (e.g., calibrated, corrected for atmospheric effects, etc.) – referred to as the data products – for operational use by the US government and organizational users around the world. The access to the data by an individual researcher is currently cumbersome (the requests are processed asynchronously, as the data in most cases are
not readily available online), and the pre-processing made by DAACs usually does not meet the researcher’s needs. In particular, the purpose of many RPC experiments is to define new pre-processing procedures that, if successful, can be later employed by DAACs to generate new data products.
The pre-processing of the data takes many steps and the steps to be performed depends on technical details of the sensor and the nature of the research. For the sake of brevity, only Moderate Resolution Imaging Spectroradiometer (MODIS) [2] data are discussed here, as a representative example. MODIS sensors are deployed on two platforms: Aqua and Terra that are viewing the entire Earth's surface every 1 to 2 days, acquiring data in 36 spectral bands. The data (the planetary reflectance) is captured in swatches 2330 km (cross track) by 10 km (along track at nadir). The postprocessing of MODIS data may involve the selection of the region of interest (that may require combining several swatches taken at different times, and possibly merging data from Terra and Aqua), sub-sampling, re-projection, band selection or computation of the vegetation or moisture indices by combining data from different spectral bands, noise removal and de-clouding, feature detection, correlation with GIS data and other. The post-processed data are then fed into computational models and/or compared with in situ observations (changes in vegetation, changes in soil moisture, fires, etc.). Of particular interest for RPC experiments currently performed by MRC is the time evolution of Normalized Difference Vegetation Index (NDVI) defined as (NIR-RED)/(NIR+RED), where RED and NIR stand for the spectral reflectance measurements acquired in the red, and near-infrared regions, respectively. Different algorithms are being tested for eliminating gaps in the data caused by the cloud cover by fusing data collected by Aqua and Terra and weighted spatial and temporal interpolations. Finally, the comparison of data coming from different sources (and corresponding model predictions) require handling the differences in spatial and temporal resolutions, differences in satellites orbits, differences in spectral bands, and other sensor characteristics.
84 Int'l Conf. Grid Computing and Applications | GCA'08 |
Enabling RPC experiments, in this context, means thus a radical simplification of access to both actual and simulated data, as well as tools for data pre- and post-processing. The tools must be interoperable allowing the user to create computational workflows with the data seamlessly transferred as needed, including third-party transfers to high-performance computing platforms. In addition, the provenance of the data must be preserved in order to document results of different what-if scenarios and to enable collaboration and data sharing between users.
The development of the RPC system does not involve developing the tools for data processing. These tools are expected to be provided by the researchers performing experiments, projects focused on the tool development, and the community at large. Indeed, many tools for handling Earth science data are available from different sources, including NASA, USGS, NOAA, UCAR/Unidata, and numerous universities. Instead, the RPC system is expected to be an integration platform supporting adding (“plugging in”) tools as needed.
Enabling Community-Wide Peer-Review Process The essence of the RPC process is to provide an evaluation of the feasibility of transferring research capabilities into routine operations for societal benefits. The evaluation should result in a recommendation for the NASA administrators to pursue or abandon the topic under investigation. Since making an evaluation requires a narrow expertise in a given field (e.g., invasive species, crop predictions, fire protection, etc.), the results presented by a particular research needs to be peer-reviewed. One way of doing that is publishing papers in professional journals and conferences. However, this introduces latency to the process, and the information given in a paper is not always sufficient for conclusive evaluation of the research results. The proposed remedy is to provide means for publishing the results electronically – that is, providing the community access not only to the final reports and publication but also to the data used and/or produced during the analysis, as well as providing access to tools used to derive the conclusions of the evaluation. The intention is not to let the peer scientists to repeat a complete experiment, which may involve processing voluminous data on high-performance systems, but rather to provide means for testing new procedures, tools, and final analysis developed in the course of performing the experiment.
Design Considerations The development of an RPC system satisfying all the requirements described above is an immense task. Consequently, one of the most important design decisions was to prioritize the system features and select the sequence of actions that would lead towards the implementation of the full functionality. Taking into account the particular needs of
the experiments carried on by MSC, the following implementation roadmap has been agreed upon [3].
Phase I: Interactive web site for describing the experiments and gathering feedback from the community. All experiments are performed outside the RPC infrastructure.
Phase II: RPC data server acting as a cache for experimental data (Unidata’s THREDDS server [4]). In the prototype deployment a small amount (~6 TBytes) of disk space is made available for the experimenters with support for transfers of the data between the RPC data server and a hierarchical storage facility at the High Performance Computing Collaboratory (HPCC) at Mississippi State University via a 2 Mbytes/s link. The experiments obtain the data from DAACs “the old way” (through asynchronous requests) and store them at HPCC, or generate using computational models run on HPCC Linux clusters. Once transferred to the RPC data server, the data sets are available online. This is a transitional step, and still the experiments are executed outside the RPC infrastructure. However, since the data are online, they can be accessed by various standalone tools, such as Unidata’s Integrated Data Viewer (IDV) [5].
Phase III: Online tools for data processing (“transformations”). The tools are deployed as web services and integrated with the RPC data server. Through a web interface, the user sets the transformation parameters and selects the input data sets by browsing or searching the RPC data server. The results of the transformations (together with the available provenance information) are stored back at the RPC data server at the location specified by the user. The provenance information depends on the tool, in some case it is just the input parameter files and standard output, other tools generate additional log files and metadata. Since the THREDDS server “natively” handles data in the netCDF [6] format, the primary focus is given to tools for transforming NASA’s HDF-EOS [7] format (for example, MODIS data are distributed in this format), including HDF-EOS to geoTIFF Conversion Tool (HEG) [8] supporting reformatting, band selection, subsetting and stitching , and MODIS re-projection tools (MRT[9] and MRTswath[10]). The second class of tools integrated with the RPC system is the Applications Research Toolbox (ART) and the Time Series Product Tool (TSPT), developed specially for the RPC system by the Institute for Technology Development (ITD) [11] located at the NASA Stennis Space Center. The ART tool is used for generating simulated Visible/Infrared Imager/Radiometer Suite (VIIRS) data. VIIRS is a part of the National Polar-orbiting Operational Environmental Satellite System (NPOESS) program, and it is expected to be deployed in 2009. The VIIRS data will replace MODIS. The TSPT tool generates layerstacks of various data products to assist in time series analysis (including de-clouding). In particular, TSPT operates on MODIS and simulated VIIRS data. Finally, the RPC system integrates the Performance Metrics Workbench tools for data visualizations and statistical analysis. These tools have been developed at the GeoResources Institute at
Int'l Conf. Grid Computing and Applications | GCA'08 | 85

Mississippi State University and the Geoinformatics Center at the University of Mississippi. At this phase, the experimenters can use the RPC portal for rapid prototyping of experimental procedures using online, interactive tools on data uploaded to the RPC data server. Furthermore, the peer researchers can test the proposed methods using the same data sets and the same tools.
Phase IV: Support for batch processing. The actual data analysis needed to complete an experiment usually requires processing huge volumes of data (e.g., a year’s worth of data). This is impractical to perform interactively using web interfaces. Instead, support for asynchronous (“batch”) processing is provided. The tools are still deployed as web services; however, they delegate the execution to remote high-performance computational resources. The user selects the range of files (or a folder), selects the transformation parameters and submits processing of all selected files by clicking a single submit button. Since the data pre-processing is usually embarrassingly parallel (the same operation is repeated for each file or for each pixel across the group of files in TSPT), the user automatically gains by using the Portal, as the system seamlessly makes all necessary data transfers and parallelizes the execution. Since the batch execution is asynchronous, the Portal provides tools for monitoring the progress of the task. Furthermore, even very complex computational models (as opposed to a relatively simple data transformation tools) can be easily converted to a Web service, and thus all of the computational needs of the user can be satisfied through the Portal. At this phase the user may actually perform the experiment using the RPC infrastructure, assuming that the input data sets are “prefetched” to the RPC data server or HPCC storage facility, all computational models are installed at HPCC systems, and all tools are wrapped as Web Services.
Phase V: The RPC system is deployed at NASA Stennis Space Center, and it becomes a seed for a Virtual Organization (VO). Each deployment comes with its own portal, creating a network of RPC points of access. Each Portal deploys a different set of tools that are accessible through a distributed Service Bus. Each site contributes storage and computational resources that are shared across the VO. In collaboration with DAACs the support for online access is developed.
Implementation
Grid Portal The functionality of the RPC Portal naturally splits into several independent modules such as interactive Web site, data server, tool’s interfaces, or monitoring service. Each such module is implemented as an independent portlet [12]. The RPC Portal aggregates the different contents provided by the portlets into a single interface employing a popular GridSphere [13] open source portlet container. GridSphere,
while fully JSR-168 compliant, also provides out-of-the-box support for user authentication and maintaining user credentials (X509 certificates, MyProxy [14]), vital when providing access to remote resources.
Access to full functionality of the Portal, which includes the right to modify the contents served by the Portal, is granted only to the registered users who must explicitly login to start a Portal session. To access remote resources, in addition, the user must upload his or her certificate to the myProxy server associated with the Portal, using a portlet developed by the GridSphere team. In phases II - IV of the RPC system deployment, the only remote resources available to the RPC users are those provided by HPCC. Remote access to the HPCC resources is granted to registered users with certificates signed by the HPCC Certificate Authority (CA).
Phase V of the deployment calls for establishing a virtual organization allowing the users to access the resources made available by the VO participants, including perhaps the NASA Columbia project and TeraGrid. To simplify the user task to obtain and manage certificates, Grid Account Management Architecture (GAMA) [15] will be adopted. It remains to be determined what CA(s) will be recognized, though.
Interactive Web Site It is imperative for the PRC system to provide an easy way for the experimenters to update the contents of the web pages describing their experiments, in particular, to avoid intermediaries such as a webmaster. A ready to use solution for this problem is Wiki - a collaborative website which can be directly edited by anyone with access to it [16]. From several available open source implementations, Media Wiki [17] has been chosen for the RPC portal, as the RPC developers are impressed by the robustness of the implementation proven by the multi-million pages Wikipedia [18].
Media Wiki is deployed as a portlet managed by GridSphere. The only (small) modification introduced to Media Wiki in order to integrate it with the RPC Portal is replacing the direct Media Wiki login by automatic login for users who successfully logged in to GridSphere. With this modification, by a single login to the RPC Portal the user not only gets access to the RPC portlets and remote resources accessible to RPC users (through automatic retrieval of the user certificate from the MyProxy server) but also she acquires the rights to modify the Wiki contents.
The rights to modify the Wiki contents are group-based. Each group is associated with a namespace and only members of the group can make modifications to the pages in the associated namespace. For example, only participants of an RPC experiment can create and update pages describing that experiment, while anyone can contribute to the blog area and participate in the discussion of the experimental pages. In
86 Int'l Conf. Grid Computing and Applications | GCA'08 |

addition, each group is associated with a private namespace – not accessible to nonmembers at all – which enables collaborative development of confidential contents.
Data Server The science of the Sun-Sun system is notorious for collecting an incredible amount of observational data that come from different sources in a variety of formats and with inconsistent and/or incomplete metadata. The solution of the general problem of managing such data collections is a subject of numerous research efforts and it goes far beyond the scope of this project. Instead, for the purpose of the RPC system it is desirable to adopt an existing solution representing the community common practice. Even though such solution is necessarily incomplete, by the virtue of being actually used by the researchers, it is useful enough and robust enough to be incorporated into the RPC infrastructure.
From the available open source candidates, Unidata’s THREDDS Data Server (TDS) has been selected and deployed as a portlet. In order to better integrate it with the other RPC Portal functionality, and in particular, to provide user-friendly interfaces to the data transformations, a thin layer of software on top of TDS – referred to as the TDS Explorer – has been developed
THREDDS Data Server THREDDS (Thematic Real-time Environmental Distributed Data Services) [4] is middleware developed to simplify the discovery and use of scientific data and to allow scientific publications and educational materials to reference scientific data. Catalogs are the heart of the THREDDS concept. They are XML documents that describe on-line datasets. Catalogs can contain arbitrary metadata. The THREDDS Catalog Generator produces THREDDS catalogs by scanning or crawling one or more local or remote dataset collections. Catalogs can be generated periodically or on demand, using configuration files that control what directories get scanned, and how the catalogs are created.
THREDDS Data Server (TDS) actually serves the contents of the datasets, in addition to providing catalogs and metadata for them. The TDS uses the Common Data Model to read datasets in various formats, and serves them through OPeNDAP, OGC Web Coverage Service, NetCDF subset, and bulk HTTP file transfer services. The first three allow the user to obtain subsets of the data, which is crucial for large datasets. Unidata’s Common Data Model (CDM) is a common API for many types of data including OPeNDAP, netCDF, HDF5, GRIB 1 and 2, BUFR, NEXRAD, and GINI. A pluggable framework allows other developers to add readers for their own specialized formats.
Out-of-the-box TDS provide most functionality needed to support data sets commonly used in climatology applications
(e.g., weather forecasting, climate change) and GIS applications because of the supported file formats. It is possible to create CDM-based modules to handle other data formats, in particular, HDF4-EOS that is critical for many RPC experiments, however, that would possibly lead to loss of the metadata information embedded in HDF headers. Furthermore, while TDS provides support for subsetting CDM-based data sets, it does not allow for other operations, often performed on HDF4-EOS data, such as re-projections. To minimize modifications and extensions to TDS needed to integrate it with RPC infrastructure, the new functionality needed for RPC is developed as a separate package (a web application) that acts as an intermediary between the user interface and TDS. The requests for services that can be rendered by TDS are forwarded to TDS, while the others are handled by the intermediary: the TDS Explorer.
TDS Explorer The TDS native interface allows browsing the TDS catalog one page at a time, which makes the navigation of a hierarchical catalog a tedious process. To remedy that, a new interface inspired by the familiar Microsoft File Explorer (MSFE) has been developed. The structure of the catalog is now represented as an expandable tree in a narrow pane (iframe) on the left hand side of the screen. The selection of a tree node or leave results in displaying the catalog page of the corresponding data collection or data set, respectively, in an iframe occupying the rest of the screen. The TDS explore not only makes the navigation of the data repository more efficient, it also simplifies the development of interfaces to other services not natively supported by TDS. Among the services are:
• Creating containers for new data collections and uploading new data sets. The creation of a new container is analogous to creating a new folder in MSFE: select a parent folder, from menu select option “new collection”, in a pop-up iframe type in the name of the new collection and click OK (or cancel). There are two modes of uploading files: from the user workstation using HTTP and from a remote location using gridFTP (until phase V of the deployment, only HPCC storage facility). In either case select the destination collection, from menu select option “uploadHTTP” or “uploadGridFTP” , select files(s) in the file chooser popup, and click OK (or cancel).
• Renaming and deleting datasets and collections: select dataset or data collection and use the corresponding option in the menu
• Downloading the data either to the user desktop using HTTP or transferring it to a remote location using gridFTP.
• Displaying the provenance of a dataset. By choosing this option, the list of files is displayed (instead of the
Int'l Conf. Grid Computing and Applications | GCA'08 | 87

TDS catalog page) that were generated when creating the datasets, if any. Typically, the provenance files are generated when an RPC tool is used to create a dataset, and the list may include the standard output, the input parameter file, a log file, a metadata record, or other depending on the tool.
• Invoke tools for the selected fileset(s) or collection. Some tools operate on a single dataset (e.g., multispectral viewer, other may be invoked for several datasets (e.g. HEG tool), yet others operate on data collections (e.g., TSPT). The tools GUI pop up as new iframes. The tools are described in Section 4 below.
The user interface of the TDS Explorer is implemented using JavaScript, including AJAX. The server side functionality is a web application using JSP technology. The file operations (upload, delete, rename) are performed directly on the file system. The changes in the file system are propagated to the TDS Explorer tree by forcing TDS to recreate the catalog by rescanning the file system (with optimizations prohibiting rescanning folders that have not changed). Finally, the TDS explorer web application invokes TDS API for translating datasets logical names into physical URLs, as needed.
RPC Tools From the perspective of the integration, there are three types of tools. One type is standalone tools capable of connecting to the RPC data server to browse and select the dataset but otherwise performing all operations independently of the RPC infrastructure. The Unidata IDV is an example of such a tool. Obviously, such tools require no support from the RPC infrastructure except for making the RPC data server conform to accepted standards (such as DODS). One of the advantages of TDS is that it supports many of the commonly used data protocols, and consequently, the data served by the RPC data server may be accessed by many existing community developed tools, immediately enhancing the functionality of the RPC system.
The second type of tools is transformations that take a dataset or a collection as an input, and output the transformed files. Examples of such transformations are HEG, MRT, ART, and TSPT. They come with a command line interface (a MatLab executable in the case of ART and TSPT), and are controlled by a parameter input file. The integration of such tools with the RPC infrastructure is made in two steps. First, the Web-based GUI is developed (using JavaScript and Ajax as needed to create lightweight but rich interfaces) to produce the parameter file. The GUI is integrated with the TDS explorer to simplify the user task of selecting the input files and defining the destination of the output files. The other step is to install the executable on the system of choice and convert it to a service. To this end open source ServiceMix [19] that implements the JSR-208 Java Business Integration Specification [20] is used; implementations of JBI are usually referred to as “Service Bus”. Depending on the user chosen
target machine the service forks a new process on one of the servers associated with the RPC system, or submits the job on the remote machine using Globus GRAM[21]. In the case of remote submission, the service registers itself as the listener of GRAM job status change notifications. The notifications are forwarded to a Job Monitoring Service (JMS). JMS stores the information on the jobs in a database (mySQL). A separate RPC portlet provides the user interface for querying the status of all jobs submitted by the user. The request for a job submission (local or remote) contains an XML job descriptor that specifies all information needed to submit the job: the location of the executable, values of environmental variables, files to be staged out and in, etc. Consequently, the same ServiceMix service is used to submit any job with the job descriptor generated by the transformation GUI (or supporting JSP page). Furthermore, a new working directory is created for each instance of a job. Once the job completes, the result of the transformation is transferred to the TDS server to the location specified by the user, while “byproducts” such as standard output and log files, if created, are transparently moved to a location specified by the RPC server: a folder with the name created automatically by hashing the physical URL of the transformation result. This approach eliminates unnecessary clutter in the TDS catalog. Using the TDS explorer the user navigates only the actual datasets. If the provenance information is needed, the TDS explorer recreates the hash from the dataset URL and shows the contents of that directory providing the user with access to all files there.
Finally, the data viewers and statistical analysis tools do not produce new datasets. In this regard, they are similar to standalone tools. The advantage of integrating them with the RPC infrastructure is that the data can be preprocessed on the server side reducing the volume of the necessary data transfers. Because of the interactivity and rich functionality (visualizations), they are implemented as Java applets.
Summary This paper describes the requirements, design and implementation progress of an e-Science environment to enable rapid evaluation of innovative methods of processing science observations, in particular data gathered by sensors deployed on NASA-launched satellites. This project is intended to be a low-cost effort focused on integrating existing open source, public domain, and/or community developed software components and tools. Critical for success is a carefully designed implementation plan allowing for incremental enhancement of the functionality of the system, including incorporating new tools per user requests, while maintaining an operational system and hardening its implementation. This has been achieved by rigorously following the principles of separation of concerns, loose coupling, and service oriented architectures employing Portlet (GridSphere), Service Bus (ServiceMix), and Grid (Globus) technologies, as well as introducing a new layer on top of the
88 Int'l Conf. Grid Computing and Applications | GCA'08 |

THREDDS data server (TDS Explorer). At the time of writing this paper, the implementation is well into phase IV, while continuing to add new tools. The already deployed tools allow for subsampling, reprojections, format translations, and de-clouding of selected data sets and collections, as well as for generating simulated VIIRS data approximating data feeds from future NASA missions.
References
[1] NASA Science Mission Directorate, Applied Sciences Program. Rapid Prototyping Capability (RPC) Guidelines and Implementation Plan, http://aiwg.gsfc.nasa.gov/esappdocs/RPC/RPC_guidelines_01_07.doc
[2] http://modis.gsfc.nasa.gov
[3] T. Haupt and R. Moorhead, “The Requirements and Design of the Rapid Prototyping Capabilities System”, 2006 Fall Meeting of the American Geophysical Union, San Francisco, USA, December 2006.
[4] http://www.unidata.ucar.edu/projects/THREDDS/
[5] http://www.unidata.ucar.edu/software/idv/
[6] http://en.wikipedia.org/wiki/NetCDF
[7] http://hdf.ncsa.uiuc.edu/hdfeos.html
[8] http://newsroom.gsfc.nasa.gov/sdptoolkit/HEG/HEGHome.html
[9] http://edcdaac.usgs.gov/landdaac/tools/modis/index.asp
[10] http://edcdaac.usgs.gov/news/mrtswath_update_020106.asp
[11] http://www.iftd.org/rapid_prototyping.php
[12] JSR-168 Portlet Specification, http://jcp.org/aboutJava/communityprocess/final/jsr168/
[13] www.gridsphere.org
[14] MyProxy Credential Management Service, http://grid.ncsa.uiuc.edu/myproxy/
[15] K. Bhatia, S. Chandra, K. Mueller, "GAMA: Grid Account Management Architecture," First International Conference on e-Science and Grid Computing (e-Science'05), pp. 413-420, 2005.
[16] Howard G. "Ward" Cunningham, http://www.wiki.org/wiki.cgi?WhatIsWiki
[17] http://en.wikipedia.org/wiki/MediaWiki
[18] http://en.wikipedia.org/wiki/Wikipedia:About
[19] http://incubator.apache.org/servicemix/home.html
[20] http://jcp.org/en/jsr/detail?id=208
[21] http://www.globus.org
Int'l Conf. Grid Computing and Applications | GCA'08 | 89
The PS3 R© Grid-resource model
Martin Rehr and Brian VintereScience center, University of Copenhagen, Copenhagen, Denmark
Abstract—This paper introduces the PS3 R© Grid-resourcemodel, which allows any Internet connected Playstation 3to become a Grid Node without any software installation.The PS3 R© is an interesting Grid resource as each ofthe over 5 millions sold world wide contains a powerfulheterogeneous multi core vector processor well suited forscientific computing. The PS3 R© Grid node provides a nativeLinux execution environment for scientific applications.Performance numbers show that the model is usable whenthe input and output data sets are small. The resulting systemis in use today, and freely available to any research project.
Keywords: Grid, Playstation 3, MiG
1. Introduction
The need for computation power is growing daily as anincreasing number of scientific areas use computer modelingas a basis for their research. This evolution has led to awhole new research area called eScience. The increasingneed of scientific computational power has been known foryears and several attempts have been made to satisfy thegrowing demand. In the 90’s the systems evolved from vectorbased supercomputers to cluster computers which is build ofcommodity hardware leading to a significant price reduction.In the late 90’s a concept called Grid computing[7] wasdeveloped, which describes the idea of combining the differentcluster installations into one powerful computation unit.
A huge computation potential beyond the scope of clustercomputers is represented by machines located outside theacademic perimeter. While traditional commodity machinesare usually PC’s based on the X86 architecture a whole newtarget has turned up with the development and release of theSony Playstation 3 (PS3 R©). The heart of the PS3 R© is theCell processor, The Cell Broadband Engine Architecture (CellBE)[4] is a new microprocessor architecture developed in ajoint venture between Sony, Toshiba and IBM, known as STI.Each company has their own purpose for the Cell processor.Toshiba uses it as a controller for their flat panel televisions,Sony uses it for the PS3 R©, and IBM uses it for their HighPerformance Computing (HPC) blades. The development ofthe Cell started out in the year 2000 and involved around 400engineers for more than four years and consumed close tohalf a billion dollars. The result is a powerful heterogeneousmulti core vector processor well suited for gaming and HighPerformance Computing (HPC)[8].
1.1. Motivation
The theoretical peak performance of the Cell processor inthe PS3 R© is 153,6 GFLOPS in single precision and 10.98GFLOPS in double precision[4]1. According to the press morethan 5 million PS3’s have been sold worldwide at October2007. This gives a theoretical peak performance of morethan 768.0 peta-FLOPS in single precision and 54.9 peta-FLOPS in double precision, if one could combine them allin a Grid infrastructure. This paper describes two scenariosfor transforming the PS3 R© into a Grid resource, firstly theNative Grid Node (NGN) where full control is obtained ofthe PS3 R©. Secondly the Sandboxed Grid Node (SGN) whereseveral issues have to be considered to protect the PS3 R© fromfaulty code, as the machine is used for other purposes thanGrid computing.
Folding@Home[6] is a scientific distributed application forfolding proteins. The application has been embedded into theSony GameOS of the PS3 R©, and is limited to protein folding.This makes it Public Resource Computing as opposed to ourmodel which aims at Grid computing, providing a completeLinux execution environment aimed at all types of scientificapplications.
2. The Playstation 3
The PS3 R© is interesting in a Grid context due to thepowerful Cell BE processor and the fact that the game consolehas official support for other operating systems than the defaultSony GameOS.
2.1. The Cell BE
The Cell processor is a heterogeneous multi core processorconsisting of 9 cores, The Primary core is an IBM 64 bit powerprocessor (PPC64) with 2 hardware threads. This core is thelink between the operating system and the 8 powerful workingcores, called the SPE’s for Synergistic Processing Element.The power processor is called the PPE for Power ProcessingElement, figure 1 shows an overview of the Cell architecture.The cores are connected by an Element Interconnect Bus (EIB)capable of transferring up to 204 GB/s at 3.2 GHz. Each SPE
1. The PS3 R© Cell has 6 SPE’s available for applications. Each SPE isrunning at 3.2 GHz and capable of performing 25.6 GFLOPS in singleprecision and 1.83 GFLOPS in double precision.
90 Int'l Conf. Grid Computing and Applications | GCA'08 |

BEI
IOIF_1
IOIF_0
PPE
Element Interconnect Bus (EIB)
SPE0 SPE2 SPE4 SPE6
SPE1 SPE3 SPE5 SPE7
MICXIOXIO
BEI
IOIF
MIC
PPE
SPE
XIO
Cell Broadband Engine Interface
I/O interface
Memory Interface Controller
Power Processor Element
Synergistic Processor Element
Rambus XDR I/O
Figure 1. An overview of the Cell architecture
Synergistic Processor Element (SPE)
Even pipeline
Local Store
Memory Flow Controller (MFC)
Instruction Prefetch and Issue Unit
Register File
Odd pipeline
Element Interconnect Bus (EIB)
Figure 2. An overview of the SPE
is dual pipelined, has a 128x128 bit register file and 256 kBof on-chip memory called the local store. Data is transferedasynchronously between main memory and the local storethrough DMA calls handled by a dedicated Memory FlowController (MFC). An overview of the SPE is shown in figure2.
By using the PPE as primary core, the Cell processor canbe used out of the box, due to the fact that many existingoperating systems support the PPC64 architecture. Therebyit’s possible to boot a PPC64 operating system on the Cellprocessor, and execute PPC64 applications, however these willonly use the PPE core. To use the SPE cores it’s necessary todevelop code specially for the SPE’s, which includes settingup a memory communications scheme using DMA throughthe MFC.
2.2. The game console
Contrary to other game consoles, the PS3 R© officially sup-ports alternative operating systems besides the default SonyGame OS. Even though other game consoles can be modifiedto boot alternative operating systems, this requires either anexploit of the default system or a replacement of the BIOS.Replacing the BIOS is intrusion at the highest level, expensiveat a large volume and not usable beyond the academic perime-ter. Security exploits are most likely to be patched within thenext firmware update, which makes this solution unusable inany scenario. Beside the difficulties modifying other gameconsoles towards our purposes, the processors used by thegame consoles currently on the market, except for the PS3 R©,
PS3 Hypervisor Virtualization Layer
SPU GPU AUDIOGbE
WiFi
ATA
HDD/CD
USB
HID
BlueTooth
PPU
SPUFS*
Audio/Video*
ALSA**
FB
PS3VRAMMTD
GbE*
Network
TCP/IP
Storage*
SCSI
HDD** CD
OHCI/EHCI*
USB** PPU
PS3PF*
PS3 Hardware
PS3 Linux Kernel
***
PS3 Hypervisor Linux drivers provided by SONY Linux drivers NOT included on the PS3LIVE CD
Figure 3. An overview of the PS3 R© Hypervisor structurefor the Grid-resource model
are not of any interest for scientific computing.The fact that the PS3 R© is low priced from a HPC point
of view, equipped with a high performance vector processor,and supports alternative operating systems, makes it interestingboth as an NGN node and an SGN node. All sold PS3’scan be transformed to a powerful Grid resource with a littleeffort from the owner of the console. Third party operatingsystems work on top of the Sony GameOS, which acts as ahypervisor for the guest operating system. See figure 3. Thehypervisor controls which hardware components are accessiblefrom the guest operating system. Unfortunately the GPU isnot accessible by guest operating systems2, which is a pity,as it in itself is a powerful vector computation unit witha theoretical peak performance of 1.8 tera-FLOPS in singleprecession. However 252 MB of the 256 MB GDDR3 ramlocated on the graphics card can be accessed through thehypervisor, The hypervisor reserves 32 MB of main memoryand 1 of the 7 SPE’s available in the PS3 R© version of the Cellprocessor3. This leaves 6 SPE’s and 224 MB of main memoryfor guest operating systems. Lastly a hypervisor model alwaysintroduces a certain amount of performance decrease, as theguest operating system does not have direct access to thehardware.
3. The PS3 R© Grid resource
The PS3 R© supports alternative operating systems, makingthe transformation into a Grid resource rather trivial, as asuitable Linux distribution and an appropriate Grid client arethe only requirements. However if you target a large amountof PS3’s this becomes cumbersome. Furthermore if the PS3’s
2. It is not clear whether it’s to prevent games to be played outside SonyGameOS, due to DRM issues or due to the exposure of the GPU’s register-level information
3. The Cell processor consists of 8 SPE’s, but in the PS3 R© one is removedfor yield purposes, if one is defective it is removed, if none is defective agood one is removed to assure that all PS3’s have exactly 6 SPE’s availablefor applications, to preserve architectural consistency
Int'l Conf. Grid Computing and Applications | GCA'08 | 91
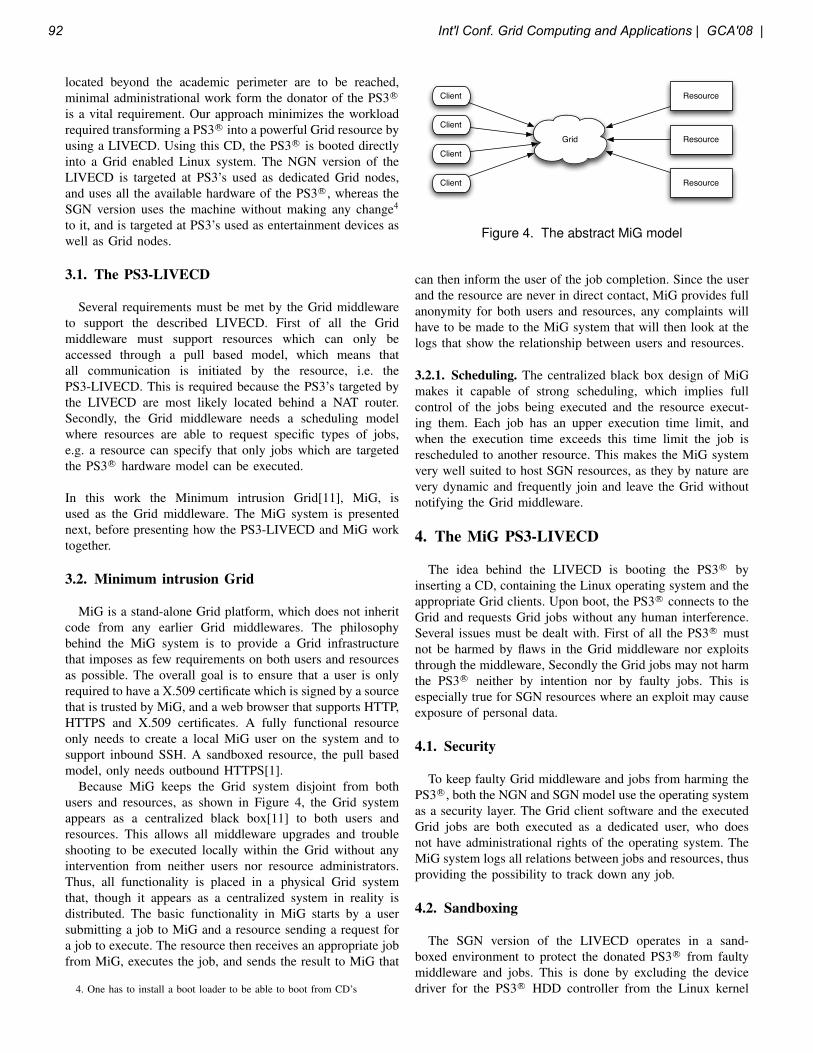
located beyond the academic perimeter are to be reached,minimal administrational work form the donator of the PS3 R©
is a vital requirement. Our approach minimizes the workloadrequired transforming a PS3 R© into a powerful Grid resource byusing a LIVECD. Using this CD, the PS3 R© is booted directlyinto a Grid enabled Linux system. The NGN version of theLIVECD is targeted at PS3’s used as dedicated Grid nodes,and uses all the available hardware of the PS3 R©, whereas theSGN version uses the machine without making any change4
to it, and is targeted at PS3’s used as entertainment devices aswell as Grid nodes.
3.1. The PS3-LIVECD
Several requirements must be met by the Grid middlewareto support the described LIVECD. First of all the Gridmiddleware must support resources which can only beaccessed through a pull based model, which means thatall communication is initiated by the resource, i.e. thePS3-LIVECD. This is required because the PS3’s targeted bythe LIVECD are most likely located behind a NAT router.Secondly, the Grid middleware needs a scheduling modelwhere resources are able to request specific types of jobs,e.g. a resource can specify that only jobs which are targetedthe PS3 R© hardware model can be executed.
In this work the Minimum intrusion Grid[11], MiG, isused as the Grid middleware. The MiG system is presentednext, before presenting how the PS3-LIVECD and MiG worktogether.
3.2. Minimum intrusion Grid
MiG is a stand-alone Grid platform, which does not inheritcode from any earlier Grid middlewares. The philosophybehind the MiG system is to provide a Grid infrastructurethat imposes as few requirements on both users and resourcesas possible. The overall goal is to ensure that a user is onlyrequired to have a X.509 certificate which is signed by a sourcethat is trusted by MiG, and a web browser that supports HTTP,HTTPS and X.509 certificates. A fully functional resourceonly needs to create a local MiG user on the system and tosupport inbound SSH. A sandboxed resource, the pull basedmodel, only needs outbound HTTPS[1].
Because MiG keeps the Grid system disjoint from bothusers and resources, as shown in Figure 4, the Grid systemappears as a centralized black box[11] to both users andresources. This allows all middleware upgrades and troubleshooting to be executed locally within the Grid without anyintervention from neither users nor resource administrators.Thus, all functionality is placed in a physical Grid systemthat, though it appears as a centralized system in reality isdistributed. The basic functionality in MiG starts by a usersubmitting a job to MiG and a resource sending a request fora job to execute. The resource then receives an appropriate jobfrom MiG, executes the job, and sends the result to MiG that
4. One has to install a boot loader to be able to boot from CD’s
Grid
Client Resource
Resource
ResourceClient
Client
Client
Figure 4. The abstract MiG model
can then inform the user of the job completion. Since the userand the resource are never in direct contact, MiG provides fullanonymity for both users and resources, any complaints willhave to be made to the MiG system that will then look at thelogs that show the relationship between users and resources.
3.2.1. Scheduling. The centralized black box design of MiGmakes it capable of strong scheduling, which implies fullcontrol of the jobs being executed and the resource execut-ing them. Each job has an upper execution time limit, andwhen the execution time exceeds this time limit the job isrescheduled to another resource. This makes the MiG systemvery well suited to host SGN resources, as they by nature arevery dynamic and frequently join and leave the Grid withoutnotifying the Grid middleware.
4. The MiG PS3-LIVECD
The idea behind the LIVECD is booting the PS3 R© byinserting a CD, containing the Linux operating system and theappropriate Grid clients. Upon boot, the PS3 R© connects to theGrid and requests Grid jobs without any human interference.Several issues must be dealt with. First of all the PS3 R© mustnot be harmed by flaws in the Grid middleware nor exploitsthrough the middleware, Secondly the Grid jobs may not harmthe PS3 R© neither by intention nor by faulty jobs. This isespecially true for SGN resources where an exploit may causeexposure of personal data.
4.1. Security
To keep faulty Grid middleware and jobs from harming thePS3 R©, both the NGN and SGN model use the operating systemas a security layer. The Grid client software and the executedGrid jobs are both executed as a dedicated user, who doesnot have administrational rights of the operating system. TheMiG system logs all relations between jobs and resources, thusproviding the possibility to track down any job.
4.2. Sandboxing
The SGN version of the LIVECD operates in a sand-boxed environment to protect the donated PS3 R© from faultymiddleware and jobs. This is done by excluding the devicedriver for the PS3 R© HDD controller from the Linux kernel
92 Int'l Conf. Grid Computing and Applications | GCA'08 |

used, and keeping the execution environment in memoryinstead. Furthermore, the support for loadable kernel modulesis excluded, which prevents Grid jobs from loading modulesinto the kernel, even if the OS is compromised and root accessis achieved.
4.3. File access
Enabling file access to the Grid client and jobs withouthaving access to the PS3’s hard drive is done by using thegraphics card’s VRAM as a block device. Main memory isa limited resource5, therefore using the VRAM as a blockdevice is a great advantage compared to the alternative ofusing a ram disk, which would decrease the amount of mainmemory available for the Grid jobs. However the total amountof VRAM is 252 MB and therefore Grid jobs requiringinput/output files larger than 252 MB are forced to use aremote file access framework[2].
4.4. Memory management
The PS3 R© has 6 SPE cores and a PPE core all capable ofaccessing the main memory at the same time, through theirMFC controllers. This results in a potential bottleneck in theTLB, as it in the worst case ends up thrashing, which is aknown problem in multi core processor architectures. TLBthrashing can be eliminated by adjusting the page size to fitthe TLB, which means that all pages have an entry in the TLB.This is called huge pages, as the page size grows significantly.The use of huge pages has several drawbacks, one of them isswapping. Swapping in/out a huge page results in a longerexecution halt as a larger amount of data has to be movedbetween main memory and the hard drive.
The Linux operating system implements huge pages as amemory mapped file, this results in a static memory divisionof traditional pages and huge pages, using different memoryallocators. The operating system and standard shared librariesuse the traditional pages which means the memory footprintof the operating system and the shared libraries has to beestimated in order to allocate the right amount of memory forthe huge pages. Opposite to a cluster setup where the executionenvironment and applications are customized to the specificcluster, this can’t be achieved in a Grid context6. Therefore ageneric way of addressing the memory is needed. Furthermorefuture SPE programming libraries will most likely use the de-fault memory allocator. This and the fact that no performancemeasurement clarifying the actual gain of using huge pagescould be found, led to the decision to skip huge pages for thePS3-LIVECD.
At last it’s believed by the authors that the actual applica-tions which could gain a performance increase by using hugepages is rather insignificant, as the the majority of applicationswill be able to hide the TLB misses by using double- ormulti buffering, as memory transfers through the MFC areasynchronous.
5. The PS3 R© only has 224 MB of main memory for the OS and applications6. Specially in MiG where the user and resources are anonymous to each
other
5. The execution environment
The PS3-LIVECD is based on the Gentoo Linux[9] PPC64distribution with a customized kernel[5] capable of communi-cating with the PS3 R© hypervisor. Gentoo catalyst[3] was usedas build environment, this provides the possibility of configur-ing exactly which packages to include on the LIVECD, as wellas providing the possibility to apply a custom made kernel andinitrd script. The kernel was modified in different ways, firstlyloadable modules support was disabled to prevent potentialevil jobs, which manages to compromise the OS security,from modifying the kernel modules. Secondly the frame-buffer driver has been modified to make the VRAM appearas a memory technology device, MTD, which means that theVRAM can be used as a block device. The modification ofthe frame-buffer driver also included freeing 18 MB of mainmemory occupied by the frame-buffer used in the defaultkernel7.
The modified kernel ended up consuming 7176 kB of thetotal 229376 kB main memory for code and internal datastructures, leaving 222200 kB for the Grid client and jobs.Upon boot the modified initrd script detects the block deviceto be used as root file system8 and formats the detected devicewith the ext2 filesystem, reserving 2580 kB for the superuser,leaving 251355 kB for the Grid client and jobs9. When theblock device has been formatted, the initrd script sets up theroot file system by coping writable directories and files fromthe CD to the root file system. Read-only directories, files,and binaries are left on the CD and linked symbolically to theroot filesystem keeping as much of the root filesystem free forGrid jobs as possible. The result is that the root file systemonly consumes 1.6 MB of the total space provided by the usedblock device.
When the Linux system is booted the LIVECD initiatesthe communication with MiG through HTTPS. This is doneby sending a unique key identifying the PS3 R© to the MiGsystem, if this is the first time the resource connects to theGrid a new profile is created dynamically. The response tothe initial request is the Grid resource client scripts, these aregenerated dynamically upon the request. By using this methodit’s guaranteed that the resource always has the newest versionof the Grid resource client scripts, disabling the need fordownloading a new CD upon a Grid middleware update. Whenthe Grid resource client script is executed the request of Gridjobs is initiated through HTTPS. Within that request a uniqueresource identifier is provided, giving the MiG scheduler thenecessary information about the resource such as architecture,memory, disc space and an upper time-limit. Based on theseparameters the MiG scheduler finds a job suited for the PS3 R©
and places it in a job folder on the MiG system. From thislocation the PS3 R© is able to retrieve the job consisting of
7. As the hypervisor isolates the GPU from the operating system, thedisplay is operated by having the frame-buffer writing the data to be displayedto an array in main memory, which is then copied to the GPU by thehypervisor
8. The SGN version uses VRAM, DGN version uses the real hard driveprovided through the hypervisor
9. This is true for the SGN version, the NGN version uses the total discspace available, which is specified through the Sony Game OS
Int'l Conf. Grid Computing and Applications | GCA'08 | 93
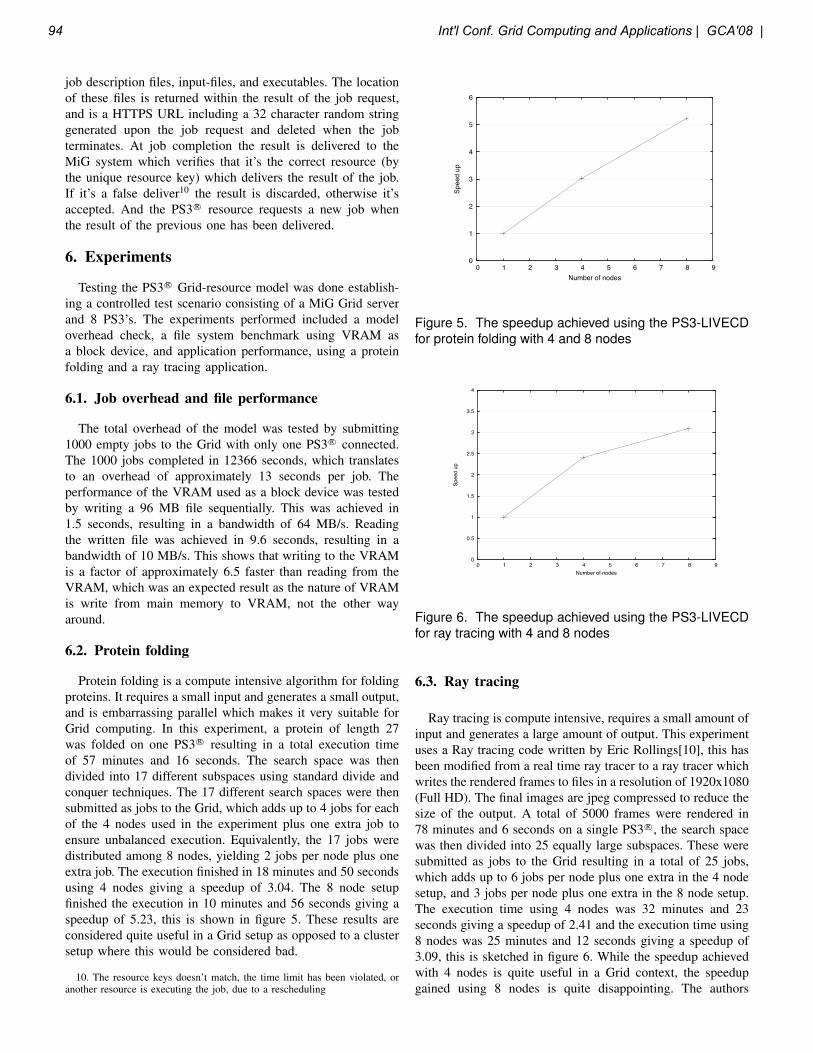
job description files, input-files, and executables. The locationof these files is returned within the result of the job request,and is a HTTPS URL including a 32 character random stringgenerated upon the job request and deleted when the jobterminates. At job completion the result is delivered to theMiG system which verifies that it’s the correct resource (bythe unique resource key) which delivers the result of the job.If it’s a false deliver10 the result is discarded, otherwise it’saccepted. And the PS3 R© resource requests a new job whenthe result of the previous one has been delivered.
6. Experiments
Testing the PS3 R© Grid-resource model was done establish-ing a controlled test scenario consisting of a MiG Grid serverand 8 PS3’s. The experiments performed included a modeloverhead check, a file system benchmark using VRAM asa block device, and application performance, using a proteinfolding and a ray tracing application.
6.1. Job overhead and file performance
The total overhead of the model was tested by submitting1000 empty jobs to the Grid with only one PS3 R© connected.The 1000 jobs completed in 12366 seconds, which translatesto an overhead of approximately 13 seconds per job. Theperformance of the VRAM used as a block device was testedby writing a 96 MB file sequentially. This was achieved in1.5 seconds, resulting in a bandwidth of 64 MB/s. Readingthe written file was achieved in 9.6 seconds, resulting in abandwidth of 10 MB/s. This shows that writing to the VRAMis a factor of approximately 6.5 faster than reading from theVRAM, which was an expected result as the nature of VRAMis write from main memory to VRAM, not the other wayaround.
6.2. Protein folding
Protein folding is a compute intensive algorithm for foldingproteins. It requires a small input and generates a small output,and is embarrassing parallel which makes it very suitable forGrid computing. In this experiment, a protein of length 27was folded on one PS3 R© resulting in a total execution timeof 57 minutes and 16 seconds. The search space was thendivided into 17 different subspaces using standard divide andconquer techniques. The 17 different search spaces were thensubmitted as jobs to the Grid, which adds up to 4 jobs for eachof the 4 nodes used in the experiment plus one extra job toensure unbalanced execution. Equivalently, the 17 jobs weredistributed among 8 nodes, yielding 2 jobs per node plus oneextra job. The execution finished in 18 minutes and 50 secondsusing 4 nodes giving a speedup of 3.04. The 8 node setupfinished the execution in 10 minutes and 56 seconds giving aspeedup of 5.23, this is shown in figure 5. These results areconsidered quite useful in a Grid setup as opposed to a clustersetup where this would be considered bad.
10. The resource keys doesn’t match, the time limit has been violated, oranother resource is executing the job, due to a rescheduling
0
1
2
3
4
5
6
0 1 2 3 4 5 6 7 8 9
Spee
d up
Number of nodes
Figure 5. The speedup achieved using the PS3-LIVECDfor protein folding with 4 and 8 nodes
0
0.5
1
1.5
2
2.5
3
3.5
4
0 1 2 3 4 5 6 7 8 9
Spee
d up
Number of nodes
Figure 6. The speedup achieved using the PS3-LIVECDfor ray tracing with 4 and 8 nodes
6.3. Ray tracing
Ray tracing is compute intensive, requires a small amount ofinput and generates a large amount of output. This experimentuses a Ray tracing code written by Eric Rollings[10], this hasbeen modified from a real time ray tracer to a ray tracer whichwrites the rendered frames to files in a resolution of 1920x1080(Full HD). The final images are jpeg compressed to reduce thesize of the output. A total of 5000 frames were rendered in78 minutes and 6 seconds on a single PS3 R©, the search spacewas then divided into 25 equally large subspaces. These weresubmitted as jobs to the Grid resulting in a total of 25 jobs,which adds up to 6 jobs per node plus one extra in the 4 nodesetup, and 3 jobs per node plus one extra in the 8 node setup.The execution time using 4 nodes was 32 minutes and 23seconds giving a speedup of 2.41 and the execution time using8 nodes was 25 minutes and 12 seconds giving a speedup of3.09, this is sketched in figure 6. While the speedup achievedwith 4 nodes is quite useful in a Grid context, the speedupgained using 8 nodes is quite disappointing. The authors
94 Int'l Conf. Grid Computing and Applications | GCA'08 |

believe this is due to network congestion when the renderedframes are sent to the MiG storage upon job termination.
7. Conclusion
In this work we have demonstrated a way to use theSony Playstation 3 as a Grid computing device, without theneed to install any client software on the PS3 R©. The useof the Linux operating system provides a native executionenvironment suitable for the majority of scientific applications.The advantage of this is that existing Cell applications can beexecuted without any modifications. A sandboxed version ofthe execution environment has been presented which deniesaccess to the hard drive of the PS3 R©. The advantage of thisis that donated PS3’s can’t be compromised by faulty or eviljobs, the disadvantage is the lack of file access, which is solvedby using the VRAM of the PS3 as block device.
The Minimum intrusion Grid supports the required pull-job model for retrieving and executing Grid jobs on a re-source located behind a firewall without the need to openany incoming ports. By using the PS3-LIVECD approach anyPS3 R© connected to the Internet can become a Grid resource bybooting it with the LIVECD. When a Grid connected PS3 R© isshut down the MiG system will detect this event, by a timeout,and resubmit the job to another resource.
Experiments show that the ray tracing application doesn’tscale well, due to the large amount of output data resulting innetwork congestion problems. Opposite to this, a considerablespeedup is reached when folding proteins despite of the modeloverhead of 13 seconds applied to each job.
References
[1] Rasmus Andersen and Brian Vinter. Harvesting idle windowscpu cycles for grid computing. In Hamid R. Arabnia, editor,GCA, pages 121–126. CSREA Press, 2006.
[2] Rasmus Andersen and Brian Vinter. Transparent remote fileaccess in the minimum intrusion grid. In WETICE ’05: Pro-ceedings of the 14th IEEE International Workshops on EnablingTechnologies: Infrastructure for Collaborative Enterprise, pages311–318, Washington, DC, USA, 2005. IEEE Computer Soci-ety.
[3] Gentoo Catalyst. http://www.gentoo.org/proj/en/releng/catalyst.
[4] Thomas Chen, Ram Raghavan, Jason Dale, and Eiji Iwata. Cellbroadband engine architecture and its first implementation. IBMdeveloperWorks, 2005. http://www.ibm.com/developerworks/power/library/pa-cellperf.
[5] PS3 Linux extensions. ftp://ftp.uk.linux.org/pub/linux/Sony-PS3.
[6] Folding@home. http://folding.stanford.edu.
[7] Ian Foster. The grid: A new infrastructure for 21st centuryscience. Physics Today, 55(2):42–47, 2002.
[8] Mohammad Jowkar. Exploring the Potential of the CellProcessor for High Performance Computing. Master’s thesis,University of Copenhagen, Denmark, August 2007.
[9] Gentoo Linux. http://www.gentoo.org.
[10] Eric Rollings. Ray tracer. http://eric rollins.home.mindspring.com/ray/ray.html.
[11] Brian Vinter. The Architecture of the Minimum intrusion Grid(MiG). In Communicating Process Architectures 2005, sep2005.
Int'l Conf. Grid Computing and Applications | GCA'08 | 95

Numerical Computational Solution of Fredholm
Integral Equations of the Second Kind by Using
Multiwavelet
K. Maleknejada
aDepartment of mathematicsIran University of Science and Technology
Narmak, Tehran 1684613114, Iran
T. Lotfib, and K. NouriabDepartment of mathematicsI. A. U. H. (Hamadan Unit)
Hamadan, Iran
Abstract The main purpose of this paper is to
develope a multiwavelets Galerkin method for ob-
tain numerical solution of Fredholm integral equa-
tions of second kind. On other hand, we use a
class of multiwavelet which construct a bases for
L2(R) and leads to a sparse matrices with high pre-
cision, in numerical methods as Galerkin method.
Because multiwavelets are able to offer a combi-
nation of orthogonality, symmetry, higher order
of approximation and short support, methods us-
ing multiwavelets frequently outperform those us-
ing the comparable scale wavelets. Since spline
bases have a maximal approximation order with
respect to their length, we using a family of spline
multiwavets that are symmetric and orthogonal as
basis. Finally, by using numerical examples we
show that our estimation have a good degree of
accuracy.
Keywords: Integral Equation, Multiwavelet, Galerkin
System, Orthogonal Bases
1 Introduction
This section provide an overview of the topics thatwe need in this paper. The use of wavelet basedalgorithms in numerical analysis is superficially sim-ilar to other transform methods, in which, insteadof representing a vector or an operator in the usualway it is expanded in a wavelet basis, or it’s matrixrepresentation is computed in this bases.
1.1 Multiwavelet
The multiwavelet is more general than the scalerwavelet. The recursion coefficients are now matri-
ces, the symbols are trigonometric matrix polyn-imials, and so on. This change is responsible formost of the extra complication. We now considera dilation factor of m rather than 2. The mul-tiscaling function is still φ, the multiwavelet areψ(1), ..., ψ(m−1). Likewise, the recursion coefficientsare Hk and G(1), ...,G(m−1) and so on.
Definition 1 A refinable function vector is avector-valued function
φ(x) =
φ1(x)...
φr(x)
, φn : R −→ C,
which satisfies a two-scale matrix refinement equa-tion of the form
φ(x) =√m
k1∑k=k0
Hφ(mx− k), k ∈ Z. (1)
r is called the multiplicity of φ; the integer m ≥ 2is the dilation factor. The recursion coefficients Hk
are r × r matrices.
2 Construction MultiwaveletBases
We begin with construction of a class of bases forL2[0, 1]. The class is indexed by p ∈ Z+, which de-notes the number of vanishing moments of the basisfunctions; we say a basis {b1, b2, b3, . . . } form thisclass is of order p, if∫ 1
0
bi(x)xjdx = 0, j = 0, . . . , k − 1,
for each bi with i > p.
96 Int'l Conf. Grid Computing and Applications | GCA'08 |

2.1 Multiwavelet Bases for L2[0, 1]
We employ the multiresolution analysis frame-work, Keinert [1]. For m = 0, 1, 2, . . . and i =0, 1, . . . , 2m−1, we define a half open interval Im,i ⊂[0, 1) as below
Im,i = [2−mi, 2−m(i+ 1)). (2)
For a fixed m, the dyadic intervals Im,i are di-joint and their union is [0, 1); also Im,i = Im+1,2i ∪Im+1,2i+1. Now we suppose that p ∈ Z+ and form = 0, 1, . . . , and i = 0, 1, . . . , 2m − 1, we define aspace V k
m,i of piecewise polynomial functionl
V km,i = {f | f : R → R, f = PpχIm,i
}, (3)
and we define
V pm = V p
m,0 ⊕ V pm,1 ⊕ V p
m,2 ⊕ · · · ⊕ V pm,2m−1.
It is apparent that for each m and i the space V pm,i
has dimension p, the space V pm has dimension 2mp,
andV p
m,i ⊂ V pm+1,2i ⊕ V p
m+1,2i+1;
thusV p
0 ⊂ V p1 ⊂ · · · ⊂ V p
m ⊂ . . . .
Form = 0, 1, 2, . . . and i = 0, 1, . . . , 2m−1, we definethe p-dimensional space W p
m,i to be the orthogonalcomplement of V p
m,i in V pm+1,2i ⊕ V p
m+1,2i+1,
V pm,i⊕W
pm,i = V p
m+1,2i⊕Vpm+1,2i+1, W p
m,i ⊥W pm,i,
and we define
W pm = W p
m,0 ⊕W pm,1 ⊕W p
m,2 ⊕ · · · ⊕W pm,2m−1.
Now we have V pm⊕V p
m = V pm+1, so we inductively
obtain the decomposition
V pm = V p
0 ⊕W p0 ⊕W p
1 ⊕ · · · ⊕W pm−1. (4)
Suppose that functions ψ1, ψ2, . . . , ψp : R → Rform an orthogonal basis for W p
0 . Since W p0 is or-
thogonal to V p0 , the first p moments ψ1, . . . , ψp van-
ish, ∫ 1
0
ψi(x)xjdx = 0, j = 0, 1, . . . , p− 1.
The space W pm,i then has an orthogonal basis con-
sisting of the P functions ψ1(2mx−i), . . . , ψp(2mx−i), which are non-zero only on the interval Im,i;furthermore, each of the functions has p vanishingmoments. Introducing the notation ψj
m,i for j =
1, . . . , p, m = 0, 1, 2, . . . , and i = 0, 1, 2, . . . , 2m − 1,by the formula
ψjm,i(x) = ψj(2mx− i), x ∈ R,
we obtain from decomposition (4) the formula
V pm = V p
0 ⊕ linear span{ψjm,i}
j = 1, . . . , p; m = 0, 1 . . . ; i = 0, 1, . . . , 2m − 1. (5)
An explicit construction of ψ1, . . . , ψp is given inWalter and Shen [3].
We define the space V p to be the union of the V pm,
given by the formula
V p =∞⋃
m=0
V pm, (6)
and observe that V p = L2[0, 1]. In particular, V 1
contains the Haar basis for L2[0, 1], which consistsof functions piecewise constant on each of the inter-vals Im,i. Here the closure V p is defined with respectto the L2-norm. We let {φ1, . . . , φp} denote any or-thogonal basis for V p
0 ; in view of (5) and (6), theorthogonal system
Bp = {φj}j
⋃{ψj
m,i}i,j,m
spans L2[0, 1]; we refer to Bp as the multiwaveletbasis of order p for L2[0, 1]. In Resnikoff and Wells[4] it is shown that Bp may be readily generalized tobases for L2(R), L2(Rd), and L2[0, 1]d.
3 Second Kind Integral Equa-tions
The matrix representations of integral operators inmultiwavelet bases are sparse. We begin this sectionby introducing some notation for integral equations.A linear Fredholm integral equation of the secondkind is an expression of the form
f(x) = g(x) +∫ b
a
K(x, t)f(t)dt, (7)
where we assume that the kernel K is in L2[a, b]2andthe unknown f and g are in L2[a, b]. For simplicity,we let [a, b] = [0, 1], and
(kf)(x) =∫ 1
0
K(x, t)f(t)dt.
Int'l Conf. Grid Computing and Applications | GCA'08 | 97

Suppose that {θi}i=1 is an orthonormal basis forL2[0, 1], the expansion of K in this basis is givenby the formula
K(x, t) =∑i=1
∑j=1
Kijθi(x)θj(t), (8)
where the coefficient Kij is given by the expression
Kij =∫ 1
0
∫ 1
0
K(x, t)θi(x)θj(t) dxdt, i, j = 1, 2, . . . .
(9)Similarly, the functions f and g have expansion
f(x) =∑i=1
fiθi(x), g(x) =∑i=1
giθi(x),
where the coefficients fi and gi are given by
fi =< f(x), θi(x) >=∫ 1
0
f(x)θi(x)dx,
gi =< g(x), θi(x) >=∫ 1
0
g(x)θi(x)dx, i = 1, 2, . . . .
By this notation, the integral equation (7) can bewritten as a infinite system of equations
fi −∑j=1
Kijfj = gi, i = 1, 2, . . . .
We can truncate the expansion forK at a finite num-ber of terms, and show it by the integral operator Tas following
(Tf)(x) =∫ 1
0
n∑i=1
n∑j=1
Kijθi(x)θj(t) f(t)dt,
f ∈ L2[0, 1], x ∈ [0, 1]
which approximates K. Therefore the integral equa-tion (7) can be approximated by the following sys-tem
fi −n∑
j=1
Kijfj = gi, i = 1, . . . , n, (10)
which is a linear system of n equation in n unknownsfi. Equations (10) may be solved numerically for ap-proximate solution of equation (7). In this case wehave the approximation solution as
fT(x) =n∑
i=1
fiθi(x).
Now we estimate the error eT = f − fT . We followthe derivation by the Delves and Mohamed in [5].
Let gT(x) =∑n
i=1 giθi(x), we rewrite equations (7)and (10) in terms of operators K and T, we have
(I−K)f = g, (I−T)fT = gT .
Therefore we have
(I−K)eT = (K−T)fT + (g − gT ).
Provided that (I−K)−1 exists, we obtain the errorbound
‖eT ‖ ≤ ‖(I−K)−1‖.‖(K−T)fT + (g− gR)‖. (11)
4 Numerical performances
For showing efficiency of numerical method, we con-sider the following examples. We note that, Delvesand Mohamed ([5]):
‖ eN ‖=(∫ 1
−1
e2N (t) dt) 1
2
≈
(1N
N∑i=0
e2N (xi)
) 12
,
where
e(si) = x(si)− xN (si), i = 0, 1, . . . , N,
Such that xN (si) and x(si) are, respectively the ap-proximate and exact solutions of the integral equa-tions.
4.1 EXAMPLES
Example 1. x(s) = sin s − s +∫ π/2
0st x(t) dt,
with exact solution x(s) = sin s.
Example 2. x(s) = es − es+1−1s+1 +
∫ 1
0estx(t)dt with
exact solution x(s) = es.
Example 3. x(s) = s+∫ 1
0K(s, t)x(t) dt,
K(s, t) =
{s, s ≤ t
t, s ≥ t,
with exact solution: x(s) = sec 1 sin s.The following table shows the computed error ‖ eN ‖for the before examples.
Table 1: Errors ‖eN‖ at m=6 forMultiwavelet
N Example 1 Example 2 Example 32 5.2× 10⁻² 3.3× 10⁻² 3.5×10⁻²
3 5.5× 10⁻³ 7.2× 10⁻³ 1.5× 10⁻³
4 4.6× 10⁻⁶ 9.8×10⁻⁵ 8.5× 10⁻⁴
5 5.3× 10⁻⁹ 3.2× 10⁻⁷ 2.8× 10⁻⁷
6 3.6× 10⁻¹² 8.9× 10⁻¹⁰ 1.0× 10⁻⁹
98 Int'l Conf. Grid Computing and Applications | GCA'08 |

5 Conclusion
The main advantage of multiwavelets over scalarwavelets in numerical methods lies in their short sup-port, which makes boundaries much easier to han-dle. If symmetric/antisymmetric multiwavelets areused, it is even possible to use only the antisymmet-ric components of the boundary function vector forproblems with zero boundary conditions. The char-acteristics of the multiwavelets bases which lead toa sparse matrix representation are that
1. The basis functions are orthogonal to low orderpolynomials (having vanishing moments).
2. Most basis functions have small interval of sup-port.
References
[1] F. Keinert, ”Wavlets and Multiwavelets.” Chap-man and Hall/CRC, 2004.
[2] G.S. Burrus, R.A. Gopinath, H. Guo, ”Introduc-tion to Wavelets and Wavelet Transform.” Pren-tice Hall,1998.
[3] G.G. Walter, X. Shen, ”Wavelets and OtherOrthogonal Systems.” Chapman and Hall/CRC,Second Edition, 2001.
[4] H.L. Resnikoff, R.O. Wells, ”Wavelet Analysis.”Springer, 1998.
[5] L.M. Delves, J.L. Mohamed, ”ComputationalMethods for Integral Equations.” CambridgeUniversity Press, Cambridge, 1985.
[6] I. Daubechies, ”Ten Lecture on Wavelets.”SIAM, Philadelphia, PA, 1992.
[7] I. Daubechies, ”Orthonormal Bases of Com-pactly Supported Wavelets II, Variations on aThems.” SIAM J.Math.Ana, 24(2), pp. 499-519,1993.
[8] K. Maleknejad, S. Rahbar, ”Numerical solutionof Fredholm Integral Equation of the Second Kindby Using B-Spline Function.” Int.J.Eng.Sci,13(5), pp. 9-17, 2000.
[9] K. Maleknejad, F. Mirzaee, ”Using RationalizedHaar Wavelet for Solving Linear Integral Equa-tions.” Applied Mathematics and Computation(AMC), 160(2), pp. 579-587, 2005.
[10] K. Maleknejad, H. Mesgarani, T. Nikzad,”Wavelet-Galerkin Solution for Fredholm Inte-gral Equation of the Second Kind.” Int.J.Eng.Sci,13(5), pp. 75-80, 2002.
Int'l Conf. Grid Computing and Applications | GCA'08 | 99
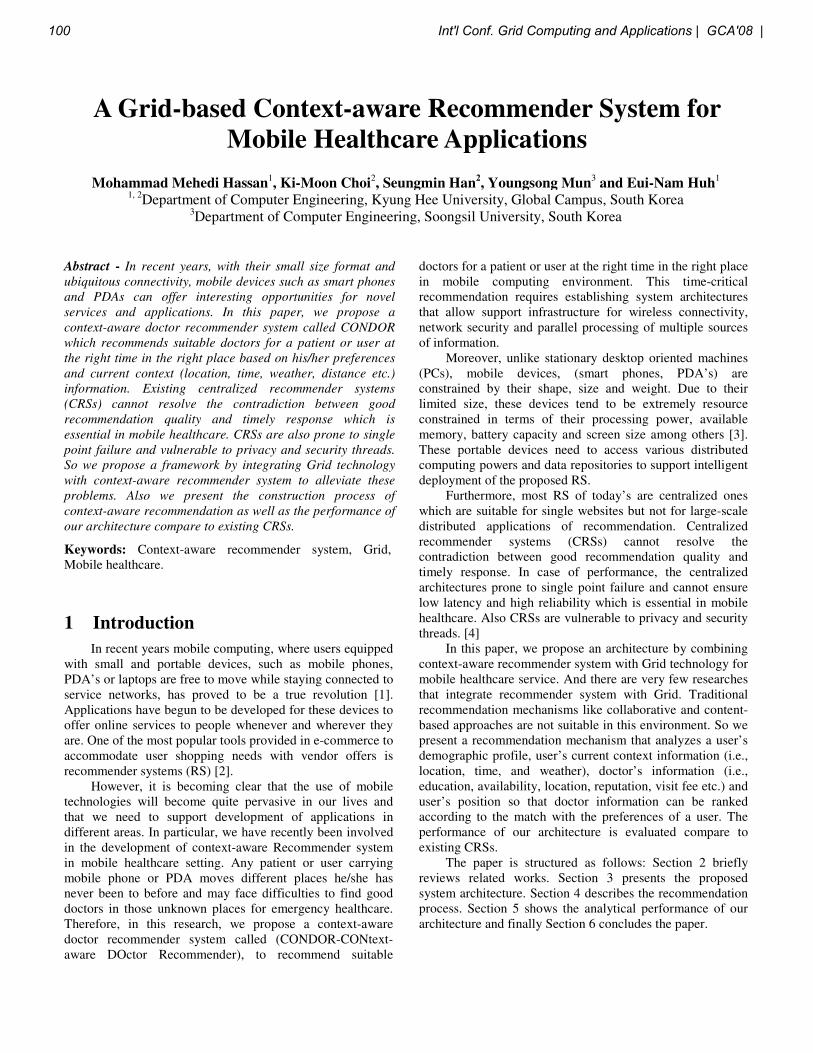
A Grid-based Context-aware Recommender System for
Mobile Healthcare Applications
Mohammad Mehedi Hassan1, Ki-Moon Choi
2, Seungmin Han
2, Youngsong Mun
3 and Eui-Nam Huh
1
1, 2Department of Computer Engineering, Kyung Hee University, Global Campus, South Korea
3Department of Computer Engineering, Soongsil University, South Korea
Abstract - In recent years, with their small size format and
ubiquitous connectivity, mobile devices such as smart phones
and PDAs can offer interesting opportunities for novel
services and applications. In this paper, we propose a
context-aware doctor recommender system called CONDOR
which recommends suitable doctors for a patient or user at
the right time in the right place based on his/her preferences
and current context (location, time, weather, distance etc.)
information. Existing centralized recommender systems
(CRSs) cannot resolve the contradiction between good
recommendation quality and timely response which is
essential in mobile healthcare. CRSs are also prone to single
point failure and vulnerable to privacy and security threads.
So we propose a framework by integrating Grid technology
with context-aware recommender system to alleviate these
problems. Also we present the construction process of
context-aware recommendation as well as the performance of
our architecture compare to existing CRSs.
Keywords: Context-aware recommender system, Grid,
Mobile healthcare.
1 Introduction
In recent years mobile computing, where users equipped
with small and portable devices, such as mobile phones,
PDA’s or laptops are free to move while staying connected to
service networks, has proved to be a true revolution [1].
Applications have begun to be developed for these devices to
offer online services to people whenever and wherever they
are. One of the most popular tools provided in e-commerce to
accommodate user shopping needs with vendor offers is
recommender systems (RS) [2].
However, it is becoming clear that the use of mobile
technologies will become quite pervasive in our lives and
that we need to support development of applications in
different areas. In particular, we have recently been involved
in the development of context-aware Recommender system
in mobile healthcare setting. Any patient or user carrying
mobile phone or PDA moves different places he/she has
never been to before and may face difficulties to find good
doctors in those unknown places for emergency healthcare.
Therefore, in this research, we propose a context-aware
doctor recommender system called (CONDOR-CONtext-
aware DOctor Recommender), to recommend suitable
doctors for a patient or user at the right time in the right place
in mobile computing environment. This time-critical
recommendation requires establishing system architectures
that allow support infrastructure for wireless connectivity,
network security and parallel processing of multiple sources
of information.
Moreover, unlike stationary desktop oriented machines
(PCs), mobile devices, (smart phones, PDA’s) are
constrained by their shape, size and weight. Due to their
limited size, these devices tend to be extremely resource
constrained in terms of their processing power, available
memory, battery capacity and screen size among others [3].
These portable devices need to access various distributed
computing powers and data repositories to support intelligent
deployment of the proposed RS.
Furthermore, most RS of today’s are centralized ones
which are suitable for single websites but not for large-scale
distributed applications of recommendation. Centralized
recommender systems (CRSs) cannot resolve the
contradiction between good recommendation quality and
timely response. In case of performance, the centralized
architectures prone to single point failure and cannot ensure
low latency and high reliability which is essential in mobile
healthcare. Also CRSs are vulnerable to privacy and security
threads. [4]
In this paper, we propose an architecture by combining
context-aware recommender system with Grid technology for
mobile healthcare service. And there are very few researches
that integrate recommender system with Grid. Traditional
recommendation mechanisms like collaborative and content-
based approaches are not suitable in this environment. So we
present a recommendation mechanism that analyzes a user’s
demographic profile, user’s current context information (i.e.,
location, time, and weather), doctor’s information (i.e.,
education, availability, location, reputation, visit fee etc.) and
user’s position so that doctor information can be ranked
according to the match with the preferences of a user. The
performance of our architecture is evaluated compare to
existing CRSs.
The paper is structured as follows: Section 2 briefly
reviews related works. Section 3 presents the proposed
system architecture. Section 4 describes the recommendation
process. Section 5 shows the analytical performance of our
architecture and finally Section 6 concludes the paper.
100 Int'l Conf. Grid Computing and Applications | GCA'08 |

2 Related Works
2.1 Decentralized Recommender Systems
Modern distributed technologies need to be incorporated
into recommender systems to realize distributed
recommendation. Chuan-Feng Chiu, et al proposed the
mechanism to achieve community recommendation based on
the design of the generic agent framework which is designed
based on the peer-to-peer (P2P) computing architecture [5].
Peng Han, et al. proposed a distributed hash table (DHT)
based technique to implement efficient user database
management and retrieval in decentralized Collaborative
Filtering system [6]. Pouwelse et al. also proposed in [7], a
P2P recommender system capable of social content discovery
called TRIBLER. TRIBLER uses an algorithm based on an
epidemic protocol. However the above systems did not
consider context-awareness which is very important in case
of mobile computing. Also in healthcare service, parallel
processing of multiple sources of information is very
important.
Today Grid computing promises the accessibility of vast
computing and data resources across geographically
dispersed areas. This capability is significantly enhanced by
establishing support for mobile wireless devices to access
and perform on-demand service delivery from the Grid [8].
Integration of recommender system with Grid can enable
portable devices (mobile phones, PDA’s) to perform complex
reasoning and computation efficiently with various context
information exploiting the capabilities of distributed resource
integration (computing resources, distributed databases etc.).
The author in [4] proposed a knowledge Grid based
intelligent electronic commerce recommender systems called
KGBIECRS. The recommendation task is defined as a
knowledge based workflow and the knowledge grid is
exploited as the platform for knowledge sharing and
knowledge service. Also context-awareness for mobility
support is not considered.
We propose a framework by combining context-aware
recommender system with Grid technology in a mobile
environment.
2.2 Context-aware Recommender Systems
Context is any information that can be used to
characterize the situation of an entity. An entity is any
person, place or object that is considered relevant to the
interaction between a user and an application, including the
user and application themselves [9]. Examples of contextual
information are location, time, proximity, and user status and
network capabilities. The key goal of context-aware systems
is to provide a user with relevant information and/or services
based on his current context.
There are many researches in the literature to use
context-aware recommender system in different application
areas like travel, shopping, movie, music etc. [10-13]. All
these RSs are centralized ones. Thus they are prone to single
point failure and vulnerable to security threads.
Existing popular recommendation mechanism like
collaborative, content based and their hybrid approaches
cannot be used in our application area as they cannot handle
both user situation and personalization at the same time. So
we propose an efficient recommendation mechanism which
effectively handles users’ current context information and
recommends appropriate doctors in case of normal or
emergency condition.
3 Proposed System Architecture
To provide recommendation, the proposed CONDOR
system needs following functional requirements:
(i) Appropriate data preparation/collection
(ii) Creation of personalization method of recommendation
Data preparation/collection includes the following:
a) User Demographic Information: This includes age, gender,
income range, own car, health insurance etc.
b) User Context Information: This includes current location,
distance, time, and weather information.
c) User Preference Information: This is the user’s tendency
toward selecting certain doctor among others.
d) Doctor Information: This includes specialty, board
certification, price, service hour etc. The system will have
access to different hospitals and healthcare databases to
collect doctor information. Also different doctors can register
their information to our system. Doctors will be encouraged
to provide their information to get more patients and improve
their healthcare quality according to user feedback. Also user
can register good doctors in their area into the system.
The overall CONDOR architecture is shown in figure 1.
Our architecture consists of user interface, middleware and
data Service. The major components of our architecture are
described as follows:
a) Web Portal: This is used as a web interface for the user
which can be accessed from users mobile’s or PDA’s internet
browser. It also provides Grid security interface (GSI) for
preventing unauthorized or malicious users. Users/patients
and doctors register their profiles or information through this
web portal. Also user can give some doctors information
through this portal. Also user submits his recommendation
request (query) through this portal as shown in figure 2.
b) Context Manager: The context manager retrieves
information about the user’s current context by contacting the
appropriate context Information services (see the fig 1) and
send context information to recommendation web service.
The location information is collected by two major location
positioning technologies, Global Positioning System (GPS)
and Mobile Positioning System (MPS). The distance is the
Euclidean distance between user location and doctor location.
Time and day information is provided by the computer
system and the weather information is obtained from the
weather bureau website.
c) OGSA-DAI: OGSA-DAI (Open Grid Service Architecture-
Data Access and Integration) [11] is an extensible framework
for data access and integration. It exposes heterogeneous data
resources to be accessed via stateful web services. No
additional code is required to connect to a data base or for
Int'l Conf. Grid Computing and Applications | GCA'08 | 101

Figure 1: Our Proposed CONDOR System Architecture
Figure 2: User query interface in mobile browser
querying data. OGSA-DAI supports an interface integrating
various databases such as XML databases and relational
databases. It provides three basic activities- querying data,
transforming data, and delivering the results using ftp, e-mail
etc. All information regarding users, doctors, hospitals,
recommendation results, doctor’s rating information etc. are
saved through OGSA-DAI to the distributed databases.
d) Recommendation Generation Web Service (RGWS): This
actually generates the recommendation using our
recommendation technique. Usually this generates top 5
doctors who are suitable in user’s current context.
e) Map Service: Using map service, the doctor’s location
map is displayed on the user’s mobile phone browser.
The workflow of our architecture is as follows:
(1) When a user or patient needs the recommendation
service, a recommendation request is sent to the system from
user’s mobile phone web browser.
(2) Then recommendation web service is invoked from the
web service factory for that user. It then collects necessary
information like user’s profile data, current doctor’s
information on that location through OGSA-DAI and user’s
current context information from context manager.
(3) The service broker then schedules the recommendation
service to run on different machines and a list of
recommended doctor’s are generated using our
recommendation algorithm and are passed to the user’s
mobile phone browser through the web portal.
(4) When the user selects a doctor, his location map is
displayed through the map service on the mobile phone’s
web browser display.
(5) User is also asked to provide his/her rating about that
doctor he/she already visited so that the system can produce
better recommendation.
4 Recommendation Process
4.1 Identification of Appropriate Doctors
Using Bayesian Network
To identify appropriate doctors for the individual
mobile patient or user in any location based on his/her
current context, it requires effective representations of the
relationships among several kinds of information as shown in
figure 3. Because many uncertainties exist among different
kinds of information and their relationships, a probabilistic
approach such as a Bayesian Network (BN) can be utilized.
Bayesian networks (BNs) which constitute a probabilistic
framework for reasoning under uncertainty in recent years,
have been representative models to deal with context
inference [14].
With the Bayesian network, we can formulate
user/patient’s interest to a doctor in his/her current situation
Patient/User Id
Doctor Specialty: Cardiology, medicine etc.
Visit Fee Range: Average, Low, High
Condition: Normal/Emergency
Parking Area: (Yes/No)
102 Int'l Conf. Grid Computing and Applications | GCA'08 |

Figure 3: A simple recommendation Space
in the form of a joint probability distribution. For
constructing the structure of the Bayesian network, we need
the knowledge of user preference of choosing a good doctor
in any location. A survey by US National Institute of Health
[15] showed that board certification, rating (reputation), type
of insurance accept, location (distance), visit fee, hours the
service is available and existence of lab test facility, in
descending order, are the most important factors to
user/patient in choosing a new doctor. Also car parking
facility is required by user in doctor’s location. Therefore, we
design the BN structure considering user preference
information as shown in figure 4. From the BN structure we
can easily calculate the probability of Interest (u, d) – interest
of user u on a doctor d, that is,
Interest (u, d) = p (interest | user_age, user_gender, doctor_
specialty, user_ current location, time, user_income) (1)
Figure 4: A BN structure for finding Interest (u, d)
Bayesian networks built by an expert cannot reflect a
change of environment. To overcome this problem, we apply
a parameter learning technique. Based on collected data,
CPTs (Conditional Probability Tables) are learned by using
EM (Expectation Maximization) algorithm as shown below:
Let, V denotes variable set 1 2{ , ,....... }nx x x and S Bayesian
network structure. The value of each variable in structure S
is 1 2{ , ,...., }r
i i ix x x .And 1 2{ , ,...., }mD C C C= is samples data set.
iπ is the parent’s sets of xi . Then ( | )k j
i ip x π represents that
the probability when xi is the kth
and i
π is the jth
, we denote it
byijkθ . The purpose of Bayesian networks parameter learning is
to evaluate the conditional probabilistic density
( | , )p D Sθ using prior knowledge when network structure S
and samples set D are given.
The main task in EM algorithm is calculating
conditional probability ( )( , | , )t
i i lp x Dπ θ for all parameter set
D and all variables xi. When data set D is given, the log
likelihood is:
( | ) ln ( | )l
l
l D p Dθ θ=∑
( , ) lnk j
i i ijk
ijk
f x π θ=∑ (2)
Where ( , )k j
i if x π denotes the value in dataset when i
x k= and
ijπ = , the maximal log likelihood θ can be obtained by :
( , )
( , )
k j
i iijk k j
i i
f x
f x
πθ
π=∑
(3)
The EM algorithm initializes an estimated value (0)θ and
repairs it continuously Th.ere are two steps from current ( )tθ to next ( 1)tθ + , Expectation calculation and Maximum.
Expectation calculation calculates the current expectation of
θ when D is given.
( ) ( )
( | ) ln ( , | ) ( | , )i
t t
l l l l
l x
l p D X p X Dθ θ θ θ=∑∑ (4)
For all θ , there are ( 1) ( )( | ) ( | )t tl lθ θ θ θ+ ≥ . From equation (2):
( )
, ,
( | ) ( , ) lnt k j
t i i ijk
i j k
l f xθ θ π θ= ∑
Where ( )( , ) ( , | , )t
i i i i i l
l
f x p x Dπ π θ=∑ (5)
Maximization chooses next ( 1)tθ + by maximize expectation
of current log likelihood: ( 1) ( )argmax [ ( | ) | , , ]t t
ijkE P D D Sθ θ θ+ ′=
( , )
( , )
k j
i i
k j
j i i
f x
f x
π
π=∑
(6)
Equation (5) calculates the Expectation and (6) the
Maximization. When this EM algorithm converges slowly,
we use the improved E and M step using the procedure in
[16].
4.2 Calculation of Final Ranking Score
Considering User Sensitivity to Location
The sensitivity of users to location is considered by the
CONDOR system. We posit that the likelihood of a doctor
being visited by a user/patient not only depends on hi/her
interest on a doctor but also on distance between them. The
distance is the Euclidean distance between user location and
doctor location. Usually user is more likely to choose a
doctor with highest similarity and minimum distance. In case
of emergency, distance will get more priority and user will
choose a doctor with minimum distance and moderate
similarity. So we consider a distance weight variable (DWV)
User Demographic
Information
User Context
Information
Doctor
Information
Doctor 2 Doctor 1
distance2 distance1
Int'l Conf. Grid Computing and Applications | GCA'08 | 103

for measuring the user’s sensitivity to distance. DWV for a
user u with respect to different doctors i
d is calculated as
follows:
max2
2 max
distance ( , )log [ ]
distance ( , ) +1( . )
log distance ( , )
ii
u d
u dDWV u d
u d= (7)
where i = 1, 2, 3……n (No. of doctors in the similarity list)
maxdistance ( , )u d = The maximum or farthest distance of a
doctor location from user current location among the doctors
in the preferred list.
distance ( , )i
u d = The distance between the user and any
doctor.
In the formula (7), DWV will be reduced when
distance ( , )i
u d increases and DWV is also normalized. I.e., if
distance ( , )i
u d =max
distance ( , )u d , then DWV = 0, if
distance ( , )i
u d = 0, then DWV = 1.Therefore, the final score
for any doctor di for a user u in user’s present position with
current user context is calculated as follows:
1 2 ( , ) ( , ) ( , )i i i
Score u d W Interest u d W DWV u d= ∗ + ∗
………. (8)
where W1 and W2 are two weighting factors
( 1; 0 1; 0 11 2 1 2W W W W+ = ≤ ≤ ≤ ≤ ) reflecting the relative
importance of similarity/interest (u, d) and distance. Based on
the highest score, the doctors will be ranked and
recommended to that particular user/patient.
Initially, W1 = 0.5 and W2 = 0.5 if we consider equal
importance of interest value and distance. If emergency
situation arrives, W1 = 0.1 and W2 = 0.9. Figure 5 illustrates
the scenario of the recommendation process.
Recommendation Input Space
DRS output in the user’s mobile Internet browser
Figure 5: CONDOR’s recommendation construction process
5 Evaluation
5.1 Effectiveness of the Recommendation
Algorithm
In order to find the effectiveness of the recommendation
process, some case studies are presented in this section. We
have created different sample datasets and applied our
recommendation mechanism.
Suppose user x wants to use the CONDOR system for
finding a doctor of Cardiology. So he registers his
demographic information to the system. As Bayesian
Network is used, all data should be in discrete form. Table 1
shows preprocessed data set which consists of demographic
information of user x required for registration. Let, in user’s
current location, the system finds four doctors of cardiology
specialist. User’s current context information is shown in
table 2. Table 3 shows the information of four doctors (D1,
D2, D3 and D4) in user’s current location.
Table 1: Demographic information of user x
User x
Gender Male
Age 30-39
Income (1,000 won) 200-250
Health Insurance No.(If exist) H-0012
Own Car Yes
Table 2: Context information of user x
Context Information of User x
Time 10am – 11am
Weather Sunny
Day Weekday
Location Differ Distance
Table 3: Doctors information in current location
D1 D2 D3 D4
Specialty Card Card. Card. Card.
Board
Certification Yes Yes No No
Overall Rating 0.8 1 0.3 0.3
Accept Health
Insurance Yes Yes Yes Yes
Visit Fee Avg. Avg. Low Avg.
Service Hour
(Weekday)
10a.m.
-
9p.m.
10a.m.
- 9p.m.
9a.m. -
10p.m.
9a.m. -
10p.m.
Service Hour
(Weekend)
10a.m.
-
3p.m.
11a.m.
- 4p.m.
10a.m. -
3p.m.
10a.m.
- 3p.m.
Lab Test
facility Yes Yes No No
Differ
Distance(km) 2 8 5 3
Parking Area Yes Yes Yes No
To calculate the final score of each doctor for
recommendation, first using the formula in equation (1), the
probability of interest of user x to each doctor di is calculated
Doctors’ Information
User Preference
User Context
1 2 ( , ) ( , ) ( , )Score u d W Interest u d W DWV u di i i= ∗ + ∗
Doctor’s List
(Based on Ranking Score)
D1 (View Map)
D2 (View Map)
D3 (View Map)
Distance (Km)
2
4
3
104 Int'l Conf. Grid Computing and Applications | GCA'08 |

using the BN structure as shown in figure 4. We used Hugin
Lite [17] for calculation. Using the equation in (7), the DWV
of doctors’ location is calculated. The results of Interest (x,
Di) and DWV are shown in figure 6.
Figure 6: Interest (x, Di) and DWV value of four doctors
If user x selects normal condition, then final ranking score
for each doctor is calculated using equation (8), considering
W1= 0.5 and W2 = 0.5:
1
RankingScoreD
= 0.5*0.8 + 0.5*0.47 = 0.635
2
RankingScoreD
= 0.5*1.0 + 0.5*0 = 0.5
3RankingScore
D= 0.5*0.65 + 0.5*0.14 = 0.395
4RankingScore
D= 0.5*0.6 + 0.5*0.33 = 0.465
Final doctors list is displayed on user mobile phone web
browser as shown in figure 7.
Figure 7: Recommendation results in normal condition
If in the same position, user x selects emergency condition,
then the result will be calculated considering W1= 0.1 and W2
= 0.9. The result is shown in figure 8. The doctor D4 will not
be in the list since it has long distance.
1RankingScore
D= 0.1*0.8 + 0.9*0.47 = 0.503
2RankingScore
D= 0.1*1.0 + 0.9*0 = 0.1
3
RankingScoreD
= 0.1*0.65 + 0.9*0.14 = 0.191
4RankingScore
D= 0.1*0.6 + 0.9*0.33 = 0.356
Figure 8: Recommendation results in emergency case
5.2 Effectiveness of the Architecture
In this experiment we are concentrated on the on-line
workload of the CONDOR system in Grid environment. Let
us model the CONDOR system as an M/G/1 queue
(centralized system). An M/G/1 queue consists of a FIFO
buffer with requests arriving randomly according to a
Poisson process at rate λ and a server, which retrieves
requests from the queue for servicing. User requests are
serviced at a first-come-first-serve (FCFS) order. We use the
term ‘task’ as a generalization of a recommendation request
arrival for service. We denote the processing requirements of
a recommendation request as ‘task size’ and service time is a
general distribution. All requests in its queue are served on a
FCFS basis with mean service rate µ .
It has been observed that the workloads in Internet are
heavy-tailed in nature [18], characterized by the function,
Pr{ } ~X x xα−> , where 0 2α≤ ≤ . In CONDOR system,
users/patients request for recommendation varies with the no.
of doctors of that category. For example, in case of medicine,
there may be 10,000 doctors, where in case of cardiology; the
no. of doctors may be 2000. Based on the no. doctors the
processing requirements (i.e. task size) also vary. Thus, the
task size on a given CONDOR’s service capacity follows a
Bounded Pareto distribution. The probability density function
for the Bounded Pareto ( , , )B k p α is:
1( )1 ( / )
kf x x
k p
αα
α
α − −=−
where α represents the task size variation, k is the smallest
possible task size and p is the largest possible task size
( )k x p≤ ≤ . By varying the value of α , we can observe
distributions that exhibit moderate variability ( 2)α = to high
variability ( 1)α = . We start the derivation of waiting
time ( )E W . W is the time a user has to wait for service.
( )qE N is the number of waiting customers and ( )E X is the
mean service time. By Little’s law, the mean queue length
( )qE N can be expressed in terms of waiting time. Therefore,
( ) ( )qE N E Wλ= and load on the server, ( )E Xρ λ= . Let
( )jE X be the j-th moment of the service distribution of the
tasks. We have,
(( ) ( ) )
( )(1 ( ) )( )
ln( )
(1 ( ) )
j j
j
p k p k p
j k pE X
k p k
k p
α
α
α
α
α
α
α
−
− −= −
Hence, using P-K formula, we obtain the expected
waiting time in the CONDOR system’s queue, 2( ) ( ) 2(1 )E W E Xλ ρ= − . Now we want to measure the
expected waiting time with respect to varying server load and
task sizes. In centralized CONDOR system, ( )E W waiting
time increases when the service time increases and load on
server also increases. But in the Grid environment, the load
will be distributed to different machines and new load will
if j α≠
if j α=
Doctors List
D1 (View Map)
D2 (View Map)
D4 (View Map)
D3 (View Map)
Distance (Km)
2
8
3
5
Doctor’s List
D1 (View Map)
D4 (View Map)
D3 (View Map)
Distance (Km)
2
3
5
(9)
(10)
Int'l Conf. Grid Computing and Applications | GCA'08 | 105
be (1 )redirect
Pρ = − on primary server and new arrival rate will
be (1 )redirectPλ λ= − . Figure 9 shows the effectiveness of our
CONDOR system in Grid environment compare to CRS in
terms of expected waiting time considering task
variability ( 1.5)α = and redirection probability ( 0.5)redirect
P = .
In figure 9, we can see a reasonable improvement in expected
waiting time in distributed environment. Without sharing
resources, when the system load approaches to 1.0, the user
perceived response time for recommendation service.
Figure 9: Effectiveness of our Grid-based CONDOR system
architecture compare to Centralized RS
6 Conclusion
In this paper, we present a novel context-aware doctor
recommender system architecture called CONDOR in Grid
environment. The system helps a user/patient to find suitable
doctors at the right time, in the right place. We have also
discussed the recommendation process which efficiently
recommends appropriate doctors in case of normal and
emergency case. The CONDOR system based on Grid
technology improves high performance and stability along
with better quality than the centralized ones which are prone
to single point failure and lack the capabilities of improving
recommendation quality and privacy. We are in the
implementation process of the architecture. In future, we will
evaluate our framework using real-world testing data.
Acknowledgement
This research was supported by the MKE (Ministry of
Knowledge Economy), Korea, under the ITRC (Information
Technology Research Center) support program supervised by
the IITA (Institute of Information Technology Advancement) (IITA-2008-(C1090-0801-0002)
References
[1] T. F. Stafford and M. L. Gillenson. “Mobile commerce:
what it is and what it could be”. Communications of the
ACM, 46(12), 2003
[2] Special issue on information filtering. Communications
of the ACM, 35(12), 1992
[3] S. Goyal and J. Carter. “A lightweight secure cyber
foraging infrastructure for resource-constrained Devices”.
The Sixth IEEE workshop on Mobile Computing Systems
and Applications, 2004, pp-186-195
[4] P. Liu, G. Nie, D. Chen and Z. fu. “The knowledge
Grid-Based Intelligent Electronic Commerce Recommender
Systems”. IEEE Intl. Conf. of SOCA, 2007, pp: 223-232
[5] C. Chin, T. K. Shiih and U. Wang. “An Integrated
Analysis Strategy and Mobile Agent Framework for
Recommendation System in EC over Internet”. Tamkang
Journal of Science and Engineering, 2002, 5(3):159-174
[6] P. Han, B. Xie, F. Yang and R. Shen et al. “A scalable
P2P recommender system based on distributed collaborative
filtering”. Expert Systems with Applications, 2004, 27(2)
[7] J. A. Pouwelse, P. Garbacki et al.” Tribler: A social-
based peer-to-peer system”. In the Proceedings of the 5th
International P2P conference (IPTPS 2006), 2006
[8] D. C. Chu and M. Humphrey. “Mobile OGSI.NET:
Grid Computing on Mobile Devices”. The 5th
IEEE/ACM
Int. Workshop on Grid Computing, 2004, Pittsburgh, PA
[9] A.K. Dey. “Understanding and Using Context”,
Personal and Ubiquitous Computing, Vol.5, pp.20-24, 2001
[10] M. V. Setten, S. Pokraev and J. koolwaaij. “ Context-
Aware Recommendation in the Mobile Tourist Application:
COMPASS”. AH-2004, 26-29 August, Eindhoven, The
Netherlands, LNCS, 3137, pp. 235-244
[11] W. Yang, H. Cheng and J. Dia, “A Location-aware
Recommender System for Mobile Shopping Environments”.
Journal of Expert System with Applications, 2006
[12] H. Park, J. Yoo and S. Cho. “A Context-aware Music
Recommendation System Using Fuzzy Bayesian Networks
with Utility Theory”. FSKD 2006, LNAI 4223, pp. 970-979
[13] C. Ono, M. Kurokawa, Y. Motomura and H. Asoh. “A
Context-Aware Movie Preference Model Using a Bayesian
Network for Recommendation and Promotion”, UM 2007,
LNAI 4511, pp. 247-257
[14] P. Korpipaa, et al.”Bayesian Approach to Sensor-based
Context Awareness”. Personal and Ubiquitous Computing,
Vol. 7, pp. 113-124, 2003
[15] http://www.niapublications.org/agepages/choose.asp
[16] S. Zhang, Z. Zhang, N. Yang, J. Zhang and X. Wang
“An improved EM Algorithm for Bayesian Networks
Parameter Learning” Proceedmgs of the Third International
Conference on Machine Learning and Cybernetics, Shanghai,
26-29 August 2004
[17] http://www.hugin.com/Products_Services/Products/De
mo/Lite/
[18] M. E. Crovella, M. S. Taqqu and A. Bestavros. “A
Heavy Tailed Probability Distribution in the World Wide
Web”. A Practical Guide To Heavy Tails, Birkhauser Boston
Inc., Cambridge, MA, USA, pp. 3-26, 1998
106 Int'l Conf. Grid Computing and Applications | GCA'08 |

A Two-way Strategy for Replica Placement in Data Grid
Qaisar Rasool, Jianzhong Li, Ehsan Ullah Munir, and George S. Oreku School of Computer Science and Technology, Harbin Institute of Technology, China
Abstract – In large Data Grid systems the main objective of replication is to enhance data availability by placing replicas at the proximity of users so that user perceived response time is minimized. For a hierarchical Data Grid, replicas are usually placed in either top-down or bottom-up way. We put forward Two-way replica placement scheme that places replicas of most popular files close to the requesting clients and less popular files a tier below from the Data Grid root. We facilitate data requests to be serviced by the sibling nodes as well as by the parent. Experiments results show the effectiveness of Two-way replica placement scheme against no replication.
Keywords: Replication, Replica placement, Data Grid.
1 Introduction Grid computing [5] is a wide-area distributed
computing environment that involves large-scale resource sharing among collaborations, often referred to as Virtual Organizations, of individuals or institutes located in geographically dispersed areas. Data grids [2] are grid infrastructure with specific needs to transfer and manage massive amounts of scientific data for analysis purposes.
Data replication is an important technique used in distributed systems for improving data availability and fault tolerance. Replication schemes are divided into static and dynamic. While static replication is user-centered and do not support the changing behavior of the system, dynamic replication is more suitable for environments like P2P and Grid systems. In general, replication mechanism determines which files should be replicated, when to create new replicas, and where the new replicas should be placed.
There are many techniques proposed in research for dynamic replication in Grid [10, 7, 11, 13]. These strategies differ by the assumptions made regarding underlying grid topology, user request patterns, dataset sizes and their distribution, and storage node capacities. Other distinctive features include data request path and the manner in which replicas are placed on the Grid nodes. Two common approaches for replica placement in a tree topology Data Grid are top-down [10, 7] and bottom-up [11]. In both cases, the root of Data Grid tree is considered as the central repository for all datasets to be replicated.
For a Data Grid tree, usually clients at the leaf nodes generate data requests. A request travels from client to parent node in search of replica until it reaches at root node. We in this paper propose a Two-way replication scheme that takes a different path for data request. It is assumed that the children under the same parent in the Data Grid tree are linked in a P2P-like manner. For any client’s request, if desired data is not available at the client’s parent node, the request moves to the sibling nodes one by one until it finds the required data. If none of the siblings can fulfill the request, the request moves to the parent node one level up. Here also all the siblings are probed and if data not found the request moves to next parent and ultimately to root node.
In Two-way replication scheme we use both bottom-up and top-down approaches to place the data replicas in order to enhance availability of requested data in Data Grid. The files which are more frequent are placed close to the clients and the less frequent files are placed close to the root, one tier below, in the Grid. The simulation studies show the benefit of Two-way replication strategy over the case when no replication is used. We perform experiments with data files of uniform size and with variable sizes separately.
2 Data Grid Model
Several Grid activities such as [3, 8] have been launched since the early years of this century. We find that many practical Grids, for example, GriPhyN [12] employ topology which is hierarchical in nature. The High Energy Physics (HEP) community seeks to take advantage of the grid technology to provide physicists with the access to real as well as simulated LHC [8] data from their home institutes. Data replication and management is hence considered to be one the most important aspects of HEP Data Grids. In this paper we have used the hierarchical Data Grid model.
A tree T is used to represent the topology of the Data Grid which is composed of root, intermediate nodes and leaf nodes. We hereafter refer the intermediate nodes as cache nodes and leaf nodes as client nodes. All client nodes are local sites issuing request for data stored at the root or cache nodes of the Data Grid. For any parent node, all its children are linked into P2P-like manner (i.e. are siblings) and can transfer replicas to each other when required. The only
Int'l Conf. Grid Computing and Applications | GCA'08 | 107

exception is client tier since storage space of a client node is very limited and can hold only one file.
Unlike most of the previous hierarchical model in Data Grid in which data request sequence is along the path from child to parent and up to the root of the tree, our hierarchical model has another data request path. A request moves upward to parent node only after all the sibling nodes have been searched for the required data. The process is as follows:
1. A client c requests a file f. If the file is available in the client’s cache then ok. Otherwise step 2.
2. The request is forwarded to the parent of client c. If data is found there, it is transferred to the client. Otherwise request is forwarded to the sibling node.
3. Probe all sibling nodes one after another in search of data. If data is found, it is transferred to the client via shortest path.
4. If data is not found at any sibling node, the request is forwarded to the parent node and the Step 3 is repeated.
5. Step 4 continues until the request reaches at root. The Data Grid model and example data access paths are
shown in the Fig.1.
Fig.1. Data access operation in hierarchical Grid model
3 Two-way Replication Scheme
Replication techniques increase availability of data and facilitate load sharing. With respect to data access operations, Data Grids are read-only environments in which either data is introduced or existing data is replicated. To satisfy the latency constraints in the system, there are two ways: one is to vary the speed of data transfer, and other is to shorten the transfer distance. Since bandwidth and CPU speed are usually expensive to change, shortening transfer distance by placing replicas of data objects closer to
requesting clients is the cheapest and essential way to ensure faster response time.
The Grid Replication Scheduler (GRS) is the managing entity for two-way replication scheme. At each cache node and the root, a Replica Manager is held that stores information about requested files and the time when requests were made. This info is accumulated and coordinated to GRS into a global workload table G. The attributes of G are (reqArrivalTime, clientID, fileID), where reqArrivalTime is the time when the request is arrived in the system. Replicas are registered in the Replica Catalog when they are created and placed to the nodes in the Grid.
3.1 Replica Creation A replica management system should be able to handle a large number of replicas and their creation and placement. Like most of the previous dynamic replication strategies, we base the decision of replica creation on the data access frequency. Over the time the GRS accumulates access request history in the global workload table G. The table G is processed to get a cumulative workload table W having attributes (clientID, fileID, NoA), where NoA stands for Number of Accesses. This table W is used to trigger replication of requested files. The GRS maintains all the necessary information about the replicas in Replica Catalog. Whenever the decision is made to initiate replication, the GRS registered the newly created replicas into the replica catalog along with the information of their creation time and the hosting nodes.
3.2 Replica Placement As stated, for each newly created replica, the GRS
decides where to place the replica and registers that replica into the Replica Catalog. The decision of replica placement is made in the following way. The GRS sorts the cumulative workload table W on the basis of fileID and NoA; the fileID in ascending and NoA in descending order. Then, Project operation is applied on the sorted table, SW, over fileID and NoA to get table F(fileID, NoA). Since the table F may have many NoA entries corresponding to a fileID, therefore the table is processed to get AF, containing the aggregate values of NoA for each individual file so that GRS become aware of how many times a file was accessed in the system.
Further, the table AF is sorted to get SF. The first half of SF contains entries of more-frequent files (MFFs) and the lower half consists of entries of less-frequent files (LFFs). We simply divide the number of entries in SF by 2 and round the result to an integer. For example, there would be 389 MFFs and 388 LFFs in a table of 777 entries (Fig.2).
A data file may be requested by many clients in the Grid and a client which generates the maximum requests for a file may be termed as the best client node to host the replica of that file. We can easily get the information about the best
108 Int'l Conf. Grid Computing and Applications | GCA'08 |
W SW F AF SF
BC
Fig.2. Procedure to find the MFFs and LFFs
Client file NoA c1 a 20 c2 b 30 c3 a 45 c1 c 40 c4 c 10
Client file NoA c3 a 45 c1 a 20 c2 b 30 c1 c 40 c4 c 10
file NoA a 45 a 20 b 30 c 40 c 10
file NoA a 65 b 30 c 50
file NoA a 65 c 50 b 30
file best client a c3 b c2 c c1
MFFs: a, c LFFs: b
client for any requested file from the table SW. The GRS extracts and stores the entries of best clients for all files into the table BC. The procedure of obtaining MFFs and LFFs from the sorted workload table SW is depicted in Fig.2.
The storage capacity of Grid nodes is an important consideration while replicating the data as the size may be huge. The client nodes comparatively have the lowest storage capacity in the Data Grid hierarchy. Therefore it is not suitable to choose a best client node as a replica server. However, we can get benefit from the principle of locality by placing replicas very close to the best client. We resolve to place replicas at the parent node of the best client. Thus all MFFs are replicated in the immediate parent nodes of the best clients. All the LFFs are replicated at the children of the root node along the path to the best clients.
Two-wayReplicaPlacement(W) t Get-Time()
SW Sort(W) over fileID ASC, NoA DESC BC Extract-BestClient(SW) F project(SW) over fileID, NoA AF Aggregate-NoA(F) over fileID SF sort(AF) over NoA MFF Upper-Half(SF) LFF Lower-Half(SF) con Replicate-HFF(HFF, BC, t) Replicate-LFF(LFF, BC, t)
Fig.3. Two-way Replica Placement Algorithm
After replication, the GRS will flush out the workload
tables in order to calculate the access statistics afresh for the next interval. While placing a replica if GRS finds that desired replica is already present at the selected node, it just updates the replica creation time in the catalog. The steps of Two-way replica placement algorithm are given in Fig.3.
The replication of MFFs and LFFs are depicted by the functions Replicate-MFF and Replicate-LFF respectively. These functions are executed concurrently to get the replicas spread to the selected locations. In each case, the replicas are placed along the way to the best client. Fig.4 depicts the steps for Replicate-MFF algorithm. For each file entry in the table MFF, the GRS finds its best client by consulting the table BC and then replicates that file at the parent node of its best client. Steps for Replicate-LFF algorithm are shown in Fig.5
Replicate-MFF(MFF, BC, t)
for all record r in MFF do f r.fileID
c BC[f].nodeID p Parent(c)
if Exist-in(f) Update-CT(f, p, t) end if skip to end if AvailableSpace(p, t) < size(f) Evacuate(p, t) end if Replicate(f, p, t) end for
Fig.4. Algorithm for Replicating MFF files
If the free space of the replica server is less than the size
of the new replica, then some replicas may be deleted to make room for the new replica. Only if the available space of the node is greater or equal to the size of the requested data file, can functions Replicate-MFF and Replicate-LFF be called. In each case, the function reserves the storage space for file f in the selected node first, and then invokes the transmission of file f to the candidate node in the
Int'l Conf. Grid Computing and Applications | GCA'08 | 109

background. The replica is transferred to the selected destination from a closest node that has the replica of data file f. After the transmission is completed, the new replica’s creation time is set to t.
Replicate-LFF(LFF, BC, t) for all records r in LFF f r.fileID n BC[f].nodeID while n ≠ Root do n parent(n) end while c child(n) if Exist-in(f, c) update-CT(f, c, t) skip to end end if if AvailableSpace(c, t) < size(f) Evacuate(c, t) end if Replicate(f, c, t) end for
Fig.5. Algorithm for Replicating LFF files
3.3 Replica Replacement Policy
A replica replacement policy is essential to make decision which of the stored replicas should be replaced with the new replica in case there is a shortage of storage space at the selected node. At a specific time, the available space of a replica server will be equivalent to its remaining free space plus the space occupied by the possible redundant replicas. A replica is considered as redundant if it is created earlier than the current time session and currently not being active or referenced; meaning there is no request in the current session for this replica.
The function Evacuate in Replicate-MFF and Replicate-LFF is used for this purpose. For a given selected node it checks the creation times of all present replicas and continues to remove each redundant replica until the storage space is sufficient to host the new replica.
4 Experiments
In order to evaluate the proposed Two-way Replica Placement scheme, we conduct experiments using the Data Grid model shown in Fig.1. The link bandwidth was constructed according to the estimations shown in Table 1. We consider the data to be read-only and so there are no consistency issues involved.
The simulation runs in sessions and each session having a random set of requests generated by various clients in the system. When a client generates a request for a file, the replica of that file is fetched from the nearest replica server
and transported and saved to the local cache of the client. Initially all the data was held only at root node. As the time progresses, the access statistics are gathered and are used for the decision of replica creation and placement. When a replica is being transferred from one node to another, the link is considered busy for the duration of transfer and cannot be used for any other transfer simultaneously. We used an access pattern with medium degree of temporal locality. That is, some files were requested more frequently than others and such requests were 60% of the whole.
Table 1. Grid tiers link bandwidth
Data Grid tiers Bandwidth Scaling Tier 0 – Tier 1 2.5 Gbps 1MB Among Tier 1 7.0 Gpbs 2.8MB Tier 1 – Tier 2 2.5 Gpbs 1MB Among Tier 2 7.0 Gpbs 2.8MB Tier 2 – Tier 3 622 Mbps 0.24MB
We run experiments in two categories. In first category,
we use files of variable sizes ranging 500MB to 1GB. And in experiments of second category we used files of uniform size of 1GB. For convenience, we did scaling to file sizes and bandwidth values uniformly, reducing 1GB file size to 3.2MB. The scaling of bandwidth values between tiers is given in Table 1.
0
2
4
6
8
10
12
14
16
18
1 2 3 4 5
Request patterns with medium degree of temporal locality
Avg
Res
pons
e Ti
me
(sec
)
No Replication Two-way Strategy
Fig.6. Experiment with data files of variable sizes
0
5
10
15
20
25
1 2 3 4 5
Request patterns with medium degree of temporal locality
Avg
Res
pons
e Ti
me
(sec
)
No Replication Two-way Strategy
Fig.7. Experiment with data files of uniform size
110 Int'l Conf. Grid Computing and Applications | GCA'08 |

For each client node, we keep a record of how much time it took for each file that it requested to be transported to it. The average of this time for various simulation runs was calculated. Compared to no replication case, the Two-way replication technique presents better performance as shown in Fig.6 and Fig.7. Since the file size is uniform in the experiment of second category, therefore in Fig.7 we have a straight line for no replication case.
5 Related Work
An initial work on dynamic data replication in Grid environment was done by Ranganathan and Foster in [10] proposing six replication strategies: No Replication or Caching, Best Client, Cascading, Plain Caching, Cascading plus Caching and Fast Spread. The analysis reveals that among all these top-down schemes, Fast Spread shows a relatively consistent performance through various access patterns; it gives best performance when access pattern are random. However when locality is introduced, Cascading offers good results. In order to find the nearest replica, each technique selects the replica server site that is at the least number of hops from the requesting client.
In [1] an improvement in Cascading technique is proposed namely Proportional Share Replication policy. The method is heuristic one that places replicas on the optimal locations when the number of sites and the total replicas to be distributed is known. The work on dynamic replication algorithms is presented by Tang et al [11] in which they have shown improvement over Fast Spread strategy while keeping the size of data files uniform. The technique places replicas on Data Grid tree nodes in a bottom up fashion.
In [9, 13], replica placement problem is formulated mathematically followed by theoretical proofs of the solution methods.
A hybrid topology is used in [6] where ring and fat-tree replica organizations are combined into multi-level hierarchies. Replication of a dataset is triggered when requests for it at a site exceed some threshold. A cost model evaluates the data access costs and performance gains for creating replicas. The replication strategy places a replica at a site that minimizes the total access costs including both read and write costs for the datasets. The experiments were done to reflect the impact of size of different data files and the storage capacities of replica servers. The same authors proposed a decentralized data management middleware for Data Grid in [7]. Among various components of the proposed middleware, the replica management layer is responsible for the creation of new replicas and their transfer between Grid nodes. The experiments were done considering both the top down and bottom up methods separately with data repository located at the root of Data Grid and at the bottom (clients) respectively.
Each of these techniques uses either the top-down or bottom-up method for replica placement at a time. We in our work have used both methods together in order to enhance the data availability.
6 Conclusions The management of huge amounts of data generated in scientific applications is a challenge. By replicating the frequent data to the selected locations, we can enhance the data availability. In this paper we proposed a two-way replication strategy for Data Grid environment. The most frequent files are placed very close to the users and the less frequent files are replicated from top to bottom one tier down the Grid hierarchy. The experiment results show the performance of two-way replica placement scheme.
7 References [1] J. H. Abawajy. “Placement of File Replicas in Data Grid Environments” Proceedings of International Conf on Computational Sciences, LNCS 3038, 66-73, 2004.
[2] A. Chervenak, I. Foster, C. Kesselman, C. Salisbury and S. Tuecke. “The Data Grid: Towards an Architecture for the Distributed Management and Analysis of Large Scientific Datasets”; Journal of Network and Computing Appl., v23, 3, 187-200, 2000.
[3] EGEE, http://www.eu-egee.org/
[4] Q. Fan, Q. Wu, Y. He, and J. Huang. “Transportation Strategies of the Data Grid” International Conference on Semantics, Knowledge, and Grid (SKG), 2006.
[5] Ian Foster and Carl Kesselman. “The Grid2: Blueprint for a New Computing Infrastructure” Morgan Kaufmann, 2003.
[6] H. Lamehamedi, B.K. Szymanski, Z. Shentu and E. Deelman. “Data Replication Strategies in Grid Environments” Proceedings of International Conf on Antennas and Propagation (ICAP), IEEE Computer Science Press, Los Alamitos, CA, 378-383, Oct 2002.
[7] H. Lamehamedi and B.K. Szymansi. “Decentralized Data Management Framework for Data Grids”; FGCS (Elsevier), v23, 1, 109-115, 2007.
[8] LHC Computing Grid, http://www.cern.ch/LHCgrid/
[9] Y.F. Lin, P. Liu and J.J. Wu. “Optimal Placement of Replicas in Data Grid Environment with Locality Assurance” International Conference on Parallel and Distributed Systems (ICPADS), 2006.
Int'l Conf. Grid Computing and Applications | GCA'08 | 111

[10] Kavitha Ranganathan and Ian Foster. “Identifying Dynamic Replication Strategies for a High-performance Data Grid” Proceedings of International Grid Computing Workshop, LNCS 2242, 75-86, 2001.
[11] Ming Tang, Bu-Sung Lee, Chai-Kiat Yeo and Xueyan Tang. “Dynamic Replication Algorithms for the Multi-tier Data Grid”; FGCS (Elsevier), v21, 775-790, 2005.
[12] Grid Physics Network, http://www.griphyn.org/
[13] Y. Yuan, Y. Wu, G. Yang and F. Yu. “Dynamic Data Replication based on Local Optimization Principle in Data Grid” 6th International Conference on Grid and Cooperative Computing (GCC), 2007.
112 Int'l Conf. Grid Computing and Applications | GCA'08 |

The Influence of Sub-Communities on a Community-Based Peer-to-Peer
System with Social Network Characteristics
Amir Modarresi1, Ali Mamat2, Hamidah Ibrahim2, Norwati Mustapha 2
Faculty of Computer Science and Information Technology, University Putra Malaysia [email protected],
2{ali,hamidah,norwati}@fsktm.upm.edu.my
Abstract
The objective of this paper is to investigate the
effect of sub-communities on Peer-to-Peer systems
which have social network characteristics. We
propose a general Peer-to-Peer model based-on
social network to illustrate these effects. In this model
the whole system is divided into several communities
based on the contents of the peers and each one is
divided into several sub-communities. A computer
based model is created and social network
parameters are calculated in order to show the effect
of sub-communities. The result confirms that a large
community with many highly connected nodes can be
substituted with many sub-communities with normal
nodes.
Keywords: Peer-to-peer computing, social network,
community
1. Introduction
There are many systems form a network structure;
a combination of vertices which are connected by
some edges. Among them we can mention social
network like collaboration network or acquaintance
network; technical network such as World Wide Web
and electrical network; biological network, such as
food network and neural network. The concepts of
social networks are applicable in many technical
networks, especially those which connect people.
These concepts help designers to catch more
information about a group of people who are using
the network and the result is providing better services
for the group according to their interests and needs.
Peer to Peer (P2P) systems also settle in this
structure. Since people are working with these nodes,
social network concepts can be applicable for them.
In theoretical point of view, P2P systems create a
graph in a way that each node will be a vertex and
each neighborhood relation between two nodes will
be an edge of this graph. When no criterion is
considered for choosing a neighbor, this graph will be
a random graph [1]; however, two important factors
[2] change this characteristic in P2P: 1) principal of
limited interest which declares that each peer interests
in some few contents of other peers and 2) spatial
locality law. Since each node represents one user in
the system, a P2P will be a group of users with
different interests who try to find similar users. Such
structure creates a social network. On the other hand
Barab´asi [3] has shown that in the real social
network the probability of occurring a node with
higher degree is very low. In other words, the higher
the degree the least likely it is to occur. This relation
is defined by power law distribution, i.e. 𝑝 𝑑 = 𝑑−𝑘
where k>0 is the parameter of distribution, for degree
of network nodes. The network model which has
been defined with characteristics in [3] has a short
characteristic path length and a large clustering
coefficient as well as a degree distribution that
approaches a power law. Characteristic path length is
a global property which measures the separation
between two vertices; whereas clustering coefficient
is a local property which measures the cliquishness of
a typical neighborhood. As an example, we envision the scenario of
sharing knowledge among researchers. Since each
researcher has a limited number of interests, he can
communicate with other researchers who work in the
same area of interests. Because of many limitations
like distance and resources researcher usually work
with their colleagues in the same institute or college.
Sometimes these connections can be extended to
other places in order to get more cooperation. This
behavior defines a social network with some dense
clusters where these clusters are connected by few
connections like figure 1. If one researcher is
represented by one node, a P2P system will be
created which obeys social network characteristics.
Int'l Conf. Grid Computing and Applications | GCA'08 | 113

The remaining of this paper is organized as
below. In section 2 some related works are reviewed.
In section 3 community concepts and structure of the
model are explained. In section 4 setting up a
computer-based model and results are shown and
section 5 concludes the paper.
2. Related Works
Different structures and strategies have been
introduced for P2P system for better performance and
scalability. This part mainly reviews those
approaches which focus on community and peer
clustering.
Locality proximate clusters have been used to
connect all peers with the same proximity in one
cluster. Number of hop counts and time zone are
some of criteria for detecting such proximity. In [4]
the general clusters have been introduced which
support unfixed number of clusters. Two kinds of
links, local and global, connect each node to other
nodes in their own cluster or nodes in other clusters.
This clustering system doesn’t concern about content
of nodes. Physical attributes are the main criteria for
making clusters. In [5] a Semantic Network Overly
(SON) has been created based on common
characteristics in an unstructured model. Peers with
the same contents are connected to each other and
make a SON which is actually a semantic cluster. The
whole system can be considered as sets of SONs with
different interest. If a peer, for example, in SON S1
searches contents unrelated to his group, finding
proper peer is not always very efficient. If there is no
connection between S1 and the proper SON, flooding
must be used.
Common interest is another criterion for making
proper overlay. In [6] all peers with the same interest
make a connection with each other, but locality of
peers in one interest group has not been concerned. In
[7] all peers with the same interests are recognized
after receiving many proper answers based on their
interests. Such peers make shortcuts, a logical
connection, to each other. After a while a group of
peers with the same interests will be created and the
richer peer in connection will be the leader of the
group. Since this structure is based on unstructured
system and receiving proper answer in the range of
the issued queries, we cannot expect that all peers
with the same interests in the system are gathered in
one group.
In [8] communities have been considered.
Authors have described community as the
gregariousness in a P2P network. Each community is
created by one or more peers that have several things
in common. The main concern in this paper was
connectivity among peers in communities. They have
explained neither the criteria of creation nor size of
each community. In [9] communities have been
modeled like human communities and can be
overlapped. For each peer three main groups of
interest attributes have been considered, namely
personal, claimed, and private. Interests of each peer
and communities in the system are defined as
collections of those attribute values and peers whose
attributes conform to a specific community will join
it. Since 25 different attributes have been used in the
model, finding a peer which has the same values for
all of these attributes is not easy. That is why a peer
may join in different communities with partial match
in its attributes. Although the concept of communities
is the same as our work, in our model a shared
ontology defines the whole environment and one
community is part of the environment. There is also a
bootstrapping node in each domain in order to
prevention of node isolation. Our model also uses
such nodes, but their main role is controlling sub-
communities. [10] uses a shared ontology in
unstructured P2P for peer clustering. Each peer
advertises his expertise to all of his neighbors. Each
neighbor can accept or reject this advertisement
according to his own expertise. Expertise of each
peer is identified by the contents of files which the
peer has stored. Since the ontology is used, a generic
definition for the whole environment of the model is
provided which is better than using some specific
attributes.
Super peers have also been used for controlling
peer clustering and storing global information about
the system. In [11] super peers are used in partially
centralized model for indexing. All peers who obey
system-known specific rules can connect to a
designated super peer. It creates a cluster that all
peers have some common characteristics. Search in
each cluster is done by flooding, but sending query to
just a group of peers will produce better performance.
According to these rules, super peers who control
common rules must create larger index; therefore
they need more disk space and CPU power. In [12]
instead of using rules, elements of ontology are used
for indexing. In this structure each cluster is created
based on indexed ontology which is similar to our
method. All peers with the same attribute are
indexed. Our model also uses super peers and
elements of ontology for indexing, but instead of
One cluster Bridge
Figure 1: Many related clusters create a community
114 Int'l Conf. Grid Computing and Applications | GCA'08 |

referring to each node in the cluster, super peers refer
to the representative of that cluster which controls
sub-communities of a specific community. This will
reduce the size of index to number of elements in
ontology which is usually less than the number of
peers in a large system and provide better scalability.
3. Overview and Basic Concepts of the
Proposed Model
We investigate the effect of sub-communities
based on a proposed social network P2P model. First,
we briefly state the community concept and then we
introduce the model. This model uses ontology for
defining the environment of the system and creating
communities. It also uses super peers for referring to
these communities. Sub-communities are considered
for better locality inside each community.
3.1. Community Concepts
A social network can be represented by a graph
G(V, E) where V denotes a finite set of actors, simply
people, in the network and E denotes relationship
between two connected actors such that E VV.
Milgram [13] has shown that the world around us
seems to be small. He experimentally showed that
average shortest path between each two persons is
six. Although this is an experimental result, we
experience it in the real world. We usually meet
persons who are unknown for us but turn out to be a
friend of one of our friends. People usually make a
social cluster based on their interests but in different
size. Such clusters which are usually dense in
connections are connected to each other by few paths.
All of these clusters with similar characteristics
create a community. In each community: 1) each
person must be reachable in reasonable steps (what
Milgram named as small world) and 2) each person
must have some connections to others which are
defined by clustering coefficient. With such
characteristics some structure like tree or lattice
cannot show the behavior of social network. As
stated previously in section 1, each dense cluster in
the network is connected to few other clusters. In
each cluster, some individuals who are called hubs
are more important than others, because they have
more knowledge or connections than other
individuals. In order to join to a cluster as a new
member either a known person or a member of the
cluster must be addressed. We summarize an example as an instantiate of our
model. A computer scientist regularly has to search
publications or correct bibliographic meta data. A
scenario which we explain here is community of
researchers who share the bibliographic data via a
peer-to-peer system. Such scenarios have been
expressed in [14] and [10]. The whole data
environment can be defined by ACM ontology [15].
Each community in the system is defined by an
element of the ontology and represented by a
representative node. Each community comprises of
many sub-communities or clusters which are gathered
around a hub. We show the effectiveness of sub-
communities by the model. Figure 2 depicts this
example.
As a social network point of view, hubs in our
model have been defined with the same
characteristics in the social network, like a
knowledgeable person with rich connection. They
define sub-communities or clusters inside a
community. They may also make connection with
other hubs. Representative and super peers work as a
bridge in the model among communities. The
difference is that representatives work as a bridge
among communities which are closer in the ontology,
while super peers work as bridges among all
communities. Peers have a capacity for making
connections which is defined based on power law
distribution. It doesn’t allow the model to change to a
tree like structure.
3.2. Definition of the Model
We define our P2P model M (like figure 2) as
below.
M has a set of peer P where: 𝑃 = 𝑝1,𝑝2 , … , 𝑝𝑛 . Each peer pi can have d different direct neighbors
which make set Ni and each of them are identified by
dij defined jth
neighbor of peer i as: 𝑁𝑖 = 𝑑𝑖1 , 𝑑𝑖2 , … , 𝑑𝑖𝑑 . As a direct neighbor, pk is one
logical hop away from pi, but physical connection
between pi and pk may not a one hop connection.
M uses shared ontology O in order to define the
environment of the model; therefore by using a
proper ontology this model can be applicable for
different environment. For simplicity all peer pi have
the same ontology.
O can define several logical communities which
have many peers with common interest. Each
One Sub-community
Representative
Hub
Ordinary peer
Hub
<acm:SubTopic>ACMTopic
/Information_Systems</acm:
SubTopic>
Figure 2: Principle elements of the model
One Community
<acm:SubTopic>A
CMTopic/Software
</acm:SubTopic>
Super Peer
Int'l Conf. Grid Computing and Applications | GCA'08 | 115

community cl contains at least one member as a
known member who is the representative of that
community. This role is usually granted to the first
peer who defines a new community cl and identified
by rl.
Since each community in real world is a set of
clusters or sub-communities and members of each
cluster usually obey some kind of proximity, such a
structure must be considered in the model. Good
criteria to address the proximity in a network can be
either number of hop or IP address as a less precise
metric. Since all peers in one community have similar
interest, located peers with closer number of hop, it
may provide closer distance among peers. Such
configuration gives better response time for queries
whose answers are in one community. In other word,
locality of interest will be established in a better form
inside the community. Popular peers or hubs are
defined in order to provide such locality. Hubs are
peers who are rich in contents and connections in a
specific place. Each hub creates a sub-community or
cluster in one area of a community. All other peers
with the same interest who are in his nearby will
connect to this hub and complete the sub-community.
Since hubs establish many connections to other peers
they are a good point of reference for searching
documents. Hubs in one community can be connected
to each other in order to create non-dense connections
among sub-communities like figure 1. They create set
ppl for cl. Formally, we have: ∨ 𝐶𝑙 : 𝑝𝑝𝑙 = 𝑝1 , 𝑝2 , … , 𝑝𝑠 Where S is number of sub-
communities or hubs in the community, identified by
policy of the system. Each hub in the community cl is
also refereed by the representative rl.
Once peer pi joins the community, pi asks
representative rl about sub-communities inside the
community. rl sends address of all hubs in ppl of the
community. pi communicates with each of them and
calculates his distance from each member of ppl. The
shorter distance to any member of ppl identifies the
cluster which pi must join.
Contents of shared files in each pi identify the
interest of pi. These interests can be defined by shared
ontology O which is stored in each peer to understand
the relationship among communities. If pi has
different kinds of files which distinguish different
interest, pi can contribute in different community cl, as
a result, two communities can be connected to each
other via pi.
M also has a set of super peer SP where:
𝑆𝑃 = 𝑠𝑝1 , 𝑠𝑝2 , … , 𝑠𝑝𝑚 𝑎𝑛𝑑 𝑚 ≪ 𝑛
At the time of joining, pi will announce his
interest to the closest super peer spk. According to the
announcement, spk will identify the community who
has similar interest. Actually spk identifies rl, the
representative of the community cl. Since number of
communities are few as number of elements in the
shared ontology, the size of index will be smaller
than similar models which super peers index files or
even peers in the system. This feature let the system
be more scalable than the similar ones.
The structure of the model M creates
interconnected communities. This advantage let any
peer can search the network for any interest, even if
that interest is not as same as his own interest. Super
peer spk provide such connections in the highest level
of the model; while, representative rl of community cl
creates interconnected sub-communities in lower
level. Sub-community interconnection provides a
path to nearly any peer inside the community. It
means that a piece of data can be retrieved with high
probability in the system with low overhead; because
one part of the system, a community, for a specific
query is searched.
4. Simulation Setup
We wrote a simulator to create a computer based
community model to show the behavior of sub-
communities and in what extend they are close to a
social network. We run two different experiments. In
the first experiment we just simulate one community
and assume that all peers with the same contents
based on a shared ontology are gathered in a specific
community, and then social network parameters are
calculated in order to show the efficiency of the
model. Since in each community all peers have the
same characteristics, showing the behavior of one
community is enough to show the characteristics of
the whole system; although simulating more than one
community is also possible.
In the second experiment we define two different
communities with different interests and create
queries in the system, then we calculate number of
successful queries and recall for finding answers.
In the both experiment, we define the number of
peers in the model in advance and identify a capacity
for making connections with other peers based on
power law distribution. The distribution of the
connections among peers which is defined by the
simulator is shown in figure 3. During the simulation,
joining and leaving of peers are not considered. The
first peer who joins the community is chosen as the
representative of the community. Based on the
definition of the model many peers who are richer in
connection are chosen as hubs. When a new peer
joins the community, he communicates with the
representative. Representative returns addresses of
the hubs in the community. Then, new peer sends a
message to each hub and calculates his distance from
them. This is done in the model by defining random
hops between new peer and hubs. The hub with the
116 Int'l Conf. Grid Computing and Applications | GCA'08 |

smallest path is chosen. Since hubs are normal peers
with higher capacity for accepting connection, if all
the connections have already been used another hub
will be chosen. Such a restriction in connection
limitation has many reasons. First, it allows
controlling the connection distribution in the system.
Second, after all hubs are full, the new peer must
connect to other normal peers. This mimics the
behavior of joining a member to a community by
another member. If the new peer has capacity more
than one connection, other neighbors will be chosen
randomly. First, all the members inside the same sub-
community are chosen because they may have shorter
distance and then, if all peers cannot accept any more
connections, other peers from other sub-communities
are chosen. These kinds of connections create
potential bridges among sub-communities which
make different sub-communities are connected
accompany with the representative of the community.
Since the locality is the main concern, such
connections will be established if the target peers is
rich in favor contents.
Figure 3: Distribution of connection among nodes
Watts in [16] has shown that a small world graph
is a graph which is located between regular and
random graphs. Such a graph has a characteristic path
length as low as random graph and cluster coefficient
as high as regular graph. The highest cluster
coefficient belongs to fully connected graph and
shortest path is obviously 1. So we calculate cluster
coefficient and characteristic path length for the
model.
Table 1 shows the result of cluster coefficient for
a community with 500 nodes. The capability of
accepting maximum connections, the number of hubs
and sub-communities are changing.
As it can be expected, by defining sub-
communities cluster coefficient is increased even
with just one sub-community. With the small number
of hubs and less capability of accepting connection,
many peers are connected to each other without any
connection to any hubs. This effect defines longer
characteristic path length in table 2. When number of
connections is increased, the cluster coefficient is
also increased. Moreover, there will be more chance
for other peers to connect to hubs. It decreases the
characteristic path length. When capability of
accepting connections is high, more than number of
peers in the community, the graph of the model is
moving toward complete graph. This explains larger
value for cluster coefficient. Moreover, existence of
many points of references in the model, hubs,
decreases the characteristic path length. Needless to
say, when peers have high capability of accepting
connections, many other clusters are created inside
the sub-community. Since they are implicit, reaching
them won’t be very fast, except through its explicit
sub-community.
Table 1: The value of cluster coefficient for different sub-communities and connections
Figure 4: Cluster coefficient while maximum connections change in different sub-communities
Since the results in table 1 show the path length for
one community, by adding 2 extra steps the value for
the whole model is calculated. This is the average
path length when one peer in one community tries to
reach another one in different community through the
available super peers in the model.
In the second experiment, we define two different
communities and 1000 peers in advance. Each peer
can choose one of the defined communities and join
it during network construction. This selection is
based on the interest of the peers which is related to
loaded files for each peers. 60 percent of loaded files
in each peer have the similar interests as same as
peer’s interest. The other 40 percent are files which
are not related to the interest of the peer. Moreover,
we do not consider any special shared data capacity
for hubs. A peer is chosen as a hub that has larger
data capacity with the same distribution that other
Max.
Connections
40
hubs
20
Hubs
10
hubs
5
hubs
1
Hub
No
Hub
10 0.39 0.26 0.19 0.14 0.11 0.096
50 0.41 0.39 0.42 0.29 0.15 0.11
100 0.43 0.4 0.42 0.46 0.25 0.15
500 0.57 0.56 0.53 0.54 0.59 0.48
1000 0.69 0.64 0.64 0.62 0.64 0.48
0
0.1
0.2
0.3
0.4
0.5
0.6
0.7
0.8
0 200 400 600 800 1000 1200
Clu
sete
r C
oe
ffie
cen
t
Maximum Connections
No
1
5
10
20
40
Sub Communities
0
50
100
150
200
250
300
350
0 50 100 150 200 250
Fre
qu
en
cy
Connections
Frequency of Nodes per Connections
Int'l Conf. Grid Computing and Applications | GCA'08 | 117

peers obey. Considering extra storages creates better
results.
Table 2: The value of characteristic path length for different sub-communities and connections
Figure 5: Characteristics path length while
maximum connections change in different sub-communities
Throughout the simulation, a peer is chosen
randomly and poses a query. The query may have the
same interest as the peer’s interest or other interests
which have defined in the model. If the query has the
same interest, answers will be found in the same
community, otherwise it is sent to a proper
community. We define a successful query as a query
which can retrieve at least one result. As we can
expect, by increasing number of sub-communities
and cluster coefficient the number of successful
queries is also increased. Figure 6 shows this result.
Likewise the recall rate is also increased. The recall
rate is also affected by these changing. Figure 7
shows the values of recall rate.
Figure 6: Success rate while maximum connections change in different sub-communities
Figure 7: Recall values for different sub-
communities when maximum connection change
In unstructured network when flooding is used for
answering queries, number of neighbors has a direct
effect on recall rate and also network traffic. By
defining many sub-communities we can obtain same
recall rate with lower network connection. Moreover,
during answering queries just one part of the network
is affected by produced traffic.
5. Conclusion
We can conclude that when sub-community
concept is used, powerful nodes in P2P systems can
be substituted with normal nodes and few
connections. Choosing a tradeoff between maximum
number of connections in the system and number of
sub-communities can reduce resource consumption in
nodes and index size in representatives. In other
words, by using sub-communities a P2P model like
our model can be constructed with regular nodes
instead of powerful nodes.
References
[1] Erdős, P. and Rényi, A. "On Random Graphs", 1956.
[2] Chen, H., Z., Huang and Gong, Z., "Efficient Content
Location in Peer-to-Peer Systems.", In proceedings of the
2005 IEEE International Conference on e-Business
Engineering (ICEBE’05), 2005.
[3] Barab´asi, Albert-L´aszl´o and Albert, R´eka.,
"Emergence of Scaling in Random Networks.", Sience,
1999, Vols. 286:509-512.
[4] Hu, T. -H and Sereviratne, A., "General Clusters in
Peer-to-Peer Networks.", ICON, 2003.
[5] Crespo, A. and Garcia-Molina, H., "Semantic Overlay
Networks for P2P Systems.", USA : Agents and Peer-to-
Peer Computing (AP2PC), 2004.
[6] Sripanidkulchai, K., Maggs, B. M. and Zhang, H.,
"Efficient Content Location Using Interest-Based Locality
in Peer-to-Peer Systems", INFOCOM, 2003.
[7] Chen, Wen-Tsuen, Chao, Chi-Hong and Chiang, Jeng-
Long., "An Interested-based Architecture for Peer-to-Peer
Network Systems.", AINA 2006, 2006.
0
1
2
3
4
5
0 200 400 600 800 1000 1200
Pat
h L
engt
h
Maximum Connections
No
1
5
10
20
40
Sub Communities
0
0.2
0.4
0.6
0.8
1
0 10 20 30 40 50
Succ
ess
Rat
e
Maximum Connections
No
1
5
10
20
40
Sub Communities
0
0.1
0.2
0.3
0.4
0.5
0.6
0.7
0.8
0.9
0 10 20 30 40 50
Rec
all
Maximum Connections
No
1
5
10
20
40
Sub Communities
Max.
Connections
40
hubs
20
Hubs
10
Hubs
5
Hubs
1
Hub
No
Hub
10 3.08 3.75 4.14 4.24 4.36 4.42
50 2.64 2.67 2.76 2.83 2.88 2.92
100 2.48 2.47 2.54 2.55 2.52 2.61
500 2.04 2.01 2.06 2.11 1.91 1.96
1000 1.95 1.91 1.91 1.93 1.88 2.01
118 Int'l Conf. Grid Computing and Applications | GCA'08 |

[8] Shijie, Z., et al., "Interconnected Peer-to-Peer Network:
A Community Based Scheme.", AICT/ICIW 2006, 2006.
[9] Khambatti, M., Dong Ryu, K. and and Dasgupta, P.,
"Structuring Peer-to-Peer Networks Using Interest-Based
Communities.", DBISP2P 2003, Springer LNCS 2944,
2003.
[10] Haase, P., et al., "Bibster - A Semantics-Based
Bibliographic Peer-to-Peer System.", In international
Semantic Web Conference 2004, 2004.
[11] Nejdl, W., et al., "Super Peer-Based Routing and
Clustering Strategies for RDF-Based Peer-to-Peer
Networks.", In proceedings of WWW 2003, 2003.
[12] Schlosser, M., et al., "HyperCuP—Hypercubes,
Ontologies and Efficient Search on P2P networks.",
Bologna, Italy : In International Workshop on Agents and
Peer-to-Peer Computing, 2002.
[13] Milgram, S., "The Small World Problem.",
Psychology Today, 1967, Vols. 1(1):61-67.
[14] Ahlborn, B., Nejdl, W. and Siberski, W., "OAI-P2P: A
Peer-to-Peer Network for Open Archives.", In 2002
International Conference on Parallel Processing Workshops
(ICPPW’02), 2002.
[15] ACM. 1998 ACM Computing Classification System.
[Online] http://www.acm.org/class/1998.
[16] Watts, D. and Strogatz, S., "Collective Dynamics of
'Small World' Networks.", Nature Journal, Vol. 393, P.440-
442, 1998.
Int'l Conf. Grid Computing and Applications | GCA'08 | 119

120 Int'l Conf. Grid Computing and Applications | GCA'08 |

SESSION
SECURITY AND RELIABILITY ISSUES +MONITORING STRATEGIES
Chair(s)
TBA
Int'l Conf. Grid Computing and Applications | GCA'08 | 121

122 Int'l Conf. Grid Computing and Applications | GCA'08 |

Estimating Reliability of Grid Systems using Bayesian Networks
O. Doguc, J. E. Ramirez-Marquez
Department of Systems Engineering and Engineering Management, Stevens Institute of Technology, Hoboken, New Jersey 07030, USA
Abstract - With the rapid spread of computational environments for large-scale applications, computational grid systems are becoming popular in various areas. In general, a grid service needs to use a set of resources to complete certain tasks. Thus, in order to provide a grid service, allocating required resources to the grid is necessary. The conventional reliability models have some common assumptions that cannot be applied to the grid systems. This paper discusses the use of Bayesian networks as an efficient tool for estimating grid service reliability.
Keywords: Bayesian networks, K2, Grid system reliability
1 Introduction With the rapid spread of computational environments
for large-scale applications, computational grid systems are becoming popular in various areas. However most of those applications require utilization of various geographically or logically distributed resources such as mainframes, clusters and data sources owned by different organizations. In such circumstances, grid architecture offers an integrated system in which the communication between two nodes is available. The ability to share resources is a fundamental concept for grid systems; therefore, resource security and integrity are prime concerns [1]. Traditionally, the function of computer networks is to exchange files between two remote computers. But in grid systems there is a demand that networks can provide all kinds of services such as computing, management, storage and so on [2].
Grid system reliability becomes an important issue for the system users due to excessive system requirements. As an example, the Internet is a large-scale computational grid system. Due to large number of internet users and the resources that are shared through Internet, interactions between the users and resources cannot be easily modeled. Moreover Internet users can share resources through other users, and same resources can be shared by multiple users;
which makes it difficult to understand the overall system behavior.
As a recent topic, there are a number of studies on estimating grid system reliability in the literature [3-6]. In these studies, the grid system reliability is estimated by focusing on the reliabilities of services provided in the grid system. For this purpose, the grid system components that are involved in a grid service are classified into spanning trees, and each tree is studied separately. However these studies mostly focus on understanding grid system topology rather than estimating actual system reliability. Thus for simplification purposes, they make certain assumptions on component failure rates, such as satisfying a probabilistic distribution.
Bayesian networks (BN) have been proposed as an efficient method [7-9] for reliability estimation. For systems engineers BN provide significant advantages over traditional frameworks, mainly because they are easy to interpret and they can be used in interaction with domain experts in the reliability field [10]. In general and from a reliability perspective, a BN is a directed graph with nodes that represent system components and edges that show the relationships among them. Within this graph, each edge is assigned with a probabilistic value that shows the degree (or strength) of the relationship it represents. Using the BN structure and the probabilistic values, the system reliability can be estimated with the help of Bayes’ rule. There are several recent studies for reliability estimation using BN [7, 9, 11-13], which require specialized networks that are designed for a specific system. That is, the BN to be used for analyzing system reliability should be known beforehand, so that the BN can be built by an expert who has “adequate” knowledge about the system under consideration. However, human intervention is always open to unintentional mistakes that could cause discrepancy in the results [14].
To address these issues, this paper introduces a methodology for estimating grid system reliability by combining various techniques such as BN construction from raw component and system data, association rule mining and evaluation of conditional probabilities. Based on extensive literature review, this is the first study that incorporates these methods for estimating grid system reliability. Unlike previous studies, the methodology proposed in this paper does not rely on any assumptions
Int'l Conf. Grid Computing and Applications | GCA'08 | 123

about the component failure rates in grid systems. Our methodology automates the process of BN construction by using the K2 algorithm (a commonly used association rule mining algorithm), that identifies the associations among the grid system components by using a predefined scoring function and a heuristic. The K2 algorithm has proven to be efficient and accurate for finding associations [15] from a dataset of historical data about the system. The K2 algorithm reduces the algorithmic complexity of finding associations from exponential to quadratic [15] with respect to the number of components in the system. According to our proposed method, once the BN is efficiently and accurately constructed, reliabilities of grid services can be estimated with the help of Bayes’ rule. 2 Grid Systems
Different than typical distributed systems, the computational grid systems require large-scale sharing of resources on different types of components. A service request in a grid system involves a set of nodes and links, through which the service can be provided. In a grid system, the Resource Managers (RM) control and share resources, while the Root Nodes (RN) request service from RM (an RN may also share resources) [5]. Reliability of a grid system can be estimated by using reliabilities of services provided through the system.
There are several studies in the literature that focus on the reliability of grid systems, however many of them rely on certain assumptions [3-6, 16] that will be discussed. Dai and Wang present a methodology to optimally allocate the resources in a grid system in order to maximize the grid service reliability [5]. They use genetic algorithm to find the optimum solution efficiently among numerous possibilities. Later Levitin and Dai propose dividing grid services into smaller-size tasks and subtasks, then assigning the same tasks to different RM for parallel processing [16].
An example grid system is displayed in Figure 1. The RM are shown as single and RN are shown as double circles in the figure. In order to evaluate the reliability for a grid service, the links and nodes that are involved in that service should be identified. Dai and Wang show that the links and nodes in each grid service form a spanning tree [5]. The resource spanning tree (RST) is defined as a tree that starts from the requestor RN (as its root) and covers all resources that are required for the requested grid service [5].
For example in the grid system in Figure 1, when the RN, G1 requests the resources R1 and R5, there are several paths to provide this service. {G1, G2}, {G1, G3, G5}, {G1, G4, G6}, {G1, G3, G5, G6} and {G1, G2, G5, G6} are some of the RST that include the requested resources. The number of RST for a grid service can be quite large; and minimum resource spanning tree (MRST) is defined as an RST that does not contain any redundant components. Thus, when a component is removed from an MRST, it
does not span all the requested resources anymore [5]. For example in the grid system in Figure 1 {G1, G3, G5} is a MRST but {G1, G2, G5} is not, because {G1, G2} already covers all the requested resources. The reliability of a service in a grid system can be evaluated by using the reliabilities of services through MRST and it has been shown that MRST among a grid system can be efficiently discovered [5].
Figure 1: A sample grid system
3 Bayesian Networks
Estimation of systems reliability using BN dates back as early as 1988, when it was first defined by Barlow [17]. The idea of using BN in systems reliability has mainly gained acceptance because of the simplicity it allows to represent systems and the efficiency for obtaining component associations. The concept of BN has been discussed in several earlier studies [18-20]. More recently, BN have found applications in, software reliability [21, 22], fault finding systems [19], and general reliability modeling [23].
One could summarize the BN as an approach that represents the interactions among the components in a system from a probabilistic perspective. This representation is performed via a directed acyclic graph, where the nodes represent the variables and the links between each pair of nodes represent the causal relationships between the variables. From a system reliability perspective, the variables of a BN are defined as the components in the system while the links represent the interaction of the components leading to system “success” or “failure”. In a BN this interaction is represented as a directed link between two components, forming a child and parent relationship, so that the dependent component is called as the child of the other. Therefore, the success probability of a child node is conditional on the success probabilities associated with each of its parents. The conditional probabilities of the child nodes are calculated by using the Bayes’ theorem via the probability values assigned to the parent nodes. Also, absence of a link between any two nodes of a BN indicates that these components do not interact for system failure/success thus, they are considered independent of each other and their probabilities are calculated separately. As will be discussed in Section 3.2 in detail, calculations for the
124 Int'l Conf. Grid Computing and Applications | GCA'08 |

independent nodes are skipped during the process of system reliability estimation, reducing the total amount of computational work. 3.1 Bayesian Network Construction Using
Historical Data
The K2 algorithm, for construction of a BN, was first defined by Cooper and Herskovits as a greedy heuristic search method [24]. This algorithm searches for the parent set for a node that has the maximum association with it. The K2 algorithm is composed of two main factors: a scoring function to quantify the associations and rank the parent sets according to their scores, and a heuristic to reduce the search space to find the parent set with highest degree of association [24]. Without the heuristic, the K2 algorithm would need to examine all possible parent sets, i.e. starting from the empty set, it should consider all subsets. Even with a restriction on the maximum number of parents (u), the search space would be as large as 2u (total number of subsets of a set of size u); which requires an exponential-time search algorithm to find the most optimal parent set. With the heuristic, the K2 algorithm does not need to consider the whole search space; it starts with the assumption that the node has no parents and adds incrementally that parent whose addition most increases the scoring function. When addition of no single parent can increase the score, the K2 algorithm stops adding parents to the node. Using the heuristic reduces the size of the search space from exponential to quadratic.
With the help of the K2 algorithm, we develop a methodology that uses historical system and component data to construct a BN model. Moreover, as stated above, the BN model is very efficient in representing and calculating the interactions between system components.
3.2 Estimating Reliability Using Bayesian Networks
BN are known to be useful in assessing the probabilistic relationships and identifying probabilistic mappings between system components [3]. The components are assigned with individual CPT (conditional probability table) within the BN. The CPT of a given component X contains p(X|S) where S is the set of X’s parents. In X’s CPT all of its parents are instantiated as either “Success” and “Failure”; so for m parents there are 2m different parent set instantiations; thus 2m entries in CPT. The BN is complete when all the conditional probabilities are calculated and represented in the model.
To illustrate these concepts, the BN shown in Figure 2 presents an expert’s perspective on how the five components of a system interact. For this BN the child-parent relationships of the components can be observed, where on the quantitative side [13] the degrees of these relationships (associations) are expressed as probabilities and each node is associated with a CPT.
In Figure 2 the topmost nodes (G1, L1 and L2) do not have any incoming edges, therefore they are conditionally independent of the rest of the components in the system. The prior probabilities that are assigned to these nodes should be known beforehand -with the help of a domain expert or using historical data about the system. Based on these prior probabilities, the success probability of a dependent node, such as G3, can be calculated using Bayes’ theorem as shown in Equation (1):
),()()|,(
),|(11
3311113 LGp
GpGLGpLGGp = (1)
As shown in Equation (1), the probability of the
node G3 is only dependent on its parents, G1 and L1 in the BN shown in Figure 2. Total number of computations done for calculating this probability is reduced from 2n (where n is the number of nodes in the network) to 2m, where m is number of parents for a node (and m << n). Similar to the prior probabilities, CPT can be computed by using historical data of the system. Equation (1) can be applied to node G5 similarly using L2 as input. Overall system reliability (i.e. success probability of the bottom most node) can also be calculated by using the same equation.
Figure 2: A sample Bayesian network
4 Our Approach – Estimating Grid System Reliability Using BN
There are many studies [7-11, 25-27] in the literature that define reliability estimation methods for traditional small-scale systems. However these studies mostly rely on certain assumptions on the system topology and operational probabilities of the components (links and nodes). In the case of dynamic grid systems, these assumptions may be invalid as links can be destroyed or established on the fly. Moreover due to dynamic creation and modifications of nodes and links, logical connections between nodes may exist [5], thus the operational probabilities of nodes and links cannot be assigned with constant values. There are several recent studies on
Int'l Conf. Grid Computing and Applications | GCA'08 | 125

estimating grid service reliability using MRST [3-5] as discussed in Section 2; however these studies rely on the assumptions that node and link failures satisfy a probabilistic distribution.
In this paper we present a methodology that uses the K2 algorithm to construct the BN model for each MRST without need of a human domain expert. According to our methodology historical grid system data is used to estimate node and link reliabilities with the help of the BN model. As explained in Section 2, we focus on reliabilities of MRST in a grid system in order to evaluate the overall grid service reliability. In this manner, each MRST can be thought as a smaller size grid system [5] and therefore can be modeled and evaluated separately. For example, {G1, G3, G5} forms a MRST with three nodes and two links in the example grid system given in Figure 1. Thus it can be considered as a system with five components and modeled with a BN. For this purpose, each component in the MRST is represented with a separate node in this BN model. Once a historical system dataset (as shown in Table 1) is available, we can use the K2 algorithm to construct BN for each MRST.
Table 1: Example historical dataset
Observation G1 L1 G3 L2 G5 MRST
Behavior 1 0 0 1 1 0 0 2 1 0 0 0 0 0 3 1 0 0 1 1 0 4 1 1 1 1 1 1 5 1 1 1 1 1 1 6 0 1 0 0 1 0 7 0 0 0 0 0 0 8 1 1 1 1 1 1 9 0 1 0 1 0 0 10 1 0 0 1 1 0
In Table 1, all five components of the example MRST
are represented in different columns (Gs represent nodes and Ls represent links). Each row in Table 1 shows the state of the components (nodes and links) at an instance of time ti; when the observation was done. For the sake of simplicity and without loss of generality in our proposed methodology, we assume that the component failure data follows a binary behavior. That is, for each component in the MRST the value of 0 represents failure while the value of 1 represents full functionality. Also, in Table 1 information about the overall MRST Behavior is provided in last column (0 represents failure and 1 represent availability of the grid service through MRST).
The K2 algorithm finds the associations between these components and outputs the BN structure. In the first step of our proposed method the K2 algorithm starts with the first component in the dataset, G1. As G1 does not have any succeeding components, i.e. possible candidate
parents in the BN, the K2 algorithm skips it and picks the second component in the dataset, which is L1.
For L1, there may be two alternative parent sets: the empty set φ , or G1. Therefore, the K2 algorithm computes the scoring function f using each of these alternative parent sets and compares the results. Then, the set of candidate parents with highest f score will be chosen as the parent set for L1. At the end of this iteration the values
13201 and
42001 are computed and compared; and the
former, representing the score of the empty set {φ }, picked as the parent. So the K2 algorithm decides that L1 has no parents, which means that there is no association between G1 and L1.
In the following iterations of the K2 algorithm, the number of possible candidate parent sets to be considered and thus, the amount of computations for f score calculation increases. Skipping the details, f scores of the candidate parent sets for the G3 component are given in Table 2. Because the K2 algorithm iterates on the components according to their ordering in dataset, components L2 and G5 are not taken into account as candidate parents for G3. The K2 algorithm selects the set {G1, L1} as parent set of G3, because it has the highest f score. The number of computations grows with the order of the component, and when the K2 algorithm finishes with the last column (MRST Behavior in Table 1), it outputs the BN structure displayed in Figure 2.
Table 2: f scores for all possible candidate parent sets for
G3
Parent Set f score
φ 1320
1
{G1} 2800
1
{L1} 1800
1
{G1, L1} 640
1
The next step of the proposed method estimates
system reliability using the BN that was constructed by the K2 algorithm. Besides the associations that were discovered in the previous step, the inference rules described in Section 3 should be used to calculate the conditional probabilities. The conditional probabilities are calculated and stored in CPT and each component with a non-empty parent set in the BN is associated with a CPT (The ones with no parents are independent of others and associated with prior probabilities as explained in Section 3). Each CPT has 2u entries, where u is the number of parents of that component in the network.
126 Int'l Conf. Grid Computing and Applications | GCA'08 |

The probability values in the CPT are calculated by using the raw data in Table 1 and can be expressed as the probability of an instantiation of the parent set. For example the probability, G3 being 0 given the parent instantiations as G1=0 and L1=0 is 0.5, as two out of ten observations parents are instantiated as 0 and 0; and for one of these cases G3 is instantiated as 0. In the next step, with the help of CPT and the prior probabilities that G1 and L1 have, the success probability value for G3 can be calculated. According to the BN structure (in Figure 2) components G1 and L1 are independent of others; therefore their success probabilities can be directly inferred from the observations dataset in Table 1. From Table 1 it can be evaluated that p(G1=1)=0.6 and p(L1=1)=0.5.
When we continue the computations for the other components in the network, success probabilities for the rest of the components in the sample MRST can be evaluated; such that p(L2=1)=0.6 and p(G5=1)=0.75. In the last step, the MRST reliability can be calculated by using these probability values and the CPT of the MRST Behavior node in the BN structure given in Figure 2. The success probability of the MRST Behavior node can be calculated as 0.35 or 35%; which is the reliability of the MRST used in this section. The reader must recall that this reliability value is calculated based on only 10 observations on the sample system. With more observations available, the K2 algorithm provides more accurate results on the degrees of associations between the system components and calculate more precise values in the CPT of the nodes; which will increase the accuracy of the calculated system reliability in turn.
Extending this methodology, BN can be constructed by using historical data to calculate the reliabilities of each of the MRST, and these reliability values can be combined by using Bayes’ rule to calculate the overall grid service reliability [5]. Unlike other studies on grid systems, our methodology does not rely on any assumptions about the node and link failures in the system. Also with the help of the K2 algorithm [24] and the BN model [17-19, 21-23], our methodology provides efficient and accurate reliability values. 5 Conclusions
Grid system is a newly developed architecture for large-scale distributed systems. In a grid system there can be various nodes that are logically and physically distributed; and large-scale sharing of resources is essential between these nodes. There are mainly two types of nodes in a grid system: RM share resources and RN request service from them. Identification of the links and nodes between RN and RM is essential for estimating the reliability of the requested service. Due to their special and complex nature, traditional reliability estimation methods cannot be used for grid systems. Dai and Wang [5] show that these nodes and links form RST, define MRST as RST that do not have any redundant
components. They also provide an efficient algorithm to find MRST for a given grid service. In this paper we combine the BN model with MRST, to estimate grid service reliability. Unlike previous studies on grid system reliability, our methodology does not rely on any assumptions about component failure rates. Alternatively, using historical system data we represent each MRST for a grid service with a BN and as shown in earlier studies we can efficiently and accurately estimate reliability of MRST using BN. 6 References [1] Butt, A. R., Adabala, S., Kapadia, N. H. and Figueiredo, R., (2002), "Fortes, Fine-Grain Access Control for Securing Shared Resources Incomputational Grids", J.A.B. Parallel and Distributed Processing Symposium Proceedings International, pp.22-29. [2] Wenjie, L., Guochang, G. and Hongnan, W., (2004), "Communication and Recovery Issues in Grid Environment", In Proceedings of the 3rd international Conference on Information Security, pp.82-86. [3] Dai, Y. S. and Levitin, G., (2007), "Optimal Resource Allocation for Maximizing Performance and Reliability in Tree-Structured Grid Services", IEEE Transactions on Reliability, vol.56(3), pp.444-453. [4] Dai, Y. S., Pan, Y. and Zou, X., (2007), "A Hierarchical Modeling and Analysis for Grid Service Reliability", IEEE Transactions on Computers, vol.56, pp.681-691. [5] Dai, Y. S. and Wang, X., (2006), "Optimal Resource Allocation on Grid Systems for Maximizing Service Reliability Using a Genetic Algorithm", Reliability Engineering & System Safety, vol.91(9), pp.1071-1082. [6] Dai, Y. S., Xie, M. and Poh, K. L., (2006), "Reliability of Grid Service Systems", Computers and Industrial Engineering, vol.50, pp.130-147. [7] Amasaki, S., Takagi, Y., Mizuno, O. and Kikuno, T., (2003), "A Bayesian Belief Network for Assessing the Likelihood of Fault Content", In Proceedings of the 14th International Symposium on Software Reliability Engineering, p125. [8] Boudali, H. and Dugan, J. B., (2006), "A Continuous-Time Bayesian Network Reliability Modeling, and Analysis Framework", IEEE Transaction on Reliability, vol.55 (1), pp.86-97.
Int'l Conf. Grid Computing and Applications | GCA'08 | 127
[9] Gran, B. A. and Helminen, A., (2001), "A Bayesian Belief Network for Reliability Assessment", Safecomp 2001, vol.2187, pp.35–45. [10] Sigurdsson, J. H., Walls, L. A. and Quigley, J. L., (2001), "Bayesian Belief Nets for Managing Expert Judgment and Modeling Reliability", Quality and Reliability Engineering International, vol.17, pp.181–190. [11] Hugin Expert, (2007), Aalborg, Denmark http://www.hugin.dk [12] Dahll, G. and Gran, B. A., (2000), "The Use of Bayesian Belief Nets in Safety Assessment of Software Based Systems", Special Issues of International Journal on Intelligent Information Systems, vol.24(2), pp.205-229. [13] Lagnseth, H. and Portinale, L., (2005), "Bayesian Networks in Reliability", Technical Report, Dept. of Computer Science, University of Eastern Piedmont "Amedeo Avogadro", Alessandria, Italy. [14] Inamura, T., Inaba, M. and Inoue, H., (2000), "User Adaptation of Human-Robot Interaction Model Based on Bayesian Network and Introspection of Interaction Experience", In Proceedings of the 2000 IEEE/RSJ International Conference on Intelligent Robots and Systems, pp.2139-2144. [15] Kardes, O., Ryger, R. S., Wright, R. N. and Feigenbaum, J., (2005), "Implementing Privacy-Preserving Bayesian-Net Discovery for Vertically Partitioned Data", In Proceedings of the Workshop on Privacy and Security Aspects of Data Mining, Houston, TX, [16] Levitin, G. and Dai, Y. S., (2007), "Performance and Reliability of a Star Topology Grid Service with Data Dependency and Two Types of Failure", IIE Transactions, vol.39(8), p783. [17] Barlow, R. E., (1988), "Using Influence Diagrams", Accelerated life testing and experts’ opinions in Reliability, pp.145–150. [18] Cowell, R. G., Dawid, A. P., Lauritzen, S. L. and Spiegelhalter, D. J., (1999), Probabilistic Networks and Expert Systems, Springer-Verlag, New York, NY. [19] Jensen, F. V., (2001), Bayesian Networks and Decision Graphs, Springer Verlag, New York, NY. [20] Pearl, J., (1988), Probabilistic Reasoning in Intelligent Systems, Morgan Kaufmann, San Francisco, CA.
[21] Fenton, N., Krause, P. and Neil, M., (2002), "Software Measurement: Uncertainty and Causal Modeling", IEEE Software, vol.10(4), pp.116-122. [22] Gran, B. A., Dahll, G., Eisinger, S., Lund, E. J., Norstrøm, J. G., Strocka, P. and Ystanes, B. J., (2000), "Estimating Dependability of Programmable Systems Using Bbns", In Proceedings of the Safecomp 2000, Springer, pp.309-320. [23] Bobbio, A., Portinale, L., Minichino, M. and Ciancamerla, E., (2001), "Improving the Analysis of Dependable Systems by Mapping Fault Trees into Bayesian Networks", Reliability Engineering and System Safety, vol.71(3), pp.249–260. [24] Cooper, G. F. and Herskovits, E., (1992), "A Bayesian Method for the Induction of Probabilistic Networks from Data", Machine Learning, vol.9(4), pp.309-347. [25] Chen, D. J., Chen, R. S. and Huang, T. H., (1997), "A Heuristic Approach to Generating File Spanning Trees for Reliability Analysis of Distributed Computing Systems", Computers and Mathematics with Application, vol.34, pp.115–131. [26] Dai, Y. S., Xie, M., Poh, K. L. and Liu, G. Q., (2003), "A Study of Service Reliability and Availability for Distributed Systems", Reliability Engineering and System Safety, vol.79, pp.103–112. [27] Kumar, A. and Agrawal, D. P., (1993), "A Generalized Algorithm for Evaluating Distributed-Program Reliability", IEEE Transactions on Reliability, vol.42, pp.416-424.
128 Int'l Conf. Grid Computing and Applications | GCA'08 |

A Novel Proxy Certificate Issuance on Grid Portal
Without Using MyProxy
Ng Kang Siong, Sea Chong Seak, Galoh Rashidah Haron, Tan Fui Bee and Azhar Abu Talib
Cyberspace Security Center, MIMOS Berhad, Kuala Lumpur, Malaysia
Abstract - MyProxy was proposed to solve the problem of
extending proxy certificate issuance capability supported by
Globus Toolkit to Grid Portal running on web server.
However, the introduction of MyProxy has imposed several
security vulnerabilities into the computing grids. This paper
described a novel method to allow direct proxy certificate
issuance from end entity certificate on smart card to Grid
Portal via web browser without using MyProxy. This
method can also be used for proxy certificate issuance on
any web based application.
Keywords: proxy certificate, MyProxy, grid, single sign-on,
PKI.
1 Introduction
In the quest of building computers with more
computation power, distributed computing or grid
computing is gaining popularity. The primary advantage of
grid computing is that each node can be purchased as
commodity hardware, which when combined can produce
similar computing resources to a many-CPU supercomputer,
but at lower cost.
Ian Foster et al. defined the „grid problem‟ [1] as the
challenge to enable coordinated resource sharing among
dynamic collections of individuals, institutions and
resources. In an effort to address the „grid problem‟, Ian
Foster initiated the open sourced Globus Toolkit (GTK)
middleware for building grid computing based on
commodity computer. Even though there are other software
toolsets available for the construction of computing grids,
GTK remains the most widely used and continuously
maintained and upgraded middleware toolkit for computing
grids.
In view of the fact that computing nodes share
resources over open Internet, a set of libraries and toolkits
called Grid Security Infrastructure (GSI) are included in the
standard GTK to provide the necessary security measures to
support the computing grids. GSI relies on Public Key
Technologies (PKI) to provide mutual strong authentication
and message protection through TLS/SSL [3] protocol.
X.509 digital certificates are used extensively to identify
users, services and hosts [4]. Proxy certificate [5] that
conforms to IETF RFC 3820 can be used by GSI for job
delegation and single sign-on to multiple computing nodes.
By providing a web interface to GTK, Grid Portal
allows end user to interact with computing grids using a
common and mature user interface technology. Due to the
fact that Grid Portal acts as the man-in-the-middle between
GTK and the end user using web browser, the proxy
certificate issuance capability provided by GTK is not
usable in this situation that involves web browser.
MyProxy [7] was proposed and few implementations
that involved the use of MyProxy had been carried out. This
paper examines MyProxy architectural weaknesses. The
contribution of this paper is a novel method to address the
inherent weaknesses of MyProxy. This novel method
enables direct proxy certificate creation via web browser
interface using private key resides in a smart card without
the need of MyProxy server.
2 Background
Globus Security Infrastructure (GSI) is the portion of
the GTK that provides the fundamental security services
needed to support grid computing. The primary motivations
[2] behind GSI are to provide secure communication
between computing nodes, a decentralized security
management and to support "single sign-on" for users of the
Grid.
Public Key Infrastructure became the natural choice for
authentication which can be bind to the establishment of
secure communication between computing nodes through
Transport Layer Security (TLS) protocol [3]. However, in
the situation where a web portal is in the pathway between a
client and a server, this security mechanism does not allow
the server to authenticate the client. The reason being private
key is required during the challenge-respond mechanism for
TLS mutual authentication method. Copying the private key
to the portal violate the needs to keep the private key secret.
2.1 Proxy Certificate
Proxy credential is used to solve the problem by
allowing the user to use his private key to sign on a
Int'l Conf. Grid Computing and Applications | GCA'08 | 129
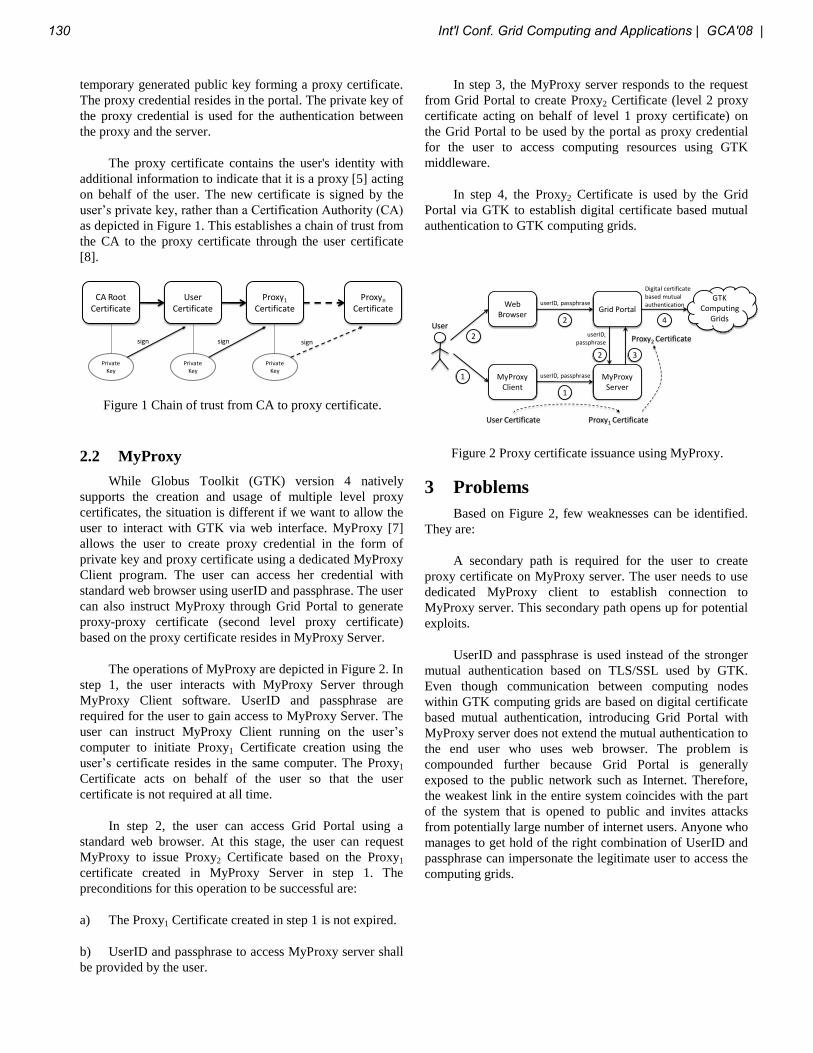
temporary generated public key forming a proxy certificate.
The proxy credential resides in the portal. The private key of
the proxy credential is used for the authentication between
the proxy and the server.
The proxy certificate contains the user's identity with
additional information to indicate that it is a proxy [5] acting
on behalf of the user. The new certificate is signed by the
user‟s private key, rather than a Certification Authority (CA)
as depicted in Figure 1. This establishes a chain of trust from
the CA to the proxy certificate through the user certificate
[8].
CA Root Certificate
User Certificate
Proxy1
CertificateProxyn
Certificate
sign
Private Key
sign
Private Key
sign
Private Key
Figure 1 Chain of trust from CA to proxy certificate.
2.2 MyProxy
While Globus Toolkit (GTK) version 4 natively
supports the creation and usage of multiple level proxy
certificates, the situation is different if we want to allow the
user to interact with GTK via web interface. MyProxy [7]
allows the user to create proxy credential in the form of
private key and proxy certificate using a dedicated MyProxy
Client program. The user can access her credential with
standard web browser using userID and passphrase. The user
can also instruct MyProxy through Grid Portal to generate
proxy-proxy certificate (second level proxy certificate)
based on the proxy certificate resides in MyProxy Server.
The operations of MyProxy are depicted in Figure 2. In
step 1, the user interacts with MyProxy Server through
MyProxy Client software. UserID and passphrase are
required for the user to gain access to MyProxy Server. The
user can instruct MyProxy Client running on the user‟s
computer to initiate Proxy1 Certificate creation using the
user‟s certificate resides in the same computer. The Proxy1
Certificate acts on behalf of the user so that the user
certificate is not required at all time.
In step 2, the user can access Grid Portal using a
standard web browser. At this stage, the user can request
MyProxy to issue Proxy2 Certificate based on the Proxy1
certificate created in MyProxy Server in step 1. The
preconditions for this operation to be successful are:
a) The Proxy1 Certificate created in step 1 is not expired.
b) UserID and passphrase to access MyProxy server shall
be provided by the user.
In step 3, the MyProxy server responds to the request
from Grid Portal to create Proxy2 Certificate (level 2 proxy
certificate acting on behalf of level 1 proxy certificate) on
the Grid Portal to be used by the portal as proxy credential
for the user to access computing resources using GTK
middleware.
In step 4, the Proxy2 Certificate is used by the Grid
Portal via GTK to establish digital certificate based mutual
authentication to GTK computing grids.
Grid Portal
MyProxyServer
Web Browser
MyProxyClient
userID, passphrase
userID, passphrase
User Certificate Proxy1 Certificate
1
2
Proxy2 Certificate
3
userID, passphrase
User
1
2
2
GTK Computing
Grids
Digital certificate based mutual authentication
4
Figure 2 Proxy certificate issuance using MyProxy.
3 Problems
Based on Figure 2, few weaknesses can be identified.
They are:
A secondary path is required for the user to create
proxy certificate on MyProxy server. The user needs to use
dedicated MyProxy client to establish connection to
MyProxy server. This secondary path opens up for potential
exploits.
UserID and passphrase is used instead of the stronger
mutual authentication based on TLS/SSL used by GTK.
Even though communication between computing nodes
within GTK computing grids are based on digital certificate
based mutual authentication, introducing Grid Portal with
MyProxy server does not extend the mutual authentication to
the end user who uses web browser. The problem is
compounded further because Grid Portal is generally
exposed to the public network such as Internet. Therefore,
the weakest link in the entire system coincides with the part
of the system that is opened to public and invites attacks
from potentially large number of internet users. Anyone who
manages to get hold of the right combination of UserID and
passphrase can impersonate the legitimate user to access the
computing grids.
130 Int'l Conf. Grid Computing and Applications | GCA'08 |
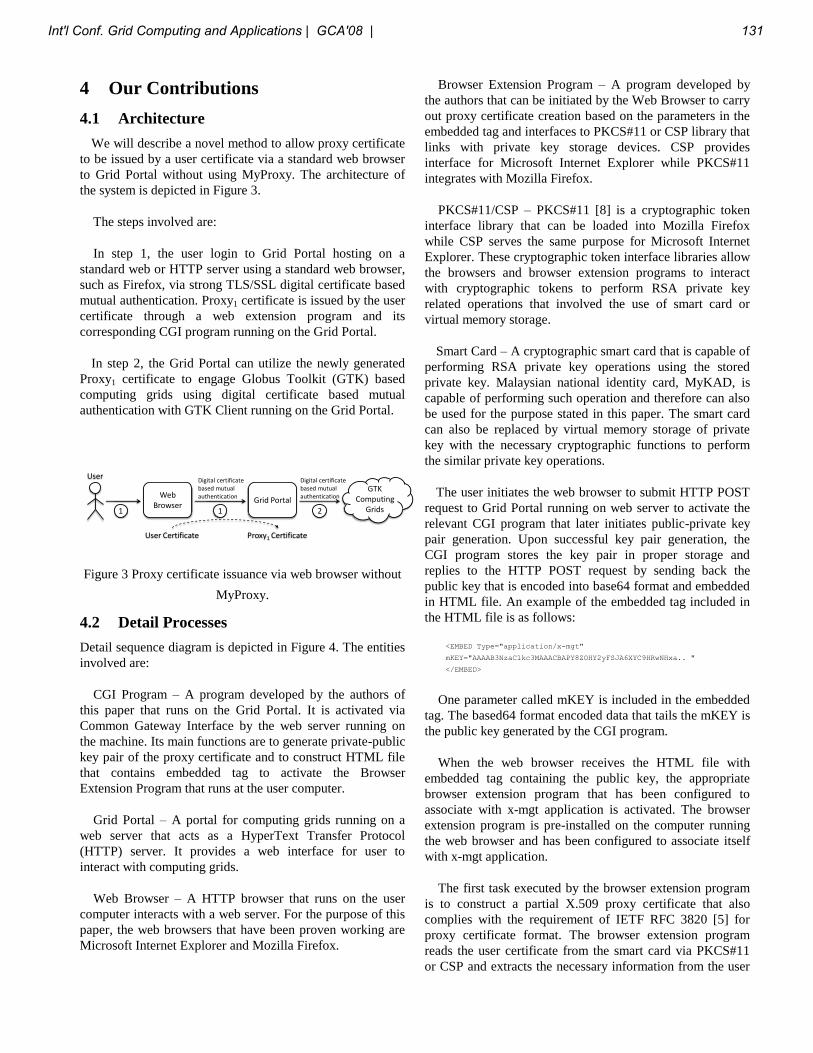
4 Our Contributions
4.1 Architecture
We will describe a novel method to allow proxy certificate
to be issued by a user certificate via a standard web browser
to Grid Portal without using MyProxy. The architecture of
the system is depicted in Figure 3.
The steps involved are:
In step 1, the user login to Grid Portal hosting on a
standard web or HTTP server using a standard web browser,
such as Firefox, via strong TLS/SSL digital certificate based
mutual authentication. Proxy1 certificate is issued by the user
certificate through a web extension program and its
corresponding CGI program running on the Grid Portal.
In step 2, the Grid Portal can utilize the newly generated
Proxy1 certificate to engage Globus Toolkit (GTK) based
computing grids using digital certificate based mutual
authentication with GTK Client running on the Grid Portal.
Grid PortalWeb
Browser
User Certificate Proxy1 Certificate
1
User
1
GTK Computing
Grids2
Digital certificate based mutual authentication
Digital certificate based mutual authentication
Figure 3 Proxy certificate issuance via web browser without
MyProxy.
4.2 Detail Processes
Detail sequence diagram is depicted in Figure 4. The entities
involved are:
CGI Program – A program developed by the authors of
this paper that runs on the Grid Portal. It is activated via
Common Gateway Interface by the web server running on
the machine. Its main functions are to generate private-public
key pair of the proxy certificate and to construct HTML file
that contains embedded tag to activate the Browser
Extension Program that runs at the user computer.
Grid Portal – A portal for computing grids running on a
web server that acts as a HyperText Transfer Protocol
(HTTP) server. It provides a web interface for user to
interact with computing grids.
Web Browser – A HTTP browser that runs on the user
computer interacts with a web server. For the purpose of this
paper, the web browsers that have been proven working are
Microsoft Internet Explorer and Mozilla Firefox.
Browser Extension Program – A program developed by
the authors that can be initiated by the Web Browser to carry
out proxy certificate creation based on the parameters in the
embedded tag and interfaces to PKCS#11 or CSP library that
links with private key storage devices. CSP provides
interface for Microsoft Internet Explorer while PKCS#11
integrates with Mozilla Firefox.
PKCS#11/CSP – PKCS#11 [8] is a cryptographic token
interface library that can be loaded into Mozilla Firefox
while CSP serves the same purpose for Microsoft Internet
Explorer. These cryptographic token interface libraries allow
the browsers and browser extension programs to interact
with cryptographic tokens to perform RSA private key
related operations that involved the use of smart card or
virtual memory storage.
Smart Card – A cryptographic smart card that is capable of
performing RSA private key operations using the stored
private key. Malaysian national identity card, MyKAD, is
capable of performing such operation and therefore can also
be used for the purpose stated in this paper. The smart card
can also be replaced by virtual memory storage of private
key with the necessary cryptographic functions to perform
the similar private key operations.
The user initiates the web browser to submit HTTP POST
request to Grid Portal running on web server to activate the
relevant CGI program that later initiates public-private key
pair generation. Upon successful key pair generation, the
CGI program stores the key pair in proper storage and
replies to the HTTP POST request by sending back the
public key that is encoded into base64 format and embedded
in HTML file. An example of the embedded tag included in
the HTML file is as follows:
<EMBED Type="application/x-mgt"
mKEY="AAAAB3NzaC1kc3MAAACBAPY8ZOHY2yFSJA6XYC9HRwNHxa.. "
</EMBED>
One parameter called mKEY is included in the embedded
tag. The based64 format encoded data that tails the mKEY is
the public key generated by the CGI program.
When the web browser receives the HTML file with
embedded tag containing the public key, the appropriate
browser extension program that has been configured to
associate with x-mgt application is activated. The browser
extension program is pre-installed on the computer running
the web browser and has been configured to associate itself
with x-mgt application.
The first task executed by the browser extension program
is to construct a partial X.509 proxy certificate that also
complies with the requirement of IETF RFC 3820 [5] for
proxy certificate format. The browser extension program
reads the user certificate from the smart card via PKCS#11
or CSP and extracts the necessary information from the user
Int'l Conf. Grid Computing and Applications | GCA'08 | 131
certificate which will become the issuance certificate or End
Entity Certificate (EEC). The public key is extracted from
the variable field mKEY from the embedded tag. The partial
X.509 proxy certificate is constructed based on the above
mentioned information.
Certificate-digest or hash value is calculated from the
partial X.509 format proxy certificate. This hash value is
sent to the smart card via PKCS#11 or CSP interface to be
signed using the private key in the smart card. The signed
hash value is returned to the browser extension program and
is combined with the partial proxy certificate to form a
complete proxy certificate.
The final task of the browser extension program is to
initiate the web browser to send a POST command to deliver
the proxy certificate to the Grid Portal via HyperText
Transfer Protocol (HTTP). This POST command and its
payload of proxy certificate are received by the CGI program
running at the Grid Portal to store it to the appropriate
location for proxy certificate storage.
This concludes the entire proxy certificate issuance
process. The proxy certificate and its corresponding private
key will be used by GTK client to initiate digital certificate
based mutual authentication with other GTK computing
nodes.
Web Browser Grid Portal
Generate Key Pair
Public Key
Proxy Certificate
CGI ProgramBrowser Extension Program
Public Key
Public Key
Proxy Certificate
Request Issuance
Request Generate Key Pair
Smart Card
Sign
Hash
Sign(Hash)
PKCS#11/CSP
Hash
Sign(Hash)
Proxy Certificate
Store
HTML
HTML
Construct Partial X.509 Certificate
Construct Proxy Certificate
Read Certificate
Read Certificate
User Certificate
User Certificate
Figure 4 Proxy certificate issuance sequence diagram.
4.3 Advantages
The immediate advantage to this approach is to eliminate
the need of using MyProxy as intermediary for proxy
certificate storage and issuance. There is no need to maintain
a secondary communication path to MyProxy.
In doing so, we have also reduced the number of
cascading proxy certificate required in order to access to
computing grids. Only one proxy certificate is required for
our method while two stages of proxy certificates are
required for MyProxy implementation.
Strong digital certificate based authentication using
TLS/SSL is maintained for the entire communication chain
between end user browser and computing nodes in GTK
computing grids. No userID and passphrase are used in this
method and hence, eliminating this glaring weakness for
system using MyProxy.
While session management between computing nodes are
maintained by GTK software, session management between
web browser and the Grid Portal can be tied to the user
certificate that establishes TLS/SSL session. This is a feature
that cannot be provided by system using MyProxy
implementation.
Using standard cryptographic token interface library such
as PKCS#11 and CSP allows our method to be generic. Our
method will work with all PKCS#11 or CSP libraries
supplied by respective smart card vendors. It will also work
with user certificate that is stored in other forms such as USB
drive, hard disk and etc., provided that a matching PKCS#11
or CSP is available.
4.4 Variation
On top of the above mention method, we have discovered
that there exists another variation of the solution mentioned
above. The construction of partial X.509 proxy certificate
can be done at the CGI program instead of at the browser
extension program. In order to ensure compliance that the
subject name of the proxy certificate must be the same as the
subject name of the issuer or user certificate as per the
requirement of IETF RFC 3820 [5], the CGI program must
have the capability to access the user certificate for the
purpose of extracting the subject name from the user
certificate.
Bear in mind that the user certificate is at the smart card
and can be accessed by the browser extension program
running at the user computer via PKCS#11 or CSP as per the
solution mentioned above. Fortunately, the user certificate
has been transmitted to the web browser via TLS/SSL digital
certificate mutual authentication process. It can be accessed
by the CGI program from the Grid Portal on web server SSL
session variable. This unique situation makes it possible for
the CGI program to generate the partial X.509 proxy
certificate and subsequently the hash value.
132 Int'l Conf. Grid Computing and Applications | GCA'08 |

The information exchange between the CGI program and
the browser extension program remains the same as
described in the previous method
The hash value can be sent to the browser extension
program using the same mechanism of putting the parameter
in the embedded tag. The signed hash value is returned to the
CGI program using the similar mechanism as the above
mentioned method. Hash value and signed hash value are
being exchanged instead of public key and a complete proxy
certificate.
Upon receipt of the signed hash value, the CGI program
constructs the complete proxy certificate at the machine
running the Grid Portal.
This solution variant achieves the same goal of direct
proxy certificate issuance via web browser.
5 Conclusions and Future Works
We have described a novel method to replace the usage
of MyProxy for proxy certificate issuance and hence
avoiding the inherent security weakness imposed by the
implementation of MyProxy on Globus Security
Infrastructure (GSI). The advantages of this new method are
outlined. We have also described a process with some
variations to achieve the same goal.
While this paper describes a generic case involving the
usage PKI-enabled smart card for GSI; MyKAD as a
national identity smart card with PKI capability can be used
as the national authentication token to generate proxy
certificate via standard web browser for accessing any web
based application using this novel method.
The potential future work will be to analyze in detail
the two variant processes described above and to fine- tune
the processes so that the CGI program and the browser
extension program can be adopted as a standard software
library for GSI.
6 Acknowledgement
This novel method of direct proxy certificate issuance
on Grid Portal via web browser without using MyProxy was
developed to extend the MyKAD PKI security to the
experimental grid for trusted computing project that is
funded by Ninth Malaysia Plan (9MP) to support the long-
term national grid computing initiative.
7 References
[1] Ian Foster, Carl Kesselman, and Steven Tuecke, “The
Anatomy of the Grid: Enabling Scalable Virtual
Organizations”, International Journal of High Performance
Computing Applications, vol. 15, no. 3, pp. 200-222, August
2001.
[2] University of Chicago, “GT4.0: Credential
Management: MyProxy”, July 2007.
http://www.globus.org/toolkit/docs/4.0/security/myproxy/ind
ex.pdf
[3] T. Dierks, and C. Allen, “The TLS protocol version
1.0”, IETF RFC 2246, January 1999.
http://www.ietf.org/rfc/rfc2246.txt
[4] Von Welch, “Globus Toolkit Version 4 Grid Security
Infrastructure: A Standard Perspective”, Sept 12, 2005.
http://www.globus.org/toolkit/docs/4.0/security/GT4-GSI-
Overview.pdf
[5] S. Tuechke, V. Welch, D. Engert, L. Pearlman, and M.
Thompson, “Internet X.509 Public Key Infrastructure (PKI)
Proxy Certificate Profile”, IETF, RFC 3820, June 2004.
http://www.ietf.org/rfc/rfc3820.txt
[6] Ian Foster, Carl Kesselman, Gene Tsudik, and Steven
Tuecke, “A Security Architecture for Computational Grids”,
Proceedings of the 5th ACM Conference on Computer and
Communications Security, pp. 83-92, 1998.
[7] Jason Novotny, and Steven Tuecke, “An Online
Credential Repository for the Grid: MyProxy”, 10th IEEE
International Symposium on High Performance Distributed
Computing, pp. 104, 2001.
[8] RSA Laboratories, “PKCS#11: Cryptographic Token
Interface Standard”, June 2004.
ftp://ftp.rsasecurity.com/pub/pkcs/pkcs-11/v2-20/pkcs-11v2-
20.pdf
Int'l Conf. Grid Computing and Applications | GCA'08 | 133
Anomaly Detection and its Application in Grid
Thuy T. Nguyen1,2, Thanh D. Do1, Dung T. Nguyen2, Hiep C. Nguyen2, Tung T. Doan2, Giang T. Trinh3
1 Department of Information System, Hanoi University of Technology 2 High Performance Computing Center, Hanoi University of Technology
3 Hanoi National University Hanoi, Vietnam
Abstract - Size and complexity of grid computing systems increase rapidly. Failures can have adverse effect on application executing on the system. Thus, failure information should be provided to the scheduler to make scheduling decisions that reduce effect of failures. In this paper, we survey anomaly detection methods and present in details window-based method together with experiments to evaluate it. The experiments show that window-based method is efficient in detecting anomalies. It may be implemented in a monitoring service. We introduce architecture of services to make failure information available for other services in grid. Using these services, grid schedulers and job/execution managers can get additional information for matching and handling task failures.
Keywords: anomaly detection, Grid monitoring, job monitoring, window-based detection method, anomaly detection.
1 Introduction In recent years, grid-computing systems have been developed sharply to satisfy various scientific computing demands such as weather forecasting, drug emulation, high-energy physics, etc. Complex hardware and software on these systems make failures more difficult to predict. They may occur in any components, and have different affections to the performance of system and running application. Statistic data of failures is very useful in performance prediction. Real computing capacity of a machine partly depends on failure rate, and is often less than theoretical capacity. Avoiding unreliable machines will increase overall performance of computing systems. Therefore, it is necessary to have a mechanism to monitoring application performance and notify the failure to scheduler or handler.
Although many grid monitoring systems [1] [2] [3] have been developed but, to our knowledge, little effort has focused on aggregating anomaly information into systems monitoring. In existing anomaly detecting solutions [4] [5], obtained information is not provided as a service. This makes it difficult to exploit anomaly capability broadly and efficiently on overall grid system. In this paper, we present a survey of anomaly detection methods. Among various anomaly detection methods, we recommend to integrate
window-based method into a monitoring system. Experiments show that window-based anomaly detecting approach is simple but efficient. We also propose a grid monitoring architecture that supports the process of making scheduling/handling decisions.
The remainder of this paper is organized as follows. In Section 2, we introduce various methods used to detect anomalies. In Section 3, we present window-based method in details. Experiments of window-based method with different parameters are presented in Section 4. In Section 5, we introduce the architecture of information service about anomaly in grid nodes. Finally, we conclude our paper in Section 6.
2 Anomaly detection methods Anomaly detection is the process of finding values that changes much when compared to the remained values. It has a wide range of applications, ranging from intrusion detection to failure monitoring. The values to be considered for detecting anomaly may be system metrics such as CPU usage, free memory, and bandwidth in a computing system. When the metrics significantly deviated from normal pattern, they are considered as anomalies. For example, if CPU usage of an application process at a particular computing node suddenly goes down for a while, the application process might go to a zombie state or is preempted by other higher priority processes. If the decrease in CPU usage takes a long period, the application performance may reduce considerably, leading to an anomaly. There are various methods for detecting anomaly, each of which has its pro and con. In the following section, a brief description of popular methods is presented.
2.1 Value-based change detection
In this method, the value of monitoring metric is considered normal if it lies in a set of normal values and often defined by the lower and upper bounds. If a new value is greater than upper bound value or less than lower bound value, it is considered as an anomaly. This is the simplest and fastest method. However, it is not suitable enough to detect application's anomalies since in such a complicated environment like the grid; a range of values is not always
134 Int'l Conf. Grid Computing and Applications | GCA'08 |

enough to describe normal behavior of the system or application. Different jobs require different resources and behave differently. For example, matrix multiply application requires a lot of CPU, while data transmission application requires large amount of bandwidth.
2.2 Model-based change detection
In this approach, it is assumed that data is produced by a single source that may be described by a model. A model is a collection of parameters representing the source. Any anomalous change in one of these parameters is considered as an anomaly. In addition, abnormal change in co-relationships among parameters can be a sign of anomaly. For example, if the data is generated by a Gaussian source, the mean and standard deviation are used to characterize the model. The more we understanding the source, the more properties we can use for anomaly detecting purpose. We describe some of the most popular models that can be used in detecting application anomaly in the following.
Operational Model. This model is based on the operational assumption that normal values are quite stable on a specified system. First N values are used to estimate the normal range. Then, new value is compared with this range to decide if it is anomaly or not. This approach may adapt well to real time running system.
Mean and standard deviation model. From N newest values x1,…xn, the mean and standard deviation are calculated by following equation:
N
xmean
N
ii∑
== 1 (1)
21
2
meanN
xstdev
N
ii
−=∑= (2)
The observation xn+1 is defined as abnormal if it falls outside a confidence interval that is d standard deviations from the mean. For example, if d=2, the value which lies between mean ± 2*stdev is consider normal. Otherwise, it is an anomaly.
Multivariate Model. This model is similar to the mean and standard deviation model except that it is based on correlations among two or more metrics. It is useful in monitoring applications where there is relationship among various system metrics such as CPU usage, data transfer and file I/O. For example, in an MPI application, when data transmission among running processes increases, CPU usage of each process decreases because of it has to wait until the data transmission is completed. When the process receives
enough data, it starts to compute intensively [6], leading to the significant increase in CPU usage.
Markov Process Model. In this model, events are classified into types called state variables. A state transition matrix is used to characterize the transition probability between states. A new observation is defined to be abnormal if its probability as determined by the previous state and the transition matrix is too low. To apply this model, observed values must be classified into state and the transition matrix has to be defined. This process seems to be the most difficult task when applying this model in to practice. Moreover, addressing relationships between metrics which is very diversified and may required multi-dimension states [7]. This makes the application of Markov Process Model less popular than others do.
Neural network-based model. Neural network is non-linear statistical model for representing complex relationships between inputs and outputs. By learning, neural network updates the weight among elements in network to adapt desired output, thus it is good if learning set is big. Neural network-based method requires much time to process and is time-consuming in building learning set [8].
2.3 Rule-based change detection
In rule-based approach, normal activities and relationships between metrics are described as rules. If there are any conflicts with these rules, an alarm is triggered. Ideally, a complete set of rules that characterizes all the behavior of the system should be constructed, but in a complex system like distributed computing environments, it may be impossible. Rules are often obtained by machine learning techniques [9] [10].
3 Window-based method Perhaps window-based method is the most simple but efficient and flexible one. In this technique, a window is moving across the interest system metrics. Any violation from the window within a specified threshold will be considered as anomaly. A simple modification that can improve its performance is to signal an alarm after a minimum number of consecutive violations of the threshold.
In window-based method, periodical activities of system processes can be addressed. For example, the Network File System (NFS) client process periodically utilizes an amount of CPU resource at a specified interval to listen for any change from the NFS server. These periodical behaviors may change statistical characteristic of data. They should be filter out before anomaly detection phase because if not filtered, they may cause false alarms. Fast Fourier Transform (FFT) technique can be exploited to eliminate periodical pattern of data [4]. In the FFT approach, discrete data is transformed into the frequency domain. Then, signals with greatest
Int'l Conf. Grid Computing and Applications | GCA'08 | 135
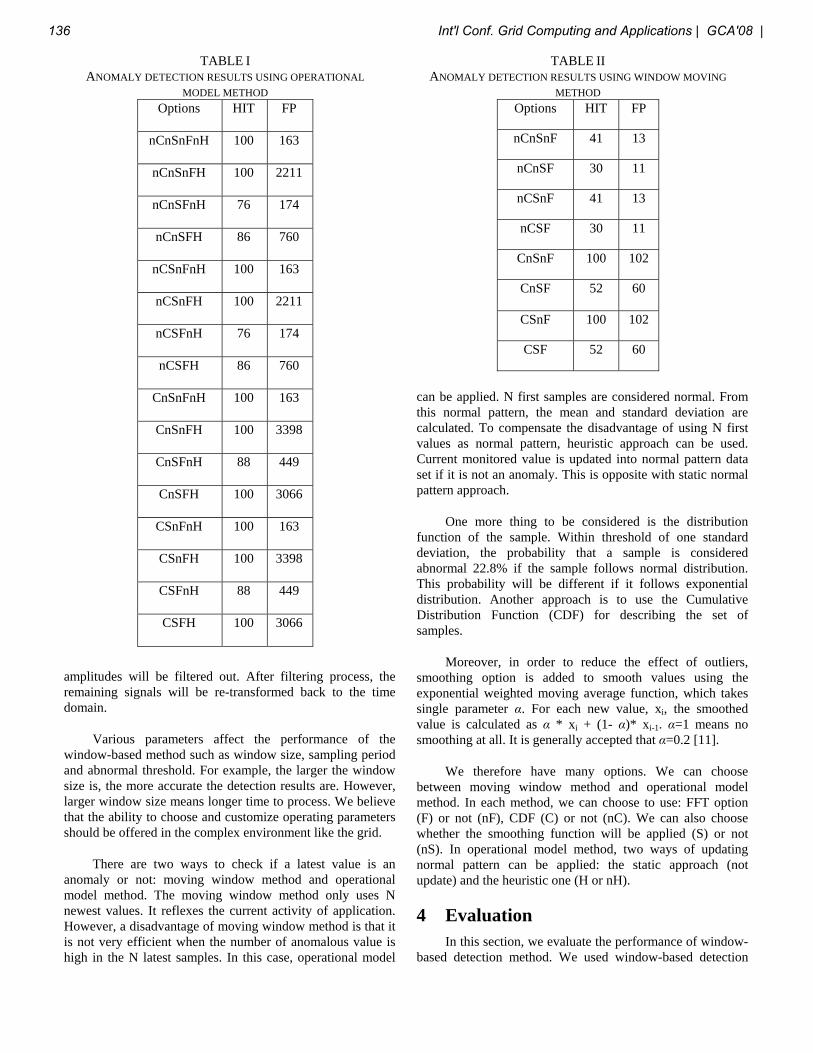
amplitudes will be filtered out. After filtering process, the remaining signals will be re-transformed back to the time domain.
Various parameters affect the performance of the window-based method such as window size, sampling period and abnormal threshold. For example, the larger the window size is, the more accurate the detection results are. However, larger window size means longer time to process. We believe that the ability to choose and customize operating parameters should be offered in the complex environment like the grid.
There are two ways to check if a latest value is an anomaly or not: moving window method and operational model method. The moving window method only uses N newest values. It reflexes the current activity of application. However, a disadvantage of moving window method is that it is not very efficient when the number of anomalous value is high in the N latest samples. In this case, operational model
can be applied. N first samples are considered normal. From this normal pattern, the mean and standard deviation are calculated. To compensate the disadvantage of using N first values as normal pattern, heuristic approach can be used. Current monitored value is updated into normal pattern data set if it is not an anomaly. This is opposite with static normal pattern approach.
TABLE II ANOMALY DETECTION RESULTS USING WINDOW MOVING
METHOD Options HIT FP
nCnSnF 41 13
nCnSF 30 11
nCSnF 41 13
nCSF 30 11
CnSnF 100 102
CnSF 52 60
CSnF 100 102
CSF 52 60
TABLE I ANOMALY DETECTION RESULTS USING OPERATIONAL
MODEL METHOD Options HIT FP
nCnSnFnH 100 163
nCnSnFH 100 2211
nCnSFnH 76 174
nCnSFH 86 760
nCSnFnH 100 163
nCSnFH 100 2211
nCSFnH 76 174
nCSFH 86 760
CnSnFnH 100 163
CnSnFH 100 3398
CnSFnH 88 449
CnSFH 100 3066
CSnFnH 100 163
CSnFH 100 3398
CSFnH 88 449
CSFH 100 3066
One more thing to be considered is the distribution function of the sample. Within threshold of one standard deviation, the probability that a sample is considered abnormal 22.8% if the sample follows normal distribution. This probability will be different if it follows exponential distribution. Another approach is to use the Cumulative Distribution Function (CDF) for describing the set of samples.
Moreover, in order to reduce the effect of outliers, smoothing option is added to smooth values using the exponential weighted moving average function, which takes single parameter α. For each new value, xi, the smoothed value is calculated as α * xi + (1- α)* xi-1. α=1 means no smoothing at all. It is generally accepted that α=0.2 [11].
We therefore have many options. We can choose between moving window method and operational model method. In each method, we can choose to use: FFT option (F) or not (nF), CDF (C) or not (nC). We can also choose whether the smoothing function will be applied (S) or not (nS). In operational model method, two ways of updating normal pattern can be applied: the static approach (not update) and the heuristic one (H or nH).
4 Evaluation In this section, we evaluate the performance of window-based detection method. We used window-based detection
136 Int'l Conf. Grid Computing and Applications | GCA'08 |
method to detect anomalies in CPU usage of processes. We used two metrics: the number of successful detections, HIT, and the number of false positives, FP.
We carried out the experiment in 25 hours. We injected deliberately and randomly 100 CPU usage anomalies generated by a CPU consumption tool. The consumption tool consists of N simultaneous computing intensive processes. We also run some processes periodically to emulate periodic patterns.
We set the threshold to 2 standard deviations and 10 percent with CDF option. The window size was 256. The number of samples in normal profile was 256, too. We run both operational model method and moving window method with various options. The experimental result is illustrated in table I and table II. It can be seen that smooth option does not affect the detection result. The most influential option is CDF. Using CDF makes the HIT rate higher. CDF reflexes probability of each real value. Thus, the detection result does not depend on the hypothesis of distribution rules.
The second noticeable option, which affects the detection result, is FFT option. FFT option results in lower HIT rate and higher ratio FP/HIT. There are two main reasons. First, the periodic patterns are not clear. Second, FFT option not only eliminates periodic patterns but also alters observed values (as illustrated in Figure 1). In the experiment, any frequency whose amplitude is greater than average is cut. FFT option creates more distortion in observed values. Some normal values are altered to anomaly and vice verse.
Heuristic option makes the number of alarm increases dramatically. Heuristic selection of normal profile makes values converge. Thus, the range of normal values is shrunk. This causes the number of values triggered as anomalies increase.
5 Anomaly detection in grid Monitoring service is considered as an important part of grid information systems [12] such as Globus MDS [1] and R-GMA [2]. At cluster level, Ganglia [3] is a scalable and widely used cluster monitoring system. However, this approach does not support monitoring and detecting the anomaly of jobs that are running in the grid. A number of solutions have been proposed for grids to monitor the application. Systems such as NetLogger [13], OCM-G [14] and Autopilot [15] focus on application monitoring [16]. However, detecting anomaly of grid job requires the interoperation between the monitoring system and the grid services. When the user submits a job to the grid, the job will be managed by a job manager. Each running job in grid consists of multiple processes. The relation between the job id (in grid) and the processes running on each host is identified by the job management service. It is essential to set
up a monitoring system that can be integrated into grid. The monitoring system will collects the information running jobs and uses this information to detect anomaly with the window-based algorithm. The overall architecture is illustrated in Figure 2. It consists of following components:
-50
0
50
100
150
0 50 100 150 200 250
Sample
CP
U (%
)
originafter FFT cut
Fig. 1. Application performance value before (the upper) and after (the lower) FFT cut.
1) Grid Job Information Service. This service provides information about the jobs running in the grid. It communicates with the job manager to get the job manifest, a document that contains both the description of the job and the specification of the requested local resources. An example of the job manager is Globus GRAM [17]. This service registers itself with the directory service, indicating type of information it supports. This data can be queried by the Local Monitoring Manager on each host to identify state of the job in this host and the processes belonged to it.
2) Sensor. Each host in the grid has a sensor attached to it. The sensor consists of two components. Local Monitoring Management is responsible for starting and stopping Information Collector and Anomaly Detector. It identifies the processes to be monitored in each host via the Grid Job Information Service. The Information Collector and Anomaly Detector can monitor significant resource usage of these processes and detect anomalies if they occur.
3) Directory Service. Directory Service is used to publish the location of Grid Job Information Service, Anomaly Event Producer and Monitoring Service. This allows Monitoring Service to discover which Anomaly Event Producer is currently active and contact to get a given sensor’s output. Query-optimized Directory Services such as LDAP [18] and Globus MDS provide fundamental mechanisms for this purpose. LDAP is a simple, standard solution. LDAP servers can be hierarchical. In Grid Monitoring Architecture [19], Producers register themselves with Directory Service and describe the type and structure of information they want to make available to the Grid. Consumer can query Directory Service to find out what type of information is available and locate the relevant Producers. Once Producers are known, Consumer will contact them directly to obtain the appropriate data.
Int'l Conf. Grid Computing and Applications | GCA'08 | 137

4) Producer Service. Consumer cannot connect directly to a target host because of some system’s policies. Thus, an intermediate Producer can be installed on a host that has connectivity to both sides. This Producer can act as a proxy between the Consumer and the target host. Proper authentication and authorization policies at this proxy make the system secure and manageable.
5) Monitoring Service. The primary role of Monitoring Service is to retrieve dynamic status information from the appropriate Local Monitoring Manager. Monitoring Service only gathers the most recent value published by Producer. It communicates with Producer using a request-reply type transaction. This collected information will be used by any Grid Information Service. In GMA, Consumers have to register with Directory Service to be notified about changes occurring in relevant Producers.
6 Conclusion Grid monitoring plays an important role in building robust grid computing infrastructure. The monitoring task provides information about not only system resource but also status of running jobs. Early alarm of anomaly occurrences has significant benefit. When anomaly is detected, suitable actions such as canceling or restarting job can be made. In this paper, we presented a variety of anomaly detection methods. We described details window-based method with comprehensive options. Evaluation result indicated that a suitable combination of options brings good result. To exploit anomaly-detecting system on nodes, we introduced the architecture of grid monitoring service that addressed anomaly information. The architecture involves producing anomaly information and providing the protocol for incorporating grid monitoring system and grid scheduler. In the future, we plan to implement this service and deploy it at High Performance Computing Center at Hanoi University of Technology.
Acknowledgement
Fig. 2. Components of Anomaly Detection System in Grid
This research is conducted at High Performance Computing Center, Hanoi University of Technology. It is supported in part by VN-Grid, SAREC 90 RF2, and KHCB 20.10.06 projects.
References [1] K. Czajkowski, I. Foster et al:Grid Information Services for Distributed Resource Sharing. in 10th IEEE International Symposium on High Performance Distributed Computing, San Francisco, California. August, 2001.
[2] S. Fisher, R. Byrom et al: R-GMA: A Relational Grid Information and Monitoring System. in 2nd Cracow Grid Workshop, Cracow, Poland. 2003.
[3] M. L. Massie, D. E. Culler and B. N. Chun: The Ganglia distributed monitoring system: design, implementation, and experience. in International Journal Parallel Computing. 2004.
[4] L. Yang, I. Foster et al: Anomaly detection and diagnosis in grid environments. in Proceedings of the International Conference for High Performance Computing, Networking, Storage and Analysis (SC'07), Reno, Nevada, USA. 2007.
[5] J. Bresnahan, D. Gunter et al: Log Summarization and Anomaly Detection for Troubleshooting Distributed Systems, in Proceedings of 8th IEEE/ACM International Conference on Grid Computing, Austin, TX, USA. 2007. p. 226-234.
[6] W. Gropp and E. Lusk: Reproducible Measurements of MPI Performance Characteristics. in PVM/MPI, Lecture Notes in Computer Science, Vol. 1697, pp. 11-18, Springer. 1999.
[7] L.R. Rabiner: A tutorial on hidden Markov models and selected applications in speech recognition. in Proceedings of the IEEE, Vol. 77, pp. 257-286. 1989.
[8] R.P.W. Duin: Learned from Neural Networks. in Proc. ASCI 2000, 6th Annual Conf. of the Advanced School for Computing and Imaging (Lommel, Belgium, June 14-16), ASCI, Delft, 9-13. 2000.
[9] P. Langley and H.A. Simon: Applications of Machine Learning and Rule Induction. in Communications of the ACM, 38(11), pp. 54-64. November 1995.
[10] S. Hariri and B.U. Kim: Anomaly-based fault detection system in distributed system. in Proceedings of Fifth International Conference on Software Engineering Research, Management and Applications. 2007.
138 Int'l Conf. Grid Computing and Applications | GCA'08 |

[11] W.G. Hunter, J.S Hunter et al: Statistics for Experimenters. 1978, Wiley-Interscience.
[12] C. Kesselmna, I. Foster and S. Tuecke: The Autonomy of the Grid, Enabling Scalable Virtual Organizations. International Journal Super Computing. 2002.
[13] B. L. Tierney, D. Gunter et al: Dynamic Monitoring of High Performance Distributed Applications. in Proc. 11th IEEE International Symposium on High Performance Distributed Computing, Edinburgh, Scotland. July 2002.
[14] B. Bali´s, M. Bubak, et al: An Infrastructure for Grid Application Monitoring. in Proc. 9th European PVM/MPI Users’ Group Meeting, Linz, Austria. September/October 2002.
[15] J. Vetter, R. Ribler et al: Autopilot: Adaptive Control of Distributed Applications. in Proc. 7th IEEE Symposium on High Performance Distributed Computing, Chicago, Illinois. July 1998.
[16] G. Gombás and Z. Balaton: Resource and Job Monitoring in the Grid. in Euro-Par 2003 Parallel Processing: 9th International Euro-Par Conference Klagenfurt, Austria. August 26-29, 2003.
[17] I. Foster, K. Czajkowski et al: A Resource Management Architecture for Metacomputing Systems. in IPPS/SPDP ’98 Workshop on Job Scheduling Strategies for Parallel Processing. 1998.
[18] T. Howes, M. Wahl and S. Kille: Lightweight Directory Access Protocol (v3), RFC 2251. December 1997.
[19] R. Aydt, D. Gunter et al: A Grid Monitoring Architecture in Global Grid Forum, Performance Working Group, Grid Working Document GWD-Perf-16-1, 2001
Int'l Conf. Grid Computing and Applications | GCA'08 | 139

“Secure Thyself”: Securing Individual Peers in
Collaborative
Peer-to-Peer Environments
Ankur Gupta1 and Lalit K. Awasthi
2
1Computer Science & Engineering, Model Institute of Engineering & Technology, Jammu, Jammu &
Kashmir, India 2 Computer Science & Engineering, National Institute of Technology, Hamirpur, Himachal Pradesh, India
Abstract - P2P networks and the computations that they
enable hold great potential in designing the next generation
of very-large scale distributed applications. However, the
P2P phenomenon has largely left untouched large
organizations and business which have stringent security
requirements and are uncomfortable with the anonymity,
lack of centralized control and censorship, which are the
norm in P2P systems. Hence, there is an urgent need to
address the security concerns in deploying P2P systems
which can leverage the under-utilized resources in millions
of organizations across the world. This paper proposes a
novel containment-based security model for cycle-stealing
P2P applications, based on the Secure Linux (SE Linux)
Operating System, which alleviates existing security
concerns, allowing peers to host untrusted or even hostile
applications. The model is based on securing individual
peers rather than computing trust/reputation metrics for the
thousands of peers in a typical P2P network, which involves
significant computational overheads.
Keywords: Peer-to-Peer Computing, Peer-to-Peer Security,
Containment-Based Security Model, Secure Linux
1 Introduction
P2P networks are self-organizing in nature, extremely
fault-tolerant and designed to provide acceptable
connectivity and performance in the face of a highly-
transient population of nodes. Their desirable characteristics
have resulted in several P2P-based applications being
proposed/built for a wide-variety of domains such as
distributed computing (SETI@HOME [1], Condor [2],
Avaki [3]), file/information sharing (kazaa [4], facebook
[5]), collaboration (Groove [6]) and middleware/platforms
(JXTA [7]) enabling further development and deployment of
P2P applications. However, business organizations have
largely been left untouched by the P2P phenomenon, citing
lack of security as the biggest concern for staying away from
potentially beneficial collaborations, sharing of information
and other possible financial benefits that cross-organizational
P2P interactions could enable. The lack of centralized
control, censorship and anonymity offered by P2P systems,
coupled with the potential for malicious activity, could
compromise the confidential data of an organization, besides
putting its compute resources at risk. However, the potential
benefits of enabling cross-organization P2P interactions [8],
necessitates that the research community attempt to mitigate
the security threats posed by the P2P system model.
Several schemes for ensuring the security of peers
participating in P2P networks have been proposed. Most of
the research has focused on security of content-sharing P2P
applications/networks, while P2P applications which
involving remote task execution have not received the
desired attention. A majority of these schemes rely on trust
and reputation [10-12] based mechanisms in attempting to
isolate untrusted/malicious peers from the rest of the peers.
However, such schemes require computing trust values for
each peer interaction and then communicating the computed
values to all peers in the network. Clearly, such schemes are
not fool-proof. Besides forged identities, groups of malicious
peers can act together to circumvent the trust management
schemes. Moreover, the computational overheads required
for such schemes render them ineffective when trying to
ensure bullet-proof security for participating peers, a major
requirement for all organizations. Other schemes [13-16]
incorporating elements of access control,
authentication/authorization and encryption have also been
proposed, which rely on introducing centralized security
servers in an otherwise decentralized P2P environment. This
introduces a single-point-of-failure in the P2P network,
besides constituting a performance bottleneck. Also, in
resource-exchanging P2P environments, once the remote
code is resident on the host-peer these approaches are silent
on containing the potential damage that can occur. What is
really needed is to secure individual peers while dealing with
untrusted peers and reduce or mitigate the impact of hosting
140 Int'l Conf. Grid Computing and Applications | GCA'08 |
malicious remote code, especially for cycle-stealing P2P
applications, which rely on harvesting idle compute cycles.
This research paper proposes a simple containment-
based security model for cycle-stealing P2P applications,
which creates a virtual sandbox for remote code, thereby
mitigating the security threat posed by any malicious peers.
The model uses the fine-grained privileges and Rule-Based
Access Control mechanisms provided by Secure Linux [9]
and a deploys a custom-built Remote Application Monitor
(RAM) to create a secure computing environment for cycle-
stealing P2P applications, without having to pay the
overheads of managing trust and reputation values. This
work is a part of a bigger effort to enable secure P2P
interactions across organizations and some of the issues
addressed are due to specific requirements of the architecture
proposed in [8] by the authors.
The rest of the paper is organized as follows: section 2
provides an overview of various flavors of Secure Operating
Systems, which form a basis for the proposed solution.
Section 3 discusses the system model of the proposed
solution, while section 4 provides the implementation details
on Secure Linux. Section 5 analyses the effectiveness of the
proposed solution and finally section 6 concludes the paper.
2 Secure Operating Systems
Several Operating Systems [17-19] now provide inbuilt
security mechanisms based on virtualization [20], fine-
grained privileges, role-based access control and concepts of
containment and compartmentalization. The basic idea is to
allow the system to host a wide-variety of users/applications,
requiring access to specific resources, while insulating them
from the other users/applications on the system, thereby
creating a “sandbox” effect. Moreover, virtualization has
been employed by many hardware vendors to create logical
partitions on the same computer system. Some of these
solutions even allow for isolation of physical faults in these
partitions, thereby ensuring that the other partitions continue
to operate normally. However, these features are primarily
designed for specific applications installed on the system and
not for the varied applications that could be uploaded to a
remote peer for execution. Moreover, these security features
are typically available only on the high-end servers, not the
typical systems you would see in a P2P network. A security
framework needs to be more generalized and work with all
possible hardware configurations. Hence, we decided to use
SE Linux for its easy availability (open-source). However,
our implementation can be applied to any of the operating
systems discussed above.
3 System Model
For P2P systems, we need to provide security at two
levels; security of shared content, with multiple remote peers
accessing the data and and when multiple remote
peers/applications make use of the idle CPU cycles and disk
space on the host peer. Any security model would also need
to be flexible and customizable, since different organizations
would have different security policies. We also introduce a
Remote Application Monitoring (RAM) module, which shall
monitor the application for any suspicious activity like
increased/heavy CPU utilization, increased
outbound/inbound network traffic, increased disk space
usage, increased memory utilization etc. If the application
exceeds its pre-defined quotas (quotas could be pre-
negotiated based on the local peers characteristics and
resource availability or via an organization-wide policy), the
RAM can promptly terminate the application. By using the
access control features provided by SE Linux in conjunction
with our custom application monitor, the local peer can be
secured and malicious remote code can be contained without
causing serious damage within the P2P network. The
proposed containment based solution shall be implemented
on individual peers hosting remote applications and shall
work as follows:
a. Create an area reserved for remote P2P
applications.
b. Create a security policy for Secure Linux, which
shall control access to the resources of the local
peer. This policy is pre-configured.
c. Allow remote applications/code to reside in the
reserved area and use idle compute and system
resources, as per defined security policy. SE Linux
security features shall ensure that access to critical
resources is denied to any malicious code.
d. Configure the Remote Application Monitor (RAM)
with pre-defined thresholds or quotas. These quotas
provide the upper limit on peer resource usage and
shall be based on the peer’s local requirements and
resource availability.
e. Monitor the resource usage of the remote
application and take corrective action, if usage
crosses thresholds, say CPU utilization crosses a
particular threshold, or the application stays active
after its allotted time is over.
f. Monitor the application for any potentially
malicious activity; say a spike in the
incoming/outbound network traffic etc. and
terminate the application if needed.
Fig. 1 provides an overview of the system model for the
proposed solution.
Int'l Conf. Grid Computing and Applications | GCA'08 | 141

4 Implementation
The implementation of the system has two components;
the security policy for individual peers to securely host
remote applications and a custom-built Remote Application
Monitor (RAM). We have used the SE Linux features to
define a security policy suited to meet the security
requirements for cycle-stealing P2P applications. Although
the system is still under development, some aspects of the
system have been realized and tested. Due to the lack of user
support for SE Linux, writing security policies is a hit-and-
trial approach at best. Hence, a lot more testing shall be
needed to fine-tune the system and make it work in a live
environment.
4.1 The SE Linux Security Policy
This section provides details of the policy designed to
secure individual peers, enabling them to host untrusted
remote applications. To host the remote application a user
“remote_user” is created on the host machine. The security
policies are defined in the context of the “remote_user” and
the remote application “remote_app”, which shall make use
of the resources of the host peer. Figs. 2. and 3. provide
indicative security policies on Secure Linux. The syntax and
semantics for writing security policies for SE Linux are
available at [9] along with sample policies. It is assumed that
the relevant P2P middleware shall place the remote
application in the remote_user’s home directory and assign
the ownership of the remote application to “remote_user”.
Moreover, for RAM, the executable name is assumed to be
fixed (remote_app) at present. It is possible to generate
configuration policies at runtime at a later stage to cater to
different applications.
Reserved Area for Remote
Applications on Disk
Remote
Application
Remote Application Monitor
(RAM)
Run-Time
Monitoring
RAM Threshold Configuration
CPU
Util
Disk
Usage
Network
Usage
S
E
L
I
N
U
X
S
E
C
U
R
I
TY
L
A
Y
E
R
System
Resources
(sockets, files
IPC Objects)
System Calls
File System
Access
Request
Access
Decision
Time-
Based
Usage
Fig. 1 System Model for the Proposed Security Scheme; Uses SE Linux Access Control
Features with Custom Remote Application Monitor to Ensure Security of Local Peer
SE LINUX
Security Policy
142 Int'l Conf. Grid Computing and Applications | GCA'08 |
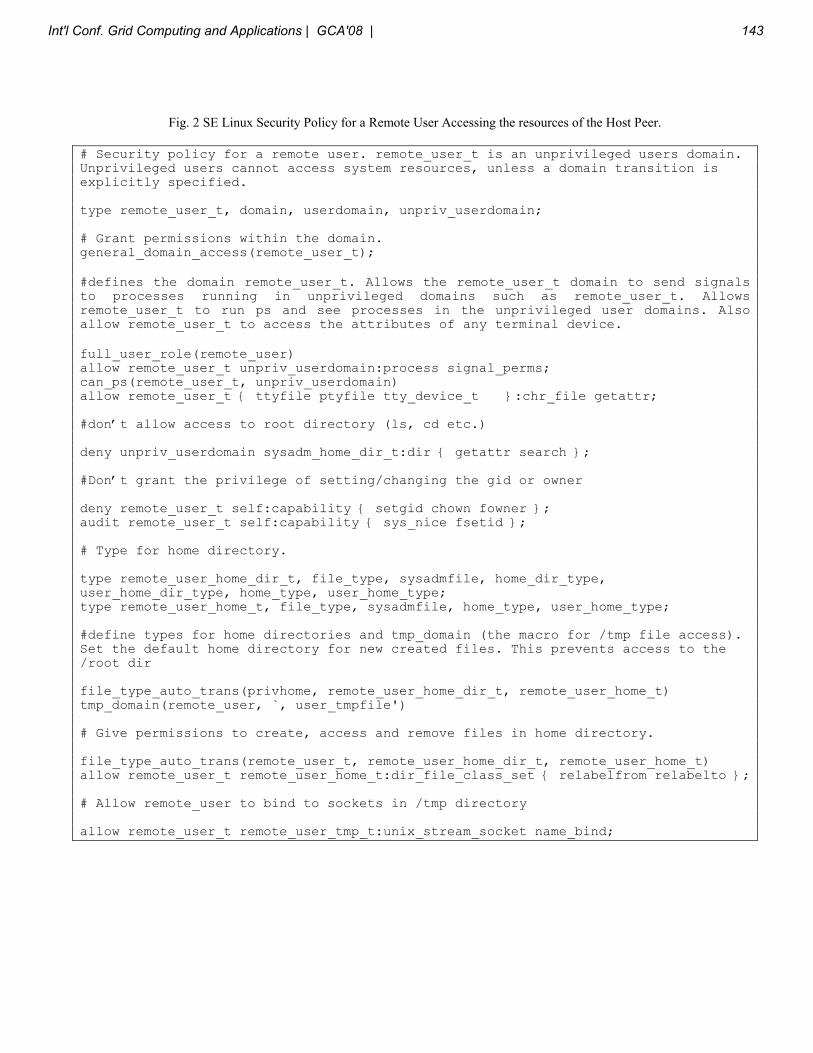
Fig. 2 SE Linux Security Policy for a Remote User Accessing the resources of the Host Peer.
# Security policy for a remote user. remote_user_t is an unprivileged users domain. Unprivileged users cannot access system resources, unless a domain transition is explicitly specified. type remote_user_t, domain, userdomain, unpriv_userdomain; # Grant permissions within the domain. general_domain_access(remote_user_t);
#defines the domain remote_user_t. Allows the remote_user_t domain to send signals to processes running in unprivileged domains such as remote_user_t. Allows remote_user_t to run ps and see processes in the unprivileged user domains. Also allow remote_user_t to access the attributes of any terminal device.
full_user_role(remote_user) allow remote_user_t unpriv_userdomain:process signal_perms; can_ps(remote_user_t, unpriv_userdomain) allow remote_user_t { ttyfile ptyfile tty_device_t }:chr_file getattr; #don’t allow access to root directory (ls, cd etc.) deny unpriv_userdomain sysadm_home_dir_t:dir { getattr search }; #Don’t grant the privilege of setting/changing the gid or owner deny remote_user_t self:capability { setgid chown fowner }; audit remote_user_t self:capability { sys_nice fsetid }; # Type for home directory. type remote_user_home_dir_t, file_type, sysadmfile, home_dir_type, user_home_dir_type, home_type, user_home_type; type remote_user_home_t, file_type, sysadmfile, home_type, user_home_type; #define types for home directories and tmp_domain (the macro for /tmp file access). Set the default home directory for new created files. This prevents access to the /root dir file_type_auto_trans(privhome, remote_user_home_dir_t, remote_user_home_t) tmp_domain(remote_user, `, user_tmpfile') # Give permissions to create, access and remove files in home directory. file_type_auto_trans(remote_user_t, remote_user_home_dir_t, remote_user_home_t) allow remote_user_t remote_user_home_t:dir_file_class_set { relabelfrom relabelto }; # Allow remote_user to bind to sockets in /tmp directory allow remote_user_t remote_user_tmp_t:unix_stream_socket name_bind;
Int'l Conf. Grid Computing and Applications | GCA'08 | 143

Fig. 3 SE Linux Security Policy for remote applications executing on the host peer.
# Security Policy for a remote executable # Types for the files created by remote app type remote_app_file_t, file_type; # Allow remote_app to create files and directories of type remote_app_file_t create_dir_file(remote_app_t, remote_app_file_t) # Allow user domains to read files and directories these types r_dir_file(userdomain, { remote_app_file_t }) can_exec(remote_app_t, { remote_app_exec_t bin_t }) # Allow network access can_network(remote_app_t) # Allow Socket Operations can_unix_send( { remote_app_t sysadm_t }, { remote_app_t sysadm_t } ) allow remote_app_t self:unix_dgram_socket create_socket_perms; create_stream_socket_perms; can_unix_connect(innd_t, self) # Allow PIPE operations and binding to a socket allow remote_app_t self:fifo_file rw_file_perms; allow remote_app_t innd_port_t:tcp_socket name_bind; allow remote_app_t innd_var_run_t:sock_file create_file_perms; # Deny privilege to set gid and uid deny remote_app_t self:capability { dac_override kill setgid setuid }; deny remote_app_t self:process setsched; # deny access to key system directories deny remote_app_t { bin_t sbin_t }:dir search; deny remote_app_t usr_t:lnk_file read; deny remote_app_t usr_t:file { getattr read ioctl }; deny remote_app_t lib_t:file ioctl; deny remote_app_t { etc_t resolv_conf_t }:file { getattr read }; deny remote_app_t { proc_t etc_runtime_t }:file { getattr read }; deny remote_app_t urandom_device_t:chr_file read;
4.2 The Remote Application Monitor
The RAM is a collection of scripts which uses the
psmon [21] freeware tool to enforce certain quotas like max
application instances, time to live for the remote application,
max CPU utilization, max memory utilization etc. psmon
has the ability to slay the processes which exceed the
configured limits. Other quotas like max network
connections are implemented using scripts based on the
output of the netstat command on linux. Monitoring is done
on % CPU utilization, number of instances of remote
application, disk usage, number of network connections,
network usage and time-based usage (CPU time). The RAM
allows the user to specify quotas on these parameters and if
the application exceeds its quota, it is terminated by RAM.
Although the custom security policy on SE Linux would
deny access to critical system resources, it does not prevent
the remote application from initiating malicious activity, like
Distributed-Denial-of-Service (DDoS) attacks on other peers
in the P2P network by pumping in invalid packets/queries.
Also, SE Linux is unable to specify the quantum of resource
usage, a requirement for collaborative P2P environments,
where resources are exchanged frequently. Hence, we need
the RAM to strictly enforce resource usage limits for the
peer hosting the remote application, besides monitoring the
number of network connections established by the remote
application and the traffic generated. It is planned to extend
144 Int'l Conf. Grid Computing and Applications | GCA'08 |

the RAM to monitor several other application specific
parameters in future.
5 Analysis
Fig. 4 provides details of the responses by the proposed
security framework to some potentially malicious activity by
a sample application.
Fig. 4 Possible malicious behavior by remote hosted
application and the responses of the CBSM
S.No Malicious Activity Result
1. Establishing Multiple
Network Connections and
generating traffic above
threshold
RAM Terminates
the Application
2. Attempt to access files in a
directory outside reserved
area
Access declined
by SE Linux
3. Attempt to fork repeatedly
resulting in multiple
instances of the remote
application
RAM terminates
application after it
crosses
num_instances
quota for remote
app.
4. Attempt to generate network
traffic and propagate
Distributed-Denial-of-
Service Attacks
RAM terminates
the application
after monitoring
network traffic
generated by it.
5. Application performs
compute-intensive tasks
leading to high CPU
utilization
RAM terminates
the application
after it crosses
CPU utilization
quota.
6. Attempt to execute system
calls with admin privileges
SE Linux Security
Policy denies
access to the
application.
The overheads introduced by the Remote Application
Monitor (RAM) are incurred only when the remote
application is being run. Although, SE Linux does introduce
some overheads in making access decisions at run-time,
several optimizations like caching access decisions for future
use help to keep the application performance impact to
negligible levels. A complete analysis of performance
overheads of SE Linux can be found in [22]. It is evident that
by combining the rule-based access control mechanisms
provided by SE linux along with the custom Remote
Application Monitor (RAM), the security of the peer hosting
remote work is enhanced significantly. By providing more
flexible security configuration settings, it is possible to safely
enable peer interactions across organizations and host
untrusted remote applications.
6 Conclusions and Future Work
Our research shows that by using standard off-the-shelf
components combined with a custom application monitor, it
is possible to build a secure environment for cycle-stealing
P2P applications. Very little attention of the research
community has been focused on this important area. Hence,
this research is significant, since it allows individual peers to
be secured, allowing them to host any remote application,
without putting its resources/confidential information at risk.
Moreover, the proposed scheme does not require any
expensive trust/reputation management schemes to ensure
security. It is hoped that this research can form the basis for
more comprehensive security mechanisms, promoting the
adoption/deployment of P2P applications across
organizations, helping realize the enormous potential of
cross-organization P2P interactions.
Future work shall involve identifying as many scenarios
indicating malicious activity by the remote applications and
tweaking the system to provide fool-proof security. The
detailed analysis of the effectiveness of the proposed model
and its performance overheads shall be available shortly
when the system is tested extensively using several flavors of
malicious code and compared with existing security
approaches.
7 References
[1] SETI@HOME: Website http://setiathome.berkeley.edu
[2] AVAKI: Website http://www.avaki.com
[3] CONDOR: Website http://www.wisc.com/condor
[4] KAZAA: Website http://kazaa.com/us/index.htm
[5] FACEBOOK: Website http://www.facebook.com
[6] GROOVE: Website http://office.microsoft.com/en-
us/groove/FX100487641033.aspx
[7] JXTA: Website http://www.sun.com/jxta
[8] Ankur Gupta and Lalit K. Awasthi, “Peer Enterprises:
Possibilities, Challenges and Some Ideas Towards Their
Realization”, Proceedings of the 1st International Workshop
on Peer-to-Peer Networks, Nov 26, 2007, OTM WS, Part –
II, LNCS 4806, pp 1011-1020, Springer-Verlag.
[9] Linux SE http://www.nsa.gov/selinux/info/docs.cfm
Int'l Conf. Grid Computing and Applications | GCA'08 | 145

[10] Sergio Marti and Hector Garcia-Molina, "Taxonomy of
Trust: Categorizing P2P Reputation Systems", COMNET
Special Issue on Trust and Reputation in Peer-to- Peer
Systems, 2005.
[11] S.D Kamwar, M.T. Schlosser and H. Garcia-Molina,
The EigenTrust Algorithm for Reputation Management in
P2P Networks, Proc. WWW 2003
[12] Singh, A and Liu, L, TrustMe: Anonymous
Management of Trust Relationships in Decentralized P2P
Systems. In Proceedings of the Third International
Conference on Peer-to-Peer Computing, September 2003
[13] Y. Kim, D. Mazzocchi, and G. Tsudik, “Admission
Control in Peer Groups,” in Second IEEE International
Symposium on Network Computing and Applications, p.
131, Apr. 2003.
[14] J. S. Park and J. Hwang, “Role-based Access Control
for Collaborative Enterprise In Peer-to-Peer Computing
Environments,” in Proceedings of the eighth ACM
symposium on Access control models and technologies, pp.
93–99, 2003.
[15] Gaspary, L. P., Barcellos, M. P., Detsch, A., and
Antunes, R. S. 2007. Flexible security in peer-to-peer
applications: Enabling new opportunities beyond file
sharing. Comput. Networks 51, 17 (Dec. 2007)
[16] Park, J.S.; An, G.; Chandra, D., Trusted P2P computing
environments with role-based access control, Information
Security, IET Volume 1, Issue 1, March 2007 Page(s):27 –
35
[17] HP-UX 11i Security Containment White Paper
http://h20338.www2.hp.com/hpux11i/downloads/SecurityCo
ntainmentExecutiveWhi epaper1.pdf
[18] Sun Trusted Solaris
http://www.sun.com/software/solaris/trustedsolaris/document
ation/index.xml
[19] VMWare Website: http://www.vwware.com
[20] Mendel Rosenblum, Tal Garfinkel, "Virtual Machine
Monitors: Current Technology and Future Trends,"
Computer, vol. 38, no. 5, pp. 39-47, May, 2005
[21] Process Table Monitoring Script; psmon website:
http://www.psmon.com
[22] Peter Loscocco , Stephen Smalley, Integrating Flexible
Support for Security Policies into the Linux Operating
System, Proceedings of the FREENIX Track: 2001 USENIX
Annual Technical Conference, p.29-42, June 25-30, 2001
146 Int'l Conf. Grid Computing and Applications | GCA'08 |

Behavioral Trust Management System
S.Thamarai selvi1, R.Kumar
1, and K.Rajendar
1
1Information Technology, CARE, MIT, Anna University , Chennai, Tamil Nadu, India
Abstract - Grid environment provides the capability to
access variety of heterogeneous resources across
multiple domains or organizations. The real challenge
in such a distributed environment is the selection of an
appropriate Resource Provider. Effective utilization of a
Resource provider can be achieved by considering the
Trust relationship among the entities. In this paper,
Trust management System is introduced to resource
selection in Grid, which aims at considering Trust as
one of the parameter. We propose a methodology for
computing the Trustworthiness of the Resource provider
depending on the past behavior and the belief of its
current execution.
Keywords: Trust Management, Resource provider.
1 Introduction
Trust is a complicated concept and the ability to
generate, understand and build relationships. Trust is defined
as the quantified belief by a trustor with respect to the
competence, honesty, security and dependability of a Trustee
within a specified context [28]. Based on the literature survey,
Trust models are classified according to the scope, principle
used for computation of Trust, Transaction and the nature of
the Trust metrics. The trust relationship exists between
various entities in a computation grid environment. RMS
plays a significant role in determining the Trustworthiness of
a RP. Although there is a greater need towards the evaluation
of trust relationship among these entities, the main focus and
the challenge lies in determining the Trust of the Resource
provider. In a computational Grid environment, with varied
and distributed Resource providers and Users, Resource
Management System (RMS) plays a vital role in the
determining the QoS of Resource provider and the security
consideration while selecting the Resource provider.
Integration of Trust in such a Resource management System
has been proposed by various researchers [4]. This objective
of determining the Trust as one of the parameter for Resource
selection motivates us towards the proposal of generic Trust
Management System.
The rest of paper is organized as follows section 2 describes
our proposed Trust management System. Mathematical model
is derived in Section 3. Trust Computation example has been
explained in Section 4. Section 5 concludes our work.
2 Trust Management System
Various proposals have been made towards the
evaluation of Trustworthiness of a Resource provider. PET,
PErsornalized Trust model [29] aims at determining the
Trustworthiness of P2P system using the factors like
Reputation and Risk. This model uses the recommendation
and Interaction derived Information for deriving the
Reputation and Risk. Recommendation is the opinions of the
peers towards the target peers, which involve in the process of
collecting the feedback from peers. Although this model
classified four levels of services ranging from Good to
Byzantine level, the constant value (negative or positive) for
associating these levels are left as the user's choice. Further,
this model lacks the concrete reasons for classifying the four
levels of Services. In [30] , Trust towards the Multi Agent
System have been proposed. In this model, Trust is focused as
the combination of self-esteem, reputation and familiarity
within specific context. The computation methodology used in
this model for determining Reputation, involves the user's
opinion about the Service and hence the result obtained here
is of subjective in nature, as expressed by User. Further, this
model lacks the grade for reviewing the user's level of Trust.
We propose a solution to the above discussed problem by
considering the Resource provider’s past experience with the
Resource Management System and also the present salient
features of the Resource provider, which will be useful for the
computational grid environment. A Trust Management
System that identifies the trust of any Resource provider with
the grid is discussed in the following Section3.
Most of the Research papers deal with the Trust
computation using various methodologies involving the
subjective nature as one of the parameter in the computation.
Further, they focus on the Reputation factor which depends
entirely on the opinion of the entities involved. We propose a
new and Generic Trust Management System (TMS) which
follows the Trust management life cycle in determining the
Trust of a RP. Our model has the advantages of obtaining
Trust metrics which are of objective nature. We compute the
Service entity's reputation and quality of service in an indirect
manner. Our model would like to identify the Trust metrics of
any Resource provider in the Grid environment, and these
metrics are very important to prove the quality of Service. It
also aims at considering the historic value and the Current
Resource capability, which is more significant more
computational environment. TMS follows a specific life cycle
and the various phases of the life cycle are as follows
Int'l Conf. Grid Computing and Applications | GCA'08 | 147

Figure 1. Life cycle of a Trust Management System
The various phases of TMS are
Trust Metric Identification
Trust Metric Evaluation
Trust Metric Calculation
Trust Value updation and
Trust Integration.
2.1 Trust Metric Identification
Trust Metric Identification is the first and foremost
important phase in Life cycle. It is more important to identify
the Trust Metric which reflects the nature of the system
involved.
2.2 Trust Metric Evaluation
The next phase is the Trust Metric Evaluation, a suitable
methodology is applied to determine the value of those
metrics, which have been identified in the previous phase.
2.3 Trust Metric Calculation
The Trust metric thus evaluated should be computed using
suitable mathematical model. Once the values for all the
metrics are obtained, the overall trust value of a Resource
provider is determined. It requires formalization of trust
model expressed in terms of the metrics identified.
2.4 Trust Value updation
Since, to reflect the dynamic nature of grid environment
where trust value will change rapidly as the resource provider
and consumer interacts. It is mandatory to monitor and
compute the metrics periodically and update the Trust value.
2.5 Trust Integration
The Trust value thus obtained is then used for making
decisions towards job scheduling, service access and for other
purpose depending on the type of the trust system established.
Azzedin [4], have proposed a mathematical model which
depends on the reputation and Trust level. This model aims at
the computation of Trust using the Direct Trust factor and the
reputation value from other entities. Furthermore, the Direct
Trust is Classified as the various levels A through F, with the
assumption A being the highest Trust value and F as the
lowest. It doesn't provide any confined values for those levels.
Also the reputation which is earned by the System is fully
subjective in nature and didn't addresses at identifying the
misbehaving entities. Our model has advantages by
considering the objective nature of the Trust and there are no
subjective measures involved in the computation of the Trust
metric. Although, there have been various possibility of
failures in the Grid Environment, we focus only on the quality
of service provided by the Resource provider, taking into
account about the possibility of failures which occurs on the
Resource provider. We focus Trust of a Resource provider as
the combined effect of the reputation and the degree of
fulfillment belief. Reputation is the opinion about the
Resource provider proven track capability in the user
perspective view. Since we compute Reputation in an indirect
manner without obtaining the user’s opinion, the two main
trust metrics which we have identified viz. are success rate
and the availability. Availability describes the ratio of the
number of times the Resource is in working state to the total
number of attempts made to verify the Resource’s existence.
This ratio depicts the Resource provider’s existence and the
dedicative nature towards the Grid environment. Success Rate
reflects the Resource provider’s capability in the job
execution. Thus it can be represented as the ratio of the
number of success jobs executed to the total number of jobs
submitted to the Resource provider. Thus these two
parameters namely Availability and the Success Rate would
reflect the reputation earned by the Resource provider over a
period of time.
We define a function , to represent the Historic Trust value of
the Resource provider ( ir ) with respect to the parameter
Availability and Success Rate. We represent trust as the
combined effect of the Resource provider’s past experience
with the present Resource provider’s system features. Thus we
can represent Trust as the summation of the function
),( nriHf and the function ( )trf siP
, .The
function ),( nriHf represent the Historic value of the
Resource provider ( ir ) with respect to the parameter
Availability and Success Rate, over a range of ‘n’ interaction
with the Resource Brokder.The function ( )trf siP,
represent the comparative ratio of the Resource provider with
148 Int'l Conf. Grid Computing and Applications | GCA'08 |
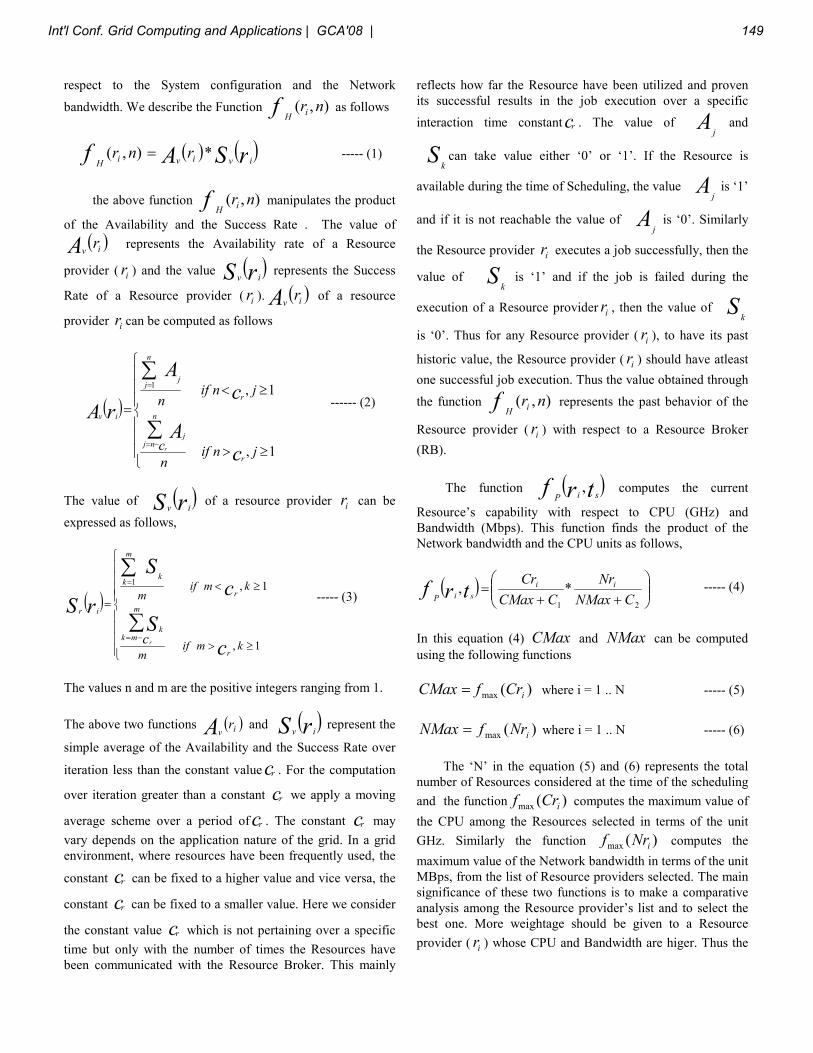
respect to the System configuration and the Network
bandwidth. We describe the Function ),( nriHf as follows
),( nriHf ( ) ( )rSA iviv
r *= ----- (1)
the above function ),( nriHf manipulates the product
of the Availability and the Success Rate . The value of
( )ivrA represents the Availability rate of a Resource
provider ( ir ) and the value ( )rS iv represents the Success
Rate of a Resource provider ( ir ). ( )ivrA of a resource
provider ir can be computed as follows
( )
≥>
≥<=
∑
∑
−=
=
1,
1,1
jnifn
c
jnifn
cA
cA
rA
r
n
njj
r
n
jj
iv
r
------ (2)
The value of ( )rS iv of a resource provider ir can be
expressed as follows,
( )
≥>
≥<
=
∑
∑
−=
=
1,
1,1
kmifm
kmifm
cS
cS
rS
r
m
mkk
r
m
kk
ir
cr
----- (3)
The values n and m are the positive integers ranging from 1.
The above two functions ( )ivrA and ( )rS iv
represent the
simple average of the Availability and the Success Rate over
iteration less than the constant valuecr . For the computation
over iteration greater than a constant cr we apply a moving
average scheme over a period ofcr . The constant cr may
vary depends on the application nature of the grid. In a grid
environment, where resources have been frequently used, the
constant cr can be fixed to a higher value and vice versa, the
constant cr can be fixed to a smaller value. Here we consider
the constant value cr which is not pertaining over a specific
time but only with the number of times the Resources have
been communicated with the Resource Broker. This mainly
reflects how far the Resource have been utilized and proven
its successful results in the job execution over a specific
interaction time constantcr . The value of Aj and
Sk
can take value either ‘0’ or ‘1’. If the Resource is
available during the time of Scheduling, the value Aj is ‘1’
and if it is not reachable the value of Aj is ‘0’. Similarly
the Resource provider ir executes a job successfully, then the
value of Sk
is ‘1’ and if the job is failed during the
execution of a Resource provider ir , then the value of Sk
is ‘0’. Thus for any Resource provider ( ir ), to have its past
historic value, the Resource provider ( ir ) should have atleast
one successful job execution. Thus the value obtained through
the function ),( nriHf represents the past behavior of the
Resource provider ( ir ) with respect to a Resource Broker
(RB).
The function ( )trf siP, computes the current
Resource’s capability with respect to CPU (GHz) and
Bandwidth (Mbps). This function finds the product of the
Network bandwidth and the CPU units as follows,
( )
++=
21
*,CNMax
Nr
CCMax
Cr ii
siP trf ----- (4)
In this equation (4) CMax and NMax can be computed
using the following functions
)(max iCrfCMax = where i = 1 .. N ----- (5)
)(max iNrfNMax = where i = 1 .. N ----- (6)
The ‘N’ in the equation (5) and (6) represents the total
number of Resources considered at the time of the scheduling
and the function )(max iCrf computes the maximum value of
the CPU among the Resources selected in terms of the unit
GHz. Similarly the function )(max iNrf computes the
maximum value of the Network bandwidth in terms of the unit
MBps, from the list of Resource providers selected. The main
significance of these two functions is to make a comparative
analysis among the Resource provider’s list and to select the
best one. More weightage should be given to a Resource
provider ( ir ) whose CPU and Bandwidth are higer. Thus the
Int'l Conf. Grid Computing and Applications | GCA'08 | 149
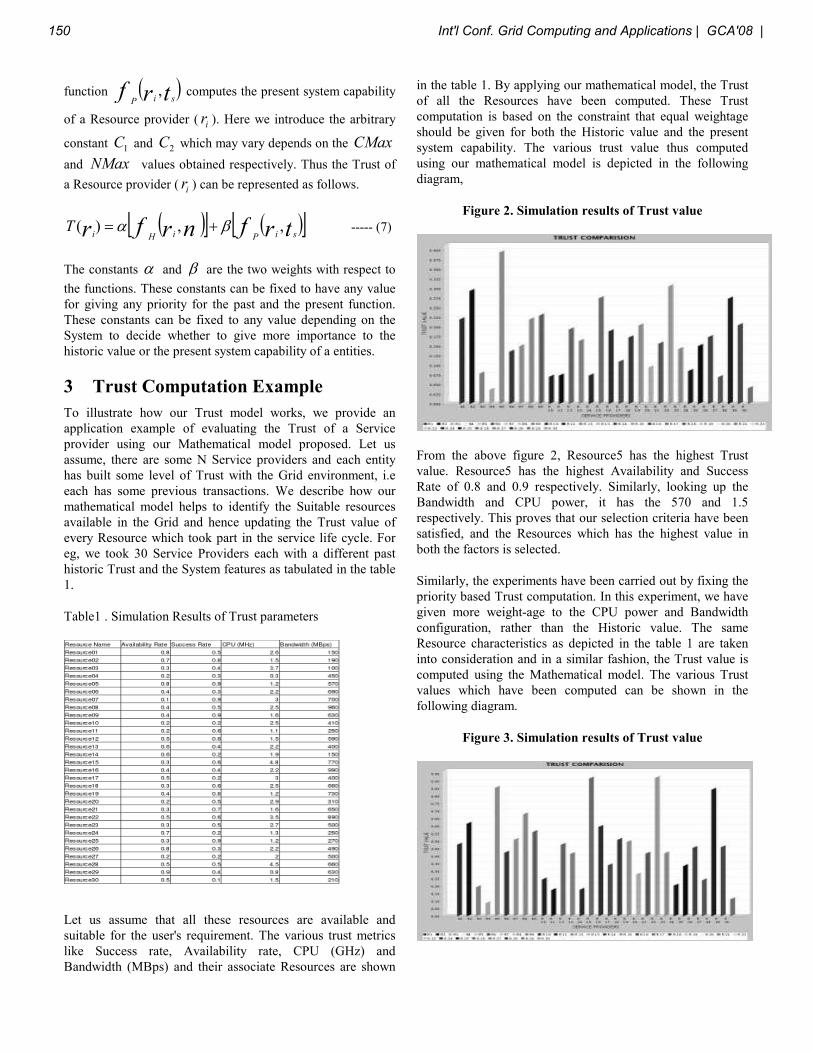
function ( )trf siP, computes the present system capability
of a Resource provider ( ir ). Here we introduce the arbitrary
constant 1C and 2C which may vary depends on the CMax
and NMax values obtained respectively. Thus the Trust of
a Resource provider ( ir ) can be represented as follows.
( )[ ] ( )[ ]trfnrfr siPiHiT ,,)( βα += ----- (7)
The constants α and β are the two weights with respect to
the functions. These constants can be fixed to have any value
for giving any priority for the past and the present function.
These constants can be fixed to any value depending on the
System to decide whether to give more importance to the
historic value or the present system capability of a entities.
3 Trust Computation Example
To illustrate how our Trust model works, we provide an
application example of evaluating the Trust of a Service
provider using our Mathematical model proposed. Let us
assume, there are some N Service providers and each entity
has built some level of Trust with the Grid environment, i.e
each has some previous transactions. We describe how our
mathematical model helps to identify the Suitable resources
available in the Grid and hence updating the Trust value of
every Resource which took part in the service life cycle. For
eg, we took 30 Service Providers each with a different past
historic Trust and the System features as tabulated in the table
1.
Table1 . Simulation Results of Trust parameters
Let us assume that all these resources are available and
suitable for the user's requirement. The various trust metrics
like Success rate, Availability rate, CPU (GHz) and
Bandwidth (MBps) and their associate Resources are shown
in the table 1. By applying our mathematical model, the Trust
of all the Resources have been computed. These Trust
computation is based on the constraint that equal weightage
should be given for both the Historic value and the present
system capability. The various trust value thus computed
using our mathematical model is depicted in the following
diagram,
Figure 2. Simulation results of Trust value
From the above figure 2, Resource5 has the highest Trust
value. Resource5 has the highest Availability and Success
Rate of 0.8 and 0.9 respectively. Similarly, looking up the
Bandwidth and CPU power, it has the 570 and 1.5
respectively. This proves that our selection criteria have been
satisfied, and the Resources which has the highest value in
both the factors is selected.
Similarly, the experiments have been carried out by fixing the
priority based Trust computation. In this experiment, we have
given more weight-age to the CPU power and Bandwidth
configuration, rather than the Historic value. The same
Resource characteristics as depicted in the table 1 are taken
into consideration and in a similar fashion, the Trust value is
computed using the Mathematical model. The various Trust
values which have been computed can be shown in the
following diagram.
Figure 3. Simulation results of Trust value
150 Int'l Conf. Grid Computing and Applications | GCA'08 |

From the figure 3, the Resource having the highest Trust value
is the Resource22. Since, our Resource selection is based on
the more weight-age to the System capability rather than the
historic value, the Resource which has the highest value of
System capability should be selected. By applying our
mathematical model, the Resource having the Highest Trust
value is the Resource22. Resource22 has the Success and
Availability rate of 0.5 and 0.6 respectively. Similarly, the
Resource22 has the highest bandwidth and CPU power of 890
and 3.5 respectively.
After an each transaction, the Availability of all those
Resources have been updated. Similarly, the Transaction
results, whether the success or failure rate has been updated
for a particular Resource entity. Thus, these updated results
act as a source for the historic trust as when computed for the
next transaction.
4 Conclusion
In this paper, we have proposed a Trust Model
architecture, which manages and computes the Trust of any
Service entities available in the Grid. The value of Trust thus
evolved is fully objective in nature and makes an advantage
over the other model of considering the subjective nature. We
also proposed a Mathematical model for computing the Trust
value of any Service entities. Further this Trust architecture
can be integrated to any Grid Meta Scheduler, for the ease of
improving the Resource selection module and hence increases
the reliability of Meta-scheduler.
5 Acknowledgement
The authors would like to thank the Department of
Information Technology, Ministry of Communication and
Information Technology of India for their financial support
and encouragement in pursing this research by its sponsored
Centre for Advanced Computing Research and Education
(CARE).
References
[1] Foster, I., Kesselman C., Tuecke, S., “The Anatomy of the
Grid: Enabling Scalable Virtual Organizations,” International
J. Supercomputer Applications 2001
[2] Foster, I., Kesselman. C., Nick, J.M., Tuecke, S., “The
Physiology of the Grid: An Open Grid Services Architecture
for Distributed Systems Integration”, Open Grid Service
Infrastructure WG, Global Grid Forum 2002.
[3] Foster I, Kesselman C (editors). The Grid: Blueprint for a
New Computing Infrastructure. Morgan Kaufmann: San
Fransisco, CA, 1999.
[4] Farag Azzedin and Muthucumaru Maheswaran
"Integrating Trust into Grid Resource Management Systems"
” Systems International Conference on Parallel Processing. .,
Vol 1., pp 47-54, 2002.
[5] Ramin Yahyapour, Philipp Wieder (editors), “Grid
Scheduling Use Cases,” GFD-I.064, Grid Scheduling
Architecture Research Group (GSA- RG), March 26, 2006.
[6] Eduardo Huedo, Ruben S. Montero and Ignacio M.
Llorente, “An Experimental Framework for Executing
Applications in Dynamic Grid Environments,” ICASE Nov
2002.
[7] R. Yahyapour and Ph. Wieder ,“Grid Scheduling Use
Cases v1.5, Grid Working Draft, Global Grid Forum, 2005.
https://forge.gridforum.org/projects/gsa-rg/document /
GridScheduling Use Cases V1.5.doc
[8] Abramson D, Giddy J, Kotler L, “High performance
parametric modeling with nimrod/g: Killer application for the
global grid?,” Proceedings of the 14th International Parallel
and Distributed Processing Symposium (IPDPS 2000), April
2000; 520–528.
[9] Buyya R, Abramson D, Giddy J. Nimrod/G: An
architecture for a resource management and scheduling
system in a global computational Grid. Proceedings of the
International Conference on High Performance Computing
in Asia–Pacific Region (HPC Asia 2000), 2000.
[10] U. Schwiegelshohn, R. Yahyapour, Ph. Wieder,
“Resource Management for Future Generation Grids,”
Technical Report TR-0005, Institute on Scheduling and
Resource Management, CoreGRID – Network of Excellence,
May 2005
[11] T. Grandison and M. Sloman, “A Survey of Trust in
Internet Applications”, IEEE Communications Surveys and
Tutorials, Vol. 4, No. 4, pp. 2-16, 2000.
[12] R.Dingledine, et al “Reputation in p2p anonymity
systems”, proc.of the 1st Workshop on Economics of p2p
systems June, 2003.
[13] B.Gross and et al “Balances of power on ebay:Peers or
unequals.” , Workshop on Economics of p2p systems June,
2003.
[14] K.Aberer and et al “Managing trust in peer-to-peer
information systems.” Proceedings of the 10th
International
Conference on Information and Knowledge Management,
2001
[15] Indrajit Ray and Sudip Chakraborth, “A Vector Model of
Trust Developing Trustworty Systems”,1999, 259-278.
Int'l Conf. Grid Computing and Applications | GCA'08 | 151

[16] Bin Yu and Munindar P.Singh, “Distributed Reputation
Management For Electronic Commerce”, First International
Joint Conference on Autonomous Agents and Multiagent
Systems, Bologna, Italy, 2002.
[17] A. Abdul-Rahman,”The PGP Trust Model”,EDI-Forum,
April 1997.
[18] M.Blaze,J. Feigenbaum, and J. Lacy, “Decentralized
trust management,” IEEE Conference on Security and
Privacy, 1996
[19] M. Blaze, “Using the KeyNote trust management
system,” AT&T Research Labs,1999.
[20]P. Resnick, R. Zeckhauser, E. Friedman and K.
Kuwabara,“ Reputation systems”,Communications of the
ACM 43(12):45–48, 2001
[21] R. Dingledine, N. Mathewson, and P. Syverson,
“Reputation in p2p anonymity systems”, Proc. of the 1st
Workshop on Economics of Peer-to-PeerSystems, June
2003.
[22] Matt Blaze, Joan Feigenbaum, and Jack Lacy
“Decentralized Trust Management”, IEEE Symposium on
Security and Privacy,1996, Oakland CA, May 6-8 1996. IEEE
Press
[23] Ernesto Damiani, De Capitani di Vimercati, Stefano
Paraboschi, Pierangela Samarati and Fabio Violante, “A
reputation-based approach for choosing reliable resources in
peer-to-peer networks”, 9th ACM conference on Computer
ACM Press, Nov 2002
[24] Sepandar D. Kamvar, Mario T. Schlosser, and Hector
Garcia-Molina, “The EigenTrust Algorithm for Reputation
Management in P2P Networks”, Twelfth International
World Wide Web Conference, 2003, Budapest, Hungary,
May 20-24 2003. ACM Press.
[25] Michael Brinklov and Robin Sharp, “Incremental Trust
in Grid Computing”, Seventh IEEE International Symposium
on Cluster Computing and the Grid (CCGrid’07), March 2007
[26] Runfang Zhou and Kai Hwang, “Trust Overlay Networks
for Global Reputation Aggregation in P2P Grid Computing”,
IEEE International Parallel and Distributed Processing
Symposium (IPDPS-2006), Rhodes Island, Grace, April,
2006.
[27] Muhammad Hanif Durad, Yuanda Cao, “A Vision for
the Trust Managed Grid”, Proceedings of the Sixth IEEE
International Symposium on Cluster Computing and the Grid
Workshops (CCGRIDW'06)
[28] Tyrone Grandison, Morris Sloman , "Specifying and
Analysing Trust for Internet Applications", 2nd IFIP
conference on e-commerce, e-Business, e-Government,
I3e2002, Lisbon oct.2002.
[29] Zhengqiang Liang and Weisong Shi, "PET: A
PErsonalized Trust model with Reputation and Risk
Evaluation for P2P Resource Sharing", Proceedings of the
38th Hawaii International Conference on System Sciences
(2005).
[30] Gabriel Queiroz Lana and Carlos Becker Westphall ,
”User Maturity Based Trust Management for Grid
Computing”, Seventh International Conference on
Networking, 2008.
[31] Mahantesh Hosamani, Harish Narayanappa and Hridesh
Rajan “Monitoring the Monitor: An Approach towards
Trustworthiness in Service Oriented Architecture” , TR #07-
07 Initial Submission: , 2007.
[32] P.Varalakshmi, S. Thamarai Selvi and M.Pradeep, “A
multi-broker trust management framework for resource
selection in grid”, IAMCOM, 2007.
152 Int'l Conf. Grid Computing and Applications | GCA'08 |
Research on Security Resource Management Architec-ture for Grid Computing System
Tu Guoqing1
1Computer School, Wuhan University, Wuhan, Hubei, China
Abstract- In grid computing environment, large heteroge-neous resources are shared with geographically distributed virtual organization memberships, each having their own resource management policies and different access and cost models. There have been many projects that have designed and implemented the resource management systems with a variety of architectures and services. Grid applications have increasingly multifunctional and security requirements. However, current techniques mostly protect only the re-source provider from attacks by the user, while leaving the user comparatively dependent on the well behavior of the resource provider. In this paper, we analyze security pro-blems existing in Grid ComputingSystem and describes the security mechanism in Grid Com-puting System, and propose a domain-based trustworthy resource management architecture for grid computing sys-tem.
Keywords: grid computing, resource management
1 IntroductionGrid applications are distinguished from traditional
client-server applications by their simultaneous use of large numbers of resources, dynamic resource requirements, use of resources from multiple administrative domains, complex communication structures, and stringent performance requi-rements, among others[1]. Many of these applications rely on the ability for message processing intermediaries to forward messages, and Controlling access to applications through robust security protocols and security policy is paramount to controlling access to VO resources and assets. Thus, authen-tication mechanisms are required so that the identity of indi-viduals and services can be established, and service provi-ders must implement authorization mechanisms to enforce policy over how each service can be used. The security chal-lenges faced in a Grid environment can be grouped into threecategories: integration with existing systems and technolo-gies, interoperability with different “hosting environments”,and trust relationships among interacting hosting environ-ments.
Security of Grid Computing System should solve the following problems: user masquerade, server masquerade, data wiretapping and sophisticating, remote attack, resource abusing, malicious program, and system integrity. Grid Computing System is a complicated, dynamic and wide-area system, adding restricted authorization on user cannot be solved by the current technologies. So developing new secu-rity architecture is necessary.
Now, some most famous security models are put into application, such as GT2 Grid Security Model and GT3 Security Model for OGSA[2]. Based on analyzing deeply and comparing with many kinds of security model for re-source management in grid computing system, as an effective trustworthy security model in grid computing system, the domain- based security model for Resource Management Architecture is presented in this paper.
This paper is organized as follows: In section 2 back-ground and related works are reviewed. Section 3 describes the architecture of the domain-based model and the advanced reservation algorithm. The conclusion is in Section 4.
2 Related workThe security in Grid architecture is of major concern as
the sharing the Grid environments. It is also more than sha-ring data or basic computing resources in large organiza-tions. Primarily, Grid environments aim at direct access to computers, software, data, and other resources, as is required by a range of collaborative problem-solving and resource-brokering strategies. While crossing the physical and organi-zation boundaries, Grid environment demands solutions to support security policies and management of credentials. Support for remote access to computing and data resources is to be provided. Further, Grid technology includes wide per-mutations of mobile devices, gateways, proxies, load balan-cers, globally distributed data centers, demilitarized zones etc.
2.1 Grid Security ChallengesThe security challenges in Grid environment can be
grouped into three main categories, Integration, Interoperabi-lity, and Trust Relationship[3].
Integration is unreasonable to expect that a single secu-rity technology can be defined to address all Grid security challenges and to be adoptable in every hosting environment. Legacy infrastructure cannot be changed rapidly, and hence the security architecture in Grid environment should inte-grate with existing security infrastructure and models. For example, each domain in a Grid environment is likely to have one or more registries in which user accounts are main-tained; such registries are unlikely to be shared with other organizations or domains. Similarly, authentication mecha-nisms deployed in an existing environment that is reputed secure and reliable will continue to be used. Each domain typically has its own authorization infrastructure that is de-ployed, managed and supported. It will not typically be ac-ceptable to replace any of these technologies in favor of a single model or mechanism.
Int'l Conf. Grid Computing and Applications | GCA'08 | 153
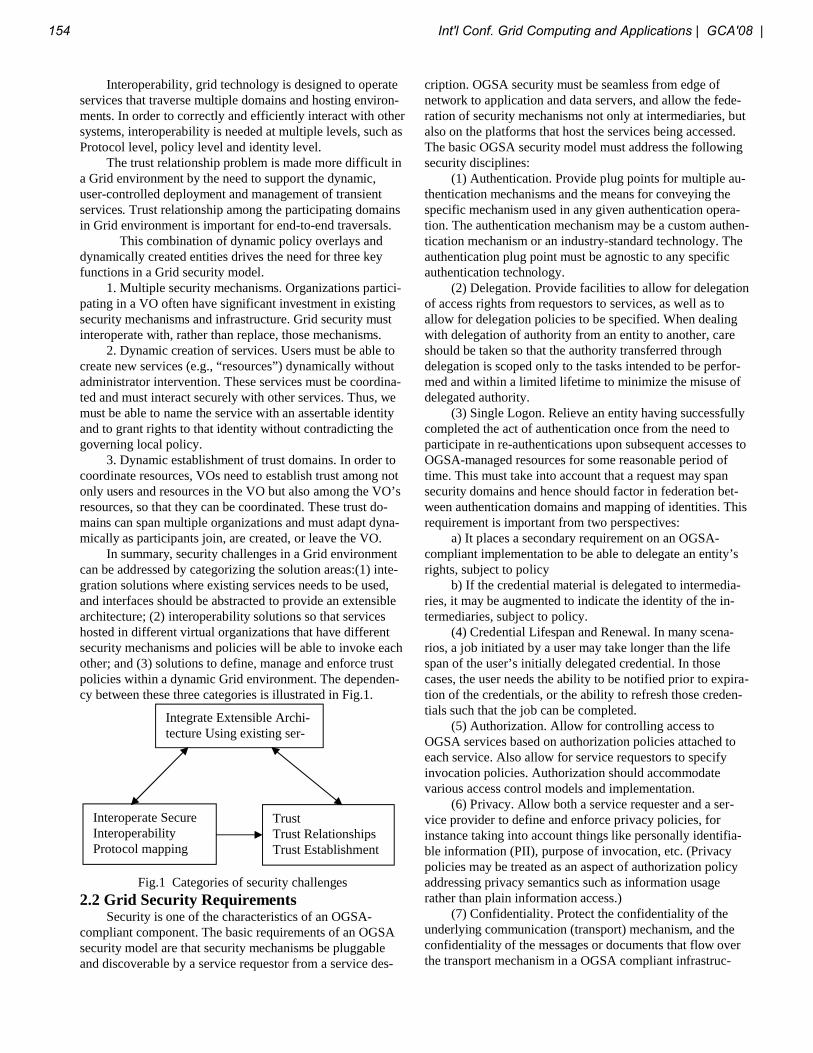
Interoperability, grid technology is designed to operate services that traverse multiple domains and hosting environ-ments. In order to correctly and efficiently interact with other systems, interoperability is needed at multiple levels, such as Protocol level, policy level and identity level.
The trust relationship problem is made more difficult in a Grid environment by the need to support the dynamic, user-controlled deployment and management of transient services. Trust relationship among the participating domains in Grid environment is important for end-to-end traversals.
This combination of dynamic policy overlays and dynamically created entities drives the need for three key functions in a Grid security model.
1. Multiple security mechanisms. Organizations partici-pating in a VO often have significant investment in existing security mechanisms and infrastructure. Grid security must interoperate with, rather than replace, those mechanisms.
2. Dynamic creation of services. Users must be able to create new services (e.g., “resources”) dynamically without administrator intervention. These services must be coordina-ted and must interact securely with other services. Thus, we must be able to name the service with an assertable identity and to grant rights to that identity without contradicting the governing local policy.
3. Dynamic establishment of trust domains. In order to coordinate resources, VOs need to establish trust among not only users and resources in the VO but also among the VO’s resources, so that they can be coordinated. These trust do-mains can span multiple organizations and must adapt dyna-mically as participants join, are created, or leave the VO.
In summary, security challenges in a Grid environment can be addressed by categorizing the solution areas:(1) inte-gration solutions where existing services needs to be used, and interfaces should be abstracted to provide an extensible architecture; (2) interoperability solutions so that services hosted in different virtual organizations that have different security mechanisms and policies will be able to invoke each other; and (3) solutions to define, manage and enforce trust policies within a dynamic Grid environment. The dependen-cy between these three categories is illustrated in Fig.1.
Fig.1 Categories of security challenges
2.2 Grid Security RequirementsSecurity is one of the characteristics of an OGSA-
compliant component. The basic requirements of an OGSA security model are that security mechanisms be pluggableand discoverable by a service requestor from a service des-
cription. OGSA security must be seamless from edge of network to application and data servers, and allow the fede-ration of security mechanisms not only at intermediaries, but also on the platforms that host the services being accessed. The basic OGSA security model must address the following security disciplines:
(1) Authentication. Provide plug points for multiple au-thentication mechanisms and the means for conveying the specific mechanism used in any given authentication opera-tion. The authentication mechanism may be a custom authen-tication mechanism or an industry-standard technology. The authentication plug point must be agnostic to any specific authentication technology.
(2) Delegation. Provide facilities to allow for delegation of access rights from requestors to services, as well as to allow for delegation policies to be specified. When dealing with delegation of authority from an entity to another, care should be taken so that the authority transferred through delegation is scoped only to the tasks intended to be perfor-med and within a limited lifetime to minimize the misuse of delegated authority.
(3) Single Logon. Relieve an entity having successfully completed the act of authentication once from the need to participate in re-authentications upon subsequent accesses to OGSA-managed resources for some reasonable period of time. This must take into account that a request may span security domains and hence should factor in federation bet-ween authentication domains and mapping of identities. This requirement is important from two perspectives:
a) It places a secondary requirement on an OGSA-compliant implementation to be able to delegate an entity’s rights, subject to policy
b) If the credential material is delegated to intermedia-ries, it may be augmented to indicate the identity of the in-termediaries, subject to policy.
(4) Credential Lifespan and Renewal. In many scena-rios, a job initiated by a user may take longer than the life span of the user’s initially delegated credential. In those cases, the user needs the ability to be notified prior to expira-tion of the credentials, or the ability to refresh those creden-tials such that the job can be completed.
(5) Authorization. Allow for controlling access to OGSA services based on authorization policies attached to each service. Also allow for service requestors to specify invocation policies. Authorization should accommodate various access control models and implementation.
(6) Privacy. Allow both a service requester and a ser-vice provider to define and enforce privacy policies, for instance taking into account things like personally identifia-ble information (PII), purpose of invocation, etc. (Privacy policies may be treated as an aspect of authorization policy addressing privacy semantics such as information usage rather than plain information access.)
(7) Confidentiality. Protect the confidentiality of the underlying communication (transport) mechanism, and the confidentiality of the messages or documents that flow over the transport mechanism in a OGSA compliant infrastruc-
Integrate Extensible Archi-tecture Using existing ser-vices
TrustTrust RelationshipsTrust Establishment
Interoperate Secure InteroperabilityProtocol mapping
154 Int'l Conf. Grid Computing and Applications | GCA'08 |

ture. The confidentiality requirement includes point–to–point transport as well as store-and-forward mechanisms.
(8)Message integrity. Ensure that unauthorized changes made to messages or documents may be detected by the recipient. The use of message or document level integrity checking is determined by policy, which is tied to the offered quality of the service (QoS).
(9) Policy exchange. Allow service requestors and pro-viders to exchange dynamically security (among other) poli-cy information to establish a negotiated security context between them. Such policy information can contain authenti-cation requirements, supported functionality, constraints, privacy rules etc.
(10) Secure logging. Provide all services, including se-curity services themselves, with facilities for time-stamping and securely logging any kind of operational information or event in the course of time - securely meaning here reliably and accurately, i.e. so that such collection is neither interrup-tible nor alterable by adverse agents. Secure logging is the foundation for addressing requirements for notarization, non-repudiation, and auditing.
(11) Assurance. Provide means to qualify the security assurance level that can be expected of a hosting environ-ment. This can be used to express the protection characteris-tics of the environment such as virus protection, firewall usage for Internet access, internal VPN usage, etc. Such information can be taken into account when making a deci-sion about which environment to deploy a service in.
(12) Manageability. Explicitly recognize the need for manageability of security functionality within the OGSA security model. For example, identity management, policy management, key management, and so forth. The need for security management also includes higher-level requirements such as anti-virus protection, intrusion detection and protec-tion, which are requirements in their own rights but are typi-cally provided as part of security management.
(13) Firewall traversal. A major barrier to dynamic, cross-domain Grid computing today is the existence of fire-walls. As noted above, firewalls provide limited value within a dynamic Grid environment. However, it is also the case that firewalls are unlikely to disappear anytime soon. Thus, the OGSA security model must take them into account and provide mechanisms for cleanly traversing them—without compromising local control of firewall policy.
(14) Securing the OGSA infrastructure. The core Grid service specification (OGSI) presumes a set of basic infras-tructure services, such as handleMap, registry, and factory services. The OGSA security model must address the securi-ty of these components. In addition, securing lower level components that OGSI relies on would enhance the security of the OGSI environment.2.3 GT2 Grid Security ModelThe Globus Toolkit version 2 (GT2) includes services for Grid Resource Allocation and Management (GRAM), Moni-toring and Discovery (MDS), and data movement (GridF-TP). These services use a common Grid Security Infrastruc-ture (GSI) to provide security functionality[2]. GSI defines a
common credential format based on X.509 identity certifica-tes and a common protocol based on transport layer security. Each GSI certificate is issued by a trusted party known as a certificate authority (CA), usually run by a large organization or commercial company. In order to trust the X.509 certifi-cate presented by an entity, one must trust the CA that issued the certificate. A single entity in an organization can decide to trust any CA, without necessarily involving the organiza-tion as a whole. This feature is key to the establishment of VOs that involve only some portion of an organization, where the organization as a whole may provide little or no support for the VO. CAS allows VOs to express policy, and it allows resources to apply policy that is a subset of VO and local policy.This process comprises three steps: (1) The user authenticates to CAS and receives assertions from CAS expressing the VO’s policy in terms of how that user may use VO resources. (2) The user then presents the assertion to a VO resource along with the usage request. (3) In evaluating whether to allow the request, the resource checks both local policy and the VO policy expressed in the CAS assertion.
2.4 GT3 Grid Security ModelVersion 3 of the Globus Toolkit (GT3) and its accom-
panying Grid Security Infrastructure (GSI3) provide the first implementation of OGSA mechanisms. GT3’s security mo-del seeks to allow applications and users to operate on the Grid in as seamless and automated a manner as possible. Security mechanisms should not have to be instantiated in an application but instead should be supplied by the surroun-ding Grid infrastructure, allowing the infrastructure to adapt on behalf of the application to meet the application's requi-rements. The application should need to deal with only ap-plication-specific policy. GT3 uses the following powerful features of OGSA and Web services security to work toward this goal:
(1)Casts security functionality as OGSA services to al-low them to be located and used as needed by applications.
(2) Uses sophisticated hosting environments to handle security for applications and allow security to adapt without having to change the application.
(3) Publishes service security policy so that clients can discover dynamically what credentials and mechanisms are needed to establish trust with the service.
(4) Specifies standards for the exchange of security to-kens to allow for interoperability.
In order to establish trust, two entities need to be able to find a common set of security mechanisms that both unders-tand. The use of hosting environments and security services, as described previously, enables OGSA applications and services to adapt dynamically and use different security me-chanisms. The published policy in OGSA can express requi-rements for mechanisms, acceptable trust roots, token for-mats, and other security parameters. An application wishing to interact with the service can examine this published policy and gather the needed credentials and functionality by contacting appropriate OGSA security services.
The security of request can be described following steps. Firstly, the client’s hosting environment retrieves and
Int'l Conf. Grid Computing and Applications | GCA'08 | 155
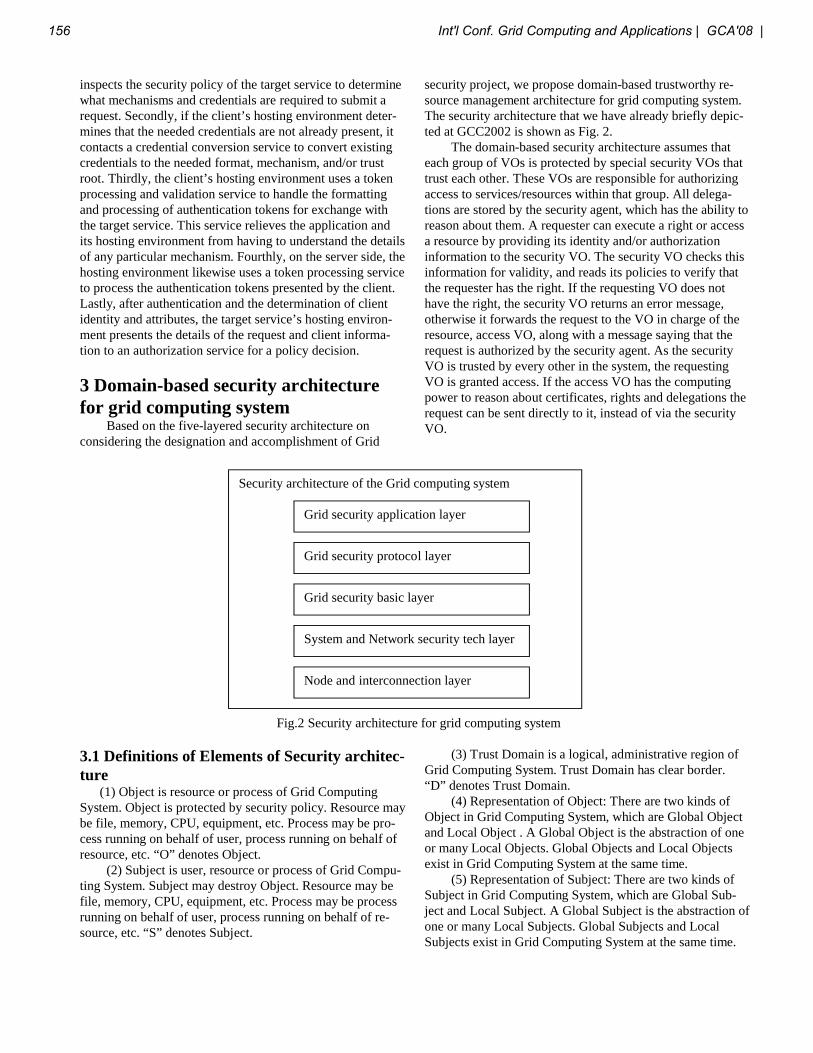
inspects the security policy of the target service to determine what mechanisms and credentials are required to submit a request. Secondly, if the client’s hosting environment deter-mines that the needed credentials are not already present, it contacts a credential conversion service to convert existing credentials to the needed format, mechanism, and/or trust root. Thirdly, the client’s hosting environment uses a token processing and validation service to handle the formatting and processing of authentication tokens for exchange with the target service. This service relieves the application and its hosting environment from having to understand the details of any particular mechanism. Fourthly, on the server side, the hosting environment likewise uses a token processing service to process the authentication tokens presented by the client. Lastly, after authentication and the determination of client identity and attributes, the target service’s hosting environ-ment presents the details of the request and client informa-tion to an authorization service for a policy decision.
3 Domain-based security architecture for grid computing system
Based on the five-layered security architecture on considering the designation and accomplishment of Grid
security project, we propose domain-based trustworthy re-source management architecture for grid computing system. The security architecture that we have already briefly depic-ted at GCC2002 is shown as Fig. 2.
The domain-based security architecture assumes that each group of VOs is protected by special security VOs that trust each other. These VOs are responsible for authorizing access to services/resources within that group. All delega-tions are stored by the security agent, which has the ability to reason about them. A requester can execute a right or access a resource by providing its identity and/or authorization information to the security VO. The security VO checks this information for validity, and reads its policies to verify that the requester has the right. If the requesting VO does not have the right, the security VO returns an error message, otherwise it forwards the request to the VO in charge of the resource, access VO, along with a message saying that the request is authorized by the security agent. As the security VO is trusted by every other in the system, the requestingVO is granted access. If the access VO has the computing power to reason about certificates, rights and delegations the request can be sent directly to it, instead of via the security VO.
Fig.2 Security architecture for grid computing system
3.1 Definitions of Elements of Security architec-ture (1) Object is resource or process of Grid Computing System. Object is protected by security policy. Resource may be file, memory, CPU, equipment, etc. Process may be pro-cess running on behalf of user, process running on behalf of resource, etc. “O” denotes Object.
(2) Subject is user, resource or process of Grid Compu-ting System. Subject may destroy Object. Resource may be file, memory, CPU, equipment, etc. Process may be process running on behalf of user, process running on behalf of re-source, etc. “S” denotes Subject.
(3) Trust Domain is a logical, administrative region of Grid Computing System. Trust Domain has clear border. “D” denotes Trust Domain.
(4) Representation of Object: There are two kinds of Object in Grid Computing System, which are Global Object and Local Object . A Global Object is the abstraction of one or many Local Objects. Global Objects and Local Objects exist in Grid Computing System at the same time.
(5) Representation of Subject: There are two kinds of Subject in Grid Computing System, which are Global Sub-ject and Local Subject. A Global Subject is the abstraction of one or many Local Subjects. Global Subjects and Local Subjects exist in Grid Computing System at the same time.
Security architecture of the Grid computing system
Grid security application layer
Grid security protocol layer
Grid security basic layer
System and Network security tech layer
Node and interconnection layer
156 Int'l Conf. Grid Computing and Applications | GCA'08 |

(6) Representation of Trust Domain: There are two kinds of Trust Domain in Grid Computing System, which are Global Trust Domain DG and Local Trust Damian DL. Glo-bal Trust Domain is the abstraction of all Local Trust Do-mains. Global Trust Domain and Local Trust Domain exist in Grid Computing System at the same time. Trust Domain
of Grid Computing System consists of three elements: Ob-jects existing in this Trust Domain, Subjects existing in this Trust Domain and Security Policy which protect Objects against Subjects. Trust Domain can be denoted by D=({O},{S},P), D
denotes Trust Domain, {O} denotes the set of all Objects existing in this Trust Domain, {S}denotes the set of all Sub-jects existing in this Trust Domain, and P denotes Security Policy of this Trust Domain. Global Trust Domain can be denoted by DG=({OG},{SG},PG), and Local Trust Domain can be denoted by
Di=({Oi},{Si},Pi) i=1,2,3…Let us assume that there are two domains DOM1 and
DOM2 that are collaborating on a certain project. If Bob, an administrator at DOM1, wants to access the database of the
client, DOM2, and if Bob has the permission to do so, he sends a Request for Action to his own security agent. The security agent returns an authorization certificate, which Bob uses to access the database.We also assume that Bob has the permission to access the database and that this permission can be delegated. Bob wants all users to access the database as well, and so he sends a certificate containing a delegate statement to security VO. The architecture of domain-based security for Grid Computing System is show as Fig3.
Fig.3 Architecture of domain-based security
3.2 Policy and Implementation of the domain-based security architecture
The Grid Computing System is abstracted to the ele-ments such as Objects, Subjects, Security Policies, Trust Domains, Operations, Authorization, etc. Grid Computing System is composed of four parts: Global Trust Domain, Local Trust Domain, Operations and Authorizations[5,6]. It can be denoted by
G=(DG,{ Di },{O j},{AK}) i=1,2,3… j=1,2,3… k=1,2,3…G denotes Grid Computing System, DG denotes Global Trust Domain, {Di} denotes the set of all Local Domain, {Oj} denotes the set of all Operations, {AK} denotes the set of all Authorizations. The security of Grid Computing Sys-tem can be regarded as the relationship among the basic elements. That is to say, “user access and use resources” can be abstracted as “Subject operate Object”, this can be deno-ted by S—OP—>O. Checking the relationship of Subject, Object and Security Policy, we can examine whether Subject can operate Object, and also can tell whether user can access resource.
This policy consists of authorization and delegation po-licies. Authorization policies deal with the rules for checking the validity of requests for actions. An example of a rule for authorization would be checking the identity certificate of an agent and verifying that the agent has an axiomatic right. Delegation policies describe rules for delegation of rights. A rule for delegation would be checking that an agent has the ability to delegate before allowing the delegation to be ap-proved. A policy also contains basic or axiomatic rights, and rights associated with roles. We introduce the concept of primitive or axiomatic rights, which are rights that all indivi-duals possess and that are stored in the global policy. For example, there are basic rights that are not often expressed, but used implicitly. A policy can be viewed as a set of rules for a particular domain that defines what permissions a user has and what permissions she/he can obtain.
How the Domain-based security policy actually takes place as follows.
(1) SA-DOM2 loads the domain policy for DOM2 and loads a global shared policy.
(2) SA-DOM1 loads the domain policy for DOM1 and loads a global shared policy.
Intrusion Detection
Anti-virus Management
Policy Management
User Management
Key Management Transport, protocol, message security
Policy Expression and Exchange
End-pointPolicy
MappingRules
Authorization
PolicyPrivacyPolicy
Secure Conversations Access Control Enforcement
TrustModel
Int'l Conf. Grid Computing and Applications | GCA'08 | 157

(3) SA-DOM2 sends message to SA-DOM1 saying that SA-DOM1 has the right to delegate access to db5, which is a database in DOM2, to all users:
a) tell(sa-DOM2, sa-DOM1, idelegate(StartTime, End-Time, sa-Dom2, sa-Dom1, canDo(X,accessDB(db5), user(X,DOM1)), true, true).
b) SA-DOM1 asserts the proposition: dele-gate(IssueTime, StartTime, EndTime, sa-Dom2, sa-Dom1, canDo(X,accessDB(db5),user(X,DOM1)), true, true).
c) SA-DOM1 gives all administrators the right to access db5, but not the ability to delegate: tell(sa-Dom1, sa-Dom1, idelegate(StartTime, EndTime, sa-Dom1, X, canDo(X, ac-cessDB(db5), true), role(X, administrator), false).
d) A delegate statement to be inserted into the kno-wledge base: delegate(IssueTime, StartTime, EndTime, sa-Dom1, X, canDo(Z, accessDB(db5), true), role(X, adminis-trator), false)
(4)Bob requires some information from database, db5, at DOM2. He sends a request to SA-DOM1 along with his certificate request(Bob, accessDB(db5)).
(5) SA-DOM1 knows that the request is from Bob be-cause of his certificate. It then checks the rules to see if Bob as an administrator has access to db5. As this is true, SA-DOM1 creates an authorization certificate and sends it back to Bob.
(6) Bob sends a request to SA-DOM2 with his ID certi-ficate and the authorization certificate: request(Bob, access-DB(db5)).
(7) SA-DOM2 verifies both the certificates and checks its policy. SA-DOM2 approves the access and the request is sent to the agent controlling access to the database.
(8) If Eric, a user tries to access the database, db5, his request will fail because the SA-DOM1 has only given ad-ministrators the right.
If all these steps complete successfully, the target hos-ting environment then presents the authorized request to the target service application. The application, knowing that the hosting environment has already taken care of security, can focus on application-specific request processing steps.
4 ConclusionsGrid computing presents a number of security challenges
that are met by the Globus Toolkit’s Grid Security Infras-
tructure (GSI). Version 3 of the Globus Toolkit (GT3) im-plements the emerging Open Grid Services Architecture; its GSI implementation (GSI3) takes advantage of this evolution to improve on the security model used in earlier versions of the toolkit. GSI3 remains compatible (in terms of credential formats) with those used in GT2, while eliminating privile-ged network services and making other improvements. Its development provides a basis for a variety of future work. In particular, we propose the domain-based trustworthy re-source management architecture for the grid computing sys-tem, we believe it will be very useful in the grid computing system.
5 References[1] I. Foster, C. Kesselman, G. Tsudik, S. Tuecke. A Securi-ty Architecture for Computational Grids. Proc. 5th ACM Conference on Computer and Communications Security Conference, pp. 83-92, 1998.[2] Foster, I. and Kesselman, C. Globus: A Toolkit-Based Grid Architecture. Foster, I. and Kesselman, C. eds. The Grid: Blueprint for a New Computing Infrastructure, Morgan Kaufmann, 1999, 259-278.[3] OGSA-SEC-WG Draft, “Security Architecture for Open Grid Services”, https://forge.gridforum.org, 2007.[4] M.Blaze, J.Feigenbaum, J.Lacy. ”Decentralized Trust Management”, IEEE Proceedings of the 17th Symposium on Security andPrivacy, 1996[5] Ellison, M.Carl, et al, ”SPKI Certificate Theory”, RFC 2693, Internet Society, 1999[6] W.Johnston, C.Larsen. ”A use-condition centered ap-proach to authenticated global capabilities: security archi-tectures for large-scale distributed collaboratory environ-ments” , Available at: http://www-itg.1bl.gov/Security/Arch/publications.html[7] A.Herzberg, Y.Mass, J.Michaeli, D.Naor, Y.Ravid, ”Ac-cess control meets public key infrastructure, or: assigning roles to strangers”Available at: http://www.hrl.il.ibm.com/TrustEstablishment/paper.htm[8] IBM, Microsoft, RSA Security and VeriSign. Web Servi-ces Trust Language (WS-Trust), 2002.
158 Int'l Conf. Grid Computing and Applications | GCA'08 |

SESSION
GRID UTILITIES, SYSTEMS, TOOLS, ANDARCHITECTURES
Chair(s)
TBA
Int'l Conf. Grid Computing and Applications | GCA'08 | 159

160 Int'l Conf. Grid Computing and Applications | GCA'08 |
On Architecture of the Economic-aware Data Grid
Thuy T. Nguyen1,2, Thanh D. Do1, Tung T. Doan2, Tuan D. Nguyen2, Trong Q. Duong2, Quan M. Dang3
1Deparment of Information Systems, Hanoi University of Technology, Hanoi, Vietnam 2High Performance Computing Center, Hanoi University of Technology, Hanoi, Vietnam
3School of Information Technology, International University, Germany {thuynt-fit, thanhdd-fit, tungdt-hpc}@mail.hut.edu.vn
Abstract – Data Grid has been adopted as the next-generation platform by many scientific communities to share, access, transport, process, and manage large data collections distributed worldwide. The increasing popularity of Data Grid as a solution for large dataset issues as well as large-scale processing problems promises the adoption of many organizations that have a great demand at this moment. This requires applying innovative business model to conventional Data Grid. In this paper, we propose a business model based on outsourcing approach and a framework called the Economic-aware Data Grid that takes the responsibilities of coordinating operations. The framework works in an economic-aware way to minimize the cost of the organization.
Keywords: Data Grid, economic-aware, business model, grid computing, outsourcing.
1 Introduction
Inspired by the need of sharing, accessing, transporting, processing and managing large data collections distributed worldwide between universities, laboratories as well as High Performance Computing Center (HPCC), Data Grid has appeared and evolved as the next-generation distributed storage platform by many scientific communities[1],[2] as well as industrial companies. Many enterprises show great demand to handle business operation that deals with distributed data sets, such as a large, multinational financial service group with a range of activities covering banking, brokerage, and insurance. The amount of data that has to be retained and manipulated has been growing rapidly. Those organizations have to deal with the problems of organizing massive volumes of data and running data mining applications under certain conditions such as limited budget and resources.
Among related existing technologies, scientific Data Grid seems to be the most suitable one to solve two problems above. Its model usually includes many HPCCs with enormous storage capacity and computing power. However, it has some drawbacks. First, investing a Data Grid needs a lot of money. The financial sources for building such Data Grid are from governments or scientific funding foundations.
Hence, researchers within the Data Grid can use those resources freely. Second, the resources might be used unfairly or inefficiently. Because of these major drawbacks, only a few of business applications are built around these Grid solutions.
In this paper, , we integrate the Software as a Service (SaaS)[3] business model into Data Grid to overcome disadvantages of scientific Data Grid. In particular, we propose a business model, which consists of three main participants: the resource provider, the software provider and the organization deploying the economic-enhanced Data Grid for its business operations. The Data Grid will work in an economic-aware way by complementing necessary scenarios and components.
The rest of this paper is organized as follows. In Section 2, we explain in detail our motivation for the economic-aware Data Grid. The proposed business model is demonstrated in Section 3. In Section 4, we describe the high-level system design. We cite related works in Section 5. After discussing some problems that need to be considered in our framework in Section 6, we present future works and conclude the paper.
2 Motivation
The model of scientific Data Grid does not fully meet the requirements of enterprises. Thus, an economic-enhanced Data Grid is an explicit choice over other possibilities. It is worth describing here, in more detail, why they should make this choice. An economic-aware Data Grid can save lot money in resource investment. It not only provides capability of using resources efficiently but also ensures fairness among participants.
Considering the case of an investment bank, it has many geographical distributed branches each of which has its own business. Each branch usually runs data mining applications over the set of collected financial data. With the time, this activity becomes important and need to be extended. This leads to two challenges. First, the computing tasks need more computing power and storage capacity. Second, the data source is not just from the branch but also from other branches. Because all the branches belong to the investment bank, the data can be shared among branches with a suitable
Int'l Conf. Grid Computing and Applications | GCA'08 | 161

authorization policy. Thus, the bank needs a technology to share large data sets effectively. To deal with both problems, it is necessary to have a Data Grid in the investment bank. We can see many similar scenarios in the real world.
To build such a Data Grid, one solution is applying the way of scientific Data Grid, in which each branch invests to build its own computer center. Those computer centers are then connected together to form a Data Grid. Users in each branch can use the Grid freely. However, this approach has many disadvantages. First, it costs a lot of money for hardware and software investment. They also need money to operate and maintain the operations of the computer center, such as money for electric power, human resource and so on. The initial investment and maintaining cost could take most of the budget of the branch. Second, the resource utilization is not efficient. Usually, data mining applications are executed when all the financial data are collected. This happens at the end of a month, end of a quarter or end of a year. At those periods, all computing resources are employed and the workload is always 100 %. In normal period, the workload is much lower. Thus, many computers run wastefully. Finally, there may have unfair resource usage on the Grid. Because individual departments within an investment bank are very competitive, the notion of freely sharing their resources is very difficult to accept. Some branches may contribute little resource to the Grid but use a lot.
Another approach is outsourcing. This means each branch does not invest to build a computer center itself but hire from resource providers and pay per use. In other word, the investment bank will build a Data Grid over the business Grid. This approach overcomes disadvantages discussed above. It brings about many benefits to the investment bank and its branches, as follows:
• Economy and efficiency. The users can obtain resources whenever they need them. The degree of need is expressed under user control and can be described with high precision for resource use for now and for future times of interest, like before deadlines. Thanks to pay-per-use characteristic, users are sure to get the great benefits by saving a large amount of money invested in their own computing center. Additionally, by hiring necessary resources in run-time, they could avoid the wastefulness of computing resource as regarding above.
• Fair sharing. To use resource, users have to pay by using accounting and charging service. Thus, the more branches use resources, the more they have to pay.
However, up to now, there is no business model and technical solution to realize this approach. The work in this paper is the first attempt to solve this issue. In particular, the
main contribution of the paper includes the proposal for a business model and the design of an economic-aware Data Grid framework. In next Sections, we will demonstrate our business model to explain how it meets expectations above.
3 Proposed business model
Figure 1. The business model of the system
3.1 Participants
The business model includes three main participants, as illustrated in Figure 1. They are resource provider, software provider, and the organization deploying the Data Grid.
3.1.1 Resource providers The resource provider provides server, storage, and network resources. The providers already have their own accounting, charging, and billing as well as job deployment modules. They offer storage capacity and computing power service. We assume that the price of using resource is published. To ensure the quality of service (QoS), the resource providers should have advanced resource reservation mechanisms. The users could be charged for storage capacity, the number of computing nodes, and the amount of bandwidth they use.
3.1.2 Software provider
Software providers are business entities that provide software services. In particular, they provide software and its license to ensure that, the software can work under negotiated condition. The income of the software provider is from selling software license.
3.1.3 Organization deploying the Data Grid
Organization consists of many branches distributed worldwide. Instead of building a computer center for each branch, the organization has an Information Technology (IT) central department. This department has an economic-aware Data Grid middleware responsible for coordinating internal data sharing among branches.
162 Int'l Conf. Grid Computing and Applications | GCA'08 |
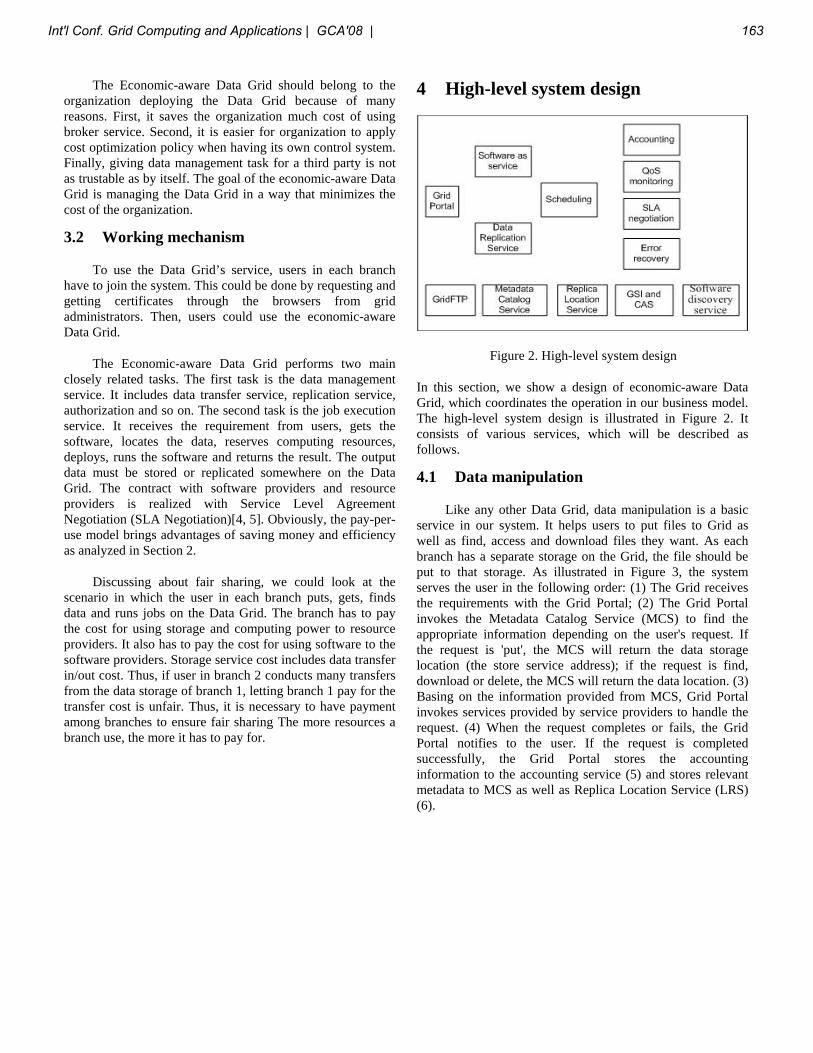
The Economic-aware Data Grid should belong to the organization deploying the Data Grid because of many reasons. First, it saves the organization much cost of using broker service. Second, it is easier for organization to apply cost optimization policy when having its own control system. Finally, giving data management task for a third party is not as trustable as by itself. The goal of the economic-aware Data Grid is managing the Data Grid in a way that minimizes the cost of the organization.
3.2 Working mechanism
To use the Data Grid’s service, users in each branch have to join the system. This could be done by requesting and getting certificates through the browsers from grid administrators. Then, users could use the economic-aware Data Grid.
The Economic-aware Data Grid performs two main closely related tasks. The first task is the data management service. It includes data transfer service, replication service, authorization and so on. The second task is the job execution service. It receives the requirement from users, gets the software, locates the data, reserves computing resources, deploys, runs the software and returns the result. The output data must be stored or replicated somewhere on the Data Grid. The contract with software providers and resource providers is realized with Service Level Agreement Negotiation (SLA Negotiation)[4, 5]. Obviously, the pay-per-use model brings advantages of saving money and efficiency as analyzed in Section 2.
Discussing about fair sharing, we could look at the scenario in which the user in each branch puts, gets, finds data and runs jobs on the Data Grid. The branch has to pay the cost for using storage and computing power to resource providers. It also has to pay the cost for using software to the software providers. Storage service cost includes data transfer in/out cost. Thus, if user in branch 2 conducts many transfers from the data storage of branch 1, letting branch 1 pay for the transfer cost is unfair. Thus, it is necessary to have payment among branches to ensure fair sharing The more resources a branch use, the more it has to pay for.
4 High-level system design
Figure 2. High-level system design
In this section, we show a design of economic-aware Data Grid, which coordinates the operation in our business model. The high-level system design is illustrated in Figure 2. It consists of various services, which will be described as follows.
4.1 Data manipulation
Like any other Data Grid, data manipulation is a basic service in our system. It helps users to put files to Grid as well as find, access and download files they want. As each branch has a separate storage on the Grid, the file should be put to that storage. As illustrated in Figure 3, the system serves the user in the following order: (1) The Grid receives the requirements with the Grid Portal; (2) The Grid Portal invokes the Metadata Catalog Service (MCS) to find the appropriate information depending on the user's request. If the request is 'put', the MCS will return the data storage location (the store service address); if the request is find, download or delete, the MCS will return the data location. (3) Basing on the information provided from MCS, Grid Portal invokes services provided by service providers to handle the request. (4) When the request completes or fails, the Grid Portal notifies to the user. If the request is completed successfully, the Grid Portal stores the accounting information to the accounting service (5) and stores relevant metadata to MCS as well as Replica Location Service (LRS) (6).
Int'l Conf. Grid Computing and Applications | GCA'08 | 163

Figure 3. Scenario of putting a file on Grid
4.2 Replication
The replication service is used to reduce access latency, improve data locality, and increase robustness, scalability and performance of distributed applications. The system should analyze the pattern of previous file requests, and replicate files toward sites that show a corresponding increased frequency of file access request [6]. The Replication function is performed by Data Replication Service module.
Figure 4. Scenario of replication on Grid
The operation of the Data Replication Service is showed in Figure 4 and could be described as follows: (1) The Data Replication service receives request, reads and interprets it. (2) The Data replication service invokes scheduling service to find out a suitable replication location. The scheduling service discovers candidate resources, matches the user's requirements and the candidate resources in an optimal way and then returns selected resources to the Data Replication Service. (3) The Data Replication service reserves bandwidth with resource providers by an SLA. (4) The Data Replication service invokes the file transfer service of the determined resource provider for transferring data. (5) The Data Replication service invokes monitoring module to monitor
the QoS. (6-7) If the operation is completed successfully, the Data Replication service stores data information to MCS and RLS. (8) It also stores the accounting information to the accounting service.
4.3 Job Execution
When a user wants to run a job, he provides the software’s name, name of the input/output data, resource requirements and a deadline to complete the job. The scenario of Job Execution is illustrated in Figure 5. It could be described as follows: (1) The Grid Portal receives the user's request. (2) The Grid Portal invokes the SaaS service. (3) The SaaS invokes the Software Discovery service to find the location of the software provider. (4) The SaaS invokes the MCS and RLS to find the location of the data file. (5) The SaaS invokes Scheduling service to find the suitable resource provider. (6) The SaaS signs SLA contract to hire software, computing resource and bandwidth with software providers as well as resource providers. (7)The SaaS transfers the software and data to the execution site and executes the job. (8) During the execution, the monitoring module is invoked to observe the QoS. (9) If error occurs, SaaS will invoke the Error Recovery module. (10) When the execution finishes, the SaaS moves the output data to the defined places and updates MCS and RLS. (11) The SaaS also stores accounting information to accounting service.
Figure 5. Scenario of job execution on Grid
We emphasize that in our system, unlike the general SaaS, the number of software here is not so big, thus the Software Discovery module is relatively simple.
5 Related works
Most current researches in economy grid pay little effort on sharing internal and large data sets effectively. Instead, they are developing open Grid architecture that allows several providers and consumers to be interconnected and to trade services. Others are developing and deploying business models with the purpose of selling their own products and
164 Int'l Conf. Grid Computing and Applications | GCA'08 |

services such as GridASP[7], GRASP[8], GRACE[9], BIG[10] and EU-funded project GridEcon[11]. These models usually do not involve several providers. For instant, Sun Utility Grid [12] and Amazon EC2 [13] , provide on-demand computing resources while VPG [14] and WebEx [15] provide certain on-demand applications (music, video on-demand, web conferencing, etc) that do not relate to data sharing.
Current large-scale Data Grid projects such as the Biomedical Informatics Research Network (BIRN) [16], the Southern California Earthquake Center (SCEC) [17], and the Real-time Observatories, Applications, and Data management Network (ROADNet) [18] make use of the San Diego Supercomputer Center (SDSC) Storage Resource Broker as the underlying Data Grid technology. These applications require widely distributed access to data by many people in many places. The Data Grid creates virtual collaborative environments that support distributed but coordinated scientific and engineering research. The economic aspects are not considered in those projects.
In [19], a cost model for distributed and replicated data over a wide area network is presented. Cost factors for the model are the network, data server and application specific costs. Furthermore, the problem of job execution is discussed under the viewpoint of sending the job to the required data (code mobility) or sending data to a local site and executing the job locally (data mobility). However, in the model, the cost is not money but the time of job execution. With this assumption, the system is pseudo economic-aware. Moreover, the infrastructure works with the best effort mechanism. The QoS and resource reservation are not considered. Thus, it does not suit with the business environment.
Heiser et. al. [20] proposed a commodity market of storage space within the Mungi operating system. The proposed system focuses on the extra accounting system used for backing store management. All accounting of the operations on storage objects can be done asynchronously without slowing down such operations. It is based on bank accounts from which rent is collected for the storage occupied by objects. Rent automatically increases as available storage runs low, forcing users to release unneeded storage. Bank accounts use a taxation system to prevent excessive build up of funds on underutilized accounts. However, the system considers only the storage resource and the scope of the system is just inside an organization.
Buyya [21], [22] discussed the possible use of economy in a scientific Data Grid environment. Specifically, a token-exchange approach is proposed to regulate demand for data access from the servers of the Data Grid. For example, a token may correspond to 10KB of data volume. By default, a single user may only access as much data as he has tokens. This gives other users a chance to access data. However, the amount of data that they access for a given token depends on
various parameters such as demand, system load, and QoS, etc. The users can trade-off between QoS and tokens. The negotiation/redistribution of tokens after their expiration, their mapping to real money and the pricing policies of storage servers are not discussed Moreover, this work focuses on the resource provider level while we focus on the system built up over the commercial resource providers.
6 Discussion
According to a survey of EU-funded project GridEcon [11], investment banks have been using Grid computing at least 3-4 years. Currently, most of the investment banks have completed this exercise to link these heterogeneous Grids and develop limited resource sharing. The next step is to create an internal shared computing platform for Utility Computing. Further evolutions planned include: (1) Following self-service approach: users submit a job directly to the global grid without going through the IT department; (2) Applying SaaS model and open source to reduce cost, especially software-licensing costs. (3)Adding SLA monitoring, policy management, and charge-back across heterogeneous resources.
Our solution combines the last two. This brings about great advantages (Section 2), but the biggest drawbacks are the dependence of data-intensive application on the network performance as well as the limitation of user's local access to the software. In the near future, these will no longer exist due to the rapid development of high-speed internet. Our works focus on one specific part of this promising trend. We integrate SaaS model with the Data Grid instead of the general grid. Further research includes two issues: What is the scheduling mechanism for single job and workflow job? What is the hiring strategy for storage resource?
Scheduling mechanism is one of the most important problems in any distributed system. In scientific Grid, a scheduling component (such as such as Legion[23], Condor[24], AppLeS[25, 26] Netsolve[27], Punch[28]) decides which jobs are to be executed at which site based on certain cost functions. In the economic approach, the scheduling decision is flexibly conducted regarding to end users' requirements. Whereas a conventional model often deals with software and hardware costs for running applications, the business model primarily charges the end-users for services that they consume based on the value they derive from it. Pricing based on users’ demand and the supply of resources is the main drive in the competitive, economic market model..
The second issue is the hiring strategy for storage resource and software. Our system is based on business Grid and works in an Economic-aware way. Therefore, we put the benefit problems between consumers and providers. The consumers must pay for usage and the providers get money for their storage and software resource. Nevertheless, how the
Int'l Conf. Grid Computing and Applications | GCA'08 | 165

consumers could hire the storage resource and software is the problem that depends on each organization deploying this system. They could hire on demand. That means they only pay whenever they use. However, in many cases, the users also want to hire resource a long time before using that one. The providers could account for storage usage or for data transfer, or the quality of storage and QoS provided. Hiring strategy must be paid a lot of attention in any Economic-aware system.
7 Conclusion and future work
In this paper, we raised a scope of problems in which current researches have not yet solve completely. We proposed the Economic-aware Data Grid as an appropriate solution for them. Our solution based on two ideas. The first is integrating SaaS into Data Grid. The second is that the system is based on business Grid and works with Economic-aware way. We presented the high-level design and three basic operating scenarios of our system to demonstrate how the system could tackle the problems. Our proposed system has many advantages. It brings economic benefit to business organization. It also gives provider a chance to get money from their resource and software. It also reduces the complexity in resource management problems in compare with scientific Data Grid. We strongly believe that Economic-aware Data Grid in particular and Economic-aware Grid in general will play a more important role in the development of Grid computing in the near future.
We have specified all components at the class level including the working mechanism, interface with other components and input/output parameters. We have designed UML diagrams and portal interface. For next steps, we intend to build a prototype of the system using Java language. We have built a test bed including 12 computers from our HPC Center. We plan to deploy and do some experiments to verify our approach.
Acknowledgements
This research is conducted at High Performance Computing Center, Hanoi University of Technology, Hanoi, Vietnam. It is supported in part by VN-Grid, SAREC 90 RF2, and KHCB 20.10.06 projects.
References [1]. Venugopal, S., R. Buyya, and R. Kotagiri, A Taxonomy
of Data Grids for Distributed Data Sharing, Management and Processing. 2006.
[2]. Allcock, B., et al., Data management and transfer in high-performance computational grid environments, in Parallel Computing. 2002.
[3]. Konary, E.T.a.A., Software-as-a-Service Taxonomy and Research Guide. 2005.
[4]. Quan, D.M. and O. Kao, SLA negotiation protocol for Grid-based workflows. 2005.
[5]. Quan, D.M. and O. Kao, On Architecture for SLA-aware workflow in Grid environments. Journal of Interconnection Networks, World Scientific Publishing Company, 2005.
[6]. Bell, W.H., et al. Evaluation of an Economy-Based File Replication Strategy for a Data Grid. in Proceedings of the 3rd IEEE/ACMInternational Symposium on Cluster Computing and the Grid (CCGrid 2003). 2003. Tokyo,Japan: IEEECSPress.
[7]. GridASP Website. [cited; Available from: http://www.gridasp.org/wiki/.
[8]. GRASP Web site. [cited; Available from: http://eu-grasp.net/.
[9]. GRACE Website. [cited; Available from: http://www.buyya.com/ecogrid/.
[10]. T. Weishupl, F.D., E. Schikuta, H. Stockinger, and a.H. Wanek. Business In the Grid: The BIG Project. in GECON2005, the 2nd International Workshop on Grid Economics and Business Models. 2005. Seoul.
[11]. GridEcon Website. [cited; Available from: http://gridecon.eu/html/deliverables.shtml.
[12]. Sun Grid Web site. [cited; Available from: http://www.sun.com/service/sungrid/.
[13]. Amazon Web Services. [cited; Available from: http://www.amazon.com/.
[14]. Falcon, F., GRID - A Telco perspective: The BT Grid Strategy, in the 2nd International Workshop on Grid Economics and Business Models. 2005: Seoul.
[15]. WebEx Connect: First SaaS Platform to Deliver Mashup Business Applications for Knowledge Workers. 2007 [cited; Available from: http://www.webex.com/pr/pr428.html.
[16]. Biomedical Informatics Research Network. [cited; Available from: http://www.nbirn.net/.
[17]. Southern California Earthquake Center. [cited; Available from: http://www.scec.org/.
[18]. Real-time Observatories, Applications, and Data management Network. [cited; Available from: http://roadnet.ucsd.edu/.
[19]. Stockinger, H., et al. Towards a Cost Model for Distributed and Replicated Data Stores. in Proceedings of the 9th Euromicro Workshop on Parallel and Distributed Processing (PDP 2001) 2001. Italy.
[20]. G. Heiser, F.L., and S. Russell. Resource Management in the Mungi Single-Address-Space Operating System. in Proceedings of Australasian Computer Science Conference. 1998. Perth Australia.
[21]. Buyya, R., et al., Economic models for resource management and scheduling in Grid computing. 2002.
[22]. Buyya, R., D. Abramson, and S. Venugopal, The grid economy. 2005.
[23]. S.Chapin, J. Karpovich, and A. Grimshaw, The legion resource management system, in The 5th Workshop Job Scheduling Strategies for Parallel Processing. 1999: San Juan,Puerto Rico.
166 Int'l Conf. Grid Computing and Applications | GCA'08 |

[24]. M. Litzkow, M. Livny, and M. Mutka, CondorA hunter of idle workstations, in the 8th Int.Conf.Distributed Computing Systems(ICDCS1988). 1988: SanJose,CA.
[25]. Berman, F. and R. Wolski, The AppLeS project: A status report, in the 8th NEC Research Symp. 1997: Berlin, Germany.
[26]. H. Casanova, et al., The AppLeS parameter sweep template: User-level middleware for the grid, in the IEEE Supercomputing Conf.(SC2000). 2000: Dallas,TX.
[27]. Casanova, H. and J. Dongarra, NetSolve: A network server for solving computational science problems. Int.J.Super computing Applicat.High Performance Computing, 1997.
[28]. Kapadia, N. and J. Fortes, PUNCH: An architecture for web-enabled wide-area network-computing. Cluster Computing, 1999.
Int'l Conf. Grid Computing and Applications | GCA'08 | 167

Grid-enabling complex system applications with
QosCosGrid: An architectural perspective
Valentin Kravtsov1, David Carmeli
1, Werner Dubitzky
2, Krzysztof Kurowski
3;4, and Assaf Schuster
1
1Technion - Israel Institute of Technology, Technion City, Haifa, Israel
2University of Ulster, Coleraine, Northern Ireland, UK
3Poznan Supercomputing and Networking Center, Poznan, Poland
4University of Queensland, St. Lucia, Brisbane, Australia
Abstract - Grids are becoming mission-critical components
in research and industry, offering sophisticated solutions in
leveraging large-scale computing and storage resources.
Grid resources are usually shared among multiple
organizations in an opportunistic manner. However, an
opportunistic or "best effort" quality-of-service scheme may
be inadequate in situations where a large number of
resources need to be allocated and applications which rely
on static, stable execution environments. The goal of this
work is to implement what we refer to as quasi-
opportunistic supercomputing. A quasi-opportunistic
supercomputer facilitates demanding parallel computing
applications on the basis of massive, non-dedicated
resources in grid computing environments. Within the EU-
supported project QosCosGrid we are developing a quasi-
opportunistic supercomputer. In this work we present the
results obtained from studying and identifying the
requirements a grid needs to meet in order to facilitate
quasi-opportunistic supercomputing. Based on these
requirements we have designed architecture for a quasi-
opportunistic supercomputer. The paper presents and
discusses this architecture.
Keywords: Grid, Quasi-Opportunistic Supercomputing.
1 Introduction
Supercomputers are dedicated, special-purpose
multiprocessor computing systems that provide close-to-best
achievable performance for demanding parallel workloads
[12]. Supercomputers possess a set of characteristics that
enable them to process such workloads efficiently. First, all
the high-end hardware components, such as CPUs, memory,
interconnects and storage devices are characterized not only
by considerable capacity levels but also by a high degree of
reliability and performance predictability. Second,
supercomputer middleware provides a convenient
abstraction of a homogeneous computational and networking
environment, automatically allocating resources according to
the underlying networking topology [2]. Third, the resources
of a conventional supercomputer are managed exclusively
by a single centralized system. This enforces global resource
utilization policies, thus maximizing hardware utilization
while minimizing the turnaround time of individual
applications. Together, these features give supercomputers
their unprecedented performance, stability and dependability
characteristics.
The vision of grids becoming powerful virtual
supercomputers can be attained only if their performance
and reliability limitations can be overcome. Due to the
considerable differences between grids and supercomputers,
the realization of this vision poses considerable challenges.
Some of the main challenges are briefly discussed below.
The co-allocation of a large number of participating
CPUs. In conventional supercomputers, where all CPUs are
exclusively controlled by a centralized resource management
system, the simultaneous allocation (co-allocation) and
invocation (co-invocation) of processing units is handled by
suitable co-allocation and co-invocation components [10]. In
grid systems, however, inherently distributed management
coupled with the non-dedicated (opportunistic) nature of the
underlying resources makes co-allocation very hard to
accomplish. Previous research has focused on co-allocation
in grids of supercomputers and dedicated clusters [17], [15],
[3]. The co-allocation problem has received little attention in
the high-performance grid computing community. While co-
allocation issues arise in other situations (e.g., co-allocation
of processors and memory, co-allocation of CPU and
networks, setup of reservations along network paths), the
dynamic, non-dedicated nature of grids presents special
challenges [6]. The potential for failure and the
heterogeneous nature of the underlying resource pool are
examples of such special challenges.
Synchronous communications. Typically, synchronous
communications form a specific communication topology
pattern (e.g., stencil exchange in MM5 [15] [13] and local
structures in complex systems [7]). This is satisfied by
supercomputers via special-purpose, low-latency, high-
throughput hardware as well as optimized allocation by the
resource management system to ensure that the underlying
networking topology matches the application's
communication pattern [2]. In grids, however, synchronous
communication over a wide area network (WAN) is slow,
and topology-aware allocation is typically not available
despite the existing support of communication libraries [8].
168 Int'l Conf. Grid Computing and Applications | GCA'08 |

Allocation of resources does not change during runtime.
While always true in supercomputers, this requirement is
difficult to satisfy in grids, where low reliability of resources
and WANs, as well as uncoordinated management of
different parts of the grid, contribute to extreme fluctuations
in the number of available resources.
Fault tolerance. In large-scale synchronous computation,
the high sensitivity of individual processes to failures usually
leads to termination of the entire parallel run in case of such
failures. While rare in supercomputers because the high
specifications of their hardware, system and component
failures are very common in grid systems.
We define a quasi-opportunistic supercomputer as a grid
system which could address the challenges mentioned above
but still hide many of the grid-related complexities from
applications and users.
In this paper we present some of the early results coming out
of the QosCosGrid project1 which is aimed at developing a
quasi-opportunistic supercomputer. The main contributions
of this paper are that we
• Introduce and motivate the concept of a quasi-
opportunistic supercomputer.
• Summarize the main requirements of a quasi-
opportunistic supercomputer.
• Present a detailed system architecture designed for
the QosCosGrid quasi-opportunistic
supercomputer.
2 Requirements of a quasi-opportunistic
supercomputer
Many real-world systems involve large numbers of
highly interconnected heterogeneous elements. Such
structures, known as complex systems, typically exhibit non-
linear behavior and emergence [4]. The methodologies used
to understand the properties of complex systems involve
modeling, simulation and often require considerable
computational resources that only supercomputers can
deliver. However, many organizations wanting to model and
simulate complex systems lack the resources to deploy or
maintain such a computing capability. This was the
motivation that prompted the initiation of the QosCosGrid
project, whose aim it is to develop core grid technology
capable of providing quasi-opportunistic supercomputing
grid services and technology. Modeling and simulation of
complex systems provide a huge range of applications
requiring supercomputer or supercomputer-like capabilities.
The requirements derived from the analysis of nine diverse
complex systems applications are summarized below.
Co-allocation. Complex systems simulations require
simultaneous execution of code on very high numbers of
1 www.QosCosGrid.com
CPUs. In this context, co-allocation also means that
resources for a certain task are allocated in advance. Those
resources must be negotiated in advance and guaranteed to
be available when the task's time slot arrives. This implies
the need for a sophisticated distributed negotiation protocol
which is supported by advance reservation mechanisms.
Topology aware resource management. A complex
system simulation is usually composed of multiple agents
performing tasks of different complexity. The agents are
arranged in a dynamic topology with different patterns of
communication. To execute such a simulation, appropriate
computational and network resources must be allocated. To
perform this task, resource co-allocation algorithms must
consider the topological structure of resource requests and
offers and match these appropriately.
Economics-based grid. In "best-effort" grids, local cluster
administrators are likely to increase the priorities of local
users, possibly disallowing remote jobs completely and thus
disassembling the grid back into individual clusters. This is
because administrators lack suitable incentives to share the
resources. We believe that resource co-allocation must be
backed up by an economic model that motivates resource
providers to honor their guarantees to the grid user and force
the user to carefully weigh the cost of resource utilization.
This model is also intended to address the "free-rider"
problem [1].
Service-level agreements. The economic model should be
supported by formal agreements, whose fulfillment can later
be confirmed. Thus, an expressive language is required to
describe such agreements, along with monitoring,
accounting and auditing systems that can understand such a
language.
Cross-domain fault tolerant MPI and Java RMI
communication. The majority of current fault-tolerant MPI
and Java RMI implementations provide transparent fault
tolerance mechanisms for clusters. However, to provide a
reliable connection within a grid, a cross-domain, fault-
tolerant and grid-middleware-aware communication library
is needed.
Distributed checkpoints. In grids, nodes and network
failures will inevitably occur. However, to assure that an
entire application will not be aborted after a single failure,
distributed checkpoints and restart protocols must be used to
stop and migrate the whole application or part of it.
Scalability, extensibility, ease of use. In order to be widely
accepted by the complex systems community, the
QosCosGrid system must offer easy interfaces yet still allow
extensions and further development. Additionally, for real-
world grids, the system must be scalable in terms of
computing resources and supported users.
Int'l Conf. Grid Computing and Applications | GCA'08 | 169

Interoperability. The system must facilitate seamless
interoperation and sharing of computing and data resources.
Standardization. To facilitate interoperation and evolution
of the QosCosGrid system, the design and implementation
should be based on existing and emerging grid and grid-
related standards and open technology.
3 QosCosGrid System Architecture
The working hypothesis in QosCosGrid project is that a
quasi-opportunistic supercomputer (as characterized in
Section 1) can be built by means of a collaborative grid
which facilitates sophisticated resource sharing across
multiple administrative domains (ADs). Loosely based on
Krauter [16], a collaborative grid consists of several
organizations participating in a virtual organization (VO)
and sharing resources. Each organization contributes its
resources for the benefit of the entire VO, while controlling
its own administrative domain and own resource
allocation/sharing policies. The organizations agree to
connect their resource pools to a trusted "grid level"
middleware which tries to achieve optimal resource
utilization. In exchange for this agreement, partners gain
access to very large amounts of computational resources.
The QosCosGrid architecture is depicted in Figure 1. The
diagram depicts a simplified scenario involving three
administrative domains (labeled Administrative Domain 1, 2
and 3). Administrative Domain 3 consists of two resource
pools, each of which is connected to an AD-level service,
located in the center of the diagram. AD-level services of all
the administrative domains are connected to a trusted,
distributed grid-level service. The grid-level services are
designed to maximize the global welfare of the users in the
entire grid.
Figure 1: QosCosGrid system architecture.
3.1 Grid fabric
The basic physical layer consists of computing and
storage nodes connected in the form of computing cluster.
The computing cluster is managed by a local resource
management system (LRMS) – in our case a Platform Load
Sharing Facility (LSF Cluster) – but may be replaced by
other advanced job scheduling systems such as SGE or
PBSPro. The LSF cluster runs batch or interactive jobs,
selecting execution nodes based on current load conditions
and the resource requirements of the application. The
current load of CPUs, network connections, and other
monitoring statistics are collected by the cluster and
networking monitoring system, which is tightly integrated
with LRMS and external middleware monitoring services. In
order to execute cluster-to-cluster parallel applications, the
QosCosGrid system supports the advance reservation of
computing resources, in addition to basic job execution and
monitoring features. Advance reservation is critical to the
QosCosGrid system as it enables the QosCosGrid
middleware to deliver resources on-demand with
significantly improved quality of service.
3.1.1 FedStage Open DRMAA Service Provider and
advance reservation APIs
A key component of the QosCosGrid architecture is a
LRMS offering job submission, monitoring, and advance
reservation features. However, for years LRMS provided
either only proprietary script-based interfaces for application
integration or nothing at all, in which case the command-line
interface was used. Consequently, no standard mechanisms
existed for programmers to integrate both grid middleware
services and applications with local resource management
systems. Thanks to Open Grid Forum and its Distributed
Resource Management Application API (DRMAA) working
group [19], the DRMAA 1.0 specification has recently been
released. It offers a standardized API for application
integration with C, Java, and Perl bindings. Today, DRMAA
implementations that adopt the latest specification version
are available for many local resource management systems,
including SGE, Condor, PBSPro, and Platform LSF, as well
as for other systems such as GridWay or XGrid. In the
QosCosGrid we have successfully used FedStage2 DRMAA
for LSF and integrated those APIs with the Open DRMAA
Service Provider (OpenDSP). OpenDSP is an open
implementation of SOAP Web Service multi-user access and
policy-based job control using DRMAA routines
implemented by LRMS. As a lightweight and highly
efficient software component, OpenDSP allows easy and fast
remote access to computing resources. Moreover, as it is
based on standard Web Services technology, it integrates
well with higher level grid middleware services. It uses a
request-response-based communication protocol with
standard JSDL XML and SOAP schemas protected by
2 http://www.fedstage.com/wiki/
170 Int'l Conf. Grid Computing and Applications | GCA'08 |

transport level security mechanisms such as SSL/TLS or
GSI. However, neither DRMAA nor OpenDSP provide
standard advance reservation and resource synchronization
APIs required by cross-domain parallel applications.
Therefore, in the QosCosGrid project, we have extended
DRMAA and proposed standard advance reservation APIs
that are suited to the various APIs of underlying local
resource management systems.
3.1.2 QosCosGrid parallel cross-domain execution
environments
The QosCosGrid Open MPI (QCG-OMPI) is an
implementation of the message passing interface that enables
users to deploy and use transparently MPI applications in the
QosCosGrid testbed, and to take advantage of local
interconnects technology3. QCG-OMPI supports all the
standard high-speed network technologies that Open MPI
supports, including TCP/Ethernet, shared memory,
Myrinet/GM, Myrinet/MX, Infiniband/OpenIB, or
Infiniband/mVAPI. In addition, it supports inter-cluster
communications using relay techniques in a manner
transparent to users and can be integrated with the LSF
Cluster. QCG-OMPI relates to a check-pointing interface
that provides a coordinated check-pointing mechanism on
demand. To the best of our knowledge, no other MPI
solution provides a fault-tolerant mechanism on a
transparent grid deployment environment. Our intention is
that the QCG-OMPI implementation will be fully compliant
with the MPI 1.2 specification from the MPI Forum4.
QosCosGrid ProActive (QCG-ProActive) is a Java-based
grid middleware for parallel, distributed and multi-threaded
computing integrated with OpenDSP. It is based on
ProActive, which provides a comprehensive framework and
programming model to simplify the programming and
execution of parallel applications. ProActive uses by default
the RMI Java standard library as a portable communication
layer, supporting the following communication protocols:
RMI, HTTP, Jini, RMI/SSH, and Ibis [5].
3.2 Administrative domain- and grid-level
services
Grid fabric software components, in particular
OpenDSP, QCG-OMPI and QCG-ProActive, must be
deployed on physical computing resources at each
administrative domain and be integrated with the AD-level
services. AD-level services, in turn, are connected to the
Grid-level services in order to share and receive information
about the entire grid as well as for tasks that cannot be
performed within a single administrative domain. We
distinguish five main high-level types of services:
3 http://www.open-mpi.org/
4 http://www.mpi-forum.org/
3.2.1 Grid Resource Management System
The Grid Resource Management System (GRMS) is a
grid meta-scheduling framework which allows developers to
build and deploy resource management systems for large-
scale distributed computing infrastructures at both
administrative domain and grid levels. The core GRMS
broker module has been improved in QosCosGrid to provide
both dynamic resource selection and mapping, along with
advance resource reservation mechanisms. As a core service
for all resource management processes in the QosCosGrid
system, the GRMS supports load-balancing among LRMS,
workflow execution, remote job control, file staging and
advanced resource reservation. At the administrative level,
the GRMS communicates with OpenDSP services to expose
the remote access to underlying computing resources
controlled by LRMS. Administrative domain-level GRMS is
synchronized with the Grid-level GRMS during the job
submission, job scheduling and execution processes.
At the grid level, the GRMS offers much more advanced co-
allocation and topology-aware scheduling mechanisms.
From the user's perspective, all parallel applications and
their requirements (including complex resource topologies)
are formally expressed by an XML-based job specification
language called QCG Job Profile. Those job requirements,
together with resource offers, are provided to the GRMS
during scheduling and decision making processes.
3.2.2 Accounting and economic services
Accounting services support the needs of users and
organizations with regard to allocated budgets, credit
transactions, auditing, etc. These services are responsible for
(a) Monitoring: Capturing resource usage records across the
administrative domains, according to predefined metrics; (b)
Usage record storage: Aggregation and storage of the usage
records gathered by the monitoring system; (c) Billing:
Assigning a cost to operations and charging the user, taking
into account the quality of service actually received by the
user; (d) Credit transaction: The ability to transfer credits
from one administrative domain to another as means of
payment for received services and resources; (e) VO
management: Definition of user groups, authorized users,
policies and priorities; (f) Accounting: Management of user
groups' credit accounts, tracking budget, economical
obligations, etc.; (g) Budget planning: Cost estimations for
aggregation of resources according to the pricing model; and
(h) Usage analysis: Analysis of the provided quality of
service using information from usage records, and
comparison of this information to the guaranteed quality of
service.
3.2.3 Resource Topology Information Service (RTIS)
The RTIS provides information on the resource
topology and availability. Information is provided by means
Int'l Conf. Grid Computing and Applications | GCA'08 | 171

of the Resource Topology Graph (RTG) schema, instances
of which depict the properties of the resources and their
interconnections. For a simpler description process, the RTG
does not contain a "point-to-point" representation of the
desired connections but is based instead on the
communication groups concept, which is quite similar to the
MPI communicator definition. The main goals of the RTIS
are to facilitate topology-aware services to discover the grid
resources picture as well as to disclose information about
those resources, on a "need-to-know" basis.
3.2.4 Grid Authorization System
Currently, the most common solution for mutual
authentication and authorization of grid users and services is
the Grid Security Infrastructure (GSI). The GSI is a part of
the Globus Toolkit and provides fundamental security
services needed to support grids [9]. In many GSI-based grid
environments, the user's identity is mapped to a
corresponding local user identity, and further authorization
depends on the internal LRMS mechanisms. The
authorization process is relatively simple and static.
Moreover, it requires that the administrator manually modify
appropriate user mappings in the gridmap file every time a
new user appears or has to be removed. If there are many
users in many administrative domains whose access must be
controlled dynamically, the maintenance and
synchronization of various gridmap files becomes an
important administrative issue. We believe that more
advanced mechanisms for authorization control are required
to support dynamic changes in security policy definition and
enforcement over a large number of middleware services.
Therefore, in QosCosGrid we have adopted the Grid
Authorization Service (GAS), an authorization system
integrated with various grid middleware such as the Globus
Toolkit, GRMS or OpenDSP. GAS offers dynamic fine-
grained access control and enforcement for shared
computing services and resources. Taking advantage of the
strong authentication mechanisms implemented in PKI and
GSI, it provides crucial security mechanisms in the
QosCosGrid system. From the QosCosGrid architecture
perspective, the GAS can also be treated as a trusted single
logical point for defining security policies.
3.2.5 Service-Level Agreement Management System
In order to enforce the rules of the economic system,
we employ a service-level agreement (SLA) protocol [18]. A
SLA defines a dynamically established and managed
relationship between the resource providers and resource
consumers. Both parties are committed to the negotiated
terms. These commitments are backed up by organization-
wide policies, incentives, and penalties to encourage each
party to fulfill its obligations. For each scheduled task, a set
of SLAs is signed by the administrative domain of the task
owner, and by each of the provider administrative domains.
The SLA describes the service time interval, and the
provided QoS – resources, topology, communication, and
mapping of user processes to provider's resources. SLAs are
represented using the RTG model, and are stored in RTIS.
The SLA Compliance Monitor analyzes the provided quality
of service for each time slot, and calculates a weighted
compliance factor for the whole execution. The compliance
factor is used by the pricing service (which is a part of
accounting services) to calculate the costs associated with
the service if it is provided successfully, or the penalties that
arise when a guarantee is violated.
4 Related Work
One of the largest European grid projects, Enabling Grids
for E-SciencE (EGEE) [11], has developed a grid system
that facilitates the execution of scientific applications within
a production level grid environment. To the best of our
knowledge, EGEE does not support advance reservation,
checkpoint and restart protocols, and cannot guarantee the
desired level of quality of service for long executions. One
of the major drawbacks of the EGEE system stems from the
presence of large numbers of small misconfigured sites. This
results in considerable delays. To some extent, this problem
is caused by the sheer scale of the system, but also by the
lack of an appropriate incentive for the participating
administrative domain administrators.
The HPC4U [14] project is arguably closest to the
objectives of QosCosGrid. Its goal is to expand the potential
of the grid approach to complex problem solving. This is
envisaged to be done through the development of software
components for dependable and reliable grid environments,
combined with service-level agreements and commodity-
based clusters providing quality of service. The QosCosGrid
project differs from HPC4U mainly in its "grid orientation".
QosCosGrid assumes multi-domain, parallel executions (in
contrast to within-cluster parallel execution in HPC4U) and
applies different MPI and checkpoint/restart protocols that
are grid-oriented and highly scalable.
VIOLA (Vertically Integrated Optical Testbed for Large
Applications in DFN) [20] is a German national project
intended for the execution of large-scale scientific
applications. The project emphasizes the provision of high
quality of service for execution node interconnection.
VIOLA uses UNICORE grid middleware as an
implementation of an operational environment and offers a
newly developed meta-scheduler component, which supports
co-allocation on optical networks. The main goals of the
VIOLA project include testing of advanced network
equipment and architectures, development and test of
software tools for user-driven dynamical provision of
bandwidth, interworking of network equipment from
different manufacturers, and enhancement and test of new
advanced applications. The VIOLA project is mainly
targeted at supporting a new generation of networks, which
172 Int'l Conf. Grid Computing and Applications | GCA'08 |

provide many advanced features that are not present in the
majority of up-to-date clusters and of course not at the
Internet level.
5 Conclusions
The main objective of the QosCosGrid project is to
address some of the key technical challenges to enable
development and execution of large scale parallel
experiments across multiple administrative, resource and
security domains. In this paper we summarized presented the
main requirements and important software components that
make up consistent software architecture. This high-level
architecture perspective is intended to give readers the
opportunity to understand a design concept without the need
to know the many intricate technical details related in
particular to Web service, WSRF technologies, remote
protocol design, and security in distributed systems. The
QosCosGrid architecture is designed to address key quality-
of-service, negotiation, synchronization, advance reservation
and access control issues by providing well-integrated grid
fabric, administrative domain- and grid-level services. In
contrast to existing grid middleware architectures, all
QosCosGrid system APIs have been created on top of
carefully selected third-party services that needed to meet
the following requirements: open standards, open source,
high performance, and security and trust. Moreover, the
QosCosGrid pluggable architecture has been designed to
enable the easy integration of parallel development tools and
supports fault-tolerant cluster-to-cluster message passing
communicators and libraries that are well known in high-
performance computing domains, such as Open MPI,
ProActive and Java RMI. Finally, we believe that without
extra support for administrative tools, it would be difficult to
deploy, control, and maintain such a big system. Therefore,
as a proof of concept, we have developed various client
tools to help administrators connect sites from Europe,
Australia and the USA. After the initial design and
deployment stage, we have begun carrying out many
performance tests of the QosCosGrid system and cross-
domain application experiments. Collected results and
analysis will be taken into account during the next phase of
system re-design and deployment.
Acknowledgments. The work described in this paper was
supported by the EC grant QosCosGrid IST FP6 033883.
6 References
[1] N. Andrade, F. Brasileiro, W.Cirne, and M. Mowbray.
"Discouraging free riding in a peer-to-peer CPU-sharing
grid". In Proceedings of the 13th IEEE International
Symposium on High Performance Distributed Computing
(HPDC-'04), 2004.
[2] Y. Aridor, T. Domany, O. Goldshmidt, J.E. Moreira,
and E. Shmueli. "Resource allocation and utilization in the
Blue Gene/L supercomputer". IBM Journal of Research and
Development, 49(2-3):425–436, 2005.
[3] F. Azzedin, M. Maheswaran, and N. Arnason. "A
synchronous co-allocation mechanism for grid computing
systems". Cluster Computing, 7(1):39–49, 2004.
[4] Complex systems. Science, 284(5411), 1999.
[5] J. Cunha and O. Rana. "Grid computing: Software
environments and tools, chapter 9, Programming,
Composing, Deploying for the Grid". Springer Verlag, 2006.
[6] K. Czajkowski, I. Foster, and C. Kesselman. "Resource
co-allocation in computational grids". In Proceedings of the
8th IEEE International Symposium on High Performance
Distributed Computing (HPDC-'99), page 37, 1999.
[7] R. Bagrodia et al. Parsec. "A parallel simulation
environment for complex systems". Computer, 31(10):77–
85, 1998.
[8] I. Foster and N.T. Karonis. "A grid-enabled MPI:
Message passing in heterogeneous distributed computing
systems". IEEE/ACM Conference on Supercomputing,
pages 46–46, Nov. 1998.
[9] I. Foster and C. Kesselman. "The grid: Blueprint for a
new computing infrastructure", chapter 2, The Globus
Toolkit. Morgan Kaufmann, 1999.
[10] E. Frachtenberg, F. Petrini, J. Fernandez, S. Pakin, and
S. Coll. "STORM: Lightning-fast resource management". In
Proceedings of the 2002 ACM/IEEE Conference on
Supercomputing, pages 1–26, USA, 2002. IEEE Computer
Society Press.
[11] F. Gagliardiand, B. Jones, F. Grey, M-E. Bgin, and M.
Heikkurinen. "Building an infrastructure for scientific grid
computing: Status and goals of the EGEE project".
Philosophical Transactions A of the Royal Society:
Mathematical, Physical and Engineering Sciences,
363(833):1729–1742, 2005.
[12] S. L. Graham, C. A. Patterson, and M. Snir. "Getting
Up to Speed: The Future of Supercomputing". National
Academies Press, USA, 2005.
[13] G.A. Grell, J. Dudhia, and D. R. Stauffer. "A
Description of the Fifth Generation Penn State/NCAR
Mesoscale Model (MM5)". NCAR, USA, 1995.
[14] M. Hovestadt. "Operation of an SLA-aware grid
fabric". IEEE Trans. Neural Networks, 2(6):550–557, 2006.
[15] Y.S. Kee, K. Yocum, A.A. Chien, and H. Casanova.
"Improving grid resource allocation via integrated selection
Int'l Conf. Grid Computing and Applications | GCA'08 | 173

and binding". In Proceedings of the 2006 ACM/IEEE
Conference on Supercomputing (SC'06), page 99, New
York, USA, 2006, ACM.
[16] K. Krauter, R. Buyya, and M. Maheswaran. "A
taxonomy and survey of grid resource management systems
for distributed computing". Software – Practice and
Experience, 32:135–164, 2002.
[17] D. Kuo and M. Mckeown. "Advance reservation and
co-allocation protocol for grid computing". In Proceedings
of the 1st Intl. Conf. On e-Science and Grid Computing,
pages 164–171, Washington, DC, USA, 2005. IEEE
Computer Society.
[18] H. Ludwig, A. Keller, A. Dan, and R. King. "A service
level agreement language for dynamic electronic services".
WECWIS, page 25, 2002.
[19] P. Troeger, H. Rajic, A. Haas, and P. Domagalski.
"Standardization of an API for distributed resource
management systems". In Seventh IEEE International
Symposium on Cluster Computing and the Grid, pages 619–
626, 2007.
[20] VIOLA Vertically Integrated Optical Testbed for
Large Application in DFN 2005. http://www.viola
testbed.de/.
174 Int'l Conf. Grid Computing and Applications | GCA'08 |

The Scientific Byte Code Virtual MachineRasmus Andersen
University of CopenhageneScience Centre
2100 Copenhagen, DenmarkEmail: [email protected]
Brian VinterUniversity of Copenhagen
eScience Centre2100 Copenhagen, Denmark
Email: [email protected]
Abstract—Virtual machines constitute an appealing technologyfor Grid Computing and have proved a promising mechanismthat greatly simplifies and enforces the employment of gridcomputer resources.
While existing sandbox technologies to some extent providesecure execution environments for applications deployed in aheterogeneous platform as the Grid, they suffer from a num-ber of problems including performance drawbacks and specifichardware requirements.
This project introduces a virtual machine capable of execut-ing platform-independent byte codes specifically designed forscientific applications. Native libraries for the most prevalentapplications domains mitigate the performance penalty. As such,grid users can view this machine as a basic grid computingelement and thereby abstract away the diversity of the underlyingreal compute elements.
Regarding security, which is of great concern to resourceowners, important aspects include stack isolation by using aharvard memory architecture, and no support for neither I/Onor system calls to the host system.
Keywords: Grid Computing, virtual machines, scientific appli-cations.
I. I NTRODUCTION
Although virtualization was first introduced several decadesago, the concept is now more popular than ever and hasrevived in a multitude of computer system aspects that benefitfrom properties such as platform independence and increasedsecurity. One of those applications is grid Computing[5] whichseeks to combine and utilize distributed, heterogeneous re-sources as one big virtual supercomputer. Regarding utilizationof the public’s computer resources for grid computing, virtual-ization, in the sense of virtual machines, is a necessity for fullyleveraging the true potential of grid computing. Without virtualmachines, experience shows that people are, with good reason,reluctant to put their resources on a grid where they have to notonly install and manage a software code base, but also allownative execution of unknown and untrusted programs. All theseissues can be eliminated by introducing virtual machines.
As mentioned, virtualization is by no means a new concept.Many virtual machines exist and many of them have beencombined with grid computing. However, most of these weredesigned for other purposes and suffer from a few prob-lems when it comes to running high performance scientificapplications on a heterogeneous computing platform. Gridcomputing is tightly bonded to eScience, and while standardjobs may run perfectly and satisfactory in existing virtual
e−Science
Virtual MachinesGrid
Fig. 1. Relatationship between VMs, the Grid, and eScience
machines, ’gridified’ eScience jobs are better suited for adedicated virtual machine in terms of performance.
Hence, our approach addresses these problems by develop-ing a portable virtual machine specifically designed for scien-tific applications: The Scientific Byte Code Virtual Machine(SciBy VM).
The machine implements a virtual CPU capable of executingplatform independent byte codes corresponding to a very largeinstruction set. An important feature to achieve performanceis the use of optimized native libraries for the most prevalentalgorithms in scientific applications. Security is obviously veryimportant for resource owners. To this end, virtualization pro-vides the necessary isolation from the host system, and severalaspects that have made other virtual machines vulnerable havebeen left out. For instance, the SciBy VM supports neithersystem calls nor I/O.
The following section (II) motivates the usage of virtualmachines in a grid computing context and why they arebeneficial for scientific applications. Next, we describe thearchitecture of the SciBy VM in Section III, the compiler inSection IV, related work in Section VI and conclusions inSection VII.
II. M OTIVATION
The main building blocks in this project arise from proper-ties from virtual machines, eScience, and a grid environmentin a combined effort, as shown in figure 1.
The individual interactions impose several effects from theviewpoint of each end, described next.
A. eScience in a Grid Computing Context
eScience, modelling computationally intensive scientificproblems using distributed computer networks, has driven thedevelopment of grid technology and as the simulations get
Int'l Conf. Grid Computing and Applications | GCA'08 | 175

more and more accurate, the amount of data and neededcompute power increase equivalently. Many research projectshave already made the transition to grid platforms to accom-modate the immense requirements for data and computationalprocessing. Using this technology, researchers gain access tomany networked computers at the cost of a highly heteroge-neous computing platform. Obviously, maintaining applicationversions for each resource type is tedious and troublesome,and results in a deploy-port-redeploy cycle. Further, differenthardware and software setups on computational resourcescomplicate the application development drastically. One neverknows to which resource a job is submitted in a grid, andwhile it is possible to assist each job with a detailed list ofhardware and software requirements, researchers are better leftoff with a virtual workspace environment that abstracts a realexecution environment.
Hence, a virtual execution environment spanning the hetero-geneous resource platform is essential in order to fully leveragethe grid potential. From the view of applications, this wouldrender a resource access uniform and thus the much easier”compile once run anywhere” strategy; researchers can writetheir applications, compile them for the virtual machine andhave them executed anywhere in the Grid.
B. Virtual Machines in a Grid Computing Context
Due to the renewed popularity of virtualization over the lastfew years, virtual machines are being developed for numerouspurposes and therefore exist in many designs, each of themin many variants with individual characteristics. Despite thevariety of designs, the underlying technology encompasses anumber of properties beneficial for Grid Computing [4]:
1) Platform Independence:In a grid context, where it isinherently intrinsic to move around application code as freelyas application data, it is highly profitable to enable applicationsto be executed anywhere in the grid. Virtual machines bridgethe architectural boundaries of computational elements in agrid by raising the level of abstraction of a computer system,thus providing a uniform way for applications to interact withthe system. Given a common virtual workspace environment,grid users are provided with a compile-once-run-anywheresolution.
Furthermore, a running virtual machine is not tied to aspecific physical resource; it can be suspended, migrated toanother resource and resumed from where it was suspended.
2) Host Security: To fully leverage the computationalpower of a grid platform, security is just as important asapplication portability. Today, most grid systems enforce se-curity by means of user and resource authentication, a securecommunication channel between them, and authorization invarious forms. However, once access and authorization isgranted, securing the host system from the application is leftto the operating system.
Ideally, rather than handling the problems after systemdamage has occurred, harmful - intentional or not - gridapplications should not be able to compromise a grid resourcein the first place.
Virtual machines provide stronger security mechanisms thanconventional operating systems, in that a malicious processrunning in an instance of a virtual machine is only capableof destroying the environment in which it runs, i.e. the virtualmachine.
3) Application Security: Conversely to disallowing hostsystem damage, other processes, local or running in othervirtualized environments, should not be able to compromisethe integrity of the processes in the virtual machine.
System resources, for instance the CPU and memory, ofa virtual machine are always mapped to underlying physicalresources by the virtualization software. The real resources arethen multiplexed between any number of virtualized systems,giving the impression to each of the systems that they haveexclusive access to a dedicated physical resource. Thus, gridjobs running in a virtual machine are isolated from other gridjobs running simultaneously in other virtual machines on thesame host as well as possible local users of the resources.
4) Resource Management and Control:Virtual machinesenable increased flexibility for resource management andcontrol in terms of resource usage and site administration. Firstof all, the middleware code necessary for interacting with theGrid can be incorporated in the virtual machine, thus relievingthe resource owner from installing and managing the gridsoftware. Secondly, usage of physical resources like memory,disk, and CPU usage of a process is easily controlled with avirtual machine.
5) Performance:As a virtual machine architecture inter-poses a software layer between the traditional hardware andsoftware layers, in which a possibly different instruction set isimplemented and translated to the underlying native instructionset, performance is typically lost during the translation phase.Despite of recent advances in new virtualization and trans-lation techniques, and the introduction of hardware-assistedcapabilities, virtual machines usually introduce performanceoverhead and the goal remains achieving near-native perfor-mance only. The impact depends on system characteristics andthe applications intended to run in the machine.
To summarize, virtual machines are an appealing technologyfor Grid Computing because they solve the conflict betweenthe grid users at the one end of the system and resourceproviders at the other end. Grid users want exclusive accessto as many resources as possible, as much control as possible,secure execution of their applications, and they want to usecertain software and hardware setups.
At the other end, introducing virtual machines on resourcesenables resource owners to service several users at once,to isolate each application execution from other users ofthe system and from the host system itself, to provide auniform execution environment, and managed code is easilyincorporated in the virtual machine.
C. A Scientific Virtual Machine for Grid Computing
Virtualization can occur at many levels of a computersystem and take numerous forms. Generally, as shown inFigure 2, virtual machines are divided in two main categories:
176 Int'l Conf. Grid Computing and Applications | GCA'08 |

System virtual machines and process virtual machines, eachbranched in finer division based on whether the host and guestinstruction sets are the same or different. Virtual machines withthe same instruction set as the hardware they virtualize do existin multiple grid projects as mentioned in Section VI. However,since full cross-platform portability is of major importance, weonly consideremulatingvirtual machines, i.e. machines thatexecute another instruction set than the one executed by theunderlying hardware.
Virtual Machines
Process VMs System VMs
Different ISADifferent ISA Same ISASame ISA
Fig. 2. Virtual machine taxonomy. Similar to Figure 13 in [9]
System virtual machines allow a host hardware platformto support multiple complete guest operating systems, allcontrolled by a virtual machine monitor and thus acting as alayer between the hardware and the operating systems. Processvirtual machines operate at a higher level in that they virtualizea given platform for user applications. A detailed descriptionof virtual machines can be found in [9].
The overall problem with system virtual machines thatemulate the hardware for an entire system, including appli-cations as well as an operating system, is the performanceloss incurred by converting all guest system operations toequivalent host system operations, and the implementationcomplexity in developing a machine for every platform type,each capable of emulating an entire hardware environment foressentially all types of software.
Since the application domain in focus is scientific appli-cations only, there is really no need for full-featured operatingsystems. As shown in Figure 3, process level virtual machinesare simpler because they only execute individual processes,each interfaced to the hardware resources through a virtualinstruction set and an Application Binary Interface.
Applications
Operating System
Applications
ISA
Virtual MachineABI
ABIISA
Virtual Machine
Operating System
Fig. 3. System VMs (left) and Process VMs (right)
Using the process level virtual machine approach, the virtualmachine is designed in accordance with a software devel-opment framework. Developing a virtual machine for whichthere is no corresponding underlying real machine may soundcounterintuitive, but this approach has proved successful inseveral cases, best demonstrated by the power and usefulnessof the Java Virtual Machine. Tailored to the Java programminglanguage, it has provided a platform independent computingenvironment for many application domains, yet there is no
commonly used real Java machine1.Similar to Java, applications for the SciBy VM are compiled
into a platform independent byte code which can be executedon any device equipped with the virtual machine. However,applications are not tied to a specific programming language.As noted earlier, researchers should not be forced to rewritetheir applications in order to use the virtual machine. Hence,we produce a compiler based on a standard ansi C compiler.
D. Enabling Limitations
While the outlined work at hand may seem comprehensive,especially the implementation burden with virtual machines fordifferent architectures, there are a some important limitationsthat greatly simplify the project. Firstly, the implementationburden is lessened drastically by only giving support forrunning a single sequential application. Giving support forentire operating systems is much more complex in that itmust support multiple users in a multi-process environment,and hardware resources such as networking, I/O, the graphicsprocessor, and ’multimedia’ components of currently usedstandard CPUs are also typically virtualized.
Secondly, a virtual machine allows fine-grained controlover the actions taken by the code running in the machine.As mentioned in Section VI, many projects use sandboxmechanisms in which they by various means check all systeminstructions. The much simpler approach taken in this projectis to simply disallow system calls. The rationale for thisdecision is that:
• scientific applications perform basic calculations only• using a remote file access library, only files from the grid
can be accessed• all other kinds of I/O are not necessary for scientific
applications and thus prohibited• indispensable systems calls must be routed to the grid
III. A RCHITECTURAL OVERVIEW
The SciBy Virtual Machine is an abstract machine executingplatform independent byte codes on a virtual CPU, either bytranslation to native machine code or by interpretation. How-ever, in many aspects it is designed similarly to conventionalarchitectures; it includes an Application Binary Interface,an Instruction Set Architecture, and is able to manipulatememory components. The only thing missing in defining thearchitecture is the hardware. As the VM is supposed to berun on a variety of grid resources, it must be designed tobe as portable as possible, thereby supporting many differentphysical hardware architectures.
Based on the previous sections, the SciBy VM is designedto have 3 fundamental properties:
• Security• Portability• Performance
That said, all architectural decisions presented in the follow-ing sections rely solely on providing portability. Security is
1The Java VM has been implemented in hardware in the Sun PicoJava chips
Int'l Conf. Grid Computing and Applications | GCA'08 | 177
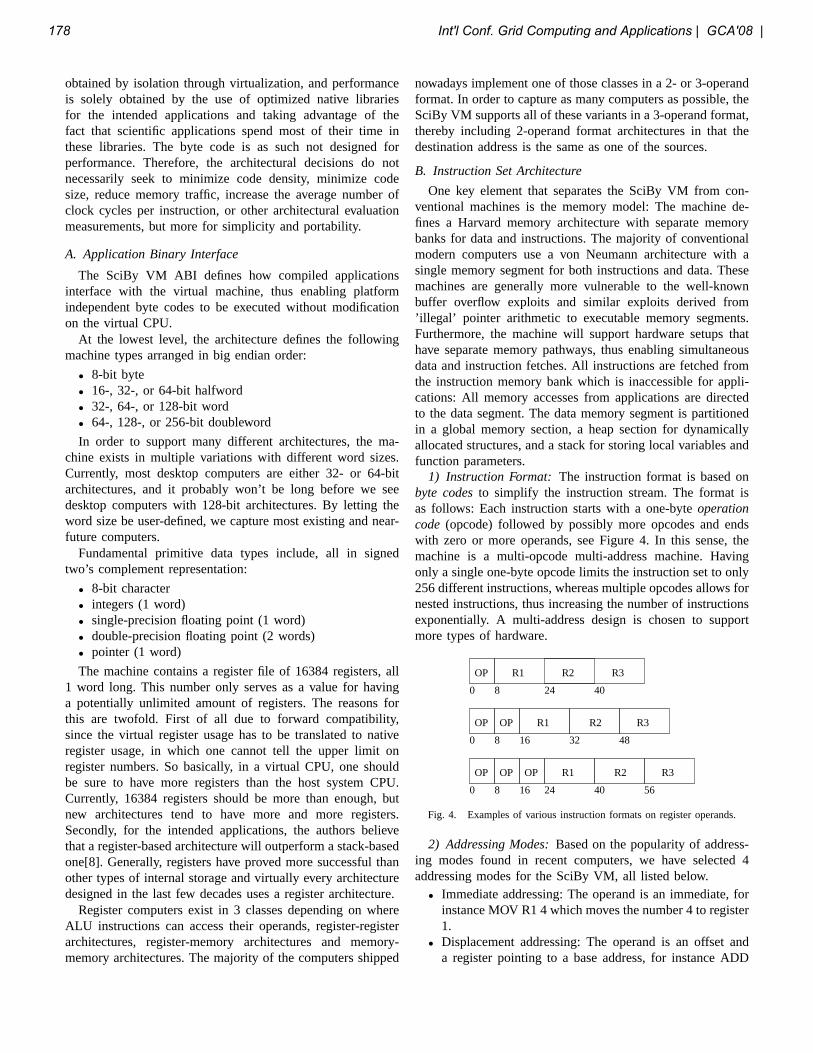
obtained by isolation through virtualization, and performanceis solely obtained by the use of optimized native librariesfor the intended applications and taking advantage of thefact that scientific applications spend most of their time inthese libraries. The byte code is as such not designed forperformance. Therefore, the architectural decisions do notnecessarily seek to minimize code density, minimize codesize, reduce memory traffic, increase the average number ofclock cycles per instruction, or other architectural evaluationmeasurements, but more for simplicity and portability.
A. Application Binary Interface
The SciBy VM ABI defines how compiled applicationsinterface with the virtual machine, thus enabling platformindependent byte codes to be executed without modificationon the virtual CPU.
At the lowest level, the architecture defines the followingmachine types arranged in big endian order:
• 8-bit byte• 16-, 32-, or 64-bit halfword• 32-, 64-, or 128-bit word• 64-, 128-, or 256-bit doubleword
In order to support many different architectures, the ma-chine exists in multiple variations with different word sizes.Currently, most desktop computers are either 32- or 64-bitarchitectures, and it probably won’t be long before we seedesktop computers with 128-bit architectures. By letting theword size be user-defined, we capture most existing and near-future computers.
Fundamental primitive data types include, all in signedtwo’s complement representation:
• 8-bit character• integers (1 word)• single-precision floating point (1 word)• double-precision floating point (2 words)• pointer (1 word)
The machine contains a register file of 16384 registers, all1 word long. This number only serves as a value for havinga potentially unlimited amount of registers. The reasons forthis are twofold. First of all due to forward compatibility,since the virtual register usage has to be translated to nativeregister usage, in which one cannot tell the upper limit onregister numbers. So basically, in a virtual CPU, one shouldbe sure to have more registers than the host system CPU.Currently, 16384 registers should be more than enough, butnew architectures tend to have more and more registers.Secondly, for the intended applications, the authors believethat a register-based architecture will outperform a stack-basedone[8]. Generally, registers have proved more successful thanother types of internal storage and virtually every architecturedesigned in the last few decades uses a register architecture.
Register computers exist in 3 classes depending on whereALU instructions can access their operands, register-registerarchitectures, register-memory architectures and memory-memory architectures. The majority of the computers shipped
nowadays implement one of those classes in a 2- or 3-operandformat. In order to capture as many computers as possible, theSciBy VM supports all of these variants in a 3-operand format,thereby including 2-operand format architectures in that thedestination address is the same as one of the sources.
B. Instruction Set Architecture
One key element that separates the SciBy VM from con-ventional machines is the memory model: The machine de-fines a Harvard memory architecture with separate memorybanks for data and instructions. The majority of conventionalmodern computers use a von Neumann architecture with asingle memory segment for both instructions and data. Thesemachines are generally more vulnerable to the well-knownbuffer overflow exploits and similar exploits derived from’illegal’ pointer arithmetic to executable memory segments.Furthermore, the machine will support hardware setups thathave separate memory pathways, thus enabling simultaneousdata and instruction fetches. All instructions are fetched fromthe instruction memory bank which is inaccessible for appli-cations: All memory accesses from applications are directedto the data segment. The data memory segment is partitionedin a global memory section, a heap section for dynamicallyallocated structures, and a stack for storing local variables andfunction parameters.
1) Instruction Format: The instruction format is based onbyte codesto simplify the instruction stream. The format isas follows: Each instruction starts with a one-byteoperationcode (opcode) followed by possibly more opcodes and endswith zero or more operands, see Figure 4. In this sense, themachine is a multi-opcode multi-address machine. Havingonly a single one-byte opcode limits the instruction set to only256 different instructions, whereas multiple opcodes allows fornested instructions, thus increasing the number of instructionsexponentially. A multi-address design is chosen to supportmore types of hardware.
OP OP
0 8 32 4816
R1 R2 R3
0 8
OP R1 R2 R3
OP OP
56
R1 R2 R3OP
0 8 16 24 40
24 40
Fig. 4. Examples of various instruction formats on register operands.
2) Addressing Modes:Based on the popularity of address-ing modes found in recent computers, we have selected 4addressing modes for the SciBy VM, all listed below.
• Immediate addressing: The operand is an immediate, forinstance MOV R1 4 which moves the number 4 to register1.
• Displacement addressing: The operand is an offset anda register pointing to a base address, for instance ADD
178 Int'l Conf. Grid Computing and Applications | GCA'08 |

R1 R1 4(R2) which adds to R1 the value found 4 wordsfrom the address pointed out by R2.
• Register addressing: Operand is a register, for instanceMOV R1 R2
• Register indirect addressing: Address part is a registercontaining the address of an operand, for instance ADDR1, R1, (R2), which adds to R1 the value found at theaddress pointed out by R2.
3) Instruction Types:Since the machine defines a Harvardarchitecture, it is important to note that data movement iscarried out byLOAD andSTORE operations which operate onwords in the data memory bank.PUSH and POP operationsare available for accessing the stack.
Table I summarizes the most basic instructions available inthe SciBy VM. Almost all operations are simple 3-addressoperations with operands, and they are chosen to be simpleenough to be directly matched by native hardware operations.
Instruction group MnemonicMoves load, storeStack push, popArithmetic add, sub, mul, div, modBoolean and, or, xor, notBitwise and, or, shl, shr, ror, rolCompare tst, cmpControl halt, nop, jmp, jsr, ret, br, beeq, br lt, etc
TABLE IBASIC INSTRUCTIONSET OF THESCIBY VM
While these instructions are found in virtually every com-puter, they exist in many different variations using variousaddressing modes for each operand. To accommodate thisand assist the compiler as much as possible, the SciBy VMprovides regularity by making the instruction set orthogonalon both operations, data types, and the addressing modes. Forinstance the ’add’ operation exists in all 16 combinations ofthe 4 addressing modes on the two source registers for bothintegers and floating points. Thus, the encoding of an ’add’instruction on two immediate source operands takes up 1 bytefor choosing arithmetic, 1 byte to select the ’add’ on twoimmediates, 2 bytes to address one of the 16384 registersas destination register and then 16 bytes for each of theimmediates, yielding a total instruction length of 36 bytes.
C. Libraries
In addition to the basic instruction set, the machine imple-ments a number of basic libraries for standard operations likefloating-point arithmetic and string manipulation. These areextensions to the virtual machine and are provided on an per-architecture basis as statically linked native libraries optimizedfor specific hardware.
As explained above, virtual machines introduce a perfor-mance overhead in the translation phase from virtual machineobject code to the native hardware instructions of the un-derlying real machine. The all-important observation here isthat scientific applications spend most of their running timeexecuting ’scientific instructions’ such as string operations,
linear algebra, fast fourier transformations, or other libraryfunctions. Hence, by providing optimized native libraries, wecan take advantage of the synergy between algorithms, thecompiler translating them, and the hardware executing them.
Equipping the machine with native libraries for the mostprevalent scientific algorithms and enabling future support fornew libraries increases the number of potential instructionsdrastically. To address this problem, multiple opcodes allowsfor nested instructions as shown in Figure 5. The basicinstructions are accessible using only one opcode, whereasa floating point operation is accessed using two opcodes, i.e.FP lib FP sub R1 R2 R3,and finally, if one wishes to usethe WFTA instruction from theFFT_2 library, 3 opcodes arenecessary:FFT lib FFT 2 WFTA args.
Halt
Load
Store
Push
Pop
Str_lib
FP_lib
Fp_add
FP_sub
FFT_1
FFT_2
FFT_3
String_move
String_cmp
WFTA
PFA
FFT_lib
Fig. 5. Native libraries as extension to the instruction set
A special library is provided to enable file access. Whilemost grid middlewares use a staging strategy that downloadsall input files prior to the job execution and uploads output filesafterwards, the MiG-RFA [1] library accesses files directly onthe file server on an on-demand basis. Using this strategy,an application can start immediately, and only the neededfragments of the files it accesses are transferred.
Ending the discussion of the architecture, it is important tore-emphasize that all focus in this part of the machine is onportability. For instance, when evaluating the architecture, onemight find that:
• Having a 3-operand instruction format may give unnec-essarily large code size in some circumstances
• Studies may show that the displacement addressing modeis typically used to nearby addresses, thereby suggestingthat these instructions only need a few bits for the operand
• Using register-register instructions may give unnecessar-ily high instruction count in some circumstances
• Using byte codes increases the code density• Variable instruction encoding decreases performance
Designing an architecture includes a lot of trade-offs, andeven though many of these issues are zeroed by the interpreteror translator, the proposed byte code is far from optimal bynormal architecture metrics. However, the key point is thatwe target only a special type of applications on a very broadhardware platform.
Int'l Conf. Grid Computing and Applications | GCA'08 | 179

IV. COMPILATION AND TRANSLATION
While researchers do not need to rewrite their scientificapplications for the SciBy VM, they do need to compile theirapplication using a SciBy VM compiler that can translatethe high level language code to the SciBy VM code. Whiledeveloping a new compiler from scratch of course is a possi-bility, it is also a significant amount of work which may proveunprofitable since many compilers designed to be retargetablefor new architectures already exist.
Generally, retargetable compilers are constructed using thesame classical modular structure: A front end that parses thesource file, and builds an intermediate representation, typicallyin the shape of a parse tree, used for machine-independentoptimizations, and a back end that translates this parse tree toassembly code of the target machine.
When choosing between open source retargetable compilers,the set of possibilities quickly narrows down to only a fewcandidates: GCC and LCC. Despite the pros of being the mostpopular and widely used compiler with many supported sourcelanguages in the front end, GCC was primarily designed for32-bit architectures, which greatly complicates the retargetingeffort. LCC however, is a light-weight compiler, specificallydesigned to be easily retargetable to a new architecture.
Once compiled, a byte code file containing assembly in-struction mnemonics is ready for execution in the virtualmachine, either by interpretation or by translation, whereinstructions are mapped to the instruction set of the host ma-chine using either a load-time or run-time translation strategy.Results remain to be seen, yet the authors believe that in casea translator is preferable to an interpreter, the best solutionwould be load-time translator, based on observations fromscientific applications:
• their total running time is fairly long which means thatthe load-time penalty is easily amortized
• they contain a large number of tight loops where run-time translation is guaranteed to be inferior to load-timetranslation
V. EXPERIMENTS
To test the proposed ideas, a prototype of the virtualmachine has been developed, in the first stage as a simpleinterpreter implemented in C. There is no compiler yet, so allsample programs are hand-written in assembly code with theonly goal of giving preliminary results that will show whetherdevelopment of the complete machine can be justified.
The first test is a typical example of the scientific appli-cations the machine targets: A Fast Fourier Transform (FFT).The program first computes 10 transforms on a vector ofvarying sizes, then checksums the transformed vector to verifythe result. In order to test the performance of the virtualmachine, the program is also implemented in C to get thenative base line performance, and in Java to compare theresults of the SciBy VM with an existing widely used virtualmachine.
The C and SciBy VM programs make use of the fftwlibrary[6], while the Java version uses an FFT algorithm from
Vector size Native SciBy VM Java524288 1.535 1.483 7.4441048576 3.284 3.273 19.1742097152 6.561 6.656 41.7574194304 14.249 14.398 93.9608388608 29.209 29.309 204.589
TABLE IICOMPARISON OF THE PERFORMANCE OF ANFFT APPLICATION ON A 1.86
GHZ INTEL PENTIUM M PROCESSOR, 2MB CACHE, 512 MB RAM
Vector size Native SciBy VM Java524288 0.879 0.874 4.8671048576 1.857 1.884 10.7392097152 3.307 3.253 23.5204194304 6.318 6.354 50.7518388608 13.045 12.837 110.323
TABLE IIICOMPARISON OF THE PERFORMANCE OF ANFFT APPLICATION ON A
DUAL CORE 2.2 GHZ AMD ATHLON 4200 64-BIT, 512KB CACHE PER
CORE, 4GB RAM
the SciMark suite[7]. Obviously, this test is highly unfairin disfavor of the Java version for several reasons. Firstly,the fftw library is well-known to give the best performance,and comparing hand-coded assembly with compiler-generatedhigh-level language performance is a common pitfall. How-ever, even though Java-wrappers for the fftw library exist, itis essential to put these comparisons in a grid context. If thegrid resources were to run the scientific applications in JavaVirtual Machine, the programmers - the grid users - wouldnot be able to take advantage of the native libraries, sinceallowing external library calls breaks the security of the JVM.Thereby, the isolation level between the executing grid job andthe host system is lost2. In the proposed virtual machine, theselibraries are an integrated part of the machine, and using themis perfectly safe.
As shown in Table II the FFT application is run on the 3machines using different vector size,2
19, ..., 2
23. The resultsshow that the SciBy VM is on-par with native execution, andthat the Java version is clearly outperformed.
Since the fftw library is multithreaded, we repeat the ex-periment on a dual core machine and on a quad dual-coremachine. The results are shown in Table III and Table IV.
From these results it is clear that for this application there
2In fact there is a US Patent (#6862683) on a method to protect nativelibraries
Vector size Native SciBy VM Java524288 0.650 0.640 4.9551048576 1.106 1.118 12.0992097152 1.917 1.944 27.8784194304 3.989 3.963 61.4238388608 7.796 7.799 134.399
TABLE IVCOMPARISON OF THE PERFORMANCE OF ANFFT APPLICATION ON A
QUAD DUAL -CORE INTEL XEON CPU, 1.60 GHZ, 4MB CACHE PER CORE,8GB RAM
180 Int'l Conf. Grid Computing and Applications | GCA'08 |

is no overhead in running it in the virtual machine. It hasimmediate support for multi-threaded libraries, and thereforethe single-threaded Java version is even further outperformedon multi-core architectures.
VI. RELATED WORK
GridBox [3] aims at providing a secure execution environ-ment for grid applications by means of a sandbox environ-ment and Access Control Lists. The execution environment isrestricted by thechroot command which isolates each appli-cation in a separate file system space. In this space, all systemcalls are intercepted and checked against pre-defined AccessControl Lists which specify a set of allowed and disallowedactions. In order to intercept all system calls transparently, thesystem is implemented as a shared library that gets preloadedinto memory before the application executes. The drawback ofthe GridBox library is the requirement of a UNIX host systemand application and it does not work with statically linkedapplications. Further, this kind of isolation can be opened ifan intruder gains system privileges leaving the host systemunprotected.
Secure Virtual Grid (SVGrid) [10] isolates each grid appli-cations in its own instance of a Xen virtual machine whose filesystem and network access requests are forced to go throughthe privileged virtual machine monitor where the restrictionsare checked. Since each grid virtual machine is securelyisolated from the virtual machine monitor from which it iscontrolled, many levels of security has to be opened in orderto compromise the host system, and the system has provedits effectiveness against several malicious software tests. Theperformance of the system is also above acceptable with a verylow overhead. The only drawback is that while the model canbe applied to other operating systems than Linux, it still makesuse of platform-dependent virtualization software.
The MiG-SSS system [2] seeks to combine Public ResourceComputing and Grid Computing by using sandbox technologyin the form of a virtual machine. The project uses a genericLinux image customized to act as a grid resource and ascreen saver that can start any type of virtual machine capableof booting an ISO image, for instance VMware player andVirtualBox. The virtual machine then boots the linux imagewhich in turn retrieves a job from the Grid and executes thejob in the isolated sandbox environment.
Java and the Microsoft Common Language Infrastructureare similar solutions trying to enable applications written in theJava programming language or the Microsoft .Net framework,respectively, to be used on different computer architectureswithout being rewritten. They both introduce an intermediateplatform independent code format (Java byte code and theCommon Intermediate Language respectively) executable byhardware-specific execution environments (the Java VirtualMachine and the Virtual Execution System respectively).While these solution have proved suitable for many applicationdomains, performance problems and their requirement of aspecific programming language class rarely used for scientific
applications disqualifies the use of these virtual machines forthis project.
VII. C ONCLUSIONS ANDFUTURE WORK
Virtual machines can solve many problems related to usingdesktop computers for Grid Computing. Most importantly, forresource owners, they enforce security by means of isolation,and for researchers using the Grid, they provide a level ofhomogeneity that greatly simplifies application deployment inan extremely heterogeneous execution environment.
This paper presented the basic ideas behind the ScientificByte Code Virtual Machine and proposed a virtual machinearchitecture specifically designed for executing scientific appli-cations on any type of real hardware architecture. To thisend, efficient native libraries for the most prevalent scientificsoftware packages are an important issue that the authors be-lieve will greatly minimize the performance penalty normallyincurred by virtual machines.
An interpreter has been developed to give preliminaryresults that have shown to justify the ideas of the machine. Themachine is on-par with native execution, and on the intendedapplication types, it outperforms the Java virtual machinesdeployed in grid context.
After the proposed initial virtual machine has been im-plemented, several extension to the machine are planned,including threading support, debugging, profiling, an advancedlibrary for a distributed shared memory model, and support forremote memory swapping.
REFERENCES
[1] Rasmus Andersen and Brian Vinter,Transparent remote file access inthe minimum intrusion grid, WETICE ’05: Proceedings of the 14thIEEE International Workshops on Enabling Technologies: Infrastructurefor Collaborative Enterprise (Washington, DC, USA), IEEE ComputerSociety, 2005, pp. 311–318.
[2] , Harvesting idle windows cpu cycles for grid computing, GCA(Hamid R. Arabnia, ed.), CSREA Press, 2006, pp. 121–126.
[3] Evgueni Dodonov, Joelle Quaini Sousa, and Helio Crestana Guardia,Gridbox: securing hosts from malicious and greedy applications, MGC’04: Proceedings of the 2nd workshop on Middleware for grid computing(New York, NY, USA), ACM Press, 2004, pp. 17–22.
[4] Renato J. Figueiredo, Peter A. Dinda, and José A. B. Fortes,Acase for grid computing on virtual machines, ICDCS ’03: Proceedingsof the 23rd International Conference on Distributed Computing Systems(Washington, DC, USA), IEEE Computer Society, 2003.
[5] Ian Foster,The grid: A new infrastructure for 21st century science,Physics Today55(2) (2002), 42–47.
[6] Matteo Frigo and Steven G. Johnson,The design and implementationof FFTW3, Proceedings of the IEEE93 (2005), no. 2, 216–231, specialissue on ”Program Generation, Optimization, and Platform Adaptation”.
[7] Roldan Pozo and Bruce Miller, Scimark 2.0,http://math.nist.gov/scimark2/.
[8] Yunhe Shi, David Gregg, Andrew Beatty, and M. Anton Ertl,Virtualmachine showdown: stack versus registers, VEE ’05: Proceedings ofthe 1st ACM/USENIX international conference on Virtual executionenvironments (New York, NY, USA), ACM, 2005, pp. 153–163.
[9] J.E. Smith and R. Nair,Virtual machines: Versatile platforms for systemsand processes, Morgan Kaufmann, 2005.
[10] Xin Zhao, Kevin Borders, and Atul Prakash,Svgrid: a secure virtualenvironment for untrusted grid applications, MGC ’05: Proceedings ofthe 3rd international workshop on Middleware for grid computing (NewYork, NY, USA), ACM Press, 2005, pp. 1–6.
Int'l Conf. Grid Computing and Applications | GCA'08 | 181

Interest-oriented File Replication in P2P FileSharing Networks
Haiying ShenDepartment of Computer Science and Computer Engineering
University of Arkansas, Fayetteville, AR 72701
Abstract - In peer-to-peer (P2P) file sharing networks,file replication avoids overloading file owner and im-proves file query efficiency. Most current methods repli-cate a file along query path from a client to a server.These methods lead to large number of replicas and lowreplica utilization. Aiming to achieve high replica uti-lization and efficient file query, this paper presents aninterest-oriented file replication mechanism. It clustersnodes based on node interest. Replicas are shared bynodes with common interest, leading to less replicas andoverhead, and enhancing file query efficiency. Simu-lation results demonstrate the effectiveness of the pro-posed mechanism in comparison with another file repli-cation method. It dramatically reduces the overhead offile replication and improves replica utilization.
Keywords: File replication, Peer to peer, Distributedhash table
1. Introduction
Over the past years, the immerse popularity of Inter-net has produced a significant stimulus to peer-to-peer(P2P) file sharing networks [1, 2, 3, 4, 5]. A popular filewith very frequent visit rate in a node will overload thenode, leading to slow response to file requests and lowquery efficiency. File replication is an effective methodto deal with the problem of overload due to hot files.Most current file replication methods [6, 7, 8, 9, 10, 11]replicate a file along query path between a requester anda file owner to increase the possibility that a query canencounter a replica node during routing. We use Path todenote this class of methods. In Path, a file query stillneeds to be routed until it encounters a replica node orthe file owner. However, they cannot guarantee that a re-quest meets a replica node. To enhance the effectivenessof file replication on query efficiency, this paper presentsan interest-oriented file replication mechanism, namely
Cluster. It groups nodes with a common interest into acluster. Cluster is novel in that replicas are shared bynodes with common interest, leading to less replicas andoverhead, and enhancing file query efficiency.
The rest of this paper is structured as follows. Sec-tion 2 presents a concise review of representative filereplication approaches for P2P file sharing networks.Section 3 presents Cluster file replication mechanism,including its structure and algorithms. Section 4 showsthe performance of Cluster in comparison to other ap-proaches with a variety of metrics, and analyzes the fac-tors effecting file replication performance. Section 5concludes this paper.
2. Related Work
File replication in P2P systems is designed to releasethe load in hot spots and meanwhile decrease file querytime. PAST [12] replicates each file on a set number ofnodes whose ID matches most closely to the file owner’sID. It has load balancing algorithm for non-uniform stor-age node capacities and file sizes, and uses caching alongthe lookup path for non-uniform popularity of files tominimize fetch distance and to balance the query load.Similarly, CFS [6] replicates blocks of a file on nodesimmediately after the block’s successor on the Chordring [1]. Stading et al. [7] proposed to replicate a filein locality close nodes near the file owner. LAR [13]and Gnutella [14] replicate a file in overloaded nodesat the file requester. Backslash [7] pushes cache to onehop closer to requester nodes as soon as nodes are over-loaded. Freenet [8] replicates objects both on insertionand retrieval on the path from the requester to the target.CFS [6], PAST [12], LAR [13], CUP [9] and DUP [10]perform caching along the query path. Cox et al. [11]studied providing DNS service over a P2P network. Theycache index entries, which are DNS mappings, alongsearch query paths.
Ghodsi et al. [15] proposed a symmetric replication
182 Int'l Conf. Grid Computing and Applications | GCA'08 |
scheme in which a number of IDs are associated witheach other, and any item with an ID can be replicated innodes responsible for IDs in this group. HotRoD [16] isa DHT-based architecture with a replication scheme. Anarc of nodes (i.e. successive nodes on the ring) is “hot”when at least one of these nodes is hot. In the scheme,“hot” arcs of nodes are replicated and rotated over the IDspace. By tweaking the degree of replication, it can tradeoff replication cost for load balance.
Path methods still require file request routing, and themethods cannot ensure that a request meets replica nodeduring routing. Thus, they cannot significantly improvefile query efficiency. Rather than replicating file in a sin-gle requester, Cluster replicates a file for nodes with acommon interest. Consequently, the file replication over-head is reduced, and replica utilization and query effi-ciency are increased.
3. Interest-oriented File Replication
3.1. Overview
We use Chord Distributed Hash Table (DHT) P2P sys-tem [1] as an example to explain the file replication inP2P file sharing networks. Without loss of generality, weassume that nodes have their interests and these inter-ests can be uniquely identified. A node’s interests are de-scribed by a set of attributes with globally known stringdescription such as “image”, “music” and “book”. Theinterest attributes are fixed in advance for all participat-ing nodes. Each interest corresponds to a category offiles. A node frequently requests its interested files. Thestrategies that allows content to be described in a nodewith metadata [17, 18, 19, 20, 21] can be used to derivethe interests of each node. Due to the space limit, wedon’t explain the details of the strategies.
3.2. Cluster Structure Construction
Consistent hash function such as SHA-1 is widelyused in DHT networks for node or file ID due to itscollision-resistant nature. Using such a hash function,it is computationally infeasible to find two different mes-sages that produce the same message digest. Therefore,the consistent hash function is effective to cluster inter-est attributes based on their differences. Same interest at-tributes will have the same consistent hash value, whiledifferent interest attributes will have different hash val-ues.
Next, we introduce how to use the consistent hashfunction to cluster nodes based on interest. To facili-tate such a clustering, the information of nodes with a
common interest should be marshaled in one node in theDHT network, so that these nodes can locate each otherin order to constitute a cluster. Although logically closenodes do not necessarily have common interest, Clusterenables common-interest nodes report their informationto the same node.
In a DHT overlay [1], an object with a DHTkey is allocated to a node by the interface ofInsert(key,objet), and the object can be foundby Lookup(key). In Chord, the object is assigned tothe first node whose ID is equal to or follows the key inthe ID space. If two objects have similar keys, then theyare stored in the same node. We use H to denote theconsistent hash value of a node’s interest, and Info todenote the information of the node including its IP ad-dress and ID. Because H distinguishes node interests, ifnodes report their information to the DHT overlay withtheir H as the key by Insert(H,Info), the infor-mation of common-interest nodes with similar H willreach the same node, which is called repository node.As a result, a group of information in a repository nodeis the information of nodes with a common interest. Therepository node can further classify the information ofthe nodes based on their locality. The information of thelocality can be included into the reporting information.The work in [22] introduced a method to get the localityinformation of a node. Please refer to [23] for the detailsof methods to measure a node’s locality.
Therefore, a node can find other nodes with the sameinterest in its repository node by Lookup(H). In eachcluster, highest-capacity node is elected as the server ofother nodes in the cluster (i.e., clients). Thus, each clienthas a link connecting to its server, and a server connectsto a group of clients in its cluster. The server has anindex of all files and file replicas in its clients. Everytime a client accepts or deletes a file replica, it reports tothe server. A server uses broadcasting to communicatewith its clients.
P2P overlay is characterized by dynamism in whichnodes join, leave and fail continually. The structuremaintenance mechanism in my previous work [24] isadopted for the Cluster structure maintenance. Thesetechniques are orthogonal to our study in this paper.
3.3. File Replication and Query Algorithms
Cluster reduces the number of replicas, increasesreplica utilization and significantly improves file queryefficiency. Rather than replicating a file to all nodes in aquery path, it considers the request frequency of a groupof nodes, and makes replicas for nodes with a commoninterest. Since common-interest nodes are grouped in acluster, a node can get its frequently-requested file in its
Int'l Conf. Grid Computing and Applications | GCA'08 | 183

11.5
22.5
33.5
44.5
5
5 10 15 20 25Number of replicating operations when overloaded
Ave
. pat
h le
ngth
ClusterPath
Figure 1. Average path length.
own cluster without request routing in the entire system.This significantly improves file query efficiency.
In addition to file owners, we assume other nodes canalso replicate files. Therefore, file owner and servers areresponsible for file replication. For simplicity, in the fol-lowing, we use server to represent both of them.
When overloaded, a server replicates the file in a nodein a cluster. Recall that the information of common-interest nodes are further classified into sub-groups basedon node locality or query visit rate. The server choosesthe sub-group with the highest file query frequency, andthen chooses the node with the highest file query fre-quency.
Unlike Path methods that replicate a file in all nodesin a query path, Cluster avoids unnecessary file replica-tions by only replicating a file for a group of frequent-requesters. It guarantees that file replicas are fully uti-lized. Requesters that frequently query for file f canget file f from itself or its cluster without query rout-ing. Thus, the replication algorithm improves file queryefficiency and saves file replication overhead.
Considering that file popularity is non-uniform andtime-varying and node interest varies over time, some filereplicas become unnecessary when there are few queriesfor them. To cope with this situation, Cluster lets eachserver keep track of file visit rate of replica nodes, andperiodically remove the under-utilized replicas. If a fileis no longer requested frequently, there will be few filereplicas for it. The adaptation to cluster query rate en-sures that all file replicas are worthwhile and there is nowaste of overhead for unnecessary file replica mainte-nance.
When node i requests for a file, if the file isnot in the requester’s interests, the node uses DHTLookup(key) function to query the file. Otherwise,node i first queries the file in its cluster among nodes in-terested in the file. Specifically, in the first step, node isends a request to its server in the cluster of this inter-
est. The server searches the index for the requested filein its cluster. Searching among interested nodes has highprobability to find a replica of the file. After the steps,if the query still fails, node i resorts to Lookup(key)function.
4 Performance Evaluation
This section presents the performance evaluation ofCluster in average case in comparison with Path. We usereplica hit rate to denote the percentage of the numberof queries that are resolved by replica nodes among totalqueries. The experiment results demonstrate the supe-riority of Cluster over Path in terms of average lookuppath, replica hit rate, and the number of replicas. In theexperiment, when overloaded, a file owner or a client’sserver conducts a file replicating operation. In a filereplicating operation, Cluster replicates a file to a singlenode while Path replicates a file to a number of nodesalong a query path. In the experiments, the number ofnodes was set to 2048. We assumed there were 200 in-terest attributes, and each attribute had 500 files. We as-sumed a bounded Pareto distribution for the capacity ofnodes. The shape of the distribution was set to 2, thelower bound of a node’s capacity was set to 500, and theupper bound was set to 50000. The number of queriedfiles was set to 50, and the number of queries per file wasset to 1000. This distribution reflects real world situa-tions where machine capacities vary by different ordersof magnitude. The file requesters and the queried fileswere randomly chosen in the experiments.
4.1 Effectiveness of File Replication
Figure 1 plots the average path length of Cluster andPath. We can see that Cluster leads to shorter pathlength than Path. Unlike Cluster that replicates a fileonly in one node in each file replicating operation, Path
184 Int'l Conf. Grid Computing and Applications | GCA'08 |

0.6
0.7
0.8
0.9
1
5 10 15 20 25Number of replicating operations when overloaded
Rep
lica
hit r
ate
ClusterPath
Figure 2. Replica hit rate.
0
500
1000
1500
2000
2500
3000
3500
4000
5 10 15 20 25Number of replicating operations when overloaded
Num
ber o
f file
repl
icas Cluster
Path
Figure 3. Number of replicas.
replicates file in nodes along a query path. Therefore,it increases replica hit rate and produces shorter pathlength. However, it is unable to guarantee that everyquery can encounter a replica. Cluster can achieve muchhigher lookup efficiency with much less replicas. It il-lustrates the effectiveness of Cluster to replicate files fora group of nodes. A node can get a file directly from anode in its own cluster which enhances the utilization ofreplicas and also reduces the lookup path length. Clus-ter lets a replica be shared within the group of nodes,which increases the utilization of replicas and reducespath length.
Figure 2 demonstrates the replica hit rate of differ-ent approaches. We can observe that Cluster leads tohigher hit rate than Path. For the same reason observedin Figure 1, Path replicates files at nodes along the rout-ing path, more replica nodes render higher possibility fora file request to meet a replica node. However, its effi-ciency is outweighed by its much more replicas. In ad-dition, it cannot ensure that each request can be resolvedby a replica node. Cluster replicates a file for a group ofcommon-interest nodes, which improves the probabilitythat the file query is resolved by a replica node, leadingto higher hit rate.
4.2 Efficiency of File Replication
Figure 3 illustrates the total number of replicas inCluster and Path. It shows that the number of repli-cas increases as the number of replicating operations in-creases. This is due to the reason that more replicatingoperations for a file lead to more total replicas. Path gen-erates excessively more replicas than others, and Clusterproduces less number of replicas. In each file replicatingoperation, Path replicates a file in multiple nodes alonga routing path, and Cluster replicates a file in a singlenode. Therefore, Path generates much more replicas thanothers. In Cluster, a replica is fully utilized through be-ing shared by a group of nodes, generating high replica
hit rate, and reducing the possibility that a file owner isoverloaded. Thus, the file owner has less replicating op-erations, which leads to fewer replicas and less overheadfor replica maintenance.
5 Conclusions
Most current file replication methods for P2P filesharing networks incur prohibitively high overhead byreplicating a file in all nodes along a query path froma client to a server. This paper proposes an interest-oriented file replication mechanism. It generates areplica for a group of nodes with the same interest.The mechanism reduces file replicas, guarantees highquery efficiency and high utilization of replicas. Sim-ulation results demonstrate the superiority of the pro-posed mechansim in comparison with another file repli-cation approach. It dramatically reduces the overhead offile replication and produces significant improvements inlookup efficiency and replica hit rate.
Acknowledgements
This research was supported in part by the Acxiom Cor-poration.
References
[1] I. Stoica, R. Morris, D. Liben-Nowell, D. R.Karger, M. F. Kaashoek, F. Dabek, and H. Balakr-ishnan. Chord: A Scalable Peer-to-Peer LookupProtocol for Internet Applications. IEEE/ACMTransactions on Networking, 1(1):17–32, 2003.
[2] S. Ratnasamy, P. Francis, M. Handley, R. Karp, andS. Shenker. A scalable content-addressable net-work. In Proc. of ACM SIGCOMM, pages 329–350,2001.
Int'l Conf. Grid Computing and Applications | GCA'08 | 185
[3] A. Rowstron and P. Druschel. Pastry: Scalable,decentralized object location and routing for large-scale peer-to-peer systems. In Proc. of IFIP/ACMInternational Conference on Distributed SystemsPlatforms (Middleware), pages 329–350, 2001.
[4] B. Y. Zhao, L. Huang, J. Stribling, S. C. Rhea, A. D.Joseph, and J. Kubiatowicz. Tapestry: An Infras-tructure for Fault-tolerant wide-area location androuting. IEEE Journal on Selected Areas in Com-munications, 12(1):41–53, 2004.
[5] H. Shen, C. Xu, and G. Chen. Cycloid: A Scal-able Constant-Degree P2P Overlay Network. Per-formance Evaluation, 63(3):195–216, 2006.
[6] F. Dabek, M. F. Kaashoek, D. Karger, R. Morris,and I. Stocia. Wide-area cooperative storage withCFS. In Proc. of the 18th ACM Symp. on OperatingSystems Principles (SOSP-18), 2001.
[7] T. Stading, P. Maniatis, and M. Baker. Peer-to-peer Caching Schemes to Address Flash Crowds.In Proc. of the International workshop on Peer-To-Peer Systems, 2002.
[8] I. Clarke, O. Sandberg, B. Wiley, and T. W. Hong.Freenet: A Distributed Anonymous InformationStorage and Retrieval System. In Proc. of the Inter-national Workshop on Design Issues in Anonymityand Unobservability, pages 46–66, 2001.
[9] M. Roussopoulos and M. Baker. CUP: ControlledUpdate Propagation in Peer to Peer Networks. InProc. of the USENIX 2003 Annual Technical Conf.,2003.
[10] L. Yin and G. Cao. DUP: Dynamic-tree BasedUpdate Propagation in Peer-to-Peer Networks. InIEEE International Conference on Data Engineer-ing (ICDE), 2005.
[11] R. Cox, A. Muthitacharoen, and R. T. Morris. Serv-ing DNS using a Peer-to-Peer Lookup Service. InProc. of the International workshop on Peer-To-Peer Systems, 2002.
[12] A. Rowstron and P. Druschel. Storage Manage-ment and Caching in PAST, a Large-scale, Persis-tent Peer-to-peer Storage Utility. In Proc. of the18th ACM Symp. on Operating Systems Principles(SOSP-18), 2001.
[13] V. Gopalakrishnan, B. Silaghi, B. Bhattacharjee,and P. Keleher. Adaptive Replication in Peer-to-Peer Systems. In Proc. of the 24th Interna-tional Conference on Distributed Computing Sys-tems (ICDCS), 2004.
[14] Gnutella home page. http://www.gnutella.com.
[15] A. Ghodsi, L. Alima, and S. Haridi. SymmetricReplication for Structured Peer-to-Peer Systems.In Proc. of International Workshop on Databases,Information Systems and Peer-to-Peer Computing,page 12, 2005.
[16] T. Pitoura, N. Ntarmos, and P. Triantafillou. Repli-cation, Load Balancing and Efficient Range QueryProcessing in DHTs. In Proc. of the 10th Interna-tional Conference on Extending Database Technol-ogy (EDBT), 2006.
[17] W. Nejdl, W. Siberski, M. Wolpers, and C. Schm-nitz. Routing and clustering in schema-based superpeer networks. In Proc. of the 2nd InternationalWorkshop on Peer-to-Peer Systems (IPTPS), 2003.
[18] A. Y. Halevy, Z. G. Ives, P. Mork, and I. Tatari-nov. Piazza: Data management infrastructure forsemantic web applications. In Proc. of the 12nd In-ternational World Wide Web Conference, 2003.
[19] K. Aberer, P. Cudre-Mauroux, and M. Hauswirth.The chatty web: Emergent semantics through gos-siping. In Proc. of the 12nd International WorldWide Web Conference, 2003.
[20] A. Loser, W. Nejdl, M. Wolpers, and W. Siberski.Information integration in schema-based peer-to-peer networks. In Proc. of the 15th InternationalConference of Advanced Information Systems En-gieering (CAiSE), 2003.
[21] W. Nejdl, M. Wolpers, W. Siberski, A. Loser,I. Bruckhorst, M. Schlosser, and C. Schmitz. Super-peer-based routing and clustering strategies for rdf-based peer-to-peer networks. In Proc. of the 12ndInternational World Wide Web Conference, 2003.
[22] H. Shen and C. Xu. Locality-Aware and Churn-Resilient Load Balancing Algorithms in StructuredPeer-to-Peer Networks. IEEE Transactions on Par-allel and Distributed Systems, 2007.
[23] H. Shen. Interest-oriented File Replication in P2PFile Sharing Networks. Technical Report TR-2008-01-85, Computer Science and Computer Engineer-ing Department, University of Arkansas, 2008.
[24] H. Shen and C.-Z. Xu. Hash-based Proximity Clus-tering for Efficient Load Balancing in Heteroge-neous DHT Networks. Journal of Parallel and Dis-tributed Computing (JPDC), 2008.
186 Int'l Conf. Grid Computing and Applications | GCA'08 |

CRAB: an Application for Distributed Scientific Analysis in Grid Projects
D. Spiga1-3-6, S. Lacaprara2, M.Cinquilli3, G. Codispoti4, M. Corvo5, A. Fanfani4, F. Fanzago5-6, F. Farina6-7, C. Kavka8, V. Miccio6, and E. Vaandering9
1University of Perugia, Perugia, Italy2INFN Legnaro, Padova, Italy3INFN Perugia, Perugia, Italy
4INFN and University of Bologna, Bologna, Italy5CNAF, Bologna, Italy
6CERN, Geneva, Switzerland7INFN Milano-Bicocca, Milan, Italy
8INFN Trieste, Trieste, Italy9FNAL, Batavia, Illinois, USA
Int'l Conf. Grid Computing and Applications | GCA'08 | 187

Abstract - Starting from 2008 the CMS experiment will produce several Petabytes of data each year, to be distributed over many computing centers located in many different countries. The CMS computing model defines how the data has to be distributed in a way that CMS physicists can efficiently run their analysis over the data. CRAB (CMS Remote Analysis Builder) is the tool, designed and developed by the CMS collaboration, that facilitates the access to the distributed data in a totally transparent way. The tool's main feature is the possibility to distribute and and to parallelize the local CMS batch data analysis processes over different Grid environments. CRAB interacts with the local user environment, CMS Data Management services and the Grid middleware.
Keywords: Grid Computing, Distributed Computing, Grid Application, High Energy Physics Computing.
Introduction
The Compact Muon Solenoid (CMS)[1] is one of two large general-purpose particle physics detectors integrated in to the proton-proton Large Hadron Collider (LHC)[2] at CERN (European Organization for Nuclear Research) in Switzerland. The CMS detector has 15 millions of channels; through them data will be taken at a rate of TB/s and selected by an on-line selection system (trigger) that will reduce the frequency of data taken from 40 MHz (LHC frequency) to 100 Hz (writing data frequency), that means 100 MB/s and 2 PB data per year. This challenging experiment is a collaboration constituted by about 2600 physicist from 180 scientific institutes all over the world. The quantity of data to analyze (and to simulate) needs a plenty of resources to satisfy the computational experiment requirements, as the large disk space needed to store the data and many cpus where to run physicist's algorithms. It is also needed a way to make all data and shared resources accessible from all the people in the collaboration. This environment has encouraged the CMS collaboration to define an ad-hoc computing model that satisfy these problematics.. This leans on the use of Grid computing resources, services and toolkits as basic building blocks, making realistic requirements on grid services. CMS decided to use a combination of tools, provided by the LCG (LHC Computing Grid)[3] and OSG (Open Science Grid)[4] projects, as well as specialized CMS tools are used together. In this environment, the computing system has been arranged in tiers (Figure 1) where the majority of computing resources are located away from the host lab. The system is geographically distributed, consistent with the nature of the CMS collaboration itself: • The Tier-0 computing centre is located at
CERN and is directly connected to the experiment for the initial processing,
Figure 1. Multi-tier architecture based on distributed resources and Grid services.
188 Int'l Conf. Grid Computing and Applications | GCA'08 |

reconstruction and data archiving. • A set of large Tier-1 centers where the Tier-0 distributes data (processed and not); these
centers provide also considerable services for different kind of data reprocessing. • A typical Tier-1 site distributes the processed data to smaller Tier-2 centers which have
powerful cpu resources to run analysis tasks and Monte Carlo simulations. Distributed analysis model in CMS For the CMS experiment in the Grid computing environment there are many problematic points due to the wide amount of dislocated resources. The CMS Workflow Management System (CMS WM) manages the large scale data processing and reduction process which is the principal focus of experimental HEP computing. The CMS WM has to be considered the main flow to manage and access the data, giving to the user an unique interface that allows to interact with the generic Grid services and with the specific experiment services as an unique common environment. The Grid services are mainly constituted by the Grid WMS which takes jobs into account, performs match-making operations and distributes the jobs toward the Computing Element (CE); the CE manages local queues that point to a set of resources located to a specific site as the Worker Nodes where the jobs run; finally there are Storage Elements (SE) that are logic entities that warranty an uniform access to a storage area where the data is stored. As part of its computing model, CMS has chosen a baseline in which the bulk experiment-wide data is pre-located at sites and thus the Workload Management (WM) system submit the jobs to the correct CE. The Dataset Bookkeeping System (DBS) allows to discover and access various forms of event data in a distributed computing environment. The analysis model[5] is batch-like and consists of main steps: the user runs interactively on small samples of the data somewhere in order to develop his code and test it; once the code is the desired one, the user selects a large data and submit the very same code to analyze the chosen data. The results is made available to the user to be analyzed interactively. The analysis can be done in step, saving the intermediate ones and iterating over the latest ones. The distributed analysis workflow over the Grid backs on the Workflow Management System, which is not directly user oriented. In fact the analysis flow in the above specified distributed environment is a more complex computing task because it assume to know which data are available, where data are stored and how to access them, which resources are available and are able to comply with analysis requirements, also at the above specified Grid and CMS infrastructure details.
The CMS Remote Analysis Builder
The users do not want to deal with the previously described issues and they want to analyze data in a simple way. The CMS Remote Analysis Builder (CRAB)[6] is the application designed
Int'l Conf. Grid Computing and Applications | GCA'08 | 189
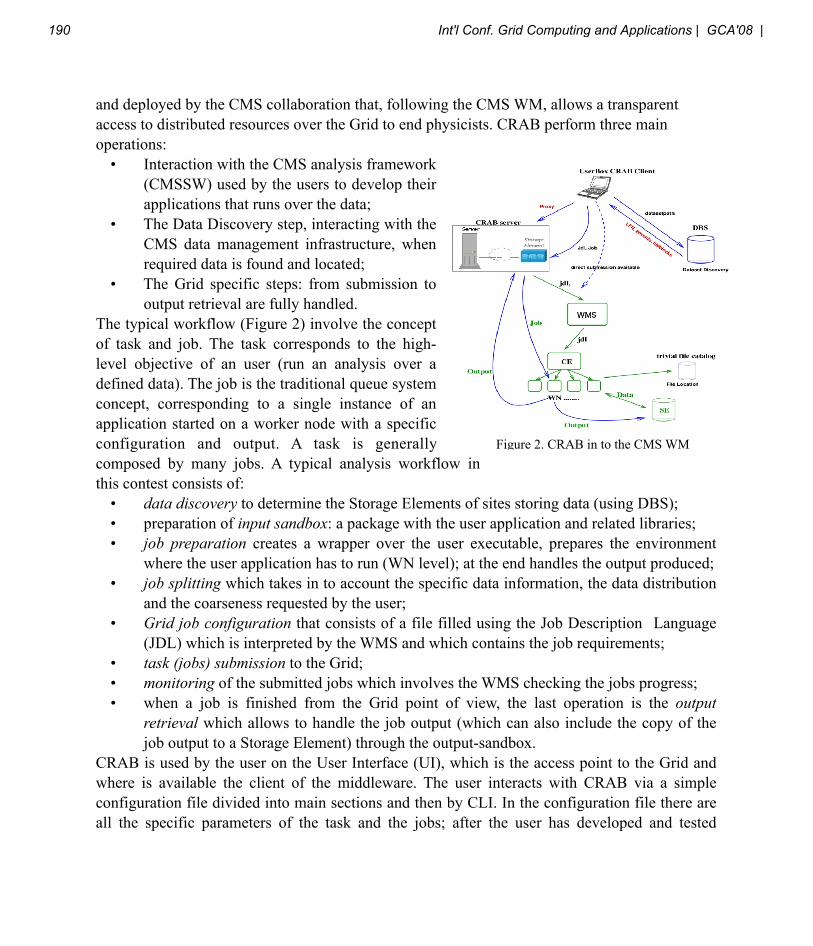
and deployed by the CMS collaboration that, following the CMS WM, allows a transparent access to distributed resources over the Grid to end physicists. CRAB perform three main operations: • Interaction with the CMS analysis framework
(CMSSW) used by the users to develop their applications that runs over the data;
• The Data Discovery step, interacting with the CMS data management infrastructure, when required data is found and located;
• The Grid specific steps: from submission to output retrieval are fully handled.
The typical workflow (Figure 2) involve the concept of task and job. The task corresponds to the high-level objective of an user (run an analysis over a defined data). The job is the traditional queue system concept, corresponding to a single instance of an application started on a worker node with a specific configuration and output. A task is generally composed by many jobs. A typical analysis workflow in this contest consists of: • data discovery to determine the Storage Elements of sites storing data (using DBS); • preparation of input sandbox: a package with the user application and related libraries; • job preparation creates a wrapper over the user executable, prepares the environment
where the user application has to run (WN level); at the end handles the output produced; • job splitting which takes in to account the specific data information, the data distribution
and the coarseness requested by the user; • Grid job configuration that consists of a file filled using the Job Description Language
(JDL) which is interpreted by the WMS and which contains the job requirements; • task (jobs) submission to the Grid; • monitoring of the submitted jobs which involves the WMS checking the jobs progress; • when a job is finished from the Grid point of view, the last operation is the output
retrieval which allows to handle the job output (which can also include the copy of the job output to a Storage Element) through the output-sandbox.
CRAB is used by the user on the User Interface (UI), which is the access point to the Grid and where is available the client of the middleware. The user interacts with CRAB via a simple configuration file divided into main sections and then by CLI. In the configuration file there are all the specific parameters of the task and the jobs; after the user has developed and tested
Figure 2. CRAB in to the CMS WM
190 Int'l Conf. Grid Computing and Applications | GCA'08 |

locally his own analysis code, he specifies which application he wishes to run, the dataset to analyze and the general requirements on the input dataset as the job splitting parameter, the information related to how threat the output that can be retrieved back to the UI or can be directly copied to an existing Storage Element. There are also post-output retrieval operations that can be executed by the users, which include the data publication that allows to register user data into a local DBS instance, to consent an easy access on the user-registered data.
CRAB Architecture and Implementation
The programming language used to develop CRAB is Python. It allows a reduced development time and an improved maintenance, included the fact that does not need to be compiled. CRAB can perform three main kinds of job submission where each one is totally transparent to the user: • the direct submission to the Grid interacting directly with the middleware; • the direct submission to local resources and relative queues, using the batch system, in a
LFS (Load Sharing Facilities) environment; • the submission to the Grid using the CRAB server as a layer where to delegate the
interaction with the middleware and the task/job management.Actually the major effort of the development activity is devoted to the client-server implementation. The client is on the User Interface, while the server could be located somewhere over the Grid. The CRAB client is directly used by the users and it enables to perform the operations involved in the task/job preparation and creation, as: the data discovery, the input-sandbox preparation, the job preparation (included the job splitting) and the requirement definition. Then the client makes a request, completely transparent to the user, to the CRAB server. This one fulfills each request, handling the task and performing the related flow, in any kind of Grid interaction: job submission to the Grid; automatic job monitoring; automatic job output retrieval; re-submission of failed jobs following particular rules for different kinds of job failures; every specific command requested by the user as the job killing; notify the user by e-mail when the task reach a specified level and when it is fully ended (the output results of each jobs are ready). This operation partitioning between the client and the server allows to automatize as much as possible the interaction with the Grid reducing the unnecessary human load, having all possible actions into the server side (at minimum those on client side), centralizing the Grid interaction and then allowing to handle every kind of trouble on a unique place. This also permits to improve the scalability of the whole system[7].The communication between the client and the server is on SOAP[8]. Selecting it has some obvious reasons: it is a de facto standard in the Grid service development community, it uses HTTP protocol, provides interoperability across institutional and application language. The client has to assume nothing about the implementation details of the server and vice versa. In this case
Int'l Conf. Grid Computing and Applications | GCA'08 | 191

the SOAP based communication is developed by using gSOAP[9]. gSOAP provides a cross-platform development toolkit for developing server and client applications, allowing to not maintain any custom protocol. It does not require any pre-installed runtime environment, but using the WSDL (Web Services Description Language) it generates code in ANSI C/C++.The internal CRAB server architecture (Figure 3) is based on components implemented as independent agents communicating through an asynchronous and persistent message service (as a publish and subscribe model) based on a MySQL[10] database. Each agent takes charge of specific operations, allowing a modular approach from a logical point of view. The actual server implementation provides the following components: • CommandManager: endpoint of SOAP service that handles commands sent by the client; • CrabWorker: component that performs direct job submission to the Grid; • TaskTracking: updates information about tasks under execution polling the database; • Notification: notifies the user by e-mail when his task is ended and the output has been
already retrieved; it also notify the server administrator for special warning situation; • TaskLifeManager: manages the task
life on the server, cleaning ended tasks;
• JobTracking: tracks the status of every job;
• GetOutput: retrieves the output of ended jobs;
• JobKiller: when asked kills single or multiple jobs;
• ErrorHandler: performs a basic error handling that allows to resubmit jobs;
• RSSFeeder: provides RSS channels to forward information about the server status;
• AdminComponent: executes specific server maintenance operations.Many of the above listed components are implemented following a multithreading approach, using safe connection to the database. This allows to manage many tasks at the same time shortening and often totally removing the delay time for an single operation that has to be accomplished on many tasks. The use of threaded components is very important when interacting with the Grid middleware, where some operation (e.g.: on a bulk of jobs at the same moment) requires a not unimportant time. Two important entities in the CRAB server architecture are the WS-Delegation and a specific area on an existing Storage Element. The WS-Delegation is a
Figure 3. CRAB Server
192 Int'l Conf. Grid Computing and Applications | GCA'08 |

compliant service for the user proxy delegation from the client to the server; this allows to the server to perform each Grid operation for a given task with the corresponding user proxy. The SE allows to transfer the input/output-sandboxes between the User Interface and the Grid, working as a sort of drop-box area. The server has a specific interface made up by a set of API and a core with hierarchical classes which implement different protocols, allowing to interact transparently with the associated remote area, independently from the transfer protocol. The ability of the server to potentially interact with any associated storage server, independently from the protocol, allows to have a portable and scalable object, where the Storage Element that hosts the job sand-boxes is completely independent from the server. Then the CRAB server is then really adaptable to different environments and configurations. It is also complained to have a local disk area mounted on the local CRAB server instance, with a GridFTP server associated with, to be used for the sandbox transfers (instead of a remote Storage Element). The interaction with the Grid is performed using the BossLite framework included in the server core. This framework can be considered a thin layer between the CRAB server and the Grid, used to interact with the middleware and to maintain specific information about tasks/jobs. BossLite is constituted by a set of API that works as an interface to the core. The core of BossLite maps the database objects (e.g.: task, job) and allows to execute specific Grid operations over database-loaded objects.
Conclusions
CRAB is in production since three years and is the only computing tool in CMS used by generic physicist. It is widely used inside the collaboration with more then 600 distinct users during the 2007 and over about 50 distinct Tier-2 sites involved in the Grid analysis activities. The CRAB tool is continuously evolving and the actual architecture allows to simply add new components to the structure to support new use cases that will come up.
References1. The CMS experiment http://cmsdoc.cern.ch2. The Large Hadron Collider Conceptual Design Report CERN/AC/95-053. LCG Project: LCG Technical Design Report,CERN TDR-01 CERN-LHCC-2005-024, June 20054. The Open Science Grid project http://www.opensciencegrid.org5. The CMS Technical Design Report http://cmsdoc.cern.ch/cms/cpt/tdr6. D.Spiga, S.Lacaprara, W.Bacchi, M.Cinquilli, G.Codispoti, M.Corvo, A.Dorigo, A.Fanfani, F.Fanzago, F.Farina, M.Merlo, O.Gutsche, L.Servoli, C.Kavka (2007). "The CMS Remote Analysis Builder (CRAB)". High Performance Computing -HiPC 2007 14th International Conference. Goa, India. vol. 4873, pp. 580-5867. D.Spiga, S.Lacaprara, W.Bacchi, M.Cinquilli, G.Codispoti, M.Corvo, A.Dorigo, F.Fanzago, F.Farina, O.Gutsche, C.Kavka, M.Merlo, L.Servoli, A.Fanfani. (2007). "CRAB: the CMS distributed analysis tool development and design". Hadron Collider Physics Symposium 2007. La Biodola, Isola d'Elba, Italy. vol.177-178C, pp. 267-2688. SOAP Messagging Framework http://www.w3.org/TR/soap12-part19. The gSOAP Project http://www.cs.fsu.edu/~engelen/soap.html10. MySQL Open Source Database http://www.mysql.com
Int'l Conf. Grid Computing and Applications | GCA'08 | 193

Fuzzy-based Adaptive Replication Mechanism in Desktop Grid Systems
HongSoo Kim, EunJoung ByunDept. of Computer Science & Engineering, Korea University
{hera, vision}@disys.korea.ac.kr
JoonMin GilDept. of Computer Education, Cathoric University of Daegu
JaeHwa Chung, SoonYoung JoungDept. of Computer Science Education, Korea University
{bigbearian, jsy}@comedu.korea.ac.kr
Abstract
In this paper, we discuss the design of replication mech-anism to guarantee correctness and support deadlinetasks in desktop grid systems. Both correctness and per-formance are considered important issues in the designof such systems. To guarantee the correctness of re-sults, voting-based and trust-based sabotage tolerancemechanisms are generally used. However, these mech-anisms suffer from two potential shortcomings: wasteof resources due to running redundant replicas of thetask, and increase in turnaround time due to the inabil-ity to deal with dynamic and heterogeneous environments.In this paper, we propose a Fuzzy-based Adaptive Repli-cation Mechanism (FARM) for sabotage-tolerance withdeadline tasks. This is based on the fuzzy inference pro-cess according to their trusty and result-return prob-ability. Using these two parameters, our desktop gridsystem can provide both the sabotage-tolerance and a re-duction in turnaround time. In addition, simulation re-sults show that compared to existing mechanisms, theFARM can reduce resource waste in replication without in-creasing the turnaround time.
1. Introduction
Desktop grid computing is a means of carrying out high-throughput scientific applications using the idle time ofdesktop computers (PCs) connected to the Internet [5]. Ithas been used in massively parallel applications composedof numerous instances of the same computation. The ap-plications usually involve scientific problems that require a
large amounts of sustained processing capacity over longperiods. In recent years, there has been increased inter-est in desktop grid computing because of the success ofthe most popular examples, such as SETI@Home [10] anddistributed.net [16]. There has been a number of studiesof desktop grid systems that provide an underlying plat-form, such as BOINC [15], Entropia [17], Bayanihan [18],XtremWeb [19], and Korea@Home [6].
One of the main characteristics of desktop grid comput-ing is that computing resources, referred to as volunteers,are free to leave or join, which results in a great deal ofnode volatility. Thus, desktop grid systems (DGSs) are lackof reliability due to uncontrolled and unspecified comput-ing resources and cannot help being exposed to sabotageby erroneous results of malicious resources. When a mali-cious volunteer submits bad results to a server, this may in-validate all other results. For example, it has been reportedthat SETI@Home suffered from the malicious behavior bysome of its volunteers who faked the number of tasks com-pleted. Other volunteers actually faked their results by usingdifferent or modified client software [2, 10]. Consequently,DGSs should be equipped with a sabotage-tolerance mech-anism to protect them from intentional attacks by maliciousvolunteers [22, 23].
In previous studies, the verification of work resultswas accomplished by voting- and trust-based mecha-nisms. In the voting-based sabotage-tolerance (VST)mechanisms [14], when a task is distributed in paral-lel to n volunteers, k or more of these volunteers where k≤ n should have the same result to guarantee result ver-ification for the task. This mechanism is often calledthe k-out-of-n system. In DGSs, it can be assumed thatall n volunteers are stochastically identical and func-tionally independent. This mechanism is simple and
194 Int'l Conf. Grid Computing and Applications | GCA'08 |

straightforward, but it is inefficient because it wastes re-sources. On the other hand, trust-based sabotage-tolerance(TST) mechanisms [3, 4, 7, 9, 21] have a lower redun-dancy for result verification than voting mechanisms.Instead, a lightweight task for which the correct result is al-ready known is distributed periodically to volunteers. Inthis way, a server can obtain the trust value of each vol-unteer by counting how many lightweight tasks arereturned correctly. This trust value is used as a key fac-tor in the scheduling phase. However, these mechanismsare based on first-come first-serve (FCFS) schedul-ing, which typically allocates tasks to resources whenthe resources become available, without any considera-tion of the applications whose task should be completedbefore a certain deadline. From the viewpoint of result ver-ification, FCFS scheduling results in a high turnaroundtime because it cannot cope effectively with dynamic en-vironments, such as volunteers leaving or joining the sys-tem due to interference with other priorities and hardwarefailures. If a task is allocated to a volunteer with high dy-namicity, then it is susceptive to failure. Thus, it should bereallocated to other volunteers. As a result, this leads to in-creasing the turnaround time of the task. Furthermore, if atask must be completed within a specific time (i.e. a dead-line), then its turnaround time will be high.
To provide DGSs with result verification to support taskdeadlines, this paper proposes Fuzzy-based Adaptive Repli-cation Mechanism (FARM) for sabotage-tolerance based onthe trusty and the result-return probability of volunteers.The FARM provides a mechanism for combining the ben-efits of the voting-based mechanism with the trust-basedmechanism. First, we devised autonomous sampling withmo-bile agents to evaluate the trusty and result-return prob-ability of each volunteer. In this scheme, volunteers re-ceive a sample whose result is already known. The resultcomputed by a volunteer is compared to the original re-sult of the sample to estimate the volunteer’s trusty. In ad-dition, the volunteer’s result-return probability is calculatedbased on the availability and performance of the volunteer.These trusty and result-return probability values are usedto fuzzy sets through fuzzy inference process. The char-acteristic function of the fuzzy set is allowed to have val-ues between 0 and 1, which denotes the degree of mem-bership of an element in a given set. For the transforma-tion from requirements (i.e. correctness and deadline) of anapplication to fuzzy set, we provide the empirical member-ship functions. In this paper, fuzzy inference process is todetermine the replication number through the trust proba-bility and result-return probability of each volunteer. In ad-dition, simulation results show that our mechanism can re-duce the turnaround time compared with the voting-basedmechanism and trust-based mechanism. The FARM is alsosuperior to the other two mechanisms in terms of the effi-
Figure 1. Desktop grid environments.
cient use of resources.The rest of this paper is organized as follows. In Sec-
tion 2, we represent the desktop grid environment. Section3 describes fuzzy-based adaptive replication mechanism forsabotage-tolerance with deadline tasks. In Section 4, werepresent implementation and performance evaluation. Fi-nally, our conclusions are given in Section 5.
2. Desktop Grid Environment
Figure 1 shows the overall architecture of our DGSmodel. As shown in Fig. 1, our DGS model consists ofclients, an application management server, a storage server,coordinators, and volunteers. A client submits its own ap-plication to an application management server. A coordina-tor looks after scheduling, computation group management,and agent management. A volunteer is a resource providerthat contributes its own resources to process large-scale ap-plications during CPU idle time. In this model, volunteersand a coordinator are organized into computation group asthe unit of scheduling. In this group, the coordinator reor-ganizes work groups as the unit of executing a task accord-ing to properties of each volunteer when the coordinator’sscheduler allocates tasks to the volunteers.
Our DGS includes several phases:
1. Registration Phase: Volunteers register their static in-formation (e.g., CPU speed, memory capacity, OStype, etc.) with the application management server.The application management server then sends this in-formation to coordinators.
2. Job Submission Phase: A client submits a large-scaleapplication to the application management server.
3. Task Allocation Phase: The application managementserver splits the application into a set of tasks and allo-cates them to coordinators.
Int'l Conf. Grid Computing and Applications | GCA'08 | 195

4. Load Balancing Phase: Each coordinator inspects thenumber of tasks in its task pool and balances the load,either periodically or on demand, by transferring sometasks to other coordinators.
5. Adaptive Scheduling Phase: Each coordinator assignstasks in its task pool according to the properties ofavailable resources using fuzzy inference process.
6. Result Collection Phase: Each coordinator collects re-sults from volunteers and performs result verification.
7. Job Completion Phase: Each coordinator returns aset of correct results to the application managementserver.
The application submitted by a client is divided into a se-quence of batches, each of which consists of mutually inde-pendent tasks in the set W = {w1, w2, ..., wn} where n isthe total number of tasks. This type of application is knownas the single program multiple data (SPMD) model, whichuses the same code for different data. It has been used as thetypical application model in most DGSs, and thus we usedan SPMD-type application in the present study.
3. Fuzzy-based Adaptive Replication
This section describes fuzzy-based adaptive replicationmechanism (FARM) for sabotage-tolerance in applicationswith specific deadlines.
3.1. System Model
We assume that application has been divided into tasksand each task has independent property, and the tasks haveto be returned within a deadline. Our FARM determinescorrectness based on a volunteer’s trust probability (TP). Italso uses a result-return probability (RP) based on availabil-ity and dynamic information, such as current CPU perfor-mance, to estimate a volunteer’s ability to complete a taskwithin a certain deadline. In the FARM, the scheduler letstasks to execute in volunteers with high TP and high RP inhigh priority. For volunteers with low TP and low RP, thescheduler applies replication policy to the tasks accordingto fuzzy inference process.
In the desktop grid computing environment, over-all system performance is influenced by the dynamic na-ture of volunteers [12]. In order to classify volunteersinto fuzzy sets according to the dynamic nature of volun-teers, we represent a fuzzy inference process based on TPand RP. First of all, both TP and RP are defined as Ta-ble 1:
Trust Probability (TP). The TP is a factor determined
by the correctness of the computation results exe-cuted by a volunteer. The trusty value of the ith volunteerTPi is
TPi ={
1− fn , if n > 0
1− f, if n = 0(1)
In Eq. (1), TPi represents the trusty value of a volun-teer vi, n is the number of correct results returned in oursampling scheme, and f is the probability that a volun-teer chosen at random returns incorrect results.
Result-return Probability (RP). The RP is the proba-bility that a volunteer will complete a task within a giventime under a computation failure.
In a desktop grid environment, the task completion ratedepends on both the availability and the performance (e.g.,the number of floating point operations per second) of in-dividual volunteers [12]. Therefore, we have defined RP asthe probability that a volunteer will return a result beforea specified deadline under computation failure. The aver-age completion time ACTi of each volunteer is calculatedby
ACTi =∑
γk
K(2)
where γi represents the completion time of the kth sampleand K is the number of samples completed by volunteer i.
To determine the time taken by a volunteer to perform atask through sampling by an agent, we define the estimationtime ETi of each volunteer as follows:
ETi = µ · t (3)
where µ represents the number of floating point operationsfor a sample by a dedicated volunteer, and t is the time re-quired by that dedicated volunteer to execute one floatingpoint operation. Using Eq. (3), we can estimate the comple-tion time without computation failure for volunteer vi.
Then, the average failure ratio AFRi of volunteer i canbe calculated using eqs. (2) and (3).
AFRi = 1− ETi
ACTi(4)
If the time taken to complete a task by volunteer i fol-lows an exponential distribution with average AFRi, thenthe probability of volunteer i completing task j before thedeadline dj is calculated as follows:
RPi(D ≤ dj) =∫ d
0
AFRie−AFRidj =1− e−AFRidj
(5)
196 Int'l Conf. Grid Computing and Applications | GCA'08 |

Parameters DescriptionTP (Trust Probability) The TP is a factor determining robustness for the computation
result executed by a volunteer.ACT (Average Completion Time) The ACT denotes an average completion time which means
the ratio of mean completion time of samples to the number ofsamples completed by the volunteer.
ET (Estimation Time) The ET means an estimation time which means multiplicationthe number of floating point operations for the computing timeof a float point operation.
AFR (Average Failure Ratio) The AFR denotes an average failure ratio which is calculatedas ET for ACT.
RP(Result-return Probability) The RT is the probability that a volunteer will complete a taskwithin a given time under a computation failure.
RD (replication degree) The RT is the probability that a volunteer will complete a taskwithin a given time under a computation failure.
Table 1. Parameters.
where D represents the actual computation time of the vol-unteer.
3.2. Fuzzy Inference Process
A fuzzy set expresses the degree to which an elementbelongs to a set. The characteristic function of a fuzzy setis allowed to have values between 0 and 1, which denotesthe degree of membership of an element in a given set. Forthe transformation from requirements (i.e. correctness anddeadline) of an application to fuzzy set, we provide the em-pirical membership functions in Figure 2. In Fig. 2(a), afuzzy set for trust probability are determined to group ac-cording to trust range [0, 1] of a volunteer. If the TP valueof a volunteer approaches 0, the volunteer has nearly mali-cious behavior, and 1 denotes fully trusted resource. In Fig2(b), as a fuzzy set for result-return probability, this figureshows membership function for five level of RPi. If RP isnearly 0, the volunteers are extremely return a result withina given time. Contrary, RP is almost 1, it will return a re-sult within a deadline.
In this paper, fuzzy inference process is to deter-mine the replication number of each volunteer through theTPi and RPi. These two parameters can be calculatedfuzzy rule with replication degree in order to return cor-rect results within a given time. We set up the RDi in therange [1, 5] according to our previous experiences. We de-termined 5 as the maximum number of replicas because thenumber of replicas becomes larger than 5 when we con-ducted an experiments for the past one month. As shownin figure 3, we can infer fuzzy set from each volun-teer’ replication degree (RD), which represents the numberof redundancy. In here, each set represents computa-
tional redundancy. For example, volunteers belonging tothe medium set are executed with three redundancy of theset for a task. This set is determined according to fuzzy in-ference rules that are given in the follows:
RULE 1: IF TPi is very high and RPi is very high,THEN RDi is very good.RULE 2: IF TPi is high and RPi is high, THEN RDi isgood....
The fuzzy inference rules determine the number of re-dundancy to make use of the TP and the RP in order to guar-antee correctness and complete within a given deadline. Inthe grid system, membership function and rules should bechosen according to application requirement and user re-quirement.
4. Simulation and Performance Evaluation
In this section, we evaluate the performance of ourFARM. To show an efficiency of the mechanism, we ana-lyze our mechanism in terms of correctness and turnaroundtime, and compare the performance of our mechanism withthat of both VST and TST mechanisms.
4.1. Distribution of Volunteers
In the performance evaluation, we obtained the distribu-tion shown in Fig. 4 from the log data of each volunteerfor one week in Korea@Home DGS. In this figure, the trustprobability on the x-axis is the probability of correct resultsreturned by each volunteer to the coordinator through au-tonomous sampling. The y-axis represents the result-return
Int'l Conf. Grid Computing and Applications | GCA'08 | 197

0.2
0.4
0.6
0.8
1
0
0 0.2 0.4 0.6 0.8 1
very low low medium high very high
TPi
�(TPi)
(a) Membership function for five levels of TPi
0.2
0.4
0.6
0.8
1
0
0 0.2 0.4 0.6 0.8 1
very low low medium high very high
RPi
�(RPi)
(b) Membership function for five levels of RPi
Figure 2. Membership functions for different levels of TPi and RPi
0.0 0.2 0.4 0.6 0.8 1.00.0
0.2
0.4
0.6
0.8
1.0
VERY GOOD
GOOD
MEDIUM
BAD
VERY BAD
Figure 4. Volunteer distribution according to result-return probability and trust probability. This fig-ure shows each fuzzy set according to fuzzy inference process.
probability, which is the probability of the returning the re-sult before a deadline. The boxes in Fig. 4 represent fuzzyset, which is redundancy group of volunteers determined bythe fuzzy rule (refer to the fuzzy inference process in Sec-tion 3). As shown in this figure, the volunteers were classi-fied into fuzzy set as five types: very good, good, medium,bad, and very bad.
4.2. Comparison of Result Verification Mecha-nisms
We have compared our FARM with the other result veri-fication mechanisms (VST and TST). For VST mechanism,we used five replicas per a task in a work group. In TSTmechanism, a volunteer used the randomly selected task onbasis of its trust set. For this comparison, turnaround timeand resource utilization were measured by different num-bers of tasks.
Figure 5(a) shows the resource utilization of three resultverification mechanisms. In this figure, we can observe that
198 Int'l Conf. Grid Computing and Applications | GCA'08 |

10 100 1000
0
500
1000
1500
2000
2500
3000
3500
4000
(a) resource utilization
10 100 1000
0
5000
10000
15000
20000
(b) turnaround time
Figure 5. Comparison of result verification mechanisms
0.2
0.4
0.6
0.8
1
0
1 2 3 4 5
very good good medium bad very bad
RDi
�(RDi)
Figure 3. Membership function for differentlevels of RDi.
our FARM reduces slightly compared with the TST, and itis far more efficiently than the VST. This means that ourmechanism reduce the reallocation cost for the work be-cause it selects resources having high RP and TP in com-putation group. As a result, the FARM has made remark-able progress for the resource utilization compared with theVST and TST mechanisms.
Meanwhile, Figure 5(b) shows the turnaround time ofthree result verification mechanisms. In this figure, we ob-serve that as the number of tasks increases, the turnaroundtime becomes slower. This is not surprised, because theVST and TST mechanisms are not considered list schedul-ing method based on various factors such as result-returnprobability and trust probability. However, our FARM hasthe fastest turnaround time among the other two mech-anisms. This has been expected, as the scheduler in our
FARM allocates a task to the resources to be completedwithin a given deadline. As described previous, the othermechanisms do not essentially consider the deadline inthe phase of resource selection. Accordingly, the results ofsome tasks may be not returned within the deadline, andthus such the tasks should be reallocated to other resources.That results in an increment of turnaround time.
From the results of Fig. 5, we can see that our FARM hasfast turnaround time than the other result verification mech-anism, with relatively low resource redundancy.
5. Conclusion and Future Work
We have proposed the fuzzy-based adaptive replicationmechanism that supports sabotage-tolerance with deadlinetasks in desktop grid systems. In the mechanism, the con-cept of replication groups was introduced to deal with thedynamic nature of volunteers in the phase of result verifica-tion. As a criterion to organize replication groups, result-return probability and trust probability were used. Basedon fuzzy inference process, five fuzzy sets were presented,which can employ differently according to volatility andtrusty of the volunteers. Using these concepts, our resultverification mechanism can guarantee tasks to return cor-rect work results within a deadline.
Performance results are evaluated through simulation theperformance of our FARM, VST and TST mechanisms,from the viewpoints of turnaround time and resource uti-lization. The results showed that our FARM is superior toother two ones in terms of turnaround time, with relativelylow resource redundancy.
Int'l Conf. Grid Computing and Applications | GCA'08 | 199

Acknowledgment
This work was supported by the Korea Research Founda-tion Grant funded by the Korean Government (MOEHRD,Basic Research Promotion Fund)
References
[1] M. O. Neary and P. Cappello, ”Advanced Eager Schedul-ing for Java Based Adaptively Parallel Computing,” Concur-rency and Computation: Practice and Experience, Vol. 17,Iss. 7-8, pp. 797-819, Feb. 2005.
[2] D. Molnar, The SETI@home Problem,http://turing.acm.org/crossroads/columns/onpatrol/ septem-ber2000.html
[3] L. Sarmenta, ”Sabotage-Tolerance Mechanism for VolunteerComputing Systems,” Future Generation Computer Systems,Vol. 18, No. 4, pp. 561-572, Mar. 2002.
[4] C. Germain-Renaud and N. Playez, ”Result Checking inGlobal Computing Systems,” Proc. of the 17th Annual Int.Conf. on Supercomputing, pp. 226-233, June 2003.
[5] C. Germain, G. Fedak, V. Neri, and F. Cappello, ”GlobalComputing Systems,” Lecture Notes in Computer Science,Vol. 2179, pp. 218-227, 2001.
[6] Korea@Home homepage, ”http://www.koreaathome.org/eng”.[7] F. Azzedin and M. Maheswaran, ”A Trust Brokering Sys-
tem and Its Application to Resource Management in Public-Resource Grids,” Proc. of the 18th Int. Parallel and Dis-tributed Processing Symposium, pp. 22-31, April 2004.
[8] W. Du, J. Jia, M. Mangal, and M. Murugesan, ”UncheatableGrid Computing,” Proc. of the 24th Int. Conf. on DistributedComputing Systems, pp. 4-11, 2004.
[9] S. Zhao, V. Lo, and C. G. Dickey, ”Result Verification andTrust-Based Scheduling in Peer-to-Peer Grids,” Proc. of the5th IEEE Int. Conf. on Peer-to-Peer Computing, pp 31-38,Sept. 2005.
[10] SETI@Home homepage, ”http://setiathome.ssl.berkeley.edu”.[11] S. Choi, M. Baik, H. Kim, E. Byun, and C. Hwang, ”Re-
liable Asynchronous Message Delivery for Mobile Agent,”IEEE Internet Computing, Vol. 10, Iss. 6, pp. 16-25, Dec.2006.
[12] D. Kondo, M. Taufer, C. L. Brooks, H. Casanova, and A.Chien, ”Characterizing and Evaluating Desktop Grids: AnEmpirical Study,” Proc. of the 18th Int. Parallel and Dis-tributed Processing Symposium, pp. 26-35, April 2004.
[13] J. Dongarra, ”Performance of various computers using stan-dard linear equations software,” ACM SIGARCH ComputerArchitecture News, Vol. 20 , pp. 22-44, June 1992.
[14] M. Castro and B. Liskov. ”Practical Byzantine Fault Toler-ance,” Proc. of Symposium on Perating Systems Design andImplementation, pp. 173-186, Feb. 1999.
[15] D. P. Anderson, ”BOINC: A System for Public-ResourceComputing and Storage,” Proc. of 5th IEEE/ACM Int. Work-shop on Grid Computing, pp. 4-10, Nov. 2004.
[16] distributed.net homepage, ”http://www.distributed.net”.[17] Entropia homepage, ”http://www.entropia.com”.
[18] L. F. G. Sarmenta and S. Hirano. ”Bayanihan: Building andStudying Volunteer Computing Systems Using Java,” FutureGeneration Computer Systems, Vol. 15, Issue 5/6, pp. 675-686, Oct. 1999.
[19] O. Lodygensky, G. Fedak, F. Cappello, V. Neri, M. Livny, D.Thain, ”XtremWeb & Condor : sharing resources betweenInternet connected Condor pool,” Proc. of 3rd IEEE/ACMInt. Symposium on Cluster Computing and the Grid: Work-shop on Global and Peer-to-Peer Computing on Large ScaleDistributed Systems, pp. 382-389, May 2003.
[20] A. Baratloo, M. Karaul, Z. Kedem, and P. Wijckoff, ”Char-lotte: Metacomputing on the Web,” Future Generation Com-puter Systems, Vol. 15, Issue 5-6, pp.559-570, Oct. 1999.
[21] J. Sonnek, M. Nathan, A. Chandra and J. Weissman,”Reputation-Based Scheduling on Unreliable Distributed In-frastructures,” Proc. of the 26th International Conference onDistributed Computing Systems (ICDCS’06), pp. 30, July2006.
[22] D. Kondo, F. Araujo, P. Malecot, P. Domingues, L. M. Silva,G. Fedak, and F. Cappello, ”Characterizing Result Errors inInternet Desktop Grids,” Lecture Notes in Computer Science,Vol. 4641, pp. 361-371, Aug. 2007.
[23] M. Taufer, D. Anderson, P. Cicotti, and C. L. Brooks III,”Homogeneous Redundancy: a Technique to Ensure In-tegrity of Molecular Simulation Results Using Public Com-puting,” 19th IEEE Int. Parallel and Distributed ProcessingSymposium - Workshop 1, pp. 119a, April 2005.
200 Int'l Conf. Grid Computing and Applications | GCA'08 |

Implementation of a Grid Performance Analysis and Tuning Framework using Jade Technology
Ajanta De Sarkar , Dibyajyoti Ghosh
, Rupam Mukhopadhyay
and Nandini Mukherjee
Department of Computer Science and Engineering, Jadavpur University, Kolkata 700 032, West Bengal, India.
Abstract – The primary objective in a Computational Grid
environment is to maintain performance-related Quality of
Services (QoS) at the time of executing the jobs. For this
purpose, it is required to adapt to the changing resource
usage scenario based on analysis of real time performance
data. The objectives of this paper are (i) to present a
framework for performance analysis and adaptive execution
of jobs, (ii) to focus on the object-oriented implementation
of a part of the framework and (iii) to demonstrate the
effectiveness of the framework by carrying out some
experiments. The framework deploys autonomous agents,
each of which can carry out their responsibilities
independently.
Keywords: Grid, hierarchical agent framework, performance
properties, Jade technology.
1 Introduction
Performance monitoring of any application in Grid is
always complex, different and challenging. In the absence of
precise knowledge about the availability of resources at any
point of time and due to the dynamic resource usage
scenario, prediction-based analysis is not possible. Thus,
performance analysis in Grid must be characterized by
dynamic data collection (as performance problems must be
identified during run-time), data reduction (as the amount of
monitoring data is large), low-cost data capturing (as
overhead due to instrumentation and profiling may
contribute to the application performance), and adaptability
to heterogeneous environment.
In order to address the above issues, a hierarchical agent
framework has already been proposed in [3] and [4]. The
novelty of the framework is that it considers execution
performances of multiple jobs (possibly components of an
application or multiple applications) running concurrently in
Grid and aims at maintaining the overall performance of
these jobs at a predefined QoS level. Moreover, unlike other
traditional Grid performance monitoring systems, this
framework support adaptation of the jobs to the changing
resource usage scenarios either by enabling local tuning
actions or migrating them onto a different resource provider
(host). This paper refines the design of the framework
presented in [3] and [4] and uses the concept of performance
properties that have been introduced in [5].
The paper also presents an object-oriented implementation
of a part of the agent framework. Implementation has been
done using Jade framework. Jade agents can be active at
same time on different nodes in Grid and they can interact
with each other without incurring much overhead in real
time. The current implementation of the agent framework
deals with parallel Java programs written in JOMP 1.
Organization of this paper is as follows. Related work is
discussed in Section 2. The hierarchical organization of
analysis agents is briefed in Section 3. The concepts related
to performance properties and their relevance in the current
work are discussed in Section 4. Severity computation for
each property is introduced in Section 5. Section 6 presents
Jade framework-based implementation of a part of the agent-
based system. Section 7 and Section 8 give details of the
experimental setup and results. Section 9 concludes with a
direction of the future work.
2 Related Work
Grid performance tools, such as SCALEA-G [15] and
ASKALON [16] are usually based on the Grid Monitoring
Architecture (GMA). GMA provides an infrastructure based
on OGSA and supports performance analysis of a variety of
Grid services including computational resources, networks,
and applications. Performance tools associated with ICENI
[7] and GrADS [9] also focus on performance monitoring of
the applications running in Grid environment. The ICENI
project highlights a component framework, in which
performance models are used to improve the scheduling
decisions. The GrADS project focuses on building a
framework for both preparing and executing applications in
Grid environment [10]. Each application has an application
manager, which monitors the performance of that application
for QoS achievement. GrADS monitors resources using
NWS [17] and uses Autopilot for performance prediction
[12].
Unlike the previous systems, our work takes into account a
situation where multiple jobs are executing concurrently on
different resource providers. Overall performance of all these
jobs needs to be considered and monitored in order to
maintain a predefined QoS level. Thus, we use a hierarchical
agent structure, which is comparable to that of the Peridot
project [6]. Although, unlike the framework in Peridot, here
1 JOMP implements an OpenMP-like set of directives and
library routines for shared memory parallel programming in
Java.
Int'l Conf. Grid Computing and Applications | GCA'08 | 201

different categories of Analysis Agents (with various sub
goals) are used. Moreover, if performance degrades, a
suffered job is locally tuned (or migrated) in order to achieve
the QoS level.
3 Hierarchical Organizations of
Analysis Agents
The hierarchical agent framework is part of a multi-agent
system [14], which supports performance-based resource
management for multiple concurrent jobs executing in Grid
environment. Within the system, a group of interacting,
autonomous agents work together towards a common goal.
Altogether six types of agents are used, these are: Broker
Agent, ResourceProvider Agent, JobController Agent,
JobExecutionManager Agent, Analysis Agent, and Tuning
Agent. The functions of these agents and the interactions
among them have been thoroughly discussed in [14]. This
work deals with the last three agents, namely
JobExecutionManager Agent, Analysis Agent, and Tuning
Agent.
As envisaged in [11], Grid may be considered to have a
hierarchical structure with different types of Grid resources
like clusters, SMPs and even workstations of dissimilar
configurations positioned at its lowest level. All of these are
tied together through a middleware layer. A Grid site
comprises a collection of all these local resources, which are
geographically located in a single site. All these Grid sites,
which mutually agree to share resources located in several
sites, form an enterprise Grid. Enterprise Grid provides
support for multiple Grid resource registries and Grid
security services through mutually distrustful administrative
domains. In order to monitor the Grid at all these different
levels (which is necessary for overall monitoring and
execution planning of multiple concurrent jobs), a
hierarchical organization of the Analysis Agents is proposed.
Existing architectures (including GMA) do not extend
support for such hierarchical organization. However, in our
work, we make use of multiple Analysis Agents and organize
them in a hierarchy. Each Analysis Agent at its own level of
deployment, however, resembles with the consumer in
GMA, while the JobExecutionManager Agent (JEM Agent)
is the producer of the events in which the Analysis Agents
are interested.
In accordance with the above understanding, the Analysis
Agents are divided into the following four logical levels of
deployment in descending order: (1) Grid Agent (GA), (2)
Grid Site Agent (GSA), (3) Resource Agent (RA) and (4)
Node Agent (NA). At the four levels of agent hierarchy each
agent has some specific responsibilities [3]. A block diagram
presenting all the agents is shown in Figure 1. Among all the
agents at different levels, the current work concentrates on
the lowest level agents of the hierarchy, i.e. on Node Agents
(NAs) and the Tuning Agents (TAs).
4 Performance Properties and Agents
The main focus of our work is to capture the runtime
behaviour of a job and modify its behaviour during execution
so that the QoS requirement of the job as laid down in the
SLA is met. Design of an NA and TA therefore depends on
the concepts related to performance properties, which have
been thoroughly discussed in [5]. A performance property
characterizes specific performance behaviour of a program
and can be checked by a set of conditions. Every
performance property is associated with a severity figure,
which shows how important the performance property is in
the context of the performance of an application. When the
severity figure crosses a pre-defined threshold value, the
property becomes a performance problem and the
performance property with highest severity value is
considered to be a performance bottleneck.
Figure 1: Block diagram of Agents
In our system, the resource provider publishes the policies
and defines the specific performance properties to be
checked for detecting any kind of performance bottleneck at
the time of execution of a job. For each performance
property, the evaluation process is also defined and stored
for later use by the NA. In addition to the OpenMP
properties described in [5], we have defined a new
performance property, namely Inadequate Resources. This
property identifies the problem related to execution of a
portion of job sequentially (or on less number of processors)
when additional number of processors is required in order to
maintain the QoS.
An NA monitors all the jobs running on a particular resource
provider (an SMP or workstation). When execution of a job
starts, NA begins collecting monitoring data. On the basis of
this data and the performance property specifications (define
the condition, confidence and severity for each property), it
evaluates the severities of specified performance properties
(using the process specifications) and generates Performance
Details Report (Figure 2). In order to evaluate the severity of
each performance property, the NA consults the SLA and the
JobMetaData (discussed later) sent by the client.
202 Int'l Conf. Grid Computing and Applications | GCA'08 |
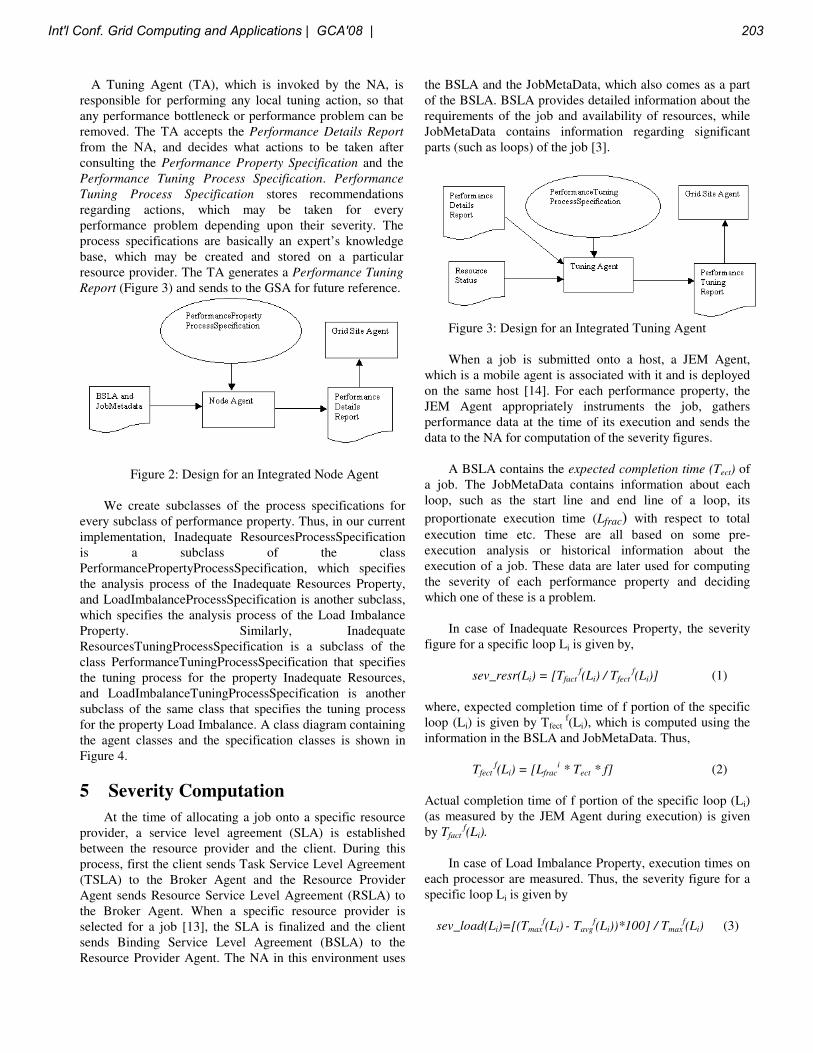
A Tuning Agent (TA), which is invoked by the NA, is
responsible for performing any local tuning action, so that
any performance bottleneck or performance problem can be
removed. The TA accepts the Performance Details Report
from the NA, and decides what actions to be taken after
consulting the Performance Property Specification and the
Performance Tuning Process Specification. Performance
Tuning Process Specification stores recommendations
regarding actions, which may be taken for every
performance problem depending upon their severity. The
process specifications are basically an expert’s knowledge
base, which may be created and stored on a particular
resource provider. The TA generates a Performance Tuning
Report (Figure 3) and sends to the GSA for future reference.
Figure 2: Design for an Integrated Node Agent
We create subclasses of the process specifications for
every subclass of performance property. Thus, in our current
implementation, Inadequate ResourcesProcessSpecification
is a subclass of the class
PerformancePropertyProcessSpecification, which specifies
the analysis process of the Inadequate Resources Property,
and LoadImbalanceProcessSpecification is another subclass,
which specifies the analysis process of the Load Imbalance
Property. Similarly, Inadequate
ResourcesTuningProcessSpecification is a subclass of the
class PerformanceTuningProcessSpecification that specifies
the tuning process for the property Inadequate Resources,
and LoadImbalanceTuningProcessSpecification is another
subclass of the same class that specifies the tuning process
for the property Load Imbalance. A class diagram containing
the agent classes and the specification classes is shown in
Figure 4.
5 Severity Computation
At the time of allocating a job onto a specific resource
provider, a service level agreement (SLA) is established
between the resource provider and the client. During this
process, first the client sends Task Service Level Agreement
(TSLA) to the Broker Agent and the Resource Provider
Agent sends Resource Service Level Agreement (RSLA) to
the Broker Agent. When a specific resource provider is
selected for a job [13], the SLA is finalized and the client
sends Binding Service Level Agreement (BSLA) to the
Resource Provider Agent. The NA in this environment uses
the BSLA and the JobMetaData, which also comes as a part
of the BSLA. BSLA provides detailed information about the
requirements of the job and availability of resources, while
JobMetaData contains information regarding significant
parts (such as loops) of the job [3].
Figure 3: Design for an Integrated Tuning Agent
When a job is submitted onto a host, a JEM Agent,
which is a mobile agent is associated with it and is deployed
on the same host [14]. For each performance property, the
JEM Agent appropriately instruments the job, gathers
performance data at the time of its execution and sends the
data to the NA for computation of the severity figures.
A BSLA contains the expected completion time (Tect) of
a job. The JobMetaData contains information about each
loop, such as the start line and end line of a loop, its
proportionate execution time (Lfrac) with respect to total
execution time etc. These are all based on some pre-
execution analysis or historical information about the
execution of a job. These data are later used for computing
the severity of each performance property and deciding
which one of these is a problem.
In case of Inadequate Resources Property, the severity
figure for a specific loop Li is given by,
sev_resr(Li) = [Tfact f(Li) / Tfect
f(Li)] (1)
where, expected completion time of f portion of the specific
loop (Li) is given by Tfect f(Li), which is computed using the
information in the BSLA and JobMetaData. Thus,
Tfect f(Li) = [Lfrac
i * Tect * f] (2)
Actual completion time of f portion of the specific loop (Li)
(as measured by the JEM Agent during execution) is given
by Tfact f(Li).
In case of Load Imbalance Property, execution times on
each processor are measured. Thus, the severity figure for a
specific loop Li is given by
sev_load(Li)=[(Tmaxf(Li)
- Tavg
f(Li))*100] / Tmax
f(Li) (3)
Int'l Conf. Grid Computing and Applications | GCA'08 | 203

where, Tmaxf(Li) is the maximum time spent by a processor
while executing f portion of the loop and Tavgf(Li) is the
average taken over all the processors executing f portion of
the loop.
6 Jade Implementation of the Agents
The entire multi-agent framework [14] has been
implemented using Java RMI technology. A part of our
hierarchical analysis agent framework has been implemented
using Jade framework [1]. Jade is a Java Agent Development
Environment, built with Java RMI registry facilities. It
provides standard agent technologies. The agent platform
can be distributed on several hosts; each one of them
executes one Java Virtual Machine. Jade follows FIPA
standard, thus its agent communication platform is FIPA-
compliant. It uses Agent Communication Language (ACL)
for efficient communication in distributed environment. Jade
framework supports agent's mobility and agents can execute
independently and parallelly on different network hosts.
Jade uses one thread per agent. Agent tasks or agent
interactions are implemented through the logical execution
threads. These threads or behaviors of the agents can be
initialized, suspended and spawned at any given time.
In Jade, multiple agents can interact with each other
using their own containers [1]. Containers are the actual
environments for each agent. Typically multiple agents can
be active at same time on different nodes with various
containers. But there is only one central agent, and it needs
to start first. In our implementation, the NA is first initiated
as central agent, which coordinates with other agents. In a
Grid environment, it is important that the performance
analysis be done at run-time and tuning action is taken at
run-time without incurring much overhead. Thus, the active
Jade agents on a Grid resource cooperate with each other and
interact in order to detect performance problems in real time.
Initially, performance properties that will be checked by the
NA and priority of checking these properties are decided on
the basis of the nature of a job and kind of a resource
provider. A job is instrumented depending on the types of
data the Analysis Agent requires to collect. As soon as the
job starts its execution, JEM Agent communicates with the
corresponding NA sitting at that particular node.
NA receives the BSLA and the JobMetaData from the JEM
Agent along with a ‘Ready’ message. It then sends a ‘Query’
message to the JEM Agent with a fraction value (e.g. 0.05)
indicating the portion of a significant block of the job (in the
current implementation, a significant loop) to be executed
before collecting any performance data. The job starts and
continues its execution up to the specified percentage or
fraction of the significant block. After completing this
portion, JEM Agent sends execution performance data to the
NA and suspends the job.
Figure 4: Class Diagram for Node Agent and Tuning Agent
NA immediately starts analyzing the data on the basis of the
commitment included in BSLA. While doing this, the NA
computes severity of a specific performance property. If the
computed severity is greater than some threshold value, NA
sends a ‘Warning’ message to the JEM Agent and invokes
TA. NA also sends ‘Performance_Details’ message (XML
form of Performance Details Report) to TA mentioning the
identified performance problem and its severity along with
other details. TA decides a tuning action and directs the JEM
Agent to resume the job after applying the tuning action. If
no performance problem is detected by the NA, the job
resumes and continues its execution. The next performance
property (according to the priority list) is checked after
continuing execution for another fraction of the significant
block and collecting data as before.
It is often possible that multiple jobs are executing on the
same host (particularly on an SMP system). Consequently
multiple JEM Agents are associated with these jobs,
although there is only one NA. Nevertheless, in our system
communication between all the JEM Agents and the sole NA
may continue until the NA starts analysis of data for a
particular job. Since a job remains suspended during the
analysis, it is desirable that the analysis time remains as less
as possible. So the NA does not entertain any communication
during this time. Communication starts again when the
analysis is over. Interactions among the agents during
analysis and local tuning process are depicted in the
sequence diagram in Figure 5.
204 Int'l Conf. Grid Computing and Applications | GCA'08 |

In the current implementation, we have implemented the
specifications, computations and tuning related to Inadequate
Resources Property and the Load Imbalance Property. The
next sections provide some experimental results
demonstrating the analysis and tuning these properties.
7 Experimental Setup
A local Grid test bed has been set up that consists of
heterogeneous nodes running in Linux. The computational
nodes of the test bed include HP NetServer LH 6000 with 2
processors, HP ProLiant ML570 G4 with 4 Intel core2 Duo
processors, Intel core2 Duo PCs and Intel Pentium-4 PCs.
The nodes communicate through a fast local area network.
The Grid test bed is built with Globus Toolkit 4.0 (GT4) [8].
The multi-agent system (which includes the hierarchical
analysis agent framework) is implemented on top of GT4.
The agents (NA, JEM Agent and TA) are deployed on every
node.
This paper demonstrates the results of local performance
tuning of multiple applications running on the same node.
Exclusively one NA is responsible for analyzing the
performance of multiple jobs submitted to the same node and
running simultaneously. Experiments have been carried out
on a HP ProLiant ML570 G4 with 4 Intel core2 Duo
processors (referred as HPserver) in the Grid environment.
We have used Java codes with JOMP [2] directives as test
codes, and executed them in Jade framework. When a
particular performance problem is identified by the NA, TA
decides to locally tune the code (if possible or otherwise to
migrate the code). Because we have considered only two
performance properties, the TA either provides additional
processors to execute the job (in order to overcome
Inadequate Resources performance problem) or changes the
scheduling strategy of the parallel regions of the job (in case
of Load Imbalance performance problem).
For example, if the job initially executes on p (>=1)
processors, performance enhancement may be achieved by
providing more processors (q>p) at run-time. TA decides
whether the job will continue either with p processors or with
additional processors q (>p) and resumes job after allocating
additional resources to the job.
8 Results
Two sets of experiments have been carried out. The first
set is for detecting Inadequate Resources performance
property and the second set is for detecting both Inadequate
Resources and Load Imbalance performance properties
according to a predefined order. The following two
subsections demonstrate the results of these experiments.
Figure 5: Agent Interaction
8.1 Detecting Inadequate Resources Property
In this case, we have experimented with two different
test codes. However, in order to demonstrate the
effectiveness of our system, we submitted multiple images of
the same code as separate jobs. The jobs have been initiated
at different times. Thus, two exepriments have been carried
out and each time two Matrix Multiplication jobs and two
Gauss Elimination have been executed. These jobs started at
different times; but major portions of them were executed
concurrently. Data sizes are different for different jobs (1000
and 2000 in Case I and 3000 and 4000 in Case II). In both
cases, experimental data were collected in the following
three scenarios. Scenario 1 occurs if the system continues
with the job as submitted by the client, scenario 2 occurs if
some tuning actions are taken at run-time (based on our
algorithm) and scenario 3 is the result of running the job in a
situation which best fits for a specific job and a specific
resource provider.
Scenario 1: Test codes execute on the HPserver with one
processor without any interaction with the NA and TA.
Scenario 2: Test codes execute initially on one processor and
interact with NA. After computing a certain fraction of the
significant loop (here 0.05), NA detects
InadequateResources performance problem and the TA tunes
each job to run (remaining part) on four processors of the
HPserver.
Scenario 3: Test code executes entirely on four processors of
the HPserver without interaction with NA and TA.
Figure 6 (a) and (b) compare the execution times of the
Matrix Multiplication test codes in the above three scenarios.
The results demonstrate that performances obtained in
Scenario 2 and Scenario 3 are almost same, which signify
Int'l Conf. Grid Computing and Applications | GCA'08 | 205

that the overhead for run-time analysis and tuning is nominal.
In case of Gauss Elimination, we obtained similar results.
Figure 7(a) and 7(b) show the overheads associated with
execution of all the four jobs (two Matrix Multiplications
and two Gauss Eliminations) in Scenario 2. The times
required for run-time analysis, tuning and communication
among the agents are measured and shown. These overheads
are negligible compared to the performance improvement of
the jobs even though when multiple jobs are running
concurrently on the same resource only one NA is
responsible for performance analysis of these jobs
Test Case I
050000
100000150000200000250000300000
1000 2000
jMM1 jMM2
Job w ith data size
Tim
e (
ms) scenario1
scenario2
scenario3
Figure 6(a): Performance Improvement for Test Case I
Test Case II
0500000
100000015000002000000250000030000003500000
3000 4000
jMM3 jMM4
Job with data size
Tim
e (
ms) scenario1
scenario2
scenario3
Figure 6(b): Performance Improvement for Test Case II
8.2 Periodic Measurements for Detection of
Properties
In this experiment, we demonstrate periodic measurements
of performance data and detection of more than one property
according to a given priority. Thus, when the job starts
executing, first f portion of its significant block is executed
and performance data related to a specific performance
property is gathered. If the performance problem occurs, the
TA takes a tuning action and resumes the job. After
executing the next f portion of the same block, again
performance data is collected and the second property is
checked. Again if a performance problem is detected, the TA
takes another tuning action. Thus, the job continues with
periodic measurements of performance data and tuning of the
job based on the analysis of these performance data.
A LU factorization job has been used for the purpose of
this experiment. Here the NA decides to check the
Inadequate Resources Property first and then the Load
Imbalance Property. The experiment has been carried out by
comparing the following three scenarios. As before, scenario
1 occurs if the system continues with the job as submitted by
the client, scenario 2 occurs if some tuning actions are taken
at run-time (based on our algorithm) and scenario 3 is the
result of running the job in a situation which best fits for a
specific job and a specific resource provider.
Test Case I
0% 50% 100%
1000
2000
1000
2000
jMM
1jM
M2
jGE
1jG
E2
Jo
b w
ith
data
siz
e
Time (ms)
5%, Proc=1
total overhead
95%, Proc=4
Figure 7(a): Overhead Calculation for Test Case I
Test Case II
0% 50% 100%
3000
4000
3000
4000
jMM
3jM
M4
jGE
3jG
E4
Jo
b w
ith
data
siz
e
Time (ms)
5%, Proc=1
Total Overhead
95%, Proc=4
Figure 7(b): Overhead Calculation for Test Case II
Scenario 1: Test code executes entirely on the HPserver with
one processor and static schedule strategy without any
interaction with the NA and TA.
Scenario 2: Test code executes initially on one processor,
static schedule. After computing a certain fraction of the
significant loop (here 0.05), NA detects
InadequateResources problem and the TA tunes the job to
run (remaining portion) on four processors of the HPserver.
After computing next 0.05 portion of the significant loop,
NA detects LoadImbalance problem and the TA tunes job to
run (remaining portion) on four processors of the HPserver
with dynamic scheduling strategy.
Scenario 3: Test code executes entirely on the HPserver with
four processor and dynamic schedule without any interaction
with the NA and TA.
The results of running the job in the above three scenarios
are depicted in Figure 8. It is clear from the figure that there
206 Int'l Conf. Grid Computing and Applications | GCA'08 |

is a significant improvement in scenario 2 compared to
scenario 1, although not much overhead has been incurred
(compared to scenario 3) for performance analysis and
tuning of the job.
Performance Improvement
01020304050
4000
6000
8000
1000
0
Datasize
Tim
e (
min
)
Scenario1
Scenario2
Scenario3
Figure 8: Performance Improvement of LU
9 Conclusion
In this paper, we have presented the design and object-
oriented specification for implementation of Node Agent in a
Hierarchical Analysis Agent framework for Grid
environment. This framework is actually used for
performance analysis of applications executing concurrently
on distributed systems (like Grid) and also for dynamically
improving their execution performances. This paper
highlights the interaction and exchange of information
among the agents for collecting data, analyzing and
improving the performance by application of local tuning
actions. It also discusses the implementation of some of
them. The results presented in this paper highlight the
effectiveness of the framework by demonstrating the
performance improvement through tuning and showing that
the agent control overheads are negligible even when
multiple jobs are submitted concurrently onto the same
resource. In future work we shall experiment in more
complex system. Also the future work will focus on
incorporating more categories of performance properties and
implementation of other analysis agents in the hierarchy.
10 References
[1] Bellifemine, F., Poggi, A. and Rimassa, G., “Developing
multi agent systems with a FIPA-compliant agent
framework”, in Software - Practice & Experience. V31: 103-
128.
[2] Bull J.M., M.E. Kambities, "JOMP - an OpenMP -like
interface for java", Proceedings of the ACM2000 Java
Grande Conference, pp. 44-53, June 2000.
[3] De Sarkar A., S. Kundu and N. Mukherjee, “A
Hierarchical Agent framework for Tuning Application
Performance in Grid Environment” in the Proceedings of the
2nd
IEEE APSCC 2007, Tsukuba, Japan, December 11-14,
2007, pp. 296-303.
[4] De Sarkar A., S. Roy, S. Biswas and N. Mukherjee, “An
Integrated Framework for Performance Analysis and Tuning
in Grid Environment” in Web Proceedings of the
International Conference on High Performance Computing
(HiPC ’06), December 2006.
[5] Fahringer, T., Gerndt, M., Riley, G.D., and Traiff, J. L.,
“Formalizing OpenMP Performance Properties with ASL”,
In Proceedings of the Third International Symposium on
High Performance Computing (October 16-18, 2000),
ISHPC, pp. 428-439.
[6] Furlinger K., “Scalable Automated Online Performance
Analysis of Applications using Performance Properties”,
Ph.D. Thesis, 2006 in Technical University of Munich,
Germany.
[7] Furmento N., A. Mayer, S. McGough, S. Newhouse, T.
field, and J. Darlington, “ICENI: Optimization of
Component Applications within a Grid environment”,
Parallel Computing, 28(12): 1753-1772, 2002.
[8] Globus Toolkit 4.0 – available in
www.globus.org/toolkit.
[9] GrADS: Grid Application Development Software
Project, http://www.hipersoft.rice.edu/grads/.
[10] Kennedy K., et al, “Toward a Framework for Preparing
and Executing Adaptive Grid Programs”, Proceedings of the
International Parallel and Distributed Processing Symposium
Workshop (IPDPS NGS), IEEE Computer Society Press,
April 2002.
[11] Kesler J. Charles, “Overview of Grid Computing”,
MCNC, April 2003.
[12] Ribler R.L, H. Sinitchi, D. A. Reed, “The Autopilot
Performance-Directed Adaptive Control system”, Future
Generation Computer Systems 18(1), pp. 175-187,
September 2001.
[13] Roy S., M. Sarkar and N. Mukherjee – “Optimizing
Resource Allocation for Multiple Concurrent Jobs in Grid
Environment “, Accepted for publication, In Proceedings of
Third International Workshop on scheduling and Resource
Management for Parallel and Distributed systems, SRMPDS
’07, Hsinchu, Taiwan, December 5-7, 2007.
[14] Roy S., N. Mukherjee, “Utilizing Jini Features to
Implement a Multiagent Framework for Performance-based
Resource Allocation in Grid Environment” Proceedings of
GCA’06 – The 2006 International Conference on Grid
Computing and Applications, pp-52-58.
[15] Truong H.-L. , T. Fahringer, "SCALEA-G: A Unified
Monitoring and Performance Analysis System for the Grid",
Scientific Programming, 12(4): 225-237, IOS Press, 2004.
[16] Wieczorek M., R. Prodan and T. Fahringer, “Scheduling
of Scientific Workflows in the ASKALON Grid
Environment”, SIGMOD Record, Vol. 34, No. 3, September
2005.
[17] Wolski, R., N.T. Spring and J. Hayes, “The Network
Weather service: A distributed performance forecasting
service for metacomputing”, Future Generation Computer
Systems 15(5), pp. 757-768, October 1999.
Int'l Conf. Grid Computing and Applications | GCA'08 | 207
Optimizing Database Resources on the Grid
Prof. MSc. Celso Henrique Poderoso de Oliveira1, and Prof. Dr. Maurício Almeida Amaral2 1FIAP – Faculdade de Informática e Administração Paulista
Av. Lins de Vasconcelos, 1264 – Aclimação – São Paulo – SP 2CEETEPS – Centro Paula Souza
Rua dos Bandeirantes, 169 – Bom Retiro – São Paulo – SP [email protected], [email protected]
Abstract. Research and development activities relating to
Grid Computing are growing in the academic field and
have reached corporate organizations. Now it is possible to
join desktop computers in a grid environment, increasing
the processing and storage capability of application
systems. Although this has allowed progress in building
rapidly various aspects of Grid infrastructure, the
integration of different resources, including database, is
fundamental. The use of relational databases and the query
distribution among them are vital to develop consistent grid
applications. This paper shows the planning, distribution
and parallelization of database query on grid computing
and how one single complex query can optimize the use of
database resources.
Keywords: Database, Grid Computing, Query,
Distribution, OGSA-DAI
1 Introduction
One of the huge obstacles to use grid environment
outside the academic systems is because flat files are used
more than relational databases and there is a few middleware
that integrates these resources on the grid. Most corporate
organizations use relational or object-relational databases to
store and manage data.
This paper shows a research result that used an
algorithm to plan, distribute, and parallelize a SELECT
statement over database management system (DBMS) on the
grid. To achieve this goal, it was used the main middleware
that provides access to databases: Open Grid Services
Architecture - Data Access and Integration (OSGA-DAI).
OGSA-DAI receive the user request, and submit it to the
available database resources on the grid. The module created
intercepts the user request and before OGSA-DAI submit it,
it parses the complex query into simple ones. Then it asks
the available resources to OGSA-DAI and finally submits it
to the available databases. After the execution of each query,
the module join all results into a single response file. This
file is sent back to the user. The process is transparent to
end-user.
This paper is divided into four sections. The second
one shows the fundamentals of grid, plan and database. In
the third section is showed the results and finally in the last
section are listed the conclusions.
2 Grid, Plan and Database Fundamentals
Distributed processing is an important research area
because the evolution of components will not follow the
needs of data processing [3]. Distributed storage is
important as well, because of security reasons and the
amount of data to be stored.
Grid computing is part of distributed processing that
uses distributed resources, i.e. computers, storage, databases,
that can be integrated and shared as if it is a single
environment [4]. It uses a middleware that balance data and
processing load, provide security access and fail control.
The main aspects of a grid computing environment include
decentralization, resources and services heterogeneity. The
services and resources are used to provide data management
and processing through the network.
As resources are shared in a network, it is important
keep access control and management. A group of
organizations or people that share the same interests in a
controlled way is called Virtual Organization (VO). The VO
generally uses the resources to achieve a specific goal [4].
Databases are important resources to use and share in a
VO. Companies uses to store data in databases. Grid
middleware can identify, locate and submit queries to
databases even if it is local or remote. One of the most
important middleware used to manage database on the grid
is OGSA-DAI.
Watson [11] establishes a proposal to integrate
databases on the grid. Some acceptable parameters are: grid
and database independence, and the use of existing
databases instead of create a new one. Databases use some
of existing grid services and it is important to use the same
services [12]: security, database programming, web services
integration, scheduling, monitoring and metadata.
208 Int'l Conf. Grid Computing and Applications | GCA'08 |

2.1 Grid Database Services
Database services are grid services that use database
interface [5]. Open Grid Services Architecture (OGSA) grid
data service is a grid service that implements one or more
access or management interfaces to distributed resources [5].
A grid data service uses one of four basic interfaces to
control different behavior of a database. These interfaces use
specific Web Services Description Language (WSDL) ports
and when a service implements one of this interfaces it is
known as an Open Grid Services Infrastructure (OGSI) Web
Service.
Data Access and Integration Services (DAIS) group
works to define the key database services that should be
used on the grid. Data Access and Integration (DAI)
implements these definitions on OGSA. The main goal of
OGSA-DAI is to create an infrastructure to deploy high
quality grid database services [1].
2.2 Plan
A planning problem should have an initial state
description, a partial description goal and the tasks that map
the transition of the elements from one state to the other [6].
Some algorithms, simple or complexes, can be used to
achieve the goal of a plan. It is possible relate temporal
aspects, uncertainties, and optimization properties. Artificial
Intelligence is a planning problem that applies tasks in a
workflow and allocates resources in each task [2]. Each task
component is modeled as a planning operator whose effects
and preconditions shows input and output of data relation.
A partial order plan is created by, at least, two tasks in
a plan [9]. There is no importance in task execution order.
Sometimes there can be an order restriction if some data
must be used in the next step of the plan. But it does not
affect the task parallelization because the link between data
input and output is preserved. The huge advantage in using
this plan technique is that it is possible applies some basic
tasks that are independent between them. When the
independent tasks had finished, they are joined to return the
final result.
Heuristics can be used to determine the best execution
plan. In a VO there are some different heterogeneous and
limited resources that can be used. Some important decisive
factor to schedule database resources are: resource
utilization, response time, global and local access policy and
scalability [8].
In this paper, the planning operator will be the SQL
SELECT command. The planning will determine the submit
sequence of this command in different databases using a grid
database service. As the complex SQL SELECT command
is parsed into some simple queries, they can be submitted in
parallel.
3 Results
The goal was to create a service that should make an
execution plan to select available relational databases on the
grid and submit queries based on SELECT command.
OGSA-DAI middleware was chosen because it is the most
used one. It is installed on Globus Toolkit. The proposal was
to develop a grid data service to be used on a virtual
organization. The developed service uses recent techniques
to extract and heuristics to solve query planning problems.
The metrics used to define the heuristics in a database
management system were: CPU, available memory, network
bandwidth, and I/O volume of stored data. These data were
extracted from the databases metadata.
Most databases can parallelize and distribute queries.
But it is done on the same environment and using the same
product. When they use different databases, there are a lot of
limitations that must be followed. Cluster databases can do
the same job, but it is centralized and supervised by one
single control center. Grid Computing aims to bypass this
limitation. Small databases can be installed on
heterogeneous resources and ordinary desktop computers.
3.1 Planning Phases
The planning system was divided into five main parts: (1)
the user request is intercepted by the service; (2) ask the
middleware the available databases; (3) parse complex SQL
query command into simple queries; (4) distribute each
simple query to the middleware; and (5) join the results and
send back to the user.
Figure 1 shows the planning inputs and outputs.
OGSA-DAI identifies and communicate with the databases.
The first information needed is the available resources and
tables to execute each query command. After the parsing the
planning system establishes the execution plan. After this the
plan is submitted to the middleware. The middleware
executes each query on the databases. The service keeps
track of the submission and the final phase is receiving all
rows, joins them and sends it to the user.
Int'l Conf. Grid Computing and Applications | GCA'08 | 209

Figure 1 – Service Planning Inputs and Outputs
The tests were made over Shipp [10] genetic database.
It is a complex model that stores a lot of DNA data. There is
a lot of attributes on each table and the data analysis is a
good challenge to our service.
In other hand, this model could be easily understood
and can be used in non-academic institutions. Figure 2
shows the entity-relationship model of this database.
Figure 2 – Entity-Relationship Model
There are four tables on this model:
LYMPH_OUTCOME, LYMPH_EXP, LYMPH_MAP e
LYMPH_TEMP. The first one stores data clinic results.
There are 58 rows in this table. The second one stores
genetic values for each different model. DNA sequences are
represented in this table. There are 7.129 rows in this table.
The third one has 7.129 rows too and stores the gene
identity. The fourth one stores 413.482 rows and it is the
data pivot result of the other tables. It is used to store
original genetic expression.
The queries used to test the algorithms are:
Resources
SGBD User Needs
Planning
System
OGSA-DAI
XML File
Results
XML File
Results
Metrics and
Resources
210 Int'l Conf. Grid Computing and Applications | GCA'08 |

i) select a.gene_id, a.accession,
b.gene_id, b.sample_id from
lymph_map a, lymph_exp b where
a.gene_id = b.gene_id
ii) select a.gene_id, a.accession,
b.gene_id, b.sample_id,
c.sample_id, c.status from
lymph_map a, lymph_exp b,
lymph_outcome c where a.gene_id
= b.gene_id and b.sample_id =
c.sample_id
v) select a.gene_id, a.accession,
b.gene_id, b.sample_id, d.dlbc1
from lymph_map a, lymph_exp b,
lymph_temp d where a.gene_id =
b.gene_id and a.gene_id =
d.gene_id
vi) select a.gene_id, a.accession,
b.gene_id, b.sample_id,
c.sample_id, c.status, d.dlbc1
from lymph_map a, lymph_exp b,
lymph_outcome c, lymph_temp d
where a.gene_id = b.gene_id and
b.sample_id = c.sample_id and
a.gene_id = d.gene_id
The main goal of these queries was identify the service
planning behavior. With these queries it was possible test the
parsing phase of complex SQL SELECT command, the
distribution in parallel of the resulted simple queries into
resources, and time response. The queries use regular joins
to test the ability to distribute queries over available
databases. Query (i) uses two tables. Queries (ii) and (v) use
three tables, and query (vi) uses four tables.
There were only three available databases on the grid.
Two servers were held by a local network. Oracle 10g R2
database was installed in one of them and the other server
has one MySQL 5.0 and one Oracle 10g R1. OGSA-DAI
and Globus were installed on the same server. The best
metrics were on the OGSA-DAI server, because there was
no need to use network. This server had more available
memory and the faster processor.
All databases were populated with the same tables and
rows. We used a data replica because our goal was test only
the power to distribute queries on the grid. Figure 3 shows
the test results.
Recursos x Tempo
0:08:21
0:08:38
0:08:56
0:09:13
0:09:30
0:09:48
0:10:05
0:10:22
i (2 t) ii (3 t) v (3 t) vi (4 t)
Consultas
Te
mp
o
0
0,5
1
1,5
2
2,5
3
3,5
Tempo
Recursos
Figure 3: Query Distribution on the available resources and processing time
Figure 3 shows that there was resource usage
optimization on virtual organization when the service is
used. Based on this result, the more complex a query is and
the more available databases on the grid, the query
distribution would be best. As shown, the planning system
used all available databases based on the query. When the
SQL SELECT command used only two tables on the query,
the planning service uses two databases. When the query
used three tables, the service used three available databases.
When the query used four tables, the service used the
maximum available databases (three) and waits the first
available one to submit the last query.
Int'l Conf. Grid Computing and Applications | GCA'08 | 211

Time response were better when all available databases
were used, i.e., queries (ii) and (v). When there was more
available database than the tables in the query, the time
response was not better. When there were more tables in the
query and less available databases (vi), time response was
almost the same (ii). It shows that, using the virtual
organization concept, it is important to use as much
resources as possible. It would increase the time response of
complex queries.
3.2 Related Work
There is a similar work that distributes queries on
OGSA-DAI. Distributed Query Processing (OGSA-DQP)
goal is implement declarative and high-level language to
access and analyze data. It tries to simplify the resource
management on the grid using some services. The main
problem of this solution is that it does not uses all OGSA-
DAI services. There are other problems like some databases
cannot be used on DQP and the use of Polar* partitioning
service [7] that is executed outside OGSA-DAI. It uses
Object Query Language (OQL) instead of SQL. SQL is the
relational database standard language.
4 Conclusion
It is possible use a simple service to plan, parallelize
and distribute complex SQL queries on the grid. The use of
OGSA-DAI is and important feature because there is a lot of
researchers establishing the services that will be developed
to integrate databases on the grid. Thus, it will be possible
aggregate new services into the middleware.
Some important issues were followed, as the use of
heterogeneous servers, operating systems, and databases. In
our tests we used standard SQL queries with tables joined
and rows restriction.
The main contribution of this paper was that it shows
the utilization of different and remote databases in a virtual
organization. When it is used, the resources will be
optimized and the queries will return faster than using only
one database. Ordinary desktop computers can be used to do
these tasks that would be overloading the database server.
5 References
[1] Alpdemir, M. N.; Mukherjee, A.; Paton, N. W.;
Watson, P.; Fernandes, A. A. A.; Gounaris, A.; Smith, J.
“Service-Based Distributed Querying on the Grid” : 2003.
[2] Blythe, J.; Deelman, E. e Gil, Y. “Planning and
Metadata on the Computational Grid”. Em: AAAI Spring
Symposium on Semantic Web Services: 2004.
[3] Dantas, M. “Computação Distribuída de Alto
Desempenho”. Ed. Axcel. Rio de Janeiro: 2005.
[4] Foster, I. ; Kesselman, C. e Tuecke, S. “The Anatomy
of the Grid: Enabling Scalable Virtual Organizations” Em:
International J. Supercomputer Applications, vol 15(3):
2001
[5] Foster, I.; Tuecke, S. e Unger, J. “OGSA Data
Services”. Em: http://www.ggf.org: 2003. Acessado em
julho de 2005.
[6] Nareyek, A. N.; Freuder, E. C.; Fourer, R.;
Giunchiglia, E.; Goldman, R. P.; Kautz, H.; Rintanen, J. e
Tate, A. “Constraints and AI Planning”. IEEE Intelligent
Systems 20(2): 62-72: 2005.
[7] OGSA-DAI. http://www.ogsadai.org.uk/about/ogsa-
dqp/. Acessado em fevereiro de 2006.
[8] Ranganathan, Kavitha e Foster, Ian Simulation Studies
of Computation and Data Scheduling Algorithms for Data
Grids. Em: Journal of Grid Computing, Volume 1 p. 53-62:
2003.
[9] Russell, Stuard e Norvig, Peter. Inteligência Artificial.
Ed. Campus. Rio de Janeiro: 2004.
[10] Shipp, M. A. et al. Diffuse Large B-Cell Lymphoma
Outcome Prediction by Gene Expression Profiling and
Supervised Machine Learning. Em: Nature Medicine, vol. 8,
nº 1, pp 68-74: 2002.
[11] Watson, P.; Paton, N.; Atkinson, M.; Dialani, V.;
Pearson, D. e Storey, T. “Database Access and Integration
Services on the Grid” Em: Fourth Global Grid Forum (GGF-
4): 2002. http://www.nesc.ac.uk/technical_papers/dbtf.pdf.
Acessado em julho de 2005.
[12] Watson, P. “Database and the Grid” Em: Grid
Computing: Making the Global Infrastructure a Reality.
John Wiley & Sons Inc: 2003.
212 Int'l Conf. Grid Computing and Applications | GCA'08 |
An Efficient Load Balancing Architecture forPeer-to-Peer Systems
Brajesh Kumar ShrivastavaSymantec Corporation
brajeshkumar [email protected]
Sandeep Kumar Samudrala,Guruprasad Khataniar,Diganta GoswamiDepartment of Computer Science and Engineering
Indian Institute of Technology GuwahatiGuwahati - 781039, Assam, India
{samudrala,gpkh,dgoswami}@iitg.ernet.in
Abstract - Structured peer-to-peer systems like Chord arepopular because of their deterministic nature in routing, whichbounds the number of messages in finding the desired data.In these systems, DHT abstraction, Heterogeneity in nodecapabilities and Distribution of queries in the data space leadsto load imbalance.
We present a 2-tier hierarchical architecture to deal with thechurn rate, load imbalance thereby reducing the cost of loadbalancing and improve the response time. Proposed approachof load balancing is decentralized in nature and exploits thephysical proximity of nodes in the overlay network during loadbalancing.
Keywords: P2P Network, Overlay network,Load bal-ancing, DHT, Super node and Normal node.
1 IntroductionPeer-to-Peer(P2P) systems offer a different paradigm
for resource sharing. In P2P systems every node has gotequal functionality. Every node provides and takes theservice to and from the network. The main objective ofP2P systems is to efficiently utilize the resources withoutoverloading any of the nodes. Especially Structured P2Psystems like Chord[1], CAN[2] etc., also called DHTbased systems, in which data and node ids are mappedto a number space and each node is responsible for apart of data space.
Since each node is mapped to a part of data space,data finding in these systems is easy. This deterministicnature and bounded number of messages in searchingfor data made these systems more popular.
DHT abstraction assumes the homogeneity of nodecapabilities which is not in practice because each nodepossesses different capabilities. DHT’s make use ofconsistent hashing in mapping data items to nodes. How-ever, consistent hashing produces a bound of O(logN)imbalance of keys among the nodes in the system, whereN is the number of nodes in the system [3].
Data that is shared to the network is not uniformly dis-tributed and the queries are never uniformly distributedin the network. Thus, assuming homogeneity of nodecapabilities, DHT abstraction, Data shared to the networkand Queries in the network lead to considerable amountof load imbalance in the system.
We present a 2-Tier Hierarchical architecture toachieve the proximity aware load balancing to improve
the response time, handle churn rate to reduce themessage traffic, deal with Free-riding to ensure that eachnode provides sufficient resources to deal with the greedynodes, which take the service from the network withoutsharing to the network.
Rest of this paper is organized as follows : Section 2presents related work, Section 3 describes the proposedoverlay system. Section 4 concludes the paper.
2 Related workDHT-based P2P systems [1][2][4][5], address the load
balancing issue in a simple way by using the uniformityof the hash function used to generate object ids. This ran-dom choice of object ids does not produce perfect loadbalance. These systems ignore the node heterogeneitywhich has been observed in [6].
Chord[1] was the first to propose the concept of virtualservers to address the load balancing issue by havingeach node simulate a logarithmic number of virtualservers. Virtual servers donot completely solve the loadbalancing issue.
Rao et al.[7] proposed three simple load balancingschemes for DHT- based P2P systems: One-to-One, One-to-Many and Many-to-Many. The basic idea behind theirschemes is that virtual servers are moved from heavynodes to light nodes for load balancing.
Byers et al.[8] addressed the load balancing from dif-ferent perspective. They proposed using the the “powerof two choices” paradigm to achieve load balance. Eachdata item is hashed to a small number of different idsand then is stored in the least loaded node among thenodes which are responsible for those ids.
Karger et al.[9] proposed two load balancing pro-tocols, like address-space balancing and item balanc-ing. Proximity information has been used in bothtopologically-aware DHT construction[10] and proxim-ity neighbor selection in P2P routing tables [11][12].The primary purpose of using the proximity informationin both cases is to improve the performance of DHToverlays. We use proximity for load balancing.
Haiying shen et al.[13] presented a new structurecalled Cycloid to deal with the load balancing by con-sidering the proximity.
Int'l Conf. Grid Computing and Applications | GCA'08 | 213

Zhenyu et al.[14] proposed a distributed load bal-ancing algorithm based on virtual servers. In this eachnode aggregates the load information of the connectedneighbors and moves the virtual servers from heavilyloaded nodes to lightly loaded nodes.
Our architecture exploits the node capabilities andproximity of nodes in the network for load balancing.This architecture uses the Chord in the upper level of thehierarchy and deals with the Free-riding by constrainingthe minimum amount of sharing on the nodes in thelower level of hierarchy.
3 System ModelIn this model, we broadly categorize the nodes into
two types i.e. Super Node and Normal Node, basedon their capabilities like Bandwidth, Processing power,Storage, Number of nodes it can connect to.
i. Super node: A Super node is exposed to the upperlevel DHT based network (Chord). It manages the groupof Normal nodes connected to it. The data that is mappedon to a Super node is stored on the Normal nodespertaining to it’s group. It represents a group of Normalnodes in the DHT based network. It routes the queriesof the Normal nodes in it’s group.
ii. Normal node: A Normal node is a node that joinsthe network in the second level of hierarchy. It maintainsthe data mapped on to the Super node with which it isconnected. This is not exposed to the upper level DHTbased network.
These are in-turn classified into two types:i. Stable-Normal node.
ii. Unstable-Normal node.
TstabUn stable
Normal nodes
Stable
Normal nodes
Fig. 1. Categorization of Normal Nodes
i. Stable-Normal node: A Normal node that is inthe overlay network since Tstab or more time units.These are expected to be in the network with ac-ceptable probability. These are considered for loadbalancing by a Super node. In this paper, wheneverNormal node is referred it is called Stable-Normalnode unless and until explicitly specified.ii. Unstable-Normal node: These are recentlyjoined nodes and can leave the network at anytime.These are not considered by the Super node for loadbalancing.
3.1 BootstrappingWe assume that at the startup of the network, nodes
that join the network are Super nodes and directly added
: Super Node
: Normal Node
Fig. 2. 2-Tier Hierarchical Overlay Structure
in the upper level (chord). If N is the complete dataspace, then as soon as the number of nodes in thenetwork reach logN node addition in the upper level isstopped. Initially number of groups G = logN . There-after nodes that join in the second level of the network byconnecting to the nearest Super node. Each Super nodemanages a group of Normal nodes. Maximum numberof nodes in a group is Gmax. The moment a super nodedetects that number of nodes in it’s group go beyondGmax it splits the group into two groups. Splitting agroup invokes a node addition in the upper level ofhierarchy. At the time of division of a group, number ofnodes and data space are equally divided. The momenta Super node detects that number of nodes in it’s groupare less than Gmin, then nodes and data space of thegroup are equally divided to predecessor and successorgroups. This invokes node deletion in the upper level ofhierarchy.
3.2 Data Distribution:Every Super node divides it’s data space into K sets
and distributes each set to a group of Normal nodes.At the startup nodes are assigned to the data regions inround robin fashion. For instance, consider a Super nodeS1. Let the data space maintained by it be from X1 to
214 Int'l Conf. Grid Computing and Applications | GCA'08 |
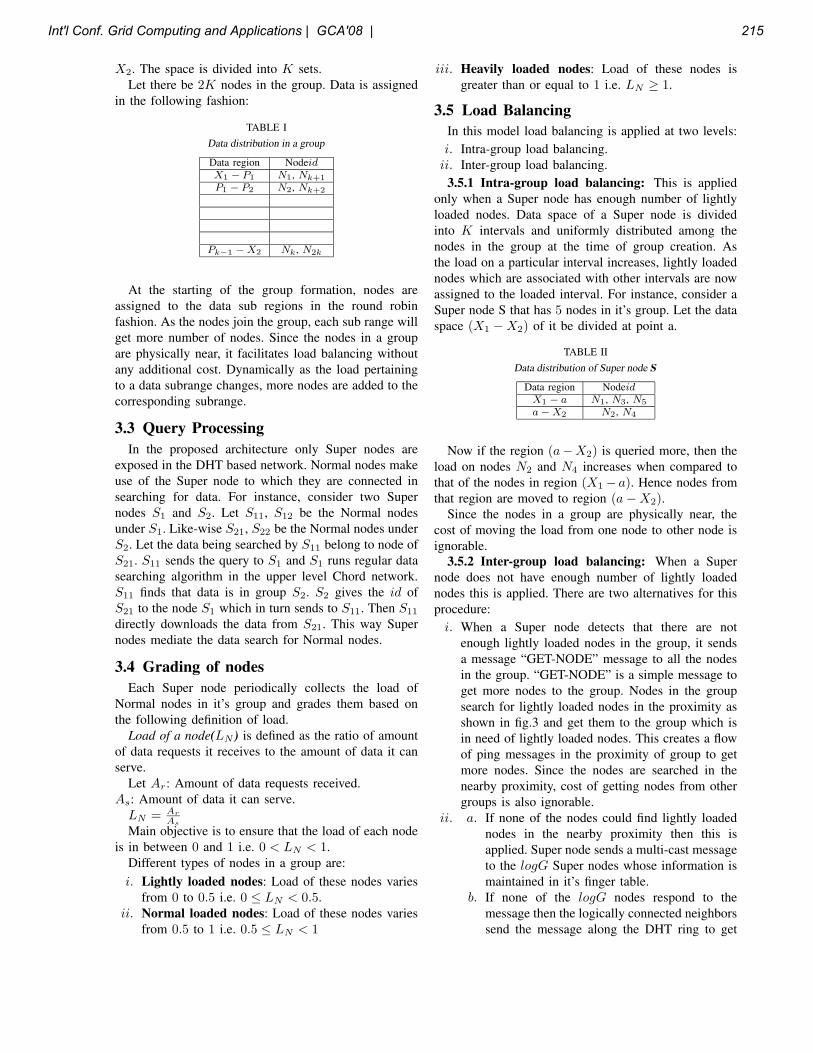
X2. The space is divided into K sets.Let there be 2K nodes in the group. Data is assigned
in the following fashion:
TABLE IData distribution in a group
Data region NodeidX1 − P1 N1, Nk+1
P1 − P2 N2, Nk+2
Pk−1 − X2 Nk , N2k
At the starting of the group formation, nodes areassigned to the data sub regions in the round robinfashion. As the nodes join the group, each sub range willget more number of nodes. Since the nodes in a groupare physically near, it facilitates load balancing withoutany additional cost. Dynamically as the load pertainingto a data subrange changes, more nodes are added to thecorresponding subrange.
3.3 Query ProcessingIn the proposed architecture only Super nodes are
exposed in the DHT based network. Normal nodes makeuse of the Super node to which they are connected insearching for data. For instance, consider two Supernodes S1 and S2. Let S11, S12 be the Normal nodesunder S1. Like-wise S21, S22 be the Normal nodes underS2. Let the data being searched by S11 belong to node ofS21. S11 sends the query to S1 and S1 runs regular datasearching algorithm in the upper level Chord network.S11 finds that data is in group S2. S2 gives the id ofS21 to the node S1 which in turn sends to S11. Then S11
directly downloads the data from S21. This way Supernodes mediate the data search for Normal nodes.
3.4 Grading of nodesEach Super node periodically collects the load of
Normal nodes in it’s group and grades them based onthe following definition of load.
Load of a node(LN ) is defined as the ratio of amountof data requests it receives to the amount of data it canserve.
Let Ar: Amount of data requests received.As: Amount of data it can serve.
LN = Ar
As
Main objective is to ensure that the load of each nodeis in between 0 and 1 i.e. 0 < LN < 1.
Different types of nodes in a group are:i. Lightly loaded nodes: Load of these nodes varies
from 0 to 0.5 i.e. 0 ≤ LN < 0.5.ii. Normal loaded nodes: Load of these nodes varies
from 0.5 to 1 i.e. 0.5 ≤ LN < 1
iii. Heavily loaded nodes: Load of these nodes isgreater than or equal to 1 i.e. LN ≥ 1.
3.5 Load BalancingIn this model load balancing is applied at two levels:i. Intra-group load balancing.
ii. Inter-group load balancing.3.5.1 Intra-group load balancing: This is applied
only when a Super node has enough number of lightlyloaded nodes. Data space of a Super node is dividedinto K intervals and uniformly distributed among thenodes in the group at the time of group creation. Asthe load on a particular interval increases, lightly loadednodes which are associated with other intervals are nowassigned to the loaded interval. For instance, consider aSuper node S that has 5 nodes in it’s group. Let the dataspace (X1 − X2) of it be divided at point a.
TABLE IIData distribution of Super node S
Data region NodeidX1 − a N1, N3, N5
a − X2 N2, N4
Now if the region (a−X2) is queried more, then theload on nodes N2 and N4 increases when compared tothat of the nodes in region (X1 − a). Hence nodes fromthat region are moved to region (a − X2).
Since the nodes in a group are physically near, thecost of moving the load from one node to other node isignorable.
3.5.2 Inter-group load balancing: When a Supernode does not have enough number of lightly loadednodes this is applied. There are two alternatives for thisprocedure:
i. When a Super node detects that there are notenough lightly loaded nodes in the group, it sendsa message “GET-NODE” message to all the nodesin the group. “GET-NODE” is a simple message toget more nodes to the group. Nodes in the groupsearch for lightly loaded nodes in the proximity asshown in fig.3 and get them to the group which isin need of lightly loaded nodes. This creates a flowof ping messages in the proximity of group to getmore nodes. Since the nodes are searched in thenearby proximity, cost of getting nodes from othergroups is also ignorable.
ii. a. If none of the nodes could find lightly loadednodes in the nearby proximity then this isapplied. Super node sends a multi-cast messageto the logG Super nodes whose information ismaintained in it’s finger table.
b. If none of the logG nodes respond to themessage then the logically connected neighborssend the message along the DHT ring to get
Int'l Conf. Grid Computing and Applications | GCA'08 | 215
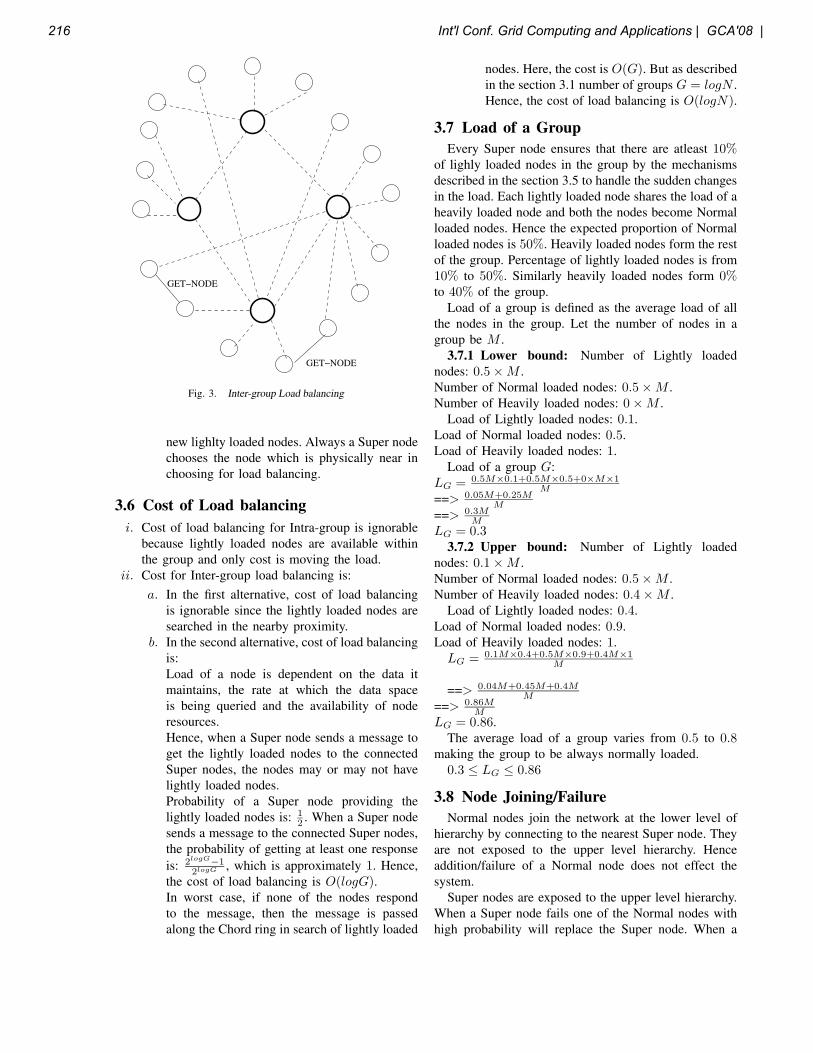
GET−NODE
GET−NODE
Fig. 3. Inter-group Load balancing
new lighlty loaded nodes. Always a Super nodechooses the node which is physically near inchoosing for load balancing.
3.6 Cost of Load balancingi. Cost of load balancing for Intra-group is ignorable
because lightly loaded nodes are available withinthe group and only cost is moving the load.
ii. Cost for Inter-group load balancing is:a. In the first alternative, cost of load balancing
is ignorable since the lightly loaded nodes aresearched in the nearby proximity.
b. In the second alternative, cost of load balancingis:Load of a node is dependent on the data itmaintains, the rate at which the data spaceis being queried and the availability of noderesources.Hence, when a Super node sends a message toget the lightly loaded nodes to the connectedSuper nodes, the nodes may or may not havelightly loaded nodes.Probability of a Super node providing thelightly loaded nodes is: 1
2 . When a Super nodesends a message to the connected Super nodes,the probability of getting at least one responseis: 2logG
−12logG , which is approximately 1. Hence,
the cost of load balancing is O(logG).In worst case, if none of the nodes respondto the message, then the message is passedalong the Chord ring in search of lightly loaded
nodes. Here, the cost is O(G). But as describedin the section 3.1 number of groups G = logN .Hence, the cost of load balancing is O(logN).
3.7 Load of a GroupEvery Super node ensures that there are atleast 10%
of lighly loaded nodes in the group by the mechanismsdescribed in the section 3.5 to handle the sudden changesin the load. Each lightly loaded node shares the load of aheavily loaded node and both the nodes become Normalloaded nodes. Hence the expected proportion of Normalloaded nodes is 50%. Heavily loaded nodes form the restof the group. Percentage of lightly loaded nodes is from10% to 50%. Similarly heavily loaded nodes form 0%to 40% of the group.
Load of a group is defined as the average load of allthe nodes in the group. Let the number of nodes in agroup be M .
3.7.1 Lower bound: Number of Lightly loadednodes: 0.5 × M .Number of Normal loaded nodes: 0.5 × M .Number of Heavily loaded nodes: 0 × M .
Load of Lightly loaded nodes: 0.1.Load of Normal loaded nodes: 0.5.Load of Heavily loaded nodes: 1.
Load of a group G:LG = 0.5M×0.1+0.5M×0.5+0×M×1
M
==> 0.05M+0.25MM
==> 0.3MM
LG = 0.33.7.2 Upper bound: Number of Lightly loaded
nodes: 0.1 × M .Number of Normal loaded nodes: 0.5 × M .Number of Heavily loaded nodes: 0.4 × M .
Load of Lightly loaded nodes: 0.4.Load of Normal loaded nodes: 0.9.Load of Heavily loaded nodes: 1.
LG = 0.1M×0.4+0.5M×0.9+0.4M×1M
==> 0.04M+0.45M+0.4MM
==> 0.86MM
LG = 0.86.The average load of a group varies from 0.5 to 0.8
making the group to be always normally loaded.0.3 ≤ LG ≤ 0.86
3.8 Node Joining/FailureNormal nodes join the network at the lower level of
hierarchy by connecting to the nearest Super node. Theyare not exposed to the upper level hierarchy. Henceaddition/failure of a Normal node does not effect thesystem.
Super nodes are exposed to the upper level hierarchy.When a Super node fails one of the Normal nodes withhigh probability will replace the Super node. When a
216 Int'l Conf. Grid Computing and Applications | GCA'08 |

group joins/ fails finger tables of the other Super nodesneed to be updated.
Let Rj : Rate of joining of nodes in the network.Rl: Rate of leaving of nodes in the network.Gj : Rate of getting the nodes from nearby groups.Gl: Rate of giving the nodes to other groups.Gmax: Maximum group size.G: Number of groups.
Effective number of nodes joining the system per unittime: (Rj + Gj − Rl − Gl).
Effective number of nodes joining per group:(Rj+Gj−Rl−Gl)
G.
A group is created only if the number of nodes in agroup cross Gmax.
Number of groups created by a group is:(Rj+Gj−Rl−Gl)
Gmax∗G.
Addition of a group is equivalent to addition of anode in the chord. Chord[1] takes atmost O(log2N)2
messages, where N is the number of nodes in the system.Here, number of groups is G. Addition of a group
takes O(log2G)2.Number of messages routed because of new groups
created by a group is: (Rj+Gj−Rl−Gl)Gmax∗G
× O(log2G)2.Total number of messages routed in the upper level
network: (Rj+Gj−Rl−Gl)Gmax
× O(log2G)2.Since the Group joining and Group deletion are de-
pendent on the parameters given above. These eventsdo not occur very often. Hence the churn rate does notdegrade the system performance.
3.9 Data InsertionWhen a node shares the data to the network, the
Super node to which this data gets mapped needs to beidentified. This is similar to searching for a data in theChord. [1] proved that in chord network, number of stepsto find the data is O(logN). In the proposed network,there are G groups in the upper level hierarchy, hencethe cost of data insertion is O(logG).
TABLE IIIAnalysis of the system
Function MessagesData Insertion O(logG)
Query Processing O(logG)Node join/failure ConstantGroup insertion O(logG)2
Intra-group load balancing ConstantInter-group load balancing Avg:O(logG), Worst case:O(G).
3.10 Free-RidingSince the Normal nodes join the network by con-
necting to nearest Super nodes, at the time of joiningSuper node puts a minimum constraint on the amount
of sharing space it has to provide to the network. Thusnodes which do not give sufficient sharing space are notconnected to the network. Nodes which do not provideenough sharing cannot be put to use for handling the dataspace of the Super node. Thus Free-Riding is controlledat the lower level of the network.
4 ConclusionIn this paper we present efficient load balancing mech-
anisms by considering locality in a 2-tier hierarchicaloverlay network. In the proposed architecture, nodes areclassified as Super nodes and Normal nodes. Numberof normal nodes are limited initially to logN , where N
is the size of data space. Super nodes balance the loadby moving the load across the Normal nodes which arephysically near. Since the number of Super nodes arelimited initially and the rate at which the Super nodesjoin the network is very less, this architecture deals withthe churn rate. Constraining the minimum amount ofsharing by the Normal nodes regulates Free-Riding.
References[1] Ion Stoica, R. Morris, D. Karger, M. Kaashoek, and H. Balakrish-
nan, Chord: A scalable peer-to-peer lookup service for internetapplications, in Proceedings of SIGCOMM 2001.
[2] Sylvia Ratnasamy, P. Francis, M. Handley, R. Karp, and S.Shenker, A Scalable Content- Addressable Network, in Proceed-ings of ACM SIGCOMM 2001.
[3] David Karger, Eric Lehman, Tom Leighton, Matthew Levine,Daniel Lewin, Rina Panigrahy, Consistent Hashing and RandomTrees: Distributed Caching Protocols for Relieving Hot Spotson the World Wide Web, In proceedings of Symp. Theory ofcomputing(STOC’ 97)pp..654-663,1997.
[4] Antony Rowstron and P. Druschel, Pastry: Scalable, distributedobject location and routing for large-scale peer-to-peer systems,in IFIP/ACM International Conference on Distributed SystemsPlatforms (Middleware), Heidelberg, Germany, pp. 329 - 350,November 2001.
[5] Ben Y. Zhao, L. Huang, J. Stribling, S. C. Rhea, A. D. Joseph, andJ. D. Kubiatowicz, Tapestry: A Resilient Global-Scape Overlayfor Service Deployment, IEEE Journal on Selected Areas inCommunications, vol. 22, 2004.
[6] Stefan Saroiu, P. Krishna Gummadi, Steven D. Gribble, A Mea-surement Study of Peer-to-Peer File Sharing Systems, in Proceed-ings of Multimedia Computing and Networking (MMCN), 2002.
[7] A.Rao, K. Lakshminarayanan, S.Surana, R.Karp and I.Stoica,Load Balancing in Structured P2P Systems, in Proceedings ofSecond International workshop on P2P systems(IPTPS),pp.68-79,Feb 2003.
[8] J.W.Byers, J.Considine and M.Mitzenmacner, Simple Load Bal-ancing for Distributed Hash Tables, in Proceedings of Second In-ternational workshop on P2P systems(IPTPS),pp.80-87,Feb 2003.
[9] D.R.Karger and M.Ruhl, Simple Efficient Load Balancing Al-gorithms for Peer to Peer Systems, In proceedings of ThirdInternational workshop on P2P Systems(IPTPS),Feb.2004.
[10] S.Ratnasamy, M.Handley, R.M.Karp and S.ShenkerTopologically-Aware Overlay construction and Server Selection,In proceedings of IEEE INFOCOM, vol.3, pp.1190-1199, June2002.
[11] Z.Xu, C.Tang and Z.Zhang, Building Topology Aware OverlaysUsing Global Soft-State, In proceedings of 23rd Internationalconference on Distributed Computing Systems(ICDCS), pp.500-508, May 2003.
Int'l Conf. Grid Computing and Applications | GCA'08 | 217

[12] Z.Xu, M.Mahalingam and M.Karlsson, Turning Heterogeneityinto an Advantage in Overlay Routing, In proceedings of IEEEINFOCOM, VOL. 2, PP.1499-1509, April 2003.
[13] Haiying Shen and Cheng-Zhong Xu, Locality Aware and ChurnResilient Load Balancing Algorithms in Strructured Peer to PeerNetworks, In proceedings of IEEE Transactions on Parallel andDistributed Systems, vol. 18, No.6, June 2007.
[14] Zhenyu Li and Gaogang Xie, A Distributed Load Balancing Al-gorithm for Structured P2P Systems, In proceedings of 11th IEEESymposium on Comnputers and Communuications(ISCC’06).
218 Int'l Conf. Grid Computing and Applications | GCA'08 |

Grid Performance Analysis in a Parallel Environment
Y.S. Atmaca1, O. Kandara1, and A. Tan2
1Computer Science Department, Southern University and A&M College, Baton Rouge, Louisiana, USA 2 Center for Energy and Environmental Services, Southern University and A&M College, Baton Rouge,
Louisiana, USA
Abstract - High performance computing is a relatively new emerging technology gaining more and more importance everyday. Super computing, clustering, and the grid computing are the currently existing technologies used in high performance computing.
In this paper, we first studied the three types of emerging grid technologies, namely cluster grid, campus grid, and global grid. We use the cluster grid in our implementation. We used 11 nodes, where one node is dedicated to submit the jobs. The remaining 10 nodes are used as the computational units. Then we carried out a performance analysis based on the number of nodes in the grid. In the analysis, we observed that peak performance can be achieved with a certain number of nodes in the grid. That is to say, more nodes do not mean always more performance.
Our study proves that we can create a grid for high performance computing with the optimal number of nodes for jobs with the same or similar characteristics. This will lead us to implement parallel grids with the nodes that are not cost-efficient in performance to add to the existing grids.
Keywords: High performance computing, grid computing, grid performance analysis, cluster grid.
1 Introduction One way of categorizing a computational problem in computer science is by its degree of "parallelism". If a problem can be split into many smaller sub-problems that can be worked on by different processors in parallel, computation can be speed up a lot by using many computers. Fine-grained calculations are better suited to big, monolithic supercomputers, or at least very tightly coupled clusters of computers, which have lots of identical processors with an extremely fast, reliable network between the processors, to ensure there are no bottlenecks in communications. This type of computing is often referred to as high-performance computing (HPC). In its current stage of evolution,
most applications of the Grid fall into the HPC classification. This is due to the fact that Grid computing arose out of the need for more cost-effective HPC solutions to address critical problems in science and engineering. The initial adoption of the Grid by commercial enterprises has continued to focus on HPC because of the high return on investment and competitive advantage realized by solving compute intensive problems that were previously insolvable in a reasonable period of time or cost.
A simplified basic architecture of a Grid is shown in the Figure 1 with Grid middleware providing the location transparency that allows the applications to run over a virtualized layer of networked resources. The key aspect of middleware is that it gives the Grid the semblance of a single computer system, providing the coordination among all the computing resources that comprise the Grid. These functions usually include tools for handling resource discovery and monitoring, resource allocation and management, security, performance monitoring, and accounting.
Figure 1: Basic Architecture of a Grid
Key to success of Grid computing is the development of the 'middleware', the software that organizes and integrates the disparate computational facilities belonging to a Grid. Its main role is to automate all the "machine to machine" negotiations required to interlace the computing and storage resources and the network into a single, seamless computational "fabric".
Int'l Conf. Grid Computing and Applications | GCA'08 | 219
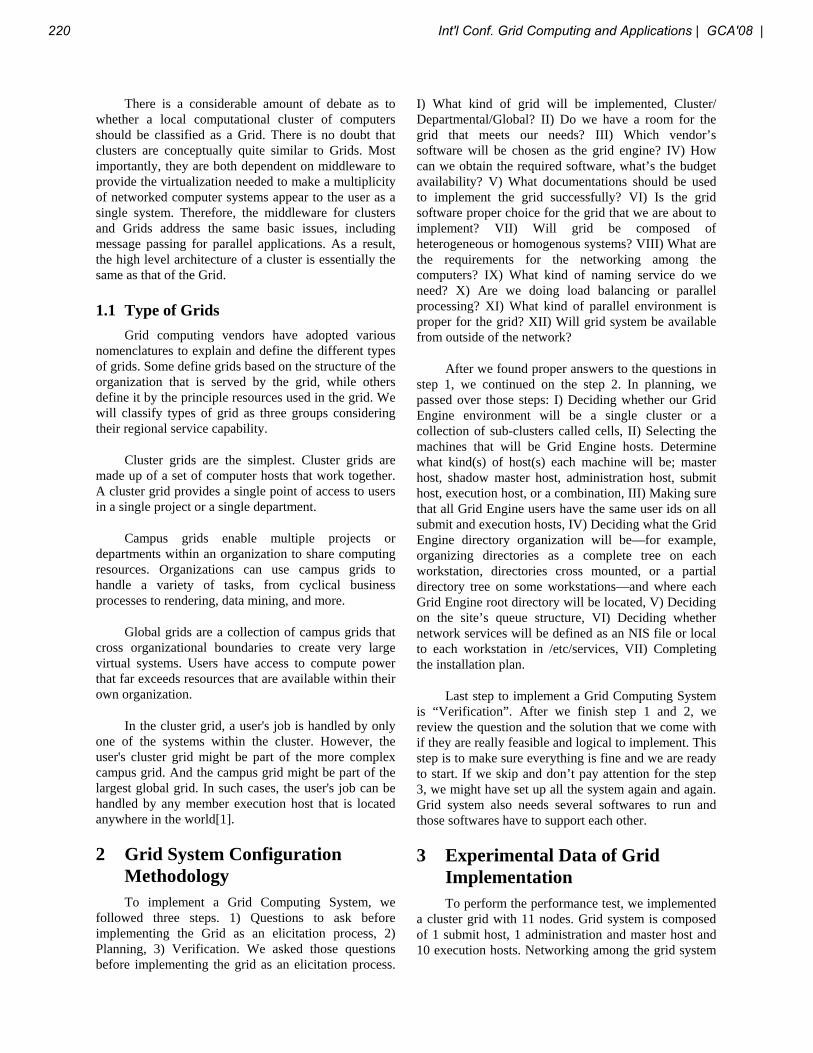
There is a considerable amount of debate as to whether a local computational cluster of computers should be classified as a Grid. There is no doubt that clusters are conceptually quite similar to Grids. Most importantly, they are both dependent on middleware to provide the virtualization needed to make a multiplicity of networked computer systems appear to the user as a single system. Therefore, the middleware for clusters and Grids address the same basic issues, including message passing for parallel applications. As a result, the high level architecture of a cluster is essentially the same as that of the Grid.
1.1 Type of Grids Grid computing vendors have adopted various nomenclatures to explain and define the different types of grids. Some define grids based on the structure of the organization that is served by the grid, while others define it by the principle resources used in the grid. We will classify types of grid as three groups considering their regional service capability.
Cluster grids are the simplest. Cluster grids are made up of a set of computer hosts that work together. A cluster grid provides a single point of access to users in a single project or a single department.
Campus grids enable multiple projects or departments within an organization to share computing resources. Organizations can use campus grids to handle a variety of tasks, from cyclical business processes to rendering, data mining, and more.
Global grids are a collection of campus grids that cross organizational boundaries to create very large virtual systems. Users have access to compute power that far exceeds resources that are available within their own organization.
In the cluster grid, a user's job is handled by only one of the systems within the cluster. However, the user's cluster grid might be part of the more complex campus grid. And the campus grid might be part of the largest global grid. In such cases, the user's job can be handled by any member execution host that is located anywhere in the world[1].
2 Grid System Configuration Methodology To implement a Grid Computing System, we
followed three steps. 1) Questions to ask before implementing the Grid as an elicitation process, 2) Planning, 3) Verification. We asked those questions before implementing the grid as an elicitation process.
I) What kind of grid will be implemented, Cluster/ Departmental/Global? II) Do we have a room for the grid that meets our needs? III) Which vendor’s software will be chosen as the grid engine? IV) How can we obtain the required software, what’s the budget availability? V) What documentations should be used to implement the grid successfully? VI) Is the grid software proper choice for the grid that we are about to implement? VII) Will grid be composed of heterogeneous or homogenous systems? VIII) What are the requirements for the networking among the computers? IX) What kind of naming service do we need? X) Are we doing load balancing or parallel processing? XI) What kind of parallel environment is proper for the grid? XII) Will grid system be available from outside of the network?
After we found proper answers to the questions in step 1, we continued on the step 2. In planning, we passed over those steps: I) Deciding whether our Grid Engine environment will be a single cluster or a collection of sub-clusters called cells, II) Selecting the machines that will be Grid Engine hosts. Determine what kind(s) of host(s) each machine will be; master host, shadow master host, administration host, submit host, execution host, or a combination, III) Making sure that all Grid Engine users have the same user ids on all submit and execution hosts, IV) Deciding what the Grid Engine directory organization will be—for example, organizing directories as a complete tree on each workstation, directories cross mounted, or a partial directory tree on some workstations—and where each Grid Engine root directory will be located, V) Deciding on the site’s queue structure, VI) Deciding whether network services will be defined as an NIS file or local to each workstation in /etc/services, VII) Completing the installation plan.
Last step to implement a Grid Computing System is “Verification”. After we finish step 1 and 2, we review the question and the solution that we come with if they are really feasible and logical to implement. This step is to make sure everything is fine and we are ready to start. If we skip and don’t pay attention for the step 3, we might have set up all the system again and again. Grid system also needs several softwares to run and those softwares have to support each other.
3 Experimental Data of Grid Implementation
To perform the performance test, we implemented a cluster grid with 11 nodes. Grid system is composed of 1 submit host, 1 administration and master host and 10 execution hosts. Networking among the grid system
220 Int'l Conf. Grid Computing and Applications | GCA'08 |
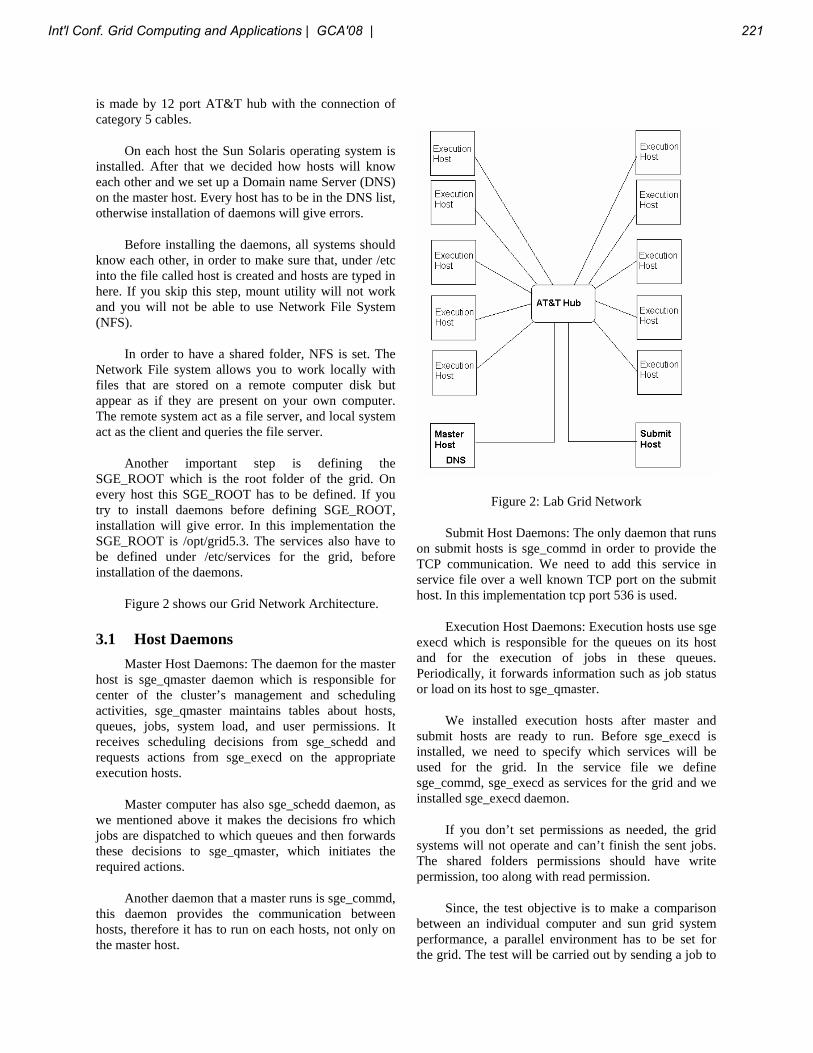
is made by 12 port AT&T hub with the connection of category 5 cables.
On each host the Sun Solaris operating system is installed. After that we decided how hosts will know each other and we set up a Domain name Server (DNS) on the master host. Every host has to be in the DNS list, otherwise installation of daemons will give errors.
Before installing the daemons, all systems should know each other, in order to make sure that, under /etc into the file called host is created and hosts are typed in here. If you skip this step, mount utility will not work and you will not be able to use Network File System (NFS).
In order to have a shared folder, NFS is set. The Network File system allows you to work locally with files that are stored on a remote computer disk but appear as if they are present on your own computer. The remote system act as a file server, and local system act as the client and queries the file server.
Another important step is defining the SGE_ROOT which is the root folder of the grid. On every host this SGE_ROOT has to be defined. If you try to install daemons before defining SGE_ROOT, installation will give error. In this implementation the SGE_ROOT is /opt/grid5.3. The services also have to be defined under /etc/services for the grid, before installation of the daemons.
Figure 2 shows our Grid Network Architecture.
3.1 Host Daemons Master Host Daemons: The daemon for the master host is sge_qmaster daemon which is responsible for center of the cluster’s management and scheduling activities, sge_qmaster maintains tables about hosts, queues, jobs, system load, and user permissions. It receives scheduling decisions from sge_schedd and requests actions from sge_execd on the appropriate execution hosts.
Master computer has also sge_schedd daemon, as we mentioned above it makes the decisions fro which jobs are dispatched to which queues and then forwards these decisions to sge_qmaster, which initiates the required actions.
Another daemon that a master runs is sge_commd, this daemon provides the communication between hosts, therefore it has to run on each hosts, not only on the master host.
Figure 2: Lab Grid Network
Submit Host Daemons: The only daemon that runs on submit hosts is sge_commd in order to provide the TCP communication. We need to add this service in service file over a well known TCP port on the submit host. In this implementation tcp port 536 is used.
Execution Host Daemons: Execution hosts use sge execd which is responsible for the queues on its host and for the execution of jobs in these queues. Periodically, it forwards information such as job status or load on its host to sge_qmaster.
We installed execution hosts after master and submit hosts are ready to run. Before sge_execd is installed, we need to specify which services will be used for the grid. In the service file we define sge_commd, sge_execd as services for the grid and we installed sge_execd daemon.
If you don’t set permissions as needed, the grid systems will not operate and can’t finish the sent jobs. The shared folders permissions should have write permission, too along with read permission.
Since, the test objective is to make a comparison between an individual computer and sun grid system performance, a parallel environment has to be set for the grid. The test will be carried out by sending a job to
Int'l Conf. Grid Computing and Applications | GCA'08 | 221

the grid which processes this job in a parallel environment and an individual system that process this job by itself. As soon as job is sent to the grid, master computer checks its table for the hosts that show which computer load is low and which host is running which job and which hosts are more available to handle the job. According to this table information, execution hosts take over the job, they run and finish and create the output.
The first thing to do is choosing the environment that we work with. There are 2 choices PVM (Parallel Virtual Machine) and MPI (Message Passing Interface). PVM is a software package that permits a heterogeneous collection of UNIX and/or Windows computers hooked together by a network to be used as a single large parallel computer. Thus large computational problems can be solved more cost effectively by using the aggregate power and memory of many computers. The software is very portable. PVM enables users to exploit their existing computer hardware to solve much larger problems at minimal additional cost. Hundreds of sites around the world are using PVM to solve important scientific, industrial, and medical problems in addition to PVM's use as an educational tool to teach parallel programming. With tens of thousands of users, PVM has become the de facto standard for distributed computing world-wide [2].
On the other hand, MPI was designed for high performance on both massively parallel machines and on workstation clusters. MPI is widely available, with both free available and vendor-supplied implementations. MPI is the only message passing library which can be considered a standard. It is supported on virtually all HPC platforms. There is no need to modify your source code when you port your application to a different platform that supports (and is compliant with) the MPI standard [3].
Because main logic of Grid computing is to use unused resources and having high performance computing by using those resources, it is more proper and logical to use PVM in our grid. PVM is better because applications will be run over heterogeneous networks. It has good interoperability between different hosts. PVM allows the development of fault tolerant applications that can survive host or task failures. Because the PVM model is built around the virtual machine concept (not present in the MPI model), it provides a powerful set of dynamic resource manager and process control function [4]
4 Discussion and Conclusion A grid configuration methodology is given with a step by step procedure. Before implementation of a grid, the system administrators should follow the given procedures and should understand the core requirements in order to be successful in implementation of the grid. Section 3 provides a detailed explanation which procedures the system administrators are supposed to go through.
If the grid can be set up in an appropriate way by understanding core requirements, there is no doubt about its robustness. As the goal of this paper, we are doing a performance analysis on the grid.
Figure 3: Grid Performance Table
Figure 3 presents the grid performance analysis that we have done by using ten nodes. These computers have the same hardware characteristics and the same operating system which is Sun Solaris 9. If we consider the performance results, we can easily notice that the more nodes, the more performance, and from first node to second node the performance doubles itself.
Figure 4: Grid Performance Analysis
222 Int'l Conf. Grid Computing and Applications | GCA'08 |

Figure 4 is the graphical presentation of the same analysis. Job duration is more than 12 minutes for a single node and when we run two nodes for the same job, the duration decreases to 6 minutes. This is a great performance increase, when we add the other nodes for the same job completion; we see that performance is still increasing noticeably. When we add the tenth node, the performance decreases according to result of ninth analysis. By using nine nodes, the job is finished in 2.10 minutes; however it completes the job in 2.20 minutes with ten nodes. This shows the performance depends on not only the number of nodes but also the job’s characteristics. We can state that the peak performance node requirement for that particular job can be gained by nine nodes. Therefore we can say that the more nodes do not mean always more performance. We can conclude that for any particular job, this peak performance node requirement can differ
5 References [1] http://docs.sun.com/app/docs/doc/817-6117 as of January 09, 2008
[2] http://www.csm.ornl.gov/pvm/ as of January 15, 2008
[3] http://www.llnl.gov/computing/tutorials/mpi/#What as of February 12, 2008
[4] http://www.rrsg.uct.ac.za/mti/pvmvsmpi.pdf as of January 15, 2005
[5] Performance analysis and Grid Computing, V. Getov et al, Kluwer Academic Publishers, 2004, ISBN-10: 1402076932
[6] The HPCVL Working Template: A Tool for High-Performance Programming, G. Liu et al., 19 International Symposium on High Performance Computing Systems and Applications, (HPCS`05) pp.110-116.
th
[7] Online Performance Monitoring and Analysis of Grid Scientific Workflows, H. Truong, T. Fahringer, Advances in Grid Computing – EGC 2005: European Grid Conference, Amsterdam, pp.1154-1164.
Int'l Conf. Grid Computing and Applications | GCA'08 | 223

�
������������� �������������������������������
������� �������������������������������������������
���������
��� ��!���"����
���������������� ���������������������������� ���������� ���������� ������
�
�
��������� ����������������� � �������� ���������������
����� � �������� � �� �� ����� �� ��������� ���������
�� ���� � � � �� ����� ����� ������ ����� ������������
� � ����� � � ���� �������� ��� ����� ��� ��� ��� ��� � ��
����� ���� ��������� ������� �� ��������� ������� � ���
�� ������������������ ����� ��������������� �������������
�� ��������� ���� ��� � � ��!����� ���� �� �������� �������
�� ����� � �� ��� ���� �� ������������ ��� � ����
��������" � ����� ������� ���� ������� �������� � �����
��������������������� �� ��� �����������������
������� ������ #� �� � � ��� � � ����� ������$� ������� � ���
������ � �� ��������� � �������� �� ��� �� ��� ����� ��
����� ��������� � ���� ���� �������� ������� �� %�� ��� �
������� ��� ������� ����� �� �� ���� � ��� ������ ���������
� ��� ������������ �� ����� ��
#�$����%� ����� � ����� � !"#�$� �""!%�� �
���&�������� ��'��$"!('�
�
&� ������������
�� ����� ���� ���$�)��� ��� ���)������������ ��� �*��
���&�� +,-� ��.�����.� ����) � �������.� ����)�� ����
��/���)� �����0)����������� ����/��� ��� ��.�����.�
����*�� ��1� ���&����0�)������������������������������&�� �
�))�/��.� ����� 0�����0�������� .)���))�� ��������������))�)�
���)�0������� /��*���� 0���)�2� )�����.� 0����1� #��*�
�������� *���� ����� ��00�����)� ���.��� ��� ������� ���
���)�0��������3�0��1�"���*����*��*��� �������������$�)���
�*����)���� ��� �����))�� ���������)� � ���� �*��� ��� ����
�����������/�))�/��*���*�� ��� ���)����� )�������0*����
����&1��*�� ������ ��� �*�� ���0����� �*�� ����������������
���*�������������$�)���/�����������))������)�������� �*��
����� ����� ��� )���� � ���*� �������� /��� ���)�� ��*��
�����������)��/��*������))�����)����.��*�� )���������������
�����.� ����� �00����� �*��� �����)� ����������)���1� ���
���)��� �*�� ��������� � /�� �����.���� �*�� /*�)�� ���&��
������� ��� 0�))��������� /��*� �*�� ���$�)��� ����� ��� �*��
���������������������� �%��2��))�1��*�������.��*��������
�2������� � ��0)����.� �*�� ����/��� �0*���0���� ��� ��))��
���)�����*���
)����� ������� � ����)���)� �&�� ���0���0������� �*��� ������
�*������)�0��������.����)����0�))�0����2�����������)�2��)���
���)���)���.�����. ��������0*��.�������*������0�)� �
���� �����1��*�� �����.� �����0��))�� �*���&�����0���0����� �
*��� ����� 0����))�� ����� ��� �*��� ��0*� .���� 0���
�����������)�� ����0�� ����0����� ���)������������ ���
���&�1�
&� � ���
� �*�� ����� +4 5-� ��� �� 0)����6����������� ������� ���
.)���)� 0�������.1� ��� �))�/�� �00���� ��� ��)���)�� ������
0�����������)� ���� ��������� �����1� ����� 0)������ 0���
�������������)�� �00���� ������ 0�����������)� ����0���
���� )��.��.��� ��0*� ��������������1� )���)� 0�������.�
���)�0������� 0��� ��� ���)�� ����)�� ��� ����.� �*������� ������
)������� ��� ��� *����� �*�� 0���)�2������ ��� �*�� ����)���.�
������1�
'� ()*+���)# ��
� �*�� )����� ���)���� ��� �� 0�))�0����� ��� ����)��� �*���
�������� ������������ )�/��)���)� �������� ���
���)�������.� �� ����������� ������� ��� �*�� ��1� ���)�7�
0����� �*�� ����0��� �������� ��� )���� � ��� /*�0*� ��0*�
����0��0����������� �����������)��/*���������1�8��.����
����� ���0�������� ��� �*�� ����� �)������ ����)��� ���
���&�1�
$�� 9� ��� $�0����� �������0���� : $�;� ������ ��� �*��
0���������*����0������ ��0�)��������)���.��))� �*�� ��������
��� )����1� ��� ����)��� ���.)�� ��.����� ����.� 0�����0����
��)�.���������������&%�1�
���9� )����������0���))�0����������.��: ���;����
�� <��0��� �����=� �*������*����0�����0)����������.� $��������
0�����0���� � ����� ��� �*�� )�0�)� ���� �00���� � ���� ��������
�2�0����)����)��1�
�$9� ��������.� ���� ��0�����.� $���0�� :�$;� ��� ��
���0��������0���*���������������0�������������/��*���
�*�� ��1� �$� 0�������� ��� �/�� )����� ��� !�.*�/��.*��
��0���� �00���� &���0�)� :!�&;� ����� � ��� ����2�
224 Int'l Conf. Grid Computing and Applications | GCA'08 |

�
����������� $���0�� : ��$; � /*�0*� ����.��� ��3�0��/�����
���������� � ���� ��� �����0�� ����������� $���0��
: ��$; �/*�0*������������)����������)�0�)�����������1�
)������6"9� )������6"� ����)��� ��0��� 0������0������
���/���� ��� ����� ����.� $� � �������.� ��������
���6/�����&�� ��)�������)�0���.��6"��*��� ����.�����/��*�
�*�� )������*�����)����1�
�$$� 9� )���)� �00���� ��� $�0������ $���.�� : �$$;�
����������������������)�����������0�)�����0���� �������1�
�$$� 0��� ��� ����� ��� 0��3��0����� /��*� ���� ��� ���.��
0)������������)���+>-�
���)��7;�� )���������0���$���0�� ����)������� ��0�������$�0�����
�
�����������
�������0����
�
�����0������.�����
�
��������.������
�
�������0������
�
�
�
�
�
�
$��
�
�$6 ��$6 ��$�
�
���6��"��
�
�$$6 �����&�
�
��2��6 )������6"�
�
$��.)����.���� �
���*����0������
�
���������������0��
�
��������.�����0��
����.������
�
�������������00����
�
�������0������
����0��
�
�
,���(����-��������
� ���&�� ��� �� ��.�����.� ����)� ������ ��� 0)�����
����� ������ ��0����� 0�))� :�&�;+7?- � /��*� ��������
����������))�/��������.�����.��������������0�����0����
��� �0�������0� ���)�0������� ��� �*�� ��1� ���)�0������
��.������ /���� ��������))�)� 0)����� ��.���� ����.�
����)�� ���� ���������� ���&���&��� �*��� *��������� ��� �*��
0���)�2������ ����)���.� ��� ��.�����.1� ��� �� ���)� �
��.������)�0���.��2�����0��������))�)���.�����. �
)��� �)���� �*�� �� � 0��)�� ���))� 0�����0�� ��� ���)�0�������
�����)���)�1� ��� �*�� ����� ���� � 0����������� �������� ���
��0����)����� ����� ��� �2�0����)�� 0��������� 0�))��� �*��
������� '2�0����)�1� �)����� ��.��� ����0�))�� ��������
�������'2�0����)�������@�����0�������������������������
�*�� ����A� ����0*������ ���))�)� �2�0������� ��� ��)���)��
������� '2�0����)��� ��� ��������� ������ ���)�� ��� ����)��
����3���� ���))�)� �2�0����� � /*�)�� ������� ���&��
����0������� /��*� 0���)�2� ���0*����������� ���)���.� ���
.����)����� �������))�)� 0������������ ��� �)��� ������)�� ���
�*�� ��.������ *���� 0����)� ���� �*�� �������
'2�0����)�������))��*��0����������������1�
���&�� ������� .����))�� 0�������� ��� �*�� ��))�/��.� ����
0���������9�
�)����� 0��������9� �)����� 0���������� ��� ��.���� �*���
�������@��������� ���&������0�������
'�0*� 0��������� 0�������� ��� �*�����=���������.�������
�*�� ���&��)����1��
$���� 0��������9� $���� 0��������� �������� �������
'2�0����)���������0�������)�/ �
������� �2�0����)�9� ������� '2�0����)��� ������ �*��
�0���)�0���������������*��$���1�
'�0*� 0��������� 0�������� ��� ��������)���� ����������
0������������� ��������.��������������������.�� �����
�����������)����0������0������)����1�
����������� ����0�9� ����������� ����0�� �������� �������
����������� ��� �*�� 0)����� 0��������� ��� ������� ���� ���
0������0����/��*��*���������'2�0����)��0��������1+> B-�
,� ����.(� ��������������� ��� ���� (������
����"���
������������� ��)�� � ��� 0������� ��� �������� ��0���������
��� ����� ��� /*�0*� �*�� )����� ������0�� /��� ������ ��� ���
�����*��.*� �������� ���������������� �����.����� )�����
0���������� ���0�)�� ��� ���)������ �*�� ���&�� �������1�
���� ���0���0�))� � ����� � ���)���� �*�� ��))�/��.�
0���������� ���� �*�� )����� ���)���� ��� �*�/�� ��� ��.���
71+>-�
���9� $����� �*�� �)�� ��� �*�� ����� ��� �*�� �)�� �����
������1�
�$9� &��)��*��� ������0�� ����������� ���� ���*����� ���
���&��0���������1�
)������6"9� �)����� ���� ������ �2�0����)�� 0������0����
/��*���0*���*������.� )������6"1�
�$$� 9� �����0��� ������� ���� ����� ��� �*�� ���&��
0�������������*��0)�����0����)�1�
Int'l Conf. Grid Computing and Applications | GCA'08 | 225

�
�
1�/���- ��������.(������ � *��� �/�� 0���.����� ��� �&��1� "��� ��� �*�� �����
0�������)�� <)�.�0�=� �&� � ���� �*�� ��*�� ��� �*�� ��/� :)�/�
)���);� ���&�� �&�� �*��� *��� ����� ���3�0���� ���
0�))��������� ��������������� �0��������� ��� �*�� )���)� ���
�����/��*� �*�����$�)��� ����� ������%1������ �������
��� ���� ��� �*�� �����0�� ���)������������ ��� �*�� ���&��
�&�1� &��0���)� ���0������ ��� ���&�� �&�� ��� �*�/�� ���
���)�,1+>-1�
���)��,;� ���&���&�����0���)����0������
���0����� ��0�������
����
.�0C���0����C*���)�C�����
:�
.�0C���0����C*���)�C�� D�
*���)� �
0*��D�*���C���� �
������� �
0*��D����0C����;A�
������)����� ���0����� *���)��
����.� �*�� ��������
�����������
����.�0C/���C����:�
����D���&�;A�
8���� ��� 0���)������ ��� ����
��� �*�� �&��� �������� ���
.�0C0�))C����0������*����
����.�0C0�))�:�
.�0C���0����C*���)�C��D �
�����;A�
&������ �� �)�0���.� �&��
/��*��*�����0�����*���)������
�.������1��*���0�))��)�0���
����)��&��0���)����1�
����.�0C0�))C����0�:�
.�0C���0����C*���)�C��D �
�����;A�
&��������
����)�0���.:����0*�����;�
�&��/��*��*�����0�����
*���)�������.������1��
���� .�0C/���:����
��������;A�
8���� ��� 0���)������ ��� �*��
�������� ���0������ ��� �*��
��������1�
�
0�����������-������
�*�� ����� &���)� +E-� ��0�)������� �*�� ����)������� ��� ���
����)�������������0�))��.�������.�������)� ��������� �*���
0����������� F$&����� F����$��)���� ������ ������)�0������
������0������������!��.��.��:�!;������������G�!1��*��
�����&���)��*������)������� ����&�������� ���0*���������
���������0��/��*���0����� �������0��1�
��.��� 4� �*�/�� �*�� �0*���0���� �������� &���)1� �*�������
&���)� ����� F������ � ��� �00���� ����&�2�� ����� ��� �*��
����.�������������0�������)�1�
1��2�-�
�*������)�����������0� �/*�0*�0�����������F$&������F����
$��)��� 0��������������0�))��.������������*�������&���)1�
�*�� F$&� ��� ����� ��� �����0�� /��*� ����� ���� ����)���
�����.��� ��� �*�� 0)���������1� �*��� 0��� �)��� �������
��������� ���� �� ����� *���)��.� $��)�� � /*�0*� ��� ����� ���
���� ��)������ ���� � �2�0���� �� ��� ���)�0������ ����
.������������)�����������.�1�
3������.(�
����� �����*�� ��������������*���������������*����������
���� ��� �*�� �, � ������.����/��������������0�)� )�����
���0�����)���� ���� �*�� ���� ��� �&�� ��0*��)�.�1� ����� �
�������� ����0*������ 0������0������� ���/���� ����� �
0)��������������� ������1�
�
�
�� ��'�4;������������ �� ������������
4��(���������
��$�����+H- �����2������������*�������&���) ���������)����
��� ���)���.� ��� ����)�1� ��� �������� �� ��� ���)�0������
����)�*�����.� ����� �*��� ��������0�))�� .�������� ����
���)��*��� �� 0���������� 8��� ������0�� ��� �00�����.� �*��
226 Int'l Conf. Grid Computing and Applications | GCA'08 |

�
��0����� ��� ����0��1� �*������� ���� ��� ��$����� ��� ���
*���� �*�� 0���)�2���� ��� �*�� ����)���.� �������0���� ����
��� ����1� ��� �))�/�� ����)����� ��� ������� ���� ���)�� �*���
��� ���)�0����������)�� ��� �*�� �)�1� ��$����� ��0��������
�*�� .��������� ��� ����)�� ��� ���0���0� ���)�0������� �*���
������� ����0��� ��� ������)����.� 0���)�2� ������ ��� �*��
��1� ��.��� 5� �*�/�� �*�� �0*���0���� ��� ��$����1� �*��
�����0�����������������)�����0�������)�/1�
"��� �&������
#�������� �,� $� ��*���00���������))�����������������
���*����0������ ���� ���*��������1� ���� 0�������)�� ���
����.��� ��� ����&�2�� ����� ���� �00������ ���� �*�� F����
�� ����1�
'� ������ �
�*������ �*���������������0�����9���� ����)�0����������
����0�1�� ���� ���0����� 0�������� ����������� �.����.�
�����=���00��������������� ���)�������.�����������)�0������
����)�������*��)�0����������*����&�2��������*�����������
�����������*�����=��0�������)���
�
��.��5�;��*���0*���0������� ��$�����
�
�� ����0�����0�����0�������� ������������)����� ���*�/�
��� �00���� �� ����0�1� ��� ���)�0������ ���0����� 0��������
����������� �)����� ��� ���)�0������ ���������� � ��0*� ���
�������� � ����)���� ��)��� ���� �����1� '�0*� ���0�����
0�������� ��� ��� G�!� ��0������ �������� ��� �� ��$�����
G�!�$0*���1�
'� ���������� �����
�*�� ��0����� ���������� ��� ����� ��� ���0*��. � �����.�
����������.��))��.����������0�����1�
�
"���������(�������������
�*�����)�0������&���)� �����������*��0���0������������
�*�� ��$����� ���)���1� ��� .�������� ��� ���)�0������ ����)�
������0�� ���� �� ���� ��� �@����� ���0������ �*��� ���
������0�))�� )������ ���� �*�� ��0����� ���������1� �*��
.������� �������� �*�� ��0������G�!���0������ �/*�0*�
��� �*��� ���*�))��� ����� F���� ��3�0��� ���� ������ +B- � ���
��������0�� ����� ������.� ����/��� ��� F���� �*��� 0���
.������� F���� ��3�0��� ���� G�!� ���0�������1� �*��
.�����������0�����F$&���)�������*��F������3�0�� �/*�0*�
���)�������*���0���)����)�0����������)���.�1+I-�
&5� ������������
� 8�����0������*��0��0����������*�����)��������������
�� )����������� ���&�� ������� ����� 1� �*����� ��� �*��
)����� ���)��� � ����� � ��/� �������� �� ��0��� ����
���������)�� ���&�� ����/�� � 0������� ��� ����
����0����1�����)������.������*�� )��������)�����))�/���
������0����0������������������)�����������*��0��������� �
��0�)������.� ����0����� ����)������ � �������.� �*�� 0)����
����� ��� �*�� )����� ����)������� ����1� &�)�������
���)������� �*�/�� �*��� �*�� ������)� ���*���� :����)���.�
����)�� �$� )������ ���� ���� ����0������ 0���;� ��� ����
�����)� ���� �00�����)� � ����0��))�� /*��� �*�� ����� ����� ���
)�.�1�8���*��)� �*�/��� ��������/����������0���*���0����
��� �2�������� 0�0*��.� ��� ���&�� ������� ��� �*�� ������
���������������� 1�
&&�������������
�
+7-�*�������� �� �����������.9���&�0��0�)� ��������
��0*��)�.���������)�0�������� �����)�#:,??5;�
�
+,-���$ �*���9660������10��10*68�)0���1*��)6�
�
+4-$���� � � ������� J � $���.�0*�� $ � ��������� $ �
��.��*���� � � ����.�� J1� ����9� �� ���/��� ������
����������� )����� ��� �� .)���)� /�)��/���� 0�������.�
�������0���1� J�.*�&������0�� ��������.� ����
���/����.� :!�0���� ������ ��� �������� $0���0� � ��)1�
7,,>;1�$���.� �7IIE1�
+5-� J1� ������ � �1� $��� � $1� $���.�0*� � ���.�� ����
���)������������ ��� ����9� ��/���� �� )���)� ��������.�
�������0��� � ������ ��������� ��������.� $������ �
����0�������.�$��0��)������ "0�����7III1�
+>-� ���� #����� � ���*���� F1� 1J'K � ������� �1��2� A�
L.���0�������.������.��*��.)���)��������0��������)���M�
/�))��:,??4;�
+B-������*���������� ���0*�)���%����� ������0����)���9�
L�� ���&�.�����.�&����&�.�����.�
Int'l Conf. Grid Computing and Applications | GCA'08 | 227

�
����)�8����.� ���M � )���)� ��������7 ��������� ���0*�5�E �,??7�
�
+E-�$������ ��1� ��� �)1���������,??,1��*�������&���)9�
��� ��������0� ��������� ���)� ��� �*�� ��� &���)�1�
�0�����.�� ��� F���� ����� ,??, � $����)� �
8��*��.��� �$�1���������1�
+H-���!�$ �*���966��)���2�������1�.61�
+I-�����*���)�� �����#��� ��*��.���0�����0*��)�.��� �
8�!'K �,??>�
�
+7?-�J��*����)��/���� ��������������)��� ������0���
�����������0*�0�����������))�)���0�����. 8�!'K �
,??>�
�
�
228 Int'l Conf. Grid Computing and Applications | GCA'08 |

SESSION
LATE PAPERS
Chair(s)
TBA
Int'l Conf. Grid Computing and Applications | GCA'08 | 229

230 Int'l Conf. Grid Computing and Applications | GCA'08 |

Implementation of Enhanced Reflective Meta Object to Address Issues Related to Contractual
Resource Sharing within Ad-hoc Grid Environments
Syed Alam, Norlaily Yaacob and Anthony Godwin Faculty of Engineering and Computing
Coventry University, Priory Street, Coventry CV1 5FB, UK {aa117, n.yaacob, a.n.godwin} @coventry.ac.uk
Abstract ⎯ Grid technologies allows for policy based resource sharing. The sharing of these resources can be subject to constraints such as committed consumption limitation or on timing basis. These ad hoc grid environments where non dedicated resources are shared, introduces several interesting challenges interims of scheduling, monitoring, auditing resource consumption and the issues of migration of tasks. This work attempts to propose a possible framework for non-dedicated ad-hoc grid environments based on Computational Reflection’s Meta object programming paradigm. The framework uses the Grid Meta Object with enhanced properties to aid in monitoring and migration related tasks.
Index Terms- Grid Computing, Middleware, Meta Object, Monitoring, Migration
1. INTRODUCTION Sharing of resources within grid environment[1,2] can be based on various computing factors such as CPU Cycles, Memory Consumption and Disk usage etc. With recent adoption of grid technology in various non-dedicated computing environments such as mobile computing devices, this resource sharing can also be based upon non-computing factor such as time. An example of this can be an enterprise using their Local Area Network computers within a grid environment during the non business or some other dedicated hours. Sharing of such nature introduces several interesting challenges in terms of controlling and managing resource allocation and consumption. If a grid job is requesting further resource consumption and the node has reached the committed grid resource level then a suitable strategy needs to be introduced.
In the above scenario a possible strategy may be to immediately abort the grid job since the committed resource level has been reached. However, an immediate abortion will result in an incomplete grid job. A fair policy in such scenario needs to look at the contract of resource sharing as being hard or soft. We refer to hard resource sharing as a fixed resource commitment and consumption model where no further resource access is possible beyond the committed level. On the other hand, soft resource sharing refers to a less restrictive resource sharing variant allowing consumption beyond the committed level. An employable grid computing model for both the hard and soft resource sharing requires monitoring and auditing of committed resources. Apart from monitoring, such models also need to provide support for job migration so that after consuming committed resources on the execution node the job may migrate to another node if possible. Migration of a job to another node will require identification of a suitable grid node and validation of its pre-requisites on the available node. These pre-requisites may be availability of specific runtime or a specific version of an operating system. The status of the job also needs to be archived and the job needs to be started from the last point of migration.
The rest of the paper discusses how computational reflection aids in addressing the contractual resource sharing issues within ad-hoc grid environments: Section 2 provides a discussion on ad-hoc resource sharing. Section 3 addresses the properties of Grid Meta object and how they can be used in a larger framework. Section 4 comments on possible costs and overheads of the proposed framework and finally the conclusions and future work is presented in section 5.
Int'l Conf. Grid Computing and Applications | GCA'08 | 231

2. RESOURCE SHARING ISSUES IN AD-HOC GRID ENVIRONMENTS
A major issue within ad-hoc grid environment is that the resources are shared on a temporal basis. For example a non dedicated grid user may become the member of the grid community for a specific duration of time willing to commit a limited quantity of resources. This contributes towards issues relating to control and consumption of resource availability and monitoring during this ad-hoc grid membership. It also leads to overheads of monitoring and auditing of these temporal nodes for their availability and the status of any jobs being submitted to them. Due to the ad-hoc nature of the grid membership, a binding contract for resource sharing needs to be addressed in order to secure the availability of the temporal node for the duration on the contract. The grid infrastructure should cater for these contractual needs of the negotiating nodes. These contractual needs can be of diverse nature. For example, a node may wish to commit a specific amount of disk space or a specific amount of CPU cycles during specific hours. These resource sharing constraints need to be addressed by the grid framework.
3. GRID META OBJECT
Computational Reflection [3] and its implementation techniques [4] allow support for monitoring of objects by allowing a base object to be monitored by a connected Meta object. The Meta object maintains a casual connection with the base object and utilizes a data structure to store the monitoring information. Our implementation of the Grid Meta Object [13] supports the JAVA [6] platform with built-in monitoring support (See figure 1)
Fig 1. Base and Meta Object with the Implementation Framework The major components [7, 8 and 9] of the implementation framework are based on JAVA technology to support heterogeneous grid environments. Our work has proposed several enhancements to the traditional Meta object structure
to favor grid environments. We have proposed the following enhanced set of properties:
• Ability to maintain base object status information: This is same as the classic base and Meta object model where the ability to maintain base object status information is acquired through a suitable structure and a casual connection with the base object. •Ability to acquire node identification/environment information: An interesting property is base object's access to its execution environment. This is implicitly known to the base object and is not modeled explicitly. However, for grid Meta object the Meta object must have some kind of property to identify its execution node by a unique identifier such as node's IP. This will assist in migration of Meta object to identify the source and destination nodes of the Meta object. • Ability to send and receive through broadcast channel: The Meta object should be allowed to send and receive data through some kind of broadcast channel so that exact replica of the Meta object on other grid nodes can maintain replica Meta objects for specific purpose. • Ability to maintain migration, special action flag methods: A meta object should be allowed to store specific action flag methods and be able to store associated action, such as, if an exception occurs in the base object or a specific function is called on base object, the meta object can perform some special kind of action, such as broadcasting a message to associated remote meta object or node or start negotiating migration process to another node. • Ability to maintain specific call and action structure: This is the same case as above with the only difference that there may be a stack of action and an alternate action defined. • Ability to serialize: Meta object should have the ability to be serialized on streams so that they can have persistence and their life span is not only restricted to the in-memory execution life cycle. Persisting Meta object will help further analysis of Meta objects after execution life cycle is finished and broadcast of Meta object through streams such as disk or socket can become a possibility.
3.1 ADVANTAGES OF GRID META OBJECT The proposed Meta object properties offer the following advantages to the grid environment:
232 Int'l Conf. Grid Computing and Applications | GCA'08 |
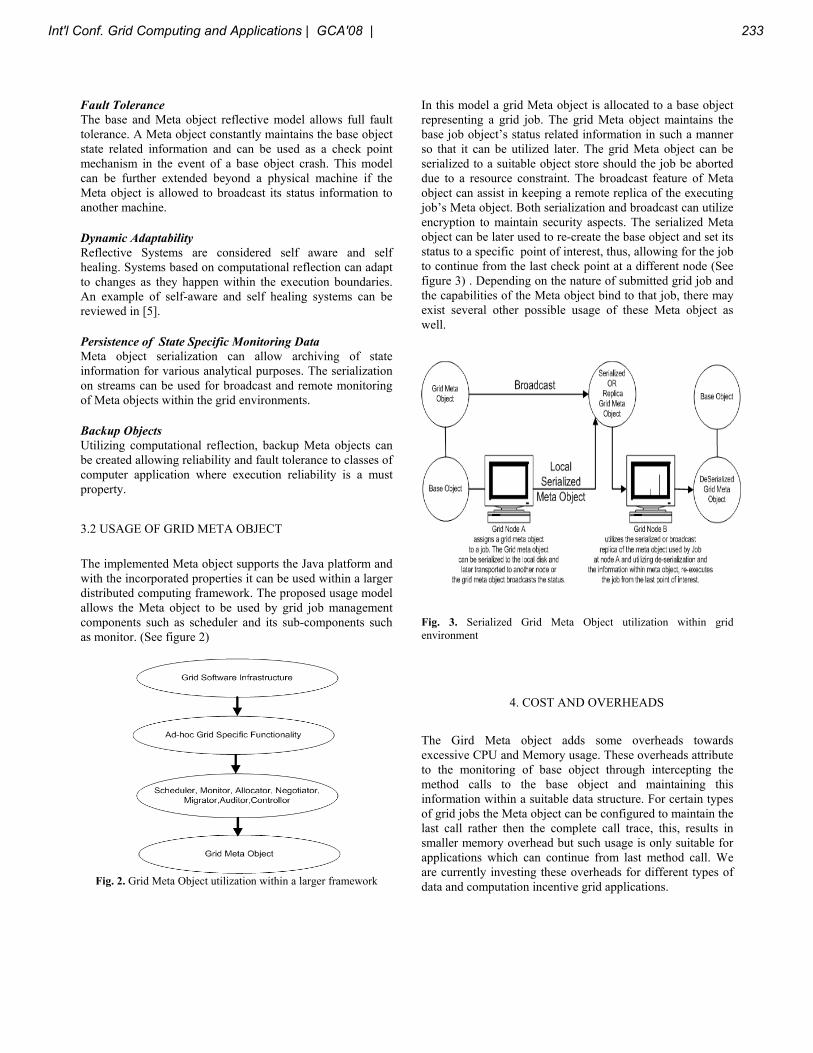
Fault Tolerance The base and Meta object reflective model allows full fault tolerance. A Meta object constantly maintains the base object state related information and can be used as a check point mechanism in the event of a base object crash. This model can be further extended beyond a physical machine if the Meta object is allowed to broadcast its status information to another machine. Dynamic Adaptability Reflective Systems are considered self aware and self healing. Systems based on computational reflection can adapt to changes as they happen within the execution boundaries. An example of self-aware and self healing systems can be reviewed in [5]. Persistence of State Specific Monitoring Data Meta object serialization can allow archiving of state information for various analytical purposes. The serialization on streams can be used for broadcast and remote monitoring of Meta objects within the grid environments. Backup Objects Utilizing computational reflection, backup Meta objects can be created allowing reliability and fault tolerance to classes of computer application where execution reliability is a must property.
3.2 USAGE OF GRID META OBJECT The implemented Meta object supports the Java platform and with the incorporated properties it can be used within a larger distributed computing framework. The proposed usage model allows the Meta object to be used by grid job management components such as scheduler and its sub-components such as monitor. (See figure 2)
Fig. 2. Grid Meta Object utilization within a larger framework
In this model a grid Meta object is allocated to a base object representing a grid job. The grid Meta object maintains the base job object’s status related information in such a manner so that it can be utilized later. The grid Meta object can be serialized to a suitable object store should the job be aborted due to a resource constraint. The broadcast feature of Meta object can assist in keeping a remote replica of the executing job’s Meta object. Both serialization and broadcast can utilize encryption to maintain security aspects. The serialized Meta object can be later used to re-create the base object and set its status to a specific point of interest, thus, allowing for the job to continue from the last check point at a different node (See figure 3) . Depending on the nature of submitted grid job and the capabilities of the Meta object bind to that job, there may exist several other possible usage of these Meta object as well.
Fig. 3. Serialized Grid Meta Object utilization within grid environment
4. COST AND OVERHEADS
The Gird Meta object adds some overheads towards excessive CPU and Memory usage. These overheads attribute to the monitoring of base object through intercepting the method calls to the base object and maintaining this information within a suitable data structure. For certain types of grid jobs the Meta object can be configured to maintain the last call rather then the complete call trace, this, results in smaller memory overhead but such usage is only suitable for applications which can continue from last method call. We are currently investing these overheads for different types of data and computation incentive grid applications.
Int'l Conf. Grid Computing and Applications | GCA'08 | 233

5. CONCLUSION AND FUTURE WORK This paper has presented a proposed model for efficient Grid Meta object usage as part of a larger framework to address the issues related to contractual resource sharing with in ad-hoc Grid platform. The work is a continuation of our progress as reported in [10, 11, 12 and 13]. The work attempts to identify suitable Meta object properties to favor grid computing environments and argues that Meta object should be allowed their own specific properties other than their conventional usage limitations. We are currently investigating the overheads and possibilities of Grid Meta object usage towards various kinds of data and computational intensive grid applications.
REFERENCES
[1] I. Foster, C. Kesselman, and S. Tuecke. "The Anatomy of the Grid:
Enabling Scalable Virtual Organizations". In the International Journal of High Performance Computing Applications, vol. 15, pp. 200 - 222, 2001.
[2] I. Foster and C. Kesselman, “Globus: A Metacomputing Infrastructure Toolkit.” In the International Journal of Supercomputer Applications, vol.11, no. 2, pp. 115-128, 1997.
[3] P. Maes, “Concepts and Experiments in Computational Reflection”. In the OOPSLA Conference on Object-Oriented Programming: Systems and Applications, pp. 147 – 154, 1987.
[4] N. Yaacob. “Reflective Computation in Concurrent Object-based
Languages: A Transformational Approach”. PhD Thesis, University of Exeter, UK, 1999.
[5] G. S. Blair, G. Coulson, L. Blair, H. Duran-Limon, P. Grace, R. Moreira and N. Parlavantzas. “Reflection, Self-Awareness and Self-Healing”. In Proceedings of Workshop on Self-Healing Systems '02, Charleston, SC, 2002.
[6] James Gosling, Bill Joy, Guy Steele and Gilad Bracha. “The Java Language Specification, Third Edition”. Addison-Wesley, Reading, Massachusetts, 2004.
[7] S. Chiba “Load-time Structural Reflection in Java”. In the ECOOP 2000 – Object-Oriented Programming, LNCS 1850, Springer Verlag, pp. 313 –336, 2000.
[8] A. W. Keen, T. Ge, Justin T. Marin, R. Olsson. “JR: Flexible Distributed Programming in Extended Java”. In the ACM Transactions on Programming Languages and Systems, vol. 26, no. 3, pp. 578- 608, 2004.
[9] www.hyperic.com/products/sigar.html
[10] Yaacob N, Godwin A.N. and Alam S., “Reflective Approach to
Concurrent Resource Sharing for Grid Computing”, In Proceedings of the 2005 International Conference on Grid Computing and Applications, GCA '05, Las Vegas, USA, ISBN: 1-932415-57-2.
[11] Norlaily Yaacob, Anthony Godwin and Syed Alam, “Meta Level Architecture for Management of Resources in Grid Computing”, International Conference on Computational Science and Engineering (ICCSE 2005) June 2005, Istanbul, pp: 299-304, ISBN: 975-561-266-1.
[12] N. Yaacob, A. Godwin and S. Alam, “Resource Monitoring in Grid Computing Environment Using Computational Reflection and Extended JAVA – JR”, In 2nd International Computer Engineering Conference Engineering the Information Society, ICENCO'2006 , Faculty of Engineering, Cairo University, Cairo, EGYPT December 26-28,2006.
[13] Yaacob N, Godwin A.N. and Alam S., “Developing a Reflective Framework for Resource and Process Monitoring within Grid Environments”, In Proceedings of the 2007 International Conference on Grid Computing and Applications, GCA '07, Las Vegas, USA.
234 Int'l Conf. Grid Computing and Applications | GCA'08 |

Enhanced File Sharing Service among Registered Nodes in Advanced Collaborating Environment
for Efficient User Collaboration
Mohammad Rezwanul Huq, Prof. Dr. M. A. Mottalib,
Md. Ali Ashik Khan, Md. Rezwanur Rahman, Tamkin Khan Avi
Department of Computer Science and Information Technology (CIT), Islamic University of Technology (IUT),
Gazipur, Dhaka, Bangladesh.
[email protected], [email protected], [email protected], [email protected], [email protected],
Abstract – Now-a-days, it is extremely necessary to provide file sharing and adaptation in a collaborative environment. Through file sharing and adaptation among users at different nodes in a collaborative environment, highest degree of collaboration can be achieved. Some authors have already proposed file sharing and adaptation framework. As per their proposed framework, users are allowed to share adapted files among them, invoking their file sharing and adaptation service built on the top of advanced collaborating environment. The goal of this adaptation approach is to provide the best possible adaptation scheme and convert the file according to this scheme keeping in mind the user’s preferences and device capabilities.
In this paper, we propose some new features for file sharing and adaptation framework to have faster and more efficient collaboration among users in advanced collaborating environment. We are proposing a mechanism that enables the other slave ACE nodes along with the requesting node to share the adapted files, where the nodes should have device capabilities similar to the requesting slave ACE node as well as they should be registered to the master ACE node. This approach will radically reduce not only the chance of redundant requests from different slave ACE nodes for sharing the same file in adapted form but also the adaptation overhead for adapting and sharing the same file for different slave ACE nodes. The registered nodes would also have the privilege to upload files to the server via master node. We distinguish each file according to their hit ratio that has been known from historical data so that only the frequently accessed files can be shared automatically among all other authenticated slave ACE nodes. This approach leads towards better collaboration among the users of ACE.
Keywords: File Sharing, Registered Node, Hit Ratio, User Collaboration
1 Introduction The concept of advanced collaborating environment is essential to provide interactive communication among a group of users. The traditional video conferencing becomes obsolete now-a-days due to the advancement in the field of networking and multimedia technology. The 3R factor that is- Right People, Right data and Right time, is the major concern of ACE, in order to perform a task, solve a problem, or simply discuss something of common interest [1]. Figure 1 depicts the concept of Advanced Collaborating Environment (ACE), where media, data, applications are shared among participants joining a collaboration session via multi-party networking [2]. Some early prototypes of ACE have been mainly applied to large-scale distributed meetings, seminar or lectures and collaborative work sessions, tutorials, training etc [3], [4]. Advanced Collaborating Environment (ACE) has been realized on the top of Access Grid which is a group to-group collaboration environment with an ensemble of resources including multimedia, large-format displays, and interactive conferencing tools. It has very effectively envisioned the implementation of ACE in real life scenario. The term venue server and venues come from the Access Grid multi party collaboration system [4], [5]. In [6], a file sharing and adaptation framework has been proposed for ACE. Through this framework, users at slave ACE nodes can share adapted files through master ACE node. Master ACE node has the capability to directly communicate to venue through venue client as well as venue server [6]. Slave ACE node has less capability compared to Master ACE Node in terms of device configuration as well as it cannot communicate to Venue and Venue Server directly [6]. Figure 2 shows the connectivity among master ACE
Int'l Conf. Grid Computing and Applications | GCA'08 | 235

nodes, slave ACE nodes and venue server. For file adaptation, a hybrid approach has been mentioned for adapting files which considers user’s preferences as well as user’s device capabilities. In our work, we give emphasize to build some extended feature on the top of [6] so that the degree of user collaboration can be radically increased. Our extended feature will allow any slave ACE node to share adapted files depending on its own device capabilities where the request has been originated from another slave ACE node. Moreover, we provide some privilege to registered slave ACE nodes to upload file in venue server. For providing intelligent collaboration only the frequently accessed files will be automatically shared among slave ACE nodes. To serve this purpose, we use hit ratio of accessing files to distinguish the files in two categories: hot and cold. The rest of the paper is organized as follows. In Section 2, the Problem Statement is specified clearly. Section 3 begins the discussion of related work followed by the contribution of our work is evidently described in section 4. In section 5, we describe our proposed mechanism followed by the current implementation status as well as different implementation issues to be addressed in section 6. Finally, we draw conclusion and talk about some of our future works in section 7.
2 Problem Statement In this paper, we have tried to enhance the efficiency of file sharing and adaptation framework described in [6] by introducing slave node registration to facilitate file uploading to the venue server, reducing redundancy of file adaptation requests and applying hit ratio analysis for better collaboration. These new features allow users at Slave ACE nodes to share files in an efficient and faster way which will definitely increase user collaboration. Thus our problem statement may be summarized as follows: To provide file uploading privilege as well as efficient and faster file sharing capabilities to the users at slave ACE nodes by reducing not only the chance of redundant
requests from other slave ACE nodes for sharing the same file but also the adaptation overhead to adapt the same file from master node. Moreover, to provide better and intelligent collaboration among the users by advertising about frequently accessed files through multicast messages to registered slave ACE nodes. 3 Related Work Much research has been initiated in the area of context-aware computing in the past few years. Many projects have been initiated for developing interactive collaboration. These projects enable users to collaborate with each other for sharing files and other media types. The Gaia [7], [8], [9] is a distributed middleware infrastructure that manages seamless interaction and coordination among software entities and heterogeneous networked devices. A Gaia component is software module
that can be executed on any device within an Active Space. Gaia a number of services, including a context service, an event manager, a presence service, a repository and context file system. On top of these basic services, Gaia’s application framework provides mobility, adaptation and dynamic binding of components. Aura [10], [11] allows a user to migrate the application from one environment to another such that the execution of these tasks maximizes the use of available resources and minimizes user distraction. Two middleware building blocks of Aura are Coda and Odyssey. Coda is an experimental file system that offers seamless access to data [10] by relying heavily on caching. Odyssey includes application aware adaptations that offer energy-awareness and bandwidth-awareness to extend battery life and improve multimedia data access on mobile devices. The work on user-centric content adaptation [12] proposed a decision engine that is user-centric with QoS awareness, which can automatically negotiate for the appropriate adaptation decision to use in the synthesis of an optimal adapted version. The decision engine will look for the best
Figure 1 : Advanced Collaborating Environment (ACE)
Figure 2 : Master and Slave ACE nodes
236 Int'l Conf. Grid Computing and Applications | GCA'08 |

trade off among various parameters in order to reduce the loss of quality in various domains. The decision has been designed for the content adaptation in mobile computing environment. The work described in [6] proposed a file sharing and adaptation framework. In [6], users are allowed to share adapted files among them, invoking their file sharing and adaptation service built on the top of advanced collaborating environment. The goal of this adaptation approach is to provide the best possible adaptation scheme and convert the file according to this scheme keeping in mind the user’s preferences and device capabilities. But in their proposed framework, they didn’t allow slave ACE nodes to upload file. Moreover, only the requesting slave ACE node receives the adapted files but other ACE nodes may initiate another request to share the same file which incurs a lot of processing overhead to the master ACE node. We have tried to extend the service provided by [6] in our work. In later sections, we discuss our proposed mechanism to enhance the file sharing service proposed in [6] in detail.
4 Our Contribution To the best of our knowledge there is not much work in the issues like Data Adaptation and File Sharing in Advanced Collaborating Environment, though other related fields had been explored as we described in the previous section. File Sharing and Adaptation Framework illustrated in [6] includes file sharing and data adaptation service. File sharing service is demonstrated by the realization of data adaptation service. These two services are very much necessary to provide effective collaboration among users in advanced collaborating environment. But there are some problems associated with this approach. As for example, in the existing framework, the slave ACE nodes cannot upload any data or file in the venue server which hinders to achieve maximum collaboration among ACE nodes. Again another drawback is, if there were multiple requests from different nodes of compatible device capabilities, the data adaptation technique must be repeated several times, which is an absolute overhead for the overall system. Furthermore, no automated features for enhancing user satisfaction have been found in the existing framework. Our target is to provide some extended features on the top of the existing framework so that the highest degree of collaboration among users can be realized. In this paper, we have tried to identify these problems and provide some effective solutions to address these issues.To enhance user collaboration, we propose node registration, which ensured a minimal privilege for the slave ACE nodes to upload files to the venue server via master node. We also propose for a data analysis approach based on user preference along with device capability records, which drastically reduces the chance of redundant file adaptation
requests, execution of adaptation process as well as communication overhead. And finally we devise a mechanism to facilitate the users with an intelligent and easy experience of collaboration based on hit ration of files. Thus, the comparison shows that our work will definitely encompass a meaningful advancement over the aforementioned work in the issues of increasing slave node activities to an acceptable extent, reducing the redundant complexity of data adaptation requests, decreasing the communication overhead at the master ACE node with both venue Server and Slave nodes and enhancement of overall collaboration by considering the hit ratio. We believe that our effort will certainly play a leading role for overcoming the deficiencies of this framework and also break new ground for more advancement in this field of research. 5 Proposed Mechanism In this section, we describe in detail the mechanism for our proposal. Before going into the detail, we give some definitions of related terminologies.
• User Registration: In ACE, the user registration is normally done by providing e-mail address along with other necessary information.
• Node registration: Node registration is a proposed feature of our paper, where the network admin of a venue server will authenticate some of the slave ACE nodes as registered node. Thus these nodes would have the privilege of uploading files to the venue server.
• Requesting node: The slave ACE node that requests for a file to master ACE node is termed as requesting node.
• Hit ratio: Hit ratio is the ratio between the number of times a file is requested and the total number of files requested. A mathematical representation of this term can be: Hit ratio, Hf1 = Number of times f1 is requested/ Number of total requests of files. where, f1 is any particular file.
• File counter: A process that counts the number of times a file is requested.
• Threshold Value: It is a dynamic value that is used in our framework to determine the ranking of files according to their hit ratio.
• Hot listed files: The list of files for which the number of requests exceeds the threshold value is termed as hot listed files.
• Cold listed files: The list of files for which the number of requests remains below the threshold value is termed as cold listed files.
Int'l Conf. Grid Computing and Applications | GCA'08 | 237
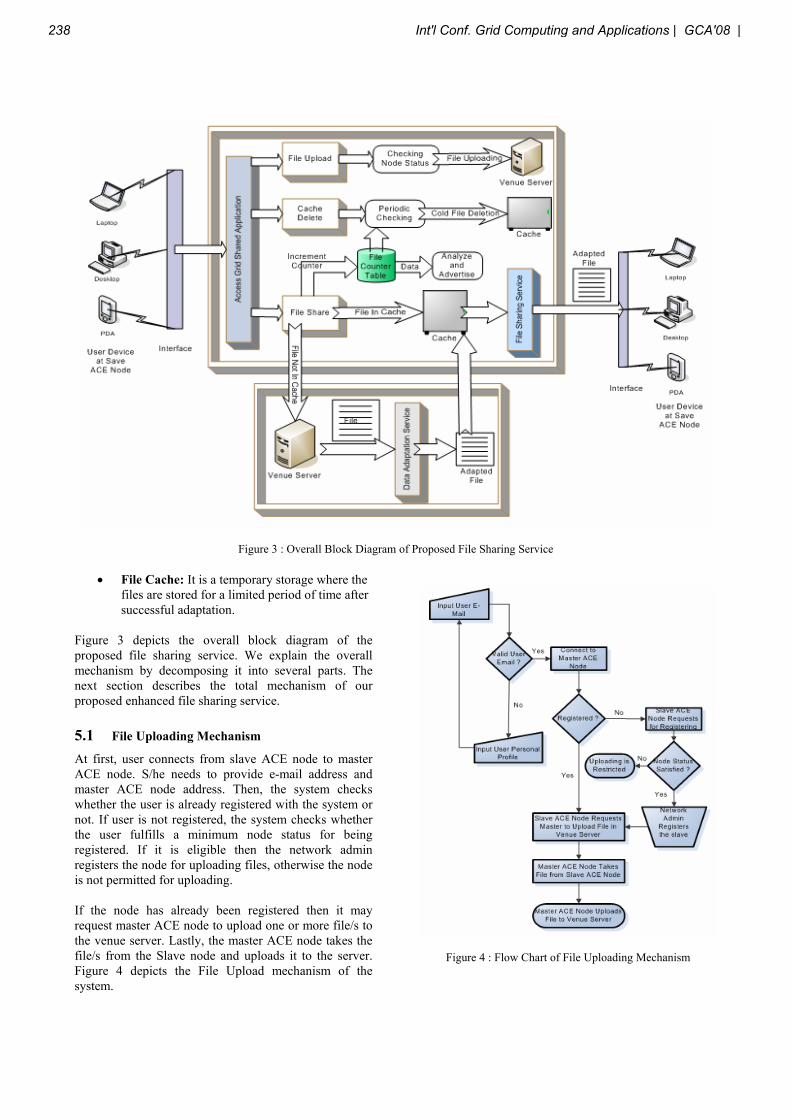
Figure 3 : Overall Block Diagram of Proposed File Sharing Service
• File Cache: It is a temporary storage where the files are stored for a limited period of time after successful adaptation.
Figure 3 depicts the overall block diagram of the proposed file sharing service. We explain the overall mechanism by decomposing it into several parts. The next section describes the total mechanism of our proposed enhanced file sharing service. 5.1 File Uploading Mechanism
At first, user connects from slave ACE node to master ACE node. S/he needs to provide e-mail address and master ACE node address. Then, the system checks whether the user is already registered with the system or not. If user is not registered, the system checks whether the user fulfills a minimum node status for being registered. If it is eligible then the network admin registers the node for uploading files, otherwise the node is not permitted for uploading. If the node has already been registered then it may request master ACE node to upload one or more file/s to the venue server. Lastly, the master ACE node takes the file/s from the Slave node and uploads it to the server. Figure 4 depicts the File Upload mechanism of the system.
Figure 4 : Flow Chart of File Uploading Mechanism
238 Int'l Conf. Grid Computing and Applications | GCA'08 |

5.2 File Sharing Mechanism:
Firstly, user connects from slave ACE node to master ACE node by providing e-mail address, user preference and master ACE node address. After being connected, the slave ACE node requests for a file. The master ACE node increases the hit counter for that particular file. After this, two types of checking are being executed. The system checks whether the hit counter exceeds the threshold value. If yes, an advertise for sharing this adapted file is multicasted to all the slave nodes of compatible device capabilities. The other checking is for whether any adapted version of the requested file of same preference already exists in the cache. If it is available then the file is simply sent by retrieving from the cache. If not then the normal file adaptation approach is followed. Figure 5 depicts the file sharing mechanism of the system.
Figure 5 Flow Chart of File Sharing Mechanism
5.3 Cache Updating Mechanism
At the beginning of this process the system checks whether the periodical time for updating cache has been elapsed or not. If yes then the master ACE node analyzes the hit list data by comparing the file counter with the threshold value. If the file counter of a file is more than the threshold value then that particular file would be treated as hot file and it remains in the cache. If the file counter does not exceed threshold then it is treated as cold item and is
deleted from the cache. Figure 6 depicts the File Sharing mechanism of the system.
Figure 6 Flow Chart of Cache Updating Mechanism 6 Current Implementation Status
and Future Issues Master file sharing service had been implemented as an AG shared application. That is why, it was implemented in python. This module retrieves files from data store at venue server and sends this file for appropriate adaptation. Figure 7 shows the user interface for connecting master ACE node and choosing specific file.
Figure 7: Connecting Master ACE Node and Choosing File
Int'l Conf. Grid Computing and Applications | GCA'08 | 239

Slave file sharing service had been implemented as stand-alone application. It was implemented in python. It provides the user interface for entering venue URL and selecting the desired file. It also shows (see figure 8) the confirmation of successful reception of adapted file to the users at slave ACE nodes.
Figure 8: Confirmation Window of Successful Reception Data adaptation service is a stand-alone application.This module has a decision engine which provides the appropriate adaptation scheme for converting the original file. At the beginning, the user enters his/her e-mail address and preferred file type for sharing. Then, he/she presses the appropriate button for connecting Master ACE node (see figure 7). After pressing the connect button the master file sharing service will connect to the venue data store and retrieves file of user mentioned type. Then, the user will select one of the files. The specified file will be downloaded through the master file sharing service, the decision engine takes the decision of selecting appropriate adaptation method and then it will be passed to the data adaptation service. The function DataAdapter() takes the file and convert it based on the decision provided by the decision engine. Then adapted file will be sent to Slave ACE node by master file sharing serviceandtheadaptedfile will bestoredintothelocal storage of slave ACE node. Figure 8 shows the confirmation screen that adapted file has been successfully received by slave ACE node. There are a lot of future implementation issues which will be discussed in this portion of text. We try to implement each of these features very soon and incorporat eit with our current prototype. The basic requirement of the file upload feature is the node registration. The network admin would register an eligible slave ACE node to provide with the capabilities of uploading files to the venue server. As depicted in the
figure 9, the registered_node table would have node_id as Primary key and device_id as Foreign key referred from the device_profile table. In fact device_MAC field of this table is the main factor to distinguish each machine separately. For enhanced file sharing feature, there are two main concerns. Whether any adapted version of the file exists in the cache, and whether the device capability of the requesting node matches as one of the compatible nodes listed in the table. We explain each of these concerns one by one. The existence of any adapted version of the file in the cache mainly depends on the hit ratio based analysis. A dynamic threshold value is used for ranking the files according to the number of time the file has been requested. That is if the file counter is reaches the threshold value the file is known as Hot File and otherwise it is labeled as cold file. Now the formula for calculating hit ratio devised as follows:
• Hit Ratio, T = (File counter value / Total Number of requests arrived) × 100%
If T > 30% for any particular file, we termed that file as hot file. They are not deleted from the file cache. The files that have T value below the mentioned level are named as Cold files. To update the file cache as well as to obtain free space we need to drain out some Cold files. If T < 5% for any particular file, that cold file is deleted from the cache. One thing must be mentioned here, the deletion of files is done periodically. And this periodical time is a variable measure. For our system we may consider its value equal to 1 week. Now the later concern for file sharing feature is, in case of compatible device capability, we emphasize on lowest possible capability. Whenever we have any particular adapted file in the file cache, then the system searches for the slave nodes those are compatible with the device capability used for adapting that file. To find out a compatible node D (d1, d2……dn), D is acceptable, if and only if
di ≥ vi ( i = 1…n) where, di = device configuration in ith dimension
vi = Lowest possible device capability in ith dimension
We will try to implement the aforementioned feature as soon as possible considering all implementation alternatives. Our proposed enhanced feature can be useful for efficient file sharing. We will implement our module providing enhanced and extended feature in python so that they can be easily pluggable into ACE which has been built on the top of access grid.
240 Int'l Conf. Grid Computing and Applications | GCA'08 |

Figure 9: Schema Design for Backend Database
7 Conclusion and Future Work In this paper, we have presented the enhanced features for file sharing and data adaptation framework in ACE. Our proposed features enable users at Slave ACE nodes to share adapted files faster and intelligently. Moreover, file uploading mechanism allows users at slave ACE nodes to upload files in the venue server as well via master ACE node. These features together realize the improved file sharing service. There is a lot of interesting work to be done in the near future for efficient file sharing and adaptation service. We plan to implement P2P file sharing among the slave ACE nodes. We may also explore the issues like automated device identification for the user and node registration purpose as well as user requirement prediction which will ensure higher degree of user collaboration. We believe our proposal for enhanced file sharing service and the prototype implementation to realize this service will be considered as a leading work in this domain in near future.
References [1] B. Corri, S. Marsh and S. Noel, “Towards Quality of Experience in Advanced Collaborative Environments”, In Proc. of the 3rd Annual Workshop on Advanced Collaborative Environments, 2003. [2] Sangwoo Han, Namgon Kim, and JongWon Kim, “Design of Smart Meeting Space based on AG Service
Composition”, AG Retreat 2007, Chicago, USA, May 2007. [3] R. Stevens, M. E. Papka and T. Disz, “Prototyping the Workspaces of the Future”, IEEE Internet Computing, pp. 51-58, 2003. [4] L. Childers, T. Disz, R. Olson, M. E. Papka, R. Stevens and T. Udeshi, “Access Grid: Immersive Group-to-Group Collaborative Visualization”, In Proc. of Immersive Projection Technology Workshop, 2000. [5] Access Grid, http://www.accessgrid.org/ [6] Mohammad Rezwanul Huq, Young-Koo Lee, Byeong-Soo Jeong, Sungyoung Lee: Towards Building File Sharing and Adaptation Service for Advanced Collaborating Environment. In the International Conference on Information Networking (ICOIN 2008), Busan, Korea, January 23-25, 2008. [7] Anand Ranganathan and Roy H. Campbell, “A Middleware for Context-Aware Agents in Ubiquitous Computing Environments”, In ACM/IFIP/USENIX International Middleware Conference, Brazil, June,2003. [8] The Gaia Project, University of Illinois at Urbana-Champaign, http://choices.cs.uiuc.edu/gaia/, 2003. [9] M. Roman, C. Hess, R. Cerqueira, A. Ranganathan, R. Campbell and KNahrstedt, “A Middleware Infrastructure for Active Spaces”, IEEE Pervasive Computing, vol. 1, no. 4, 2002. [10] M. Satyanarayanan, Project Aura, http://www-2.cs.cmu.edu/~aura/, 2000. [11] M. Satyanarayanan, “Mobile Information Access”, IEEE Personal Communications, http://www-2.cs.cmu.edu/~odyssey/docdir/ieeepcs95.pdf,Feb. 1996. [12] W.Y. Lum and F.C.M. Lau, “User-Centric Content Negotiation for Effective Adaptation Service in Mobile Computing”, IEEE Transactions on Software Engineering, Vol. 29, No. 12, Dec. 2003.
Int'l Conf. Grid Computing and Applications | GCA'08 | 241

Overbooking in Planning Based Scheduling Systems ∗
Georg Birkenheuer #1, Matthias Hovestadt ∗2, Odej Kao ∗3, Kerstin Voss #4
#Paderborn Center for Parallel Computing,Universitat Paderborn
Furstenallee 11, 33102 Paderborn, [email protected] [email protected]
∗Technische Universitat BerlinEinsteinufer 17, 10587 Berlin, Germany
[email protected] [email protected]
Abstract
Nowadays cluster Grids encompass many cluster sys-tems with possible thousands of nodes and processors, of-fering compute power that was inconceivable only a fewyears ago. For attracting commercial users to use these en-vironments, the resource management systems (RMS) haveto be able to negotiate on Service Level Agreements (SLAs),which are defining all service quality requirements of sucha job, e.g. deadlines for job completion. Planning-basedscheduling seems to be well suited to guarantee the SLAadherence of these jobs, since it builds up a schedule for theentire future resource usage. However, it demands the userto give runtime estimates for his job. Since many users arenot able to give exact runtime estimates, it is common prac-tice to overestimate, thus reducing the number of jobs thatthe system is able to accept. In this paper we describe thepotential of overbooking mechanisms for coping with thiseffect.
Keywords: Grid-Scheduling, Overbooking, ResourceManagement, SLA
1 Introduction
Grid Computing is providing computing power for sci-entific and commercial users. Following the common evo-lution in computer technology, the system and network per-formance have constantly increased. The latest step in this
∗The authors would like to thank the EU for partially supporting thiswork within the 6th Framework Programme under contract IST-031772Advanced Risk Assessment and Management for Trustable Grids (As-sessGrid).
process was the introduction of multiple cores per proces-sor, making Grid nodes even more powerful. This evolu-tionary process particularly affects the scheduling compo-nents of resource management systems that are used formanaging cluster systems. On the one hand, the increas-ing number of nodes, processors, and cores results in anincreased degree of freedom for the scheduler, since thescheduler has more options of placing jobs on the nodes(and cores) of the system. On the other hand, also the re-quirements of users have changed. Commercial users askfor contractually fixed service quality levels, e.g. the ad-herence of deadlines. Hence, the scheduler has to respectadditional constraints at scheduling time.
Queuing is a technique used in many currently avail-able resource management systems, e.g. PBS [1], Load-Leveler [2], Grid Engine [3], LSF [4], or Condor [5]. Sincequeueing-based RMS only plan for the present, it is hard toprovide guarantees on future QoS aspects.
Planning-based RMS make functionalities like advancereservations trivial to implement. If a new job enters thesystem, the scheduling component of the RMS tries to placethe new job into the current system schedule, taking aspectslike project-specific resource usage limits, priorities, or ad-ministrative reservations into account. In planning-basedsystems it is mandatory for the user to specify the runtimeof his job. If thinking of the negotiation of Service LevelAgreements, this capability is essential for the provider’sdecision making process. As an example, using fixed reser-vations, specific resources can be reserved in a fixed timeinterval. In addition to plain queuing, the Maui [6] sched-uler also provides planning capabilities. Few other RMSlike OpenCCS [7] have been developed as planning-basedsystems from scratch.
242 Int'l Conf. Grid Computing and Applications | GCA'08 |
However, (fixed) reservations in planning-based systemspotentially result in a high level of fragmentation of thesystem schedule, preventing the achievement of optimal re-source utilization and workload. Moreover, users tend tooverestimate the runtime of their jobs, since a planning-based RMS would terminate jobs once their user-specifiedruntime has expired. This termination is mandatory, if suc-ceeding reservations are scheduled for being executed onthese resources. Overestimation of job runtime inherits anearlier availability of assigned resources as expected by thescheduler, i.e. at time tr instead of tp. Currently, mecha-nisms like backfilling with new jobs or rescheduling (start,if possible, an already planned job earlier) are initiated tofill the gap between tr and the planned start time ts ≥ tp ofthe succeeding reservation. Due to conflicts with the earli-est possible execution time, moving of arbitrary succeedingjobs to an earlier starting time might not be possible. In par-ticular the probability to execute a job earlier might be lowif users have strict time intervals for the job execution sincea planning-based scheduler rejects job requests which can-not be planned according to time and resource constraintsin the schedule. An analysis of cluster logfiles revealedthat users overestimated the runtime of their jobs by a fac-tor of two to three [8]. For the provider this might resultin a bad workload and throughput, since computing poweris wasted if backfilling or rescheduling cannot start otherjobs earlier as initially planned. To prevent poor utilizationand throughput, overbooking has proven its potential in var-ious fields of application for increase the system utilizationand provider’s profit. As a matter of fact, overbooking re-sults in resource usage conflicts if the user-specified runtimeturns out to be realistic, or if the scheduler is working withan overestimation presumption that is too high. To com-pensate such situations, the suspension and later restart ofjobs are important instruments of the RMS. To suspend arunning job and without losing already performed compu-tation steps, the RMS makes a snapshot of the job, i.e. stor-ing the job process environment (including memory, mes-sages, registers, and program counter), to be able to mi-grate them to another machine or to restart them at a laterpoint of time. In the EC-funded project HPC4U [9] the nec-essary mechanisms have been integrated in the planning-based RMS OpenCCS to generate checkpoints and migratejobs. These fault-tolerance mechanisms are the basis fora profitable overbooking approach as presented in this pa-per since stopping a job does not imply losing computationsteps performed. Hence, gaps between advance reserva-tions can be used from jobs, which will be finished beforethe next reservation has to be started. In the next sectionwe discuss the related work followed by our ideas for over-booking, which are described in Section 3. In Section 4 weconclude the paper with a summary of our ideas and pre-senting plans for future work.
2 Related Work
The idea of overbooking resources is a standard ap-proach in many fields of application like in flight, hospi-tal, or hotel reservations. Overbooking beds, flights, etc.is a consequence of that a specific percentage of reserva-tions are not occupied, i.e. usually more people reserve ho-tel rooms [10] or buy flight tickets [11, 12] than actuallyappearing to use their reservation. The examples of hotelsand aeronautical companies show the idea we are followingalso in the provisioning of compute resources. Overbookingin the context of computing Grids slightly differs from thosefields of applications since therein the assumption is madethat less customers utilize their reservations than booked.In Grid computing all jobs that have been negotiated will beexecuted, however, in planning-based systems users signif-icantly overestimate the job duration. Comparing the usageof a compute resource and a seat in an aircraft is not mean-ingful since generally in computing Grids no fixed intervalsfor the resource utilization exist whereas a seat in an air-craft will not be occupied after the aircraft had taken off.As a consequence, results and observations from overbook-ing in the classical fields of applications cannot be reused inGrid scheduling. As a non-classical field of application [13]presents an overbooking approach for web platforms, how-ever, the challenges also differ from the Grid environment.
In the Grid context, consider overbooking approaches ismost sensible for planning based scheduling since in queu-ing based systems even the runtime have to be estimatedand thereby an additional uncertainty has to be taken intoaccount. Other work concerning overbooking in Grid orHPC environments is rare. In the context of Grid or HPCscheduling the benefits of using overbooking are pointedout, but no solutions are provided [14, 15]. Overbookingis also foreseen in a three layered protocol for negotiationin Grids [16]. Here, the restriction is made that overbookingis only used for multiple reservations for workflow sub-jobswhich were made by the negotiation protocol for optimalworkflow planning.
2.1 Planning Approaches
Some work had been done in the scope of planning al-gorithms. Before showing in Section 3 how overbookingcan be integrated, different approaches already developedare described in the following.
2.1.1 Geometry based approaches
Theoretical approaches for planning-based systems identifythat the scheduling is a special case of bin packing: thewidth of a bin is defined as the number of nodes generallyavailable and its height equals the time the resource can be
Int'l Conf. Grid Computing and Applications | GCA'08 | 243

used. As the total usage time for an arbitrary number of jobsdoes not end, the height of the bin is infinite. Consequentlyit is not a bin, rather defined as a strip. Jobs are consideredas rectangles having a width equal to the number of requirednodes and a height equal to the execution time determinedby the user. The rectangles have to be positioned in thestrip in such a way that the distances between rectangles inthe strip are minimal and the jobs must not overlap them-selves. Since strip packing is an NP-hard problem, severalalgorithms have been developed which work with heuris-tics and are applicable in practice. Reference [17] gives agood overview of strip packing algorithms. Two kinds, on-line and offline, of strip packing algorithms are differed. Anoffline algorithm has information about all jobs to be sched-uled a priori whereas an online algorithms cannot estimatewhich jobs arrive in future. It is obvious that offline algo-rithms can achieve better utilization results since all jobsare known and can be scheduled by comparing among eachother. The approaches could be divided into several mainareas: Bottom-left algorithms which try to put a new job asfar to the bottom of the strip and as left as possible, level-oriented algorithms [18], split algorithms [18], shelf algo-rithms [19], and hybrid algorithms which are combinationsof the above mentioned ones.
2.1.2 Planning for Clusters
In practice, most planning based systems use first-comefirst-serve (FCFS) approaches. Grid scheduling has touse an online algorithm and consequently planning optimalschedules is not possible. The job is scheduled as soon aspossible according to the current schedule (containing alljobs previously scheduled) as well as its resource and timeconstraints. The FCFS approach might lead to gaps whichcould be prevented if jobs would have scheduled in a dif-ferent order. To increase the system utilization, backfilling[20] had been introduced to avoid such problems. Conser-vative Backfilling follows the objective to fill free gaps inthe scheduled produced by FCFS planning without delay-ing any previously planned job. Simulations show that theoverall utilization of systems is increased using backfillingstrategies. If effects/delays of not started jobs are accept-able, the more aggressive EASY backfilling [21] can furtherimprove the system utilization. However, [22] shows thatfor systems with high load the EASY approach is not bet-ter than the conservative backfilling. Furthermore, EASYbackfilling has to be used with caution in systems guaran-teeing QoS aspects since delays of SLA bound jobs mightlead to SLA violations implying penalties.
Concluding, there is much work done in the scope ofplanning based scheduling. Good resource utilization inGrid systems can be achieved by using backfilling. How-ever, applying conservative backfilling does not result in
a 100% workload since only gaps can be assigned to jobswhose duration is less than the gap length. The more ag-gressive EASY backfilling strategy does not necessarilyprovide a better utilization of the system and implies haz-ards for SLA provisioning. Combining conservative back-filling with overbooking should further increase the systemutilization and does not affect the planned schedule. Con-sequently, using these strategies combined has no disadvan-tages for not overbooked jobs and offers the possibility toschedule more jobs than with a simple FCFS approach.
3 Planning-Based Scheduling and Overbook-ing
This chapter explains the basic ideas to use overbook-ing in planning-based HPC systems. A user sends anSLA bound job request to the system. The SLA definesjob type (batch or interactive), number r of resources re-quired, estimated runtime d, as well as an execution win-dow [tstart, tend], i.e. earliest start-time and latest comple-tion time. The planning-based system can determine beforeagreeing the SLA whether it is possible to execute the jobaccording to time and resource constraints.
Fixed Reservations Planning-based scheduling is espe-cially beneficial if users are allowed to define time-slots(r, h) in the SLA for interactive sessions, i.e. reservingcompute nodes and manually start (multiple) jobs duringthe valid reservation time. The difference from an inter-active session and a usual advance reservation is that thereservation duration equals tend − tstart. For exampler = 32 nodes should be reserved from h = [11.12.08 :900, 11.12.08 : 1400] for a duration of h = 5 hours. Suchso called interactive or fixed reservations increase the dif-ficulty of the planning mechanism as these are fixed rect-angles in the plan and cannot be moved. This will haveworse effects on the system utilization than planning onlyadvance reservations less strict timed. Consequently, sup-porting fixed reservations step up the demand for additionalapproaches like overbooking to ensure a good system uti-lization. However, such fixed reservations appreciate thevalue of using Grid computing for end-users if these haveeither interactive applications or need to run simulations ex-actly on-time, like for example for presentations.
For example, a resource management system (RMS) op-erates a cluster with 32 nodes and the typical jobs scheduledneed 32 nodes and run 5 hours. During the day researchersmake two fixed reservations from 9am to 2pm and from2pm to 7pm. All other jobs are scheduled as batch jobs.In this scenario during the night, in the 14 hours betweenthe fixed reservations, only two 5 hours batch jobs could bescheduled since these could be totally completed. Conse-quently, the cluster would be idle for 4 hours. To achieve
244 Int'l Conf. Grid Computing and Applications | GCA'08 |

a better system utilization, either the user has to shift thefixed reservations one hour every day. Since this not feasi-ble because of working-hours, assuming that the batch jobsfinishes after 4 hours and 30 minutes enables to overbookresources and execute the three batch jobs.
3.1 Overbooking
Overbooking benefits from the fact that users overesti-mate their jobs’ runtime. Consequently their jobs finish be-fore the jobs’ planned completion time. Taking advantageof this observation will increase the system utilization andthereby the provider’s profit.
This section shows the process of integrating overbook-ing in planning-based systems following conservative back-filling as basic scheduling strategy. At first, aspects arehighlighted which have to be considered when declaringjobs as usable for overbooking. Afterwards the overbookingalgorithm is described which is followed by remarks con-cerning fault-tolerance mechanisms, which should preventjob losses in case of wrong estimations of actual runtimemade. An example forms the end of this section.
3.1.1 Runtime-Estimations for Overbooking
The prevention of job losses caused by overbooking is oneimportant task of the scheduler. Further, good predictionsof the overestimated runtime forms the key factors for prof-itable overbooking.
On the first glance, users overestimate the job durationin average by two to three times of the actual runtime [8].Unfortunately, job traces show that the distribution of theoverestimation seems to be uniform [22] and depending onthe trace, 15% to nearly 30% of jobs are underestimatedand have to be killed in planning-based systems after theplanned completion time. Obviously, more not completedjobs could be killed when using overbooking. For instance,using the average value of overestimation from the statisti-cal measure (which is 150% up to 500%) in scope of over-booking would lead to conflicts since half of the jobs wouldbe killed. Instead of exhausting overestimation to their fullextend, it will be more profitable to balance between the riskof a too high overestimation and the opportunity to schedulean additional job. Hence, it might be often beneficial to notsubtract the average overestimated runtime from the esti-mated one in order to use this additional time for overbook-ing. In many cases only using 10% of the overestimationcan be sufficient. Given a uniform distribution, this wouldforce 10% of the overbooked jobs to be lost, but 90% wouldbe finished and increase the utilization. These in additionto the default strategy executed jobs increase the providersprofit. To use good predictions of the overestimated run-time, historical observations on the cluster and of the users
are necessary. A detailed analysis has to be performed aboutthe functional behavior of the runtime since an average ormedian value is not as meaningful as needed for reducingthe risk for the provider to cause job losses. If enough mon-itoring data is available, the following question arises: Howcan statistical information about actual job runtime be usedto effectively overbook machines? The answer is to ana-lyze several different aspects. First of all, a user-orientedanalysis has to be performed since users often utilize com-puting Grids for tasks in their main business/ working areawhich results in submitting same applications with similarinput again and again [23, 24]. Consequently, analyzing es-timated and actual runtime should whether and how muchoverestimations are made. If the results show that a userusually overestimates the runtime by factor x, the schedulercan use xo < x of the overestimated time as a time-framefor overbooking. If the statistical analysis shows, that theuser made accurate estimations, the scheduler should notuse her jobs for overbooking. If the user underestimatesthe runtime the scheduler might even plan more time toavoid job-kills at the end of the planned execution time. Anapplication-oriented statistical analysis of monitoring datashould be also performed in order to identify correlations ofoverestimations and a specific application. Performed stud-ies show, that automatically determined runtime estimationsbased on historical information (job traces) can be betterthan the user’s estimation [25, 26, 27]. The condition forits applicability is that enough data is available. In additionto these separated foci, a third analysis should combine theuser-oriented and application-oriented approach in order toidentify whether specific users over- or underestimate theruntime when using a specific application. This analysisshould result in valuable predictions.
3.1.2 Algorithmic Approach
This paragraph provides the algorithmic definition of thescheduling strategy for conservative backfilling with over-booking. When a new job j with estimated duration d, num-ber of nodes n, and execution window [tstart, tend] arrivesin the system, the following algorithm is used inserting therequest into the schedule which has anchor point ts whereresources become available and points where such slots endtendslot:
1. Select, if available, statistical information about theruntime of the application and the runtime estimationof the user. Compare them with the given runtime forthe new job j. If
• the estimated runtime d is significant longer thanthe standard runtime of the application
• or the user is tending to overestimate the runtimeof jobs
Int'l Conf. Grid Computing and Applications | GCA'08 | 245

– then mark the application as promising foroverbooking. Assuming a uniform distribu-tion, the duration of the job d can be adjustedto d′ = d
1+maxPoF where maxPoF is themaximum acceptable probability of failure.The time interval oj = d − d′ can be usedfor overbooking.
• else the job should not be used for overbookingd′ = d, oj = 0.
2. Find starting point ts for job j, set ts as anchor point:
• Scan the current schedule and find the first pointts ≥ tstart where enough processors are avail-able to run this job.
• Starting from this point, check whether ts + d ≤tend and if this is valid, continue scanning theschedule to ascertain that these processors re-main available until the job’s expected termina-tion ts + d ≤ tendslot.
• If not,
– check validity of ts + d′ ≤ tend andwhether the processors remain available un-til the job’s expected termination reducedby the time usable for overbooking ts +d′ ≤ tendslot. If successful, mark the jobas overbooked and set the job duration d′ =tendslot − ts.
– It not, check, if there are direct predecessorsin the plan, which are ending at ts and areusable for overbooking. Then reduce ts bythe time a = mink{ok} of those jobs k andtry again. ts−a+d′ ≤ tendslot. (In this case,other jobs are also overbooked; neverthelesstheir runtime is not reduced. If they do notfinish earlier than excepted, they can still fin-ish and the overbooked job will be startedafter their initially planned completion.) Ifsuccessful, mark the job as overbooked andset the job duration d′ = tendslot− (ts− a).
• If overbooking was not possible, return and con-tinue the scan to find the next possible anchorpoint.
3. Update the schedule to reflect the allocation of r pro-cessors by this job j with the duration d′ for the reser-vation h = [ts, min(tendslot, ts +d)], starting from itsanchor point ts, or earlier ts − a.
4. If the job’s anchor is the current time, start it immedi-ately.
The algorithm defines that a job k which was overbookedby a job j should be resumed until its completion or its
planned completion time if it had not finished at time ts−a.Considering SLA bound jobs, this might be doubtful if ful-filling the SLA of job j would be more profitable than ofjob k. However, the reservation duration of job k is onlyreduced after curtaining the duration of job j. Hence, theprovider has no guarantee that the SLA of job j would benot violated if stopping the job execution of job k. Conse-quently, the scheduler should act conservatively and providefor job k the resources as required and prevent an SLA vio-lation of job k.
3.1.3 Checkpointing and Migration
By using overbooking the likelihood of conflicts increasesand consequently the need of preventing job losses becomesmore important. Which contractor (end-user or provider)has to pay the penalty in case of a not completed job de-pend on the responsibilities. In conservative planning-basedsystems, the user is responsible for an underestimated run-time of a job. Hence, if the job is killed after providing re-sources for the defined runtime, the provider does not careabout saving the results. The provider is responsible if itthe requested resources have not been available for the re-quested time. Hence, violating an SLA caused by overbook-ing results in that the provider has to pay the penalty fee.If the scheduler overbooked a schedule with a job which isplanned for less than the user’s estimated runtime and has tobe killed/ dispatched for another job, the provider is respon-sible since resources had not been available as agreed. TheRMS can prevent such conflicts by using the fault-tolerancemechanisms checkpointing and migration [9]. If the exe-cution time had been shortened by the RMS, at the end ofthe reservation a checkpoint can be generated of the job, i.e.making a snapshot of its memory, messages, the registers,and program counter. The checkpoint can be stored in a filesystem available in the network. This allows to restart thenot completed job in the next free gap before the job lat-est completion time. To be efficient, the free gap should beat least as long as the remaining estimated runtime. Notethat filling gaps by partly executing jobs should not be ageneral strategy since checkpointing and migration requiresresources and result in additional costs for the job execu-tion. As result, planning with checkpointing and migrationallow pre-emptive scheduling of HPC systems.
3.1.4 Example
To exemplify the approach, in the following a possible over-booking procedure is explained. Assume a Grid clusterwith X nodes, each job on the cluster will be assignedto the same fixed reservations with a duration of 5 hours[700 − 1200, 1200 − 1700]. Assume further that the fixedand some usual advance reservations are already scheduled,
246 Int'l Conf. Grid Computing and Applications | GCA'08 |

directly beneath each other. Thus, the resources are oc-cupied for 20 hours of the schedule: [700 − 1200, 1200 −1700, 1700 − 2100, 2100 − 300]. This schedule is the sameevery day in the week considered. Then another job j withh = 5 hour reservation for X nodes should be inserted inthe schedule in the next two days. However, the resourcesare only free for 4 hours [300 − 700]! Consequently, thescheduler has to reject the job request, in case it cannotoverbook the schedule 300 + 5 hours = 800 ¬ ≤ 700 .We assume that the scheduler has statistics about the esti-mated and actual runtimes of applications. and users thatpropound an overestimation by 40%. Assume the sched-uler can takeo = d − d′ of the statistic over-estimated run-time of a job for overbooking, let the maximum PoF bemaxPoF = 13%. For a five-hour job these are 34 minutes.(As h = 5 hours = 300 minutes and maxPoF = 0, 13 →d′ = d
1+maxPoF = 3001,13 ≈ 265, 5minutes → o = d − d′ =
300 minutes − 266 minutes = 34 minutes .) If we over-book the advance reservation h for 34 minutes, the sched-ule is still not feasible (300 + 4:26 hours = 726 ¬ ≤ 700 )since the gap is only 4 hours and j would be given a run-time of 4 hours and 26 minutes. If the predecessor is alsooverbooked by 34 minutes, each job is reduced by half anhour and reservation h can be accepted (300−0:34 hours)+4:26 hours = 652 ≤ 700. Thus the job j with an user esti-mated runtime d = 5 hours has a duration d′ = 4:26 hoursand an estimated earliest start-time from ts = 226 in theoverbooked time-slot [300 − 700] The complete schedule is[700−1200, 1200−1700, 1700−2100, 2100−300, 300−700].
Note that, overbooking is possible only, if neither j itselfnor the predecessor (in case of its overbooking) is a fixedreservation. Hence, in our example avoiding an idle timeof 4 hours can be achieved by using overbooking only, ifthe job j and the reservations before [2100 − 300] are notfixed. For all reservations which are not fixed, a greaterflexibility exists if the start time ts of all those jobs couldbe moved forward to their earliest start time tstart, if thejobs before are ending earlier than planned. In this case, ifthe other execution times are dynamically shifted, any over-booked reservation from the schedule could be straightenout before execution. This approach has the big advantagethat an 1 hour overbooked reservation h could be finishedeven it would use the estimated time, if in total the prede-cessor reservations in the schedule require all in all 1 hourless time than estimated.
4 Conclusion and Future Work
The paper first motivated the need for Grid systems andin common with the management of supercomputers theadvantages of planning-based scheduling for SLA provi-sioning and fixed reservations. However, advance reserva-tions have the disadvantage to decrease the utilization of
the computer system. Using overbooking might be a pow-erful instrument to re-increase the system utilization and theprovider’s profit. The paper presented the concept and algo-rithm to use overbooking. Since overbooking might leadto conflicts because of providing resources for a shortertime than required, fault-tolerance mechanisms are crucial.Checkpointing and migration can be used for preventing joblosses and SLA violations and support the applicability ofoverbooking in Grid systems.
Future work focus on statistical analysis of runtime andimplementing the overbooking algorithm in the backfillingscheduling algorithms. At last we will develop a simulationprocess for testing and evaluating how much overbookingincreases the system utilization and provider’s profit.
References
[1] C. Ressources, “Torque resource man-ager,” 2008. [Online]. Available:http://www.clusterresources.com/pages/products/torque-resource-manager.php
[2] IBM, “Loadleveler,” 2008. [On-line]. Available: http://www-03.ibm.com/systems/clusters/software/loadleveler/index.html
[3] Gridengine, “Sun,” 2008. [Online]. Available:http://gridengine.sunsource.net/
[4] Platform, “Lfs load sharing facility,” 2008. [On-line]. Available: http://www.platform.com/Products/Platform.LSF.Family
[5] “Condor,” 2008. [Online]. Available:http://www.cs.wisc.edu/condor/
[6] D. Jackson, Q. Snell, and M. Clement, “Core Algo-rithms of the Maui Scheduler,” Job Scheduling Strate-gies for Parallel Processing: 7th International Work-shop, JSSPP 2001, Cambridge, MA, USA, June 16,2001: Revised Papers, 2001.
[7] “Openccs: Computing center software,” 2008.[Online]. Available: https://www.openccs.eu/core/
[8] A. Streit, “Self-tuning job scheduling strate-gies for the resource management of hpc sys-tems and computational grids,” Ph.D. disserta-tion, Paderborn Center for Parrallel Comput-ing, 2003. [Online]. Available: http://wwwcs.uni-paderborn.de/pc2/papers/files/422.pdf
[9] “Hpc4u: Introducing quality of service for grids,”http://www.hpc4u.org/, 2008.
Int'l Conf. Grid Computing and Applications | GCA'08 | 247

[10] V. Liberman and U. Yechiali, “On the hotel overbook-ing problem-an inventory system with stochastic can-cellations,” Management Science, vol. 24, no. 11, pp.1117–1126, 1978.
[11] J. Subramanian, S. Stidham Jr, and C. Lautenbacher,“Airline yield management with overbooking, can-cellations, and no-shows,” Transportation Science,vol. 33, no. 2, pp. 147–167, 1999.
[12] M. Rothstein, “Or and the airline overbooking prob-lem,” Operations Research, vol. 33, no. 2, pp. 237–248, 1985.
[13] B. Urgaonkar, P. Shenoy, and T. Roscoe, “Resourceoverbooking and application profiling in shared host-ing platforms,” ACM SIGOPS Operating Systems Re-view, vol. 36, no. si, p. 239, 2002.
[14] M. Hovestadt, O. Kao, A. Keller, and A. Streit,“Scheduling in hpc resource management systems:Queuing vs. planning,” Job Scheduling Strategiesfor Parallel Processing: 9th International Workshop,Jsspp 2003, Seattle, Wa, Usa, June 24, 2003: RevisedPapers, 2003.
[15] A. Andrieux, D. Berry, J. Garibaldi, S. Jarvis, J. Ma-cLaren, D. Ouelhadj, and D. Snelling, “Open Issues inGrid Scheduling,” UK e-Science Report UKeS-2004-03, April 2004.
[16] M. Siddiqui, A. Villazon, and T. Fahringer, “Grid al-location and reservation—Grid capacity planning withnegotiation-based advance reservation for optimizedQoS,” Proceedings of the 2006 ACM/IEEE conferenceon Supercomputing, 2006.
[17] N. Ntene, “An algorithmic approach to the 2d orientedstrip packing problem,” Ph.D. dissertation.
[18] E. Coffman Jr, M. Garey, D. Johnson, and R. Tar-jan, “Performance bounds for level-oriented two-dimensional packing algorithms,” SIAM Journal onComputing, vol. 9, p. 808, 1980.
[19] B. Baker and J. Schwarz, “Shelf algorithms for two-dimensional packing problems,” SIAM Journal onComputing, vol. 12, p. 508, 1983.
[20] D. Feitelson and M. Jette, “Improved Utilization andResponsiveness with Gang Scheduling,” Job Schedul-ing Strategies for Parallel Processing: IPPS’97 Work-shop, Geneva, Switzerland, April 5, 1997: Proceed-ings, 1997.
[21] D. Lifka, “The ANL/IBM SP Scheduling System,”Job Scheduling Strategies for Parallel Processing:
IPPS’95 Workshop, Santa Barbara, CA, USA, April25, 1995: Proceedings, 1995.
[22] A. Mu’alem and D. Feitelson, “Utilization, pre-dictability, workloads, and user runtime estimates inscheduling the IBM SP 2 with backfilling,” IEEETransactions on Parallel and Distributed Systems,vol. 12, no. 6, pp. 529–543, 2001.
[23] A. Downey and D. Feitelson, “The elusive goal ofworkload characterization,” ACM SIGMETRICS Per-formance Evaluation Review, vol. 26, no. 4, pp. 14–29, 1999.
[24] D. Feitelson and B. Nitzberg, “Job Characteristics of aProduction Parallel Scientific Workload on the NASAAmes iPSC/860,” Job Scheduling Strategies for Par-allel Processing: IPPS’95 Workshop, Santa Barbara,CA, USA, April 25, 1995: Proceedings, 1995.
[25] R. Gibbons, “A Historical Application Profiler for Useby Parallel Schedulers,” Job Scheduling Strategiesfor Parallel Processing: IPPS’97 Workshop, Geneva,Switzerland, April 5, 1997: Proceedings, 1997.
[26] A. Downey, “Using Queue Time Predictions forProcessor Allocation,” Job Scheduling Strategies forParallel Processing: IPPS’97 Workshop, Geneva,Switzerland, April 5, 1997: Proceedings, 1997.
[27] W. Smith, I. Foster, and V. Taylor, “Predicting Ap-plication Run Times Using Historical Information,”Job Scheduling Strategies for Parallel Processing:IPPS/SPDP’98 Workshop, Orlando, Florida, USA,March 30, 1998: Proceedings, 1998.
248 Int'l Conf. Grid Computing and Applications | GCA'08 |

Germany, Belgium, France, and Back Again: Job Migration using Globus
D. Battre1, M. Hovestadt1, O. Kao1, A. Keller2, K. Voss2
1Technische Universitat Berlin, Germany1Paderborn Center for Parallel Computing, University of Paderborn, Germany
Abstract
The EC-funded project HPC4U developed a Grid fab-ric that provides not only SLA-awareness but also asoftware-only based system for checkpointing sequentialand MPI parallel jobs. This allows job completion andSLA-compliance even in case of resource outages. Check-points are generated transparently to the user in thebackground. There is no need to modify the applications inany way or to execute it in a special manner. Checkpointdata sets can be migrated to other cluster systems toresume the job execution. This paper focuses on the jobmigration over the Grid by utilizing the WS-Agreementprotocol for SLA negotiation and mechanisms provided bythe Globus-Toolkit.
Keywords: Checkpointing, Globus, Job-Migration,Resource-Management, SLA-Negotiation, WS-Agreement
I. Introduction
The developments of the recent years in scope of Gridtechnologies have formed the basis for an invisible Gridwhose distributed services can be easily accessed andused. Using Grids to execute compute-intensive simula-tions and applications in the scientific community is verycommon nowadays. Founded by national and internationalorganizations, large grids like ChinaGrid, D-Grid, EGEE,NAREGI, TeraGrid, or the UK-eScience initiative havebeen established and are successfully used in the academicworld. Additionally, companies like IBM or Microsofthave identified the commercial potential of providing Gridservices as reflected in their participation and funding ofGrid initiatives.
However, while the technological basis for the Gridutilization is mostly available, some obstacles still have to
This work has been partially supported by the EC within the 6thFramework Programme under contract IST-031772 “Advanced Risk As-sessment and Management for Trustable Grids” (AssessGrid) and IST-511531 “Highly Predictable Cluster for Internet-Grids” (HPC4U).
be solved in order to gain a wide commercial uptake. Oneof the most challenging issues is to provide Grid services ina manner that fulfils the consumer’s demands of reliabilityand performance. This implies that providers have to agreeon Quality of Service (QoS) aspects which are important tothe end-user. QoS in the scope of Grid services addressesprimarily resource and time constraints, like number andspeed of compute nodes as well as earliest executiontime or latest completion time. To contractually determinesuch QoS requirements between service providers andconsumers, Service Level Agreements (SLAs) [1] are com-monly used. They allow the formulation of all expectationsand obligations in the business relationship between thecustomer and the provider.
The EC-funded project HPC4U (Highly PredictableCluster for Internet Grids) [2] developed a Grid fabric thatprovides not only SLA-awareness but also a software-onlybased system for checkpointing sequential and MPI paral-lel jobs. This allows job completion and SLA-complianceeven in case of resource outages. Checkpoints are gen-erated transparently to the user in the background (i.e.the application does not need to be modified in any way)and are used to resume the execution of an interruptedapplication on healthy resources. Normally, the job isresumed on the same system, since spare resources havebeen provided to enhance the reliability of the system.However, in case there are not enough spare resourcesavailable to resume the execution, the HPC4U systemis able to migrate the job to other clusters within thesame administrative domain (intra-domain migration) oreven over the Grid (inter-domain migration) by using WS-Agreement [3] and mechanisms provided by the GlobusToolkit [4]. This paper focuses on the inter domain migra-tion. In the next section we highlight the architecture of theHPC4U software stack. Section III discusses some issuesrelated to the negotiation protocol. Section IV describesthe phases of the job migration over the Grid in a moredetailed way. An overview about related work and a shortconclusion completes this paper.
Int'l Conf. Grid Computing and Applications | GCA'08 | 249

Fig. 1. The HPC4U software stack
II. The Software Stack Architecture
The software stack depicted in Figure 1 consists of aplanning based [5] Resource Management System (RMS)called OpenCCS [6], a Negotiation Manager (NegMgr),and the Globus Toolkit (GT).
OpenCCS: The depicted modules (related to job mi-gration) are the Planning Manager (PM), the Sub-SystemController (SSC) and dedicated subsystems for check-pointing of processes (CP), network (NW), and storage(ST). The PM computes the schedule whereas the SSCorchestrates the mentioned subsystems for periodicallycreating checkpoints. OpenCCS communicates with theNegMgr through a so called ProtocolProxy (PP). It isresponsible for translating between the SOAP and Javabased NegMgr and the TCP-stream and C based OpenCCS.
The Negotiation Manager: The NegMgr facilitates thenegotiation of SLAs between an external entity with theRMS by implementing the WS-Agreement specificationversion 1.0. The NegMgr has been developed in a closecollaboration between the EC funded projects HPC4U andAssessGrid [7]. The Negotiation Manager is implementedas a Globus Toolkit service because this allows to use andsupport several mechanisms that are offered by the toolkit,such as authentication, authorization, GridFTP, monitoringservices, etc. Another major decision for implementing theNegotiation Manager as a Globus Toolkit service was thepotential impact by this move, as the GT is among thede-facto standard Grid middlewares used throughout theworld.
The consumer of the negotiation service can either be anend-user interface (e. g. a portal or command line tools) oreven a broker service. The consumer accesses the NegMgrfor creating or negotiating new SLAs and for checkingthe status of existing SLAs. WS-Notification is used tomonitor changes in the status of an agreement and theWS-ResourceFramework provides general read access tocreated agreements but also write access to the databaseof agreement templates.
III. The Negotitation Protocol
The WS-Agreement protocol is limited in terms ofnegotiation, basically resembling a one-phase commit pro-tocol. This is insufficient for scenarios with more thantwo parties, e.g. an end-user, who is interested in theconsumption of compute resources, a resource broker, anda resource provider. Three different usage scenarios are themain subjects.
• Direct SLA negotiation between an end-user and aprovider.
• The end-user submits an SLA request to the broker,which then looks for suitable resources and forwardsthe request to suitable providers. The broker returnsthe SLA offers to the end-user who is then free toselect and commit to an SLA offer by interactingdirectly with the corresponding provider.
• The broker acts as a virtual provider. The end-useragrees an SLA with the broker, which in turn agreesSLAs with all providers involved in executing theend-user’s application.
From these scenarios we can conclude that the current ne-gotiation interface of WS-Agreement does not satisfy ourneeds. According to WS-Agreement, by the act of issuingan SLA request to a resource provider, a resource consumeris already committed to that request. The provider can onlyaccept or reject the request. This has certain shortcomings.
It is common real-world practice that a customer spec-ifies a job and asks several companies for offers. Thecompanies state their price for the job and the customercan pick the cheapest offer. This is not possible in the cur-rent WS-Agreement specification. By submitting an SLArequest, the user is committed to that request. We neglectthat assumption. A user can submit a non-binding SLArequest and the provider is allowed to modify the requestby answering with an SLA offer that has a price tag. Theprovider is bound to this offer and the user can eithercommit to the offer or let it expire. Therefore, the interfaceand semantics of the WS-Agreement implementation wereslightly modified. A createAgreement call is not bindingfor the issuer and the WS-Agreement interface is extendedby a commit method. As the WS-GRAM implementation
250 Int'l Conf. Grid Computing and Applications | GCA'08 |

of Globus is designed for queuing based schedulers, anew state machine was implemented that supports externalevents from the RMS (over the PP), GridFTP, and timeevents to trigger state transitions.
For standardizing the execution requirements of a com-putational job, the Job Submission Description Language(JSDL) [8] has been introduced by the JSDL-workinggroup of the Global Grid Forum. By means of JSDLall parameters for job submission can be specified, e.g.name of executable, required application parameters, orfile transfer filters for stage-in and stage-out. Our currentWS-Agreement implementation supports only a subset ofJSDL (namely POSIX jobs).
The Globus Resource Allocation Manager (GRAM)forms the glue between the RMS and the Globus Toolkit. Itis responsible for parsing requests coming from upper layerGrid levels and transferring it to uniform service requestsfor the underlying RMS. Unfortunately, the GRAM is notable to handle (advance) reservations. Therefore we bypassthe GRAM layer.
If an SLA request has been found to be templatecompliant, it is passed to the resource management systemwhich decides if it is able to provide the requested Service-Level. The job is integrated into a tentative schedulewhich forms the decision base. In case the job fits intothe schedule and no previously agreed SLAs need to beviolated, an offer is generated.
First, the SLA describes the time by which the userguarantees to provide files for stage-in. At this time,the negotiation manager’s state machine triggers the filestaging via GridFTP. Next, the SLA specifies the earliestjob start and finish time as well as the requested executiontime. The RMS scheduler is free to allocate the resourcesfor the requested time, anywhere between earliest start andlatest execution time. It is considered the user’s task toestimate the duration of the stage-in phase and set theearliest job start accordingly. In order to compensate smallunderestimations, a synchronization point is introduced. Incase the stage-in is not completed when the resources areallocated, the actual execution pauses until the stage-in iscompleted. Note that this idle-time is part of the guaranteedCPU time and may prevent the successful execution of theprogram.
IV. Grid Migration Phases
Initializing the Migration Progress: The first step of themigration process is triggered by the detection of a failure(e.g. a node crash) by the monitoring functionalities ofOpenCCS. The PM is signaled about this outage and triesto create a new schedule that pays attention to this changedsystem situation. If it is not possible to generate a schedulewhere the SLAs of all jobs are respected, the PM initiates
the job migration.Packing the Migration Data Set: Before any migration
process can be initiated, it has to be ensured that themigration data set is available. This is signaled to theSSC which is then generating such a data set. Beside thecheckpoint itself it includes information provided by theRMS like number of performed checkpoints or the layoutof MPI processes on the nodes. Once the migration dataset has been generated, the PP is finally transferring allnecessary data to the NegMgr for starting the query forpotential migration targets. This includes also the path toa transfer directory where the SSC has saved the migrationdata and where the results should be written to.
Finding the Migration Target: The NegMgr is now incharge of finding appropriate migration targets. For this,it uses for instance resource information catalogues inthe Grid. This query is the static part of the retrievalprocess. In a second step, the NegMgr contacts all otherNegMgr services of the returned Grid fabrics and initiatesthe negotiation process with them.
This SLA negotiation is started with a getQuote mes-sage to the remote NegMgr, asking for an SLA offer.The remote system can either reject this message, oranswer with OK. It has to be noted, that this OK is non-binding. The source NegMgr now has to choose among theofferings, where the remote Negotiation Managers repliedwith an OK message. An important aspect of this rankingcould be the price. At the end, the initiating NegMgr willsend one of these remote NegMgrs a createAgreementmessage. If the remote site still agrees, it replies with OK,which makes the SLA binding for both the local and theremote site. Otherwise the remote site will terminate theprocess (e.g. because free resources have been allocatedby other jobs meanwhile).
Transferring the Migration Data Set: The transfer pro-cess is driven by the remote site. This is possible, sincethe SSC has generated the migration data set in a transferdirectory accessible by the Globus Toolkit. Since the datatransfer is secured by proxy credentials, the source siteonly provides these rights to the respective remote site, sothat no other party may access the data. After transferringthe data set to the remote site both RMSs are notifiedby their associated NegMgr. This is triggered by a WS-Notification event. The source PM then changes the stateof the migrated job to remote execution. Similar to this, theremote NegMgr signals the remote PM that the migrationdata set is available, so that the job execution could beresumed.
Resuming the Job Execution: Once the migration datahas been transferred and the PM decides to restart the jobfrom the migrated checkpoint, the SSC is first signaledto re-establish the process environment by regarding thesituation of the storage working container. During the
Int'l Conf. Grid Computing and Applications | GCA'08 | 251

runtime, the SSC creates checkpoints in regular intervals.Transferring the Result Data Set: If everything goes
right, the job finally finishes its computation and the jobresults can be transferred back to the source. The resultsare packed by the remote SSC component and saved to atransfer directory. The PP then signals its NegMgr, that theresult data set is available. The remote NegMgr initiatesthe data transfer to the location that has been originallyprovided by the source site at negotiation time. Oncethe data transfer has been completed successfully, bothNegMgrs inform their PM components. On remote site,all used resources are now released. On source site, thePM initiates the stage-out of the result data to the userspecified target. This way, the user retrieves the result data,not noticing any difference to a solely local computation.
Job Forwarding: In case the job also fails on the remotesite, it may be migrated again to another site to resumethe execution. The steps are the same as described above.However transferring the result data back to the originatingsite is done along the whole migration chain. All inter-mediate sites are then acting as a proxy, forwarding theincoming result data. This also simplifies the clean-up.
V. Related Work
The worldwide research in Grid computing resulted innumerous different Grid packages. Beside many commod-ity Grid systems, general purpose toolkits exist such asUnicore [9] or the Globus Toolkit [4]. Although the GlobusToolkit represents the de-facto standard for Grid toolkits,all these systems have proprietary designs and interfaces.To ensure future interoperability of Grid systems as wellas the opportunity to customize installations, the OGSA(Open Grid Services Architecture) working group withinthe Open Grid Forum (OGF) aims to develop the architec-ture for an open Grid infrastructure [10].
In [11], important requirements for the Next Gener-ation Grid (NGG) were described. An architecture thatsupports the co-allocation of multiple resource types,such as processors and network bandwidth, was presentedin [12]. The Grid community has identified the need fora standard for SLA description and negotiation. This ledto the development of WS-Agreement/-Negotiation [3].The Globus Architecture for Reservation and Allocation(GARA) provides “wrapper” functions to enhance a localRMS not capable of supporting advance reservations withthis functionality. This is an important step towards anintegrated QoS aware resource management. The GARAcomponent of Globus currently does not support the def-inition of SLAs nor malleable reservations, nor does itsupport resilience mechanisms to handle resource outagesor failures.
VI. Conclusion
In this paper we described the mechanisms providedby the HPC4U software stack for migrating checkpointdata sets of sequential or MPI parallel applications overthe Grid. We are using the Globus toolkit for findingappropriate resources and for migrating the checkpoint andresult data sets. We also developed an implementation ofthe WS-Agreement protocol to be able to negotiate withthe local RMSs.
Thanks to the transparent checkpointing capabilities,these mechanisms also apply for the execution of com-mercial applications, where no source code is availableand recompiling or relinking is not possible. The user evendoes not have to modify the way of executing the job.
We have shown the practicability of the presentedmechanisms by migrating jobs from a site in Germanyto Belgium and from there to a site in France. The resultswere automatically transferred back again to Germany. Thedeveloped software can be found on the project pages.
References
[1] A. Sahai, S. Graupner, V. Machiraju, and A. van Moorsel, “Spec-ifying and Monitoring Guarantees in Commercial Grids throughSLA,” Internet Systems and Storage Laboratory, HP LaboratoriesPalo Alto, Tech. Rep. HPL-2002-324, 2002.
[2] “Highly Predictable Cluster for Internet-Grids (HPC4U), EU-fundedproject IST-511531,” http://www.hpc4u.eu.
[3] A. Andrieux, K. Czajkowski, A. Dan, K. Keahey, H. Ludwig,T. Nakata, J. Pruyne, J. Rofrano, S. Tuecke, and M. Xu,“Web Services Agreement Specification (WS-Agreement),”www.gridforum.org/Public Comment Docs/Documents/Oct-2005/WS-AgreementSpecificationDraft050920.pdf, 2004.
[4] “Globus Alliance: Globus Toolkit,” http://www.globus.org.[5] M. Hovestadt, O. Kao, A. Keller, and A. Streit, “Scheduling in
HPC Resource Management Systems: Queuing vs. Planning,” inJob Scheduling Strategies for Parallel Processing: 9th InternationalWorkshop, JSSPP, Seattle, WA, USA, 2003.
[6] “OpenCCS,” http://www.openccs.eu.[7] “Advanced Risk Assessment and Management for Trustable
Grids (AssessGrid), EU-funded project IST-031772,” http://www.assessgrid.eu.
[8] “Job Submission Description Language (JSDL),” www.gridforum.org/documents/GFD.56.pdf.
[9] “UNICORE Forum e.V.” http://www.unicore.org.[10] GGF Open Grid Services Architecture Working Group (OGSA
WG), “Open Grid Services Architecture: A Roadmap,” http://www.ggf.org/ogsa-wg, 2003.
[11] K. Jeffery (edt.), “Next Generation Grids 2: Requirements andOptions for European Grids Research 2005-2010 and Beyond,”ftp://ftp.cordis.lu/pub/ist/docs/ngg2 eg final.pdf, 2004.
[12] I. Foster, C. Kesselman, C. Lee, B. Lindell, K. Nahrstedt, andA. Roy, “A Distributed Resource Management Architecture thatSupports Advance Reservations and Co-Allocation,” in 7th Inter-national Workshop on Quality of Service (IWQoS), London, UK,1999.
252 Int'l Conf. Grid Computing and Applications | GCA'08 |

Development of Grid Service Based Molecular Docking Application
HwaMin Lee1, DooSoon Park1, and HeonChang Yu2
1Division of Computer Science & Engineering, Soonchunhyang University Asan, Korea 2Department of Computer Science Education, Korea University, Seoul, Korea
Abstract - A molecular docking is the process of reducing an unmanageable number of compounds to a limited number of compounds for the target of interest by means of computational simulation. And it is one of a large-scale scientific application that requires large computing power and data storage capability. Previous applications or software for molecular docking were developed to be run on a supercomputer, a workstation, or a cluster-computer. However the molecular docking using a supercomputer has a problem that a supercomputer is very expensive and the molecular docking using a workstation or a cluster-computer requires a long execution time. Thus we propose Grid service-based molecular docking application. We designed a resource broker and a data broker for supporting efficient molecular docking service and developed various services for molecular docking. Our application can reduce a timeline and cost of drug or new material design.
Keywords: Molecular docking, grid computing, grid services.
1 Introduction Drug discovery is an extended process that may take
heavy cost and long timeline from the first compound synthesis in the laboratory until the therapeutic agent or drug, is brought to market [1, 2]. The molecular docking as shown figure 1 is to search the feasible binding geometries of a putative ligand with a target receptor whose 3D structure is known. Molecular modeling methodology combines computational chemistry and computer graphics. And molecular docking has emerged as a popular methodology for drug discovery [3]. Docking methods in virtual screening can dock the large number of small molecules into the binding site of a receptor, allowing for a rank ordering in terms of strength of interaction with a particular receptor [4]. Docking each molecule in the target chemical database is both a compute and data intensive task [3]. Tremendous efforts are underway to improve programs aimed at the automated process of docking or positioning compounds in a binding site and scoring or rating the complementarity of small molecules. The challenge in the applications of molecular docking is that it is very compute intensive and requires a very fast computer to run.
Figure 1. Molecular docking
In the mid 1990s, Grid computing has emerged as an important new field, distinguished from conventional distributed computing by its focus on large-scale resource sharing, innovative applications, and high-performance orientation [5, 6]. Grid computing system [6] consists of large sets of diverse, geographically distributed resources that are grouped into virtual computers for executing specific applications. Today, Grid computing offers the strongest low cost and high throughput solutions [2] and is spotlighted as the key technology of the next generation internet. Grid computing is used in fields as diverse as astronomy, biology, drug discovery, engineering, weather forecasting, and high-energy physics.
A molecular docking is one of large-scale scientific applications that require large computing power and data storage capability. Thus we developed a Grid service-based molecular docking application using Grid computing technology which supports a large data intensive operation. In this paper, we constructed a 3-dimensional chemical molecular database for molecular docking. And we designed a resource broker and a data broker for supporting efficient molecular docking service and proposed various services for molecular docking. We implemented Grid service based molecular docking application with DOCK 5.0 and Globus toolkit 3.2. Our application can reduce a timeline and cost of drug discovery or new material design.
This paper is organized as follows: Section 2 presents related works and section 3 explains constructing chemical molecular
Int'l Conf. Grid Computing and Applications | GCA'08 | 253

database. In section 4, we present architecture of Grid service based molecular docking system. Section 5 explains services for molecular docking. Section 6 describes the results of implementation. Finally, the paper concludes in Section 7.
2 Related Works Previous applications or software for molecular docking such as AutoDock, FlexX, DOCK, LigandFit, Hex were developed to be run on a supercomputer, a workstation, or a cluster-computer. However the molecular docking using a supercomputer has a problem that a supercomputer is very expensive and molecular docking using a workstation or a cluster-computer requires a long execution time. Recently several researches have been made on molecular modeling in Grid computing such as the virtual laboratory [3], BioSimGrid [7], protein structure comparison [8], and APST [9].
The virtual laboratory [3] provided an environment which runs grid-enable the molecular process by composing it as parameter sweep allocation using the Nimrod-G tools. The virtual laboratory proposed the Nimrod Parameter Modeling Tools for enabling DOCK as parameter sweep application, Nimrod-G Grid Resource Broker for scheduling DOCK jobs on the Grid, and Chemical Database (CDB) Management and Intelligent Access Tools. But the virtual laboratory did not support web service because it was implemented using Globus toolkit 2.2 and did not provide integration functionality of heterogeneous CDBs and retrieval functionality in distributed CDB.
BioSimGrid [7] project provides a generic database for comparative analysis of simulations of biomolecules of biological and pharmaceutical interest. The project is building an open software framework system based on OGSA and OGSA-DAI. The system has a service-oriented computing model and consists of the GUI, service, Grid middleware, and database/data.
A grid-aware approach to protein structure comparison [8] implemented a software tools for the comparison of protein structures. They proposed comparison algorithms based on indexing techniques that store transformation invariant properties of the 3D protein structures into tables. Because the method required large memory and intensive computing power, they used Grids framework.
Parameter sweeps on the Grid with APST [9] designed and implemented APST (AppLeS Parameter Sweep Template). APST project investigated adaptive scheduling of parameter sweep applications on the Grid, and evolved into a usable application execution environment. Parameter sweep applications are structured as sets of computational tasks that are mostly independent. APST software consists of a scheduler, a data manger, a compute manager, and a metadata manager.
However [3], [8], [9] did not support web service and [8], [9] did not provide integrated database service. Although [3] provided basic database service, it did not provide integrated database management of heterogeneous and distributed database/data in Grid environment. Therefore we construct integrated 3-dimensional chemical database and propose Grid service based molecular docking system.
3 Constructing 3D chemical database for molecular docking
In Grid computing, many applications use a large scale database or data. In existing chemical databases, order, kinds and degrees of fields are heterogeneous. Because kinds of chemical compounds become various and size of database increases, a data insertion, a data deletion, a data retrieval, and an integration of data in chemical databases become more difficult. Thus we construct a database that integrates the existing various chemical databases using MySQL. Table 1 shows Protomer table in our chemical database. Our chemical database contains 32,889 chemical molecules. Our Grid service based molecular docking system retrieves data fields for virtual screening and the retrieved data automatically composes a file mol2. And our database service provides a Query Evaluation Service. Query Evaluation Service inquires information of data nodes for selecting optimal data node.
Table 1. Protomer table in our chemical database
Attribute Description Prot_ID Molecular_ID Type Subset Type ex) Fragment-like, Drug-like Mole_name The name of molecular LogP Log of the octanol/water partition coefficient Apolar_desolvation Apolar desolvation Polar_desolvation Polar desolvation H_bond_donors The number of H bond donors H_bond_acceptors The number of H bond acceptors Charge Total charge of the molecule Molecular_weight Molecular weight with atomic weights taken fromRotable_bond The number of rotable bonds Content Whole contents of Mol2 file
4 Architecture of Grid service based
molecular docking system The current methodology in Grid computing is service
oriented architecture. In this section, we explain the components of Grid service based molecular docking system and the steps involved in molecular docking execution. Figure 2 shows an architecture of Grid service based molecular docking system. Grid service based molecular docking system consists of broker, computation resources, and data resources. And it is composed of multiple individual services located on different heterogeneous machines and administered by different organizations.
254 Int'l Conf. Grid Computing and Applications | GCA'08 |

Figure 2. Architecture of Grid service based molecular docking system
Resource broker
The resource broker is responsible for scheduling docking jobs. For scheduling, it uses information about CPU utilization and available memory capacity and dispatches docking jobs to selected computation nodes. And it monitors the execution state of jobs and gathers computation results. Our resource broker uses MDS (Metacomputing Directory Service) for resource selection. It provides Dock Service Group Registry and Dock Service Factory.
Data broker
In Grid computing, data intensive applications produce data sets on terabytes or petabytes, and these data sets are replicated within Grid environment for reliability and performance. The data broker is responsible for selecting suitable CDB services and replica for efficient docking execution. It uses replica catalogue and database information service. And it uses information about network bandwidth to select optimal data resource which provides chemical data for molecular docking execution. Our data broker provides CDB Query Service Registry and CDB Query Service Factory.
Replica catalogue
Replica catalogue manages replicas information for CDB resource discovery. It maintains mapping between logical name and target address. Logical name is unique identifier for replicated data contents and target address is physical location of replica.
Database information service
Database information service integrates and manages information required for selecting and accessing data resources. When data broker sends a query about data resources, it replies the results of the query to data broker. Resource selection algorithms of data broker can select suitable data resources using replica catalogues and database information service.
Computation resources
Computation resource provides Dock Evaluation Service Factory that performs docking with receptor and ligand.
Data resources
Data resources consist of various file systems, databases, XML databases, and hierarchical repository system. Data resource provides Query Evaluation Service Factory. In our Grid service based molecular docking system, services that want to use data resources can access heterogeneous data resources by uniform method using data broker. And Dock Service can access data resources using OGSA-DAI and OGSA-DQP.
5 Grid service specification for molecular docking In this section, we explain service specification for
molecular docking. The service specification is orthogonal to the Grid authentication and authorization mechanisms.
Dock Service Group Registry
Dock Service Group Registry (DSGR) is persistent service, which registers Dock Evaluation Service Factory (DESF) to execute docking in computation resource. DSGR provides DockServiceGroupRegistry PortType derived from GridService PortType, NotificationSource PortType, ServiceGroup PortType, and Service Group Registration PortType in OGSI. DESF registers and deletes services in DSGR using Service Group Registration PortType. DSGR creates Service Group Entry service and manages duration time of registered services. Dock Service can inquiry information about computation resources for resource scheduling using DSGR.
Dock Service Factory
Dock Service Factory (DSF) is persistent service, which provides DockServiceFactory PortType derived from GridService PortType of OGSI. The primary function of DSF is to create Dock Service instance at the request of client. Any Client wishing to execute molecular docking first connects to DSF and creates an instance. Dock Service
Int'l Conf. Grid Computing and Applications | GCA'08 | 255

instance discoveries suitable computation resources through DSGR and requests Dock Evaluation Service.
Dock Evaluation Service Factory
Dock Evaluation Service Factory (DESF) executes docking application with given receptor and ligand. DESF creates Dock Evaluation Service (DES) instance at the request of Dock Service instance. DES instance inquires ligands through CDB Query Service Factory (CDBQSF). DESF provides DockEvaluationServiceFactory PortType derived from GridService PortType of OGSI.
CDB Service Group Registry
CDB Service Group Registry (CDBSGR) is persistent service, which provides CDBServiceGroupRegistry PortType derived from GridService PortType, NotificationSource PortType, ServiceGroup PortType, and ServiceGroupRegistration PortType of OGSI. CDBSGR registers Query Evaluation Service Factory (QESF) that has inquiry functionality of molecules in CDB. CDBESF creates ServiceGroupEntry service and manages a lifespan using ServiceGroupEntry service. And it inquires information about registered services using GridService PortType and provides functionality that notifies updated services using NotificationSource PortType.
CDB Query Service Factory
CDB Query Service Factory (CDBQSF) is persistent service, which inquires information about ligand that DES instance requests. When CDB is available from more than one source, data broker selects one of them using CDBQSF. CDBQSF provides CDBQueryServiceFactory PortType derived from GridService PortType of OGSI. CDBQSF creates a CDB Query Service (CDBQS) instance at the request of DESI. CDBQS instance inquires information about ligand through QESF.
Query Evaluation Service Factory
Query Evaluation Service Factory (QESF) is persistent service, which inquires ligand that CDBQS instance requests in CDB. QESF provides QueryEvaluation ServiceFactory PortType derived from GridService PortType of OGSI and GDS PortType of OGSA-DAI. QESF creates Query Evaluation Service (QES) instance at the request of CDBQS instance. QES instance inquires database using OGSA-DAI.
6 Implementation We implemented Grid service based molecular docking
system using Globus Toolkit 3.2 and DOCK 5.0 developed by researchers at UCSF. And we constructed CDB using MySQL and defined services with XML and WSDL.
Figure 3 shows screenshot running the globus-start-container command. The list shown in figure 3 is the list of Grid services that are started along with the container. DockServiceFacoty, DockEvalServcieFactory, DockService GroupRegistry, CDBQueryServiceGroupRegisty, CBDQuery ServiceFactory, and QueryEvaluationServiceFactory that we defined and implemented are shown in figure 3 red box.
Figure 3. Screenshot running the globus-start-container command
We implemented Dock Client for user ease. Figure 4 shows interface of Dock Client and window searching ligands. The interface of Dock Client is divided into toolbar, process state display section, and screened molecules section. The toolbar consists of Login, Search Receptor, Search Ligand, and Docking. If more than two molecules are searched, client can select some of them in table.
Figure 4. Interface of Dock Client and window searching
ligands
Figure 5 shows screenshot that executes docking with selected receptor and ligand. The energy score as result of docking execution is shown in figure 5 red box. If client clicks column of energy score, energy score is sorted by ascending order.
256 Int'l Conf. Grid Computing and Applications | GCA'08 |

Figure 5. Screenshot that executes docking with selected
receptor and ligand
7 Conclusion In development of drug discovery, molecular docking is an important technique because it reduces an unmanageable number of compounds to a limited number of compounds for the target of interest. Previous applications or software for molecular docking were developed to be run on a supercomputer, a workstation, or a cluster-computer. However the molecular docking using a supercomputer has a problem that a supercomputer is very expensive and the molecular docking using a workstation or a cluster-computer requires a long execution time. Thus we proposed a Grid service based molecular docking system using Grid computing technology. To develop a Grid service based molecular docking system, we constructed a 3-dimensional chemical molecular database and defined 6 services for molecular docking. We implemented Grid service based molecular docking system with DOCK 5.0 and Globus toolkit 3.2. Our system can reduce a timeline and cost of drug discovery or new material design and provide client the ease of use. In the future, we plan to make various experiments with data sets on terabytes or petabytes for measuring efficiency of our molecular docking system.
References
[1] Elizabeth Lunney. “Computing in Drug Discovery: The Design Phase”. IEEE Computing in Science and Engineering Magazine, 2001.
[2] Ahmar Abbas. “Grid Computing: A practical guide to technology and applications”. Charles River Media, 2003.
[3] Rajkumar Buyya, Kim Branson, Jon Giddy, David Abramson. “The Virtual Laboratory: a toolset to enable distributed molecular modeling for drug design on the World-
Wide Grid”. Concurrency and Computation: Practice and Experience. Vol. 15, 2003.
[4] Philip Bourne, Helge Weissig. Structural Bioinformatics. WILEY-LISS, 2003.
[5] I. Foster, C. Kesselman, S. Tuecke. “The Anatomy of the Grid : Enabling Scalable Virtual Organizations”. International J. Supercomputer Applications, 15(3), 2001.
[6] Ian Foster, Carl Kesselman. The Grid : Blueprint for a New Computing Infrastructure. Morgan Kaufmann Publishers, 1998.
[7] Bing Wu, Kaihsu Tai, Stuart Murdock, Muan Hong Ng, Steve Johnston, Hans Fangohr, Paul Jefferys, Simon Cox, Jonathan Essex, Mark Sansom. “BioSimGrid: towards a worldwide repository for biomolecular simulations”. Organic & Biomolecular Chemistry, Vol. 2, 2004.
[8] Carlo Ferrari, Concettina Guerra, G. Zanotti. “A Grid-aware approach to protein structure comparison”. Journal of Parallel and Distributed Computing, 2003.
[9] H. Casanova, F. Berman. “Parameter Sweeps on the Grid with APST”. Grid Computing: Making the Global Infrastructure a Reality, Wiley Publishers, 2003.
Int'l Conf. Grid Computing and Applications | GCA'08 | 257

A Reliability Model in Wireless Sensor Powered Grid
Saeed Parsa, Azam Rahimi, Fereshteh-Azadi Parand Faculty of Computer Engineering, Iran University of Science and Technology, Narmak, Tehran, Iran
Abstract - The widespread use of sensor networks along with growing interest on grid computing and data grid infrastructures have led to integrate them as a unique system. To measure the reliability of such integrated system named Sensor Powered Grid (SPG), a reliability model has been proposed. Considering a semi-centralized architecture, comprising grid clients, resource manager, computing resources and sensor networks, a time distribution model has been developed as a reliability measure. Using such distribution model and the universal moment generating function (UMGF), the performance of each element like sensors, resources and their communication paths with resource management system (RMS) was formulated distinctly resulting to the system's total performance.
Keywords: Grid Computing, Sensor Networks, Fault Tolerance, Reliability, UMGF
1 Introduction With the advent of technology in micro-electromechanical systems (MEMS) and creation of small sensor nodes which integrate several kinds of sensors, sensor networks are used to observe natural phenomena such as seismological, weather conditions and traffic monitoring. These tiny sensor nodes can easily be deployed into a designated area to form a wireless network and perform a specific function. In the other hand, the availability of increasingly inexpensive different embedded computing and wireless communication technologies, such as IEEE 802.11 and Bluetooth is now making mobile computing more affordable. The increasing reliance on wireless networking for information exchange makes it critical to maintain reliable and fault-tolerant communication even in the instance of a component failure or security breach. In such wireless networks, mobile application systems continuously join and leave the network and change location with the resulting mobility impacting the degree of survivability, reliability and fault-tolerance of the communication. In the other hand Grid computing provides widespread dynamic, flexible and coordinated sharing of geographically distributed heterogeneous network resource among dynamic user groups. By spreading workload across a large number of computers, the grid computing user can take advantage of enormous computational, storages and bandwidth resource that would otherwise be prohibitively expensive to attain within traditional multiprocessor supercomputers.
The combination of sensor networks and grid computing enables the complementary strengths and characteristics of sensor networks and grid computing to be realized on a single integrated platform. This integrated platform provides real-time data about the environment for computational resources which enables the construction of real-time models and databases of the environment and physical processes as they unfold, from which high-value computation like decision making, analytics, data mining, optimization and prediction can be carried out. As the unreliable nature of the sensor network and grid environment, the investigation of reliability of sensor powered grid has great importance. Due to the low cost and the deployment of a large number of sensor nodes in an uncontrolled environment, it is not uncommon for the sensor nodes to become faulty and unreliable. On the other hand using sensor networks as eyes and ears of grid, necessitates the deployment of more reliable and fault tolerant resource management system, in other words sensor networks employment in grid means to insert more potentially faulty decisions to the grid environment, thus the fault-tolerance in sensor powered grid is one of the most important factors in resource management. Although some fault-tolerant models has been proposed for grid and sensor networks distinctly, but a comprehensive model for integrated grid and sensor network is not proposed yet. The important of a complementary fault tolerance model will be presented more, when the lack of middle layer between the fault tolerance models in grid and sensor network is observed.
2 Related Works In providing fault tolerance, four phases can be identified: error detection, damage confinement, error recovery, and fault treatment and continued system service [1]. some fault tolerance models are involved in error detection. Globus HBM [2] provides a generic failure detection service designed to be incorporated into distributed systems and grids. The applications notify the failure and takes appropriate recovery action. MDS-2 [3] in theory can support the task crash failure detection functionality via its GRRP notification protocol and GRIS/GIIS framework. Legion [4] uses pinging and time out mechanism since to detect task failures. Condor-G [5] adopts ad-hoc failure detection mechanisms since the underlying grid protocols ignore fault tolerance issues. In the case of error recovery the basis of most of researches are check pointing and replication. Job replication is a common method that aims to provide fault tolerance in distributed environments by scheduling redundant copies of
258 Int'l Conf. Grid Computing and Applications | GCA'08 |

easirewfrfotaan[3chMmreG fawPrreMsoanesThaguofprdifanodasepr[1Manchsemtoneprin
3 innodrofsucotofugr
ach job, so asimple job exequirements fo
with a failure dramework. In ocus on the pargeting their n application 3,4] provides heck-pointing
Menlat [8] anmechanisms. Tecovery mech
G and replicatiIn the field
ault tolerance who proposed a
rasad et al. [1educing the o
Marzullo's appolution relaxend uses statisstimate of th
There are manave been suguarantees relif different typroposed in [1ifferent types ault tolerance ode placemenata disseminatensor networkresented a sch18] presents a
Modular Redunnd recovery teheck-pointingensor network
model for fauolerance modetworks distinroposed to ntegrated grid.
3 ArrangSome arran
ntegrating the ot comprehenrawback. Thaf centralized uch a way omputing, seno the grid and usion is execurid computing
s to increase thecuted. In [6or fault toleradetection serv
this case morovision of a system specifto take app
mechanism tg. Remaining nd Condor-G They provideanism (e.g. reon in Menlat)of sensor netmodels. It w
a model that t11] extended Moutput intervaproach is prs the assumpttics theory to
he parameter ny other FT sgested. In [13able and fairlpes of sensor14] where a s of resourcesin sensor net
nt. The Geogrtion uses dataks. Saleh etalhema for enea fault toleranndancy (TMRechnique to p
g technique. Ik has made itult detectiondels are connctly and no address faul. In this paper
gement Mngement mod
grid computinnsive and neeam and Buyya
and decentrthat in the
nsors and sensall computati
uted out of gg is executed
he probability6] a very intance in the grivice and a flexost of researcsingle fault t
fic domains. Inpropriate recoto support fau
grid systems[9] have th
e a single uetrying in Nets). tworks; there
was first studietolerates indivMarzullo's mo
al estimate. Aresented in tion on the nuo obtain a fau
being measuschemes for s3] an algorithly accurate ours. A fault tosingle type o. The work itworks from t
raphic Hash Ta replication fol [17] introduergy-aware faunce model baR) technique provide a wireIntegrating thet necessary to
n and recovencentrated on
comprehensilt tolerance r we address th
Model dels have bng and sensor
ed to be moda [19] have cralized sensor
former to sor networks cions take plac
grid. Howeveron a distribu
y of having atteresting analid is presentedxible failure hches have theitolerance mecn Globus [2] very action. ult tolerance ss like Netsol
heir failure reuser-transport solve and in C
are many pred by Marzul
vidual sensor fodel by consi
Another exten[12]; the prmber of faulty
ult tolerant intured by the ssensor networhm is developutput from a nolerance technf resource ban [15] considthe point of v
Table (GHT) [or tolerating fuce the conceult-tolerance. ased on (i) Aand (ii) Checeless TMR (We grid with wo propose a cery. Proposedn grids andive model hain wireless
his problem.
been proposr networks whdified to avoidconsidered twr-grid compuachieve sens
connect and ine in the grid,
r in the later uted architectu
t least a lysis of d, along andling ir main
chanism there is Legion such as lve [7], ecovery
failure Condor-
roposed llo [10] failures. derably
nsion of roposed y nodes tegrated sensors. rks that ped that number
nique is acks up ders the view of [16] for faults in ept and Neogy
A Triple ck-point WTMR) wireless capable d fault
sensor as been
sensor
ed for hich are d some o types
uting in sor-grid nterface no data sensor-
ure in a
mamasengribacoaremodesenforfeeaftpoanreqcencopofiltnegri
4 Tfaisysco
Sformiothdeprofaitherelneco
S
anner that thiaking within nsor-grid archids where dec
ase on the decnsidered the de some shortodel is morecision makingnsor network.recasting and ed for completer collecting
ossible that alnd planning aquired factorntralized modmputing reso
owered grid tering and deltwork and otid. Fig. 1 illus
F
Fault TTo explain theilure definitionstem. It is a nditions is sat1. The reso
due to a r2. The avai
the minimSensor powerr sensor dataight require her data can lay. In otherocess failuresilures. Fig. 2 ie SPG is equaliability of dattworks. The nnections betw
Sensor Network
is approach inthe sensor nehitecture. Thicision makingcisions actuatodecentralized tcomings in t suitable forg is simple an While in gridso on the co
ex computing ithe raw data
ll computationa comprehensr is so impdel comprisingources and s(SPG) wher
livering the rether complex strates the gen
Fig. 1. Utilized A
Tolerance e fault toleranns which will failure if an
tisfied: urce processinresource or seilability of a rmum levels ofred grid shall a delivery. Folow-latency, tolerate cert
r hand failurs, resource oillustrates genal to the reliabta resources in
complementaween grid and
k
nvolves proceetwork and atis method is
gs are took plaors will be acmethod as a b
their model. r sensor-actuand it is possibd computing sollected sensoin the grid wh
a by sensor nens take placesive architectuportant. We g grid clientssensor networe some leveeliable data is
computationsneral architectu
Architecture for
Model nce model we
be used in ound only if on
ng or sensor densor crash. resource or sef Quality of Se
support varyor example, highly reliab
tain degrees ores include thor sensor failneral fault typebility of compun which data rary FT mod
d sensor netwo
RMS
essing and det other levels designed foace by raw dactivated. Theybetter choice. Their decentr
ator systems ble to make thsystems like wor data is the hich will be inetwork. So it e in sensor neure considericonsider a
, resource maorks named els of informconducted in s are took plure of the SPG
r SPG
propose a seur fault managne of the foll
data collection
ensor does noervice (QoS).ying degree ocertain sensoble delivery, of network lhree general lures, and nees. The reliabiuting resourceresources are
del shall covork.
R
ecision of the
or data ata and y have There
ralized where
hem in weather
initial nitiated
is not etwork ing all
semi-anager, sensor mation sensor
lace in G.
eries of gement lowing
n stops
ot meet
of QoS or data
while oss or types:
etwork ility of es plus sensor er the
Resource
Int'l Conf. Grid Computing and Applications | GCA'08 | 259

Fault type examples in complementary FT model:
1- Resource processor failure. 2- Lack of availability of required resource accuracy. 3- Sensor network proxy stops. 4- Unavailability of sensor network proxy. 5- Disconnect between resource manager and sensor network or
disconnect between resource manager and resource. 6- Slow communication between resource manager and sensor
network.
Fig. 2. Classification of fault types in SPG
5 The Model
Our proposed reliability model consists of two sectors: The data sector and the computational sector. Thus the SPG reliability consists of: SPG reliability = reliability of sensor network Λ reliability of computational grid According to our assumptions the entire task is divided into m subtasks which should be done in resources [20] and n data vector which should be provided by sensor network in a way that:
, (1)
Where C is the entire computational task complexity and cj
is the complexity of each subtask j and D is the entire sensor detection complexity and di is the detection rate for data vector i. The subtask processing time and data vector detection time are as follows:
(If the resource does not fail) And
(If the sensor does not fail)
And Tkj= ∞ or = ∞ if resource or sensor fails. In case of resources with constant failure rate the probability that resource k does not fail during processing of subtask j is:
The amount of data should be transmitted between RMS and the resource k that is processing subtask j (input data from the resource to RMS). Therefore the time of communication between RMS and resource k that process subtask j can take value:
(4)
For constant failure rate the probability that communication channels k does not fail during delivering the initial data and sending the results of subtask j can obtained as:
(5)
These give the distribution of the random subtask processing time in computational resources:
And ∞ 1
(6)
In case of sensor network with variable failure rate, the probability that sensor l does not fail during detection of vector data i is:
(7)
In which is the average number of failures. The amount of data should be transmitted between the sensor l that collect data vector i and RMS (input data from sensor network to
: Reliability functions of time t τ : Random time of data i detection by sensor l : Probability that subtask j is correctly completed by resource k : Number of detected data
: Probability that data i is correctly detected by sensor l : Data quantity should be transmitted between RMS and the resource k
: Task complexity a : Data quantity should be transmitted between the sensor l and RMS
: Data Vector Complexity : Communication channel speed for resource k : Computational complexity of subtask j : Communication channel speed for sensor : Detection rate of data vector i δ : Communication time of resource k for subtask j : Processing speed of resource k δ : Communication time of sensor l for data vector i
: Detection speed of sensor l : Probability that data quantity aj transported from resource k without failure
: Random time of subtask j processing by resource k : Probability that data quantity ai transported from sensor l
(3)
(2)Network Failure
Network QoS Failure 6
Sensor Powered Grid Failures
Resource or Sensor Failure Process Failures
Resource or Sensor Stop 3 Resource or Sensor QoS Failure 4
Network Disconnect Failure Process Stop Failure 1
Process QoS Failure 2
260 Int'l Conf. Grid Computing and Applications | GCA'08 |

RMS). The time of communication between sensor network and RMS is:
(8)
For constant failure rate the probability that communication channels l does not fail during detect of data i can obtained as:
(9)
These give the distribution of the random data detection time:
And ∞ 1 (10)
Since the subtask is completed when its output reaches the RMS, the random completion time , for the detected data vector i subjecting to subtask j assigned to resource k is equal to . It can be easily seen that the distribution of this time is:
And ∞ 1
(11)
We assume that each sensor detect a vector data i and send it to RMS and then RMS divides it to m subtasks. Each subtask j is assigned to resources comprising set . In this case the random time of subtask j completion is:
, , (12)
The entire task is completed when all of the subtasks (including the slowest one) are completed. Therefore the random task execution time takes the form:
, (13)
5.1 Reliability and Performance In order to estimate both the service reliability and its performance, different measures can be used depending on the application. The system reliability is defined as a probability that the correct output is produced in time less than . This index can be obtained as:
. Θ θ
(14)
Where Θ Θ and is critical time. The service performance (the number of executed tasks over a fixed time) is another point of interest. The service performance is defined as the probability that it produces correct outputs without respect to the total task execution time. This index can be referred to as . The conditional expected task execution time W (given the system produces correct output) is considered to be a measure of its performance. This index
determines the expected service execution time given that the system does not fail. It can be obtained as:
∞∞
(15)
The procedure used in this paper for the evaluation of service time distribution is based on the universal moment generating function (UMGF) technique. In this paper the procedure used is based on the universal z-transform, which is a modern mathematical technique introduced in [21]. This method, convenient for numerical implementation, is proved to be very effective for high dimension combinatorial problems. In the literature, the universal z-transform is also called UMGF or simply u-transform. The UMGF extends the widely known ordinary moment generating function [22]. The UMGF of a discrete random variable y is defined as a polynomial:
(16)
Where the variable y has J possible values and Pj is the probability that y is equal to yj. To obtain the u-transform representing the performance of a function of two independent random variables φ y , y , composition operators are introduced. These operators determine the u-transform for φ y , y using simple algebraic operations on the individual u-transform of the variables. All of the composition operators take the form:
(17)
, , ,
, , ,
In the case of grid system, the u-transform , can define performance of total completion time , for data vector i resulted to subtask j assigned to resource k. This u-transform takes the form:
(18)
, 1 ∞ for resources And
, 1 ∞ for sensors
6 An Analytical Example Consider a sensor powered grid service that uses data vectors of two sensor and four computational resources. Assume that each data vector's computational process is divided into two subtasks by RMS. The first subtask of each data vector is assigned to resources 1 and 2; the second
Int'l Conf. Grid Computing and Applications | GCA'08 | 261

subtask is assigned to resources 3 and 4. The reliability of the sensors and resources and assigned subtask completion times for available sensors and resources are presented in tables 1 and 2. About communication times in table 1 and 2, it is assumed that resources start the computation process as soon as the sensor networks start data detection. Also, it is assumed that the communication time of sensor networks is included the start up time before data transmittal. The estimated arrangement of the possible network is illustrated in Fig. 3.
Fig. 3. Schematic arrangement of possible network, S: Sensors, R: Resources & P: Paths
Table 1. Reliability , of SPG resources and resources’
communication paths and Subtask completion time kjkjT δ+ include
computation and communication times (s)
No of resource k
Reliability Completion Time No of subtask j No of subtask j
1 2 1 2 1 2 3 4
0.6, 0.7 0.5, 0.9
- -
- -
0.4, 0.7 0.7, 0.5
7+1 8+2
- -
- -
9+1 10+3
Table 2. Reliability , of SPG sensors and sensors’ communication paths and data detection completion time
, include detection and communication times (s)
No of sensor i
, ,
1 2
0.7, 0.3 0.5, 0.6
3+6 2+7
In order to determine the completion time distribution for both sensors and both subtasks, the u-transform , is defined:
{ }( ) ∞+= ZZZkju 3.037.0,1 , { }( ) ∞+=′ ZZZkju 7.063.0,1 S1 and P1
{ }( ) ∞+= ZZZu kj 5.05.0 2,2 , { }( ) ∞+=′ ZZZu kj 4.06.0 7
,2 S2 and P2
{ }( ) ∞+= ZZZui 4.06.0 71,1 , { }( ) ∞+=′ ZZZui 3.07.0 1
1,1 R1 and P3 in s1
{ }( ) ∞+= ZZZui 5.05.0 82,1 , { }( ) ∞+=′ ZZZui 1.09.0 2
2,1 R2andP4 in s1
{ }( ) ∞+= ZZZui 6.04.0 93,2 , { }( ) ∞+=′ ZZZui 3.07.0 1
3,2 R3andP5 in s2
{ }( ) ∞+= ZZZui 3.07.0 104,2 , { }( ) ∞+=′ ZZZui 5.05.0 3
4,2 R4andP6in s2
The u-transform representing the performance of completion times { }kij ,θ are obtained as follows:
{ } { }( ) ∞+=′Ω ZZuu kjkj 79.021.0, 6,1,11 (S1&P1),
{ } { }( ) ∞+=′Ω ZZuu kjkj 7.03.0, 7,2,22 (S2 & P2)
{ } { }( ) ∞+=′Ω ZZuu ii 58.042.0, 71,11,13 (R1&P3),
{ } { }( ) ∞+=′Ω ZZuu ii 55.045.0, 82,12,14 (R2 & P4)
{ } { }( ) ∞+=′Ω ZZuu ii 72.028.0, 93,23,25 (R3&P5), Then:
( ) ∞++=ΩΩΓ ZZZ 553.0237.021.0, 76211 For data vector
( ) ∞++=ΩΩΓ ZZZ 319.0261.042.0, 87
432 For subtask 1
( ) ∞++=ΩΩΓ ZZZ 468.0252.028.0, 109653 For subtask 2
And finally:
( ) ∞++=ΓΓΩ ZZZ 698.0115.0187.0, 87217
( )( ) ∞++=ΓΓΓΩΩ ZZZ 836.0075.0089.0,, 10932178
Now this u-transform represents the performance of Θ : ( ) 089.09Pr ==Θ , ( ) 075.010Pr ==Θ , ( ) 836.0Pr =∞=Θ
From the obtained performance we can calculate the service reliability as follows:
089.0)( * =θR for 109 * ≤<θ , ( ) 164.0=∞R ( ) 457.9164.0/10075.09089.0 =×+×=W
7 Conclusions Use of sensor networks is greatly spread in computational grids. The requirement of online data in computational grids has mandated the necessity of using the integrated sensor network powered computational grid. Although some fault tolerance models has been developed in grids, little investigations has been developed on FT models in sensor powered grids. In this paper using the UMGF technique, a reliability model for SPG has been developed. Other results are outlined hereunder:
- A diagram showing the classified SPG failures has been represented. In one hand all failures are classified into two groups of crash related and QoS level related failures, and on the other hand failures can be classified into three sectors of process, resource or sensor and network failures.
- Using the distributions of random processing, detection and communication times a performance measure for different SPG arrangements has been developed.
- Using the UMGF technique, a model for measuring the total time of task execution has been represented.
- In the represented model the total time has been divided into processing time in resources, detection time in sensors and communication times in sensor-RMS and resource-RMS paths.
S1
S2
R4
R3
R2
R1
P1
P2
P3 P4
P5
P6RMS
262 Int'l Conf. Grid Computing and Applications | GCA'08 |

- The performance of sensors, resources and paths are measured distinctly.
8 References [1] Jalote, P. “Fault tolerance in Distributed Systems”;
Prentice-Hall, Inc, 1994. [2] Stelling, P., Foster, I., Kesselman, C., Lee, C.,
Laszewski, G. von. “A Fault Detection Service for Wide Area Distributed Computations”; In: Proceedings of the Seventh IEEE Symposium on High Performance Distributed Computing. 268—278, 1998.
[3] Czajkowski, K., Fitzgerald, S., Foster, I., Kesselman, C. “Grid Information Services for Distributed Resource Sharing”; In Proceedings of the Tenth IEEE Symposium on High Performance Distributed Computing, 2001.
[4] Grimshaw, A., Wulf, W., Team, T.L. “The Legion Vision of a Worldwide Virtual Computer”; Communications of the ACM, 1997.
[5] Frey, J., Tannenbaum, T., Foster, I., Livny, M., Tuecke, S. “Condor-G: A Computation Management Agent for Multi-Institutional Grids”; Cluster Computing, Vol. 5, No. 3, 2002.
[6] Hwang, S., Kesselman, C. “A flexible framework for fault tolerance in the grid”; J. Grid Comput. 1, 251—272, 2003.
[7] The Globus project, http://www-fp.globus.org/hbm [8] Grimshaw, A.S., Ferrari, A., West, E.A., Mentat. In.
Wilson, G.V., Lu (Eds.), P. “Parallel Programming Using C++”; 382—427 (Chapter10), 1996.
[9] Gartner, F.C. “Fundamentals of fault-tolerant distributed computing in asynchronous environments”; ACM Comput. Surv. 31 (1), 1999.
[10] Marzullo, K. “Tolerating Failures of Continuous Valued Sensors”; In ACM Transactions on Computer Systems. Vol. 8, 284—304, Nov 1990.
[11] Prasad, L. , Iyengar, S. S., Kashyap, R. L. , Madan, R. N. “Functional Characterization of Fault Tolerant Integration in Distributed Sensor Networks”; In IEEE Transactions on Systems. Man and Cybernetics, vol. 21, 1082—1087, Sep/Oct 1991.
[12] Liu, H.W, Mu, C.D. “Efficient Algorithm for Fault Tolerance in Multi-sensor Networks”; In International Conference on Machine Learning and Cybernetic, Vol. 2, 1258—1262, August 2004.
[13] Jayasimha, D. N. “Fault tolerance in multi-sensor networks”; In IEEE Transactions on Reliability, June 1996.
[14] Koushanfar, F., Otkonjak, M., Sangiovanni, A., Vincentelli, “Fault Tolerance in Wireless Ad-Hoc Sensor Networks”; In IEEE Sensors, 1491—1496, June 2002.
[15] Ishizuka, M., Aida, M. “Performance Study of Node Placement in Sensor Networks”; In Proceedings of the 24th International Conference on Distributed Computing Systems Workshops, 598—603, 2004.
[16] Ratnasamy, S., Karp, B., Shenker, S., Estrin, D., Govindan, R., Yin, L., Fang Yu. “Data-Centric Storage
in Sensor nets with GHT, a Geographic Hash Table”; Mob. Netw. Appl., 8(4): 427—442, August 2003.
[17] Saleh, I., Agbaria, A., Eltoweissg, M. “In-Network Fault Tolerance in Networked Sensor Systems”; DIWANS’06, Sept 2006.
[18] Neogy, S. “WTMR – A new Fault Tolerance Technique for Wireless and Mobile Computing Systems”; Department of Computer Science & Engineering, Jadavpur University, India, 2007.
[19] Tham, C. K., Buya, R. “SensorGrid: Integrating Sensor Networks and Grid Computing”; CSI Communications, 24, July 2005.
[20] Levitin, G., Dai, Y. S. “Service reliability and performance in grid system with star topology”; Reliabilty Engineering & System Safety, 2005.
[21] EL-Neweihi E., Proschan F., Degradable systems “A survey of multi states system theory”; Common. Statis. Theory Math., 13(4), 405—432, 1984.
[22] Ushakov I. A., “Universal generating function”; Sov. J. Computing System Science, 24(5), 118—129, 1986.
Int'l Conf. Grid Computing and Applications | GCA'08 | 263
G-BLAST: A Grid Service for BLAST
Purushotham Bangalore, Enis Afgan
Department of Computer and Information Sciences
University of Alabama at Birmingham
1300 University Blvd., Birmingham AL 35294-1170
{puri, afgane}@cis.uab.edu
Abstract – This paper described the design and
implementation of G-BLAST – a Grid Service for one of the
most widely used bioinformatics application Basic Local
Alignment Search Tool (BLAST). G-BLAST uses the factory
design pattern to provide application developers a common
interface to incorporate multiple implementations of BLAST.
The process of application selection, resource selection,
scheduling, and monitoring is completely hidden from the
end-user through the web-based user interfaces and the
programmatic interfaces enable users to employ G-BLAST as
part of a bioinformatics pipeline. G-BLAST uses an adaptive
scheduler to select the best application and the best set of
resources available that will provide the shortest turnaround
time when executed in a grid environment. G-BLAST is
successfully deployed on a campus and regional grid and
several BLAST applications are tested for different
combinations of input parameters and computational
resources. Experimental results illustrate the overall
performance improvements obtained with G-BLAST.
Keywords: grid, BLAST, scheduling, usability
1 Introduction
Basic Local Alignment Search Tool (BLAST) is a
sequence analysis tool that performs similarity searches
between a short query sequence and a large database of
infrequently changing information such as DNA and amino
acid sequences [8, 9]. With the rapid development of
sequencing technology of large genomes for several species,
the sequence databases have been growing at exponential
rates [11]. Facing the rapid expanding target databases and
the length and number of queries used in the search, the
BLAST programs take significant time to find a match.
Parallel computing techniques have helped BLAST to gain
speedup on searches by distributing searching jobs over a
cluster of computers. Several parallel BLAST search tools
[13, 19] have been demonstrated to be effective on
improving BLAST’s performance. mpiBLAST [19] and
TurboBLAST [13] use database segmentation to distribute a
portion of the sequence database to each cluster node. Thus,
each cluster node only needs to search a query against its
portion of the sequence database. On the other side, some
researchers apply query segmentation to alleviate the burden
of searching jobs [16, 18]. In query segmentation, a subset of
queries, instead of the database, is distributed to each cluster
node, which has access to the whole database. As for as the
end-user of the BLAST application is concerned the final
outcome and turnaround time is of interest and typical users
do not really care which of the above techniques were used to
generate the final results.
The majority of parallel BLAST applications, however,
cannot cross the boundary of computer clusters, i.e., the
communication among parallel instances of BLAST
algorithms are limited among computing nodes with
homogeneous system architectures and operating systems.
This limitation heavily encumbers the development of
cooperative BLAST applications across heterogeneous
computing environments. Particularly when many
universities and research institutes have started to build grids
to take advantage of various computational resources
distributed across the organization.
The emerging Grid computing technology [12] based on
Service Oriented Architecture (SOA) [20] and Web Services
provides an ideal development platform to take advantage of
the distributed computational resources. Grid computing not
only presents maximum available data/computing resources
to BLAST search, but also shows its powerful ability on
some critical issues, such as security, load balancing, and
fault tolerance. Grid services [20] provide several unique
features such as statefull services, notification, and uniform
authentication and authorization across different
administrative domains. The focus of this paper is to develop
a grid service for BLAST by exploiting these unique features
of grid services and provide ubiquitous access to distributed
computational resources as well as hide the various details
about application and resource selection, job scheduling,
execution, and monitoring. One of the goals of this work is to
provide a web-based interface through which users can
submit queries, monitor their job status, and access results.
The portal could then dispatch the queries to all the available
computing resources according to a well-planed scheduling
scheme that takes into account the heterogeneity of the
resources and performance characteristics of BLAST on
these resources based on the query length, number of queries,
and the database used. An additional goal of this effort is to
provide applications developers a common interface so that
different implementations of BLAST could be easily
264 Int'l Conf. Grid Computing and Applications | GCA'08 |
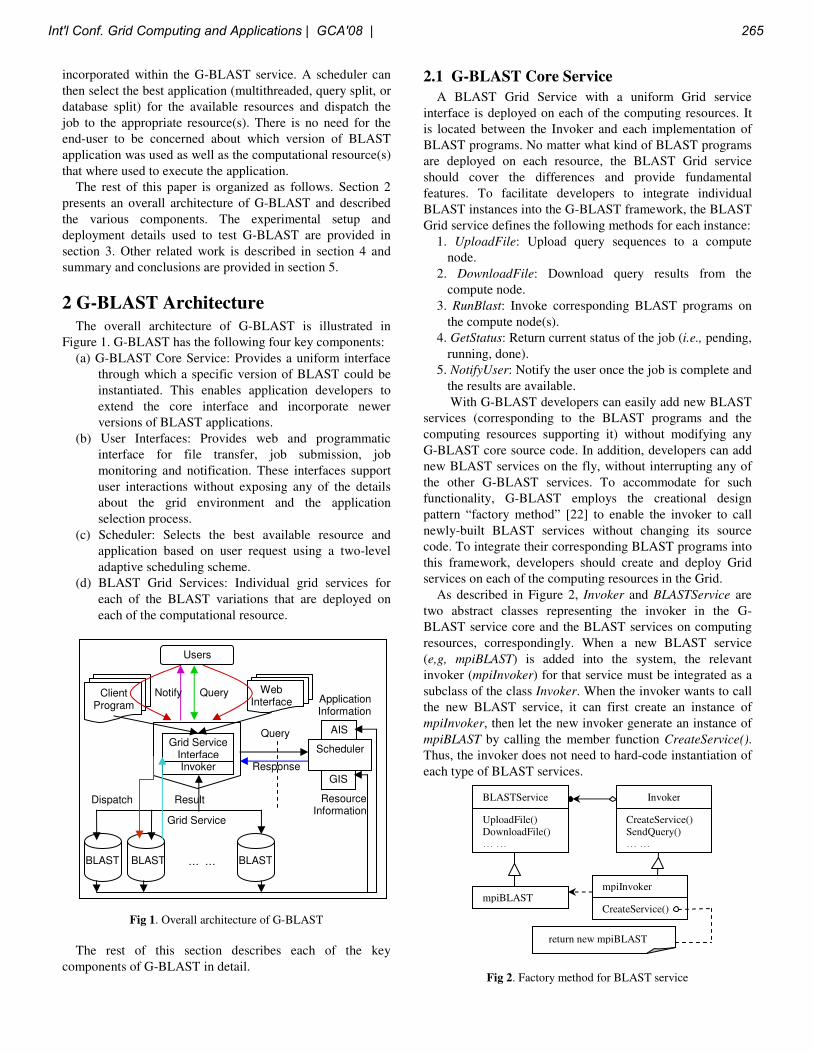
incorporated within the G-BLAST service. A scheduler can
then select the best application (multithreaded, query split, or
database split) for the available resources and dispatch the
job to the appropriate resource(s). There is no need for the
end-user to be concerned about which version of BLAST
application was used as well as the computational resource(s)
that where used to execute the application.
The rest of this paper is organized as follows. Section 2
presents an overall architecture of G-BLAST and described
the various components. The experimental setup and
deployment details used to test G-BLAST are provided in
section 3. Other related work is described in section 4 and
summary and conclusions are provided in section 5.
2 G-BLAST Architecture
The overall architecture of G-BLAST is illustrated in
Figure 1. G-BLAST has the following four key components:
(a) G-BLAST Core Service: Provides a uniform interface
through which a specific version of BLAST could be
instantiated. This enables application developers to
extend the core interface and incorporate newer
versions of BLAST applications.
(b) User Interfaces: Provides web and programmatic
interface for file transfer, job submission, job
monitoring and notification. These interfaces support
user interactions without exposing any of the details
about the grid environment and the application
selection process.
(c) Scheduler: Selects the best available resource and
application based on user request using a two-level
adaptive scheduling scheme.
(d) BLAST Grid Services: Individual grid services for
each of the BLAST variations that are deployed on
each of the computational resource.
Fig 1. Overall architecture of G-BLAST
The rest of this section describes each of the key
components of G-BLAST in detail.
2.1 G-BLAST Core Service
A BLAST Grid Service with a uniform Grid service
interface is deployed on each of the computing resources. It
is located between the Invoker and each implementation of
BLAST programs. No matter what kind of BLAST programs
are deployed on each resource, the BLAST Grid service
should cover the differences and provide fundamental
features. To facilitate developers to integrate individual
BLAST instances into the G-BLAST framework, the BLAST
Grid service defines the following methods for each instance:
1. UploadFile: Upload query sequences to a compute
node.
2. DownloadFile: Download query results from the
compute node.
3. RunBlast: Invoke corresponding BLAST programs on
the compute node(s).
4. GetStatus: Return current status of the job (i.e., pending,
running, done).
5. NotifyUser: Notify the user once the job is complete and
the results are available.
With G-BLAST developers can easily add new BLAST
services (corresponding to the BLAST programs and the
computing resources supporting it) without modifying any
G-BLAST core source code. In addition, developers can add
new BLAST services on the fly, without interrupting any of
the other G-BLAST services. To accommodate for such
functionality, G-BLAST employs the creational design
pattern “factory method” [22] to enable the invoker to call
newly-built BLAST services without changing its source
code. To integrate their corresponding BLAST programs into
this framework, developers should create and deploy Grid
services on each of the computing resources in the Grid.
As described in Figure 2, Invoker and BLASTService are
two abstract classes representing the invoker in the G-
BLAST service core and the BLAST services on computing
resources, correspondingly. When a new BLAST service
(e,g, mpiBLAST) is added into the system, the relevant
invoker (mpiInvoker) for that service must be integrated as a
subclass of the class Invoker. When the invoker wants to call
the new BLAST service, it can first create an instance of
mpiInvoker, then let the new invoker generate an instance of
mpiBLAST by calling the member function CreateService().
Thus, the invoker does not need to hard-code instantiation of
each type of BLAST services.
Fig 2. Factory method for BLAST service
BLASTService Invoker
UploadFile()
DownloadFile()
… …
mpiBLAST
CreateService()
SendQuery()
… …
mpiInvoker
CreateService()
return new mpiBLAST
Client Program
Web Interface
Users
… … BLAST BLAST BLAST
GIS Invoker
Grid Service Interface
Resource Information
Grid Service
Query
Response
Query
Dispatch Result
Notify
AIS
Scheduler
Application Information
Int'l Conf. Grid Computing and Applications | GCA'08 | 265
This design pattern encapsulates the knowledge of which
BLAST services to create and delegate the responsibility of
choosing the appropriate BLAST service(s) to the scheduler
(described in Section 2.C). The Invoker could invoke more
than one BLAST service based on the availability of
resources to satisfy user requirements.
2.2 User Interfaces
G-BLAST framework provides unified, integrated
interfaces for users to invoke BLAST services over
heterogeneous and distributed Grid computing environment.
The interfaces summarize the general functionalities that are
provided by each individual BLAST service, as well as cover
the implementation details from the end users. Two user
interfaces are currently implemented to satisfy different
users’ requirements. For users who want to submit queries as
part of workflow, a programmable interface is furnished
through a Grid Service. Service data and notification
mechanism supported by Grid Services are integrated into
the BLAST Grid service to provide statefull services with
better job monitoring and notification. For users who want to
submit each query with individual parameter settings and
familiar with traditional BLAST interface, like NCBI
BLAST [26], a web interface is implemented for job
submission, monitoring, and file management.
G-BLAST exploits the notification mechanism [20]
provided by grid services in two aspects. One aspect is the
notification of changes by BLAST services to the scheduler.
The other aspect is the notification of job completion to the
end users. Both of these two instances strictly follow the
protocol of notification. In notification of service changes,
the BLAST services are the notification source, and the
scheduler is the notification subscriber. Whenever the
BLAST service on the computing node has any changes, the
service itself will automatically notify the scheduler with up-
to-date information. This mechanism keeps the scheduler
updated with the most recent status of the BLAST service,
therefore helps scheduler make informed decisions on the
selection of computing resources. Notification for job
completion has a similar implementation, except that the
notification sink is the registered client program.
To facilitate users’ using G-BLAST, a programming
template is also provided to guide users’ code their own
client program for G-BLAST service invocation. Figure 3
demonstrates the major part of a client program that invokes
G-BLAST service by creating Grid service handler,
uploading query sequence(s) to the back-end server,
submitting a query job, checking the job status, and finally
retrieving the query results.
In addition to providing a programmatic interface for the
end user, the framework also provides a web workspace that
supports the needs of a general, non-technical Grid user who
prefers graphical user interface to writing code. The most
common needs of a general user are file management, job
submission, and job monitoring. File management is
supported through a web file browser allowing users to
upload new query files or download search result files. It is a
simplified version of an FTP client that is developed in PHP.
Job submission module is made as simple as possible to use,
the user after naming the job for easy reference only provides
or selects a search query file and chooses the database to
search against. Application selection, resource selection, file
mapping, and data transfer are handled automatically by the
system. Finally, the job monitoring module presents the user
with the list of his or her jobs. It includes a date range
allowing the user to view not only the currently running jobs,
but the completed jobs as well. When viewing the jobs, the
user is given the name of the job, current status (running,
done, pending, or failed) and job execution start/end time.
Upon clicking on the job name, the user can view more
detailed information about the query file, database used, and
start and end time. The user is also given the option to re-
submit a job with the same set of parameters or after
changing one of the parameters.
// Get command-line argument as Grid Service Handler
URL GSH = new java.net.URL(args[0]);
// Get a reference to the Grid Service instance
GBLASTServiceGridLocator gblastServiceLocator = new
GBLASTServiceGridLocator();
GBLASTPortType gblast =
gblastServiceLocator.getGBLASTServicePort(GSH);
………..
//Query sequence uploading
gblast.FileTransfer(inputFile, src, remote);
………..
//Submit query as a job
gblast.BLASTRequest(blastRequest);
jobid=gblast.JobSubmit();
………..
//Check query (job) status
gblast.JobStatus(jobid);
………..
//Retrieve back the query result
gblast.ResultRetrive(jobid);
Fig 3. Client program to invoke G-BLAST service
2.3 Two-level Adaptive Scheduler
Due to the heterogeneity of available resources in the
Grid, system usability as well performance of the application
can be drastically affected without an efficient scheduler
service. Rather than developing a general purpose meta-
scheduler that tries to schedule any application equally by
using the same set of deciding factors, we have created a
two-level application-specific scheduler that uses application
and resource specific information to provide a high-level
service for the end user (either in turnaround time, better
resource utilization, or usability of the system).
The scheduler collects application specific information in
the Application Information Services (AIS) [3], initially from
the developer through Application Specification Language
(ASL) [3] and later from application runs. ASL assists
266 Int'l Conf. Grid Computing and Applications | GCA'08 |

developers to describe the application requirements and the
AIS acts as a repository of application descriptors that can be
used be a resource broker to select the appropriate
application. ASL is much like RSL but from the application
point of view. It is a language that provides a way for the
application developer to specify the requirements imposed by
the application. It specifies deployment parameters that have
to be fulfilled during runtime such as required libraries,
specific operating system, minimum/maximum number of
processors required to run, specific input file(s) required,
specific input file format, minimum/maximum amount of
memory and disk space, type of interconnection network and
so on. Unlike RSL, where only the end user specifies the
requirements for their job, ASL allows the application
developer or owner to specify requirements for allowing the
application to be run (e.g., licensing, subscription fee) and
thus is creating a contract between the user and the
developer.
The scheduler uses this information for each of the
subsequent decision makings when selecting the best
available resource (say, resource resulting in shortest
turnaround time, or the cheapest resource, or the most
reliable resource). Once the user provides the necessary job
information (as described by the JDF), the scheduler obtains
a snapshot of the available resources in the Grid, and based
on the information obtained from AIS, it automatically
performs a matching between the JDF and ASL as to which
of the available algorithms and available resources will result
in desired performance. For the more details on the inner
workings of the scheduler please refer to [5, 6].
3 Deployment and Results
3.1 UABGrid
UABGrid is a campus grid that includes computational
resources belonging to several administrative and academic
units at the University of Alabama at Birmingham (UAB).
The campus-wide security infrastructure required to access
various resources on UABGrid are provided by Weblogin
[28] using the campus-wide Enterprise Identify Management
System [27]. There is diverse pool of available machines in
UABGrid, ranging from mini clusters based on Intel Pentium
IV processors and Intel Xeon based Condor pool to several
of clusters made up of 64-bit AMD Opteron and Intel Xeon
CPU’s. Each of the departments participating has complete
autonomy over local resource administration, resulting in a
true grid setup. Access to individual resources was
traditionally made through SSH or command line GRAM
tools, but more recently we have added a general purpose
resource broker [7, 23] and a portal that facilitates resource
selection based on user’s job requirements. Since we are
focusing our work to BLAST, a common feature of all the
resources in UABGrid is that they have BLAST and/or
mpiBLAST installed and available for use. The sequence
databases on local resources are updated daily by a cron job
and formatted appropriately to speedup user query searches.
3.2 Experimental Setup and Results
The scheduler has to select not only the best resource
among a set of available resources but also select the best
version of the BLAST application to deliver the shortest
turnaround time for any given user request. In order to
develop the knowledgebase required to test the capabilities of
the scheduler in delivering these goals we have executed
these applications on diverse computer architectures that are
representative of actual resources on UABGrid [4]. On each
of these computer architectures three different versions of
BLAST algorithm: multithreaded, query split, and database
split are executed. Each version of the BLAST application is
in-turn tested with three protein databases of varying sizes
and three different query file sizes (varying number of
queries and query lengths). In this section we provide some
of key performance results to illustrate the impact of these
various parameters on the overall performance of BLAST
queries and describe how the adaptive scheduler uses these
performance results to decide the appropriate BLAST
application and the computational resources.
Three protein databases available from NCBI’s website
(ftp://ftp.ncbi.nlm.nih.gov/blast/db/) are used as part of these
experiments. The smallest database selected was yeast.nt, a
13 MB representing protein translations from yeast genome.
As the medium size database, we selected the non-redundant
protein database (nr). It is an 821 MB database with entries
from GenPept, Swissprot, PIR, PDF, PDB, and RefSeq [2]
and finally, the largest database selected was 5GB est
database, or Expressed Sequence Tags. This is a division of
GenBank, which contains sequence data and other
information on "single-pass" cDNA sequences from a
number of organisms [1]. These databases represent a wide
range of possible sizes and have been selected to reflect the
most commonly used databases by the scientists in order to
provide a solid base for the scheduling policies developed as
part of this application. 10,000 protein queries were run
against three NCBI's protein databases. Query input files are
grouped into three groups based on the number of queries;
small, medium and large. Small number of queries is
anything less than 100 queries, medium is between 100 and
1,000, while large is anything over 1,000 queries.
For any given computer architecture and BLAST version,
the performance depends on the following input parameters:
individual query lengths, total number of queries, and the
size of the database against which the search is performed.
Results indicate that the execution time increases linearly as
the length of individual queries increase. Figure 4 provides
BLAST execution time for queries of varying lengths using
nr database on three different architectures. Similar
experiments with other databases indicate that the execution
time increases correspondingly when the database size
increases. These experiments also highlight the importance
of CPU clock frequency on the overall execution time of a
BLAST query as the query length increases.
The performance of query splitting and database splitting
approaches were also compared on different architectures
Int'l Conf. Grid Computing and Applications | GCA'08 | 267

with different query files and databases. Figure 5 provides
the comparison between query split and database split
approaches for the nr database using 10,000 query input file.
From the diagram, we can observe that BLAST keeps a
nearly linear speedup up-to 16 CPUs regardless of the
algorithm used. Overall performance results indicate that the
query-splitting algorithm outperforms database-splitting
algorithm by almost a factor of two. Use of different database
shows similar results as long as the size of the database is
less than the amount of main memory available. In the later
case, the database-splitting algorithm outperforms the query-
splitting algorithm due to the reduced I/O involved in trying
to keep only a portion of the original database in memory.
Execution time vs. Query length with nr database on 1000 queries
0
20
40
60
80
100
120
0 500 1000 1500 2000 2500
Query Length
Tim
e (
seco
nd
s)
Xeon EM64T 3.2 GHz Xeon 32-bit 2.66 GHz Opteron 1.6 GHz
Linear (Xeon EM64T 3.2 GHz) Linear (Xeon 32-bit 2.66 GHz) Linear (Opteron 1.6 GHz) Fig 4. BLAST application performance as a function of query
length.
Testing the validity of resource selection involved
submitting a number of equal jobs and varying resource
availability. We varied the number of available CPUs as well
as availability of resources of different architectures and
capabilities. Table 1 shows the performance of multithreaded
BLAST on different architectures for 10 queries of varying
lengths with the nr database. These results indicate that
CPUs with higher clock frequencies and larger caches, along
with more memory, outperform their slower counterparts. In
addition, hyper-threading seems to offer significant
performance improvements on the Intel Xeon EM64T
architecture.
0
100,000
200,000
300,000
400,000
500,000
600,000
2 4 8 10 16
Number of Processors
Ru
n t
ime (
in s
eco
nd
s)
10,000-db-split
10,000-query-split
Fig 5. Direct comparison of execution time of query splitting and
database splitting versions of the BLAST with varying number of
processors.
Table 1. Performance comparison on different processor types
against nr database (1.1 GB) and input file with 10 queries.
Processor Type Threads
1 2 3
Intel Xeon (2.66 GHz, 32 bit, 512 Kb L2, 2
GB RAM) – Dual processors 508 265 266
Intel Xeon (3.2 GHz, 64 bit, 2 MB L2, 4 GB
RAM) – Dual processors 426 231 180
AMD Opteron (1.6 GHz, 64 bit, 1 MB L2, 2
GB RAM) – Dual processors 471 243 242
Macintosh G5 (2.5 GHz, 64 bit, 512 KB L2, 2
GB RAM) – Dual processors 382 198 ---
Sun Sparc E450 (400 MHz, 64 bit, 4 MB L2, 4
GB RAM) – Quad Processors 2318 1183 590
Sun Sparc V880 (750 MHz, 64 bit, 8 MB L2,
8 GB RAM) – Quad Processors 1211 615 318
The use of grid technologies and the described scheduler
has enabled G-BLAST to move beyond executing on any
single resource and execute on users’ jobs on multiple
resources simultaneously, thus realizing a shorter job
turnaround time. The aim of the scheduler is to minimize
job’s overall turnaround time. This is achieved through
selection of resources to execute the job from the pool of
available resources and selection of which algorithm to
employ on each resource. These two main directives are
further complicated by the need to minimize load imbalance
across selected resources. Details on the scheduler
implementation can be found in [6], while the results in paper
focus on showing the ‘value added’ to a user employing G-
BLAST. G-BLAST enables execution of a job across
multiple resources simultaneously, and because this is
typically not available, it is hard to provide a direct
comparison of obtained results. As such, provided results
focus on internal functionality of the scheduler while overall
job runtimes of G-BLAST jobs and standard BLAST jobs
can be derived from Figure 4.
Figure 6 shows execution of a G-BLAST job across
multiple resources using 100 queries and nr database.
Following a job submission, G-BLAST selects resources for
execution and the input data is automatically distributed and
submitted to those resources. The figure shows execution of
the same job using 16, 8, 4, and 2 processors among selected
machines. As can be seen, the load imbalance across
resources is minimized, but not eliminated. This is generally
due to the inconsistencies of performance of individual
resource that was not predicted by the scheduler, as well as
the contention of any one fragment with other jobs currently
being submitted to the given resource and thus competing
with the one another.
All of the results presented above indicate the different
intricacies that a typical end-user has to handle while
executing BLAST in a grid environment. The scheduler
encapsulates all these details and makes it easier for the end-
user to take advantage of a grid environment. By analyzing
these experiments, we were able to confirm that the choice
the scheduler was making during algorithm selection was
indeed accurate. Under the constraints of resource
availability, it can be inferred from the above figures the
overall time saved by the user when performing searches
268 Int'l Conf. Grid Computing and Applications | GCA'08 |

using G-BLAST. We observed that with average resource
availability of 8 CPUs on the UABGrid, the maximum time
saved by a user was around 75%, when compared to
executing the same job on a scientist’s local, single processor
workstation.
Fig. 6. Individual fragments across resources using 16, 8, 4, and 2
CPUs.
4 Related Work
4.1 BLAST on Grid
Several Grid-based BLAST systems have been proposed
to provide flexible BLAST systems that could harness
distributed computational resources. GridBLAST [24] is a set
of Perl scripts that distribute work over computing nodes on
a grid using a simple client/server model. Grid-BLAST [32]
employs a Grid Portal User Interface to collect query
requests and dispatch those requests to a set of NCSA
clusters. Each cluster in the system is added and tuned to
accept jobs in an ad hoc way. The major disadvantage of a
non-service based system is that the computing resources
cannot be integrated into the system automatically and
human intervention is required to adapt a new version of
BLAST and new computational resources. GT3 based
BLAST [10] system, however, is based on web services
programming model. A meta-scheduler is also used to farm
out query requests onto remote clusters. Nevertheless, the job
submission is still through traditional batch submission tools
and does not exploit the benefits of SOA and Grid Services.
4.2 Scheduling
Due to the heterogeneity of resources as well as different
application choices in the Grid, resource selection is a hard
task to perform correctly. Unlike the local schedulers [29, 33]
which have much of the necessary information readily
available to them, grid meta-schedulers are dependent on the
underlying infrastructure. The general meta-schedulers such
as Nimrod-G [15], AppLeS [21], the Resource Broker from
CrossGrid [17], Condor [25], and MARS [14] are helping
the general user in alleviating some of the intricacies of
resource selection by automating resource selection across
the Grid through application and resource parameter pooling.
Due to the mentioned heterogeneity of applications and
resources, a general meta-scheduler simply does not have
enough information and support from the middleware to
perform the optimal resource selection. In order to
accommodate this need, application-specific meta-schedulers
based on application runtime characteristics are used in G-
BLAST framework to adaptively schedule applications on
the grid. Runtime information is also used by other software
packages (ATLAS [31]and STAPL [30]) to determine the
best application specific parameters on a given architecture.
5 Summary and Conclusions
The overall architecture for G-BLAST – a Grid Service for
the Basic Local Alignment Search Tool (BLAST) was
presented in this paper. G-BLAST not only enabled the
execution of BLAST application in a grid environment but
also abstracted the various details about selecting a specific
application and computational resource and provided simple
interfaces to the end-user to use the service. Using the factory
design pattern multiple implementations of BLAST were
incorporated into G-BLAST without requiring any change to
the Core Interface. The two-level adaptive scheduler and the
user interfaces used by G-BLAST enabled the process of
application selection, resource selection, scheduling, and
monitoring without requiring extensive user interventions. G-
BLAST was successfully deployed on UABGrid and
different BLAST applications were tested for various
combinations of input parameters and computational
resources. The performance results obtained by executing
various BLAST applications (multithreaded, query split,
database split) on different architectures with different
databases and query lengths illustrated the role of the
adaptive scheduler in improving the overall performance of
BLAST applications in a Grid environment. In this paper, we
have used BLAST as an example for performing local
alignment search. We also plan to extend this architecture to
other bioinformatics applications.
REFERENCES
[1] (2000, July 11). "Expressed Sequence Tags database,"
Retrieved June 6, 2005, from
http://www.ncbi.nlm.nih.gov/dbEST/
[2] (2004, December 22). "GenBank Overview," Retrieved
4/21, 2005, from http://www.ncbi.nlm.nih.gov/Genbank/
[3] Afgan, E. and P. Bangalore, "Application Specification
Language (ASL) – A Language for Describing
Applications in Grid Computing," In the Proceedings of
The 4th International Conference on Grid Services
Engineering and Management - GSEM 2007, Leipzig,
Germany, 2007, pp. 24-38.
[4] Afgan, E. and P. Bangalore, "Performance
Characterization of BLAST for the Grid," In the
Proceedings of IEEE 7th International Symposium on
Bioinformatics & Bioengineering (IEEE BIBE 2007),
Boston, MA, 2007, pp. 1394-1398.
Int'l Conf. Grid Computing and Applications | GCA'08 | 269
[5] Afgan, E., P. V. Bangalore, and S. V. Peechakara,
"Effective Utilization of the Grid with the Grid
Application Deployment Environment (GADE),"
Univeristy of Alabama at Birmingham, Birmingham, AL
UABCIS-TR-2005-0601-1, June 2005 2005.
[6] Afgan, E., V. Velusamy, and P. Bangalore, "Grid
Resource Broker with Application Profiling and
Benchmarking," In the Proceedings of European Grid
Conference 2005 (EGC '05), Amsterdam, The
Netherlands, 2005, pp. 691-701.
[7] Afgan, E., V. Velusamy, and P. V. Bangalore, "Grid
Resource Broker using Application Benchmarking," In
the Proceedings of European Grid Conference,
Amsterdam, Netherlands, 2005, pp. 10.
[8] Altschul, S. F., W. Gish, W. Miller, E. W. Myers, and D.
J. Lipman, "Basic local alignment search tool," J Mol
Biol, vol. 215, pp. 403-10, 1990.
[9] Altschul, S. F., T. L. Madden, A. A. Schaffer, J. Zhang,
Z. Zhang, W. Miller, and D. J. Lipman, "Gapped BLAST
and PSI-BLAST: a new generation of protein database
search programs," Nucleic Acids Res., vol. 25, pp. 3389-
3402, 1997.
[10] Bayer, M., A. Campbell, and D. Virdee, "A GT3 based
BLAST grid service for biomedical research," In the
Proceedings of UK e-Science All Hands Meeting,
Nottingham, UK, 2004
[11] Bergeron, B., "Bioinformatics Computing," 1st ed.
Upper Saddle River, New Jersey: Pearson Education,
2002.
[12] Berman, F., A. Hey, and G. Fox, "Grid Computing:
Making The Global Infrastructure a Reality." New York:
John Wiley & Sons, 2003, pp. 1080.
[13] Bjomson, R. D., A. H. Sherman, S. B. Weston, N.
Willard, and J. Wing, "TurboBLAST: A Parallel
Implementation of BLAST Built on the TurboHub," In the
Proceedings of Proceedings of International Parallel and
Distributed Processing Symposium: IPDPS 2002
Workshops, Ft. Lauderdale, FL, 2002
[14] Bose, A., B. Wickman, and C. Wood, "MARS: A
Metascheduler for Distributed Resources in Campus
Grids," In the Proceedings of Fifth IEEE/ACM
International Workshop on Grid Computing, Pittsburgh,
PA, 2004, pp. 10.
[15] Buyya, R., D. Abramson, and J. Giddy, "Nimrod-G: An
Architecture for a Resource Management and Scheduling
in a Global Computational Grid," In the Proceedings of
4th International Conference and Exhibition on High
Performance Computing in Asia-Pacific Region (HPC
ASIA 2000), Beijing, China, 2000
[16] Camp, N., H. Cofer, and R. Gomperts, "Hight-
Throughput BLAST," SGI September 1998.
[17] CrossGrid. (2004). "CrossGrid Production resource
broker," Retrieved 4/15, 2004, from
http://www.lip.pt/computing/projects/crossgrid/crossgrid-
services/resource-broker.htm
[18] Czajkowski, K., S. Fitzgerald, I. Foster, and C.
Kesselman, "Grid Information Services for Distributed
Resource Sharing," In the Proceedings of 10 th IEEE
Symp. On High Performance Distributed Computing,
2001
[19] Darling, A. E., L. Carey, and W.-c. Feng, "The Design,
Implementation, and Evaluation of mpiBLAST," In the
Proceedings of ClusterWorld Conference & Expo in
conjunction with the 4th International Conference on
Linux Clusters: The HPC Revolution 2003, San Jose, CA,
2003
[20] Foster, I., C. Kesselman, J. Nick, and S. Tuecke, "The
Physiology of the Grid: An Open Grid Services
Architecture for Distributed Systems Integration," Global
Grid Forum June 22 2002.
[21] Fran, B., W. Rich, F. Silvia, S. Jennifer, and S.Gary,
"Application-Level Scheduling on Distributed
Heterogeneous Networks," In the Proceedings of
Supercomputing '96, Pittsburgh, PA, 1996, pp. 28.
[22] Gamma, E., R. Helm, R. Johnson, and J. Vlissides,
"Design Patterns," 1st ed: Addison-Wesley Professional,
1995.
[23] Huedo, E., R. S. Montero, and I. M. Llorente, "A
Framework for Adaptive Execution on Grids," Journal of
Software - Practice and Experience, vol. 34, pp. 631-651,
2004.
[24] Krishnan, A., "GridBLAST: A High Throughput Task
Farming GRID Application for BLAST," In the
Proceedings of BII, Singapore, 2002
[25] Litzkow, M., M. Livny, and M. Mutka, "Condor - A
Hunter of Idle Workstations," In the Proceedings of 8th
International Conference of Distributed Computing
Systems, June 1988, pp. 104-111.
[26] NCBI. (2004, November 15). "NCBI BLAST,"
Retrieved 4/21, 2005, from
http://www.ncbi.nlm.nih.gov/BLAST/
[27] Puljala, R., R. Sadasivam, J.-P. Robinson, and J.
Gemmill, "Middleware: Single Sign On Authentication
and Authorization for Groups," In the Proceedings of the
ACM Southeastern Conference, Savannah, GA, 2003
[28] Robinson, J.-P., J. Gemmill, P. Joshi, P. Bangalore, Y.
Chen, S. Peechakara, S. Zhou, and P. Achutharao, "Web-
Enabled Grid Authentication in a Non-Kerberos
Environment," In the Proceedings of Grid 2005 - 6th
IEEE/ACM International Workshop on Grid Computing,
Seattle, WA, 2005
[29] Systems, V., "OpenPBS v2.3: The Portable Batch
System Software," 2004.
[30] Thomas, N., G. Tanase, O. Tkachyshyn, J. Perdue, N.
M. Amato, and L. Rauchwerger, "A Framework for
Adaptive Algorithm Selection in STAPL," In the
Proceedings of ACM SIGPLAN Symp. Prin. Prac. Par.
Prog. (PPOPP), Chicago, IL, 2005
[31] Whaley, R. C., A. Petitet, and J. Dongarra, "Automated
empirical optimizations of software and the ATLAS
project," Parallel Computing, vol. 27, pp. 3-35, 2001.
[32] Yong, L., "Grid-BLAST: Building A Cyberinfrastructure
for Large-scale Comparative Genomics Research," In the
Proceedings of 2003 Virtual Conference on Genomics
and Bioinformatics, 2003
[33] Zhou, S., "LSF: Load Sharing in Large-scale
Heterogeneous Distributed Systems," In the Proceedings
of Workshop on Cluster Computing, 1992
270 Int'l Conf. Grid Computing and Applications | GCA'08 |