Implementation Manual for the Universal Access Transceiver ...
236
International Civil Aviation Organization 999 University Street Montreal, Quebec, Canada H3C 5H7 Implementation Manual for the Universal Access Transceiver (UAT) Draft Revision 2.1 22 June 2005 Prepared by: ACP WG-C UAT Subgroup © 2005. ACP-WGW01/AI-1 Appendix D
-
Upload
khangminh22 -
Category
Documents
-
view
2 -
download
0
Transcript of Implementation Manual for the Universal Access Transceiver ...

International Civil Aviation Organization
999 University Street Montreal, Quebec, Canada H3C 5H7
Implementation Manual for the Universal Access Transceiver (UAT)
Draft Revision 2.1 22 June 2005
Prepared by: ACP WG-C UAT Subgroup © 2005.
ACP-WGW01/AI-1Appendix D

Change Record
Date/Version Change 21 July 2003/v0.1 Original Draft
20 February 2004/v0.2 In preparation for review for the UAT Subgroup at Meeting #5 in Montreal, 1-4 March 2004.
4 March 2004/v0.3 As modified during the UAT Subgroup at Meeting #5 in Montreal, 1-4 March 2004
12 August 2004/v0.4
a. Indicating suggestions made during ICAO ACP WG-C/7 meeting in Montreal, 19-21 April 2004, and entering those suggestions as actions, highlighted in yellow,
b. incorporating other material as completions of action items, highlighted in yellow, and
c. generally preparing the document for review for the UAT Subgroup meeting in Madrid, 15-17 September 2004.
17 September 2004/v0.5 Review of the status of action items and discussion during the UAT Subgroup Meeting #6 in Madrid, 15-17 September 2004.
16 November 2004/v1.0
As agreed to in the Minutes of ACP WG-C/8 Meeting in Munich, the revision level was set to v1.0 after no comments were received from WG-C members. Version 1.0 was the document going into the review during the UAT Subgroup meeting in Montreal, 16-18 November 2004.
18 November 2004/v1.1
Action Item completions were included and highlighted in yellow for the benefit of review by the UAT Subgroup during Meeting #7 in Montreal, 16-18 November. The UAT Subgroup performed detailed page-by-page reviews and made numerous editorial changes and modifications of Action Items as reflected in Version 1.1.
31 January 2005/v1.2 Add an Action Item in §7.2 for Larry Bachman to include a table that shows separation distance as a function of DME/TACAN power.
2 March 2005/v1.3 As modified during the UAT Subgroup Meeting #9 in Montreal, 28 February – 2 March.
17 March 2005/v1.4 As modified during the UAT Subgroup Meeting #10 in Montreal, 14 - 17 March 2005.
22 March 2005/v1.5
As updated in preparation for review by ACP WG-C at their Meeting #9, 4-8 April 2005. Updates included text in Section 8 related to Spurious Emissions and insertions of several updated figures in section 6 for examples of descriptions of UAT Ground Infrastructure.
5 April 2005/v1.6 As reviewed and modified during the ACP WG-C Meeting #9, 4 – 8 April 2005, including adding §5.6 to explain the setting of the value for the SIL parameter.
13 April 2005/v2.0 As modified during the editorial review of UAT Subgroup Meeting #11, 11-13 April 2005 in Montreal, and approved by WG-C.
22 June 2005/v2.1 As modified during ACP WGW01, 22 June 2005, to add reference to RTCA/DO-292 into Section 5.5 for GNSS L5/E5A.
ACP-WGW01/AI-1Appendix D

i
TABLE OF CONTENTS
1 INTRODUCTION ................................................................................................................................ 1
1.1 OUTLINE OF THE MANUAL ................................................................................................................ 1 1.2 OBJECTIVE AND SCOPE...................................................................................................................... 2 1.3 DEFINITIONS ....................................................................................................................................... 2
2 OPERATING CONCEPTS ................................................................................................................. 5
2.1 APPLICATIONS SUPPORTED............................................................................................................... 5 2.1.1 AUTOMATIC DEPENDENT SURVEILLANCE –BROADCAST (ADS-B) ................................................. 5 2.1.2 GROUND UPLINK SERVICES.............................................................................................................. 5 2.1.3 UAT BROADCAST CONNECTIVITY ................................................................................................... 6 2.2 FREQUENCY CHANNEL AND WAVEFORM DESCRIPTION................................................................. 8 2.3 TIMING STRUCTURE AND MEDIUM ACCESS..................................................................................... 9 2.3.1 UAT ADS-B MESSAGE TRANSMISSION BY AIRCRAFT .................................................................. 10 2.3.2 GROUND UPLINK SERVICES............................................................................................................ 11 2.4 BASIC AVIONICS OPERATION AND EQUIPAGE LEVELS ................................................................. 11 2.4.1 AVIONICS OPERATING CONCEPT .................................................................................................... 11 2.4.2 EXAMPLES OF UAT EQUIPAGE CLASSES........................................................................................ 13 2.4.2.1 UAT ADS-B Aircraft Transmitting Subsystem........................................................................... 17 2.4.2.2 UAT Aircraft Receiving Subsystem............................................................................................ 17 2.5 GROUND STATION OPERATION ....................................................................................................... 17
3 SCHEDULING OF UAT ADS-B MESSAGES................................................................................ 19
3.1 MESSAGE DATA BLOCK SELECTION CYCLE.................................................................................. 19 3.1.1 ADS-B MESSAGE DATA BLOCK TYPE TRANSMISSION SEQUENCE................................................ 19 3.1.2 MESSAGE TRANSMISSION CYCLE................................................................................................... 19
4 UAT A/V ADS-B TRANSMITTING SUBSYSTEM INPUT REQUIREMENTS ........................ 21
5 UAT AIRCRAFT INSTALLATION GUIDANCE.......................................................................... 23
5.1 AIRCRAFT MUTUAL SUPPRESSION BUS .......................................................................................... 23 5.2 UAT SUPPRESSION PULSE IMPACT ON AIRCRAFT COSITE SSR, ACAS AND DME PERFORMANCE .......................................................................................................................................... 23 5.2.1 ANALYSIS OF IMPACT ON DME...................................................................................................... 24 5.2.2 ANALYSIS OF THE IMPACT OF UAT SUPPRESSION BUS PULSES ON ACAS.................................... 24 5.2.3 ANALYSIS OF IMPACT OF UAT SUPPRESSION BUS PULSES ON SSR TRANSPONDERS.................... 25 5.3 SHARING ANTENNAS WITH SSR TRANSPONDER............................................................................ 26 5.3.1 OPTIONAL DIPLEXER REQUIREMENTS............................................................................................ 27 5.3.1.1 The UAT Diplexer Channel ........................................................................................................ 28 5.3.1.2 The Transponder Diplexer Channel............................................................................................. 28
ACP-WGW01/AI-1Appendix D

ii
5.3.1.3 UAT Diplexer Channel to Transponder Diplexer Channel Isolation .......................................... 29 5.4 COMPATIBILITY WITH SSR WHEN UAT AND SSR ARE USING SEPARATE ANTENNAS................ 29 5.5 COMPATIBILITY WITH FUTURE GNSS OPERATING IN THE BAND 1164 MHZ TO 1215 MHZ..... 29 5.6 UAT INTERFACE TO GPS/GNSS RECEIVER .................................................................................. 29 5.7 SURVEILLANCE INTEGRITY LEVEL (“SIL”) FIELD VALUE........................................................... 30
6 UAT GROUND INFRASTRUCTURE............................................................................................. 31
6.1 GENERAL DESCRIPTION .................................................................................................................. 31 6.1.1 GROUND BROADCAST..................................................................................................................... 31 6.1.1.1 Geometric Service Volumes ........................................................................................................ 31 6.1.1.1.1 FIS-B Product Coverage........................................................................................................... 32 6.1.1.1.2 TIS-B Product Coverage .......................................................................................................... 33 6.1.1.2 Data Source for Ground Broadcast.............................................................................................. 33 6.1.2 GROUND SURVEILLANCE OF UAT-EQUIPPED AIRCRAFT AND VEHICLES ...................................... 33 6.1.3 SUMMARY OF INFRASTRUCTURE AND IMPLICATIONS .................................................................... 34 6.2 GROUND STATION DEPLOYMENT ................................................................................................... 35 6.2.1 TIME SLOTS AND “DATA CHANNELS” ............................................................................................ 35 6.2.2 TIS-B SITE IDENTIFIER (ID) ........................................................................................................... 36 6.2.3 SECTORIZED CELLS AND CO-SITE TRANSMISSION ISOLATION ...................................................... 39 6.3 RF INTERFERENCE........................................................................................................................... 40 6.3.1 DME/TACAN INTERFERENCE ....................................................................................................... 40 6.3.2 JTIDS/MIDS INTERFERENCE ......................................................................................................... 41 6.4 MULTIPLE ADS-B LINKS................................................................................................................. 41
7 UAT FREQUENCY PLANNING CRITERIA ................................................................................ 42
7.1 USE OF 978 MHZ FOR DME/TACAN ............................................................................................. 42 7.2 DME/TACAN TO UAT GROUND STATION SITING CRITERIA...................................................... 42
8 GUIDANCE ON UAT SPURIOUS EMISSIONS............................................................................ 44
8.1 ITU REGULATIONS........................................................................................................................... 44 8.2 EXAMPLE APPLICATION OF THE ITU REGULATION TO THE UAT CASE ..................................... 45 8.3 CONCLUSION .................................................................................................................................... 46
9 POTENTIAL FUTURE SERVICES OF UAT................................................................................. 47
A. ACRONYMS & DEFINITION OF TERMS................................................................................... 3
A.1 ACRONYMS......................................................................................................................................... 3 A.2 DEFINITION OF TERMS...................................................................................................................... 7
B UAT SYSTEM PERFORMANCE SIMULATION RESULTS ....................................................... 3
B.1 INTRODUCTION .................................................................................................................................. 3 B.1.1 ORGANIZATION ................................................................................................................................ 3
ACP-WGW01/AI-1Appendix D

iii
B.1.2 BACKGROUND .................................................................................................................................. 3 B.1.3 GENERAL ASSUMPTIONS.................................................................................................................. 4 B.1.4 UAT DETAILED SIMULATION DESCRIPTION AND LIMITATIONS...................................................... 4 B.2 ANTENNA MODEL .............................................................................................................................. 6 B.3 RECEIVER PERFORMANCE MODEL.................................................................................................. 8 B.3.1 MEASURED DATA ............................................................................................................................ 8 B.3.2 RECEIVER MODEL.......................................................................................................................... 12 B.3.2.1 Receiver Model Accuracy........................................................................................................... 12 B.4 MULTI-AIRCRAFT SIMULATION (MAUS) RESULTS...................................................................... 16 B.4.1 LOS ANGELES BASIN 2020 (LA2020) ............................................................................................ 16 B.4.2 CORE EUROPE 2015 ....................................................................................................................... 24 B.4.3 LOW DENSITY SCENARIO............................................................................................................... 32 B.4.4 ACQUISITION PERFORMANCE......................................................................................................... 34 B.4.5 SURFACE PERFORMANCE ............................................................................................................... 35 B.4.6 A CLASS A0 AIRCRAFT ON THE SURFACE RECEIVING AN AIRCRAFT THAT IS ON APPROACH ...... 36 B.4.7 TIS-B PERFORMANCE OF UAT IN THE LA2020 ENVIRONMENT ................................................... 38 B.4.7.1 Additional TIS-B Assumptions................................................................................................... 38 B.4.7.2 TIS-B Results.............................................................................................................................. 39 B.4.7.2.1 TIS-B Hotspot Analysis........................................................................................................... 41 B.5 MODEL VALIDATION....................................................................................................................... 44
C STANDARD INTERFERENCE ENVIRONMENT......................................................................... 3
C.1 BACKGROUND.................................................................................................................................... 3 C.2 OPERATIONAL ENVIRONMENTS ....................................................................................................... 3 C.3 CO-SITE ENVIRONMENT ................................................................................................................... 6 C.4 SCENARIO ASSESSMENTS.................................................................................................................. 7
D. UAT RECEIVER PERFORMANCE IN THE PRESENCE OF DME/TACAN, JTIDS/MIDS AND SELF-INTERFERENCE.................................................................................................................. 3
D.1 INTRODUCTION.................................................................................................................................. 3 D.2 PRE-PRODUCTION TESTING ............................................................................................................. 3 D.2.1 DME/TACAN TESTING................................................................................................................... 3 D.2.2 JTIDS/MIDS TESTING................................................................................................................... 11 D.2.3 UAT SELF-INTERFERENCE TESTING.............................................................................................. 12 D.2.4 COMBINED INTERFERENCE TESTING ............................................................................................. 13 D.3 PRODUCTION TESTING.................................................................................................................... 13 D.3.1 DME/TACAN TESTING................................................................................................................. 13 D.3.2 UAT SELF-INTERFERENCE TESTING.............................................................................................. 13 D.4 SUMMARY ........................................................................................................................................ 15
E UAT ERROR DETECTION AND CORRECTION PERFORMANCE ........................................ 3
F. DME OPERATION IN THE PRESENCE OF UAT SIGNALS..................................................... 3
G. EXAMPLE UAT ADS-B MESSAGE ENCODING ........................................................................ 3
ACP-WGW01/AI-1Appendix D

iv
G.1 REED SOLOMON ENCODING OF MESSAGE DATA BLOCK .............................................................. 3 G.2 REED SOLOMON ENCODING OF BASIC TYPE 0 UAT ADS-B MESSAGE DATA BLOCK ................ 3 G.3 REED SOLOMON ENCODING OF LONG TYPE 1 UAT ADS-B MESSAGE DATA BLOCK................. 5
H. AIRCRAFT ANTENNA CHARACTERISTICS............................................................................. 3
H.1 ANTENNA CHARACTERISTICS .......................................................................................................... 3 H.1.1 GENERAL CHARACTERISTICS .......................................................................................................... 3 H.1.2 RADIATION PATTERNS..................................................................................................................... 3 H.1.3 DIRECTIONAL GAIN RADIATION PATTERNS .................................................................................... 3 H.2 TYPICAL VSWR MEASUREMENTS OF EXISTING TRANSPONDER / DME ANTENNAS................... 5 H.2.1 SENSOR SYSTEMS L BAND BLADE ANTENNA P/N S65-5366-7L .................................................... 7 H.2.2 AEROANTENNA P/N AT-130-1........................................................................................................ 7 H.2.3 ¼ WAVE WHIP ANTENNA ................................................................................................................ 7 H.3 PASSIVE ANTENNA DIPLEXER CHARACTERISTICS ......................................................................... 8 H.3.1 ANTENNA DIPLEXER TESTING ......................................................................................................... 9 H.3.1.1 SSR Transponder Testing ............................................................................................................. 9 H.3.1.2 UAT Diplexer Testing ................................................................................................................ 12 H.3.1.3 Prototype Diplexer Performance ................................................................................................ 13 H.3.2 TYPICAL INSTALLATION DIAGRAM ............................................................................................... 16
I. SIMULATED RESULTS FOR DELIVERY OF FOUR TRAJECTORY CHANGE REPORTS OVER UAT IN CORE EUROPE 2015 ..................................................................................................... 3
I.1 INTRODUCTION ................................................................................................................................... 3 I.2 INTENT RESULTS USING FOUR-SECOND EPOCH .............................................................................. 3 I.3 INTENT RESULTS USING FIVE SECOND EPOCH ................................................................................ 5
J. UAT GROUND STATION DATA CHANNEL ASSIGNMENT GUIDANCE.............................. 3
J.1 INTRODUCTION................................................................................................................................... 3 J.2 IDEAL CASE ........................................................................................................................................ 3 J.2.1 ALTERNATIVE VIEW OF IDEAL CASE ................................................................................................ 6 J.2.2 ALTERNATIVE DCB ASSIGNMENTS .................................................................................................. 9 J.3 DEPLOYMENT EXAMPLE.................................................................................................................... 9 J.3.1 AN IMPLEMENTATION EXAMPLE .................................................................................................... 10
K. FUTURE RANGE VALIDATION OF UAT MESSAGES............................................................. 3
K.1 BACKGROUND.................................................................................................................................... 3 K.2 INSTALLED END-END TIMING PERFORMANCE ............................................................................... 3 K.3 UAT TIMING REQUIREMENTS ......................................................................................................... 5 K.4 CONSIDERATIONS FOR ADS-B VALIDATION TECHNIQUES............................................................ 6
L. REQUIREMENTS AND DESIRABLE FEATURES FOR THE UNIVERSAL ACCESS TRANSCEIVER (UAT) SYSTEM ............................................................................................................ 1
ACP-WGW01/AI-1Appendix D

v
LIST OF FIGURES Figure 2-1: UAT Connectivity...................................................................................................................... 6 Figure 2-2: UAT Frame .............................................................................................................................. 10 Figure 2-3: High Level Function of UAT Avionics ................................................................................... 12 Figure 2-4: UAT Ground Station Simplified Block Diagram..................................................................... 18 Figure 3-2: Transmitter Antenna Use for Diversity Installations ............................................................... 20 Figure 5-1: Optional Passive Diplexer Block Diagram .............................................................................. 27 Figure 5-2: UAT Interface to GPS/GNSS Receiver ................................................................................... 30 Figure 6-1: Example Coverage Cell Layout ............................................................................................... 32 Figure 6-2: General Form of Ground Infrastructure ................................................................................... 35 Figure 6-3: 7-Data Channel Block Re-Use Pattern..................................................................................... 36 Figure 6-4: Example of TIS-B Site ID and Data Channel Block................................................................ 38 Figure 6-5: Sectorized Antenna Pattern (3 sectors) .................................................................................... 39 Figure 6-6: Possible UAT Ground Station Antenna Geometries................................................................ 40 Figure 8-1: Unwanted Emissions and Necessary Bandwidth ..................................................................... 45 Figure A-1: Ideal eye diagram ..................................................................................................................A-9 Figure A-2: Distorted eye diagram ...........................................................................................................A-9 Figure B-1: TLAT Antenna Model Elevation Gain.................................................................................. B-7 Figure B-2: TLAT Random Azimuth Gain............................................................................................... B-8 Figure B-3: Test Setup for measuring BER .............................................................................................. B-9 Figure B-4: BER Due to DME interference............................................................................................ B-11 Figure B-5: BER Due to DME Interference ........................................................................................... B-11 Figure B-6: Link 16 Interference ............................................................................................................ B-12 Figure B-7: Gaussian Noise + Single UAT, 1.2 MHz Receiver ............................................................. B-13 Figure B-8: Gaussian Noise + Two Equal UATs, 1.2 MHz Receiver .................................................... B-13 Figure B-9: Two Unequal UATs, INR >> 0 dB, 0.8 MHz Receiver ...................................................... B-14 Figure B-10: N Equal UATs, INR >> 0, 0.8 MHz Receiver .................................................................. B-14 Figure B-11: Model Errors for All Data, 1.2 MHz Receiver .................................................................. B-15 Figure B-12: Model Errors for All Data, 0.8 MHz Receiver .................................................................. B-15 Figure B-13: Air-to-Air Reception by A3 Receiver at High Altitude over LA2020 .............................. B-18 Figure B-14: Air-to-Air Reception by A3 Receiver at FL 150 over LA2020 ........................................ B-18 Figure B-15: Air-to-Air Reception by A2 Receiver at High Altitude over LA2020 .............................. B-19 Figure B-16: Air-to-Air Reception by A2 Receiver at FL 150 over LA2020 ........................................ B-19 Figure B-17: Air-to-Air Reception by A1 Receiver at High Altitude over LA2020 .............................. B-20 Figure B-18: Air-to-Air Reception by A1 Receiver at FL 150 over LA2020 ........................................ B-20 Figure B-19: Air-to-Air Reception by A0 Receiver at FL 150 over LA2020 ........................................ B-21 Figure B-20: Air-to-Ground Reception by a Receiver at LAX in LA2020 ............................................ B-21 Figure B-21: Reception of Ground Vehicle Transmissions by Aircraft on Approach at 2000 feet
into LAX in 2020.......................................................................................................... B-22 Figure B-22: 95th Percentile Update Interval for Target State Reports as a Function of Range for
A3 and A2/A1H Transmitters ....................................................................................... B-24 Figure B-23: Air-to-Air Reception by A3 Receiver at High Altitude over BRU in CE 2015 ................ B-26 Figure B-24: Air-to-Air Reception by A3 Receiver at FL 150 over BRU in CE 2015 .......................... B-27 Figure B-25: Air-to-Air Reception by A2 Receiver at High Altitude over BRU in CE 2015 ................ B-27 Figure B-26: Air-to-Air Reception by A2 Receiver at FL 150 over BRU in CE 2015 .......................... B-28 Figure B-27: Air-to-Air Reception by A1 Receiver at High Altitude over BRU in CE 2015 ................ B-28 Figure B-28: Air-to-Air Reception by A1 Receiver at FL 150 over BRU in CE 2015 .......................... B-29 Figure B-29: Air-to-Air Reception by A0 Receiver at FL 150 over BRU in CE 2015 .......................... B-29 Figure B-30: Air-to-Ground Reception at BRU in CE 2015 .................................................................. B-30 Figure B-31: Air-to-Ground Reception Using a 3-Sector Antenna at BRU in CE 2015 ........................ B-30
ACP-WGW01/AI-1Appendix D

vi
Figure B-32: Air-to-Ground Reception 2 NM from a 10 kW TACAN Using a 3-Sector Antenna at BRU in CE 2015 ........................................................................................................... B-31
Figure B-33: Reception of Ground Vehicle Transmissions by Aircraft on Approach at 2000 feet into BRU in 2015 with 10 kW 979 MHz TACAN at Airport....................................... B-31
Figure B-34: A3 Receiver in Low Density Scenario Receiving A3 Transmissions ............................... B-33 Figure B-35: Receptions of A3 Transmissions by a UAT Ground Receiver in a Low Density
Scenario co-located with a TACAN at 979 MHz with –30 dBm Power at the UAT Antenna................................................................................................................ B-34
Figure B-36: A0 Receivers on the Ground in LA2020 Receiving All Aircraft on Approach at an Altitude of 2000 feet ..................................................................................................... B-37
Figure B-37: A0 Receivers on the Ground in CE2015 Receiving All Aircraft on Approach at an Altitude of 2000 feet to Brussels co-located with a 10 kW 979 MHz TACAN ........... B-37
Figure B-38: Locations of UAT Ground Stations, Including Service Volumes and Number of Uplinks per Second (2008) in Each Service Volume for LA2020 Scenario................. B-38
Figure B-39: TIS-B 95% Update Intervals in LA 2008 (No ADS-B Equipage) .................................... B-39 Figure B-40: ADS-B 95% Update Interval in Near-Term Scenario ....................................................... B-40 Figure B-41: ADS-B Air-to-Air Performance in the Presence of ADS-R Ground Transmissions in
LA2020 ......................................................................................................................... B-41 Figure B-42: 95% State Vector Update Times for an A3 Receiver at 40,000 feet Receiving A3
Transmissions in the Presence of a Ground Station at Various Ranges Broadcasting 1000 TIS-B Messages Per Second.......................................................... B-42
Figure B-43: 95& State Vector Update Times for an A3 Receiver at 40,000 feet Receiving A3 Transmissions in the Presence of a Ground Station at Various Ranges Broadcasting 500 RIS-B Messages Per Second............................................................ B-43
Figure B-44: 95th Percentile State Vector Updates Times for an A3 Receiver at 40,000 feet Receiving A3 Transmissions in the Presence of a Ground Station 40 NM Away at Various Uplink Rates ................................................................................................ B-43
Figure B-45: Comparison of Bench Test Measurements of MOPS-Compliant UAT Reception in LA2020 Self-Interference with Predictions by MAUS................................................. B-44
Figure B-46: Bench Test Measurements of UAT Performance in Core Europe UAT Self-Interference, Combined with DME/TACAN and Link 16 Interference ....................... B-45
Figure B-47: Bench Test Measurements of UAT Performance in the LA2020 UAT Self-Interference, Combined with DME/TACAN and Link 16 Interference ....................... B-46
Figure C-1: Sample Scenario ................................................................................................................... C-5 Figure C-2: Normalized DME Pattern ...................................................................................................... C-5 Figure C-3: Normalized TACAN Pattern ................................................................................................. C-6 Figure C-4: Targets of Interest for Computing Update Interval ............................................................. C-10 Figure D-3: UAT Receiver Performance DME 2700 Pulse Pairs at +2 MHz ..........................................D-4 Figure D-4: UAT Standard Receiver Performance DME 2700 Pulse Pairs at +1 MHz ...........................D-5 Figure D-5: UAT High Performance Receiver with DME 2700 Pulse Pairs at +1 MHz .........................D-6 Figure D-6: UAT Standard Receiver Performance DME 2700 Pulse Pairs On Frequency......................D-7 Figure D-7: UAT High Performance Receiver DME 2700 Pulse Pairs on Frequency.............................D-7 Figure D-8: UAT Standard Receiver Performance DME 3600 Pulse Pairs at +2 MHz ...........................D-8 Figure D-9: UAT High Performance Receiver DME 3600 Pulse Pairs at +2 MHz .................................D-8 Figure D-10: UAT Standard Receiver Performance DME 3600 Pulse Pairs at +1 MHz .........................D-9 Figure D-11: UAT High Performance Receiver DME 3600 Pulse Pairs at +1 MHz ...............................D-9 Figure D-12: UAT Standard Receiver Performance DME 3600 Pulse Pairs On Frequency..................D-10 Figure D-13: UAT High Performance Receiver DME 3600 Pulse Pairs on Frequency.........................D-10 Figure D-14: UAT Receiver Performance DME 2700 Pulse Pairs Offset in Frequency........................D-11 Figure D-15: UAT Receiver Performance TACAN 2700 and DME 3600 Pulse Pairs at +1 MHz........D-11 Figure D-16: UAT Receiver Performance with the first JTIDS/MIDS Scenario ...................................D-12 Figure D-17: UAT Production Standard Receiver Performance Comparison with the Core Europe
2015 Self-Interference Scenario ...................................................................................D-14
ACP-WGW01/AI-1Appendix D

vii
Figure D-18: UAT A3 Receiver Performance Comparison with the Core Europe 2015 Self-Interference Scenario ....................................................................................................D-15
Figure E-1: Basic UAT ADS-B Message Performance ............................................................................ E-4 Figure E-2: Long UAT ADS-B Message Performance ............................................................................ E-4 Figure E-3: UAT Ground Uplink Message Performance ......................................................................... E-5 Figure E-4: UAT Ground Uplink Message Undetected Message Error Rate ........................................... E-6 Figure E-5: UAT Ground Uplink Message Total Message Error Rate..................................................... E-6 Figure E-6: Logical Flow of ADS-B Reception ....................................................................................... E-7 Figure F-1: Bendix King KD-7000 Frequency Offset Test .......................................................................F-4 Figure F-2: Bendix King KD-7000 Reply Efficiency Test........................................................................F-5 Figure F-3: Bendix King KD-7000 CW testing: DME level –83 dBm .....................................................F-6 Figure F-4: Narco DME-890 Frequency Offset Test.................................................................................F-7 Figure F-5: Narco DME-890 Reply Efficiency Test .................................................................................F-8 Figure F-6: Narco DME-890 CW testing: DME level -75 dBm................................................................F-8 Figure F-7: Honeywell KDM-706A Frequency Offset Test......................................................................F-9 Figure F-8: Honeywell KDM-706A Reply Efficiency Test ....................................................................F-10 Figure F-9: Honeywell KDM-706A CW testing: DME level –83 dBm..................................................F-11 Figure F-10: Rockwell-Collins DME-900 Frequency Offset Test ..........................................................F-11 Figure F-11: Rockwell-Collins DME-900 Reply Efficiency Test ...........................................................F-12 Figure F-12: Rockwell-Collins DME-900 CW testing: DME level –83 dBm.........................................F-12 Figure F-13: Comparison of all DME Frequency Offset Tests................................................................F-13 Figure F-14: Comparison of all DME Reply Efficiency Tests ................................................................F-14 Figure F-15: Comparison of all DME CW Interference Tests.................................................................F-14 Figure F-16: JTIDS/MIDS and UAT Combined Interference Analysis ..................................................F-16 Figure H-1: Passive Gain Antenna for 960 MHz to 1215 MHz Frequency Band ....................................H-4 Figure H-2: Gain Array Antenna Azimuth Pattern ..................................................................................H-5 Figure H-3: Jet Transport Antenna ...........................................................................................................H-7 Figure H-4: Capstone Antenna .................................................................................................................H-7 Figure H-5: ¼ Wave Whip Antenna .........................................................................................................H-8 Figure H-6: Sensitivity Variation with Frequency, All 1’s Interrogation, Transponder MS-1...............H-12 Figure H-7: Diplexer UAT Port ..............................................................................................................H-13 Figure H-8: Diplexer Transponder Port ..................................................................................................H-14 Figure H-9: Diplexer UAT-to-Transponder Port Isolation .....................................................................H-15 Figure H-10: Diplexer Installation..........................................................................................................H-16 Figure I-1: 95th Percentile Trajectory Change Report Update Times for an A3 Receiver at High
Altitude in CE 2015 over Brussels Using TC Rotation to Deliver Messages Containing Information for 3 or 4 TCRs ..........................................................................I-4
Figure I-2: 95th Percentile Trajectory Change Report Update Times for an A3 Receiver at High Altitude in CE 2015 over Brussels Using a 5 Second Epoch to Deliver 4 TC Messages...........................................................................................................................I-5
Figure I-3: 95th Percentile Target Change Report Update Times for an A3 Receiver at High Altitude in CE 2015 over Brussels Comparing Both Methods for Delivering 4 TC Messages...........................................................................................................................I-6
Figure J-1: Basic Pattern (4) ..................................................................................................................... J-5 Figure J-2: The (4, 4) Pattern for Tiers 1 & 2 ............................................................................................ J-6 Figure J-3: Tier 3 of Pattern (4, 3, 3) ......................................................................................................... J-7 Figure J-4: Tiers 2 and 3 of Pattern (4, 3, 3).............................................................................................. J-8 Figure J-5: Complete Pattern (4, 3, 3)........................................................................................................ J-8 Figure J-6: Conceptual View of Uplink Service Volume in Cross Section ............................................... J-9 Figure J-7: USA East Coast Coverage at 40000 feet AMSL ................................................................... J-11 Figure J-8: USA East Coast Coverage at 10000 feet AGL...................................................................... J-11 Figure J-9: USA East Coast Coverage at 3000 feet AGL........................................................................ J-12
ACP-WGW01/AI-1Appendix D

viii
LIST OF TABLES
Table 2-1: Examples of UAT Installed Equipment Classes........................................................................ 16 Table 2-2: Transmitter Power Levels.......................................................................................................... 17 Table 3-1: Message Data Block Type Code Transmission Sequence......................................................... 19 Table 4-1: UAT ADS-B Transmitting Subsystem Input Requirements ..................................................... 22 Table 6-1: Example of TIS-B Site ID Table ............................................................................................... 38 Table 7-1: Maximum Power of a 979 MHz DME/TACAN for a given Separation Distance to a
UAT Ground Station Receiver.......................................................................................... 43 Table 7-2: Minimum Distance of a UAT Ground Station Receiver to a 979 MHz DME/TACAN............ 43 Table 9-1: Summary of Potential Future Applications of UAT.................................................................. 48 Table B-1: Ranges of Compliance for UAT Transmit-Receive Combinations in the LA2020
Scenario ........................................................................................................................ B-22 Table B-2: Ranges of ADS-B Compliance for UAT Transmit-Receive Combinations in CE 2015
Scenario ........................................................................................................................ B-32 Table B-3: Acquisition Requirements..................................................................................................... B-35 Table B-4: 99th Percentile Range for Information Acquisition for Various Combinations of
Transmit-Receive Pairs (NM)....................................................................................... B-35 Table B-5: 95% Update Times for ADS-R Transmissions from UAT Ground Stations in LA2020...... B-40 Table C-1: Signal Level Analysis of the Sample Scenario ....................................................................... C-6 Table C-2: Interference Scenarios and Implementation Assumptions...................................................... C-8 Table C-3: Received Power Levels (dBm) for Current European DME/TACAN Environment.............. C-9 Table C-4: Received Power Levels (dBm) for 2015 European DME/TACAN Environment .................. C-9 Table C-5: Co-site Environment ............................................................................................................... C-9 Table C-6: Overview of Scenario Assessments ...................................................................................... C-11 Table E-1: Maximum Undetected RS Word Error Rates.......................................................................... E-3 Table E-2: Upper Bounds on Undetected Message Error Probabilities.................................................... E-9 Table G-1: Example of Basic UAT ADS-B Message Data Blocks ..........................................................G-4 Table G-2: Example of Long Type 1 UAT ADS-B Message Data Blocks ..............................................G-6 Table H-1: Typical Antennas....................................................................................................................H-6 Table H-2: Diplexer Testing with ATC Transponders ...........................................................................H-10 Table J-1: Data Channel Mapping to DCB for the 5-4-2 Plan................................................................... J-9 Table K-1: Worst Case Timing Offset ......................................................................................................K-5 Table L-3.1.3: State Vector Accuracy, Update Interval, and Acquisition Range Requirements ............. L-4 Table L-3.1.5: Mode Status Accuracy and Acquisition Range Requirements......................................... L-7 Table L-3.1.7: Summary of Target State Report Acquisition Range and Update Interval
Requirements .................................................................................................................. L-8
ACP-WGW01/AI-1Appendix D

1
© 2005
1 Introduction
1.1 Outline of the Manual
This Manual contains guidance material relevant for the implementation of the Universal Access Transceiver (UAT).
Section 1 of this document presents the objectives and scope of the manual and provides definition of key terms used in this Manual.
Section 2 describes the applications supported by UAT and the fundamentals of system operation and introduces an example set of aircraft equipage classes.
Section 3 provides guidance for scheduling of UAT ADS-B Message transmissions by each of the example aircraft equipage classes described in Section 2.
Section 4 provides guidance on UAT ADS-B transmitter inputs by each of the example aircraft equipage classes described in Section 2.
Section 5 provides guidance on UAT aircraft installation aspects.
Section 6 provides guidance on the implementation of UAT Ground Infrastructure. Assumptions consistent with this guidance have been used to estimate UAT performance when supporting air-to-ground applications of ADS-B.
Section 7 describes UAT frequency planning criteria.
Section 8 describes guidance on UAT spurious emissions.
Section 9 describes potential future services that could be supported by UAT.
Appendix A provides the acronyms and definition of terms used in this manual.
Appendix B summarizes results of detailed UAT System performance simulations in the Standard Interference Environments contained in Appendix C. It also includes an estimation of the air-air, air-to-ground and ground-to-air system performances of UAT. All performance estimations reflect the broadcast of State Vector (SV), Mode Status (MS), and intent information (which includes information for both Target State (TS) and Trajectory Change (TC) Reports), as appropriate to the UAT equipage class.
Appendix C describes the interference environments when operating UAT in the presence of Distance Measuring Equipment (DME), Tactical Air Navigation (TACAN), Joint Tactical Information Distribution System (JTIDS) and Multifunctional Information Distribution System (MIDS) signals as well as the effects of UAT self-interference which were assumed for the performance simulations documented in Appendix B. These environments are based upon traffic scenarios for current and future high as well as low density airspace and in particular contain near-worst-case estimates of interference caused by other systems transmitting on or near the UAT operational frequency of 978 MHz.
ACP-WGW01/AI-1Appendix D

2
© 2005
Appendix D describes measurement data that were collected on UAT equipment to characterize UAT receiver performance in various interference scenarios including nearby emissions from DME/TACAN, JTIDS/MIDS and the effect of self-interference from other UAT transmissions.
Appendix E describes the UAT Error Detection and Correction Performance.
Appendix F describes test results that substantiate compatibility of the operation of DME in the presence of RF UAT signals.
Appendix G contains a specific example of a UAT ADS-B Message, formatted in a manner consistent with Section 12.4.4 of the UAT SARPs and Section 2.1 of the Manual on the UAT Detailed Technical Specifications.
Appendix H contains information and guidance regarding UAT Aircraft Antenna Characteristics. A technique for sharing existing SSR transponder antennas with UAT equipment is described.
Appendix I contains an approach for UAT to convey Trajectory Change (TC) Reports, a type of intent information. The Appendix contains a description of how up to four (4) different TC Reports from each appropriately equipped aircraft may be supported by UAT.
Appendix J contains guidance on UAT Ground Station Data Channel Assignment.
Appendix K contains information on a future range validation capability for UAT ADS-B Messages.
Appendix L contains UAT Requirements and Desirable Features which served as the basis for the design of the UAT system.
1.2 Objective and Scope
The objective of this Manual is to provide information and guidance related to the implementation of the UAT system.
1.3 Definitions
This section highlights the definitions of several key terms.
UAT: Universal Access Transceiver (UAT) is a broadcast data link operating on 978 MHz, with a modulation rate of 1.041667 Mbps.
UAT ADS-B Message: UAT ADS-B Messages are broadcast once per second by each aircraft to convey State Vector and other information. UAT ADS-B Messages can be in one of two forms depending on the amount of information to be transmitted in a given second: the Basic UAT ADS-B Message or the Long UAT ADS-B Message (see §12.4.4.1 of the UAT SARPs for definition of each).
ACP-WGW01/AI-1Appendix D

3
© 2005
UAT Ground Uplink Message: The UAT Ground Uplink Message is used by Ground Stations to broadcast, within the Ground Segment of the UAT Frame, flight information such as text and graphical weather data, advisories, and other aeronautical information, to aircraft that are in the service volume of the Ground Station (see Section §12.4.4.2 of the UAT SARPs for further details).
Standard Receiver: A general purpose UAT receiver satisfying the minimum rejection requirements of interference from adjacent frequency Distance Measuring Equipment (DME) (see Section §12.3.2.2of the UAT SARPs for further details).
High Performance Receiver: A UAT receiver with enhanced selectivity to further improve the rejection of adjacent frequency DME interference (see Section §12.3.2.2 of the UAT SARPs for further details).
Optimum Sampling Point: The optimum sampling point of a received UAT bit stream is at the nominal center of each bit period, when the frequency offset is either plus or minus 312.5 kHz.
Power Measurement Point (PMP): A cable connects the antenna to the UAT equipment. The PMP is the end of that cable that attaches to the antenna. All power measurements are considered as being made at the PMP unless otherwise specified. The cable connecting the UAT equipment to the antenna is assumed to have 3 dB of loss.
Successful Message Reception (SMR): The function within the UAT receiver for declaring a received message as valid for passing to an application that uses received UAT messages. See Section 4.0 of the Manual on the UAT Detailed Technical Specifications for a detailed description of the procedure to be used by the UAT receiver for declaring successful message reception.
Pseudorandom Message Data Block: Several UAT requirements state that performance will be tested using pseudorandom message data blocks. Pseudorandom message data blocks should have statistical properties that are nearly indistinguishable from those of a true random selection of bits. For instance, each bit should have (nearly) equal probability of being a ONE or a ZERO, independent of its neighboring bits. There should be a large number of such pseudorandom message data blocks for each message type (Basic ADS-B, Long ADS-B or Ground Uplink) to provide sufficient independent data for statistical performance measurements. See Section 2.3 of the Manual on the UAT Detailed Technical Specifications for an example of how to provide suitable pseudorandom message data blocks.
Service Volume: A part of the facility coverage where the facility provides a particular service in accordance with relevant SARPs and within which the facility is afforded frequency protection.
Appendix A provides definitions of other terms and acronyms used in this manual.
ACP-WGW01/AI-1Appendix D

4
© 2005
This Page Intentionally Left Blank
ACP-WGW01/AI-1Appendix D

5
© 2005
2 Operating Concepts
2.1 Applications Supported
2.1.1 Automatic Dependent Surveillance –Broadcast (ADS-B)
Automatic Dependent Surveillance – Broadcast (ADS-B) is a means by which aircraft, vehicles and other objects can automatically transmit and/or receive data such as identification, position (latitude, longitude and altitude), velocity, and additional data as appropriate, in a broadcast mode via a data link.
When such information is made available through ADS-B transmissions from other nearby aircraft, the relative position and movement of those aircraft with reference to one's own aircraft can be established. Further, ground-based facilities can monitor ADS-B broadcasts to provide surveillance capabilities, or to supplement existing surveillance systems. Other data that can be included in an ADS-B Message is intent information related to the aircraft's intended flight path, aircraft type, and other information.
ADS-B is automatic in the sense that no pilot or controller action is required for the information to be transmitted (broadcast). The surveillance provided by ABS-D is dependent in the sense that the aircraft surveillance-type information is derived (dependent) from data provided by on-board navigation equipment.
ADS-B is considered to be a key enabling technology to enhance safety and efficiency in airspace operations. These include basic applications, such as the use of ADS-B to enhance the pilot's visual acquisition of other nearby aircraft1, as well as more advanced applications, such as enabling enhanced closely spaced parallel approach operations. Other applications involving airport surface operations, improved surveillance in non-radar airspace, and advanced conflict management are also described. Fleet management and search and rescue are also applications that can be supported by ADS-B.
Initial PANS-ATM procedures for the use of ADS-B, including ADS-B provided over the UAT data link, will likely use ADS-B in a traditional “radar-like” manner in order to provide separation in airspaces that do not have radar coverage. The standardization of air-air use of ADS-B for applications other than those of a purely advisory nature will have a further consequential effect on PANS-ATM and other ICAO documents. Such standardization is likely to build upon efforts currently in progress in several Regions to harmonize such applications.
2.1.2 Ground Uplink Services
Traffic Information Service - Broadcast (TIS-B) is a ground-based service intended to provide aircraft with a more-complete traffic picture in situations where not all aircraft are equipped with the same ADS-B system, or none at all.
1 Ground vehicles on the airport movement area, obstacles, etc., may also transmit UAT ADS-B Messages where appropriate. The term “aircraft” may include such other transmitters.
ACP-WGW01/AI-1Appendix D

6
© 2005
When providing surveillance data for non-ADS-B equipped aircraft, TIS-B involves three major steps. First, another source of surveillance information on non-ADS-B aircraft (such as Secondary Surveillance Radar (SSR)) must be available. Second, this surveillance information must be converted and processed so as to be usable by ADS-B-equipped aircraft. And third, TIS-B conveys this information to aircraft with UAT or other data link systems capable of receiving and processing such information.
When providing surveillance data for ADS-B equipped aircraft that are equipped with a data link other than UAT, the TIS-B service takes as input ADS-B reports from such aircraft and converts those reports to a format appropriate to UAT, for uplink broadcast to UAT equipped aircraft.
UAT preferably supports TIS-B by having UAT ground uplink stations transmit TIS-B information for each aircraft in the format of UAT ADS-B Messages in the ADS-B segment of the UAT frame. The discussion of TIS-B in this manual is based upon supporting TIS-B through uplink ADS-B Messages. Alternatively, if necessary, TIS-B information could be broadcast in the ground segment of the UAT frame, but not in the format of a UAT ADS-B Message.
FIS-B is the ground-to-air broadcast of advisory information needed by pilots to operate more safely and efficiently. For example, FIS-B may provide weather graphics and text (e.g., METAR and TAF), Special Use Airspace information, Notices to Airmen (NOTAMs) and other information. UAT has been designed to support the broadcast of FIS-B information in the ground segment of the UAT frame using the ground uplink message.
2.1.3 UAT Broadcast Connectivity
Figure 2-1 below shows the connectivity supported by UAT for ADS-B air-air, ADS-B air-to-ground, and the uplink services of TIS-B and FIS-B.
ADS-B
ADS-B
Weather andAeronautical
Information (FIS-B)
TrafficInformation
(TIS-B)
FIS-BTIS- B
ADS-B
ADS-B
UAT Ground Station
FIS-BTIS- B
Transmit Only
Figure 2-1: UAT Connectivity
ACP-WGW01/AI-1Appendix D

7
© 2005
Aircraft UAT equipment may support transmit-only or transmit and receive capability. When aircraft are in the service volume of a Ground Station, uplink services may be provided and the Ground Station can serve as a surveillance sensor for ground based ADS-B applications. Regardless of whether aircraft users are in coverage of a Ground Station or not, air-air ADS-B connectivity is available. While networking of Ground Stations can offer certain advantages, each can also operate independently of others if desired. Requirements for coordination among Ground Stations are that they all operate on a common time standard (as do UAT avionics) and that the ground uplink Data Channels (see §6.2.1) on which they transmit are assigned through appropriate coordination on a Regional basis.
Appendix B presents performance estimates for the UAT system under a variety of different operational scenarios. The information in Appendix B is intended to provide guidance on the expected performance (compared with UAT Requirements and Desirable Features in Appendix L) in different types of airspace regions for States that wish to implement a UAT capability. Detailed results of full-scale multi-aircraft simulations are shown for air-air, air-to-ground, and ground-to-air performance for two high air traffic density scenarios and one low density scenario. In addition, performance results for several specific circumstances are presented, including track acquisition, surface-surface, and reception of aircraft on approach.
The two high density air traffic scenarios are intended to represent worst-case stressful conditions for an ADS-B link. One of these, the Los Angeles (LA) 2020 scenario, is a scenario that was developed to represent a single high-density central region with a large percentage of low-flying aircraft. The other, Core Europe (CE) 2015, has five high-density regions around TMAs and includes a large percentage of high altitude aircraft. The Low Density scenario is made up of a much smaller, uniform density of high-flying aircraft spread out over a large area. Each of these scenarios is meant to represent a different type of airspace that may resemble one where implementation is planned. A State wishing to implement UAT in an airspace region resembling one of these could expect to achieve performance results no worse than those presented in the Appendix.
The LA 2020 scenario performance results may be expected to be valid for a central region of high density gradually tapering off outside that region, with a large percentage of general aviation aircraft. This scenario is also characterized by the absence of a DME/TACAN at 979 MHz, although one as close in frequency as 980 MHz could operate in this environment and not materially affect the performance results presented in the Appendix. A State wishing to implement UAT in a high-density air traffic region in the absence of DME/TACAN interference sources at 979 MHz could expect performance results no worse than those presented in §B.4.1 of the Appendix for LA 2020. For example, as illustrated in Figure B-20 in Appendix B, in LA 2020 air-to-ground update rates are expected to meet or exceed those for typical radar scan rates for all aircraft equipage classes to well past 100 NM.
The CE 2015 scenario performance results may be used to predict expected performance in a high-density region in the presence of a number of high power DME/TACANs at 979 MHz. One of the performance evaluation points used in this scenario was chosen to be the worst-case DME/TACAN location. This location was selected to provide the highest interference from DME/TACANs. The worst-case DME/TACAN environment selection required moving a high-power mobile 979 MHz TACAN to a particular location near several other 979 MHz TACANs and placing the receive evaluation point in
ACP-WGW01/AI-1Appendix D
8
© 2005
the midst of these interference sources. A State wishing to implement UAT in a high-density air traffic region in the presence of DME/TACAN interference sources could expect performance results no worse than those presented in §B.4.2 of the Appendix for CE 2015.
A further aspect of the CE 2015 scenario is the large proportion of aircraft flying at high altitudes. This characteristic of the scenario results in a UAT Ground Station receiving transmissions from a very large number of aircraft-in-view. In order to achieve satisfactory air-to-ground reception at all ranges to 150 NM for all UAT-equipped aircraft, UAT Ground Station design should include a higher performance receive antenna than the omni-directional antenna discussed in §2.5 of this Manual. For example, Figure B-30 in Appendix B illustrates expected air-to-ground performance for a UAT Ground Station using an omni-directional antenna in the CE 2015 scenario at Brussels (BRU). As illustrated in Figure B-31 in Appendix B, in order to achieve typical radar scan rates for air-to-ground reception out to 150 NM in the CE 2015 environment, a three-sector receive antenna would be required.
Another consideration for States wishing to implement UAT in the presence of a high-power 979 MHz DME/TACAN located near a potential UAT ground receiver is what siting restrictions would be necessary. While the UAT transmissions would not pose restrictive interference with the DME/TACAN performance, §7.2 describes some of the restrictions on the range between the DME/TACAN and the UAT receiver that would be necessary to prevent the DME/TACAN transmissions from hindering UAT air-to-ground receive performance.
The Low Density scenario is intended to represent a typical en route airspace region. A State wishing to implement UAT in an environment such as this could expect performance that would be no worse than that shown in the Appendix for Low Density.
2.2 Frequency Channel and Waveform Description
The UAT employs the single common frequency channel at 978 MHz for both the aircraft and ground-based transmissions and has a signaling rate of just over 1 Mbps. The single channel architecture ensures seamless air-air connectivity and obviates the need for multi-channel receivers or tuning procedures. The UAT frequency channel has been sized to ensure adequate ADS-B performance is maintained in future high traffic density environments. Additionally, the UAT waveform has been designed specifically to provide tolerance to intra-system interference and other pulsed interference encountered on nearby frequencies (e.g. DME/TACAN). The UAT waveform is defined in the UAT SARPs.
Detailed information on UAT ADS-B performance assessment in low density and in current and future high-density traffic airspace is provided in Appendix B. This assessment also accounts for expected sources of interference from other systems in the 960 MHz to 1215 MHz as described in Appendix C. Appendix D describes the bench test measurements used to develop receiver performance models that provide a basis for the simulations in Appendix B.
ACP-WGW01/AI-1Appendix D

9
© 2005
There are two types of broadcast transmissions - or messages - on the UAT frequency channel: the UAT ADS-B Message (from aircraft, surface vehicles or ground stations (for TIS-B Messages)), and the UAT Ground Uplink Message. Regardless of type, each message has two fundamental components: the Message Data Block that contains user information, and message overhead, primarily consisting of Forward Error Correction (FEC) code parity that supports the error-free transfer of the data. The FEC was selected to ensure that UAT Messages would be received with an undetected error rate, at the UAT link layer, of at most one in 10-8 per UAT Message. Details on the format of these message types are provided in §12.4.4 of the UAT SARPs. Details on the contents and format of the Message Data Blocks are provided in §2.1 of the Manual on the UAT Detailed Technical Specifications.
Information on the error detection and correction performance of the UAT FEC scheme is provided in Appendix E.
Finally, test results assessing the impact of UAT signals on DME interrogator receivers are presented in Appendix F. Guidance on sharing antennas with SSR transponders is provided in Appendix H. The output of suppression pulses by UAT equipment and the impact of UAT on other onboard systems operating in the 960 MHz to 1215 MHz frequency band are discussed in §5.1 and §5.2.
2.3 Timing Structure and Medium Access
UAT support for multiple services is accomplished using a hybrid medium access approach that incorporates both time-slotted and pseudorandom access. By virtue of its waveform, modulation rate, precise time reference, and message-starting discipline, UAT may in the future be used for independent validation of position information of received UAT ADS-B Messages (see §9 ).
Figure 2-2 illustrates the message timing structure called a UAT frame. A UAT frame is one second long and begins at the start of each Coordinated Universal Time (UTC) second. Each UAT frame is divided into two segments:
1. The Ground Segment in which UAT Ground Uplink Messages are broadcast in one or more time slots, and
2. The ADS-B Segment in which UAT ADS-B Messages are broadcast.
Guard times are incorporated between the segments to allow for signal propagation and timing drift. The UAT frame contains 3952 Message Start Opportunities (MSOs) that are spaced at 250µs intervals. This spacing represents the smallest time increment used by UAT for scheduling message transmissions, and each transmission must start only at a valid MSO.
Note: The MSO concept was established primarily to govern the transmission protocol used by avionics UAT transmitters—as detailed in §3.1.2 of the Manual on the UAT Detailed Technical Specifications. The MSO serves to constrain the pseudorandom transmit time to a finite number of time synchronized possibilities spaced evenly throughout the allowed UAT ADS-B Message transmission interval (i.e., ADS-B segment). Using a transmission protocol constrained to a set of synchronized MSOs as opposed to a totally random approach allows a
ACP-WGW01/AI-1Appendix D

10
© 2005
receiver to infer the precise time of transmission, thus allowing a measurement of the propagation time of a UAT Message.
For consistency, the same MSO framework is used to define the time slots used for transmission of UAT Ground Uplink Messages by UAT Ground Stations as detailed in §3.2.2 of the Manual on the UAT Detailed Technical Specifications. The ground segment contains 32 transmission time slots, each consisting of 22 MSO's.
6 m s 6 m s1 2 m s
U A T F r a m e = O n e U T C S e c o n d
( S t a r t : o n t h e U T C s e c o n d ) ( E n d )
M S O 0 M S O 3 9 5 1
M e s s a g e S t a r t O p p o r t u n i t i e s ( M S O s )
A D S - B S e g m e n t 8 0 0 m s
G r o u n d S e g m e n t 1 7 6 m s
M S O 7 5 2M S O 7 0 4
Figure 2-2: UAT Frame
Notes:
1. Shaded segments represent guard times for signal propagation and timing drift (not to scale).
2. When the last MSO is selected for the transmission of a UAT ADS-B Message, part of a transmission (20 microseconds for a Basic UAT Message and 180 microseconds for a Long UAT Message) will occur within the final guard interval of 6 milliseconds.
As shown in Figure 2-2, 176 milliseconds in each 1-second UAT frame are devoted to UAT Ground Uplink Message transmissions, and 800ms are devoted to UAT ADS-B Message transmissions. MSOs start at the end of the initial 6ms guard time, are spaced at 250μs intervals, and are numbered sequentially from 0 through 3951. In the 12 milliseconds guard-time between the ground segment and the ADS-B segment no messages are transmitted, bringing the total of MSO's available to 3904.
2.3.1 UAT ADS-B Message Transmission by Aircraft
As shown in Figure 2-2, the ADS-B Segment of each UAT frame is 800ms long, and spans 3200 MSOs (i.e., from MSO 752 to MSO 3951). All UAT ADS-B Messages, including ADS-B Messages containing TIS-B information that are generated by ground stations, are transmitted in this segment of the frame. Each UAT-equipped aircraft or vehicle generates only one UAT ADS-B Message transmission per frame, and makes a pseudorandom selection from among any of the 3200 MSOs in the segment to start
ACP-WGW01/AI-1Appendix D

11
© 2005
transmission of the message. Approximately 6 milliseconds of guard time are appended after the ADS-B Segment to fill out the UAT frame to the end of the UTC second.
The pseudorandom selection of an MSO within each UAT frame for the start of an aircraft's UAT ADS-B Message is intended to prevent two aircraft from systematically interfering with each other's UAT ADS-B Message transmissions.
Construction of an example UAT ADS-B Message Data Block including the FEC is provided in Appendix G.
2.3.2 Ground Uplink Services
UAT Ground Uplink Messages are used to support services such as FIS-B. UAT Ground Uplink Messages will occur within one or more of the 32 time slots defined within the ground segment of the UAT frame. Detailed procedures for UAT Ground Uplink Message transmission are provided in §3.2.2 of the Manual on the UAT Detailed Technical Specifications.
UAT Ground Stations can support TIS-B through the transmission of individual messages in the UAT ADS-B format in the ADS-B segment of the UAT frame. This includes re-transmission from ADS-B messages available at the ground from other ADS-B systems or from primary or secondary radar. Using this approach, TIS-B transmissions will appear to be nearly identical to UAT ADS-B Messages both in terms of message format and media access. Each such TIS-B transmission must start only at a valid MSO as is the case with transmission of ADS-B Messages from aircraft.
2.4 Basic Avionics Operation and Equipage Levels
2.4.1 Avionics Operating Concept
Implementations will consist of transmit and receive subsystems. Most implementations will include both subsystems; however, transmit-only configurations are also possible. Figure 2-3 shows the high level functions of an avionics implementation that supports both transmission and reception.
ACP-WGW01/AI-1Appendix D

12
© 2005
ReportFormatting
and Delivery
ADS-B MsgComposition andTransmission
Transmitter
Receiver
Status
Intent
Other
On-board Applications
ADS-B Transmitting Subsystem
Receiving Subsystem
Position, Velocity Time Mark
Aircraft Address
Broadcast Messages
Figure 2-3: High Level Function of UAT Avionics
The UAT ADS-B Transmitting Subsystem performs the following basic functions:
a. Determine the proper message format based on the predetermined (fixed) message transmit schedule.
b. Acquires various inputs for elements of the UAT ADS-B Message and format those elements into the UAT ADS-B Message structure.
c. Determine the appropriate MSO for transmission (once per second) based on pseudorandom seed.
d. Select the antenna for transmission (for installations requiring transmit diversity, see §2.4.2 below).
e. Transmit the UAT ADS-B Message over the UAT frequency channel.
These functions result in one UAT ADS-B Message being transmitted each second. Additionally, the UAT ADS-B Transmitting Subsystem may make use of information indicating whether the vertical status of the aircraft is "ON GROUND" or "AIRBORNE". Where this information is available, the UAT ADS-B Message format and MSO selection algorithm change in several respects depending on the Vertical Status declared. Further information may be found in §2.1.5 and §3.1.2.1 of the Manual on the UAT Detailed Technical Specifications and in §3.1.2 of this Manual.
The UAT Receiving Subsystem performs the following basic functions:
a. Select antenna for reception (in installations that employ antenna switching, but do not employ receiver diversity, see §2.4.2).
b. Detection and decoding of UAT Messages (both Ground Uplink Messages and UAT ADS-B Messages) on the UAT frequency channel.
ACP-WGW01/AI-1Appendix D

13
© 2005
c. Apply “Successful Message Reception” criteria to each detected message to ensure integrity. See §4 of the Manual of the UAT Detailed Technical Specifications.
d. For each Successful Message Reception, format the resulting Message Data Block for use by on-board applications.
Each UAT Message successfully received will trigger the generation of a report, which includes the Message Data Block information of that message and an indication of the time (time stamp) indicating when the message was received. Forward error correction coding is used to ensure that the received message is identical to that transmitted.
2.4.2 Examples of UAT Equipage Classes
RTCA has categorized ADS-B equipment (other than Ground Stations) into equipage classes as defined in RTCA/DO-242A, the ADS-B MASPS (Minimum Aviation System Performance Standards). This categorization is based on potential ADS-B applications and the needs of particular airspace users. This Manual provides, for exemplary purposes, configurations of UAT avionics consistent with the RTCA equipage categories. Appendix B to this Manual provides projected UAT performance for each of these equipage classes using both high and low-density traffic scenarios. For UAT ADS-B equipment, the installed performance of these equipment classes is defined by Table 2-1.
Aircraft systems supporting both transmission and reception of UAT Messages, termed Class A UAT Systems, are defined by equipage classification according to the provided user capability. All Class A UAT Aircraft configurations support the provision of at least basic air-to-ground ATC surveillance services to a estimated range of 150 NM (see Appendix B for supporting analysis and UAT Ground Station receiver assumptions). The variations listed below are primarily distinguished by their support of air-air applications. The following types of Class A1 systems are defined:
1. Class A0: Supports minimum Message transmission and reception capability for UAT equipped aircraft that always operate below 18,000 feet MSL. Air-air ADS-B applications for this Class of equipage are intended to support a range of at least 10 NM between participants (an air-air range of at least 20 NM has been projected). UAT ADS-B Messages are based upon source data available on the aircraft. UAT ADS-B Messages received from other aircraft support generation of UAT ADS-B reports that are used by on-board applications.
2. Class A1: Supports all class A0 functionality and supports ADS-B air-air applications to a range of at least 20 NM between participants. The Class A1 equipage class has been divided into two classes. Class A1 Low (A1L) is to be used by aircraft that always operate below 18,000 feet MSL, Class A1 High (A1H) is used by aircraft operating at all altitudes. The major equipment performance difference between classes A1L and A1H is the Transmitter RF output power. An air-air range of at least 40 NM has been projected for Class A1H equipment.
1 There may be future recognition of Receive-Only configurations in which the requirements for an appropriate Class A Receive capability are met. Such configurations would be intended for use only in aircraft that support an interactive capability on an alternate ADS-B data link.
ACP-WGW01/AI-1Appendix D

14
© 2005
3. Class A2: Supports all Class A1 functionality and supports ADS-B air-air applications to a range of at least 40 NM between participants. Additional data is supplied in ADS-B Messages to support further ADS-B air-air applications for receiving aircraft. This service requires the broadcast and receipt of intent information contained in Target State and Trajectory Change Reports.
4. Class A3: Supports all Class A2 functionality and supports ADS-B air-air applications between A3 equipped users to a range of at least 120 NM. Class A3 has the ability to broadcast and receive multiple Trajectory Change reports. The analysis in Appendix B, which assumes a particular method of transmitting two Trajectory Change Reports, indicates that the exchange of a second Trajectory Change Report at distances of 120 NM is accomplished at approximately one-half of the update rate of the first Trajectory Change Report. Alternative methods of transmitting up to four Trajectory Change Reports for an ADS-B system participant are discussed in Appendix I.
The UAT SARPs refer to “Standard” and “High Performance” Receivers. Class A3 equipment employs the High Performance Receiver and the remaining Class A equipments employ the Standard Receiver. The performance projections in Appendix B of this Manual assume that receivers for UAT Ground Stations are Standard Receivers with a receiver sensitivity at the unit 2 dB better than the sensitivity of a Standard Receiver in an aircraft.
The High Performance Receiver employs a narrower bandwidth filter to allow it to better reject adjacent frequency DME emissions. The use of High Performance Receivers is recommended to support longer range air-air ADS-B applications in air spaces which have a significant number of DME assignments on frequencies adjacent to the 978 MHz UAT transmission frequency. The narrow bandwidth introduces some distortion of the desired signal that degrades the performance in the presence of self interference. However the benefit of rejecting the DME energy offsets this effect in terms of overall performance. The full effect of the narrow bandwidth filter was accounted for in the performance assessments in Appendix B.
Table 4 in the UAT SARPs specifies a more stringent receiver rejection ratio for High Performance Receivers at a 1 MHz offset from the UAT frequency of 978 MHz than at a -1 MHz offset. This higher rejection ratio requirement was adopted to provide additional performance margin for aircraft UAT equipment operating in a high density 979 MHz DME environment, as is found in the European Region. Additionally, the rejection characteristics in Table 4 were found to be provided by readily available avionics components. Should DME operation at 977 MHz reach the level that presently exists at 979 MHz, a symmetric rejection ratio at ±1 MHz of 40 dB would be desirable.
Some UAT ADS-B system participants will not need to receive information from other participants but will only need to broadcast their State Vector and associated data. Class B UAT ADS-B systems meet the needs of these participants. Class B UAT systems are defined as follows:
1. Class B0: Aircraft broadcast-only system. Class B0 UAT systems require an interface with own-platform navigation systems. Class B0 UAT systems require
ACP-WGW01/AI-1Appendix D

15
© 2005
transmit powers and information capabilities equivalent to those of Class A0. Class B0 installations are on aircraft that always operate below 18,000 feet MSL.
2. Class B1: Aircraft broadcast-only system. Class B1 UAT systems require an interface with own-platform navigation systems. Class B1 UAT systems require transmit powers and information capabilities equivalent to those of Class A1H.
3. Class B2: Vehicle broadcast-only UAT ADS-B system. Class B2 UAT systems require a high-accuracy source of navigation data and a nominal 5 NM effective broadcast range. Vehicles qualifying for UAT ADS-B equipage may be limited to those that operate within the airport surface movement area.
4. Class B3: Fixed obstacle broadcast-only UAT ADS-B system. Class B3 UAT systems do not require a source of navigation data (their position can be determined through an appropriate pre-installation survey) and a nominal 5 NM effective broadcast range. Collocation of the transmitting antenna with the obstacle is not required as long as broadcast service volume requirements are met. Structures and obstructions identified by appropriate ATS authorities as safety hazards may have their positions communicated to aircraft using UAT.
UAT Ground Stations are discussed further in §2.5.
The complete set of ADS-B information transmitted will vary somewhat for each equipment class as determined by the schedule of UAT ADS-B Message Data Blocks to be transmitted by each equipment class (see §3.1.1 of this Manual). Receiving applications can infer the equipment class of a system participant by observing the set of UAT ADS-B Message Data Blocks being received from each participant. Certain air-air applications may require the receiving application to determine the applications supported by ADS-B targets under surveillance. In the future this information will be explicitly encoded in the Message Data Block of the Mode Status Element (see the Manual on the UAT Detailed Technical Specifications, §2.1.5.4).
ACP-WGW01/AI-1Appendix D

16
© 2005
Important characteristics of the UAT ADS-B Class A and Class B equipage classes are summarized in Table 2-1.
Table 2-1: Examples of UAT Installed Equipment Classes
Intended Antenna Diversity (when Airborne for Classes A & B0-B1) Equipage
Class
Air-to-Air Application
Ranges Supported
Transmit RF Power Delivered to Antenna
System Transmit Receive
A0 10 NM Single Antenna (see Note 4)
Single Antenna (see Note 4)
A1L
Low Power (Altitude always
below 18,000 feet) Alternating every 2 sec.
Alternating every sec.
A1H 20 NM
Medium Power Alternating every 2 sec.
Alternating every sec.
A2 40 NM Medium Power Alternating every 2 sec. Dual Receiver
A3 120 NM High Power Alternating every 2 sec. Dual Receiver
B0 10 NM Low Power
(Altitude always below 18,000 feet)
Single Antenna (see Note 4) n/a
B1 20 NM Medium Power Alternating every 2 sec. n/a
B2 5 NM +28 to +32 dBm Single Antenna n/a
B3 5 NM +30 dBm (minimum) Single Antenna n/a
Ground Station
Specified by the service provider to meet local requirements within the constraint of Section 12.1.2.3.2 of the UAT SARPs
Notes:
1. See §2.4.2.1 for definition of Transmitter RF power levels.
2. Transmitter RF power requirement depends on the aircraft maximum altitude capability. Low-altitude aircraft (maximum certified altitude for aircraft <18,000 feet MSL) need not support the higher-power transmitter requirements due to line-of-sight limitations.
3. Top antenna is not required if use of a single antenna does not degrade signal propagation. This allows for single antenna installation on radio-transparent airframes.
4. For a single-antenna installation, antenna gain pattern performance should be shown at least equivalent to that of a quarter-wave resonant antenna mounted on the fuselage bottom surface.
ACP-WGW01/AI-1Appendix D

17
© 2005
5. For further information on Antenna diversity see RTCA DO-282A, §2.2.8.1 and §2.2.6.1.3 or equivalent certification guidance.
6. Consistent with Table 1 of the UAT SARPs Section 12.1.2.3.1, projected performance is 20 NM for Class A0 and 40 NM for Class A1H. The intended ranges in the Table above were taken from the UAT Requirements and Desirable Features document (see Appendix L) and used as “design-to” numbers.
2.4.2.1 UAT ADS-B Aircraft Transmitting Subsystem
A UAT ADS-B Aircraft Transmitting Subsystem is classified according to the unit’s range capability and the set of parameters it is capable of transmitting. Table 2-2, adapted from section 12.1.2.3.1 of the UAT SARPs defines the transmitter power levels.
Table 2-2: Transmitter Power Levels
Transmitter Type Minimum Power at PMP
Maximum Power at PMP
Intended Minimum Air-air Ranges
Aircraft (Low) 7 watts (+38.5 dBm)
18 watts (+42.5 dBm) 20 NM
Aircraft (Medium) 16 watts (+42 dBm)
40 watts (+46 dBm) 40 NM
Aircraft (High) 100 watts (+50 dBm)
250 watts (+54 dBm) 120 NM
2.4.2.2 UAT Aircraft Receiving Subsystem
All UAT Aircraft receivers have the same receiver sensitivity requirements. The receiver sensitivity at the PMP, for 90% Message Success Rate in the absence of interference, is –93 dBm for Long UAT ADS-B Messages, –94 dBm for Basic UAT ADS-B Messages, and –91 dBm for Ground Uplink (ground-to-air) Messages. Performance of UAT Aircraft receivers in the presence of interference is discussed in Appendices B and D.
2.5 Ground Station Operation
The UAT Ground Station will operate as a UAT ADS-B sensor similar to that of aircraft units. The UAT System has been designed to support line-of-sight air-to-ground ADS-B service volume for a single Ground Station, even in future high-density airspaces. The UAT Ground Station is also capable of transmitting UAT Ground Uplink Messages in one or more of the 32 Ground Segment time slots assigned to the Ground Station TIS-B transmissions from a UAT Ground Station can utilize the UAT ADS-B Message format in the ADS-B segment of the UAT frame. In this event, the aircraft UAT Receiving Subsystem makes no distinction in its processing of UAT ADS-B Messages from other aircraft or TIS-B data in the format of a UAT ADS-B Message from a Ground Station (although the aircraft application can distinguish these via the Address Qualifier field). Alternatively, in particular traffic environments, a UAT Ground Station may transmit TIS-B information in one or more of the 32 assigned Ground Segment time slots.
ACP-WGW01/AI-1Appendix D

18
© 2005
The typical UAT Ground Station antenna has an antenna gain of 6 to 8 dBi, with an omni-directional antenna pattern (the maximum EIRP of the UAT Ground Station is, per UAT SARPs §12.1.2.3.2, 58 dBm). High-density traffic environments may require use of separate transmit and receive antennas, and/or sectorized receive antennas (see Appendix H of this Manual). The air-to-ground performance simulation results in Appendix B were based on a Ground Station receiver sensitivity of –98 dBm, measured at the PMP. Additionally, it was assumed that the maximum tolerable power level of continuous wave interference at 978 MHz was -106 dBm at the PMP. Figure 2-4 gives an overview of the Ground Station.
T/R
TIS-B Reports,uplink data
ADS-B ReportsUAT Ground Station
Transceiver Application Processor(s)
Timing Reference
Figure 2-4: UAT Ground Station Simplified Block Diagram
A single UAT Ground Station is capable of supporting the following functions:
1. Receiving air-to-ground UAT ADS-B Messages and producing UAT ADS-B reports.
2. Ground broadcast transmission (e.g., TIS-B, FIS-B).
3. Providing backup timing for aircraft (see the Manual on the UAT Detailed Technical Specifications, §3.1.1.2(c)). In order to implement this backup timing capability the Ground Station will need to provide Ground Uplink Messages on a regular basis.
Additional guidance on the working concept for a UAT ground infrastructure is provided in Section §6 of this Manual.
ACP-WGW01/AI-1Appendix D

19
© 2005
3 Scheduling of UAT ADS-B Messages
3.1 Message Data Block Selection Cycle
UAT ADS-B Message Data Block types are to be transmitted according to a Message Data Block selection cycle defined to ensure timely transmission of appropriate ADS-B information. For the exemplary equipment classes of Table 2-1, UAT ADS-B Messages of seven different Message Data Block types (out of 32 possible Message Data Block types) have been defined. Each equipment class transmits up to four of these Message Data Block types in a pre-determined sequence: Message Data Block Selection (MDBS)-A, MDBS-B, MDBS-C, and MDBS-D.
3.1.1 ADS-B Message Data Block Type Transmission Sequence
For the equipment classes of Table 2-1 of this Manual, Table 3-1 below specifies the Message Data Block selections, using UAT ADS-B Message Data Block Type Codes defined in Table 2-2 of the Manual on the UAT Detailed Technical Specifications.
Table 3-1: Message Data Block Type Code Transmission Sequence
Equipment Class MDBS-A MDBS-B MDBS-C MDBS-D A0, A1L, A1H, B0, B1 1 0 2 0 A1H, B1 (see Note 2) 3 6 0 6 A2 1 4 4 4 A3 1 4 5 4 B2, B3 1 0 0 0
Notes:
1. This schedule is to be followed regardless of the unavailability of any Message Data Block fields.
2. Optional Message Data Block Type Code assignment if the installation can support transmission of Target State information.
3.1.2 Message Transmission Cycle
A message transmission cycle of 16 seconds is defined to ensure a proper mix of Message Data Blocks for installations that support ADS-B Message transmission from dual (diversity) antennas. When an aircraft is determined to be in the AIRBORNE condition, transmissions occur through Top (T) (if so equipped) and Bottom (B) antennas each Message Transmission Cycle as shown in Figure 3-2.
ACP-WGW01/AI-1Appendix D

20
© 2005
Antenna T T B B T T B B T T B B T T B B
MDBS # A B C D D A B C C D A B B C D A
Seconds 1 2 3 4 5 6 7 8 9 10 11 12 13 14 15 16
Time
Message Transmission Cycle
Figure 3-2: Transmitter Antenna Use for Diversity Installations
Notes:
1. There is no requirement that the message transmission sequence be aligned in time between different Aircraft/Vehicles (A/Vs); the sequence is defined for each A/V to ensure a proper mix of transmitted message types from the A/V.
2. For Class A1 receivers with antenna diversity provided by switching according to §2.4.2, the transmission pattern in the Table ensures that each Message Data Block type transmitted by a UAT aircraft according to the transmission pattern is received by the Class A1 receiver using each possible transmit (by the UAT aircraft) /receive (by the A1 receiver) antenna combination once every 16 seconds.
When an aircraft is determined to be in the ON-GROUND condition, the top antenna (if so equipped) is selected for all transmissions. The transmission sequences are as shown in Figure 3-2, second and third rows.
ACP-WGW01/AI-1Appendix D

21
© 2005
4 UAT A/V ADS-B Transmitting Subsystem Input Requirements
a. The UAT A/V ADS-B Transmitting Subsystem should accept the input data elements listed in Table 4-1 via an appropriate data input interface and use such data to establish the corresponding UAT ADS-B Message contents.
b. Data elements that are indicated as “Optional,” and that have no input interface on a particular aircraft, should either indicate the “data unavailable” condition, or be processed using the “data unavailable” procedures related to that element.
ACP-WGW01/AI-1Appendix D

22
© 2005
Table 4-1: UAT ADS-B Transmitting Subsystem Input Requirements
Applicability to UAT Equipment Class
Ele
men
t #
Input Data Element
Relevant Technical Manual
Paragraph
Data Lifetime (seconds) A0,
B0 A1L A1H, B1 A2 A3 B2 B3
1 ICAO 24-bit Aircraft Address 2.1.5.1.3.1 No limit M M M M M M (1) M (1)
2 Latitude 2.1.5.2.1 2 M M M M M M M 3 Longitude 2.1.5.2.1 2 M M M M M M M
4 Altitude Type Selection (Barometric vs Geometric) 2.1.5.2.2 60 O O O O O n/a M
5 Barometric Pressure Altitude 2.1.5.2.3 2 M M M M M n/a n/a 6 Geometric Altitude 2.1.5.2.3 2 M M M M M n/a M 7 NIC 2.1.5.2.4 2 M M M M M M M
8 Automatic AIRBORNE / ON-GROUND Indication 2.1.5.2.5 2 O O M M M n/a n/a
9 North Velocity 2.1.5.2.6.1 2 M M M M M M M 10 Ground Speed 2.1.5.2.6.2 2 O O M M M O n/a 11 East Velocity 2.1.5.2.6.3 2 M M M M M M M 12 Track Angle 2.1.5.2.6.4 2 O O M M M n/a n/a 13 Heading 2.1.5.2.6.4 2 O O M M M n/a n/a
14 Barometric Vertical Rate 2.1.5.2.7.1.1 2.1.5.2.7.1.3 2 M M M M M n/a n/a
15 Geometric Vertical Rate 2.1.5.2.7.1.1 2.1.5.2.7.1.3 2 O O O O O n/a n/a
16 A/V Length and Width, and POA 2.1.5.2.7.2 No limit M M M M M M M 17 UTC 1 PPS Timing 2.1.5.2.8 2 M M M M M M M 18 Emitter Category 2.1.5.4.1 No limit M M M M M M M 19 Call Sign 2.1.5.4.5 60 M M M M M O O 20 Emergency / Priority Status Selection 2.1.5.4.6 60 M M M M M O n/a 21 SIL 2.1.5.4.8 60 M M M M M M M 22 NACP
2.1.5.4.11 2 M M M M M M M 23 NACV
2.1.5.4.12 2 M M M M M n/a n/a
24 NICBARO 2.1.5.4.13 2 Can be
internally “hard coded”
M M M n/a n/a
25 CDTI Traffic Display Capability 2.1.5.4.14.1 60 M M M M M n/a n/a 26 ACAS Installed and Operational 2.1.5.4.14.2 60 M M M M M n/a n/a
27 ACAS Resolution Advisory Flag 2.1.5.4.15.1 18 Required only if the UAT ADS-B Transmitting Subsystem is intended for installation with ACAS; otherwise can be “hard coded”
28 IDENT Selection 2.1.5.4.15.2 60 M M M M M M n/a 29 “Receiving ATC Services” Flag 2.1.5.4.15.3 60 M M M M M M n/a 30 “True/Magnetic” Indicator Flag 2.1.5.4.16 60 n/a n/a O M M M n/a 31 Heading / Track Indicator 2.1.5.6.1.1 60 n/a n/a O M M n/a n/a 32 Target Source Indicator (Horizontal) 2.1.5.6.1.2 60 n/a n/a O M M n/a n/a 33 Mode Indicator (Horizontal) 2.1.5.6.1.3 60 n/a n/a O M M n/a n/a 34 Target Heading or Track Angle 2.1.5.6.1.5 60 n/a n/a O M M n/a n/a 35 Target Altitude Type 2.1.5.6.2.1 60 n/a n/a O M M n/a n/a 36 Target Source Indicator (Vertical) 2.1.5.6.2.2 60 n/a n/a O M M n/a n/a 37 Mode Indicator (Vertical) 2.1.5.6.2.3 60 n/a n/a O M M n/a n/a 38 Target Altitude Capability 2.1.5.6.2.4 60 n/a n/a O M M n/a n/a 39 Target Altitude 2.1.5.6.2.5 60 n/a n/a O M M n/a n/a 40 Radio Altitude 2.1.5.2.5.1 2 O O O O O n/a n/a 41 Pressure Altitude Disable 2.1.5.2.2 No limit M M M M M n/a n/a 42 Airspeed 2.1.5.2.5.1 2 O O O O O n/a n/a M = Mandatory (the equipment must have the ability to accept the data element) O = Optional n/a = not applicable to this equipage class
Note: (1) Addresses for Vehicles and Obstacles may be assigned by the appropriate ATS Authority.
ACP-WGW01/AI-1Appendix D

23
© 2005
5 UAT Aircraft Installation Guidance
5.1 Aircraft Mutual Suppression Bus
Section 4.2 of the Manual on the UAT Detailed Technical Specifications requires UAT equipment to output suppression pulses during UAT transmission. In practice these pulses will be transmitted on the aircraft’s Mutual Suppression Bus. On aircraft without such a bus, the installation of UAT equipment effectively results in such a bus being implemented. The Mutual Suppression Bus is used in aircraft for systems operating in the 960 MHz to 1215 MHz band such as Secondary Surveillance Radar (SSR) transponders, ACAS and DMEs (the use of the Mutual Suppression Bus for future receipt of GNSS signals in the 1151 MHz to 1215 MHz band is not planned). The 960 MHz to 1215 MHz frequency band systems on the aircraft physically connect to the common bus. The 960 MHz to 1215 MHz frequency band systems that are connected to the bus may drive the bus to announce to other systems that a transmission is taking place during the interval that the bus is activated. They may also listen on the bus to react to other 960 MHz to 1215 MHz frequency band transmissions on the aircraft. The 960 MHz to 1215 MHz frequency band systems that listen on the bus may choose to delay their own transmissions so as not to simultaneously transmit while another 960 MHz to 1215 MHz frequency band system is transmitting and/or desensitize its receiver to protect itself during high powered transmissions which could damage or impair its receive capability.
5.2 UAT Suppression Pulse Impact on Aircraft Cosite SSR, ACAS and DME Performance
As indicated above, systems operating within the 960 MHz to 1215 MHz frequency band may need interference protection from each other to ensure safe and proper operation. A major consideration of systems connecting to and driving the mutual suppression bus is to minimize the duration of the suppression pulse to minimize the impact to other connected systems. This section demonstrates that UAT operation does not operationally impact performance of cosite SSR, ACAS or DME systems. It should be noted that while UAT receivers are not required to respond to suppression pulses from cosite transmissions from these systems, the performance estimates of Appendix B assume that no UAT Message reception will occur during periods of cosite transmissions in the 960 MHz to 1215 MHz frequency band.
UAT is required to drive the Mutual Suppression Bus during the UAT transmission. UAT does not monitor the Mutual Suppression Bus so it does not inhibit or delay its transmissions as a result of Mutual Suppression Bus pulses from other 960 MHz to 1215 MHz frequency band systems connected to the bus. The impact to the UAT receiver during other 960 MHz to 1215 MHz frequency band transmissions that drive the suppression bus was considered when assessing UAT receiver performance in high density airspace, as the UAT receiver was considered completely blanked during on-board 960 MHz to 1215 MHz frequency band transmissions from ACAS, SSR transponders and DME systems. The UAT system performance estimates in Appendix B reflect this conservative blanking assumption. UAT averages one transmission per second and transmits either a Basic UATADS-B Message, which is 280 microseconds in duration, or a Long UAT ADS-B Message, which is 420 microseconds (436 bit periods x 0.96 microseconds/bit period). The suppression interval is required, per section 5.2 of the Manual on the UAT Detailed Technical Specifications, to be active during the
ACP-WGW01/AI-1Appendix D

24
© 2005
transmission interval when the power is –20 dBm or higher. The –20 dBm requirement was developed based on the maximum power tolerable without SSR transponders generating unsolicited replies when signal levels from out of band emissions from UAT transmitters fall within the SSR transponder receiver band are above the transponder receiver threshold. The maximum length of a suppression pulse generated by UAT aircraft equipment is 430 microseconds (420 microseconds for a UAT ADS-B Long Message plus 10 microseconds per section 5.2 of the Manual on the UAT Detailed Technical Specifications). The impact of this suppression interval to other 960 MHz to 1215 MHz frequency band systems is documented below.
The results of the compatibility analysis have been coordinated with the appropriate technical ICAO Panels.
5.2.1 Analysis of Impact on DME
The impact of the mutual suppression interval as a result of on-board UAT transmissions on DME systems was assessed. The short duration of the UAT suppression is insignificant to the DME transmitter/interrogator. The DME operation can safely withstand interrogation delays of 430 microseconds each second that may result if worst case delay were imposed on the DME. Looking at the receiver blanking of DME that would result from UAT suppression activity, the 0.043% worst case blanking is insignificant when considering that DME operation is acceptable at relatively low reply efficiencies. Appendix F of the UAT Implementation Manual contains data showing consistent DME operation on four different DME units when a reply efficiency of 30% or more is achieved. The measurements were performed relative to two performance criteria used in DME operation: 1) Acquire Stable Operating Point (ASOP), the point that prohibits the DME to acquire a track, 2) Break Stable Operating Point (BSOP), the point that causes DME to lose a track that it has already acquired. ASOP and BSOP were not operationally affected by UAT suppression pulses.
5.2.2 Analysis of the Impact of UAT Suppression Bus Pulses on ACAS
ACAS systems are connected to the Mutual Suppression Bus and accept and respond to suppression pulses on the bus so that ACAS activity (at least for reception) is disabled when other 960 MHz to 1215 MHz frequency band equipment transmit. The ACAS receiver, which decodes SSR Mode C/S signals, is required to recover to within 3 dB of normal receiver sensitivity within 15 microseconds after the end of the suppression pulse. UAT Long Message transmissions would result in a worst case 445 microsecond desensitization of the ACAS receiver. ACAS activity can be divided into three major functions: 1) Listening period for transponder acquisition squitters, 2) Whisper-shout interrogation/reply processing, 3) Mode S interrogation/reply processing. The impact of UAT Mutual Suppression Bus activity can be assessed for each of these functions. The potential blanking of a 445 microsecond interval during the Listening period of squitters is considered not to be a significant performance issue. Acquisition squitters are broadcast randomly on average once per second. The probability of reception of an aircraft squitter is reduced by 0.045% by the combination of UAT Mutual Suppression Pulses and ACAS receiver recovery time and is considered as an insignificant factor in squitter acquisition. The probability of two squitters from the same aircraft being missed on subsequent seconds due to UAT is in the order of 2 x 10⁻⁷. The impact of missing a single acquisition squitter at any point in time is not a performance issue for ACAS. The
ACP-WGW01/AI-1Appendix D

25
© 2005
system design allows reception of acquisition squitters with enough margin from target aircraft prior to the target aircraft being within range of the listening aircraft for threat determination. The whisper-shout function is an interrogation sequence to acquire SSR Mode A/C transponder equipped aircraft which varies interrogation power levels to reduce aircraft replies in a systematic way to reduce the overlap of replies, or garbling, that can occur in high density airspace. Whisper-shout interrogations occur at defined power levels and typically one to six power levels are transmitted under normal operating conditions. The number of whisper-shout interrogations can exceed 120 per second in a high density aircraft situation. The 445 microsecond UAT interval per second is not a significant impact to the Whisper-shout sequence of ACAS. The 445 microseconds may blank the receiver and cause one or more missed replies in any one second. But since the UAT transmission is random and a low probability exists for losing more than one SSR reply from any individual aircraft from the Whisper-shout interrogation sequence, this aspect of ACAS performance remains acceptable with UAT Mutual Suppression Bus blanking. The impact of UAT Mutual Suppression Bus pulses to the Mode S interrogation interval of ACAS is also seen as not a significant performance issue. The ability of ACAS to re-interrogate a particular aircraft if a reply is not received mitigates any risk of not receiving a reply from any individual interrogation. The main sources of interference are co-frequency SSR Mode A/C/S overlaps of desired replies. The limited UAT blanking of the ACAS receiver is not a significant factor.
5.2.3 Analysis of Impact of UAT Suppression Bus Pulses on SSR Transponders
When assessing the impact of UAT occupation of the Mutual Suppression Bus on SSR transponders, the addition of UAT suppression pulse to SSR transponder availability is to be considered. With the exception of the Acquisition and Extended Squitter transmissions of a Mode S transponder, the transponder transmits on a request basis from Ground and Aircraft interrogators, including Ground SSR Mode A/C/S, both EnRoute and Terminal, and ACAS. Transponder availability is impacted by several mechanisms. Transponders have side lobe suppression (SLS) functionality to inhibit the transponder from responding to interrogations for a defined interval (typically 35 microseconds). Ground interrogators use SLS to prevent transponders from replying to interrogations that are not within the main beam of the rotating antenna. The transponder is additionally not available during the active interrogation acceptance/reply and recovery interval. In high density airspace, where the number of Ground interrogators and the number of aircraft is high, the transponder has a reduced availability due to the high number of interrogations. The transponder is also not available due to other on-board 960 MHz to 1215 MHz frequency band systems such as ACAS and DME that blank the transponder receiver. Worst case transponder availability relative to all of these factors can be determined for a high density airspace by using the number of SSR Mode A/C/S and ACAS interrogations in the Core Europe 2015 future high density scenario contained in Appendix C, Table C-5, along with measured data from high density areas. The worst case transponder availability is calculated to be around 90%, meaning that the transponder cannot respond to interrogations at most 10% of the time. The addition of the UAT Mutual Suppression Bus blanking of the SSR transponder receiver reduces the availability at most from 90% to 89.957%. This reduction has not been considered to be of significant impact to the operational availability of SSR transponders.
ACP-WGW01/AI-1Appendix D

26
© 2005
5.3 Sharing Antennas with SSR Transponder
A potential method of providing an antenna for the UAT is to use a passive frequency Diplexer that is installed between an existing SSR transponder and the SSR antenna. The use of a Diplexer to operate UAT equipment and the on-board SSR transponder must ensure proper operation of UAT equipment and SSR transponders. Certain characteristics were critical to enable the use of a Diplexer. The power loss across the Diplexer was an important consideration. The typical cable attenuation that installations allow between the SSR transponder and antenna is 3 dB. The Diplexer cannot use up a significant portion of this allocation without eliminating most existing transponder installations as candidates for UAT antenna sharing. To ensure the proper operation of both UAT and SSR, a Diplexer loss less than 0.5 dB is expected to enable most existing SSR installations to use a Diplexer, permitting sharing of the SSR transponder antenna with UAT. The goals of the Diplexer design are to support a transponder port that would minimize the insertion loss in the 1030 / 1090 MHz band and possessing adequate passband so that 1030 MHz interrogation signals and 1090 MHz reply signals were unaffected by the Diplexer.
As shown in Figure 5-1, the Diplexer is a passive device and consists of three ports that provide connectivity from the UAT port to the antenna port (UAT Diplexer Channel) and connectivity from the Mode A/C/S port (Transponder Diplexer Channel) to the antenna port. An optional direct current (DC) path in the Transponder Diplexer Channel is allowed so that installations that require antenna sensing can maintain the capability to sense the presence of an antenna. The Transponder Diplexer Channel will attenuate signals at 978 MHz, providing isolation from the UAT. In some cases, Diplexer isolation actually exceeds the level of isolation obtained by using separate transponder and UAT antennas. The latter is a function of distance between antennas. The UAT’s Diplexer port can provide minimal insertion loss to the antenna at 978 MHz while manifesting a high impedance at the 1030 / 1090 MHz band.
ACP-WGW01/AI-1Appendix D

27
© 2005
Transponder Channel
UAT Channel
Antenna
UAT
SSRTransponder
Transponder – Antenna1015 – 1105 MHz 0.5 dB
Transponder – UAT 978 MHz 20 dB1030 MHz 30 dB1090 MHz 50 dB
UAT – Antenna977 – 979 MHz 0.5 dB
Figure 5-1: Optional Passive Diplexer Block Diagram
5.3.1 Optional Diplexer Requirements
An option to use a passive frequency Diplexer is provided to allow sharing of a single antenna between the SSR Mode A/C/S Transponder and the UAT unit is provided herein. Sharing a common antenna between the two systems may be desirable in aircraft to minimize antenna installation cost and complexity. The UAT Diplexer Channel frequency response requirements ensure adequate passband bandwidth around the 978 MHz UAT frequency to ensure that UAT signal integrity is maintained through the UAT unit, Diplexer and antenna path. Likewise, the Transponder Diplexer Channel frequency response requirements ensure adequate passband bandwidth around the 1030 MHz and 1090 MHz frequencies to ensure that the required interrogation and reply signal integrity is maintained through the SSR Transponder, Diplexer and antenna path. The Diplexer characteristics must ensure that performance of both the UAT and SSR Transponder systems is equivalent to their performance without the Diplexer. An attenuation of up to 0.5 dB through the Diplexer is acceptable. A delay within the Diplexer of up to 30 nanoseconds for the SSR signals through the Diplexer is also acceptable. The insertion loss and delay characteristics of the Diplexer must be taken into consideration when determining the overall cable loss and cable delay budgets between the UAT unit and antenna as well as between the SSR Transponder and the antenna. The use of the Diplexer does not preclude the UAT from driving the suppression bus during UAT transmissions. Diplexer installations must include connection to and use of the suppression bus driven by the UAT and received by the SSR Transponder and any cosite DME equipment. Installations that incorporate the Diplexer must ensure that the off
ACP-WGW01/AI-1Appendix D

28
© 2005
frequency power seen by the front end of the UAT equipment and the SSR Mode A/C/S transponders through the Diplexer are within the design characteristics of each unit to ensure proper operation. The UAT installation needs to consider the power seen at the input of the UAT receiver from the SSR Transponder, and it should be verified that the SSR Transponder as installed can handle the UAT power through the isolation provided by the Diplexer.
5.3.1.1 The UAT Diplexer Channel
The Diplexer includes a UAT Channel that conveys UAT signals without distortion of the waveform. The UAT Diplexer Channel conveys UAT Basic, Long and Ground Uplink Messages while maintaining the modulation accuracy of the input UAT signals as specified in §12.4.3 in the UAT SARPs, and produce no more than 0.5 dB amplitude additional attenuation (to be included in the 3 dB assumed for cable losses) and no more than 30 nanoseconds in propagation delay within the Diplexer. Additionally, the variation in delay is no more than 10 nanoseconds over the frequency band of 977 MHz to 979 MHz. The UAT Diplexer Channel provides a passband beginning at or below 977 MHz and ending at or above 979 MHz (2.0 MHz minimum) with a maximum attenuation of 0.5 dB. The minimum and maximum attenuation in the passband are different by no greater than 0.20 dB. The UAT port of the Diplexer needs to be capable of peak power transmissions according to the appropriate aircraft equipage class given by Table 2-1 and Table 2-2. The VSWR produced by the Diplexer at the UAT port of the Diplexer, when the other two ports are terminated in a 50 ohm load, does not exceed 1.3:1 for frequencies between 977 MHz and 979 MHz.
5.3.1.2 The Transponder Diplexer Channel
The Diplexer includes a Transponder Diplexer Channel that conveys 1030 MHz and 1090 MHz signals without distortion of the waveform. The Transponder Diplexer Channel conveys pulses that are amplitude modulated on either 1030 MHz or 1090 MHz and having rise and fall times of 50 nanoseconds or more and produce no more than 0.5 dB additional amplitude attenuation and no more than 10 nanoseconds delay within the Diplexer while retaining the pulse rise and fall times and pulse width of the input pulses. Additionally, the variation in delay over the frequency band of 1015 MHz to 1105 MHz is no more than 5 nanoseconds. The Transponder Diplexer Channel provides a passband from no greater than 1015 MHz to no less than 1105 MHz (90 MHz minimum) and a maximum attenuation of 0.5 dB. The minimum and maximum attenuation in the passband are different by no greater than 0.20 dB (within the 0.5 dB maximum attenuation). The Transponder port is capable of handling 1000 Watts instantaneous power. The VSWR produced by the Diplexer at the Transponder port, when the other two ports are terminated in a 50 ohm load, does not exceed 1.3:1 for frequencies within the passband. If required by the transponder installation, the Diplexer supports DC coupling from the Transponder port to the antenna port as required by the electrical characteristics of the installed equipment.
ACP-WGW01/AI-1Appendix D

29
© 2005
5.3.1.3 UAT Diplexer Channel to Transponder Diplexer Channel Isolation
The Diplexer provides RF isolation between the UAT Diplexer Channel and the Transponder Diplexer Channel. The Diplexer provides a minimum of 50 dB of isolation between these ports at 1090 MHz. Additionally, the Diplexer provides a minimum isolation of 30 dB between the UAT and Transponder ports of the Diplexer at 1030 MHz. The Diplexer provides a minimum of 20 dB of isolation between the ports at 978 MHz.
Note: Installations that incorporate the Diplexer must ensure that the SSR reply power seen by the front end of the UAT Receiver and the UAT transmission power seen by the front end of the SSR Mode A/C/S receiver through the Diplexer are within the design tolerances of each unit to ensure proper operation. It has been determined that the isolations provided above should in general ensure safe operation for most transponders with respect to off frequency effects. This determination should be verified for a specific aircraft installation.
5.4 Compatibility with SSR when UAT and SSR are Using Separate Antennas
This compatibility is assured by the UAT equipment providing suppression pulses as provided by section 5.2 of the Manual on the UAT Detailed Technical Specifications, and the supporting analysis shown in section 5.3 above.
5.5 Compatibility with Future GNSS Operating in the Band 1164 MHz to 1215 MHz
The Band 1164 MHz to 1215 MHz is planned to be used for a future GNSS. An assessment of radio frequency interference relevant to the GNSS L5/E5A frequency band was undertaken in RTCA. This study assessed the combined pulsed interference impact from all on-board sources including UAT. The study noted the frequency separation and low duty factor of UAT relative to other on-board systems, and concluded that the combined effects from all sources would not cause interference to L5/E5A. Information on the compatibility of UAT and L5/E5A GNSS operation is provided in RTCA/DO-292, “Assessment of Radio Frequency Interference Relevant to the GNSS L5/E5A Frequency Band.”
5.6 UAT Interface to GPS/GNSS Receiver
UAT Aircraft equipment must be interfaced to a GPS/GNSS receiver in order to obtain Position, Velocity and Time information. One component is a 1 pulse per second Time Mark. Position, Velocity and Timing information are provided over a data interface. Timing information provided over the data interface could include the offset of the Time Mark relative to the 1.0 second UTC epoch (if any) and time of day. Figure 5-2 shows the interfaces and timing requirements related to these interfaces.
ACP-WGW01/AI-1Appendix D

30
© 2005
Figure 5-2: UAT Interface to GPS/GNSS Receiver
Notes:
1. 1 Pulse Per Second leading edge should be within ±1 msec of the 1.0 second UTC epoch.
2. Position and Velocity data provided by the GPS/GNSS receiver should be applicable to within ±5 msec of the 1 Pulse Per Second Time Mark.
3. Position, Velocity and Time data should be available to the UAT Aircraft equipment within 200 msec of the leading edge of the 1 Pulse Per Second Time Mark.
5.7 Surveillance Integrity Level (“SIL”) Field Value
Since the Surveillance Integrity Level (SIL) is intended to reflect the integrity of the navigation source of the position information broadcast, the SIL value transmitted should be indicative of the true integrity of the ADS-B position data. A problem for installations that include currently available GNSS receivers and FMS systems is that SIL is not output by these systems. With the lack of SIL information being provided by the navigation source, implementers should not arbitrarily set a SIL value of zero indicating unknown integrity. It is suggested, unless there is a tightly coupled navigation source where SIL can be unambiguously determined, that the ADS-B Transmitting Subsystem provision for the static setting of SIL as part of the installation procedure. The value for SIL is determined by the integrity level of the navigation sources that would be used by the ADS-B Transmitting Subsystem.
ACP-WGW01/AI-1Appendix D

31
© 2005
6 UAT Ground Infrastructure
This section describes the working concept for a UAT ground infrastructure and clarifies the provisions made to support the ground infrastructure.
6.1 General Description
The role of the UAT ground infrastructure is three fold:
1. To receive UAT ADS-B Messages from aircraft and generate a summary of the UAT-equipped air traffic in a given area, possibly fusing UAT ADS-B data with other surveillance data (e.g. radar or multilateration systems).
2. To transmit in the UAT Ground segment flight service information, e.g. weather, NOTAMS, to aircraft for use in the cockpit.
3. To transmit in the UAT ADS-B segment TIS-B Messages.
There is considerable flexibility for the deployment and functionality of the ground infrastructure. The receive and transmit functions may be physically separate and even have different providers, or they could be a single ground network of transceivers feeding an integrated system providing all the above functions. This will probably be decided more by economics and regulations than by engineering design. This section describes the key elements of the UAT Ground Infrastructure at a functional level.
6.1.1 Ground Broadcast
6.1.1.1 Geometric Service Volumes
Because of the limited range and geometry of a single Ground Station, a network of ground broadcast transmitting stations will be required to provide service over a large area. The service volume of a Ground Station is the geographic scope of responsibility the Ground Station assumes for each product broadcast.
The UAT system uses time division multiplexing for Ground Uplink Messages to allow multiple Ground Stations to operate on the same frequency. At the designer's disposal are the 32 time slots within the Ground Segment of the UAT frame. Since time slots must be re-used geographically, there is a potential for self-interference where radio coverage is greater than the designed minimum. The allocation of one or more time slot resources to a given Ground Station based on some re-use pattern will mitigate this self-interference.
ACP-WGW01/AI-1Appendix D

32
© 2005
As an example of assigning service volumes, a hexagonal “cellular” pattern of Ground Stations with a nominal intersite spacing of 100 NM would assure single coverage everywhere down to about 3000 feet above ground level (AGL). (This is based on a 4/3 earth refraction model, a nominal antenna height of 50 feet, and ignores terrain effects.) This intersite spacing would require each Ground Station to have a service volume of radius of about 58 NM. A longer range may be specified if additional overlapping coverage is desired. A nominal coverage cell layout is shown in Figure 6-1. In this example case, the service volume has a radius of 58 NM. As discussed below different uplink products broadcast by a Ground Station may cover different geographical areas, called product coverages, than the Service Volume of that Ground Station.
Weather radar information for shaded area broadcast within Service Volume depicted
Service Volume for a single Ground Station
100 NM
Figure 6-1: Example Coverage Cell Layout
6.1.1.1.1 FIS-B Product Coverage
The FIS-B product coverage and update rate can be tailored to suit the characteristics of the particular FIS-B information being broadcast. For example, information that is relatively small in terms of total data volume and that is updated infrequently such as Automated Terminal Information Service (ATIS) messages could have a relatively large product coverage (e.g., a circle of diameter 500 NM) and a relatively low update rate. The FIS-B product coverage of, e.g. a weather map, could exceed the service volume of a single Ground Station.
If an aircraft receives FIS-B uplinks from multiple UAT Ground Stations, it may combine these data. This task can be minimized by having the ground infrastructure assure that product information from different Ground Stations for the same geographical location is identical. For example, adjacent uplink stations reporting precipitation strength for a given point or grid element should report exactly the same data. Then the application in the aircraft need only associate the reports and choose either for displaying or processing (rather than averaging, interpolating, or inferring data integrity). Note that with autonomous, isolated Ground Stations this is not an issue.
ACP-WGW01/AI-1Appendix D

33
© 2005
Looking back at Figure 6-1, a sample product coverage is shown along with the service volume for a single cell. For this product coverage, there is a consistent picture of the product as the aircraft flies through the lightly shaded region depicted.
6.1.1.1.2 TIS-B Product Coverage
A product such as traffic data (TIS-B) calls for a higher update rate than FIS-B, which results in a smaller product coverage area to keep UAT data link uplink requirements at a reasonable level. TIS-B product coverage overlap between adjacent Ground Stations should be just enough to assure service continuity across the boundary. This approach keeps the load on the data link as low as possible and minimizes the burden on the ADS-B Receiving Subsystems to eliminate redundant reports.
6.1.1.2 Data Source for Ground Broadcast
Contents of the ground broadcast messages can be put in the following categories:
1. Flight Information Services-Broadcast (FIS-B) – the broadcast distribution of weather and aeronautical information.
2. Traffic information from other surveillance sources (radar, multilateration) – this augments the ADS-B data received directly from the air-air link.
3. ADS-B data collected from non-UAT ADS-B sources.
4. Other.
In the UAT data link, FIS-B and “other” information is sent during the Ground segment of the UAT frame. TIS-B data can be broadcast during the UAT ADS-B segment of the UAT frame in an ADS-B Message format.
There are many possible configurations for the flow of information for UAT Ground Station. Not all stations need to be configured the same way. The configuration chosen will depend on the products being provided. In any case, a single UAT Ground Station is one part of the overall ground infrastructure, which will be primarily defined by the communication links between ground stations (land line (phone, fiber) or RF links such as satellite, microwave or other), by the data sources (radar, multilateration, weather observation and forecast), and by the applications that fuse this data and generate the UAT Ground Uplink Messages (FIS-B) and TIS-B Messages.
6.1.2 Ground Surveillance of UAT-equipped Aircraft and Vehicles
UAT ADS-B Messages being transmitted by aircraft, and surface vehicles, will be received (in general) at multiple UAT Ground Stations. This redundancy is readily fused since all stations are receiving the same message contents. Because of the required frame synchronization of all UAT transmitters and receivers, there is ample accuracy in the time-of-arrival stamp on each message to readily associate them and merge them. No averaging or weighting need be done on the contents as they are all the same.
ACP-WGW01/AI-1Appendix D

34
© 2005
6.1.3 Summary of Infrastructure and Implications
Figure 6-2 shows a generalized diagram of the components and interconnnect of a ground infrastructure for the UAT data link. Many variations of this general structure are possible. Transmitters and receivers may or may not be co-located. Different sites may have different levels of service.
A considerable transition time period to full ADS-B equipage will need to be supported, and the UAT data link has the necessary flexibility to provide such support. Because of the generality of the data link, the system can be expanded as the ground infrastructure is developed and “filled in.” The UAT Ground Station is adapted to each specific deployment by the application(s) driving it.
The characteristics of the UAT data link required to support this general structure are in the areas of time stamps and predictable latency, one second frame synchronization, time division coordination of adjacent ground cells, and a waveform tolerant of self-interference.
ACP-WGW01/AI-1Appendix D

35
© 2005
UAT RECEIVERUAT RECEIVER
UAT RECEIVERUAT RECEIVER
UAT RECEIVERUAT RECEIVER
UAT RECEIVERUAT TRANSMITTER
RECEIVENETWORK
TRANSMITNETWORK
SENSOR INTEGRATIONAS REQUIRED
PRODUCTINTEGRATION
TOAIRCRAFT
TO ENDUSERS
PRODUCTS e.g.FIS AND TIS
FROMAIRCRAFT
Figure 6-2: General Form of Ground Infrastructure
6.2 Ground Station Deployment
6.2.1 Time Slots and “Data Channels”
The UAT data link has 32 uplink time slots available within the Ground Segment of the UAT frame. As described in §3.2.2 of the Manual on the UAT Detailed Technical Specifications, this results in 32 data channels, where each data channel represents the incremental resource that can be assigned to Ground Station transmitters so they can operate without mutual interference. That is, a “Data Channel” is a time slot sized resource assignable to a Ground Station where the actual time slot used shifts on a continual basis per a defined time slot rotation scheme. One or more Data Channels may be assigned to any given UAT Ground Station.
ACP-WGW01/AI-1Appendix D

36
© 2005
One or more Data Channels assigned to a UAT Ground Station is the station’s “Data Channel Block” (DCB). A conservative approach to forming DCBs is to give one data channel to each Ground Station. In a hexagonal deployment using this conservative approach, the nearest station using the same Data Channel as a given station will on average be about 6 cell diameters away.
In practice, it will be desirable for each DCB to contain multiple Data Channels. This will allow the uplink bandwidth necessary for each Ground Station to deliver its entire product. An assignment of Data Channels to one of 7 distinct DCBs (A – G) will meet this objective by allowing cells that re-use a given DCB to be separated by about 2.5 cell diameters as shown in Figure 6-3 below.
Figure 6-3: 7-Data Channel Block Re-Use Pattern
Note: The Data Channel Block re-use pattern of Figure 6-3 is provided for illustrative purposes and is suitable for providing services within a limited altitude range. A possible approach that covers a wide range of altitudes is discussed in Appendix J.
6.2.2 TIS-B Site Identifier (ID)
Each station is assigned a TIS-B Site ID number (Manual on the UAT Detailed Technical Specifications, §2.2.1.8). This number is not unique, having only a 4-bit value. The
ACP-WGW01/AI-1Appendix D

37
© 2005
purpose of the ID is to give a short (few bits) way of identifying the source of a TIS-B uplink message. This source identification is useful for confidence measures of time synchronization and to counteract spoofing. In low-density areas, as well as in the approach to Data Channel Block assignment given in Appendix J with a unique TIS-B Site ID assigned to each Data Channel Block, only one station with a given TIS-B Site ID will be within reception range. In the event that more than one Ground Station can be received (but not a large number) with the same TIS-B Site ID, range checking can be performed, using uplinked UAT Ground Station locations to remove any ambiguity in TIS-B information. The remainder of this section discusses this latter event.
As an example, consider a 7-cell reuse pattern of Data Channels. Figure 6-4 shows an assignment of 7 Data Channel Blocks (labeled A through G) and of the 15 TIS-B Site ID numbers (labeled 1 through 15). To see the repeat pattern in this example, look at a cell with Data Channel Block label “G” as the center of a 7-cell cluster. A through F are clockwise around it. These clusters are then packed hexagonally. This is just an illustrative example to demonstrate the idea.
The approximate reception area of an aircraft is shaded in Figure 6-4. The aircraft’s trajectory is shown by the arrowed line and the swath of the reception area is shown by the dotted lines. During the UAT Ground segment, the aircraft is solidly receiving data from UAT Ground Stations using Data Channel Blocks A, B, D, and E (these Ground Stations are labeled A9, B14, D10, and E5 in Figure 6-4). The aircraft can tell that these UAT Ground Stations are within a normal reception range based on the UAT Ground Station location broadcast in each UAT Ground Uplink Message.
Table 6-1 shows a list of these locations and TIS-B Site ID’s as they can be kept in the aircraft’s ADS-B application. Entries can be dropped from the table when they are beyond range by some pre-determined amount. At the time shown, there are also two entries in the table with TIS-B Site ID 4 as well as two entries with TIS-B Site ID 8. Note that the Data Channel Block indicator (labeled A-G) in the table is for clarity of the example only.
ACP-WGW01/AI-1Appendix D

38
© 2005
Current radio reception
F15
B14
G 13
C6
D5
A4
E 12
C11
D10
A9
G1
E2
F 8
B7
G6
E5
F12
C 4
D3
A2
F1
B15
G8
E3
C2
F10
B9
D 1
C13
D12
A7 E
14F
6
A2
F1
B15
G11
Path of aircraft
Figure 6-4: Example of TIS-B Site ID and Data Channel Block
Table 6-1: Example of TIS-B Site ID Table
TIS-B Site ID Location Data Channel
Block 9 lat long A
14 lat long B 4 lat long C
10 lat long D 5 lat long E
13 lat long G 6 lat long G 8 lat long F
15 lat long F 11 lat long C 2 lat long E 4 lat long A 8 lat long G
Each of these UAT Ground Stations also transmits TIS-B Messages in the ADS-B segment of the UAT frame. Since UAT Ground Stations transmit TIS-B Messages in random MSO’s, the messages can all be received with high probability. Since each TIS-B Message contains the TIS-B Site ID (0-15) of the UAT Ground Station that transmitted the message, an ADS-B application in the UAT-equipped aircraft can validate the received TIS-B Message using the aircraft’s known position, the location of the UAT Ground Station that transmitted the message, and time-of-arrival techniques.
ACP-WGW01/AI-1Appendix D

39
© 2005
It is possible that a legitimate TIS-B Message can be rejected from a distant station based on this method, if the station is not on the list. This is not a problem because if the target is important to the aircraft it will be included in the TIS-B Messages transmitted by a nearer station, giving good range validation checks. This can be assured by the design of the product coverage for each cell.
6.2.3 Sectorized Cells and Co-Site Transmission Isolation
In some areas of dense air traffic, a UAT Ground Station’s range for reception of ADS-B Messages from aircraft can be limited by UAT self-interference (see, for example, Figure B-30 in Appendix B which presumes that the UAT Ground Station has an omni-directional receive antenna). In this event, satisfactory air-to-ground reception can be achieved by the installation of additional UAT Ground Stations. An alternative solution to this problem is to implement the UAT Ground Station with a sectorized antenna.
In cases where UAT ground equipment is co-located with other transmitting equipment at a nearby frequency (e.g. a DME/TACAN installation at 979 MHz,) it is desirable to get as much rejection of that DME/TACAN interfering signal as possible. In these cases, the same sectorized antenna mentioned above can also help. Section 6.3 discusses the required signal rejection in cases of DME/TACAN interference.
Figure 6-5 shows an antenna radiation pattern for a 3-sector UAT Ground Station antenna. The solid curve is one sector and the dashed curves are the other two sectors. This pattern is representative of a DME-type column antenna with a reflector behind it to shape the pattern and block the backlobe.
Figure 6-5: Sectorized Antenna Pattern (3 sectors)
Figure 6-6 shows two possible geometries that will produce isolation between co-sited DME equipment and UAT equipment. The required isolation will depend on the power of the DME equipment and the tolerable maximum signal level of the interference at the UAT equipment. Sections B.4.1 and B.4.2 in Appendix B discuss performance with various scenarios of DME/TACAN interference. In a future Core Europe high air traffic density scenario, for example, the tolerable DME interference signal level (measured at
ACP-WGW01/AI-1Appendix D

40
© 2005
979 MHz) from a DME operating at 979 MHz is -30 dBm at the PMP corresponding to a sector of the antenna. This is discussed further in §7.2.
Side view
Top view
UAT sector antenna (3)
DME antennaUAT sector antenna (3)
DME antenna
Top view
UAT sector antenna (3)
DME antennaIsolation radius
(a) (b)
Figure 6-6: Possible UAT Ground Station Antenna Geometries
6.3 RF Interference
There are two primary sources of RF interference from other systems at the UAT operational frequency of 978 MHz: DME/TACAN and JTIDS/MIDS. There has been a considerable amount of analysis, simulation, and laboratory measurement to determine the working limitations of UAT with these other two systems developed. Most of the limitations are as a result from DME usage and are discussed below.
6.3.1 DME/TACAN Interference
An important potential interference factor to the UAT data link operating at 978 MHz is DME/TACAN transponders operating on adjacent frequencies. The DME channel (frequency) allotment table (Annex 10, Volume I, Chapter 3) identifies 977 MHz and 979 MHz as the closest assignable DME/TACAN transponder transmitting frequencies relative to the UAT frequency of 978 MHz.
Siting criteria for UAT Ground Stations in the presence of DME/TACAN transponders operating at 979 MHz and above, are contained in Section 7.2.
There are a number of techniques that may be used to mitigate the effect of high DME/TACAN signal levels on a collocated UAT Ground Station Receiver. If the UAT Ground Station is using sectorized antennas (Section 6.2.4) a 25 dB attenuation of the DME/TACAN signal may be achieved by locating the DME/TACAN antenna in the UAT antenna backlobe. Vertical stacking of the antennas may yield even more isolation. The UAT air-to-ground performance is ultimately a function of the DME/TACAN interfering signal level.
ACP-WGW01/AI-1Appendix D

41
© 2005
An alternative technique to achieve the necessary isolation is the use of a very sharp (e.g. tuned cavity) filter on the UAT Ground Station. The approach would be to find a filter for the UAT receiver with acceptable in-band loss for the desired sensitivity to be achieved and then use the 979 MHz rejection of the filter to ease the burden on the antenna separation. A representative filter will give less than 5 dB of in-band (insertion) loss while rejecting the out-of-band (979 MHz) interference by 40 dB. This net benefit of 35 dB is available if the insertion loss will not reduce the intended service range of the UAT Ground Station.
In environments where the co-located DME/TACAN transponder is at 980 MHz (or higher frequencies) instead of 979 MHz, the above isolation techniques are not likely to be necessary, provided that the DME/TACAN transponder and UAT Ground Station are separated as recommended in Section 7.2.
6.3.2 JTIDS/MIDS Interference
The mutual effects of JTIDS/MIDS and UAT are discussed in Appendix D. In short, between the spread spectrum nature of JTIDS/MIDS and the interference rejection of the UAT modulation, the systems operate compatibly.
6.4 Multiple ADS-B Links
ADS-B in high air-traffic density airspaces may use multiple ADS-B data links. Through its support of ADS-B re-broadcast, the UAT data link is capable of supporting a multi-link deployment. This allows information on any non-UAT ADS-B traffic to be obtained by the ground infrastructure and supplied to UAT-equipped aircraft.
ACP-WGW01/AI-1Appendix D

42
© 2005
7 UAT Frequency Planning Criteria
As previously discussed, the UAT frequency is centered at 978 MHz with a necessary bandwidth of 1.3 MHz. UAT/DME frequency planning criteria to support future high air traffic density environments will specify that the closest assignable DME Ground Station transmitting frequencies relative to the UAT frequency of 978 MHz are the first adjacent DME frequencies.
7.1 Use of 978 MHz for DME/TACAN
Co-frequency operation of UAT and DME/TACAN is not recommended. Test, simulation and analysis have shown that UAT and co-frequency DME could be operated on a compatible basis when both the number of DME stations in view to UAT aircraft receivers is limited, and the density of UAT transmitters is low. Further analysis would be required to establish appropriate parameters for co-frequency operation. It should be noted however that the use of 978 MHz for DME ramp test equipment can still be supported, as the characteristics of the operational interaction scenario for UAT-to-ramp tester serves to preclude interference.
7.2 DME/TACAN to UAT Ground Station Siting Criteria
Extensive testing has indicated no operationally significant impact to DME/TACAN in a high density UAT environment when DME/TACANs are receiving on the first upper adjacent DME frequency (979 MHz) to the UAT frequency (978 MHz). A similar result can be inferred for DME reception at the lower first adjacent frequency of 977 MHz. Analysis of an example approach/landing scenario in Core Europe 2015 has shown that first adjacent frequency DME operation is also compatible with an environment that includes a nearby UAT Ground Station broadcasting at a high duty factor.
Any limitations on the siting of UAT Ground Stations vis-à-vis DME/TACANs are likely to result from the effects of DME/TACAN transmissions on UAT performance. This question has been studied by examining UAT performance with a first upper adjacent frequency DME/TACAN Ground Station co-located with a UAT Ground Station receiver at a high density airport. Air-air, ground-air, air-to-ground, and surface-surface performance were studied. The result of the combined analysis of these cases is a recommendation that a sufficient level of isolation be provided between a DME/TACAN transmit antenna and a UAT receiver on the surface. This could be supplied through either separation by distance or some other means, and the amount of isolation required depends on the parameters of the DME/TACAN and the design of the UAT receive system.
For example, to provide a performance level sufficient to allow for the air-to-ground reception requirement to be met to 150 NM for Class A0-equipped aircraft in high density Core Europe 2015 in the presence of a co-located DME/TACAN, Table 7-1 and Table 7-2 show the trade-off between distance from the UAT ground receiver and EIRP for a 979 MHz DME/TACAN. The analysis is based upon a maximum DME/TACAN signal level, measured at 979 MHz, of -50 dBm at the PMP of the UAT Ground Receiver, assuming an omni-directional UAT receive antenna. For further assumptions used in this analysis, see Appendix B.
ACP-WGW01/AI-1Appendix D

43
© 2005
Table 7-1: Maximum Power of a 979 MHz DME/TACAN for a given Separation Distance to a UAT Ground Station Receiver
For a DME/TACAN-
UAT Distance of:
Maximum DME/TACAN EIRP (W)
2 NM 10,000 1 NM 2,500
0.5 NM 625 0.25 NM 157
Table 7-2: Minimum Distance of a UAT Ground Station Receiver to a 979 MHz DME/TACAN
For a DME/TACAN EIRP (W) of:
Minimum Distance
10,000 2 NM 5,000 1.4 NM 1,000 0.63 NM 500 2700 ft.
For DME/TACAN transponders operating at frequencies between 980 MHz and 1213 MHz, the distance between the UAT Ground Receiver and a DME/TACAN transponder should be such that the power of the DME/TACAN transmission received by the UAT Ground Receiver is less than -30 dBm at the PMP. This provides for air-to-ground reception which supports surveillance up to 150 NM for all aircraft transmit power levels.
Note: This statement is based on analysis performed for a high density Core Europe 2015 air traffic scenario (as described in Appendix B), with a UAT Ground Station receiving signals from 980-1213 MHz DME/TACAN transponders.
ACP-WGW01/AI-1Appendix D

44
© 2005
8 Guidance on UAT Spurious Emissions
8.1 ITU Regulations
The ITU Radio Regulations require that the bandwidths of emissions be such as to ensure the most efficient utilization of the radio spectrum. In general this requires that bandwidths be kept at the lowest values which the state of the art and the nature of the radio service permit. Emission outside the necessary bandwidth is called the unwanted emission and consists of out-of-band and spurious emissions. Out of band emissions are the main component of the unwanted emissions close to the fundamental emission, and the spurious emissions become dominant further from the fundamental emission. The out-of-band and spurious domains are characterized by the type of unwanted emissions which are predominant, the boundary between the domains is determined is generally 2.5 times the necessary bandwidth, but with certain exceptions. Guidance on these exceptions is given in Recommendation ITU–R SM.1439.
ITU Radio Regulations contain the following definitions:
1.144 Out-of-band emission: Emission on a frequency or frequencies immediately outside the necessary bandwidth which results from the modulation process, but excluding spurious emissions.
1.145 Spurious emission: Emission on a frequency or frequencies which are outside the necessary bandwidth and the level of which may be reduced without affecting the corresponding transmission of information. Spurious emissions include harmonic emissions, parasitic emissions, intermodulation products and frequency conversion products but exclude out-of-band emissions.
1.146 Unwanted emissions: Consist of spurious emissions and out-of-band emissions. (Note: Both out-of-band and spurious emissions occur outside the necessary bandwidth of an emission).
1.152 Necessary bandwidth: For a given class of emission, the width of the frequency band which is just sufficient to ensure the transmission of information at the rate and the quality required under specified conditions.
Figure 8-1 provides a pictorial representation of the above terms.
ACP-WGW01/AI-1Appendix D

45
© 2005
Figure 8-1: Unwanted Emissions and Necessary Bandwidth
Attenuation values used to calculate maximum permitted spurious domain emission power levels for use with radio services are defined in the ITU Radio Regulations, Appendix 3, Section II as well as the Recommendation ITU-R SM.329-9 for transmitters installed after 1 January 2003 and all transmitters after 1 January 2012.
The spurious emission levels are specified in the following reference bandwidths:
– 1 kHz between 9 kHz and 150 kHz
– 10 kHz between 150 kHz and 30 MHz
– 100 kHz between 30 MHz and 1 GHz
– 1 MHz above 1 GHz.
A UAT transmitter installed after 1 January 2003 must meet a spurious domain emission attenuation of 43 + 10 log (P), or 70 dBc, whichever is less stringent (where P is the mean power in Watts supplied to the antenna transmission line).
Recommendation ITU-R SM.329-9 also provides guidelines on the frequency range within which unwanted emissions need to be measured. For transmitted frequencies between 600 MHz and 5.2 GHz, the lower measurement limit should be 30 MHz and the upper limit is (including) the 5th harmonic.
8.2 Example Application of the ITU Regulation to the UAT Case
Information received from the ITU indicates that the two main functions of the UAT system (ADS-B and Ground Uplink) belong to different radio services. The ADS-B part of UAT is considered as an Aeronautical Radionavigation Service (ARNS) whereas the UAT Ground Uplink part needs to be treated as an Aeronautical Mobile (R) Service.
ACP-WGW01/AI-1Appendix D

46
© 2005
With a maximum total mean power of 500 W1 supplied by a UAT transmitter to the antenna transmission line, the attenuation relative to the total mean power equals 43 + 10 log (500) = 70 dBc. Therefore, the spurious emissions supplied by a UAT transmitter to the antenna transmission line of maximum power UAT transmitters must not exceed 57 dBm – 70 dBc = -13 dBm. That spurious emission level is to be measured with a 100 kHz reference bandwidth for spurious emissions in the frequency range 30 – 1000 MHz and with a 1 MHz reference bandwidth for spurious emissions at frequencies above 1000 MHz.
In the case of UAT, a necessary bandwidth of 1.3 MHz (equal to the measured occupied – i.e., 99% power -- bandwidth) has been determined. Therefore the boundary between spurious and out-of-band emissions is set to 2.5 * 1.3 MHz = 3.25 MHz. With a UAT carrier frequency of 978 MHz, the spurious emission domain is located at frequencies below 974.75 MHz and above 981.25 MHz.
The requirements for the spurious domain for UAT cover the frequency band 30 MHz to 5*978=4890 MHz excluding the fundamental emission and the out-of band domain (974.75 MHz to 981.25 MHz).
The UAT SARPs, §12.1.2.3.3 "Transmit Mask" states: "The spectrum of a UAT message transmission modulated with pseudorandom payload data shall fall within the limits specified in Table 2 when measured in a 100 KHz bandwidth." At frequencies off-tuned by 3.25 MHz (where the spurious domain starts), UAT signal components should be attenuated by at least 60 dB compared to the UAT signal at 978 MHz (measured in a 100 KHz bandwidth). Therefore, Figure 1 of the UAT SARPs has to be interpreted for a maximum power UAT transmitter as if that maximum power at 978 MHz (i.e., 57 dBm measured in a 1.3 MHz bandwidth) equals approximately 47 dBm per 100 KHz. At 3.25 MHz offset, the mask requires the emission to be 60 dB less (i.e. -13 dBm per 100 KHz). Hence, the transmit mask of the UAT SARPs is consistent with the spurious emissions requirements of the ITU Radio Regulations even for the maximum UAT transmit power levels. It is important to note that the mask is more conservative than the ITU spurious emission requirements for lower UAT transmit power levels2.
8.3 Conclusion
The transmit mask in the UAT SARPs will ensure that the ITU spurious emission requirements are met at the out-of-band/spurious emission boundary.
Spurious emissions should be measured in a reference bandwidth of 100 KHz in the frequency band 30 MHz to 974.75 MHz and 981.25 to 1 GHz, and in a reference bandwidth of 1 MHz in the frequency band of 1 GHz to 4.890 GHz.
1 The UAT SARPs specify a maximum power of 54 dBm at the PMP. Assuming a 3 dB feeder line loss, the maximum UAT transmitter output power will be 57 dBm (500 W). 2 For example, in the case of a 50 watt UAT, the spurious emission limit is 43 + 10log(50) = 60 dBc, or 47 dBm – 60 dB = -13 dBm. The mask however requires the emission at the out-of-band/spurious boundary to be 60 dB down from approximately 37 dBm (i.e., the portion of the 50 watt 1.3 MHz UAT emission that is measured in a 100 kHz measurement bandwidth) or –23 dBm.
ACP-WGW01/AI-1Appendix D

47
© 2005
9 Potential Future Services of UAT
Some potential future services for UAT-equipped aircraft are described in this section. The services identified here support position determination of UAT-equipped aircraft based on Time of Message Reception (TOMR) of UAT signals. The services are listed below:
1. Range validation of ADS-B reported position data, based on the one way propagation time of the ADS-B Message. This function can be performed by a single receiving station and relies on both the transmitter and receiver having access to precise timing information (referred to as being in the “UTC coupled” condition). This is useful mainly to attain some confidence the ADS-B transmission is from a bona fide user and is not a result of “spoofing.” Further information on this potential future service can be found in Appendix K.
2. Localization of a mobile (aircraft or surface vehicle) ADS-B transmitter from a fixed ground receiver network. This function requires reception of the ADS-B Message by at least 3 UAT Ground Stations. Each UAT Ground Station requires precise knowledge of time in order to provide the TOMR with each reception. The TOMR allows a central processor to localize the transmitter via the time-difference-of arrival technique. The mobile transmitter does not require knowledge of its own position nor does it require precise knowledge of time. This capability—coupled with the reported identification and barometric altitude—could provide backup air-to-ground surveillance in the event of widespread outage of GNSS, presuming that the Ground Station time source is independent of GNSS and accurate to within 500 nanoseconds of UTC.
3. Localization of the mobile (ownship) ADS-B receiver. This is based on reception of 3 or more UAT Ground Station transmissions within the same UTC second. Each UAT Ground Station transmission is based on precise knowledge of time. The ownship UAT receiver need not have precise knowledge of time, but determines position from the time-difference-of arrival technique and knowledge of the UAT Ground Station locations encoded in the received messages. This capability could provide a crude form of backup navigation in the event of widespread outage of GNSS, presuming that the UAT Ground Station time source is independent of GNSS and accurate to within 500 nanoseconds of UTC.
ACP-WGW01/AI-1Appendix D

48
© 2005
Table 9-1: Summary of Potential Future Applications of UAT
Potential Future UAT
Service
UAT Transmitting
Subsystem Requirements
UAT Receiving Subsystem
Requirements
Primary Application Limitations
Range Validation
Navigation input, UTC Coupled
Navigation input, UTC Coupled
Integrity check of ADS-B
Total timing errors limit
range accuracy to ~ 0.7 NM
(see Appendix E)
Backup Air-to-ground
Surveillance None UTC Coupled Surveillance
backup for GNSS
Service available only
in areas of significant
Ground Station infrastructure
Backup Navigation
UTC Coupled (stable source can operate without
GNSS for hours)
None Navigation backup for GNSS
Service available only
in areas of significant
Ground Station infrastructure
ACP-WGW01/AI-1Appendix D

Appendix A
Acronyms & Definition of Terms
Comparison Source – ICAO Document 9713, “International Civil Aviation Vocabulary”, Parts 1 and 2, Second Edition, 2001. NOTE:
• Reference in brackets [Xxxx] indicates ICAO subject field.
•
ACP-WGW01/AI-1Appendix D

This Page Intentionally Left Blank
ACP-WGW01/AI-1Appendix D

Appendix A Page A - 3
© 2005
A. Acronyms & Definition of Terms
A.1 Acronyms
ACAS – Airborne Collision Avoidance System [A284]
ADS-B - Automatic Dependent Surveillance-Broadcast [A729]
AGL - Above Ground Level
AMSL – Above Mean Sea Level
APDU – Application Protocol Data Unit
A/V - Aircraft/Vehicle
ATC - Air Traffic Control [A439]
ATCS - Air Traffic Control Services [A284]
ATIS - Automatic Terminal Information Service
CDTI - Cockpit Display of Traffic Information [C245]
dB – Decibel
dBm – Decibel with respect to 1 milliwatt
DC – Direct Current
DME - Distance Measuring Equipment [D185]
EPU - Estimated Position Uncertainty
E/W – East/West
ERP - Effective Radiated Power
FEC – Forward Error Correction [F205]
FIS-B - Flight Information Services-Broadcast
FMS - Flight Management System [F138]
ACP-WGW01/AI-1Appendix D

Appendix A Page A - 4
© 2005
f0 – Nominal or Center Frequency
GNSS - Global Navigation Satellite System [G56]
GPS - Global Positioning System [G60]
HFOM – Horizontal Figure of Merit
Hz - Hertz [H48]
ICAO - International Civil Aviation Organization [I234]
INS - Inertial Navigation System [I95]
JTIDS – Joint Tactical Information Distribution System (also known as Link 16 or MIDS)
kHz – Kilohertz
LSB - Least Significant Bit [L62]
MASPS - Minimum Aviation System Performance Standards
Mbps – Million Bits Per Second
MDB – Message Data Block
MDBS – Message Data Block Selection
MHz - Megahertz
MIDS – Multifunctional Information Distribution Systems (also known as Link 16 or JTIDS)
MOPS - Minimum Operational Performance Standards [M163]
MS - Mode Status
ACP-WGW01/AI-1Appendix D

Appendix A Page A - 5
© 2005
MSL - Mean Sea Level
MSO – Message Start Opportunity
NM - Nautical Mile [N14]
N/S – North/South
NACP - Navigation Accuracy Category - Position
NACV - Navigation Accuracy Category - Velocity
NICbaro - Navigation Integrity Category - Barometric
PMP - Power Measurement Point
PPM – Parts Per Million [P62]
PPS – Pulse Per Second
RA - Resolution Advisory [R216]
RC – Radius of Containment
RF - Radio Frequency
RNP - Required Navigation Performance [R192]
RS - Reed-Solomon Code [R110]
SA - Selective Availability [S111]
SARPs - Standards and Recommended Practices [S282]
SSR - Secondary Surveillance Radar [S81]
TA - Track Angle
TACAN - UHF Tactical Air Navigation Aid [U1]
TC - Trajectory Change
ACP-WGW01/AI-1Appendix D

Appendix A Page A - 6
© 2005
TIS-B - Traffic Information Service-Broadcast
TOMR - Time of Message Receipt
TOMT – Time of Message Transmission
TS – Target State
UAT – Universal Access Transceiver
US - United States
UTC - Co-ordinated Universal Time [C469]
VFOM – Vertical Figure of Merit
WGS-84 - World Geodetic System 1984
ACP-WGW01/AI-1Appendix D

Appendix A Page A - 7
© 2005
A.2 Definition of Terms
Accuracy - A degree of conformance between the estimated or measured value and the true value. Note. – For measured positional data the accuracy is normally expressed in terms of a distance from a stated position within which there is a defined confidence of the true position falling. [A41] With specific reference to UAT, a measure of the difference between the A/V position reported in the UAT ADS-B Message field as compared to the true position. Accuracy is usually defined in statistical terms of either 1) a mean (bias) and a variation about the mean as defined by the standard deviation (sigma) or a root mean square (rms) value from the mean. The values given in this document are in terms of the two-sigma variation from an assumed zero mean error.
ADS-B Broadcast and Receive Equipment - Equipment that can transmit and receive ADS-B messages. Defined as Class A equipment.
ADS-B Broadcast Only Equipment - Equipment that can transmit but not receive ADS-B messages. Defined as Class B equipment.
ADS-B Message – A modulated packet of formatted data which conveys information used in the development of ADS-B reports.
ADS-B Report – Specific information provided by the ADS-B user participant subsystem to external applications. Reports contain identification, state vector, and status/intent information. Elements of the ADS-B Report that are used and the frequency with which they must be updated will vary by application. The portions of an ADS-B Report that are provided will vary by the capabilities of the transmitting participant.
ADS-B Subsystem - The set of avionics or equipment that performs ADS-B functionality in an aircraft or for ground-based, non-aircraft, participants.
ADS-B System - A collection of ADS-B subsystems wherein ADS-B messages are broadcast and received by appropriately equipped participant subsystems. Capabilities of participant subsystems will vary based upon class of equipage.
Advisory - An annunciation that is generated when crew awareness is required and subsequent crew action may be required; the associated color is unique but not red or amber/yellow. (Source: Advisory Circular AC 25 - 11).
Aircraft Address - A unique combination of twenty-four bits available for assignment to an aircraft for the purpose of air-ground communications, navigation and surveillance. [A297] In the context of UAT, the term “address” is used to indicate the information field in a UAT ADS-B Message that identifies the ADS-B unit that issued the message. The address provides a continent means by which ADS-B receiving units—or end applications—can sort messages received from multiple issuing units.
Aircraft/Vehicle (A/V) - Either 1) a machine or service capable of atmospheric flight, or 2) a vehicle on the airport surface movement area. In addition to A/Vs, ADS-B equipage
ACP-WGW01/AI-1Appendix D

Appendix A Page A - 8
© 2005
may be extended to temporarily uncharted obstacles (i.e., obstacles not identified by a current NOTAM).
Applications - The ultimate use of an information system, as distinguished from the system itself. [A570] For the case of ADS-B, applications are defined in terms of specific operational scenarios.
Barometric Altitude - Geopotential altitude in the earth's atmosphere above mean standard sea level pressure datum surface, measured by a pressure (barometric) altimeter.
Barometric Altitude Error - For a given true barometric pressure, PO, the error is the difference between the transmitted pressure altitude and the altitude determined using a standard temperature and pressure model with PO.
Call Sign - The term “aircraft call sign” means the radiotelephony call sign assigned to an aircraft for voice communications purposes. (This term is sometimes used interchangeably with “flight identification” or “flight ID”). For general aviation aircraft, the aircraft call sign is normally its national registration number; for airline and commuter aircraft, it is usually comprised of the company name and flight number (and therefore not linked to a particular airframe); and for the military, it usually consists of numbers and code words with special significance for the operation being conducted.
Cockpit Display of Traffic Information (CDTI) - A generic avionics device on the flight deck that is capable of displaying the position information of nearby aircraft. It may also include ground reference points and navigation information to increase the AIRSAW. [C245] In the specific context of UAT, a function which provides the pilot/flight-crew with surveillance information about other aircraft, including their position. The information may be presented on a dedicated multi-function display (MFD), or be processed for presentation on existing cockpit flight displays. Traffic information for the CDTI function may be obtained from one or multiple sources (including ADS-B, ACAS, and TIS) and it may be used for a variety of purposes. Requirements for CDTI information will be based on intended use of the data (i.e., application).
Collision Avoidance - An unplanned maneuver to avoid a collision.
Conflict - Predicted covering of aircraft in space and time which constitutes a violation of a given separation minima. [C365] In the specific context of UAT, any situation involving two or more aircraft, or an aircraft and an airspace, or an aircraft and ground terrain, in which the applicable separation minima may be violated.
Conflict Management - Process of detecting and resolving conflicts.
Coordinated Time Scales – A time scale synchronised within stated limits to a reference time scale. Co-ordinated Universal Time (UTC) is the time scale maintained by Bureau International des Poids et Mesures (BIPM), and the International Earth Rotation Service (IERS), which forms the basis of a co-ordinated dissemination of standard frequencies
ACP-WGW01/AI-1Appendix D

Appendix A Page A - 9
© 2005
and time signal. It corresponds exactly in the rate with the International Atomic Time (TAI), but differs from it by an integer number of seconds.
Data Channel – In the context of UAT Ground Stations, a “Data Channel” is a time slot sized resource assignable to a Ground Station for the transmission of Ground Uplink Messages. The actual time slot used shifts on a continual basis per a defined time slot rotation scheme.
Data Channel Block (DCB) - The “Data Channel Block” of a UAT Ground Station is the fixed set of one or more Data Channels assigned to that UAT Ground Station.
Eye Diagram – The eye diagram of the transmitted UAT wave form can be constructed from a graph of frequency deviation versus time by overlaying multiple versions of the graph shifted by integral numbers of symbol (bit) periods. An example can be seen in Figure A-1. The timing of the points where the lines converge defines the “optimum sampling point.” Figure A-2 shows an eye pattern that has been partially closed.
Figure A-1: Ideal eye diagram
Figure A-2: Distorted eye diagram
Poorly defined optimum sampling point.
Well defined optimum sampling point.
ACP-WGW01/AI-1Appendix D

Appendix A Page A - 10
© 2005
Field - The elements of the UAT ADS-B Message Data Block. Most of these elements are enumerated in the ADS-B Minimum Aviation System Performance Standards (MASPS) document, RTCA Document DO-242A (e.g., Latitude, Longitude, Velocity, etc.).
Global Navigation Satellite System (GNSS) - A worldwide position and time determination system that includes one or more satellite constellations, aircraft receivers and system integrity monitoring, augmented as necessary to support the required navigation performance for the intended operation. [G56]
Global Positioning System (GPS) - The satellite navigation system operated by the United States. [G60]
Ground Uplink Message – A message containing 432 bytes of data transmitted only by UAT Ground Stations and only within the ground segment of the UAT frame.
Horizontal Figure of Merit (HFOM) - A 95% bound on the horizontal position error.
JTIDS – Joint Tactical Information Distribution System is a military command, control, and communications system operated by several States which is implemented on a frequency hopping basis on 51 frequencies between 969 MHz and 1206 MHz. This system is also called “Link 16.” A further implementation of this system’s waveform is known as “MIDS” (Multifunction Information Distribution System). This system is operated on a non-interfering basis with aeronautical radio navigation systems.
Latency - The latency of an ADS-B transmission is the time period from the time of applicability of the aircraft/vehicle position ADS-B report until the transmission of that ADS-B report is completed.
Message – The actual RF transmission on the UAT frequency. There are fundamentally two message types: UAT ADS-B Messages and UAT Ground Uplink Messages. (Also see ADS-B Message.)
Message Data Block (MDB) – The portion of the UAT ADS-B Message that carries data (user information) that will be consumed by application systems outside the UAT system.
ACP-WGW01/AI-1Appendix D

Appendix A Page A - 11
© 2005
Message Data Block Selection Cycle – A 16 second time interval during which each of up to 4 UAT ADS-B Message types is transmitted at least 4 times (in order to optimize the effect of antenna diversity).
Message Overhead – The portion of the message which supports the physical layer transfer of the data.
Message Reception and Decoding – The primary function of the Message Reception and Decoding function is to deliver all Successful Message Receptions to the Report Assembly Function.
Message Start Opportunity – Discrete times separated by 250 μsec which define the moments when messages can be transmitted. The MSO selected for each transmission changes each second as a result of a pseudorandom process.
Message Transmission Cycle – A period of 16 seconds in which each MTO appears four times in a pattern that ensures a proper mix of message types are distributed to both Top and Bottom antennas when diversity transmission is used.
Mode A/C/S – As referred to in this document, Mode A/C transponders are those that conform to the characteristics prescribed in ICAO Annex 10, Volume IV, paragraph 3.1.1. Mode S transponders are those that conform to the characteristics prescribed in ICAO Annex 10, Volume IV, paragraph 3.1.2. The functional capabilities of Mode A/C transponders are an integral part of those of Mode S transponders.
Optimum Sampling Point – The point during the bit period at which the opening of the eye diagram (i.e., the minimum separation between positive and negative frequency offsets at very high signal–to-noise ratios) is maximized.
Power Measurement Point (PMP) – A cable connects the antenna to the UAT equipment. The PMP is the end of that cable that attaches to the antenna. All power measurements are considered as being made at the PMP unless otherwise specified. The cable connecting the UAT equipment to the antenna is assumed to have 3 dB of loss.
Product Coverage – The geographical area covered by the information contained in a UAT Ground Uplink Message that conveys FIS-B information. This geographical area may be larger or smaller than the service volume of the Ground Station. It also includes the geographical area covered by the information contained in UAT ADS-B Messages broadcast by a single Ground Station that convey TIS-B information.
Report – The encapsulated Message Data Block elements of received UAT ADS-B Messages that is forwarded to on-board application processors. (See ADS-B Report.)
ACP-WGW01/AI-1Appendix D

Appendix A Page A - 12
© 2005
Report Assembly Function – The Report Assembly Function receives all Successful Message Receptions from the Message Reception and Decoding function and structures Reports for delivery to the Report Output Storage Buffer.
Required Navigation Performance (RNP) - A statement of the navigation performance necessary for operation within a defined airspace. Note. – Navigation performance and requirements are defined for a particular RNP type and/or application. [R192]
Resolution – A number of units or digits to which a measured or calculated value is expressed and used. [R220] In the specific context of UAT, the smallest increment reported in an UAT ADS-B Message field. The representation of the least significant bit (LSB) in a UAT ADS-B Message field.
Seamless - A “chock-to-chock” continuous and common view of the surveillance situation from the perspective of all users.
Service Volume – A part of the facility coverage where the facility provides a particular service in accordance with relevant SARPs, and within which the facility is afforded frequency protection.
State Vector - An aircraft or vehicle’s current kinematic state.
Successful Message Reception – Detection of synchronization pattern and successful FEC decoding for either ADS-B or uplink (i.e., FIS-B) messages.
Target - Aircraft or vehicle from which an ADS-B Message can be received, or which can be the subject of a TIS-B Message uplinked by a UAT Ground Station.
Target State (TS) Report – The Target State (TS) Report provides information on the intended horizontal and vertical positions toward which the aircraft is maneuvering for the active flight segment.
Track Angle - Instantaneous angle measured from either true or magnetic north to the aircraft's track.
Traffic Information Service – Broadcast (TIS-B) – A service that broadcasts traffic information derived from one or more ground surveillance sources to suitably equipped aircraft or surface vehicles.
Transition Level (TRL) – The lowest flight level available for use above the transition altitude. [T194]
Transponder Diplexer Channel – RF path of the (optional) Diplexer which connects an SSR Transponder to the antenna. This RF path provides a passband which includes the 1030 MHz SSR interrogation frequency and the 1090 MHz SSR reply frequency.
Trigger – Detection of ADS-B or Ground Uplink synchronization sequence.
ACP-WGW01/AI-1Appendix D

Appendix A Page A - 13
© 2005
UAT Diplexer Channel – RF path of the (optional) Diplexer which connects the UAT equipment to the antenna. This RF path provides a passband centered at the UAT frequency of 978 MHz.
UAT Frame – In the UAT system, the frame is the most fundamental time unit. Frames are one second long, and begin at the start of each UTC (or GPS) second. Each frame is divided into two segments: one segment in which Ground Uplink messages occur, and another segment in which ADS-B messages occur.
UTC (Coordinated Universal Time) – See coordinated time scales. [C469]
UTC 1 second epoch signal – The reference timing used to establish message transmit and reception times with precision, as well as the time of applicability of Position and Velocity when the UAT transmitter is “UTC Coupled” to a GPS/GNSS navigation source.
Vertical Figure of Merit (VFOM) – A 95% bound on the vertical position error.
World Geodetic System (WGS) - A consistent set of parameters describing the size and shape of the earth, the positions of a network of points with respect to the center of mass of the earth, transformations from major geodetic datum’s, and the potential of the earth (usually in terms of harmonic coefficients).
World Geodetic System 1984 - A set of quantities, developed by the U.S. Department of Defense for determining geometric and physical geodetic relationships on a global scale, based on a geocentric origin and a reference ellipsoid with semi-major axis 6378137 and flattening 1/298.257223563.
ACP-WGW01/AI-1Appendix D

Appendix A Page A - 14
© 2005
This Page Intentionally Left Blank
ACP-WGW01/AI-1Appendix D

Appendix B
UAT System Performance Simulation Results
ACP-WGW01/AI-1Appendix D

This Page Intentionally Left Blank
© 2005
ACP-WGW01/AI-1Appendix D

Appendix B Page B - 3
B UAT System Performance Simulation Results
B.1 Introduction
B.1.1 Organization
This introductory section discusses the background and assumptions for the Multi-Aircraft UAT Simulation (MAUS), which has been used as a tool for evaluating the performance of UAT as an ADS-B data link under a number of different possible system parameters and configurations.
Section B.2 describes in detail the antenna gain model, which is used by MAUS in calculating the signal levels received from the transmitting aircraft in the simulation. This antenna gain model is identical to that used in simulations employed in the past to evaluate all three ADS-B link candidates (see, for example, Comparative Analysis of Potential ADS-B Links, AMCP/8).
The UAT receiver performance model used by MAUS is described in Section B.3. The model is based on measured data, and both the data and model characteristics are described in this section.
The results shown in Section B.4 are compared to requirements from the UAT Requirements and Desirable Features document (Appendix L) as specified in Table 3.1.3 “SV and MS Accuracy, Update Interval, and Acquisition Range Requirements” and Table 3.1.7 “Summary of Target State Report Acquisition Range and Update Interval Requirements.” Section B.4 presents results for the analysis of UAT performance. Section B.4.1 describes the Los Angeles 2020 (LA2020) scenario and the UAT system performance in this environment. Section B.4.2 presents the Core Europe scenario, and describes the performance of UAT in this environment. Section B.4.3 describes and presents results for the Low Density scenario. Acquisition performance is presented in Section B.4.4, and aircraft-aircraft performance on the surface is discussed in Section B.4.5. Section B.4.6 presents the results for an A0 receiver on the surface receiving aircraft on approach. Section B.4.7 describes results of a study on the use of a geographical distribution of UAT Ground Stations for uplinking TIS-B information in the LA2020 environment.
Finally, validation of the MAUS results is presented in Section B.5. This section describes a comparison of MAUS predictions with measured data from specially devised test equipment. This equipment was designed to emulate a high-density UAT self-interference environment, and the MAUS was run for identical conditions.
B.1.2 Background
Analytical models and detailed simulations of data links operating in future scenarios are required to assess expected capabilities in stressed circumstances. Accurately modeling future capabilities for potential system designs in a fair way, however, is challenging. Since validation of simulation results in future environments is unrealistic, other means of verification such as the following are required. System characteristics represented in these simulations should agree with actual measurements on components of the proposed design, e.g., bench measurements on prototype equipment and calibrated flight test data should be used, when possible, for the receiver/decoder capabilities and as comparison with modeled link budgets. Similarly, suitable interference models help to support estimates of how these conditions may change in future scenarios. Credibility of any
© 2005
ACP-WGW01/AI-1Appendix D

Appendix B Page B - 4
simulation results for future scenarios also requires that they be able to model current conditions and provide results that appropriately agree with measurements made under these conditions. Existing tools have been used as cross-checks where possible for the final detailed simulations and models.
B.1.3 General Assumptions
In an effort to capture as many real-world effects important to the assessment of the performance of UAT as possible, an attempt was made to include, to the extent possible, representations of the effects of:
• Propagation and cable losses
• Antenna gains
• Propagation delays
• Co-channel interference (specifically, DME/TACAN and JTIDS (Link 16))
• Co-site interference (in and out of band)
• Multiple self-interference sources
• Alternating transmissions between top and bottom antennas (where applicable)
• Performance as a function of receiver configuration (e.g., diversity, switched, bottom only)
• Transmit power variability and configuration
• Receiver re-triggering
• Receiver performance based on bench testing
• Message transmission sequence and information content by aircraft equipage
• Ground receiver assumptions
Section B.4.7.1 will contain additional assumptions that were required to analyze the TIS-B uplink performance of UAT.
B.1.4 UAT Detailed Simulation Description and Limitations
The UAT detailed simulation software is written in the “C” programming language and allows for horizontal, constant-velocity motion of the aircraft in the scenario, if the user so chooses. The simulation reads in the inputs specifying the particular case to be run, generates all of the ADS-B transmissions and interference, calculates signal levels and times of arrival for these transmissions, and determines the corresponding message error rates for each ADS-B transmission by all aircraft within line of sight of the victim receiver. MAUS is often run in a mode that regards all of the ADS-B transmissions by the air traffic scenario as interference, and inserts a number of probe aircraft as desired transmitters to provide message error rate data. This permits the augmentation of the statistical sample used. This information is then written to an output file, one entry line for each ADS-B transmission, which is then analyzed by post-simulation software. Each of the effects listed in Section B.1.2 will now be discussed in turn.
© 2005
ACP-WGW01/AI-1Appendix D

Appendix B Page B - 5
• Propagation and cable losses. The UAT simulation calculates the free-space propagation loss for each transmission, using the range between transmitter and receiver at the time of transmission. There is also a nominal receiver cable loss of 3 dB incorporated in the calculation. An optional transmit cable loss is also included in the simulation, but since the transmit powers have been defined at the antenna, the transmit cable loss has been set to zero.
• Antenna gains. The antenna gain model included in the UAT simulation is described in Section B.2.
• Propagation delays. Calculation of the propagation delay incurred by the signal in traversing the free space between transmitter and receiver has been included in the UAT simulation
• Co-channel interference. In certain geographic areas, UAT may have to co-exist with transmissions from DME/TACAN and Link 16 sources. Link 16 scenarios have been provided in cooperation with a military authority and have been applied to all of the performance analysis shown in this document. Various DME/TACAN scenarios provided by Eurocontrol have been applied to Core Europe analysis. In all cases, every attempt was made to provide conservative estimates of the co-channel interference environment. (see Appendix C for more detailed explanation of the interference environment)
• Co-site interference. Co-site transmissions of UAT messages, DME interrogations, Mode S interrogations and replies, whisper-shout interrogations, and ATCRBS replies are all modeled as interference in the UAT simulation. All of these are treated as interference which completely blocks UAT reception; therefore, it is assumed that no UAT reception may occur during any of these co-site transmissions (including a 15 microsecond suppression period added to the end of each co-site transmission). (see Appendix C for more detailed explanation of the interference environment)
• Multiple self-interference sources. Although the UAT transmission protocol specifies that a transmission begin on one of a fixed number of message start opportunities, the propagation delay described above will cause the arrivals of messages at the victim receiver to be quasi-random. There may be a number of messages overlapping one another, and these overlaps will be for variable amounts of time. This interference is accounted for in the multi-aircraft simulation. Multiple UAT interferers are treated in the receiver performance model by combining their interference levels in a way consistent with bench test measurements. The simultaneous presence of UAT interference, co-channel interference, and self-interference is treated in a detailed fashion by the model. Further discussion is presented in Section B.3. Since the UAT system description specifies that the ground uplink transmissions occur in a separate, guarded time segment than the air-to-air transmissions, FIS-B should not interfere with the ADS-B transmissions of the aircraft. Therefore, the simulation does not model this data load for the ADS-B performance assessment.
• Alternating transmissions. The model simulates the alternating transmission sequence specified for aircraft Class A1, A2, and A3 equipage, TTBBTTBB…, where T = top and B = bottom. For Class A0 equipage, the model simulates transmission from a bottom antenna.
• Receiver diversity. For Class A2 and A3 equipage, the model simulates receiver diversity by calculating the message error rate at both the top and bottom receive antennas and calculating the joint reception probability. For A1 equipage, the model simulates the single-receiver dual-antenna configuration by switching the receive
© 2005
ACP-WGW01/AI-1Appendix D

Appendix B Page B - 6
antenna alternately between top and bottom each successive second. For Class A0-equipped aircraft, reception is only permitted from a bottom antenna.
• Transmit power variability. The transmit power for an aircraft is chosen from a uniform distribution given by the limits specified for the aircraft equipage. The transmit powers for different equipage levels are defined in Section 2.4.2.1.
• Receiver retriggering. The UAT simulation checks each individual ADS-B Message arriving at the victim receiver for its message error rate. This procedure amounts to allowing for retriggering in the receiver, i.e. the potential for the receiver to switch from receiving a message to a stronger message signal that arrives after the start of the reception of the first message.
• Receiver performance model. The receiver performance model used in the UAT simulation is based on experimental data collected on special UAT receivers that were provided for that purpose. These receivers were modified to be compliant with the requirements specified in this document. Both the 0.8 MHz filter specified for A3 equipage and the 1.2 MHz filter used in A0-A2 equipage were tested. The results of the bench testing and the receiver performance model are described in Section B.3. The sensitivity of the receiver is assumed to be –93 dBm. This represents the signal level at which 10% error rate is achieved in the absence of interfering signals. This parameter was validated in the simulation.
• Message transmission sequence and content. Section 3.1.1 and Table 2-2 of the Manual on the UAT Detailed Technical Specifications define the types of messages, their content, and the sequence of messages transmitted for each category of aircraft equipage. See the table in Section B.4.4 for a summary of all the types of information transmitted by each equipage class. The information content transmitted by each aircraft is explicitly modeled by the multi-aircraft simulation.
• Ground receiver assumptions. For Air-to-ground studies that follow, several assumptions were changed for the special case of the ground receiver. There was assumed to be no co-site interference, but the same Link 16 Baseline interference used in airborne receptions was included. The receiver sensitivity used was –96 dBm. The antenna gain was slightly different, in that it used an omni-directional TACAN antenna, with elevation gain based on measured data. The ground antenna uses a 1.2 MHz filter only. In certain cases, a 3-sector antenna is used.
B.2 Antenna Model
The antenna gain model contains two components, to accommodate both the elevation pattern variation, as well as non-uniformity in the azimuth pattern. A fixed component is based on the elevation angle between the two aircraft. An additional random component is used to characterize the real-world effects of fuselage blockages in the azimuth pattern. The distributions describing these two components are based on measurement data and are intended to provide sufficient statistical variability to capture a wide variety of antenna installations on aircraft. The two components in dB units are summed to create the total antenna gain pattern for each of a given pair of aircraft.
Figure B-1 shows the elevation gain for a top-mounted antenna. The same gain is used for a bottom-mounted antenna, with the pattern inverted vertically. The antenna has a peak gain of 4.1 dBi at an elevation angle of 26 degrees. For best resolution of display, this figure is limited to a minimum gain of –40 dB.
© 2005
ACP-WGW01/AI-1Appendix D

Appendix B Page B - 7
Figure B-1: TLAT Antenna Model Elevation Gain
© 2005
ACP-WGW01/AI-1Appendix D

Appendix B Page B - 8
The variation in gain due to azimuth pattern effects is based on the probability distribution shown in the Figure B-2.
TLAT Random Azimuth Gain
-10
-8
-6
-4
-2
0
2
4
6
8
0 0.1 0.2 0.3 0.4 0.5 0.6 0.7 0.8 0.9 1
Uniform Random Input
Gai
n (d
B)
Figure B-2: TLAT Random Azimuth Gain
A uniform random variable on the x-axis is used to select a value that characterizes the azimuth variation in antenna gain. Note that approximately 1/3 of the time, the variation can be a loss of up to 8.6 dB. Approximately 2/3 of the time, the variation is an additional gain of up to 6 dB. Note that the median gain in the azimuthal direction is 1 dB.
The elevation and azimuth angles to other aircraft are constantly changing. To simulate this, the antenna model allows for a new random selection of the azimuth gain variation each time the relative azimuth between a pair of targets is altered by more than 5 degrees. This antenna gain model was used in the performance assessments of each of the three links treated in the Comparative Analysis of Potential ADS-B Links, AMCP/8.
B.3 Receiver Performance Model
B.3.1 Measured Data
Measurements of the Bit Error Rate (BER) receive performance were made on two pre-production UAT transceivers, one with a nominal 1.2 MHz bandwidth and one with a nominal 0.8 MHz bandwidth. Simultaneous measurements were made while the same input signal was applied to both units. The input signal consisted of a Signal of Interest
© 2005
ACP-WGW01/AI-1Appendix D

Appendix B Page B - 9
(SOI), from a nominal 1.5 MHz bandwidth UAT transceiver, summed with an interference signal. The SOI was a Long UAT ADS-B Message.
A BER test fixture was created in order to allow measuring the BER impact of pulsed interference as a function of time relative to the start of the pulse. It included circuitry for gating the test interference signal off during the UAT message synchronization header, and software for determining the position of every bit error in every received Message Data Block or FEC. The test setup is shown in Figure B-3
D e s ire dU A T T X
(1 .5 M H z )
R F(P A )
F ixe d a tte nu ato rs a nd a m plifie rs a re ad ju sted to p ro v id e :
- a d es ired -s ig na l leve l a t th e U A T R X in pu ts o f -2 0 dB m w h en s ig na l a tte n ua to ris se t to 0 dB , a nd
- a p ea k in te rfe re nc e leve l a t the U A T R X in pu ts o f -2 0 dB m w h e n in te rfe ren ceis g a ted o n a n d the 2 0 dB in te rfe re n ce a tte nu a to r is byp as se d .
U A T R X(0 .8 M H z )
S p ec tru mA n alyzer
E x te rn a lc lo cks &1 p p s re f
C u sto m B E R T es t F ix tu re(P C to co n tro l a tten u a to r
an d co lle c t d a ta )
In te rfe re n c eS o u rce
R F
C u s to mIn te rfe re n ce
T im in gC ircu itry
tr ig ge r
∑
U A T R X(1 .2 M H z)
∑
A D S -Bm e ss a g e
re p or ts
A D S -Bm e ss a g e
re p or ts
R F
R Fc ntr l
d es ire ds ign a l
a tte n ua to rc on tro l
c on tro l &d ata re ad
T P 6
2 0 d Ba tte n
L N A
A M P
trig ge r in te rfe re n ceg atin g a n da tte n ua to r
Figure B-3: Test Setup for measuring BER
The interference signals used for the BER tests were the following:
1. No external interference (internal receiver noise only). SOI level was varied to achieve various Signal-to-Noise Ratios (SNRs). Note that SNR depends on the noise bandwidth used, which will be defined later in this section.
2. White Gaussian interference. SOI level was varied to achieve various SNRs.
3. A single UAT (1.5 MHz bandwidth) interferer. The levels of both SOI and interferer were independently varied to achieve various SNRs and various Interference-to-Noise Ratios (INRs).
4. A simulated combination of multiple UAT (1.5 MHz bandwidth) interferers. An Arbitrary Waveform Generator (AWG) produced these combination signals by playing back a variety of input data files. The input data files were generated from a set of single-UAT files recorded by a digital oscilloscope. These files were adjusted in level, offset in time and summed together to create the multi-UAT scenarios of interest, specifically:
Two UATs, both at the same level, and at various INRs.
Two UATs at high INR and at various relative levels.
© 2005
ACP-WGW01/AI-1Appendix D

Appendix B Page B - 10
Three, five and ten UATs, all at the same level and at high INR.
(As a check on the fidelity of the simulation, a single UAT at high INR was also simulated and measured and the BER was compared with the corresponding BER measured using an actual UAT at high INR. The discrepancy between the two was found to be less than 0.7 dB.)
5. A DME interferer emitting pulse pairs with 12-usec separation. DME signals at two frequencies were used, at the SOI center frequency and one MHz above. The level of the SOI was varied to achieve a wide range of Signal-to-Interference Ratios (SIRs). The variation of BER with time during and shortly after the DME pulse pair was measured.
6. A Link 16 interferer, at various frequencies, at the SOI center frequency, three MHz higher, 6 MHz higher and so on up to 21 MHz higher. It was assumed that the corresponding lower frequency response would be similar. The level of the SOI was varied to achieve a wide range of Signal-to-Interference Ratios (SIRs). The variation of BER with time during and shortly after the Link 16 pulse pair was measured.
For all of the above interference conditions, bit errors were measured at every position in the Message Data Block and FEC. Results from multiple messages were averaged together. Enough messages were measured to permit determining BER values down to about 10-5. For the continuous interference conditions (no external interference or Gaussian noise), bit errors from all received Message Data Block and FEC bit were averaged together. For the UAT interferers, bit errors from all Message Data Block and FEC bits during interference transmission were averaged together.
For the pulsed interference conditions (DME and Link 16 signals), bit errors were averaged independently for each time offset after the start of the interference pulse (to a resolution of 0.5 UAT bit periods). This enabled determining BER values as a function of SIR, time and frequency offset. Sample plots of measured BER data for DME and Link 16 interferers are shown in Figure B-4 through Figure B-6.
© 2005
ACP-WGW01/AI-1Appendix D

Appendix B Page B - 11
−4.5
−4
−3.5
−3
−2.5
−2
−1.5
−1
−0.5
SIR, dB
Tim
e, U
AT
Bits
log10(BER) for interference = DME, df = 1 MHz, BW = 0.8 MHz
−70 −60 −50 −40 −30 −20
0
5
10
15
20
25
30
35
40
45
Figure B-4: BER Due to DME interference
0 5 10 15 20 25 3010
−4
10−3
10−2
10−1
100
Time, UAT bits
BER
Off−channel DME at SIR = −40 dB
1.2 MHz BW 0.8 MHz BW 7−usec pulses, 12 usec apart
(Frequency offset = 1 MHz, Receiver bandwidth = 0.8 MHz. log10 {BER} encoded as color)
Figure B-5: BER Due to DME Interference
(Frequency offset = 1 MHz, Vertical Slice Through Color Plots Like Figure B-4 at SIR = -40 dB)
© 2005
ACP-WGW01/AI-1Appendix D

Appendix B Page B - 12
−70 −60 −50 −40 −30 −20 −10 0 1010
−5
10−4
10−3
10−2
10−1
100
SIR, dB
BER
Intf = Link 16, bit position = 5.5 (Start of Crest); solid = 1.2 MHz, dashed = 0.8 MHz
df = 0 MHz df = 3 MHz df = 6 MHz df = 9 MHz df = 12 MHz df = 15 MHz df = 18 MHz df = 21 MHz
Figure B-6: Link 16 Interference
(Horizontal Slice Through Color Plots Like Figure B-4 at Bit Position 5.5)
B.3.2 Receiver Model
Based on the above BER measurements, a computer program (the “UAT BER Model”) was designed to estimate MOPS-compliant UAT BER performance under arbitrary combinations of UAT, DME and Link 16 interference. The UAT BER Model is incorporated within the Multi-Aircraft UAT Simulation (MAUS), which uses the BER estimates to evaluate the reception success of UAT messages.
B.3.2.1 Receiver Model Accuracy
Figure B-7 through Figure B-10 show the measured and modeled BER Vs. SINR curves for four sample subsets of the measured data. Figure B-9 and Figure B-10 show the BER modeling error for all the Gaussian noise plus UAT interference data so as to indicate the equivalent power error in dB. The BER-to-power curve used for Figure B-11 and Figure B-12 is the curve appropriate for pure Gaussian noise interference. With this measure, it can be seen that most of the data is modeled to ±1.5 dB accuracy.
© 2005
ACP-WGW01/AI-1Appendix D

Appendix B Page B - 13
Figure B-7: Gaussian Noise + Single UAT, 1.2 MHz Receiver
Figure B-8: Gaussian Noise + Two Equal UATs, 1.2 MHz Receiver
© 2005
ACP-WGW01/AI-1Appendix D

Appendix B Page B - 14
Figure B-9: Two Unequal UATs, INR >> 0 dB, 0.8 MHz Receiver
Figure B-10: N Equal UATs, INR >> 0, 0.8 MHz Receiver
© 2005
ACP-WGW01/AI-1Appendix D

Appendix B Page B - 15
Figure B-11: Model Errors for All Data, 1.2 MHz Receiver
Figure B-12: Model Errors for All Data, 0.8 MHz Receiver
© 2005
ACP-WGW01/AI-1Appendix D

Appendix B Page B - 16
B.4 Multi-Aircraft Simulation (MAUS) Results
B.4.1 Los Angeles Basin 2020 (LA2020)
This scenario is based on the LA Basin 1999 maximum estimate. It is assumed that air traffic in this area would increase by a few percent each year until 2020, when it would be 50 % higher than in 1999. The distribution of aircraft in the scenario is based on approximations of measured altitude and range density distributions.
The following assumptions are made for the airborne and ground aircraft and ground vehicles for the LA Basin 2020 scenario:
• The density of airborne aircraft is taken to be:
Constant in range from the center of the area out to 225 nautical miles (5.25 aircraft/NM), (i.e., the inner circle of radius one NM would contain approximately five aircraft, as would the ring from 224 to 225 NM) and
Constant in area from 225 NM to 400 NM (0.00375 aircraft/NM2).
• There are assumed to be a fixed number of aircraft on the ground (within a circle of radius 5 NM at each airport), divided among LAX, San Diego, Long Beach, and five other small airports, totaling 225 aircraft. Half of the aircraft at each airport were assumed to be moving at 15 knots, while the other half were stationary. In addition, a total of 300 ground vehicles are distributed at these airports as well.
• The altitude distribution of the airborne aircraft is assumed to be exponential, with a mean altitude of 5500 feet. This distribution is assumed to apply over the entire area.
• The airborne aircraft are assumed to have the following average velocities, determined by their altitude. The aircraft velocities for aircraft below 25000 feet are uniformly distributed over a band of average velocity ±30 percent.
0 - 3000 feet altitude 130 knots
3000 - 10000 feet 200 knots
10000 - 25000 feet 300 knots
25000 - up 450 knots
• The aircraft are all assumed to be moving in random directions.
• UAT equipage Class A0 (and A1L as defined in §2.4.2) are restricted to fly below 18000 feet. All other aircraft are assumed to be capable of flying at any altitude. The aircraft in the LA2020 scenario are assumed to be in the following proportions:
A3 30%
A2 10%
A1 40%
A0 20%
For the LA2020 scenario, the A1 equipage was assumed to include two subclasses: A1H (high) and A1L (low). These subclasses are defined in Section 2.4.2.
The scenario for the 2020 high density LA Basin case contains a total of 2694 aircraft: 1180 within the core area of 225 NM, 1289 between 225 - 400 NM, and 225 on the ground. This represents a scaling of the estimated maximum 1999 LA Basin levels
© 2005
ACP-WGW01/AI-1Appendix D

Appendix B Page B - 17
upward by 50 percent. Of these aircraft, 471 lie within 60 NM of the center. (This includes aircraft on the ground.) Around ten percent of the total number of aircraft are above 10000 feet in altitude, and more than half of the aircraft are located in the outer (non-core) area of the scenario.
An attempt was made to at least partially account for the expected lower aircraft density over the ocean. In the third quadrant (between 180 degrees and 270 degrees), for distances greater than 100 NM from the center of the scenario, the density of aircraft is reduced to 25 % of the nominal value used. The other 75% of aircraft which would have been placed in this area are distributed uniformly among the other three quadrants at the same range from the center. This results in relative densities of 1:5 between the third quadrant and the others.
As outlined in Section 3 of Appendix L, the ADS-B requirements for ADS-B air-to-air surveillance range and report update interval are used to assess how the candidate links perform in relation to suggested operational enhancements. These requirements specify the minimum range for acquisition of the State Vector and the mode-status and TC and TS reports where applicable, as well as the maximum update periods allowed for this information.
Appendix L contains specific air/ground performance requirements. These air/ground criteria specify ranges and update times. Additionally, air-to-air requirements for long-range deconfliction are also specified.
Results are presented as a series of plots of 95% update times as a function of range for State Vector updates and intent updates, where applicable. The 95% time means that at the range specified, 95% of aircraft will achieve a 95% update rate at least equal to that shown. Each point on the plot represents the performance of Aircraft/Vehicles within a 10 NM bin centered on the point. The ADS-B requirements specified in Appendix L are also included on the plots for reference. Since the transmit power and receiver configuration are defined for each aircraft equipage class, performance is shown separately for each combination of transmit-receive pair types. In addition, performance of different transmit-receive pairs is shown at several different altitudes, where appropriate. The first altitude considered is “high altitude”, which is defined to be the aircraft near the center of the scenario with the largest number of other aircraft in view. This is invariably an aircraft in the range of FL 350 – FL 400, and applies to Classes A3, A2, and A1H equipage. The other altitude used is FL 150 at the center of the scenario, and applies to all equipage classes.
Results for all of these cases are shown for State Vector updates in Figure B-13 through Figure B-21 and conclusions are presented below. The ADS-B requirements for State Vector updates are shown as black lines on the plots. As specified in Appendix L, the maximum required ranges for air-to-air update rates are: for Class A0 to 10 NM, Class A1 to 20 NM, Class A2 to 40 NM, and Class A3 to 90 NM (120 NM desired), while the criteria shown on the plots continue to 150 NM for Class A3. This may not include all potential requirements. Air-to-ground requirements are defined to 150 NM for all aircraft equipage classes. Performance in compliance with ADS-B requirements is indicated by results that are below the black line.
© 2005
ACP-WGW01/AI-1Appendix D

Appendix B Page B - 18
0 20 40 60 80 100 120 140 160 180 2000
5
10
15
20
25
30
95t
h P
erce
nti
le U
pd
ate
Inte
rval
(se
c)
Range (NM)
A3 transmitter
A2 transmitterA1H transmitter
Figure B-13: Air-to-Air Reception by A3 Receiver at High Altitude over LA2020
0 20 40 60 80 100 120 140 160 180 2000
5
10
15
20
25
30
95t
h P
erce
nti
le U
pda
te I
nte
rval
(se
c)
Range (NM)
A3 transmitterA2 transmitterA1H transmitterA1L transmitterA0 transmitter
Figure B-14: Air-to-Air Reception by A3 Receiver at FL 150 over LA2020
© 2005
ACP-WGW01/AI-1Appendix D

Appendix B Page B - 19
0 20 40 60 80 100 120 140 160 180 2000
5
10
15
20
25
30
95t
h P
erce
nti
le U
pd
ate
Inte
rval
(se
c)
Range (NM)
A3 transmitter
A2 transmitterA1H transmitter
Figure B-15: Air-to-Air Reception by A2 Receiver at High Altitude over LA2020
0 20 40 60 80 100 120 140 160 180 2000
5
10
15
20
25
30
95t
h P
erce
nti
le U
pd
ate
Inte
rval
(se
c)
Range (NM)
A3 transmitterA2 transmitterA1H transmitterA1L transmitterA0 transmitter
Figure B-16: Air-to-Air Reception by A2 Receiver at FL 150 over LA2020
© 2005
ACP-WGW01/AI-1Appendix D

Appendix B Page B - 20
0 20 40 60 80 100 120 140 160 180 2000
5
10
15
20
25
30
95t
h P
erce
nti
le U
pd
ate
Inte
rval
(se
c)
Range (NM)
A3 transmitter
A2 transmitterA1H transmitter
Figure B-17: Air-to-Air Reception by A1 Receiver at High Altitude over LA2020
0 20 40 60 80 100 120 140 160 180 2000
5
10
15
20
25
30
95t
h P
erce
nti
le U
pd
ate
Inte
rval
(se
c)
Range (NM)
A3 transmitterA2 transmitterA1H transmitterA1L transmitterA0 transmitter
Figure B-18: Air-to-Air Reception by A1 Receiver at FL 150 over LA2020
© 2005
ACP-WGW01/AI-1Appendix D

Appendix B Page B - 21
0 20 40 60 80 100 120 140 160 180 2000
5
10
15
20
25
30
95t
h P
erce
nti
le U
pd
ate
Inte
rval
(se
c)
Range (NM)
A3 transmitterA2 transmitterA1H transmitterA1L transmitterA0 transmitter
Figure B-19: Air-to-Air Reception by A0 Receiver at FL 150 over LA2020
0 20 40 60 80 100 120 140 160 180 2000
5
10
15
20
25
30
95t
h P
erce
nti
le U
pd
ate
Inte
rval
(se
c)
Range (NM)
A3 transmitterA2 transmitterA1H transmitterA1L transmitterA0 transmitter
Figure B-20: Air-to-Ground Reception by a Receiver at LAX in LA2020
© 2005
ACP-WGW01/AI-1Appendix D

Appendix B Page B - 22
0 2 4 6 8 10 12 14 16 18 200
2
4
6
8
10
12
14
16
18
20
Range (NM)
95t
h P
erce
nti
le U
pd
ate
Inte
rval
(se
c)A3 ReceiverA2 ReceiverA1 ReceiverA0 Receiver
Figure B-21: Reception of Ground Vehicle Transmissions by Aircraft on Approach at 2000 feet into
LAX in 2020
Recall that the LA2020 scenario includes 2694 aircraft and 300 ground vehicles transmitting on UAT. In addition, a baseline Link 16 scenario is also included as co-channel interference.
The results for LA2020 UAT air-to-air system performance shown in Figure B-13 to Figure B-19 are summarized in Table B-1 below. This summary indicates that the UAT System is projected to be fully compliant with the Appendix L air-to-air State Vector report update requirements at both the required and desired ranges.
Table B-1: Ranges of Compliance for UAT Transmit-Receive Combinations in the LA2020 Scenario
TRANSMITTER RECEIVER A3 A2 A1 A0 A3 (High Altitude) 120 40+ 40+(A1H) NA A3 (FL 150) 130 40+ 50+(A1H)/30+(A1L) 30+ A2 (High Altitude) 130 50 50(A1H) NA A2 (FL 150) 130 50 60(A1H)/40(A1L) 30 A1 (High Altitude) 110 40 40+(A1H) NA A1 (Low Altitude) 120 40 40+(A1H)/30(A1L) 30 A0 100+ 40 40+(A1H)/30(A1L) 30
The results for the LA2020 scenario shown in Figure B-13 through Figure B-21 may be summarized as follows:
© 2005
ACP-WGW01/AI-1Appendix D

Appendix B Page B - 23
• ADS-B air-to-air requirements and desired criteria are met for all aircraft equipage transmit-receive pairs in the LA2020 scenario for State Vector update rates at all ranges specified by Appendix L. Performance for receivers located at FL 150 tends to be better in general than the corresponding receivers at high altitude, due primarily to the lower levels of self-interference encountered at lower altitudes.
• The extension to 150 NM for Class A3 equipage air-to-air reception is only met for LA2020 at the 95% level out to 120 - 130 NM, but the 95th percentile update rate at 150 NM is 14 - 15 seconds, depending on the altitude of the receiving aircraft.
• Air-to-ground update requirements are met to 150 NM for a standard ground receiver located at LAX in the LA2020 scenario for Class A3, A2, and A1H equipages. Class A1L and A0 equipage met requirements out to 140 and 120 NM, respectively. A test case was run for the case of a 980 MHz DME/TACAN co-located with the ground receiver. The results of the test case show that, in the presence of a 5 kw TACAN at 980 MHz located 50 feet away from the ground receiver at LAX in the LA2020 scenario, a three-sector antenna allows the update requirements to be met for all aircraft equipages to 150 NM. Another test case was run for the case of the co-located 980 MHz TACAN with a standard ground receiver, to see what level of power at the UAT antenna could be supported without degradation in performance. The results show that –90 dBm TACAN power at the UAT antenna at 980 MHz does not significantly change the standard ground performance in LA2020: Class A3, A2, and A1H performance meet the update rate requirements out to 150 NM, and Class A1L and A0 meet the requirements out to 120 and 110 NM, respectively. This means that, if the TACAN were located 1000 feet from the ground receive antenna, an additional 30 dB of isolation would be required in order to assure compliance with reception update rate requirements. This could be achieved by increasing the separation distance, for example.
• System performance results are presented for State Vector updates of ground vehicles to an aircraft on approach to LAX in the LA2020 scenario. There is no specific update rate requirement for this situation.
Figure B-22 shows the result for air-to-air ADS-B reception over UAT of Target State Report information in the LA2020 scenario. This intent information is transmitted by high altitude aircraft (Class A3, A2, and A1H equipage), and the receiver for this plot is a Class A3.
© 2005
ACP-WGW01/AI-1Appendix D

Appendix B Page B - 24
0 10 20 30 40 50 60 70 80 90 1000
5
10
15
20
25
30
95t
h P
erce
nti
le U
pd
ate
Inte
rval
(se
c)
Range (NM)
A3 Transmitter
A2/A1H TransmitterTSR Requirement
Figure B-22: 95th Percentile Update Interval for Target State Reports as a Function
of Range for A3 and A2/A1H Transmitters
The results in Figure B-22 confirm that UAT in a high density environment is expected to meet the air-to-air reception requirement for Target State Reports.
B.4.2 Core Europe 2015
A high density air traffic scenario was developed by Eurocontrol to represent Core Europe in 2015 (CE2015). The operation of UAT in Core Europe 2015 is based on the premise that the existing on-channel DME/TACANs will be moved from 978 MHz to other available frequencies. Therefore, the future scenario assumes that there will be no DME/TACANs on 978 MHz, but that all existing and planned DME/TACANs at 979 MHz will be operational and running at full allowed power levels, no matter how close they are to one another. This condition was chosen in order to provide a conservatively severe estimate of the DME/TACAN interference environment.
Two cases were analyzed: worst-case traffic density (over the center of the scenario at Brussels, selected to provide the highest UAT self-interference levels) and worst-case DME/TACAN environment (location selected to provide the highest interference from DME/TACANs). The worst-case DME/TACAN environment selection required moving a high-power mobile 979 MHz TACAN to a particular location near several other 979 MHz TACANs.
For the Core Europe 2015 scenario, the distributions and assumptions made were taken directly from the Eurocontrol document entitled “High-Density 2015 European Traffic Distributions for Simulation,” dated August 17, 1999. This scenario is well-defined and straightforward to apply. The scenario used in this analysis includes a total of 2091
© 2005
ACP-WGW01/AI-1Appendix D

Appendix B Page B - 25
aircraft (both airborne and ground) and 500 ground vehicles, and is based on the following assumptions:
• There are five major TMAs (Brussels, Amsterdam, London, Paris, and Frankfurt), each of which is characterized by:
The inner region (12 NM radius) contains 29 aircraft at lower altitudes,
The outer region (50 NM radius) contains 103 aircraft at mid to higher altitudes.
There are 25 aircraft on the ground within a 5 NM radius of each TMA. Additionally, there are 25 aircraft not associated with a TMA randomly distributed through the scenario.
There are assumed to be 100 ground vehicles equipped with transmit-only UAT equipment.
• These aircraft are assumed to be symmetrically distributed azimuthally, and the aircraft in an altitude band are assumed to be uniformly distributed throughout the band. However, all aircraft in the same band are assumed to be traveling at the same band-dependent velocity.
• Superimposed over these aircraft is a set of airborne en route aircraft, which are distributed over a circle of radius 300 NM. These aircraft are distributed over four altitude bands, ranging from low to upper altitudes. They also travel at velocities that are altitude band dependent.
• As in the LA Basin 2020 scenario, for the Core Europe 2015 scenario all aircraft are assumed to be ADS-B equipped. The equipage levels have been adjusted to be: 30 % A3 30% A2 30% A1 10% A0
Aircraft equipage is assigned according to altitude. The lower percentages of Class A0 and A1 aircraft than those found in the LA Basin scenarios reflect differences in operating conditions and rules in European airspace.
The two geographical areas that underlie the scenarios discussed above (LA Basin and Core Europe) correspond to very different types of situations for an aircraft to operate in, and thus should provide two diverse environments for evaluation. The LA Basin scenario contains only about 14% of all airborne aircraft at altitudes above 10000 feet, while the Core Europe scenario has around 60% above 10000 feet. Thus, there will be vastly different numbers of aircraft in view for the two scenarios. Additionally, the aircraft density distributions are also quite different, which will place different stresses on the data link systems.
The results of simulation runs which correspond to the assumptions stated above for the full complement of 2091 aircraft and 500 ground vehicles are presented below. Recall that DME/TACANs on 978 MHz are assumed to have been moved, and that all potential and planned DME/TACANs on 979 MHz are assumed to have been implemented and transmit at maximum allowed powers. Two locations are considered for CE2015: one in the midst of worst-case UAT self-interference, in the center of the scenario over Brussels; the other in a location that is thought to represent the worst-case DME environment, over western Germany. In addition, the Baseline B Link 16 scenario is also assumed to
© 2005
ACP-WGW01/AI-1Appendix D

Appendix B Page B - 26
interfere with UAT transmissions in the CE2015 environment. Results are presented as a series of plots of 95% update times as a function of range for State Vector updates. The 95% time means that at the range specified, 95% of aircraft will achieve a 95% update rate at least equal to that shown. The ADS-B requirements are also included on the plots for reference. Since the transmit power and receiver configuration are defined for each aircraft equipage class, performance is shown separately for each combination of transmit-receive pair types. In addition, performance of different transmit-receive pairs is shown at several different altitudes, where appropriate.
Results are presented in Figure B-23 to Figure B-33 for 95% update times as a function of range for State Vector updates. Each point on the plot represents the performance of Aircraft/Vehicles within a 10 NM bin centered on the point. Appendix L requirements for State Vector updates are shown as black lines on the plots. The maximum ranges specified for air-to-air update rates are: for Class A0 to 10 NM, Class A1 to 20 NM, Class A2 to 40 NM, and Class A3 to 90 NM (120 NM desired), while the criteria continue to 150 NM for Class A3. Air-to-ground requirements are defined to 150 NM for all aircraft equipage classes. Performance in compliance with requirements is indicated by results that are below the black line.
0 20 40 60 80 100 120 140 160 180 2000
5
10
15
20
25
30
95t
h P
erce
nti
le U
pd
ate
Inte
rval
(se
c)
Range (NM)
A3 transmitter
A2 transmitterA1H transmitter
Figure B-23: Air-to-Air Reception by A3 Receiver at High Altitude over BRU in CE 2015
© 2005
ACP-WGW01/AI-1Appendix D

Appendix B Page B - 27
0 20 40 60 80 100 120 140 160 180 2000
5
10
15
20
25
30
95t
h P
erce
nti
le U
pd
ate
Inte
rval
(se
c)
Range (NM)
A3 transmitterA2 transmitterA1H transmitterA1L transmitterA0 transmitter
Figure B-24: Air-to-Air Reception by A3 Receiver at FL 150 over BRU in CE 2015
0 20 40 60 80 100 120 140 160 180 2000
5
10
15
20
25
30
95t
h P
erce
nti
le U
pd
ate
Inte
rval
(se
c)
Range (NM)
A3 transmitter
A2 transmitterA1H transmitter
Figure B-25: Air-to-Air Reception by A2 Receiver at High Altitude over BRU in CE 2015
© 2005
ACP-WGW01/AI-1Appendix D

Appendix B Page B - 28
0 20 40 60 80 100 120 140 160 180 2000
5
10
15
20
25
30
95t
h P
erce
nti
le U
pd
ate
Inte
rval
(se
c)
Range (NM)
A3 transmitterA2 transmitterA1H transmitterA1L transmitterA0 transmitter
Figure B-26: Air-to-Air Reception by A2 Receiver at FL 150 over BRU in CE 2015
0 20 40 60 80 100 120 140 160 180 2000
5
10
15
20
25
30
95t
h P
erce
nti
le U
pd
ate
Inte
rval
(se
c)
Range (NM)
A3 transmitter
A2 transmitterA1H transmitter
Figure B-27: Air-to-Air Reception by A1 Receiver at High Altitude over BRU in CE 2015
© 2005
ACP-WGW01/AI-1Appendix D

Appendix B Page B - 29
0 20 40 60 80 100 120 140 160 180 2000
5
10
15
20
25
30
95t
h P
erce
nti
le U
pd
ate
Inte
rval
(se
c)
Range (NM)
A3 transmitterA2 transmitterA1H transmitterA1L transmitterA0 transmitter
Figure B-28: Air-to-Air Reception by A1 Receiver at FL 150 over BRU in CE 2015
0 20 40 60 80 100 120 140 160 180 2000
5
10
15
20
25
30
95t
h P
erce
nti
le U
pd
ate
Inte
rval
(se
c)
Range (NM)
A3 transmitterA2 transmitterA1H transmitterA1L transmitterA0 transmitter
Figure B-29: Air-to-Air Reception by A0 Receiver at FL 150 over BRU in CE 2015
© 2005
ACP-WGW01/AI-1Appendix D

Appendix B Page B - 30
0 20 40 60 80 100 120 140 160 180 2000
5
10
15
20
25
30
95t
h P
erce
nti
le U
pd
ate
Inte
rval
(se
c)
Range (NM)
A3 transmitterA2 transmitterA1H transmitterA1L transmitterA0 transmitter
Figure B-30: Air-to-Ground Reception at BRU in CE 2015
0 20 40 60 80 100 120 140 160 180 2000
5
10
15
20
25
30
95t
h P
erce
nti
le U
pd
ate
Inte
rval
(se
c)
Range (NM)
A3 transmitterA2 transmitterA1H transmitterA1L transmitterA0 transmitter
Figure B-31: Air-to-Ground Reception Using a 3-Sector Antenna at BRU in CE 2015
© 2005
ACP-WGW01/AI-1Appendix D

Appendix B Page B - 31
0 20 40 60 80 100 120 140 160 180 2000
5
10
15
20
25
30
95t
h P
erce
nti
le U
pd
ate
Inte
rval
(se
c)
Range (NM)
A3 transmitterA2 transmitterA1H transmitterA1L transmitterA0 transmitter
Figure B-32: Air-to-Ground Reception 2 NM from a 10 kW TACAN Using a 3-Sector Antenna at
BRU in CE 2015
0 2 4 6 8 100
2
4
6
8
10
12
14
16
18
20
Upd
ate
Tim
e (s
ec)
Range (NM)
A3 rxA2 rxA1 rxA0 tx
Figure B-33: Reception of Ground Vehicle Transmissions by Aircraft on Approach at 2000 feet into
BRU in 2015 with 10 kW 979 MHz TACAN at Airport
© 2005
ACP-WGW01/AI-1Appendix D

Appendix B Page B - 32
Recall that the CE2015 scenario includes 2091 aircraft and 500 ground vehicles transmitting on UAT. The DME/TACAN interference environment is characterized by up to four adjacent-channel emitters, all at the maximum allowable powers. In addition, a baseline Link 16 scenario is also included as co-channel interference.
The UAT air-to-air performance in Core Europe shown in Figure B-23 through Figure B-29 is summarized in Table B-2. This summary indicates that the UAT System is projected to be fully compliant with the ADS-B air-to-air report update requirements at both the required and desired ranges.
Table B-2: Ranges of ADS-B Compliance for UAT Transmit-Receive Combinations in CE 2015 Scenario
TRANSMITTER RECEIVER A3 A2 A1 A0 A3 (High Altitude) 120 40+ 40+(A1H) NA A3 (FL 150) 120 40+ 40+(A1H)/30+(A1L) 20+ A2 (High Altitude) 130 50 50(A1H) NA A2 (FL 150) 120 40+ 40+(A1H)/30(A1L) 20+ A1 (High Altitude) 100+ 40 40+(A1H) NA A1 (FL 150) 110 40 40(A1H)/20+(A1L) 20+ A0 100 30+ 30+(A1H)/20+(A1L) 20+
The results for Core Europe 2015 shown in Figure B-23 through Figure B-33 may be summarized as follows:
• ADS-B air-to-air requirements and desired criteria are met for all aircraft equipage transmit-receive pairs for both State Vector update rates at all ranges specified by Appendix L.
• The extension to 150 NM for A3 equipage is not met at the 95% level, but the 95% State Vector update time at 150 NM is 15-16 seconds, depending on receiver altitude and location. The 95% level is achieved to around 120 NM, depending on receiver altitude and location.
• All known air-to-ground update rate requirements are substantially met for all classes of aircraft out to at least 150 NM, even in the presence of a co-located TACAN emitter, by using a three-sector antenna. A test case was run, which included a 10 kW co-located 979 MHz TACAN. It was determined that the TACAN signal at the receive antenna had to be received at a level that did not exceed –30 dB, in order for all equipage classes to meet air-to-ground requirements. This corresponds to an isolation of 20 dB from the receive antenna, in addition to that provided by a 50 foot separation distance between the TACAN transmitter and ground receiver plus isolation provided by the receive antenna null. This could be achieved by increasing the separation distance, for example.
• System performance results are presented for updates of ground vehicles to an aircraft on approach. We know of no specific ADS-B requirements for this situation.
B.4.3 Low Density Scenario
In addition to the two high-density scenarios described above, a scenario was also run to represent low-density traffic levels. This scenario was developed for 360 total aircraft. These aircraft are uniformly distributed in the horizontal plane within a circle of radius
© 2005
ACP-WGW01/AI-1Appendix D
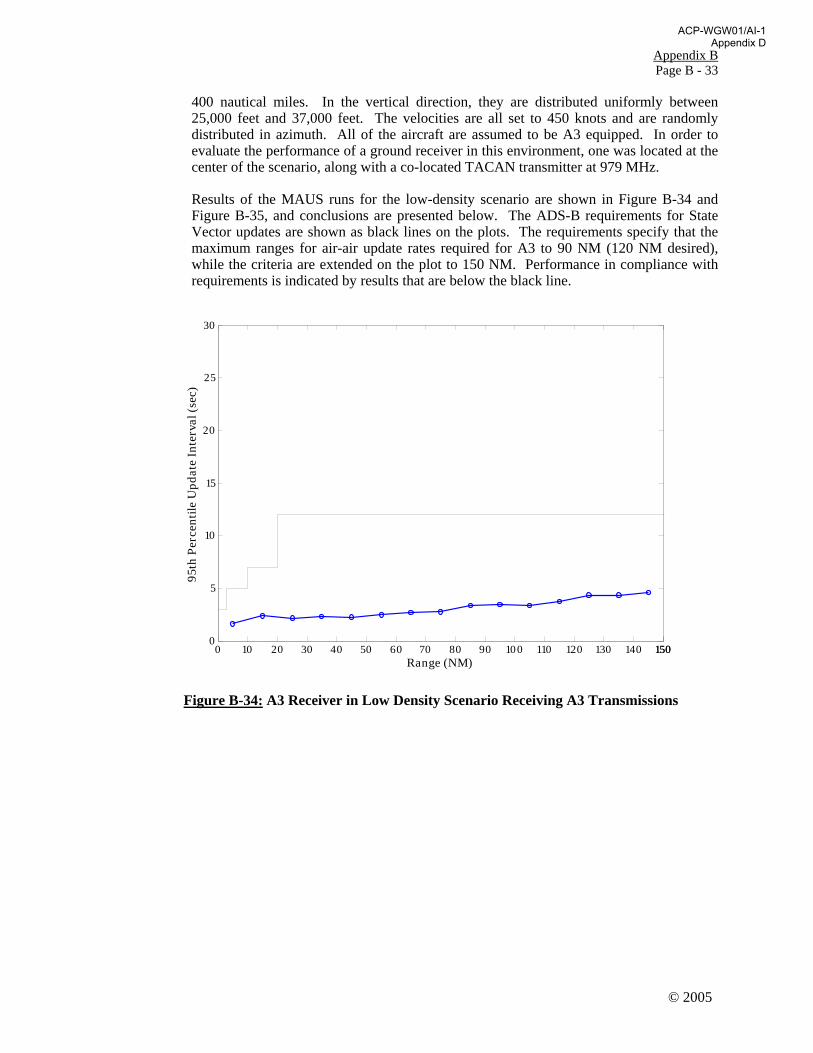
Appendix B Page B - 33
400 nautical miles. In the vertical direction, they are distributed uniformly between 25,000 feet and 37,000 feet. The velocities are all set to 450 knots and are randomly distributed in azimuth. All of the aircraft are assumed to be A3 equipped. In order to evaluate the performance of a ground receiver in this environment, one was located at the center of the scenario, along with a co-located TACAN transmitter at 979 MHz.
Results of the MAUS runs for the low-density scenario are shown in Figure B-34 and Figure B-35, and conclusions are presented below. The ADS-B requirements for State Vector updates are shown as black lines on the plots. The requirements specify that the maximum ranges for air-air update rates required for A3 to 90 NM (120 NM desired), while the criteria are extended on the plot to 150 NM. Performance in compliance with requirements is indicated by results that are below the black line.
0 10 20 30 40 50 60 70 80 90 100 110 120 130 140 1501500
5
10
15
20
25
30
95t
h P
erce
nti
le U
pd
ate
Inte
rval
(se
c)
Range (NM)
Figure B-34: A3 Receiver in Low Density Scenario Receiving A3 Transmissions
© 2005
ACP-WGW01/AI-1Appendix D

Appendix B Page B - 34
0 20 40 60 80 100 120 140 160 180 2000
5
10
15
20
25
30
95t
h P
erce
nti
le U
pd
ate
Inte
rval
(se
c)
Range (NM)
Figure B-35: Receptions of A3 Transmissions by a UAT Ground Receiver in a Low Density Scenario co-located with a TACAN at 979 MHz with –30 dBm Power at the UAT Antenna
The results for the low-density scenario may be summarized as follows:
• ADS-B air-to-air requirements and desired criteria are met for all aircraft for both State Vector and intent update rates at all ranges specified in Appendix L.
• The extension to 150 NM for A3 equipage is met at the 95% level, as required.
• All known air-to-ground update rate requirements are met out to at least 150 NM, in the absence of the co-located TACAN emitter, with the use of a single antenna on the ground. A test case was run, which included a 10 kW co-located 979 MHz TACAN. It was determined that the TACAN signal at the receive antenna had to be received at a level that did not exceed –30 dBm, in order to meet air-to-ground requirements. This corresponds to an isolation of 20 dB from the receive antenna, in addition to that provided by a 1000 foot separation distance. Alternatively, a three-sector ground antenna configuration should also enable satisfaction of the air-to-ground requirements to 150 NM.
B.4.4 Acquisition Performance
Performance of the UAT ADS-B system in the area of aircraft information acquisition was evaluated. In a head-on situation in the LA2020 scenario, the 99th percentile range for acquisition by the victim receiver of all information transmitted on ADS-B by the desired aircraft was determined for each aircraft equipage type. This was done for a large sample of cases, and the 99th percentile case was chosen. In other words, 99% of aircraft are expected to achieve a 99% probability of acquiring all information about an aircraft flying on a head-on path by the range selected.
© 2005
ACP-WGW01/AI-1Appendix D

Appendix B Page B - 35
The information necessary to acquire varies by aircraft equipage, so the evaluation was done for various transmitter-receiver combinations of equipage. For each equipage type, the message transmit sequence used was that defined in Section 3.1.1. Table B-3 shows the assumptions made in this analysis for information required to achieve acquisition for each type of transmit equipage.
Table B-3: Acquisition Requirements
Transmit Equipage Class Required Information for Acquisition A3 SV, MS, TSR, TCR0, TCR1 A2 SV, MS, TSR, TCR0 A1H SV, MS, TSR A1L SV A0 SV
The abbreviations used in Table B-3 are:
• SV: State Vector
• MS: Mode Status
• TSR: Target State Report
• TCR0: Trajectory Change Report 0
• TCR1: Trajectory Change Report 1
The methodology used in this analysis was to run a set of probe aircraft in a head-on scenario and determine, for each, probe aircraft, the 99th percentile range at which all of the above information was received by the victim aircraft. The results are shown in Table B-4 for each transmit-receive combination.
Table B-4: 99th Percentile Range for Information Acquisition for Various Combinations of Transmit-Receive Pairs (NM)
Transmitter
A3 A2 A1H A1L A0
A3 137 53 53 49 18
A2 145 54 53 52 17
Rec
eive
r
A1 122 50 48 37 11
These results are for somewhat more restrictive acquisition criteria than are usually applied. From the results, it appears that UAT will be able to comply with all known ADS-B track acquisition requirements.
B.4.5 Surface Performance
An evaluation was performed of the performance of the UAT system on the surface, i.e., aircraft-to-aircraft State Vector update rates were determined for transmit-receive pairs on the ground at LAX in the LA2020 scenario. The aircraft separation was varied between
© 2005
ACP-WGW01/AI-1Appendix D

Appendix B Page B - 36
one and five nautical miles, and cases were run with and without severe horizontal surface multipath included. The multipath model used is described in Appendix M.6 of the ADS-B Technical Link Assessment Team (TLAT) Technical Link Assessment Report, March, 2001. It was thought that these two cases would provide conservative bounds on expected performance, since it was assumed that the severe multipath effects would always interfere destructively with the received signal.
Recall that the LA2020 scenario, in addition to a total of 2694 aircraft (75 on the ground at LAX) transmitting UAT, includes 100 transmitting ground vehicles at LAX as well. The results for the analysis of aircraft-to-aircraft surface-to-surface performance may be summarized as follows:
• For the bounding cases with no multipath and with worst-case elevation plane multipath, the 95th percentile surface update requirements in Appendix L (1.5 seconds out to 5 NM) are met for Class A3 transmitters up to 1 - 2 NM away.
• The 95th percentile surface update requirement (1.5 seconds out to 5 NM) is not met for all other cases on the surface.
• The 95th percentile update time on the surface for all aircraft classes to 5 NM for the bounding case of no multipath is approximately 2 seconds. Class A3 transmitters can be seen by Class A2 and A3 receivers out to 5 NM with, approximately, a 3 second 95th percentile update time. Class A2 transmitters can be seen by Class A2 and A3 receivers out to 5 NM with, approximately, a 5 second 95th percentile update time.
• The 95th percentile update time on the surface for all aircraft classes for the bounding case of worst-case multipath is approximately 3 seconds at a range of 1 NM. The limiting factor at ranges greater than 1 NM is the transmit power and antenna placement for Class A0 and A1L class equipment, combined with the effect of 175 interferers at close range.
B.4.6 A Class A0 Aircraft on the Surface Receiving an Aircraft that is on Approach
An evaluation was performed of the performance of the UAT system for an aircraft on the surface receiving State Vector transmissions from aircraft on landing approach in both the LA2020 and CE2015 scenarios. The aircraft on approach were modeled at an altitude of 2000 feet. The receiving aircraft on the ground is equipped as a Class A0 receiver. It was thought this would provide a worst case performance for aircraft on the surface receiving airborne transmitters due to the Class A0 receiver potentially only having a single antenna on the bottom of the aircraft. No multipath was included.
The evaluation was performed using the same co-site interference environment as for the airborne scenarios. In practice, the actual interference environment would be more benign, because of much lower instances of interrogations from ACAS and radar ground systems when operating on the surface, and potentially from a lack of DME equipment on some portion of the Class A0 and A1L fleet. In addition, the Core Europe scenario had a 10 kW 979 MHz TACAN located 1000 feet away from the UAT receiving antenna.
Results of the MAUS runs for a Class A0 aircraft on the ground receiving UAT transmissions from aircraft on approach are shown in Figure B-36 and Figure B-37 for the LA2020 and CE 2015 scenarios, and conclusions are presented below. We know of no specific ADS-B requirements for this situation.
© 2005
ACP-WGW01/AI-1Appendix D

Appendix B Page B - 37
0 5 10 15 20 250
2
4
6
8
10
12
14
16
18
20
Upd
ate
Tim
e (s
ec)
Range (NM)
A3 txA2 txA1H txA1L txA0 tx
Figure B-36: A0 Receivers on the Ground in LA2020 Receiving All Aircraft on Approach
at an Altitude of 2000 feet
0 5 10 15 20 250
2
4
6
8
10
12
14
16
18
20
Upd
ate
Tim
e (s
ec)
Range (NM)
A3 txA2 txA1H txA1L txA0 tx
Figure B-37: A0 Receivers on the Ground in CE2015 Receiving All Aircraft on Approach
at an Altitude of 2000 feet to Brussels co-located with a 10 kW 979 MHz TACAN
© 2005
ACP-WGW01/AI-1Appendix D

Appendix B Page B - 38
Recall that the LA2020 scenario, in addition to a total of 2694 aircraft (75 on the ground at LAX) transmitting UAT, also includes 100 transmitting ground vehicles at LAX as well. Furthermore, the CE2015 scenario has 2091 aircraft transmitting UAT, including 25 aircraft and 100 ground vehicles on the surface in Brussels.
B.4.7 TIS-B Performance of UAT in the LA2020 Environment
An analysis was performed to investigate UAT ground-to-air performance of TIS-B uplinks in the high density air traffic environment of LA2020 (see Section B.4.1 for a description of the LA2020 scenario). This section presents the results of that work. Section B.4.7.1 reviews many of the additional assumptions necessary to describe the system under study, and Section B.4.7.2 summarizes the results of the analysis.
B.4.7.1 Additional TIS-B Assumptions
This section describes additional assumptions (to those described in Section B.4.1 for the LA2020 scenario), which were necessary to describe a more complete ground infrastructure for the UAT system. It addresses the number and locations of UAT ground stations, their basic operation, and the TIS-B transmissions from these ground stations.
A total of 21 locations for UAT ground stations were selected for the Los Angeles Basin region defined for the LA2020 scenario. Most of these were selected to be located at various airports in the area. Each of these stations was responsible for the aircraft in a defined service volume, as shown in Figure B-38 below.
126oW 123oW 120oW 117oW 114oW 111oW 27oN
30oN
33oN
36oN
39oN
40
30
41
34
39 25
28 15
24
22 26
29
16
56
55
41
41
31
57 89 52
Figure B-38: Locations of UAT Ground Stations, Including Service Volumes and Number of Uplinks per Second (2008) in Each Service Volume for LA2020 Scenario
© 2005
ACP-WGW01/AI-1Appendix D

Appendix B Page B - 39
TIS-B transmissions were assumed to be made in the ADS-B segment of the UAT frame by the Ground Stations, using two possible scheduling algorithms. One was the so-called “Capstone” algorithm, because it reflects the technique implemented for the UAT Ground Stations acquired for the Alaska Capstone program. The other algorithm studied was a simple random selection method.
Two operational time frames were investigated: near-term (2008) reflecting no ADS-B equipage, with TIS-B updates provided by radar reports; and 2020, assuming 100% ADS-B equipage (40% 1090 ES and 60% UAT), with TIS-B updates provided by ADS-B rebroadcast (ADS-R). The radar updates occurred once every 1.2 to 4.8 seconds, depending on the altitude of the aircraft, while ADS-R updates were assumed to be provided at a constant rate of once per second.
TIS-B uplinks were assumed to begin at a MSO, and were further assumed to consist of a Long UAT ADS-B Message. The Ground Station transmit power was assumed to be 45 dBm, with an antenna gain pattern that is omni-directional in azimuth and TACAN in elevation. A number of airborne receivers were studied, but the results reported here are for the worst-case Class A1 receiver type.
B.4.7.2 TIS-B Results
Figure B-39 shows the results for the 95% TIS-B update interval for a receiver located at a worst case position in the near term (2008) scenario, receiving TIS-B messages from LAX. There are three sets of outcomes shown on the graph, representing the update intervals for the three different radar detection intervals: 1.2 seconds, 2.4 seconds, and 4.8 seconds. For each detection interval, results are shown for both a single UAT transmission for each update and for two transmissions per update. For this scenario, there appears to be little difference in UAT TIS-B uplink performance between the two algorithms, although in this high density air traffic environment with low ADS-B equipage, repeating the TIS-B uplink message does seem to provide an important advantage.
4.8 sec 2.8 sec 1.2 sec0
1
2
3
4
5
6
7
8
9
10
TIS
-B U
pd
ate
Inte
rval
(se
c)
Detection Interval
Random - No RepeatCapstone - No RepeatRandom - One RepeatCapstone - One Repeat
Figure B-39: TIS-B 95% Update Intervals in LA 2008 (No ADS-B Equipage)
© 2005
ACP-WGW01/AI-1Appendix D

Appendix B Page B - 40
The ADS-B air-to-air UAT performance is affected by the large amount of TIS-B uplink traffic coming from the UAT Ground Stations in this near-term scenario. However, as shown in Figure B-40, the effect is not sufficiently large to cause the performance to exceed the required ADS-B 95% update time.
0 5 10 15 20 25 30 35 40 45 500
2
4
6
8
10
12
14
16
18
20
95t
h P
erce
nti
le U
pd
ate
Tim
e (s
ec)
Range (NM)
Location #3 - A1L transm itters
N o UplinkTIS-B w/ Random M ethodTIS-B w/ Capstone M ethod
Figure B-40: ADS-B 95% Update Interval in Near-Term Scenario
For the LA2020 scenario, all aircraft are assumed to be ADS-B equipped with either 1090 MHz Extended Squitter or UAT, so all ground uplinks are ADS-R and updates are assumed to occur every second for each 1090ES-equipped aircraft. Table B-5 below shows the 95% update time for the ADS-R transmissions as received at an airborne receiver located near a number of ground stations in the dense central area of the scenario. Note that the 95% time for the Capstone slot selection algorithm is around two seconds for all of the ground stations.
Table B-5: 95% Update Times for ADS-R Transmissions from UAT Ground Stations in LA2020
Ground Station
Uplinks per sec
Range (NM) Random Capstone
1 (LAX) 89 36.6 2.3 2.0
5 55 38.2 2.5 2.0
6 41 33.6 2.3 2.0
7 41 51.2 3.0 2.1
© 2005
ACP-WGW01/AI-1Appendix D

Appendix B Page B - 41
Figure B-41 shows the effect of the ADS-R transmissions from the ground stations on the ADS-B air-to-air performance of Class A1L transmitters to the Class A1 airborne receiver. Note that there were four algorithms tested for this case, and all made the ADS-B air-to-air performance worse than with no ground transmissions, but none caused the ADS-B performance to exceed the required 95% update time.
0 5 10 15 20 25 30 35 40 45 500
2
4
6
8
10
12
14
16
18
20
95t
h P
erce
nti
le U
pd
ate
Tim
e (s
ec)
Range (NM)
Location #3 - A1L transmitters
No RebroadcastQueue MethodRandom MethodCapstone MethodMod. Queue Method
Figure B-41: ADS-B Air-to-Air Performance in the Presence of ADS-R Ground Transmissions in LA2020
B.4.7.2.1 TIS-B Hotspot Analysis
This section discusses the performance of a Class A3 receiver in the Core Europe 2015 traffic scenario attempting to receive ADS-B Messages from one other airborne UAT transmitter in an extreme TIS-B interference environment. This is intended to be a worst case analysis of the early transition to ADS-B in which most aircraft are not equipped with UAT transmitters. The term 'hotspot' has been used to describe the effect to be simulated here, where one ground-based transmitter generates all TIS-B Message traffic (in the ADS-B segment of the one-second frame) rather than the distributed nature of the airborne transmitters in the standard CE 2015 scenario. It is the intention of this section to estimate the effect that this hotspot has on airborne ADS-B performance in CE 2015.
To estimate the worst-case of TIS-B uplinks providing interference, it was assumed that only two aircraft are equipped with ADS-B in the CE2015 scenario. In the CE2015 scenario, there are approximately 1000 aircraft within line-of-sight of a ground station at Brussels. Therefore, for the worst case the ground station is assumed to transmit 1000 TIS-B messages per second in the ADS-B segment of the UAT frame. Other cases, where the ground station transmits fewer than 1000 messages/second, are also reported. In addition to the TIS-B interference, Link 16 Baseline B, co-site and the appropriate DME interference are all assumed to be present.
© 2005
ACP-WGW01/AI-1Appendix D
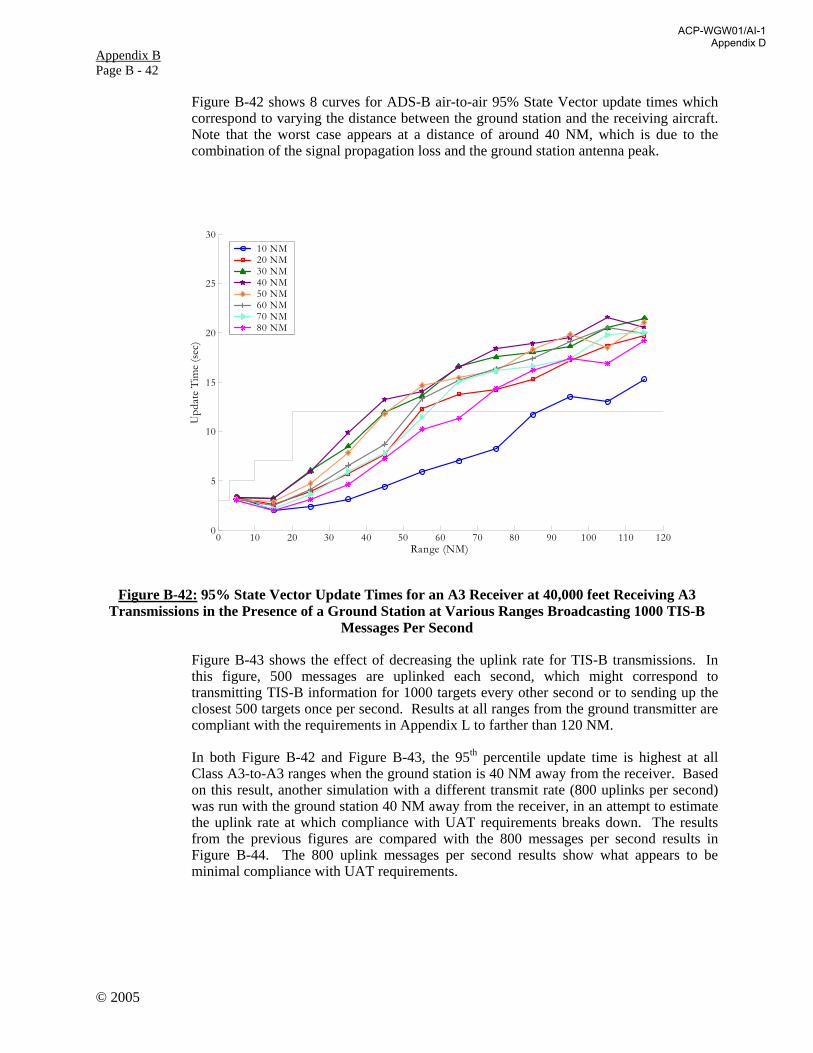
Appendix B Page B - 42
Figure B-42 shows 8 curves for ADS-B air-to-air 95% State Vector update times which correspond to varying the distance between the ground station and the receiving aircraft. Note that the worst case appears at a distance of around 40 NM, which is due to the combination of the signal propagation loss and the ground station antenna peak.
0 10 20 30 40 50 60 70 80 90 100 110 1200
5
10
15
20
25
30
Upd
ate
Tim
e (s
ec)
Range (NM)
10 NM20 NM30 NM40 NM50 NM60 NM70 NM80 NM
Figure B-42: 95% State Vector Update Times for an A3 Receiver at 40,000 feet Receiving A3 Transmissions in the Presence of a Ground Station at Various Ranges Broadcasting 1000 TIS-B
Messages Per Second
Figure B-43 shows the effect of decreasing the uplink rate for TIS-B transmissions. In this figure, 500 messages are uplinked each second, which might correspond to transmitting TIS-B information for 1000 targets every other second or to sending up the closest 500 targets once per second. Results at all ranges from the ground transmitter are compliant with the requirements in Appendix L to farther than 120 NM.
In both Figure B-42 and Figure B-43, the 95th percentile update time is highest at all Class A3-to-A3 ranges when the ground station is 40 NM away from the receiver. Based on this result, another simulation with a different transmit rate (800 uplinks per second) was run with the ground station 40 NM away from the receiver, in an attempt to estimate the uplink rate at which compliance with UAT requirements breaks down. The results from the previous figures are compared with the 800 messages per second results in Figure B-44. The 800 uplink messages per second results show what appears to be minimal compliance with UAT requirements.
© 2005
ACP-WGW01/AI-1Appendix D

Appendix B Page B - 43
0 10 20 30 40 50 60 70 80 90 100 110 1200
5
10
15
20
25
30
Upd
ate
Tim
e (s
ec)
Range (NM)
10 NM20 NM30 NM40 NM50 NM60 NM70 NM80 NM
Figure B-43: 95& State Vector Update Times for an A3 Receiver at 40,000 feet
Receiving A3 Transmissions in the Presence of a Ground Station at Various Ranges Broadcasting 500 RIS-B Messages Per Second
0 10 20 30 40 50 60 70 80 90 100 110 1200
5
10
15
20
25
30
Upd
ate
Tim
e (s
ec)
Range (NM)
1000 uplinks/sec800 uplinks/sec500 uplinks/sec
Figure B-44: 95th Percentile State Vector Updates Times for an A3 Receiver at
40,000 feet Receiving A3 Transmissions in the Presence of a Ground Station 40 NM Away at Various Uplink Rates
© 2005
ACP-WGW01/AI-1Appendix D

Appendix B Page B - 44
These results provide guidance for a potential limit on the TIS-B uplink transmission rate that can be supported in this high air traffic density type of environment. In principle, the analysis shows that, during the period of transition from no ADS-B equipage to more substantial equipage rates, a level of 800 uplink messages/second from a single UAT ground station should allow the UAT required update rates to be achieved for air-air reception.
B.5 Model Validation
The validation effort for MAUS focused on reproducing a complete interference environment. The United States Federal Aviation Administration’s (FAA) William J. Hughes Technical Center (FAATC) developed a UAT interference simulator, which was capable of reproducing both the LA2020 and CE2015 UAT self-interference environments. The additional capability of simultaneously inserting DME and Link 16 interference along with the UAT self interference was also implemented, resulting in emulation of high density, stressful environments containing a combination of all three types of interference. This simulator, along with “desired” UAT messages were combined and fed into UAT MOPS compliant UAT receivers. The Message Success Rate (MSR) was then measured as a function of desired signal level for various combinations of interference, and compared with predictions of the MAUS for identical circumstances and assumptions. In all cases, the predictions of the MAUS were in agreement with the measured results, within the experimental uncertainties. An example of this comparison is shown in Figure B-45 for the LA2020 UAT self interference environment. The results comparing measurements taken at the FAATC and the Joint Spectrum Center of the Defense Information Systems Agency (JSC) on UAT MOPS compliant equipment with MAUS simulation results are shown in Figure B-45.
JSC MOPS Combined Interference Testing
0
10
20
30
40
50
60
70
80
90
100
-100 -95 -90 -85 -80 -75 -70 -65 -60 -55 -50
UAT Level (dBm)
MSR (%)
-0.8 MHz BW JSC LA ONLY-1.2 MHz BW JSC LA ONLYAPL LA2020 - 0.8APL LA2020 - 1.21.2 MSR (FAATC)
LA 2020 Self-Interference Environment ONLY
Figure B-45: Comparison of Bench Test Measurements of MOPS-Compliant UAT Reception
in LA2020 Self-Interference with Predictions by MAUS
© 2005
ACP-WGW01/AI-1Appendix D

Appendix B Page B - 45
As is evident from Figure B-45, there is very little difference between the bench test data and the predictions of the MAUS. The two sets of data are quite consistent with each other within the limits of measurement. It is important to note that there were no free parameters that needed to be adjusted to achieve this agreement. This type of validation provides an increased measure of confidence in the simulation predictions.
Bench test measurements were also made of the Core Europe environment, which included UAT self-interference, DME/TACAN interference, and Link 16 interference. Results of these measurements are shown in Figure B-46 and Figure B-47. Figure B-46 shows the measurement results for the 0.8 MHz filter receiver, which is to be used for A3 class equipment. The addition of Link 16 interference to the DME/TACAN and UAT interference results in a reduction in MSR of up to around 10% for a given desired signal level, although the curves are much closer than that over much of the signal range. Simulation results have not been run for comparison in this scenario; however, there is a slight reduction in performance when Link 16 interference is added to the identical Core Europe scenario.
0.8 MHz UAT Receiver Combined Interference Testing
0
10
20
30
40
50
60
70
80
90
100
-100 -95 -90 -85 -80 -75 -70 -65 -60 -55 -50
UAT Level (dBm)
MSR (%)
0.8 MHz CE2015 Only
0.8 MHz CE2015; High Alt DME
0.8 MHz CE2015; High Alt DME; JTIDSSnapshot UAT 001 100/50 (300)
Core Europe 2015; High Altitude DME = 2 TACAN's (-56 and -71 dBm) / 1 DME (-64 dBm) all @ +1 MHz; JTIDS Snapshot UAT 001 100/50 (300) = 50% FG @ -42 dBm + 50% R1 @ -63 dBm +
300% Background @ -87 dBm(Standard JTIDS interference Levels adjusted for Line Loss)
Figure B-46: Bench Test Measurements of UAT Performance in Core Europe UAT Self-Interference, Combined with DME/TACAN and Link 16 Interference
Figure B-47 shows the results for measurements taken with the 1.2 MHz receiver filter, which corresponds to the receiver used for all equipage classes other than A3. These results are similar in nature to those for the Core Europe scenario shown in Figure B-46, in that the addition of Link 16 interference results in a small reduction of the MSR at a given desired signal level.
© 2005
ACP-WGW01/AI-1Appendix D

Appendix B Page B - 46
1.2 MHz UAT Receiver Combined Interference Testing
0
10
20
30
40
50
60
70
80
90
100
-100 -95 -90 -85 -80 -75 -70 -65 -60 -55 -50
UAT Level (dBm)
MSR (%)
1.2 MHz LA2020 Only
1.2 MHz LA2020 and High Alt DME Only
1.2 MHz LA 2020; High Alt DME; JTIDSSnapshot UAT 001 100/50 (300)
LA 2020; High Altitude DME = 2 TACAN's (-56 and -71 dBm) / 1 DME (-64 dBm) all @ +1 MHz; JTIDS Snapshot UAT 001 100/50 (300) = 50% FG @ -42 dBm + 50% R1 @ -63 dBm +
300% Background @ -87 dBm(Standard JTIDS interference Levels adjusted for Line Loss)
Figure B-47: Bench Test Measurements of UAT Performance in the LA2020 UAT Self-Interference, Combined with DME/TACAN and Link 16 Interference
© 2005
ACP-WGW01/AI-1Appendix D

Appendix C
Standard Interference Environments
ACP-WGW01/AI-1Appendix D

This Page Intentionally Left Blank
ACP-WGW01/AI-1Appendix D

Appendix C Page C - 3
© 2005
C Standard Interference Environment
C.1 Background
The Universal Access Transceiver (UAT) is designed to operate in the lower portion of the 960 - 1215 MHz aeronautical radionavigation service (ARNS) band. This portion of the band is heavily utilized throughout the world for International Civil Aviation Organization (ICAO) standard systems such as Distance Measuring Equipment (DME), and military systems such as Tactical Air Navigation (TACAN), and in some countries the Joint Tactical Information Distribution System/Multifunctional Information Distribution Systems (JTIDS/MIDS). Each of these systems share a common characteristic in that they utilize pulses that are short in relation to UAT pulses. As a result, the UAT waveform and receiver front-end has been specifically tailored to tolerate a high-density pulsed environment. In addition, the random-start nature of the UAT ADS-B access protocol results in self-interference. The extent of this interference is dependent on the number of aircraft visible to the “victim” UAT.
Because of the complexity of the potential interference environment, UAT performance in an operational environment was determined through the use of high-fidelity computer simulations. Those simulations were based on two specific inputs:
1. The performance of the UAT receiver in the presence of interference1 as a function of signal-to-interference and desired-to-undesired signal overlap; and
2. The time/amplitude distribution of interfering signals. This Appendix will address the assumptions driving the latter input, while the UAT test specifications (RTCA DO-282A, §2.4) will ensure that UAT equipment meeting the UAT MOPS (RTCA DO-282A) can match the assumed UAT performance.
C.2 Operational Environments
The operating frequency of UAT at 978 MHz was selected to minimize the impact to existing DME/TACAN use. That DME/TACAN channel (17X) is reserved worldwide for “emergency use,” and as a result there exist very few operational 978 MHz DME/TACAN systems. In the United States for example, both 978 MHz and 979 MHz are reserved for DME “ramp tester” equipment. Such an application is very low power, offering no interference to UAT usage2. Europe however does use both 978 MHz and 979 MHz for operational DME/TACAN, so European scenarios considered DME/TACAN as an interference source. It should be noted that early test and analysis results indicated that, for off-board DME/TACAN, only those that were co-frequency and/or first adjacent-frequency to the UAT (i.e., on 978 or 979 MHz) need be considered. This accrued as a result of the narrow spectral content of the DME/TACAN signals, in concert with the good frequency rejection properties of the UAT receiver. While the UAT SARPs contain a rejection of pulsed interference requirement for 980 MHz DMEs as well as DMEs operating at frequencies above 980 MHz, the impact of this interference on overall UAT system performance is projected to be negligible.
1 This performance was quantified through high-fidelity bench test measurements. 2 Testing and analysis has also shown that co-frequency UAT usage will not interfere with ramp tester implementation.
ACP-WGW01/AI-1Appendix D

Appendix C Page C - 4
© 2005
Driven by the diverse environments in which UAT would operate, a number of different interference scenarios were postulated and simulated. The goal was to ensure that the UAT design would provide the necessary performance as UAT traffic increases in the future and to ensure that UAT receivers are measured against the most challenging interference environment from JTIDS/MIDS3 and DME sources. Within a given scenario, UAT receiver locations were chosen to represent the most challenging geographic areas.
Aircraft distributions were based on scenarios developed by the joint United States Federal Aviation Administration (FAA)/Eurocontrol Technical Link Assessment Team (TLAT) to assess candidate ADS-B links. One scenario was intended to represent a low-density air traffic environment, while another mimicked introducing UAT into today’s Core Europe setting. The final two “future” scenarios predicted Los Angeles Basin 2020 and Core Europe 2015 environments respectively. Together these scenarios provided diverse assessments of UAT performance, and their characteristics are catalogued in Table C-2. Note that to fully assess the resulting performance of a victim UAT receiver, practical UAT receiver implementation limitations that impact receiver availability are also included.
To analyze DME interference in core Europe, the International Civil Aviation Organization (ICAO) database4 of existing and planned DME/TACAN assignments was examined. While the underlying assumption for DME/TACAN is that co-channel assignments will eventually need to be moved in order to achieve full operational UAT performance, it is also recognized that in the near-term low-density UAT self-interference environments offer performance margin that could be used to accommodate co-channel DME/TACAN interference. Geographic analysis of existing DME/TACAN assignments – i.e., quantifying the number and power of received DME/TACAN signals at geographic points in space – resulted in development of the environments shown in Table C-3 to capture current worst-case DME/TACAN conditions. In recognition of future environments, the UAT design was tailored to ensure that UAT could provide an adequate level of performance as 978 MHz DME/TACANs are reassigned over time. As part of this, noting that current “planned” assignments allow latitude for regulators to expand usage of 979 MHz, assumptions were made to predict future DME/TACAN interference. In particular, for the Core Europe 2015 scenario, it was assumed that while all 978 MHz DME/TACANs were reassigned, all planned 979 MHz assignments in ICAO database had become operational. Details of the resultant environments are captured in Table C-4. In total, the goal of each of the test scenarios was to reasonably over-bound any operational environment the UAT could be expected to experience.
Sample Derivation:
Figure C-1 illustrates a scenario in today’s environment focusing on an aircraft at 40,000 feet flying over Germany. Using the DME/TACAN emitter location and power information from the ICAO database, the DME and TACAN normalized ground station antenna patterns shown in Figures C-2 and C-3, relative emitter-aircraft geometry, and
3 JTIDS/MIDS scenarios are defined in terms of source time slot duty factor (a measure of number of pulses per second), and source received power level. For the MOPS effort a number of operational JTIDS/MIDS scenarios were provided by the US Department of Defense as representing postulated training needs. These were included as part of the standard interference environment as shown in Table C-2. 4 Listings were reviewed/verified by Eurocontrol.
ACP-WGW01/AI-1Appendix D

Appendix C Page C - 5
© 2005
propagation loss equations, the values in Table C-15 can be derived. Repeating for various locations/geometries allowed the worst-case positions to be determined and utilized for compatibility analyses.
0o 2oE 4oE 6oE 8oE 10oE 12oE 14oE 16oE 18oE 44oN
45oN
46oN
47oN
48oN
49oN
50oN
51oN
52oN
53oN
54oN
55oN
56oN
AHLHORN
FURSTENFELDBRUCK
METZ/FRESCATY
ALL GERMANY
GEILENKIRCHEN
(BRU) A irc ra f t
Figure C-1: Sample Scenario
-40 -35 -30 -25 -20 -15 -10 -5 0-40
-35
-30
-25
-20
-15
-10
-5
0
Figure C-2: Normalized DME Pattern
5 Note these levels are also reflected in row 4 of Table C-3. The “All Germany” emitter reflects a mobile TACAN. For the purpose of this assessment it was placed in the worst-case location allowed by channel assignment rules.
ACP-WGW01/AI-1Appendix D

Appendix C Page C - 6
© 2005
-40 -35 -30 -25 -20 -15 -10 -5 0-40
-35
-30
-25
-20
-15
-10
-5
0
Figure C-3: Normalized TACAN Pattern
Table C-1: Signal Level Analysis of the Sample Scenario
AHLHORN FURSTENF… METZ/FRE… GEILENKI… ALL_GERM…
Type TAC TAC TAC TAC Mobile TAC Longitude (deg) 8.233 11.150 6.133 6.017 9.298 Latitude (deg) 52.883 48.217 49.067 50.967 50.525 Frequency (MHz) 978 978 978 979 979 Ground Distance (NM) 148.7 155.2 150.1 128.0 1.5 Elevation Angle (deg) 2.54 2.43 2.51 2.94 77.13 EIRP (dBm) 70 70 70 67 70 Normalized Ground Antenna Gain (dB) -2.67 -2.81 -2.71 -2.19 -13.25 Free-Space Propagation Loss (dB) -141.05 -141.42 -141.14 -139.77 -114.19 Rec. Power at Aircraft Antenna (dBm) -73.72 -74.23 -73.85 -74.96 -57.44
C.3 Co-Site Environment
In addition to all the scenarios for the external interference environment, effects were included to account for on-board sources of interference from systems operating in the 960 MHz to 1215 MHz band. The components of this co-site environment were estimated during the TLAT deliberations and have been further refined for the expected UAT aircraft installations. This environment was selected to be conservative and consistent for all aircraft classes, which resulted in including, for example, the assumption that A0 aircraft could be equipped with Airborne Collision Avoidance Systems (ACAS). The co-site environment is defined in Table C-5, depicting the assumptions of transmission duration and rates of onboard transmitters operating in the 960 MHz to 1215 MHz band, including signals from onboard DME equipment, ACAS and transponders. Also noted is the allowance made for receiver recovery time under the assumption that pulse suppression circuitry is employed.
ACP-WGW01/AI-1Appendix D

Appendix C Page C - 7
© 2005
C.4 Scenario Assessments
With the preceding environments established, ADS-B reception performance was assessed for various receiver types in various locations within the environment6. The primary metric was the update interval achieved at a 95% confidence level for 95% of the aircraft population of interest. In early assessments of air-air surveillance performance, the aircraft population of interest was limited in elevation relative to the own aircraft in order to eliminate from consideration targets that were of no operational interest (see Figure C-4). However, this limitation of the aircraft population of interest was not used in the performance assessment reported in the UAT MOPS, RTCA DO-282A, Appendix K because an alternate method of using “probes” was employed as described in that Appendix.
Table C-6 is a matrix delineating the individual simulations performed in making design decisions for the UAT MOPS, RTCA DO-282A. Results from a select subset of these simulation runs are provided in Appendix B to indicate performance that can be expected of a UAT built to the standards of the UAT MOPS, RTCA DO-282A.
6 It is recognized that UAT ground stations in close geographic proximity to 978 or 979 MHz DME/TACAN transponders may require special siting to ensure proper operation of the UAT equipment.
ACP-WGW01/AI-1Appendix D

Appendix C Page C - 8
© 2005
Table C-2: Interference Scenarios and Implementation Assumptions
Scenarios Core Europe 2015 Core Europe Current LA 2020 Low Density
UAT Self Interference
Per TLAT Core Europe 2015 (2091 a/c in 300 NM radius)
+ 100 Surface vehicles per major
airport @ 28-32 dBm and 1 Basic message/sec
1193 aircraft 500 ground vehicles
300 NM radius
Per TLAT LA 2020 (2694 a/c in 400 NM radius)
+ 100 Surface vehicles per major
airport @ 28-32 dBm and 1 Basic message/sec
Per TLAT Low Density (360 a/c in 400 NM radius)
+ No surface vehicles
DME All currently planned 979
assignments See Table C-4
All current 978 MHz and 979 MHz assignments
See Table C-3
None
Same DME environment
as CE 2015 St
anda
rd In
terf
eren
ce E
nvir
onm
ent
JTIDS (levels seen at UAT victim antenna port)
TSDF 50% @ -39 dBm +
TSDF 50% @ -60 dBm +
TSDF 300% @ -84.5 dBm
TSDF 50% @ -39 dBm +
TSDF 50% @ -60 dBm +
TSDF 300% @ -84.5 dBm
TSDF 50% @ -39 dBm +
TSDF 50% @ -60 dBm +
TSDF 300% @ -84.5 dBm
TSDF 50% @ -39 dBm +
TSDF 50% @ -60 dBm +
TSDF 150% @ -78 dBm +
TSDF 150% @ -82 dBm
Co-site See Table C-5 (scenario independent)
Re-trigger capable T/R switching results in 2 millisecond receiver blanking immediately before and after own-ship transmissions
-20 dBc pedestal for 4 usec duration immediately before and after own-ship transmission
Inst
alla
tion
and
Impl
emen
tatio
n A
ssum
ptio
ns
UAT Implementation
Effects (Applies to all
classes) “Pulse stretching” effects from high level DME seen in bench tests of “Pre-MOPS” units included in model
ACP-WGW01/AI-1Appendix D

Appendix C Page C - 9
© 2005
Table C-3: Received Power Levels (dBm) for Current European DME/TACAN Environment
Aircraft (Lat, Lon) Alt (ft) AHLHORN METZ/FRE… FURSTENF… ALL_GERM… BRUGGEN GEILENKI… 50.9 deg, 4.5 deg 40000 -76 -72 -79 -66 50.9 deg, 4.5 deg 15000 -75 -69 50.5 deg, 9.3 deg 40000 -74 -74 -74 -57 -75 50.5 deg, 9.3 deg 15000 -76 -76 -77 -53
Not Operational
-78
Table C-4: Received Power Levels (dBm) for 2015 European DME/TACAN Environment
Aircraft (Lat, Lon) Alt (ft) AHLHORN METZ/FRE… FURSTENF… ALL_GERM… BRUGGEN GEILENKI… 50.9 deg, 4.5 deg 40000 -77 -76 -66 50.9 deg, 4.5 deg 15000 -68 -76 -69 51.0 deg, 6.0 deg 40000 -70 -76 -62 51.0 deg, 6.0 deg 15000
Assumed Cleared
-72 -72 -56
Table C-5: Co-site Environment
Event Blanking Interval (usec) Events per Second
Event Event Duration Additional
Blanking due to Rx Recovery
A0 A1 (L)/(H) A2 A3
DME Interrogations 19 15 µsec 70 70 70 70
ATCRBS Replies 20 15 µsec 200 200 200 200 Mode S Replies 64 15 µsec 4.5 4.5 4.5 4.5
Mode S Interrogations 20 15 µsec 5 5 5 5
Whisper Shout Interrogations 25 15 µsec 80 80 80 80
ACP-WGW01/AI-1Appendix D

Appendix C Page C - 10
© 2005
Figure C-4: Targets of Interest for Computing Update Interval
12,0
00’
30,0
00’
3 NM
10 NM
20 NM
3
000’
No
Alti
tude
Lim
its B
eyon
d 20
NM
ACP-WGW01/AI-1Appendix D

Appendix C Page C - 11
©2005
Table C-6: Overview of Scenario Assessments
Perspective of Victim Receiver Scenario
Location Altitude Rx Type Core Europe 2015
Core Europe Current LA 2020 Low Density
A3 x x x x A2 x x x 40,000’ A1 x (H) x(H) x (H)
A2/A3 x x x A1 x x x 15,000’ A0 x x x
On Approach (2000’) A0-A37 x x x
A08 x x9 Ground Station x x10
At Scenario Center
On Surface (979 MHz DME
@ -10 dBm) Ground Station11 x A3 x x x A2 x x 40,000’ A1 x(H) x(H)
A2/A3 x x A1 x x
At Worst Case DME
15,000’ A0 x x
7 Update intervals based on aircraft “probe” approaching from 20 miles 8 Update intervals based on aircraft “probe” approaching from 20 miles at 2000’ 9 No DME interference included in this case 10 No DME interference included in this case 11 With cavity filter in line that is assumed to reduce DME interference to that equivalent of on-channel DME at –50 dBm. Filter assumed to introduce insertion loss of 4 dB
ACP-WGW01/AI-1Appendix D

Appendix C Page C - 12
©2005
This Page Intentionally Left Blank
ACP-WGW01/AI-1Appendix D

Appendix D
UAT Receiver Performance in the Presence of DME/TACAN, JTIDS/MIDS and Self-Interference
ACP-WGW01/AI-1Appendix D

This Page Intentionally Left Blank
ACP-WGW01/AI-1Appendix D

Appendix D Page D - 3
©2005
D. UAT Receiver Performance in the Presence of DME/TACAN, JTIDS/MIDS and Self-Interference
D.1 Introduction
Tests were conducted during the early standards work of UAT to insure that the UAT system provides acceptable performance in the intended future worst-case environments. Results of testing with the Standard Interference Environment described in Appendix C are summarized in Appendix B. Extensive testing was conducted on prototype UAT receivers and additional testing was conducted on production-level equipment to characterize UAT receiver performance and validate acceptable performance of equipment that is designed to the developed standards. As described in Appendix C, sources of interference to the UAT receiver include on-channel self- interference from other UAT transmitters, DME on-channel or adjacent channel and JTIDS/MIDS signals that periodically occupy the frequency band at or near the 978 MHz UAT center frequency. The following test results contain data that was collected to assess UAT receiver performance against each interference source individually and in combination.
D.2 Pre-Production Testing
Testing was conducted during the development of the RTCA UAT MOPS (RTCA/DO-282A) to characterize UAT receiver performance when subjected to signals from systems that could impact UAT receiver performance. Testing also served to insure that receiver requirements specified resulted in expected performance. Pre-production units (which will be referred to here as “Pre-MOPS” units) were produced and used as victim receivers subjected to various interference scenarios to characterize and validate performance. Pre-MOPS receivers that were tested included both the Standard Receiver and the High Performance Receiver. For the purposes of the data presented in this section, the Standard Receiver is referred to as the 1.2 MHz Receiver and the High Performance Receiver is the 0.8 MHz receiver denoting the receiver filter bandwidths of each Pre-MOPS receiver type.
D.2.1 DME/TACAN Testing
Testing was conducted subjecting the Pre-MOPS receivers to various DME and TACAN signal powers and rates to assess impact. DME frequencies were selected to assess impact of on-channel DME interference, 1 MHz adjacent channel and 2 MHz off channel DME signals. In each of the series of test runs, a desired UAT signal was subjected to the DME or TACAN interference where the desired signal level was varied, typically in 1 dB steps, from below receiver sensitivity to above a power level where receiver performance was no longer impacted by the interference source.
The following data presents results from subjecting the UAT receiver with DME pulse pairs at various rates and amplitudes. The results of receiver performance with DME at 2700 pulse pairs per second 2 MHz from the UAT frequency are contained in Figure D-3. Power levels of the DME interference injected were -15, -21, -27 and -34 dBm. The results indicate that the Standard Receiver provides slightly better performance to DME signals 2 MHz above the UAT frequency.
ACP-WGW01/AI-1Appendix D

Appendix D Page D - 4
©2005
JSC Pre-MOPS Combined Interference Testing
0
10
20
30
40
50
60
70
80
90
100
-100 -95 -90 -85 -80 -75 -70 -65 -60 -55 -50
UAT Level (dBm)
MSR
(%)
0.8 MHz -15 dBm0.8 MHz -21 dBm0.8 MHz -27 dBm0.8 MHz -34 dBm1.2 MHz -15 dBm1.2 MHz -21 dBm1.2 MHz -27 dBm1.2 MHz -34 dBm
0.8 and 1.2 MHz ReceiverDME 2700 + 2 MHz OFF Channel Tests
Figure D-3: UAT Receiver Performance DME 2700 Pulse Pairs at +2 MHz
Figure D-4 and Figure D-5 contain results from subjecting the Standard Receiver and the High Performance Receiver, respectively, to DME at 2700 pulse pairs per second 1 MHz above the UAT frequency at various amplitudes.
ACP-WGW01/AI-1Appendix D

Appendix D Page D - 5
©2005
JSC Pre-MOPS Combined Interference Testing
0
10
20
30
40
50
60
70
80
90
100
-100 -95 -90 -85 -80 -75 -70 -65 -60 -55 -50
UAT Desired Signal Level (dBm)
MSR
(%)
DME = -15 dBm
DME = -20 dBm
DME = -26 dBm
DME = -34 dBm
DME = -37 dBm
DME = -40 dBm
DME = -43 dBm
DME = -46 dBm
DME = -49 dBm
DME = -52 dBm
DME = -55 dBm
DME = -58 dBm
DME = -61 dBm
DME = -64 dBm
DME = -67 dBm
DME = -70 dBm
DME = -73 dBm
DME = -76 dBm
DME = -79 dBm
DME = -82 dBm
DME = -88 dBm
DME = -94 dBm
DME = -127 dBm
1.2 MHz Bandwidth UAT+1 MHz OFF CHANNEL DME 2700 PPPS
(With ID Tone ON)
Figure D-4: UAT Standard Receiver Performance DME 2700 Pulse Pairs at +1 MHz
ACP-WGW01/AI-1Appendix D

Appendix D Page D - 6
©2005
JSC Pre-MOPS Combined Interference Testing
0
10
20
30
40
50
60
70
80
90
100
-100 -95 -90 -85 -80 -75 -70 -65 -60 -55 -50
UAT Desired Signal Level (dBm)
MSR
(%)
DME = -15 dBm
DME = -20 dBm
DME = -26 dBm
DME = -34 dBm
DME = -37 dBm
DME = -40 dBm
DME = -43 dBm
DME = -46 dBm
DME = -49 dBm
DME = -52 dBm
DME = -55 dBm
DME = -58 dBm
DME = -61 dBm
DME = -64 dBm
DME = -67 dBm
DME = -70 dBm
DME = -73 dBm
DME = -76 dBm
DME = -79 dBm
DME = -82 dBm
DME = -88 dBm
DME = -94 dBm
DME = -127 dBm
0.8 MHz Bandwidth UAT+1 MHz OFF CHANNEL DME 2700 PPPS
(With ID Tone ON)
Figure D-5: UAT High Performance Receiver with DME 2700 Pulse Pairs at +1 MHz
Figure D-6 and Figure D-7 contain results from subjecting the Standard Receiver and the High Performance Receiver, respectively, to DME at 2700 pulse pairs per second on the UAT frequency at various amplitudes.
Figure D-8 through Figure D-14 contain similar results except that the DME pulse pairs were injected at the higher 3600 pulse pairs per second rate.
Figure D-15 shows a comparison between DME and TACAN interference to both the Basic and High Performance UAT Receivers. A simulated DME station at 3600 pulse pairs per second (DME signals are normally not transmitted at this rate) is compared to TACAN at 2700. The power level of -60 dBm was applied to the UAT receiver at a frequency offset of 1 MHz from the UAT operating frequency. Figure D-15 shows comparable performance between DME and TACAN interference at the same amplitude; the number of pulses pairs is the dominant performance consideration. Comparison of UAT Basic and High Performance Receivers indicates improved performance with the High Performance Receiver when subjected to DME/TACAN pulse pairs that are 1 MHz offset from UAT.
ACP-WGW01/AI-1Appendix D

Appendix D Page D - 7
©2005
JSC Pre-MOPS Combined Interference Testing
0
10
20
30
40
50
60
70
80
90
100
-100 -95 -90 -85 -80 -75 -70 -65 -60 -55 -50
UAT Desired Signal Level (dBm)
MSR
(%)
DME = -12 dBm
DME = -15 dBm
DME = -21 dBm
DME = -27 dBm
DME = -34 dBm
DME = -40 dBm
DME = -46 dBm
DME = -52 dBm
DME = -58 dBm
DME = -64 dBm
DME = -70 dBm
DME = -76 dBm
DME = -82 dBm
DME = -88 dBm
DME = -94 dBm
DME = -100 dBm
BASELINE NODME
1.2 MHz Bandwidth UATON CHANNEL DME 2700 PPPS (With ID Tone
ON)
Figure D-6: UAT Standard Receiver Performance DME 2700 Pulse Pairs On Frequency
JSC Pre-MOPS Combined Interference Testing
0
10
20
30
40
50
60
70
80
90
100
-100 -95 -90 -85 -80 -75 -70 -65 -60 -55 -50
UAT Desired Signal Level (dBm)
MSR
(%)
DME = -12 dBm
DME = -15 dBm
DME = -21 dBm
DME = -27 dBm
DME = -34 dBm
DME = -40 dBm
DME = -46 dBm
DME = -52 dBm
DME = -58 dBm
DME = -64 dBm
DME = -70 dBm
DME = -76 dBm
DME = -82 dBm
DME = -88 dBm
DME = -94 dBm
DME = -100 dBm
BASELINE NODME
0.8 MHz Bandwidth UATON CHANNEL DME 2700 PPPS (With ID Tone
ON)
Figure D-7: UAT High Performance Receiver DME 2700 Pulse Pairs on Frequency
ACP-WGW01/AI-1Appendix D

Appendix D Page D - 8
©2005
JSC Pre-MOPS Combined Interference Testing
0
10
20
30
40
50
60
70
80
90
100
-100 -95 -90 -85 -80 -75 -70 -65 -60 -55 -50
UAT Desired Signal Level (dBm)
MSR
(%)
DME = -9dBm
DME = -12 dBm
DME = -15 dBm
DME = -18 dBm
DME = -21 dBm
DME = -24 dBm
DME = -27 dBm
DME = -30 dBm
DME = -33 dBm
DME = -127 dBm
1.2 MHz Bandwidth Pre-MOPS UAT Receiver+2 MHz OFF CHANNEL DME 3600 PPPS
(With ID Tone ON)
Figure D-8: UAT Standard Receiver Performance DME 3600 Pulse Pairs at +2 MHz
JSC Pre-MOPS Combined Interference Testing
0
10
20
30
40
50
60
70
80
90
100
-100 -95 -90 -85 -80 -75 -70 -65 -60 -55 -50UAT Desired Signal Level (dBm)
MSR
(%)
DME = -9dBm
DME = -12dBm
DME = -15dBm
DME = -18dBm
DME = -21dBm
DME = -24dBm
DME = -27dBm
DME = -30dBm
DME = -33dBm
DME = -127dBm
0.8 MHz Bandwidth Pre-MOPS UAT Receiver+2 MHz OFF CHANNEL DME 3600 PPPS
(With ID Tone ON)
Figure D-9: UAT High Performance Receiver DME 3600 Pulse Pairs at +2 MHz
ACP-WGW01/AI-1Appendix D

Appendix D Page D - 9
©2005
JSC Pre-MOPS Combined Interference Testing
0
10
20
30
40
50
60
70
80
90
100
-100 -95 -90 -85 -80 -75 -70 -65 -60 -55 -50UAT Desired Signal Level (dBm)
MSR
(%)
DME =-9 dBm
DME = -12 dBm
DME = -15 dBm
DME = -18 dBm
DME = -21 dBm
DME = -24 dBm
DME = -27 dBm
DME = -30 dBm
DME = -33 dBm
DME = -36 dBm
DME = -39 dBm
DME = -42 dBm
DME = -45 dBm
DME = -48 dBm
DME = -51 dBm
DME = -54 dBm
DME = -57 dBm
DME = -60 dBm
DME = -63 dBm
DME = -66 dBm
DME = -69 dBm
DME = -72 dBm
DME = -75 dBm
DME = -78 dBm
DME = -127 dBm
1.2 MHz Bandwidth Pre-MOPS UAT Receiver+1 MHz OFF CHANNEL DME 3600 PPPS
(With ID Tone ON)
Figure D-10: UAT Standard Receiver Performance DME 3600 Pulse Pairs at +1 MHz
JSC Pre-MOPS Combined Interference Testing
0
10
20
30
40
50
60
70
80
90
100
-100 -95 -90 -85 -80 -75 -70 -65 -60 -55 -50
UAT Desired Signal Level (dBm)
MSR
(%)
DME =-9 dBm
DME = -12 dBm
DME = -15 dBm
DME = -18 dBm
DME = -21 dBm
DME = -24 dBm
DME = -27 dBm
DME = -30 dBm
DME = -33 dBm
DME = -36 dBm
DME = -39 dBm
DME = -42 dBm
DME = -45 dBm
DME = -48 dBm
DME = -51 dBm
DME = -54 dBm
DME = -57 dBm
DME = -60 dBm
DME = -63 dBm
DME = -66 dBm
DME = -69 dBm
DME = -72 dBm
DME = -75 dBm
DME = -78 dBm
DME = -127 dBm
0.8 MHz Bandwidth Pre-MOPS UAT Receiver+1 MHz OFF CHANNEL DME 3600 PPPS
(With ID Tone ON)
Figure D-11: UAT High Performance Receiver DME 3600 Pulse Pairs at +1 MHz
ACP-WGW01/AI-1Appendix D

Appendix D Page D - 10
©2005
JSC Pre-MOPS Combined Interference Testing
0
10
20
30
40
50
60
70
80
90
100
-100 -95 -90 -85 -80 -75 -70 -65 -60 -55 -50
UAT Desired Signal Level (dBm)
MSR
(%)
DME = -9 dBmDME = -12 dBmDME = -15 dBmDME = -18 dBmDME = -21 dBmDME = -24 dBmDME = -27 dBmDME = -30 dBmDME = -33 dBmDME = -36 dBmDME = -39 dBmDME = -42 dBmDME = -45 dBmDME = -48 dBmDME = -51 dBmDME = -54 dBmDME = -57 dBmDME = -60 dBmDME = -63 dBmDME = -66 dBmDME = -69 dBmDME = -72 dBmDME = -75 dBmDME = -78 dBmDME = -81 dBmDME = -84 dBmDME = -87 dBmDME = -90 dBmDME = -93 dBmDME = -96 dBmDME = -99 dBmDME = -127 dBm
1.2 MHz Bandwidth Pre-MOPS UAT ReceiverON CHANNEL DME 3600 PPPS
(With ID Tone ON)
Figure D-12: UAT Standard Receiver Performance DME 3600 Pulse Pairs On
Frequency
ACP-WGW01/AI-1Appendix D

Appendix D Page D - 11
©2005
JSC Pre-MOPS Combined Interference Testing
0
10
20
30
40
50
60
70
80
90
100
-100 -95 -90 -85 -80 -75 -70 -65 -60 -55 -50
UAT Desired Signal Level (dBm)
MSR
(%)
DME = -9 dBmDME = -12 dBmDME = -15 dBmDME = -18 dBmDME = -21 dBmDME = -24 dBmDME = -27 dBmDME = -30 dBmDME = -33 dBmDME = -36 dBmDME = -39 dBmDME = -42 dBmDME = -45 dBmDME = -48 dBmDME = -51 dBmDME = -54 dBmDME = -57 dBmDME = -60 dBmDME = -63 dBmDME = -66 dBmDME = -69 dBmDME = -72 dBmDME = -75 dBmDME = -78 dBmDME = -81 dBmDME = -84 dBmDME = -87 dBmDME = -90 dBmDME = -93 dBmDME = -96 dBmDME = -99 dBmDME = -127 dBm
0.8 MHz Bandwidth Pre-MOPS UAT ReceiverON CHANNEL DME 3600 PPPS
(With ID Tone ON)
Figure D-13: UAT High Performance Receiver DME 3600 Pulse Pairs on Frequency
JSC Pre-MOPS Combined Interference Testing
0
10
20
30
40
50
60
70
80
90
100
-100 -95 -90 -85 -80 -75 -70 -65 -60 -55 -50
UAT Desired Signal Level (dBm)
MSR
(%)
0.8 MHz +1 MHz
1.2 MHz +1 MHz
0.8 MHz +2 MHz
1.2 MHz +2 MHz
0.8 MHz +3 MHz
1.2 MHz +3 MHz
0.8 MHz NO DME
1.2 MHz NO DME
DME 2700 OFF Channel Tests+1 MHz, +2 MHz and +3 MHz Comparison
DME = -15 dBm
Figure D-14: UAT Receiver Performance DME 2700 Pulse Pairs Offset in Frequency
ACP-WGW01/AI-1Appendix D

Appendix D Page D - 12
©2005
JSC Pre-MOPS Combined Interference Testing
0
10
20
30
40
50
60
70
80
90
100
-100 -95 -90 -85 -80 -75 -70 -65 -60 -55 -50
UAT Desired Signal Level (dBm)
MSR
(%)
0.8 MHz TACAN0.8 MHz DME 36001.2 MHz TACAN1.2 MHz DME 3600
TACAN 2700 versus DME 3600 at - 60 dBm and + 1 MHz
Figure D-15: UAT Receiver Performance TACAN 2700 and DME 3600 Pulse Pairs at
+1 MHz
D.2.2 JTIDS/MIDS Testing
Testing was conducted subjecting the prototype receivers to various JTIDS/MIDS scenarios. These scenarios were derived and utilized in development of the Standard Interference Environment as described in Appendix C.
Two scenarios were developed and used to test UAT performance against JTIDS/MIDS. A first scenario, depicted in the first three columns of Table C-2, is a scenario that was utilized in all prior JTIDS/MIDS and DME compatibility testing. A second scenario, depicted in the fourth column of Table C-2, consisted of a denser JTIDS/MIDS environment. Both scenarios represented multiple JTIDS/MIDS signal levels with one or more users and allocated JTIDS/MIDS pulses into groups each with an assigned duty factor and amplitude level. JTIDS/MIDS transmissions occur in time slots that are assigned randomly by the transmitter, so the scenarios were defined by the percentage occupation of legal time slots. The strongest amplitudes are the foreground transmissions followed by up to 4 rings, each with decreasing power level. Each ring is assigned a time slot duty factor (TSDF). The first scenario consisted of a 300% JTIDS/MIDS background density.
Figure D-16 shows the performance of the UAT receiver as a function of desired signal level when subjected to the first JTIDS/MIDS scenario. Both the Standard Receiver and the High Performance receiver results are depicted. In general, the entire set of JTIDS/MIDS scenario runs yielded similar results as to impact to UAT receiver performance.
ACP-WGW01/AI-1Appendix D

Appendix D Page D - 13
©2005
Figure D-16: UAT Receiver Performance with the first JTIDS/MIDS Scenario
D.2.3 UAT Self-Interference Testing
UAT self-interference testing was conducted under the future high density Core Europe 2015 and LA 2020 scenarios described in Appendix C. Results of self-interference testing with the Pre-MOPS units are shown in Appendix B.
D.2.4 Combined Interference Testing
UAT combined interference testing, including the effects of self-interference, TACAN/DME and JTIDS/MIDS was conducted under the future high density Core Europe 2015 and LA 2020 scenarios described in Appendix C. Results of combined interference testing with the Pre-MOPS units are shown in Appendix B.
D.3 Production Testing
Testing was conducted on production UAT airborne avionics since units produced under United States Federal Aviation Administration (FAA) Technical Standard Order (TSO) C154, that to conform to the UAT MOPS, RTCA/DO-282A, became available during the UAT SARPs Validation Phase. These units, the Garmin UAT Model GDL90, were certified as Class A1H type Airborne Transceivers. These units were bench tested to verify requirements related to interference rejection including self-interference and DME/TACAN. Since these units were tested according to the test procedures stipulated
JSC Pre-MOPS Combined Interference Testing
0
10
20
30
40
50
60
70
80
90
100
-100 -95 -90 -85 -80 -75 -70 -65 -60 -55 -50
UAT Level (dBm)
MSR (%)
0.8 MHz 1st scenario1.2 MHz 1st scenario
JTIDS/MIDS standard interference environment comparison chart JTIDS/MIDS : 50% @ - 42 dBm; 50% @ - 63 dBm; 300% @ - 87 dBm
ACP-WGW01/AI-1Appendix D

Appendix D Page D - 14
©2005
in the RTCA UAT MOPS, DO-282A, TSO test results related to DME interference rejection were used to demonstrate compliance to the UAT SARPs.
Also, the receiver was subjected to future high density self-interference scenarios equivalent to those used to validate the Pre-MOPS receiver units used during the development of the UAT MOPS. Therefore, comparison of the future high density scenarios test results from tests that were conducted on the Pre-MOPS 1.2 MHz filter, the equivalent to the Class A1H Standard Receiver, can be made to validate that the requirements of the UAT SARPs. It would be expected that the production Class A1H Standard Receiver would result in acceptable performance when subjected to the future scenarios in which the UAT system will be operating. The self-interference performance measured on the production units would be expected to meet or exceed the performance of the Pre-MOPS units. These test results are described in the following subsections.
Although a certified production Class A3 transceiver was not available for production testing, production Class A1H units were modified with a narrow filter to conform to the receiver selectivity requirements of the Class A3 High Performance Receiver. Although the unit was not modified to conform to neither the Class A3 transmitter requirements, nor the antenna diversity requirements, it served as a testable unit that could validate Class A3 receiver performance. Results of testing with these units are described below.
D.3.1 DME/TACAN Testing
Testing was conducted subjecting the Production Standard Receiver to the DME/TACAN pulsed interference requirements stipulated in the UAT SARPs. DME interference on frequency at 978 MHz, first adjacent channel at 979 MHz and second adjacent channel at 980 MHz frequencies were selected to assess impact of on-channel DME interference, 1 MHz adjacent channel and 2 MHz off channel DME signals.
D.3.2 UAT Self-Interference Testing
UAT self-interference testing was conducted under the future high density Core Europe 2015 scenario, the identical scenario used in the Pre-Production testing described in section D.2.2. Results of self-interference testing with the Class A1H production units are plotted in Figure D-17. The plot includes the data from the Standard Receiver equivalent, the Pre-MOPS 1.2 MHz receiver filter, to verify that the certified Class A1H receiver meets, or exceeds, the performance achieved from the Pre-MOPS units. As shown in Figure D-17, performance of the Class A1H production unit comfortably exceeded the performance of the Pre-MOPS unit.
ACP-WGW01/AI-1Appendix D

Appendix D Page D - 15
©2005
CE2015 Self-Interference PerformanceProduction Standard Receiver vs Pre-MOPS
0
10
20
30
40
50
60
70
80
90
100
-102 -97 -92 -87 -82 -77 -72Signal Level @ Receiver Port (dBm)
MSR
Production BaselineProduction CE2015 Self-InterferencePre-MOPS CE2015 Self Interference
Figure D-17: UAT Production Standard Receiver Performance Comparison with the Core Europe 2015 Self-Interference Scenario
Results of self-interference testing with the UAT SARPs Class A3 receiver, the certified production Class A1H receiver unit modified with the Class A3 High Performance Receiver filter characteristics, are plotted in Figure D-18. The plot includes the data from the High Performance Receiver equivalent, the Pre-MOPS 0.8 MHz receiver filter, to verify that a UAT receiver meets, or exceeds, the performance achieved from the Pre-MOPS units. As shown in Figure D-18, performance of the Class A3 unit comfortably exceeded the performance of the Pre-MOPS unit.
ACP-WGW01/AI-1Appendix D

Appendix D Page D - 16
©2005
CE2015 Self-Interference PerformanceA3 High Performance Receiver vs Pre-MOPS
0
10
20
30
40
50
60
70
80
90
100
-102 -97 -92 -87 -82 -77 -72Signal Level @ Receiver Port (dBm)
MSR
SARPS A3 BaselineSARPS A3 CE2015 Self-InterferencePre-MOPS CE2015 Self-Interference
Figure D-18: UAT A3 Receiver Performance Comparison with the Core Europe 2015 Self-Interference Scenario
D.4 Summary
The results of bench tests conducted with prototype Basic and High Performance UAT Receivers with the interference sources that UAT will be subjected to verify that acceptable performance was achieved by the receiver design developed from the Pre-MOPS testing. These characteristics, when implemented, as shown by the results of testing of the certified production Class A1H Standard Receiver, verifies that when implementing the UAT SARPs requirements, acceptable performance is achieved.
ACP-WGW01/AI-1Appendix D

Appendix E
UAT Error Detection and Correction Performance
ACP-WGW01/AI-1Appendix D

This Page Intentionally Left Blank
ACP-WGW01/AI-1Appendix D

Appendix E Page E - 3
©2005
E UAT Error Detection and Correction Performance This Appendix provides information on the performance of the Reed Solomon (RS) codes used by the various message types of UAT. The Basic UAT ADS-B Message is a RS (30, 18) code word; the Long UAT ADS-B Message is a RS (48,34) code word; and the UAT Ground Uplink Message is six RS (92, 72) code words. These codes provide very strong error correction. Also, the error detection provided by these codes is sufficient to provide a maximum undetected error rate that is less than 10-8 for each of the message types, so additional CRC coding is not needed. Note that this excellent undetected error performance is due, in part, to the use of hard decision decoding. Schemes involving erasures might have considerably larger (i.e., degraded) undetected error rates. The total word error rate for a RS (n, k) code is given by the formula:
jnS
jS
n
tjE pp
jnjnP −
+=
−−
= ∑ )1()!(!
!1
,
where t=(n-k)/2 and Sp is the symbol error rate (SER). EP includes both undetected and detected word error probabilities. Because there are 8 bits per symbol, the connection between the SER and the channel bit error rate (BER) is given by: 8)1(1 ppS −−= . where p is the channel BER. The asymptotic value for the undetected word error rate (achieved when the channel bit error rate is 0.5) for a RS (n, k) code can be calculated using the formula:
jt
jn
k
U jnjnP 255
)!(!!
2561256
0∑= −
−=
where t=(n-k)/2. The results are given in Table E-1.
Table E-1: Maximum Undetected RS Word Error Rates
Code Maximum Undetected Word Error Rate RS(30,18) 2.06e-9 RS(48,34) 9.95e-10 RS(92,72) 5.74e-12
The undetected error performance of a RS code as a function of channel bit error rate can also be calculated, but the mathematical complexity is much greater [1]. The results are shown in Figure E-1 through Figure E-3. These graphs show total word error rate together with undetected word error rate. The detected word error rate, DP , is just the difference between the two curves. If the correct word error rate is defined as CP , then all the probabilities are related by:
CDUCE PPPPP ++=+=1 .
ACP-WGW01/AI-1Appendix D

Appendix E Page E - 4
©2005
Figure E-1: Basic UAT ADS-B Message Performance
(“Undetected” = UP ; “Error Total” = EP .)
Figure E-2: Long UAT ADS-B Message Performance
(“Undetected” = UP ; “Error Total” = EP .)
RS(48,34) Performance
1.00E-181.00E-161.00E-141.00E-121.00E-101.00E-081.00E-061.00E-041.00E-021.00E+00
0.001 0.01 0.1 1
Channel BER
Mes
sage
Err
or R
ate
UndetectedError Total
RS(30,18) Performance
1.00E-181.00E-161.00E-141.00E-121.00E-101.00E-081.00E-061.00E-041.00E-021.00E+00
0.001 0.01 0.1 1
Channel BER
Mes
sage
Err
or R
ate
UndetectedError Total
ACP-WGW01/AI-1Appendix D

Appendix E Page E - 5
©2005
Figure E-3: UAT Ground Uplink Message Performance
(“Undetected” = UP ; “Error Total” = EP .) Note that for the UAT ADS-B Messages, the word error rate is equal to the message error rate because there is one word per message. This is not true for the UAT Ground Uplink Message. Figure E-3 shows the performance of a single RS (92, 72) word. The performance of an entire message, consisting of six words, is given by:
and
Again, PE is the total word error rate, and PU is the undetected word error rate. A graph of the undetected message error rate versus the channel BER is shown in Figure E-4, which indicates that the maximum undetected error rate is about 1.3e-12, which occurs when the channel BER is about 0.012. To see why there is a maximum, consider the following approximation: ( )516 EUUBurst PPP −≈ .
6666 )()1()1( CUCEUEUburst PPPPPPP −+=−−+−=
66 1)1(1 CEEburst PPP −=−−=
RS(92,72) Performance
1.00E-201.00E-181.00E-161.00E-141.00E-121.00E-101.00E-081.00E-061.00E-041.00E-02
1.00E+00
0.001 0.01 0.1 1
Channel BER
Wor
d Er
ror R
ate Undetected
Error Total
ACP-WGW01/AI-1Appendix D

Appendix E Page E - 6
©2005
The UP term is small at low BER and the ( )51 EP− term is small at high BER (because EP is nearly 1 in that case).
Figure E-4: UAT Ground Uplink Message Undetected Message Error Rate
(“Undetected” = UBurstP .)
For completeness, a graph of the total up link message error rate versus channel BER is also provided in Figure E-5.
Figure E-5: UAT Ground Uplink Message Total Message Error Rate
(“Error Total” = EBurstP .)
Up Link Message Performance
0.00E+002.00E-134.00E-136.00E-138.00E-131.00E-121.20E-121.40E-12
0 0.004 0.008 0.012 0.016 0.02
Channel BER
Mes
sage
Err
or R
ate
Undetected
Up Link Message Performance
1.00E-091.00E-081.00E-071.00E-061.00E-051.00E-041.00E-031.00E-021.00E-011.00E+00
0.001 0.01 0.1 1
Channel BER
Mes
sage
Err
or R
ate
Error Total
ACP-WGW01/AI-1Appendix D

Appendix E Page E - 7
©2005
Up to this point the discussion has dealt with the performance of the RS codes in the presence of noise that generates random bit errors. However, in addition to protecting against errors created by stationary and non-stationary interference (see Appendix B), the RS codes are also used as the sole means to differentiate between Long and Basic UAT ADS-B Messages. It is of interest to investigate the performance of this identification process. In order to analyze this issue, it is useful to have a clear picture of the ADS-B reception process as defined in this document. The logical flow of the process is as shown in Figure E-6.
Figure E-6: Logical Flow of ADS-B Reception
After each successful detection of an ADS-B synchronization pattern, the receiver will first check if the RS (48,34) decoding process is successful. If so, the receiver will determine that a Long UAT ADS-B Message was actually sent. However, if this decoding process fails, the receiver will check if the RS(30,18) decoding process is successful. If it is, the message is a candidate Basic UAT ADS-B Message. As a final safeguard, the receiver will check if the 5 bits of the MESSAGE DATA BLOCK TYPE CODE field are all zeros. If this test is successful, the receiver will determine that a Basic UAT ADS-B Message was actually sent. If the MESSAGE DATA BLOCK TYPE CODE test fails or if the RS (30,18) decoding process fails, the entire message is discarded. (Note that this is a logical flow only. It is possible, for example, for the two RS decodes to be done in any time order.) For this investigation there are two possible failure modes of interest. First, an actual Basic UAT ADS-B Message could be perceived as a Long UAT ADS-B Message. Second, a Long UAT ADS-B Message could be perceived as a Basic UAT ADS-B Message. These two will be discussed separately. When a Basic UAT ADS-B Message is received, it is first subjected to the RS (48,34) decoding process. The input to the decoder will be the 30 bytes of the Basic UAT ADS-B Message (assumed to have no bit errors) plus 18 bytes of random data. Because the random part of the input to the decoder includes the entire parity check sequence, the probability of a successful decode is the same as the maximum
Detect ADS-B Sync
SuccessfulRS(48,34) Decode?
Long ADS-B Message
SuccessfulRS(30,18) Decode?
PAYLOAD TYPE = 00000?
Basic ADS-B Message
Message Failure
yes
yes yes
no
no no
ACP-WGW01/AI-1Appendix D

Appendix E Page E - 8
©2005
undetected error rate reported in Table E-1, i.e., 9.95x10⁻¹⁰. Thus, there is about one chance in one billion that a particular Basic message will appear to be a Long UAT ADS-B Message. Note that in the case above a RS (30,18) decoding attempt would have been successful if carried out, since there are assumed to be no bit errors. However, the decoding rules give precedence to a successful Long UAT ADS-B decision. When a Long UAT ADS-B Message is received, it also is subjected initially to the RS (48,34) decoding process. If there are no bit errors, then the decoding will succeed, and the message will correctly be determined to be a Long UAT ADS-B Message. However, the process will not succeed if there are more than 7 incorrect bytes. In that case the decoder may (with probability no greater than 9.95x10⁻¹⁰) produce an undetected error, i.e., it will produce a Long UAT ADS-B Message different from the one that was sent. It is far more likely that the decoder will fail to produce any result, and the RS (30,18) decoding process will be attempted next. From the point of view of the RS (30,18) decoder, the first 30 bytes of the Long UAT ADS-B Message are equivalent to a random sequence of 240 bits, except that the first five bits (the location of the MESSAGE DATA BLOCK TYPE CODE field) are not 00000. Thus, the decoding process must change the first byte to include 00000 in order to succeed. The probability of this occurring is given by the following equation:
115
012 1029.1255
29256
8 −
=
=⎟⎟⎠
⎞⎜⎜⎝
⎛⋅= ∑ x
kp k
k.
Checking for the correct MESSAGE DATA BLOCK TYPE CODE lowers the false decode probability from 2.06x10⁻⁹ to 1.29x10⁻¹¹. During the development of UAT there was some concern that there might be an abnormally high probability of misinterpreting a Long UAT ADS-B Message as a Basic UAT ADS-B Message if there were a preponderance of zeros (0) in the Message Data Block. This might happen if many of the fields were “stuffed” with zeros due to the unavailability of data. Since “all-zeros” is a valid RS code word and the RS (30,18) code can correct up to 6 erroneous bytes, the first 30 bytes of a Long UAT ADS-B Message will “successfully” decode to the all-zero Basic UAT ADS-B Message whenever 6 or less of the 30 bytes are nonzero. Because the RS (48,34) decoding process has precedence, this scenario requires that the Long decoding process must fail and the Basic decoding process must succeed. Normally, a BER high enough to cause the RS (48,34) decoding process to fail would turn enough of the zero bytes into nonzero bytes so that the RS (30,18) decoding process would also fail. However, it is possible that interference (e.g., another UAT ADS-B Message) could overlap only the tail end of a Long UAT ADS-B Message, leaving the first 30 bytes essentially intact. It is difficult to assess the likelihood that such a situation will arise since it depends on the number of potential interference sources and their relative signal strengths. Whatever their probability might be, if the conditions described in the previous paragraph should prevail, the decoding process will incorrectly result in an all-zero Basic UAT ADS-B Message. This decoded message will pass the MESSAGE DATA BLOCK TYPE CODE test; however, this should not generate an operational problem because such a message will necessarily contain the all-zero ICAO address, which is invalid. Thus, in order to cope with this (very unlikely) situation, any application that uses a decoded UAT ADS-B Message could check the validity of the ICAO address before processing the remainder of the information.
ACP-WGW01/AI-1Appendix D

Appendix E Page E - 9
©2005
As a final note it should be pointed out that the receiver could, as an option, check the MESSAGE DATA BLOCK TYPE CODE field of candidate Long ADS-B messages as well as of candidate Basic UAT ADS-B Messages. Checking that the MESSAGE DATA BLOCK TYPE CODE field is not 00000 will lower very slightly (by a factor of 31/32) the probability of undetected error in the presence of random bit errors. It will also lower the probability of interpreting a Basic UAT ADS-B Message as a Long UAT ADS-B Message by a factor of about 7; this probability is given by the following formula:
106
014 1041.1255
47256248 −
=
=⎟⎟⎠
⎞⎜⎜⎝
⎛⋅= ∑ x
kp k
k.
This check is not a requirement since the improvement it provides is rather modest. The information contained in this Appendix is summarized in Table E-2. The numbers presented are upper limits on the likelihood of potential UAT ADS-B Messages being misinterpreted. The first two rows assume that the input bit stream is corrupted by strong interference, and the entries are upper bounds on the probabilities of interpreting a Long (Basic) UAT ADS-B Message as an incorrect Long (Basic) UAT ADS-B Message. The other rows provide upper limits on the probabilities of incorrectly interchanging Long and Basic. The shaded cells represent the results obtained by using the optional check of the MESSAGE DATA BLOCK TYPE CODE field for Long UAT ADS-B Message candidates. Table E-2 does not address the likelihood of a successful synchronization being followed by a very high BER for all or part of the remaining message; the probability of encountering the interference conditions necessary for misinterpreting message length is certainly much less than 1.
Table E-2: Upper Bounds on Undetected Message Error Probabilities
Transmission Perceived Reception
Raw Probability of Undetected
Error
Probability with MESSAGE DATA
BLOCK TYPE CODE Check
Long Long 9.95e-10 9.64e-10 Basic Basic 2.06e-9 6.45e-11 Basic Long 9.95e-10 1.41e-10 Long Basic 2.06e-9 1.29e-11
Reference [1]: Kasami,T., and S. Lin, 1984, “On the Probability of Undetected Error for Maximum Distance Separable Codes,” IEEE Trans. Comm., COM-32,998-1006.
ACP-WGW01/AI-1Appendix D

Appendix E Page E - 10
©2005
This Page Intentionally Left Blank
ACP-WGW01/AI-1Appendix D

Appendix F
DME Operation in the Presence of UAT Signals
ACP-WGW01/AI-1Appendix D

This Page Intentionally Left Blank
ACP-WGW01/AI-1Appendix D

Appendix F Page F - 3
© 2005
F. DME Operation in the Presence of UAT Signals
This Appendix provides a summary of testing and analysis that verifies UAT compatibility with Distance Measuring Equipment (DME) and that DME equipment will operate without degradation in the presence of UAT signals.
The goal of the DME testing, conducted as a part of the UAT MOPS development, was to verify that UAT signals do not interfere with the proper operation of DMEs, which operate in the band in which UAT will operate. The focus of the bench testing herein was to conduct tests on DME units that were representative of the vast majority of the DMEs used in the different categories of aviation equipage. However, due to the large number of different manufacturers and types of DMEs, it was unrealistic to test all of the possible DMEs in the system. Four DME units were selected based on availability, and representing the different categories of avionics instrumentation. The specific models used in the testing were:
1. Bendix King KD-7000 2. Narco DME-890 3. Rockwell-Collins DME-900 4. Honeywell 706-A
The latter two were selected to represent units currently in use in the European Union.
The first phase of testing was to determine the impact of overlapping UAT signals onto the DME pulse pairs. The test configuration consisted of a victim DME interrogator connected to a DME ground station simulator and a UAT message source generating Long ADS-B UAT Messages. The DME ground station simulator received interrogations from the DME unit under test and transmitted replies as well as unsolicited pulse pairs to closely match the operation of an actual ground simulator. Since the selected frequency for UAT does not reside in the interrogation frequency band, the testing was configured with a clear interrogation channel. This assumption is consistent with standard DME interrogator test procedures and any interference on the interrogator channel would be manifested in the system as a reduction in transponder reply efficiency. The UAT frequency was tested co-channel with the DME reply frequency and testing was also conducted with DMEs located on adjacent DME channels. On the reply channel, every reply was completely overlapped with the same level of UAT interference. This is much more severe than any real world interference environment, but is appropriate for the purposes of the bench testing where performance under extreme conditions provides the data required to model real world scenario performance. A data point consists of measuring both the interfering signal level that prohibits the DME to acquire a track (Acquire Stable Operating Point [ASOP]) and the level that causes the DME to lose a track that it has already acquired (Break Stable Operating Point [BSOP]). In general, it was found that these two levels were separated by approximately 1 dB.
One especially informative measurement was taken where ASOP and BSOP were determined as a function of the reply efficiency of the ground station. The simulator utilized in the test configuration had the capability to randomly reply to 0-100% of the interrogations it received. The measurements showed that the DME interrogator could acquire and track in the presence of the same level of UAT interference as long as at least 30% of its interrogations elicit replies. Each DME model tested could tolerate relatively
ACP-WGW01/AI-1Appendix D

Appendix F Page F - 4
©2005
high amplitude UAT interference, although each unit tolerated a slightly different level of interference. This seems to indicate that as long as a DME is able to receive more than 30% of the replies from its interrogations with interference less than the ASOP/BSOP point particular to that DME unit, it will operate. It is important to note that although this was a consistent characteristic of the four DME units tested, this may not be true of all DME units operating in the system. However, given the significant margin with respect to the 70% reply efficiency monitor limit, there is enough of a margin to have the confidence to apply these results to operational DMEs in the system.
The results of the bench test conducted are depicted in the following figures. Figure F-1 summarizes the data results of co-channel and adjacent channel DME operation of the Bendix King KD-7000 DME. The DME levels utilized were –68 dBm and –83 dBm and reply efficiency was set at 100%.
-100
-90
-80
-70
-60
-50
-40
-30
-20-3 -2 -1 0 1 2 3
Frequency Offset (MHz)
Interference Level (dBm
)
BSOP-DME @ -68ASOP-DME @ -68ASOP-DME @ -83BSOP-DME @ -83DME Sensitivity
Figure F-1: Bendix King KD-7000 Frequency Offset Test
ACP-WGW01/AI-1Appendix D

Appendix F Page F - 5
© 2005
Figure F-2 depicts the performance of the Bendix King KD-7000 DME as a function of reply efficiency. DME levels of –68 dBm and –83 dBm were utilized and these signals were co-channel. This plot shows the consistent behavior of the DME as a function of reply efficiency above 30%.
-100
-90
-80
-70
-60
-500 10 20 30 40 50 60 70 80 90 100
Reply Efficiency (%)
Interference Level (dBm
)
BSOP-DME @ -68BSOP-DME @ -83ASOP-DME @ -83ASOP-DME @ -68DME Sensitivity
Figure F-2: Bendix King KD-7000 Reply Efficiency Test
ACP-WGW01/AI-1Appendix D

Appendix F Page F - 6
©2005
Figure F-3 depicts the performance of the Bendix King when subjected to CW with a DME level of –83 dBm. The results are very similar to the UAT signal interference results as a function of frequency offset.
-90
-80
-70
-60
-50
-40
-30
-20-3 -2 -1 0 1 2 3
UAT Frequency Offset (MHz)
CW
Level (dBm
)
BSOP
ASOP
Figure F-3: Bendix King KD-7000 CW testing: DME level –83 dBm
ACP-WGW01/AI-1Appendix D

Appendix F Page F - 7
© 2005
Figure F-4 summarizes the data results of co-channel and adjacent channel DME operation of the Narco DME-890. The DME levels utilized were –60 dBm and –75 dBm. These amplitude levels were chosen to allow comparison with the other DME units at comparable levels above sensitivity. The Narco DME-890 had the least sensitive receiver of the four units that were measured at –81 dBm.
-90
-80
-70
-60
-50
-40
-30
-20
-10
0-3 -2 -1 0 1 2 3
Frequency Offset (MHz)
Interference Level (dBm
)
BSOP-DME @ -60ASOP-DME @ -60ASOP-DME @ -75BSOP-DME @ -75DME Sensitivity
Figure F-4: Narco DME-890 Frequency Offset Test
ACP-WGW01/AI-1Appendix D

Appendix F Page F - 8
©2005
Figure F-5 depicts the performance of the Narco DME-890 as a function of reply efficiency. DME levels of –60 dBm and –75 dBm were utilized and these signals were co-channel. As also seen in the behavior of Bendix King KD-7000, the performance is consistent as a function of reply efficiency above 30%. Figure F-6 depicts the performance of the Narco DME-890 when subjected to CW with a DME level of –75 dBm.
-85
-80
-75
-70
-65
-60
-55
-50
-45
-40
-350 10 20 30 40 50 60 70 80 90 100
Reply Efficiency (%)
Interference Level (dBm
)
BSOP-DME @ -60BSOP-DME @ -75ASOP-DME @ -75ASOP-DME @ -60DME Sensitivity
Figure F-5: Narco DME-890 Reply Efficiency Test
-80
-70
-60
-50
-40
-30
-20
-10-4 -3 -2 -1 0 1 2 3 4
UAT Frequency Offset (MHz)
CW
Level (dBm
)
BSOP
ASOP
Figure F-6: Narco DME-890 CW testing: DME level -75 dBm
ACP-WGW01/AI-1Appendix D

Appendix F Page F - 9
© 2005
Figure F-7 summarizes the data results of co-channel and adjacent channel DME operation of the Honeywell KDM-706A DME. The DME levels utilized were –68 dBm and –83 dBm and reply efficiency was set at 100%.
-100
-90
-80
-70
-60
-50
-40
-30
-20-4 -3 -2 -1 0 1 2 3 4
Frequency Offset (MHz)
BSOP-DME @ -83ASOP-DME@-83DME SensitivityASOP-DME @ -68BSOP-DME @ -68
Figure F-7: Honeywell KDM-706A Frequency Offset Test
ACP-WGW01/AI-1Appendix D

Appendix F Page F - 10
©2005
Figure F-8 depicts the performance of the Honeywell KDM-706A DME as a function of reply efficiency. DME levels of –68 dBm and –83 dBm were utilized and these signals were co-channel.
-110
-100
-90
-80
-70
-60
-500 10 20 30 40 50 60 70 80 90 100
Reply Efficiency (%)
Interference Level (dBm
)
ASOP-DME @ -83ASOP-DME @ -68BSOP-DME @ -68BSOP-DME @ -83DME Sensitivity
Figure F-8: Honeywell KDM-706A Reply Efficiency Test
ACP-WGW01/AI-1Appendix D

Appendix F Page F - 11
© 2005
Figure F-9 depicts the performance of the Honeywell KDM-706A DME when subjected to CW with a DME level of –83 dBm. As with the previous DME units, the results are very similar to the UAT signal interference results as a function of frequency offset.
-100-90-80-70-60-50-40-30-20-10
-4 -3 -2 -1 0 1 2 3 4UAT Frequency Offset (MHz)
CW
Level (dBm
)
BSOP
ASOP
Figure F-9: Honeywell KDM-706A CW testing: DME level –83 dBm
Figure F-10 through Figure F-12 summarizes the data results of the Rockwell-Collins DME-900.
-100-90-80-70-60-50-40-30-20
-4 -3 -2 -1 0 1 2 3 4Frequency Offset (MHz)
BSOP-DME @ -83ASOP-DME@-83DME SensitivityASOP-DME @ -68BSOP-DME @ -68
Figure F-10: Rockwell-Collins DME-900 Frequency Offset Test
ACP-WGW01/AI-1Appendix D

Appendix F Page F - 12
©2005
-110
-100
-90
-80
-70
-60
-500 10 20 30 40 50 60 70 80 90 100
Reply Efficiency (%)Interference Level (dB
m)
ASOP-DME @ -83ASOP-DME @ -68BSOP-DME @ -68BSOP-DME @ -83DME Sensitivity
Figure F-11: Rockwell-Collins DME-900 Reply Efficiency Test
-100-90-80-70-60-50-40-30-20-10
-4 -3 -2 -1 0 1 2 3 4UAT Frequency Offset (MHz)
CW
Level (dBm
)
BSOP
ASOP
Figure F-12: Rockwell-Collins DME-900 CW testing: DME level –83 dBm
ACP-WGW01/AI-1Appendix D

Appendix F Page F - 13
© 2005
The comparisons of all four DME units tested are depicted in the following figures.
Figure F-13 summarizes the data results of co-channel and adjacent channel DME operation of the four DMEs. Figure F-14 depicts the performance of the four DMEs as a function of reply efficiency. Figure F-15 depicts the performance of all four DMEs when subjected to CW. As can be seen by the co-channel results in Figure F-13 and Figure F-15, the KDM-706A had the worst signal to interference rejection.
-100
-90
-80
-70
-60
-50
-40
-30
-20
-10
0-3 -2 -1 0 1 2 3Frequency Offset (MHz)
Interference Level (dBm
)
-75 dBm DME ReplyDME-890@-75-83 dBm DME ReplyDME-900@-83KD-7000@-83KDM-706A@-83
Figure F-13: Comparison of all DME Frequency Offset Tests
ACP-WGW01/AI-1Appendix D

Appendix F Page F - 14
©2005
-105-100-95-90-85-80-75-70-65-60-55
0 10 20 30 40 50 60 70 80 90 100
Reply Efficiency (%)Interference Level (dB
m)
-75 dBm DME ReplyDME-890 @ -75-83 dBm DME ReplyDME-900 @ -83KD-7000 @ -83KDM-706A @ -83
Figure F-14: Comparison of all DME Reply Efficiency Tests
-100
-90
-80
-70
-60
-50
-40
-30
-20
-10
0-3 -2 -1 0 1 2 3
Frequency Offset (MHz)
Interference Level (dBm
)
-75 dBm DME ReplyDME-890@-75-83 dBm DME ReplyDME-900@-83KDM-706A@-83KD-7000@-83
Figure F-15: Comparison of all DME CW Interference Tests
Using the combined data from the aforementioned bench testing and simulated high-density UAT traffic scenarios, the basis for making some basic conclusions on UAT and DME compatibility can be made. It can be determined, for example, at what desired signal level, which can then be converted into a range, that a particular DME can be
ACP-WGW01/AI-1Appendix D

Appendix F Page F - 15
© 2005
expected to stop working in a specified UAT environment. It can also provide a measure of how much of a margin is left for DME performance after UAT interference and other DME interference sources are considered. As shown by the bench results where all DME pulse pairs are directly overlapped by UAT Messages, the DMEs exhibit exceptional immunity to even co-channel UAT interference. The UAT/DME environments that must be considered span different time frames. In the near term, over approximately a ten year time interval, DMEs operating at 978 MHz are expected to be moved. However, over this time span, there will be DMEs operating at 978 MHz co-channel with UAT in a number of European locations. In the longer term after these DMEs are moved, the closest DME will be 1 MHz away from the UAT 978 MHz frequency. Upon examining the bench test results, the consistent behavior of the DMEs at a given UAT interference level down to reply efficiency of 30%, can be utilized to make conclusions of UAT effect on DME in the projected environments. If one analyzes the Core Europe 2015 scenario to determine the probability of overlapping a DME pulse pair at or above the UAT interference level that would cause loss of operation, it can be determined that the DME will operate without any measurable degradation in that environment. For example, taking the co-channel Honeywell KD-7000 DME unit results with a desired signal level of –83 dBm, UAT signals at or above –96 dBm could potentially impair DME operation if the reply efficiency reduced to 30% or below. Taking the Core Europe 2015 scenario and looking at the number of UAT messages at a level of –96 dBm or above, on average, less than 900 messages per second would be received if a DME receiver is positioned over Brussels at 40,000 feet. This is the same aircraft location used in the high density Core Europe 2015 analysis in Appendix K. The probability of overlap is significantly less than the minimum probability that would cause probability of reception to be reduced to the level that would impact DME operation. Since the co-channel case would not occur at the aircraft densities produced by the Core Europe 2015 scenario, the operation of DMEs on 978 MHz can be safely achieved. Since the co-channel DME case is validated for Core Europe 2015, the DME channels 1 MHz or more from the UAT occupied frequency will not be impacted given there is on average 10 dB additional protection shown by the bench test results when the DME is 1 MHz away from UAT signals.
The UAT environment described in Appendix B, the Core Europe 2015 scenario, represents the future environment under which DMEs and UAT were examined to verify that proper operation would be maintained. A bench measurement with a DME unit subjecting the victim DME to the Core Europe 2015 UAT environment was performed to validate that DMEs would properly operate in the future UAT environment. Utilizing a UAT Message Generator, which produced UAT signal environments for model validation efforts described in Appendix B, the Core Europe 2015 UAT Messages that would be experienced by a victim airborne DME receiver were input to the DME receiver. Performance as a function of DME signal amplitude was examined. Rate, timing and amplitudes of UAT Messages for this scenario represent a more realistic worst-case scenario than the conditions under which the bench tests were conducted. The testing was conducted on the Narco DME-890 and the results were measured to determine the DME level to achieve ASOP. This was compared to the measured sensitivity of the DME unit without interference. The results indicated that when the DME unit is subjected to the future UAT environment, it was able to achieve ASOP within 1 dB of its normal sensitivity without UAT interference.
Further examination of the effect of UAT on DME was performed to examine the combined effect of UAT and JTIDS/MIDS on DME. Since the bench results and analysis indicates significant margin before UAT would impact DME operation, it was
ACP-WGW01/AI-1Appendix D

Appendix F Page F - 16
©2005
not expected that UAT combined with JTIDS/MIDS would result in an impact on DME operation. An analysis was performed to determine quantitatively how much interference JTIDS/MIDS could produce relative to the UAT signal interference produced by the Core Europe 2015 environment. Figure F-16 depicts the incremental change in interference that would be experienced by a DME receiver by the combined effect of UAT and JTIDS/MIDS when compared to UAT interference alone in the ADS-B segment of the UAT Frame. The CDF is a measure of the percentage time that interference is experienced by the victim DME receiver at or below the corresponding interference signal level. This analysis was performed with the DME and UAT co-channel in the Core Europe 2015 scenario and the JTIDS/MIDS Baseline B scenario described in Appendix G. As observed by the results, the combination of JTIDS/MIDS and UAT is not significantly different than UAT interference alone.
In summary, a significant amount of testing on 4 models of DME equipment representative of the existing equipment population was performed to validate proper operation of DMEs when subjected to UAT signals. This testing has shown the DME interrogators to be very tolerant to the UAT signal even when operated co-channel with UAT. Based on tests conducted to date, no compatibility issues are expected with DME operation even when operated co-channel with UAT even with very high levels of future UAT/ADS-B equipage in high density European airspace.
-200 -180 -160 -140 -120 -100 -80 -60 -40 -20 00
0.1
0.2
0.3
0.4
0.5
0.6
0.7
0.8
0.9
1CDF of Received Interference Level for Core Europe
Interference (dBm)
CD
F
UAT OnlyUAT and JTIDS
Figure F-16: JTIDS/MIDS and UAT Combined Interference Analysis
ACP-WGW01/AI-1Appendix D

Appendix G
Example UAT ADS-B Message Encoding
ACP-WGW01/AI-1Appendix D

This Page Intentionally Left Blank
ACP-WGW01/AI-1Appendix D

Appendix G Page G - 3
©2005
G. Example UAT ADS-B Message Encoding
G.1 Reed Solomon Encoding of Message Data Block
The encoding is accomplished by means of a systematic RS 256-ary code with 8 bit code symbols (Bytes). The first parity symbol out of the FEC encoder is treated as the most significant symbol of the parity sequence. The parity check symbols are appended to the trailing end of the sequence of data symbols.
The ordering of the Bytes is from MSB to LSB, left to right, as they enter and exit the Reed Solomon encoder, as is the ordering of the bits within each Byte (MSB to LSB). When treated as polynomial coefficients this is equivalent to transmitting the high order coefficient(s) first. Since the systematic Reed Solomon Code is defined over the Galois Field GF(28), using the primitive polynomial [with binary coefficients, i.e., GF(2)] given as:
1)( 278 ++++= xxxxxp
all of the non-zero elements of the extension field GF(256) can be described as powers of a root of p(x); that is, for α such that ,0)( =αp the nonzero elements of GF(256) are given as mα , for m = 0, 1, 2, ..., 254 (where 10255 =≡ αα ). For example,
1278 +++≡ αααα = (1,0,0,0,0,1,1,1) as a binary 8-tuple (Byte).
To complete the description of the extension field elements, the “zero” element (additive identity) is denoted as 0 = (0,0,0,0,0,0,0,0).
The generator polynomial for the Reed Solomon codes is given as:
∏=
−=P
i
ixxG120
)()( α
where P = 131 for RS (30,18) and P = 133 for RS (48,34) codes used for two ADS-B messages.
G.2 Reed Solomon Encoding of Basic Type 0 UAT ADS-B Message Data Block
The generator polynomial for the RS (30,18) Reed Solomon code is given as:
ACP-WGW01/AI-1Appendix D

Appendix G Page G - 4
©2005
588622079282891571066117612)( xxxxxxxxxG ααααααα +++++++=
231562503145420 ααααα +++++ xxxx
Table G-1 represents an example of a Basic ADS-B Message Data Block with selected values for individual fields and the equivalent bit oriented representation. Each data field from Table G-1 is arranged in sequence as shown to depict the transmitted Basic UAT ADS-B Message data sequence.
Transmitted Basic UAT ADS-B Message Data Byte # MSB 1 2 3 4 5 6 7
0000 0000 1111 1010 1010 0001 0010 0011 0101 0101 0101 0101 0101 0101
8 9 10 11 12 13 14 1100 0000 0000 0000 0000 0000 0000 0011 0101 0100 0000 0110 0100 0100
15 16 17 18
0011 0010 1100 0000 0010 1000 0000 0000LSB
Table G-1: Example of Basic UAT ADS-B Message Data Blocks
Data Field Value Bit-Oriented Equivalent Message Data Block Type Code 0 0 0000
Address Qualifier 0 000 Aircraft Address FAA123 (HEX) 1111 1010 1010 0001 0010 0011 Latitude (WGS-84) 60° N 010 1010 1010 1010 1010 1010 Longitude (WGS-84) 45º W 1110 0000 0000 0000 0000 0000 Altitude Type 0 0 Altitude 300 feet 0000 0011 0101 NIC 4 0100 Air/Ground State 0 00 [Reserved Bit] 0 0 North Velocity or Ground Speed 400 knots North 001 1001 0001
East Velocity or Heading 100 knots East 000 0110 0101 Vertical Velocity +64 feet/minute (UP) 100 0000 0010 UTC coupled 1(YES) 1 [Reserved Bits] 0 000 [Reserved Byte] 0 0000 0000
Note: The Message Data Block field definition of UAT ADS-B Type 0 and Type 1 Messages in Table G-1 and Table G-2 respectively are current as of issue of the UAT MOPS (RTCA/DO-282A). These two messages are given as an example to describe how the field element α is defined within each symbol and how the
ACP-WGW01/AI-1Appendix D

Appendix G Page G - 5
©2005
data symbols sequence enter RS encoder and exit with FEC parity sequence at its trailing end.
In generating the FEC, the UAT ADS-B Message data bits are arranged into eight bit bytes assuming that the leftmost byte is the Most Significant Byte. The encoder accepts the 18 information symbols (Bytes) as:
]0,,,,,,,,0,0,,,,,,,,0[ 20110522214310021499105848484232124165 αααααααααααααα←
and generates the 12 symbols parity sequence:
],,,,,,,,,,,[ 7117590220761381831201284114560 αααααααααααα←
The parity sequence is then appended to the (right) end of the information sequence to complete the 30 symbols Codeword for transmission (left symbol first).
MSB ADS-B Basic Message Data Block Bits + FEC Parity Bits 0000 0000 1111 1010 1010 0001 0010 0011 0101 0101 0101 0101 0101 0101 1100 0000 0000 0000 0000 0000 0000 0011 0101 0100 0000 0110 0100 0100 0011 0010 1100 0000 0010 1000 0000 0000 1111 1110 1001 0111 1100 0100 0011 0100 1110 0001 1111 1111 0101 0011 0110 0101 1100 1111 1000 1111 1010 1111 1110 0100LSB
G.3 Reed Solomon Encoding of Long Type 1 UAT ADS-B Message Data Block
The generator polynomial for the RS (48,34) Reed Solomon code is given as:
613871358140926107011211249138214)( ααααααααα ++++++++= xxxxxxxxxG
24170239313464522 αααααα ++++++ xxxxx
Table G-2 represents an example of Long Type 1 UAT ADS-B Message Data Block (Basic ADS-B State Vector plus MS [Mode Status] elements, and AUX State Vector report elements fields) and the equivalent bit oriented representation.
ACP-WGW01/AI-1Appendix D

Appendix G Page G - 6
©2005
Table G-2: Example of Long Type 1 UAT ADS-B Message Data Blocks
Data Field Value Bit-Oriented Equivalent Message Data Block Type Code 1 0 0001 Address Qualifier 0 000 Aircraft Address FAA123 (HEX) 1111 1010 1010 0001 0010 0011 Latitude (WGS-84) 60° N 010 1010 1010 1010 1010 1010 Longitude (WGS-84) 45º W 1110 0000 0000 0000 0000 0000 Altitude Type 0 0 Altitude +300 feet 0000 0011 0101 NIC 4 0100 Air/Ground State 0 00 [Reserved Bit] 0 0 North Velocity or Ground Speed 400 knots North 001 1001 0001 East Velocity or Heading 100 knots East 000 0110 0101 Vertical Velocity +64 feet/minute(UP) 100 0000 0010 UTC coupled 1(YES) 1 [Reserved Bits] 0 000 Emitter Category Code and Call Sign Characters#1 and #2 2 (Small) and “AB” 0000 1110 0001 1011
Call Sign Characters#3, #4, and #5 “CD1” 0100 1101 0000 1001
Call Sign Characters#6, #7, and #8 “234” 0000 1100 1111 1100
Emergency 0 000 MOPS Version 1 001 SIL 0 00
TMSO(6 LSBs of 12-bit MSO #) 1250 (only 6 LSB is transmitted) 10 0010
[Reserved Bits] 0 00 NACP 7 0111 NACV 2 010 NICBARO 0 0 Capability Class (CC) Codes 0 00 Operational Mode (OM) Codes 0 000 True Magnitude 0 0 [Reserved Bits] 0 00 0000 0000 0000 0000 Secondary Altitude +300 feet 0000 0011 0101
[Reserved Bits] 0 0000 0000 0000 0000 0000 0000 0000
Note: The Message Data Block field definition of UAT ADS-B Type 0 and Type 1 Messages in Table G-1 and Table G-2 respectively are current as of issue of the UAT MOPS (RTCA/DO-282A). These two messages are given as an example to describe how the field element α is defined within each symbol and how the data symbols sequence enter RS encoder and exit with FEC parity sequence at its trailing end.
Each data field from Table G-2 is arranged in sequence as shown to depict the transmitted Long Type 1 UAT ADS-B Message data sequence.
ACP-WGW01/AI-1Appendix D

Appendix G Page G - 7
©2005
Transmitted Long Type 1 UAT ADS-B Message Data Bytes # MSB----1 2 3 4 5 6 7 0000 1000 1111 1010 1010 0001 0010 0011 0101 0101 0101 0101 0101 0101
8 9 10 11 12 13 14
1100 0000 0000 0000 0000 0000 0000 0011 0101 0100 0000 0110 0100 0100
15 16 17 18 19 20 21 0011 0010 1100 0000 0010 1000 0000 1110 0001 1011 0100 1101 0000 1001
22 23 24 25 26 27 28
0000 1100 1111 1100 0000 0100 1000 1000 0111 0100 0000 0000 0000 0000
29 30 31 32 33 34 0000 0000 0000 0011 0101 0000 0000 0000 0000 0000 0000 0000LSB
In generating the FEC, the UAT ADS-B Message data bits are arranged into eight bit bytes assuming that the leftmost byte is the Most Significant Byte. The encoder accepts the 34 information symbols (Bytes) as:
,,,,,,,,,0,0,,,,,,,,[ 107201105222143100214991058484842321241653 αααααααααααααααα← ]0,0,0,,,0,0,0,,,,,,,, 202993414425810120511749 αααααααααα
and generates the 14 symbol parity sequence:
],,,,,,,,,,,,,[ 3520613151465110024063133183159221107 αααααααααααααα←
The parity sequence is then appended to the (right) end of the information sequence to complete the 48 symbols Codeword for transmission (left symbol first).
MSB Long Type 1 UAT ADS-B Message Data Block Bits + FEC Parity Bits 0000 1000 1111 1010 1010 0001 0010 0011 0101 0101 0101 0101 0101 0101 1100 0000 0000 0000 0000 0000 0000 0011 0101 0100 0000 0110 0100 0100 0011 0010 1100 0000 0010 1000 0000 1110 0001 1011 0100 1101 0000 1001 0000 1100 1111 1100 0000 0100 1000 1000 0111 0100 0000 0000 0000 0000 0000 0000 0000 0011 0101 0000 0000 0000 0000 0000 0000 0000 0000 1110 0001 1001 1000 0101 1111 1111 1001 1100 0110 1011 0011 0011 0000 0110 0110 1100 1010 1001 1111 0100 0011 1101 0001 0010 1110 1000 LSB
ACP-WGW01/AI-1Appendix D

Appendix G Page G - 8
©2005
Appendix G References
References for forward Error Coding and the Galois Field are listed below: G-1. Peterson, W.W., and E.J. Weldon, Jr., Error-Correcting Codes, 2nd ed., MIT Press, Cambridge, MA,
1972.
G-2. Michelson, A. M., and A. H. Levesque, Error-Control Techniques for Digital Communication, John Wiley & Sons, New York, NY 1985.
ACP-WGW01/AI-1Appendix D

Appendix H
Aircraft Antenna Characteristics
ACP-WGW01/AI-1Appendix D

This Page Intentionally Left Blank
ACP-WGW01/AI-1Appendix D

Appendix H Page H - 3
© 2005
H. Aircraft Antenna Characteristics
H.1 Antenna Characteristics
H.1.1 General Characteristics
The UAT System is expected to be able to utilize any standard transponder/DME antenna. Potential sharing of existing transponder antennas is discussed in Section H.3 below. The antenna must be suitable to receive and transmit vertically polarized signals at 978 MHz. The VSWR produced by the antenna into a manufacturer specified load must not exceed 1.7:1 at 978 MHz ±1 MHz.
H.1.2 Radiation Patterns
Performance of the UAT ADS-B System was estimated using a model of antenna gain that was developed for the United States Federal Aviation Administration (FAA) Safe Flight – 21 (SF-21) Technical Link Assessment Team (TLAT) Report. See Appendix B of this Manual. In practice, equipment designers assume 0.5 dB less average gain in the azimuth plane than that given in the TLAT Antenna Gain Model. However, in data links such as UAT, which are interference limited, this difference should not be expected to affect the performance presented in Appendix B of this Manual.
H.1.3 Directional Gain Radiation Patterns
For some applications (such as applications specific to Class A3 equipment), it may be suitable to use antennas with directional gain patterns to increase the range in the forward direction. Limitations on such directional gain antennas include not creating undesired nulls in the azimuth pattern, maintaining the minimum air-to-air range in the aft direction, and ensuring that any future requirements for minimum air-to-ground range are met. This subparagraph contains some examples of antennas that can achieve these goals.
The Figure H-1 shows the azimuth pattern of an antenna that has been evaluated through the development of the ADS-B 1090 MHz Extended Squitter MOPS (RTCA DO-260A). This antenna achieves its gain through use of passive reflector elements. The antenna has a peak gain of 7.5 dBi, and an F/B ratio of 5 dB. This antenna could be easily scaled for 978 MHz, or undergo additional investigation to determine its characteristics as a combined antenna for both 978 and 1090 MHz.
ACP-WGW01/AI-1Appendix D

Appendix H Page H - 4
© 2005
Figure H-1: Passive Gain Antenna for 960 MHz to 1215 MHz Frequency Band
ACP-WGW01/AI-1Appendix D

Appendix H Page H - 5
© 2005
Figure H-2 shows a theoretical antenna that uses a pair of active driven elements to achieve directional gain while creating a uniform pattern. This antenna consists of a pair of quarter-wave resonant elements spaced at 1/8 wavelength, and driven 45 degrees out of phase.
This antenna design achieves 6.4 dBi of gain at an elevation angle of 13 degrees, with an F/B ratio of 4 dB.
Figure H-2: Gain Array Antenna Azimuth Pattern
H.2 Typical VSWR Measurements of Existing Transponder / DME Antennas
There are several varieties of existing antennas that are suitable for use with the UAT datalink. These are summarized in Table H-1 below.
ACP-WGW01/AI-1Appendix D

Appendix H Page H - 6
© 2005
Table H-1: Typical Antennas
FAA TSO RTCA Equipment Type VSWR & Frequency TSO-C66c DO-189C DME 2:1 from 960-1215
TSO-C74c DO-144 SSR Transponder 1.5:1 on 1030, 1090 TSO-C112 DO-181C SSR Mode A/C/S 1.5:1 from 1030-1090
Typically, antennas that comply with TSO-C112 are specified with VSWR < 1.5:1 from 1030 MHz to 1090 MHz, and VSWR < 1.7:1 over the remainder of the band from 978 MHz to 1215 MHz. Certain types of transponder antennas that utilize very thin radiator elements are only intended for use at 1030 MHz and 1090 MHz. These types of antennas should be evaluated on a model-by-model basis to determine their suitability as UAT data link antennas.
Note that RF system performance is not strongly affected by VSWR values. A VSWR value as high as 2:1 does not increase the losses in the transmitted signal by more than 0.5 dB. This lack of sensitivity in system performance to VSWR values should be kept in mind when evaluating antennas for UAT applications.
The following subparagraphs illustrate these VSWR characteristics for specific antenna models. These measurements were performed with the antenna mounted in the center of a 4-foot diameter conductive ground plane.
ACP-WGW01/AI-1Appendix D

Appendix H Page H - 7
© 2005
H.2.1 Sensor Systems L Band Blade Antenna P/N S65-5366-7L
This antenna is typical of those found on jet transport aircraft, and is rated for TSO C66b, C74c, and C112. This antenna would be suitable as a UAT antenna.
VSWR vs. Frequency
1
1.2
1.4
1.6
1.8
2
2.2
2.4
970
975
980
985
990
995
1000
1005
1010
1015
1020
1025
1030
1035
1040
1045
1050
1055
1060
1065
1070
1075
1080
1085
1090
1095
1100
Frequency (MHz)
VSW
R
Figure H-3: Jet Transport Antenna
H.2.2 AeroAntenna P/N AT-130-1
This antenna was designed for the FAA Alaska Capstone program as a dedicated UAT antenna.
Figure H-4: Capstone Antenna
H.2.3 ¼ Wave Whip Antenna
This data represents a typical GA-application thin whip antenna, such as a RAMI Model AV-22 (TSO C-74c). Note that although not specified for performance outside of the 1030 to 1090 MHz range, it actually performs best at frequencies lower than 1030 MHz.
VSWR vs. Frequency
1
1.2
1.4
1.6
1.8
2
2.2
2.4
970
975
980
985
990
995
1000
1005
1010
1015
1020
1025
1030
1035
1040
1045
1050
1055
1060
1065
1070
1075
1080
1085
1090
1095
1100
Freq. in MHz
VSW
R
ACP-WGW01/AI-1Appendix D

Appendix H Page H - 8
© 2005
This antenna would be a suitable UAT datalink antenna, and illustrates the need to look at the characteristics of each candidate antenna closely.
VSWR vs. Frequency
1
1.5
2
2.5
3
970
980
990
1000
1010
1020
1030
1040
1050
1060
1070
1080
1090
1100
Freq. in MHz
VSW
R
Figure H-5: ¼ Wave Whip Antenna
H.3 Passive Antenna Diplexer Characteristics
A potential method of providing an antenna for the UAT is to use a passive frequency Diplexer that is installed between an existing transponder and its antenna. Allowing the use of a Diplexer to operate UAT equipment and the on-board SSR transponder required extensive validation to verify that the use of a Diplexer would not degrade the operation of either system. A test effort utilizing a prototype Diplexer conforming to the requirements of the UAT MOPS (RTCA/DO-282A, §2.2.14.3) was utilized to conduct the necessary testing.
Upon initial investigation into the concept of antenna sharing by use of a Diplexer, certain characteristics were critical to enable use of a Diplexer. The power loss across the Diplexer was an important consideration. The typical loss that installations allow between the transponder and antenna is 3 dB. The Diplexer cannot use up a significant portion of this allocation without eliminating most existing transponder installations as candidates for UAT antenna sharing. The requirement that the Diplexer loss cannot exceed .5 dB is expected to enable most existing installations to use a Diplexer and share the transponder antenna. The goals of the Diplexer design were to support a transponder port that would minimize the insertion loss in the 1030/1090 MHz band and possessing adequate passband so that 1030 MHz interrogation signals and 1090 MHz reply signals were unaffected by the Diplexer. An optional DC path in the Diplexer’s transponder channel is allowed so that installations that require antenna sensing can maintain the capability to sense the presence of an antenna. The Diplexer’s transponder channel will attenuate signals at 978 MHz, providing isolation from the UAT. In some cases, Diplexer isolation actually exceeds the level of isolation obtained by using separate transponder and UAT antennas. The latter is a function of distance between antennas. The UAT’s Diplexer port can provide minimal insertion loss to the antenna at 978 MHz, while manifesting a high impedance at the 1030/1090 MHz band.
ACP-WGW01/AI-1Appendix D

Appendix H Page H - 9
© 2005
H.3.1 Antenna Diplexer Testing
Tests were conducted to validate the performance of ATC transponders sharing an aircraft antenna with a UAT by incorporating a Diplexer into the installation. The purpose of the tests was to insure that both the UAT equipment and transponders perform according to the applicable standards and that the Diplexer does not introduce any signal distortions on the 978 MHz frequency of UAT and the 1030/1090 MHz frequencies of ATC transponders. A selected set of tests was performed to measure any potential degradation of equipment performance due to the Diplexer installation. The tests measured the effect of both the UAT/Diplexer on the performance of the transponder and the effect of the transponder/Diplexer on the performance of the UAT system.
H.3.1.1 SSR Transponder Testing
Tests were conducted to measure the effect of the Diplexer installation on the performance of ATC transponders. Two prototype Diplexers built by two different manufacturers were tested. Each Diplexer was tested with seven different transponders including 3 SSR Mode S, and 4 SSR Mode A/C transponders.
A comprehensive set of tests were run on each transponder to measure transmitter and receiver characteristics, reply pulse characteristics, side lobe suppression, undesired replies, and pulse decoder characteristics. Each test was performed both with and without the Diplexer installed to measure the relative effects of the Diplexer. Where appropriate, with the Diplexer installation, the UAT system was connected and transmitting.
Table H-2 shows a summary of the test results. Parameters labeled “none” under measured effects showed no measurable effect within the accuracy of the test system. The test system measurement accuracy either met or exceeded the specified test conditions in the appropriate MOPS.
ACP-WGW01/AI-1Appendix D

Appendix H Page H - 10
© 2005
Table H-2: Diplexer Testing with ATC Transponders
TEST PARAMETER MEASURED EFFECT Reply Power 0.2 to 0.4 dB loss Reply Frequency None
Reply Delay (SSR Mode A/C/S) Increased 0.01 to 0.018 microseconds
Reply Delay Jitter (SSR Mode A/C/S) None Reply Pulse Spacing (SSR Mode A/C/S) None Reply Pulse Shape (SSR Mode A/C/S) None
Undesired Replies
UAT transmission triggered SSR Mode A/C/S replies with some units
Sensitivity (SSR Mode A/C/S) 0.25 to 0.35 dB loss Dynamic Range None Sensitivity Variation with Frequency None Bandwidth None Pulse Position Tolerance (SSR Mode A/C/S) None Pulse Duration Tolerance (SSR Mode A/C/S) None Pulse Level Tolerance P4 (SSR Mode A/C/S) None Sync Phase Reversal Position Tolerance (SSR Mode S) None SLS Decoding (SSR Mode A/C/S) None SLS Pulse Ratio (SSR Mode A/C/S) None Suppression Duration None Suppression Reinitiation None Recovery From Suppression None SSR Mode S SLS None SSR Mode A/C Desensitization Pulse and Recovery None
The Reply Power and Receiver Sensitivity of the transponders were reduced a fraction of a dB through the Diplexer. This is expected due to the insertion loss of the transponder channel of the Diplexer that is specified to be 0.5 dB maximum. This should not be a detriment to proper operation as long as the installation accounts for the additional loss.
The reply delay showed an increase of about 10 to almost 20 nanoseconds average for all Diplexer and transponder combinations. This is an effect of the sum of the 1030 MHz interrogation and the subsequent 1090 MHz reply each being delayed through the Diplexer about 5 to 10 nanoseconds.
The Undesired reply rate was measured by monitoring SSR Mode A/C and SSR Mode S reply transmissions without interrogating the transponder. With the Diplexer and UAT installed and operating with the transponder, some of the transponder/Diplexer combinations resulted in unsolicited SSR replies. This was caused by the low-level UAT signal leakage into the transponder channel of the Diplexer. This occurred significantly
ACP-WGW01/AI-1Appendix D

Appendix H Page H - 11
© 2005
more with one of the Diplexers than with the other and it varied with the transponder type. The worst case measured was at an average rate of about 0.75 SSR Mode A/C replies per UAT transmission. There were no unsolicited SSR Mode S replies with any of the test configurations. The undesired reply rate for SSR Mode A/C modes is required to be 5 replies per second or less averaged over a 30 second interval. (This is the requirement for SSR Mode S transponders – RTCA DO-181B) The MOPS for Airborne ATC Transponder Systems (RTCA DO-144) requires that the random triggering rate not exceed 30 replies per second. This latter requirement is after installation with all possible interfering equipment operating. Although the undesired reply rate caused by the UAT transmissions were within the requirements, it was not desirable to trigger transponder emissions by the UAT signal. This issue was not solely a Diplexer issue, since depending upon UAT antenna and transponder antenna proximity in an installation, UAT transmissions could cause transponder responses during UAT transmissions without a Diplexer. For this reason, UAT equipment is required to output a suppression pulse to the transponder to inhibit the transponder receiver during UAT transmissions.
Measurements also indicated that the Diplexer installation does affect VSWR. With SSR Mode A/C transponders, the change in VSWR altered the transponder reply frequency. SSR Mode S transponders were more immune to VSWR variations. Proper tuning of the installed cabling and adjusting for VSWR as specified in section 3.2.1.2 of this document for UAT installation, and for the transponder, as required by the applicable standard, is required.
Since the passive Diplexer integrates UAT equipment with the SSR transponder on the aircraft, it was necessary to coordinate the use of a Diplexer with the Surveillance and Conflict Resolution Systems Panel (SCRSP) of the International Civil Aviation Organization (ICAO). SCRSP produces and maintains international standards for the SSR systems. The results of the extensive tests that were conducted to verify proper operation of the SSR transponder with a passive Diplexer were made available to SCRSP to evaluate the performance of the SSR transponder through the Diplexer.
An additional set of tests were recommended by SCRSP to investigate the performance of a SSR Mode S transponder with the use of a Diplexer and its ability to properly decode SSR Mode S interrogations with numerous Differential Phase Shift Keying (DPSK) phase shifts. These tests would verify that the bandwidth of the Diplexer does not cause distortion of the interrogation signal that would degrade the ability of the SSR Mode S transponder receiver to properly decode these interrogations. In order to evaluate the Diplexer impact on DPSK, the transponder receiver sensitivity was tested as interrogation frequency was varied. Three SSR Mode S type transponders were tested both with and without the Diplexer installed in order to make a direct comparison of the Diplexers effect. The transponders tested were from three different manufacturers. The installation of the Diplexer affects the Voltage Standing Wave Ratio (VSWR) of the antenna ports, so a slotted line and stub tuner were used to monitor and control VSWR. The stub tuner was used to set the VSWR to the same minimum value obtainable with and without the Diplexer. This was done to minimize the VSWR influence on the sensitivity measurements.
Figure H-6 shows a plot of the Sensitivity Variation with Frequency measurements for one of the transponders tested. The interrogation consisted of a legal uplink format defined by the first five bits of the interrogation. All other data bits equal to binary ‘1’ except the Address Parity (AP) field, which was properly coded to elicit a response from the transponder. The all binary 1’s format was used to maximize the number of phase
ACP-WGW01/AI-1Appendix D

Appendix H Page H - 12
© 2005
shifts in the uplink interrogation. This was the primary interrogation format used to test all three transponders.
The data shows a consistent average reduction in sensitivity of about 0.2 dBm, the loss through the Diplexer, which does not vary significantly with frequency. Additional tests were conducted with all variable data bits equal to binary ‘0’ to minimize the number of phase shifts with nearly identical results.
Sensitivity Variation with Frequency - Mode S Interrogation All 1's - Transponder MS-1
-78.0
-77.0
-76.0
-75.0
-74.0
-73.0
-72.0
1029
.5
1029
.6
1029
.7
1029
.8
1029
.9
1030
.0
1030
.1
1030
.2
1030
.3
1030
.4
1030
.5
Interrogation Frequency (MHz)
Sen
sitiv
ity (d
Bm
)
No Diplexer
Diplexer
Figure H-6: Sensitivity Variation with Frequency, All 1’s Interrogation,
Transponder MS-1
All three tested SSR Mode S transponders yielded similar results. The conclusion from running these tests is that other than the expected reduction in the transponder receiver sensitivity from the loss across the Diplexer, the SSR Mode S sensitivity is not affected as a function of frequency within the operating bandwidth of the transponders. The Diplexer bandwidth characteristics for the SSR transponder channel adequately handles 1030 MHz SSR Mode S interrogation signals with excessive DPSK phase variations.
H.3.1.2 UAT Diplexer Testing
A variety of tests were conducted to determine the effects of UAT signals through a Diplexer. Testing was facilitated using nine different configurations to test various combinations of remote or onboard UAT receivers, remote Ground Uplink transmissions, interference to UAT from remote or onboard SSR Mode S or SSR Mode A/C transponders, as well as onboard transponder leakage, in circuit with an implemented antenna Diplexer.
Since no performance difference was measured looking at UAT reception at the on-board UAT receiver nor remotely when looking at UAT signals from the on-board transmitter through the Diplexer, the severe case of onboard interference from SSR Mode S or SSR Mode A/C transmissions through the transponder port of a Diplexer to a UAT receiver,
ACP-WGW01/AI-1Appendix D

Appendix H Page H - 13
© 2005
was investigated. Even though the assumptions for the UAT performance model assume no UAT receptions when UAT signals are overlapped by on-board SSR transmissions, the test results show that the Diplexer provides sufficient isolation from the on-board 1030 MHz and 1090 MHz transmissions to enable a high probability of successful reception of low-level UAT messages. In all of the test cases where SSR Mode A/C/S transmissions interfered with UAT message receptions, the test was particularly severe. The transponder transmissions were overlaid in time with the UAT messages 100 % of the time, yet the UAT receiver, isolated by the antenna Diplexer, performed with no significant degradation
H.3.1.3 Prototype Diplexer Performance
The following figures show measured data obtained from a prototype Diplexer.
Figure H-7 shows the performance between the Antenna and UAT ports.
Figure H-7: Diplexer UAT Port
ACP-WGW01/AI-1Appendix D

Appendix H Page H - 14
© 2005
Figure H-8 shows the performance between the Antenna and Transponder ports.
Figure H-8: Diplexer Transponder Port
ACP-WGW01/AI-1Appendix D

Appendix H Page H - 15
© 2005
Figure H-9 shows the isolation between the UAT and Transponder ports. Note that the isolation between the ports at the UAT frequency is 25 dB, and the isolation at the Transponder frequencies are 42 dB at 1030 MHz, and 64 dB at 1090 MHz.
Figure H-9: Diplexer UAT-to-Transponder Port Isolation
ACP-WGW01/AI-1Appendix D

Appendix H Page H - 16
© 2005
H.3.2 Typical Installation Diagram
Figure H-10 illustrates how a UAT might be added to a typical existing transponder installation by using frequency Diplexer/combiner. Shaded boxes indicate the new components added to the existing installation. The Diplexer can be added anywhere in the antenna’s feedline. The most logical place for this addition would be in the aircraft’s equipment bay in close proximity to both the UAT and transponder units. This way, existing feedlines would not have to be re-routed or altered.
Figure H-10: Diplexer Installation
Diplexer
Diplexer
UAT
SSRTransponder # 1
SSRTransponder # 2
Existing top Antenna
Existing Bottom Antenna
Shaded boxes indicate new components
ACP-WGW01/AI-1Appendix D

Appendix I
Simulated Results for Delivery of Four Trajectory Change Reports over
UAT in Core Europe 2015
ACP-WGW01/AI-1Appendix D

This Page Intentionally Left Blank
ACP-WGW01/AI-1Appendix D

Appendix I Page I - 3
©2005
I. Simulated Results for Delivery of Four Trajectory Change Reports over UAT in Core Europe 2015
I.1 Introduction
The use of ADS-B for exchange of intent information has been viewed as a possibility that could enable long-range airborne applications, such as conflict detection and avoidance. The ADS-B MASPS (RTCA/DO-242A) outlines some guidelines for transmission of some intent information, but does not specify requirements for the transmission of Trajectory Change Reports (TCRs). The current UAT MOPS (RTCA/DO-282A) discusses the transmission of two TCRs. This Appendix contains a description of how up to four (4) TCRs may be supported by the UAT system. The purpose is to examine the performance of several potential schemes for transmission of multiple TCRs over UAT, with the intention of facilitating future discussions of broadcasting intent over UAT.
Three paths for different transmission schemes for Class A3-equipped aircraft were proposed for consideration:
1. Changing the current four-second transmission epoch to five seconds, with four
TCR messages plus a Mode Status message; 2. Maintaining the four-second epoch, which currently results in a total of twelve
TCR transmissions in sixteen seconds (eight TC0 and four TC1), and modifying the current TCR transmission schedule to cycle through 3 or 4 different TCRs; and, finally,
3. Re-definition of the TCR information, to determine whether the actual data requirements would be less than those currently suggested by RTCA, leading to the possibility of including two TCRs in a single ADS-B message. This last course was not carried out for this analysis.
The results of the analysis using the first two techniques will each be described in more detail in the sections below.
I.2 Intent Results Using Four-Second Epoch
Currently, the Class A3 equipage level transmission schedule, as outlined in the Manual on the UAT Detailed Technical Specifications, section §2.1.3 and in section §3.1.1 of this Manual, specifies that the four-message sequence consists of:
• Message type 1, which contains no intent information • Two message type 4, which can contain TC+0, the next Trajectory Change
Point for the aircraft • Message type 5, which can contain TC+1, a second Trajectory Change Point
for the aircraft to be reached after TC+0
ACP-WGW01/AI-1Appendix D

Appendix I Page I - 4
©2005
These messages are to be transmitted in the following sequence, over the course of 16 seconds, as indicated in section §3.1.2 of this Manual:
1-4-4-5-5-1-4-4-4-5-1-4-4-4-5-1.
This is done in order to ensure that each message is transmitted and received from both top and bottom antennas in a uniform manner.
The analysis in this section makes use of the sixteen-message sequence listed above, with the message types 4 and 5 replaced by “any intent message”, so that the sequence becomes:
1-N-N-N-N-1-N-N-N-N-1-N-N-N-N-1,
with N representing a message containing the information for a Trajectory Change Report, with N=4 (TC+0), 5 (TC+1), 7 (TC+2), or 8 (TC+3). Intent Messages to be transmitted are cycled in order. This means that for four TC transmissions, the scheduler cycles through 4-5-7-8 as it reaches each N message, while for three TCs, it cycles through 4-5-7. This scheme results in three of each TC being transmitted every 16 seconds for the four TC case, and four of each TC going out every 16 seconds for the three TC case.
The Multi-Aircraft UAT Simulation (MAUS) was run to assess received TCR performance for these two cases, and the results are summarized in Figure I-1 below.
0 10 20 30 40 50 60 70 80 90 100 110 120 130 140 1500
10
20
30
40
50
60
70
80
90
100
Upd
ate
Tim
e (s
ec)
Range (NM)
3TCR Rotation4 TCR RotationDO-242A Req.Eurocontrol
Figure I-1: 95th Percentile Trajectory Change Report Update Times for an A3 Receiver
at High Altitude in CE 2015 over Brussels Using TC Rotation to Deliver Messages Containing Information for 3 or 4 TCRs
ACP-WGW01/AI-1Appendix D

Appendix I Page I - 5
©2005
These simulation runs were made for a Class A3 receiver over Brussels (in the Core Europe 2015 air traffic scenario with all aircraft equipped with UAT and including JTIDS/MIDS and DME interference) receiving Class A3 intent transmissions. Since each TC is transmitted in the same pattern, the data were accumulated to show the TC 95th percentile update time for receiving any of the four TCRs as a function of range. The dashed line represents guidance on desired TCR reception provided by Eurocontrol, while the solid line is the requirement of the RTCA/DO-242A, ADS-B MASPS, for the TCR containing the TC+0 information.
As expected, the three-TC case performs better than the four-TC case, since each message is transmitted more frequently when only three TCs are used. It should be noted that no attempt has been made to optimize TC transmissions.
I.3 Intent Results Using Five Second Epoch
The MAUS was modified to allow for a five-second epoch for transmissions from aircraft equipped with Class A3 UAT avionics, defined with the following sequence:
1-4-5-7-8,
repeated continuously.
A set of MAUS runs was made using this modified version with the exact same air traffic scenario as described in the previous section: Class A3 reception of Class A3 intent information, over Brussels in the same interference conditions. The results are presented in Figure I-2 below.
ACP-WGW01/AI-1Appendix D

Appendix I Page I - 6
©2005
0 10 20 30 40 50 60 70 80 90 100 110 120 130 140 1500
10
20
30
40
50
60
70
80
90
100
Upd
ate
Tim
e (s
ec)
Range (NM)
5 Second EpochDO-242A Req.Eurocontrol
Figure I-2: 95th Percentile Trajectory Change Report Update Times for an A3 Receiver at High Altitude in CE 2015 over Brussels Using a 5 Second Epoch to
Deliver 4 TC Messages
As in the previous section, these results show the TC 95th percentile update time for receiving any of the four TCRs as a function of range. The dashed line represents the guidance received from Eurocontrol on the desired update rate, while the solid line is the requirement of the RTCA/DO-242A ADS-B MASPS for the TCR containing information on TC+0.
Figure I-3 compares the performance of the two techniques outlined here for the transmission of four TC messages over UAT. Once again, it should be noted that these results represent only an initial attempt to accommodate four TC transmissions. No effort has been made to improve or optimize the techniques used. In addition, reception of intent information by a receiver on the ground has not been studied.
ACP-WGW01/AI-1Appendix D

Appendix I Page I - 7
©2005
0 10 20 30 40 50 60 70 80 90 100 110 120 130 140 1500
10
20
30
40
50
60
70
80
90
100
Upd
ate
Tim
e (s
ec)
Range (NM)
5 Second Epoch4 TCR RotationDO-242A Req.Eurocontrol
Figure I-3: 95th Percentile Target Change Report Update Times for an A3 Receiver at High Altitude in CE 2015 over Brussels Comparing Both Methods for Delivering
4 TC Messages
From Figure I-3, it appears that as defined for this analysis, the 5-second epoch technique used produces better results than that used with the 4-second epoch. This might have been anticipated, since the 5-second epoch results in three repetitions of each TCR every 15 seconds, while the 4-second epoch supplies three copies of each TCR every 16 seconds. These results supply a rough guideline for comparing the two techniques. It should be noted that the use of the five-second epoch results in the transmission of Mode Status information, once every five seconds instead of once every four seconds. The operational impact, if any, of this difference has not been evaluated.
ACP-WGW01/AI-1Appendix D

Appendix I Page I - 8
©2005
This Page Intentionally Left Blank
ACP-WGW01/AI-1Appendix D

Appendix J
UAT Ground Station Data Channel Assignment Guidance
ACP-WGW01/AI-1Appendix D

This Page Intentionally Left Blank
ACP-WGW01/AI-1Appendix D

Appendix J Page J - 3
© 2005
J. UAT Ground Station Data Channel Assignment Guidance
J.1 Introduction
The Appendix describes one method that could be used to coordinate the assignment of uplink resources from UAT Ground Stations within a region. In developing this assignment method, the guiding operational objective was limited to providing a user with connectivity to at least one Ground Station at any point within the combined service area of the network. Additionally, it is assumed this one Ground Station need not be any particular Ground Station – each Ground Station will transmit products of interest to any user likely to receive them. Finally, this assignment method relies on horizon blockage of the undesired signal rather than relying on a specific Desired to Undesired (D/U) signal ratio.
In order to maximize the volume of airspace within which aircraft equipped with UAT receivers can receive up-linked information from Ground Stations (GS), the locations of the GS must be carefully chosen. In addition, the service volume depends critically on the way the ground up-link segment resources (32 Data Channels) are distributed among the GS. One or more Data Channels assigned to a UAT Ground Station is called the station’s “Data Channel Block” (DCB). The reason this maximization is not trivial is that there are two conflicting criteria that must be satisfied. In order to provide low-level coverage, GS must be spaced closely together due to line-of-sight (LOS) considerations. On the other hand, aircraft at high altitudes will see many of the closely-spaced GS. Thus, in order to avoid unwanted interference, all the GS within view of a particular aircraft should, to the degree possible, use separate DCBs. This means that if a wide range of altitudes is to be supported, there may need to be many different DCBs. However, the number of such sets is very limited. Assume, for the moment, that each GS has four Data Channels’ worth of information to transmit each second (see §J.2.2 for a discussion of unequal DCBs). In that case, there will be only 8 DCBs. In what follows it will be shown that the way these DCBs are assigned to the GS can have a profound impact on the overall system performance.
In the §J.2, an ideal case where the Earth is assumed to be a smooth sphere and where ground sites can be freely chosen to be on a nearly perfect hexagonal grid will be considered. In §J.3 a more realistic approach is considered, where siting is constrained and terrain effects come into play.
J.2 Ideal Case
There are well-known rules for assigning resources on a hexagonal grid. Normally, the resource is a frequency assignment, but in this case it is a DCB assignment. The rules are the same. There are certain allowable patterns such as the 7-fold pattern commonly used in cellular telephone systems. All the patterns employ a number of separate resources given by:
22 nmnmN ++=
where m and n are any two nonnegative integers. Below, the focus will be on patterns with N=3, N=4, and N=7. Each pattern will be referred to the by its value of N. For instance pattern (7) corresponds to m = 2 and n = 1.
ACP-WGW01/AI-1Appendix D

Appendix J Page J - 4
© 2005
Figure J-1 shows pattern (4). (Only part of the grid is filled out. The remainder should be obvious.) The DCB assignments are labeled A, B, C and D. Note that two of the A cells have been singled out by coloring them red and blue. These two have the potential to interfere with one another; however, if the distances and altitudes are such that the radio horizon of the blue cell (shown as the blue circle) lies entirely outside the red cell, it will not materially interfere with reception from the red ground site within the red cell. If the intersite distance is D, then the radius of the blue circle is 23D , and the radius of the
red circle is 3D . These two radii can be related to the highest altitude (service ceiling) of the cells that provides no interference and the lowest altitude of the cells that has complete coverage (service floor). These are given by:
f
c
HD
HD
23.13
23.12
3
=
=
with H given in feet and D given in nautical miles. In this case the ratio of the service ceiling to the service floor is just:
427
=f
c
HH
.
Thus, if the service ceiling height were 54000 feet, the service floor would be at 8000 feet.
ACP-WGW01/AI-1Appendix D

Appendix J Page J - 5
© 2005
A
A
A
A
A
A
B
B
B
B
B
B
C
C
C
C
C
B
D
D
D
D
D
D
D
C
C
A
Figure J-1: Basic Pattern (4)
A similar analysis for pattern (7) shows that the ratio of service ceiling to service floor would be 13. For example, if the service ceiling were 39000 feet the service floor would be 3000 feet. This may appear to be the limit of service floor/ceiling performance given the restriction to no more than 8 DCBs; however, there is a way to extend this range by adopting a tiered approach.
Suppose, for example, that there is an array of widely-spaced GS in pattern (4) to cover an upper tier (Tier 1) from 54000 feet to 8000 feet (as above). A second set of sites that are more closely spaced can then be used to fill in the low-level gaps in coverage provided by the first set. The second layer of coverage is called Tier 2. If Tier 2 is also laid out in pattern (4), the result may appear as shown in Figure J-2. This pattern is designated pattern (4, 4). The sites supporting Tier 1 are given upper case letters, and the sites supporting Tier 2 are given lower case letters1. Note that only the letters a, b and c are used in Figure J-2, making it appear as though this would be more correctly called a pattern (4,3). However an important point is that sites that support Tier 1 also support Tier 2. In other words, if we replace the upper case letters with the letter “d”, the result is pattern (4). The fact that the potential “d” sites employ 4 different DCBs will only lower the possibility of interference between them (below the lowered service ceiling of Tier 2). (See §J.2.1 for further explanation.)
1 To this point DCBs have been consistently referred to using only capital letters. Within the remainder of this appendix the concept of groups of DCBs (each oriented to altitude tiers) is developed. To clearly delineate each of these groups, capital letter, small letters and numbers are all used to represent DCBs belonging to three groups (tiers).
ACP-WGW01/AI-1Appendix D

Appendix J Page J - 6
© 2005
A
B
AD
C
C
D
a
b
c
a
b
c
a
b
c
a
b
c
a
bc
a
b
c
a
b
c
Figure J-2: The (4, 4) Pattern for Tiers 1 & 2
Note: The tier 1 cells (capital letters) serve double duty; they also form the fourth DCB of tier 2. Thus the designation as Pattern (4,4)
If we let D1 be the intersite spacing of the Tier 1 cells and D2 be the intersite spacing of the Tier 2 cells, then
212 DD = .
It is critical to note that the service ceiling of the Tier 2 sites is 13500 feet and the service floor is at 2000 feet. Because the service floor of Tier 1 is lower than the service ceiling of Tier 2, there are no gaps in coverage. Also, the total range of altitudes covered is larger than the range provided by the single-tiered approach using pattern (7).
An exhaustive search of all the possible tiered patterns using no more than 8 DCBs shows that the best GS layout is given by the three-tiered array designated as pattern (4, 3, 3). This uses all 8 available DCBs. (Recall that each of the lower tiers uses only two additional DCBs.) If the spacing between the closest sites is 60.25 NM, the pattern provides gapless coverage for all altitudes from 800 feet to 48600 feet (a ratio of 60.75).
ACP-WGW01/AI-1Appendix D

Appendix J Page J - 7
© 2005
J.2.1 Alternative View of Ideal Case
In the previous section, a top-down description of the proposed patter (4, 3, 3) was provided. It may be instructive to include a description from the bottom up. Figure J-3 shows a standard set of pattern (3) hexagons labeled 1, 2 and 3. These will constitute the Tier 3 sites. If they are separated by 60.25 NM they will provide coverage from 800 feet to 3200 feet.
Figure J-3: Tier 3 of Pattern (4, 3, 3)
For coverage above 3200 feet, the sites labeled 3 in Figure J-3 are relabeled as a, b or c as shown in Figure J-4. These Tier 2 sites are separated by 104.35 NM and provide coverage from 2400 feet to 9600 feet.
ACP-WGW01/AI-1Appendix D

Appendix J Page J - 8
© 2005
Figure J-4: Tiers 2 and 3 of Pattern (4, 3, 3)
Finally, Tier 1 is constructed by relabeling the Tier 2 sites labeled c with A, B, C or D to give Figure J-5. These Tier 1 sites are separated by 180.75 NM and provide coverage from 7200 feet to 48600 feet. Figure J-6 illustrates the general shape of the effective service volumes of cells from each tier.
Figure J-5: Complete Pattern (4, 3, 3)
ACP-WGW01/AI-1Appendix D

Appendix J Page J - 9
© 2005
Figure J-6: Conceptual View of Uplink Service Volume in Cross Section
J.2.2 Alternative DCB Assignments
Up to this point it has been assumed that the DCBs assigned to the different ground sites all have the same capacity, i.e., they all consist of 4 Data Channels. However, it seems likely that the sites servicing the larger volumes (the higher tiers) will have more information to convey. Thus, it may be advantageous to assign the capacity unevenly. For example, for the pattern (4, 3, 3) the numbers of Data Channels assigned per site might be 5, 4 and 2 (going from Tier 1 to Tier 3). If that were the case, then the total number of Data Channels assigned would be 5x4+4x2+2x2 = 32; all the Data Channels would be assigned to one type of site or another.
In the original case where each DCB consists of 4 Data Channels. The Data Channels assigned to each DCB can always be allocated to GS so that in each second individual GS can transmit on a schedule with evenly-spaced transmissions 8 Data Channels apart. This will ease the up-link transmitter design by keeping the short-term duty factor low. However, for the 5-4-2 plan described in the previous paragraph, this is not possible. For this Data Channel usage plan the following schedule ensures that successive transmissions from any GS are no closer than 6 Data Channels. (Data Channels are numbered from 1 to 32.) Of course, the actual slots are rotated on a second-by-second basis according the rules of section §3.2.2.2 of the Manual on the UAT Detailed Technical Specifications.
Table J-1: Data Channel Mapping to DCB for the 5-4-2 Plan
DCB Data Channel 1 1,17 2 9,25 a 3,11,19,27 b 7,15,23,31 A 5,12,18,24,30 B 2,8,14,21,28 C 4,10,16,22,29 D 6,13,20,26,32
J.3 Deployment Example
In an actual deployment, site selection for UAT will tend to be limited to ground locations that are already available to the service provider. Also, varying terrain may
ACP-WGW01/AI-1Appendix D

Appendix J Page J - 10
© 2005
enhance radio line-of-sight range (LOS) if a site is at a high elevation or limit it if a site is surrounded by mountains, for example. Thus, the coverage of the ground sites will be anything but regular, and a perfect cellular layout will not be possible. Nevertheless, it seems that the method of providing a tiered approach may still be a good one. The question is how to most efficiently construct the tiers.
Important parameters that will determine the solution of the Data Channel assignment problem are the desired service ceiling and service floor altitudes. The achievable service floor is largely determined by the intersite spacing. If the spacing between any two sites is large, the bottom of the coverage between them will be high. To achieve a low service floor will require close spacing. That, in turn, may require a large number of ground sites to cover a given geographical region. Of course, low level coverage may only be necessary in selected locations, so the number of sites could be reduced. On the other hand, the effects of terrain variation may increase the number of sites needed.
One strategy for Data Channel assignment would be to begin with all the available sites and attempt to create Tier 1. An initial site for assignment of DCB “A” could be chosen near the edge of the overall coverage area, and then a second site could be chosen such that its LOS did not impinge upon the desired service volume of the initial site and the LOS of the initial site did not impinge upon the desired service volume of the second site. To do this it is necessary to define what is meant by the “desired service volume” of a site. That depends on the ideal pattern being approximated. Suppose it is pattern (4, 3, 3). If the target Tier 3 intersite distance, D3, is taken to be 60.25 NM (as in §J2), then the next reuse of DCB “A” would be about 2D1 = 6D3 = 361 NM away, and the desired LOS would be somewhere between NMD 902/1 = and NMD 1043/1 = . Choose the closest site that meets the noninterference criteria. The next site to use DCB “A” should be the one of the remaining sites that is closest to the first two and also obeys the noninterference criteria. In this case “closest” could mean the one for which the sum of the distances to the two nearest sites using DCB “A” is the least. This process should continue until no more DCB “A” sites can be assigned. This process should then be repeated using B, C and D DCBs. When choosing these sites, care should be taken to pick locations that most closely approximate the desired hexagonal effect. If all goes well, this process will provide total coverage from 48600 feet down to an altitude below the service ceiling of Tier 2. Tier 2 can now be populated using a similar method. For selected locations that need particularly low altitude coverage, Tier 3 locations can also be identified using similar techniques.
J.3.1 An Implementation Example
The process described in the previous plan has been used on a limited basis to make DCB assignments for a deployment of 30 GS in the southeastern part of the United States. Using the top-down approach it was relatively easy to define the Tier 1 sites with the proper spacing. The Tier 2 sites were more difficult to define since the available sites were not evenly distributed geographically. It was nearly impossible to assign Tier 3 sites according to the rule of the ideal model. These were assigned on a more ad hoc basis by trying to maximize the distance between any two sites using the same slot set, independent of their relation to the pattern of the top two tiers. The performance of the resulting assignment plan can be judged by observing the coverage at altitudes of 40000 feet, 10000 feet and 3000 feet shown in Figure J-7, Figure J-8 and Figure J-9. The shaded portions denote areas with coverage by at least one GS. Note that at the highest altitude the coverage is determined with respect to altitude Above Mean Sea Level (AMSL), while the coverage at the lower two altitudes was Above Ground Level (AGL).
ACP-WGW01/AI-1Appendix D

Appendix J Page J - 11
© 2005
In these figures terrain effects have been taken into account, which explains the sometimes irregular shapes of the individual service volumes.
Figure J-7: USA East Coast Coverage at 40000 feet AMSL
Figure J-8: USA East Coast Coverage at 10000 feet AGL
ACP-WGW01/AI-1Appendix D

Appendix J Page J - 12
© 2005
Figure J-9: USA East Coast Coverage at 3000 feet AGL
ACP-WGW01/AI-1Appendix D

Appendix K
Future Range Validation of UAT Messages
ACP-WGW01/AI-1Appendix D

This Page Intentionally Left Blank
ACP-WGW01/AI-1Appendix D

Appendix K Page K - 3
© 2005
K. Future Range Validation of UAT Messages
K.1 Background
The Manual on the UAT Detailed Technical Specifications contains timing requirements related to both the transmission of UAT ADS-B Messages and reception of UAT ADS-B and UAT Ground Uplink Messages. These timing requirements ensure the separation of the UAT Ground Uplink segment and UAT ADS-B segment, and also synchronize MSO timing for The primary objective of the timing resolution in these requirements is to support a future capability of range measurement between UAT ADS-B Transmitting and Receiving Subsystems that is independent of the ADS-B reported position data (see §Error! Reference source not found.). This range calculation can be made from knowledge of the precise Time of Message Transmission (TOMT) and Time of Message Receipt (TOMR) of UAT ADS-B Messages. An ADS-B validation technique can compare this one-way time of propagation range measurement with the range determined from the UAT ADS-B Message to increase confidence that the message came from a bona fide transmitter. As an example, certain pairwise procedures may only be authorized when the range to the other aircraft in the pair passes appropriate validation tests.
This ADS-B validation technique should only be used in cases where both the transmitting and receiving stations are UTC coupled, that is, they are receiving time from a GPS/GNSS source or equivalent. A non-UTC coupled condition can occur due to a temporary unavailability of the GPS/GNSS source or equivalent. At any given time, a UAT transmitter is obligated to announce whether or not it is in the UTC coupled condition.
The purposes of the following sections are:
1. Document the expected total installed end-to-end timing performance as guidance to UAT installers and to developers of ADS-B validation applications.
2. Provide rationale for the timing related requirements given in the Manual on the UAT Detailed Technical Specifications in the context of the expected total installed performance.
3. List additional considerations for developing ADS-B validation techniques.
K.2 Installed End-End Timing Performance
Listed below are the identified components of possible timing errors and their assumed worst-case values using the GPS component of GNSS as an example.
a) Errors due to the GPS signal in space: This is assumed bounded by the performance
specifications of the GPS Standard Positioning Service with SA OFF. Uncertainty range = -100 to +100 ns.
ACP-WGW01/AI-1Appendix D

Appendix K Page K - 4
© 2005
b) GPS antenna and coax effects. This is assumed bounded by a 20 meter maximum installed cable length. Uncertainty range = 0 to +66 ns
c) GPS-UTC time offsets: This is applicable to GPS receivers that output GPS time
instead of UTC time. Since GPS sensors that may be used for ADS-B are not required to make the UTC correction, this offset must be included. GNSS SARPs, §3.1.4 of Appendix B to Volume I of Annex 10, allow GPS time to deviate from UTC time by up to 1 microsecond. This is expected to be very conservative. Uncertainty range = -1000 ns to +1000 ns.
d) Delays due to interconnection of GPS sensor and UAT: This component applies to
installations with a UTC coupled time source that is external to the UAT equipment. Allowance is needed for delays induced in lightning protection filters and interconnect cable capacitance between the GPS/GNSS sensor and the UAT. Total uncertainty range based on tests performed by an avionics manufacturer has been determined to be = 0 to +800 ns.
e) UAT Tx/Rx time errors: These are errors due to control of transmitter turn on and in
marking message time of arrival within the receiver. An uncertainty range specifically for this component is established in the Manual on the UAT Detailed Technical Specifications. Uncertainty range = -500 ns to +500 ns.
f) UAT antenna/coax effects: This is assumed bounded by a maximum installed cable
length and optional use of a Diplexer. Uncertainty range = 0 to +66 ns
Table K-1 shows the worst case timing offset possible between a transmitting UAT ADS-B system participant and a receiving UAT ADS-B system participant given the individual error components listed above. This suggests that a value just under 0.7 NM would represent the absolute worst-case range measurement error due to timing offsets between transmitter and receiver under normal (UTC Coupled) conditions.
ACP-WGW01/AI-1Appendix D

Appendix K Page K - 5
© 2005
Table K-1: Worst Case Timing Offset
Transmitting ADS-B System
Participant (nanoseconds)
Receiving ADS-B System
Participant (nanoseconds)
Worst Case transmitter-to-
receiver relative timing offset
(nanoseconds)
Error Component
Min Max Min Max Min Max a) GPS signal in space -100 +100 -100 +100 -200 +200
b) GPS cable delay 0 +66 0 +66 -66 +66 c) GPS-UTC time offset -1000 +1000 -1000 +1000 -2000 +2000
d) GPS-UAT interconnect delay 0 +800 0 +800 -800 +800
e) UAT Tx time accuracy -500 +500 N/A N/A -500 +500
f) UAT Rx time stamp accuracy N/A N/A -500 +500 -500 +500
g) UAT cable delay 0 +66 0 +66 -66 +66 Total Worst case of all Components -4132 +4132
For comparison, note that if both the transmitter and receiver use GPS time where the GPS receiver is internal to the UAT equipment, then two of the major components, (c) and (d) in Table K-1 above, of timing offset error are largely eliminated. In this case the absolute worst-case range measurement error due to timing offsets between transmitter and receiver would be about 0.25 NM.
K.3 UAT Timing Requirements
There are essentially two requirements in the Manual on the UAT Detailed Technical Specifications related to timing: one related to control of UAT ADS-B Message transmission, and one related to time-stamping of message receipt. The requirements are treated separately depending on whether the UTC time source is internal or external to the UAT equipment.
Message Transmission Timing:
The Manual on the UAT Detailed Technical Specifications section §3.1.2.2 on “Relationship of the MSO to the Modulated Data” specifies the requirement for UAT ADS-B Message transmission timing.
1. When an internal UTC time source is used, the requirement and test is designed to verify uncertainty components c) (GPS-UTC) and e) (UAT Tx time). This is accomplished by applying an actual or simulated GPS input to the UAT such that the GPS signal presents minimal timing uncertainty. The maximum timing error allowed is 500 ns.
ACP-WGW01/AI-1Appendix D

Appendix K Page K - 6
© 2005
2. When an external UTC time source is used, the requirement and test is designed essentially to account only for part of component d) (GPS interconnection delays) and component e) (UAT Tx time). This is accomplished by applying a test 1PPS or Time Mark input that is essentially free of uncertainty components a), b), c), and most of d). The maximum timing error allowed is 500 ns.
Accuracy of Time Stamping on Message Receipt:
The Manual on the UAT Detailed Technical Specifications section §4.1.1 on “Receiver Time of Message Receipt” specifies the requirement for time-stamping of received messages.
1. When an internal UTC time source is used, the requirement and test is designed to verify uncertainty components c) (GPS-UTC) and e) (UAT Rx timestamp). This is accomplished by applying an actual or simulated GPS input to the UAT such that the GPS signal presents minimal timing uncertainty. The maximum timing error allowed is 500 ns.
2. When an external UTC time source is used, the requirement and test is designed essentially to account only for part of component d) (GPS interconnection delay) and component e) (UAT Rx timestamp). This is accomplished by applying a test 1PPS or Time Mark input that is essentially free of uncertainty components a), b), c), and most of d). The maximum timing error allowed is 500 nanoseconds.
K.4 Considerations for ADS-B Validation Techniques
Receiver Time of Message Receipt (TOMR)
The Manual on the UAT Detailed Technical Specifications details the requirements for accuracy and resolution of making the raw measurements on which a range calculation can be made. TOMR is relative to the start of the UTC second, and is reported in units of 100 nanoseconds.
The UAT receiver, or an external application, can directly calculate the range to the target by knowing how many whole and fractions of an MSO (250 microseconds) elapsed between transmission and receipt of the message. The fractional portion is directly calculated from each State Vector (SV) report received, which gives fine-scale resolution to about 30 meters (100 nanoseconds unit size times 3.0e+8 meters/second). The integer portion provides resolution of about 40.47 NM (250 microseconds times 3.0e+8 meters/second). The UAT ADS-B Message contains the six least significant bits of the MSO number used for its transmission.
Acquisition of full TOMR Range
The full TOMR range (integer and fractional parts) can be determined once a Long UAT ADS-B Message containing the Transmission Epoch field has been received (the Long Type 1 UAT ADS-B Message). The Transmission Epoch field has sufficient span to unambiguously identify in which MSO the message was transmitted. The receiving UAT
ACP-WGW01/AI-1Appendix D

Appendix K Page K - 7
© 2005
or the external application can then calculate the integer portion of TOMR, and derive the full TOMR value.
Once the full TOMR range has been acquired, the fractional portion can be used to maintain a track of the range value during the interval between receipts of a message containing the Transmission Epoch.
TOMR Range Filtering
The raw TOMR range values will likely require some filtering prior to use. An alpha-beta recursive filter, which allows for uneven time between message receptions (because of dropped messages, etc.), can be used to both smooth and predict range values.
Correlation of TOMR Range versus SV-based Range
Slant Range: The filtered range value includes the slant range effects, and will normally exceed the great-circle range calculated from the SV position of the target and the ownship SV position. The correlation of the target’s range will require either some compensation of the great-circle range to include an estimate of the slant range, or a correlation window that has greater tolerance for increased slant range at high elevation angles. Since it is possible that some targets may not be reporting their altitude, provision must be made for cases where slant range compensation is not possible.
Datalink latency: One other phenomenon affecting the TOMR range calculation is that the range measured is based on the time of transmission, while the SV-based range calculation is based on the message Time of Applicability. This can lead to some additional variation between the measured and calculated range, which would be particularly noticeable in head-on or reciprocal encounters at high velocity. For example, at a closing rate of 1200 knots, the range closes at about 620 meters per second. The range differential amounts to, at most, 0.33 NM.
Note that for a given pair of aircraft, most of the timing errors can either be compensated for, or are fixed intervals. This allows the possibility that the residual range differential (after removal of fixed or compensate-able errors) could be used as an independent means of closure rate measurement.
ACP-WGW01/AI-1Appendix D

Appendix K Page K - 8
© 2005
This Page Intentionally Left Blank
ACP-WGW01/AI-1Appendix D

Appendix L Page L - 1
Appendix L
L. REQUIREMENTS AND DESIRABLE FEATURES FOR THE UNIVERSAL ACCESS TRANSCEIVER (UAT) SYSTEM
1. INTRODUCTION 1.1 This document is divided into the following subsections:
a) general characteristics and functional capabilities of the Universal Access Transceiver (UAT) that are considered essential;
b) UAT support of the Automatic Dependent Surveillance — Broadcast (ADS-B) function for both air-to-air and air-to-ground applications1; and
c) UAT support of ground uplink services related to surveillance and situational awareness.
2. GENERAL UAT CHARACTERISTICS AND FUNCTIONAL CAPABILITIES 2.1 No degradation of safety 2.1.1 A fundamental requirement is that any new system shall not cause a degradation in safety when introduced; however, there is an overall objective to improve safety. 2.2 System Capacity 2.2.1. UAT capacity must be sufficient to support its intended functions in future high density air traffic environments with realistic self-interference/interference environments. UAT should support a capability with sufficient growth potential to support new ADS-B and situational awareness applications as they are understood. 2.3 Low Cost of Airborne Equipment 2.3.1 The system design shall seek to minimize complexity and costs for the installed airborne system, to the minimum level practical compared to present/alternative avionics costs. It is desirable that sharing of existing aircraft transponder antennas be facilitated whenever possible. 2.4 Ground Infrastructure 2.4.1 The ground infrastructure required for UAT shall be implementable on an incremental capacity/capability basis, with an acceptable cost and complexity. 1 Applications, with references to source documents concerning those applications supplied by ICAO/Contracting States, are listed in Appendix A. It is anticipated that as ADS-B application requirements mature, these Requirements and Desirable Features will need to be revisited.
ACP-WGW01/AI-1Appendix D

Appendix L Page L - 2
2.5 Human/machine interface 2.5.1 The UAT system design shall exhibit a simple human/machine interface for, e.g., aircrew inputs and for ensuring that error inducing mechanisms are not introduced. 2.6 Minimization of Workload 2.6.1 Where possible, UAT functions shall be automated to not increase pilot workload. 2.7 Aircraft Speed Air-Ground Operation 2.7.1 The UAT shall support air-ground communication for aircraft with any ground speed of up to 850 knots. Air-to-Air Operation 2.7.2 The UAT shall serve air-to-air communication for aircraft with any relative air-to-air speed of up to 1,200 knots. 2.8 UAT Range/Coverage 2.8.1 UAT air-to-ground communication for ADS-B shall be supported up to line of sight limitations (or at least 150 NM for potential long range air-to-ground applications) from a single ground station in future high density environments (e.g., at least Core Europe 2015 and Los Angeles 2020). UAT air-to-air range shall be sufficient to support intended ADS-B and situational awareness applications, including future high density environments. 2.9 Radio Frequency Compatibility with Existing Systems 2.9.1 UAT shall not create interference with existing in-band (960-1,215 MHz) systems (e.g., distance measuring equipment (DME) on adjacent channels, JTIDS/MIDS) that degrades the performance of those systems in an operationally significant manner. It is assumed in the end-state that the UAT channel itself will not be used by DME/TACAN in high-density continental airspace. UAT shall be capable of operating to its intended level of performance in the presence of anticipated levels of interference from existing systems. 2.10 Transition 2.10.1 The UAT system design shall provide for an orderly transition to an ADS-B end-state in which the large majority of aircraft are ADS-B equipped, including future high density aircraft environments. The UAT system design shall support Traffic Information Services – Broadcast (TIS-B) to accommodate ADS-B environments in which multiple ADS-B links are employed.
2.11 Validation of Received ADS-B Positions 2.11.1 The UAT system shall support a means, without reliance on ground stations, for validating received ADS-B positions, using own-ship position in combination with a time-based ranging capability. This capability is primarily directed toward air-to-air use of ADS-B in environments without air traffic service (ATS) ground stations.
ACP-WGW01/AI-1Appendix D

Appendix L Page L - 3
2.12 Service Availability 2.12.1 The UAT system design shall support a surveillance service availability of 99.999 percent. 2.13 UAT System Integrity 2.13.1 The probability of an undetected error in a UAT transmission shall be no greater than 10-8 per ADS-B or Ground Uplink message. 2.14 Support of all Classes of Users 2.14.1 The UAT system design shall support multiple configurations (e.g., power, antenna installation) to facilitate ADS-B participation by all classes of airspace users. 3. UAT SUPPORT OF THE ADS-B FUNCTION 3.1 ADS-B Requirements ADS-B Information Exchange 3.1.1 The UAT system shall support the transmission and reception of state vector (to include position, velocity, and identifying information), mode status, and intent information from appropriately equipped ADS-B system participants. State Vector (SV) 3.1.2 State vector information shall include at least the following: three-dimensional position, horizontal and vertical velocity, ADS-B participant address, air/ground state, and state vector integrity information. 3.1.3 An entire state vector should be included in each UAT transmission. Table 3.1.3 provides desired performance for receipt of state vector transmissions for air-to-air ADS-B applications. UAT shall support, including in future high density airspace, receipt by a single ground station of ADS-B airborne state vector transmissions at a 95% update interval of 5 seconds for aircraft within 60 NM and 12 seconds for aircraft within 150 NM.
ACP-WGW01/AI-1Appendix D

Appendix L Page L - 4
Table 3.1.3: State Vector Accuracy, Update Interval, and Acquisition Range Requirements
Operational Domain → Terminal, En Route, and Oceanic / Remote Non-Radar ↓ Approach ↓
Airport Surface ↓ (Note 4)
Applicable Range → R ≤ 10 NM 10 NM < R ≤ 20 NM 20 NM < R ≤ 40 NM 40 NM < R ≤ 90 NM R ≤ 10 NM (R ≤ 5 NM)
Equipage Class → (Note 5) Appropriate Appropriate Appropriate Appropriate As
Appropriate Appropriate
Airborne Conflict Management (ACM) Example
Applications → Enhanced
Visual Acquisition
Station Keeping
Merging, Conflict Management, In-
Trail Climb
Long Range Conflict
Management
AILS, Paired Approach
Surface Situational Awareness
Required 95th percentile SV
Acquisition Range 10 NM 20 NM
40 NM (Note 12)
(50 NM desired)
90 NM (Notes 3, 10)
(120 NM to 150 NM desired)
10 NM 5 NM
Required SV Nominal Update
Interval (95th percentile)
(Note 5)
≤ 3 s (3 NM) (1 s desired,
Note 2)
≤ 5 s (10 NM) (Note 11)
≤ 5 s (10 NM)
≤ 7 s (20 NM)
≤ 7 s (20 NM)
≤ 12 s (40 NM) ≤ 12 s
≤ 1.5 s (1000 ft runway
separation)
≤ 3 s (1s desired)
(2500 ft runway
separation)
≤ 1.5 s
Required 99th Percentile SV
Received Update Period
(Coast Interval)
≤ 6s (3 NM)
≤ 10 s (10 NM)
(Note 11)
≤ 10 s (10 NM)
≤ 14 s (20 NM)
≤ 14 s (20 NM)
≤ 24 s (40 NM) ≤ 24 s
≤ 3s (1000 ft runway
separation) (1s desired, Note
2)
≤ 7s (2500 ft runway
separation)
≤ 3 s
Example Permitted Total SV Errors
Required To Support Application
(1 sigma, 1D)
σhp = 200 m σhv = n/a σvp = 32 ft σvv = 1 fps
σhp = 20 m / 50 m (Note 1)
σhv = 0.6/ 0.75 m/s
(Note 1) σvp = 32 ft σvv = 1 fps
σhp = 20 / 50 m (Note 1)
σhv = 0.3/ 0.75 m/s (Note 1) σvp = 32 ft σvv = 1 fps
σhp = 200 m σhv = 5 m/s σvp = 32 ft σvv = 1 fps
σhp = 20 m σhv = 0.3 m/s σvp = 32 ft σvv = 1 fps
σhp = 2.5 m (Note 6) σhv = 0.3
m/sσ σvp = n/a σvv = n/a
Max. error due to ADS-B
(1 sigma, 1D) (Note 7)
σhp = 20 m σhv = 0.25 m/s (Note 8)
σvp = 30 ft σvv = 1 fps
σhp = 2.5 m (Note 6) σhv = 0.25
m/s σvp = n/a σvv = n/a
ACP-WGW01/AI-1Appendix D

Appendix L Page L - 5
Definitions for Table 3.1.3:
σhp: standard deviation of horizontal position error.
σhv: standard deviation of horizontal velocity error.
σvp: standard deviation of vertical position error.
σvv: standard deviation of vertical velocity error.
n/a: not applicable.
Notes for Table 3.1.3:
1. The lower number represents the desired accuracy for best operational performance and maximum advantage of ADS-B. The higher number, representative of GPS standard positioning service, represents an acceptable level of ADS-B performance, when combined with barometric altimeter.
2. A 3-second report received update period for the full state vector should yield improvements in both safety and alert rate relative to ACAS, which does not measure velocity. Further improvement in these measures can be achieved by providing a one-second report received update rate. Further definition of ADS-B based separation and conflict avoidance system(s) may result in refinements to the values in the Table.
3. The 90 NM range requirement applies in the forward direction (that is, the direction of the own aircraft’s heading). The required range aft is 40 NM. The required range 45 degrees to port and starboard of the own aircraft's heading is 64 NM. The required range 90 degrees to port and starboard of the own aircraft’s heading is 45 NM. [The 120 NM desired range applies in the forward direction. The desired range aft is 42 NM. The desired range 45 degrees to port and starboard of the own-aircraft’s heading is 85 NM.]
4. Requirements apply to both aircraft and vehicles.
5. Equipage classes may be defined, with differing performance levels, to satisfy needs of particular types of surveillance and situational awareness applications in particular types of air traffic environments (e.g., low density enroute, medium density continental, high density terminal).
6. The position error requirement for aircraft on the airport surface is stated with respect to the aircraft’s ADS-B position reference point. For further elaboration, see RTCA DO-289, Minimum Aviation System Performance Standards for Aircraft Surveillance Applications.
7. This row represents the allowable contribution to total state vector error from ADS-B.
8. The requirements on horizontal velocity error (σhv,) apply to aircraft speeds of up to 600 knots. Accuracies required for velocities above 600 knots are to be determined.
9. Specific system parameter requirements in Table 3.1.3 can be waived provided that the system designer shows that the application design goals or equivalent system level performance can be achieved.
ACP-WGW01/AI-1Appendix D

Appendix L Page L - 6
10. Air-to-air ranges extending to 90 NM are intended to support the application of Flight Path Deconfliction Planning, Cooperative Separation in Oceanic/Low Density En Route Airspace. The operational concept and constraints associated with using ADS-B for separation assurance and sequencing have not been fully validated. It is possible that longer ranges may be necessary. Also, the minimum range required may apply even in high interference environments, such as over-flight of high traffic density terminal areas.
11. Requirements for applications at ranges less than 10 NM are under development. The 3-second update period is required for aircraft pairs with horizontal separation less than [1.1 NM] and vertical separation less than [1000 feet]. The 3 second update period is also required to support ACM for aircraft pairs within 3 NM lateral separation and 6000 feet vertical separation that are converging at a rate of greater than 500 feet per minute vertically or greater than 6000 feet per minute horizontally. The update rate can be reduced to once per 5 seconds (95%) for aircraft pairs that are not within these geometrical constraints and for applications other than ACM. Requirements for ACM are under development. Requirements for future applications may differ from those stated here.
12. Separation standards of more than 2 NM may require longer acquisition ranges to provide adequate alerting times.
Mode Status Information Exchange
3.1.4 Mode Status information includes ADS-B emitter category information, call sign, state vector accuracy information, UAT equipment capability codes, operational mode information, and an integrity indication for barometric information.
3.1.5 Table 3.1.5 provides desired performance for the acquisition of mode status information transmissions to support air-to-air ADS-B applications. Consistent with these application needs, acquisition of mode status information by UAT ground stations should be achieved, at the 95th percentile, within 20 seconds for aircraft within 60 NM and 48 seconds for aircraft within 150 NM.
ACP-WGW01/AI-1Appendix D

Appendix L Page L - 7
Table 3.1.5: Mode Status Accuracy and Acquisition Range Requirements
Operational Domain → Terminal, En Route, and Oceanic / Remote Non-Radar ↓ Approach ↓
Airport Surface ↓ (Note 1)
Applicable Range → R ≤ 10 NM 10 NM < R ≤ 20 NM 20 NM < R ≤ 40 NM 40 NM < R ≤ 90 NM R ≤ 10 NM (R ≤ 5 NM)
Equipage Class → Appropriate Appropriate Appropriate Appropriate As Appro-priate Appropriate
Airborne Conflict Management (ACM) Example
Applications → Enhanced
Visual Acquisition
Station Keeping
Merging, Conflict Management, In-
Trail Climb
Long Range Conflict
Management
AILS, Paired
Approach
Surface Situational Awareness
Required 95th percentile MS
Acquisition Range 10 NM 20 NM
40 NM (Note 6)
(50 NM desired)
90 NM (Notes 2, 3)
(120 NM desired) 10 NM 5 NM
Required 99th percentile MS
Acquisition Range (Notes 4, 5)
8 NM 17 NM 34 NM (Note 6) n/a n/a n/a
Definitions for Table 3.1.5:
n/a: not applicable.
Notes for Table 3.1.5:
1. Requirements apply to both aircraft and vehicles.
2. The 90 NM range requirement applies in the forward direction (that is, the direction of the own aircraft’s heading). The required range aft is 40 NM. The required range 45 degrees to port and starboard of the own aircraft's heading is 64 NM (see RTCA/DO-242A, Appendix H). The required range 90 degrees to port and starboard of the own aircraft’s heading is 45 NM. [The 120 NM desired range applies in the forward direction. The desired range aft is 42 NM. The desired range 45 degrees to port and starboard of the own-aircraft’s heading is 85 NM.]
3. Air-to-air ranges extending to 90 NM are intended to support the application of Flight Path Deconfliction Planning, Cooperative Separation in Oceanic/Low Density En Route Airspace. The operational concept and constraints associated with using ADS-B for separation assurance and sequencing have not been fully validated. It is possible that longer ranges may be necessary. Also, the minimum range required may apply even in high interference environments, such as over-flight of high traffic density terminal areas.
4. These requirements are to be met for essential level applications. As these applications are developed, these requirements may be further refined in terms of more stringent ranges and acquisition probability.
5. It is assumed that the population for which these acquisition requirements are to be met are aircraft that have been operating and broadcasting MS reports within radio line of sight at ranges significantly greater than the acquisition range.
6. Separation standards of more than 2 NM may require longer acquisition ranges to provide adequate alerting times.
ACP-WGW01/AI-1Appendix D

Appendix L Page L - 8
Intent Information
3.1.6 Intent information, the third category of ADS-B information after state vector and mode status information, is of two types: 1) target state information (short-term intent based upon either target heading/track angle or target altitude) and 2) trajectory change point information to include at least trajectory change point longitude, latitude, altitude, and time-to-go. Target state information is provided to applications using ADS-B in Target State Reports (TSRs). Trajectory change point information is provided to applications using ADS-B in Trajectory Change Reports (TCRs).
3.1.7 UAT shall support the transmission and receipt of target state information consistent with Table 3.1.7. UAT shall support the transmission and receipt of trajectory change information for an appropriately equipped ADS-B system participant’s next trajectory change point (TCR+0) at a 95th percentile update rate of 12 seconds at ranges of up to 40 NM, with the update rate increasing with increasing range to a rate of 56 seconds at a range of 120 NM. It is further desirable that UAT support exchange of information for up to 4 trajectory change points with air-to-air and air-to-ground range of up to 150 NM in future high density airspace, with such information being received every 24 seconds upon change and every two minutes when such information is not changing, given that information acquisition requirements are met for the ADS-B applications being served.
Table 3.1.7: Summary of Target State Report Acquisition Range and Update Interval Requirements
Operational Domain → Terminal, En Route, and Oceanic / Remote Non-Radar ↓
Applicable Range → R ≤ 20 NM R = 40 NM R = 50 NM R = 90 NM R = 120 NM
Equipage Class →
As Appro-priate.
As Appro- Priate.
As Appro- Priate
As Appro-priate
As Appro-priate
TS Report Acquisition
Range
20 NM (A1 optional)
40 NM (A2, A3 required)
50 NM (A2, A3 desired)
not required
not required
TS Report state change update
period (note 3)
12 s
12 s desired
(See note 2 above.)
12 s desired
not required
not required
TS Report nominal update
period 12 s 18 s 23 s
desired not
required not
required
Notes for Table 3.1.7:
1. Table 3.1.7 is based on an air-air en route scenario between two aircraft closing at 1200 knots, which is considered a worst-case scenario for deriving range requirements for ADS-B conflict alerting.
2. Reserved.
ACP-WGW01/AI-1Appendix D

Appendix L Page L - 9
3. Trigger conditions for the desired broadcasting of Target State reports at the “state change” update rate are specified.
Additional ADS-B Requirements 3.1.8 Latency 3.1.8.1 For UAT ADS-B reports with normal accuracy/integrity, ADS-B latency of the reported information shall be less than 1.2 seconds with 95 percent confidence. For reports with “precision” accuracy/integrity, ADS-B latency shall be less than 0.4 seconds with 95% confidence. The standard deviation of the ADS-B report time error shall be less than 0.5 seconds (1 sigma). The mean report time error for position shall not exceed 0.5 seconds. The mean report time error for velocity shall not exceed 1.5 seconds. Differential delay errors should be considered and, if necessary, compensated for by the using application. All necessary information to perform compensation for differential delays must be included in the UAT ADS-B state vector report. 3.1.9 Continuity of Function 3.1.9.1 The probability that the UAT System, for a given UAT Message Generation Function and in-range UAT ADS-B Report Generation Processing Function, is unavailable during an operation, presuming that the UAT System was available at the start of that operation, shall be no more than 2 x 10⁻⁴ per hour of flight.
3.2 Supported ADS-B Operational Applications The requirements in Section 3.1 have been derived based upon supporting the potential air-to-air and air-to-ground applications of ADS-B summarized in Attachment A. 4 UAT SUPPORT OF GROUND UPLINK SERVICES RELATED TO
SURVEILLANCE AND SITUATIONAL AWARENESS 4.1 The UAT System shall support Ground Uplink Services to include TIS-B and Flight Information Service — Broadcast (FIS-B). The UAT system shall be capable of providing Ground Uplink Services without interference from UAT broadcasts from aircraft. The UAT ground-based infrastructure should be designed to support channelization of Ground Uplink Services to avoid interference between those services. It is also desirable that the ground-based infrastructure and Ground Uplink Subsystem design support secondary navigation and timing. 4.2 TIS-B 4.2.1 TIS-B shall be supported by the UAT system, either (1) through emulation of ADS-B messages from aircraft or (2) through use of a portion of the UAT bandwidth that has no interference from UAT broadcasts from aircraft. The TIS-B service volume provided by a single ground station should be flexible so that cost-effective ground infrastructure implementations can be made for various airspace traffic densities. If alternative (1) is used, the UAT system shall be
ACP-WGW01/AI-1Appendix D

Appendix L Page L - 10
capable of providing TIS-B data within the envelopes used for UAT ADS-B transmissions from aircraft. TIS-B data shall be clearly identified as such. 4.3 Flight Information Services-Broadcast (FIS-B) 4.3.1 The FIS-B function shall not degrade the required performance of other higher priority, more safety critical ADS-B and TIS-B applications supported by UAT. Moreover, FIS-B information supplied to UAT ground stations shall be uplinked without change of that information by the UAT system. The probability of an undetected error in a UAT FIS-B Ground Uplink message shall be no greater than 1.5 x 10⁻⁵.
ACP-WGW01/AI-1Appendix D

Appendix L Page L - 11
Attachment A
ADS-B Applications to be Supported by UAT
References: • RTCA DO-242A, Minimum Aviation Systems Standards for Automatic Dependent
Surveillance-Broadcast, June 25, 2002 • RTCA DO-289, Minimum Aviation System Performance Standards for Aircraft
Surveillance Applications, December 9, 2003 • OPLINK/SASP Draft Amendment Proposal for PANS-ATM, Doc 4444 for ADS-B,
November 2004 • CARE/ASAS Activity 5 Description of a First Package of GS/AS Applications, Version
2.2, September 30, 2002 Air-to-Air Applications Enhanced Visual Acquisition for See and Avoid Enhanced Successive Visual Approaches Enhanced Sequencing and Merging Operations Enhanced Crossing and Passing Operations Enhanced Traffic Situation Awareness on the Airport Surface Enhanced Traffic Situation Awareness During Flight Operations Enhanced CDTI-based Flight Rules In Trail Procedure in Oceanic Airspace Enhanced Closely Spaced Parallel Approaches Flight Path Deconfliction/Airborne Conflict Management
Air-to-Ground Applications ATC Surveillance for En-Route Airspace ATC Surveillance in Terminal Areas ATC Surveillance in Non-Radar Areas Airport Surface Surveillance Aircraft Derived Data for ATC Tools
ACP-WGW01/AI-1Appendix D

Appendix L Page L - 12
This Page Intentionally Left Blank
ACP-WGW01/AI-1Appendix D