Impact of Tumor Progression on Cancer Incidence Curves
32
1 October 2, 2012 Impact of Tumor Progression on Cancer Incidence Curves E. Georg Luebeck 1 , Kit Curtius 2 , Jihyoun Jeon 3 , William D. Hazelton 1 1 Program in Computational Biology, Fred Hutchinson Cancer Research Center, Seattle, WA 98109, USA 2 Department of Applied Mathematics, University of Washington, Seattle, WA 98195, USA 3 Program in Biostatistics and Biomathematics, Fred Hutchinson Cancer Research Center, Seattle, WA 98109, USA Running title: Impact of Tumor Progression on Cancer Incidence Curves Keywords: Multistage Clonal Expansion (MSCE) model, tumor progression, colorectal cancer inci- dence, pancreatic cancer, esophageal cancer 1. This research was supported by the National Cancer Institute (NCI) under Grant Nos. R01 CA107028 and UO1 CA217155 (E.G.L, J.J,and W.D.H.) and by the National Science Foundation (NSF) under Grant No. DGE-0718124 (KC). 2. Corresponding author: E. Georg Luebeck, Fred Hutchinson Cancer Research Center, 1100 Fairview Ave N, M1-B514, Seattle, WA 98185, Phone: 206-667-4282; Fax 206-667-1319, Email: [email protected]. 3. Conflicts of interest: None. 4. – ∼250 (limit: 250) abstract – ∼5,000 (limit: 5,000) words of text – 2 tables, 2 figures in manuscript (limit: 7 tables and/or figures) – Supplemental Information (SI) with 1 table, 3 figures – 48 (limit: 50) references on May 17, 2016. © 2012 American Association for Cancer Research. cancerres.aacrjournals.org Downloaded from Author manuscripts have been peer reviewed and accepted for publication but have not yet been edited. Author Manuscript Published OnlineFirst on October 10, 2012; DOI: 10.1158/0008-5472.CAN-12-2198
Transcript of Impact of Tumor Progression on Cancer Incidence Curves

1
October 2, 2012
Impact of Tumor Progression on CancerIncidence Curves
E. Georg Luebeck1, Kit Curtius 2, Jihyoun Jeon3, William D. Hazelton1
1 Program in Computational Biology, Fred Hutchinson Cancer Research Center, Seattle, WA 98109,USA2 Department of Applied Mathematics, University of Washington, Seattle, WA 98195, USA3 Program in Biostatistics and Biomathematics, Fred Hutchinson Cancer Research Center, Seattle, WA98109, USA
Running title: Impact of Tumor Progression on Cancer Incidence Curves
Keywords: Multistage Clonal Expansion (MSCE) model, tumor progression, colorectal cancer inci-
dence, pancreatic cancer, esophageal cancer
1. This research was supported by the National Cancer Institute (NCI) under Grant Nos.R01 CA107028 and UO1 CA217155 (E.G.L, J.J,and W.D.H.) and by the National ScienceFoundation (NSF) under Grant No. DGE-0718124 (KC).
2. Corresponding author: E. Georg Luebeck, Fred Hutchinson Cancer Research Center, 1100Fairview Ave N, M1-B514, Seattle, WA 98185, Phone: 206-667-4282; Fax 206-667-1319,Email: [email protected].
3. Conflicts of interest: None.
4. – ∼250 (limit: 250) abstract
– ∼5,000 (limit: 5,000) words of text
– 2 tables, 2 figures in manuscript (limit: 7 tables and/or figures)
– Supplemental Information (SI) with 1 table, 3 figures
– 48 (limit: 50) references
on May 17, 2016. © 2012 American Association for Cancer Research. cancerres.aacrjournals.org Downloaded from
Author manuscripts have been peer reviewed and accepted for publication but have not yet been edited. Author Manuscript Published OnlineFirst on October 10, 2012; DOI: 10.1158/0008-5472.CAN-12-2198

2
Abstract
Cancer arises through a multistage process, but it is not fully clear how this process influ-ences the age-specific incidence curve. Studies of colorectal and pancreatic cancer using themultistage-clonal-expansion (MSCE) model have identified two phases of the incidence curves.One phase is linear beginning about age of 60, suggesting that at least two rare rate-limitingmutations occur prior to clonal expansion of premalignant cells. A second phase is exponential,seen in earlier-onset cancers occurring before the age of 60 that are associated with premalignantclonal expansion. Here we extend the MSCE model to include clonal expansion of malignantcells, an advance that permits study of the effects of tumor growth and extinction on the inci-dence of colorectal, gastric, pancreatic and esophageal adenocarcinomas in the digestive tract.After adjusting the age-specific incidence for birth-cohort and calendar-year trends, we foundthat initiating mutations and premalignant cell kinetics can explain the primary features ofthe incidence curve. However, we also found that the incidence data of these cancers harboredinformation on the kinetics of malignant clonal expansion prior to clinical detection, includingtumor growth rates and extinction probabilities on three characteristic time scales for tumorprogression. Additionally, the data harbored information on the mean sojourn times for prema-lignant clones until occurrence of either the first malignant cell or the first persistent (surviving)malignant clone. Lastly, the data also harbored information on the mean sojourn time of per-sistent malignant clones to the time of diagnosis. In conclusion, cancer incidence curves canharbor significant information about hidden processes of tumor initiation, premalignant clonalexpansion and malignant transformation, and even some limited information on tumor growthbefore clinical detection.
Introduction
Uncontrolled cell proliferation is the sine qua non of carcinogenesis. However, long before symp-
toms signal cancer growth, several initiating mutations are generally required to overcome normal
homeostatic regulation in a tissue allowing the gradual expansion of premalignant clones. Albeit
slow and possibly stagnant, this growth enhances the probability that a premalignant cell under-
goes malignant transformation generating a clone that either becomes extinct or progresses until
clinical detection. Therefore, at least two distinct but overlapping clonal expansion processes are
likely to occur in a tissue prior to clinical detection of cancer. In the context of the multistage-
clonal-expansion (MSCE) carcinogenesis model described here, the first clonal expansion begins
after normal tissue stem cells acquire two rate-limiting mutations or epigenomic changes that
lead to abrogation of homeostatic tissue control, causing gradual outgrowth of occult prema-
lignant clones over an extended time period that may range from years to decades [1]. Clonal
on May 17, 2016. © 2012 American Association for Cancer Research. cancerres.aacrjournals.org Downloaded from
Author manuscripts have been peer reviewed and accepted for publication but have not yet been edited. Author Manuscript Published OnlineFirst on October 10, 2012; DOI: 10.1158/0008-5472.CAN-12-2198

3
expansion of the premalignant cell population enhances the probability that one or more of
these cells suffer additional mutations or epigenomic alterations that cause malignant transfor-
mation which enables tumors to accelerate their growth and invade neighboring tissue, a process
captured by the second (malignant) clonal expansion in the model.
Here we ask the basic question, how do the rate-limiting steps involved in tumor initiation,
malignant transformation, and ensuing clonal expansions influence the shape of the cancer inci-
dence curve? Conversely, what can we possibly learn from observed incidence curves about these
hidden processes? In previous studies [1–4], we identified two characteristic features, or phases,
in the incidence curves for colorectal and pancreatic cancers using data from the Surveillance
Epidemiology and End Results (SEER) registries [5]. After adjusting for secular trends related
to birth-cohort and calendar-year (period), we were able to identify an exponential phase in
the incidence curve beginning in early adult life and extending to approximately the age of 60
and a linearly-increasing trend for later-onset cancers extending beyond the age of 60. In this
study we ask the question whether the impact of malignant growth and fitness (defined as clone
survival) on observed incidence patterns is actually discernable? To address this question, we
use a MSCE model which explicitly incorporates distinct (but overlaping) clonal expansions for
premalignant and malignant cells giving rise to a distribution of malignant tumors in a tissue
and clinical observation of cancer via a stochastic detection event occuring in a preclinical tu-
mor. In contrast, earlier versions of the MSCE model assumed that the first malignant cell
in a tissue necessarily leads to clinical detection after a possibly random lag-time. Malignant
transformations, however, are likely to occur in altered cells whose initial survival fitness may
be compromised by genomic instability [6] and therefore may be prone to extinction in spite of
higher cell proliferation. This is supported by comparative measurements of cell division rates
and net cell proliferation (using DNA labeling and radio-graphic imaging of tumors, respec-
tively) in a variety of carcinomas, showing large differences in the two rates which can only be
explained by the frequent death of tumor cells [7].
For this model-driven investigation of cancer incidence we analyse SEER-9 [5] incidence
data (1975-2008) for four gastrointestinal malignancies: colorectal cancer (CRC), gastric cancer
on May 17, 2016. © 2012 American Association for Cancer Research. cancerres.aacrjournals.org Downloaded from
Author manuscripts have been peer reviewed and accepted for publication but have not yet been edited. Author Manuscript Published OnlineFirst on October 10, 2012; DOI: 10.1158/0008-5472.CAN-12-2198

4
(GaC), pancreatic cancer (PaC), and esophageal adenocarcinomas (EAC). We begin by adjusting
for period and birth-cohort effects, using rigorous likelihood based methods to estimate model
parameters for the extended MSCE model, including malignant clonal expansion rates for each
cancer type. We then estimate three characteristic times: (1) the mean sojourn times for
premalignant clones until occurrence of the first malignant cell regardless of its fate, (2) the
analogous mean sojourn time to appearance of the first surviving (persistent) malignant clone;
and (3) the mean sojourn time of persistent preclinical cancers from first malignant cell to time
of cancer diagnosis.
Combined with a mathematical exploration of the MSCE model hazard function (i.e., the
model-derived function which predicts the age-specific cancer incidence) our numerical findings
support the hypothesis that the initiation of a benign (non-invasive) tumor, its malignant trans-
formation, and persistence constitute major bottlenecks in the progression of a premalignant
tumor to cancer. This is consistent with results from evolutionary models which find neoplastic
progression to be driven mainly by mutations that confer only slight improvements in fitness [8],
while the transition from a non-invasive to an invasive tumor, which expands with a significantly
higher growth rate, constitutes a critical, rate-limiting event.
Materials and Methods
Model assumptions and properties
Tumor initiation: A hallmark of the MSCE model is that tumor initiation requires a number
of rate-limiting mutational events before a stem cell can undergo a clonal expansion that results
in a premalignant lesion (see Figure 1). For colon and pancreatic cancer we inferred previously
that it takes two rare hits to transform a normal tissue stem cell into an initiated tumor cell
that is no longer under homeostatic control and undergoes a (first) clonal expansion [1]. The
two significant initial hits may represent biallelic inactivation of tumor suppressor genes, such
as Tp53 or P16 that occur frequently in many cancers, or the Apc gene in colorectal cancer
(CRC) [9]. Inactivation of TP53 is seen during early development of many digestive tract
cancers, including gastric (GaC) [10], pancreatic (PaC) [11,12], and esophageal adenocarcinomas
on May 17, 2016. © 2012 American Association for Cancer Research. cancerres.aacrjournals.org Downloaded from
Author manuscripts have been peer reviewed and accepted for publication but have not yet been edited. Author Manuscript Published OnlineFirst on October 10, 2012; DOI: 10.1158/0008-5472.CAN-12-2198

5
(EAC) [14–16]. Inactivation of P16 often occurs early in the development of EAC [17] and other
cancers. However, the two hits may also represent activation of an oncogene such as Kras in
combination with gain-of-function mutation in a tumor suppressor gene [12, 13]. Additionally,
EAC is associated with earlier conversion of a section of normal esophageal squamous epithelium
to intestinal-type Barrett’s metaplasia, called Barrett’s esophagus (BE). We model the transition
to BE as an additional one-time tissue alteration which occurs prior to the two initiating events
leading to premalignant clonal expansions in the development of EAC [3].
A mathematical consequence of the two-hit hypothesis for (premalignant) tumor initiation is
that the hazard function of the model (which represents the age-specific incidence) has a linearly
increasing trend for older ages [1]. The presence of such a linear phase in the incidence curves for
colorectal and pancreatic cancer could indeed be demonstrated by likelihood-based comparisons
of models with two (or more hits) for initiation. Models with single-hit tumor initiations do not
give rise to a linear phase in the hazard function [1, 2].
Tumor promotion: Prior to the transition into the initiation-associated linear phase, the
MSCE hazard function increases exponentially with a rate which is approximately given by the
net cell proliferation rate of premalignant P cells [1]. The transition from the exponential phase
to the linear phase occurs around the age of 60 for colorectal and pancreatic cancer. Clonal
expansion of P cells is represented by a stochastic birth-death-mutation (bdm) process with cell
division rate αP , death-or-differentiation rate βP , and mutation rate µ2. The net cell proliferation
rate of P cells is given by αP −βP −µ2 and the asymptotic probability of extinction of P cells by
the ratio βP /αP [18], which is the probability that a premalignant cell, together with its progeny,
will ultimately become extinct. Premalignant P cells may suffer further mutations with rate µ2
which transform them into malignant (M) cancer stem cells. Although the premalignant cell
population is likely to undergo a complex evolutionary process involving multiple mutations in
critical regulatory pathways before acquiring a malignant phenotype [6], only two initial rate-
limiting mutations prior to clonal expansion appear necessary to adequately describe the main
shape of the incidence curve for the four digestive tract cancers studied here.
Tumor progression and cancer detection: Development of a preclinical tumor in the MSCE
on May 17, 2016. © 2012 American Association for Cancer Research. cancerres.aacrjournals.org Downloaded from
Author manuscripts have been peer reviewed and accepted for publication but have not yet been edited. Author Manuscript Published OnlineFirst on October 10, 2012; DOI: 10.1158/0008-5472.CAN-12-2198

6
model begins with a single (malignant) cell which undergoes clonal expansion and eventually, if
the clone survives extinction, progresses to clinically detectable cancer. In contrast to natural his-
tory models in which the preclinical state of a tumor is typically assumed to be screen-detectable,
the preclinical tumor development in the MSCE model starts off with a single malignant cell
which undergoes a clonal expansion and eventually, if the clone survives extinction, is detected
as cancer. Mathematically, the growth of the malignant tumor is described by a stochastic
birth-death (bd) process with cell division rate αM and cell death rate βM . Clinical detection
of the tumor is similarly treated as a stochastic event with rate ρ per cell. This implies that
a tumor of size n cells has probability nρ∆t to be detected in a time interval ∆t short enough
for the tumor to be constant in size. We refer to this generalization of the bd process as a
birth-death-observation (bdo) process. Note, all analyses reported here are with a fixed value of
ρ = 10−7. The rationale for this particular value of ρ is that a typical tumor contains about 109
cells upon (symptomatic) detection and that only about 1% of the tumor volume is occupied
by actively dividing tumor cells [19]. Results obtained with other values for ρ (in the range of
10−6 − 10−8) were similar and did not change our conclusions (see SI).
The essential stochastic components of the MSCE model are illustrated in Figure 1, includ-
ing separate clonal-expansions for premalignant and malignant cells. As we will show here (see
Results), the MSCE model contains an approximation (referred to as MSCE-1) which differs
from the original MSCE model in two important aspects: (1) the rate at which P cells suffer
a transformation event that gives rise to a detectable cancer is approximated by an ’effective’
transformation rate, µeff
2 , and (2) the approximation requires a lag-time to allow for the time
from first malignant cell that forms a persistent cancer clone to the time of diagnosis. Fur-
thermore, not all of the MSCE model parameters are identifiable from incidence data — some
parameters must be fixed initially in order to achieve parameter identifiability, as discussed in
the Results section and in the Supplemental Information (SI).
While multistage generalizations of the models shown in Figure 1 have also been explored
by others [20–24], the general impact of malignant tumor progression on the hazard function
(and the age-specific incidences of the cancers modeled here) has not been fully characterized
on May 17, 2016. © 2012 American Association for Cancer Research. cancerres.aacrjournals.org Downloaded from
Author manuscripts have been peer reviewed and accepted for publication but have not yet been edited. Author Manuscript Published OnlineFirst on October 10, 2012; DOI: 10.1158/0008-5472.CAN-12-2198

7
[1–4], especially in regard to the time scales of premalignant and malignant clonal expansion.
However, Fakir et al. [20,21] modeled stochastic effects of lung cancer progression by augmenting
a similar model with a more realistic progression model, including extinction and/or dormancy,
proliferation, and invasive growth.
MSCE model hazard function: For the full version depicted in Figure 1, which includes
two stochastic clonal expansions, it is straightforward to derive the probability, PMSCE (t), for a
cancer diagnosis/detection to occur by time t. A general approach is to solve the Kolmogorov
backward equations for the marginal probability generating functions properly conditioned on
no cancer occurring before time t, as shown in the SI. This yields the MSCE survival function
SMSCE (t) = 1 − PMSCE (t). The MSCE hazard function — the rate at which preclinical cancer
cells collectively trigger a first clinial observation event — is given by
hMSCE (t) = − d
dtlogSMSCE (t) = −SMSCE (t)/SMSCE (t), (1)
(where the dot represents a derivative with respect to t). hMSCE (t) can be computed by numer-
ically solving a set of ordinary differential equations as described in SI.
Data
We used data from the Surveillance Epidemiology and End Results (SEER) database by the
National Cancer Institute. Incidence data were for all races by single-years of age between 10
and 84 and calendar-year between 1975 and 2008 for males and females (all races) in the original
nine registries (SEER-9) [5]. Incident cancers were defined using the International Classification
of Diseases for Oncology, Third Edition (ICD-O-3) as follows: colorectal cancer (C18-C20);
esophageal (C150-C159, 8140/3 adenocarcinoma NOS); gastric cancer (C16); and pancreatic
cancer (C25). Population data were also downloaded for the nine SEER catchment areas by
gender and single years of age and calendar year. Methods for adjusting for secular trends
(period and cohort effects) are described in SI.
on May 17, 2016. © 2012 American Association for Cancer Research. cancerres.aacrjournals.org Downloaded from
Author manuscripts have been peer reviewed and accepted for publication but have not yet been edited. Author Manuscript Published OnlineFirst on October 10, 2012; DOI: 10.1158/0008-5472.CAN-12-2198

8
Results
We find that modeling of cancer incidence data provides new insights into the importance of
clonal extinction and clonal growth rates (or doubling times) of premalignant and malignant
clones in relation to three underlying time scales in carcinogenesis: the mean sojourn time for
premalignant clones until occurrence of the first malignant cell (T1), the mean sojourn time
for premalignant clones until the first surviving malignant clone (Teff
1 ), and the mean sojourn
time of persistent preclinical cancers from first malignant cell to time of diagnosis (T2). In
the following we demonstrate how these time scales contribute to, and are estimable from, the
age-specific incidence curves of four digestive tract cancers.
Mathematical properties of MSCE-1 Approximation: To gain insights into how tumor
progression is impacting cancer incidence we begin with a mathematical dissection of the hazard
function generated by the MSCE model depicted in Figure 1. This will demonstrate that the
MSCE model (with a distinct clonal expansion for malignant cells) can be closely approximated
by a reduced model (MSCE-1) which adjusts the rate of malignant transformation, µ2, for
non-extinction and further models the outgrowth of persistent malignant clones as a constant
time-lag, tlag, which in turn is approximated by the mean sojourn time of a surviving malignant
clone, from its inception to detection of cancer, T2. To better understand the relationship
between tlag and the mean sojourn time T2 in the MSCE model we show (proof given in SI)
that the hazard function of a model with two consecutive clonal expansions for premalignant
and malignant cells is mathematically equivalent to a model with a single clonal expansion of
premalignant cells with a time-dependent mutation rate, i.e., replacing µ2 ↔ µ2(1 − SM (u)),
where 1−SM (u) is the unnormalized probability of detection of malignant clones a time u after
the malignant clone is seeded. An exact expression for SM (u) is given in the SI for constant
parameters. However, this mathematical “simplification” of the model from a double to a single
clonal expansion process comes at the cost of a time-dependent (conditional) mutation rate.
The time-dependence of the conditional mutation rate µ2(1− SM (u)) has two main effects:
1) it reduces the effective rate of malignant transformation, and 2) it creates a time delay for
on May 17, 2016. © 2012 American Association for Cancer Research. cancerres.aacrjournals.org Downloaded from
Author manuscripts have been peer reviewed and accepted for publication but have not yet been edited. Author Manuscript Published OnlineFirst on October 10, 2012; DOI: 10.1158/0008-5472.CAN-12-2198

9
a malignant clone to grow, conditional on its non-extinction, into a detectable tumor. The
latter effect is mainly due to a sharp transition of the conditional mutation rate from zero to
its asymptotic value after a time which equals approximately T2, the mean sojourn time of the
malignant clone to detection of cancer (see SI). Because asymptotically SM (u) → βM /αM as
u→∞, we define µeff
2 ≡ µ2(1− βM /αM ) as the effective malignant transformation rate for the
reduced (MSCE-1) model. Therefore, the approximation amounts to
µ2 ← µeff
2
tlag ← T2. (2)
(MSCE−1) (MSCE)
Again, T2 is the mean sojourn time of a surviving malignant clone which avoids stochastic
extinction and which, in the absence of death, would eventually be detected as cancer. The
mean sojourn time of a premalignant clone to the first malignant cell (T1), the analogous mean
sojourn time to the ancestor of the first persistent malignant clone (Teff
1 ), and the mean sojourn
time of a persistent malignant tumor (T2) to detection are functions of the cell kinetic parameters
and are given by (see SI)
T1 =
∫ ∞0
(1− 1− SP (u)
1− βP /αP
)du ≈ − ln(αPµ2/(αP − βP )2)
αP − βP
Teff
1 =
∫ ∞0
(1−
1− Seff
P (u)
1− βP /αP
)du ≈ − ln(αPµ
eff
2 /(αP − βP )2)
αP − βP
,
T2 =
∫ ∞0
(1− 1− SM (u)
1− βM /αM
)du ≈ − ln(αMρ/(αM − βM )2)
αM − βM
,
respectively, where SP and Seff
P are survival functions defined analogously to SM (see SI).
Parameter identifiability and sensitivity: Not all of the MSCE model parameters are iden-
tifiable from incidence data — some parameters must be fixed initially in order to achieve param-
eter identifiability (see Heidenreich et al. [25]). Furthermore, for estimability, the exponential-
then-linear character of the multistage hazard function (see SI) suggest a parametrization that
involves the slope of the linear phase λ ≡ µ0Xµ1p∞ and the growth paratmeter of the expo-
nential phase gP ≡ αP − βP − µ2 [1]. Note, the rates µ0 and µ1 cannot be estimated separately
on May 17, 2016. © 2012 American Association for Cancer Research. cancerres.aacrjournals.org Downloaded from
Author manuscripts have been peer reviewed and accepted for publication but have not yet been edited. Author Manuscript Published OnlineFirst on October 10, 2012; DOI: 10.1158/0008-5472.CAN-12-2198

10
because the slope λ depends on their product. Analogous to premalignant growth, we introduce
the malignant growth parameter gM ≡ αM − βM − ρ. In order to identify µ2 and ρ we find it
necessary to fix the cell division rates αP and αM . Although the product αMρ is mathematically
identifiable, we were not able to obtain stable estimates and therefore also fixed the (per cell)
cancer detection paramater ρ (see Materials and Methods).
To explore the dependence of our parameter estimates on the fixed parameters αP , αM , and
the cancer detection rate ρ we have also conducted a systematic sensitivity analysis. The results
of this analysis (specifically, the ranges of the obtained maximum likelihood estimates for the
parameters λ, gP , gM , and µeff2 , assuming constant birth cohort and calendar year effects) for
each fixed parameter are given in Table S1. This analysis (although limited to CRC) shows that
the estimates of gM , and therefore the mean sojourn time T2, vary only slightly when αP and αM
are perturbed, but may vary up to 20% as the detection rate ρ changes an order of magnitude.
Therefore, the dependence of the preclinical cancer sojourn time on ρ is modest, but does not
change our conclusions.
Low fitness of malignant cells: We use the above results to gain insight into the importance
of clonal extinction. Figure 2 shows fits obtained with the MSCE model (solid line) to SEER
incidence data for a) colorectal cancer, and b) gastric cancers. These fits include adjustments of
the model-generated hazard function for secular trends (for details see SI). It is instructive to
mathematically ’dissect’ the MSCE hazard function to examine the underlying behavior of the
incidence curves for the different malignant ancestors. The combined effects of extinction and
time for (malignant) tumor growth on incidence can be seen by substituting the ’full’ rate µ2
into the MSCE-1 approximation and ignoring the lag-time, i.e., tlag = 0 (dotted line in Figure
2). The higher predicted incidence sans malignant cell extinction or tumor growth shows that
these processes greatly reduce and delay cancer incidence and change the shape of the incidence
curve. In comparison, re-introducing the effects of extinction by replacing µ2 with µeff
2 (without
a lag-time) restores the general shape of the incidence curve (dot-dash line) except for cancers
occurring too early. Finally, re-introducing the time-lag associated with malignant tumor growth
(T2) in the MSCE-1 approximation accounts for both processes (dashed line) and provides an
on May 17, 2016. © 2012 American Association for Cancer Research. cancerres.aacrjournals.org Downloaded from
Author manuscripts have been peer reviewed and accepted for publication but have not yet been edited. Author Manuscript Published OnlineFirst on October 10, 2012; DOI: 10.1158/0008-5472.CAN-12-2198

11
excellent approximation to the exact incidence curve generated by the full MSCE model (solid
line).
on May 17, 2016. © 2012 American Association for Cancer Research. cancerres.aacrjournals.org Downloaded from
Author manuscripts have been peer reviewed and accepted for publication but have not yet been edited. Author Manuscript Published OnlineFirst on October 10, 2012; DOI: 10.1158/0008-5472.CAN-12-2198

12
Time scales of tumor progression: The MSCE model explicitly models malignant transfor-
mations in premalignant tissues of an organ. These tissues may not be uncommon as they may
arise independently from a large number of normal ancestor cells. However, our results suggest
that most malignant cells and nascent malignancies undergo extinction. The time difference
between the appearance of the first malignant cell in a premalignant clone, regardless of its
fate, and the first ancestor cell that leads to a stable malignant clone that is bound to turn
into symptomatic cancer (unless a patient dies before this happens or an intervention occurs)
may be as long as 30-40 years for gastric cancer (see Table 1), as long as 20 years for CRC and
EAC, or as short as 3 years, or less, in the case for pancreatic cancer. It is not clear whether
these differences reflect transformation-specific differences in cell survival, exogenous factors, cell
senescence, or differences in the degree of genomic instability. Whatever the origin, with the
exception of pancreatic cancer, our findings suggest a generally low viability of cancer cells in
spite of their aggressive and invasive behaviour.
In contrast, the estimated mean sojourn times T2 of persistent malignant clones vary from
10-12 years for GaC and EAC, 5-7 years for CRC, down to less than 1 year for PaC (Table 1).
The latter is consistent with the observation that most pancreatic carcinoma are diagnosed at an
advanced metastatic stage. Note, however, that Teff
1 , the estimated mean time to the appearance
of the first persistent cancer clone (measured from the time the ancestral premalignant cell is
born) is somewhat longer for pancreas than colon (52.3 vs 50.6 years for males, 56.3 vs 48.7
in females). This suggests that premalignant precursor lesions in pancreas, such as pancreatic
intra-epithelial neoplasia (PanINs), may be present for many years before a stable malignant
transformation occurs.
For EAC, we also estimate a (constant) tissue conversion rate, νBE , from normal esophageal
tissue to the metaplastic tissue of Barrett’s esophagus (BE). The age-specific prevalence of
BE is therefore approximately νBE × age and appears to be subject to strong period effects
[3]. Although our MCMC-based estimates for νBE and the slope parameter λ representing
initiation of premalignant clones are highly anti-correlated (see Figure S1g-h), the predicted
BE prevalences (about 1.5% for males and 0.5% for females at age 60 in the year 2000) are
on May 17, 2016. © 2012 American Association for Cancer Research. cancerres.aacrjournals.org Downloaded from
Author manuscripts have been peer reviewed and accepted for publication but have not yet been edited. Author Manuscript Published OnlineFirst on October 10, 2012; DOI: 10.1158/0008-5472.CAN-12-2198

13
consistent with the range of epidemiological estimates obtained from studies in comparable
populations [26].
Tumor growth rates: We find highly stable estimates for the net cell proliferation rate gP
of premalignant cells, based on the posterior distributions of the identifiable MSCE model pa-
rameters given the observed cancer incidences in SEER (see Figure S1). The reason for this
stability appears to lie in the prominence of the exponential phase of the incidence curve and
the resulting linear behavior of the log-incidence (see Figure S3). Surprisingly, with the ex-
ception of gastric cancers in females, the estimated net cell proliferation rates for premalignant
lesions are similar and stay within a range of 0.14 to 0.18 per year, while estimates for the net
cell proliferation rate gM of the malignant lesions are much more variable and range from 1 per
year in gastric and esophageal cancers to rates as high as 30 per year for pancreatic cancer (see
Table 2). These values correspond to tumor volume doubling times of 250 days and 8 days, re-
spectively for this group of cancers. While the former is consistent with clinical observations for
early gastric carcinoma, which are generally slow growing [27], the latter appears too fast, but
not inconsistent with tumor marker doubling times. For example, using the pancreatic tumor
marker CA19-9, Nishida et al. [28] estimated doubling times from measurements in patients with
inoperable pancreatic cancer in the range of 6 to 313 days. For CRC, the estimated malignant
tumor volume doubling times are about 93 days for males and 119 days for females. They too
appear at the lower end of the clinical spectrum, but are consistent with the determination by
Bolin et al. [29] who followed 27 carcinomas radiographically in the colon and rectum, measuring
a median of 130 days with a range of 53 to 1570 days. In spite of considerable uncertainty and
variability of the clinical observations, the general agreement of the MSCE model predictions
with sparse measurements of tumor doubling times lends support to our claim that carefully
collected incidence data harbor quantitative information about the natural history of a tumor,
from initiation to promotion to malignant tumor progression.
on May 17, 2016. © 2012 American Association for Cancer Research. cancerres.aacrjournals.org Downloaded from
Author manuscripts have been peer reviewed and accepted for publication but have not yet been edited. Author Manuscript Published OnlineFirst on October 10, 2012; DOI: 10.1158/0008-5472.CAN-12-2198

14
Discussion
Early models of carcinogenesis recognized the importance of rate-limiting mutations but pro-
vided only crude fits to cancer incidence and mortality [30]. Subsequent incorporation of cell
proliferation made it possible to account for effects, such as the initiation/promotion effects seen
in chemical carcinogenesis [31,32] or the inverse dose-rate effect for high-LET radiation [33], that
were more difficult to explain with models that did not include clonal expansion. More recently,
multistage extensions of the original two-stage clonal expansion model by Moolgavkar, Venzon
and Knudson [34,35] have emerged as useful instruments to explore cancer incidence curves and
isolate important secular trends that segregate with birth cohort and/or calendar year (period)
from age effects driven by common underlying biological processes [3,4,36]. While secular trends
are of great interest to epidemiologists and cancer control researchers in understanding the im-
pact of screening, potential exposures to carcinogens (e.g. tobacco smoking), infections, diet,
and life-style factors on cancer incidence, in this study we focus on non-specific effects that have
their origin in common cell-level processes that drive the age-effect, in particular the impact of
malignant tumor progression on the age-specific incidence curve.
Incidence curves are consistent with two types of clonal expansions, slow and fast:
Our MSCE model fits to the incidences of four gastrointestinal cancers (CRC, GaC, PaC, and
EAC) yield parameter estimates suggesting that malignant tumor progression is preceded by a
prolonged period of premalignant tumor growth characterized by a low rate of net cell prolif-
eration (Tables 1 and 2). In contrast, malignant tumor growth is estimated to be many-fold
faster than premalignant growth. The model distinguishes features of the incidence curves that
relate to slow growth of premalignant lesions and fast growth of malignant lesions, and allows
estimation of the time period in which tumors sojourn as slowly growing masses before becom-
ing invasive. The effective sojourn time Teff
1 , i.e., the time to appearance of the first persistent
malignant clone that started with a single premalignant cell, appears to be much longer than
estimated from clinical data. For colon, clinical estimates range from 20-25 years [37]. However,
this usually refers to the time starting with a small adenoma which must have been already
on May 17, 2016. © 2012 American Association for Cancer Research. cancerres.aacrjournals.org Downloaded from
Author manuscripts have been peer reviewed and accepted for publication but have not yet been edited. Author Manuscript Published OnlineFirst on October 10, 2012; DOI: 10.1158/0008-5472.CAN-12-2198

15
present for some time. It is not known how long adenomas sojourn before they can be observed.
A clue can be found in the average time to cancer among familial adenomatous polyposis (FAP)
patients which can be viewed as a lower estimate for the mean sojourn time of an adenoma,
since adenomas are likely to form early in life in FAP patients even though the diagnosis of
polyposis may not occur until later. From the age distribution of cancer with polyposis in FAP
patients (see [37]), which peaks around the age of 40, we conclude that the mean sojourn of
an adenoma which has the potential to progress to cancer is likely longer than 40 years since
this time generally represents the time to first diagnosis of the cancer – a first passage time
in statistical parlance – and not an average time across all adenomas with neoplastic potential
including some that will not turn cancerous in a person’s lifetime. Our estimates of 50-55 years
for the mean duration of an adenoma developing into a detectable carcinoma are therefore not
inconsistent with what can be inferred from the incidence of CRC in FAP.
Identifiability of a malignant progression parameter: Our mathematical analysis shows
the approximate equivalency of the hazard functions generated by the MSCE model and a model
with a single clonal expansion (MSCE-1) which is adjusted for clonal extinction and delayed
by a lag-time representing the mean sojourn time T2 of the surviving malignancy (see Figure
1). Thus, in practice, only the time-scale associated with malignant tumor progression can be
estimated from cancer incidence data but not the full malignant cell kinetics given by the rates
of malignant cell division αM , cell death βM , and (per cell) detection ρ. However, assuming
plausible values for the cell division rates (αM ) and a (per cell) cancer detection rate ρ (see
sensitivity analysis), we do obtain estimates for the net cell proliferation rate gM in malignant
tumors that yield tumor volume doubling times which are consistent with clinical observations
from radiographic imaging of carcinoma (see Results).
For pancreatic cancer, the estimated sojourn times T2 for male and female preclinical malig-
nancies are very short, suggesting that the model only captures the short metastatic phase of
the development but cannot identify the sojourn of the primary tumor. It is conceivable that
non-invasive precursors, such as the PanINs, interact with stromal components such as myofi-
broblasts that facilitate invasion and metastatic colonization [38]. The resulting colonies may
on May 17, 2016. © 2012 American Association for Cancer Research. cancerres.aacrjournals.org Downloaded from
Author manuscripts have been peer reviewed and accepted for publication but have not yet been edited. Author Manuscript Published OnlineFirst on October 10, 2012; DOI: 10.1158/0008-5472.CAN-12-2198

16
initially grow slowly, perhaps similar to their parental premalignant precursors, but may acquire
an aggressive and expansive phenotype at a later time.
Carcinogenesis may well require more than 2 clonal expansions. However, as shown by
Meza et al. (2008) [1] for CRC and PaC, the main features of the age-specific incidence curve
can almost entirely be explained by the initiation and growth characteristics of premalignant
tumors. Here, we posed the follow-up question: what impact does a second clonal expansion
(say, representing malignant tumor growth) have on incidence curves. Our mathematical analysis
shows that the impact amounts to a time-translation of the incidence curve which appears to
be identifiable in the SEER incidences studied here. This is consistent with the common view
that premalignant tumors and malignant tumors result from rather distinct clonal expansions
which markedly different cell kinetics.
Comparison with DNA sequencing studies: For colorectal cancer Jones et al. [39] deter-
mined the time required from the founder cell of an advanced carcinoma to the appearance of
the metastatic founder cell through comparative lesion sequencing in a small number of sub-
jects. They concluded that it takes on average 2 years for the metastatic founder cell to arise
in a carcinoma and an additional 3 years for the metastatic lesion to expand, thus a total of 5
years to the detection of the (metastatic) cancer after the carcinoma forms. Our model-derived
estimates for T2, the mean sojourn time for preclinical CRC (5-7 years) are therefore in good
agreement with the estimates for CRC using a molecular clock based on mutational data and
evolutionary analysis [39].
More recently, Yachida et al. [40] undertook a similar study for pancreatic cancer sequencing
the genomes of seven metastatic lesions to evaluate the clonal relationships among primary and
metastatic cancers (see also [41]). They estimated 6.8 years for the length of time from the
appearance of sub-clones in the primary tumor with metastatic potential to the seeding of the
index metastasis and additional 2.7 years to detection. However, our T2 estimates for pancreatic
cancer are inconsistent with those derived by Yachida and colleagues (see the MCMC-based
posterior distributions for T2 in Fig. S1). Remarkably, we find shorter times which suggests
(see discussion above), that the sub-clones found by Yachida and colleagues in the primary may
on May 17, 2016. © 2012 American Association for Cancer Research. cancerres.aacrjournals.org Downloaded from
Author manuscripts have been peer reviewed and accepted for publication but have not yet been edited. Author Manuscript Published OnlineFirst on October 10, 2012; DOI: 10.1158/0008-5472.CAN-12-2198

17
already have been present in a slow growing precursor lesion. The question is therefore whether
metastatic dissemination in pancreas can occur before the primary tumor undergoes a drastic
transformation into a rapidly growing tumor.
Limitations: We previously conducted comparative analyses of incidence data with a variety
of models: simple Markov process models without clonal expansion (e.g., the Armitage and Doll
model [42, 43]), the two-stage clonal expansion (TSCE) model [44, 45], and with biologically-
motivated extensions of the TSCE model [1–4]. Although the latter usually provide superior
fits to cancer incidence data compared to the former [1, 2, 4], MSCE models are by no means
complete descriptions of the cancer process, but should be considered biologically-motivated
schemata that help to identify critical processes and time scales in carcinogenesis. The models
lack many clinical and biological features that may or may not be relevant to our understanding
of incidence curves. For example, secular trends may also be viewed as acting quite specifically
on biological parameters, while in this study we employ a statistical approach (the age-period-
cohort model [3, 4, 36]) to effectively adjust cancer incidence for secular trends. Moreover, our
analyses assume that all clonal expansions give rise to (mean) exponential growth even though
clinical evidence suggests that tumors may slow their growth in a Gompertzian manner due
to limited nutrient/oxygen supplies as the tumor develops vasculature [46]. We also did not
model effects of tumor dormancy or potential increases in tumor growth rates due to subtle
selection effects in the somatic evolution of the tumor. The inferred cell kinetics does represent
an average rate which may comprise passenger mutations that confer weak or no selection and
possibly driver mutations that are not rate-limiting (or not requisite) but are likely to speed
up the growth process, as well as spatial (niche) effects and clonal interference (as suggested by
Martens et al. [48]) that have the potential to slow the tumor growth process. While modeling
these processes may well improve our fits and alter certain parameter estimates, it is unlikely
that such fine-tuning will alter the parameters associated with the basic two (exponential-then-
linear) phases of the incidence curves in a significant way. It is remarkable that in its present
form the MSCE model identifies mean sojourn times for tumors that are broadly consistent with
clinical estimates in spite of the considerable uncertainties of our estimates and ambiguities in
on May 17, 2016. © 2012 American Association for Cancer Research. cancerres.aacrjournals.org Downloaded from
Author manuscripts have been peer reviewed and accepted for publication but have not yet been edited. Author Manuscript Published OnlineFirst on October 10, 2012; DOI: 10.1158/0008-5472.CAN-12-2198

18
clinical observations.
One way to improve the MSCE model and test model assumptions is to incorporate data
from screening and imaging of premalignant as well as malignant tumors. Screening for CRC
provides information on the number and sizes of adenomatous polyps and screen detected carci-
noma; while screening for EAC may include assessment of the presence or absence of dysplasia
and/or chromosomal abnormalities in endoscopic biopsies and surveillance for early cancer.
Mechanistic models such as the MSCE model may utilize these different outcomes to enhance
our understanding of tumor initiation, growth, persistence and preclinical sojourn.
In this study, we demonstrate that the preclinical phase of malignant tumor progression
subtly influences the shape of the age-specific incidence curve, leaving a ’footprint’ that may be
identified through likelihood based analyses of incidence data after adjusting for secular trends.
We identify and estimate three characteristic times scales of carcinogenesis: the mean sojourn
time from premalignant cell to first malignant cell, T1; the mean sojourn time from premalignant
cell to first malignant ancerstor that generates a persistent clone, Teff
1 ; and the mean sojourn
time it takes for persistent tumors to develop from a single malignant cell to clinical cancer,
T2. We conclude that malignant clone extinction and tumor sojourn times play important roles
in reducing and delaying cancer incidence and influencing the shape of incidence curves for
colorectal, gastric, pancreatic, and esophageal cancers.
Acknowledgements
We would like to thank Dr. Rafael Meza (University of Michigan) for helpful discussions.
Grant Support
This research was supported by the National Cancer Institute (NCI) under grants R01 CA107028
and UO1 CA217155 (EGL, JJ, and WDH) and by the National Science Foundation (NSF) under
grant no. DGE-0718124 (KC).
on May 17, 2016. © 2012 American Association for Cancer Research. cancerres.aacrjournals.org Downloaded from
Author manuscripts have been peer reviewed and accepted for publication but have not yet been edited. Author Manuscript Published OnlineFirst on October 10, 2012; DOI: 10.1158/0008-5472.CAN-12-2198

19
References
1. Meza R, Jeon J, Moolgavkar SH, Luebeck EG. Age-specific incidence of cancer:
Phases, transitions, and biological implications. Proc Natl Acad Sci U S A 2008 Oct
21;105(42):16284-9. Epub 2008 Oct 20.
2. Luebeck EG, Moolgavkar SH. Multistage carcinogenesis and the incidence of colorectal
cancer. Proc Natl Acad Sci U S A 2002 Nov 12;99(23):15095-100. Epub 2002 Nov 1.
3. Jeon J, Luebeck EG, Moolgavkar SH. Age effects and temporal trends in adenocarci-
noma of the esophagus and gastric cardia (United States). Cancer Causes Control 2006
Sep;17(7):971-81.
4. Meza R, Jeon J, Renehan AG, Luebeck EG. Colorectal cancer incidence trends in the
United States and United kingdom: evidence of right- to left-sided biological gradients
with implications for screening. Cancer Res. 2010 Jul 1;70(13):5419-29. Epub 2010 Jun 8.
5. Surveillance, Epidemiology, and End Results (SEER) Program SEER*Stat Database:
Incidence -SEER 9 Regs Limited-Use, Nov 2009 Sub (1973-2007) (Katrina/Rita Popula-
tion Adjustment) - Linked To County Attributes - Total U.S., 1969-2007 Counties. April
2010, based on the November 2009 submission ed: National Cancer Institute, DCCPS,
Surveillance Research Program, Cancer Statistics Branch. [last accessed on 2012 Mar 13]
Available from: http://seer.cancer.gov/.
6. Cahill DP, Kinzler KW, Vogelstein B, Lengauer C. Genetic instability and darwinian
selection in tumours. Trends Cell Biol. 1999 Dec;9(12):M57-60.
7. Moffett BF, Baban D, Bao L, Tarin D. Fate of clonal lineages during neoplasia and
metastasis studied with an incorporated genetic marker. Cancer Res. 1992 Apr 1; 52(7):
1737-43.
8. Beerenwinkel N, Antal T, Dingli D, Traulsen A, Kinzler KW, Velculescu VE, et al. Genetic
progression and the waiting time to cancer. PLoS Computational Biology 2007; 3(11):e225.
on May 17, 2016. © 2012 American Association for Cancer Research. cancerres.aacrjournals.org Downloaded from
Author manuscripts have been peer reviewed and accepted for publication but have not yet been edited. Author Manuscript Published OnlineFirst on October 10, 2012; DOI: 10.1158/0008-5472.CAN-12-2198

20
9. Powell SM, Zilz N, Beazer-Barclay Y, Bryan TM, Hamilton SR, Thibodeau SN, et al. APC
mutations occur early during colorectal tumorigenesis. Nature 1992 Sep 17;359(6392):235-
7.
10. Karaman A, Kabalar ME, Binici DN, Ozturk C, Pirim I. Genetic alterations in gastric
precancerous lesions. Genet Couns. 2010;21(4):439-50.
11. Norfadzilah MY, Pailoor J, Retneswari M, Chinna K, Noor LM. P53 expression in invasive
pancreatic adenocarcinoma and precursor lesions. Malays J Pathol. 2011 Dec;33(2):89-94.
12. Morton JP, Timpson P, Karim SA, Ridgway RA, Athineos D, Doyle B, et al. Mutant p53
drives metastasis and overcomes growth arrest/senescence in pancreatic cancer. Proc Natl
Acad Sci U S A 2010 Jan 5;107(1):246-51. Epub 2009 Dec 14.
13. Hingorani SR, Wang L, Multani AS, Combs C, Deramaudt TB, Hruban RH, et al.
Trp53R172H and KrasG12D cooperate to promote chromosomal instability and widely
metastatic pancreatic ductal adenocarcinoma in mice. Cancer Cell 2005; 7(5), pp.469-83.
14. Ramel S, Reid BJ, Sanchez CA, Blount PL, Levine DS, Seshat K, et al. Evaluation of p53
protein expression in Barrett’s esophagus by two-parameter flow cytometry. Gastroen-
terology 1992 Apr; 102(4) Pt 1: 1220-8.
15. Moore JH, Lesser EJ, Erdody DH, Natale RB, Orringer MB, Beer DG. Intestinal differen-
tiation and p53 gene alterations in Barrett’s esophagus and esophageal adenocarcinoma.
Int J Cancer. 1994 Feb 15;56(4):487-93.
16. Galipeau PC, Prevo LJ, Sanchez CA, Longton GM, Reid BJ. Clonal expansion and loss of
heterozygosity at chromosomes 9p and 17p in premalignant esophageal (Barrett’s) tissue.
J Natl Cancer Inst. 1999 Dec 15;91(24):2087-95.
17. Wong DJ, Paulson TG, Prevo LJ, Galipeau PC, Longton G, Blount PL, et al. p16(INK4a)
lesions are common, early abnormalities that undergo clonal expansion in Barrett’s meta-
plastic epithelium. Cancer Res. 2001 Nov 15;61(22):8284-9.
on May 17, 2016. © 2012 American Association for Cancer Research. cancerres.aacrjournals.org Downloaded from
Author manuscripts have been peer reviewed and accepted for publication but have not yet been edited. Author Manuscript Published OnlineFirst on October 10, 2012; DOI: 10.1158/0008-5472.CAN-12-2198

21
18. Harris TE. The Theory of Branching Processes. New York:Dover Publications, Inc.; 1989.
19. O’Brien CA, Pollett A, Gallinger S, Dick JE. A human colon cancer cell capable of initi-
ating tumour growth in immunodeficient mice. Nature 2007;445:106-10.
20. Fakir H, Tan WY, Hlatky L, Hahnfeldt P, Sachs RK. Stochastic Population Dynamic
Effects for Lung Cancer Progression. Radiat Res. 2009;172(3): 383-93.
21. Fakir H, Hofmann W, Sachs RK. Modeling progression in radiation-induced lung adeno-
carcinomas. Radiat Environ Biophys. 2010 May;49(2):169-76.
22. Dewanji A, Moolgavkar SH, Luebeck EG. Two-mutation model for carcinogenesis: joint
analysis of premalignant and malignant lesions. Math Biosci. 1991 Apr;104(1):97-109.
23. Little MP. Are two mutations sufficient to cause cancer? Some generalizations of the
two-mutation model of carcinogenesis of Moolgavkar, Venzon, and Knudson, and of the
multistage model of Armitage and Doll. Biometrics. 1995 Dec;51(4):1278-91.
24. Little MP, Heidenreich WF, Li G. Parameter identifiability and redundancy in a general
class of stochastic carcinogenesis models. PLoS One. 2009 Dec 31;4(12):e8520.
25. Heidenreich WF, Luebeck EG, Moolgavkar SH. Some Properties of the Hazard Function
of the Two-Mutation Clonal Expansion Model. Risk Anal. 1997;17(3):391-9
26. Ronkainen J, Aro P, Storskrubb T, Johansson S, Lind T, Bolling-Sternevald E, et al.
Prevalence of Barrett’s esophagus in the general population: an endoscopic study. Gas-
troenterology 2005; 129(6):1825-1831.
27. Teixeira CR, Haruma K, Teshima H, Yoshihara M, Sumii K, Kajiyama G. Endoscopic
therapy for gastric cancer in patients more than 80 years old. Am J Gastroenterol. 1991
Jun;86(6):725-8.
28. Nishida K, Kaneko T, Yoneda M, Nakagawa S, Ishikawa T, Yamane E, et al. Doubling
time of serum CA 19-9 in the clinical course of patients with pancreatic cancer and its
significant association with prognosis. J Surg Oncol. 1999 Jul;71(3):140-6.
on May 17, 2016. © 2012 American Association for Cancer Research. cancerres.aacrjournals.org Downloaded from
Author manuscripts have been peer reviewed and accepted for publication but have not yet been edited. Author Manuscript Published OnlineFirst on October 10, 2012; DOI: 10.1158/0008-5472.CAN-12-2198

22
29. Bolin S, Nilsson E, Sjodahl R. Carcinoma of the colon and rectum–growth rate. Ann Surg.
1983 Aug;198(2):151-8.
30. Renan MJ. How many mutations are required for tumorigenesis? Implications from human
cancer data. Mol Carcinog. 1993;7(3):139-46.
31. Luebeck EG, Buchmann A, Stinchcombe S, Moolgavkar SH, Schwarz M. Effects of 2,3,7,8-
tetrachlorodibenzo-p-dioxin on initiation and promotion of GST-P-positive foci in rat
liver: A quantitative analysis of experimental data using a stochastic model. Toxicol Appl
Pharmacol. 2000 Aug 15;167(1):63-73
32. Moolgavkar SH, Luebeck EG, de Gunst M, Port RE, Schwarz M. Quantitative analysis
of enzyme-altered foci in rat hepatocarcinogenesis experiments–I. Single agent regimen.
Carcinogenesis 1990; 11(8):1271-8.
33. Luebeck EG, Heidenreich WF, Hazelton WD, Paretzke HG, Moolgavkar SH. Biologi-
cally based analysis of the data for the Colorado uranium miners cohort: age, dose and
dose-rate effects. Radiat Res. 1999 Oct;152(4):339-51. Toxicol Appl Pharmacol. 2000 Aug
15;167(1):63-73.
34. Moolgavkar SH, Knudson AG. Mutation and cancer: a model for human carcinogenesis.
Journal of the National Cancer Institute. 1981;66:1037-52.
35. Moolgavkar SH, Venzon DJ. Two-event models for carcinogenesis: incidence curves for
childhood and adult tumors. Mathematical Biosciences. 1979;47:55-77.
36. Holford TR, Zhang Z, McKay LA. Estimating age, period and cohort effects using the
multistage model for cancer. Stat Med. 1994 Jan 15;13(1):23-41.
37. Muto T, Bussey HJ, Morson BC. The evolution of cancer of the colon and rectum. Cancer
1975 Dec;36(6):2251-70.
on May 17, 2016. © 2012 American Association for Cancer Research. cancerres.aacrjournals.org Downloaded from
Author manuscripts have been peer reviewed and accepted for publication but have not yet been edited. Author Manuscript Published OnlineFirst on October 10, 2012; DOI: 10.1158/0008-5472.CAN-12-2198

23
38. Brentnall TA, Lai LA, Coleman J, Bronner MP, Pan S, Chen R. Arousal of cancer-
associated stroma: overexpression of palladin activates fibroblasts to promote tumor in-
vasion. PLoS One 2012;7(1):e30219.
39. Jones S, Chen WD, Parmigiani G, Diehl F, Beerenwinkel N, Antal T, et al. Comparative
lesion sequencing provides insights into tumor evolution. Proc Natl Acad Sci U S A 2008
Mar 18;105(11):4283-8.
40. Yachida S, Zhong Y, Patrascu R, Davis MB, Morsberger LA, Griffin CA, et al. Establish-
ment and characterization of a new cell line, A99, from a primary small cell carcinoma of
the pancreas. Pancreas 2011 Aug;40(6):905-10.
41. Luebeck EG. Cancer: Genomic evolution of metastasis. Nature 2010 Oct
28;467(7319):1053-5.
42. Moolgavkar SH. Carcinogenesis models: an overview. Basic Life Sci. 1991;58:387-96; dis-
cussion 396-9.
43. Moolgavkar SH, Luebeck EG. Multistage carcinogenesis: population-based model for
colon cancer. J Natl Cancer Inst. 1992 Apr 15;84(8):610-8.
44. Heidenreich WF, Luebeck EG, Moolgavkar SH. Effects of exposure uncertainties in
the TSCE model and application to the Colorado miners data. Radiat Res. 2004
Jan;161(1):72-81.
45. Meza R, Hazelton WD, Colditz GA, Moolgavkar SH. Analysis of lung cancer incidence
in the Nurses’ Health and the Health Professionals’ Follow-Up Studies using a multistage
carcinogenesis model. Cancer Causes Control 2008 Apr;19(3):317-28. Epub 2007 Dec 6.
46. Xu XL. The biological foundation of the Gompertz model. Int J Biomed Comput. 1987
Jan;20(1-2):35-9.
on May 17, 2016. © 2012 American Association for Cancer Research. cancerres.aacrjournals.org Downloaded from
Author manuscripts have been peer reviewed and accepted for publication but have not yet been edited. Author Manuscript Published OnlineFirst on October 10, 2012; DOI: 10.1158/0008-5472.CAN-12-2198

24
47. Brosnan JA, Iacobuzio-Donahue CA. A new branch on the tree: next-generation sequenc-
ing in the study of cancer evolution. Semin Cell Dev Biol. 2012 Apr;23(2):237-42. Epub
2012 Jan 8.
48. Martens EA, Kostadinov R, Maley CC, Hallatschek. Spatial structure increases the wait-
ing time for cancer. New J Phys. 2011 Nov;13:1-22.
on May 17, 2016. © 2012 American Association for Cancer Research. cancerres.aacrjournals.org Downloaded from
Author manuscripts have been peer reviewed and accepted for publication but have not yet been edited. Author Manuscript Published OnlineFirst on October 10, 2012; DOI: 10.1158/0008-5472.CAN-12-2198

25
Tables
Table 1. MCMC-based estimates of various tumor promotion and progression time scales.See text for definitions. Estimates represent medians and 95% credibility regions of themarginal posterior distribution for each quantity listed. All units are in years.
Table 2. MCMC-based estimates of various tumor promotion and progression time scales.These identifiable parameters are defined as: λ = µ0 ·X · µ1 · p∞, gP = αP − βP − µ2,gM = αM − βM − ρ, µ
eff
2 = µ2 · p∞. Here, we define p∞ ≈ 1− βM /αM (see SI for more details).Estimates represent medians and 95% credibility regions of the marginal posterior distributionfor each quantity listed. All units are in years.
on May 17, 2016. © 2012 American Association for Cancer Research. cancerres.aacrjournals.org Downloaded from
Author manuscripts have been peer reviewed and accepted for publication but have not yet been edited. Author Manuscript Published OnlineFirst on October 10, 2012; DOI: 10.1158/0008-5472.CAN-12-2198

26
Figure Legends
Figure 1. (a) The multistage-clonal expansion (MSCE) model for cancer with two stochastic
birth-death-migration processes representing clonal expansions of premalignant and malignant
cells. The model assumes a ‘two-hit’ tumor initiation process with Poisson initiation rates µ0, µ1
which leads to the stochastic appearance of premalignant progenitor cells in the tissue. In the
lower sample MSCE realization of the cellular process, premalignant cells undergo a first clonal
expansion described by a birth-death-migration process with cell division rate αP , cell death-or-
differentiation rate βP , and malignant transformation rate µ2. Malignant cells, in turn, undergo
a second clonal expansion with cell division and death rates αM and βM , respectively, allowing
for stochastic growth and possibly extinction of the malignant tumor. Clinical detection occurs
through a size-based detection process with parameter ρ. The sample sojourn time t1 represents
the time from the initiation of a premalignant clone until first malignant transformation. The
sample sojourn time teff
1 represents the time from the initiation of a premalignant clone to the
first malignant cell in that clone which results in a persistent tumor which escapes extinction.
Lastly, the sample sojourn time t2 represents the time for a persistent tumor to develop from
a single malignant cell to detected, clinical cancer. The MSCE model is well approximated by
(b) MSCE-1 Approximation which includes an effective malignant transformation rate µeff
2 (see
text) and a constant lag-time for tumor progression.
Figure 2. Deconstruction of the MSCE hazard function: malignant clone extinction and tumor
growth influence the incidence curves for a) CRC, and b) GaC. (Plots for EAC and PaC are
similar, but not shown). The SEER data (adjusted for calendar-year and birth-cohort trends)
are shown as circles and the overall fit using the MSCE model by the thin solid line. The dotted
line on the left shows the underlying hazard for the first malignant cell, regardless of its fate.
In contrast, the dash-dotted line shows the hazard for the first ancestor of a persistent (i.e.
surviving) malignant clone and the dashed line represents the hazard for the first persistent
malignant clone shifted to the right by the mean sojourn time of the malignant clone to cancer
detection, T2 (see text).
on May 17, 2016. © 2012 American Association for Cancer Research. cancerres.aacrjournals.org Downloaded from
Author manuscripts have been peer reviewed and accepted for publication but have not yet been edited. Author Manuscript Published OnlineFirst on October 10, 2012; DOI: 10.1158/0008-5472.CAN-12-2198

Table 1
on May 17, 2016. © 2012 American Association for Cancer Research. cancerres.aacrjournals.org Downloaded from
Author manuscripts have been peer reviewed and accepted for publication but have not yet been edited. Author Manuscript Published OnlineFirst on October 10, 2012; DOI: 10.1158/0008-5472.CAN-12-2198

Table 2
on May 17, 2016. © 2012 American Association for Cancer Research. cancerres.aacrjournals.org Downloaded from
Author manuscripts have been peer reviewed and accepted for publication but have not yet been edited. Author Manuscript Published OnlineFirst on October 10, 2012; DOI: 10.1158/0008-5472.CAN-12-2198

Figure 1
on May 17, 2016. © 2012 American Association for Cancer Research. cancerres.aacrjournals.org Downloaded from
Author manuscripts have been peer reviewed and accepted for publication but have not yet been edited. Author Manuscript Published OnlineFirst on October 10, 2012; DOI: 10.1158/0008-5472.CAN-12-2198

Figure 2
on May 17, 2016. © 2012 American Association for Cancer Research. cancerres.aacrjournals.org Downloaded from
Author manuscripts have been peer reviewed and accepted for publication but have not yet been edited. Author Manuscript Published OnlineFirst on October 10, 2012; DOI: 10.1158/0008-5472.CAN-12-2198
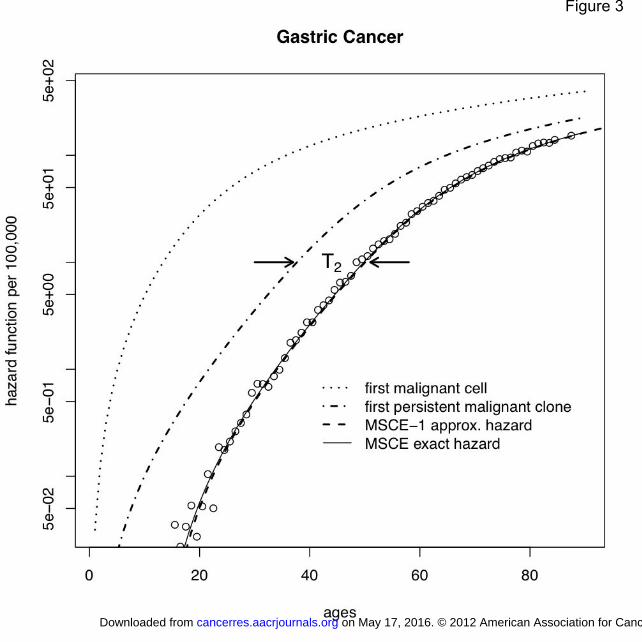
Figure 3
on May 17, 2016. © 2012 American Association for Cancer Research. cancerres.aacrjournals.org Downloaded from
Author manuscripts have been peer reviewed and accepted for publication but have not yet been edited. Author Manuscript Published OnlineFirst on October 10, 2012; DOI: 10.1158/0008-5472.CAN-12-2198

Published OnlineFirst October 10, 2012.Cancer Res E. Georg Luebeck, Kit Curtius, Jihyoun Jeon, et al. Impact of Tumor Progression on Cancer Incidence Curves
Updated version
10.1158/0008-5472.CAN-12-2198doi:
Access the most recent version of this article at:
Material
Supplementary
http://cancerres.aacrjournals.org/content/suppl/2012/10/10/0008-5472.CAN-12-2198.DC1.html
Access the most recent supplemental material at:
Manuscript
Authoredited. Author manuscripts have been peer reviewed and accepted for publication but have not yet been
E-mail alerts related to this article or journal.Sign up to receive free email-alerts
Subscriptions
Reprints and
To order reprints of this article or to subscribe to the journal, contact the AACR Publications
Permissions
To request permission to re-use all or part of this article, contact the AACR Publications
on May 17, 2016. © 2012 American Association for Cancer Research. cancerres.aacrjournals.org Downloaded from
Author manuscripts have been peer reviewed and accepted for publication but have not yet been edited. Author Manuscript Published OnlineFirst on October 10, 2012; DOI: 10.1158/0008-5472.CAN-12-2198