"IMPACT OF THE GEOLOGIC SETTING ON THE GROUNDWATER OCCURRENCE IN BERKASH AREA – WEST NILE DELTA...
25
" IMPACT OF THE GEOLOGIC SETTING ON THE GROUNDWATER OCCURRENCE IN BERKASH AREA – WEST NILE DELTA USING THE GEOELECTRICAL TECHNIQUE " Mostafa Said Mostafa Barseem Researcher in Desert Research center [email protected] " ر ي ث أ ت ع ض و ل ا ي ج و ل و ي ج ل ا ي عل د واج ت اه ي م ل ا ة ي ف و ج ل ا ي ف ة ق ط ن م اش رق ب– رب غ ا ي ل د ل ي ن ل ا دام خ ت س أ ت اب ي ن? ق ت ل ا ة يB ب ر كه و ي ج ل ا" : لاصة خ ل ا ة واج ت ق ط ا ي م لاح ص ن سلا ا ي ف ي ضرالا ا ة راوث ح ص ل ا د عدت ل اZ ن م ل ك ا ش م ل ا و اصة خ ل ا اه ي م ل أ ت ة ي ف و ج ل اZ ن م ث ي ح لة ق ة ي ح ا يb بلا ا و أده ت ر . و وجة ل م ل ا ة ق ط ن م الدراسة ي ه اجدى ه هد ق ط ا ي م ل ا و ي لت ا ع ق ت مال ش و ل ي ك ل ا ر مي35 ق ت ر ط ر مص ة درث ي ك سلا ا شاعد ي. راوى ح ص ل ا د خدت ت ع ض و ل ا ي ج و ل و ي ج ل اZ ن م ق ل وا ق ل ا و{ ر ي غ ت ل ا ي ت ب ا خ ل ا اب ن ج س ل ل ة يB ب و س ر ل ا ي عل ل م عا ت ل ا ع م لك ت لاب ك ش م ل ا و ي لت ا ر ب و ت ي عل ص ئ صا خ ل ا ة ي ح و ل درو ي ه ل ا ل ي م ة ث اد ق ت ل ا و لك . لد ة ي م شا م ل ا م ت راء ج اد عد16 سة ح ة يB ب ر كه و ي ح ة ي س را و لك د رصد ل اب ق ت لط ا لة خام ل ا اه ي م ل ل ة ي ف و ج ل ا و د خدت ت ث ي ك را لي ا ة ي ح و ل و ي ج ل ا ث ج ت ة ي ج ط س ل ا و مدى رها ي ث أ ت ي علZ ان ر جZ ن سي و ي م ل ا و د وجة ل م ل ا ل ق لا ا ما ك ا. يB شن ي م ت ة عاث ت سلا ا ومأب ل ع م ل أ ت ره ف و ي م ل اZ ن عد عد20 ر ي ث ة ق ط ن م ل أ ت. و د ق ل ح ص ئ اZ ن مال ل جZ ح ت ا يb لن اZ ن ا ة ق ط ن م الدراسةZ ون ك ي? بZ ن مد عد ث س اب ق ت ط ة ي ف عا ت م ة ق ل ن ج م ي ف مك س ل ا و وى? ي ج م ل ا رى ح ص ل ا; ى ل و لا ا ي ه ة ق ت لط ا ة ي ج ط س ل ا و ي لت اZ ون ك ي? بZ ن م ل م ر ل ا و لاب ج دا تZ ن مZ ن لطي ا و ي خص ل ا مك س ي راوح ي ثZ ن² ي ب3 و12 م و اومة ق م ة ي ع و ت ة يB ب ر كه راوح ي? ثZ ن² ي ب18 و366 اوم.م و ع ق ت وق ف ة ق ت لط ا ة ي ب ا ي ل ا اب د مك س ل ا ى الد راوح ي ثZ ن² ي ب113 – 145 م و ي ه ة ق ت ط ة اف جZ ون ك ي? بZ ن م ل م ر ل ا و ي خص ل ا و لاب ج دا تZ ن م مأ . اZ ن لطي ا ة ق ت لط ا ة ي ل ا ي ل ا ي ه ف لة خام ل ا اه ي م ل ل ة ي ف و ج ل ا و ر مي ت ب اب لاق ن ح أ ت ي ف مك س ل ا ة ج ي? نb ب ر ب ا ي ل ا وعة م ج م بZ ن م ق ل وا ق ل ا ي لت ا ل ص ئدها عد ى ل ا ة ي س ق ل وا ف ة يB شن م ص ف ج ت م و د مك ش{ ر يB ب ك ي ف
Transcript of "IMPACT OF THE GEOLOGIC SETTING ON THE GROUNDWATER OCCURRENCE IN BERKASH AREA – WEST NILE DELTA...

"IMPACT OF THE GEOLOGIC SETTING ON THE GROUNDWATEROCCURRENCE IN BERKASH AREA – WEST NILE DELTA USING
THE GEOELECTRICAL TECHNIQUE "Mostafa Said Mostafa BarseemResearcher in Desert Research center
ي�ر " ث�� أ� ع ت� ي� ال�وض�� ول�وج� ي� د ع�لي ال�ج� واج�� اه ت� ة ال�مي� ي� وف�� ي� ال�ج� ة ف� طق اش� م�ن� رب� – ب��رق� ا غ�� ل دل�ي ي� ال�ن� دام خ� أس�ت اب ت�� ي� ن� ق? ة ال�ت ي� BCب وك�هر ي� ال�ج� "
: لاصة ة ال�خ� واج� اط�ق ت� صلاح م�ي� ي� الاس�ن ي ف� ة الاراض� د ال�صحراوث�� اك�ل م�نZ ال�عدت�� اصة و ال�مش� اه ال�خ� أل�مي� ت��ة ي� وف�� ث� م�نZ ال�ج� لة ح�ي� ة ق� ي� اح�� ي bو الاب� أده ت�� . و ر� ة ال�ملوجة طق ه اج�دى هي ال�دراسة م�ن� اط�ق ه�د� ي و ال�مي� ع ال�ت ق مال ت� ش��لو ق35 مير ال�كي� �Cت ة م�صر ط�ر درث�� . ي��شاع�د الاس�كي� د ال�صحراوى� خدت�� ع ت� ي� ال�وض�� ول�وج� ي� وال�ق م�نZ ال�ج� ر} و ال�ق� ي� غ� ال�تي� ت� ب�� ا اب ال�خ� ة ل�لسجن� ي� Bب� عام�ل ع�لي ال�رس�و لك� م�ع ال�ت كلاب ت� ي� و ال�مش� ر ال�ت ب�� و� ص ع�لي ت� صائ�� ة ال�خ� ي� درول�وح�� ال�هي�
ل ة م�ي� ث�� اد� ق� ل�ك� و ال�ت� . ل�د� ة م ال�مشام�ي� راء ت� ج�� سة16 ع�دد ا� ة ح�� ي� BCب وك�هر ي� ة ح�� س�ي� ل�ك� و را� اب ل�رص�د د� ق ال�خام�لة ال�طت�اه ة ل�لمي� ي� وف�� د و ال�ج� خدت�� ث� ت� ة اليراك�ي� ي� ول�وح�� ي� جث ال�ج� ة ت� ي�ره�ا م�دى و ال�سطجي� ث�� أ� انZ ع�لي ت� ر� نZ ج�� وس�ي� و ال�مي� ال�ملوجة د�
ل ق� ا. ك�ما الا� ي� Bشن م ي�� ة ت� عاث�� أل�معلوم�أب الاس�ت �ره ت�� وف� ي�ر20 ع�دد ع�نZ ال�مي ة ث�� طق أل�من� .ت��د و ح ل�ق ص� لال م�نZ ائ� حZ ج�� ات�� ي bن�ال Zن ة ا� طق كونZ ال�دراسة م�ن� ي اب س�ث ع�دد م�نZ ب�? ق ة ط�ت� ي� عاف� ة م�ت لق� ن ي� م�ج� ف�
وى و ال�سمك� ولى; ال�صح�رى� ال�مجي? ة هي� الا� ق ة ال�طت� ي� و ال�سطجي� كونZ ال�ت ي لاب و ال�رم�ل م�نZ ب�? داج�� م�نZ ت�Zن يراوح ي��سمك� ال�خصي و ال�طي� ي²نZ ث�� اومة و م12 و3 ب�� ة م�ق وع�ي� ة ت�� ي� BCب يراوح ك�هر ي²نZ ث�? ع و اوم.م366 و18 ب�� ق ت�
وق ة ف� ق ة ال�طت� ي� ب�� ا اب ال�ي� ى� ال�سمك� د� يراوح ال�د� ي²نZ ث�� ة هي� و م145 – 113 ب�� ق ة ط�ت� اف� كونZ ج�� ي و ال�رم�ل م�نZ ب�?لاب و ال�خصي داج�� م�أ م�نZ ت� . ا� Zن ة ال�طي� ق ة ال�طت� ال�ي� هي� ال�ي� اه ال�خام�لة ف�� ة ل�لمي� ي� وف�� ر� و ال�ج� مي� ت اب ب� لاق�� ن أح�� ي� ت�� ال�سمك� ف�
ة ج� ي� ن? b�ر ب ب�� ا� موعة ال�ي مج� وال�ق م�نZ ب�� ي� ال�ق� صل ال�ت لى ع�دده�ا ئ�� ة ا� وال�ق س�ي ة ف� ي� Bشن�ص� م ف� ج� و م�ت� ر} ش�مك� د� ي� Bب�ي� ك ف�

صف� ن bن�م ة طق ة ال�دراسة م�ن� اف� ألاص�� لى ت�� ود ا� نZ م�نZ ع�دس�اب وج�� ي� ال�طي� لك� ف� ة ت� ق ر} ل�ها ال�طت� ي� ث�� أ� وده ع�لي ت� اه ج�� ال�مي�. و ة ي� وف�� د ال�ج� د ل�ق لال م�نZ وج�� ة ح�شاب� ج�� سي� ة ال�ن� وث�� د ال�مي� واج�� نZ ل�ي ي� ال�طي� لك� ف� ة ت� ق نZ ال�طت� ه ا� ة ه�د� سي� يراوح ال�ن� ث�?
Zي²ن ل�ك� % و71.6% - 5.1 ب�� عكس د� لاف� ت�� ن ر الاح�� ي� Bكب�ي� ال م ف� ي� ي� ال�ملوجة ف� يراوح ال�ت ي²نZ ث�? 1587 و326.4 ب��ء ر� ي� ج�� ة ف� ق . ال�طت� Zون غة ال�ملي� اب ال�رات�� اومة د� ة م�ق ض� ف� ج� يراوح م�ت� ي²نZ ث�? د اوم.مير18 – 6 ب�� ع ع�ي� شاب م�واق� ال�ج�
كونZ و ي نZ م�نZ ب�? يراوح ي��سمك� و ال�طي� ي²نZ ث�� م�أ24.4 و9 ب�� ة م. ا� ق ام�سة ال�طت� هي� ال�خ� كونZ ف�� ي ل�ت م�نZ ب�? ار� و ال�ي�يراوح لى32.1 م�نZ ش�مكها ث�� ة و م47 ا� ق ي�ره ال�طت� كونZ الاج� ي ي� ال�رم�ل م�نZ ب�? ت� ع ال�طن� ت� اه ال�مس� أل�مي� ة ت�� ي� وف�� ر و ال�ج� ي� عب ت�Zان ي� ال�ح�ر� وف� �ى� ال�ج� ان� ي� ال�ي� ة ف� طق ث� ال�دراسة م�ن� اومة ح�ي� ة ال�مق وع�ي� يراوح ل�ها ال�ي� ي²نZ ث�? اوم. مير. 69 و5 ب��
د و خدت�� اط�ق ل�ي? ل ال�مي� ص� ف�� ة الا� سي� أل�ن� أب ت�� لال لاول�وت�� ع� اه اس�ت ة ال�مي� ي� وف�� أر ح�ف�ر و ال�ج� ت�� Ûا ده دت�� د ج�� لق م ق�� ت�اء ش� ي�� طة ا� �Ýئ ر أب ج�� ول�وت�� ة ا� طق ح ل�من� ص� ئ� . ا� لال�ها م�نZ ال�دراسة نZ ج�� اء ا� ر� ج�� ة الا� مال�ي� ة و ال�س� ي� رف� ل هي� ال�ش� ص� ف�� و الا�
ل ق ة ت� ا ك�لما الاول�وث�� هي� ج� لى ات� ء ا� ى� ال�ح�ر� ون�� bي ى� ال�ج� �àن ل�ك� و ال�غ�ر لة د� انZ ش�مك� ل�ق ر� نZ ج�� وس�ي� ة} ال�مي� ق ولى )ال�طت� الا�اه ال�خام�لة ( و ل�لمي� ة ي� وف�� أده ال�ج� ت�� ة ر� سي� نZ ي�� الى� و ال�طي� أل�ي أده ت�� ت�� ة ر� سي� ل�ك� ي�� . ل�د� صح ال�ملوجة ن� انZ ع�لي الاع�تماد ب�� ر� ج��
Zن وس�ي� ج� ة} الاول�ي� ق ة )ال�طت� ي� ب�� ا اه ال�خام�لة ال�ي� ي� ل�لمي� ( ف� ة ي� وف�� اء ال�ج� ر� ج�� ة الا� ي� Bب� و bي ة ال�ج� ي� BCب اصة و ال�غ�ر د ج�� شاب ع�ي� ال�ج�ام رق� ل�ك� و36 و35, 26 ا� لة د� ة ش�مك� ل�ق ق ل�ت ط�ت� ار� وده و ال�ي� اه ج�� ا. ال�مي� ي� Bشن ي��
ABSTRACT: Several problems related to groundwater, such as less potentiality and inadequate quality were encountered during the reclamation of the studied area. Thepresent area of study is one of these areas. It lies close to Km. 35, north of the Cairo - Alexandria desert highway with an area of about 16 km2. The delineation of the subsurface setting helps much in such circumstances. For this purpose, 16 Vertical Electrical Soundings (VES) were carried out. In addition, available data of 20 wells drilled in the area were utilized.
The interpretation of the VES curves illustrated that the rock succession under the area consists of six layers; a surface layer formed of alluvial deposits with a thickness of up to 12 m. and electrical resistivity of 18 - 366 Ohm.m., followed downward with a thick dry zone with a thickness of 113 - 154m. and resistivity of 28 - 91 Ohm.m. This second layer is formed of sand , clayey sand and sandy clay. The third layer downward is similar in composition to the second layer but is saturated
2

with water of the Miocene aquifer. It varies in thickness from 25 to 133 m. and in resistivity from 24 to 50 Ohm.m. the calculated clay percentage in this area were found to vary from 5.1% to 71.6%, which partly explains the variation in water salinity of this layer from 326 to 1587 ppm. The third layer is underlain by a clayey layer ranging in thickness from 9 to 24 m. and in resistivity from 6 to 18 Ohm.m. The fifth member of the succession is formed of basalt with a thickness of 32 - 47 m. and resistivity range of 106 - 928 Ohm.m. The last layer downward is formed of sandy clay and clay belonging to the Oligocene aquifer with a resistivity range of 5 - 69 Ohm.m. The interpretation of the geoelectrical data together with the available well data indicted the presence of six normal faults forming a basin in the middle part of the study area.
Based on the depth to water, thickness, clay percentage (water quality) of the shallower aquifer, a priority map was constructed. The map indicated clearly that thepromising parts of the area, as to the drilling of water wells, are the eastern and northern parts. In the southern and western parts, the deeper aquifer (Oligocene) lying under the basalt sheet may be utilized for relatively better water quality. VES stations 26, 35 and 36 are considered to be the best sites for the drilling of water wells reaching to the Oligocene aquifer in these part of the area.
INTRODUCTION
2

Reclamation of the desertareas lying to the west of theNile Delta has received special attention from the government and different investment authorities for agricultural development. One of these areas is Berkash area, north west of Cairo. Many farm owners faced seriousproblems concerning groundwater potentiality and degradation of quality. Several factors play significant role in the occurrence and supply of groundwater such as sedimentary succession, the geologic structure and lateralfacies change. In the present study the geoelectrical resistivity soundings and the lithological information of wells were used to delineate the following:
a. The sedimentary succession and its
vertical and lateral facies changes.
b. The extension of water-bearing formation.
c. The impact of geologicalstructures on the groundwater occurrence and quality.
d. The distribution of the basaltic sheet and its contribution to the occurrence and flow of groundwater.
More emphasis in the application of the VES technique was made in that part of the area free of waterwells.
The study area (Fig. 1) is bounded by latitudes 30 57' 00" to 31 1' 48" N and longitudes 30 4' 48" to 30 9'00" E. It lies North of Km. 35(Cairo – Alexandria Desert Highway) with an area of about16 km2.
2

M E D IT E R R A N E A N S E A
S IN A I
C airo
A ssiut
Q en a
A sw an
L akeN asser
S iw a Qatta
ra
D epress
ion
E l-B ahariya
E l-F arafra
E l-D akhla
E l-K harg a
W E S T E R ND E S E R T
G ilf K ebir P lateau
25 00 30 00 35 00
2200
2600
3000
0 1 00 20 0 km
A lexan dri
a
S cale
E astE l O w ein at
o o o
o
o
o
S tudy area.
E l M inia
10
13
15
11
165
8
9
3
20
122 1
4
7
6
14
18
17
19
2224
25
27
34
23
35
28
31 26
32
36
33
30
29
21
T o C airoT o A lexanderia 195 3335 K m. K m.
L egendV E S stationV E S & drilled well D rilled wellC ross section
307 '12"
31 00' 00"30 57' 36"
304'48" 0 0.25 0.5 K m.
S cale
A '
A
B
B '
C
C '
M ilitary area
Fig. (1): Location map of the study area and sites of geophysical measurements
HISTORICAL STUDIES
2

The area of study has been subjected to many studies, aiming at delineatingthe Geomorphological, geological and hydrological setting. These works was made by Shata (1961), Shata and El Fayoumy (1967), Said, (1962), Omara, Sanad (1975), Sand (1973), Attia (1975), Abd El Baki (1983), CONOCO (1987), Abd El Rahman (1996), Ezz El deen (1999) and Ahmed (2002).
Geomorphologically, the study area lies southwest of the Nile Delta at Berkash (Fig2). The region within which the area is located characterized by a slightly undulating land surface, whichslopes generally towards the Nile Delta. It is divided intotwo main geomorphologic units;the alluvial plains and the structural plain. The alluvialplains are differentiated intothe young and the old alluvialplains. The young alluvial plain occupies the cultivated flat areas west of the Nile Delta and is composed of silt,clay and sand. The old alluvial plain lies to the south of the young alluvial plain and it characterized by slight undulation with severallow lying hills and is dominated by sand and gravel. The structural plain occupies
the wide area to the south of the old alluvial plain. It is an extensive pavement plain which consists of a number of alternating ridges. Geologically, the study area is lithologically covered by sedimentary rocks belonging tothe Holocene and Pleistocene (Fig. 3). According to, Abd ElBaki (1983), El Ghazawi, (1982) and El Ghazawi and Atwa(1994), It is composed of aeolian sand and gravel with occasional clay interbeds. These deposits are underlain by the Lower Miocene sediments(Moghra formation) which is composed of sand and gravel with clay intercalations. The Oligocene basalt underlies theLower Miocene deposits and overlies the Oligocene sediments represented by clay and sand interbeds. The detection of a basaltic sheet at different levels reflects the effect of structures on the geologic succession and onthe groundwater occurrence. The Eocene deposits underlie the Oligocene deposits. They are represented by chalky, clayey and sandy limestone grading into marls and clay aswell as sandy marls and clays (Said 1962, Shata 1962 and El Shazly, et.al 1975).

Y oung A lluvial P lains
O ld A lluvial P lains
W adi E l F arigh
S tructural P lains
A bu M ina D epression
M arbat D epression
K hashm E l E lsh
W adi E l N atrun
M aryut table land
E l Q uantara
E l H adid
A rea of study
K m.
30 30'30 00' 31 00'
31 0
0'30
45'
30 3
0'30
15'
S cale0 10 20
Fig.(2) Geomorphology map of the study area(After Abd El Baki, 1983 )
30 3
0'31
00'
31 00'31 30'30 00'
M editeranean S ea
B each D epositsS alt M arches and S abkhaA eolian D epositsA lluvial D epositsL agoonal D epositsG ravelsD eltacic D epositsP liocen D epositsM iocene D epositsO ligocene D epositsE ocene D eposits
Qua
terna
ryTe
rtiar
y
A rea of study
S cale0 10 20 K m.
C airo - A lex. D esert road
R osetta
Fig. (3): Geologic map of the study area (After CONOCO, 1987).
The southern part of the Nile Delta comprising the study area is structurally affected by normal two faults systems. The first is NE – SW (Aqba system) as those faults
bounding Wadi El Farigh from the north and the south. The other fault system belongs to the NW – SE (Clysmic).
Hydrogeologically, the investigated area is

characterized by an arid to semi arid climate with hot summer and mild rainy winter. The water-bearing formation inthe southwestern part of the Nile Delta belongs to the Pleistocene, Lower Miocene (Moghra formation) and Oligocene aquifers. The last two aquifers are separated by the Oligocene basalt sheet (Abd El Rahman 1996).
According to Ahmed , K. A. (2002) the Pleistocene aquifer is directly recharged from El Mansouria canal and its different branches as wellas surface seepage from the cultivated lands. The depth towater varies from 5 to 12m. The total dissolved solids
(TDS) range between 335 and 1056 ppm.. The depth to water in the lower Miocene aquifer varies from 56 to 142 m. The saturated thickness is controlled by the structural conditions prevailing the areaof study where, it ranges between 27 and 169 m.. The Oligocene reservoir is a confined aquifer due to the presence of the basaltic sheet. The depth to water reaches 130 m. from the groundsurface. The water of this aquifer is slightly fresh (1056 ppm.). The recharge of this aquifer may be due to thehydraulic connection with the overlying fractured Miocene aquifer.
FIELD MEASUREMENTS
A total of 16 Vertical Electrical Soundings were carried out in the area of study. Some of the VES stations were conducted near by drilled wells in order to obtain parametric measurements. Such measurements are considered a basis for the quantitative interpretation of the measured
field curves. Also the available data of 20 drilled wells were used. These data comprised litholigical description, thickness of the successive layers and depth towater. Figure (4) shows examples of the field soundingcurves. Figure (5) shows an example of the well log with litholigical description.

Fig.(4) Examples of the resistivity sounding curves
The Schlumberger techniques configuration was used in the VES measurements. At each VES station, the apparent resistivity (ρa) was measured for progressively increased current electrode spacing, represented by the value of AB.
In all the measured soundings the current electrodes half spacing (AB/2)was started with one meter and ended with 2000m.. This was the maximum spacing which could be reached in the area due to some military security
restrictions. However, it was enough to reach the formation beneath the tertiary basalt. The Terrameter SAS 1000 resistivity meter was used to measure the resistance (∆V/I) with high accuracy. The topographic map scale (1 :25,000) and the Global Positioning System (GPS) were used to determine the accuratelocations and ground elevations of the sites of both the geoelectrical sounding and drilled wells (Table 1).

Fig.(5) Well log and lithologic description of well No. (20)
Table (1) Ground elevations of the drilled wells and VES
stations:

RESULTS AND DISCUSSION
The field data of the Soundings have been interpreted qualitatively and quantitatively to delineate the subsurface sequence of thegeoelectrical layers in the area of study.
The Qualitative interpretation, according to the obtained VES curves, the resistivity valuesalong the first and second cycles (AB/2 = 1 to 100) represent surface and near surface variations. They reflect heterogeneity characterizing the surface layers. This heterogeneity is due to the clay beds intercalating the sand and gravel deposits. In going downwards on the field curves (third cycle at AB/2 > 100m.) show nearly the same type
which reflects homogeneity andcontinuous aerial extension ofthe deeper layers. At this part the field type KHQ dominates. This curve type indicates the last detected geoelectrical layer that has the least resistivity value, corresponding to the water-bearing formation. There are some variations in the field curves due to the variations in the depth of penetration ofthe water-bearing formation and the presence of clay intercalations . The curves ofthe H- type are mostly due to the effect of the basalt sheetwhich is characterized by relatively higher apparent resistivity.
The Quantitative interpretation, provides the true

resistivities, depths and thicknesses of the geoelectrical layers. These parameters become the main source of information which can be delineate the subsurface geologic succession, structures and water-bearing formation then presented in the form cross section and different types ofmaps. The VES curves were interpreted quantitatively by constructing a model for each curve, using the computer program RESIST, (Van Der Velpen 1988). It is a non automatic iteration method in which the measured field data are compared with data calculated from an assumed model. The models were prepared with the aid of the collected data of some wells
near the VES stations. Figure (6) shows the interpretation of VES No.34 beside well. In order to reach optimum correlation between the geoelectrical layers and the geologic units, some successive geoelectrical layers have been grouped together in one layer. The resistivity of such layer is expressed in terms of the average transverse resistivity(ρt) (Abd El Rahman 1996), calculated as follows: ρt =∑( ρ i*hi)/ ∑hi …..i = 1 to
nWhere;ρi is the resistivity of the ith layer, hi is its thickness, n is the number of layers
S urfac e layer
Dry layer
W ater-bearing layer
C lay layer
B as alt s heet
S andy c lay
L egend
Fig.(6) The interpretation of VES No. 34.
The result of the quantitative interpretation ofthe 16 VES curves are listed
in table (2). From these results, three geoelectrical cross sections (Fig.1) were

constructed (A-A`, B-B` and C-C') covering the study area (Figs. 7, 8 and 9). These cross sections together with well data show that the subsurface of the area is vertically distinguished into six main geoelectrical layers,
illustrating the geoelectricalsequences, lateral and vertical variation of the different layers and the subsurface structures. The main common features and observations are the following:
Table 2: Results of interpretation of the VES curves.
Fig.(7)Geoelectrical cross sections AA’.
1. The first layer is the surface zone which extends from the surface downwards to a depth varying from 2.5 m. at VES No 34 to 20 m. at VES No. 22 and has a
resistivity ranging from 18 Ohm.m. at VES No. 30 to 366 Ohm.m at VES No. 24. The wide range of resistivity may be due to change in

lithology from sand to sandyclay to clay.
2. The second layer consistsof several layers grouped together in one layer. It has a thickness ranging from113 m. at VES No. 22 to 154
m. at VES No. 35. This layerexhibits resistivity varyingbetween 28 Ohm.m. at VES No.21 and 91 Ohm.m. at VES No. 24, which corresponds to drysand with clay intercalationand gravel.
Fig.(8)Hydrogeoelectrical cross sections BB’.
Fig.(9)Hydrogeoelectrical cross sections CC’.
3. The third layer is nearlysimilar to the second layer in lithological composition,where it consists of sand and gravel. It represents the water-bearing zone. The resistivity of this layer ranges from 24 Ohm.m at VES No.31 to 50 Ohm.m. at VES No. 22 and thickness from 25m. at VES No 24 to 133 m. atwell No. 14. The large variation in thickness may be due to the affect of faulting.
4. The fourth layer consistsof clay underlying the water-bearing layer. It has a thickness ranging from 9 m. at VES No. 30 to 24.4 m. at VES No. 23 and exhibits low resistivity ranging from6 Ohm.m. at VES No. 31 to 18Ohm.m. at VES No. 29 Ohm.m..
5. The fifth layer has nearly a uniform thickness ranging from 32 m. at VES No. 31 to 47 m. at VES No. 27. This zone has resistivity varying between 106 Ohm.m. at VES No. 31 and
928 Ohm.m. at VES No. 24. Itcorresponds to the Oligocenebasaltic sheet which extendsunder the study area with gently undulated upper surface. The relatively low resistivity of the basalt atsome VES stations is attributed to the weathered and /or fissured nature of this sheet, in addition to the possibility of water saturation.
6. The last detected geoelectrical layer has a resistivity ranging from 5 Ohm.m. at VES No. 33 to 69 Ohm.m. at VES No. 23. It consists of Oligocene sandy clay and clayey sand. It represents the second water-bearing layer. The base of this layer was not reached as it represents the least member of the geoelectrical succession.
7. The lithologic successionis affected by normal faults. These faults affect the thickness of the water-bearing formation above the basaltic sheet
HYDROGEOLOGICAL SETTING
The water-bearing formations in the study area were classified according to the geological and hydrogeological information from the drilled wells and the
geophysical results into two main aquifers. The first aquifer is the Lower Miocene aquifer know as the Moghra formation. It is composed of sand, sandstone and interbeds.

These sediments are overlain by the Quaternary deposits e.g. Aeolian sand and or Nilotic sediments and are underlain by the Oligocene basaltic sheet (Abu Zaabal formation). This aquifer is considered to exist under semiconfined conditions. The second one is the Oligocene aquifer which underlies the basalt sheet and consists of sand, clayey sand and clay. Itis found to exist under confined to semiconfined conditions. The geoelectrical cross sections revealed that the two aquifers are hydraulically connected as a result of faulting.
The data of the depth to water measured in the wells and that obtained from the VESinterpretation have been used to construct a contour map forthe depth to water (Fig. 10).
This map shows that the maximum depth to water is 157.3 m. at VES No. 35 in the northwestern direction and theminimum value is 24 m. at VESNo. 1 in the northeastern direction. Generally, the depth to water slopes from east to west. The direction ofthe groundwater flow can be detected from the water level contour map (Fig. 11). From this map, it is clear that thegroundwater flow is generally from east to west and northwest direction but there is another direction towards the. The variation in flow patterns is mainly attributed to the lithological variationsand the structural elements prevailing the study area. Thus, it become necessary to illustrate these variations indetails as follows.
Lithologic variation: The presence of clay
lenses and clayey sand, act asimpervious layers, affecting hydraulic parameters such as transmissivity, hydraulic conductivity and yield. The estimation of sand and clay percentage within the water-bearing layer at both the drilled wells and VES stationsbecomes more useful according
to Abd El Rahman, (1996). The sand percentage of the water-bearing layer has been estimated by making use of true resistivity (ρt) of the water-bearing calculated at VES stations adjacent to boreholes. The maximum true resistivity (ρtm) with the value of 47.4 Ohm.m. at VES No. 5 adjacent to well was found correspond

10
13
15
11
165
8
9
3
20
122 1
4
7
6
14
18
17
19
2224
25
27
34
23
35
28
31 26
32
36
33
30
29
21
T o C airoT o A lexanderia 195 3335 K m. K m.
L egendV E S stationV E S & D rilled well D rilled well
307'12"
31 00' 00"30 57' 36"
304'48" 0 0.25 0.5 K m.
S cale
W est C airo A irport
20
30
40
50
60
70
80
90
100
110
120
130
140
150
160
D T W (m.)
Fig.(10): Depth to water contour map
10
13
15
11
165
8
9
3
20
122 1
4
7
6
14
18
17
19
2224
25
27
34
23
35
28
31 26
32
36
33
30
29
21
T o C airoT o A lexanderia 195 3335 K m. K m.
L egendV E S stationV E S & D rilled well D rilled well
307'12"
31 00' 00"30 57' 36"
304'48" 0 0.25 0.5 K m.
S cale
W est C airo A irport
3579111315171921232527293133353739
W L(m.)
Fig.(11): Water level contour map
to a lithologic succession consisting of 82% sand and 8% clay (calculated in terms of sand and clay layers thickness). In order to estimate the sand percentage at other VES stations, the product ρt / Ptm of water bearing at each VES station
was multiplied by 82 instead of 100, i.e.
Sand percent = ρt / ρtm * 82The clay percentage in the
water-bearing layer can be calculated by subtracting from100. The maximum clay percentage was found to be 71.6 % at VES No. 23 whereas, the minimum clay percentage
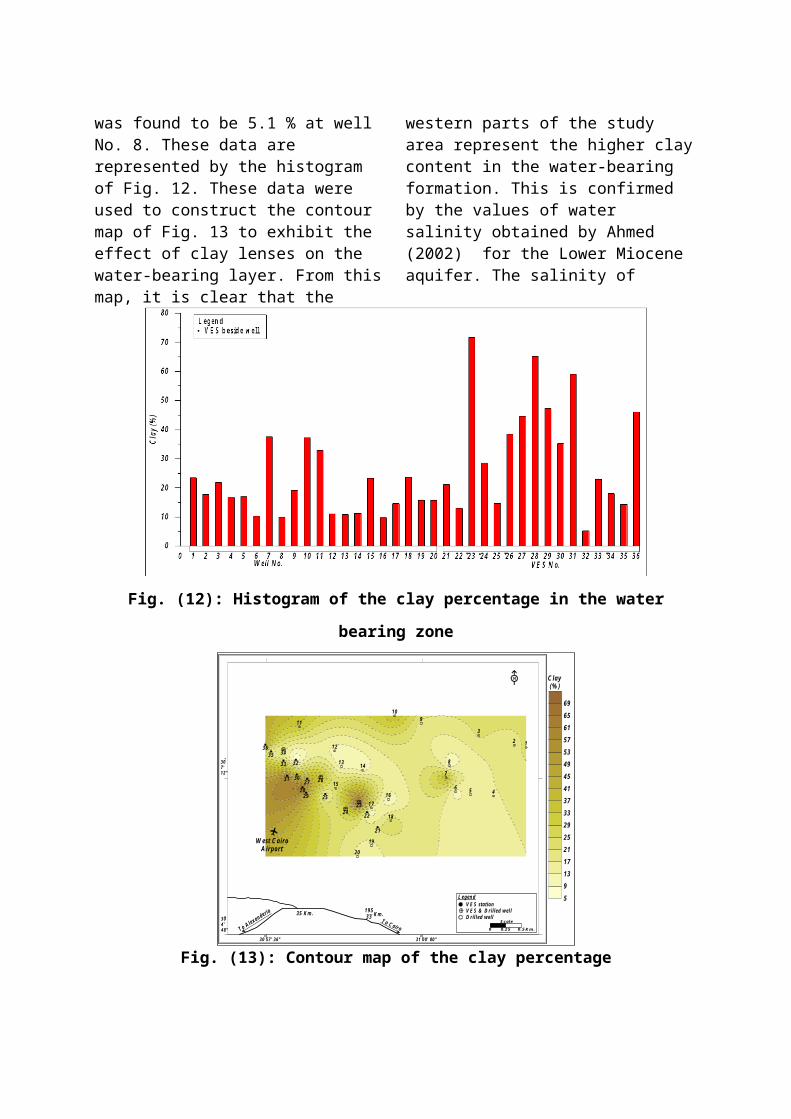
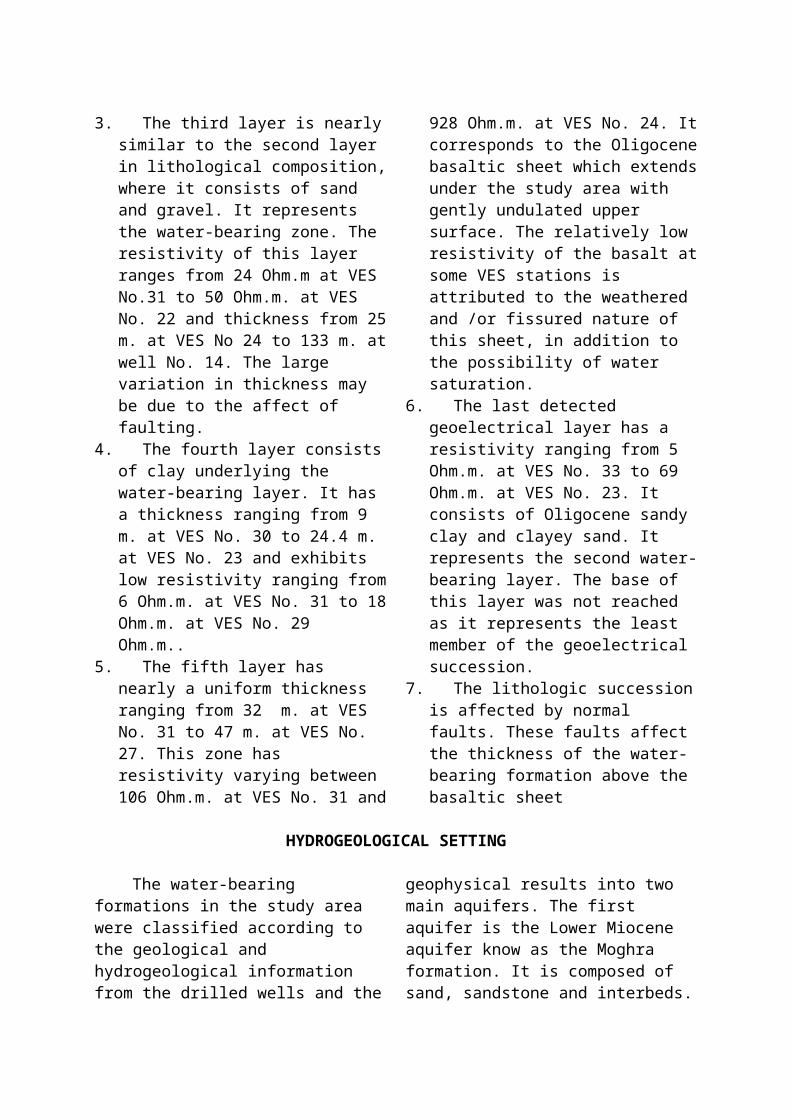
was found to be 5.1 % at well No. 8. These data are represented by the histogram of Fig. 12. These data were used to construct the contour map of Fig. 13 to exhibit the effect of clay lenses on the water-bearing layer. From thismap, it is clear that the
western parts of the study area represent the higher claycontent in the water-bearing formation. This is confirmed by the values of water salinity obtained by Ahmed (2002) for the Lower Miocene aquifer. The salinity of
Fig. (12): Histogram of the clay percentage in the water
bearing zone
10
13
15
11
165
8
9
3
20
122 1
4
7
6
14
18
17
19
2224
25
27
34
23
35
28
31 26
32
36
33
30
29
21
T o C airoT o A lexanderia 195 3335 K m. K m.
L egendV E S stationV E S & D rilled well D rilled well
307'12"
31 00' 00"30 57' 36"
304'48" 0 0.25 0.5 K m.
S cale
W est C airo A irport
C lay (% )
59131721252933374145495357616569
Fig. (13): Contour map of the clay percentage

the Miocene aquifer increases from east to west from 326.4 ppm at well No. 1 to 1587 ppm. at drilled well No. 19. The low salinity of groundwater of the Lower Miocene aquifer reflects direct recharge from the greatbasin underlying Rosetta branch of the Nile through fault. Inferred structure:
The other parameter that affects the hydrological condition in the study area isthe geologic structures induced by faulting. The delineation of faults affecting the basalt sheet certainly helps in recognizingthe
hydrogeologic variations of the water-bearing layers. The basaltic sheet has maximum resistivity values of 771 Ohm.m at VES No. 34 and minimum resistivity value of (106 Ohm.m. at VES No. 31 (Table No. 2). The variation in the resistivity value is mainly attribute to the weathered and fractured natureof the basalt sheet in addition to the possibility that it is partially saturatedwith water. The variation in depth to basalt from ground elevation has been exhibited as a contour map (Fig. 14).
This map shows that the depth to the surface of basalt sheet increases from both the northeast and southwest directions to the central parts of the study area. The maximum depth to basalt sheet is 268 m. at drilled well No. 18 while the minimum value is 124 m. at well No. 2. The abrupt change in the depth to surface of thebasalt sheet is due to faulting. The level contour map of the basalt sheet (Fig. 15) helped in deducing some ofthese faults. It is clear fromthis map that the central partof the study area lies at a higher level than the surrounding parts. From the basalt level contour map and the constructed geoelectrical cross sections some faults canbe detected as shown in (Fig. 16). From this map, it is clear that six normal faults affect the study area, striking NW – SE (F4, F5, F3 and F6), NE –SW ( F2 and F1) directions. The throw of the faults F4, F5, and F6 is towards the east while that ofthe faults F2 and F3 is towards the west. The last minor fault F1 throws towards the south direction. These faults affect the thickness ofthe water-bearing layer above the basaltic sheet. The isopach contour map of the

water-bearing formation (Fig. 17) shows the variation in thickness. From this map it isclear that the maximum thickness ( 133 m.) is at well
No. 14 and the minimum thickness (24 m.) is at VES station No. 24. This map showsa uniform thickness decreasingin the western direction.
10
13
15
11
165
8
9
3
20
122 1
4
7
6
14
18
17
19
2224
25
27
34
23
35
28
31 26
32
36
33
30
29
21
T o C airoT o A lexanderia 195 3335 K m. K m.
L egendV E S stationV E S & D rilled well D rilled well
307'12"
31 00' 00"30 57' 36"
304'48" 0 0.25 0.5 K m.
S cale
W est C airo A irport
120
130
140
150
160
170
180
190
200
210
220
230
240
250
260
270
D epth to B asalt (m.)
Fig. (14): The clay percentage contour map
According to the above discussion, sites where the water-bearing layer has a lower clay percent (less salinity), higher thickness and less depth to water would be recommended for the drilling of new water wells, for which the weighing factorsof these parameters are 50%, 30% and 20% respectively . Forthe construction of the priority map of the water-bearing zone , the clay
percent, thickness and depth to water have been categorizedinto four categories respectively (Table 3). From the priority map of the water-bearing layer (Fig. 18), it could be concluded that the most promising area for drilling wells tapping this layer is located at the eastern parts. The less priority exists in the southwestern part.

10
13
15
11
165
8
9
3
20
122 1
4
7
6
14
18
17
19
2224
25
27
34
23
35
28
31 26
32
36
33
30
29
21
T o C airoT o A lexanderia 195 3335 K m. K m.
L egendV E S stationV E S & D rilled well D rilled well
307'12"
31 00' 0 0"30 57' 36 "
304'48" 0 0.25 0.5 K m.
S cale
W est C airo A irport
-125
-115
-105
-95
-85
-75
-65
-55
-45
-35
-25
-15
B asalt level (m.)
Fig. (15): Level contour map of the basalt sheet.
10
13
15
11
165
8
9
3
20
122 1
4
7
6
14
18
17
19
2224
25
27
34
23
35
28
31 26
32
36
33
30
29
21
T o C airoT o A lexanderia 195 3335 K m. K m.
L egendV E S stationV E S & D rilled well D rilled wellF ault
307'12"
31 00' 00"30 57' 36"
304'48" 0 0.25 0.5 K m.
S cale
W est C airo A irport
F 2
F 1
F 3F 4
F 5F 6
Fig. (16): Inferred faults for the study area
10
13
15
11
165
8
9
3
20
122 1
4
7
6
14
18
17
19
2224
25
27
34
23
35
28
31 26
32
36
33
30
29
21
T o C airoT o A lexanderia 195 3335 K m. K m.
L egendV E S stationV E S & D rilled well D rilled well
307'12"
31 00' 00"30 57' 36"
304 '48" 0 0.25 0.5 K m.
S cale
W est C airo A irport
20
30
40
50
60
70
80
90
100
110
120
130
140
T hickness (m.)
Fig. (17): Isopach map contour map of thewater-bearing layer

Table (3):Clay percent, thickness and depth categoryranges for the water-bearing layer:
Category Clay percent
) (%
Thickness
( m).Depth to water
(m.)
1 < 5 > 100 < 1002 6 - 20 60 - 101 101 - 1203 21 - 60 20 - 60 121 - 1404 > 60 < 21 > 140
10
13
15
11
165
8
9
3
20
122 1
4
7
6
14
18
17
19
2224
25
27
34
23
35
28
31 26
32
36
33
30
29
21
T o C airoT o A lexanderia 195 3335 K m. K m.
L egen dV E S stationV E S & D rilled well D rilled well
307'12"
31 00' 00"30 57' 36"
304'48" 0 0.25 0.5 K m.
S cale
W est C airo A irport
(1)
(2)
(3)
(4)
Bette
r prio
rity
Fig. (18): Priority map for groundwater exploitation along the water bearing zone
CONCLUSIONS
From the results of the study, with the purpose of delineating the impact of geoelectrical setting on the ground water occurrence in thestudy area, the following can be concluded: 1. The geological succession
consists of six layers as derived from the interpretation of the sounding curves VES stations
and drilled wells information . The first layer consists of intercalations of gravel, sand, clayey sand and sandy clay. The second layer consists of a thick dry zoneformed of sand and clay intercalations overlying third layer is which is composed of sand and represents the water-bearing

layer. The fourth layer represents the end of the above layer which is consistof clay. The fifth member ofthe succession consists of the Oligocene basalt. The last layer consists of water-bearing Oligocene, formed of sandy clay.
2. The depth to water measured from the ground surface at the sites of sounding stations and wells ranges from 24 to 157.3 m. The water level lies at about 39 m above sea level.
3. The thickness of the water-bearing layer ranges from 24 to133 m which
general decreases in the western direction.
4. The presence of clay lenses and sandy clay affectthe hydraulic parameters (transmissivity, hydraulic conductivity and yield) of the water-bearing layer. Thecalculated clay percentage at each VES station and wellshows that the western partsof the study area have the higher clay content in the water-bearing formation and,so the high salinity.
5. The Oligocene basaltic sheet is affected by six normal faults that make large basin in the central part of the study area.
RECOMMENDATION
According to the results of the above study, the followingcan be recommended:1. The priority map
for the water-bearing layer of the Miocene aquifer showsthat the most promising areafor the drilling of water wells is located in the northern part.
2. In the part of the area having less in priorityof the Miocene aquifer, it is recommended to penetrate the hard basaltic sheet to reach the Oligocene water- bearing layer although of
less quality and expected less discharge. The relatively best sites for well drilling to reach thin layer are at VES station (26, 35 and 36).
3. Well logging is important to define the accurate boundaries of the sedimentary succession and to put the suitable design of the wells to be drilled.
4. Pumping test is necessary to estimate the hydraulic parameters of the saturated zones.

5. It is strongly recommended that prior to any drilling activity,
ageophysical study should beconducted at the desired sites.
REFERENCES
Abd El Baki, A.A. (1983):"Hydrogeological andhydrochemical studies on the areawest of Rosetta branch and southEl Nasser canal". Ph. D. Thesis,Fac. Sci; Ain Shams Univ. Cairo,Egypt, 156p. Abd El Rahman A. A., (1996): "Geophysical study on thegroundwater conditions in thearea south west of the Nile Deltabetween Abu Roash and El Khatatbaroad" M.SC. Thesis, Fac. SCi.,Ain Shams Univ., Egypt, 122p.Ahmed, K. A., (2002): "Hydrogeological studies on thegroundwater aquifers in thenorthwest Cairo" Ph. D. Thesis,Fac. SCi. Al Azhar Univ. 113P. Attia, S. H., (1975): " Pedology andsoil gensis of Quaternarydeposits in the region west ofthe Nile Delta (North east ofwadi El Natrun)" Ph.D. Thesis,Fac. Sci Ain shams Univ., 228p.CONOCO (1987): Geological map ofEgypt, NF 36 NW El Sad El Ali.Scale 1:500000. The EgyptianGeneral Petroleum Corporation.Conoco Coral.El Ghazawi, M.M. (1982): "Geologicalstudies of the Quaternary –Neogene aquifers in the areanorthwest Nile Delta" M.Sc.Thesis, Fac. Sci, El Azhar Univ;Cairo, Egypt, 170 p.El Ghazawy, M. M. and Attwa, S. M.,(1994): " Contribution of some
structural elements to thegroundwater conditions in thesouth western portion of the NileDelta" Egypt J. Geol., 38- ,p.649 - 667.El Shazly, E. M., Abd El Hady, M. A., ElGhawby M. A., El Kassas, I. A., Khawasik,S. M., El Shazly, M. M. and Sand, S.,(1975) :" Geologic interpretationof landsat satellite images forWest Nile Delta area, Remotesensing Center, Academy ofScientific Research andTechnology, Cairo, Egypt, p38. Ezz El Deen, H. M. M., (1999):Implication of the subsurfacestructures on the groundwateraquifers in the area betweenKM>38 and K. 46, Cairo –Alexandria desert road, Egypt"E.G.S. Proc. Of the 17th ann.Meet.,March, 1999, 99. 111 – 130.Omara, S. M., and Sanad, S. (1975): "Rock stratigraphy and structuralfeatures of the area between WadiEl Natryun and Moghra Depression,western desert, Egypt" Geol. JB.,Bl 6, Hanover, p. 45 - 73.Said , R., (1962): " Geology of Egypt,El Sevier, Publ. Amsterdam, NewYork. 377p"Sanad, S. (1973): "Geology of thearea between Wadi El Natrun andEl Moghra depression". Ph .D.Thesis, Fac. Sci, Assuit, Univ;Assuit, Egypt, 184 p.Shata, A. A., (1961): " The gelogy ofgroundwater supplies in some

arable lands in desert of Egypt "Internal report, DesertInstitute, Cairo, Egypt.Shata, A.A. (1962): "Geology, in:Preliminary report on thegeology, hydrology andgroundwater hydrology of Wadi ElNatrun and adjacent areas". Part.1, Desert Institute, Cairo,U.A.R; 39 p. Shata, A.A. and El Fayoumy, I.F. (1967):Geomorphological andmorphopedological aspects of theregion west of the Nile Deltawith special reference to Wadi El
Natrun area. Bull. Inst. Desertd'Egypt, T.XII No. 1, p. 1-38.Van Der Velpen (1988): "RESIST,Version 1.0, a package for theProcessing of the resistivitysounding data" M.Sc. ResearchProject, ITC, The Netherlands.