Conceptualizing Green Purchase Intention in Emerging Markets: An Empirical Analysis on Pakistan
Upload
independentCategory
view
8download
0
Electronic copy available at: http://ssrn.com/abstract=2152916
Innova Ciencia Vol 4, No. 4;Apr 2012
Impact of Technology on University Students:
Empirical Investigation From Pakistan
Dr. Imran Naseem,
Assistant Professor,
Department of Management Sciences,
COMSATS Institute of Information Technology,
Abbottabad, Pakistan
092-333-5216334
MsAdeelaRustam
Department of Management Sciences,
COMSATS Institute of Information Technology,
Abbottabad, Pakistan [email protected]
MsZainabAlam
Department of Management Sciences,
COMSATS Institute of Information Technology,
Abbottabad, Pakistan [email protected]
Abstract
This research is conducted to see the effect of technology on university students. This study
outlines the importance of technology and how technology can improve the education and
skills of students. For the research purpose, Hazara division was targeted and all the
universities of sciences and technology were selected and data was gathered.Data was
gathered by method of surveys, and questionnaires were floated among the students. 300
respondents were targeted and questionnaires were filled and each questionnaire contained 22
questions. Data was analyzed by making tables, estimating their frequencies and percentages.
With the help of the percentages pie-diagrams were made. And then the hypothesis was
tested by using the collected data.The overall result showed a good percentage and hypothesis
when tested with the help of factor analysis showed positive results. The research suggested
that technology does improve the teaching methods and it is helpful in good performance of
the students. It assists in attaining better quality education and helps in enhancing skills of
both teachers and students. However technology can also have a negative effect if it is used
for other purposes rather than studies. Technology may be one way instructors can maintain
Electronic copy available at: http://ssrn.com/abstract=2152916
Innova Ciencia Vol 4, No. 4;Apr 2012
student interest. Indeed, the responses appear to suggest that students perceive that they might
learn less if technology were withdrawn. Students also indicated that they would be less
inclined to take additional classes from the instructor if technology were not used. On the
other hand, the responses suggest that students might be more likely to attend class and have
a greater appreciation for instructor effort if technology were not used in the classroom.
Introduction
Technology, it seems, is everywhere these days. As computers have become
morecommonplace, the use of information technology has become pervasive in everyone’s
life.For most of us, it is hard to imagine daily life without the influence of technological
devices, be ithandheld video games, personal digital assistants, cell phones or any number of
computers. Thisis especially true for younger generations. In academia, we have likely
reached the point wherethe use of technology is expected, by both students and their parents.
Computer technology provides students and teachers with unprecedented opportunities to
transform the teaching and learning process, from the most common and simple uses to the
most sophisticated. Educators are readily embracing the challenges of integrating that
technology into their teaching.Technology helps organize presentations and notes while
widening discussion outside the lecture. Students also acknowledge technology's appeal to
different learning styles. Reasons vary from ones such as it helps students visualize things
that can't be drawn on a chalkboard and it better illustrates concepts. It facilitates teaching to
students of all learning styles and makes it easier for instructors to supplement teaching with
enrichment and extra activities. Technology can also have a negative effect but it depends on
the way it is used. Thus technology, not only enhances learning through organization and
clarity, but adds to the professionalism and atmosphere of the university, which helps
motivate students to learn and participate.
Objective of the study:
The main objective of the study was to gather the opinions of students of different
universities by asking questions, in order to know how they feel about technology introduced
into education system and how can it assist in attaining better and quality education.
Scope:
The scope of this research is to find the impact of technology on university students. How
technology can assist in better and quality education is the main theme of this study. The
purpose of this research is to see how different tools of technology can affect the credibility
of students and their learning skills. This research also sees the positive as well as negative
Innova Ciencia Vol 4, No. 4;Apr 2012
effects technology can have on learning; depending for which purpose it is used. This study
basically covers the university students and the effect technology can have on their education.
This is a small scale study covering only one university.
Limitations:
The factors limiting this research are based on the area surveyed. As this research is a small
scale study covering only Hazara Division so more diverse opinions cannot be gathered due
to time and cost constraints of targeting the area outside the Hazara division. Research could
be more diverse and variations could be seen if many different areas were targeted.
Literature Review
Technology, it seems, is everywhere these days. As computers have become
morecommonplace, the use of information technology has become pervasive in everyone’s lives.For most of us, it is hard to imagine daily life without the influence of technological
devices, be ithandheld video games, personal digital assistants, cell phones or any number of
computers. Thisis especially true for younger generations. In academia, we have likely
reached the point wherethe use of technology is expected, by both students and their parents
(Christensen, 1999)i.The use of instructional technology in higher education has increased
substantially over the past several years. "Computer technology provides students and
teachers with unprecedented opportunities to transform the teaching and learning process,
from the most common and simple uses to the most sophisticated." (Sulla, 1999)ii Educators
are readily embracing the challenges of integrating that technology into their
teaching.Technology helps organize presentations and notes while widening discussion
outside the lecture. Students also acknowledge technology's appeal to different learning
styles. Reasons vary from ones such as it helps students visualize things that can't be drawn
on a chalkboard and it better illustrates concepts. It facilitates teaching to students of all
learning styles and makes it easier for instructors to supplement teaching with enrichment and extra activities.
Technology provides a visual learning source that can help students remember lecture
materials. A research shows that students identify electronic mail as the technology that best facilitates their interaction with the instructor, collaboration with other students, and feedback
from the instructor (Barbara Draude and Sylvia Brace, 2000)iii
. Technology tends to have a meaningful impact on student preparation forclass, attentiveness, quality of notes taken,
student participation in class, student learning, desireto take additional classes from the
instructor or in the subject matter, and the overall evaluationof the course and the instructor.A
recent study by Apperson, Laws and Scepansky (2006)iv
examined the impact ofPowerPoint
on the students’ classroom experience. While they found no differences in grades asa result
Innova Ciencia Vol 4, No. 4;Apr 2012
of the use of PowerPoint in the classroom, they did find that students in
PowerPointenhancedclassrooms responded differently to the classroom experience.
Specifically, studentsbelieved that the PowerPoint classes were better organized and more
interesting.
Furthermore, Atkins-Sayre, Hopkins, Mohundro, andSayre (1998)v concluded that the use of
technology adds to the instructor’s credibility. Lecturerscan manage class time more
efficiently as less time is spent writing on whiteboards or changingtransparencies, and thus
lectures may flow better. Overall,Apperson et al (2006)vi
believe that the use of technology in
classrooms causes students to have amore favorable attitude toward their education, and
benefits accrue to instructors who utilize it intheir classes. Now a day’s students portals at
universities are also defined which help students to check their marks, download assignments
and lecture notes.
Despite this widespread belief that the use of technology in the classroom is generally good,
such may not always be the case. Burbules and Callister (2000)vii
suggest technology can be used well or poorly, and thus its effectiveness is dependent on how it is used, by whom and
for what purpose. Education technology has been found to have positive effects on student attitudes toward learning and on student self-concept. Students felt more successful in school,
were more motivated to learn and have increased self-confidence and self-esteem when using computer-based instruction. Technology can be useful in linking work experiences with
academic subjects. In a nationwide review of school to- work programs, Olson (1998)viii
found programs where students were learning the new basics or basics plus skills. These
skills include the ability to use technology to communicate ideas and information orally, as
well as in writing. Thus technology, not only enhances learning through organization and
clarity, but adds to the professionalism and atmosphere of the university, which helps
motivate students to learn and participate.
Data and Methodology
It includes the target population and the research tool used to gather data from the selected
sample.
Sampling:
All the students targeted are basically university going students.The respondents targeted include the university students of Hazara Division which includes, CUST (Comsats
University of Science and Technology) Abbottabad, Comwave Institute, UET (University of
Education and Technolgy Abbottabad), Hazara University (Mansehra, Haripur and Havelian
campuses). These respondents are basically students of age ranging from 18-25. 300
respondents were targeted to gather the data. Respondents included students from different
departments in order to analyze the impact of technology on a broader perspective.
Innova Ciencia Vol 4, No. 4;Apr 2012
Research Tool:
The research tool used in this study is basically survey questionnaire. Different students are surveyed and their opinions were taken on the basis of questionnaires.Different questions
relating to different technological devices like multimedia etc used in learning processes are developed.A questionnaire is developed for the purpose of surveying the students and
gathering their opinions and views. This questionnaire was floated throughout the universities and targeting students with different departments. The aim was to analyze what the students
think of inducing technology in education purposes and how it impacts and improves their
learning ability and styles as well as the negative impact is also seen. For this purpose, a
questionnaire comprising of 22questions was developed for gaining opinions and ideas of
students resulting from the use of technology. The likert scale used in the questionnaires is of
5 scales ranging from strongly agreed to strongly disagree.
Hypothesis Development:
As this research focuses on the impact of technology on education particularly university
students, so it includes two variables; one is independent and other is dependent.
Variables: Technology and Education are the two main variables used in this research. For
this research, technology is taken as an independent variable and education is taken as a
dependent variable. So education is dependent on technology. The more the technology is
used, the more the quality education is sustained.
TechnologyEducation
Hypothesis:Using these two variables; education and technology, a hypothesis is developed
which is in the form of a statement. And with the help of questionnaires, this hypothesis is tested. So the hypothesis statement becomes:
“Technology improves Education”
Data Analysis Technique:
The model used for testing hypothesis is Factor Analysis. Factor analysis is used as criteria
for validity. Factor analysis is the best way for type of questionnaires developed in the
research.
Innova Ciencia Vol 4, No. 4;Apr 2012
Data Tabulation and Analysis
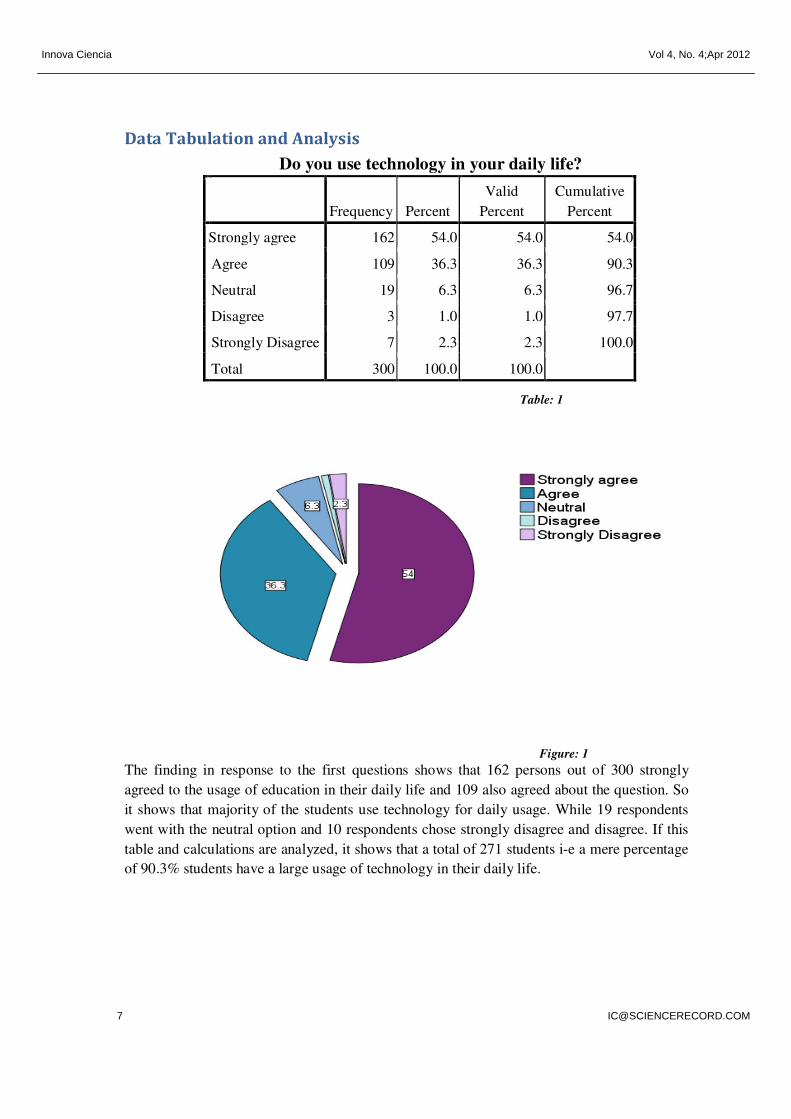
Do you use technology in your daily life?
Frequency Percent
Valid
Percent
Cumulative
Percent
Strongly agree 162 54.0 54.0 54.0
Agree 109 36.3 36.3 90.3
Neutral 19 6.3 6.3 96.7
Disagree 3 1.0 1.0 97.7
Strongly Disagree 7 2.3 2.3 100.0
Total 300 100.0 100.0
Table: 1
Figure: 1
The finding in response to the first questions shows that 162 persons out of 300 strongly
agreed to the usage of education in their daily life and 109 also agreed about the question. So
it shows that majority of the students use technology for daily usage. While 19 respondents
went with the neutral option and 10 respondents chose strongly disagree and disagree. If this
table and calculations are analyzed, it shows that a total of 271 students i-e a mere percentage
of 90.3% students have a large usage of technology in their daily life.
Innova Ciencia Vol 4, No. 4;Apr 2012
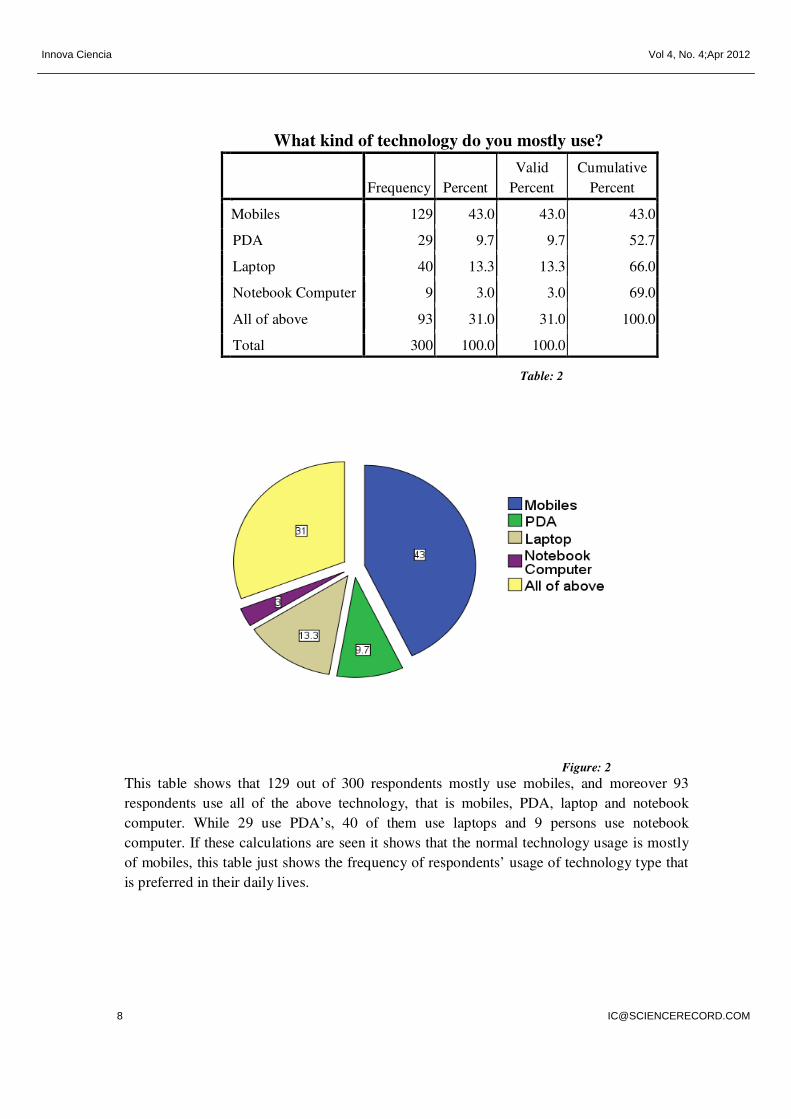
What kind of technology do you mostly use?
Frequency Percent
Valid
Percent
Cumulative
Percent
Mobiles 129 43.0 43.0 43.0
PDA 29 9.7 9.7 52.7
Laptop 40 13.3 13.3 66.0
Notebook Computer 9 3.0 3.0 69.0
All of above 93 31.0 31.0 100.0
Total 300 100.0 100.0
Table: 2
Figure: 2
This table shows that 129 out of 300 respondents mostly use mobiles, and moreover 93
respondents use all of the above technology, that is mobiles, PDA, laptop and notebook
computer. While 29 use PDA’s, 40 of them use laptops and 9 persons use notebook
computer. If these calculations are seen it shows that the normal technology usage is mostly
of mobiles, this table just shows the frequency of respondents’ usage of technology type that
is preferred in their daily lives.
Innova Ciencia Vol 4, No. 4;Apr 2012
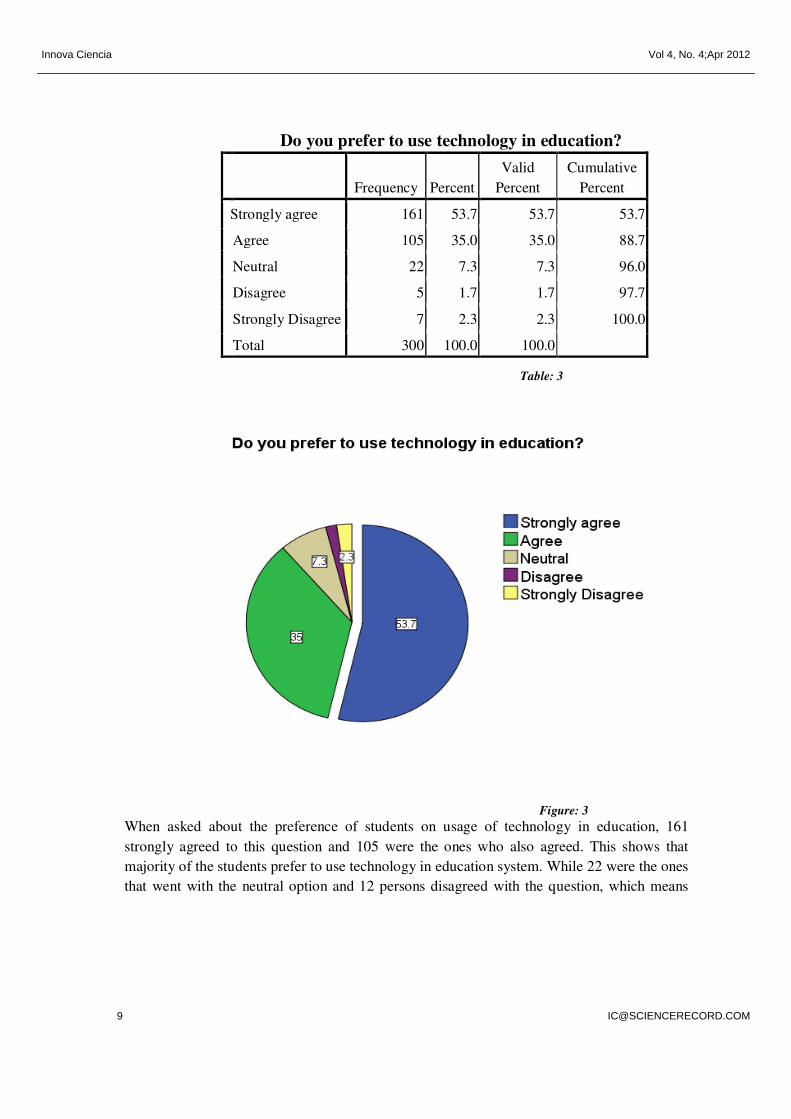
Do you prefer to use technology in education?
Frequency Percent
Valid
Percent
Cumulative
Percent
Strongly agree 161 53.7 53.7 53.7
Agree 105 35.0 35.0 88.7
Neutral 22 7.3 7.3 96.0
Disagree 5 1.7 1.7 97.7
Strongly Disagree 7 2.3 2.3 100.0
Total 300 100.0 100.0
Table: 3
Figure: 3 When asked about the preference of students on usage of technology in education, 161
strongly agreed to this question and 105 were the ones who also agreed. This shows that
majority of the students prefer to use technology in education system. While 22 were the ones
that went with the neutral option and 12 persons disagreed with the question, which means

Innova Ciencia Vol 4, No. 4;Apr 2012
that they do not prefer to use technology in the education, and they do not take any help in
their education with the technology usage. A total of 88.7% respondents prefer to use
technology for enhancing their learning skills.
Do you think technology is helpful in attaining quality
education?
Frequency Percent
Valid
Percent
Cumulative
Percent
Strongly agree 143 47.7 47.7 47.7
Agree 125 41.7 41.7 89.3
Neutral 20 6.7 6.7 96.0
Disagree 5 1.7 1.7 97.7
Strongly Disagree 7 2.3 2.3 100.0
Total 300 100.0 100.0
Table: 4
Figure: 4 143 respondents strongly believed that technology is helpful in attaining quality education.
While 125 respondents also agreed to this response. This result clearly shows their opinion of
Innova Ciencia Vol 4, No. 4;Apr 2012
using technology to attain better education. Only 12 respondents disagreed that technology is
helpful in attaining education. If it is compared with the last table and calculations, so it
shows that the 12 persons were there who do not prefer technology and they were still on
their disagreeing option, which means that these 12 persons might not like to use technology
for educational purposes.
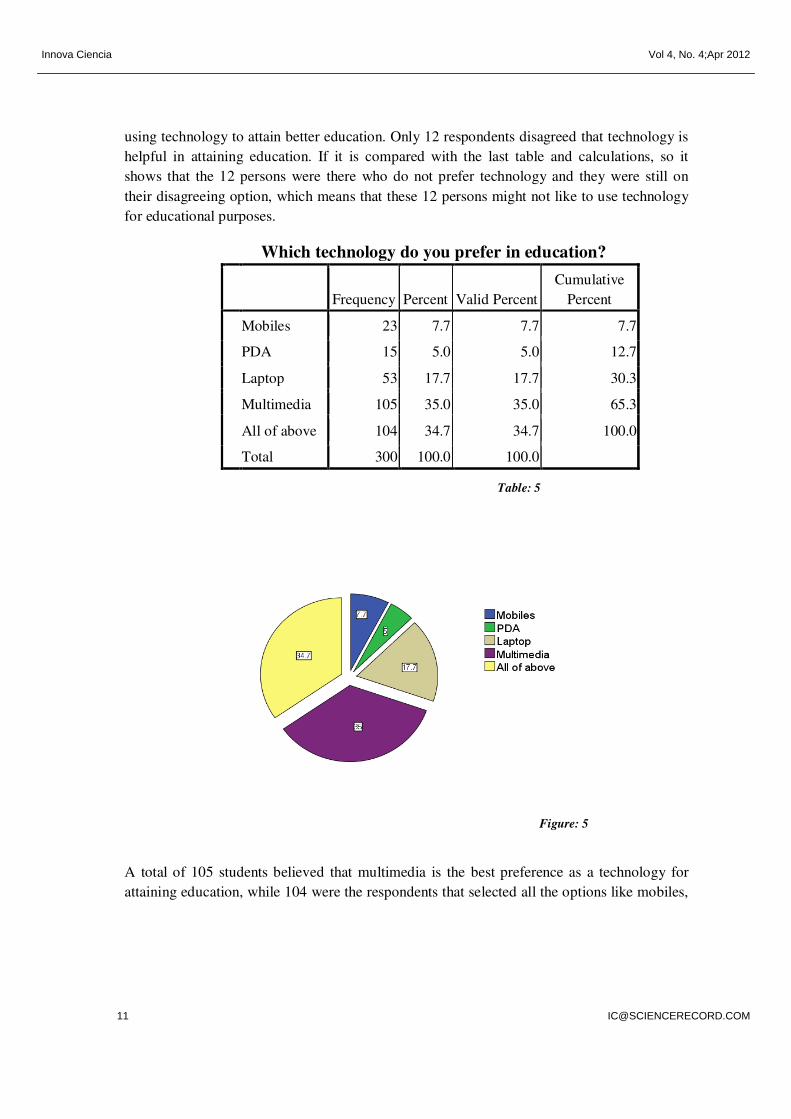
Which technology do you prefer in education?
Frequency Percent Valid Percent
Cumulative
Percent
Mobiles 23 7.7 7.7 7.7
PDA 15 5.0 5.0 12.7
Laptop 53 17.7 17.7 30.3
Multimedia 105 35.0 35.0 65.3
All of above 104 34.7 34.7 100.0
Total 300 100.0 100.0
Table: 5
Figure: 5
A total of 105 students believed that multimedia is the best preference as a technology for
attaining education, while 104 were the respondents that selected all the options like mobiles,
Innova Ciencia Vol 4, No. 4;Apr 2012
PDA, laptop and multimedia. If we see table 2 where 129 respondents agreed to use mobiles
as daily usage of technology and 142 were the respondents using the technology which is the
major educational use i-e laptop, notebook computer etc. Now in this table a total of 209 out
300 preferred technology for education. This comparison shows that more students believe in
using technology for educational purposes.
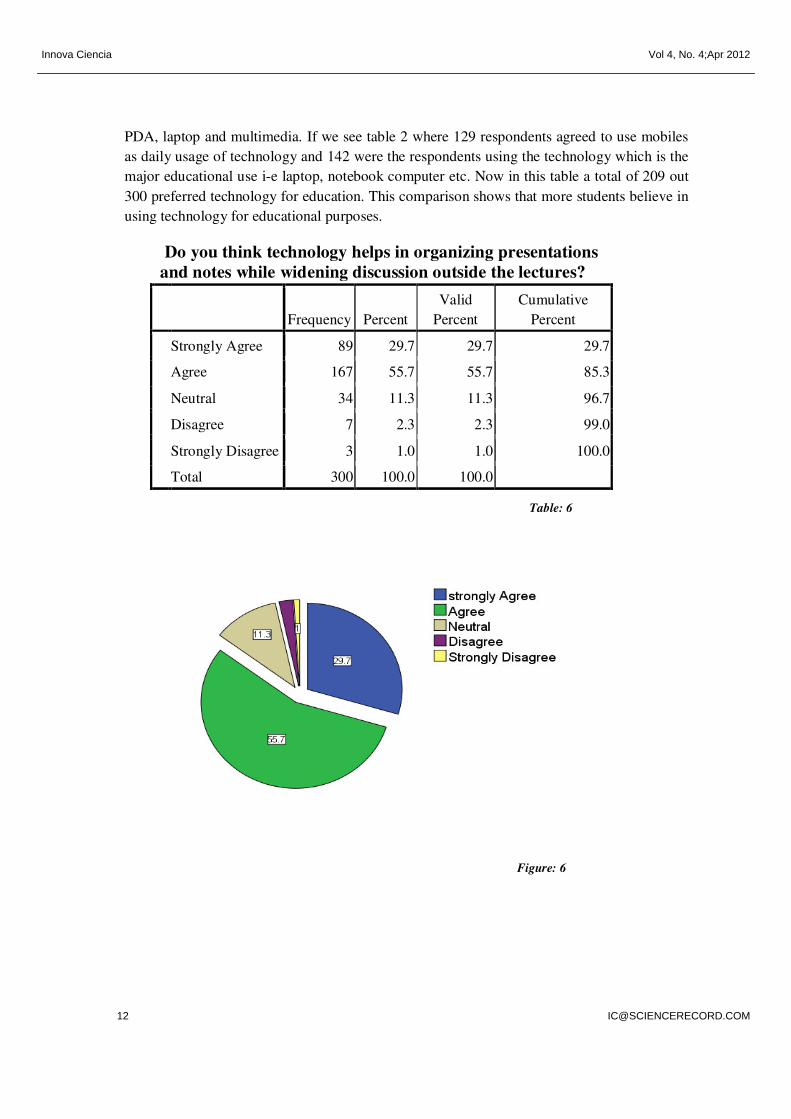
Do you think technology helps in organizing presentations
and notes while widening discussion outside the lectures?
Frequency Percent
Valid
Percent
Cumulative
Percent
Strongly Agree 89 29.7 29.7 29.7
Agree 167 55.7 55.7 85.3
Neutral 34 11.3 11.3 96.7
Disagree 7 2.3 2.3 99.0
Strongly Disagree 3 1.0 1.0 100.0
Total 300 100.0 100.0
Table: 6
Figure: 6
Innova Ciencia Vol 4, No. 4;Apr 2012
In response to this question 256 students agreed that technology helps in organizing notes and
presentations. If this table is analyzed with table 2 and table 5, so the result becomes that
there is more percentage of students who preferred the usage of technology and its help in
taking notes and widening discussions. 10 respondents disagreed to this question and 34 went
neutral. This shows that 85.4% respondents considered technology a helpful tool in widening
the discussions outside the lecture and only 3.3% is there who disagreed with them. But
majority of the students believed that technology is a active tool to broaden their learning.
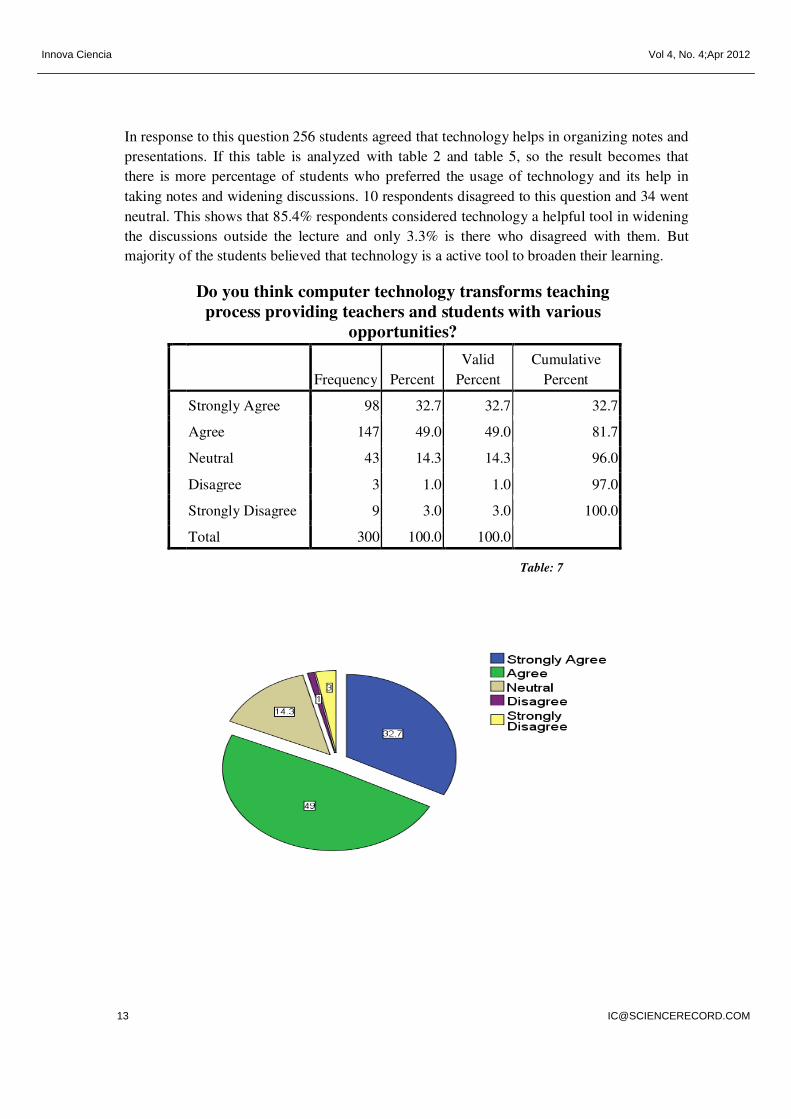
Do you think computer technology transforms teaching
process providing teachers and students with various
opportunities?
Frequency Percent
Valid
Percent
Cumulative
Percent
Strongly Agree 98 32.7 32.7 32.7
Agree 147 49.0 49.0 81.7
Neutral 43 14.3 14.3 96.0
Disagree 3 1.0 1.0 97.0
Strongly Disagree 9 3.0 3.0 100.0
Total 300 100.0 100.0
Table: 7
Innova Ciencia Vol 4, No. 4;Apr 2012
Figure: 7
245 out of 300 respondents agreed that computer technology provides teachers and students
with various opportunities. That is a total of 81.7 % agreed to this question. Here the same no
of respondents could be seen that disagreed to the past questions, they still had their opinions
firm on the technology usage in education system. Here too 12 respondents disagreed and
there were the same respondents as in the previous tables. But the percentage clearly shows
that most of the students believed that technology is a better technique for both teachers and
students as it provides them with various opportunities.
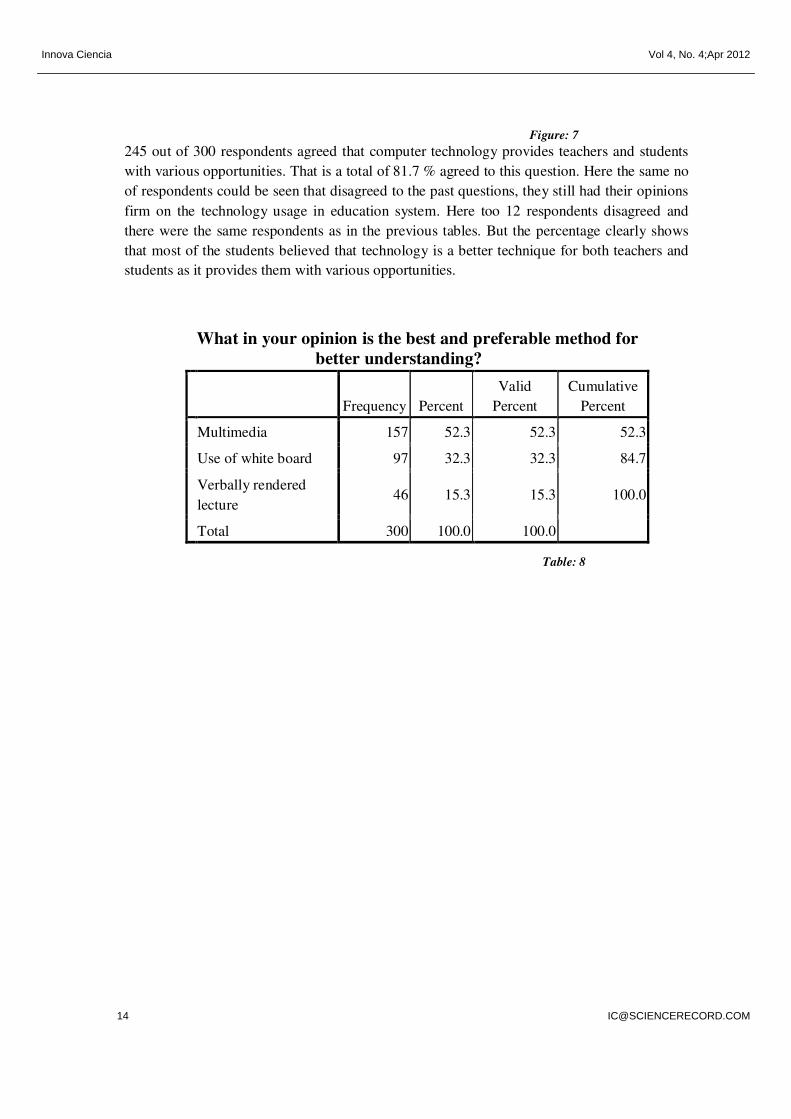
What in your opinion is the best and preferable method for
better understanding?
Frequency Percent
Valid
Percent
Cumulative
Percent
Multimedia 157 52.3 52.3 52.3
Use of white board 97 32.3 32.3 84.7
Verbally rendered
lecture 46 15.3 15.3 100.0
Total 300 100.0 100.0
Table: 8
Innova Ciencia Vol 4, No. 4;Apr 2012
Figure: 8
In response to the question that what is the better method of understanding, 157 respondents
chose multimedia, 97 chose use of white boards and the remaining 46 chose verbally
rendered lectures option. This shows that more percentage lies with the use of technology i-e
multimedia for better understanding. It means that a total of 52.3% think multimedia is the
best and preferable method for understanding. So the more percentage lies with the
technological tool, which is multimedia. Here too the calculation shows positive result.
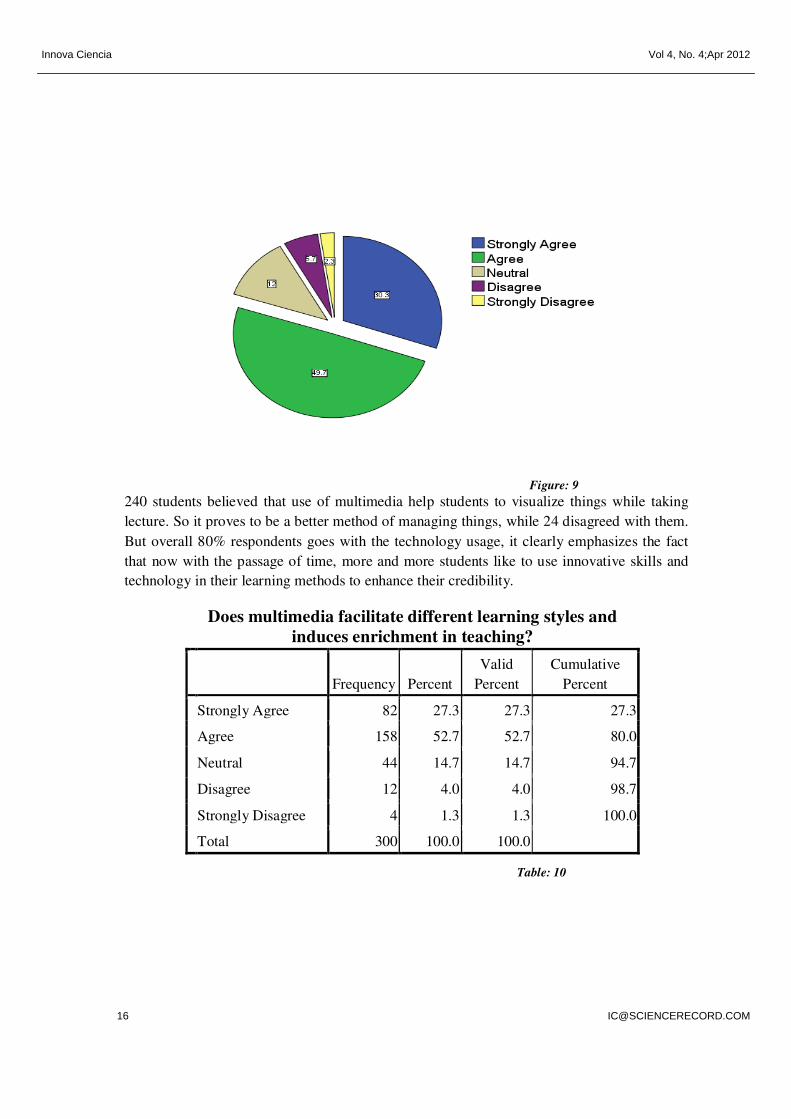
Does use of Multimediawhile taking lectures help
student visualize things?
Frequency Percent
Valid
Percent
Cumulative
Percent
Strongly Agree 91 30.3 30.3 30.3
Agree 149 49.7 49.7 80.0
Neutral 36 12.0 12.0 92.0
Disagree 17 5.7 5.7 97.7
Strongly Disagree 7 2.3 2.3 100.0
Total 300 100.0 100.0
Table: 9
Innova Ciencia Vol 4, No. 4;Apr 2012
Figure: 9 240 students believed that use of multimedia help students to visualize things while taking
lecture. So it proves to be a better method of managing things, while 24 disagreed with them.
But overall 80% respondents goes with the technology usage, it clearly emphasizes the fact
that now with the passage of time, more and more students like to use innovative skills and
technology in their learning methods to enhance their credibility.
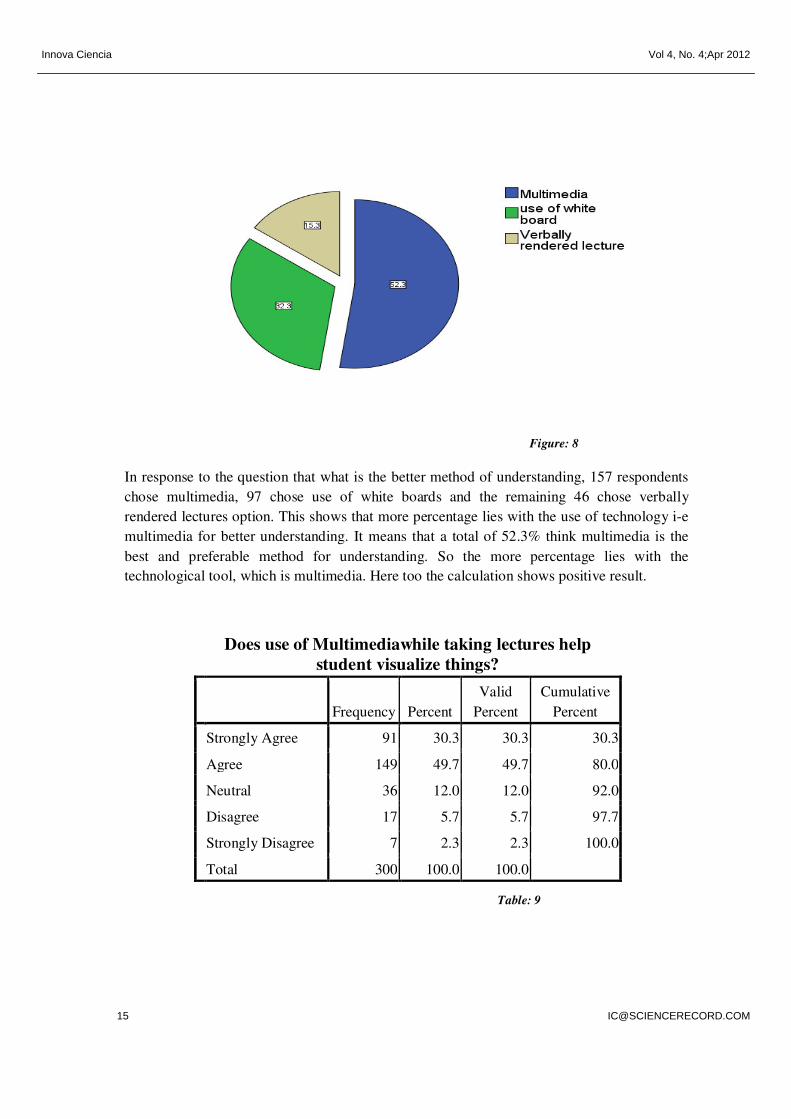
Does multimedia facilitate different learning styles and
induces enrichment in teaching?
Frequency Percent
Valid
Percent
Cumulative
Percent
Strongly Agree 82 27.3 27.3 27.3
Agree 158 52.7 52.7 80.0
Neutral 44 14.7 14.7 94.7
Disagree 12 4.0 4.0 98.7
Strongly Disagree 4 1.3 1.3 100.0
Total 300 100.0 100.0
Table: 10
Innova Ciencia Vol 4, No. 4;Apr 2012
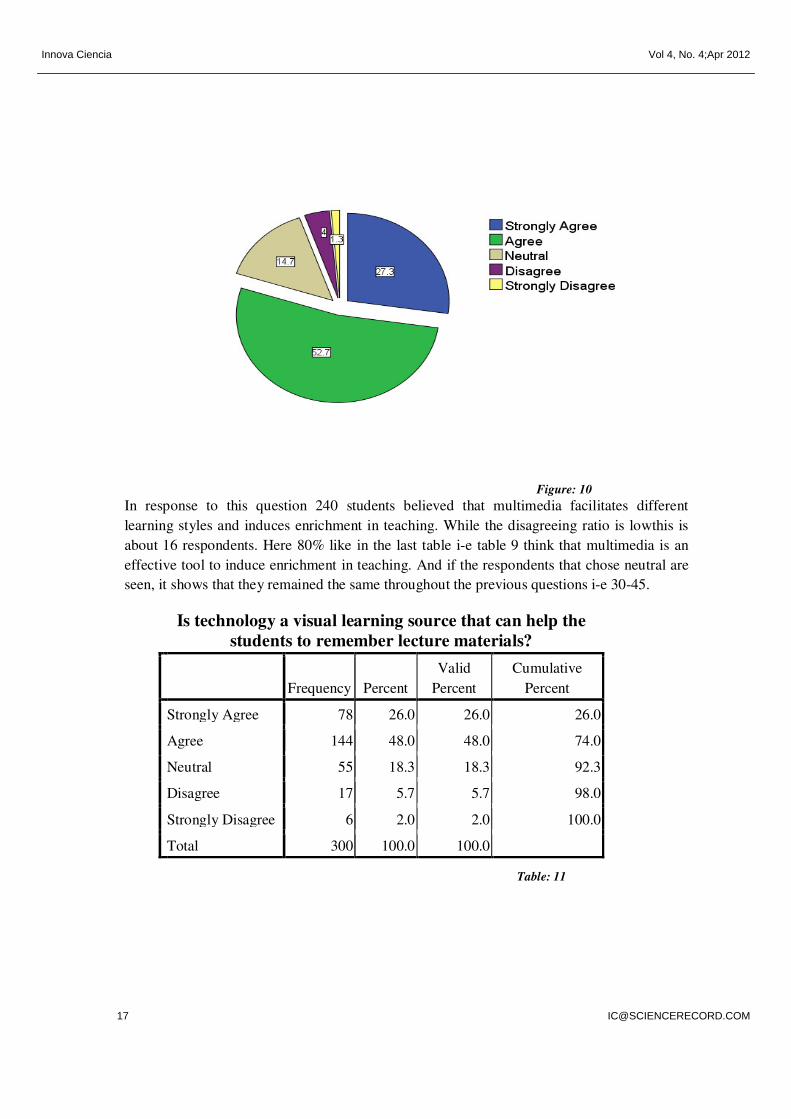
Figure: 10 In response to this question 240 students believed that multimedia facilitates different
learning styles and induces enrichment in teaching. While the disagreeing ratio is lowthis is
about 16 respondents. Here 80% like in the last table i-e table 9 think that multimedia is an
effective tool to induce enrichment in teaching. And if the respondents that chose neutral are
seen, it shows that they remained the same throughout the previous questions i-e 30-45.
Is technology a visual learning source that can help the
students to remember lecture materials?
Frequency Percent
Valid
Percent
Cumulative
Percent
Strongly Agree 78 26.0 26.0 26.0
Agree 144 48.0 48.0 74.0
Neutral 55 18.3 18.3 92.3
Disagree 17 5.7 5.7 98.0
Strongly Disagree 6 2.0 2.0 100.0
Total 300 100.0 100.0
Table: 11
Innova Ciencia Vol 4, No. 4;Apr 2012
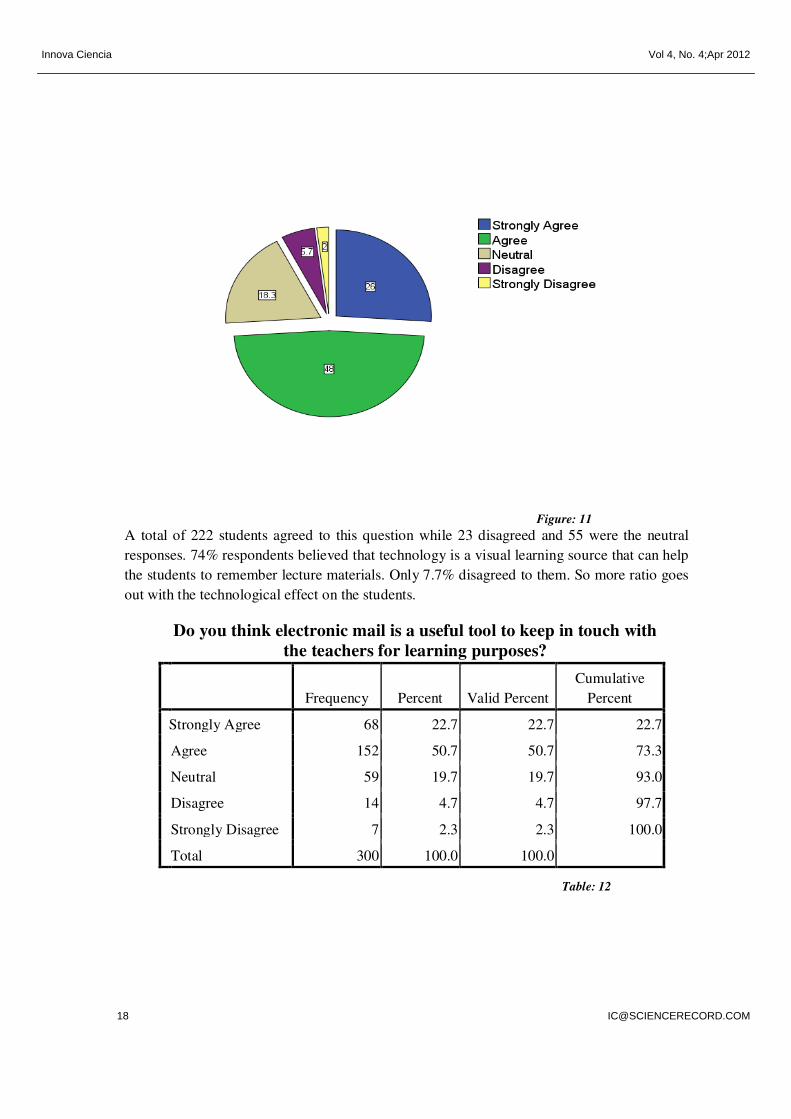
Figure: 11
A total of 222 students agreed to this question while 23 disagreed and 55 were the neutral
responses. 74% respondents believed that technology is a visual learning source that can help
the students to remember lecture materials. Only 7.7% disagreed to them. So more ratio goes
out with the technological effect on the students.
Do you think electronic mail is a useful tool to keep in touch with
the teachers for learning purposes?
Frequency Percent Valid Percent
Cumulative
Percent
Strongly Agree 68 22.7 22.7 22.7
Agree 152 50.7 50.7 73.3
Neutral 59 19.7 19.7 93.0
Disagree 14 4.7 4.7 97.7
Strongly Disagree 7 2.3 2.3 100.0
Total 300 100.0 100.0
Table: 12
Innova Ciencia Vol 4, No. 4;Apr 2012
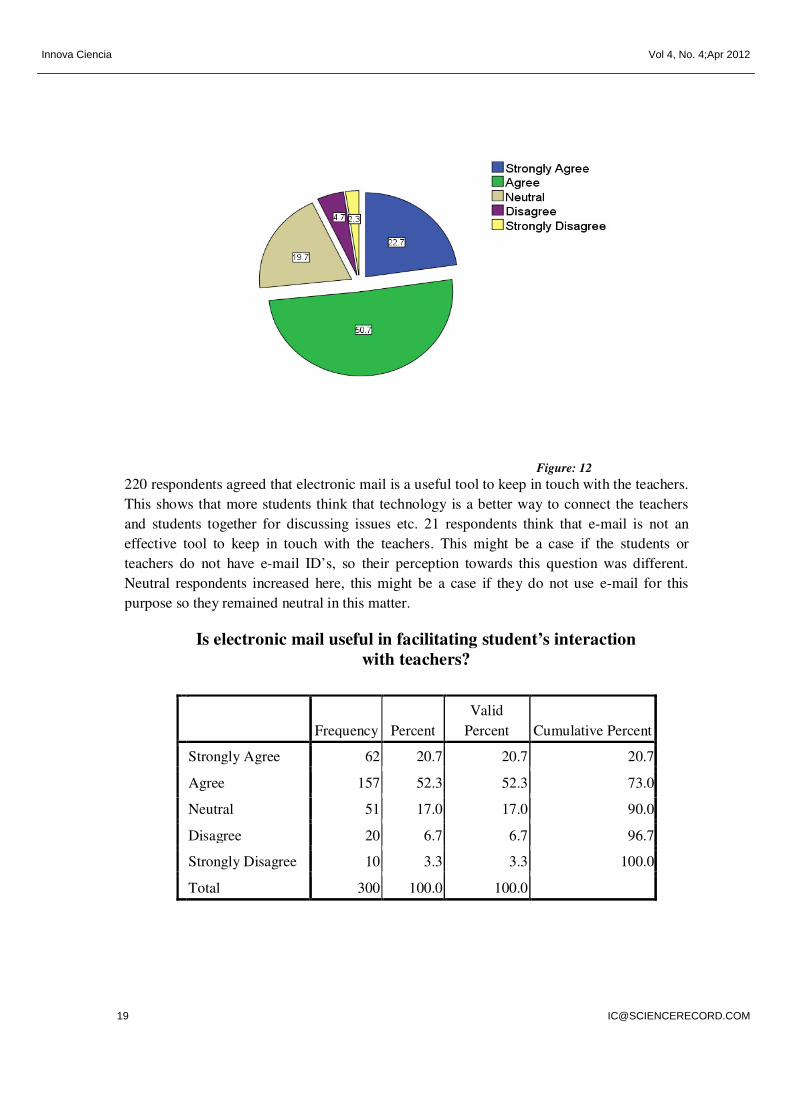
Figure: 12
220 respondents agreed that electronic mail is a useful tool to keep in touch with the teachers.
This shows that more students think that technology is a better way to connect the teachers
and students together for discussing issues etc. 21 respondents think that e-mail is not an
effective tool to keep in touch with the teachers. This might be a case if the students or
teachers do not have e-mail ID’s, so their perception towards this question was different.
Neutral respondents increased here, this might be a case if they do not use e-mail for this
purpose so they remained neutral in this matter.
Is electronic mail useful in facilitating student’s interaction
with teachers?
Frequency Percent
Valid
Percent Cumulative Percent
Strongly Agree 62 20.7 20.7 20.7
Agree 157 52.3 52.3 73.0
Neutral 51 17.0 17.0 90.0
Disagree 20 6.7 6.7 96.7
Strongly Disagree 10 3.3 3.3 100.0
Total 300 100.0 100.0
Innova Ciencia Vol 4, No. 4;Apr 2012
Table: 13
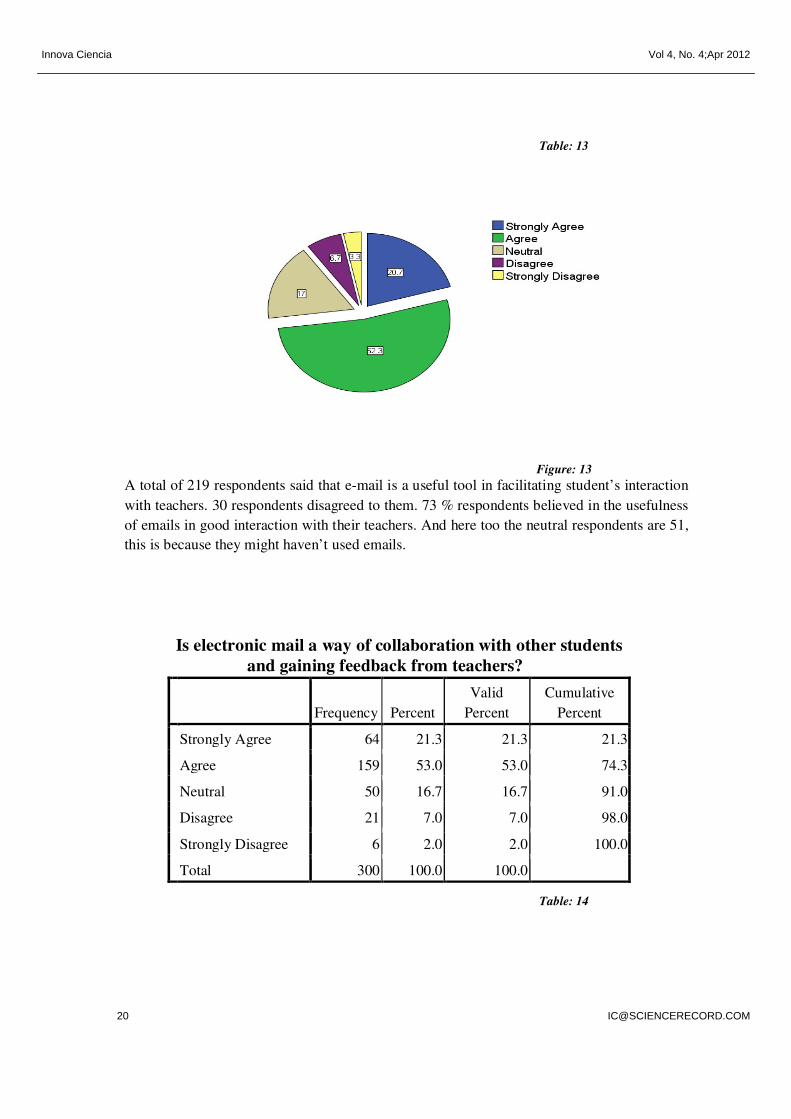
Figure: 13 A total of 219 respondents said that e-mail is a useful tool in facilitating student’s interaction
with teachers. 30 respondents disagreed to them. 73 % respondents believed in the usefulness
of emails in good interaction with their teachers. And here too the neutral respondents are 51,
this is because they might haven’t used emails.
Is electronic mail a way of collaboration with other students
and gaining feedback from teachers?
Frequency Percent
Valid
Percent
Cumulative
Percent
Strongly Agree 64 21.3 21.3 21.3
Agree 159 53.0 53.0 74.3
Neutral 50 16.7 16.7 91.0
Disagree 21 7.0 7.0 98.0
Strongly Disagree 6 2.0 2.0 100.0
Total 300 100.0 100.0
Table: 14
Innova Ciencia Vol 4, No. 4;Apr 2012
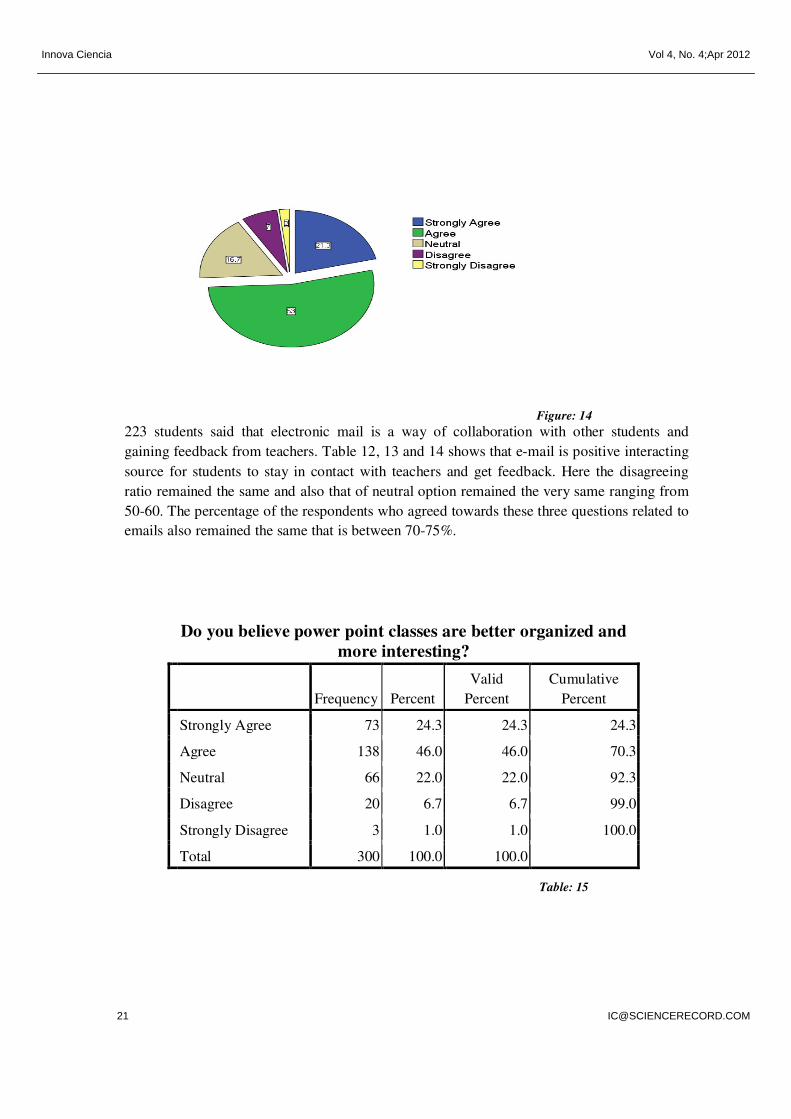
Figure: 14 223 students said that electronic mail is a way of collaboration with other students and
gaining feedback from teachers. Table 12, 13 and 14 shows that e-mail is positive interacting
source for students to stay in contact with teachers and get feedback. Here the disagreeing
ratio remained the same and also that of neutral option remained the very same ranging from
50-60. The percentage of the respondents who agreed towards these three questions related to
emails also remained the same that is between 70-75%.
Do you believe power point classes are better organized and
more interesting?
Frequency Percent
Valid
Percent
Cumulative
Percent
Strongly Agree 73 24.3 24.3 24.3
Agree 138 46.0 46.0 70.3
Neutral 66 22.0 22.0 92.3
Disagree 20 6.7 6.7 99.0
Strongly Disagree 3 1.0 1.0 100.0
Total 300 100.0 100.0
Table: 15

Innova Ciencia Vol 4, No. 4;Apr 2012
Figure: 15 211 respondents think that power point classes are better organized and more interesting.
While 66 are the students that went with neutral option that is they didn’t have any
opinionwhether PowerPoint classes are interesting or not.23 respondents disagreed to this
question. The ratio of agreeing respondents was about 70.3% in this response.
Does technology increasethe credibility of teachers?
Frequency Percent
Valid
Percent
Cumulative
Percent
Strongly Agree 74 24.7 24.7 24.7
Agree 150 50.0 50.0 74.7
Neutral 49 16.3 16.3 91.0
disagree 14 4.7 4.7 95.7
Strongly Disagree 13 4.3 4.3 100.0
Total 300 100.0 100.0
Table: 16
Innova Ciencia Vol 4, No. 4;Apr 2012
Figure: 16
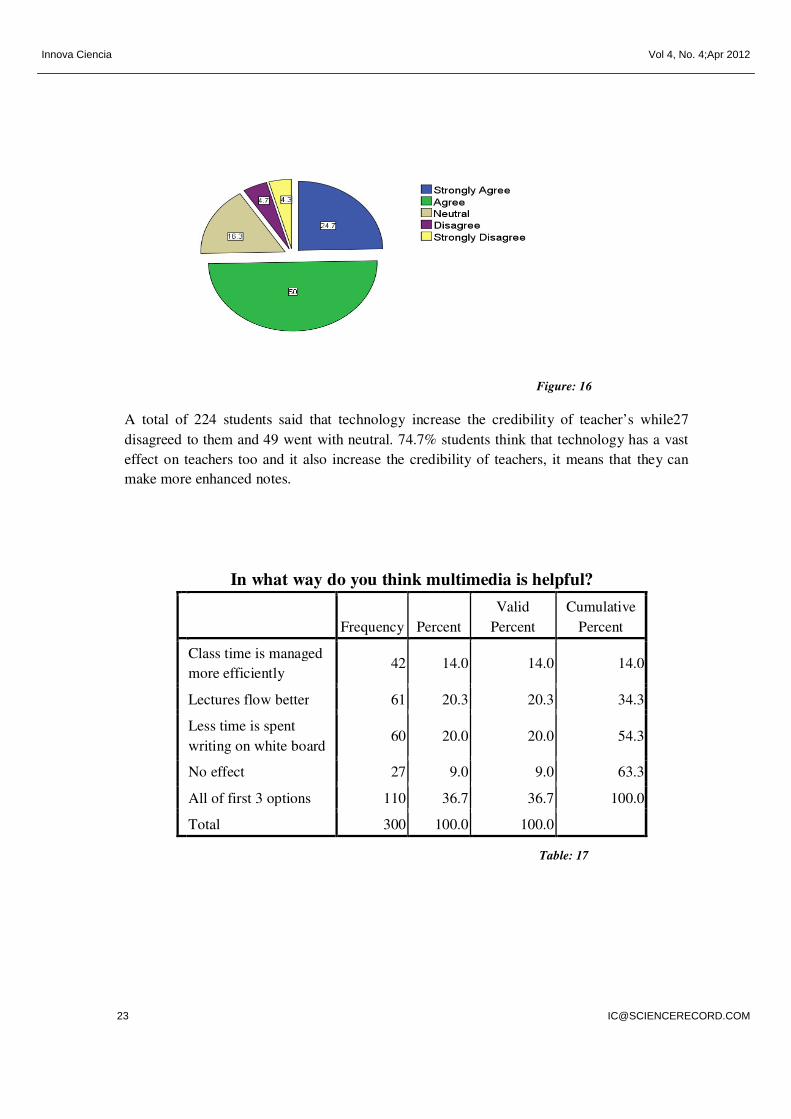
A total of 224 students said that technology increase the credibility of teacher’s while27
disagreed to them and 49 went with neutral. 74.7% students think that technology has a vast
effect on teachers too and it also increase the credibility of teachers, it means that they can
make more enhanced notes.
In what way do you think multimedia is helpful?
Frequency Percent
Valid
Percent
Cumulative
Percent
Class time is managed
more efficiently 42 14.0 14.0 14.0
Lectures flow better 61 20.3 20.3 34.3
Less time is spent
writing on white board 60 20.0 20.0 54.3
No effect 27 9.0 9.0 63.3
All of first 3 options 110 36.7 36.7 100.0
Total 300 100.0 100.0
Table: 17
Innova Ciencia Vol 4, No. 4;Apr 2012
Figure: 17
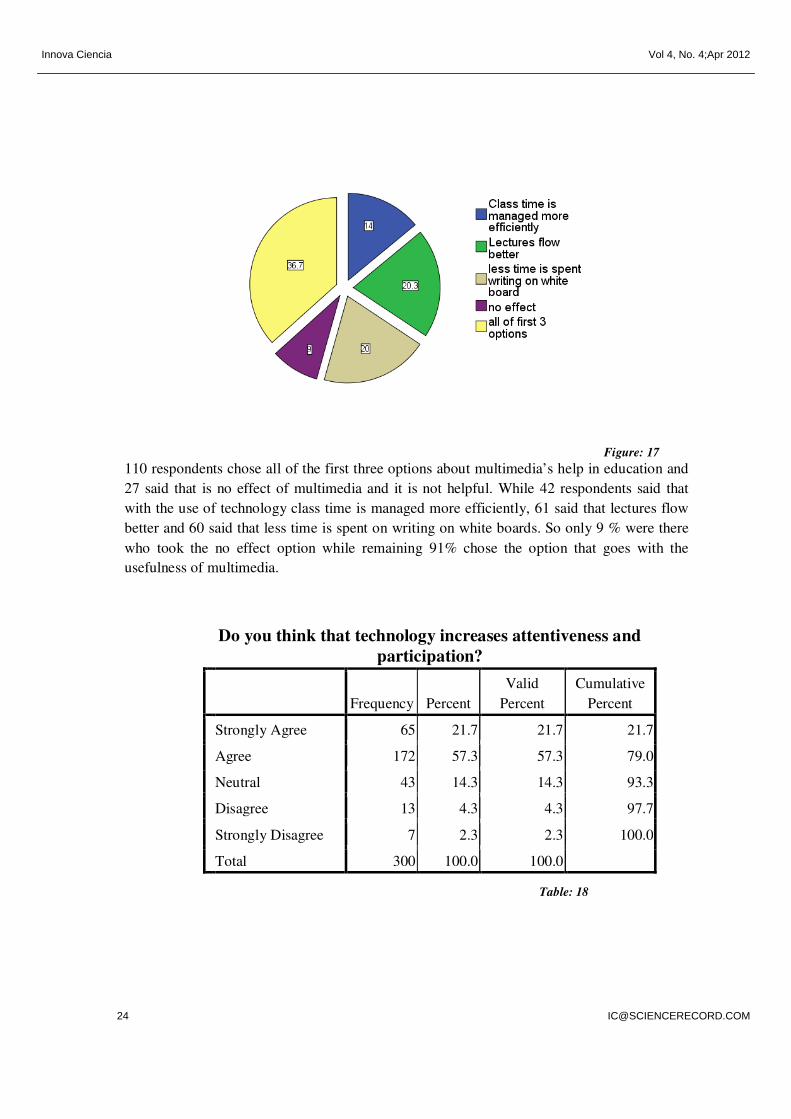
110 respondents chose all of the first three options about multimedia’s help in education and
27 said that is no effect of multimedia and it is not helpful. While 42 respondents said that
with the use of technology class time is managed more efficiently, 61 said that lectures flow
better and 60 said that less time is spent on writing on white boards. So only 9 % were there
who took the no effect option while remaining 91% chose the option that goes with the
usefulness of multimedia.
Do you think that technology increases attentiveness and
participation?
Frequency Percent
Valid
Percent
Cumulative
Percent
Strongly Agree 65 21.7 21.7 21.7
Agree 172 57.3 57.3 79.0
Neutral 43 14.3 14.3 93.3
Disagree 13 4.3 4.3 97.7
Strongly Disagree 7 2.3 2.3 100.0
Total 300 100.0 100.0
Table: 18
Innova Ciencia Vol 4, No. 4;Apr 2012
Figure: 18
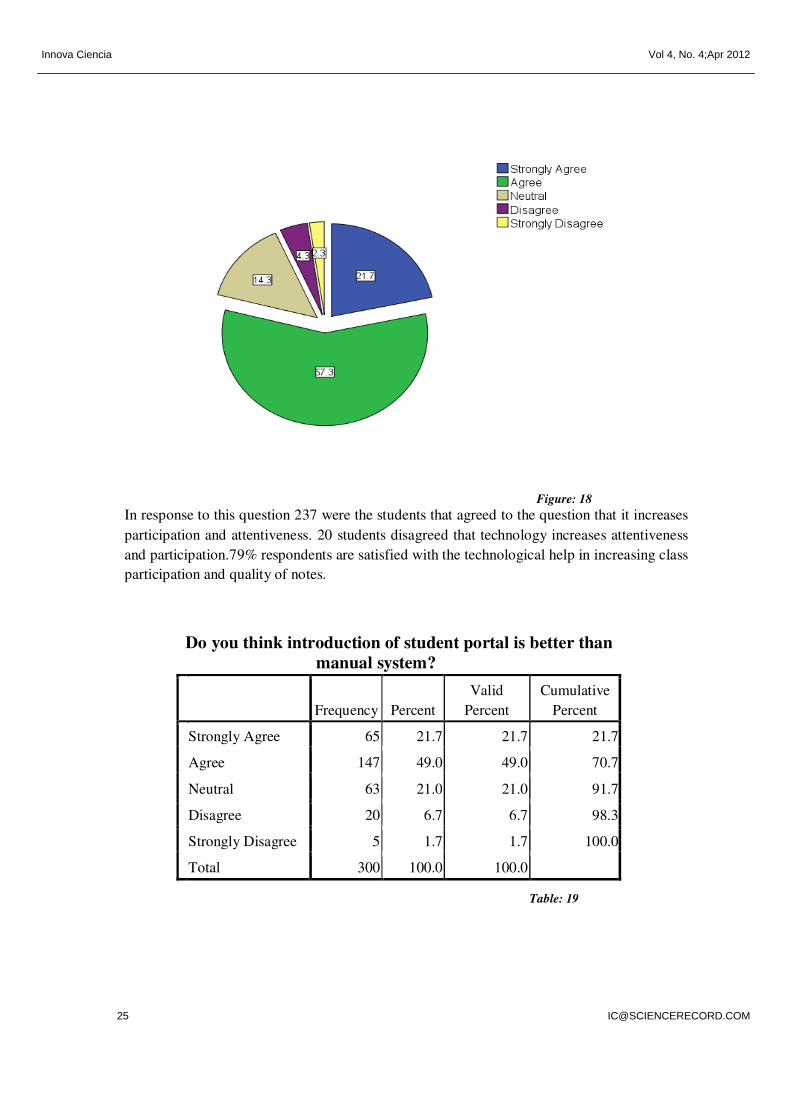
In response to this question 237 were the students that agreed to the question that it increases
participation and attentiveness. 20 students disagreed that technology increases attentiveness
and participation.79% respondents are satisfied with the technological help in increasing class
participation and quality of notes.
Do you think introduction of student portal is better than
manual system?
Frequency Percent
Valid
Percent
Cumulative
Percent
Strongly Agree 65 21.7 21.7 21.7
Agree 147 49.0 49.0 70.7
Neutral 63 21.0 21.0 91.7
Disagree 20 6.7 6.7 98.3
Strongly Disagree 5 1.7 1.7 100.0
Total 300 100.0 100.0
Table: 19
Innova Ciencia Vol 4, No. 4;Apr 2012
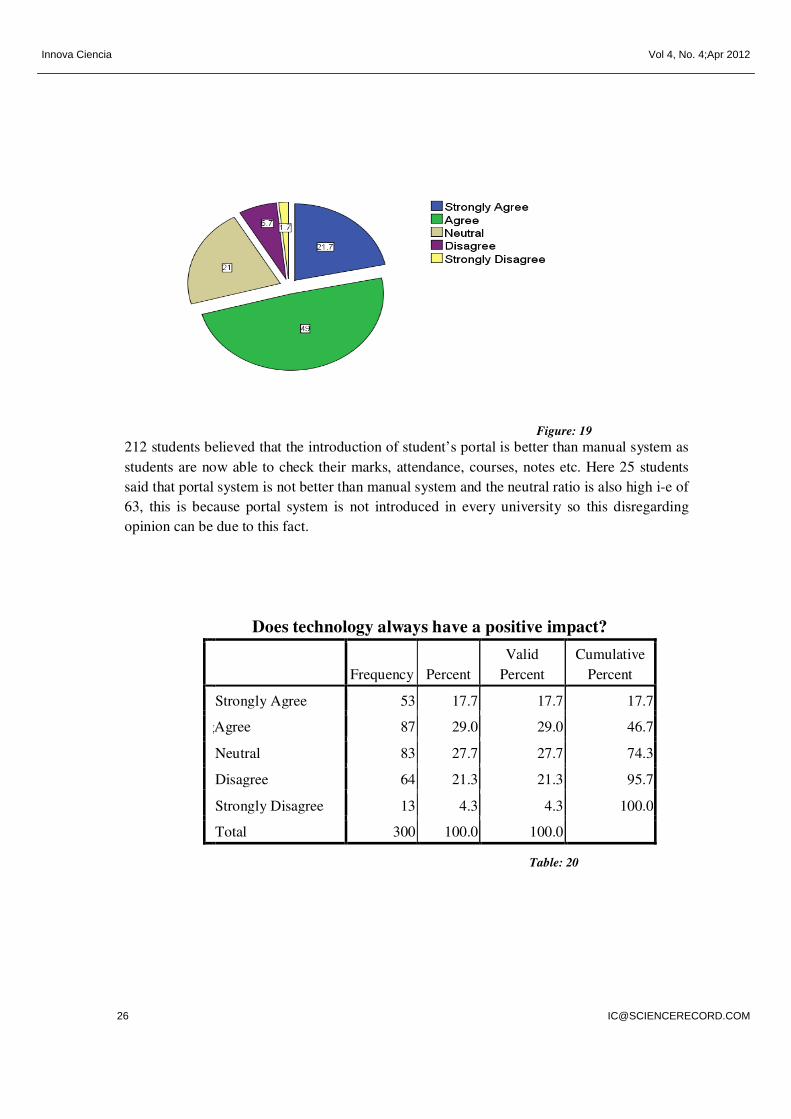
Figure: 19
212 students believed that the introduction of student’s portal is better than manual system as
students are now able to check their marks, attendance, courses, notes etc. Here 25 students
said that portal system is not better than manual system and the neutral ratio is also high i-e of
63, this is because portal system is not introduced in every university so this disregarding
opinion can be due to this fact.
Does technology always have a positive impact?
Frequency Percent
Valid
Percent
Cumulative
Percent
Strongly Agree 53 17.7 17.7 17.7
hgjhhgAgree 87 29.0 29.0 46.7
Neutral 83 27.7 27.7 74.3
Disagree 64 21.3 21.3 95.7
Strongly Disagree 13 4.3 4.3 100.0
Total 300 100.0 100.0
Table: 20
Innova Ciencia Vol 4, No. 4;Apr 2012
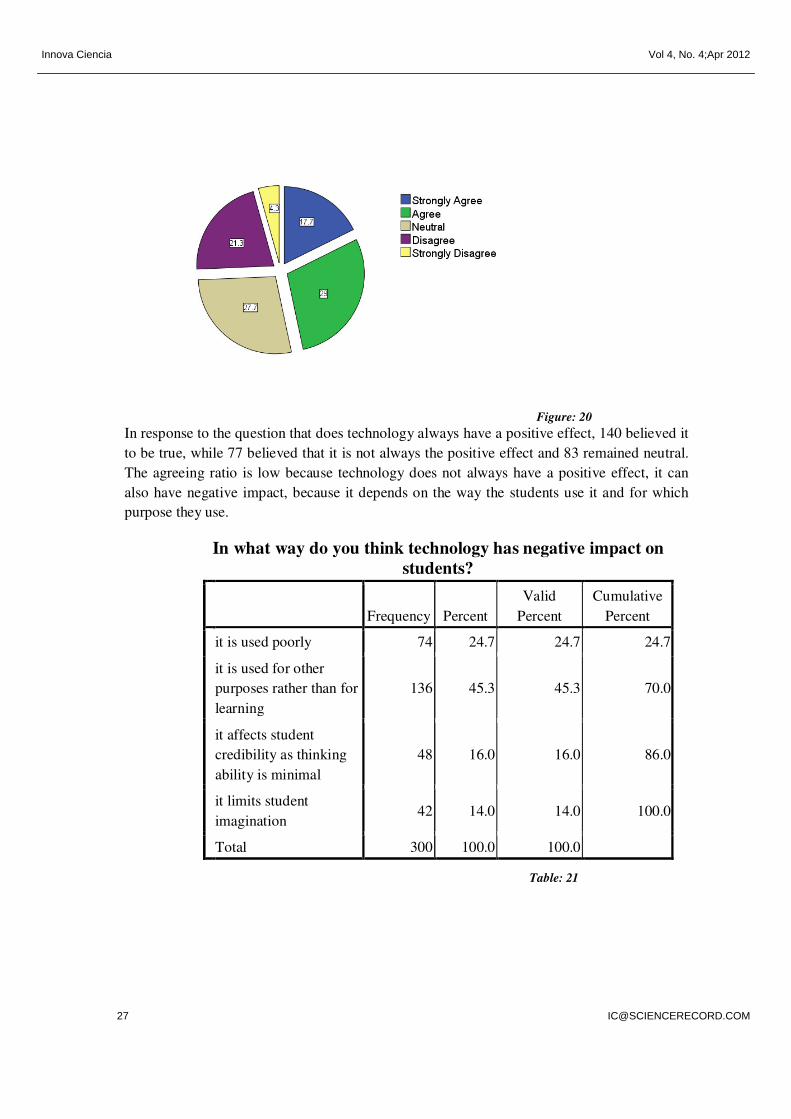
Figure: 20
In response to the question that does technology always have a positive effect, 140 believed it
to be true, while 77 believed that it is not always the positive effect and 83 remained neutral.
The agreeing ratio is low because technology does not always have a positive effect, it can
also have negative impact, because it depends on the way the students use it and for which
purpose they use.
In what way do you think technology has negative impact on
students?
Frequency Percent
Valid
Percent
Cumulative
Percent
it is used poorly 74 24.7 24.7 24.7
it is used for other
purposes rather than for
learning
136 45.3 45.3 70.0
it affects student
credibility as thinking
ability is minimal
48 16.0 16.0 86.0
it limits student
imagination 42 14.0 14.0 100.0
Total 300 100.0 100.0
Table: 21
Innova Ciencia Vol 4, No. 4;Apr 2012
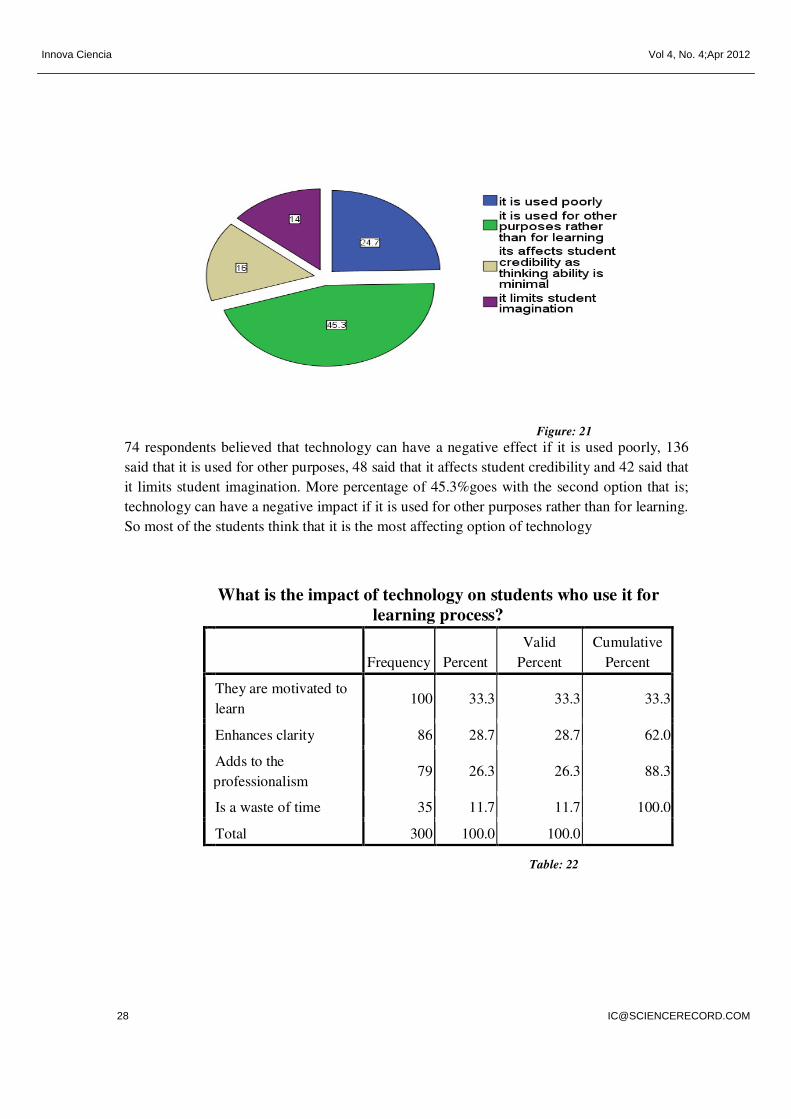
Figure: 21
74 respondents believed that technology can have a negative effect if it is used poorly, 136
said that it is used for other purposes, 48 said that it affects student credibility and 42 said that
it limits student imagination. More percentage of 45.3%goes with the second option that is;
technology can have a negative impact if it is used for other purposes rather than for learning.
So most of the students think that it is the most affecting option of technology
What is the impact of technology on students who use it for
learning process?
Frequency Percent
Valid
Percent
Cumulative
Percent
They are motivated to
learn 100 33.3 33.3 33.3
Enhances clarity 86 28.7 28.7 62.0
Adds to the
professionalism 79 26.3 26.3 88.3
Is a waste of time 35 11.7 11.7 100.0
Total 300 100.0 100.0
Table: 22
Innova Ciencia Vol 4, No. 4;Apr 2012
Figure: 22
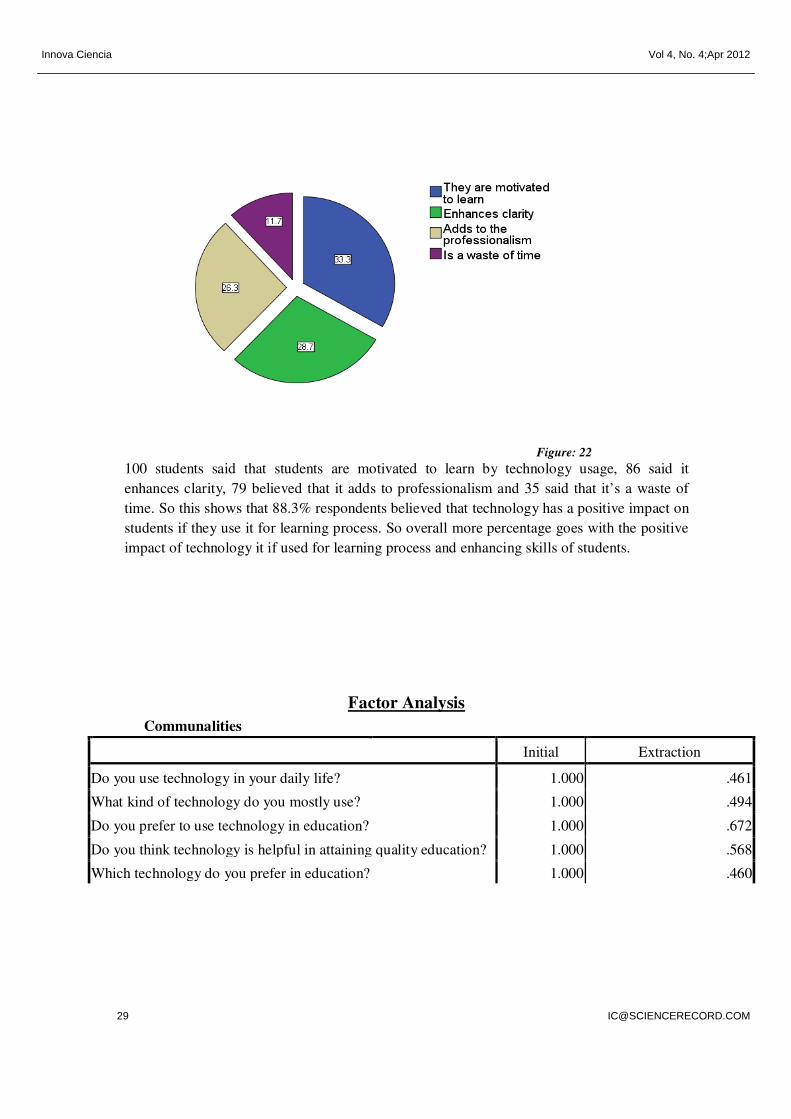
100 students said that students are motivated to learn by technology usage, 86 said it
enhances clarity, 79 believed that it adds to professionalism and 35 said that it’s a waste of
time. So this shows that 88.3% respondents believed that technology has a positive impact on
students if they use it for learning process. So overall more percentage goes with the positive
impact of technology it if used for learning process and enhancing skills of students.
Factor Analysis
Communalities
Initial Extraction
Do you use technology in your daily life? 1.000 .461
What kind of technology do you mostly use? 1.000 .494
Do you prefer to use technology in education? 1.000 .672
Do you think technology is helpful in attaining quality education? 1.000 .568
Which technology do you prefer in education? 1.000 .460
Innova Ciencia Vol 4, No. 4;Apr 2012
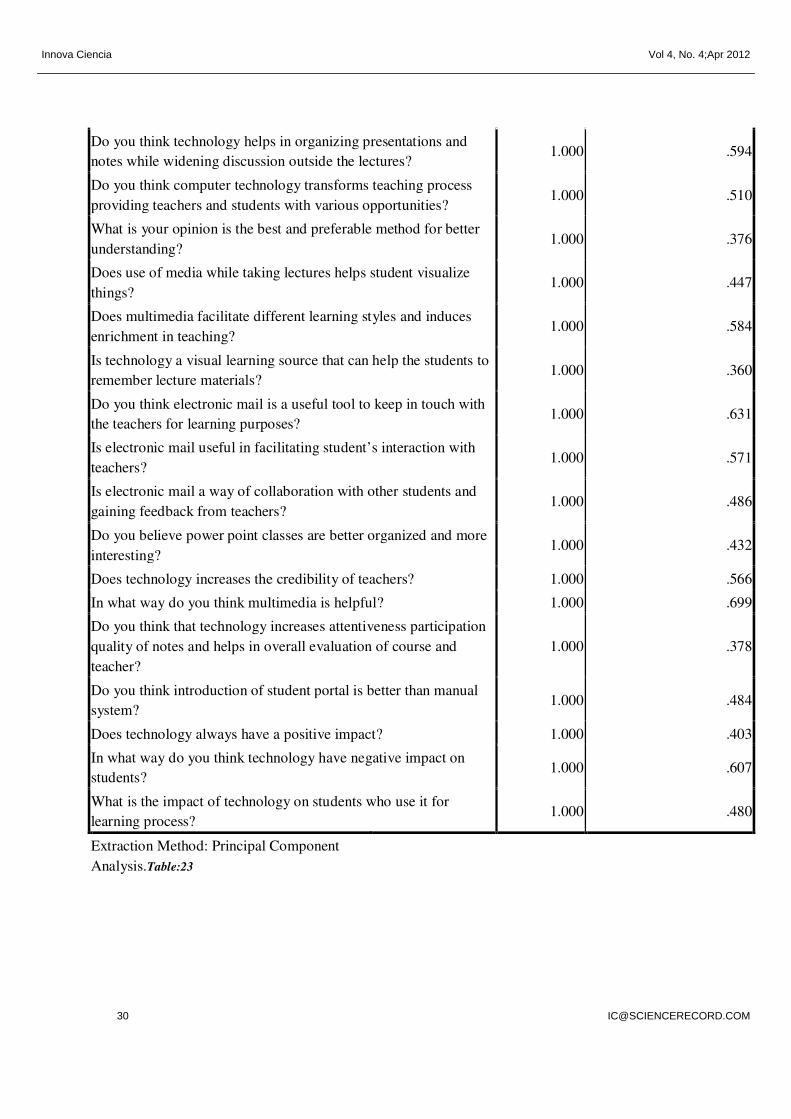
Do you think technology helps in organizing presentations and
notes while widening discussion outside the lectures? 1.000 .594
Do you think computer technology transforms teaching process
providing teachers and students with various opportunities? 1.000 .510
What is your opinion is the best and preferable method for better
understanding? 1.000 .376
Does use of media while taking lectures helps student visualize
things? 1.000 .447
Does multimedia facilitate different learning styles and induces
enrichment in teaching? 1.000 .584
Is technology a visual learning source that can help the students to
remember lecture materials? 1.000 .360
Do you think electronic mail is a useful tool to keep in touch with
the teachers for learning purposes? 1.000 .631
Is electronic mail useful in facilitating student’s interaction with
teachers? 1.000 .571
Is electronic mail a way of collaboration with other students and
gaining feedback from teachers? 1.000 .486
Do you believe power point classes are better organized and more
interesting? 1.000 .432
Does technology increases the credibility of teachers? 1.000 .566
In what way do you think multimedia is helpful? 1.000 .699
Do you think that technology increases attentiveness participation
quality of notes and helps in overall evaluation of course and
teacher?
1.000 .378
Do you think introduction of student portal is better than manual
system? 1.000 .484
Does technology always have a positive impact? 1.000 .403
In what way do you think technology have negative impact on
students? 1.000 .607
What is the impact of technology on students who use it for
learning process? 1.000 .480
Extraction Method: Principal Component
Analysis.Table:23
Innova Ciencia Vol 4, No. 4;Apr 2012
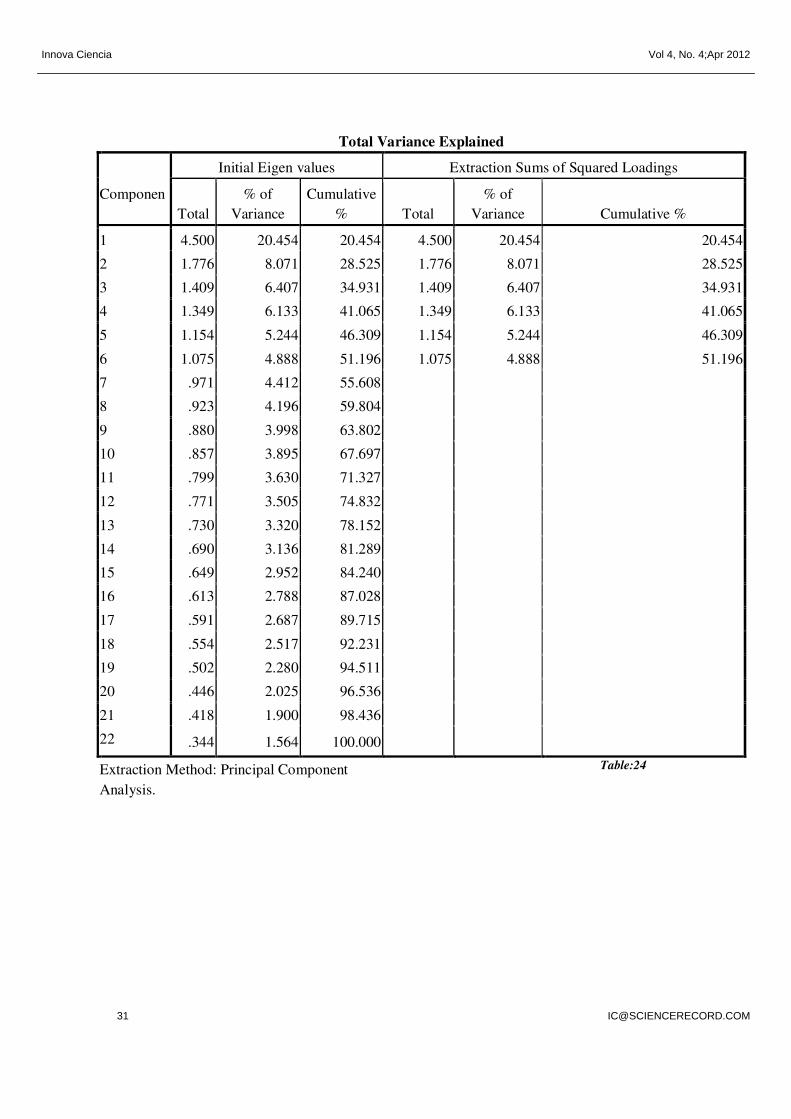
Total Variance Explained
Componen
Initial Eigen values Extraction Sums of Squared Loadings
Total
% of
Variance
Cumulative
% Total
% of
Variance Cumulative %
1 4.500 20.454 20.454 4.500 20.454 20.454
2 1.776 8.071 28.525 1.776 8.071 28.525
3 1.409 6.407 34.931 1.409 6.407 34.931
4 1.349 6.133 41.065 1.349 6.133 41.065
5 1.154 5.244 46.309 1.154 5.244 46.309
6 1.075 4.888 51.196 1.075 4.888 51.196
7 .971 4.412 55.608
8 .923 4.196 59.804
9 .880 3.998 63.802
10 .857 3.895 67.697
11 .799 3.630 71.327
12 .771 3.505 74.832
13 .730 3.320 78.152
14 .690 3.136 81.289
15 .649 2.952 84.240
16 .613 2.788 87.028
17 .591 2.687 89.715
18 .554 2.517 92.231
19 .502 2.280 94.511
20 .446 2.025 96.536
21 .418 1.900 98.436
22 .344 1.564 100.000
Extraction Method: Principal Component
Analysis.
Table:24
Innova Ciencia Vol 4, No. 4;Apr 2012
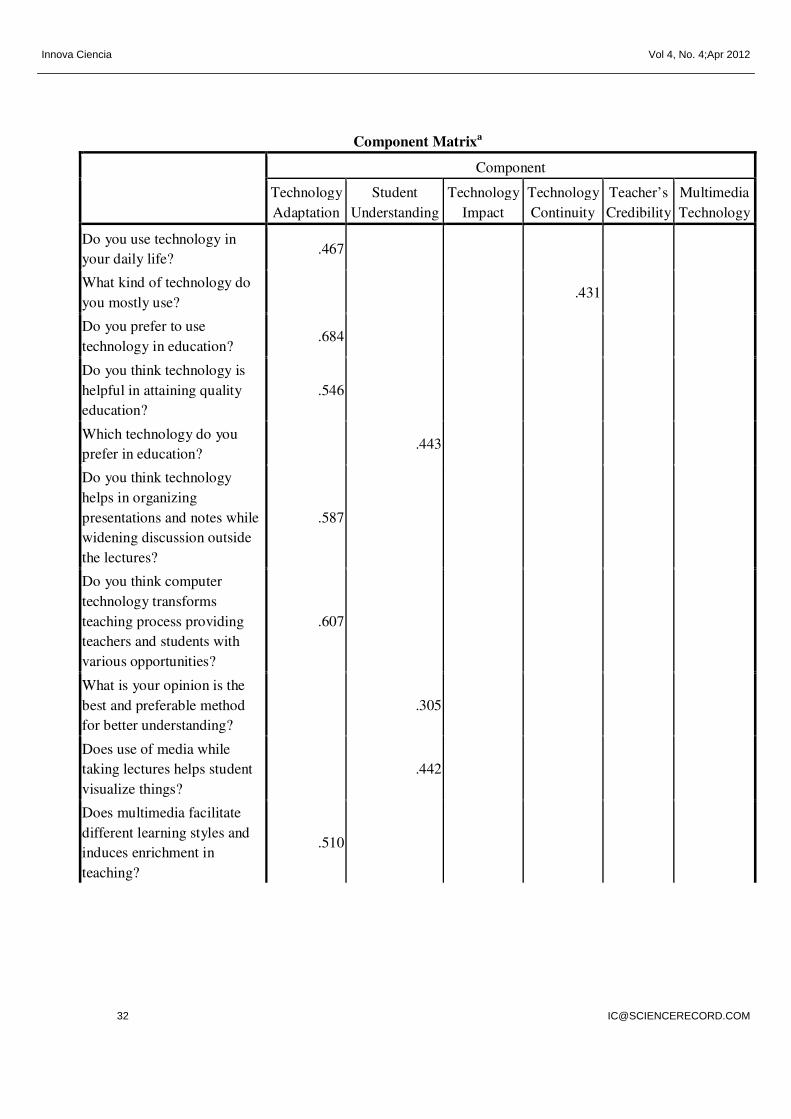
Component Matrixa
Component
Technology
Adaptation
Student
Understanding
Technology
Impact
Technology
Continuity
Teacher’s
Credibility
Multimedia
Technology
Do you use technology in
your daily life? .467
What kind of technology do
you mostly use? .431
Do you prefer to use
technology in education? .684
Do you think technology is
helpful in attaining quality
education?
.546
Which technology do you
prefer in education? .443
Do you think technology
helps in organizing
presentations and notes while
widening discussion outside
the lectures?
.587
Do you think computer
technology transforms
teaching process providing
teachers and students with
various opportunities?
.607
What is your opinion is the
best and preferable method
for better understanding?
.305
Does use of media while
taking lectures helps student
visualize things?
.442
Does multimedia facilitate
different learning styles and
induces enrichment in
teaching?
.510
Innova Ciencia Vol 4, No. 4;Apr 2012
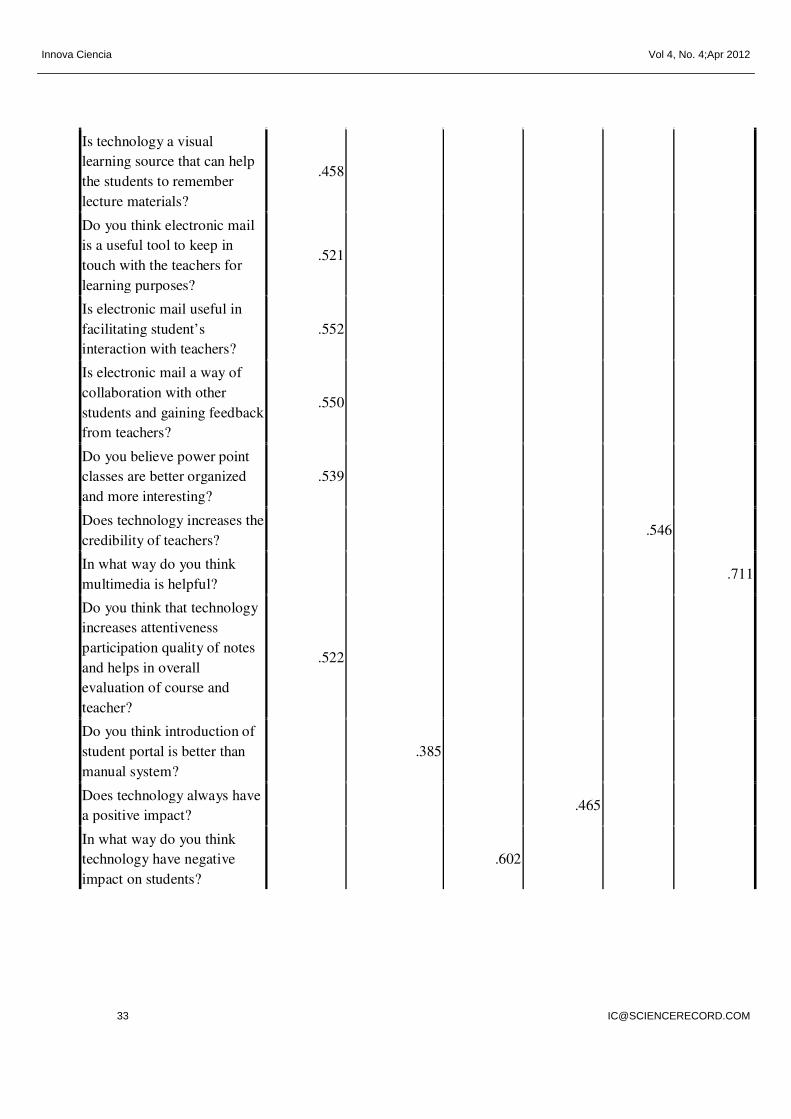
Is technology a visual
learning source that can help
the students to remember
lecture materials?
.458
Do you think electronic mail
is a useful tool to keep in
touch with the teachers for
learning purposes?
.521
Is electronic mail useful in
facilitating student’s
interaction with teachers?
.552
Is electronic mail a way of
collaboration with other
students and gaining feedback
from teachers?
.550
Do you believe power point
classes are better organized
and more interesting?
.539
Does technology increases the
credibility of teachers? .546
In what way do you think
multimedia is helpful? .711
Do you think that technology
increases attentiveness
participation quality of notes
and helps in overall
evaluation of course and
teacher?
.522
Do you think introduction of
student portal is better than
manual system?
.385
Does technology always have
a positive impact? .465
In what way do you think
technology have negative
impact on students?
.602
Innova Ciencia Vol 4, No. 4;Apr 2012
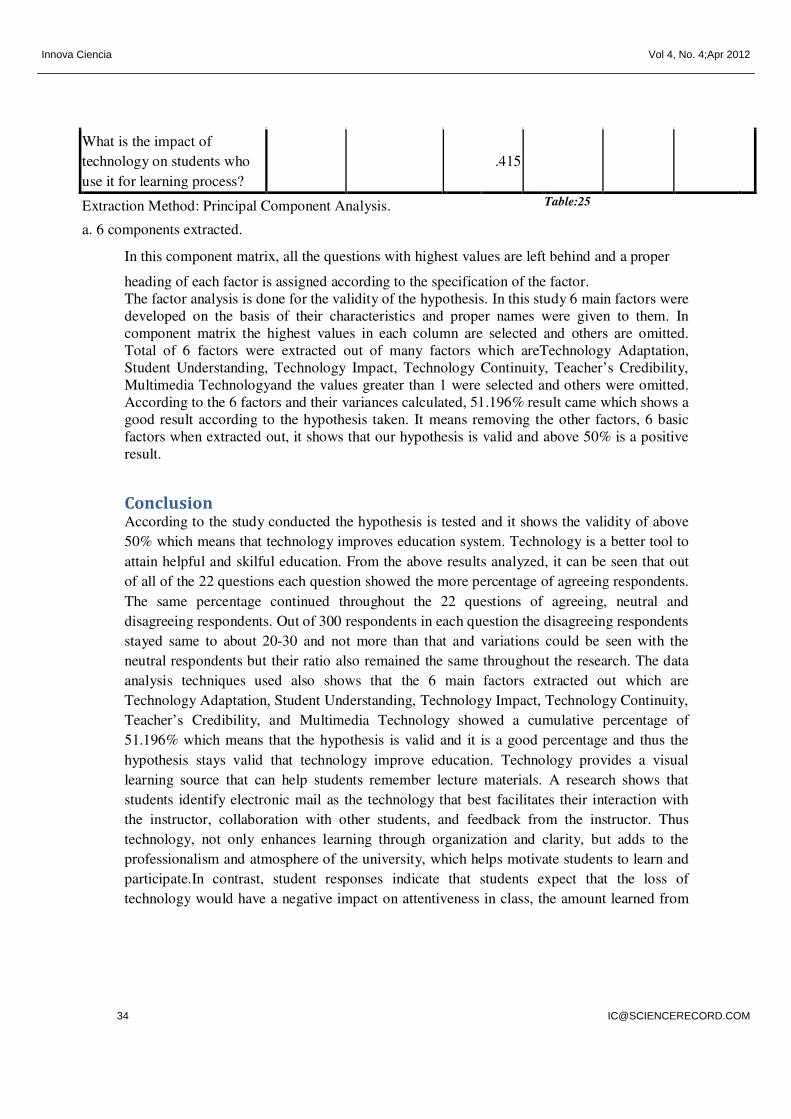
What is the impact of
technology on students who
use it for learning process?
.415
Extraction Method: Principal Component Analysis. Table:25
a. 6 components extracted.
In this component matrix, all the questions with highest values are left behind and a proper
heading of each factor is assigned according to the specification of the factor.
The factor analysis is done for the validity of the hypothesis. In this study 6 main factors were
developed on the basis of their characteristics and proper names were given to them. In
component matrix the highest values in each column are selected and others are omitted.
Total of 6 factors were extracted out of many factors which areTechnology Adaptation,
Student Understanding, Technology Impact, Technology Continuity, Teacher’s Credibility,
Multimedia Technologyand the values greater than 1 were selected and others were omitted.
According to the 6 factors and their variances calculated, 51.196% result came which shows a
good result according to the hypothesis taken. It means removing the other factors, 6 basic
factors when extracted out, it shows that our hypothesis is valid and above 50% is a positive
result.
Conclusion According to the study conducted the hypothesis is tested and it shows the validity of above
50% which means that technology improves education system. Technology is a better tool to
attain helpful and skilful education. From the above results analyzed, it can be seen that out
of all of the 22 questions each question showed the more percentage of agreeing respondents.
The same percentage continued throughout the 22 questions of agreeing, neutral and
disagreeing respondents. Out of 300 respondents in each question the disagreeing respondents
stayed same to about 20-30 and not more than that and variations could be seen with the
neutral respondents but their ratio also remained the same throughout the research. The data
analysis techniques used also shows that the 6 main factors extracted out which are
Technology Adaptation, Student Understanding, Technology Impact, Technology Continuity,
Teacher’s Credibility, and Multimedia Technology showed a cumulative percentage of
51.196% which means that the hypothesis is valid and it is a good percentage and thus the
hypothesis stays valid that technology improve education. Technology provides a visual
learning source that can help students remember lecture materials. A research shows that
students identify electronic mail as the technology that best facilitates their interaction with
the instructor, collaboration with other students, and feedback from the instructor. Thus
technology, not only enhances learning through organization and clarity, but adds to the
professionalism and atmosphere of the university, which helps motivate students to learn and
participate.In contrast, student responses indicate that students expect that the loss of
technology would have a negative impact on attentiveness in class, the amount learned from

Innova Ciencia Vol 4, No. 4;Apr 2012
class, the students’ desire to take additional classes from the particular instructor, and the
students’ desire to take additional classes in the subject matter. These results suggest that
students perceive there are specific benefits associated with technology use in the classroom.
In contrast, technology appears to have a meaningful impact on student preparation for class,
attentiveness, quality of notes taken, student participation in class, student learning, desire to
take additional classes from the instructor or in the subject matter, andthe overall evaluation
of the course and the instructor.The research is not meant to determine how effective
technology was in helping students learn or which technology might be most effective.
Rather, this research focuses on student perceptions or opinions regarding technology usage
and how adding technology to a course that does not use it or eliminating technology from a
course that does use it might impact a student’s perception of the course or the faculty
member as well as his/her behaviour.
References
iChristensen, K. (1999). A Comparison of Student Performance in Human Development
Classes Using Three Different Modes of Delivery: Online, Face-to-Face, and Combined.
Ed.D. Dissertation, Department ofeducation, Drake University.
iiSulla, N. “Technology: To Use or Infuse.” The Technology Source: Commentary,February
1999
iii Assessing the Impact of Technology on Teaching and Learning: Student Perspectives
BarbaraDraude and Sylvia Brace (2000).
ivApperson, J., Laws, E., and Scepansky, J. (2006).The Impact of Presentation Graphics on
Students’ Experience in the Classroom.Computers and Education, 47(1), pp. 116-126.
vAtkins-Sayre, W., Hopkins, S., Mohundro, S., & Sayre, W. (1998). Rewards and liabilities
of presentation software as an ancillary tool: Prison or paradise? New York, NY: National
Communication Association. (Eric Document Reproduction Service No. ED430260).
viApperson, (2006).
vii
Burbules, N. and Callister, T., Jr. (2000).Watch IT: The Promises and Risk of New
Information
Technologies for Education. Boulder, CO: Westview Press.

Innova Ciencia Vol 4, No. 4;Apr 2012
viii
Olson, L. (1998). The new basics in school-to-work.Educational Leadership, pp. 50-56.
Copyright © 2022 FDOKUMEN