
Impact of photobiomodulation on human skin melanocytes
102
Aus dem Zentrum für Medizinische Forschung der Medizinischen Fakultät Mannheim Direktor: Prof. Dr. med. Norbert Gretz (Aufgelöst zum 16.04.2020) Impact of photobiomodulation on human skin melanocytes Inauguraldissertation zur Erlangung des akademischen Grades Doctor scientiarum humanarum (Dr. sc. hum.) der Medizinischen Fakultät Mannheim der Ruprecht-Karls-Universität zu Heidelberg vorgelegt von Aparna Chauhan aus Ghaziabad, India 2020
-
Upload
khangminh22 -
Category
Documents
-
view
0 -
download
0
Transcript of Impact of photobiomodulation on human skin melanocytes

Aus dem Zentrum für Medizinische Forschung
der Medizinischen Fakultät Mannheim
Direktor: Prof. Dr. med. Norbert Gretz
(Aufgelöst zum 16.04.2020)
Impact of photobiomodulation on human skin melanocytes
Inauguraldissertation
zur Erlangung des akademischen Grades
Doctor scientiarum humanarum (Dr. sc. hum.) der
Medizinischen Fakultät Mannheim
der Ruprecht-Karls-Universität
zu
Heidelberg
vorgelegt von
Aparna Chauhan
aus
Ghaziabad, India
2020

Dekan: Prof. Dr. med. Sergij Goerdt Referent: Prof. Dr. med. Norbert Gretz

Table of Contents
1. Introduction ......................................................................................... 1
1.1 Photobiomodulation ....................................................................... 1
1.2 Human skin .................................................................................... 7
1.3 Human skin melanocytes ............................................................... 8
1.4 Blue light and optical properties of skin .......................................... 9
2. Aims of the study ............................................................................... 12
3. Material and methods ........................................................................ 13
3.1 Material ........................................................................................ 13
3.2 Methods ....................................................................................... 17
4. Results .............................................................................................. 27
4.1 Assessment of effects of different blue light irradiation time points
with corresponding doses ............................................................. 27
4.2 Influence of blue light on melanin content .................................... 30
4.3 Effect of blue light treatment on cell apoptosis ............................. 32
4.4 Blue light irradiation influences the energy metabolism level in
NHEM .......................................................................................... 34
4.5 Intracellular redox level changes inflicted by blue light ................. 35
4.6 Gene expression analysis ............................................................ 36
5. Discussion ......................................................................................... 65
5.1 Blue light doses resulted in a biphasic dose response ................. 65
5.2 Blue light induces hyperpigmentation ........................................... 66
5.3 No induction of cell death via apoptosis by blue light .................... 67
5.4 Blue lights increases ATP amount ................................................ 69
5.5 Blue light increases ROS level ..................................................... 69
5.6 AHR as a possible target for oxidative stress management from
blue light ....................................................................................... 71
5.7 Conclusion and outlook ................................................................ 73
6. Summary ........................................................................................... 75

7. References ........................................................................................ 77
8. Appendix ........................................................................................... 88
9. Curriculum vitae and Publications ..................................................... 90
Abbreviations ........................................................................................ 92
Acknowledgements ............................................................................... 97

1. Introduction - 1 -
1. Introduction
1.1 Photobiomodulation
The term photobiomodulation (PBM) is referred to as the use of visible (VIS) and
infrared (IR) spectrum of light that leads to modulation in the biological functions. It was
previously known as low-level laser (or light) therapy (LLLT) that was a well-
established and searchable MeSH term 1. In September 2014, a joint conference of
the North American Association for Light Therapy (NAALT) and the World Association
for Laser Therapy (WALT) held a nomenclature consensus meeting. In this meeting,
after the discussion about the pros and cons of several terms used for this therapy, the
term ‘Photobiomodulation Therapy’ was accepted as the new MeSH term and added
to the MeSH vocabulary for its 2016 version of the vocabulary thesaurus. As the term,
LLLT is vague because the words ‘low’ and ‘level’ are not well defined and the word
‘laser’ also is not correct anymore because of the use of other types of light sources
like light-emitting diodes (LEDs) in this field 2. The new suggested definition of PBM
therapy is as follows:
“A light therapy that utilizes non-ionizing light sources, including lasers, LEDs and
broadband light, in the visible and infrared spectrum. It is a non-thermal process
involving endogenous chromophores eliciting photophysical (i.e. linear and non-linear)
and photochemical events at various biological scales. This process results in
beneficial therapeutic outcomes including but not limited to the alleviation of pain or
inflammation, immunomodulation, and promotion of wound healing and tissue
regeneration” 3.
1.1.1 History
Sunlight is the natural source of light on the planet earth, and it has been known to
have both beneficial and detrimental effects on living beings. Hence, the use of light
therapy dates back to ancient times. However, Niels Ryberg Finsen carried out the first
pioneered work in the medical phototherapy field in the late eighteenth century 4.

1. Introduction - 2 -
He used ultraviolet (UV) radiation to treat various human ailments, especially Lupus
vulgaris. In 1895, he demonstrated the concentrated beams of UV radiation could have
bactericidal as well as stimulating the surrounding tissue and won Nobel Prize in 1903
for the same work 4. After the invention of ruby laser in 1960 and the helium-neon
(HeNe) laser in 1961 led to another milestone work by Endre Mester in 1967, at the
Semmelweis Medical University, Hungary 5. He provided the first evidence and
described the potential effect of the low-level laser therapy by applying the ruby laser
on the back of shaved mice implanted with tumour via an incision in the skin. Although
he could not cure the tumour, as an outcome of this treatment he observed a faster
rate of hair growth in the laser-treated mice as compared to non-treated controls 6. The
‘Laser Biostimulation’ term was coined due to beneficial effects of the laser treatment7.
In modern medicine, the use of this therapy gained momentum from this point onwards
and since then, several studies have been carried out to assess the effects of light.
Also progress in this field led to the development of many other light devices, for
example, non-coherent LEDs. As a result, different terms came into existence like low-
level laser (or light) therapy, low-intensity laser therapy, low-power laser therapy, cold
laser, soft laser, photobiostimulation and photobiomodulation 3. The most commonly
used was LLLT and due to this having an ambiguous definition, the term
‘Photobiomodulation’ or ‘Photobiomodulation Therapy’ was accepted.
1.1.2 Irradiation parameters
The irradiation parameters and the doses applied are very basic and critical
specifications in the light therapy field. The biggest concern in this field is improper
reporting of the irradiation parameters, which affects the reproducibility and reliability
of the experimental outcome obtained from one group to validate the results by
another8. The most important parameters are listed in Table 1.

1. Introduction - 3 -
Table 1. List of the irradiation parameters
Irradiation parameter Measurement unit
Wavelength nm
Irradiance W/cm2 (or mW/cm2)
Energy density J/cm2
Irradiation time s
Operating mode Continuous or pulsed
Among the important parameters, wavelength (λ) of the light is defined as the length
of a full oscillation of the wave. It is the most fundamental parameter for studying the
effects of different colours of visible light on the living organisms. Light is part of the
electromagnetic spectrum, which constitutes the range from gamma rays to
radiowaves 9, as shown in Figure 1.
Figure 1. The electromagnetic spectrum. Complete electromagnetic spectrum with spectral sub-
division including the visible light spectrum 10.
Next, irradiance is the intensity of the radiation incident on a patient (or an object). It is
also known as power density, where it corresponds to power (W) divided by the area
(in per cm2).
Another very essential specification include energy density, which is an important
descriptor of the dose and defined as the time integral of the irradiance (unit: J/cm2) 11.

1. Introduction - 4 -
1.1.3 Mechanism of action
The effectiveness of any kind of applied therapy or medicine holds the key to its
mechanism of action. The use of PBM still as an alternative treatment is in fact due to
lack of understanding of complete biochemical mechanisms. According to the first law
of photobiology, also called Grotthus-Draper law, light must be absorbed by the system
for a biologic effect to take place. Moreover, this could include some molecular
photoacceptors or chromophores 12. Numerous chromophores and photoacceptors
can be found in the living system, for example, chlorophyll, haemoglobin, cytochrome
C oxidase (Cox), myoglobin, flavins, flavoproteins, porphyrins 13. Also endogenous
nucleic acids, aromatic amino acids, tryptophan, tyrosine, melanin and melanin
precursors, bilirubin, β-carotene or water molecules are photoacceptors 14, 15. The
primary and secondary mechanisms of action of visible and near-infrared (NIR) have
been summarized by Karu, T. et al., 1999 13, 16. They are as follow: First,
photoexcitation of the electronic states of the components of the respiratory chain can
alter their redox properties via an acceleration of electron transfer. Second, during the
process of photoexcitation, a certain amount of excitation energy is converted to heat
and this enhances the local temperature of the absorbing chromophore. As a result, a
conformational change occurs, and this possibly triggers the biochemical reactions like
activation or inhibition of enzymes. Third, secondary messenger like H2O2 or reactive
oxygen species (ROS) like O2•- change the redox potential of mitochondria and/or the
redox status of the cell. Fourth, some photoabsorbing molecules, for example,
porphyrin and flavoproteins can be reversibly converted to photosensitizers, which
transfer the energy to adjacent molecules. These changes activate molecules
responsible for cellular homeostasis and initiate a series of biochemical reactions,
which might be involved in further promoting the secondary responses. Furthermore,
the effects of light on respiration are oxygen-dependent.
The photodynamic reactions are stimulated by certain respiratory chain components
that include flavins, hemes and Fe-S centres 17, 18 and a classic example that has been
extensively studied and reported include cytochrome C oxidase 19, 20.

1. Introduction - 5 -
1.1.4 Clinical applications
PBM is known to have a wide range of clinical applications, which are mainly involved
in stimulating, healing and restoration. These applications have emerged in diverse
medical fields, ranging from dermatology, to dentistry, to rheumatology and
physiotherapy, as summarized in Figure 2.
Figure 2. Summarized clinical applications of PBM 21, 22, 9.
Besides, there are several devices based on these clinical applications. Table 2 lists
some devices used in dermatology which are manufactured by different companies.
PBM
Wound healing
Arthritis
Psoriasis
Alopecia areata
Thyroiditis
Muscle damage
Major depression and anxiety
Traumatic brain injury
Stroke
Spinal cord injury
Cancer
Acne
Anti-aging
Pigmentary disorders

1. Introduction - 6 -
Table 2. Examples of PBMT devices used for dermatological applications 22
Supplier Product
Name Wavelength (nm)
Power
Density
(mW/cm2)
Standard
Dose
(J/cm2)
Application
PhotoMedex
(Manchester,
UK)
Omnilux
415 (±5)
633 (±6)
830 (±5)
40
105
55
48
126
66
Acne, photodamage,
nonmelanoma skin
cancers, skin
rejuvenation,
vitiligo, and wound
healing after
elective surgery
Edge
Systems
(Signal
Hill, CA)
Delphia del Sol
420
600-700
700-1000
7.4 J per
treatment
area
Acne, improving skin
texture, firmness
and resilience,
increasing
lymphatic system
activity, fine lines,
wrinkles, and
superficial
hyperpigmentation
Flip 4 (Sainte-
Julie,
Quebec,
Canada)
Max7 420-700
≤4
Acne, rejuvenation
and injured skin
healing, including
the shortening of
the post-skin
resurfacing
erythema duration
Light
BioSciences
(Virginia
Beach, VA)
Gentlewaves 588 (10) Variable
Antiaging
OPUSMED
(Montreal,
Canada)
LumiPhase-R 660 150 Skin firmness, rhytid
depth, and wrinkles
Revitalight
(Chicago, IL)
Revitalight 747
Hand Spa
Food Spa
Evolution
420
590
625
940
80
80
80
80
7.2 J per
90 s per
treatment
area
Fine lines, wrinkles,
and age spots on
the face, neck, and
hands
Soli-Tone
(Woburn, MA)
LumiFacial
Lumilift
470
525
590
640
84
27
10
89
Acne, antiaging,
hyperpigmentation,
and rosacea
DUSA
(Wilmington,
MA)
BLU-U 417 10
Acne
Curelight
(Rehovot,
Israel)
iClearXL
Clear100XL
405-420
890-900
60
Acne, antiaging, skin
rejuvenation,
acceleration of
healing of post
peel, and
postsurgical suture
sites
Lumenis
(Santa Clara,
CA)
ClearLight
Clear100 405-420 200 60 Acne
Lightwave
Technologies
(Phoneix,
AZ)
Lightwave
Professional
Deluxe LED
System
417
630
880
Antiaging and skin
rejuvenation
Dynatronics
(Salt Lake
City, UT)
Synergie LT2 660
880
500 mW
(total
power)
6 J per
treatment
area
Antiaging, skin
firmness, wrinkles,
skin tone, and
texture for face and
neck

1. Introduction - 7 -
1.2 Human skin
The skin is referred as the largest organ in the human body and consists for a surface
area of 1.5-1.8 m2. It is 1.5-4mm thick and accounts for approximately 15% of the total
adult body weight 23, 24. It serves as the physical barrier for the host body by protecting
against chemical, mechanical and microbial factors 23. Likewise, other key functions
include sensation, prevention of water loss from the body as well as thermoregulation
25, 26. The skin is divided into three layers (from top to bottom), the epidermis, the
dermis and the hypodermis (or the subcutaneous layer) 26 (Figure 3).
Figure 3. The human skin. Schematic diagram showing the different layers of human skin 27.
The epidermis is the superficial and stratified layer, where the epithelium is being
continuously renewed. It is composed of different cell types, namely keratinocytes,
melanocytes, Langerhans cells and Merkel cells. All these cells densely pack the
epidermis to a depth of 75-150 µm (up to 600 µm thick on the soles and palms). The
keratinocytes (constitute 90-95%) are either self-replicating in the basal layer or
differentiating towards the upper layer, also known as cornification and via this
sequential process the epidermis is divided into four distinct layers 28. Whereas the
rest of the epidermis is made up of melanocytes, Langerhans cells and Merkel cells.
On the other hand, dermis has a thickness of <2mm and gives mechanical strength to
the skin. It is further divided into superficial papillary dermis and deeper reticular dermis
29. It mainly comprises of collagen, elastin, glycosaminoglycans, which collectively form
the extracellular-matrix (ECM) as well as fibroblasts. Also, the hypodermis consists of

1. Introduction - 8 -
loose connective tissue, rich in adipose tissue that insulates and protects the skin 28,
30.
1.3 Human skin melanocytes
In the human skin, the melanocytes are dendritic cells located in the lower most layer
of the skin epidermis as illustrated in Figure 4, as well as hair follicles 31. Their origin is
from the embryonic cells called neural crest cells 32. The principle function of these
cells are their ability to produce the pigment termed melanin, hence responsible for the
pigmentation of skin 33. The pigment melanin is formed in specialised membrane-
bound organelles named melanosomes and these are transferred via their dendrites
to the neighbouring keratinocytes 34, known to protect against UV 35, 36. The ratio of
melanocyte to keratinocytes is 1:10 in the basal layer of the epidermis and this balance
is maintained through the human live but the exact mechanism is unknown 37.
Approximately 1200 melanocytes exist per mm2 of the skin irrespective of the human
race 38. Melanocyte biology is influenced by paracrine factors from both keratinocytes
as well as fibroblasts.
Figure 4. Skin epidermis. Schematic showing different layers of the epidermis of skin with keratinocytes and melanocyte.
Briefly, the synthesis of melanin is a complex biochemical process known as
melanogenesis 39. Two different types of melanin are produced by melanocytes:
pheomelanin and eumelanin, which differ in their colour and the mode of synthesis.

1. Introduction - 9 -
Melanin production is known to be regulated by various factors, foremost by UV as well
as many hormones and other extrinsic factors 40.
1.4 Blue light and optical properties of skin
Blue light (400-500 nm) is a major portion of the visible light spectrum (Figure 1). It has
relatively high energy due to its shorter wavelength range. The use of blue light has
been a bit debatable, firstly, due to its proximity with UV radiation (UV-C: ~100-280
nm, UV-B: ~280-315 nm and UV-A: ~315-400 nm), which is known for its cytotoxic
effects like DNA damage and mutagenesis 41, 42. Secondly, due to low penetration
depth through the tissue in comparison to red or NIR light. It has a penetration depth
of ~1 mm into the skin 43 (Figure 5).
Figure 5. Light penetration depth into the skin. Penetration depth of different wavelengths of light
into human skin 43.
Skin is the primary target organ for exposure to natural or artificial light in comparison
to the other organs of the human body. As the photons of light strike the skin surface,
they are either reflected, scattered or absorbed. Molecules known as chromophores
absorb these radiations, which results in a photochemical reactions and hence

1. Introduction - 10 -
activating the downstream processes 44. The identified photoreceptors (chromophores)
include flavins, porphyrins, opsins and nitrosated proteins 45.
Blue light has been shown to have harmful effects like age-related macular
degeneration or induction of cataract formation in the eye lens 46. Despite this, there is
a major chunk of literature, which have reported beneficial effects of this wavelength
of light. Some effects of blue light reported recently in literature have been summarized
in Table 3.
Table 3. Summary of the literature with blue light effects.
Year Author Model system
(cell/tissue/organ) Parameters Conclusion
2009 Kleinpenning, M. M. et al. 47
Human skin λ=420 nm
Dose: 20 J/cm2 per day
Transient melanogenesis
2010 Kushibiki, T. et
al. 48 Prechondrogenic
cells
λ=405 nm Irradiance: 100
mW/cm2
Time: 180 s
Increase in intracellular ROS
2012 Lavi, R. et al. 49 Sperm membrane λ=400-505 nm Dose: 20 J/cm2
Increase in ROS production
2013 Kushibiki, T. et
al. 50
3T3-L1, ATDC5, C2C12, KUSA-A1, LLC, MIN6, NIH-
3T3, HeLa, THP-1 & RBL-2H3
λ=405 nm Irradiance: 100
mW/cm2
Time: 60-120 s
Increase in intracellular ROS in all cell types
2013 Buravlev, E.A.,
et al. 51 Rat liver
mitochondria λ=442 nm
Dose: 6 J/cm2
Increase in mitochondrial
respiration by 40%
2014 Duteil, L. et al.
52 Human skin
λ=415 nm Dose: 87.5
J/cm2 Hyperpigmentation

1. Introduction - 11 -
2015 AlGhamdi, K. M.
et al. 53 Human epidermal
melanocytes
λ=457 nm Dose: 0.5-5.0
J/cm2
Increase in cell viability at 0.5-2.0 J/cm2)
2016 AlGhamdi, K. M.
et al. 54 Human epidermal
melanocytes
λ=457 nm Dose: 2.0
J/cm2
Increase in stage 1 melanosome
2017 D. Bennet, et al.
55
Human epidermal keratinocytes, melanocytes,
fibroblasts
λ=460 nm Dose: 0.2-300
mJ/cm2
Effect of different color light on cellular functions. May contribute to
premature aging.
2017 Yuan, Y., et al.
56
Bone marrow-derived
mesenchymal stem cells (BMSCs)
λ=470 nm Irradiance: 20
mW/cm2
Time: 60-3600 s
Inhibition of osteogenic differentiation,
induction of apoptosis due to increase in
ROS and DNA damage
2017 Nakashima, Y.,
et al. 57 Mouse skin
λ=460 nm Irradiance:
133mW/cm2 Time: 5s
Duty cycle: 50%
Induction of oxidative stress
2018 C. Regazzetti,
et al. 58 Human
melanocytes
λ=415 nm and λ=465 nm
Dose: 50-62.5 J/cm2
Hyperpigmentation
2018 Mignon et al. 59 Human reticular
and dermal fibroblasts
λ=450 nm Dose: 30 J/cm2
Reduction in cell metabolic activity by 50%

2. Aims of the study - 12 -
2. Aims of the study
The main objective of this dissertation was to investigate the impact of PBM using blue
light on human skin melanocytes. The intensity and different doses were studied to
optimize and create an effective irradiation cycle. Also, the induced biological effects
were analyzed on the metabolic and gene expression level in detail, thereby
determining possible side effects to keep them to a minimum.
The key cellular processes were studied to understand the impact of PBM using blue
light on melanocytes: The following factors were analysed:
1. Assessing different irradiation time points and corresponding doses on
melanocytes.
2. Changes in the pigmentation level induced by blue light dose.
3. Effects on the cellular apoptosis as a marker of cytotoxicity.
4. Evaluation of ATP level as a status of cellular metabolism.
5. Status of reactive oxygen species inside the cellular environment to bring further
changes in the downstream signalling processes.
6. Lastly, with the help of gene expression profiling revealing the gene and
pathway networks induced by the respective dose and wavelength used in this
project to shed light on the possible application(s).

3. Material and methods - 13 -
3. Material and methods
3.1 Material
3.1.1 Cell Line
The primary cells named Normal Human Epidermal Melanocyte (NHEM) were
obtained cryopreserved at passage 2 from PromoCell GmbH, Heidelberg, Germany.
NHEM were obtained from donors with lightly, moderately and darkly pigmented skin.
These cells were isolated from juvenile foreskin and from different body parts, for
example face, breast, abdomen and thighs, culturing the cells in serum-free and PMA-
free Melanocyte Growth Medium M2.
NHEM have a star-like morphology with long elongated dendrites, more than one per
cell (Figure 6).
Figure 6. Normal human epidermal melanocytes (NHEM) morphology in passage 4. Image captured
using a brightfield microscope with 10x magnificantion in phase contrast.

3. Material and methods - 14 -
3.1.2 Light source
A BioLight LED lamp provided by Philips Research, Eindhoven, Netherlands was used
to irradiate NHEM. The setup consisted of the lamp unit, current modulator, main power
supplies and fan (Figure 7).
(A) (B)
Figure 7. Bio-Light LED blue lamp set-up. (A) The experimental setup used for the blue light irradiation
of NHEM in vitro. (B) LED apertures covered with lenses.
The light source comprised of two main power supplies, one delivered a direct current
of 1A at 300V and another one powered the fan with a direct current of 0.1A and a
fixed voltage of 24V in order to provide protection against overheating. The illumination
field composed of LEDs (LUXEON Rebel LXML-PR01-0275 (blue) from Lumileds
(Amsterdam, Netherlands) was covered by a set of lenses. The current modulator
enabled pulsed driving of the LEDs. The radiation source provided a homogeneous
blue light with a peak wavelength at 453 nm at a central irradiance of 12 mW/cm2 at a
distance of 50 mm. The maximum time-averaged emittance was 100 mW/cm2 that
corresponded to 15 W for the 10 cm X 15 cm emission aperture and the maximum
peak emittance was equivalent to 350 mW/cm2. According to the company’s
specification, the LED device delivered a fixed irradiance of 23 mW/cm2 at the surface
of the cell culture plates kept at a distance of 5 cm. The irradiation field was 150 cm2
(Figure 8).

3. Material and methods - 15 -
(A) (B)
Figure 8. Bio-Light LED blue lamp specification. (A) homogeneous distribution of the light from
casing at a distance of 50mm (B) emission spectrum at 12 mW/cm2 irradiance with peak wavelength at
453 nm.
All the experiments were performed with continuous irradiation with a duty cycle of
100%. 96-well and 6-well plates were irradiated using this set-up.
Also, before each irradiation cycle for an experiment, the LEDs were pre-run to stabilize
the output.
3.1.3 Redox sensor
For reactive oxygen species measurement, lentivirus particles with a redox sensor
(Grx1-roGFP3) were utilized from our collaborator, Dr Prama Pallavi, Department of
Vascular Surgery, Medical Faculty of Mannheim, Mannheim, Germany.
Figure 9. Redox sensor. Schematic illustration explaining the principle of the functioning of redox
senosr (unpublished data, Courtesy: Dr. Prama Pallavi).

3. Material and methods - 16 -
3.1.4 Reagents and kits
Product Company
Colorimetric Cell Viability Kit III (XTT)
PromokineTM by PromoCell GmbH, Heidelberg, Germany
CellTiter-Glo® Luminescent Cell Viability Assay
Promega Corporation, Madison, WI, USA
FITC Annexin V Apoptosis Detection Kit with PI
BioLegend, San Diego, CA
Cell Staining Buffer BioLegend, San Diego, CA
Purified Annexin V BioLegend, San Diego, CA
Staurosporine (Streptomyces staurosporeus)
Sigma Aldrich, St. Louis, MO, USA
RNeasy mini kit Qiagen, Hilden, Germany
RNase-Free DNase set Qiagen, Hilden, Germany
Sodium hydroxide Sigma Aldrich, St. Louis, MO, USA
Ethanol, ROTIPURAN®, > 99.8%, p.a.
Carl Roth GmbH & Co. KG, Karlsruhe, Germany
2-Mercaptoethanol Sigma Aldrich, St. Louis, MO, USA
2-Propanol, ROTIPURAN®, > 99.8%, p.a.
Carl Roth GmbH & Co. KG, Karlsruhe, Germany
3.1.5 Cell culture reagents
Product Company
Melanocyte Growth Medium M2 PromoCell GmbH, Heidelberg, Germany
SupplementMix, Melanocyte Growth Medium M2
PromoCell GmbH, Heidelberg, Germany
Phosphate buffer saline Gibco™ by Thermo Fisher Scientific, Waltham, MA, USA
Cryo-SFM PromoCell GmbH, Heidelberg, Germany
Trypan Blue stain (0.4%) Gibco™ by Thermo Fisher Scientific, Waltham, MA, USA
0.25% Trypsin-EDTA (1x) Gibco™ by Thermo Fisher Scientific, Waltham, MA, USA
Phosphate Buffer Saline Sigma Aldrich, St. Louis, MO, USA
Melanin Synthetic Sigma Aldrich, St. Louis, MO, USA

3. Material and methods - 17 -
3.1.6 Devices
Product Description Company
BioLight LED Lamp with Lumileds LUXEON Rebel LXML-PR01-0275
Philips Electronics Nederland B.V. Philips Research, Eindhoven, Netherlands Koninklijke Philips N.V., Eindhoven, Netherlands
Microplate reader, Spark® 10M Tecan Austria GmbH, Grödig, Austria
Leica DM IRB, IRBE Leica Mikroskopie & Systeme GmbH, Wetzlar, Germany
Flow cytometer, BD FACSCanto™ II BD Biosciences, San Jose, CA, USA
NanoQuant plate™ Tecan Austria GmbH, Grödig, Austria
Agilent 2100 Bioanalyzer Agilent Technologies, Santa Clara, CA, USA
3.1.7 Softwares
Analysis Software Source
SparkControl, version 1.2 Tecan Austria GmbH, Grödig, Austria
JMP® Genomics, version 7.1 SAS Institute Inc., Cary, NC, USA
BD FACSDiva, version V8.0.1 BD Biosciences, San Jose, CA, USA
Fiji, Image processing package of ImageJ
Free software for image analysis
ZEN 2 pro Carl Zeiss AG, Oberkochen, Germany
3.2 Methods
3.2.1 Cell culture
The human primary melanocytes, NHEM-lightly, moderately and darkly pigmented
(Promocell GmbH) were cultured in Melanocyte growth medium M2 with an addition of
Melanocytes supplement mix M2.
All the cells were maintained under the standard condition in a humidified incubator at
37°C in 5% CO2. Cells were thawed rapidly in a 37°C water bath, then suspended in
pre-warmed medium and seeded in a T-75 flask. At a confluence of 70%-90% the cells
were sub-cultured after washing twice with PBS and 0.05% trypsin EDTA (in PBS) was
used to detach the cells and neutralized using 10% FBS in Melanocyte growth medium
M2. The cell suspension was centrifuged at 220Xg for 3 minutes. The supernatant was
removed and cells were suspended in fresh medium and after counting the cells, they
were seeded in the respective flask.

3. Material and methods - 18 -
For the preparation of freeze-downs, the cells were detached in the same way as
explained above and cell number-1X10⁶ cells per cryovial were used. Cell suspension
in the fresh medium was centrifuged and the cell pellet was suspended in freezing
medium known as Cryo-SFM. Aliquots of this cell suspension were prepared in
cryovials, placed in isopropanol chamber and stored at -80°C overnight. The frozen
cells were transferred the next day to liquid nitrogen.
For the study, cells from three skin phototypes were seeded in 96-well black plate with
a clear bottom in triplicates. Black well plates were incorporated into the study to avoid
the cross-link of light between the wells.
The cells were seeded in a concentration of 6000/well and 5500/well for 24 hours and
48 hours of harvesting time post-irradiation, respectively and in triplicates with three
repetitions performed in all the experiments.
3.2.2 Light treatment
24 hours after seeding, the medium was renewed and plates were incubated for 30
minutes before irradiation for the cells to be stabilized to the new supply of nutrients in
fresh medium. A special plate lid (Figure 10) was used during the light treatment which
was divided into two halves using an aluminium sheet to cover one half to have the
untreated control and treated part in the same plate to avoid a plate effect.
Figure 10. Special lid for irradiation. Plate lid used for 96-Well plate while irradiation.

3. Material and methods - 19 -
Different irradiation doses of blue light were studied on melanocytes outside the
incubator and at room temperature. The plates were maintained at a distance of 5cm
under the LED casing. The lamp operated at a steady level of 23 mW/cm2 of irradiance
at the surface of plates used. Taking into consideration the power loss due to light
absorption by the black well plate, the lid and medium correspond to approximately
50%, this reduced the irradiance level to 12 mW/cm2 60.
Accordingly, the respective doses of blue light for the irradiation time have been listed
in Table 4. As the irradiance of the lamp was fixed, the dose amount was modulated
with the change in the time duration of irradiation.
Table 4: Different irradiation times (min) with respective doses (J/cm2). The list of irradiation time-
points and corresponding doses used for the initial testing on NHEM.
Time (min) Dose (J/cm2)
0 0
2.5 1.8
5 3.6
7.5 5.4
10 7.2
15 10.8
20 14.4
30 21.6
60 43.2
90 64.8
3.2.3 Cell metabolism assay
The metabolic activity of the cells post-irradiation was measured using the colorimetric
Cell Viability Kit III (XTT) from PromoKine (PromoCell GmbH). The kit consists of the
XTT reagent and activation reagent-PMS (N-methyl dibenzopyrazine methyl sulfate).
This assay measures an integrated set of enzyme activities that are related in various
ways to cell metabolism. NADH is utilized as a cofactor by metabolically active cells

3. Material and methods - 20 -
and contributes to the reduction of the tetrazolium salt XTT in the presence of PMS to
the orange colored formazan compound.
This dye is water-soluble and the intensity of this dye is proportional to the amount of
metabolically active or viable cells. After the respective treatment and depending on
the harvesting time point, a reaction solution of XTT and the activation reagent (1:200)
was added to the medium in cell culture plates and incubated for 1 hour at 37°C at 5%
CO2.
The same reaction mixture was also added to the row with the only medium which
serves as chemical blank in the same plate. The absorbance intensities were
measured using Spark® 10M microplate reader (Tecan Austria GmbH) at 450nm with
a reference wavelength of 690nm.
3.2.4 Melanin content quantification assay
To quantify the melanin content after blue light treatment, 6-well plates were used as
a higher number of cells is required for this assay. Melanin assay was performed using
the standard protocol (Gruber and Holtz, 2013) with minor modifications. First, cells
were trypsinized and counted. Then, cells (500,000) were collected in fresh tubes and
centrifuged at 1000 rcf for 5 min. Next, media was removed from the tubes and cells
were lysed with 1N NaOH at 80°C for 2 hours. After the incubation period, the lysate
was centrifuged at 12,000 rcf for 10 min. The supernatant was collected and
transferred to fresh 96-well transparent, clear bottom plates in duplicates. Absorbance
values were measured at 405nm. Melanin content was determined using the standard
curve obtained from synthetic melanin (Figure 11).

3. Material and methods - 21 -
Figure 11. Standard curve obtained from synthetic melanin. Standard curve was obtained with a
standard series of 0.0041 mg/ml-0.33 mg/ml.
A standard stock solution (1 mg/ml) was prepared by dissolving synthetic melanin with
1N NaOH. A melanin standard curve was developed from the standard stock solution
of 1 mg/ml ranging from 0.0041 mg/ml-0.33 mg/ml.
3.2.5 Cell apoptosis-FACS analysis
To assess whether blue light induces cell apoptosis, Fluorescence-activated cell
sorting (FACS) technique was incorporated for the study. Wherein cells post-irradiation
were detached using trypsin and stained using the FITC Annexin V Apoptosis
Detection Kit with PI. Staurosporine (1 µm) was used to induce apoptosis in the cells.
This approach was used for a positive control. Cells were incubated in Staurosporine
for 4 hours at 37°C at 5% CO2. Blocking control was prepared by staining with Annexin
V pure (5 µl) and further stained as described below.
To evaluate the level of apoptosis after blue light, the treated and untreated cells were
firstly trypsinized and washed twice with cell staining buffer. After washing, the cells
were resuspended in Annexin V binding buffer (1ml). Then, they were stained with 1µl
of FITC (1:10) and followed by 2.5 µl of PI (staining details in Table 5). The cells were
vortexed and incubated for 15 minutes in dark at room temperature. After incubation,
100 µl of stained cell suspension was added to 5 ml FACS tubes and 400 µl of Annexin
V binding buffer was added. The analysis was done using pre-adjusted BD

3. Material and methods - 22 -
FACSCanto™ II, where 10,000 events were recorded per sample and data analysis
was performed using BD FACS Diva software.
Table 5: FACS staining details for different controls and samples. Summary of tubes stained with
necessary controls and treated and non-treated samples.
Tube type Cell type Annexin V pure
FITC Annexin V
PI
Unstained NHEM - - -
Blocking control NHEM + + +
Stained treated NHEM+light treatment - + +
Stained untreated NHEM+no light treatment - + +
Positive control-apoptosis
NHEM+staurosporine - + -
Positive control-necrosis
NHEM (After staining incubated in sonicator for 1-2 min.)
- - +
3.2.6 ATP measurement assay
ATP quantitation, an indicator of metabolically active cells was performed using the
CellTiter-Glo® Luminescent Cell Viability Kit (Promega Corporation).
CellTiter-Glo® substrate and CellTiter-Glo® buffer are mixed to form the CellTiter-Glo®
reagent, this reagent is added to cell culture plates after irradiation. Afterwards, the
shaking was performed for 2 minutes followed by incubation at RT for 10 minutes.
Then, the contents of each well was mixed by pipetting up and down and transferred
to the 96-well white, opaque-walled, clear bottom plate. Luminescence was recorded
using the Spark® 10M microplate reader with an integration time of 500 ms. The
luminescent signal is supposed to be directly proportional to the ATP amount present
in cells, representing the count of viable and thus metabolically active cells. Upon
mono-oxygenation of luciferin, light and oxyluciferin are formed, which is catalyzed by
Ultra-Glo™ Recombinant Luciferase in the presence of ATP, Mg2+ and molecular
oxygen.
3.2.7 Reactive Oxygen Species measurement
The generation of ROS was measured by incorporating a redox sensor. The redox
sensor is a fusion of GRX1-roGFP3 tag.

3. Material and methods - 23 -
The lentivirus particles with the sensor were transduced into the cells on day 1 in T-25
flask (approximately 60% confluency). Next day the medium was changed and once
the confluence of 80-90%, was achieved the cells were trypsinized and seeded in a
bigger flask for obtaining cells in a larger amount for the experiment. At a confluence
of 80%-90% the cells were seeded in 96-black well plates and after 24 hours of seeding
the cells were irradiated after a medium change.
The fluorescence signal was measured at different harvesting time points: 0, 0.5, 1, 2,
3, 4, 5, 6, 24, 48 hours. Two excitation wavelengths were 395 nm and 485 nm and the
emission wavelength was 510 nm.
3.2.8 Gene expression analysis
3.2.8.1 RNA Isolation
48 hours after irradiation cells were harvested and RNA was isolated from melanocytes
using RNeasy mini kit (Qiagen).
The protocol from the manufacturer was followed. The medium was removed from the
cell culture plates and washed twice with PBS. Then, a working solution of Buffer RLT
with β-ME (10 µl β-ME per 1 ml Buffer RLT) was added to the wells to lyse the cells.
The lysate was disrupted and homogenized using a tip. The content was transferred
to 2 ml tubes and 1 volume of 70% ethanol was added to the lysate. Then it was mixed
by pipetting and 700 µl of the sample was transferred to an RNeasy spin column placed
in a 2 ml collection tube. The tubes were centrifuged for 15 s at ≥8000 x g (≥10,000
rpm) and the flow-through was discarded. Now, 350 µl of Buffer RW1 was added to
the RNeasy spin column and tubes were centrifuged for 15 s at ≥8000 x g (≥10,000
rpm) to wash the spin column membrane. The flow-through was discarded. On-column
DNase digestion was performed to eliminate the genomic DNA contamination by
adding a mix of 10 µl of DNase I stock solution (10 µl of aliquots prepared by dissolving
the lyophilized DNase I in 550 µl of the RNAse-free water) with 70 µl Buffer RDD onto
the RNeasy spin column and incubated for 15minutes at room temperature.
Afterwards, again 350 µl of Buffer RW1 was added to the RNeasy spin column and
tubes were centrifuged for 15 s at ≥8000 x g (≥10,000 rpm) to wash the spin column
membrane. The flow-through was discarded. Further washing of the membrane was

3. Material and methods - 24 -
done using 500 µl Buffer RPE and again the tubes were centrifuged for 15 s at ≥8000
x g (≥10,000 rpm). A second washing step included the addition of 500 µl Buffer RPE
and the tubes were centrifuged for 2 minutes at ≥8000 x g (≥10,000 rpm) to ensure the
spin column membrane dries well and that no ethanol is carried over during RNA
elution. As residual ethanol may interfere with downstream reactions. To eliminate any
possible carryover of Buffer RPE, or if residual flow-through remains on the outside of
the RNeasy spin column after the last step, the RNeasy spin column was placed in a
new 2 ml collection tube and centrifuged at full speed for 1 min. Now, the RNeasy spin
column was placed in a new 1.5 ml collection tube. 30 µl of RNAse-free water was
added directly to the spin column membrane and centrifuged for 1 min at ≥8000 x g
(≥10,000 rpm) to elute the RNA. The RNA samples were transferred on ice (4°C) and
took for nanodrop quantification.
3.2.8.2 RNA quantification and quality control
The extracted RNA samples were quantified by nucleic acid quantification analysis
using the Spark® 10M microplate reader. In addition to the concentration, RNA purity
was determined by measuring the absorbance ratio at A260/280 with acceptable
values of 1.7 – 2.1.
Furthermore, the RNA integrity was assessed by capillary electrophoresis on an
Agilent 2100 Bioanalyzer (Agilent Technologies) providing the read-outs as the RNA
Integrity Number (RIN), with RIN≥7.0 indicating sufficient RNA quality.
3.2.8.3 RNA sequencing
RNA samples were sent for RNA sequencing to BGI, Tech Solution, Co. Limited,
Hongkong with sample requirements including the concentration of 10-1000 ng/µl,
RIN≥7.0, 28s/18s≥1.0, also baseline is smooth; 5s is normal and there is no DNA or
protein contamination in the sample. As a first step, the samples went through the
company’s quality control check wherein all the samples were qualified and following
this procedure, the RNA samples proceeded for RNA sequencing.

3. Material and methods - 25 -
3.2.8.4 RNA sequence analysis
RNA sequencing data was analyzed using R and Bioconductor using NGS analysis
package systempipeR 61. Quality control of raw sequencing was done using FastQC
(Babraham Bioinformatics). Low-quality reads were removed using trim-galore,
version 0.6.4. The resulting reads were aligned to human genome version
GRCh38.p13 from Genecode and counted using Kallisto version 0.46.1 62. The
counted data were transformed to log2-counts per million (log CPM) using the voom-
function from the limma package in R. A false positive rate of α = 0.05 with FDR
(adjusted p-value) correction was considered as the level of significance.
Volcano plots and heatmaps were created using ggplot2 package, version 2.2.1 and
the complex Heatmap, version 2.0.0 63. The pathway analysis was made with fgsea
package 64 and the enrichment browser package 65 in R using the pathway information
from the public database KEGG (https://www.genome.jp/kegg/pathway.html).
For Gene expression analysis, Fisher’s exact test was also applied.
miRWalk (http://mirwalk.umm.uni-heidelberg.de/) database was used for searching the
possible target genes for the significant miRNAs in RNA sequence data. The search
strategy is outlined in the Fig 12 and followed from Dweep, H. et al.66 with minor
changes.
Figure 12. Outline of the search strategy. Search strategy applied for predicting the possible target
genes and the respective pathways of the significant miRNA and parallel analysis with the RNA seq.
data set.

3. Material and methods - 26 -
STRING (https://string-db.org/), a biological database was used for understanding
protein-protein interaction. This database provided information about the known and
predicted protein-protein interactions from the published data on the web. The
information is obtained from the experimental data, computational prediction methods
and public text collections.
3.2.9 Statistical analysis
All the numerical data were represented as means ± standard deviation (SD).
The fold changes were obtained by normalizing the data to time-matched, non-
irradiated controls. Complete statistical analyses were performed using JMP®
Genomics, version 7.1. One-way ANOVA and a Student’s t-test for each pairwise
comparisons were performed. For all statistical tests, differences were considered
statistically significant at a false positive rate of α = 0.05. The number of repetitions
and replicates performed for each test method is indicated as N (repetitions,
replicates).

4. Results - 27 -
4. Results
4.1 Assessment of effects of different blue light irradiation time points with corresponding doses
NHEM cells were treated for different irradiation times with corresponding doses of
blue light and the effect of blue light treatment was assessed using Colorimetric Cell
Viability Kit III (XTT) from PromoKine (PromoCell GmbH) as a preliminary test.
Initially, the dose-effect was studied at the harvesting time 24 hours post-irradiation.
Short-term irradiation time points of 2.5 min (1.8 J/cm2), 5 min (3.6 J/cm2), 7.5 (5.4
J/cm2), 10 min (7.2 J/cm2) led to an increase in in the absorbance values with a
significant difference (p<0.0001) between the treated and non-irradiated control
(Figure 13).
Figure 13. Colorimetric cell viability (XTT) assay. NHEM treated with blue light at different irradiation
time points (2.5, 5, 7.5, 10, 15, 20, 30, 60, and 90 min) with respective doses after 24 hours of harvesting
after irradiation. Data are presented as mean ± standard deviation. (N=3 repetitions, 3 replicates).
Corresponding statistics summarized in Appendix 1.
On the other hand, an exposure of 15 min (10.8 J/cm2) resulted in a sharp decrease in
the signal (p<0.0001) as compared to the non-treated control. Additionally, treatment
with long-term irradiation of 30 min (21.6 J/cm2) led to further inhibition in the signal
and the effect remained almost constant after 60 min (43.2 J/cm2), and 90 min (64.8
J/cm2) of blue light irradiation.

4. Results - 28 -
As a result, a biphasic dose-response curve was obtained (represented by the smooth
curve) after application of different blue light doses after 24 hours of harvesting time
(Figure 13).
Furthermore, irradiation times 7.5, 30 and 90 min were chosen and tested for 48 hours
of harvesting time after irradiation. As these time-points represented the stimulatory
(7.5 min) and inhibitory (30 min, 90 min) effects (Figure 14).
Figure 14. Colorimetric cell viability (XTT) assay. NHEM treated with blue light at different irradiation
time points (7.5, 30 and 90 min) with respective doses after 48 hours of harvesting after irradiation. Data
are presented as box plots (non-treated control: red, treated: blue) with median, upper and lower quartile
(interquartile range (IQR) and whiskers (1.5x IQR) (N=3 repetitions, 3 replicates).
It was observed that after 48 hours after blue light treatment, the signal was
suppressed (p <0.0001) for all the doses as compared to the non-irradiated control
(Figure 14).

4. Results - 29 -
Moreover, 90 min (64.8 J/cm2) was examined 48 hours of harvesting time for the three-
skin phototypes (lightly pigmented, moderately pigmented and darkly pigmented) as
simultaneous experiments for melanin assay showed an increase in melanin content
using this dose (Figure 5). XTT assay showed a significant (p<0.0001) decrease in
absorbance values between treated and respective non-treated control for all the three
different pigmented NHEM (Figure 15).
Figure 15. Colorimetric cell viability (XTT) assay. NHEM from three skin phototypes (lightly
pigmented, moderately pigmented and darkly pigmented) exposed to 90 min blue light with 48 hours of
harvesting time. Data are presented as box plots (non-treated control: red, treated: blue) with median,
upper and lower quartile (interquartile range (IQR) and whiskers (1.5x IQR). (N=3 repetitions, 3
replicates).

4. Results - 30 -
4.2 Influence of blue light on melanin content
Melanin production is considered as the main function of melanocytes. Hence, to study
the effect of blue light on the amount of melanin in NHEM, irradiation time point 7.5
min, 30 min and 90 min were used to assess the change in melanin content from all
three different skin phototypes NHEM.
Amongst the different doses evaluated for melanin estimation, there was no significant
change observed in the melanin amount for 7.5 min, 30 min and 90 min for the
harvesting time of 24 hours, although there was a slight increase in the signal (Figure
16).
Figure 16. Melanin content estimation assay. Melanin content quantified from NHEM after an
irradiation with 7.5 min, 30 min and 90 min of blue light with 24 hours of harvesting time. Bars represent
mean ± standard deviation. (N=3 repetitions, 3 replicates).
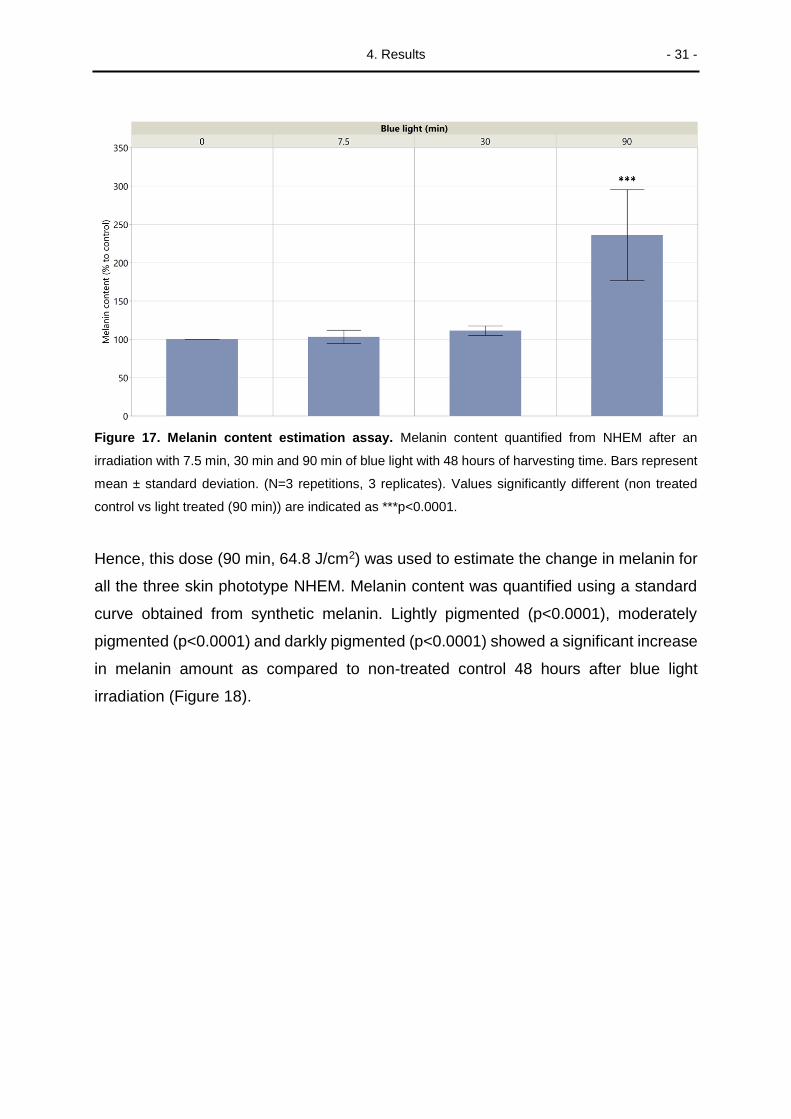
90 min (64.8 J/cm2) of irradiation led to an increase in melanin content after 48 hours
(Figure 17). Although no significant change in the melanin amount was observed for
7.5 min and 30 min post 48 hours of harvesting time post-irradiation (Figure 17).
4. Results - 31 -
Figure 17. Melanin content estimation assay. Melanin content quantified from NHEM after an
irradiation with 7.5 min, 30 min and 90 min of blue light with 48 hours of harvesting time. Bars represent
mean ± standard deviation. (N=3 repetitions, 3 replicates). Values significantly different (non treated
control vs light treated (90 min)) are indicated as ***p<0.0001.
Hence, this dose (90 min, 64.8 J/cm2) was used to estimate the change in melanin for
all the three skin phototype NHEM. Melanin content was quantified using a standard
curve obtained from synthetic melanin. Lightly pigmented (p<0.0001), moderately
pigmented (p<0.0001) and darkly pigmented (p<0.0001) showed a significant increase
in melanin amount as compared to non-treated control 48 hours after blue light
irradiation (Figure 18).

4. Results - 32 -
Figure 18. Melanin content estimation assay. Melanin content quantified from the three skin
phototypes NHEM after an irradiation with 90 min of blue light with 48 hours of harvesting time. Bars
represent mean ± standard deviation. (N=3 repetitions, 3 replicates). Values significantly different (non
treated control vs light treated (90 min)) are indicated as **p<0.001 and ***p<0.0001.
As well as the similar dose (90 min, 64.8 J/cm2) was chosen to study various other
cellular functions known to be affected by light, on these three skin phototype
melanocytes.
4.3 Effect of blue light treatment on cell apoptosis
To evaluate the effect of blue light on cell apoptosis after irradiation with 90 min both
at 24h and at 48h of harvesting time after-irradiation, fluorescent activated cell sorting
(FACS) was performed using FITC-Annexin V and PI staining.
For positive control, 1 µM of staurosporine (Streptomyces staurospores) was utilized
to induce cytotoxic effects in the NHEM cell. The cells were treated with staurosporine,
a non-selective protein kinase inhibitor, at 37°C and 5% CO2.
After 4h the cells had circularized, a mark of cell detachment from the surface, cell
morphology was documented by acquiring phase-contrast images using a light
microscope (Data shown in Appendix 2). Cell treated with 1µm of staurosporine had
approximately 95% dead cells and less than 5% living cells.

4. Results - 33 -
No significant impact on the cell apoptosis was observed between the untreated control
and treated samples after 24 hours and 48 hours of harvesting time (Figure 19). All the
three skin phototype NHEM had approximately 85%-95% living cells and the
percentage of dead cells was around 5%-15%.
(A)

4. Results - 34 -
(B)
Figure 19. Cell apoptosis using FACS. Number of events for living and dead NHEM cells from the
three skin phototypes was detected after an irradiation with 90 min of blue light with (A) 24 hours and
(B) 48 hours of harvesting time. Bars represent mean ± standard deviation. (N=3 repetitions, 3
replicates).
4.4 Blue light irradiation influences the energy metabolism level in NHEM
The ATP level inside the cell is the indicator of energy metabolism, which represents
viable and metabolically active cells. Hence, a luminescence-based assay (CellTiter-
GLO®) was applied to understand the cellular metabolic status.
The concentrations of ATP following the treatment with a dose of 90 min of blue light
resulted in an increase (**p<0.001, ***p<0.0001) after both 24h and 48h of harvesting
time points for all the three skin phototypes (Figure 20).

4. Results - 35 -
Figure 20. Cell ATP assay. Changes in ATP level of NHEM cells from the three skin phototypes was
detected after an irradiation with 90 min of blue light with 24 hours (left-hand side) and 48 hours (right-
hand side) of harvesting time. Bars represent mean ± standard deviation. (N = 3 repetitions, 3
replicates). Values significantly different (non treated control vs light treated (90 min)) are indicated as
**p<0.001and ***p<0.0001.
4.5 Intracellular redox level changes inflicted by blue light
Blue light is known to alter the level of oxidative stress inside the cell by producing
reactive oxygen species (ROS). Hence, a redox sensor (Grx1-roGFP3) was used to
determine intracellular redox changes after treatment with 90 min of blue light for
different harvesting time points (0h, 0.5h, 1h, 2h, 3h, 4h, 5h, 6h, 24h and 48h) post-
irradiation (Figure 21)
The blue light exposure resulted in a sharp increase in signal following irradiation as
compared to non-irradiated control. Immediately after the light treatment, for lightly and
moderately pigmented NHEM the oxidative stress elevated approximately 100%
(p<0.0001) whereas for the darkly pigmented it increased by approximately 300%
(p<0.0001) (Figure 21).

4. Results - 36 -
Figure 21. Intracellular redox status in NHEM in response to blue light. NHEM expressing Grx1-
roGFP3 showed changes in ROS after an irradiation with 90 min of blue light for different harvesting
time. Data are presented as mean ± standard deviation. (N=3 repetitions, 3 replicates). Corresponding
statistics summarized in Appendix 3.
For all the three skin phototypes the level of ROS decreased with time, after 6h
(p<0.0001) until 48h remained constant (p<0.0001), and approached almost the same
level as respective control values.
4.6 Gene expression analysis
The raw data obtained from RNA sequencing was subjected to distribution analysis
and batch normalization. Followed by deep analysis of differential gene expression
after the irradiation time 90 min with corresponding dose 64.8 J/cm2 of blue treatment
and cell harvesting of 48 hours.

4. Results - 37 -
4.6.1 Cluster analysis correlation
Hierarchical clustering using coloured heat maps showed the treated and non-treated
samples in distinct clusters. Figure 22 illustrates the heat map with a strong matrix
correlation between treated samples, which can be very well differentiated from the
untreated samples from the three skin phototypes NHEM.
Figure 22. Cluster analysis. Pearson correlation heat map illustrating the cluster analysis of treated
samples and non-treated samples of NHEM cells from three skin phototypes after treatment with blue
light 90 min with cell harvesting after 48 hours. (N=1, 3 replicates).
4.6.2 Altered genes post blue light treatment
Out of the complete data set, 17221 genes were found to be differentially expressed
for each respective three skin phototype NHEM after irradiation with blue light (90 min,
64.8 J/cm2). Amongst these genes, 3263 were significant for lightly pigmented, 4740
for moderately pigmented and 2409 for darkly pigmented.
Amongst the complete differentially expressed genes, a total of 7326 were significantly
differentially or commonly expressed genes for among all three skin types. Out of this,
moderately pigmented NHEM showed the highest number (2442) of significant genes
differentially expressed from the two other skin type NHEM. Whereas darkly pigmented
showed the least number of differentially expressed significant genes as compared to
the two other skin type NHEM. Amongst the total number of significant genes, 605

4. Results - 38 -
genes were noticed to be commonly shared between the three skin type NHEM Also,
the highest amount (792) of commonly shared significant genes was observed
between moderately and darkly pigmented NHEM. On the other hand, the lowest
amount (183) of commonly shared significant genes was found between lightly and
darkly pigmented NHEM (Figure 23).
Figure 23. Significant count of genes. Venn diagram showing the number of genes significantly
(adjusted p-value <0.05) commonly or differentially expressed in NHEM from the three skin phototypes
after the blue light treatment 90 min and cell harvesting 48 hours.
Table 6 lists the number of significantly up- and down-regulated genes for each skin
phototype NHEM. After the treatment with the respective dose of blue light, a maximum
number of both up- and down-regulated genes were noted for moderately pigmented
NHEM. Whereas among the two other skin phototypes, lightly pigmented had a little
bit higher number of up-regulated genes as compared to darkly pigmented. Also, the
down-regulated genes for the lightly pigmented were higher by 658 genes in
comparison to darkly pigmented.
Lightly pigmented
Moderately pigmented Darkly pigmented

4. Results - 39 -
Table 6. Summary of differentially expressed genes. Number of significantly (adjusted p-value <0.05)
up- and down-regulated genes.
Skin phototype Lightly
pigmented
Moderately
pigmented
Darkly
pigmented
Total number of up-regulated genes 1457 2324 1261
Total number of down-regulated
genes 1806 2416 1148
Further, the common genes differentially expressed for NHEM were sorted by listing
the top ten up- and down-regulated genes (Table 7).
Table 7. List of top ten up- and down- regulated differentially expressed genes. Top ten
significantly (adjusted p-value <0.05) up- and down-regulated genes (gene symbol).
Up-regulated genes Down-regulated genes
UTP14C SPP1
SMIM38 CLDN1
LINC00304 PMP2
FBXW10 TMEM26
RNF112 ENPP1
ALDH8A1 SH2D4A
LOC100996583 ABCA1
TCTE1 FAXDC2
AOC3 MME
GAL3ST1 ADAM12
These genes encode proteins implicated in protein synthesis, membrane integrity, cell-
cell interactions, transport, metabolism, cell differentiation and proliferation.
Next, the top most common up- and down-regulated genes for each of the three skin
phototype NHEM were sorted from the differentially expressed genes (Table 8)

4. Results - 40 -
Table 8. List of top ten up- and down- regulated differentially expressed genes. Top most up- and
down-regulated genes (gene symbol) for the three skin phototype NHEM.
Regulation Lightly pigmented Moderately pigmented Darkly pigmented
Up-regulated
UTP14C UTP14C LINC00304
SMIM38 LOC100996583 UTP14C
FBXW10 SECTM1 RNF112
ALDH8A1 CYP1B1 LOC100996583
LOC100996583 SMIM38 GAL3ST1
TCTE1 SERPINF2 TRIM73
RNF112 RNF112 CYP1B1
AOC3 GAL3ST1 HLA-DRA
GAL3ST1 TCTE1 SMIM38
SSPO MIR210HG TCTE1
Down-regulated
SPP1 TMEM26 SPP1
CLDN1 SH2D4A FAXDC2
PMP2 FAXDC2 SAPCD2
ENPP1 ENPP1 PYHIN1
ABCA1 ADAM12 THBS2
MME TM4SF18 PPARGC1A
PYHIN1 PYHIN1 KU-MEL-3
SH2D4A DCAF12L1 LRRC1
FAM83D ANXA3 TM4SF18
KIF14 ITFG2 ABCA1
Further, with the help of volcano plots (Figure 24), the regulation of top most significant
genes was observed. The genes with large fold change are depicted that are also
statistically significant. The red line serves as the threshold of significance and the
most statistically significant genes are towards the top of the volcano plot. Statistically
significant genes towards the right are the up-regulated genes whereas towards the
left are the down-regulated genes (Figure 24).

4. Results - 41 -
(A)
(B)
(C)
Figure 24. Volcano plots labelling top significant genes. Significantly up- and down-regulated genes
for all the three skin phototype NHEM (A) Lightly pigmented, (B) Moderately pigmented and (C) Darkly
pigmented.

4. Results - 42 -
4.6.3 De-regulated pathways after blue light treatment
GSEA (Gene Set Enrichment Analysis) was performed to ascertain whether the
defined sets of genes exhibit statistical significant in their distribution within the ranked
lists of differentially expressed genes. Also KEGG (Kyoto Encyclopedia of Genes and
Genomes), a public database was used to obtain the detailed information of pathways
involved in diverse cellular networks. Normalized enrichment score (NES) was used to
classify the pathways into up-regulated and down-regulated categories.
Total 302 pathways were screened for each skin phototype NHEM (Table 9). Lightly
pigmented had a total of 128 and 174 up- and down-regulated pathways, respectively.
Whereas darkly pigmented had contrary trends with the counts of up- and down-
regulated pathways to lightly pigmented NHEM. Moreover, moderately pigmented
NHEM had the highest count of up-regulated pathways (220) and the lowest count of
down-regulated pathways (82).
Table 9. Summary of differentially expressed KEGG pathways. Significantly up-regulated and down-
regulated pathways for all the three skin phototype NHEM have been tabulated below with different
significance level based on nominal p-value <0.05 and adjusted p-value <0.05.
Skin phototypes Lightly
pigmented Moderately pigmented
Darkly pigmented
Total number of de-regulated pathways 302 302 302
Total number of up-regulated pathways 128 220 182
Significantly up-regulated pathways (nominal p-value)
15 89 38
Significantly up-regulated pathways (adjusted p-value)
4 56 6
Total number of down-regulated pathways
174 82 120
Significantly down-regulated pathways (nominal p-value)
41 17 9
Significantly down-regulated pathways (adjusted p-value)
14 13 0
Based on the adjusted p-value <0.05, the trend for the count of the up-regulated
pathway was highest for the moderately pigmented NHEM (56) and almost similar for
lightly (4) and darkly pigmented (6) NHEM. On the contrary, the number of down-
regulated pathways with adjusted p-value <0.05 was approximately similar for

4. Results - 43 -
moderately (13) and lightly pigmented (14) NHEM and no down-regulated pathways
were found for the darkly pigmented NHEM. There were no commonly shared
significantly regulated pathways between the three skin phototypes. Although
moderately pigmented NHEM shared commonly significant pathways with lightly
pigmented (12) and darkly pigmented (4) NHEM. Moreover, moderately pigmented had
the highest amount of differentially significant de-regulated pathways as compared to
the other skin phototype NHEM, which had a very low count of differentially significantly
de-regulated pathways, 6 for lightly pigmented and 2 for darkly pigmented (Figure 25).
Figure 25. Number of significantly regulated pathways. Venn diagram depicting the count of
significantly (adjusted p-value <0.05) commonly or differentially expressed pathways in the three skin
phototype categories of NHEM after 90 min of blue light irradiation and cell harvesting 48 hours.
KEGG database sorts the complete gene sets into six main categories, namely:-
1. Metabolism
2. Genetic Information Processing
3. Environmental Information Processing
4. Cellular Processes
5. Organismal Systems
6. Human Diseases
Moderately pigmented
Lightly pigmented
Darkly pigmented

4. Results - 44 -
Based on the above information provided by KEGG, the complete data set was studied
for the networks and reactions affected due to our respective dose of blue light. The
distribution is summarized in Figure 26.
Figure 26. Significantly regulated pathways from KEGG. Significantly (adjusted p-value <0.05) up-
regulated (NES >0) and down-regulated (NES <0) pathways from the six main category obtained from
KEGG for all the three skin phototype NHEM. The numbers around the pie charts are the total number
of up- and down-regulated pathways of the respective category.

4. Results - 45 -
The distribution obtained from sorting according to the KEGG ‘Main Category’, a
significant up-regulation was observed in pathways belonging to category ‘metabolism’
for all the three skin phototype NHEM, except one pathway was significantly down-
regulated for moderately pigmented NHEM. The number of up-regulated pathways
belonging to this category were more in number for moderately pigmented NHEM as
compared to the two other skin phototype NHEM.
The second category ‘genetic information processing’ had highly down-regulated
pathways for moderately pigmented NHEM followed by lightly pigmented. Also, for the
lightly pigmented NHEM only one pathway for this category was found to be up-
regulated.
On the other hand, the significant pathways belonging to the third category
‘environmental information processing’ were found to be up-regulated for moderately
pigmented only and no significant pathways were observed for other skin phototype
NHEM.
Whereas pathways related to ‘cellular process’ were more up-regulated for moderately
pigmented and in contrast it was more down-regulated for lightly pigmented NHEM.
Further, the fifth main category, ‘organismal systems’ pathways were more up-
regulated for moderately pigmented NHEM and only one pathway for the darkly
pigmented NHEM. Moreover, only one pathway was down-regulated for the lightly
pigmented NHEM.
Lastly, the pathways related to the sixth category was found to be significantly up-
regulated for all the three skin phototype NHEM, wherein higher in number for the
moderately pigmented followed slightly for darkly pigmented and least for lightly
pigmented NHEM.
Since the number of pathways in the main categories had a small sample size, we
performed Fisher’s Exact Test, as this test is suitable when the sample size is small.
Fisher’s Exact Test was a further confirmation of the significance level of the KEGG
pathways from the main category with significant adjusted p-value <0.05 for the three
skin phototype NHEM. This test is applied when there are two variables and to find out
whether the proportions of one variable is different depending on the value of the other
variable. The result procured from this test is summarized in Table 10. The main
category pathways belonging to lightly pigmented NHEM were strongly significant,

4. Results - 46 -
followed by moderately pigmented and no significance was observed for the darkly
pigmented NHEM.
Table 10. Fisher’s Exact Test. The result of the P value obtained from the Fisher’s Exact Test for the
main category with the significant KEGG pathways for the three skin phototype NHEM.
Skin phototype Lightly
pigmented
Moderately
pigmented
Darkly
pigmented
Fisher’s Exact Test (P) <0.0001 0.0114 0.8635
Furthermore, several individual pathways, which were significantly enriched after blue
light irradiation with our dose, were sorted based on the six main categories to
understand the sub-category type of these pathways (Table 11-16).
Amongst the metabolic pathways, after blue light treatment, sub-category xenobiotics
biodegradation and metabolism were found to be up-regulated for all the three skin
phototype NHEM (Table 11). This category comprises pathways like metabolism of
xenobiotics by cytochrome P450, AHR pathway. Other related pathways to these
pathways include steroid biosynthesis and terpenoid backbone biosynthesis. Besides,
for moderately pigmented the sub-category carbohydrate metabolism was found to be
significantly up-regulated, which constitutes of pathways like
glycolysis/gluconeogenesis, pentose phosphate metabolism. Wherein the former is
known to produce small amounts of ATP and NADH, and the latter produces NADPH
and pentoses. Another interesting sub-category found to be up-regulated by blue light
treatment includes metabolism of cofactors and vitamins comprising of the pathway
porphyrin and chlorophyll metabolism (Table 11).

4. Results - 47 -
Table 11. List of significantly enriched KEGG pathways sorted for main category ‘Metabolism’.
Significantly (adjusted p-value <0.05) up- and down-regulated pathways for all three skin phototype
NHEM have been shown below. (A) Lightly pigmented, (B) Moderately pigmented and (C) Darkly
pigmented.
(A)
(B)
(C)
Transcription, translation, replication and repair were the sub-categories found
significant in the main-category ‘Genetic Information Processing’ for lightly and
moderately pigmented NHEM (Table 12). All the pathways belonging to these sub-
categories were down-regulated except for the ribosome pathway for the lightly
pigmented was found to be significantly up-regulated.

4. Results - 48 -
Table 12. List of significantly enriched KEGG pathways sorted for main category ‘Genetic
Information Processing’. Significantly (adjusted p-value <0.05) up- and down-regulated pathways for
all three skin phototype NHEM have been shown below. (A) Lightly pigmented and (B) Moderately
pigmented.
(A)
(B)
Besides, the pathways as part of the sub-category (main category ‘cellular processes’)
cell growth and death are also down-regulated for the two NHEM, i.e., lightly pigmented
and moderately pigmented (Table 13). Which included cell cycle, oocyte meiosis, p53
signalling. Although, the ferroptosis pathway was up-regulated for moderately
pigmented NHEM. Apart from this the sub-category, transport and catabolism
comprise pathways like autophagy, phagosome, mitophagy and lysosome were
significantly up-regulated for moderately-pigmented NHEM.

4. Results - 49 -
Table 13. List of significantly enriched KEGG pathways sorted for main category ‘Cellular
Processes’. Significantly (adjusted p-value <0.05) up- and down-regulated pathways for all three skin
phototype NHEM have been shown below. (A) Lightly pigmented and (B) Moderately pigmented.
(A)
(B)
Further, the sub-categories part of ‘environmental information processing’ that were
significantly up-regulated contained signal transduction and signalling molecules and
interaction for the moderately pigmented NHEM (Table 14). Amongst this, TNF
signalling which is known to play a role in inducing a wide range of pathways, for
example, apoptosis and cell survival, as well as inflammation and immunity, were
compared for the three NHEM to assess the effects of blue light treatment.
Table 14. List of significantly enriched KEGG pathways sorted for main category ‘Environmental
Information Processing’. Significantly (adjusted p-value <0.05) up- and down-regulated pathways for
all three skin phototype NHEM have been shown below for moderately pigmented.
Some of the pathways belonging to the sub-category of the endocrine system, the
immune system, the digestive system, the excretory and the nervous system were also
found to be significantly regulated in the main category ‘organismal system’ (Table 15).
The above sub-categories were significantly up-regulated for moderately and darkly
pigmented NHEM, respectively. Whereas, one of the pathway progesterone-mediate

4. Results - 50 -
oocyte maturation belonging to the endocrine system sub-category was found
significantly down-regulated for the lightly pigmented NHEM.
Table 15. List of significantly enriched KEGG pathways sorted for main category ‘Organismal
Systems’. Significantly (adjusted p-value <0.05) up- and down-regulated pathways for all three skin
phototype NHEM have been shown below. (A) Lightly pigmented, (B) Moderately pigmented and (C)
Darkly pigmented.
(A)
(B)
(C)
The sub-category cancer, immune diseases, cardiovascular diseases, endocrine and
metabolic disease and also infectious disease in the category: bacterial, viral and
parasitic as part of the main category ‘human diseases’ were found to be significantly
regulated (Table 16). Amongst this list, the few commonly shared pathways like
chemical carcinogenesis were selected for further comparison for the evaluation of the
blue light irradiation. As chemical carcinogenesis, found to be up-regulated for lightly
and moderately pigmented NHEM, this pathway is involved when there is
environmental exposure to chemical carcinogens. Moreover, rheumatoid arthritis was
found to be remarkably up-regulated for moderately and darkly pigmented NHEM,
which is part of the immune disease sub-category. In this disease, it is known to have
abnormal activation of the immune system resulting in elevation of pro-inflammatory
cytokines and chemokines levels. Moreover, rheumatoid arthritis was found to be
remarkably up-regulated for moderately and darkly pigmented NHEM, which is part of

4. Results - 51 -
the immune disease sub-category. In this disease, it is known to have abnormal
activation of the immune system resulting in elevation of pro-inflammatory cytokines
and chemokines levels. And, previously we noted, some pathways of the sub-category
signalling molecules and interaction from the main-category ‘environmental
information processing’ were found to be up-regulated as well (Table 14)
Table 16. List of significantly enriched KEGG pathways sorted for main category ‘Human
Diseases’. Significantly (adjusted p-value <0.05) up- and down-regulated pathways for all three skin
phototype NHEM have been shown below. (A) Lightly pigmented, (B) Moderately pigmented and (C)
Darkly pigmented.
(A)
(B)
(C)

4. Results - 52 -
Moreover, based on our observation from the different experiments conducted using
blue light (90 min, 64.8 J/cm2) and from the literature search, some important pathways
affected by light treatment were selected and evaluated from this data set.
Amongst the selected pathways (illustrated in Figure 27) were oxidative
phosphorylation and glycolysis/gluconeogenesis which are part of the metabolic
pathways and are involved in the ATP production. Both these pathways were found to
be up-regulated after the treatment with blue light for all the skin phototype NHEM
cells. On the other hand, the apoptosis pathway had an up-regulated trend for
moderately and darkly pigmented, but it was not significant for any of the skin
phototypes. The p53 signalling pathway was also assessed as p53 activation is
induced by stress signals, and we observed that this pathway was down-regulated for
both lightly and moderately pigmented NHEM cells, but it was up-regulated for darkly
pigmented NHEM, although not reaching a relevant level of significance.
Figure 27.Selected pathways for further analysis of gene expression data. Pathways related to
metabolism, apoptosis and stress signaling with NES for all the three skin phototype NHEM cells. Bars
represent mean.
Further, some other important players in regulating a wide range of cellular functions
including immunity, inflammation, and cell signalling to cell death are the signalling
pathways like TNF, TGF-beta, NF-Kappa B, MAPK, AMPK and FoxO signalling
pathway. In our data set, we observed a down-regulation of TGF-beta signalling
pathway for all the three skin phototypes and the AMPK signalling pathway had the
opposite trend. On the other hand, the two other pathways i.e. NF-Kappa B signalling
and MAPK signalling pathway were found to be down-regulated for lightly and darkly
pigmented NHEM, whereas up-regulated for moderately pigmented NHEM. Moreover,

4. Results - 53 -
TNF and FoxO signalling pathway had the same trend with up-regulation for
moderately and darkly pigmented and down-regulation for lightly pigmented (Figure
28).
Figure 28. Important signalling pathways selected for further analysis. Signalling pathway with
NES for all the three skin phototype. Bars represent mean.
4.6.4 Significant MicroRNAs (miRNAs) after blue light treatment
Two miRNAs, MIR4664 and MIR3189 were found to be significantly regulated in our
RNA sequencing data (Table 17). MIR4664 was significant for both lightly and
moderately pigmented NHEM cells, whereas MIR3189 was found to be significantly
regulated for darkly pigmented NHEM cells.
Table 17. List of significantly regulated miRNAs. Significant (adjusted p-value <0.05) miRNAs for all
three skin phototype NHEM have been shown below. (A) Lightly pigmented, (B) Moderately pigmented
and (C) Darkly pigmented.
Skin phototype Lightly
pigmented
Moderately
pigmented
Darkly
pigmented
miRNAs MIR4664 MIR4664 MIR3189
log Fold change 0.888714 0.909552 2.250505
Adjusted p-value 0.020844 0.008566 0.035314
Then possible target genes were searched using the miRWalk database (Table 18).

4. Results - 54 -
Table 18. Total number of possible target genes. The total number of possible target genes found in
the miRWalk database search.
miRNA Number of possible target genes
hsa-miR-4664-3p 52243
hsa-miR-4664-5p 45970
hsa-miR-3189-3p 62937
hsa-miR-3189-5p 46633
Next, the common target genes amongst the significant gene in our data and possible
targets obtained from the miRWalk database were identified (Figure 29). The common
genes between RNA seq dataset and MIR4664 dataset for lightly pigmented skin
phototype were 2671 and 3927 for moderately pigmented skin phototype NHEM. 1953
genes were found to be common between RNA seq dataset and MIR3189 dataset for
darkly pigmented skin phototype NHEM. Further, a total of 481 genes were obtained
as the common genes amongst all the three skin phototypes NHEM (Figure 29).
(A)
Lightly pigmented (RNA seq)
MIR4664

4. Results - 55 -
(B)
(C)
Figure 29. Number of common target genes. Venn diagram depicting the common target genes
between the significant gene list obtained from RNA seq and list of possible target genes obtained from
miRWalk search for all three skin phototypes (A) Lightly pigmented, (B) Moderately pigmented, and (C)
Darkly pigmented.
Afterwards, the pathway analysis was performed for these common genes using the
KEGG database and parallel-analysis with the significant pathways obtained in the
Moderately pigmented (RNA seq)
MIR4664
Darkly pigmented (RNA seq) MIR3189

4. Results - 56 -
initial gene expression analysis were analysed to understand common regulated
pathways (Figure 30).
(A)
(B)

4. Results - 57 -
(C)
Figure 30. Number of common pathways. Venn diagram depicting the common KEGG pathways
between the significant pathway list obtained from RNA seq and list of pathways belonging to possible
binding sites obtained from miRWalk search for all three skin phototypes (A) Lightly pigmented, (B)
Moderately pigmented and (C) Darkly pigmented.
In total 5 pathways were found to be common for lightly pigmented, 23 for moderately
pigmented and 1 for darkly pigmented between the RNA seq dataset and miRWalk
dataset. The common pathways with the main and sub-category as listed in Table 19
were obtained from a KEGG database anaylsis.

4. Results - 58 -
Table 19. Common pathways. The total number of common pathways found between the RNA seq
data and pathways for miRNA for all three skin phototypes (A) lightly pigmented, (B) moderately
pigmented and (C) darkly pigmented.
(A)
(B)
(C)
4.6.5 Alteration in aryl-hydrocarbon receptor (AHR) pathway and related genes
The analysis of gene expression data suggests that among the complete gene set that
was altered, CYP1B1 was observed to be highly up-regulated after 48 hours of blue
light irradiation (90 min, 64.8 J/cm2) (Figure 13). This in turn, points toward a possible
role of the transcription factor, aryl hydrocarbon receptor after blue light treatment.
Moreover, pathway analysis also showed an up-regulated trend for AHR pathway and
other pathways related to it, like metabolism of xenobiotics by cytochrome P450,

4. Results - 59 -
chemical carcinogenesis, tryptophan metabolism and steroid hormone biosynthesis
based on the normalized enrichment score (Figure 31).
Figure 31. AHR pathway and other related pathways. AHR pathway and other related pathways with
NES for all the three skin phototype NHEM. Bars represent mean.
In Figure 32, the coloured heat map reveals the expression pattern of the different
genes involved in the AHR pathway.
Figure 32. AHR pathway heat map. Pearson correlation heat map illustrating up- and down-regulation
of the AHR pathway related genes from three skin phototypes after treatment with blue light for 90 min
and cell harvesting after 48 hours. (T: light treated, C: non-treated control). Red: up-regulated expression
of the genes, green: down-regulated expression of the genes.

4. Results - 60 -
The entire list of genes involved in the AHR pathway is known as ‘AHR gene battery’
as shown in Figure 33. The trend for these genes has been summarized after blue light
irradiation (90 min, 64.8 J/cm2) and harvesting time 48 hours thereafter.
Figure 33. AHR gene battery. Genes involved in AHR pathway summarized for all the three skin
phototype NHEM. Bars represent mean.
Genes like CYP1A1, aryl hydrocarbon receptor (AHR), cyclin-dependent kinase 1 B
(CDKN1B), nuclear factor erythroid 2 like 2 (NFE2L2, also known as Nrf 2), NAD(P)H
quinone oxidoreductase 1 (NQO1), aldehyde dehydrogenase 8 family member A1
(ALDH8A1), aryl hydrocarbon receptor repressor (AHRR) were also found to be up-
regulated amongst the genes related to AHR pathway. Others like aryl hydrocarbon
receptor nuclear translocator (ARNT), CYP1A2, heat shock protein 90 alpha family
class A member 1 (HSP90AA1) were found to be down-regulated.
Using STRING database, the proteins encoded by above genes were obtained (AHR,
CYP1B1 and CYP1A1 were used as an input for the search).and, an overview of the
protein-protein interaction is illustrated in Figure 34.

4. Results - 61 -
Figure 34. Overview of protein-protein interaction. Protein-protein interaction of the genes involved
in AHR pathway as obtained from STRING database. AHR, CYP1B1 and CYP1A1 were used as an
input for the search.
4.6.6 Effects of blue light on melanogenesis
The process of production of the pigment melanin is known as melanogenesis. This
process is regulated by a varied amount of internal as well as external factors. After
blue light treatment, the melanogenesis pathway was found to be up-regulated for all
skin phototypes (Figure 35). As, tyrosine serves as the precursor for the melanin
synthesis, the regulation of this pathway was assessed following blue light irradiation.
We observed an up-regulation of the tyrosine metabolism pathway. Amongst the core
molecular pathways influencing the melanin production, c-AMP signaling pathway also
plays an important role, as it is known to activate several melanogenic genes. This
pathway was also found to be up-regulated in our data set.

4. Results - 62 -
Figure 35. Melanogenesis and related pathways. Pathways involved in the melanin synthesis with
NES and adjusted p-value for all the three skin phototype NHEM. Bars represent mean.
Many genes involved in melanogenesis, were found to be significantly regulated after
blue light irradiation. Tyrosinase (TYR) is an important enzyme in the melanin
synthesis pathway and is involved in the conversion of tyrosine to L-DOPA, which is
the rate-limiting step of this process. This enzyme is encoded by the TYR gene, which
was found to be significantly up-regulated in our gene set (Figure 36).
Figure 36. Genes involved in melanin synthesis. Genes involved directly or indirectly in melanin
synthesis for all the three skin phototype NHEM. Bars represent mean.
The STRING database was used to search for TYR. The database provided the
information about protein encoded by TYR and interaction with other proteins like
transient receptor potential cation channel subfamily C member 1 (TRPC1), OCA2
melanosomal transmembrane protein (OCA2), premelanosome protein (PMEL),
Dopachrome tautomerase (DCT), Microphthalmia-associated transcription factor
(MITF) and MLANA (Melan-A) (Figure 37). The genes encoded by these proteins
(obtained from STRING) and other important genes involved in the melanogenesis

4. Results - 63 -
pathway (from literature search) were selected for further analysis (Figure 36).
Amongst these, OCA2, opsin 3 (OPN 3) and TRPC1 were found to be up-regulated.
Whereas MITF, c-AMP response element (CREB) were found to be down-regulated.
Figure 37. Overview of protein-protein interaction. Protein-protein interaction of the genes involved
in melanogenesis pathway as obtained from STRING database. TYR was used as an input for the
search.
The melanogenesis pathway was obtained from the KEGG database and a multi-plot
was built combining the data for all the three skin phototype NHEM (Figure 38).

4. Results - 64 -
Figure 38. Overview of melanogenesis pathway. Multiplot of melanogenesis pathway as obtained
from KEGG database based on the NES. Each box allotted for a gene has been divided into three skin
phototypes (from left to right), lightly pigmented, moderately pigmented and darkly pigmented.
LP MP DP

5. Discussion - 65 -
5. Discussion
Currently, different effects of PBM have been reported in the literature on cell
metabolism, viability, proliferation, apoptosis and redox status. These outcomes vary
depending on the cell type and different irradiation parameters. The influence of PBM
on melanocytes has been shown mainly to affect the pigmentation. Moreover, the role
of PBM on melanocytes has received far less attention than its neighbouring skin cells,
keratinocytes and fibroblasts. Therefore, the present study aimed at understanding the
impact of PBM using blue light (453 nm) on human melanocytes.
Briefly, the effects of different doses of blue light on NHEM cells were assessed using
a cell viability XTT assay followed by an investigation of the role of blue light (both
stimulatory and inhibitory doses obtained from viability assay) in modulating the
amount of melanin production. An irradiation time of 90 min with a corresponding dose
of 64.8 J/cm2 was chosen to analyse known effects of light as this dose showed the
highest increase in melanin content for all three skin phototype NHEM cells. Further
functional assays were carried out using the selected dose to investigate the
photobiomodulatory effects reported in the literature. Thus, ATP measurement, redox
status analysis and cell apoptosis examined for safety concerns of the selected dose.
Subsequently, a comprehensive evaluation of gene expression profiles of all three skin
phototypes was performed. This analysis found multiple genes and pathways
deregulated, and also two significant miRNAs. Amongst these, the key findings have
been discussed.
5.1 Blue light doses resulted in a biphasic dose response
To evaluate the role of blue light on melanocytes, different doses (listed in Table 1)
were applied on NHEM cells and using viability assay, the change in metabolic activity
was assessed. Mitochondrial enzymes of metabolically active cells are known to
reduce the tetrazolium salt (XTT) and the coloured end product is measured directly
by absorbance reading 67. It resulted in a biphasic dose-response curve wherein lower
doses or the short-term irradiation affected the cell metabolism positively and led to an
increase in the activity. On the other hand, higher doses or long-term irradiation led to
a decrease in cell metabolism. Maximum acceleration of approximately 23% in the
activity was achieved for the dose 5.4 J/cm2. Whereas amongst all doses evaluated

5. Discussion - 66 -
for the study, the maximum decrease of 31% was obtained for the highest dose after
24 hours of light treatment.
Many authors have found the same results 68, 15, that has been based on ‘Arndt-Schulz
law’ dose-dependent model 69, 70. Similar findings have been also been reported by
Castellano-Pellicena, I. et al., 2019 71, blue light led to an induction in metabolic activity
of cultured keratinocytes using 453 nm of blue light. Further, in our study, 48 hours
harvesting after irradiation for doses of 5.4, 21.6, and 64.8 J/cm2 lead to a suppression
in the activity of NHEM cells. The opposite trend has been shown by AlGhamdi, K.M.,
et al, 2015 53 using short-term irradiation, using blue (457 nm) and red laser (635 nm)
after 72 hours of harvesting time.
Since we saw an inhibition in the metabolic activity with different doses after 48 hours,
we did not proceed for 72 hours of harvesting after irradiation. Also for the cells to
survive in the 96-well plate for three days after irradiation, the initial number for the
seeding of cells would have been lower, and that could have been another factor
affecting the cell response to blue light in a different manner.
5.2 Blue light induces hyperpigmentation
Melanocytes have the main function of producing the pigment melanin, and blue light
has been reported to induce pigmentation 47, 52. Hence, to elucidate whether blue light
(453 nm) can modulate the amount of melanin production in these cells selected doses
were applied on NHEM cells followed by an estimation of the melanin content. Selected
doses included 5.4, 21.6, and 64.8 J/cm2 based on the outcome of the viability assay
for their stimulatory and inhibitory effects. The blue light doses 5.4 and 21.6 J/cm2 did
not show a significant change in the melanin amount. On the other hand, the melanin
assay revealed an increase in melanin amount after application of dose 64.8 J/cm2
post 48 hours of irradiation for all the three skin phototype NHEM cells. The same
observations were reflected in gene expression analysis as well with an increase in the
melanogenesis pathway. Additionally, a significant up-regulation of the gene TYR,
encoding for tyrosinase enzyme was observed, which is located in melanocytes and is
responsible for catalysing the first rate-limiting step in the conversion of tyrosine to L-
DOPA in the melanin synthesis pathway 72, 73. Moreover, a significant up-regulation
was observed for tyrosine metabolism, as this amino acid is the natural principle
substrate for melanin 74.

5. Discussion - 67 -
In addition, significant up-regulation was observed in OCA2 melanosomal
transmembrane protein (OCA2, formerly known as P gene). It is located in
melanocytes and predicted be involved in the transport of tyrosine within the
melanocytes 75 and as well it is known to regulate the pH of the melanosome and the
melanosome maturation 76, 77. AlGhamdi, K.M et al. 54 have shown that the stage I
melanosomes were significantly higher in the treated group as compared to the non-
treated group, which points towards an induction of melanogenesis. Furthermore,
OPN3 was observed to be up-regulated. It belongs to the family of light-sensitive G-
protein coupled receptors. Opsins have recently been identified for their role in
phototherapy 78, 79. Regazzetti, C., et al., 2018 58 have demonstrated the role of Opsin
3 (OPN 3) as a sensor for blue light in melanocytes and demonstrated an increase in
pigmentation. Another proposed downstream target of opsins is transient receptor
potential (TRP) channels, which are known to be activated by light 80. Gene expression
analysis also revealed a significant up-regulation of TRPC1 in NHEM cells after blue
light treatment. Moreover, it is known that OPN 3 and other opsins signal via a pathway
involving cyclic nucleotides (c-AMP and c-GMP) 78. This would match with our KEGG
pathway analysis depicting an up-regulation in the cAMP pathway.
Although c-GMP pathway was only up-regulated for moderately and darkly pigmented
NHEM after blue light irradiation. In addition, several melanogenic genes can be
indirectly be activated by c-AMP synthesis.
Besides this MITF, the master regulator of melanocyte development and melanogenic
genes was observed to be down-regulated. This could be because this gene has been
reported to be up-regulated immediately after light exposure and later returns to its
basal level 58.
5.3 No induction of cell death via apoptosis by blue light
Cellular apoptosis is a downstream response seen after light treatment. PBM is known
to have an effect on the cell apoptosis level depending on the dose and other irradiation
parameters. We also evaluated the possibility of whether our dose could have a
stimulatory or inhibitory effect on cell apoptosis due to long-term irradiation, using flow
cytometry analysis.

5. Discussion - 68 -
Although to our surprise, the dose used in our study did not result in a significant
apoptosis between the untreated control and treated samples for two of the harvesting
time points (24 and 48 hours) for all the three skin phototypes NHEM.
From the gene expression profiles, it was noted that the majority of cell growth and
death pathways were found to be significantly down-regulated. Single gene expression
depicts a slightly up-regulation of TP53, which codes for p53, which might be due to a
light-induced stress. On the other hand, there is also a slight up-regulation of MDM2,
which is an antagonist of TP53. The former encodes a nuclear-localized E3 ubiquitin
ligase. As a result, this leads to reduced cellular stress and a subsequent down-
regulation of genes involved in caspase cascade like CASP9, CASP3. This finding is
reflected in FACS analysis, where no significant apoptosis was observed for all NHEM
after blue light treatment. In addition, the apoptotic pathways were also not significantly
regulated and the caspase cascade responsible for the execution of this programmed
cell death was slightly down-regulated due to a non-significant expression of the
respective adaptors. Similar findings have been reported by Becker, A., et al., 2016 81,
the group observed no occurrence of apoptosis after 30 min of blue light treatment with
23 mW/cm2 after 24 hours of harvesting time. In contrast to this, Oh, P.S., et al., 2014
82 obtained opposing trends in their investigation while assessing the effects of blue
light on melanoma cells. They found the induction of apoptotic cell death by a
mitochondrial-mediated pathway. The authors also observed an increase in
phosphorylation of p53 in the early phase of irradiation, which decreased after long
exposure times.
Although an overall, up-regulation was observed in the apoptosis pathway for
moderately and darkly pigmented NHEM. As well as, p53 signalling pathway showed
a slight up-regulation for darkly pigmented NHEM but it was not significant. All these
observations might be the reason for more cell death for darkly pigmented NHEM cells
noticed in flow cytometry results, followed by moderately pigmented NHEM cells.
Moreover, the TNF signalling pathway is up-regulated for both the NHEM cells,
suggesting a possible increase in inflammation. Also the NF-κB pathway is up-
regulated in moderately pigmented, which is involved in inflammation and induced
responses. Hence, there is a stimulation of regulated mechanisms to remove
unwanted and damaged components. Pathways like autophagy, phagosome,
mitophagy, lysosome and ferroptosis were up-regulated in moderately pigmented cells.

5. Discussion - 69 -
An acceleration in these pathways occurs for the removal of cell debris and further
cleansing. Cytokine-cytokine receptor interaction is up-regulated as well, which
enhances the restoration of homeostasis. Likewise, up-regulation of cell adhesion
molecules (CAMs) add to that and are up-regulated. They are known to play an
important role in homeostasis, immune response and inflammation 83. This could also
further add to the reason for more pathways related to cancer, immune disease and
infectious disease being significantly up-regulated in moderately pigmented NHEM.
5.4 Blue lights increases ATP amount
So far, with the available knowledge from the current research reported on PBM
mechanisms, it is clear that mitochondria are inevitably affected by it. Mitochondria are
known as the “powerhouse of the cell” as they are involved in energy generation in the
form of ATP, which is obtained via the process of oxidative phosphorylation. PBM has
been attributed to act directly on the complex IV (also known as cytochrome c oxidase)
of the cellular respiratory chain that is located in the mitochondrial membrane 84. To
assess the PBM effects on NHEM using the selected dose for this study, we performed
an ATP assay based on luminescence. Our findings suggested a significant increase
in ATP levels 24 and 48 hours of harvesting after irradiation for all skin phototype
NHEM. In accordance with Liebmann, J., et al., 2010 85, who have provided evidence
that the cellular ATP was elevated after blue light (453 nm) irradiation.
In the gene expression analysis, an up-regulation was observed in oxidative
phosphorylation and glycolysis or gluconeogenesis pathways, which is in accordance
with the results obtained from ATP measurements.
5.5 Blue light increases ROS level
Reactive oxygen species (ROS) are considered as an important secondary messenger
for downstream signalling. PBM has been reported to alter the cell redox potential,
which accounts for the primary changes induced by light 13. Flavins and Flavin-
containing cytochrome 86 found within the mitochondrial respiratory chain are known
to be excited by blue light and produce ROS 87, 88. Further, to investigate the role of
blue light treatment on the mitochondrial function, the redox status analysis of the cell
is an important step. Hence, to estimate the changes in the redox level in NHEM using

5. Discussion - 70 -
the selected dose for this study, we utilized live redox sensor Grx1-roGFP3. Different
dyes and chemicals used to assess the level of ROS changes in the system have many
disadvantages and, therefore this sensor was transduced into our cells to measure
real-time changes inside the cell after irradiation with our respective dose 64.8 J/cm2.
For all the skin phototype NHEM, maximum acceleration in ROS levels were seen
immediately after the irradiation, and from 30 min to 2 hours, there is an exponential
decrease. Whereas after two hours of the light treatment, the levels start shifting
towards the basal level and finally, after six hours after irradiation, the curve flattens
completely. Rohringer, S. et al. 89 showed that only blue (475 nm) LED light induced a
significant increase in ROS production, whereas the red (635 nm) and green (516 nm)
LED light did not result in a significant increase in ROS formation in the endothelial
cells. Similar results were also communicated by Liebel, F. et L: 90 about the significant
increase in ROS production following exposure to visible light (400-700 nm).
Conspicuously, the replication and repair pathways are significantly down-regulated,
indicating the possibility of the stress level being well maintained by the cellular system.
This is also reflected by the quick reduction in the rapid ROS increase observed shortly
after irradiation, which might rely on the concept of ‘mitohormesis’ (mitochondrial
hormesis). It is well known that the mitochondria are an important source of ROS within
the mammalian cells 91. Besides, the mitochondrial respiratory chain has the
photoacceptors or chromophores for blue light absorption 92, 86, 93. ROS are the
signalling molecules, produced in mitochondria due to stress, and this triggers the
retrograde response. This process results in transcriptional changes in the nucleus,
which in turn activates the cellular defense mechanism, serving as the protective shield
and prevent further damage to the cell.
Besides, this process also activates detoxification routes that finally result in alleviation
of the initial signalling molecules, and this might explain the fast recovery of the sudden
burst in ROS in NHEM. In more detail, expression of genes like SDHA, COX4I1,
COX5A, COX5B, ATP5F1A, ATP6V1A that encodes for the mitochondrial respiratory
chain complexes I-V were found to be up-regulated after blue light treatment. That led
to an increase in energy metabolism and as a result, an up-regulation in oxidative
phosphorylation was observed. This was confirmed in the ATP measurements with an
increase in the ATP amount for NHEM. This might also trigger the AMPK system, which
acts as a sensor of the cellular energy status and is activated by oxidative stress as

5. Discussion - 71 -
well. Which further results in an activation of FOXOs via phosphorylation. This is
reflected in an overall up-regulation in AMPK and FOXO signalling pathways of NHEM.
Additionally, to assert the assumption of counteracting the oxidative stress, the
metabolism of xenobiotics by cytochrome P450 was observed to be significantly up-
regulated in NHEM 48 hours after irradiation with blue light. Nrf2, a critical transcription
factor known to activate a group of stress-dependent genes and a key enhancer of
cytoprotective genes to oxidative stress as well as a potential target of AMPK. In the
inactive state, Nrf2 is bound to Kelch-like ECH-associated protein 1 (Keap1). Upon
inactivation of the latter, Nrf2 translocates to the nucleus and binds to the antioxidant
response element (ARE). Finally, this triggers the activation of transcription of genes
involved in xenobiotic metabolism and disposition, anti-oxidant defense and redox
signalling.
Moreover, the enzyme tyrosinase is known to use superoxide radical as a substrate
for melanogenesis and this might have a role in protecting melanocytes from the
harmful effects of ROS 94, 95. Hence, showing that melanin can act as photosensitizer
96, 97. Melanin has been reported to be an important regulator to balance ROS in
melanocytes that could alter the response of melanocytes to arsenic and UV radiation
when compared to keratinocytes 98, 99. Thus, melanocytes have the mechanism to
manage ROS to prevent DNA damage.
The results obtained from redox changes showed a higher increase in the amount of
ROS formation in the darkly pigmented NHEM as compared to the other two skin
phototype NHEM, which could possibly explain the higher number of dead cells
following blue light treatment as measured by flow cytometry.
5.6 AHR as a possible target for oxidative stress management from blue light
Moreover, after 48 hours of blue light treatment, gene expression revealed a strong
and significant up-regulation of CYP1B1, as well as an up-regulation of the CYP1A1
gene. They are crucial in the detoxification of polycyclic aromatic compounds like
polycyclic aromatic hydrocarbons (PAHs) and halogenated aromatic hydrocarbons
(HAHs), for example, 2,3,7,8-tetrachlorodibenzo-para-dioxin (TCDD) 100, 101, whose
activation can be extensively toxic due to production of highly reactive electrophiles,
termed as reactive oxygen metabolites (ROMs) 102. Both CYP1B1 and CYP1A1 are

5. Discussion - 72 -
regulated by AHR, which is a basic-helix/loop/helix per-Arnt-sim (bHLH/PAS)
superfamily member and a ligand-activated transcription factor. Significant up-
regulation of the AHR pathway in NHEM after blue light treatment was noted from
KEGG pathways.
AHR senses numerous intracellular and extracellular signals including endogenous
compounds, foreign chemicals, gas molecules, gravity, heat, osmotic pressure,
photons (light) 103, oxygen level, redox potential and changes to circadian rhythm,
control adaptation to the cellular environment 104. Its role in the cellular response to
light has been reported 105, 106. Tyrosine and tryptophan are known to absorb UV
radiation or visible light and even a stronger absorption observed for tryptophan,
making it more susceptible to photolytic destruction 107. The photoproducts formed as
a result include 6-formylindolo[3,2-b]carbazole (FICZ) and 6, 12-diformylindolo[3, 2-
B]carbazole (dFICZ) 108, 109. Amongst these two photoproducts, FICZ has a stronger
affinity for AHR.
The skin epidermis has an abundant source of amino acid-like tryptophan (Trp) and
upon irradiation (90 min, 64.8 J/cm2) of human melanocytes with blue light (453 nm),
Trp might be photo-oxidized to produce photo products like TCDD; FICZ or dFICZ that
act as major AHR ligands and CYP1 substrates 110, 111, 78. AHR in its non-activated
state is located in the cytoplasm and upon activation by a ligand, it translocates into
the nucleus. In the nucleus, it binds with ARNT to form the active heterodimer. This
heterodimer is known to bind further to xenobiotics response elements (XRE) to
modulate the expression of targets 112. This, in turn, up-regulates the transcription of a
battery of xenobiotic-metabolizing enzymes (XMEs) 113, which are termed as ‘AHR
gene battery’.
Amongst these, CYP1A1, CYP1A2, CYP1B1, NQO1 and ALDH3A1 are involved in
phase I and UGT1A, GSTA1 in phase II of xenobiotic metabolism 102, 114.
Apart from CYP1B1 and CYP1A1, in our data set, gene expression analysis also
revealed the up-regulation of other genes, NQO1, ALDH8A1, GSTT2B in NHEM after
blue light treatment. NQO1 has been extensively studied for its role in chemoprotection
102, 103 and ALDH8A1 is involved in tryptophan catabolism 115. Whereas, GSTT2B is
part of the phase II XMEs known for cellular detoxification. Also pathways like chemical
carcinogenesis, metabolism of cytochrome P450, steroid hormone biosynthesis and
tryptophan metabolism were found to be up-regulated in NHEM following blue light

5. Discussion - 73 -
treatment. These observations further affirm the role of AHR being involved as a sensor
of blue light. Similar findings have been reported by Becker, A., et al., 2016 81, showing
that blue light (453 nm) exposed keratinocytes had a significant increase in the
transcription of genes related to the electron transport chain, cytochrome P450-related
genes as well as steroid hormone synthesis related genes.
Besides AHR, AHRR was also observed to be slightly up-regulated. The latter differs
from AHR as it has a trans-repressor domain at C-terminal domain whereas AHR and
ARNT have a transactivation domain at the same terminal. As a result, it can suppress
AHR activity by binding to ARNT and XRE 116. Hence, this serves as a negative
regulatory loop to maintain homeostasis 112.
Correspondingly, AHR-activated CYP1 enzymes might play an interesting role in
regulating pigmentation in melanocytes. It has been reported that AHR regulates the
process of melanogenesis by coordinating the expression of melanogenic enzymes
117, 118, 119, as well as it might be also be involved in protecting melanocytes from
oxidative damage by promoting mitochondrial biogenesis 120. This is in line with our
gene expression results wherein an up-regulation of the AHR pathway as well as
related genes like CYP1B1 was observed and hence underlining the role of AHR in
modulating the melanin content.
5.7 Conclusion and outlook
We have provided an overview of the effects of PBM using blue light (453 nm) dose
64.8 J/cm2 on human melanocytes, which revealed major cellular changes including
induction of melanogenesis with no significant cell death via apoptosis as well as an
increase in ATP and ROS level, the most persistent and significant findings reported
after light treatment. Furthermore, gene expression analysis highlighted the role of
AHR and its gene battery in response to oxidative stress for detoxification process post
blue light treatment, besides the possibility of its role in the regulation of the
melanogenic enzymes as well.
Additionally, all the three skin phototype NHEM cells illustrated almost the same overall
outcome for different assays conducted in vitro as well as gene expression results
showed the same regulation for different significant genes and pathways. Although still
some variations were noticed in a few results. These variations could be attributed to
the fact that these cells were obtained from different donors.

5. Discussion - 74 -
Nevertheless, this study supports some initial interesting findings as an effect of PBM
using blue light on melanocytes, which could have a potential implication for
hypopigmentary disorders like vitiligo, depigmented lesions or scars. However, further
experiments with more cell lines and donors are necessary to validate these outcomes.

6. Summary - 75 -
6. Summary
In this study, we assessed the impact of PBM using blue light on melanocytes. Blue
light wavelength belongs to the shorter wavelength range in the electromagnetic
spectrum and is the nearest one to UV radiation. The effects of UV radiation on the
skin has been studied in great depth, but in the last decade, the focus has started to
shift towards understanding the role of the shorter wavelength range on the human
body and even other wavelengths belonging to VIS light spectrum. VIS light represents
almost half of the solar light coming on the earth. It has been shown that low levels of
VIS and NIR light can have beneficial effects, and therefore, it is being used to treat
various conditions and diseases in the medical field. In the past, the use of this therapy
has progressed but still, there is a lot that needs to be studied to unravel the cellular
and molecular mechanisms involved to assess the effects as a whole. From the
literature search, it was noted that in the skin, the consequences of blue light on
keratinocytes and fibroblasts have been explored more as compared to melanocytes.
Wide ranges of inhibitory and stimulatory effects on biological processes have been
reported. At the same time, these outcomes might not be the same for every cell type
as different irradiation parameters can bring out different impact and every cell has
own mechanisms to deal with varied type and amount of stimuli. Hence, this study
aimed to evaluate the effects of blue light wavelength (453 nm) on melanocytes.
In vitro experiments were carried out using NHEM cells with the application of different
doses of blue light to assess the dose-effect, which resulted in a biphasic dose-
response curve. Next, blue light was tested in NHEM cells for its response on melanin
production following 90 min of irradiation with a dose of 64.8 J/cm2, the cells were
harvested 48 hours after irradiation and an increased melanin concentration was
noted. The same results occurred in all the three pigmented skin phototype of NHEM
cells. Further, this dose was selected, and other parameters were evaluated, for
example, possible induction of apoptosis, influence on ATP level and consequences
on the redox status of the cells. No significant apoptosis was induced, and an increase
in the ATP level was identified as well as the ROS production increased with a sudden
burst immediately after irradiation and later with time, it shifted to basal levels.
Finally, gene expression analysis was performed, which revealed an array of genes
and pathways explaining the other in vitro data. Pathways like glycolysis and oxidative
phosphorylation were up-regulated, reflecting the results of ATP measurements.

6. Summary - 76 -
Moreover, the overall pattern for the pathways related to cell growth and death was
down-regulated, and apoptosis pathway itself was not significantly regulated, which is
reflected by the FACS analysis where no significant apoptosis was observed.
Additionally the caspase cascade was slightly down-regulated. The utmost important
gene CYP1B1 was strongly significantly up-regulated. This gene belongs to ‘AHR gene
battery’, involved in the production of phase I and phase II enzymes of xenobiotic
metabolism. They are well known for their role in preventing damage due to oxidative
stress. This outcome is in line with the observation obtained from ROS measurements.
Thus, an increase in ROS levels activates the ‘AHR gene battery’ triggering the anti-
inflammatory response as also downstream pathways like the steroid hormone
synthesis. Furthermore, an increase in the melanogenesis pathway and tyrosine
metabolism was noted, which is in agreement with the increase in melanin content
assay. Moreover, gene expression profiles revealed an up-regulation of tyrosinase
enzyme, AHR pathway as well as tryptophan metabolism. All these findings suggest
the possible role of AHR as a potential regulator of xenobiotic effects in human
melanocytes on exposure to blue light dose (64.8 J/cm2) via photo-oxidation of
tryptophan and possibly mediating pigmentation by modulating the melanogenic
enzymes.

7. References - 77 -
7. References
1. U.S. National Library of Medicine: Fact Sheet Medical Subject Headings (MeSH®).
2015. Online: http://wayback.archive-it.org/org-350/20180312141553/https://–
www.nlm.nih.gov/pubs/factsheets/mesh.html, Stand: 29.06.2020.
2. Arany, PR: Photobiomodulation: poised from the fringes. Photomed Laser Surg, 30:
507-509, 2012.
3. Anders, JJ, Lanzafame, RJ, Arany, PR: Low-level light/laser therapy versus
photobiomodulation therapy. Photomed Laser Surg, 33: 183-184, 2015.
4. Nobel Media: Niels Ryberg Finson - Biographical. 2020. Online:
https://www.nobelprize.org/prizes/medicine/1903/finsen/biographical/, Stand:
23.06.2020.
5. Mester, E, Szende, B, Tota, JG: Effect of laser on hair growth of mice. Kiserl
Orvostud, 19: 628-631, 1967.
6. Mester, E, Szende, B, Gärtner, P: [The effect of laser beams on the growth of hair
in mice]. Radiobiol Radiother (Berl), 9: 621-626, 1968.
7. Mester, E, Nagylucskay, S, Döklen, A, Tisza, S: Laser stimulation of wound healing.
Acta Chir Acad Sci Hung, 17: 49-55, 1976.
8. Hadis, MA, Zainal, SA, Holder, MJ, Carroll, JD, Cooper, PR, Milward, MR, Palin,
WM: The dark art of light measurement: accurate radiometry for low-level light
therapy. Lasers Med Sci, 31: 789-809, 2016.
9. Chung, H, Dai, T, Sharma, SK, Huang, YY, Carroll, JD, Hamblin, MR: The nuts and
bolts of low-level laser (light) therapy. Ann Biomed Eng, 40: 516-533, 2012.
10. Verhoeven, G: The reflection of two fields – electromagnetic radiation and its role
in (aerial) imaging. AARGnews, 55: 13-18, 2017.
11. Diffey, B, Kochevar, I: Basic principles of photobiology. In: Photodermatology.
edited by HENRY, W. L., New York [u.a.], Informa healthcare, 2007, pp 15-27.
12. Sutherland, J: Biological effects of polychromatic light. Photochem Photobiol, 76:
164-170, 2002.
13. Karu, TI: Primary and secondary mechanisms of action of visible to near-IR
radiation on cells. J Photochem Photobiol B, 49: 1-17, 1999.
14. Sowa, P, Rutkowska-Talipska, J, Rutkowski, K, Kosztyla-Hojna, B, Rutkowski, R.:
Optical radiation in modern medicine. Postepy Dermatol Alergol, 30: 246-251,
2013.

7. References - 78 -
15. Huang, YY, Chen, AC, Carroll, JD, Hamblin, MR: Biphasic dose response in low
level light therapy. Dose Response, 7: 358-383, 2009.
16. Karu, TI: Cellular and molecular mechanisms of photobiomodulation (Low-Power
Laser Therapy). IEEE J Sel Top Quantum Electron, 20: 143-148, 2014.
17. Giese, AC: Photosensitization of organisms with special reference to natural
photosensitizers. In: Lasers in Biology and Medicine. edited by HILLENKAMPF
F, P. R., SACCHI C, New York: Plenum press, 1980, pp 299-314.
18. Spikes, JD: Photosensitization. In: The Science of Photobiology, 2nd edition.
edited by SMITH, K. C., New York: Plenum Press, 1989, pp 79-111.
19. Karu, TI, Pyatibrat, LV, Kolyakov, SF, Afanasyeva, NI: Absorption measurements
of cell monolayers relevant to mechanisms of laser phototherapy: reduction or
oxidation of cytochrome c oxidase under laser radiation at 632.8 nm. Photomed
Laser Surg, 26: 593-599, 2008.
20. Karu, TI: Multiple roles of cytochrome c oxidase in mammalian cells under action
of red and IR-A radiation. IUBMB Life, 62: 607-610, 2010.
21. Hamblin, MR: Mechanisms and applications of the anti-inflammatory effects of
photobiomodulation. AIMS Biophys, 4: 337-361, 2017.
22. Avci, P, Gupta, A, Sadasivam, M, Vecchio, D, Pam, Z, Pam, N, Hamblin, MR: Low-
level laser (light) therapy (LLLT) in skin: stimulating, healing, restoring. Semin
Cutan Med Surg, 32: 41-52, 2013.
23. Haake, A, Holbrook, K: The structure and development of skin. In: Fitzpatrick's
dermatology in general medicine. edited by FREEDBERG, I. M.,
FITZPATRICK, T. B., New York, McGraw-Hill, Health Professions Division,
1999, pp 70-114.
24. Kolarsick, PAJ, Kolarsick, MA, Goodwin, C: Anatomy and physiology of the skin. J
Dermatol Nurses Assoc, 3: 203-213, 2011.
25. Lucas, JB: The physiology and biomechanics of skin flaps. Facial Plast Surg Clin
North Am, 25: 303-311, 2017.
26. Kanitakis, J: Anatomy, histology and immunohistochemistry of normal human skin.
Eur J Dermatol, 12: 390-399, 2002.
27. Seifert, AW, Maden, M: New insights into vertebrate skin regeneration. Int Rev Cell
Mol Biol, 310: 129-169, 2014.

7. References - 79 -
28. Freinkel, RK, Woodley, DT: The biology of the skin, New York, NY, Parthenon,
2001.
29. Wong, R, Geyer, S, Weninger, W, Guimberteau, JC, Wong, JK: The dynamic
anatomy and patterning of skin. Exp Dermatol, 25: 92-98, 2016.
30. Menon, GK: New insights into skin structure: scratching the surface. Adv Drug Deliv
Rev, 54: S3-S17, 2002.
31. Cichorek, M, Wachulska, M, Stasiewicz, A, Tyminska, A: Skin melanocytes: biology
and development. Postepy Dermatol Alergol, 30: 30-41, 2013.
32. Plonka, PM, Passeron, T, Brenner, M, Tobin, DJ, Shibahara, S, Thomas, A,
Slominski, A, Kadekaro, AL, Hershkovitz, D, Peters, E, Nordlund, JJ, Abdel-
Malek, Z, Takeda, K, Paus, R, Ortonne, JP, Hearing, VJ, Schallreuter, KU: What
are melanocytes really doing all day long...? Exp Dermatol, 18: 799-819, 2009.
33. Goding, CR: Melanocytes: The new Black. Int J Biochem Cell Biol, 39: 275-279,
2007.
34. Seiji, M, Fitzpatrick, TB: The reciprocal relationship between melanization and
tyrosinase activity in melanosomes (melanin granules). J Biochem, 49: 700-
706, 1961.
35. Kobayashi, N, Nakagawa, A, Muramatsu, T, Yamashina, Y, Shirai, T, Hashimoto,
MW, Ishigaki, Y, Ohnishi, T, Mori, T: Supranuclear melanin caps reduce
ultraviolet induced DNA photoproducts in human epidermis. J Invest Dermatol,
110: 806-810, 1998.
36. Yamaguchi, Y, Brenner, M, Hearing, VJ: The regulation of skin pigmentation. J Biol
Chem, 282: 27557-27561, 2007.
37. Haass, NK, Herlyn, M: Normal human melanocyte homeostasis as a paradigm for
understanding melanoma. J Investig Dermatol Symp Proc, 10: 153-163, 2005.
38. Miot, LD, Miot, HA, Silva, MG, Marques, ME: Fisiopatologia do melasma
[Physiopathology of melasma]. An Bras Dermatol, 84: 623-635, 2009.
39. Simon, JD, Peles, D, Wakamatsu, K, Ito, S: Current challenges in understanding
melanogenesis: bridging chemistry, biological control, morphology, and
function. Pigment Cell Melanoma Res, 22: 563-579, 2009.
40. Kauser, S, Schallreuter, KU, Thody, AJ, Gummer, C, Tobin, DJ: Regulation of
human epidermal melanocyte biology by beta-endorphin. J Invest Dermatol,
120: 1073-1080, 2003.

7. References - 80 -
41. Pfeifer, GP, Besaratinia, A: UV wavelength-dependent DNA damage and human
non-melanoma and melanoma skin cancer. Photochem Photobiol Sci, 11: 90-
97, 2012.
42. Sage, E, Girard, P-M, Francesconi, S: Unravelling UVA-induced mutagenesis.
Photochem Photobiol Sci, 11: 74-80, 2012.
43. Ash, C, Dubec, M, Donne, K, Bashford, T: Effect of wavelength and beam width on
penetration in light-tissue interaction using computational methods. Lasers Med
Sci, 32: 1909-1918, 2017.
44. Baron, ED, Suggs, AK: Introduction to photobiology. Dermatol Clin, 32: 255-266,
vii, 2014.
45. Garza, ZCF, Born, M, Hilbers, PAJ, van Riel, NAW, Liebmann, J: Visible blue light
therapy: Molecular Mechanisms and Therapeutic Opportunities. Curr Med
Chem, 25: 5564-5577, 2018.
46. Zhao, ZC, Zhou, Y, Tan, G, Li, J: Research progress about the effect and
prevention of blue light on eyes. Int J Ophthalmol, 11: 1999-2003, 2018.
47. Kleinpenning, MM, Smits, T, Frunt, MHA, van Erp, PEJ, van de Kerkhof, PCM,
Gerritsen, RMJP: Clinical and histological effects of blue light on normal skin.
Photodermatol Photoimmunol Photomed, 26: 16-21, 2010.
48. Kushibiki, T, Tajiri, T, Ninomiya, Y, Awazu, K: Chondrogenic mRNA expression in
prechondrogenic cells after blue laser irradiation. J Photochem Photobiol B, 98:
211-215, 2010.
49. Lavi, R, Ankri, R, Sinyakov, M, Eichler, M, Friedmann, H, Shainberg, A, Breitbart,
H, Lubart, R: The plasma membrane is involved in the visible light-tissue
interaction. Photomed Laser Surg, 30: 14-19, 2012.
50. Kushibiki, T, Hirasawa, T, Okawa, S, Ishihara, M: Blue laser irradiation generates
intracellular reactive oxygen species in various types of cells. Photomed Laser
Surg, 31: 95-104, 2013.
51. Buravlev, EA, Zhidkova, TV, Vladimirov, YA, Osipov, AN: Effects of laser and LED
radiation on mitochondrial respiration in experimental endotoxic shock. Lasers
Med Sci, 28: 785-790, 2013.
52. Duteil, L, Cardot-Leccia, N, Queille-Roussel, C, Maubert, Y, Harmelin, Y, Boukari,
F, Ambrosetti, D, Lacour, JP, Passeron, T: Differences in visible light-induced
pigmentation according to wavelengths: a clinical and histological study in

7. References - 81 -
comparison with UVB exposure. Pigment Cell Melanoma Res, 27: 822-826,
2014.
53. AlGhamdi, KM, Kumar, A, Ashour, AE, AlGhamdi, AA: A comparative study of the
effects of different low-level lasers on the proliferation, viability, and migration of
human melanocytes in vitro. Lasers Med Sci, 30: 1541-1551, 2015.
54. AlGhamdi, KM, Kumar, A, Al-Ghamdi, AA, Al-Rikabi, AC, Mubarek, M, Ashour, AE:
Ultra-structural effects of different low-level lasers on normal cultured human
melanocytes: an in vitro comparative study. Lasers Med Sci, 31: 1819-1825,
2016.
55. Bennet, D, Viswanath, B, Kim, S, An, JH: An ultra-sensitive biophysical risk
assessment of light effect on skin cells. Oncotarget, 8: 47861-47875, 2017.
56. Yuan, Y, Yan, G, Gong, R, Zhang, L, Liu, T, Feng, C, Du, W, Wang, Y, Yang, F, Li,
Y, Guo, S, Ding, F, Ma, W, Idiiatullina, E, Pavlov, V, Han, Z, Cai, B, Yang, L:
Effects of blue light emitting diode irradiation on the proliferation, apoptosis and
differentiation of bone marrow-derived mesenchymal stem cells. Cell Physiol
Biochem, 43: 237-246, 2017.
57. Nakashima, Y, Ohta, S, Wolf, AM: Blue light-induced oxidative stress in live skin.
Free Radic Biol Med, 108: 300-310, 2017.
58. Regazzetti, C, Sormani, L, Debayle, D, Bernerd, F, Tulic, MK, De Donatis, GM,
Chignon-Sicard, B, Rocchi, S, Passeron, T: Melanocytes sense blue light and
regulate pigmentation through Opsin-3. J Invest Dermatol, 138: 171-178, 2018.
59. Mignon, C, Uzunbajakava, NE, Castellano-Pellicena, I, Botchkareva, NV, Tobin,
DJ: Differential response of human dermal fibroblast subpopulations to visible
and near-infrared light: Potential of photobiomodulation for addressing
cutaneous conditions. Lasers Surg Med, 50: 859-882, 2018.
60. Kuch, N: Co-cultures of fibroblasts and keratinocytes under the influence of blue
light. Medical Research Center. Hochschule Mannheim, University of Applied
Sciences, 2016.
61. Backman, TWH, Girke, T: systemPipeR: NGS workflow and report generation
environment. BMC Bioinformatics, 17: 388, 2016.
62. Bray, NL: Fast RNA-seq quantification. Nat Biotechnol, 34: 525-527, 2016.
63. Gu, Z, Eils, R, Schlesner, M: Complex heatmaps reveal patterns and correlations
in multidimensional genomic data. Bioinformatics 32: 2847-2849, 2016.

7. References - 82 -
64. Sergushichev, AA: An algorithm for fast preranked gene set enrichment analysis
using cumulative statistic calculation. bioRxiv: 060012, 2016.
65. Geistlinger, L, Csaba, G, Zimmer, R: Bioconductor’s enrichment browser:
seamless navigation through combined results of set- & network-based
enrichment analysis. BMC Bioinformatics, 17: 45, 2016.
66. Dweep, H, Sticht, C, Kharkar, A, Pandey, P, Gretz, N: Parallel analysis of mRNA
and microRNA microarray profiles to explore functional regulatory patterns in
polycystic kidney disease: Using PKD/Mhm Rat Model. PLoS One, 8: e53780,
2013.
67. Scudiero, DA, Shoemaker, RH, Paull, KD, Monks, A, Tierney, S, Nofziger, TH,
Currens, MJ, Seniff, D, Boyd, MR: Evaluation of a soluble tetrazolium/formazan
assay for cell growth and drug sensitivity in culture using human and other tumor
cell lines. Cancer Res Treat, 48: 4827-4833, 1988.
68. Lanzafame, RJ, Stadler, I, Andrew, F, Connelly, R, Peter, STA, Brondon, P, Olson,
D: Reciprocity of exposure time and irradiance on energy density during
photoradiation on wound healing in a murine pressure ulcer model. Lasers Surg
Med, 39: 534-542, 2007.
69. Schulz, H: Über die Theorie der Arzneimittelwirkung. In, Virchows Archiv, 1877, pp
423-434.
70. Schulz, H: Über Hefegifte. In, Pflügers Archiv Gesammte Physiologie, 1888, pp
517-541.
71. Castellano-Pellicena, I, Uzunbajakava, NE, Mignon, C, Raafs, B, Botchkarev, VA,
Thornton, MJ: Does blue light restore human epidermal barrier function via
activation of Opsin during cutaneous wound healing? Lasers Surg Med, 51:
370-382, 2019.
72. Lai, X, Wichers, HJ, Soler-Lopez, M, Dijkstra, BW: Structure and function of human
tyrosinase and tyrosinase-related proteins. Chemistry (Easton), 24: 47-55,
2018.
73. D'Mello, SA, Finlay, GJ, Baguley, BC, Askarian-Amiri, ME: Signaling pathways in
melanogenesis. Int J Mol Sci, 17, 2016.
74. Kitano, Y, Hu, F: Melanin versus protein synthesis in melanocytes in vitro. Exp Cell
Res, 64: 83-88, 1971.

7. References - 83 -
75. Rinchik, EM, Bultman, SJ, Horsthemke, B, Lee, S-T, Strunk, KM, Spritz, RA,
Avidano, KM, Jong, MTC, Nicholls, RD: A gene for the mouse pink-eyed dilution
locus and for human type II oculocutaneous albinism. Nature, 361: 72-76, 1993.
76. Puri, N, Brillant, M: The function of the pink-eyed dilution protein. Pigment Cell Res,
11: 174, 1998.
77. Yang, Q, Yi, S, Li, M, Xie, B, Luo, J, Wang, J, Rong, X, Zhang, Q, Qin, Z, Hang, L,
Feng, S, Fan, X: Genetic analyses of oculocutaneous albinism types 1 and 2
with four novel mutations. BMC Med Genet, 20: 106, 2019.
78. Hamblin, MR: Mechanisms and Mitochondrial redox signaling in
photobiomodulation. Photochem Photobiol, 94: 199-212, 2018.
79. Serrage, H, Heiskanen, V, Palin, WM, Cooper, PR, Milward, MR, Hadis, M,
Hamblin, MR: Under the spotlight: mechanisms of photobiomodulation
concentrating on blue and green light. Photochem Photobiol Sci, 18: 1877-
1909, 2019.
80. Gu, Q, Wang, L, Huang, F, Schwarz, W: Stimulation of TRPV1 by Green laser light.
Evid Based Complement Alternat Med, 2012: 857123, 2012.
81. Becker, A, Klapczynski, A, Kuch, N, Arpino, F, Simon-Keller, K, De La Torre, C,
Sticht, C, van Abeelen, FA, Oversluizen, G, Gretz, N: Gene expression profiling
reveals aryl hydrocarbon receptor as a possible target for photobiomodulation
when using blue light. Sci Rep, 6: 33847, 2016.
82. Oh, PS, Na, KS, Hwang, H, Jeong, HS, Lim, S, Sohn, MH, Jeong, HJ: Effect of
blue light emitting diodes on melanoma cells: involvement of apoptotic signaling.
J Photochem Photobiol B, 142: 197-203, 2015.
83. Harjunpaa, H, Llort Asens, M, Guenther, C, Fagerholm, SC: Cell adhesion
molecules and their roles and regulation in the immune and tumor
microenvironment. Front Immunol, 10: 1078, 2019.
84. Karu, TI: Laser biostimulation: a photobiological phenomenon. J Photochem
Photobiol B, 3: 638-640, 1989.
85. Liebmann, J, Born, M, Kolb-Bachofen, V: Blue-light irradiation regulates
proliferation and differentiation in human skin cells. J Invest Dermatol, 130: 259-
269, 2010.
86. Cooper, GM, Hausman, RE: The cell: a molecular approach, Washington, DC,
ASM Press, 2007.

7. References - 84 -
87. Swartz, TE, Corchnoy, SB, Christie, JM, Lewis, JW, Szundi, I, Briggs, WR,
Bogomolni, RA: The photocycle of a flavin-binding domain of the blue light
photoreceptor phototropin. J Biol Chem, 276: 36493-36500, 2001.
88. Cheon, MW, Kim, TG, Lee, YS, Kim, SH: Low level light therapy by Red–Green–
Blue LEDs improves healing in an excision model of Sprague–Dawley rats. Pers
Ubiquit Comput, 17: 1421-1428, 2012.
89. Rohringer, S, Holnthoner, W, Chaudary, S, Slezak, P, Priglinger, E, Strassl, M, Pill,
K, Muhleder, S, Redl, H, Dungel, P: The impact of wavelengths of LED light-
therapy on endothelial cells. Sci Rep, 7: 10700, 2017.
90. Liebel, F, Kaur, S, Ruvolo, E, Kollias, N, Southall, MD: Irradiation of skin with visible
light induces reactive oxygen species and matrix-degrading enzymes. J Invest
Dermatol, 132: 1901-1907, 2012.
91. Murphy, MP: How mitochondria produce reactive oxygen species. Biochem J, 417:
1-13, 2009.
92. Bouly, JP, Schleicher, E, Dionisio-Sese, M, Vandenbussche, F, Van der Straeten,
D, Bakrim, N, Meier, S, Batschauer, A, Galland, P, Bittl, R, Ahmad, M:
Cryptochrome blue light photoreceptors are activated through interconversion
of flavin redox states. J Biol Chem, 282: 9383-9391, 2007.
93. Osborne, NN, Núñez-Álvarez, C, Del Olmo-Aguado, S: The effect of visual blue
light on mitochondrial function associated with retinal ganglions cells. Exp Eye
Res, 128: 8-14, 2014.
94. Videira IF, MD, Magina S: Mechanisms regulating melanogenesis. An Bras
Dermatol, 88: 76-83, 2013.
95. Tsatmali, M, Ancans, J, Thody, AJ: Melanocyte function and its control by
melanocortin peptides. J Histochem Cytochem, 50: 125-133, 2002.
96. Slominski A, TD, Shibahara S, Wortsman J: Melanin pigmentation in mammalian
skin and its hormonal regulation. Physiol Rev, 84: 1155-1228, 2004.
97. Chiarelli-Neto, O, Ferreira, AS, Martins, WK, Pavani, C, Severino, D, Faião-Flores,
F, Maria-Engler, SS, Aliprandini, E, Martinez, GR, Di Mascio, P, Medeiros,
MHG, Baptista, MS: Melanin photosensitization and the effect of visible light on
epithelial cells. PLoS One, 9: e113266-e113266, 2014.
98. Suzukawa, AA, Vieira, A, Winnischofer, SM, Scalfo, AC, Mascio, PD, da Costa
Ferreira, AM, Ravanat, J-C, de Luna Martins, D, Rocha, MEM, Martinez, GR:

7. References - 85 -
Novel properties of melanins include promotion of DNA strand breaks,
impairment of repair, and reduced ability to damage DNA after quenching of
singlet oxygen. Free Radic Biol Med, 52: 1945-1953, 2012.
99. Jenkins, NC, Grossman, D: Role of melanin in melanocyte dysregulation of reactive
oxygen species. Biomed Res Int, 2013: 908797-908797, 2013.
100. Mimura, J, Fujii-Kuriyama, Y: Functional role of AhR in the expression of toxic
effects by TCDD. Biochim Biophys Acta, 1619: 263-268, 2003.
101. Nebert, DW, Dalton, TP, Okey, AB, Gonzalez, FJ: Role of aryl hydrocarbon
receptor-mediated induction of the CYP1 enzymes in environmental toxicity and
cancer. J Biol Chem, 279: 23847-23850, 2004.
102. Nebert, DW, Roe, AL, Dieter, MZ, Solis, WA, Yang, Y, Dalton, TP: Role of the
aromatic hydrocarbon receptor and [Ah] gene battery in the oxidative stress
response, cell cycle control, and apoptosis. Biochem Pharmacol, 59: 65-85,
2000.
103. Nebert, DW: Aryl hydrocarbon receptor (AHR): "pioneer member" of the basic-
helix/loop/helix per-Arnt-sim (bHLH/PAS) family of "sensors" of foreign and
endogenous signals. Prog Lipid Res, 67: 38-57, 2017.
104. Rothhammer, V, Quintana, FJ: The aryl hydrocarbon receptor: an environmental
sensor integrating immune responses in health and disease. Nat Rev Immunol,
19: 184-197, 2019.
105. Gu, Y-Z, Hogenesch, JB, Bradfield, CA: The PAS Superfamily: Sensors of
environmental and developmental signals. Annu Rev Pharmacol Toxicol, 40:
519-561, 2000.
106. Foley, JF: The arylhydrocarbon receptor sees the light. Sci STKE, 2007: tw182,
2007.
107. Rannug, A, Fritsche, E: The aryl hydrocarbon receptor and light. Biol Chem, 387:
1149-1157, 2006.
108. Rannug, A, Rannug, U, Rosenkranz, HS, Winqvist, L, Westerholm, R, Agurell, E,
Grafström, AK: Certain photooxidized derivatives of tryptophan bind with very
high affinity to the Ah receptor and are likely to be endogenous signal
substances. J Biol Chem, 262: 15422-15427, 1987.

7. References - 86 -
109. Rannug, U, Rannug, A, Sjöberg, U, Li, H, Westerholm, R, Bergman, J: Structure
elucidation of two tryptophan-derived, high affinity Ah receptor ligands. Chem
Biol, 2: 841-845, 1995.
110. Wincent, E, Amini, N, Luecke, S, Glatt, H, Bergman, J, Crescenzi, C, Rannug, A,
Rannug, U: The suggested physiologic aryl hydrocarbon receptor activator and
cytochrome P4501 substrate 6-formylindolo[3,2-b]carbazole is present in
humans. J Biol Chem, 284: 2690-2696, 2009.
111. Smirnova, A, Wincent, E, Vikström Bergander, L, Alsberg, T, Bergman, J,
Rannug, A, Rannug, U: Evidence for new light-independent pathways for
generation of the endogenous aryl hydrocarbon receptor agonist FICZ. Chem
Res Toxicol, 29: 75-86, 2016.
112. Larigot, L, Juricek, L, Dairou, J, Coumoul, X: AhR signaling pathways and
regulatory functions. Biochim Open, 7: 1-9, 2018.
113. Shimada, T: Xenobiotic-Metabolizing Enzymes Involved in activation and
detoxification of carcinogenic polycyclic aromatic hydrocarbons. Drug Metab
Pharmacokinet, 21: 257-276, 2006.
114. Schrenk, D: Impact of dioxin-type induction of drug-metabolizing enzymes on the
metabolism of endo- and xenobiotics. Biochem Pharmacol, 55: 1155-1162,
1998.
115. Davis, I, Yang, Y, Wherritt, D, Liu, A: Reassignment of the human aldehyde
dehydrogenase ALDH8A1 (ALDH12) to the kynurenine pathway in tryptophan
catabolism. J Biol Chem, 293: 9594-9603, 2018.
116. Hahn, ME, Allan, LL, Sherr, DH: Regulation of constitutive and inducible AHR
signaling: complex interactions involving the AHR repressor. Biochem
Pharmacol, 77: 485-497, 2009.
117. Luecke, S, Backlund, M, Jux, B, Esser, C, Krutmann, J, Rannug, A: The aryl
hydrocarbon receptor (AHR), a novel regulator of human melanogenesis.
Pigment Cell Melanoma Res, 23: 828-833, 2010.
118. Jux, B, Kadow, S, Luecke, S, Rannug, A, Krutmann, J, Esser, C: The aryl
hydrocarbon receptor mediates UVB radiation-induced skin tanning. J Invest
Dermatol, 131: 203-210, 2011.

7. References - 87 -
119. Furue, M, Tsuji, G: Chloracne and hyperpigmentation caused by exposure to
hazardous aryl hydrocarbon receptor ligands. Int J Environ Res Public Health,
16: 4864, 2019.
120. Wang, X, Li, S, Liu, L, Jian, Z, Cui, T, Yang, Y, Guo, S, Yi, X, Wang, G, Li, C,
Gao, T, Li, K: Role of the aryl hydrocarbon receptor signaling pathway in
promoting mitochondrial biogenesis against oxidative damage in human
melanocytes. J Dermatol Sci, 96: 33-41, 2019.

8. Appendix - 88 -
8. Appendix Appendix 1. Statistics for Figure 13. Value significantly different for the untreated control
vs treated (90 min) are indicated by nominal p-value <0.05.
Treatment p-value
Untreated control vs 2.5 min <0.0001
Untreated control vs 5 min <0.0001
Untreated control vs 7.5 min <0.0001
Untreated control vs 10 min <0.0001
Untreated control vs 15 min <0.0001
Untreated control vs 20 min <0.0001
Untreated control vs 30 min <0.0001
Untreated control vs 60 min <0.0001
Untreated control vs 90 min <0.0001
Appendix 2. NHEM cell morphology. (A) before staurosporine treatment and (B) after 1 hour (C) after
2 hours, (D) after 4 hours of treatment with staurosporine (1 µm). Phase contrast images acquired using
inverted light microscope with 5x magnification
(A) (B)

8. Appendix - 89 -
(C) (D)
Appendix 3. Statistics for Figure 21. Value significantly different for the untreated control
vs treated (90 min) are indicated by nominal p-value <0.05.
Harvesting time post irradiation (hours) Skin phototype p-value
0
Lightly pigmented <0.0001
Moderately pigmented <0.0001
Darkly pigmented <0.0001
0.5
Lightly pigmented <0.0001
Moderately pigmented <0.0001
Darkly pigmented <0.0001
1
Lightly pigmented <0.0001
Moderately pigmented <0.0001
Darkly pigmented <0.0001
2
Lightly pigmented <0.0001
Moderately pigmented <0.0001
Darkly pigmented <0.0001
3
Lightly pigmented <0.0001
Moderately pigmented <0.0001
Darkly pigmented <0.0001
4
Lightly pigmented <0.0001
Moderately pigmented <0.0001
Darkly pigmented <0.0001
5
Lightly pigmented <0.0001
Moderately pigmented <0.0001
Darkly pigmented <0.0001
9
Lightly pigmented <0.0001
Moderately pigmented <0.0001
Darkly pigmented <0.0001
24
Lightly pigmented <0.0001
Moderately pigmented <0.0001
Darkly pigmented <0.0001
48
Lightly pigmented <0.0001
Moderately pigmented <0.0001
Darkly pigmented <0.0001

9. Curriculum vitae and Publications - 90 -
9. Curriculum vitae and Publications
Personal information
Name Aparna Chauhan
Date of birth 14.04.1992
Place of birth Ghaziabad, India
Nationality Indian
Marital status Unmarried
Father’s name Ravindra Pal Singh Chauhan
Mother’s name Saraswati Chauhan
Education
November 2017-Present Promotion, Dr. sc. hum. (scientiarum humanarum),
Medical Research Center, Medical Faculty of
Mannheim of the Heidelberg University, Germany
Thesis title: Impact of photobiomodulation on human
skin melanocytes.
August 2013-June 2015
Master of Science in Applied Microbiology
Banaras Hindu University, Varanasi, India
Master’s dissertation title: Study of BHMTG742A and
PEMTG744C polymorphisms and maternal risk for
Down syndrome.
July 2010-May 2013 Bachelor of Science, Microbiology honours
University of Delhi, Gargi College, Delhi India
Work experience
April 2016-October 2017 Junior Research Fellow, CSIR-Institute of Genomics
and Integrative Biology, New Delhi, India
Project title: Ultrastructural characterization, functional
and inflammatory regulators of type 2 diabetes
induced impaired skin health.

9. Curriculum vitae and Publications - 91 -
Publications
Jaiswal, SK, Sukla, KK, Chauhan, A, Lakhotia, AR, Kumar, A, Rai, AK: Choline
metabolic pathway gene polymorphysims and risk for Down syndrome: An
association study in a population with folate-homocysteine metabolic
impairment. Eur J Clin Nutr, 71: 45-50, 2017.
Gupta, A, Chauhan, A, Priya, A, Mantri, B, Wadhokar, M, Dalave, K, Shah, B,
Gokhale, RS, Batra, VV, Singh, A: Lesional skin in vitiligo exhibits delayed in
vivo reepithelialization compared to the nonlesional skin. Wound Rep Reg, 28:
307-314, 2020.

Abbreviations - 92 -
Abbreviations
ABCA1 ATP binding cassette subfamily A member 1
ADAM12 Distintegrin and metalloproteinase domain-contianig protein 12
AMPK AMP-activated protein kinase
AHR Aryl hydrocarbon receptor
AHRR Aryl hydrocarbon receptor repressor
AIP Aryl hydrocarbon receptor interacting protein
ALDH8A1 Aldehyde dehydrogenase 8 family member A1
ANOVA Analysis of variance
ANXA3 Annexin A3
AOC3 Menbrane primary amine oxidase
ARE Antioxidant response element
ARNT Aryl hydrocarbon receptor nuclear trasnlocator
ATP Adenosine triphosphate
ATP5F1A ATP synthase subunit alpha
ATP6V1A V-type protein ATPase catalytic subunit A
BAX BCL2 associated X, apoptosis regulator
bHLH/PAS basic-helix/loop/helix per-Arnt-sim
cAMP Cyclic adenosine monophosphate
CAMs Cell adhesion molecules
CAP2 Cyclase associated actin cytoskeleton regulatory protein 2
CASP3 Caspase 3
CASP9 Caspase 9
CDC37 Cell division cycle 37, HSP90 cochaperone
CDKN1B Cycline-dependent kinase 1B
cGMP Cyclic guanosine monophosphate
COX Cytochrome c oxidase
COX4l1 Cytochrome c oxidase subunit 4 isoform 1
COX5A Cytochrome c oxidase subunit 5A
COX5B Cytochrome c oxidase subunit 5B
CLDN1 Claudin-1
CREB c-AMP response element

Abbreviations - 93 -
CYP1A2 Cytochrome P450 family 1 subfamily A member 2
CYP1B1 Cytochrome P450 family 1 subfamily B member 1
DCAF12L1 DDB1-and CUL4-associated factor 12-like protein 1
DCT Dopachrome tautomerase
dFICZ 6, 12-diformylindolo[3, 2-B]carbazole
ECM Extracellular-matrix
EGFR Epidermal growth factor receptor
ENPP1 Ectonucleotide pyrophosphate/phosphodiesterase 1
EP300 E1A binding protein p300
FACS Fluorescence-activated cell sorting
FAM83D Family with sequence similarity 83 member D
FAXDC2 Fatty acid hydroxylase domain containing 2
FBXW10 F-box and WD repeat domain containing 10
FBS Fetal bovine serum
FDR False discovery rate (also called adjusted p-value)
FICZ 6-formylindolo[3,2-b]carbazole
FITC Fluorescein isothiocyanate
FOXOs Forkhead box protein O
GAL3ST1 Galactose-3-O-sulfotransferase 1
GSEA Gene Set Enrichment Analysis
GSTA1 Glutathione S-transferase alpha 1
GSTT2B Glutathione S-transferase theta 2B
HAHs Halogenated aromatic hydrocarbons
HeNe Helium-Neon
HES1 Hes family bHLH transcription factor 1
HLA-DRA Major histocompatibilty complex, class II, DR alpha
HSP90AA1 Heat shock protein 90 alpha family class A member 1
IL12A Interleukin 12A
IQR Interquartile range
IR Infrared
ITFG2 Integrin alpha FG-GAP repeat containing 2
JUN Jun proto-oncogene, AP-1 transcription factor subunit
JUNB JunB proto-oncogene, AP-1 transcription factor subunit

Abbreviations - 94 -
JUND JunD proto-oncogene, AP-1 transcription factor subunit
Keap1 Kelch-like ECH-associated protein 1
KEGG Kyoto Encyclopedia of Genes and Genomes
KIF14 Kinase family member 14
L-DOPA Dihydroxyphenylalanine
LEDs Light-emitting diodes
LINC00304 Long intergenic non-protein coding RNA 304
LLLT Low-level laser (or light) therapy
LRRC1 Leucine rich repeat containing 1
MDM2 E3 ubiquitin-protein ligase Mdm2
MGST1 Microsomal glutathione S-transferase 1
Min Minutes
MIR210HG MIR210 host gene (a long noncoding RNA)
MITF Microphthalimia-associated transcription factor
MLANA Melan-A
MME Membrane metalloendopeptidase
MYOF Myoferlin
NAALT North American Association for Light Therapy
NADH Nicotinamide adenine dinucleotide
NCOA1 Nuclear receptor coactivator 1
NES Normalised enrichment score
NFE2L2 Nuclear factor erythroid 2 like 2, also known as Nrf2
NF-κB Nuclear factor kappa B
NGS Next generation sequencing
NHEM Normal Human Epidermal Melanocytes
NIR Near infrared
NQO1 NAD(P)H quinone oxidoreductase 1
OCA2 OCA2 melanosomal transmembrane protein
OPN3 Opsin 3
PAHs Polycyclic aromatic hydrocarbons
PBM Photobiomodulation
PBS Phosphate buffer saline
PI Propidium iodide

Abbreviations - 95 -
PMEL Premelanosome protein
PMP2 Peripheral myelin protein 2
PMS N-methyl dibenzopyrazine methyl sulfate
POLK DNA polymerase kappa
PPARGC1A PPARG coactivator 1 alpha
PS Phosphatidylserine
PTGES3 Prostaglandin E synthase 3
PYHIN1 Pyrin and HIN domain family member 1
RIN RNA integrity number
RNA Ribonucleic acid
RNF112 Ring finger protein 112
ROMs Reactive oxygen metabolites
ROS Reactive oxygen species
RT Room temperature
SAPCD2 Suppressor APC domain containing 2
SD Standard deviation
SDHA Succinate dehydrogenase complex flavoprotein subunit A
SECTM1 Secreted and transmembrane 1
SERPINB2 Serpin family B member 2
SH2D4A SH2 domain containing 4A
SLC7A5 Solute carrier family 7 member 5
SMIM38 Small integral membrane protein 38
SPP1 Secreted phosphoprotein 1
SRC SRC proto-oncogene, non-receptor tyrosine kinase
SSPO SCO-Spondin
TCDD 2,3,7,8-tetrachlorodibenzo-para-dioxin
TCTE1 T-complex-associated-testis-expressed 1
TGF-β Transforming growth factor beta
THBS2 Thrombospondin 2
TMEM26 Transmembrane protein 26
TM4SF18 Transmembrane 4 L six family member 18
TNF Tumor necrosis factor
TP53 Tumor protein 53

Abbreviations - 96 -
TRIM73 Tripartite motif containing 73
Trp Tryptophan
TRPC1 Transient potential cation subfamily C member 1
TYR Tyrosinase
UGT1A UDP glucuronosyltransferase family 1 member 4 complex locus
UTP14C UTP14C small subunit processome component
UV Ultraviolet
VIS Visible
WALT World Association for Laser Therapy
XMEs Xenobiotics-metabolizing enzymes
XRE Xenobiotics response elements
XTT Sodium 3’-[1-(phenylaminocarbonyl)-3, 4-tetrazolium] bis
(4methoxy-6-nitro) benzene sulfonic acid hydrate

Acknowledgements - 97 -
Acknowledgements
First of all, I would like to express my deepest gratitude to Prof. Norbert Gretz for
providing me the opportunity to work in his group. I am thankful for his supervision,
support, patience and invaluable advice all throughout this period.
I am very grateful to Prof. Yvonne Samstag (Spokesperson), Research Traning Group
‘Elucidation of molecular mechanisms as foundation for an evidence-based
complementary and integrative medicine’ (Train4CIM) for having me as one of the
fellows of this group. In addition, a big thanks to the whole team for their help and
valuable feedbacks during our meetings, seminars and courses, especially Minguem
Jeong, Divya Lairikyengbam and Karina for the friendship, love and our fun get-
togethers. As well as, the Ministry of Science, Research and the Arts, Baden-
Württemberg and graduate academy, Heidelberg University for financing the fellowship
for a period of 3 years.
I would like to dedicate a special thanks to Sina Schwalm and Edda Eustachi for their
assistance in all the administrative work as well as the nice conversations during this
period.
I would like to express my deepest appreciation for Dr. Carsten Sticht, who not only
helped in gene expression analysis but also provided with his generous guidance
through the thesis writing process. I would also extend my thanks to Dr. Carolina De
La Torre for her work and support. I would thank Camela Jost, Maria Muciek and
Elisabeth Wuehl for their help and technical support. Additionally, I would like to thank
Stefanie Uhlig, Institute of Transfusion Medicine Immunology, for her support in the
flow cytometry experiments. My greatest thanks to Dr. Prama Pallavi for her
collaboration in new experimental set-up and her insightful suggestions and immense
positive conversations. My biggest thanks to all my colleagues at ZMF for their
enormous help, support and motivation. In particular, special thanks to my former
colleague Stefania Palumbo for her brainstorming and help during several
experiments, as well as Daniela Nardozi for her help in all upcoming questions and
problems.
Moreover, I am extremely thankful to my very good friend Wiktoria Banczyk and her
family for their generosity, advice and valuable time spent together filled with fun and
laughter. In addition, a special mention and thanks to Tiziana Picascia, Erika, Elenora
Scaccia for several exciting activities and trips we did together.

Acknowledgements - 98 -
My PhD would not have been completed without the unconditional love and moral
support of my family and friends in India. Especially my parents, my sister and brother
and my best friend Anup, to whom I express my gratitude for believing in me all the
time and being with me through thick and thin.
Finally, I am infinitely grateful to everyone for his or her deep trust in me, which
encouraged me to grow and reach this goal.


![Menschenhaut [Human skin]](https://static.fdokumen.com/doc/165x107/6326d24f24adacd7250b1364/menschenhaut-human-skin.jpg)

