
Impact of future climate
25
Advances in Environmental Research, Vol. 2, No. 3 (2013) 203-227 DOI: http://dx.doi.org/10.12989/aer.2013.2.3.203 203 Copyright © 2013 Techno-Press, Ltd. http://www.techno-press.org/?journal=aer&subpage=7 ISSN: 2234-1722 (Print), 2234-1730 (Online) Impact of future climate change on UK building performance Joseph Amoako-Attah and Ali B-Jahromi University of West London, School of Computing and Technology, Dept. of the Built Environment St Mary’s Road, Ealing, London W5 5RF, United Kingdom (Received July 05, 2013, Revised September 10, 2013, Accepted September 16, 2013) Abstract. Global demand for dwelling energy and implications of changing climatic conditions on buildings confront the built environment to build sustainable dwellings. This study investigates the variability of future climatic conditions on newly built detached dwellings in the UK. Series of energy modelling and simulations are performed on ten detached houses to evaluate and predict the impact of varying future climatic patterns on five building performance indicators. The study identifies and quantifies a consistent declining trend of building performance which is in consonance with current scientific knowledge of annual temperature change prediction in relations to long term climatic variation. The average percentage decrease for the annual energy consumption was predicted to be 2.80, 6.60 and 10.56 for 2020s, 2050s and 2080s time lines respectively. A similar declining trend in the case of annual natural gas consumption was 4.24, 9.98 and 16.1, and that for building emission rate and heating demand were 2.27, 5.49 and 8.72 and 7.82, 18.43 and 29.46 respectively. The study further analyse future heating and cooling demands of the three warmest months of the year and ascertain future variance in relative humidity and indoor temperature which might necessitate the use of room cooling systems to provide thermal comfort. Keywords: buildings; energy; performance; future weather; sustainability 1. Introduction Judicious making of inform long term strategic infrastructure investments decisions involve cost and sustainable environmental consideration in relation to building performance and occupancy comfort. Over the years, based on the knowledge to design and build with the view to reduce carbon dioxide emissions, professionals in the building industry have adapted two main approaches. Whilst one approach has been related to the reduction in the building energy demand through the appropriate selection of building elements and design, a converse approach has been the adaptation of renewable systems (Palme et al. 2013). Although, these two approaches have led to the enhancement and improvements of building performance predictability, yet the future accuracy in real building performance cannot be ascertained due to the variability of climatic conditions (Palme et al. 2013). In general, the variability and impact of climate change to buildings and its components have been largely ignored (Crawley 2008). Moreover, investigations ought to be pursued in the area of primary energy consumption and carbon emissions in relation to energy demands (Palme et al. Corresponding author, Ph.D. C. Eng. MICE, Reader (Assoc. Professor), E-mail: [email protected]
Transcript of Impact of future climate
Advances in Environmental Research, Vol. 2, No. 3 (2013) 203-227 DOI: http://dx.doi.org/10.12989/aer.2013.2.3.203 203
Copyright © 2013 Techno-Press, Ltd. http://www.techno-press.org/?journal=aer&subpage=7 ISSN: 2234-1722 (Print), 2234-1730 (Online)
Impact of future climate change on UK building performance
Joseph Amoako-Attah and Ali B-Jahromi
University of West London, School of Computing and Technology, Dept. of the Built Environment St Mary’s Road, Ealing, London W5 5RF, United Kingdom
(Received July 05, 2013, Revised September 10, 2013, Accepted September 16, 2013)
Abstract. Global demand for dwelling energy and implications of changing climatic conditions on buildings confront the built environment to build sustainable dwellings. This study investigates the variability of future climatic conditions on newly built detached dwellings in the UK. Series of energy modelling and simulations are performed on ten detached houses to evaluate and predict the impact of varying future climatic patterns on five building performance indicators. The study identifies and quantifies a consistent declining trend of building performance which is in consonance with current scientific knowledge of annual temperature change prediction in relations to long term climatic variation. The average percentage decrease for the annual energy consumption was predicted to be 2.80, 6.60 and 10.56 for 2020s, 2050s and 2080s time lines respectively. A similar declining trend in the case of annual natural gas consumption was 4.24, 9.98 and 16.1, and that for building emission rate and heating demand were 2.27, 5.49 and 8.72 and 7.82, 18.43 and 29.46 respectively. The study further analyse future heating and cooling demands of the three warmest months of the year and ascertain future variance in relative humidity and indoor temperature which might necessitate the use of room cooling systems to provide thermal comfort.
Keywords: buildings; energy; performance; future weather; sustainability
1. Introduction
Judicious making of inform long term strategic infrastructure investments decisions involve cost and sustainable environmental consideration in relation to building performance and occupancy comfort. Over the years, based on the knowledge to design and build with the view to reduce carbon dioxide emissions, professionals in the building industry have adapted two main approaches. Whilst one approach has been related to the reduction in the building energy demand through the appropriate selection of building elements and design, a converse approach has been the adaptation of renewable systems (Palme et al. 2013). Although, these two approaches have led to the enhancement and improvements of building performance predictability, yet the future accuracy in real building performance cannot be ascertained due to the variability of climatic conditions (Palme et al. 2013).
In general, the variability and impact of climate change to buildings and its components have been largely ignored (Crawley 2008). Moreover, investigations ought to be pursued in the area of primary energy consumption and carbon emissions in relation to energy demands (Palme et al.
Corresponding author, Ph.D. C. Eng. MICE, Reader (Assoc. Professor), E-mail: [email protected]
Joseph Amoako-Attah and Ali B-Jahromi
2013). The impact of global warming resulting to changes in the world’s climatic conditions is widely
acknowledged (Palme et al. 2013, Du et al. 2011, De Wilde and Coley 2012, UKCP 2010) and the evidence requires little justification to point to the impact of climate change on building. The Inter-government Panel on Climate Change (IPCC) fourth assessment report indicated that the rise of world temperature as a result of possible anthropogenic emissions of greenhouse gases in our century would vary between the range of 1.1 to 6.4°C (IPCC 2007). Since there is a direct bearing of changes in climatic conditions on buildings, it is imperative for the building industry to research on the impact of climate change on building performance.
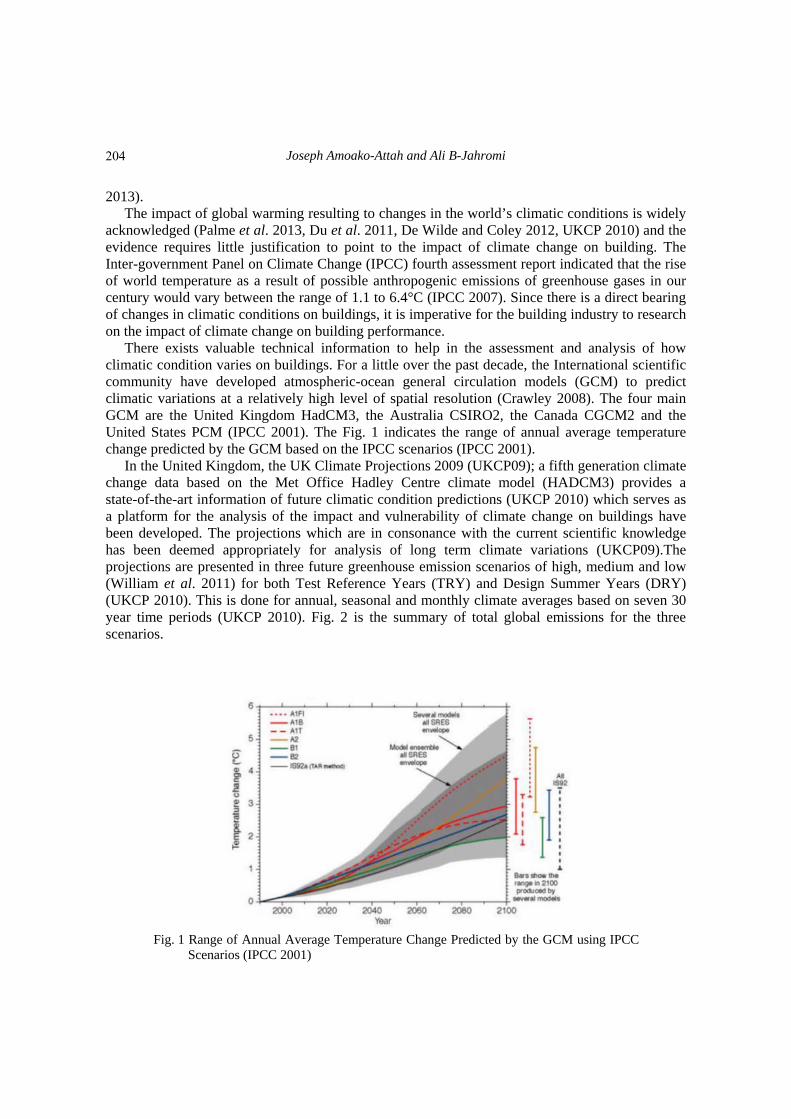
There exists valuable technical information to help in the assessment and analysis of how climatic condition varies on buildings. For a little over the past decade, the International scientific community have developed atmospheric-ocean general circulation models (GCM) to predict climatic variations at a relatively high level of spatial resolution (Crawley 2008). The four main GCM are the United Kingdom HadCM3, the Australia CSIRO2, the Canada CGCM2 and the United States PCM (IPCC 2001). The Fig. 1 indicates the range of annual average temperature change predicted by the GCM based on the IPCC scenarios (IPCC 2001).
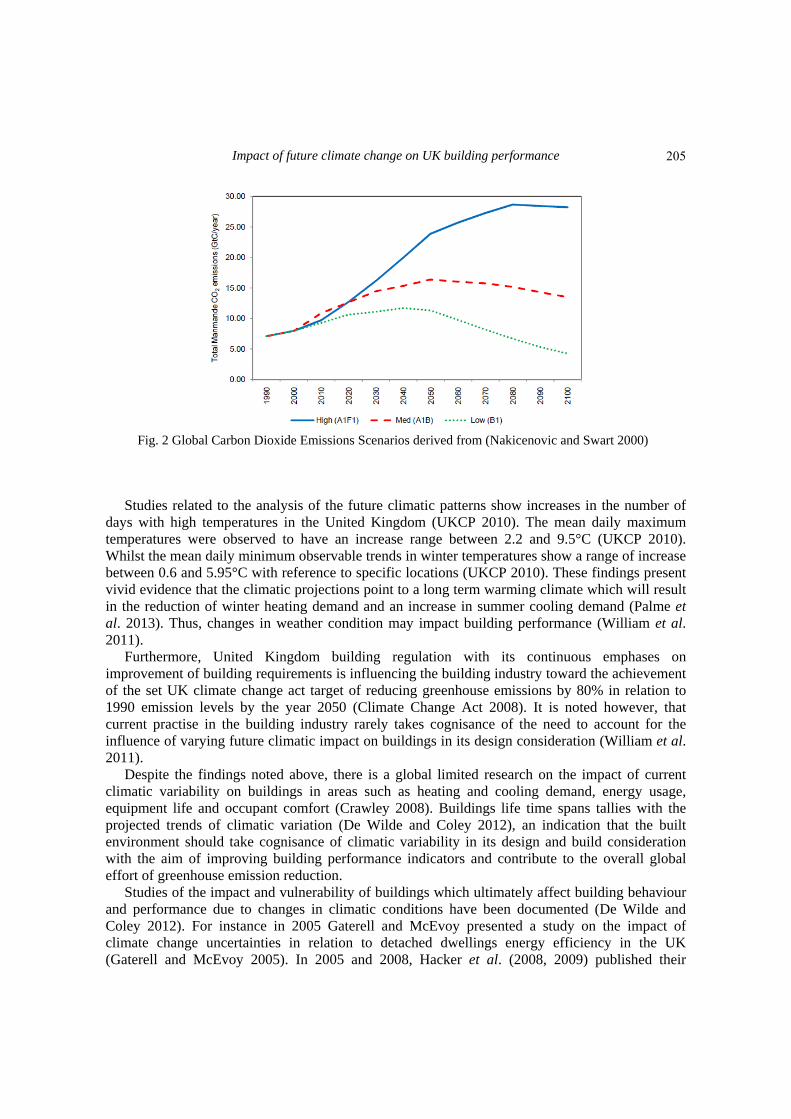
In the United Kingdom, the UK Climate Projections 2009 (UKCP09); a fifth generation climate change data based on the Met Office Hadley Centre climate model (HADCM3) provides a state-of-the-art information of future climatic condition predictions (UKCP 2010) which serves as a platform for the analysis of the impact and vulnerability of climate change on buildings have been developed. The projections which are in consonance with the current scientific knowledge has been deemed appropriately for analysis of long term climate variations (UKCP09).The projections are presented in three future greenhouse emission scenarios of high, medium and low (William et al. 2011) for both Test Reference Years (TRY) and Design Summer Years (DRY) (UKCP 2010). This is done for annual, seasonal and monthly climate averages based on seven 30 year time periods (UKCP 2010). Fig. 2 is the summary of total global emissions for the three scenarios.
Fig. 1 Range of Annual Average Temperature Change Predicted by the GCM using IPCC
Scenarios (IPCC 2001)
204
Impact of future climate change on UK building performance
Fig. 2 Global Carbon Dioxide Emissions Scenarios derived from (Nakicenovic and Swart 2000)
Studies related to the analysis of the future climatic patterns show increases in the number of
days with high temperatures in the United Kingdom (UKCP 2010). The mean daily maximum temperatures were observed to have an increase range between 2.2 and 9.5°C (UKCP 2010). Whilst the mean daily minimum observable trends in winter temperatures show a range of increase between 0.6 and 5.95°C with reference to specific locations (UKCP 2010). These findings present vivid evidence that the climatic projections point to a long term warming climate which will result in the reduction of winter heating demand and an increase in summer cooling demand (Palme et al. 2013). Thus, changes in weather condition may impact building performance (William et al. 2011).
Furthermore, United Kingdom building regulation with its continuous emphases on improvement of building requirements is influencing the building industry toward the achievement of the set UK climate change act target of reducing greenhouse emissions by 80% in relation to 1990 emission levels by the year 2050 (Climate Change Act 2008). It is noted however, that current practise in the building industry rarely takes cognisance of the need to account for the influence of varying future climatic impact on buildings in its design consideration (William et al. 2011).
Despite the findings noted above, there is a global limited research on the impact of current climatic variability on buildings in areas such as heating and cooling demand, energy usage, equipment life and occupant comfort (Crawley 2008). Buildings life time spans tallies with the projected trends of climatic variation (De Wilde and Coley 2012), an indication that the built environment should take cognisance of climatic variability in its design and build consideration with the aim of improving building performance indicators and contribute to the overall global effort of greenhouse emission reduction.
Studies of the impact and vulnerability of buildings which ultimately affect building behaviour and performance due to changes in climatic conditions have been documented (De Wilde and Coley 2012). For instance in 2005 Gaterell and McEvoy presented a study on the impact of climate change uncertainties in relation to detached dwellings energy efficiency in the UK (Gaterell and McEvoy 2005). In 2005 and 2008, Hacker et al. (2008, 2009) published their
205
Joseph Amoako-Attah and Ali B-Jahromi
findings of climate change on indoor environment and carbon dioxide emissions and thermal mass respectively (Hacker et al. 2005, 2008), whilst in 2010, Collins et al. (2010) presented their work on the bearing of climate change on future energy consumption in the United Kingdom (UK) (Collins et al. 2010). In 2009 Lomas and Ji presented work on natural ventilated in hospital wards using alternative weather projections (Lomas and Ji 2009) and in 2012, Barclays et al. (2012) also carried out work on specific building system of natural ventilation focusing on wind prediction using information from the UKCP09 (Barclays et al. 2012). Other studies have also been conducted in countries other than the United Kingdom in relation to the impact of climate change on buildings (Frank 2005, Crawley 2008, Chan 2011).
As noted above, it is evidence that some work has been undertaken by professionals in the building industry to relate the variability of future climatic conditions to building performance. Whilst future weather information has been used in these studies, almost all of these studies were published prior to the advent of the UK Climate Projection 2009. The UK Climate Projection 2009 present the most advanced comprehensive future weather information for our century, thus resulting in a more accurate and reliable predictive building performance indicators using building simulation methods (Du et al. 2011). In addition, although currently extensive research have been done on the output of the UKCP09 in relation to building performance, the various analysis were based on the weather variables rather than varying building performance indicators (William et al. 2011).
The Chartered Institution of Building Services Engineers (CIBSE) future weather data set on 14 locations in the United Kingdom is a derivation from downscaling of longitude and latitude grid from the UKCP09. This has been the result of collaboration work between CIBSE and the UK Climate Impacts Program (UKCIP) to assist in the provision of weather data set for building simulation (Shamash et al. 2012b). The CIBSE future probabilistic weather data files are presented in the form of Test Reference Years (TRYs) and Design Summer Years (DSY) of carbon emission scenarios of low, medium low, medium high and high for time slices of 2020s, 2050s and 2080s. These outcomes are as the result of morphing historical weather data based on UKCP09 projections of three time periods, three emission scenarios (of low, medium and high) and three probabilistic levels (Shamash et al. 2012a). The future weather data set not only serve to “enable designers to assess the impact of climate change on their designs using building energy and thermal simulation models” but also to “enable designers to develop strategies through which buildings can be adapted to cope with the impacts of future climate change” (Hacker et al. 2009).
Building energy modelling and simulation programs had been used to evaluate building performances and assessments in the areas of building design and regulatory compliance, evaluation of changing weather data for an overheating analysis, assessment of building internal conditions (infiltration, ventilation, lightning gain, occupancy sensible and latent, equipment sensible and latent, and pollution generation), evaluation and enhancement of building thermal mass, evaluation and selection of renewable energy sources, building automation systems and moisture phenomena. Moreover, modelling and simulation of buildings of selected building range could be extended to represent the entire building stock (Crawley 2003).
This work therefore employs an approved thermal analysis building simulator as a tool to perform series of simulations and thereby evaluate and predict the extent of the impact of varying future climatic patterns, based on the current CIBSE weather data set morphed from the UK Climate Projection 2009 weather information, on newly built detached dwellings in the UK based on five (5) key building performance of total annual energy consumption, annual gas consumption, annual electricity grid consumption, building emissions rate and heating demand.
206
Impact of future climate change on UK building performance
2. Methodology
2.1 Background The goal is to verify through a series of simulation using the latest UK Charted Institution of
Building Services Engineers CIBSE TRY of current and future weather data which incorporates the UKCIP09 Projections to evaluate and predict the impact and vulnerability of future climate change on a detached dwelling stock in the United Kingdom.
TAS software version 9.2.1.4 (build) is used as a dynamic simulation modeller to model and simulate the thermal mass of the prototype buildings. TAS has the capability to overcome the
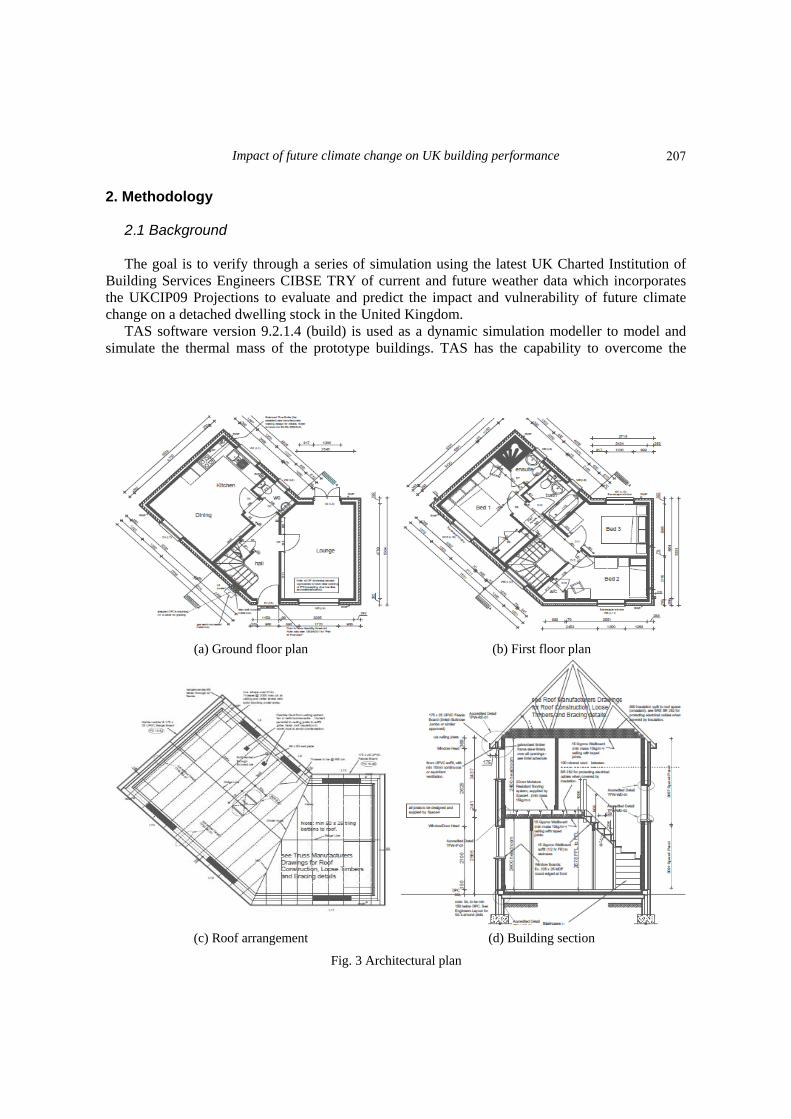
(a) Ground floor plan (b) First floor plan
(c) Roof arrangement (d) Building section
Fig. 3 Architectural plan
207
Joseph Amoako-Attah and Ali B-Jahromi
challenge of applying the ‘vast quantity of data to assess the probabilistic performance of buildings in the future’ (William et al. 2011). Moreover, it offers complete solution as a powerful modelling and simulation in the optimisation of building environment, energy performance and occupant comfort.
Ten residential dwellings of Persimmon South East Ltd Sheppey General Hospital dwelling are selected as building prototypes. Sheppey, Sheerness is 59.4 km from London, the closest weather station. Hence the current and future CIBSE London TRY are chosen for the analysis
2.2 Thermal analysis simulation (TAS) 3D modelling The data used, are the AutoCAD two-storey residential detached buildings drawings of
Persimmon South East Ltd Sheppey General Hospital. The building drawings consisted of the front elevation, rear and side elevation, a section through the elevation, ground floor plan, first floor plan and the roof arrangement plan. The Fig. 3(a)-(d) below indicate the architectural plan of one of the selected houses, the drawing data for 0712 House Type G Pri used in this work.
2.3 Modelling process Measurements of floors, doors and windows dimensions were taken from the AutoCAD
elevations drawings. The floor level was measured from the ground plane at datum 0.0 m. The default wall heights dimensions were measured from the floor finish to directly below the floor finishing of the upper floor. The respective zones on the ground floor and first floor plans were noted and further grouped into Bedrooms, Circulation, Toilet and Miscellaneous.
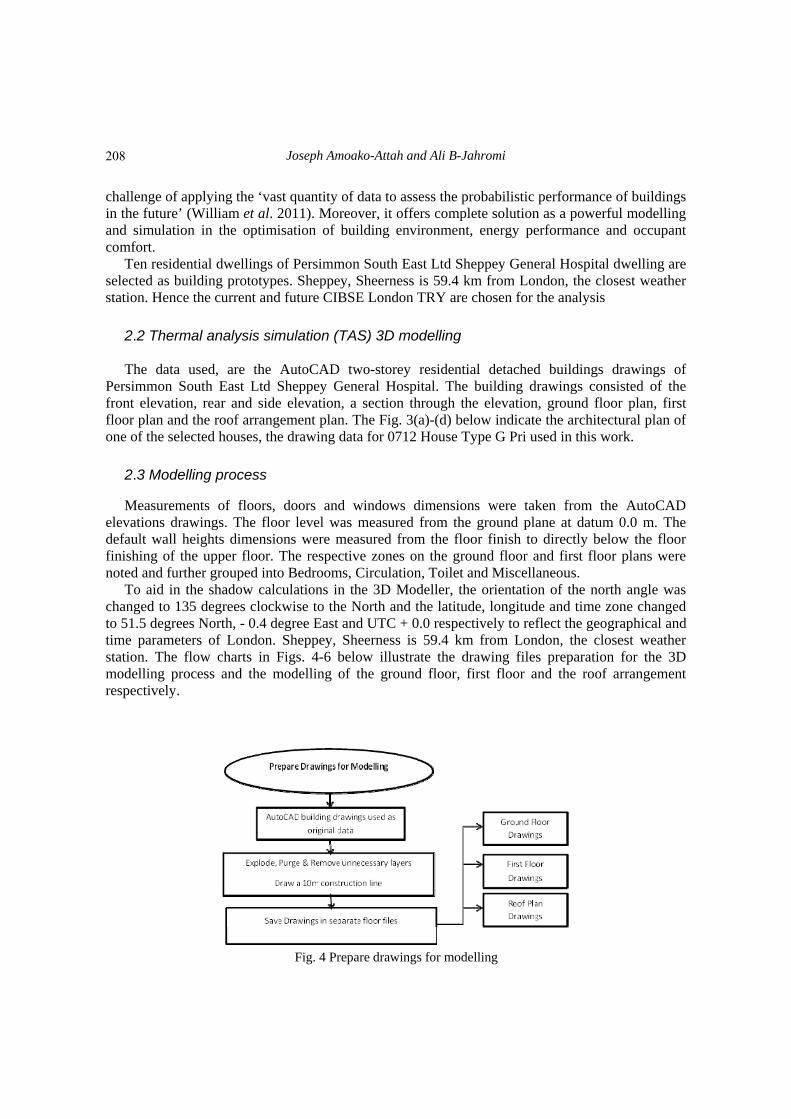
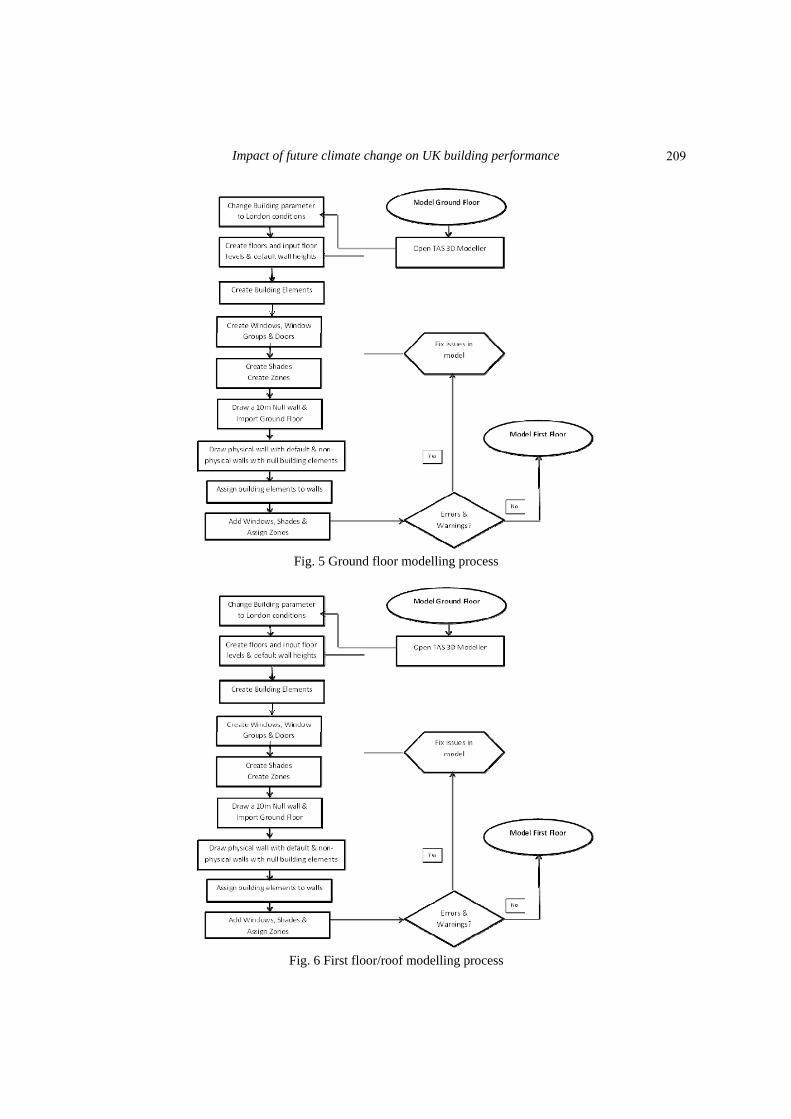
To aid in the shadow calculations in the 3D Modeller, the orientation of the north angle was changed to 135 degrees clockwise to the North and the latitude, longitude and time zone changed to 51.5 degrees North, - 0.4 degree East and UTC + 0.0 respectively to reflect the geographical and time parameters of London. Sheppey, Sheerness is 59.4 km from London, the closest weather station. The flow charts in Figs. 4-6 below illustrate the drawing files preparation for the 3D modelling process and the modelling of the ground floor, first floor and the roof arrangement respectively.
Fig. 4 Prepare drawings for modelling
208
Impact of future climate change on UK building performance
Fig. 5 Ground floor modelling process
Fig. 6 First floor/roof modelling process
209
Joseph Amoako-Attah and Ali B-Jahromi
2.4 Simulation process TAS as a dynamic simulation modeller models the thermal mass of a building. Building
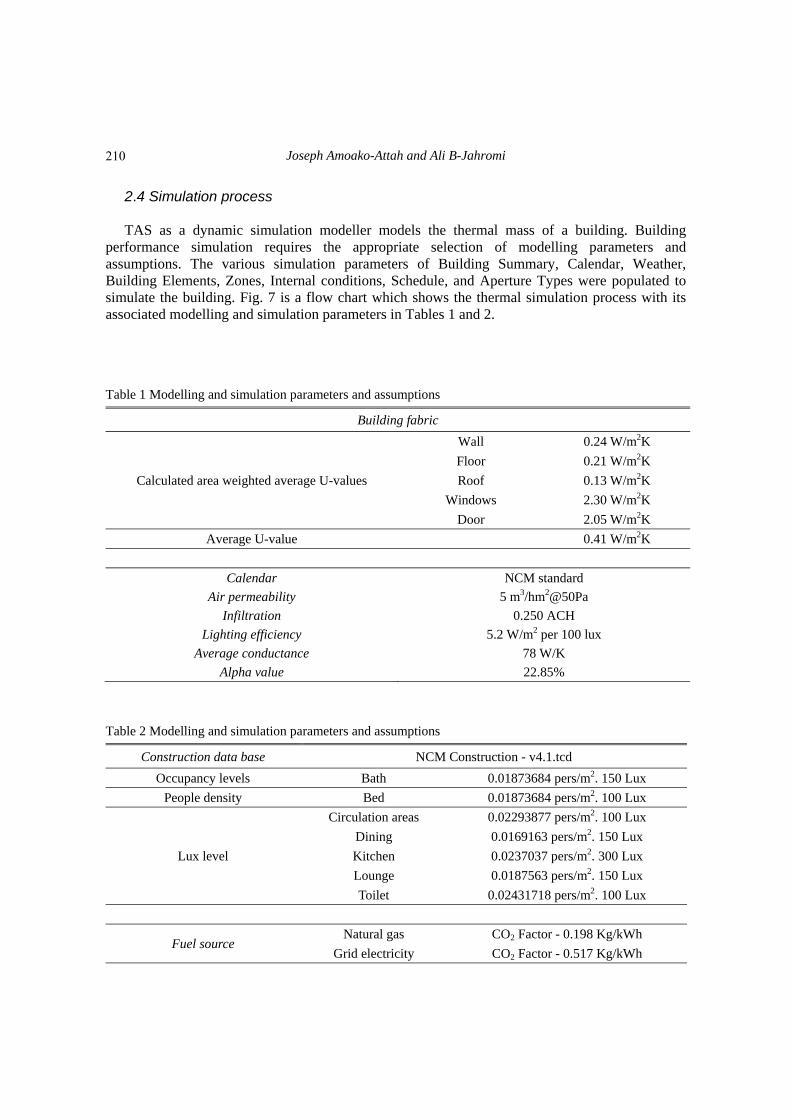
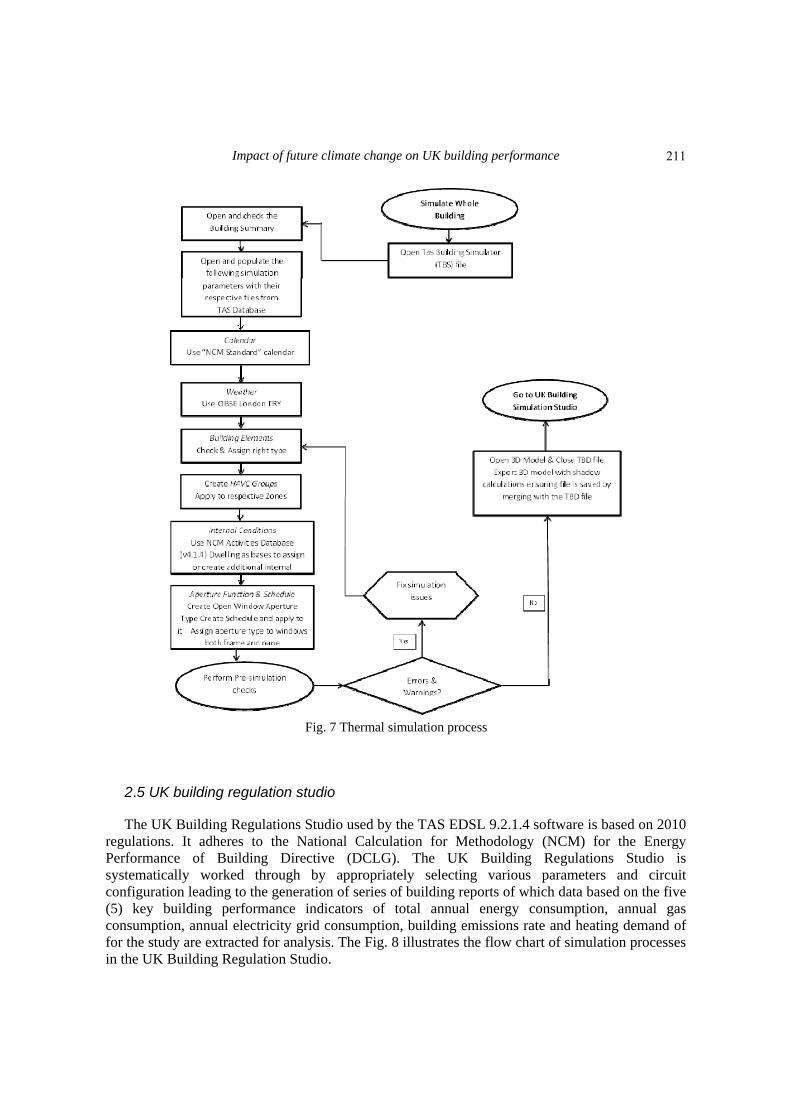
performance simulation requires the appropriate selection of modelling parameters and assumptions. The various simulation parameters of Building Summary, Calendar, Weather, Building Elements, Zones, Internal conditions, Schedule, and Aperture Types were populated to simulate the building. Fig. 7 is a flow chart which shows the thermal simulation process with its associated modelling and simulation parameters in Tables 1 and 2.
Table 1 Modelling and simulation parameters and assumptions
Building fabric
Calculated area weighted average U-values
Wall 0.24 W/m2K
Floor 0.21 W/m2K
Roof 0.13 W/m2K
Windows 2.30 W/m2K
Door 2.05 W/m2K
Average U-value 0.41 W/m2K
Calendar NCM standard
Air permeability 5 m3/hm2@50Pa
Infiltration 0.250 ACH
Lighting efficiency 5.2 W/m2 per 100 lux
Average conductance 78 W/K
Alpha value 22.85%
Table 2 Modelling and simulation parameters and assumptions
Construction data base NCM Construction - v4.1.tcd
Occupancy levels Bath 0.01873684 pers/m2. 150 Lux
People density Bed 0.01873684 pers/m2. 100 Lux
Lux level
Circulation areas 0.02293877 pers/m2. 100 Lux
Dining 0.0169163 pers/m2. 150 Lux
Kitchen 0.0237037 pers/m2. 300 Lux
Lounge 0.0187563 pers/m2. 150 Lux
Toilet 0.02431718 pers/m2. 100 Lux
Fuel source Natural gas CO2 Factor - 0.198 Kg/kWh
Grid electricity CO2 Factor - 0.517 Kg/kWh
210
Impact of future climate change on UK building performance
Fig. 7 Thermal simulation process
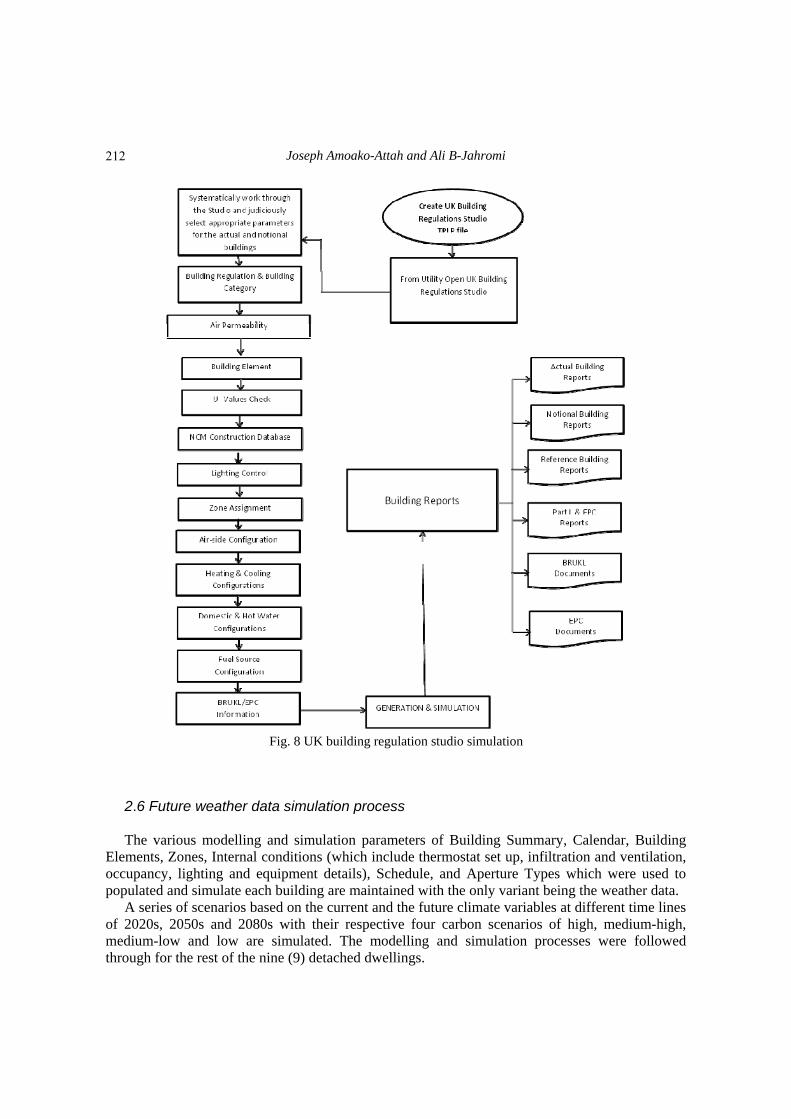
2.5 UK building regulation studio The UK Building Regulations Studio used by the TAS EDSL 9.2.1.4 software is based on 2010
regulations. It adheres to the National Calculation for Methodology (NCM) for the Energy Performance of Building Directive (DCLG). The UK Building Regulations Studio is systematically worked through by appropriately selecting various parameters and circuit configuration leading to the generation of series of building reports of which data based on the five (5) key building performance indicators of total annual energy consumption, annual gas consumption, annual electricity grid consumption, building emissions rate and heating demand of for the study are extracted for analysis. The Fig. 8 illustrates the flow chart of simulation processes in the UK Building Regulation Studio.
211
Joseph Amoako-Attah and Ali B-Jahromi
Fig. 8 UK building regulation studio simulation
2.6 Future weather data simulation process The various modelling and simulation parameters of Building Summary, Calendar, Building
Elements, Zones, Internal conditions (which include thermostat set up, infiltration and ventilation, occupancy, lighting and equipment details), Schedule, and Aperture Types which were used to populated and simulate each building are maintained with the only variant being the weather data.
A series of scenarios based on the current and the future climate variables at different time lines of 2020s, 2050s and 2080s with their respective four carbon scenarios of high, medium-high, medium-low and low are simulated. The modelling and simulation processes were followed through for the rest of the nine (9) detached dwellings.
212

Impact of future climate change on UK building performance
(a) Front elevation
(b) Rear and side elevation (c) Rear and side elevation
Fig. 9 Modelling results
3. Results and discussion
The analysis of one building prototype - Persimmon South East Ltd Sheppey General Hospital dwelling 0712 House Type G Private - two-storey residential detached building is presented below. Figs. 9(a)-(c) represent the outcome of the modelling process.
Figs. 10-12 show typical TAS results of a simulation information using the UK building Studio 2010 of the building performance indicators earmarked for the study.
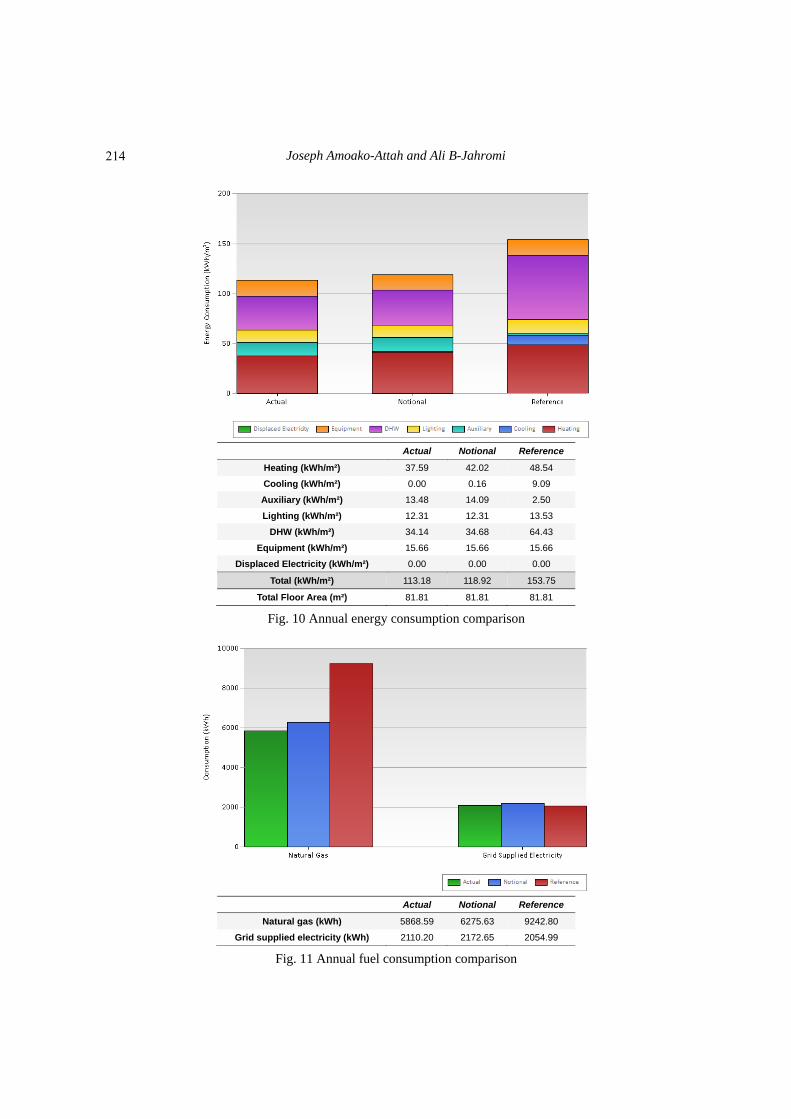
Fig. 10 shows the Part L (of the Building Regulations for England and Wales) and Energy Performance Certificate (EPC) reports of total annual energy consumption comparison of actual, notional and reference buildings simulations of the Persimmon building type G, of which information is extracted for statistical analysis. The total annual energy consumption encompasses heating, auxiliary, lighting, domestic hot water (DHW) and equipment energy usage.
From Fig. 10, the auxiliary energy is the additional electric energy consumed by fans and pumps of the heat ventilation air-conditioning (HVAC) systems. The domestic hot water (DHW) is basically the hot water consumption rates in relations to each zone activity. The equipment energy is the consumption due to household appliances, whilst the displaced electricity is the renewable energy configuration, for example the use of solar photovoltaic panels to displace the utility power.
213
Joseph Amoako-Attah and Ali B-Jahromi
Actual Notional Reference
Heating (kWh/m²) 37.59 42.02 48.54
Cooling (kWh/m²) 0.00 0.16 9.09
Auxiliary (kWh/m²) 13.48 14.09 2.50
Lighting (kWh/m²) 12.31 12.31 13.53
DHW (kWh/m²) 34.14 34.68 64.43
Equipment (kWh/m²) 15.66 15.66 15.66
Displaced Electricity (kWh/m²) 0.00 0.00 0.00
Total (kWh/m²) 113.18 118.92 153.75
Total Floor Area (m²) 81.81 81.81 81.81
Fig. 10 Annual energy consumption comparison
Actual Notional Reference
Natural gas (kWh) 5868.59 6275.63 9242.80
Grid supplied electricity (kWh) 2110.20 2172.65 2054.99
Fig. 11 Annual fuel consumption comparison
214
Impact of future climate change on UK building performance
Actual Notional Reference
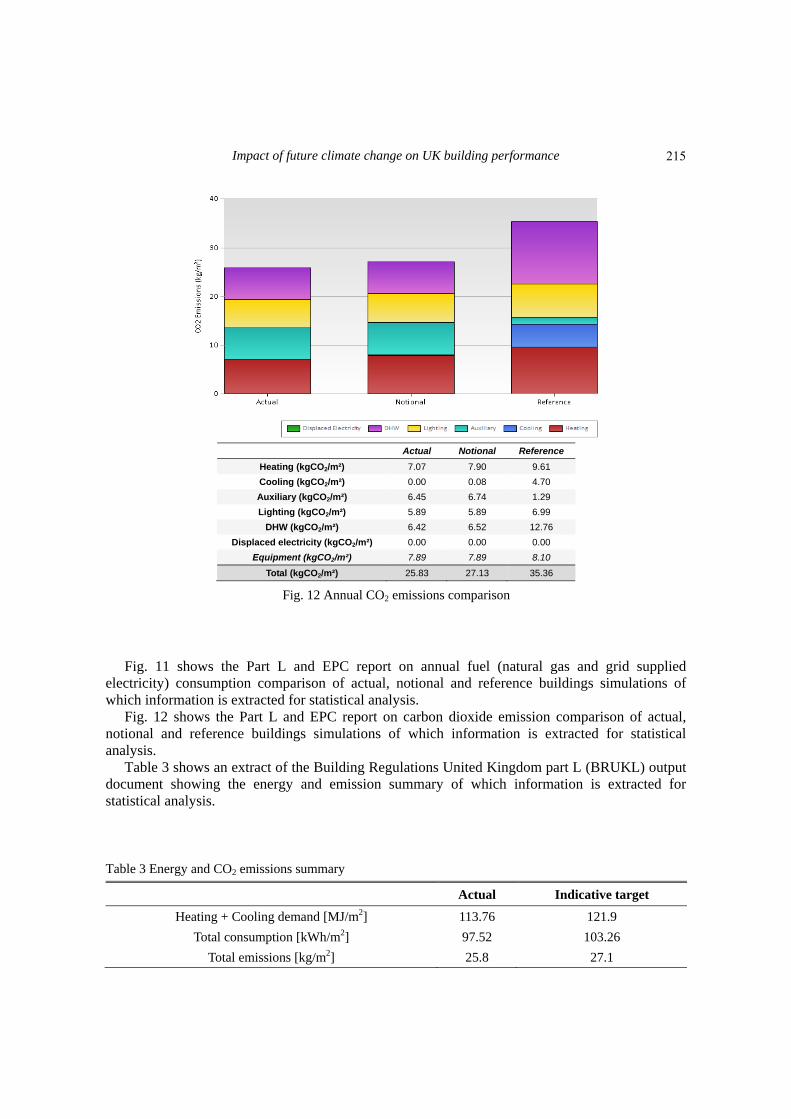
Heating (kgCO2/m²) 7.07 7.90 9.61
Cooling (kgCO2/m²) 0.00 0.08 4.70
Auxiliary (kgCO2/m²) 6.45 6.74 1.29
Lighting (kgCO2/m²) 5.89 5.89 6.99
DHW (kgCO2/m²) 6.42 6.52 12.76
Displaced electricity (kgCO2/m²) 0.00 0.00 0.00
Equipment (kgCO2/m²) 7.89 7.89 8.10
Total (kgCO2/m²) 25.83 27.13 35.36
Fig. 12 Annual CO2 emissions comparison
Fig. 11 shows the Part L and EPC report on annual fuel (natural gas and grid supplied
electricity) consumption comparison of actual, notional and reference buildings simulations of which information is extracted for statistical analysis.
Fig. 12 shows the Part L and EPC report on carbon dioxide emission comparison of actual, notional and reference buildings simulations of which information is extracted for statistical analysis.
Table 3 shows an extract of the Building Regulations United Kingdom part L (BRUKL) output document showing the energy and emission summary of which information is extracted for statistical analysis.
Table 3 Energy and CO2 emissions summary
Actual Indicative target
Heating + Cooling demand [MJ/m2] 113.76 121.9
Total consumption [kWh/m2] 97.52 103.26
Total emissions [kg/m2] 25.8 27.1
215
Joseph Amoako-Attah and Ali B-Jahromi
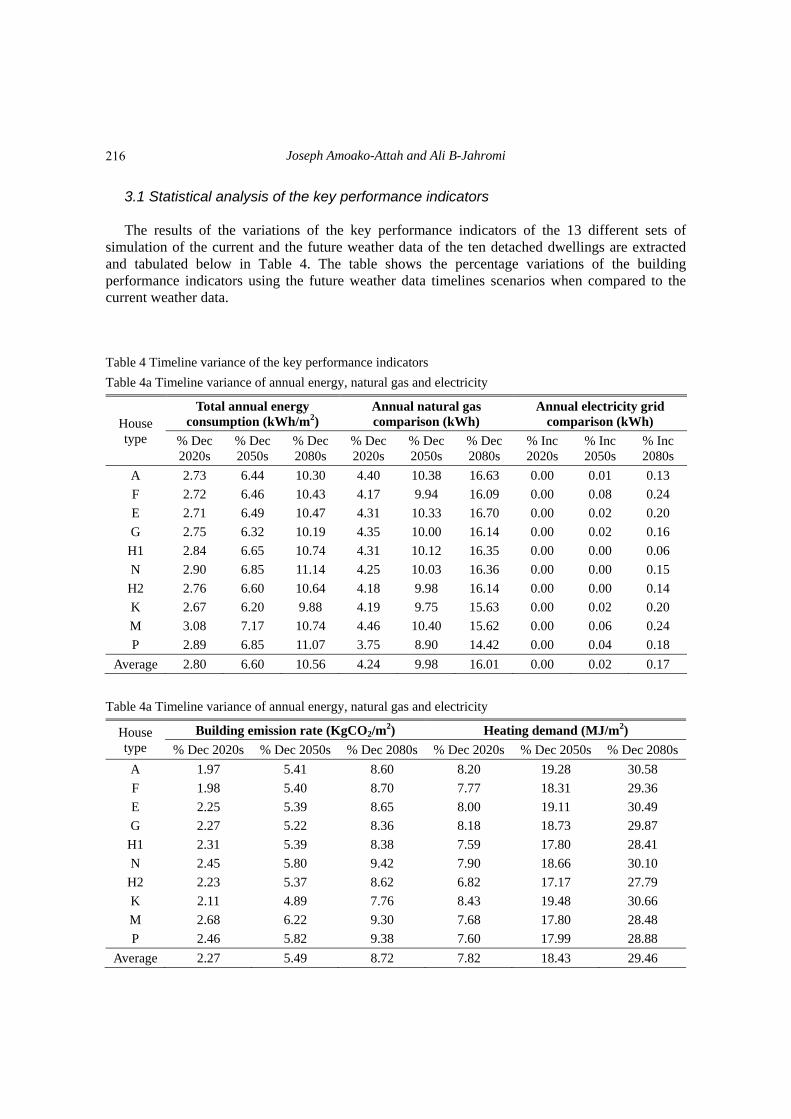
3.1 Statistical analysis of the key performance indicators The results of the variations of the key performance indicators of the 13 different sets of
simulation of the current and the future weather data of the ten detached dwellings are extracted and tabulated below in Table 4. The table shows the percentage variations of the building performance indicators using the future weather data timelines scenarios when compared to the current weather data.
Table 4 Timeline variance of the key performance indicators
Table 4a Timeline variance of annual energy, natural gas and electricity
House type
Total annual energy consumption (kWh/m2)
Annual natural gas comparison (kWh)
Annual electricity grid comparison (kWh)
% Dec 2020s
% Dec 2050s
% Dec2080s
% Dec2020s
% Dec2050s
% Dec2080s
% Inc 2020s
% Inc 2050s
% Inc 2080s
A 2.73 6.44 10.30 4.40 10.38 16.63 0.00 0.01 0.13
F 2.72 6.46 10.43 4.17 9.94 16.09 0.00 0.08 0.24
E 2.71 6.49 10.47 4.31 10.33 16.70 0.00 0.02 0.20
G 2.75 6.32 10.19 4.35 10.00 16.14 0.00 0.02 0.16
H1 2.84 6.65 10.74 4.31 10.12 16.35 0.00 0.00 0.06
N 2.90 6.85 11.14 4.25 10.03 16.36 0.00 0.00 0.15
H2 2.76 6.60 10.64 4.18 9.98 16.14 0.00 0.00 0.14
K 2.67 6.20 9.88 4.19 9.75 15.63 0.00 0.02 0.20
M 3.08 7.17 10.74 4.46 10.40 15.62 0.00 0.06 0.24
P 2.89 6.85 11.07 3.75 8.90 14.42 0.00 0.04 0.18
Average 2.80 6.60 10.56 4.24 9.98 16.01 0.00 0.02 0.17
Table 4a Timeline variance of annual energy, natural gas and electricity
House type
Building emission rate (KgCO2/m2) Heating demand (MJ/m2)
% Dec 2020s % Dec 2050s % Dec 2080s % Dec 2020s % Dec 2050s % Dec 2080s
A 1.97 5.41 8.60 8.20 19.28 30.58
F 1.98 5.40 8.70 7.77 18.31 29.36
E 2.25 5.39 8.65 8.00 19.11 30.49
G 2.27 5.22 8.36 8.18 18.73 29.87
H1 2.31 5.39 8.38 7.59 17.80 28.41
N 2.45 5.80 9.42 7.90 18.66 30.10
H2 2.23 5.37 8.62 6.82 17.17 27.79
K 2.11 4.89 7.76 8.43 19.48 30.66
M 2.68 6.22 9.30 7.68 17.80 28.48
P 2.46 5.82 9.38 7.60 17.99 28.88
Average 2.27 5.49 8.72 7.82 18.43 29.46
216
Impact of future climate change on UK building performance
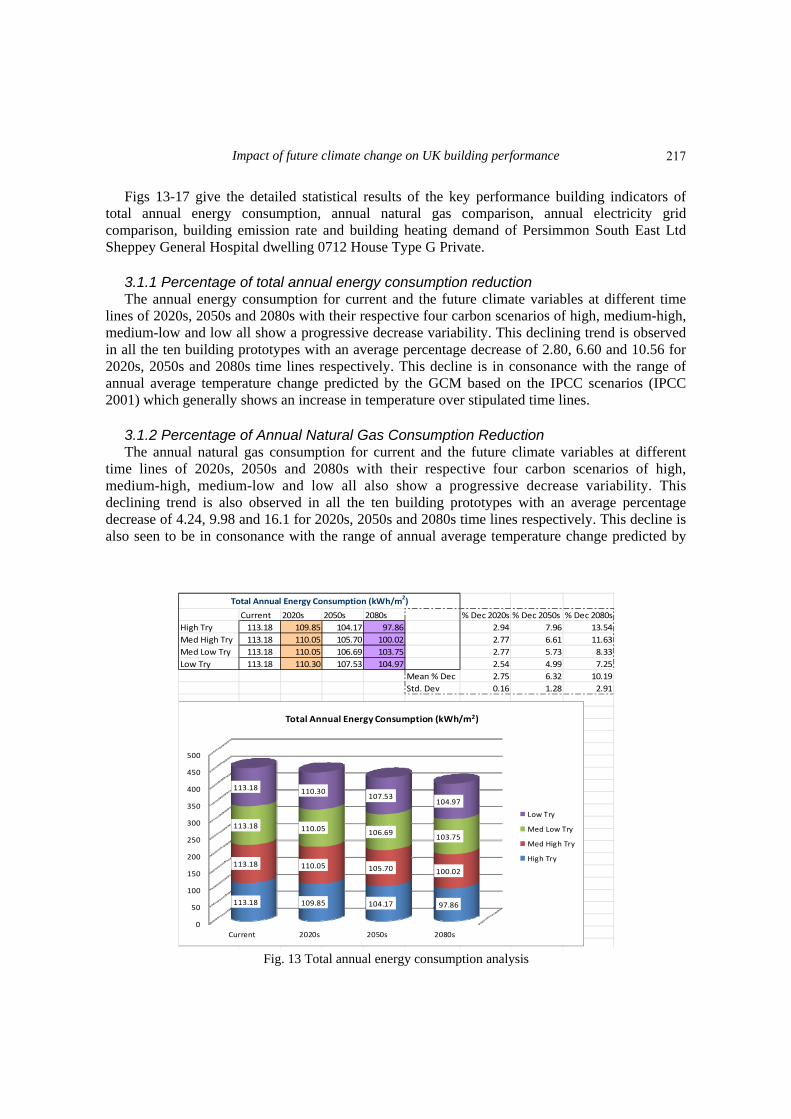
Figs 13-17 give the detailed statistical results of the key performance building indicators of total annual energy consumption, annual natural gas comparison, annual electricity grid comparison, building emission rate and building heating demand of Persimmon South East Ltd Sheppey General Hospital dwelling 0712 House Type G Private.
3.1.1 Percentage of total annual energy consumption reduction The annual energy consumption for current and the future climate variables at different time
lines of 2020s, 2050s and 2080s with their respective four carbon scenarios of high, medium-high, medium-low and low all show a progressive decrease variability. This declining trend is observed in all the ten building prototypes with an average percentage decrease of 2.80, 6.60 and 10.56 for 2020s, 2050s and 2080s time lines respectively. This decline is in consonance with the range of annual average temperature change predicted by the GCM based on the IPCC scenarios (IPCC 2001) which generally shows an increase in temperature over stipulated time lines.
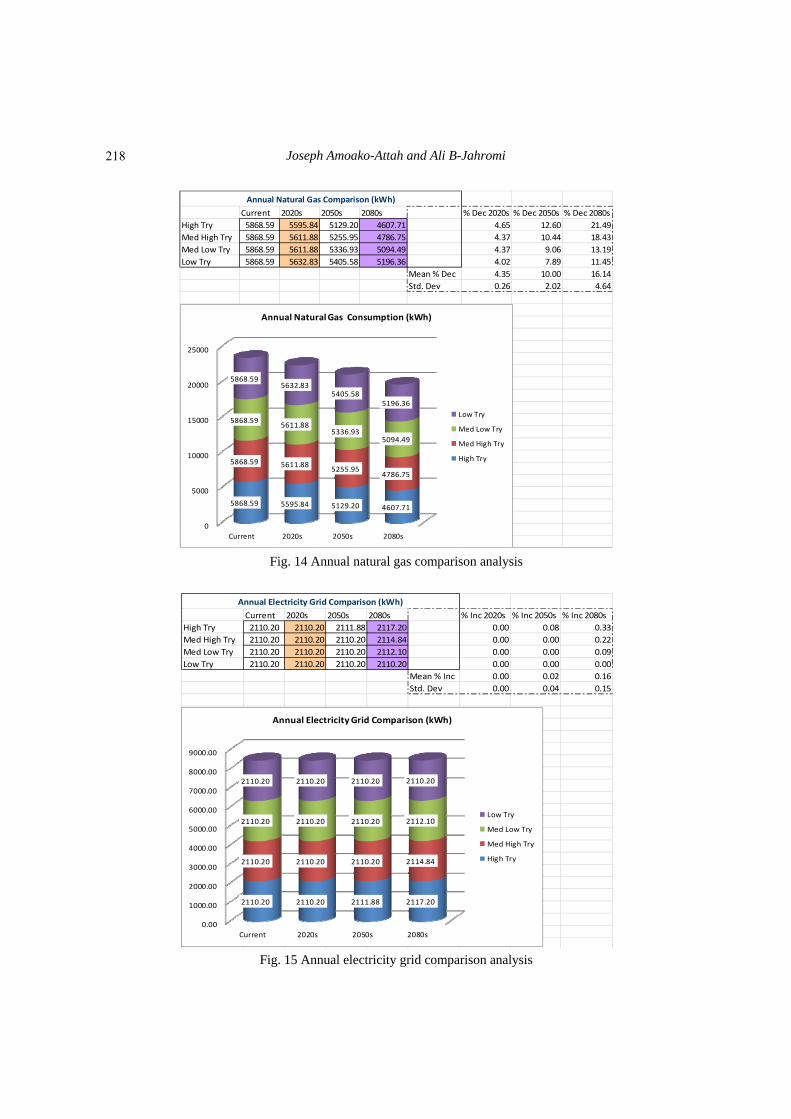
3.1.2 Percentage of Annual Natural Gas Consumption Reduction The annual natural gas consumption for current and the future climate variables at different
time lines of 2020s, 2050s and 2080s with their respective four carbon scenarios of high, medium-high, medium-low and low all also show a progressive decrease variability. This declining trend is also observed in all the ten building prototypes with an average percentage decrease of 4.24, 9.98 and 16.1 for 2020s, 2050s and 2080s time lines respectively. This decline is also seen to be in consonance with the range of annual average temperature change predicted by
Current 2020s 2050s 2080s % Dec 2020s % Dec 2050s % Dec 2080s
High Try 113.18 109.85 104.17 97.86 2.94 7.96 13.54
Med High Try 113.18 110.05 105.70 100.02 2.77 6.61 11.63
Med Low Try 113.18 110.05 106.69 103.75 2.77 5.73 8.33
Low Try 113.18 110.30 107.53 104.97 2.54 4.99 7.25
Mean % Dec 2.75 6.32 10.19
Std. Dev 0.16 1.28 2.91
Total Annual Energy Consumption (kWh/m2)
0
50
100
150
200
250
300
350
400
450
500
Current 2020s 2050s 2080s
113.18 109.85 104.17 97.86
113.18 110.05 105.70 100.02
113.18 110.05 106.69103.75
113.18 110.30107.53
104.97
Total Annual Energy Consumption (kWh/m2)
Low Try
Med Low Try
Med High Try
High Try
Fig. 13 Total annual energy consumption analysis
217
Joseph Amoako-Attah and Ali B-Jahromi
Current 2020s 2050s 2080s % Dec 2020s % Dec 2050s % Dec 2080s
High Try 5868.59 5595.84 5129.20 4607.71 4.65 12.60 21.49
Med High Try 5868.59 5611.88 5255.95 4786.75 4.37 10.44 18.43
Med Low Try 5868.59 5611.88 5336.93 5094.49 4.37 9.06 13.19
Low Try 5868.59 5632.83 5405.58 5196.36 4.02 7.89 11.45
Mean % Dec 4.35 10.00 16.14
Std. Dev 0.26 2.02 4.64
Annual Natural Gas Comparison (kWh)
0
5000
10000
15000
20000
25000
Current 2020s 2050s 2080s
5868.59 5595.84 5129.20 4607.71
5868.59 5611.885255.95
4786.75
5868.595611.88
5336.935094.49
5868.595632.83
5405.585196.36
Annual Natural Gas Consumption (kWh)
Low Try
Med Low Try
Med High Try
High Try
Fig. 14 Annual natural gas comparison analysis
Current 2020s 2050s 2080s % Inc 2020s % Inc 2050s % Inc 2080s
High Try 2110.20 2110.20 2111.88 2117.20 0.00 0.08 0.33
Med High Try 2110.20 2110.20 2110.20 2114.84 0.00 0.00 0.22
Med Low Try 2110.20 2110.20 2110.20 2112.10 0.00 0.00 0.09
Low Try 2110.20 2110.20 2110.20 2110.20 0.00 0.00 0.00
Mean % Inc 0.00 0.02 0.16
Std. Dev 0.00 0.04 0.15
Annual Electricity Grid Comparison (kWh)
0.00
1000.00
2000.00
3000.00
4000.00
5000.00
6000.00
7000.00
8000.00
9000.00
Current 2020s 2050s 2080s
2110.20 2110.20 2111.88 2117.20
2110.20 2110.20 2110.20 2114.84
2110.20 2110.20 2110.20 2112.10
2110.20 2110.20 2110.20 2110.20
Annual Electricity Grid Comparison (kWh)
Low Try
Med Low Try
Med High Try
High Try
Fig. 15 Annual electricity grid comparison analysis
218
Impact of future climate change on UK building performance
the GCM based on the IPCC scenarios (IPCC 2001) which generally shows an increase in temperature over stipulated time lines. Increase in future temperature would obviously lead in the decrease in gas consumption. Gas is mainly used in domestic heating.
3.1.3 Annual electricity grid comparison analysis The annual electricity grid consumption for current and the future climate variables at different
time lines of 2020s, 2050s and 2080s with their respective four carbon scenarios of high, medium-high, medium-low and low all also show an observable relatively flat variability with apparently no change in the consumption over the stipulated time lines. This implies that the amount of electricity consumption will remain fairly the same despite change in climatic conditions. This trend is observed in all the ten building prototypes.
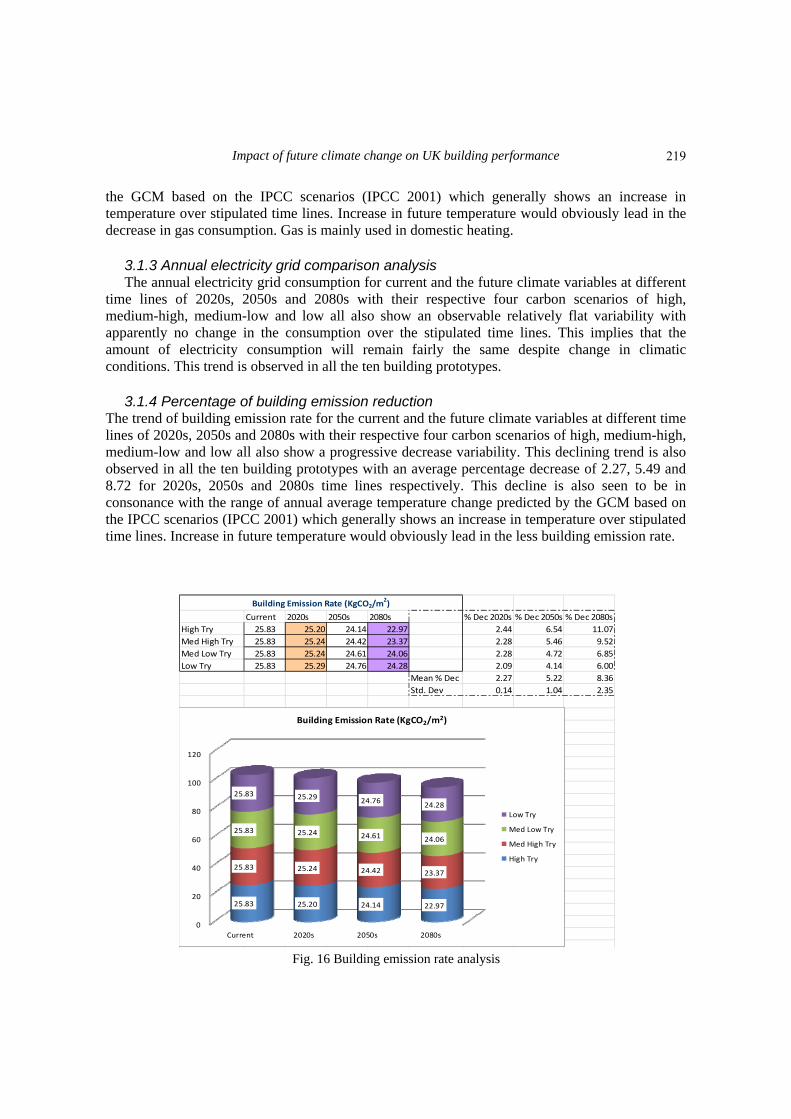
3.1.4 Percentage of building emission reduction
The trend of building emission rate for the current and the future climate variables at different time lines of 2020s, 2050s and 2080s with their respective four carbon scenarios of high, medium-high, medium-low and low all also show a progressive decrease variability. This declining trend is also observed in all the ten building prototypes with an average percentage decrease of 2.27, 5.49 and 8.72 for 2020s, 2050s and 2080s time lines respectively. This decline is also seen to be in consonance with the range of annual average temperature change predicted by the GCM based on the IPCC scenarios (IPCC 2001) which generally shows an increase in temperature over stipulated time lines. Increase in future temperature would obviously lead in the less building emission rate.
Current 2020s 2050s 2080s % Dec 2020s % Dec 2050s % Dec 2080s
High Try 25.83 25.20 24.14 22.97 2.44 6.54 11.07
Med High Try 25.83 25.24 24.42 23.37 2.28 5.46 9.52
Med Low Try 25.83 25.24 24.61 24.06 2.28 4.72 6.85
Low Try 25.83 25.29 24.76 24.28 2.09 4.14 6.00
Mean % Dec 2.27 5.22 8.36
Std. Dev 0.14 1.04 2.35
Building Emission Rate (KgCO2/m2)
0
20
40
60
80
100
120
Current 2020s 2050s 2080s
25.83 25.20 24.14 22.97
25.83 25.24 24.42 23.37
25.83 25.24 24.61 24.06
25.83 25.29 24.7624.28
Building Emission Rate (KgCO2/m2)
Low Try
Med Low Try
Med High Try
High Try
Fig. 16 Building emission rate analysis
219
Joseph Amoako-Attah and Ali B-Jahromi
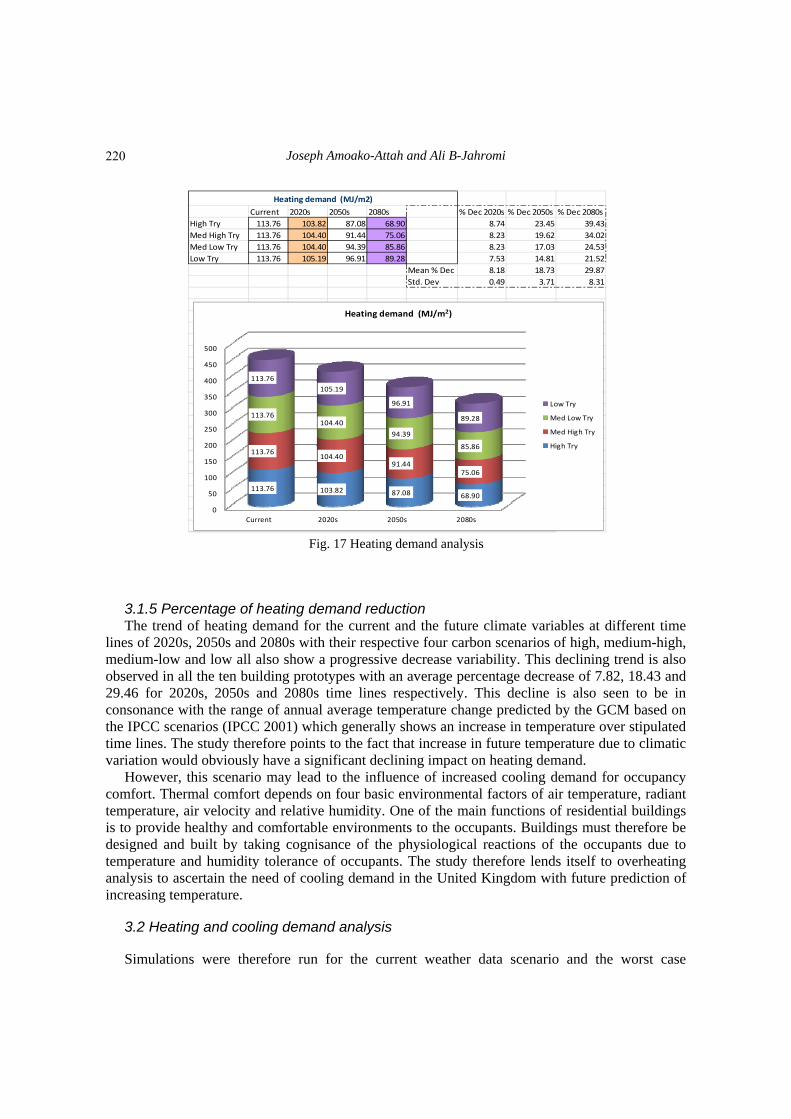
Current 2020s 2050s 2080s % Dec 2020s % Dec 2050s % Dec 2080s
High Try 113.76 103.82 87.08 68.90 8.74 23.45 39.43
Med High Try 113.76 104.40 91.44 75.06 8.23 19.62 34.02
Med Low Try 113.76 104.40 94.39 85.86 8.23 17.03 24.53
Low Try 113.76 105.19 96.91 89.28 7.53 14.81 21.52
Mean % Dec 8.18 18.73 29.87
Std. Dev 0.49 3.71 8.31
Heating demand (MJ/m2)
0
50
100
150
200
250
300
350
400
450
500
Current 2020s 2050s 2080s
113.76 103.82 87.08 68.90
113.76104.40
91.4475.06
113.76104.40
94.39
85.86
113.76
105.19
96.91
89.28
Heating demand (MJ/m2)
Low Try
Med Low Try
Med High Try
High Try
Fig. 17 Heating demand analysis
3.1.5 Percentage of heating demand reduction The trend of heating demand for the current and the future climate variables at different time
lines of 2020s, 2050s and 2080s with their respective four carbon scenarios of high, medium-high, medium-low and low all also show a progressive decrease variability. This declining trend is also observed in all the ten building prototypes with an average percentage decrease of 7.82, 18.43 and 29.46 for 2020s, 2050s and 2080s time lines respectively. This decline is also seen to be in consonance with the range of annual average temperature change predicted by the GCM based on the IPCC scenarios (IPCC 2001) which generally shows an increase in temperature over stipulated time lines. The study therefore points to the fact that increase in future temperature due to climatic variation would obviously have a significant declining impact on heating demand.
However, this scenario may lead to the influence of increased cooling demand for occupancy comfort. Thermal comfort depends on four basic environmental factors of air temperature, radiant temperature, air velocity and relative humidity. One of the main functions of residential buildings is to provide healthy and comfortable environments to the occupants. Buildings must therefore be designed and built by taking cognisance of the physiological reactions of the occupants due to temperature and humidity tolerance of occupants. The study therefore lends itself to overheating analysis to ascertain the need of cooling demand in the United Kingdom with future prediction of increasing temperature.
3.2 Heating and cooling demand analysis Simulations were therefore run for the current weather data scenario and the worst case
220
Impact of future climate change on UK building performance
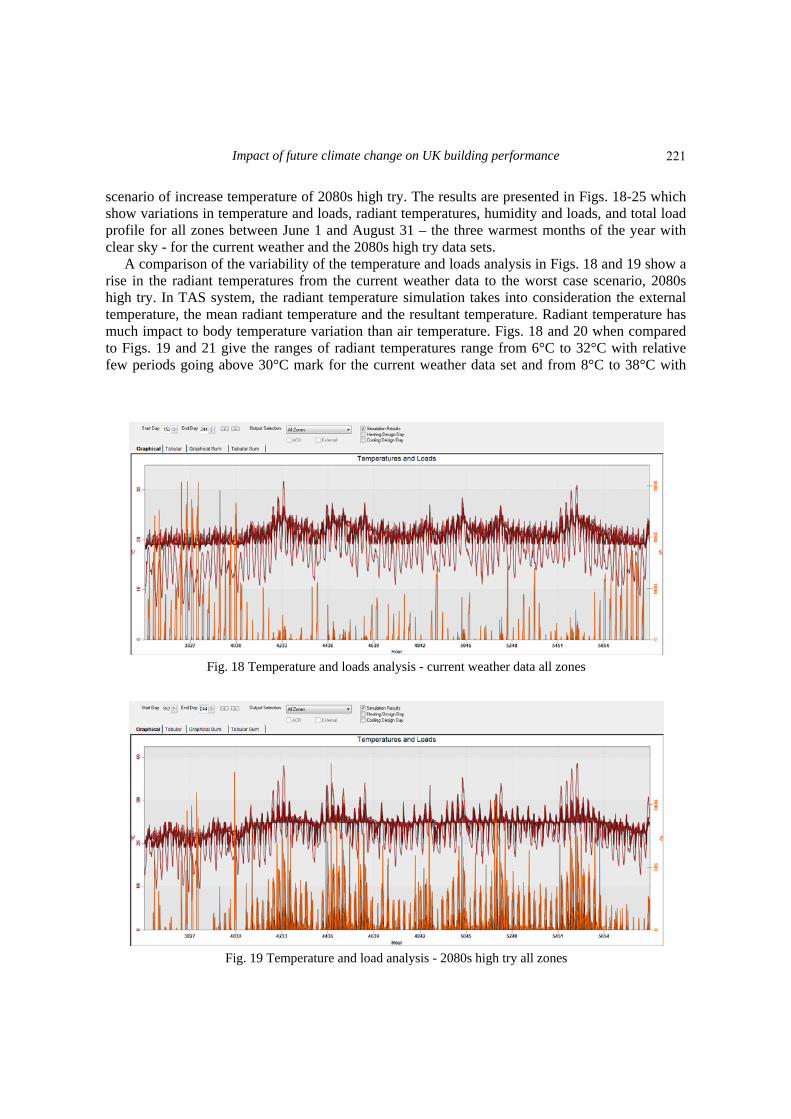
scenario of increase temperature of 2080s high try. The results are presented in Figs. 18-25 which show variations in temperature and loads, radiant temperatures, humidity and loads, and total load profile for all zones between June 1 and August 31 – the three warmest months of the year with clear sky - for the current weather and the 2080s high try data sets.
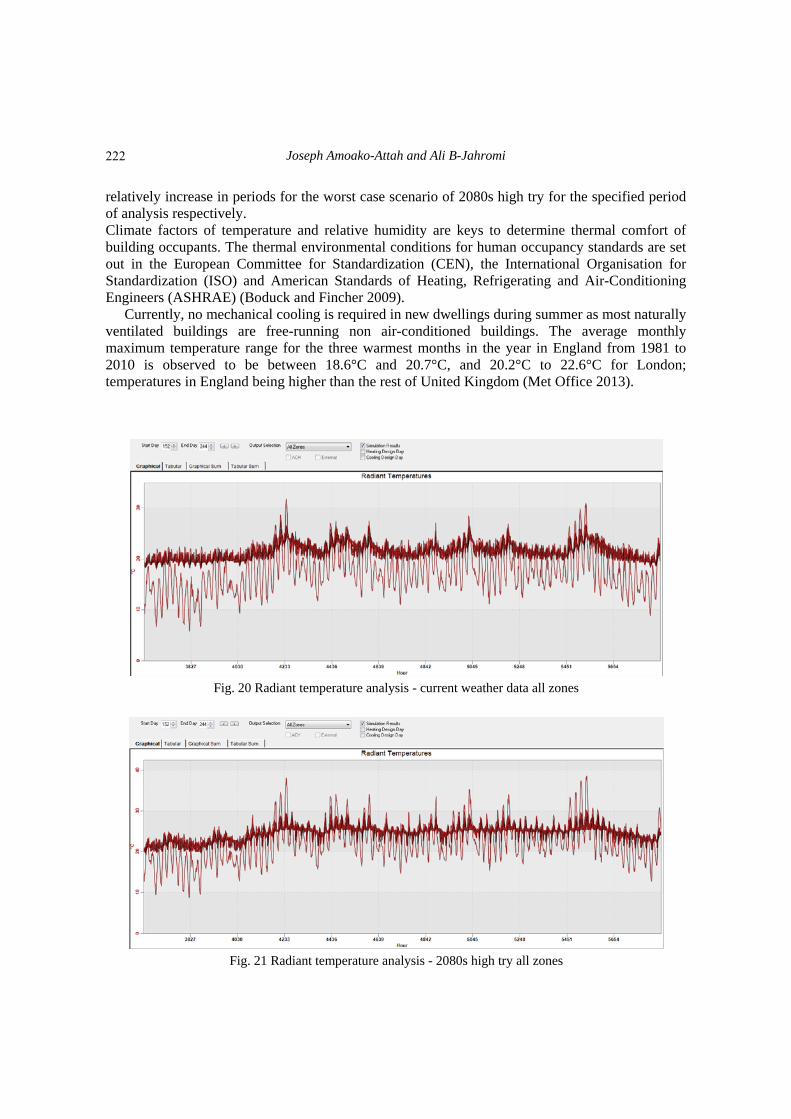
A comparison of the variability of the temperature and loads analysis in Figs. 18 and 19 show a rise in the radiant temperatures from the current weather data to the worst case scenario, 2080s high try. In TAS system, the radiant temperature simulation takes into consideration the external temperature, the mean radiant temperature and the resultant temperature. Radiant temperature has much impact to body temperature variation than air temperature. Figs. 18 and 20 when compared to Figs. 19 and 21 give the ranges of radiant temperatures range from 6°C to 32°C with relative few periods going above 30°C mark for the current weather data set and from 8°C to 38°C with
Fig. 18 Temperature and loads analysis - current weather data all zones
Fig. 19 Temperature and load analysis - 2080s high try all zones
221
Joseph Amoako-Attah and Ali B-Jahromi
relatively increase in periods for the worst case scenario of 2080s high try for the specified period of analysis respectively. Climate factors of temperature and relative humidity are keys to determine thermal comfort of building occupants. The thermal environmental conditions for human occupancy standards are set out in the European Committee for Standardization (CEN), the International Organisation for Standardization (ISO) and American Standards of Heating, Refrigerating and Air-Conditioning Engineers (ASHRAE) (Boduck and Fincher 2009).
Currently, no mechanical cooling is required in new dwellings during summer as most naturally ventilated buildings are free-running non air-conditioned buildings. The average monthly maximum temperature range for the three warmest months in the year in England from 1981 to 2010 is observed to be between 18.6°C and 20.7°C, and 20.2°C to 22.6°C for London; temperatures in England being higher than the rest of United Kingdom (Met Office 2013).
Fig. 20 Radiant temperature analysis - current weather data all zones
Fig. 21 Radiant temperature analysis - 2080s high try all zones
222
Impact of future climate change on UK building performance
The European Committee for Standardization sets the recommended criteria for the indoor temperature of a dwelling based on a running mean outside temperature as between 18°C to 27°C for all categories of residential buildings and 20°C to 26°C for normal level of expectation recommended for new buildings and renovations (EN 15251 CEN 2007). The ASHRAE’s Standard 55, Thermal Environmental conditions for Human Occupancy, stipulates the guideline room air temperatures for residences during summer to be in the range of 23°C to 26°C (ASHRAE Standard 55 1992).
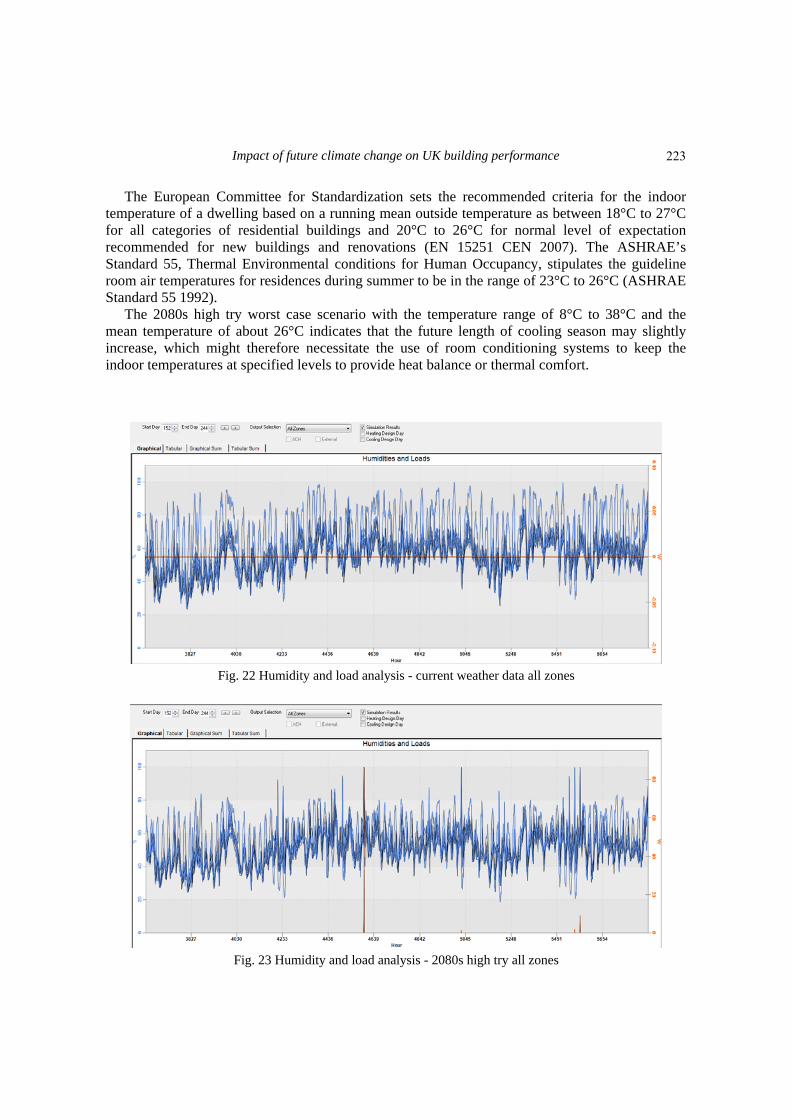
The 2080s high try worst case scenario with the temperature range of 8°C to 38°C and the mean temperature of about 26°C indicates that the future length of cooling season may slightly increase, which might therefore necessitate the use of room conditioning systems to keep the indoor temperatures at specified levels to provide heat balance or thermal comfort.
Fig. 22 Humidity and load analysis - current weather data all zones
Fig. 23 Humidity and load analysis - 2080s high try all zones
223
Joseph Amoako-Attah and Ali B-Jahromi
A comparison of Figs. 16 and 17 give the variability of humidity and loads analysis within the specified period. In the TAS system, simulation of the humilities and loads takes into consideration the external humidity, relative humidity, latent removal load and latent addition load. Fig. 16 shows humidity range variability between 25% and 98% with most relative humidity between 40% and 60%. Fig. 17 gives the range variability to be between 20% and 96% with most relative humidity values between 38% and 58%. The higher the humidity the less evaporation of sweat, thus high levels of relative humidity leads to less body evaporation resulting in minimal cooling of the body. The converse leads to skin dryness and dryness and irritation of the eyes, throat and nose (Boduch and Fincher 2009). Relative humidity between 40% and 70% has little impact on thermal comfort (Thermal Comfort 2013). The base line for thermal comfort with reference to relative humidity is set within the range of 25% and 60% (Boduch and Fincher 2009). The International Organization for Standardization ISO 7730:2005 stipulates that humidity impact is limited at temperatures less than 26°C considering moderate activity levels (ISO 7730:2005). Unlike temperature effect on heat balance, thermal comfort is expressed over a wide range of relative humidity conditions. With this wide range, variability of relative humidity unlike temperature has only a minimal effect on thermal comfort (EN 15251 CEN 2007). Thus although there is evidence of some reduction in humility in the worst case scenario of 2080s high try, the variability does not suggest a great shift to cooling demands.
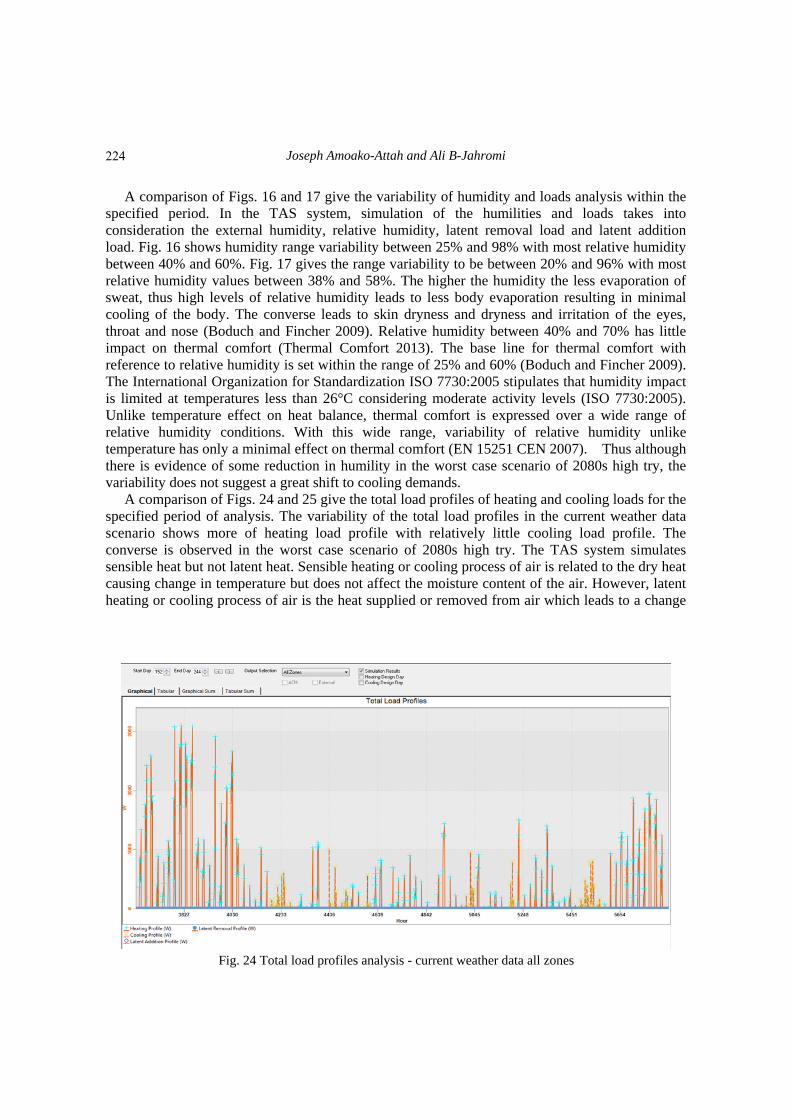
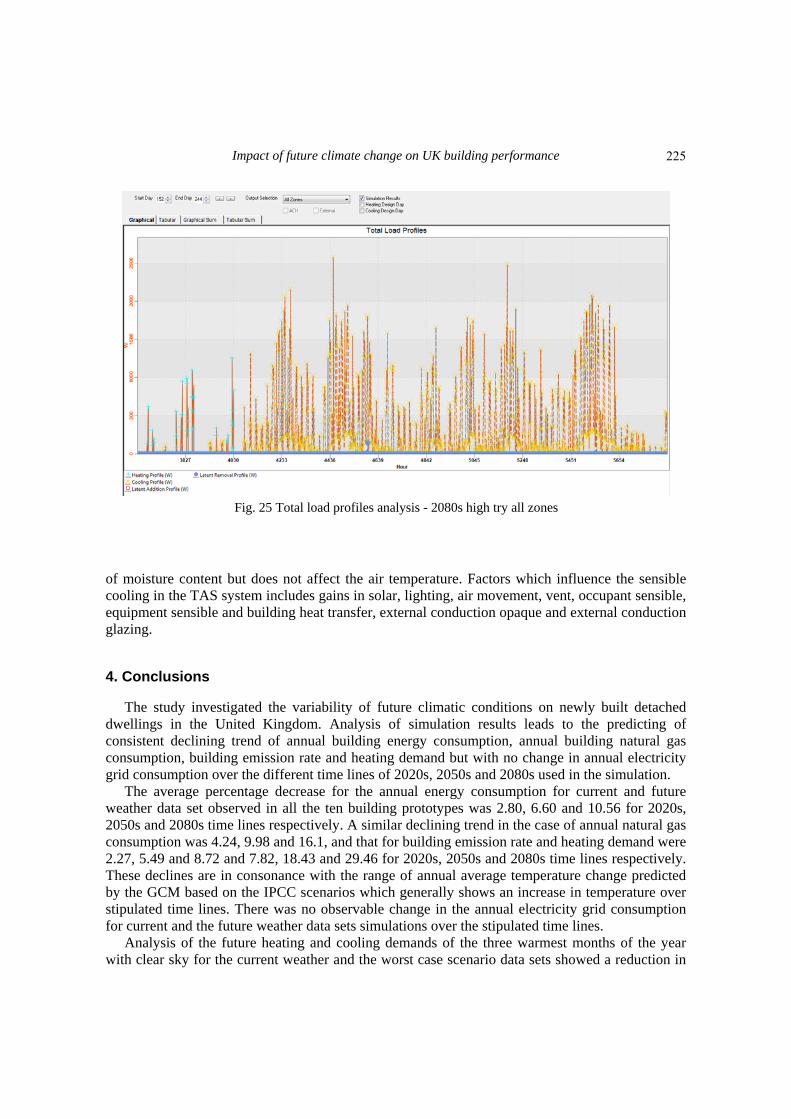
A comparison of Figs. 24 and 25 give the total load profiles of heating and cooling loads for the specified period of analysis. The variability of the total load profiles in the current weather data scenario shows more of heating load profile with relatively little cooling load profile. The converse is observed in the worst case scenario of 2080s high try. The TAS system simulates sensible heat but not latent heat. Sensible heating or cooling process of air is related to the dry heat causing change in temperature but does not affect the moisture content of the air. However, latent heating or cooling process of air is the heat supplied or removed from air which leads to a change
Fig. 24 Total load profiles analysis - current weather data all zones
224
Impact of future climate change on UK building performance
Fig. 25 Total load profiles analysis - 2080s high try all zones
of moisture content but does not affect the air temperature. Factors which influence the sensible cooling in the TAS system includes gains in solar, lighting, air movement, vent, occupant sensible, equipment sensible and building heat transfer, external conduction opaque and external conduction glazing. 4. Conclusions
The study investigated the variability of future climatic conditions on newly built detached dwellings in the United Kingdom. Analysis of simulation results leads to the predicting of consistent declining trend of annual building energy consumption, annual building natural gas consumption, building emission rate and heating demand but with no change in annual electricity grid consumption over the different time lines of 2020s, 2050s and 2080s used in the simulation.
The average percentage decrease for the annual energy consumption for current and future weather data set observed in all the ten building prototypes was 2.80, 6.60 and 10.56 for 2020s, 2050s and 2080s time lines respectively. A similar declining trend in the case of annual natural gas consumption was 4.24, 9.98 and 16.1, and that for building emission rate and heating demand were 2.27, 5.49 and 8.72 and 7.82, 18.43 and 29.46 for 2020s, 2050s and 2080s time lines respectively. These declines are in consonance with the range of annual average temperature change predicted by the GCM based on the IPCC scenarios which generally shows an increase in temperature over stipulated time lines. There was no observable change in the annual electricity grid consumption for current and the future weather data sets simulations over the stipulated time lines.
Analysis of the future heating and cooling demands of the three warmest months of the year with clear sky for the current weather and the worst case scenario data sets showed a reduction in
225
Joseph Amoako-Attah and Ali B-Jahromi
humility in the worst case scenario. However, the variability does not suggest a shift to cooling demands as the range falls within the thermal comfort relative humidity tolerance associated with the physiological reactions of the building occupants. The worst case scenario analysis of radiant temperature indicated that the future length of cooling season may slightly increase, which might therefore necessitate the use of room conditioning systems to keep the indoor temperatures at specified levels to provide heat balance or thermal comfort.
The study thus establishes the significant impact of variability of climatic patterns on building performance taking cognizance of the future timelines which also coincides with building life span. It further affirms that predicted increase in future temperatures might results in reduction in energy use for space heating and emissions but conversely lead to the increase in cooling demand, thus offsetting the gains in heating demand. Increase in cooling demand has environmental implications as it results in increase electricity consumption leading to higher emissions.
This work has indicated that building performance simulation using variation of future climatic patterns can contribute to the reduction of the environmental implications to the built environment and facilitates the drive towards the attainment of future sustainability requirements. The focus on how to reduced cooling loads and improve building energy efficiency will challenge future innovative design and adapted technological process. These will augur for climatic adaptation and mitigation strategies to effectively meet the future demand in the built environment. The measures would include planning and design options sensitive to varying climatic conditions and resilient building design which incorporates improved and better façade and building envelope, passive design technologies and high efficient HVAC and radiant systems with the aim to eventually reduce future total energy demands in dwellings. In addition emphasis should be placed on behavioural adaptations of building occupants to re-conscientize them in controlling building performance. References American Society of Heating (1992), Refrigerating and Air Conditioning Engineers, Inc. Standard 55 –
Thermal Environmental Conditions for Human Occupancy, Atlanta, ANSI. Barclays, M., Sharples, S., Kang, J. and Watkins, R. (2012), “The natural ventilation performance of
buildings under alternative future weather projections”, Building Services Engineering Research and Technology (Sage Publication Ltd.), 33(1), 35-50.
Boduch, M. and Fincher, W. (2009), “Standards of Human Comfort: Relative and Absolute”, UTSoA – Seminar in Sustainable Architecture, Meadows Seminar Fall.
Chan, A.L.S. (2011), “Developing future hourly weather files for studying the impact of climate change on buildings energy performance in Hong Kong”, Energy and Buildings, 43(10), 2860-2868.
Climate Change Act (2008), Available at http://www.legislation.gov.uk/ukpga/2008/27/contents, Accessed 20 April 2013.
Collins, L., Natarajan, S. and Levermore, G. (2010), “Climate change and future energy consumption in UK housing stock”, Building Services Engineering Research and Technology (Sage Publication, Ltd.), 31(1), 75-90.
Crawley, D.B. (2003), “Impact of Climate change on buildings”, Proceedings of the CIBSE/ASHRAE International Conference 2003, Edinburgh, Scotland, London, September.
Crawley, D.B. (2008), “Estimating the impacts of climate and urbanization on building performance”, J. Build. Perform. Simulat., 1(2), 91-115.
De Wilde, P. and Coley, D. (2012), “The implications of a changing climate for buildings”, Build. Environ., 56, 1-7.
226
Impact of future climate change on UK building performance
Du, H., Edge, J. and Underwood, C. (2011), “Modelling the impacts of new UK future weather data on a school building”, Proceedings of Building Simulation from The 12th Conference of International Building Performance Simulation Association, Sydney, Australia, November.
EN Standards (2007), Indoor Environmental Input Parameters for Design and Assessment of Energy Performance of Buildings Addressing Indoor Air Quality, Thermal Environment, Lighting and Acoustics (Pilsen, Czech Republic: EN Standards 2007).
Frank, T. (2005), “Climate change impacts on building heating and cooling energy demand in Switzerland”, Energy Build., 37(11), 1175-1185.
Gaterell, M.R. and McEvoy, M.E. (2005), “The impact of climate uncertainties on the performance of energy efficiency measures applied to dwellings”, Energy Build., 37(9), 982-995.
Hacker, J., Capon, R., and Mylona, A. (2009), “Use of climate change scenarios for building simulation: the CIBSE future weather years”, The Chartered Institution of Building Services Engineers, London, UK, CIBSE TM48:2009.
Hacker, J.N., De Saullers, T.P., Minson, A.J. and Holmes, M.J. (2008), “Embodied and operational carbon dioxide emissions from housing: A case study on the effects of thermal mass and climate change”, Energy Build., 40(3), 375-384.
Hacker, J.N., Holmes, M., Belcher, S. and Davies, G. (2005), “Climate change and indoor environment: impacts and adaptation”, The Charted Institution of Building Services Engineers, London.
Intergovernmental Panel on Climate Change (2001), Climate Change 2001: Impacts, Adaptation and Vulnerability, Cambridge, Cambridge University Press.
International Organization for Standardization (ISO) (2005), ISO 7730:2005, Ergonomics of the Thermal Environment – Analytical Determination and Interpretation of Thermal Comfort Using Calculation of the PMV And PPD Indices and Local Thermal Comfort Criteria, (Geneva: International Organization for Standardization 2005).
Intergovernmental Panel on Climate Change (IPCC) (2007), Climate change 2007: the physical science basis, Available from: http://www.ipcc.ch/publications, Accessed 20 April 2013.
Lomas, K.J. and Ji, Y. (2009), “Resilience of naturally ventilated buildings to climate change: Advanced natural ventilation and hospital wards”, Energy Build., 41(6), 629-653.
Met Office (2013), Climate Averages (1981-2010), Available at http://www.metoffice.gov.uk/climate/uk/ averages/19812010/england.html, Accessed June 9, 2013.
Nakicenovic, N. and Swart, R. (Eds). (2000), Emissions Scenarios, Cambridge University Press, UK. Palme, M., Isalgue, A. and Coch, H. (2013), “Avoiding the Possible Impact of Climate Change on the Built
Environment: The Importance of the Building’s Energy Robustness”, Buildings, 3(1), 191-204. Shamash, M., Mylona, A. and Metcalf, G. (2012a), “What guidance will building modellers require for
integrating future climates into building performance simulation?”, First Building Simulation and Optimization Conference, International Building Performance Simulation Association (IBPSA), England, Loughborough, UK, September, 253-260.
Shamash, M., Mylona, A. and Metcalf, G. (2012b), “Understanding future climate data from UKCP09 for weather data selection: a methodology”, CIBSE ASHRAE Technical Symposium, Imperial College, London, UK, April.
Thermal Comfort (2013), Available from http://www.hse.gov.uk/temperature/thermal/factors.htm#radiant, Accessed May 29, 2013.
UK Climate Projections (2010), UK Climate Projections 2009 Weather Generator User Interface (Version 1). Available at http://ukclimateprojections-ui.defra.gov.uk/ui/admin/login.php, Accessed 19 April, 2013.
Williams, D., Elghali, L., France, C. and Wheeler, R.C. (2011), “Projecting building energy demand using probabilistic weather conditions accounting for climate change”, CIBSE Technical Symposium, DeMontfort University, Leicester, UK, September.
WL
227