IMPACT OF E-COMMERCE ON EUROPEAN ...
141
i Lotta Hämäläinen IMPACT OF E-COMMERCE ON EUROPEAN CONTAINERBOARD DEMAND Faculty of Engineering and Natural Sciences Master of Science Thesis December 2019
-
Upload
khangminh22 -
Category
Documents
-
view
0 -
download
0
Transcript of IMPACT OF E-COMMERCE ON EUROPEAN ...
i
Lotta Hämäläinen
IMPACT OF E-COMMERCE ON EUROPEAN CONTAINERBOARD
DEMAND
Faculty of Engineering and Natural Sciences Master of Science Thesis
December 2019
ABSTRACT
Lotta Hämäläinen: Impact of E-commerce on European Containerboard Demand Master of Science Thesis, 125 pages, 3 appendixes Tampere University Master’s Degree Program in Industrial Engineering and Management December 2019
This master’s thesis investigates the impact of business-to-consumer electronic commerce (later e-commerce) on European containerboard demand. In e-commerce, products are usually shipped separately to consumers, which increases secondary package’s role in distribution. The main functions of e-commerce packaging are protection, convenience and brand communication. In addition, consumers are increasingly demanding sustainable packaging solutions. The most used packaging material in e-commerce is corrugated board, followed by flexible plastics. Corrugated board uses containerboard as raw material in liners and flutings.
The overall European containerboard market is well known but the impact of e-commerce on the European containerboard demand is unclear. Due to robust growth of e-commerce and lack of research on e-commerce packaging, the main goal of this research is to investigate the demand drivers for containerboard used in e-commerce packaging, paying attention to the growing sustainability concerns. The research was done for a case company, which is a global business advisor in industry and energy sectors. The objectives of this market research were achieved with literature review and by having in total 42 answerers in interviews and online survey.
The biggest drivers for containerboard demand in e-commerce packaging are overall economic situation and e-commerce development. As well, competition between packaging materials and growing sustainability concerns are big drivers. Fibre-based packaging materials are currently perceived as more sustainable than plastics due to recyclability. On the other hand, corrugated packaging may face challenges due to overpackaging, which needs to be reduced. Policies may arise due to sustainability concerns and they can have both positive and negative impacts on future e-commerce packaging demand. Big online retailers are followed in the market and their packaging decisions are observed by other retailers. Containerboard related trends in e-commerce packaging are requirements of lighter but stronger material and favour of recycled fibre-based containerboard.
E-commerce packaging material decision is made based on need of protection, cost, perceived sustainability, brand image and compatibility. Corrugated packaging has advantage over substitute materials when protection is needed. On the other hand, plastics and other flexible solutions are often less expensive than corrugated board, which means that they are usually favoured when protection is non-relevant. Packaging should be compatible with requirements of the supply chain, involving increase of automated packaging processes and intelligent packaging solutions. Good printability, opening experience and returnability are increasingly demanded from e-commerce packaging. As part of market research, the current demand of containerboard used in e-commerce packaging was estimated. Approximately 10% of the total containerboard demand in Europe is e-commerce packaging, of which 85% represent recycled fibre-based containerboard.
To conclude, the growth of e-commerce and overall consumption, together with need of protective packaging create the containerboard demand in e-commerce packaging.
Keywords: containerboard, corrugated board, packaging, e-commerce, sustainability,
demand drivers The originality of this thesis has been checked using the Turnitin OriginalityCheck service.
TIIVISTELMÄ
Lotta Hämäläinen: Verkkokaupan vaikutus aallotuskartongin kysyntään Euroopassa Diplomityö, 125 sivua, 3 liitettä Tampereen yliopisto Tuotantotalouden diplomi-insinöörin tutkinto-ohjelma Joulukuu 2019
Tämä diplomityö tutkii kuluttajan ja yrityksen välisen verkkokauppaliiketoiminnan vaikutusta aallotuskartongin kysyntään Euroopassa. Verkkokaupan tilaukset toimitetaan usein erikseen yksittäisille kuluttajille, mikä kasvattaa kuljetuspakkauksen merkitystä jakelussa. Verkkokauppapakkauksen tärkeimmät funktiot ovat suojaus, helppokäyttöisyys sekä brändiviestintä. Lisäksi kuluttajat vaativat kasvavissa määrin ympäristöystävällisiä pakkausratkaisuja. Käytetyin pakkausmateriaali verkkokaupassa on aaltopahvi, jonka jälkeen toiseksi eniten käytetään joustavia muovipakkauksia. Aallotuskartonkia käytetään raaka-aineena aaltopahvissa sen eri kerroksissa.
Nykyinen aallotuskartongin kysyntä Euroopassa on tunnettu mutta verkkokaupan vaikutus tähän kokonaiskysyntään on kuitenkin epäselvä. Verkkokauppapakkauksia koskevan tutkimuksen puutteen vuoksi sekä merkittävästi kasvavan verkkokauppaliiketoiminnan myötä, tämän tutkimuksen tavoitteena on selvittää aallotuskartongin kysynnän ajurit verkkokappapakkaamisessa, kiinnittäen huomiota erityisesti ympäristöhuolten vaikutuksiin. Tutkimus tehtiin case yritykselle, joka on maailmanlaajuinen liiketoiminta-asiantuntija teollisuus ja energia sektoreilla. Markkinatutkimuksen tavoitteisiin päästiin teoreettisen taustan, toimialakuvauksen sekä 42 haastattelu- ja verkkokyselyvastauksen avulla.
Suurimmat kysynnän ajurit aallotuskartongille verkkokauppapakkaamisessa ovat verkkokaupan kehitys sekä yleinen taloudellinen tilanne. Pakkausmateriaalien välinen kilpailu sekä kasvavat ympäristöhuolet ovat myös isoja kysynnän ajureita. Tällä hetkellä kuitupohjaiset pakkausmateriaalit nähdään ympäristöystävällisempänä vaihtoehtona kuin muovi niiden kierrätettävyyden vuoksi. Toisaalta, aaltopahvipakkausten haasteena on usein ylipakkaaminen, jota tulisi vähentää ympäristösyistä. Ympäristöhuolten tiimoilta syntyvä politiikka voi tulevaisuudessa vaikuttaa sekä positiivisesti että negatiivisesti aaltopahvin kysyntään. Isojen verkkokauppaliiketoimijoiden pakkauskehitystä seurataan markkinoilla ja muut kauppiaat saattavat ottaa mallia heidän pakkaustavoistaan. Aallotuskartonkiin liittyviä trendejä markkinoilla ovat kehitys kohti kevyemmän mutta vahvemman aallotuskartongin kysyntää sekä kierrätyskuitupohjaisen aallotuskartongin suosiminen.
Pakkausmateriaalivalinta syntyy suojaustarpeen, hinnan, koetun ympäristöystävällisyyden, brändiviestinnän sekä yhteensopivuuden pohjalta. Aaltopahvipakkauksilla on erinomaiset suojausominaisuudet, mikä on etu kilpaileviin materiaaleihin nähden. Toisaalta, muovi ja muut joustavat materiaalit ovat usein halvempi pakkausvaihtoehto, jonka vuoksi ne ovat suosittuja verkkokauppapakkaamisessa, kun suojaus ei ole olennaista. Pakkauksen tulisi olla yhteensopiva toimitusketjun vaatimusten kanssa, pitäen sisällään esimerkiksi pakkausprosessien automaation sekä älypakkausratkaisut. Verkkokauppapakkaukselta vaaditaan yhä enemmän painatusominaisuuksia, avaamiskokemusta sekä palautettavuutta. Osana markkinatutkimusta, työssä arvioitiin nykyinen aallotuskartongin kysyntä verkkokauppapakkaamisessa. Nykyisestä aallotuskartongin kysynnästä Euroopassa noin 10% on verkkokauppapakkaamista, josta noin 85% on kierrätyskuitupohjaiset aallotuskartongin kysyntää.
Yhteenvetona, kasvava verkkokauppaliiketoiminta ja kulutustottumukset sekä tarve suojaavalle pakkaukselle luovat kysynnän aallotuskartongille.
Avainsanat: aaltopahvi, aallotuskartonki, pakkaus, verkkokauppa, ympäristöystävällisyys,
kysynnän ajurit Tämän julkaisun alkuperäisyys on tarkastettu Turnitin OriginalityCheck –ohjelmalla.
PREFACE
By finalizing this master’s thesis, my journey in university is coming to an end. I have
learned a lot, gained unforgettable memories and lots of lifelong friends. Although this
chapter of my life is ending, I am sure that learning will not end, and I am ready and
motivated to start my working career!
I would like to thank the case company for providing me the opportunity to do this
master’s thesis and to learn about this interesting topic. Special thanks to my supervisors
Jenni and Janne who gave me valuable help throughout the project and helped me to
achieve the targets. Thanks to my colleagues who supported me during the journey and
advised me when they found interesting information about e-commerce packaging.
Great thanks to all interview and survey participants, who gave their valuable time and
insights about the topic.
Thanks to my university professors Saku Mäkinen and Jussi Heikkilä for all the advice
and feedback during the project. Big thanks to my lovely friends who supported me with
this thesis and who shared the best memories during the whole five and a half years in
university. These have been the best years so far! Big thanks to Valtteri for encouraging
me with this project. Most importantly, thanks to my family; äiti, pappa and mummi, who
have always listened and supported me whenever needed. Thanks for keeping me
motivated!
Vantaa, 5.12.2019
Lotta Hämäläinen
CONTENTS
1. INTRODUCTION .................................................................................................. 1
1.1 Background .......................................................................................... 1
1.2 Objective .............................................................................................. 2
1.3 Scope .................................................................................................. 3
1.4 Structure .............................................................................................. 3
2. THEORETICAL BACKGROUND........................................................................... 5
2.1 Functions of Packaging ........................................................................ 5
2.1.1 Protection ..................................................................................... 6
2.1.2 Communication ............................................................................. 7
2.1.3 Convenience ................................................................................. 8
2.1.4 Environmental Sustainability ......................................................... 9
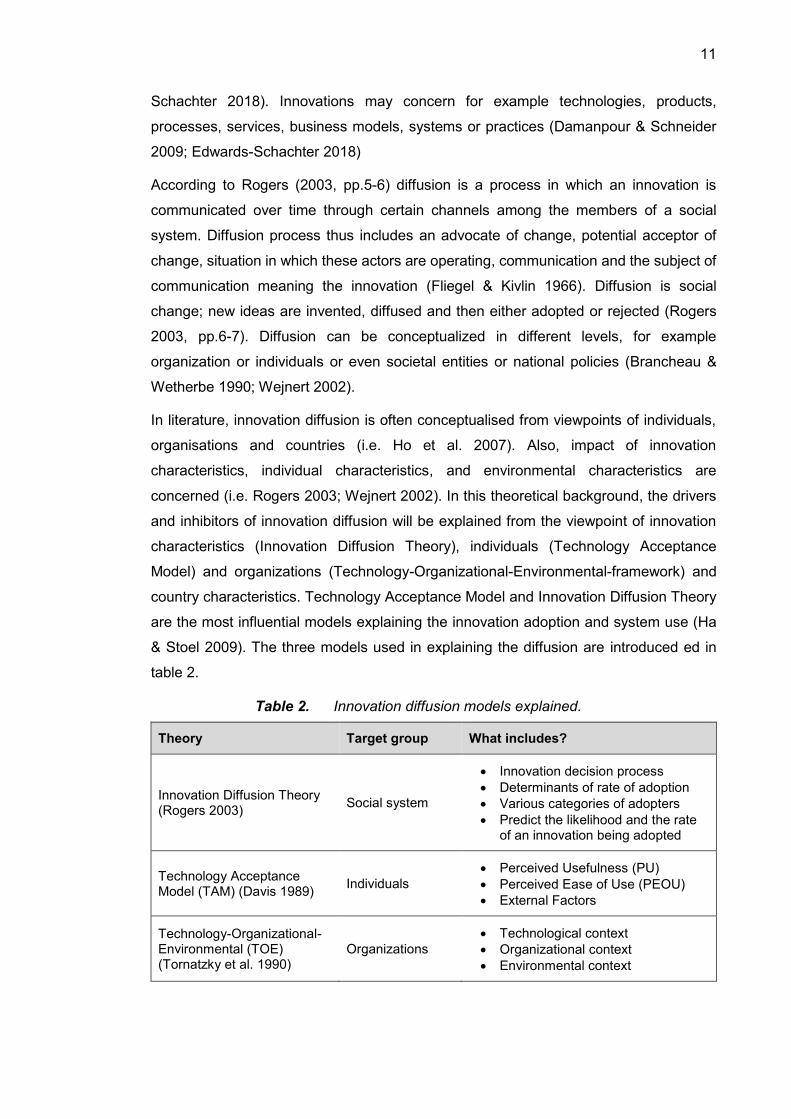
2.2 Innovation Diffusion Theory ................................................................ 10
2.2.1 Innovation Characteristics ........................................................... 12
2.2.2 Adoption-Decision Process and Adopter Characteristics ............. 16
2.3 Innovation Adoption by Individuals ..................................................... 20
2.3.1 Technology Acceptance Model ................................................... 20
2.3.2 Perceived Usefulness and Perceived Ease of Use ...................... 21
2.3.3 External Variables ....................................................................... 22
2.4 Innovation Adoption by Businesses .................................................... 27
2.4.1 Technological Context ................................................................ 28
2.4.2 Organisational Context ............................................................... 29
2.4.3 Environmental Context ................................................................ 30
2.5 Country Characteristics Affecting Innovation Adoption ....................... 31
3. INDUSTRY DESCRIPTION ................................................................................ 36
3.1 E-commerce Development ................................................................. 36
3.1.1 E-commerce Adoption in Europe ................................................ 37
3.1.2 E-commerce End Use Categories ............................................... 42
3.2 E-commerce Packaging ..................................................................... 45
3.2.1 Functions of E-commerce Packaging .......................................... 46
3.2.2 Packaging Materials in E-commerce ........................................... 50
3.3 European Containerboard Market ...................................................... 53
3.3.1 Containerboard Value Chain ....................................................... 53
3.3.2 Supply and Demand Development .............................................. 57
3.3.3 Containerboard Demand Drivers ................................................. 60
4. METHODOLOGY ................................................................................................ 62
4.1 Research Methods ............................................................................. 62
4.2 Research Process .............................................................................. 66
4.3 Research Data ................................................................................... 68
4.4 Data Analysing Methods .................................................................... 71
5. RESULTS ........................................................................................................... 74
5.1 Containerboard Demand in E-commerce Packaging .......................... 74
5.2 Substitute Materials............................................................................ 76
5.3 E-commerce Packaging Trends and Drivers ...................................... 78
5.4 Material Split in The Future ................................................................ 86
5.5 Packaging Material Selection Criteria ................................................. 89
5.6 Impact of E-commerce on Corrugated Packaging Supply .................. 93
5.7 Impact of E-commerce on In-store Packaging Demand ..................... 96
6. DISCUSSION...................................................................................................... 98
6.1 Containerboard Demand in E-commerce Packaging .......................... 98
6.2 Containerboard Demand Drivers in E-commerce Packaging .............. 99
6.2.1 Market Trends ........................................................................... 100
6.2.2 Packaging Material Decision Making Factors ............................ 103
6.2.3 Containerboard and Corrugated Packaging Development ........ 107
7. CONLUSIONS .................................................................................................. 109
7.1 Main Findings................................................................................... 109
7.2 Reliability and Validity ...................................................................... 112
7.3 Managerial Implications ................................................................... 114
7.4 Future Research Directions .............................................................. 115
REFERENCES..................................................................................................... 116
APPENDIX A: E-MAIL COVER LETTER .............................................................. 126
APPENDIX B: QUESTIONNAIRE – CONVERTERS ............................................ 127
APPENDIX C: LINKEDIN SURVEY ...................................................................... 130
LIST OF FIGURES
Figure 1. Innovation diffusion curves (modified from Rogers 2003, pp.273-281. ...................................................................................................... 17
Figure 2. Innovation-decision process (modified from Rogers 2003, p.170). ....... 19 Figure 3. Technology Acceptance Model (modified from Davis et al. 1989). ....... 21 Figure 4. New technology adoption by companies. ............................................. 28 Figure 5. Internet and e-commerce activity in EU28 countries (modified from
Eurostat 2018). .................................................................................... 37 Figure 6. Internet penetration by region (modified from Ecommerce
Foundation 2018). ................................................................................ 38 Figure 7. Most active e-commerce countries in Europe (modified from
Eurostat 2018). .................................................................................... 39 Figure 8. Least active e-commerce countries in Europe (modified from
Eurostat 2018). .................................................................................... 39 Figure 9. Regional online shopping activity in Europe (modified from E-
commerce foundation 2018). ................................................................ 40 Figure 10. Countries with highest e-commerce growth rate in 2017 (modified
from Ecommerce foundation 2018). ..................................................... 41 Figure 11. Online shopping activity in different socioeconomic groups
(modified from Ecommerce foundation 2018). ...................................... 41 Figure 12. Online shopping end uses (modified from E-shopper barometer
2017). .................................................................................................. 42 Figure 13. Online shopping end uses (modified from Ecommerce foundation
2018). .................................................................................................. 43 Figure 14. Revenue forecast for European e-commerce (modified from
Statista 2019). ...................................................................................... 43 Figure 15. E-commerce packaging materials (modified from EMOTA & FEPE
2018; Harrod 2019). ............................................................................. 51 Figure 16. Containerboard value chain (Case company 2019). ............................. 54 Figure 17. Corrugated board and flute types (Case company 2019). .................... 56 Figure 18. European corrugating hubs (Case company 2019). ............................. 57 Figure 19. Biggest containerboard producers in Europe (Case company
2019). .................................................................................................. 58 Figure 20. Biggest corrugated board producers in Europe (Case company
2019). .................................................................................................. 59 Figure 21. Research onion and methodological decisions (modified from
Saunders et al. 2009, p.108). ............................................................... 62 Figure 22. Research choices (modified from Saunders et al. 2009 p.152). ........... 65 Figure 23. Timeline for the research process. ....................................................... 67 Figure 24. Conducted Interviews. .......................................................................... 69 Figure 25. Survey answerers. ............................................................................... 70 Figure 26. Statistics of the empirical part. ............................................................. 70 Figure 27. Answering rate. .................................................................................... 71 Figure 28. Answers: The share of corrugated board used in e-commerce
packaging. ........................................................................................... 74 Figure 29. Share of containerboard used in e-commerce packaging. .................... 75 Figure 30. Materials used in e-commerce packaging. ........................................... 76 Figure 31. Substitute materials for corrugated board in e-commerce
packaging. ........................................................................................... 77 Figure 32. Corrugated box development in e-commerce packaging. ..................... 85 Figure 33. Distribution of answers how material split is going to change in
near future. .......................................................................................... 86
Figure 34. View of the material split in the future according to the type of company. ............................................................................................. 87
Figure 35. Preferred properties for liners used in e-commerce packaging. ............ 90 Figure 36. Factors affecting the choice of packaging material. .............................. 91 Figure 37. End use specific importance of packaging parameters. ........................ 92 Figure 38. Requirements in e-commerce packaging supply chain. ........................ 95 Figure 39. Answers to the question about importance of geographical
proximity. ............................................................................................. 96 Figure 40. Variables affecting shelf ready / in-store packaging demand. ............... 97 Figure 41. Revised containerboard demand in e-commerce packaging. ............... 99 Figure 42. Impact of drivers of containerboard demand in e-commerce
packaging. ......................................................................................... 100

LIST OF TABLES
Table 1. Functions of packaging. ......................................................................... 5 Table 2. Innovation diffusion models explained. ................................................. 11 Table 3. European biggest retailers and e-retailers (modified from Retail-
Index 2019). ......................................................................................... 44 Table 4. How e-commerce affects packaging functions. .................................... 47 Table 5. Advantages and disadvantages of most popular e-commerce
packaging materials. ............................................................................ 53 Table 6. Containerboard materials. .................................................................... 55 Table 7. Drivers affecting containerboard demand (Case company 2019). ........ 61
LIST OF SYMBOLS AND ABBREVIATIONS
B&M Brick and mortar B2B Business-to-business B2C Business-to-consumer CAGR Compound annual growth rate DC Distribution centre e-business Electronic business e-commerce Electronic commerce e-food Food sold through e-commerce e-retailer Electronic commerce retailer EU European Union EU28 European Union 28 countries FMCG Fast moving consumer goods GDP Gross domestic product LCA Life cycle assessment PEOU Perceived ease of use PU Perceived usefulness TAM Technology acceptance model TOE Technology-organizational-environmental (framework) TPB Theory of planned behaviour TRA Theory of reasoned action
1
1. INTRODUCTION
1.1 Background
One of the leading economic trends in the past decades has been the use of Internet to
conduct business transactions (Gibbs et al. 2003). E-commerce is often known as the
online transaction to trade goods and services in exchange of money (DeLone & McLean
2004; Regattieri et al. 2014). The transaction which is under the interest in this research,
is the growing business-to-consumer (B2C) e-commerce. Consumers are going towards
e-commerce because of seamless shopping experience and the ability to shop
whenever, where ever and whatever they want (BillerudKorsnäs 2014), and companies
feel also the pressure to adopt e-commerce to compete in the market (Gibbs et al. 2003).
Packaging is integral part of e-commerce as a product bought online cannot be stored,
packed or shipped if there is no packaging (BillerudKorsnäs 2014). In e-commerce, the
interest is in secondary packaging, which is planned to contain several products in their
primary packages for distribution and wholesaling (Hellström & Saghir 2007; Järvi-
Kääriainen & Ollila 2007, p.10; Kirwan 2013, p.4). E-commerce differs from traditional
retail, because often the products are shipped separately to consumers all having unique
orders, rather than collectively to multiple stores (BillerudKorsnäs 2014; Logistiikan
maailma 2019). This increases the secondary packaging role in product protection and
delivery (Ameripen 2017; Regattieri et al. 2014). Consumers are requiring increasingly
sustainable packaging solutions (BillerudKorsnäs 2014; Regattieri et al. 2014), which
can be seen as strategy for developing packaging with minimal environmental impact
(Lindh et al. 2016).
The most commonly used secondary packaging material in e-commerce is corrugated
board, followed by flexible plastics (EMOTA & FEPE 2018; Harrod 2019). Corrugated
board is light weight, strong, shock absorbing, cheap, printable, hygienic and recyclable
material (Järvi-Kääriainen & Ollila 2007, p.151). Corrugated board structure consists of
liners which are separated with a wave shaped core called fluting (Isaksson & Gradin
2009; Neidoni 2015). Liners and flutings can be called commonly as containerboard
(Kirwan 2013, p.314). The demand of containerboard is following the demand of
corrugated board (Case company 2019).
2
The case company is a global business advisor in industry and energy sectors. Current
European containerboard markets are well known by the case company. However, the
impact of e-commerce on containerboard demand is unclear. Due to robust e-commerce
growth, it is worth to look into the impact of e-commerce on the total containerboard
demand in Europe, in order to understand future development. In current literature
packaging functions and advantages as well as innovation and e-commerce diffusion are
covered. However, there is nearly no research on how e-commerce affects packaging,
and the only somewhat related article found was the one of Regattieri et al. (2014) about
A New Paradigm for Packaging Design in Web-based Commerce where e-commerce
business is evaluated in terms of cost. This master’s thesis will try to explain the impact
of e-commerce on containerboard demand. The objectives of this research are achieved
with theoretical review of packaging functions and innovation diffusion, industry
description and empirical part including online survey and interviews.
1.2 Objective
In this master’s thesis, the aim is to gain an understanding of the impact of e-commerce
and its challenges and opportunities for European containerboard demand. To
investigate what the drivers are for demand, the main research question to be answered
in this research is:
RQ1: What are the most important drivers impacting the demand of
containerboard used in e-commerce packaging?
The research question is broad and giving possibility to investigate the most important
demand drivers as well as new aspects and trends in e-commerce packaging.
Even though the focus of the research is on containerboard and corrugated packaging
demand in e-commerce, there are other materials and substitution in the market. Thus,
the researcher is aiming to have as objective point of view as possible in order to
understand the decisions of packaging material in e-commerce. The researcher will use
the empirical part to learn about material requirements, opportunities, threats in order to
understand the substitution in e-commerce packaging. The second research question is:
RQ2: What are the most important variables affecting the packaging decisions in
e-commerce?
The growing concerns about sustainability issues are expected to have an impact on e-
commerce packaging. To be able to understand how sustainability aspect is impacting
the demand, the third research question is:
3
RQ3: How sustainability issues are impacting containerboard demand in e-
commerce packaging?
When the overall picture of the trends and packaging decision is gained, the research
aims to find the answer to the question how much containerboard is used in e-commerce
packaging. The work is done to gain e-commerce know-how and to gain relevant and
up-to-date views regarding the future development so that the future demand in e-
commerce packaging can be evaluated. To be able to quantify the demand, the fourth
research question is:
RQ4: How much containerboard is used in e-commerce packaging?
1.3 Scope
This research will focus on containerboard demand, requirements and drivers in e-
commerce packaging market in Europe. All end uses in B2C e-commerce are in the
scope, but naturally there is more focus on the biggest end uses and their requirements.
Market outside of Europe and other e-commerce forms (i.e. business-to-business) are
left out of the research. The focus is mainly on secondary or transport packaging used
in e-commerce, but changes in primary packaging are also considered if they are
foreseen to impact the secondary packaging demand.
Even though there are substitute materials in this field, this research will not try to answer
how e-commerce impacts on them. Still, substitute materials are introduced and
discussed because competition between materials is impacting the demand of
containerboard. As the main competitor is currently plastics, it is discussed in literature
review and in empirical part. As e-commerce packaging is used in the product deliveries,
it is strongly linked to the logistics. Logistical aspects of e-commerce packaging are
mainly leaved out of scope of the research (i.e. logistical requirements of packaging, new
delivery methods, sustainability etc.), and included only if they are foreseen to impact
the material demand.
1.4 Structure
This thesis consists of literature review and empirical part. The literature review starts
with theoretical background in chapter 2. Chapter presents packaging and its functions
and the theoretical framework for innovation diffusion. Innovation diffusion is explained
in general, so that it can be used both for understanding corrugated packaging and e-
commerce diffusion attributes. Chapter 3 explains the current situation in European e-
4
commerce, e-commerce packaging and containerboard markets. This research is a
market research, so it is useful to understand the current situation in the market.
Chapter 4 introduces the main methodological decisions made in this research. As well,
the research process including literature part and empirical part are introduced. The
empirical part is conducted by having an online survey and interviews. The main results
of this research are presented in chapter 5. The results are discussed with theoretical
background in chapter 6, where the drivers of containerboard demand in e-commerce
are finally introduced. Chapter 7 concludes the whole research, evaluates research
reliability and validity, explains managerial implications and gives ideas for future
research.
5
2. THEORETICAL BACKGROUND
In this chapter, the theoretical background of packaging functions and innovation
diffusion are introduced. Section 2.1 presents the functions of packaging including
protection, communication and convenience. Also sustainability is introduced as a
strategy for packaging development. Section 2.2 presents theoretical background for
innovation diffusion theory with Rogers’ (2003) framework. Section 2.3 explains
innovation adoption by individuals and section 2.4 explains innovation adoption from
business perspective. Finally, section 2.5 presents some country characteristics
impacting the innovation adoption.
2.1 Functions of Packaging
Packaging can be seen as a means of preparing goods for transportation, distribution,
storage, retail and end use. It should ensure safe delivery and good condition of the
product with minimal overall costs (Natarajan et al. 2014, p. 2). It must provide value
and convenience for the end consumer (Hellström & Saghir 2007) as well as for the
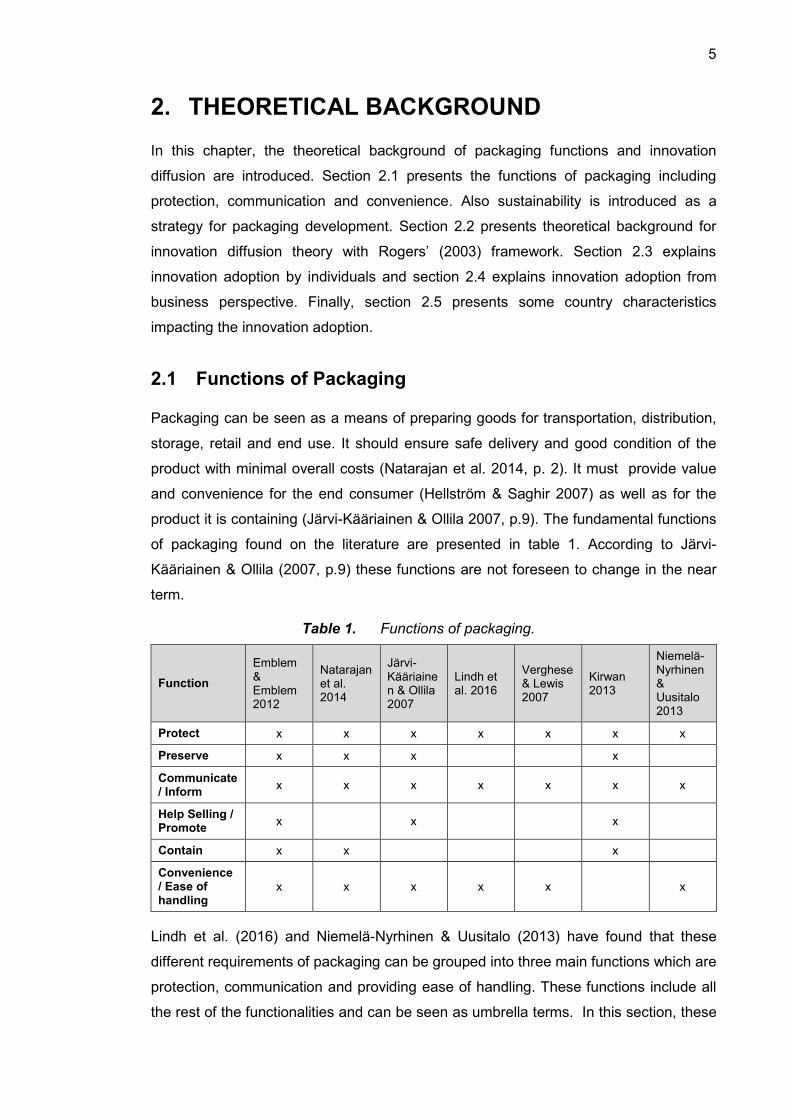
product it is containing (Järvi-Kääriainen & Ollila 2007, p.9). The fundamental functions
of packaging found on the literature are presented in table 1. According to Järvi-
Kääriainen & Ollila (2007, p.9) these functions are not foreseen to change in the near
term.
Function
Emblem & Emblem 2012
Natarajan et al. 2014
Järvi-Kääriainen & Ollila 2007
Lindh et al. 2016
Verghese & Lewis 2007
Kirwan 2013
Niemelä-Nyrhinen & Uusitalo 2013
Protect x x x x x x x
Preserve x x x x
Communicate / Inform
x x x x x x x
Help Selling / Promote
x x x
Contain x x x
Convenience / Ease of handling
x x x x x x
Lindh et al. (2016) and Niemelä-Nyrhinen & Uusitalo (2013) have found that these
different requirements of packaging can be grouped into three main functions which are
protection, communication and providing ease of handling. These functions include all
the rest of the functionalities and can be seen as umbrella terms. In this section, these
Table 1. Functions of packaging.
6
three fundamental functions of packaging will be introduced. Also, the environmental
aspect of packaging will be explained – not as a function of packaging but rather as a
strategy for developing packaging with minimal environmental effect. It can be seen as
an outcome of the packaging functions, i.e. material selection or proper protection. (Lindh
et al. 2016)
Levels of Packaging
Packaging can be classified in different levels: primary, secondary and tertiary
packaging. Primary packaging includes the material that is in direct contact with the
product (Emblem & Emblem 2012, pp.6-7; Hellström & Saghir 2007; Kirwan 2013, p.4).
Primary packaging is important in the filling process and at the point of purchase and
use. It also keeps the product in good condition and contribute strength. (Emblem &
Emblem 2012, p.10) Secondary packaging is planned to contain several products in their
primary packages for distribution and wholesaling (Hellström & Saghir 2007; Järvi-
Kääriainen & Ollila 2007, p.10; Kirwan 2013, p.4). For example, distribution packages,
retail packages and multipacks are examples of secondary packaging (Järvi-Kääriainen
& Ollila 2007, p.10). The function of tertiary packaging is to contain the whole packaging
system through the supply chain with minimal damage and to contain multiple secondary
packages (Emblem & Emblem 2012, pp.6-10; Hellström & Saghir 2007; Järvi-Kääriainen
& Ollila 2007, p.10; Kirwan 2013, p.4). Tertiary packaging can be for example pallet.
Packaging must hold all its content within a unit (Hellström & Saghir 2007) and keeping
a number of packages together (Emblem & Emblem 2012, p.25; Natarajan 2014, p.10),
applying to all primary, secondary and tertiary packages. (Emblem & Emblem 2012,
p.25). Different levels of packaging are interdependent and packaging system
performance is affected by all of the levels and their interactions (Hellström & Saghir
2007).
2.1.1 Protection
Protection means the prevention, reduction or avoidance of physical, chemical or
biological damages during supply chain or during the journey between retailer and
ultimate user (Emblem & Emblem 2012, p.26; Järvi-Kääriainen & Ollila 2007, p.11).
Packaging not only protects the product from external influences, but it may also protect
the environment from the product (Hellström & Saghir 2007; Järvi-Kääriainen & Ollila
2007, p.12). The degree of protective functions depend on the nature of the product
(Natarajan et al. 2014, p.9; Regattieri et al. 2014; Hellström & Saghir 2007).
7
Physical damages to product during the supply chain may occur due to drop, shock,
vibration (i.e. transportation), compression (i.e. stacking) or puncture. Damages can be
also caused by environmental factors such as dirt, dust, insects, humidity or temperature.
Most typically, physical damage happens in warehousing or distribution environment.
(Emblem & Emblem 2012, p.26; Järvi-Kääriainen & Ollila 2007, p.11) When developing
protective solution, it is important to remember that the combined effectiveness of all
levels of packaging is important (Emblem & Emblem 2012, p.26). Protective attributes
that can enhance value received from packaging are for example strength, proper
packaging size and proper size in relation to weight (Niemelä-Nyrhinen & Uusitalo 2013).
In addition to mechanical protection, part of product protection is also preservation from
biological and chemical hazards. The aim is to extend the shelf life of the product, so
preservation applies mainly to food, drink, pharmaceutical and cosmetic industries.
(Emblem & Emblem 2012, p.41; Järvi-Kääriainen & Ollila 2007, p.11) The spoilage or
product change can be caused by microorganism or external factor such as moisture,
oxygen, light or temperature. These can all can cause unacceptable appearance, taste,
smell or be toxic or cause illness. (Emblem & Emblem 2012, p.42)
Product protection could also mean safety. The package should inform or tell if it has
been opened or handled in a way that has damaged the product. More and more
importance has been put into ensuring that the product is original and not fake. Safe
packages also ensure that possibly dangerous products do not end up for example in
children’s hands. (Järvi-Kääriainen & Ollila 2007, pp.11-12)
2.1.2 Communication
Packaging communication function include information, marketing and brand
communication aspects. Packaging offers possibility to provide information for anyone
handling the product. Different end uses have different types of guidelines on what
should be informed in the packaging (Järvi-Kääriainen & Ollila 2007, p.11). Depending
on the product and packaging, the information can include i.e. product, weight or volume,
destination, instructions for handling, unpacking or repacking, expiry date, ingredients
list or warning statements etc. In secondary and tertiary packaging information can also
include numbers in pack as well as product and bar codes. (Emblem & Emblem 2012,
pp.47-48).
In addition to information provided in the packaging, the packaging often need to act as
the “silent salesman” to attract potential purchasers and promote or help selling the
product (Emblem & Emblem 2012, p.48; Kirwan 2013, p.25; Natarajan 2014, p.11). This
8
applies especially to traditional retail. The attractive appearance is done by a
combination of colours, graphics and shape and size of the packaging, and the chosen
style is used to create an image about the product (Emblem & Emblem 2012, p.48; Järvi-
Kääriainen & Ollila 2007, p.11).
Many products are known from their appearance, and packaging is part of creating
product image (Järvi-Kääriainen & Ollila 2007, p.11). Branding is an important aspect of
the marketing perspective, and brand owners often add features that makes purchasers
instantly recognise their products (Emblem & Emblem 2012, p.48). These can be
symbols, slogans or trademarks (Järvi-Kääriainen & Ollila 2007, p.12). This concerns
especially the primary packaging and its appearance and attractiveness in retail
(Regattieri et al. 2014). From marketing perspective, the information provided in the
packaging could provide information about the benefits and uses to encourage purchase
(Emblem & Emblem 2012, p.48).
2.1.3 Convenience
Convenience of packaging plays a role in minimizing the effort with packaging (Marsh &
Bugusu 2007). This applies to production, supply chain, and handling by consumers.
Ease of handling, convenience and safety part of minimizing packaging effort, and they
can be achieved by packaging design (Emblem & Emblem 2012, p.46). Runnability of
packaging material, efficient production and functioning on the filling or packaging line
are important aspects of convenience (Emblem & Emblem 2012, p.47; Järvi-Kääriainen
& Ollila 2007, p.11; Kirwan 2013, p.25; Niemelä-Nyrhinen & Uusitalo 2013). Regarding
logistics and supply chain, the transport packaging should be measured so that there are
minimal empty space and that the packaging functions well in warehousing, stacking,
transiting and in palletising (Järvi-Kääriainen & Ollila 2007, p.11; Natarajan et al. 2014,
p.10). Simplicity and right size of packaging enhance convenience (Niemelä-Nyrhinen &
Uusitalo 2013). Globalisation brings new challenges regarding the conditions, i.e.
weather or transports, in which packages are transported (Järvi-Kääriainen & Ollila 2007,
p.11). Thus, the conditions and requirements of the supply chain needs to be considered.
Packaging convenience includes also ergonomic properties such as easy-open and
reclose functions and how the packaging should be picked up, opened or unpacked.
These apply to both primary and secondary packages. (Emblem & Emblem 2012, p.46;
Järvi-Kääriainen & Ollila 2007, p.12; Niemelä-Nyrhinen & Uusitalo 2013) Easily
disposable materials could also enhance convenience (Niemelä-Nyrhinen & Uusitalo
2013). Packaging must be user friendly (Natarajan et al. 2014, p.10) and different
9
packaging sizes should be available for different consumer needs (Järvi-Kääriainen &
Ollila 2007, p.12).
2.1.4 Environmental Sustainability
Even though sustainability or environmental friendliness is not a packaging function, it
can be seen as a consequence of packaging and raising importance as users become
more aware of the environmental impact of their consumption (Niemelä-Nyrhinen &
Uusitalo 2013). Currently, the definition of sustainable packaging is rather objective, and
it depends on the eco-burden as well as the needs of the product contained (Wever &
Vogtländer 2013). Even though there are suggestions how sustainable packaging should
be like, there is no unified view on the definition of sustainable packaging.
The sustainability concerns raise from climate change, dependence on fossil fuels,
scarce resources, lack of fresh water and what to do with “waste”. Packaging can be
seen wasteful in itself, when its original function is completed. (Kirwan 2013, p.52) When
considering packaging, the dominating environmental aspects that are often considered
are packaging material and recycling possibilities (Williams & Wikström 2011).
Packaging has attracted criticism as using valuable resources and being environmental
pollutant (Emblem & Emblem 2012, p.9), especially in retail packaging (Verghese &
Lewis 2007). These are only a part of the whole life cycle of the packaging. Packaging
may have direct and indirect effect on sustainability. Direct effects occur during the
production, transportation or recycling of the packaging material. Indirect effects on
environment are linked to the services that packaging provides for the users and the
content. (Lindh et al. 2016) The Sustainable Packaging Coalition (2011) definition of
sustainable packaging includes the following aspects:
“Is beneficial, safe & healthy for individuals and communities throughout its life
cycle
Meets market criteria for performance and cost
Is sourced, manufactured, transported, and recycled using renewable energy
Optimizes the use of renewable or recycled source materials
Is manufactured using clean production technologies and best practices
Is made from materials healthy throughout the life cycle
Is physically designed to optimize materials and energy
Is effectively recovered and utilized in biological and/or industrial closed loop
cycles” (Sustainable Packaging Coalition 2011)
10
For example, Life-cycle assessment (LCA) addresses potential environmental impacts
and aspects through product’s life cycle, from the raw material acquisition, production,
use, end-of-life treatment, recycling, recycling and in the end final disposal. (The
International Organization for Standardization 2006). According to Wever & Vogtländer
(2013) the issue with definitions that are looking only at the reduction of eco-burden but
the reality is that the value created by packaging needs to be taken into account in
business reality. Packaging sustainability includes also minimising product waste,
improving quality of life, protecting the environment and managing the packaging waste
through proper recovery and recycling (Kirwan 2013, p.26).
Packaging can be seen delivering benefits by reducing product waste, protecting and
containing goods, and preserving against spoilage or physical damage. (Emblem &
Emblem 2012, p.9; Kirwan 2013, p.54). The share of environmental impacts of packaging
are often relatively small compared to the whole product-packaging system (Silvenius et
al. 2014; Grönman et al. 2013). The protective role and success of product supply chain
can indirectly affect the environmental impacts (Grönman et al. 2013; Verghese & Lewis
2007). This benefit can be achieved during packaging, storage, distribution, sale and
finally consumption (Kirwan 2013, p.54). The original functions of packaging in protecting
and distributing the product need to be remembered, but the challenge in the packaging
design is to find balance between the amount of packaging and product protection
(Grönman et al. 2013).
The classic sustainability perspective of packaging is to reduce environmental impacts
by using life cycle assessment (LCA) to compare different alternatives. At the same time,
the classical marketing perspective on packaging is aiming to create value through
differentiation. These two perspectives are often conflicting. LCA approach has its
limitations evaluating social or financial impact of sustainability (Lewis et al. 2010). The
value-cost ratio is important, as there should be a fair price a customer is willing to pay
and as value is perceived use and fun that customer is experiencing. (Wever &
Vogtländer 2013)
2.2 Innovation Diffusion Theory
Innovation is an idea, object or practice that is perceived as new by the adopters. It
matters little, whether or not the innovation is objectively new or how much time there is
from the first use or discovery. This way, the perceived newness is determined by the
newness to an individual or other unit of adoption. (Rogers 2003, p.12) The newness of
an innovation creates uncertainty about the expected consequences (Rogers 2003,
p.14). Invention, novelty and change can be thus use to describe innovation (Edwards-
11
Schachter 2018). Innovations may concern for example technologies, products,
processes, services, business models, systems or practices (Damanpour & Schneider
2009; Edwards-Schachter 2018)
According to Rogers (2003, pp.5-6) diffusion is a process in which an innovation is
communicated over time through certain channels among the members of a social
system. Diffusion process thus includes an advocate of change, potential acceptor of
change, situation in which these actors are operating, communication and the subject of
communication meaning the innovation (Fliegel & Kivlin 1966). Diffusion is social
change; new ideas are invented, diffused and then either adopted or rejected (Rogers
2003, pp.6-7). Diffusion can be conceptualized in different levels, for example
organization or individuals or even societal entities or national policies (Brancheau &
Wetherbe 1990; Wejnert 2002).
In literature, innovation diffusion is often conceptualised from viewpoints of individuals,
organisations and countries (i.e. Ho et al. 2007). Also, impact of innovation
characteristics, individual characteristics, and environmental characteristics are
concerned (i.e. Rogers 2003; Wejnert 2002). In this theoretical background, the drivers
and inhibitors of innovation diffusion will be explained from the viewpoint of innovation
characteristics (Innovation Diffusion Theory), individuals (Technology Acceptance
Model) and organizations (Technology-Organizational-Environmental-framework) and
country characteristics. Technology Acceptance Model and Innovation Diffusion Theory
are the most influential models explaining the innovation adoption and system use (Ha
& Stoel 2009). The three models used in explaining the diffusion are introduced ed in
table 2.
Theory Target group What includes?
Innovation Diffusion Theory (Rogers 2003)
Social system
Innovation decision process
Determinants of rate of adoption
Various categories of adopters
Predict the likelihood and the rate of an innovation being adopted
Technology Acceptance Model (TAM) (Davis 1989)
Individuals
Perceived Usefulness (PU)
Perceived Ease of Use (PEOU)
External Factors
Technology-Organizational-Environmental (TOE) (Tornatzky et al. 1990)
Organizations
Technological context
Organizational context
Environmental context
Table 2. Innovation diffusion models explained.
12
2.2.1 Innovation Characteristics
Differences among innovations are important factors affecting the innovation diffusion
(Fliegel & Kivlin 1966). One of the mostly cited reviews of innovations perceived
characteristics/attributes is that of Rogers (2003) (Moore & Benbasat 1991). Rogers’
(2003, p.221) argue that 49-87% percent of the adoption of innovation can be explained
with relative advantage, compatibility, complexity, trialability and observability. Tornatzky
& Klein (1982) added many other characteristics to the definition, and in this theoretical
background, these are viewed together with those of Rogers’ (2003). Only cost attribute
is reviewed separately, as it is not comparable to other characteristics. When
compatibility, relative advantage, observability and trialability have positive impact on
innovation adoption, complexity and cost have often negative effect on innovation
adoption (Ostlund 1974; Zhu et al. 2006). It is argued that relative advantage,
compatibility and complexity have the biggest importance in innovation adoption
(Damanpour & Schneider 2009; Tornatzky & Klein 1982).
Innovation characteristics are often used in innovation research from the viewpoint of
individuals and how they see them being important in acceptance behaviour (Agarwal &
Prasad 1997). This means that the attributes and characteristics of an innovation are
always evaluated in reference to certain system or values of cognitive framework, so the
perceptions of the characteristics are subjective, and none of the attributes can be
measured objectively. This means that these are perceived characteristics, and even
though for example price and size can be defined simply, they are relatively measured
regarding individual’s or organisation’s resources or perceptions. (Downs & Mohr 1976)
As well, often the definitions are broad, the attributes are poorly conceptualised
(Tornatzky & Klein 1982) and the characteristics could be hard to measure (Moore &
Benbasat 1991; Tornatzky & Klein 1982). Still, there are some clear directionality
between some characteristics and innovation adoption (Tornatzky & Klein 1982).
Relative Advantage
Relative advantage means the degree to which an innovation is seen better than the
prior idea (Rogers 2003, p.229). It has been argued that relative advantage is one of the
strongest factors impacting the innovation’s rate of adoption (Flight et al 2011;
Premkumar & Roberts 1999; Rogers 2003, p.233). Relative advantage has often a
positive impact on the innovation diffusion (Zhu et al. 2006). Product nature defines what
is the type of relative advantage, and the positive impact can be explained for example
by economical profitability, social side of the innovation (Rogers 2003, p.229) or superior
physical or technical attributes (Flight et al. 2011). Potential adopters want to know why
13
the innovation is seen better than the existing product or practice (Rogers 2003, p.233)
and individuals who recognise the benefits of the technology, are more willing to adopt
the technology (Carter & Weerakkody 2008).
Magnitude of financial reward is an important factor in acceptance of new ideas (Fliegel
& Kivlin 1966) A new product may be based on the advantage of reduced production
cost (Rogers 2003, p.230), increased sales and operational efficiency (Zhu et al. 2006)
or profitability (Fliegel & Kivlin 1966; Tornatzky & Klein 1982). Other non-financial
attributes creating relative advantage are for example decrease of discomfort, saving
time and effort or increasing product performance (Fliegel & Kivlin 1966; Flight et al.
2011; Premkumar & Roberts 1999; Rogers 2003, p.233). Social status could create
motivation to adopt innovation. For example, in fashion, status seeking is one of the sole
relative advantage the adopters are receiving. (Rogers 2003, p.230). Similarly Moore &
Benbasat (1991) argue that the image affects the innovation diffusion, when innovation
is perceived to enhance the adopter’s status in the social system. However, this attribute
is not important if social status is not seeked.
Relative advantage is innovation specific. According to Tornatzky & Klein (1982) and
Moore & Benbasat (1991) the relative advantage as an characteristics is perhaps too
broad, and it includes vide variety of innovation characteristics, meaning that it is lacking
of conceptual strength, reliability and prescriptive power. On the other hand, it can be
seen as meeting certain purposes of an innovation and by filling these purposes being
better than the previous ideas (Moore & Benbasat 1991).
Cost
On the contrary to relative advantage, it is argued that could act as barrier to new
technology or innovation adoption (Zhu et al. 2006). It is possible to reach economical
profitability with the innovation, but on the other hand the implementation may require
investments (Zhu et al. 2006). Rapid reduction of costs during the innovation diffusion
may also encourage the rate of adoption (Rogers 2003, p.330). It has been seen that the
lower the cost of the innovation is the more likely that it will be quickly diffused (Tornatzky
& Klein 1982). Cost attribute includes both initial costs and continuing costs of innovation
(Fliegel & Kivlin 1966) meaning both direct and indirect costs (Wejnert 2002). As well, if
the existing idea is cheaper to use that the new innovation, it can act as a barrier to move
into the new technology (Mallat 2007). Compared to many other innovation
characteristics, cost is easy to measure (Tornatzky & Klein 1982).
Even though cost is argued to have an negative impact on innovation adoption, the
research results are inconsistent, and the cost and profitability are argued to have both
14
positive and negative impact on innovation diffusion (Damanpour & Schneider 2009;
Fliegel & Kivlin 1966; Tornatzky & Klein 1982). This could mean that in some cases other
attributes are valued over cost.
Compatibility
Compatibility means the degree to which the innovation is seen compatible or
incompatible with previous innovations or ideas, sociocultural values and beliefs or
needs. It is argued that the more compatible the innovation is, the less uncertainty is
included in the adoption. (Rogers 2003, p.440) Flight et al. (2011) refers to congruence,
which is similar type of attribute meaning that “innovation is perceived in the context of
other things and ideas, both old and new, and that the perceived ties between the
innovation and elements of the context can affect adoption decision”.
One aspect of compatibility is the degree to with it fulfils the needs of clients (Rogers
2003, p.246). Flight et al. (2011) include two aspects of compatibility into the definition:
social and personal. Personal compatibility means that the innovation fits one’s regular
routines and habits (Flight et al. 2011). Compatibility to individual’s values means what
the adopter think about the innovation while compatibility to practices means operational
compatibility to what the adopter do. However, it is sometimes hard to differentiate
between the two as the definition of compatibility is so broad. (Tornatzky & Klein 1982)
Social compatibility refers to degree to which the innovation is congruent with the social
expectations of the consumer’s social structure. (Flight et al. 2011)
Compatibility of an innovation with earlier ideas may encourage or retard its adoption.
Old ideas may give meaning for the innovation and be the standard by which new
innovation is interpreted. This means that the more compatible the new idea is, the less
behavioural change it requires. (Rogers 2003, p.243). However, Flight et al. (2011) found
that compatibility does not necessarily advance innovation adoption if old and new idea
are very similar. This can mean that there should be some extent of difference in old and
new ideas in order to benefit from compatibility (Flight et al. 2011). Still, most often the
innovations with higher rate of compatibility diffused more rapidly (Agarwal & Prasad
1997; Rogers 2003, p.245).
Complexity
Complexity means how difficult the innovation is to understand or to use (Rogers 2003,
p. 257). It can be seen as a barrier to new technology adoption (Rogers 2003, p. 257;
Mallat 2007; Tornatzky & Klein 1982). It is often not as important factor as relative
advantage or compatibility, but it may explain the challenges in the diffusion (Rogers
2003, p. 257). Complexity issues can be seen affecting the usage or design of the
15
innovation. The complexity in usage refers to the ease of deriving value from the
innovation and the design complexity refers to the technical attributes and components
that creates the value. (Flight et al. 2011) For example, Mallat (2007) found that attributes
creating barrier into mobile banking include complicated processes, hardness to find
information and difficulty in usage, meaning that procedures should be simpler and
faster.
Ostlund (1974) and Mallat (2007) have added sixth dimension to explain innovation
adoption; perceived risk. This can be seen linked to the complexity of the innovation
(Flight et al. 2011). Perceived risk is defined as the probability of the innovation to fail to
satisfy the expectations, needs or wants of the potential adopter (Flight et al. 2011). This
means that if the innovation is reliable and reduces uncertainty, it may encourage the
diffusion (Fliegel & Kivlin 1966). This can concern for example security, privacy, errors,
risk of control and lack of reliability which all have negative impact on adoption (Mallat
2007). Security issues concern especially Internet technologies, such as e-commerce
(Zhu et al. 2006).
As well, discontinuous innovations can create risk and complexity into innovation
adoption (Flight et al. 2011). Technological discontinuities involves innovations that
dramatically advance industry and differs from the current norm, creating new dominant
designs (Anderson & Tushman 1990). This refers closely to disruptive innovation which
is defined as technology that present different performance set from mainstream
technologies and which displaces the mainstream technology in the market (Adner
2002). Digitalization has enabled disruptive possibilities to arise, for example Uber
(disrupting taxis), Airbnb (disrupting hotels) and Amazon (disrupting for example
booksellers and retailers) (Weill & Woerner 2015). Discontinuous innovations, can be
very successful in long term, but often includes higher perceived risk, often requiring
effort in leading by consumers and also changes in technical infrastructure (Agarwal &
Prasad 1997).
Trialability
Trialability means the extent to which new innovation can be experimented on a limited
basis. Innovations than can be experimented are diffusing faster than those that are not.
(Rogers 2003, p.258) Trial can reduce the risks involved in adopting new innovation
(Flight et al. 2011). Trialability is thus seen as an enabler and driver towards adoption
(Agarwal & Prasad 1997; Rogers 2003, p.258).
Tornatzky & Klein (1982) found in their literature review that some studies include also
divisibility of the innovation as an characteristic. Divisibility refers to the extent to which
16
the innovation can be tried on a small scale before the adoption (Fliegel et al. 1968 cited
by Tornatzky & Klein 1982). Small scale try of the innovation before full adoption could
have impact in minimizing possible unanticipated non-economic and economic
consequences (Fliegel & Kivlin 1966). The divisibility of an innovation is closely related
to trialability. However, often divisible innovation is trialable, but not all trialable
innovations are divisible. (Tornatzky & Klein 1982)
Observability
Observability means the degree to which the results of innovation adoption are visible.
The more observable and visible to others the innovation is, the more it drives towards
the innovation adoption. (Rogers 2003, pp. 258-259) The challenge of observability is
the potential for confound it with other characteristics. This means that there is no clear
distinction whether an innovation is adopted because of observability, or for example due
to observability of cost or compatibility. (Tornatzky & Klein 1982)
Visibility refers to the same idea as observability, for example Agarwal & Prasad (1997)
and Moore & Benbasat (1991) added visibility as one construct enhancing the innovation
acceptance. Technological innovation often includes both hardware and software
aspects. As the software component is less apparent or visible for observation, it could
have relatively slower rate of adoption. (Rogers 2003, p.259) The clarity of the results of
innovation adoption may have a positive relationship with the rate of adoption (Flight et
al. 2011).
In the literature, some authors also refer to communicability as an innovation
characteristic. Communicability is very similar to observability (Tornatzky & Klein 1982)
so they are combined. Communicability refers to the degree to which the innovation may
be conveyed to others (Rothman 1974 cited by Tornatzky & Klein 1982) or if the
innovation is easy to communicate and sell through mass media (Tornatzky & Klein
1982). Similarly Moore & Benbasat (1991) have found that observability as a definition
is complex and it includes visibility, communicability and demonstrability. They define
that items that helps to measure, observe and communicate the results by using the
innovation, are included in the definition. Flight et al. (2011) suggest that trialability,
observability and communicability together provides the potential adopters a greater
range of information and benefits about the innovation.
2.2.2 Adoption-Decision Process and Adopter Characteristics
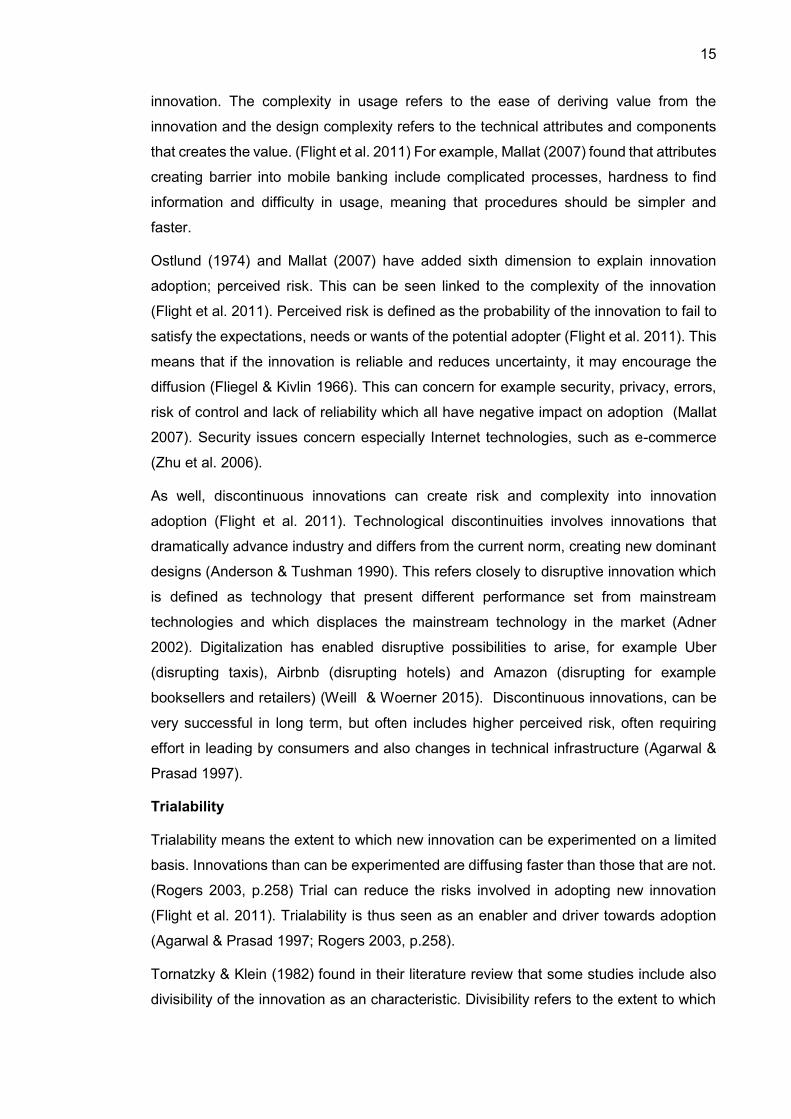
Rate of adoption is the relative speed to which innovation is adopted in a social system.
Variables impacting the rate of adoption are innovation characteristics, type of innovation
17
decision, communication channels, nature of social system and change agents’
promotional efforts. (Rogers 2003, pp.221-222) The rate of adoption is often represented
as bell-shaped curve (frequency) or S-shaped curve (cumulative). The rate of adoption
is often normally distributed. In normally distributed innovation adoption, there is small
amount of innovators and early adopters, and the adoption rate is slower at the
beginning. The curve then accelerates, and most of the people are adopting innovation
with early majority or late majority. The rate of adoption finally slows down, when there
is only fewer remaining individuals that have not adopted the technology. (Rogers 2003,
pp.272-280) The rate of adoption with bell- and S-shaped curves are presented in figure
1.
Figure 1. Innovation diffusion curves (modified from Rogers 2003, pp.273-281.
Adopter Characteristics
Research often classifies the adopter characteristics by the time of adoption in
comparison to the innovation’s launch into the market. Innovation adoption often
depends on what the societal entity is, i.e. individual, organizations, national polities,
communities, social movements, group of friends and families, as the adoption process
is often different (Wejnert 2002). As technology adoption is often based on perceived
attributes, the subjective role of the individual or organisation have impact on how the
variables are measured (Downs & Mohr 1976). It has been noticed that perceptual
variables are explaining better the innovation diffusion than the individual personal
characteristics (Ostlund 1974). However, making a positive adoption decision will be
function of individual’s perceptions of the innovation characteristics (Moore 1987). What
needs to be remembered is that the importance of different innovation characteristics
and personal characteristics may differ among different types of innovations (Ostlund
1974). According to Rogers (2003, p.287) characteristics of adopters can be divided into
three headings: socioeconomic variables, personality characteristics and communication
behaviour.
18
Socioeconomic characteristics can be divided into two economic and sociodemographic
characteristics (Wejnert 2002). Earlier adopters have often higher education (Brancheau
& Wetherbe 1990; Rogers 2003, p.288) and higher social status (Rogers 2003, p.288).
Social status refers to variables such as standard of living, income, wealth, occupational
prestige and individual’s self-perceived identification to certain social class. Sometimes
wealthy enhances adoption, as the adopter must cope with the financial uncertainty and
possible failure of the idea (Rogers 2003, p.288). Brancheau & Wetherbe (1990) suggest
that younger age anticipates earlier adoption of new innovation but Rogers (2003, p.288)
has found conflicting evidence on age impacting the adoption.
Communication aspect of innovation adoption assumes that i.e. higher social
participation, higher interconnection in social system, greater cosmopoliteness
(orientation outside a social system), greater mass media exposure and interpersonal
communication channels, more active information seeking and knowledge on the
innovation as well as higher opinion leadership predicts earlier innovation adoption
(Brancheau & Wetherbe 1990; Rogers 2003, pp.290-292). As well, personal
characteristics are impacting the adoption behaviour. Higher degree of empathy, less
dogmatism (how strongly beliefs are held), greater ability of abstraction, greater
intelligence, rationality, favourable attitude, risk taking, less fatalism (perceived lack of
ability to control own future), and higher aspirations of education and social status are all
seen predicting earlier adoption of innovation (Rogers 2003, pp.289-290). However, it is
seen that personal factors may be impacted by societal culture, for example national
culture, or culture of other heterogenous subgroup (Wejnert 2002).
Adoption Decision Process
Having the technology or innovation available is not enough; it must be accepted and
implemented by its users (Agarwal & Prasad 1997). Through Rogers’ (2003, pp.168-
169) innovation-decision process, the decision to adopt or reject an innovation is made
through series of choices. The process occurs over time and it includes often the
following five stages: knowledge, persuasion, decision, implementation and
confirmation. Throughout the process, the adopter evaluates the innovation and whether
or not to incorporate it into ongoing practices. When the first three phases concerns
adoption studies, the last two phases are relevant only after adoption (Sanguinetti et al.
2018). The innovation decision can be either optional (made by individual), collective
(made by multiple adopters) or authoritative (made by few authors) (Rogers 2003,
p.403). Adoption decision process is liked to innovation characteristics and adopter
characteristics as can be seen from figure 2. It is seen that this process is faster for
earlier adopters and slower for later adopters. (Rogers 2003, p.218)
19
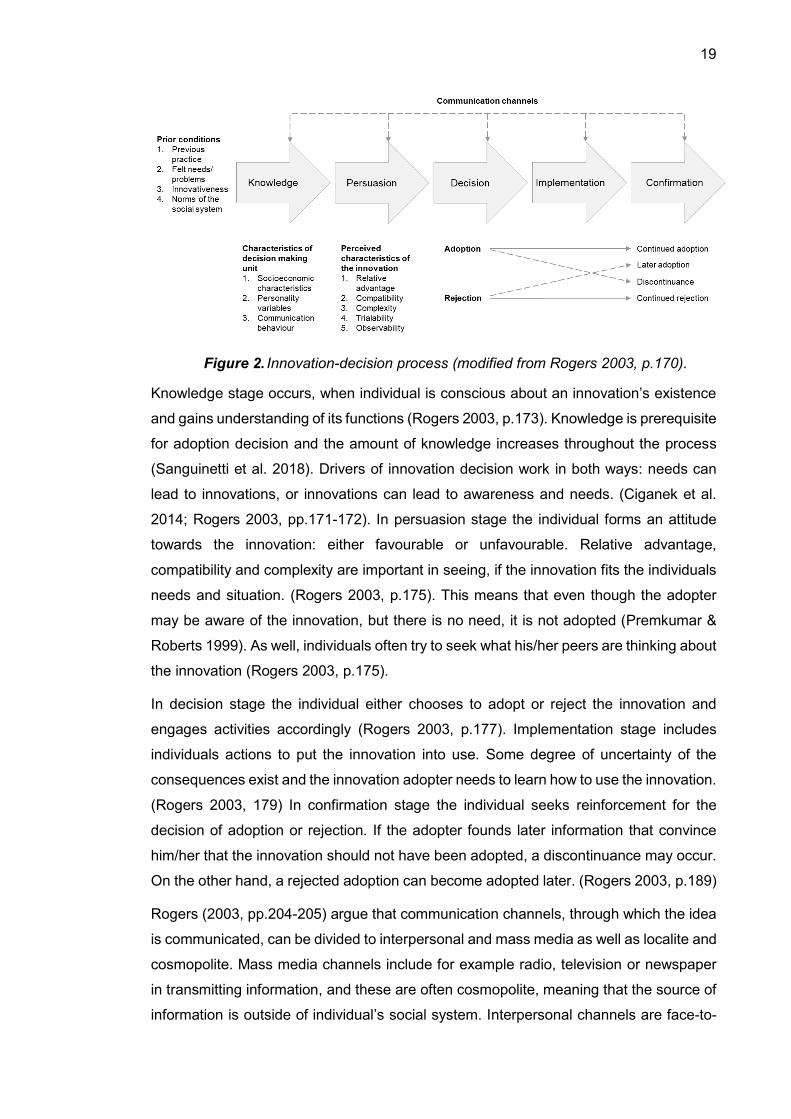
Figure 2. Innovation-decision process (modified from Rogers 2003, p.170).
Knowledge stage occurs, when individual is conscious about an innovation’s existence
and gains understanding of its functions (Rogers 2003, p.173). Knowledge is prerequisite
for adoption decision and the amount of knowledge increases throughout the process
(Sanguinetti et al. 2018). Drivers of innovation decision work in both ways: needs can
lead to innovations, or innovations can lead to awareness and needs. (Ciganek et al.
2014; Rogers 2003, pp.171-172). In persuasion stage the individual forms an attitude
towards the innovation: either favourable or unfavourable. Relative advantage,
compatibility and complexity are important in seeing, if the innovation fits the individuals
needs and situation. (Rogers 2003, p.175). This means that even though the adopter
may be aware of the innovation, but there is no need, it is not adopted (Premkumar &
Roberts 1999). As well, individuals often try to seek what his/her peers are thinking about
the innovation (Rogers 2003, p.175).
In decision stage the individual either chooses to adopt or reject the innovation and
engages activities accordingly (Rogers 2003, p.177). Implementation stage includes
individuals actions to put the innovation into use. Some degree of uncertainty of the
consequences exist and the innovation adopter needs to learn how to use the innovation.
(Rogers 2003, 179) In confirmation stage the individual seeks reinforcement for the
decision of adoption or rejection. If the adopter founds later information that convince
him/her that the innovation should not have been adopted, a discontinuance may occur.
On the other hand, a rejected adoption can become adopted later. (Rogers 2003, p.189)
Rogers (2003, pp.204-205) argue that communication channels, through which the idea
is communicated, can be divided to interpersonal and mass media as well as localite and
cosmopolite. Mass media channels include for example radio, television or newspaper
in transmitting information, and these are often cosmopolite, meaning that the source of
information is outside of individual’s social system. Interpersonal channels are face-to-
20
face information exchange between individuals, and often localite meaning interpersonal
communication inside a social system. (Rogers 2003, p.205-207) It is seen that
interpersonal channels are more important than mass media channels. As well, the
importance of interpersonal channels are growing through the innovation-decision
process, while the importance of mass media is diminishing (Brancheau & Wetherbe
1990).
2.3 Innovation Adoption by Individuals
Many models are used in the literature to explain the user acceptance of new technology
These are for example Theory of Reasoned Action (TRA) (Fishbein & Ajzen 1980),
Theory of Planned Behaviour (TPB) (Ajzen 1991) and Technology Acceptance Model
(TAM) (Davis 1989). Theory of Reasoned Action (TRA) is a well-researched intention
model that is used to explain behaviour in many domains, so it is very general (Davis et
al. 1989). Individual’s behaviour is determined by behavioural intention, which is jointly
determined by attitude (positive or negative feelings) and subjective norm (individual’s
perception on whether other people think he/she should perform the behaviour) (Davis
et al. 1989). Theory of Planned Behaviour (TPB) is a model that is designed to explain
most human behaviours and it has become one of the most cited models for the
prediction of human behaviour (Ajzen 2011). The intention is determined as well by
attitude and subjective norm, but also perceived behavioural control (individual’s
perceptions of capabilities). TAM is an adaption of TRA and it explains the user
acceptance of information systems (Davis et al. 1989). In this research, TAM is used to
explain innovation adoption by individuals.
2.3.1 Technology Acceptance Model
According to TAM there are two separate factors influencing an individual’s intention to
use new technology. These are perceived usefulness (PU) and perceived ease-of-use
(PEOU). The key purpose or TAM is to explain the impact of external factors on internal
beliefs, attitudes and intentions. TAM uses TRA as theoretical basis for specifying the
linkages between perceived usefulness, perceived ease of use, user’s attitude,
intentions and actual adoption behaviour. (Davis et al. 1989). TAM framework is
presented in figure 3.
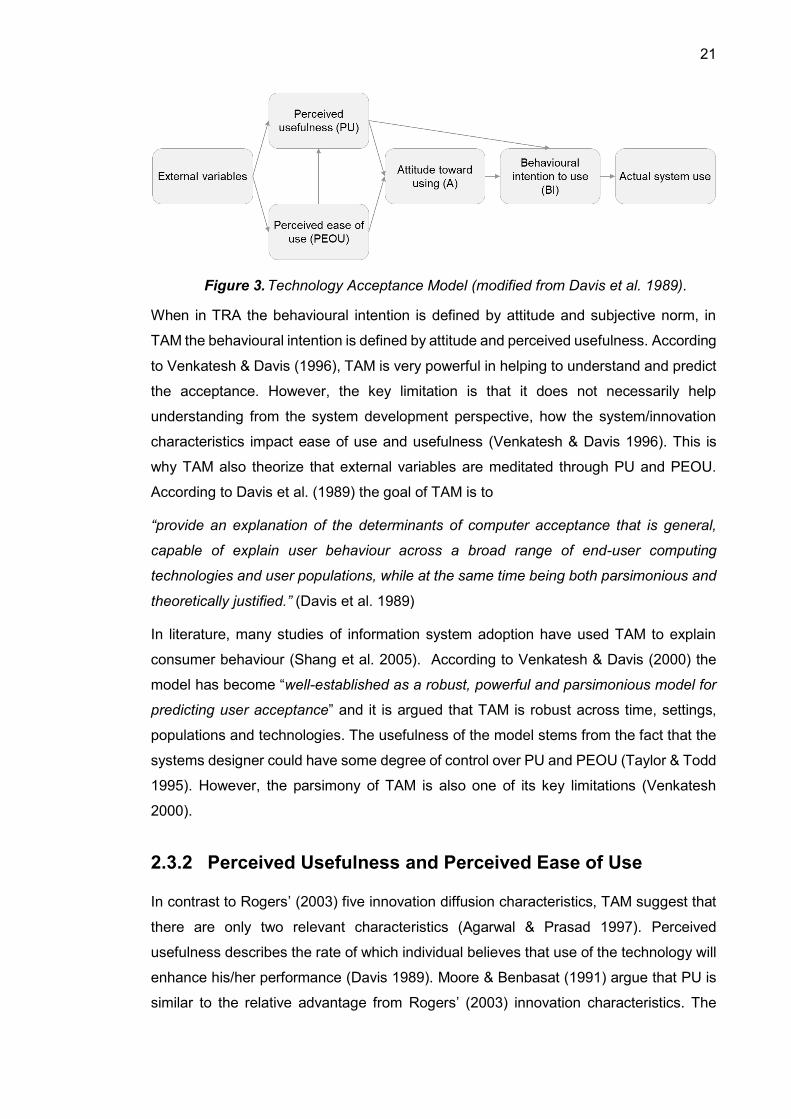
21
Figure 3. Technology Acceptance Model (modified from Davis et al. 1989).
When in TRA the behavioural intention is defined by attitude and subjective norm, in
TAM the behavioural intention is defined by attitude and perceived usefulness. According
to Venkatesh & Davis (1996), TAM is very powerful in helping to understand and predict
the acceptance. However, the key limitation is that it does not necessarily help
understanding from the system development perspective, how the system/innovation
characteristics impact ease of use and usefulness (Venkatesh & Davis 1996). This is
why TAM also theorize that external variables are meditated through PU and PEOU.
According to Davis et al. (1989) the goal of TAM is to
“provide an explanation of the determinants of computer acceptance that is general,
capable of explain user behaviour across a broad range of end-user computing
technologies and user populations, while at the same time being both parsimonious and
theoretically justified.” (Davis et al. 1989)
In literature, many studies of information system adoption have used TAM to explain
consumer behaviour (Shang et al. 2005). According to Venkatesh & Davis (2000) the
model has become “well-established as a robust, powerful and parsimonious model for
predicting user acceptance” and it is argued that TAM is robust across time, settings,
populations and technologies. The usefulness of the model stems from the fact that the
systems designer could have some degree of control over PU and PEOU (Taylor & Todd
1995). However, the parsimony of TAM is also one of its key limitations (Venkatesh
2000).
2.3.2 Perceived Usefulness and Perceived Ease of Use
In contrast to Rogers’ (2003) five innovation diffusion characteristics, TAM suggest that
there are only two relevant characteristics (Agarwal & Prasad 1997). Perceived
usefulness describes the rate of which individual believes that use of the technology will
enhance his/her performance (Davis 1989). Moore & Benbasat (1991) argue that PU is
similar to the relative advantage from Rogers’ (2003) innovation characteristics. The
22
definition of PU suffers from the same problem as relative advantage; it is rather broadly
based (Moore & Benbasat 1991). Perceived ease of use describes how individual
believes that using the technology will be free of effort (Davis 1989). PEOU is seen as
similar attribute to complexity from Rogers’ (2003) innovation characteristics (Agarwal &
Prasad 1997).
When usefulness is related to the outcome and extrinsic factors impacting usage, ease
of use refers to the process leading to the outcome of the experience, being more intrinsic
(Childers et al. 2001; Gefen & Straub 2000). Davis et al. (1989) have found that PU is
the major determinant on people’s intention to use IS, while PEOU is a significant
secondary determinant as it has been seen that the usefulness-intention relationship is
stronger compared to ease of use-intention relationship (Davis 1989; Davis et al. 1989).
Gefen & Straub (2000) have found that there are researches where PEOU have an
impact and also researches where there is no impact on use. PU is affected by PEOU,
meaning that the easier the IS usage is, the useful it can be (Venkatesh & Davis 2000).
It is argued that in the beginning of new system usage, PEOU have bigger impact, and
with experience, the significance diminish (Venkatesh & Bala 2008).
2.3.3 External Variables
TAM has been extended and tested with different external variables in literature (Shang
et al. 2005; Venkatesh & Davis 2000). External factors affect through PU and PEOU and
could include for example system design characteristics (Davis et al. 1989). However,
the relationships between these factors and between PU and PEOU are inconsistent (Ha
& Stoel 2009). Some variables are focusing on PU and some more on PEOU some
directly to attitude or behavioural intention. The importance and impact of the variables
can also change over time (Venkatesh 2000; Venkatesh & Bala 2008; Venkatesh & Davis
2000) and whether the system is voluntary to use (Venkatesh & Davis 2000). Rather
than creating a new model, we are trying to find and review the main external factors
affecting PU and PEOU and thus understand the framework. According to Venkatesh &
Davis (2000) a better understanding of the determinants would enable to design
organisational interventions that would help user acceptance and usage of new
technology. Next the key variables found on the literature will be explained.
External Variables & Perceived Usefulness
According to Venkatesh & Davis (2000) there are social factors and cognitive
instrumental factors affecting the PU in new technology adoption. The factors argued to
affect perceived usefulness are the following:
23
Subjective norm
Image
Relevance
Output quality
Result demonstrability
Perceived ease of use (Venkatesh & Davis 2000)
The mentioned factors are moderated by the experience of the technology and the
voluntariness of usage. Framework implies that the social factors affecting whether the
individual adopt or reject the new technology are subjective norm, voluntariness and
image (Venkatesh & Davis 2000). Subjective norm originates from TRA, which is also
used as basis of TAM (Davis et al. 1989). As explained, the definition of subjective norm
is person’s perception on whether other people think he/she should perform the
behaviour (Davis et al. 1989; Fishbein & Ajzen 1980; Venkatesh & Davis 2000). The
difference is that in TRA and TPB subjective norm is a direct determinant of behavioural
intention (Ajzen 1991; Fishbein & Ajzen 1980). Taylor & Todd (1995) argues that
subjective norm can be divided into different referent groups such as peers, superiors
and subordinates, because they may have different views on the use of new technology.
There are mixed results in the literature whether subjective norm has a direct effect on
technology usage (Venkatesh & Davis 2000). For example, Davis et al. (1989) have
found that it has no significant effect above and over PU and PEOU while for example
Venkatesh & Davis (2000), Venkatesh & Bala (2008) and Taylor & Todd (1995) found
that it has an effect on innovation adoption.
Hartwick & Barki (1994) and Venkatesh & Morris (2000) have noticed that over time,
subjective norms affecting the usage behaviour may be subsided with increased
experience of the system usage. Basically, this means that before the system is known
well by the individual, the user’s knowledge rely more on other’s opinions (Hartwick &
Barki 1994). When more about the system’s strengths and weaknesses are known over
time, the less important is the subjective norm (Venkatesh & Davis 2000). Also, it is
perceived that voluntariness have an effect on subjective norm. It is seen by Venkatesh
& Davis (2000) and Venkatesh & Bala (2008) that when the technology is mandatory to
use, there is significance on subjective norm affecting the system use. However, when
the technology is non-mandatory to use, the impact of subjective norm is non-important.
This means that voluntariness of use of the technology have an indirect effect on
perceived usefulness. (Venkatesh & Davis 2000)
Similarly to innovation characteristics, it is seen that the image or social status have a
direct positive effect on new technology usage (Venkatesh & Davis 2000). Image can be
24
defined the degree to which an innovation is enhancing the adopter’s social status in the
social system (Moore & Benbasat 1991). When the importance of subjective norm is
decreasing over time when the system is used, the importance of image is not declining,
as the status gains of the system usage are gained (Venkatesh & Davis 2000).
After societal factors, the cognitive factors impacting PU are explained. This means that
individuals compare cognitively what the technology is capable of doing and what needs
to get done (Venkatesh & Davis 2000). These include job relevance, output quality and
perceived ease of use. Job relevance refers strongly to the working environment, and it
can be seen as the degree to which the new system is capable of supporting the
individual in his or her job. Job relevance includes also the output quality, which has
similarly a positive impact on perceived usefulness. (Venkatesh & Davis 2000)
Venkatesh & Bala (2008) found also that job relevance and output quality have an
interactive effect on perceived usefulness meaning that when output quality increases,
also the job relevance has stronger impact on PU.
So that the individual understand why certain system is useful, the demonstrability of the
results is important (Venkatesh & Davis 2000). Similarly to the innovation characteristics,
demonstrability is defined as the tangibility of the results when using the technology
(Moore & Benbasat 1991). This means that the individual have more positive perceptions
towards technology or system usage and usefulness, when the results are seen
(Venkatesh & Davis 2000). Lastly, perceived ease of use have a direct effect on attitude
toward using the technology, but also a direct effect on perceived usefulness (Davis et
al. 1989). This is also the original perception of TAM model.
External Variables and Perceived Ease of Use
To explain the system-specific ease of use, Venkatesh (2000) uses anchor and
adjustment perspective. General information about computers and system technology
serves an anchor, meaning that before knowledge and experience of the new system,
the judgement is based on previous experience. When more information is available, the
more the judgements will be based on the context, and this can be called the
adjustments. (Venkatesh 2000) Venkatesh (2000) suggest that the factors which act as
anchors in new system usage are self-efficacy, external control, computer anxiety, and
computer playfulness. As well, the quality aspect of the process is included in the
variables affecting ease of use. When PU is referring to the quality of the output, many
researchers also includes the quality aspect of the system in their variables (i.e. Chen &
Tan 2004; Ha & Stoel 2009; Childers et al. 2001). Thus, the following aspect are
introduced:
25
Internal control (self-efficacy)
External control (facilitating conditions)
Intrinsic motivation (computer playfulness)
Computer anxiety (emotion)
System quality and usability
Control generally refers to individual’s perceptions of the availability of resources,
knowledge and opportunities that are required in a specific behaviour (Venkatesh 2000).
The control aspect includes computer self-efficacy and facilitating conditions.
Behavioural control is present in TPB framework as a direct determinant of behaviour
(Ajzen 1991). In TAM, internal control is conceptualised as self-efficacy, meaning the
individuals’ own beliefs about his/her ability to perform a specific task with the
system/computer (Bandura 1982). External control refers to the individual’s perceptions
of technology and resource facilitating conditions, meaning for example resource or
technology that reduces the barriers of new technology adoption (Taylor & Todd 1995).
Generally, it is seen that internal and external control are important anchors especially
in the early system-specific formation of ease of use (Venkatesh 2000).
System adoption includes perceptions of intrinsic and extrinsic motivation. According to
Ryan & Deci (2000) motivation can be defined as the “energy, direction, persistence and
equifinality – all aspects of activation and intention”. Intrinsic motivation is behaviour that
stem from individual itself and drives to seek out novelty or challenges to extend the
capabilities, to learn or to explore. Extrinsic motivation stands for a performance of an
activity with the aim of some separable outcome. (Ryan & Deci 2000) In TAM, the
extrinsic motivation is captured by perceived usefulness (Davis et al. 1989). Venkatesh
(2000) suggests that intrinsic motivation is captured by the ease of use construct, in
system usage this means particularly computer playfulness. Similarly other authors have
found enjoyment being an intrinsic motivator or factor affecting the technology adoption
(i.e. Childers et al. 2001; Ha & Stoel 2009; Shang et al. 2005). However, the studies differ
whether enjoyment is affecting ease of use, usefulness or attitude. Childers et al. (2001)
argues that utilitarian and hedonic aspect are affecting the technology adoption.
Utilitarian refers to perceived usefulness and hedonic aspect to the enjoyment.
Technology oriented perspective attempts to understand technology as cold information
system, but from individuals’ perspective, it may also have hedonic perspectives which
means that individual behaviour might be different i.e. in work and in free-time settings
(Childers et al. 2001; Vijayasarathy 2004). Those individuals that perceive the system of
technology being “playful”, often find it less difficult to use and simply enjoy the process
of using it. Basically, they are using the system just for sake of using it, rather than to
26
achieve certain positive outcomes. (Venkatesh 2000) For example, in e-commerce, the
extrinsic motivation could be the possibility to shop effectively in timely manner, but the
intrinsic motivation refers to the enjoyment of the experience and process (Childers et
al. 2001).
When PU includes quality of output, PEOU may be impacted by the quality of the system
used. Parasuraman et al. (1988) argues that perceived service quality are constructed
by tangibles (physical facilities, equipment and appearance), reliability (accurate
performance), responsiveness (accurate help), assurance (ability to enhance trust) and
empathy (individualized attention). We use e-commerce as an example. Ha & Stoel
(2009) found that online shopping includes many system experiences such as
information search, navigation, ordering, payment, interaction with customer service,
possible problem resolutions and possible satisfaction with the purchase. Things such
as website architecture, navigation, design and layout are factors affecting the website
usability and quality (Chen & Tan 2004). By going through the web sites, consumers are
trying to clarify the ambiguities and reduce uncertainty (Chen & Tan 2004). Poorly
designed interfaces and layouts, outdated information, ineffective search engines, dead
links, difficult navigation, and hard checkout procedures may all contribute to consumer
frustration with online shopping (Vijayasarathy 2004). Chen & Tan (2004) claims that
usability of storefront in e-commerce has a significant effect on perceived ease of use of
the virtual store and perceived service quality have direct effect towards the attitude.
Similarly Ha & Stoel (2009) have found that e-shopping quality have direct effect on ease
of use.
The emotional aspect of technology usage includes computer anxiety (Venkatesh 2000).
Computer anxiety can be defined as the individual’s anxiety when facing the possibility
of using the system/technology/computer (Simonson et al. 1987, cited by Venkatesh
2000). When computer self-efficacy and playfulness have an positive effect on ease of
use, computer anxiety is having a negative effect (Venkatesh 2000). Closely related to
computer anxiety, often trust (i.e. Chen & Tan 2004; Pavlou 2003; Ha & Stoel 2009;
Gefen et al. 2003) and risk (Pavlou 2003) are concerned variables in TAM model. As
explained by Rogers (2003, p.14), newness of innovation creates uncertainty, and this
uncertainty can be experienced as behavioural uncertainty towards the technology
provider or environmental uncertainty towards the actual technology (Pavlou 2003; Ha &
Stoel 2009). Behavioural uncertainty could concern for example lack of trust in business
practices (Gibbs et al. 2003) and the adopter’s fear of provider’s opportunism. (Pavlou
et al. 2007). Environmental uncertainties can be caused by for example data security
and information privacy and security (Chen & Tan 2004; Gibbs et al. 2003; Hoffman et
27
al. 1999; Pavlou et al. 2007) or that the technology or product is not as promised (Pavlou
et al. 2007).
The uncertainties in new technology create risks including economic risk (monetary loss),
personal risk (unsafe product/services), provider performance risk (imperfect monitoring)
and privacy risk (Pavlou 2003). Palvou et al. (2007) suggest that trust is one of the
uncertainty mitigators. Trust is a feature in most of social and economic interaction where
uncertainty is present (Pavlou 2003) and it can be defined as the feeling of insecure or
secure on relying on an entity (Chen & Tan 2004). Lack of trust can be one of the major
reasons why not adopting a new technology and those individuals who experience more
lack of trust are less likely to use the new technology (Carter & Weerakkody 2008;
Hoffman et al. 1999). Also, the nature of the product may have an effect on the level of
uncertainty (Pavlou et al. 2007).
Adjustment are the factors that are based on experience and knowledge on the system
usage. Over time, the role of self-efficacy and external control are expected to continue
and stay strong, but to be adjusted, when comparison of systems is based on the
experience rather than perceptions. This can be called objective usability. However, the
computer playfulness and anxiety are expected to diminish over time. This means that
the general playfulness as a determinant will be replaced by system-specific enjoyment.
(Venkatesh 2000).
2.4 Innovation Adoption by Businesses
It is suggested that the adoption of new technology is not determined only by innovation
characteristics but also by factors related to external environment and organisation (Lin
2014). Same technology may be used in different environments differently. As
technology adoptions are almost always organisational level decisions, the adoption
decision cannot be captured by looking only technology aspect, but also organisational
and interorganisational aspects (Chwelos et al. 2001). Tornatzky et al. (1990; cited by
Zhu et al. 2003) have developed a technology-organizational-environmental (TOE)
framework to explain three context that influence firm’s adoption of new technology.
Technological context refers to firm’s existing and new technologies, organisational
context refers to measures about the organization, and environmental context refers to
the area in which firm is operating. (Tornatzky et al. 1990 cited by Zhu et al. 2003)
The same division into technological, organisational and environmental contexts have
been used by i.e. Iacovou et al. (1995) and Grandon & Pearson (2004) who suggest that
there are three factors affecting the technology implementation in companies: perceived
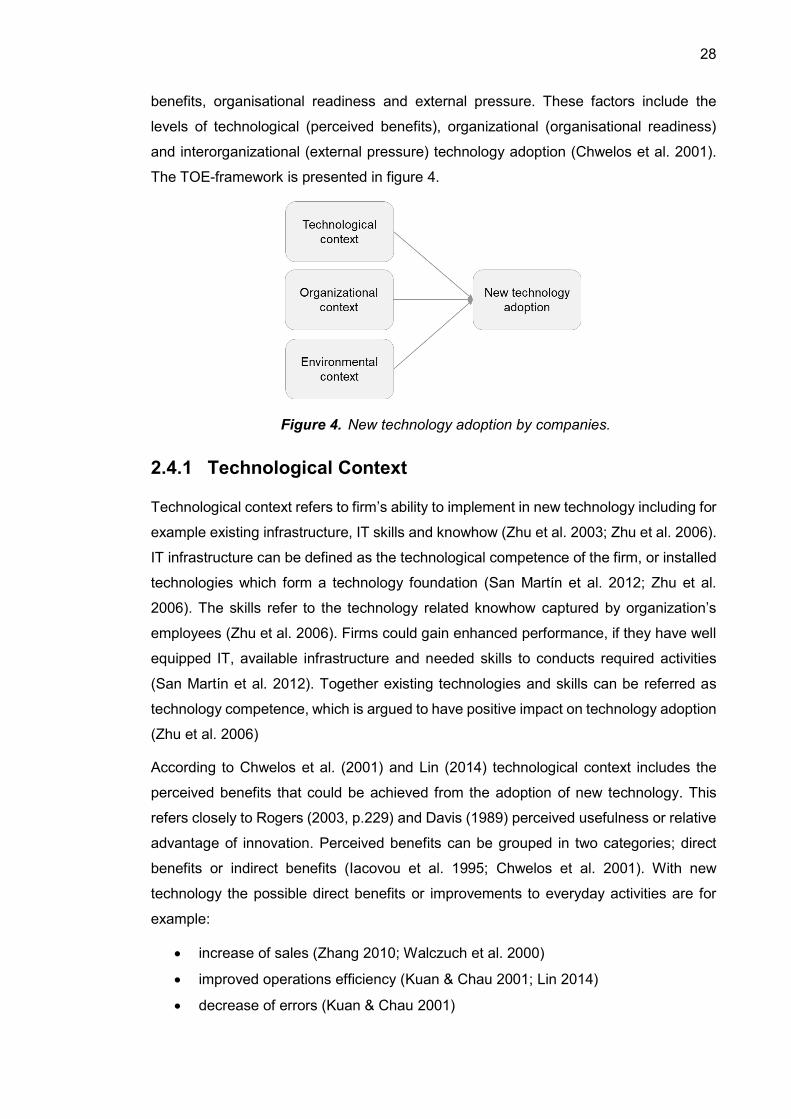
28
benefits, organisational readiness and external pressure. These factors include the
levels of technological (perceived benefits), organizational (organisational readiness)
and interorganizational (external pressure) technology adoption (Chwelos et al. 2001).
The TOE-framework is presented in figure 4.
Figure 4. New technology adoption by companies.
2.4.1 Technological Context
Technological context refers to firm’s ability to implement in new technology including for
example existing infrastructure, IT skills and knowhow (Zhu et al. 2003; Zhu et al. 2006).
IT infrastructure can be defined as the technological competence of the firm, or installed
technologies which form a technology foundation (San Martín et al. 2012; Zhu et al.
2006). The skills refer to the technology related knowhow captured by organization’s
employees (Zhu et al. 2006). Firms could gain enhanced performance, if they have well
equipped IT, available infrastructure and needed skills to conducts required activities
(San Martín et al. 2012). Together existing technologies and skills can be referred as
technology competence, which is argued to have positive impact on technology adoption
(Zhu et al. 2006)
According to Chwelos et al. (2001) and Lin (2014) technological context includes the
perceived benefits that could be achieved from the adoption of new technology. This
refers closely to Rogers (2003, p.229) and Davis (1989) perceived usefulness or relative
advantage of innovation. Perceived benefits can be grouped in two categories; direct
benefits or indirect benefits (Iacovou et al. 1995; Chwelos et al. 2001). With new
technology the possible direct benefits or improvements to everyday activities are for
example:
increase of sales (Zhang 2010; Walczuch et al. 2000)
improved operations efficiency (Kuan & Chau 2001; Lin 2014)
decrease of errors (Kuan & Chau 2001)
29
improved data accuracy and security (Kuan & Chau 2001)
or cost reduction (Gibbs et al. 2003).
Possible indirect benefits can be for example:
possibility to extend to new markets (Falk & Hagsten 2015; Gibbs et al. 2003;
Riggins & Rhee 1998; Vijayasarathy 2004; Walczuch et al. 2000)
enhanced business relationships (Lin 2014; Riggins & Rhee 1998)
improved customer service or relations (Zhang 2010; Vijayasarathy 2004;
Walczuch et al. 2000)
improved competitive advantage (Gibbs et al. 2003; Kuan & Chau 2001)
improved company image (Kuan & Chau 2001; Zhang 2010; Walczuch et al.
2000)
cheaper or more efficient communication (Zhang 2010).
If the adoption of new technology is seen creating benefits, more favourable attitude is
created towards new technology and the adoption is more likely (Lin 2014). Premkumar
& Roberts (1999) argues that firms adopt technology only if they feel a need to exploit a
business opportunity or overcome a performance gap. However, lack of awareness of
the potential benefits might affect the implementation decisions (Iacovou et al. 1995).
2.4.2 Organisational Context
It is important that the company perceives the potential benefits of innovations, but is
also important that the company can reach the benefits with its resources (Kuan & Chau
2001). Organisational readiness refers to the level of the company’s financial and
technological resources and for companies with more resources, it is usually easier to
adopt new technologies (Iacovou et al. 1995). However, Kuan & Chau (2001) argue that
the firms resources are perceived, and not directly comparable. They have found that
the lower are the perceived financial costs and the higher are the perceived technical
competences of the company, the more likely the new technology will be adopted (Kuan
& Chau 2001). Resources refers closely to the cost of the innovation and the benefits-
cost relationship may have an impact on the technology adoption (Lin 2014). As seen
from technological context, this can be positive due to cost reductions (Gibbs et al. 2003)
or negative due to financial expenses (Lin 2014).
Firm’s size might affect intention and possibility to adopt new technology (Falk & Hagsten
2015; Iacovou et al. 1995; Gibbs et al. 2003; Lin 2014; Premkumar & Roberts 1999; Zhu
et al. 2003). The size of the company indicates the financial measures and resources
the firm has available to implement new technology (Iacovou et al. 1995; Lin 2014;
30
Premkumar & Roberts 1999; Rogers 2003, p.409). Larger firms tend to have more
resources for the adoption, they are more capable of taking the risk and they have more
power to urge trading partners to implement the technology (Zhu et al. 2003). For small
firms, there is need for more financial, technological and managerial assistance (Iacovou
et al. 1995). On the other hand, small business could be also managed without these
technologies (Premkumar & Roberts 1999). However Zhu & Kraemer (2005) and Zhu et
al. (2006) show in their research that large firms are also burdened by organizational
structures and structural inertia. Firm’s large size is thus also a factor that can retard the
new technology adoption (Zhu et al. 2006). Similarly Rogers (2003, p.179) argues that
the structure of the organization that usually gives stability, may resist the implementation
of the new idea. However, the playground between small and big companies changes
when the technology is highly diffused. Zhu et al. (2003) found that larger networks and
greater diffusion are advantages for smaller firms, and the size of the business does not
play a major role.
Firm’s top management have also a positive impact on the likelihood of new technology
adoption and supportive top management can encourage the use of new technology and
shorter the decision process (Ciganek et al. 2014; Lin 2014). This is especially important
for small businesses (Premkumar & Roberts 1999). As well, when the organizational
environment is more towards risk-taking, it enhances the new technology adoption
(Ciganek et al. 2014). Firm’s scope has a significant effect on new technology adoption.
Scope is defined as the horizontal or geographical extent of firm’s operations. Firms with
larger internal business scopes or international scopes are more likely to adopt new
technology than those with less scope. (Zhu et al. 2003; Zhu & Kraemer 2005) For
example, when a company is having business in multiple markets, they need higher level
of integration, flexibility and responsiveness, in which a new technology or IT can help
linking the different stakeholders (Zhu & Kraemer 2005).
2.4.3 Environmental Context
In some cases the company’s willingness to adopt new technology does not have
anything to do with the technology or organisation, but the influences of business
partners or competitors (Kuan & Chau 2001). External pressure refers to the influence
of organisational environment and can be defined by competitive pressure and
imposition by trading partners (Iacovou et al. 1995; Chwelos et al. 2001). This means
that the resources and readiness of suppliers, customers and trading partners have
impact on possibility to adopt the technology (Barua et al. 2004).
31
Competitive pressure can be measured for example by the percentage of competitors
that have adopted the technology (Zhu et al. 2006). As more competitors and trading
partners start using new technology, companies are more inclined to adopt new
technologies in order to maintain their competitive position (Iacovou et al. 1995; Kuan &
Chau 2001; Lin 2014). Competitive pressure has generally a positive impact on
technology adoption (Zhu et al. 2006). On the other hand, San Martín et al. (2012) found
that when the technology adoption is in its early stages, the competition does not
necessary affect the firm’s perceived performance or technology adoption. This was the
case with early adoption of mobile commerce in Spain. This means that, the more
companies and competition there is in the market, the more pressure there is to adopt
the new technology (Kuan & Chau 2001).
Also, the trading partner readiness (trading partner’s intention to implement to the
technology) may affect the company’s intent to adopt new technology, if the business
partner request or recommends to do so (Chwelos et al. 2001; Kuan & Chau 2001).
Lack of trading partner readiness can be seen as inhibitor to new technology adoption
(Zhu et al. 2003). However, when the adoption of new technology is affected by firm
specific objectives and concerns, and not necessarily trading partners, the trading
partner influence seems to diminish (Lin 2014).
The impact of consumer readiness to the new technology may have an impact on the
adoption. What needs to remembered, this concerns technologies, where consumer is
one of the adopters, for example e-commerce. Consumer readiness reflects the potential
market volume and the extent to which individuals engage in new technology adoption
(Zhu et al. 2003). Zhu et al. (2003) noted in their research that when new technology
intensity and adoption increases, the environmental factors (trading partner readiness
and consumer readiness) become less important. In this case, the competitive pressure
is the only significant factor affecting new technology adoption. Sometimes companies
may even feel pressure from government to adopt certain technology (Kuan & Chau
2001).
2.5 Country Characteristics Affecting Innovation Adoption
International diffusion is important, as it may determine the pace of future technology
frontier directions (Keller 2004). In national level the components of new technology
adoption can be divided into technology, environment, people and economy (Ho et al.
2007). Similarly to business context some authors use TOE-framework or similar type of
division of factors to explain the adoption (Zhu & Kraemer 2005). The national level or
cross-country diffusion is based on macro level factors affecting new technology
32
adoption (Ho et al. 2007). As these factors may be different depending on country, there
are differences in the level of technology adoption (Zhu & Kraemer 2005). The country
characteristics driving and inhibiting new technology adoption are presented in this
section. However, there is no unified framework or number of factors that are clearly
used to evaluate the cross-country technology or innovation adoption, so the
characteristics are presented in general terms.
Compatibility & Existing Technology
Similarly to firm’s technological context, the existing technology in country level refers to
the available technologies, resources or complementors that are required to use the new
technology. The technology aspect of new innovation/technology adoption includes for
example the existing IT infrastructure and the cost of the technology (Ho et al. 2007). An
innovation does not stand alone and it is often dependent on the success of other
interdependent innovations, which can be called also complementors. From the business
ecosystem’s point of view, the complementors are affecting the usage of the final
product; if the complement is missing, the customer cannot use the product on its full
potential. (Adner & Kapoor 2010) Thus, the adoption of previous technology matters for
some technologies (Ho et al. 2007; Comin & Hobijn 2004).
An example of innovation and the impact of complementors lies in the diffusion of high
definition televisions (HDTV) invented by Philips, Thompson and Sony. From the
technology perspective, the HDTV has been ready for market since 1990s, but the critical
complements, such as signal compression technologies, production equipment and
broadcasting standards were not adopted or developed. (Adner 2006) Another example
is e-commerce. With e-commerce, the existing adoption of mobile devices, computers,
online payment channels and Internet use are enabling the usage of Internet in online
shopping transactions (Gibbs et al. 2003; Oxley & Yeung 2001; Wong 2003). This means
that lack of physical infrastructure, cost-effective systems or high cost of new technology
may create obstacles (Gibbs et al. 2003; Ho et al. 2007; Oxley & Yeung 2001). On the
other hand, Carter & Weerakkody (2008) argues that Internet accessibility and skills do
not indicate strongly the user intention in e-government adoption. Still, it has been seen
that, the countries that have led the adoption of preceding technologies, most likely lead
the adoption of new technology (Comin & Hobijn 2004).
Economy
Economy refers to the adequate resources available for new technology adoption (Ho et
al. 2007). It is assumed that the economic or the human capital or income per capita
have positive impact on the adoption of new technology (Caselli & Coleman 2001; Comin
33
& Hobijn 2004; Rogers 2003, p.288; Wong 2003; Yap et al. 2006). Often wealth in
national level is measured by GDP (gross domestic product). Comin & Hobijn (2004)
researched multiple technologies and their adoption across countries and found that real
GDP is the most significant variable explaining the diffusion of new technology. They
argue that 1% higher standard of living means that the country is 1% ahead of
technological adoption. Similarly Gibbs et al. (2003) have found that there is high
correlation with country’s GDP and e-commerce adoption and Yap et al. (2006) as well
argue it is the biggest variable determining technology adoption. This is mainly because
of the availability of financial resources and infrastructure to support the use of new
technology and individuals’ purchasing power (Caselli & Coleman 2001; Gibbs et al.
2003).
The correlation between GDP and adoption rate seem to be diminishing, when the
technology is in its maturity or declining phase. This suggest that in the early adoption
country’s GDP plays an important determinant in the rate of adoption, and when high
adoption rate is reached, other country specific factors determine larger part of adoption.
After the technology is developed often in the leading countries, it tickles down to the
lagging countries. (Comin & Hobijn 2004) Wejnert (2002) argues that economic
conditions along with culture and political environment are determining the willingness of
adoption.
People, Demographics and Culture
Demographic factors define the characteristics and size of the potential market,
consumer needs as well as the availability of skills to adapt new technology. For
example, income, age, education and gender may have an impact on the technology
adoption. (Gibbs et al. 2003) High distribution of wealth can act as inhibitor to new
technology adoption, when part of the population cannot afford the technologies (Gibbs
et al. 2003). For example, in Singapore, where the distribution of wealth is more equal,
there is relatively high technology adoption rates (Wong 2003). This means sufficient
disposal income is required (Murillo 2001).
It has been seen that on average, the new technology adoption is higher in countries
with people with higher educational level (Ho et al. 2007; Gibbs et al. 2003; Yap et al.
2006; Wong 2003). Comin & Hobijn (2004) researched the impact of enrolment rates to
the technology adoption, and suggest that 3% increase in secondary enrolment rate
increase the technology adoption by 1%. Similarly Caselli & Coleman (2001) found that
1% increase in the fraction of labour force who have better than primary education leads
to approximately 1% increase in adoption of computer technologies. However, education
34
seems to not matter, when it comes to technologies that are not skill-intensive, such as
steel or textiles. Education matters for example in the adoption of computer technology.
(Comin & Hobijn 2004).
Cultural variables may also have an impact on the new technology diffusion across
countries (Murillo 2001; Yap et al. 2006). Cultural aspect refer to values, norms,
language, religion or ideology that is present in certain system (Wejnert 2002). Similarly
to Rogers’ (2003, p.257) compatibility, people in certain country would adopt technology
if they find match between their own values and the technology (Leidner & Kayworth
2006). Culture is a challenging variable to research or measure, because of multiple
different definitions and measures of it (Leidner & Kayworth 2006). Yap et al. (2006) have
researched the impact of culture in e-commerce adoption with Hofstede’s (1984) model
of cultural values, including individualism-collectivism, masculinity-femininity, uncertainty
avoidance and power-distance. They argue that cultures with less uncertainty avoidance,
higher education rates and high individualism leads to greater technology diffusion (Yap
et al. 2006). Similarly Leidner & Kayworth (2006) found in their literature review that low
uncertainty avoidance often enhances technology adoption. Sundqvist et al. (2005)
showed also that culture, wealth and adoption are interrelated, and that in wealthier
countries the culture is more individualistic, there is lower power distance and lower
uncertainty avoidance. Also, cultural traditionalism is seen as inertia to new technology
adoption, and cultural homogeneity impacting the speed of adoption (Wejnert 2002).
Environment
International trade can be seen as one of the major channels of technology diffusion
across countries (Keller 2004). In global level, the most important factors driving to the
new technology adoption are globalization of markets and production, open trade
regimes, multinational corporation strategies and global competition. Multinational
corporations brings global competition into local markets and transfer knowledge about
technology to local players. (Gibbs et al. 2003).
It has been noticed that countries with greater degree of trade liberalization or open trade
regimes are having greater technology diffusion (Caselli & Coleman 2001; Comin &
Hobijn 2004; Gibbs et al. 2003; Wong 2003; Yap et al. 2006). Comin & Hobijn (2004)
suggest that countries that are 12-15% more open to the trade with others would be 1%
ahead of adoption of new technologies. Less taxes, regulations or tariffs are seen
causing higher diffusion of technology across countries (Yap et al. 2006). Openness to
external trade and investments can be seen as enablers to adopt new technology (Gibbs
et al.2003; Wong 2003). For example, European Union (EU) and Organization for
35
Economic Cooperation and Development (OECD) are advancing the deregulation of
markets (Gibbs et al. 2003).
Political conditions, which may impact technology diffusion are policies, structure of the
government, political freedom, laws and bureaucracies (Wejnert 2002). Policy and
government could impact both positively and negatively in innovation diffusion (Gibbs et
al. 2003). When there is reason that the political and social interest are threatened by
the adoption of new technology, most likely the government will put effort to prevent the
diffusion (Comin & Hobijn 2004). On the other hand, the legislation can be used to
promote certain technology and its use (Gibbs et al 2003). It is seen that a more effective
legislature may delay the adoption of new technologies, as the incumbent innovations
have power to lobby barring legislative against new technologies (Comin & Hobijn 2004).
Wejnert (2002) found in their literature review that also geographical settings could
impact technology adoption, including for example ecological conditions and climate (i.e.
agriculture, air conditioners). Also, geographical proximity may impact technology
adoption, as close proximity can impact the communication and observability of the
innovation (Wejnert 2002). Industry structure reflects the capabilities and demand for
new technology adoption (Gibbs et al. 2003; Falk & Hagsten 2015). Some industries
might be more willing to adopt certain technology than others. For example, in e-
commerce industries or sectors that are information sensitive and/or internationally
competitive tend to be driving the adoption of e-commerce (Gibbs et al. 2003).
36
3. INDUSTRY DESCRIPTION
3.1 E-commerce Development
E-commerce is a synonym for electronic commerce, eCommerce, Internet shopping,
online shopping, online sales and many other similar terms. According to Regattieri et
al. (2014), e-commerce has emerged from the presence of Internet and it allows people
to trade goods, services or information online with low time and distance barriers. Many
definitions include the Internet as the means of transaction. Internet can be seen as e-
commerce facilitator and medium of business (Eastin 2002), but simple business-to-
business (B2B) e-commerce transactions were possible long before the Internet (Falk &
Hagsten 2015). DeLone & McLean (2004) defines e-commerce as the use of Internet to
facilitate, execute and process business transactions, which include buyer and seller as
well as the exchange of services or goods for money. On the other hand, Gibbs et al.
(2003) defines e-commerce as the use of internet to buy, sell, or support services and
products, and the definition is not limited to financial transactions. The terminology may
differ, but generally it is seen that e-commerce covers a wide spectrum of
telecommunications applications with goal of providing services and products for
customers (Riggins & Rhee 1998) and moving people away from the traditional “shop
window” approach to purchase online (Regattieri et al. 2014).
E-commerce can take place in different commercial relationships involving consumers
or individuals (C), businesses (B) and governments (G). Business-to-business (B2B)
transactions involve private sector and it accounts for the lion’s share of e-commerce
(OECD 2019; United Nations 2015). Gibbs et al. (2003) argues that the share of B2B e-
commerce is even 80% from the total e-commerce. Business-to-government
transactions are basically government purchases and business-to-consumer (B2C) is
the growing transaction between business and consumer. Also, consumer-to-consumer
business is possible between individual consumers. (OECD 2019; United Nations 2015)
In this research, the interest is on B2C e-commerce.
B2C e-commerce is driven by consumer preferences and desires for convenience,
valuable and useful content and greater product and service selection (Gibbs et al.
2003). Consumers expect seamless shopping experience and they want to be able to
shop what they want, when they want and where they want (BillerudKorsnäs 2014). The
ability to shop at home, and eliminating frustration in traffic and parking lot and avoiding
long checkout lines are examples of consumers’ perceptions of convenience obtained
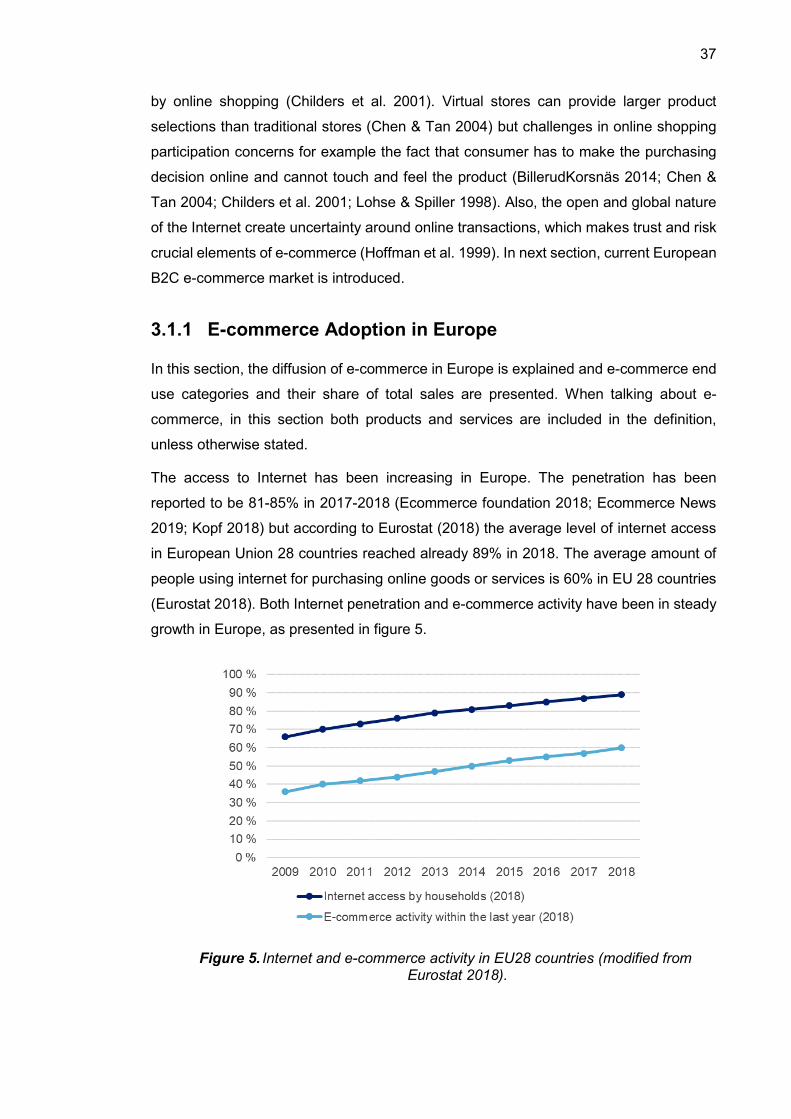
37
by online shopping (Childers et al. 2001). Virtual stores can provide larger product
selections than traditional stores (Chen & Tan 2004) but challenges in online shopping
participation concerns for example the fact that consumer has to make the purchasing
decision online and cannot touch and feel the product (BillerudKorsnäs 2014; Chen &
Tan 2004; Childers et al. 2001; Lohse & Spiller 1998). Also, the open and global nature
of the Internet create uncertainty around online transactions, which makes trust and risk
crucial elements of e-commerce (Hoffman et al. 1999). In next section, current European
B2C e-commerce market is introduced.
3.1.1 E-commerce Adoption in Europe
In this section, the diffusion of e-commerce in Europe is explained and e-commerce end
use categories and their share of total sales are presented. When talking about e-
commerce, in this section both products and services are included in the definition,
unless otherwise stated.
The access to Internet has been increasing in Europe. The penetration has been
reported to be 81-85% in 2017-2018 (Ecommerce foundation 2018; Ecommerce News
2019; Kopf 2018) but according to Eurostat (2018) the average level of internet access
in European Union 28 countries reached already 89% in 2018. The average amount of
people using internet for purchasing online goods or services is 60% in EU 28 countries
(Eurostat 2018). Both Internet penetration and e-commerce activity have been in steady
growth in Europe, as presented in figure 5.
Figure 5. Internet and e-commerce activity in EU28 countries (modified from Eurostat 2018).
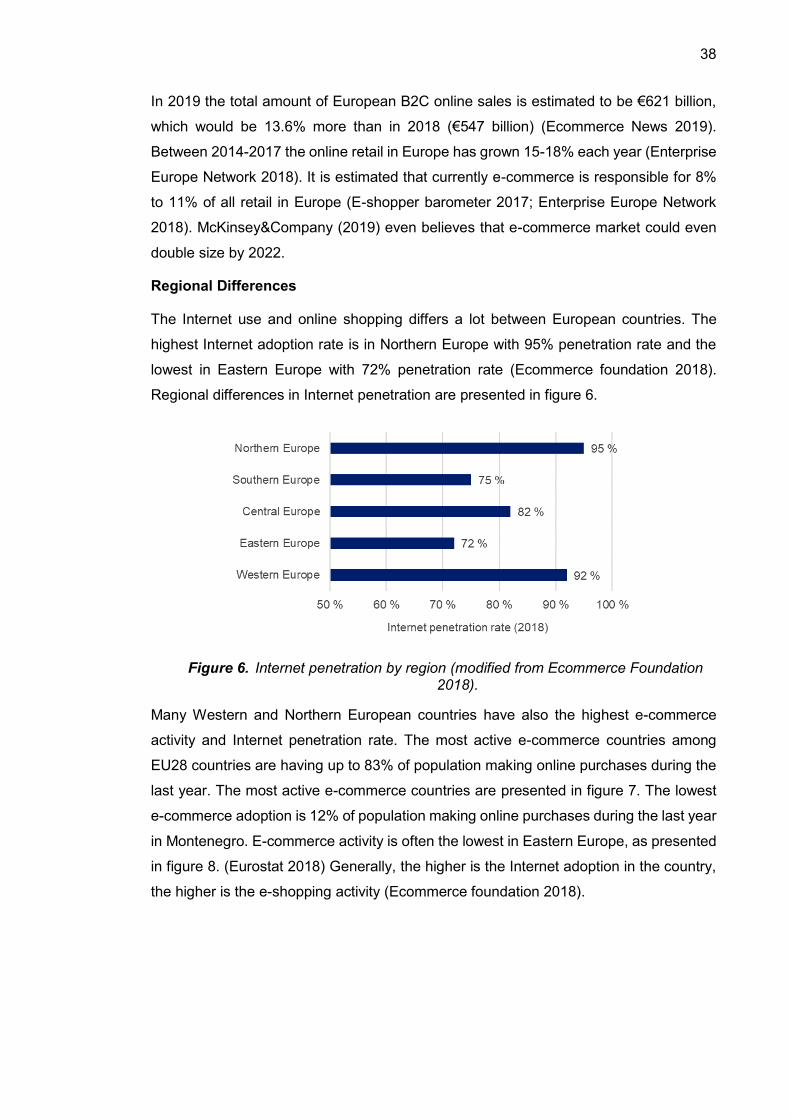
38
In 2019 the total amount of European B2C online sales is estimated to be €621 billion,
which would be 13.6% more than in 2018 (€547 billion) (Ecommerce News 2019).
Between 2014-2017 the online retail in Europe has grown 15-18% each year (Enterprise
Europe Network 2018). It is estimated that currently e-commerce is responsible for 8%
to 11% of all retail in Europe (E-shopper barometer 2017; Enterprise Europe Network
2018). McKinsey&Company (2019) even believes that e-commerce market could even
double size by 2022.
Regional Differences
The Internet use and online shopping differs a lot between European countries. The
highest Internet adoption rate is in Northern Europe with 95% penetration rate and the
lowest in Eastern Europe with 72% penetration rate (Ecommerce foundation 2018).
Regional differences in Internet penetration are presented in figure 6.
Figure 6. Internet penetration by region (modified from Ecommerce Foundation 2018).
Many Western and Northern European countries have also the highest e-commerce
activity and Internet penetration rate. The most active e-commerce countries among
EU28 countries are having up to 83% of population making online purchases during the
last year. The most active e-commerce countries are presented in figure 7. The lowest
e-commerce adoption is 12% of population making online purchases during the last year
in Montenegro. E-commerce activity is often the lowest in Eastern Europe, as presented
in figure 8. (Eurostat 2018) Generally, the higher is the Internet adoption in the country,
the higher is the e-shopping activity (Ecommerce foundation 2018).
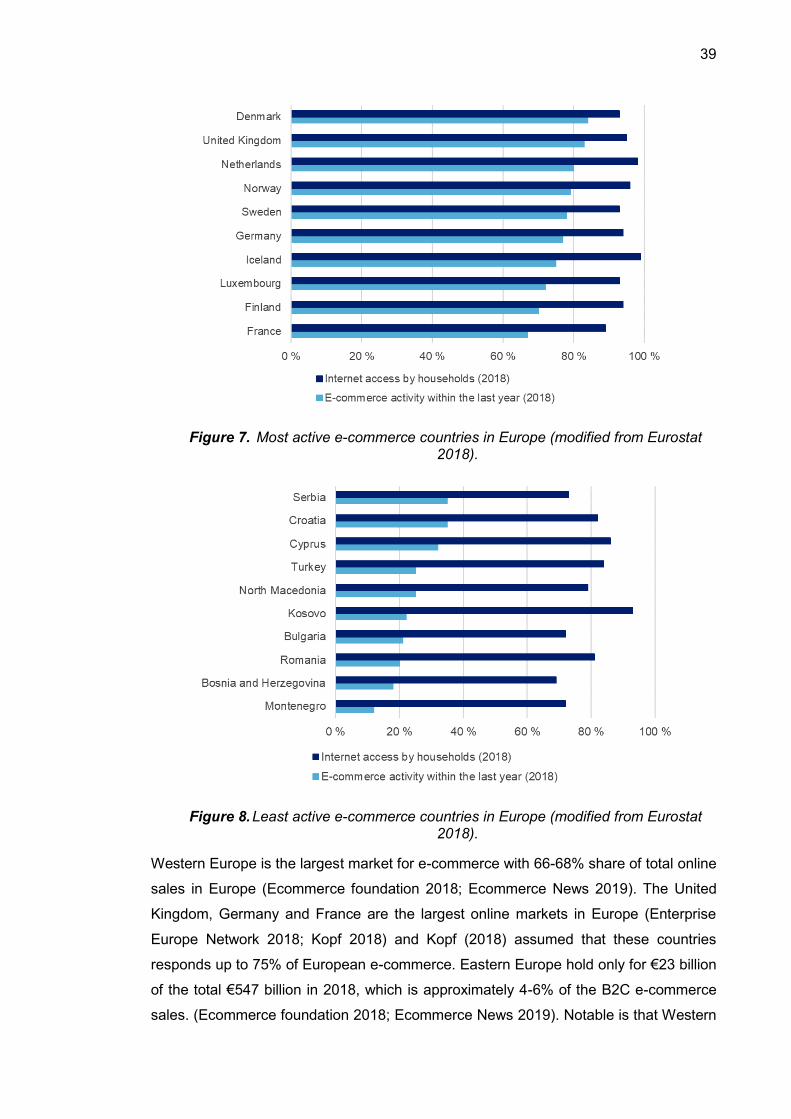
39
Figure 7. Most active e-commerce countries in Europe (modified from Eurostat 2018).
Figure 8. Least active e-commerce countries in Europe (modified from Eurostat 2018).
Western Europe is the largest market for e-commerce with 66-68% share of total online
sales in Europe (Ecommerce foundation 2018; Ecommerce News 2019). The United
Kingdom, Germany and France are the largest online markets in Europe (Enterprise
Europe Network 2018; Kopf 2018) and Kopf (2018) assumed that these countries
responds up to 75% of European e-commerce. Eastern Europe hold only for €23 billion
of the total €547 billion in 2018, which is approximately 4-6% of the B2C e-commerce
sales. (Ecommerce foundation 2018; Ecommerce News 2019). Notable is that Western
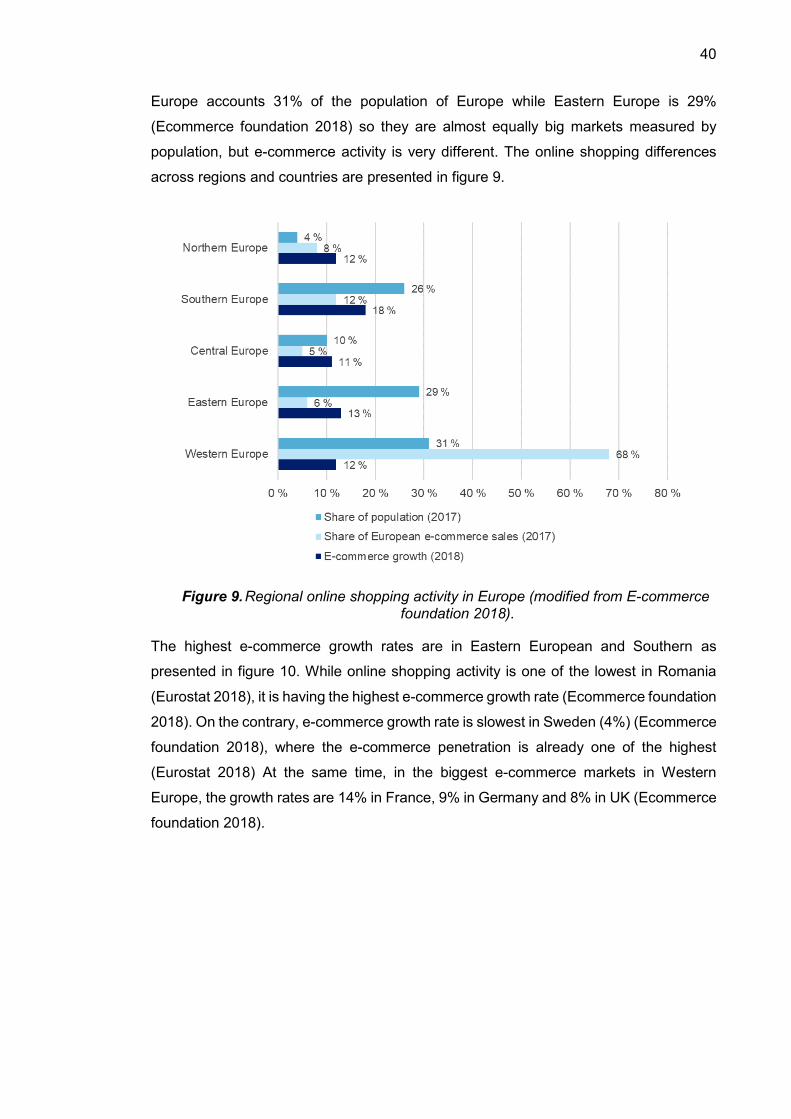
40
Europe accounts 31% of the population of Europe while Eastern Europe is 29%
(Ecommerce foundation 2018) so they are almost equally big markets measured by
population, but e-commerce activity is very different. The online shopping differences
across regions and countries are presented in figure 9.
Figure 9. Regional online shopping activity in Europe (modified from E-commerce foundation 2018).
The highest e-commerce growth rates are in Eastern European and Southern as
presented in figure 10. While online shopping activity is one of the lowest in Romania
(Eurostat 2018), it is having the highest e-commerce growth rate (Ecommerce foundation
2018). On the contrary, e-commerce growth rate is slowest in Sweden (4%) (Ecommerce
foundation 2018), where the e-commerce penetration is already one of the highest
(Eurostat 2018) At the same time, in the biggest e-commerce markets in Western
Europe, the growth rates are 14% in France, 9% in Germany and 8% in UK (Ecommerce
foundation 2018).
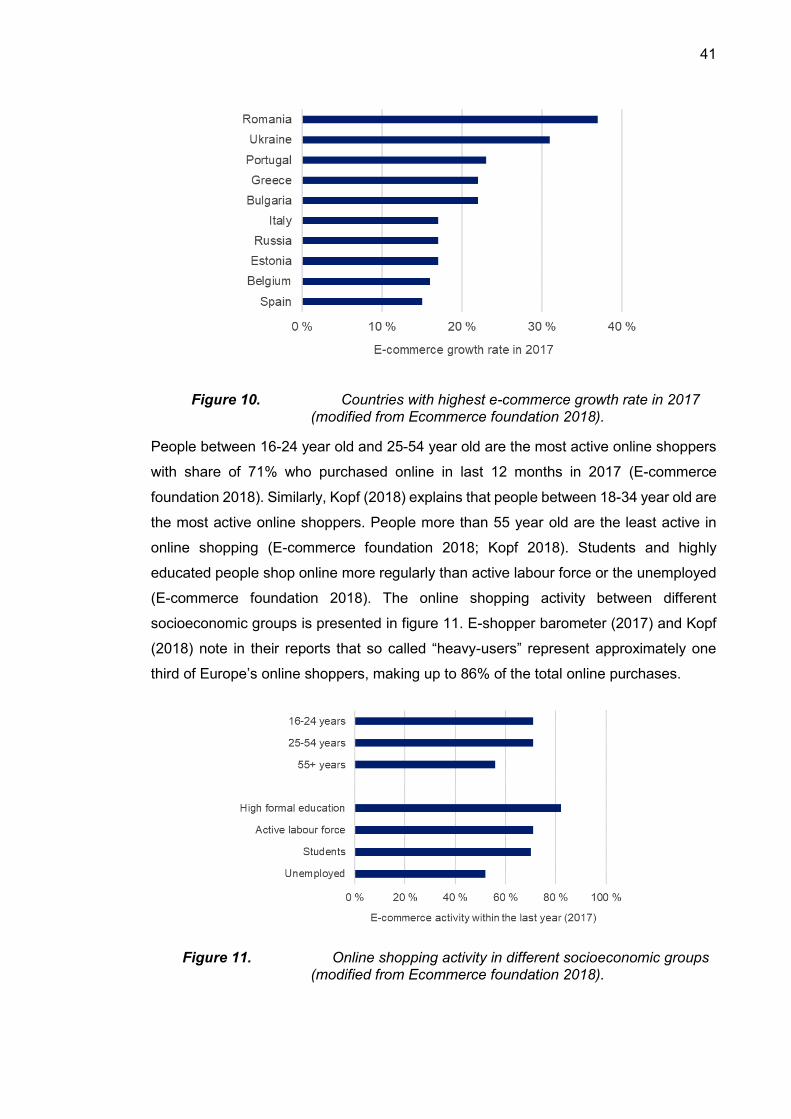
41
Figure 10. Countries with highest e-commerce growth rate in 2017 (modified from Ecommerce foundation 2018).
People between 16-24 year old and 25-54 year old are the most active online shoppers
with share of 71% who purchased online in last 12 months in 2017 (E-commerce
foundation 2018). Similarly, Kopf (2018) explains that people between 18-34 year old are
the most active online shoppers. People more than 55 year old are the least active in
online shopping (E-commerce foundation 2018; Kopf 2018). Students and highly
educated people shop online more regularly than active labour force or the unemployed
(E-commerce foundation 2018). The online shopping activity between different
socioeconomic groups is presented in figure 11. E-shopper barometer (2017) and Kopf
(2018) note in their reports that so called “heavy-users” represent approximately one
third of Europe’s online shoppers, making up to 86% of the total online purchases.
Figure 11. Online shopping activity in different socioeconomic groups (modified from Ecommerce foundation 2018).
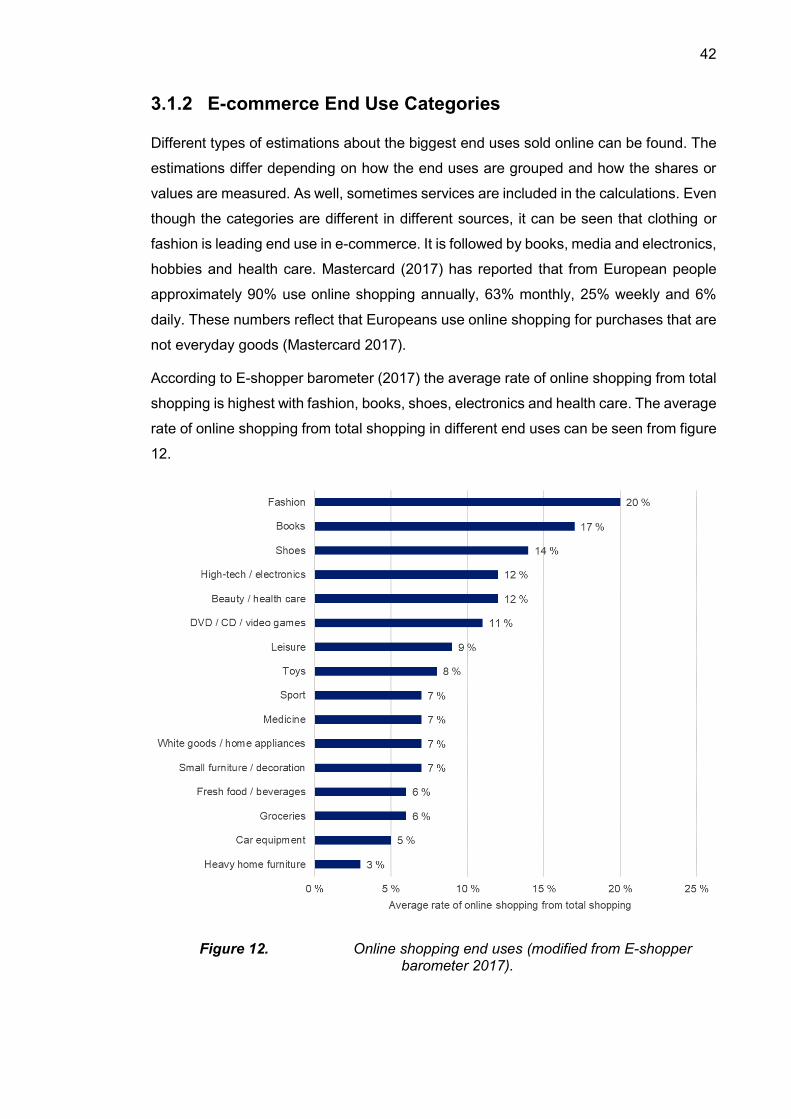
42
3.1.2 E-commerce End Use Categories
Different types of estimations about the biggest end uses sold online can be found. The
estimations differ depending on how the end uses are grouped and how the shares or
values are measured. As well, sometimes services are included in the calculations. Even
though the categories are different in different sources, it can be seen that clothing or
fashion is leading end use in e-commerce. It is followed by books, media and electronics,
hobbies and health care. Mastercard (2017) has reported that from European people
approximately 90% use online shopping annually, 63% monthly, 25% weekly and 6%
daily. These numbers reflect that Europeans use online shopping for purchases that are
not everyday goods (Mastercard 2017).
According to E-shopper barometer (2017) the average rate of online shopping from total
shopping is highest with fashion, books, shoes, electronics and health care. The average
rate of online shopping from total shopping in different end uses can be seen from figure
12.
Figure 12. Online shopping end uses (modified from E-shopper barometer 2017).
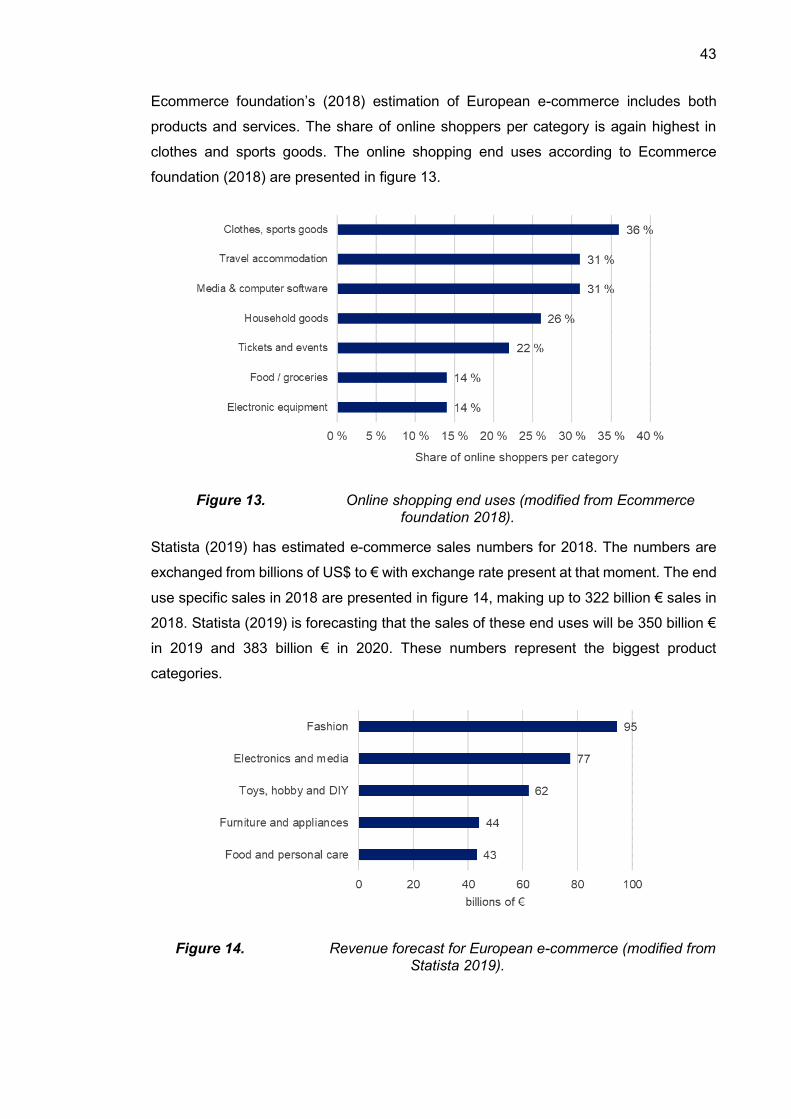
43
Ecommerce foundation’s (2018) estimation of European e-commerce includes both
products and services. The share of online shoppers per category is again highest in
clothes and sports goods. The online shopping end uses according to Ecommerce
foundation (2018) are presented in figure 13.
Figure 13. Online shopping end uses (modified from Ecommerce foundation 2018).
Statista (2019) has estimated e-commerce sales numbers for 2018. The numbers are
exchanged from billions of US$ to € with exchange rate present at that moment. The end
use specific sales in 2018 are presented in figure 14, making up to 322 billion € sales in
2018. Statista (2019) is forecasting that the sales of these end uses will be 350 billion €
in 2019 and 383 billion € in 2020. These numbers represent the biggest product
categories.
Figure 14. Revenue forecast for European e-commerce (modified from Statista 2019).
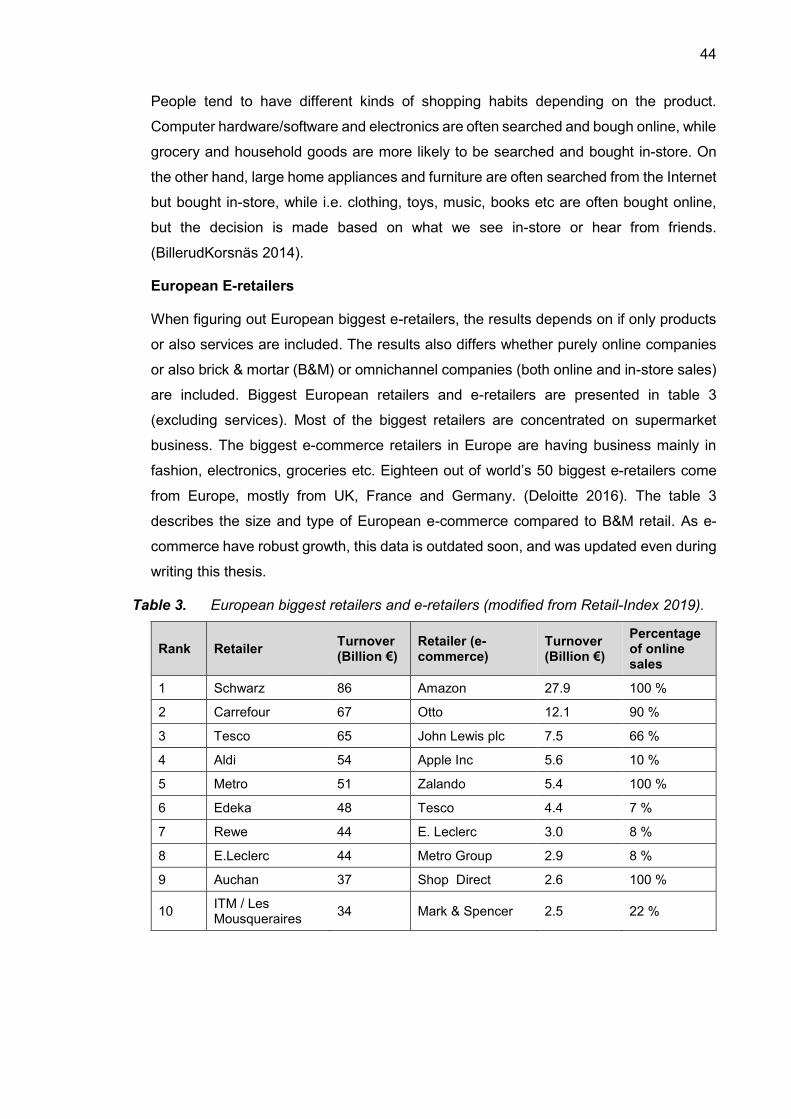
44
People tend to have different kinds of shopping habits depending on the product.
Computer hardware/software and electronics are often searched and bough online, while
grocery and household goods are more likely to be searched and bought in-store. On
the other hand, large home appliances and furniture are often searched from the Internet
but bought in-store, while i.e. clothing, toys, music, books etc are often bought online,
but the decision is made based on what we see in-store or hear from friends.
(BillerudKorsnäs 2014).
European E-retailers
When figuring out European biggest e-retailers, the results depends on if only products
or also services are included. The results also differs whether purely online companies
or also brick & mortar (B&M) or omnichannel companies (both online and in-store sales)
are included. Biggest European retailers and e-retailers are presented in table 3
(excluding services). Most of the biggest retailers are concentrated on supermarket
business. The biggest e-commerce retailers in Europe are having business mainly in
fashion, electronics, groceries etc. Eighteen out of world’s 50 biggest e-retailers come
from Europe, mostly from UK, France and Germany. (Deloitte 2016). The table 3
describes the size and type of European e-commerce compared to B&M retail. As e-
commerce have robust growth, this data is outdated soon, and was updated even during
writing this thesis.
Rank Retailer Turnover (Billion €)
Retailer (e-commerce)
Turnover (Billion €)
Percentage of online sales
1 Schwarz 86 Amazon 27.9 100 %
2 Carrefour 67 Otto 12.1 90 %
3 Tesco 65 John Lewis plc 7.5 66 %
4 Aldi 54 Apple Inc 5.6 10 %
5 Metro 51 Zalando 5.4 100 %
6 Edeka 48 Tesco 4.4 7 %
7 Rewe 44 E. Leclerc 3.0 8 %
8 E.Leclerc 44 Metro Group 2.9 8 %
9 Auchan 37 Shop Direct 2.6 100 %
10 ITM / Les Mousqueraires
34 Mark & Spencer 2.5 22 %
Table 3. European biggest retailers and e-retailers (modified from Retail-Index 2019).
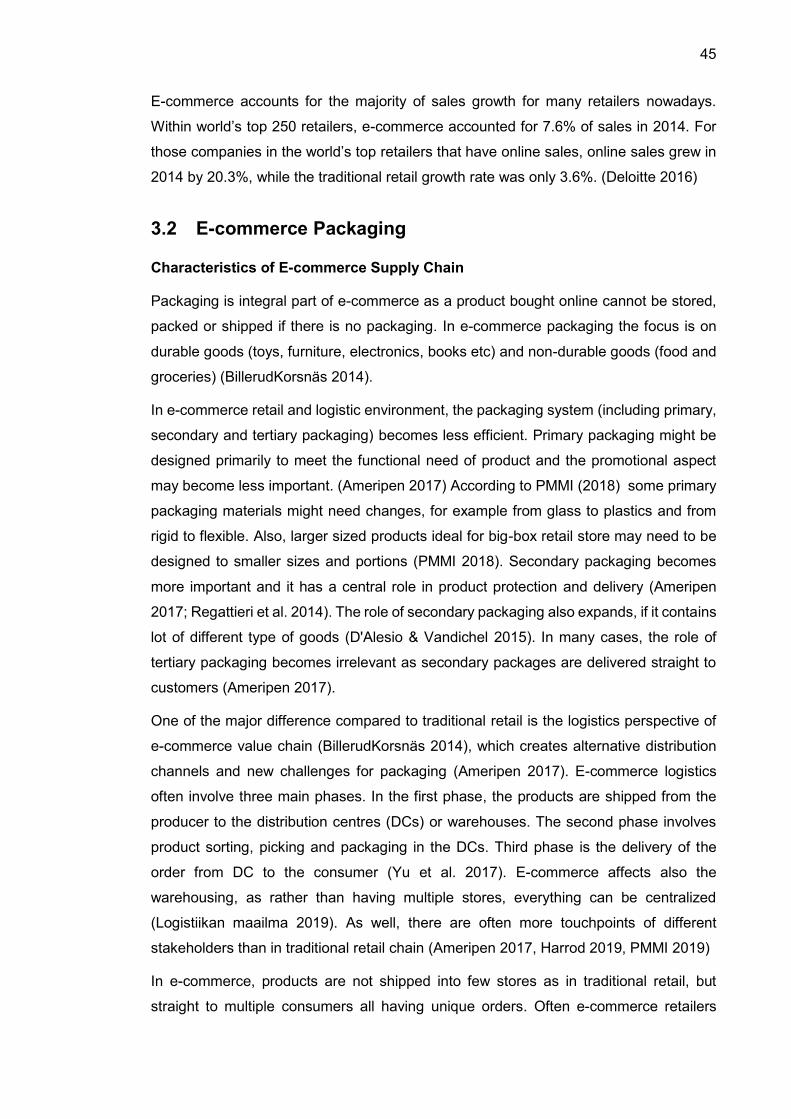
45
E-commerce accounts for the majority of sales growth for many retailers nowadays.
Within world’s top 250 retailers, e-commerce accounted for 7.6% of sales in 2014. For
those companies in the world’s top retailers that have online sales, online sales grew in
2014 by 20.3%, while the traditional retail growth rate was only 3.6%. (Deloitte 2016)
3.2 E-commerce Packaging
Characteristics of E-commerce Supply Chain
Packaging is integral part of e-commerce as a product bought online cannot be stored,
packed or shipped if there is no packaging. In e-commerce packaging the focus is on
durable goods (toys, furniture, electronics, books etc) and non-durable goods (food and
groceries) (BillerudKorsnäs 2014).
In e-commerce retail and logistic environment, the packaging system (including primary,
secondary and tertiary packaging) becomes less efficient. Primary packaging might be
designed primarily to meet the functional need of product and the promotional aspect
may become less important. (Ameripen 2017) According to PMMI (2018) some primary
packaging materials might need changes, for example from glass to plastics and from
rigid to flexible. Also, larger sized products ideal for big-box retail store may need to be
designed to smaller sizes and portions (PMMI 2018). Secondary packaging becomes
more important and it has a central role in product protection and delivery (Ameripen
2017; Regattieri et al. 2014). The role of secondary packaging also expands, if it contains
lot of different type of goods (D'Alesio & Vandichel 2015). In many cases, the role of
tertiary packaging becomes irrelevant as secondary packages are delivered straight to
customers (Ameripen 2017).
One of the major difference compared to traditional retail is the logistics perspective of
e-commerce value chain (BillerudKorsnäs 2014), which creates alternative distribution
channels and new challenges for packaging (Ameripen 2017). E-commerce logistics
often involve three main phases. In the first phase, the products are shipped from the
producer to the distribution centres (DCs) or warehouses. The second phase involves
product sorting, picking and packaging in the DCs. Third phase is the delivery of the
order from DC to the consumer (Yu et al. 2017). E-commerce affects also the
warehousing, as rather than having multiple stores, everything can be centralized
(Logistiikan maailma 2019). As well, there are often more touchpoints of different
stakeholders than in traditional retail chain (Ameripen 2017, Harrod 2019, PMMI 2019)
In e-commerce, products are not shipped into few stores as in traditional retail, but
straight to multiple consumers all having unique orders. Often e-commerce retailers
46
outsource logistics to third-part logistics companies. (BillerudKorsnäs 2014; Logistiikan
maailma 2019). The most commonly chosen delivery point in Europe is delivery at home,
but alternative points are increasingly favoured. These can be i.e. parcel shop, post
office, work, retailer store, parcel locker station etc. (E-shopper barometer 2017) At the
same time, customers are requiring fast deliveries (Ameripen 2017; Regattieri et al.
2014) so accuracy and speed become more and more important (BillerudKorsnäs 2014).
More decentralized orders and smaller quantities per stop (BillerudKorsnäs 2014;
Logistiikan maailma 2019) as well as the increased number of returned products
compared to traditional retail, increase the amount of transportation and logistics
(Manners-Bell 2016, pp.293-294; Regattieri et al, 2014). Manners-Bell (2016, p.294)
estimate that the average return rate is between 25-50%. Similarly Forbes Insight (2018)
and PMMI (2018) estimates that 20-30% of the items bought online are returned.
According to BillerudKorsnäs (2014) clothing is on the top of the return rates. In brick
and mortar, the average amount of returns is 8-9% (PMMI 2018). Often, the original
packaging is used when returning the product (BillerudKorsnäs 2014).
In this research, the main interest lies in secondary packaging, thus the packaging
material, functions and sustainability are considered from secondary packages’
perspective.
3.2.1 Functions of E-commerce Packaging
Nykänen (2018) has concluded the basic functions and requirements of e-commerce
packaging. It is to deliver products undamaged and respect customer requirements of
fit-for-purpose, right size, easy open and re-close. The trends that are currently affecting
the market include sustainability, efficiency, connectivity and personalization. (Nykänen
2018) Next, e-commerce packaging is presented from the viewpoint of packaging
functions that were presented in theoretical background, including protection,
convenience, communication and environmental sustainability. The main findings are
summarized in table 4.
47
How e-commerce impacts packaging functions?
Protection
Primary role of e-commerce packaging
The role of secondary packaging increases in deliveries
Individual product protection increases
Preservation: Last mile delivery creates challenges
Convenience
Packaging amount exceeding as smaller quantities ordered more frequently
Ease of handling by supply chain and consumer
Personalisation, functionalisation and design are important
Communication Information moving to Internet
E-commerce packaging role in brand communication
Environmental sustainability
Minimised material usage: minimised packaging waste
More recyclable, reusable or compostable materials
Balance between protection and void fill/material usage
Protection
One of the major roles of e-commerce packaging is to protect the products from physical,
chemical and biological damages that often occur during the transportation (Korzeniowsk
& Jasiczak 2005) so packaging must have robust and superior mechanical
characteristics in order to protect and contain the goods (Regattieri et al. 2014;
McKinsey&Company 2019). E-commerce logistics increase the risk of damaged
product due to a highly physical distribution patter (Ameripen 2017). Also, products are
shipped separately to consumers, which is increasing the need of individual product
protection (PMMI 2019). Compared to traditional retail, where products are shipped in
larger units, in B2C e-commerce, the focus is on the protective role of single secondary
or transport packaging. The degree of protective functions depend on product size,
weight and fragile or perishable nature (BillerudKorsnäs 2014).
Product protection is important in e-commerce, because according to Poll’s (2014)
survey, damaged products may cause that the customer starts avoiding the retailer or
consider ordering elsewhere. Also, damaged product may leave a bad impression of the
brand (BillerudKorsnäs 2014) and reduce customer satisfaction (Regattieri et al. 2014).
For this reason, packaging accessories and void fill are often used in secondary
packaging to protect products. Void fill prevents that product is not damaged by shaking,
vibration or collision. (Korzeniowsk & Jasiczak 2005) When it comes to sustainability,
protection is the most important aspect in e-commerce packaging as the product damage
is the least sustainable option. E-commerce packaging need to find the balance between
environmental sustainability and protection. (Smithers n.a.)
Table 4. How e-commerce affects packaging functions.
48
In e-commerce, last-mile deliveries (i.e. transportation straight to consumer) may create
challenges. Important aspect is how secondary packaging can preserve the products
during the delivery. For example, in e-food this mainly concerns the temperature control.
Also, different types of product requirements create challenges, when they are shipped
together in same packaging. (D'Alesio & Vandichel 2015)
Packaging can be subject to theft during transportation, so it is important to evaluate if
tracking or other intelligent solutions are needed (Regattieri et al. 2014). E-commerce
packaging can provide for example tamper-proof locks or other innovations can be used
to seal the package so that products cannot be removed or destroyed without destroying
the packaging. Safety and order traceability could be improved with intelligent packaging.
This can be done for example with microchips, electronic app-based codes or printed
electronics. (THIMM n.a.) This means decreased possibility to theft but also technologies
by which one can trace the order (Regattieri et al. 2014). What can also increase safety
in e-commerce packaging, is neutral box appearance, so no one can see what is inside.
Convenience
Product size, weight and fragile nature often dictate the design for packaging
(BillerudKorsnäs 2014). E-commerce packages should have standard dimensions, low
weight and minimal void space (Regattieri et al. 2014). E-commerce generally decreases
the order size or quantity and increases the order frequency (Logistiikan maailma 2019;
Regattieri et al. 2014). Due to the characteristic of smaller quantities and more frequent
deliveries of e-commerce orders, more individual packaging and new types of packaging
will be required (McKinsey&Company 2019). Things that should be also evaluated are
box personalisation, design and functionalisation (PMMI 2018).
From the customers’ point of view, handleability and user-friendliness are the main
aspect that needs to be taken into account in packaging design (Regattieri et al. 2014).
Packaging design determines features of packaging i.e. easy-open and reclose
functions, how the packaging should be picked up, opened or unpacked (Emblem &
Emblem 2012, p.46; Järvi-Kääriainen & Ollila 2007, p.12). In e-commerce, products
bought online cannot be tried before they reach customer and this requires easy opening
and closure from the e-commerce packaging, so that customer can return products that
do not meet the expectations (Korzeniowsk & Jasiczak 2005; PMMI 2018). Consumers
are also becoming more aware of prices and they are requiring more convenience,
personalization, and low-costs from packaging (BillerudKorsnäs 2014;
McKinsey&Company 2019).
49
Communication
In e-commerce, customer cannot feel, touch or try the product (BillerudKorsnäs 2014;
Chen & Tan 2004; Lohse & Spiller 1998). This means that consumers need to rely on
the Internet catalogues, reviews, demonstrations or any other extensive product
information that can be found online (Lohse & Spiller 1998). This replaces part of the
primary package’s role as information provider. Information functions of secondary
packaging concerns often information for distributors or information concerning the
customer. Packaging markings should instruct how the packaging should be handled,
stored and transited. General information should be easy to see, for example with printed
marks or self-adhesive labels and tags. Well managed information ensures that the order
will be sent to right customer, which could save money, effort and time. (Korzeniowsk &
Jasiczak 2005).
The secondary packaging appearance does not play a major role in e-commerce
packaging, but it can be seen as part of customer service, brand communication, quality
and sales promotion (BillerudKorsnäs 2014; Järvi-Kääriainen & Ollila 2007, p.9;
Regattieri et al. 2014; Sarkis et al. 2004). These aspects can play a role whether the
consumer repeats an online purchase (BillerudKorsnäs 2014). Packaging thus could be
a marketing strategy for brand owners (BillerudKorsnäs 2014; Visser 2002). Also,
according to Poll’s (2014) survey, people see that the role of packaging in e-commerce
indicates how much retailer cares about them, the value of the product and the
environmental commitment of the retailer. For example, unboxing experience is
important in e-commerce, as the packaging is the first touch point when consumer
delivers the good (THIMM n.a.).
Environmental Sustainability
One of the biggest trends in e-commerce packaging is sustainability
(McKinsey&Company 2019). Consumers are demanding increasingly sustainable and
recyclable solutions, forcing retailers to think about the environmental aspects of
packaging (BillerudKorsnäs 2014; Regattieri et al. 2014). According to Kirwan (2013,
p.336) the main focus points of sustainable secondary packaging are to reduce
overpackaging, increase recycling rate, reduction of emissions, protection of natural
resources and improvements of supply chain.
Packaging material and overpackaging are most often discussed in terms of
sustainability, as they are the most visible part of it and easy to understand by consumers
(Kirwan 2013, p.336). E-commerce packaging has sometimes been perceived negatively
due to large standard boxes and excess void fill or protective materials (Smithers n.a.).
50
As well, the public awareness about plastics leaking into environment has been
increasing the concerns (McKinsey&Company 2019). Sustainability concerns are
increasing the requirements of recyclable, reusable or compostable packaging materials
(McKinsey&Company 2019). Packaging materials should be also easy to recycle, for
example mono-material or biodegradable materials. (Regattieri et al. 2014) Also,
refillable or reusable materials could become increasingly attractive (Regattieri et al.
2014; Sarkis et al. 2004).
The right size of packaging should be evaluated in order to reduce empty space in
shipping, demand of void fill and produced packaging waste (PMMI 2018). Packaging
waste can be minimised by optimizing material usage or by reducing the weight per unit
(g/m2) without compromising the protection (Kirwan 2013, p.74). To protect the goods,
void fill is often added to the packaging, but regarding the environmental and economical
aspect, there also is need to reduce packaging waste (Verghese & Lewis 2007). The
mostly used void fills are air pillows, paper fillers and polystyrene (Forbes Insight 2018).
Finding the balance between sufficient protection and overpacking will be complex in
term of sustainability. The product itself might have a big carbon footprint and larger
costs than its packaging, so companies tend to overpack the products rather than take
a risk. (BillerudKorsnäs 2014) Underpackaging and overpackaging both have negative
impact on environment (Kirwan 2013, p.337).
Sometimes the sustainability of e-commerce packaging is more about perceived
sustainability and selling point than the real goal for companies (BillerudKorsnäs 2014)
and one challenge is that consumers’ desires for sustainability and they are unwilling to
pay for it (McKinsey&Company 2019).
3.2.2 Packaging Materials in E-commerce
According to EMOTA & FEPE (2018) research and Harrod (2019) from Smithers Pira,
the mostly used packaging materials in e-commerce are corrugated boxes 78%-80%,
followed by envelopes and flexible plastics. The share of e-commerce packaging
materials can be seen from figure 15. These two materials and their benefits and
challenges from secondary packaging perspective are explained next.
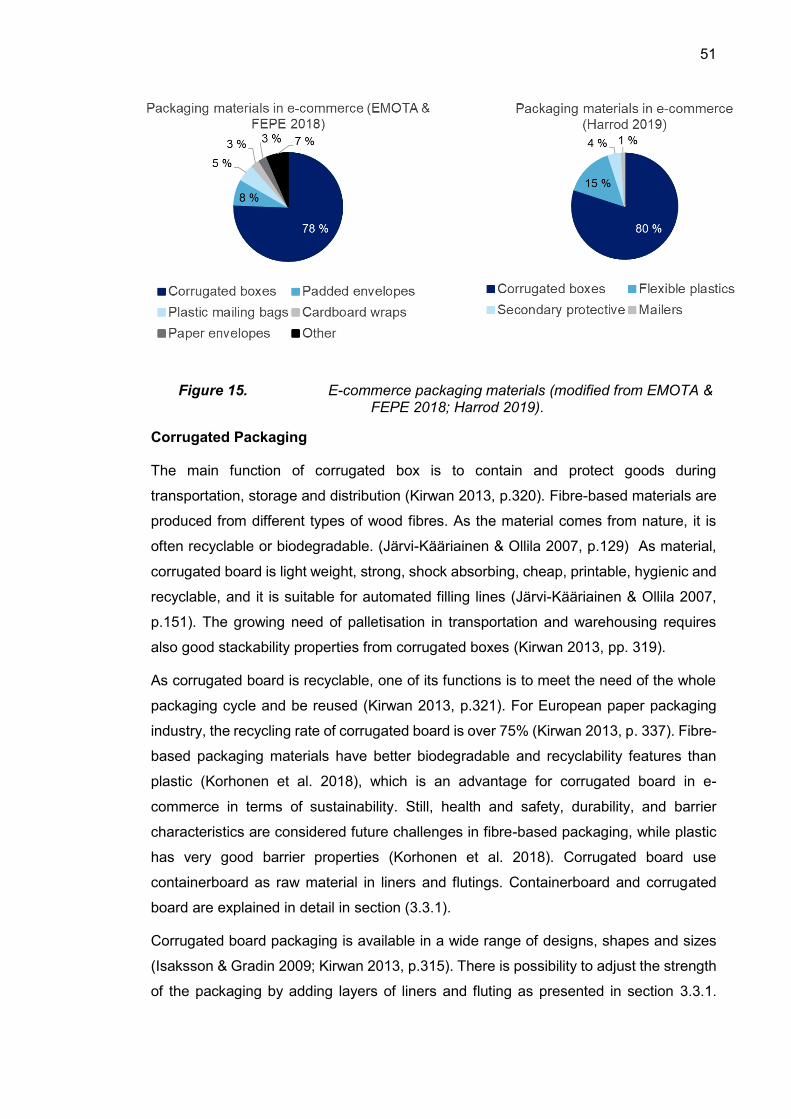
51
Figure 15. E-commerce packaging materials (modified from EMOTA & FEPE 2018; Harrod 2019).
Corrugated Packaging
The main function of corrugated box is to contain and protect goods during
transportation, storage and distribution (Kirwan 2013, p.320). Fibre-based materials are
produced from different types of wood fibres. As the material comes from nature, it is
often recyclable or biodegradable. (Järvi-Kääriainen & Ollila 2007, p.129) As material,
corrugated board is light weight, strong, shock absorbing, cheap, printable, hygienic and
recyclable, and it is suitable for automated filling lines (Järvi-Kääriainen & Ollila 2007,
p.151). The growing need of palletisation in transportation and warehousing requires
also good stackability properties from corrugated boxes (Kirwan 2013, pp. 319).
As corrugated board is recyclable, one of its functions is to meet the need of the whole
packaging cycle and be reused (Kirwan 2013, p.321). For European paper packaging
industry, the recycling rate of corrugated board is over 75% (Kirwan 2013, p. 337). Fibre-
based packaging materials have better biodegradable and recyclability features than
plastic (Korhonen et al. 2018), which is an advantage for corrugated board in e-
commerce in terms of sustainability. Still, health and safety, durability, and barrier
characteristics are considered future challenges in fibre-based packaging, while plastic
has very good barrier properties (Korhonen et al. 2018). Corrugated board use
containerboard as raw material in liners and flutings. Containerboard and corrugated
board are explained in detail in section (3.3.1).
Corrugated board packaging is available in a wide range of designs, shapes and sizes
(Isaksson & Gradin 2009; Kirwan 2013, p.315). There is possibility to adjust the strength
of the packaging by adding layers of liners and fluting as presented in section 3.3.1.
52
Smallest packaging designs could be used as primary packaging for small products such
as electronics, perfumes etc (Kirwan 2013, p.315) and the largest packaging designs
and grammages are suitable for industrial packaging or transportation purposes (Järvi-
Kääriainen & Ollila 2007, p.153). When it comes to sustainability issues, the challenges
corrugated packaging faces concern often overpackaging, overprotection and air
shipped inside the boxes (Smithers n.a). According to research done by Forbes Insights
(2018) and DS Smith, approximately one quarter of the content of corrugated packages
shipped are empty.
Plastics
Plastics are materials that are constructed by synthetic, semi-synthetic or organic
polymers. Synthetic plastics are often oil- or gas-based materials that are inexpensive to
produce, light weight, durable, with good heat and electrical barrier characteristics
(Hopewell et al. 2009; Lewis et al. 2010; Thompson et al. 2009a; Thompson et al. 2009b).
Plastics are often used in packaging due to their flexibility to form different shapes and
moulding possibilities (Hopewell et al. 2009; Marsh & Bugusu 2007).
All the main consumer packaging trends are favouring plastics over substitutes in most
dimensions, apart from sustainability (McKinsey&Company 2019). Problems lie on the
usage of finite oil resources and non-biodegradability (Johansson et al. 2012). Waste
disposal problems are raised as the material accumulate in the environment and in
landfills (Thompson et al. 2009a; Thompson et al. 2009b). Even though plastic degrades
at some point, it first breaks down into smaller pieces of plastic debris (Hopewell et al.
2009). Recycling of plastic is possible, but often combination of different polymers and
other materials increases the difficulty as most different plastic types are not compatible
with each other. Narrow range of polymers reduces the difficulty. (Hopewell et al. 2009).
It is estimated that approximately 31% of European plastics are recycled, 41% goes to
energy recovery and rest to landfills (PlasticsEurope 2018).
In the future, there will be most likely increasing amount of regulatory measures
(Thompson et al. 2009b) and requirements of recyclability (Hopewell et al. 2009)
regarding plastics. For example, European Commission have developed plastic
strategies in order to enhance circular economy (European Commission 2018). Part of
this strategy has been European Commission (2019) proposal on single-use plastics
directive, in order to fight against marine litter. The directive includes ban on the most
common single-use plastic products found on European beaches, measures to reduce
consumption of plastic beverage and food containers as well as increasing targets for
plastic bottle recycling. On the other hand, packaging waste concerns are not affecting
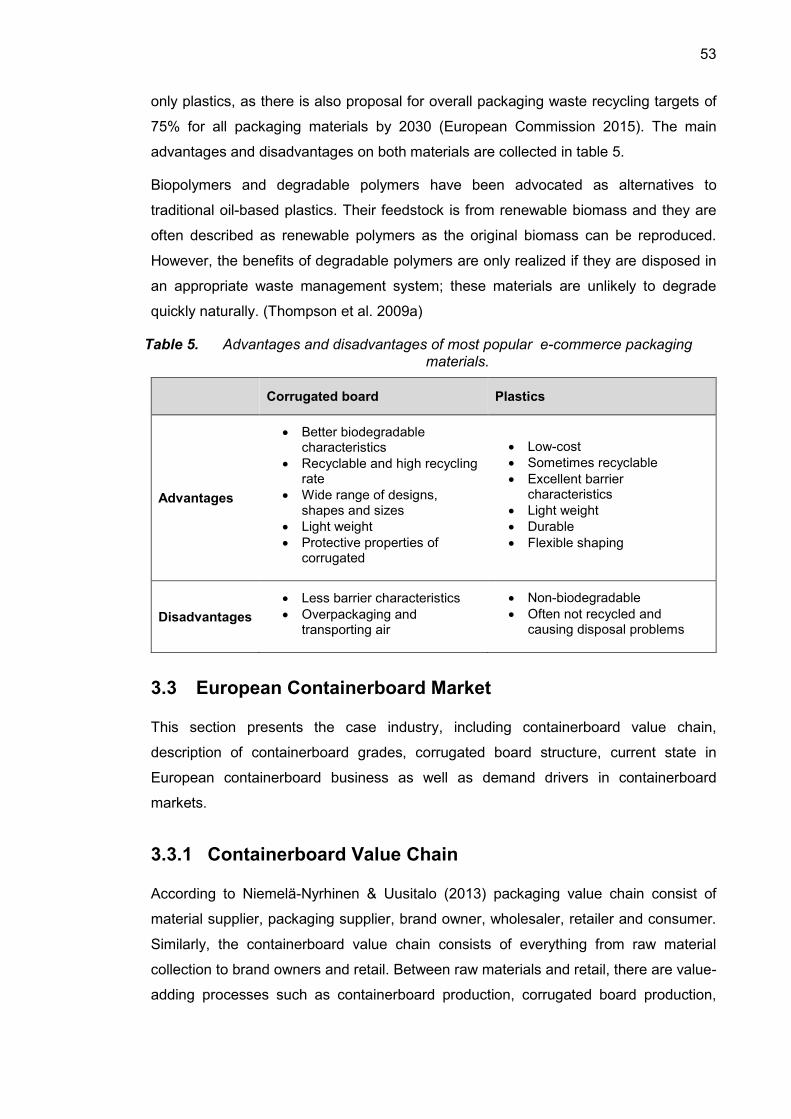
53
only plastics, as there is also proposal for overall packaging waste recycling targets of
75% for all packaging materials by 2030 (European Commission 2015). The main
advantages and disadvantages on both materials are collected in table 5.
Biopolymers and degradable polymers have been advocated as alternatives to
traditional oil-based plastics. Their feedstock is from renewable biomass and they are
often described as renewable polymers as the original biomass can be reproduced.
However, the benefits of degradable polymers are only realized if they are disposed in
an appropriate waste management system; these materials are unlikely to degrade
quickly naturally. (Thompson et al. 2009a)
Corrugated board Plastics
Advantages
Better biodegradable characteristics
Recyclable and high recycling rate
Wide range of designs, shapes and sizes
Light weight
Protective properties of corrugated
Low-cost
Sometimes recyclable
Excellent barrier characteristics
Light weight
Durable
Flexible shaping
Disadvantages
Less barrier characteristics
Overpackaging and transporting air
Non-biodegradable
Often not recycled and causing disposal problems
3.3 European Containerboard Market
This section presents the case industry, including containerboard value chain,
description of containerboard grades, corrugated board structure, current state in
European containerboard business as well as demand drivers in containerboard
markets.
3.3.1 Containerboard Value Chain
According to Niemelä-Nyrhinen & Uusitalo (2013) packaging value chain consist of
material supplier, packaging supplier, brand owner, wholesaler, retailer and consumer.
Similarly, the containerboard value chain consists of everything from raw material
collection to brand owners and retail. Between raw materials and retail, there are value-
adding processes such as containerboard production, corrugated board production,
Table 5. Advantages and disadvantages of most popular e-commerce packaging materials.
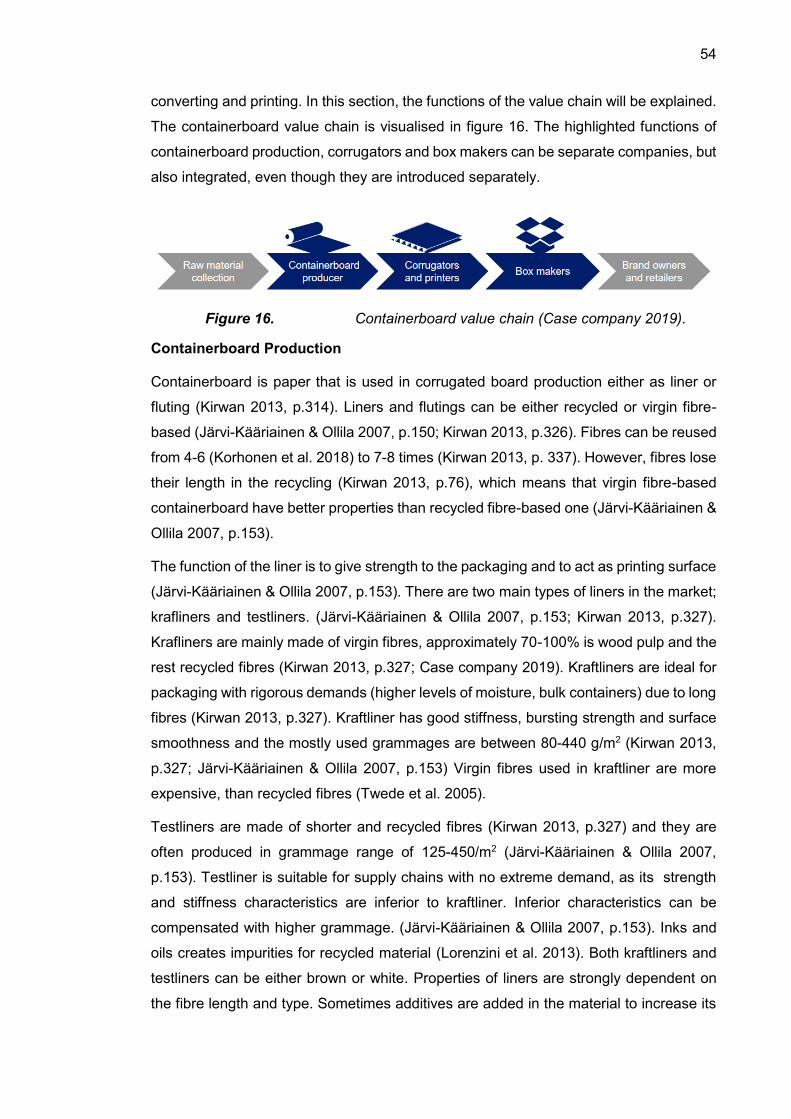
54
converting and printing. In this section, the functions of the value chain will be explained.
The containerboard value chain is visualised in figure 16. The highlighted functions of
containerboard production, corrugators and box makers can be separate companies, but
also integrated, even though they are introduced separately.
Figure 16. Containerboard value chain (Case company 2019).
Containerboard Production
Containerboard is paper that is used in corrugated board production either as liner or
fluting (Kirwan 2013, p.314). Liners and flutings can be either recycled or virgin fibre-
based (Järvi-Kääriainen & Ollila 2007, p.150; Kirwan 2013, p.326). Fibres can be reused
from 4-6 (Korhonen et al. 2018) to 7-8 times (Kirwan 2013, p. 337). However, fibres lose
their length in the recycling (Kirwan 2013, p.76), which means that virgin fibre-based
containerboard have better properties than recycled fibre-based one (Järvi-Kääriainen &
Ollila 2007, p.153).
The function of the liner is to give strength to the packaging and to act as printing surface
(Järvi-Kääriainen & Ollila 2007, p.153). There are two main types of liners in the market;
krafliners and testliners. (Järvi-Kääriainen & Ollila 2007, p.153; Kirwan 2013, p.327).
Krafliners are mainly made of virgin fibres, approximately 70-100% is wood pulp and the
rest recycled fibres (Kirwan 2013, p.327; Case company 2019). Kraftliners are ideal for
packaging with rigorous demands (higher levels of moisture, bulk containers) due to long
fibres (Kirwan 2013, p.327). Kraftliner has good stiffness, bursting strength and surface
smoothness and the mostly used grammages are between 80-440 g/m2 (Kirwan 2013,
p.327; Järvi-Kääriainen & Ollila 2007, p.153) Virgin fibres used in kraftliner are more
expensive, than recycled fibres (Twede et al. 2005).
Testliners are made of shorter and recycled fibres (Kirwan 2013, p.327) and they are
often produced in grammage range of 125-450/m2 (Järvi-Kääriainen & Ollila 2007,
p.153). Testliner is suitable for supply chains with no extreme demand, as its strength
and stiffness characteristics are inferior to kraftliner. Inferior characteristics can be
compensated with higher grammage. (Järvi-Kääriainen & Ollila 2007, p.153). Inks and
oils creates impurities for recycled material (Lorenzini et al. 2013). Both kraftliners and
testliners can be either brown or white. Properties of liners are strongly dependent on
the fibre length and type. Sometimes additives are added in the material to increase its
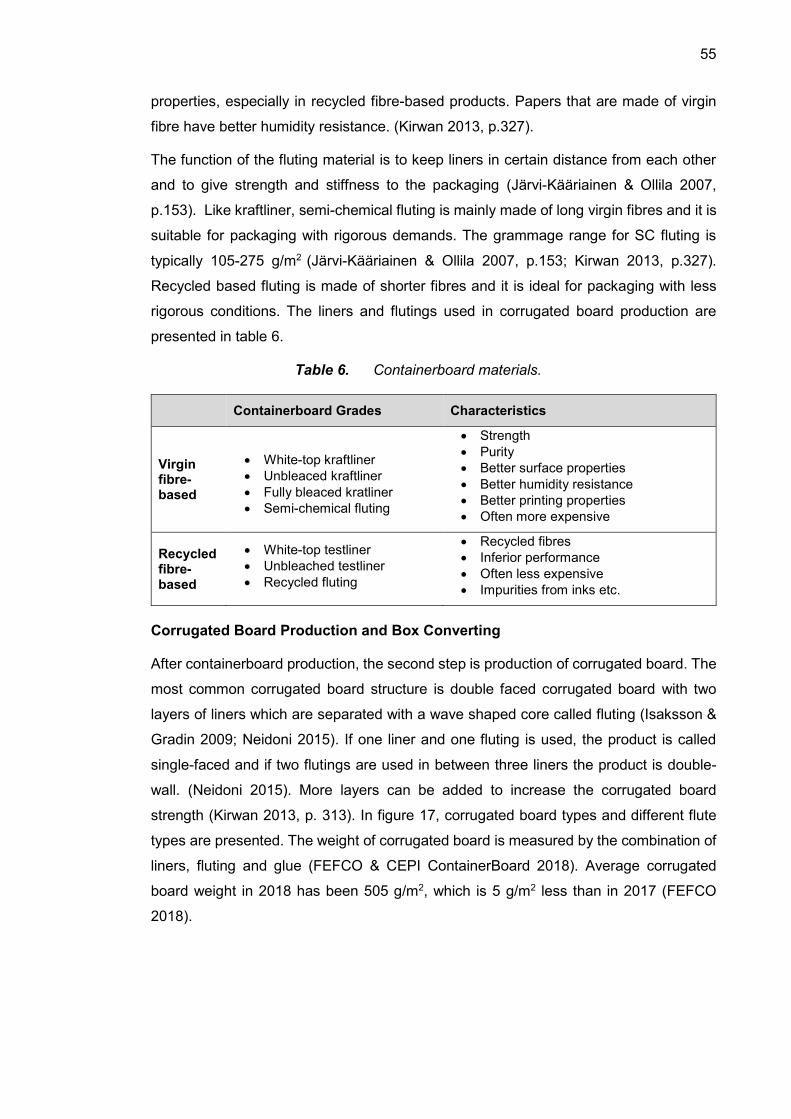
55
properties, especially in recycled fibre-based products. Papers that are made of virgin
fibre have better humidity resistance. (Kirwan 2013, p.327).
The function of the fluting material is to keep liners in certain distance from each other
and to give strength and stiffness to the packaging (Järvi-Kääriainen & Ollila 2007,
p.153). Like kraftliner, semi-chemical fluting is mainly made of long virgin fibres and it is
suitable for packaging with rigorous demands. The grammage range for SC fluting is
typically 105-275 g/m2 (Järvi-Kääriainen & Ollila 2007, p.153; Kirwan 2013, p.327).
Recycled based fluting is made of shorter fibres and it is ideal for packaging with less
rigorous conditions. The liners and flutings used in corrugated board production are
presented in table 6.
Containerboard Grades Characteristics
Virgin fibre-based
White-top kraftliner
Unbleaced kraftliner
Fully bleaced kratliner
Semi-chemical fluting
Strength
Purity
Better surface properties
Better humidity resistance
Better printing properties
Often more expensive
Recycled fibre-based
White-top testliner
Unbleached testliner
Recycled fluting
Recycled fibres
Inferior performance
Often less expensive
Impurities from inks etc.
Corrugated Board Production and Box Converting
After containerboard production, the second step is production of corrugated board. The
most common corrugated board structure is double faced corrugated board with two
layers of liners which are separated with a wave shaped core called fluting (Isaksson &
Gradin 2009; Neidoni 2015). If one liner and one fluting is used, the product is called
single-faced and if two flutings are used in between three liners the product is double-
wall. (Neidoni 2015). More layers can be added to increase the corrugated board
strength (Kirwan 2013, p. 313). In figure 17, corrugated board types and different flute
types are presented. The weight of corrugated board is measured by the combination of
liners, fluting and glue (FEFCO & CEPI ContainerBoard 2018). Average corrugated
board weight in 2018 has been 505 g/m2, which is 5 g/m2 less than in 2017 (FEFCO
2018).
Table 6. Containerboard materials.
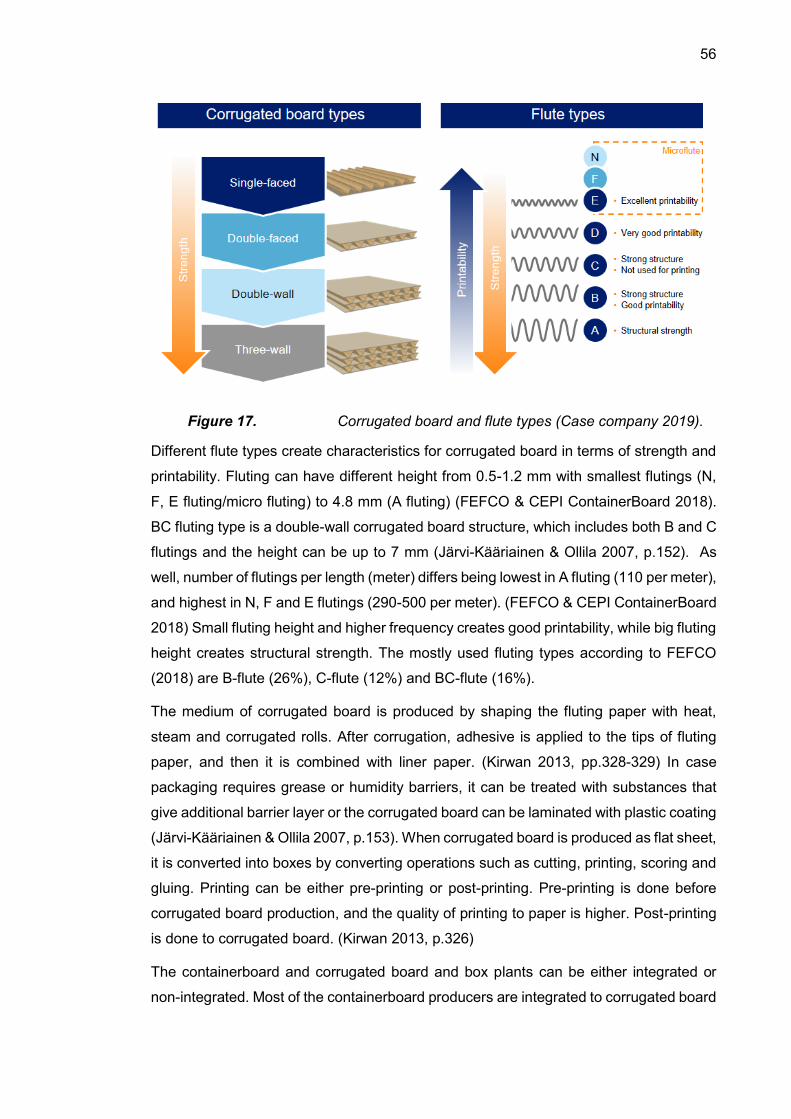
56
Figure 17. Corrugated board and flute types (Case company 2019).
Different flute types create characteristics for corrugated board in terms of strength and
printability. Fluting can have different height from 0.5-1.2 mm with smallest flutings (N,
F, E fluting/micro fluting) to 4.8 mm (A fluting) (FEFCO & CEPI ContainerBoard 2018).
BC fluting type is a double-wall corrugated board structure, which includes both B and C
flutings and the height can be up to 7 mm (Järvi-Kääriainen & Ollila 2007, p.152). As
well, number of flutings per length (meter) differs being lowest in A fluting (110 per meter),
and highest in N, F and E flutings (290-500 per meter). (FEFCO & CEPI ContainerBoard
2018) Small fluting height and higher frequency creates good printability, while big fluting
height creates structural strength. The mostly used fluting types according to FEFCO
(2018) are B-flute (26%), C-flute (12%) and BC-flute (16%).
The medium of corrugated board is produced by shaping the fluting paper with heat,
steam and corrugated rolls. After corrugation, adhesive is applied to the tips of fluting
paper, and then it is combined with liner paper. (Kirwan 2013, pp.328-329) In case
packaging requires grease or humidity barriers, it can be treated with substances that
give additional barrier layer or the corrugated board can be laminated with plastic coating
(Järvi-Kääriainen & Ollila 2007, p.153). When corrugated board is produced as flat sheet,
it is converted into boxes by converting operations such as cutting, printing, scoring and
gluing. Printing can be either pre-printing or post-printing. Pre-printing is done before
corrugated board production, and the quality of printing to paper is higher. Post-printing
is done to corrugated board. (Kirwan 2013, p.326)
The containerboard and corrugated board and box plants can be either integrated or
non-integrated. Most of the containerboard producers are integrated to corrugated board
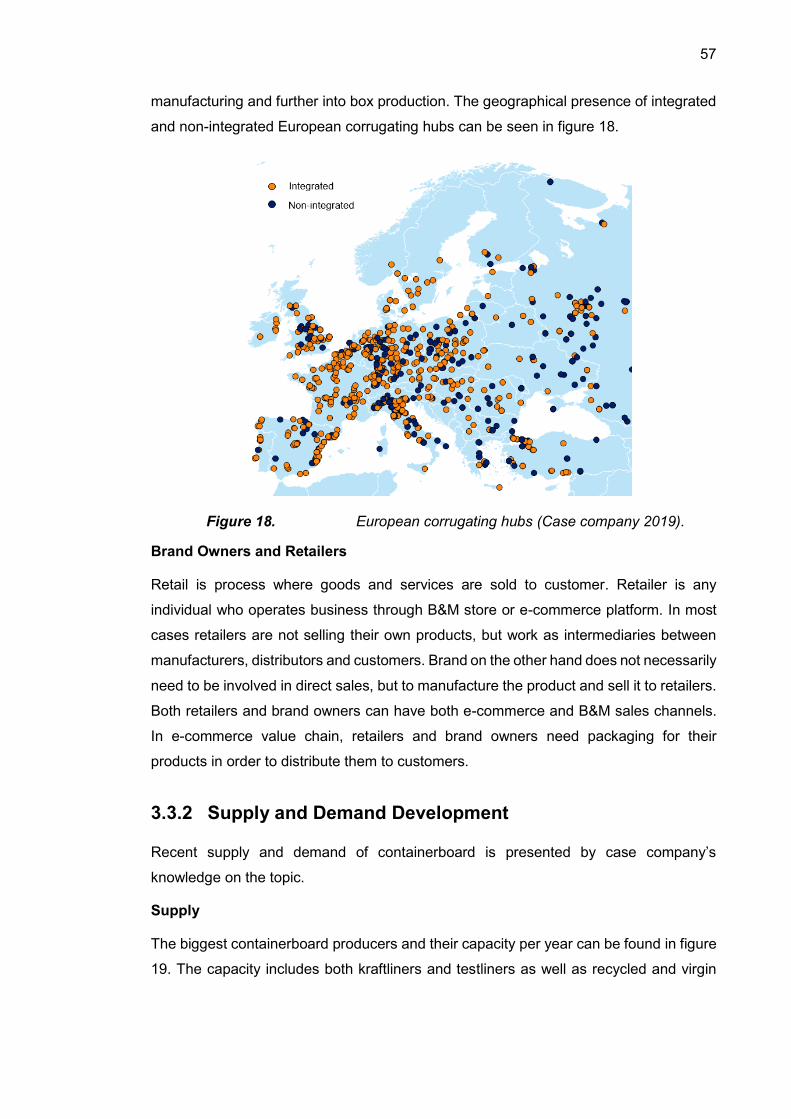
57
manufacturing and further into box production. The geographical presence of integrated
and non-integrated European corrugating hubs can be seen in figure 18.
Figure 18. European corrugating hubs (Case company 2019).
Brand Owners and Retailers
Retail is process where goods and services are sold to customer. Retailer is any
individual who operates business through B&M store or e-commerce platform. In most
cases retailers are not selling their own products, but work as intermediaries between
manufacturers, distributors and customers. Brand on the other hand does not necessarily
need to be involved in direct sales, but to manufacture the product and sell it to retailers.
Both retailers and brand owners can have both e-commerce and B&M sales channels.
In e-commerce value chain, retailers and brand owners need packaging for their
products in order to distribute them to customers.
3.3.2 Supply and Demand Development
Recent supply and demand of containerboard is presented by case company’s
knowledge on the topic.
Supply
The biggest containerboard producers and their capacity per year can be found in figure
19. The capacity includes both kraftliners and testliners as well as recycled and virgin
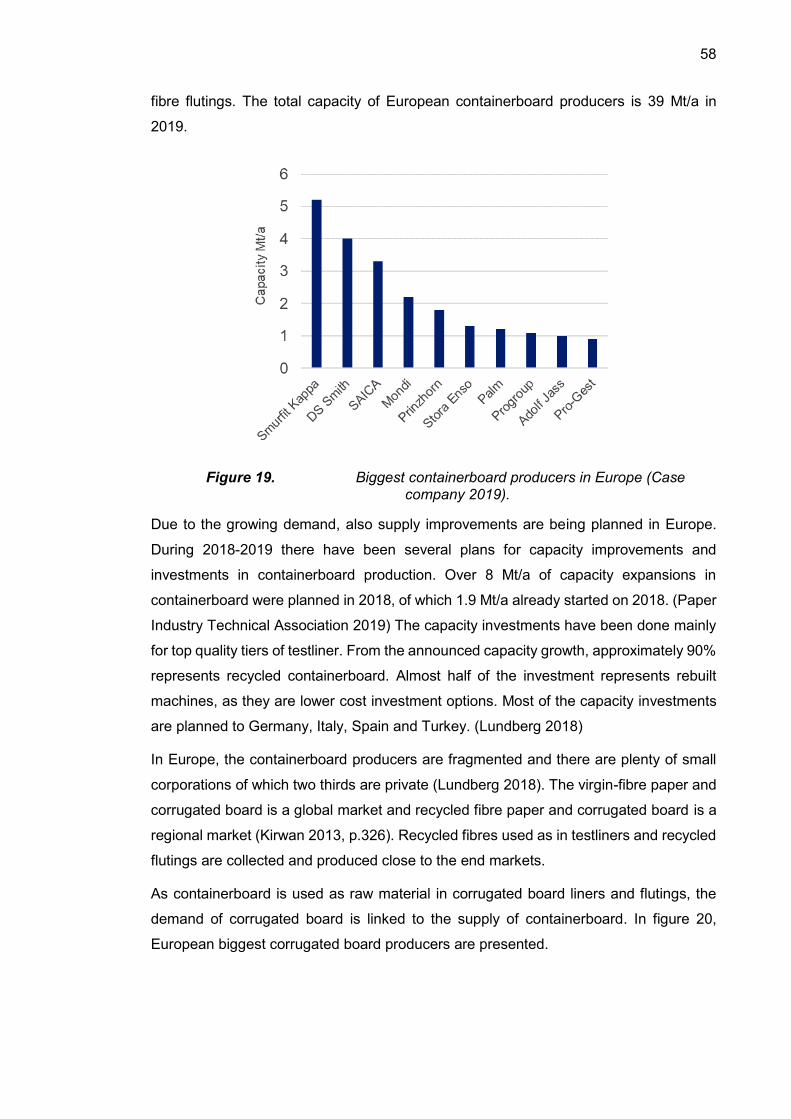
58
fibre flutings. The total capacity of European containerboard producers is 39 Mt/a in
2019.
Figure 19. Biggest containerboard producers in Europe (Case company 2019).
Due to the growing demand, also supply improvements are being planned in Europe.
During 2018-2019 there have been several plans for capacity improvements and
investments in containerboard production. Over 8 Mt/a of capacity expansions in
containerboard were planned in 2018, of which 1.9 Mt/a already started on 2018. (Paper
Industry Technical Association 2019) The capacity investments have been done mainly
for top quality tiers of testliner. From the announced capacity growth, approximately 90%
represents recycled containerboard. Almost half of the investment represents rebuilt
machines, as they are lower cost investment options. Most of the capacity investments
are planned to Germany, Italy, Spain and Turkey. (Lundberg 2018)
In Europe, the containerboard producers are fragmented and there are plenty of small
corporations of which two thirds are private (Lundberg 2018). The virgin-fibre paper and
corrugated board is a global market and recycled fibre paper and corrugated board is a
regional market (Kirwan 2013, p.326). Recycled fibres used as in testliners and recycled
flutings are collected and produced close to the end markets.
As containerboard is used as raw material in corrugated board liners and flutings, the
demand of corrugated board is linked to the supply of containerboard. In figure 20,
European biggest corrugated board producers are presented.
59
Figure 20. Biggest corrugated board producers in Europe (Case company 2019).
Demand
The total demand of containerboard in Europe was approximately 32 Mt in 2018 (with
Russia and without Turkey), of which approximately 79% is recycled fibre-based liners
and flutings and 21% virgin fibre-based liners and flutings. The demand of
containerboard and corrugated board grows approximately hand in hand when
measured by weight.
Paper and paperboard packages presents approximately 35-40% of the market share in
packaging materials (Kirwan 2013, p.2; Korhonen et al. 2018), making it the largest
packaging material used by weight (Kirwan 2013, p.2). According to Järvi-Kääriainen &
Ollila (2007, p.150) corrugated board is the mostly used packaging material in the world.
The biggest end uses for corrugated board are food and industrial end uses, accounting
approximately 54% of the demand globally and 65% in Europe. As well, containerboard
and corrugated board are used often with durables, beverages, food, fast moving
consumer goods (FMCG), IT, capital goods, auxiliary goods, logistics and other paper
products (FEFCO 2018). It is seen that demand of all of these end segments are staying
stable or growing.
According to FEFCO (2018) data, e-commerce accounts less than 3% of European
containerboard end demand. However, it is missing data from for example France and
UK, which are one of the European biggest e-commerce markets, so the actual share of
e-commerce end use could be bigger.
60
3.3.3 Containerboard Demand Drivers
According to Case company’s (2019) earlier research in containerboard and corrugated
board demand, it has been seen that there are several drivers affecting the demand in
the market. Major factor affecting containerboard demand is economic development.
There is a strong correlation between GDP growth and containerboard demand
(McKinsey&Company 2019). Trends in European corrugated and containerboard market
follow thus movements of macroeconomics and changes in industrial production (Paper
Industry Technical Association 2019). Growth of containerboard demand is caused by
overall economic situation and e-commerce (Lundberg 2018). E-commerce is facing
robust growth and re-shaping industries such as retail and logistics, and thus affecting
the demand of containerboard.
Containerboard demand is also driven by end use development, materials and
technology, substitution and sustainability. Traditional end uses such as food and
industrial end uses are creating stability to the market. The end use development creates
new demand, and it has been seen that the future growth will be on consumer durables
such as electronics, shoes, clothing and toys as well as in non-food FMCG such as
cosmetics and detergents.
Material usage and technologies may have an impact on containerboard demand in
terms of weight requirements (i.e. lighter materials), technological development in
production or grade requirements and developments (i.e. performance, appearance,
purity). It has been already seen in the markets that lightweight materials have been
favoured, creating -0.4% decrease in average weight of corrugated board in Europe
between 2000-2016. Lighter containerboard grammages and lighter box structures can
be caused by better production technology and aim to lowers the logistics costs in
transportation.
In packaging market, corrugated packaging is competing with other materials.
Competing materials include for example folding cartons, flexible and rigid plastics and
in tertiary packaging level also cages, pallets and shrink wraps. As well, containerboard
grades (virgin/recycled) are competing with each other with different characteristics.
Factors such as weight, cost, runnability, box performance, purity and surface properties
are affecting the grade choice.
Sustainability issues are creating pressure to packaging market and companies are
trying to create more sustainable packaging solutions i.e. in renewable or recyclable
packaging materials, focus on energy usage, responsible sourcing or minimizing the
amount of packaging material. In the future, the containerboard producers may face
61
pressure due to cost competition (Europe has relatively high fibre and energy cost), new
regulations and unknown variables such as global trade disputes (Lundberg 2018).
Containerboard demand drivers are summarised in table 7.
Driver Impact on demand
End use development
Traditional end uses are creating stability to market. End use development creates new demand.
Economic growth & e-commerce
Biggest factor affecting the demand. Following movements of macroeconomics. E-commerce having robust growth and creating new demand.
Materials and Technology
Long term development in production technology, material characteristics and weight requirements
Substitution Substitution with other materials (folding box board, flexible and rigid plastics, pallets etc.). Substitution between containerboard grades.
Sustainability New requirements for more sustainable packaging in terms of materials, recycling, production, sourcing, amount of packaging etc.
Table 7. Drivers affecting containerboard demand (Case company 2019).
62
4. METHODOLOGY
In this chapter explains the main methodologies used in the research. Also, the research
process and timeline is explained, and data gathering and analysing methods are
introduced.
4.1 Research Methods
The research onion is represented model by Saunders et al. (2009, p. 108). It explains
the methodological assumptions made in the research. The inner four layers of the
research onion (strategy, methodological choices, time horizon and techniques)
represent the details of data collection in the research (Saunders et al. 2009, p.138).
Before defining the data collection and analysis, it is beneficial to understand the “taken-
for-granted” assumptions, by defining the two outer layers of the research; philosophy
and approach (Saunders et al. 2009, p. 109). The methodological choices made in the
research are presented in figure 21.
Figure 21. Research onion and methodological decisions (modified from Saunders et al. 2009, p.108).
Research philosophy is important, as it defines how we understand the world. It affects
the research strategy and techniques. Research philosophy could be explained by
ontology and epistemology. Ontology explains what the researcher consider as truthful
and this can be either objective, partly objective or subjective. Epistemology defines what
the researcher considers as data and knowledge in the research and this can be
something between purely scientific facts and subjective views. (Saunders et al. 2009,
pp. 110-112) Philosophy used in this research combines both alternatives; using fact as
63
knowledge but also subjective insights. The philosophy is not thus purely based on
science, but also how people see the future development of containerboard demand in
their subjective perspective. For this reason, philosophy in the research is pragmatism.
Pragmatism argues that the most important determinant of what defines ontology and
epistemology is the research question, both qualitative and quantitative methods can be
used to figure out the best results, and multiple or mixed method designs can be used to
collect and analyse data (Saunders et al. 2009, p. 109).
In the research, data collection can be approached with either inductive (testing theories)
or deductive (creating theories) perspective (Saunders et al. 2009, pp.124-125). In this
research, the approach to data collection and analysis is something in between these
two – abductive. Literature is used to understand the current containerboard and e-
commerce packaging market, but the same time, with empirical part the aim is to get
new information and insights about the topic. Abductive approach is combining both
inductive and deductive approaches and it combines theory and practice (Pirkkalainen
2019).
The next three layers; strategy, methodological choices and time horizon are seen as
the process of defining the research design, while the most inner layer techniques
defines the more detailed information about data gathering and analysis (Saunders et al.
2009, pp.136-138). The choice of right research strategy will be guided by the research
question (Saunders et al. 2009, p.141). The research strategy in this research is market
research guided by the need of understanding the current containerboard demand in e-
commerce packaging and the foreseen development. Market research is a way to
investigate and explain human behaviour and it is often used to provide reliable
information, which can help decision making in organisations (Hamersveld & Bont 2008,
p. 37).
Before defining the research strategy, it is important to think about the purpose of the
research. Market research can be exploratory, descriptive or experimental, but
describing certain behaviour often leads to need of explain. Exploratory research
describes what is happening and gives new insights, and the precise nature of the
problem can be unsure. In this research market research is approached with explorative
purpose. Exploratory research is usually done by doing a literature review, interviewing
experts or by conducting focus group interviews. (Robson 2002; cited by Saunders et al.
2009, pp.138-140)
64
In this research the aim is to understand the specific market, packaging decision and
drivers of future development, which fits well with the objectives of market research. Four
important applications, in which market research is often used are:
to understand the markets
to understand the customer
to understand and develop the offer
to position the brand and communication (Hague et al. 2013, p.15)
It is important to consider whether the research would be approached by qualitative or
quantitative methods as these define and differentiate data gathering and analysing
procedures in research (Saunders et al. 2009, p.151). Often quantitative and qualitative
approaches are complementary in market research so both may feature (Hague et al.
2004, pp. 9-11; Hamersveld & Bont 2008, p. 39). Both approaches are used in this
research. Quantitative market research can include i.e. calculations about market size,
shares, distribution levels and so on. Qualitative methods are used to understand, not
just simply measure. Both qualitative and quantitative market research can be achieved
by extrapolating sample of the market, but often the sample is smaller in qualitative
research (Hague et al. 2004, pp. 9-11).
Either one (mono method) or more (multiple method) data collection and analysing
procedures can be used in the research (Saunders et al. 2009, p.151). In this research
both survey and interviews are used as data gathering, thus multiple method approach
is used. When choosing multiple method approach, one can see from the figure 22 that
either multi-method or mixed method approach can be used in data gathering and
analysing. Mixed-methods are used in this research, meaning that both qualitative and
quantitative data collection techniques and analysis is used, also by combining them
(Saunders et al. 2009, pp. 152-153). Combining the methods, will be used to quantify
simple qualitative data. Time horizon in the research is cross sectional, meaning that the
research provide a snapshot of a particular time (Saunders et al. 2009, p.155). This
means that the provided information of the market concerns the time in which this
research is done.
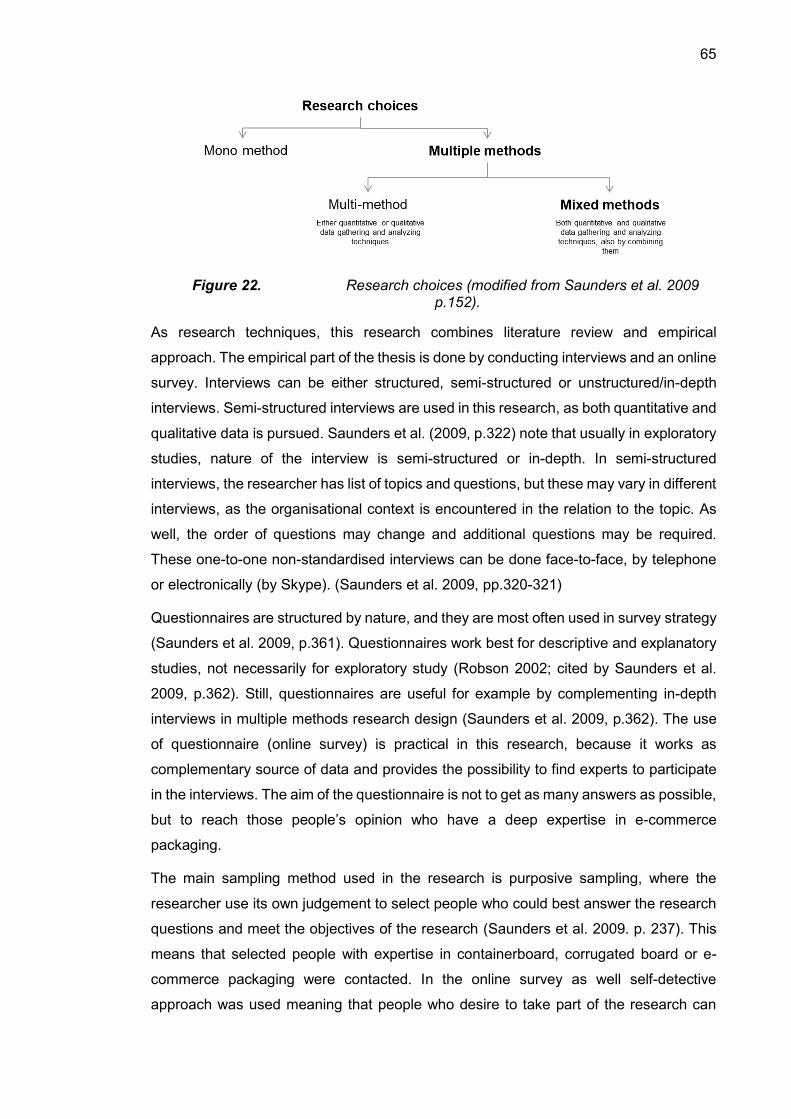
65
Figure 22. Research choices (modified from Saunders et al. 2009 p.152).
As research techniques, this research combines literature review and empirical
approach. The empirical part of the thesis is done by conducting interviews and an online
survey. Interviews can be either structured, semi-structured or unstructured/in-depth
interviews. Semi-structured interviews are used in this research, as both quantitative and
qualitative data is pursued. Saunders et al. (2009, p.322) note that usually in exploratory
studies, nature of the interview is semi-structured or in-depth. In semi-structured
interviews, the researcher has list of topics and questions, but these may vary in different
interviews, as the organisational context is encountered in the relation to the topic. As
well, the order of questions may change and additional questions may be required.
These one-to-one non-standardised interviews can be done face-to-face, by telephone
or electronically (by Skype). (Saunders et al. 2009, pp.320-321)
Questionnaires are structured by nature, and they are most often used in survey strategy
(Saunders et al. 2009, p.361). Questionnaires work best for descriptive and explanatory
studies, not necessarily for exploratory study (Robson 2002; cited by Saunders et al.
2009, p.362). Still, questionnaires are useful for example by complementing in-depth
interviews in multiple methods research design (Saunders et al. 2009, p.362). The use
of questionnaire (online survey) is practical in this research, because it works as
complementary source of data and provides the possibility to find experts to participate
in the interviews. The aim of the questionnaire is not to get as many answers as possible,
but to reach those people’s opinion who have a deep expertise in e-commerce
packaging.
The main sampling method used in the research is purposive sampling, where the
researcher use its own judgement to select people who could best answer the research
questions and meet the objectives of the research (Saunders et al. 2009. p. 237). This
means that selected people with expertise in containerboard, corrugated board or e-
commerce packaging were contacted. In the online survey as well self-detective
approach was used meaning that people who desire to take part of the research can
66
participate (Saunders et al. 2009, p. 240). Snowball sampling was also included in the
research. In this sampling method, potential contacts are asked if they can identify
people who could participate in the research, as often it is difficult to identify potential
participants from the population (Saunders et al. 2009, p. 241). As expertise in the
corrugated packaging and e-commerce at the same time was not easy to find, it was
asked if the potential interview participants would know someone else in the organisation
who would know about the topics in question, in case they are not the best persons to
answer. The contact mail can be seen in appendix A.
4.2 Research Process
The master’s thesis was conducted for the case company as internal development
project. The topic and main objectives of the research came from the case company and
the research project started in April/May 2019 by preparing the research plan and having
a meeting together with university professor, case company’s supervisors and the
researcher. In the meeting, the objectives and the scope of the research were discussed.
The main research question stayed the same during the whole process, and the research
methods of the empirical part by conducting interviews and survey were executed as
planned. The timeline for the research is presented in figure 23.
Literature review and writing the theoretical background started in May 2019 and was
finalised after the empirical part. The literature part covers theoretical part and industry
description. The theoretical background explains functions of packaging and scientific
approach to diffusion of innovations. To find suitable scientific literature material several
headwords need to be used. Mostly used headwords includes: “packaging”,
“fundamentals of packaging”, “functions of packaging”, ”e-commerce”, “electronic
commerce”, “online sales”, “innovation”, “characteristics” “adoption”, “diffusion”, “TAM”,
“TOE” etc. The headwords were combined as well. The results were arranged by times
cited, and sometimes by the newness. Many of the articles were also found through
referred authors in the articles. The researcher kept up a list of articles and their
relevance were tested in Julkaisufoorumi (2019) criteria from 1-3. The articles that did
not reach the criteria were mainly left out.
In the industry background, the approach is less scientific due to the non-researched
nature of e-commerce packaging. Publications, reports, presentations, case company’s
own industry and demand data and knowledge are used to support the industry
background description.
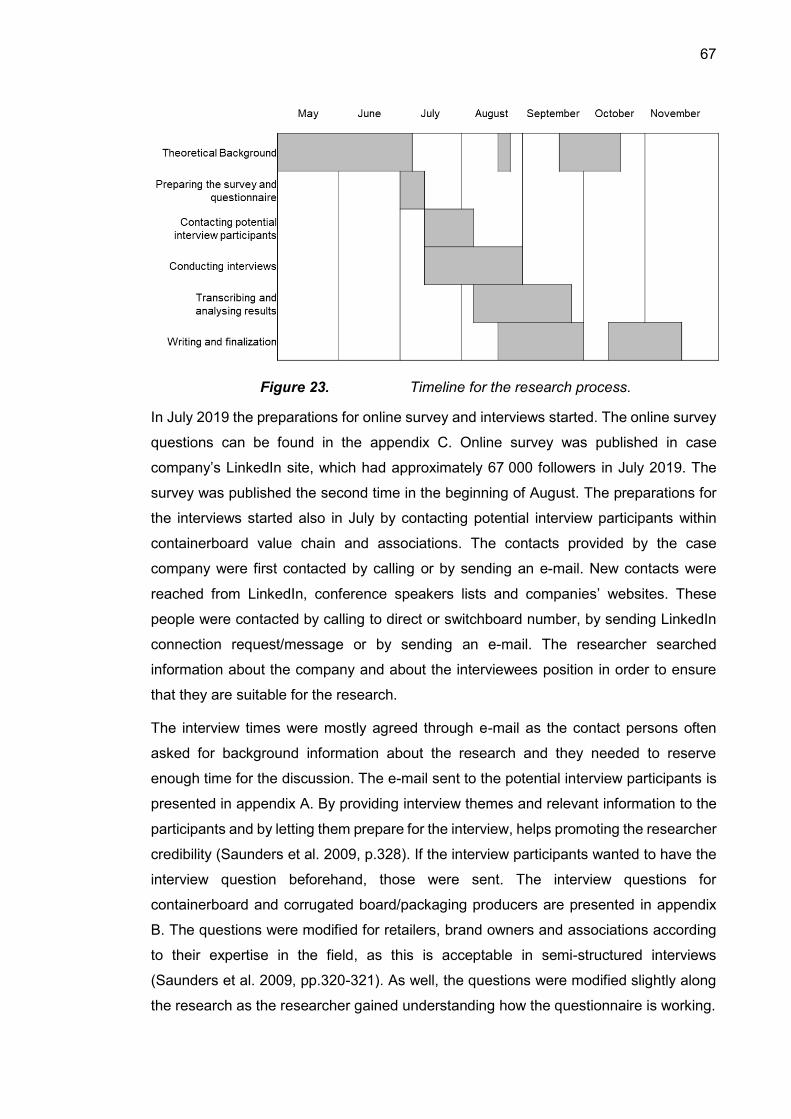
67
Figure 23. Timeline for the research process.
In July 2019 the preparations for online survey and interviews started. The online survey
questions can be found in the appendix C. Online survey was published in case
company’s LinkedIn site, which had approximately 67 000 followers in July 2019. The
survey was published the second time in the beginning of August. The preparations for
the interviews started also in July by contacting potential interview participants within
containerboard value chain and associations. The contacts provided by the case
company were first contacted by calling or by sending an e-mail. New contacts were
reached from LinkedIn, conference speakers lists and companies’ websites. These
people were contacted by calling to direct or switchboard number, by sending LinkedIn
connection request/message or by sending an e-mail. The researcher searched
information about the company and about the interviewees position in order to ensure
that they are suitable for the research.
The interview times were mostly agreed through e-mail as the contact persons often
asked for background information about the research and they needed to reserve
enough time for the discussion. The e-mail sent to the potential interview participants is
presented in appendix A. By providing interview themes and relevant information to the
participants and by letting them prepare for the interview, helps promoting the researcher
credibility (Saunders et al. 2009, p.328). If the interview participants wanted to have the
interview question beforehand, those were sent. The interview questions for
containerboard and corrugated board/packaging producers are presented in appendix
B. The questions were modified for retailers, brand owners and associations according
to their expertise in the field, as this is acceptable in semi-structured interviews
(Saunders et al. 2009, pp.320-321). As well, the questions were modified slightly along
the research as the researcher gained understanding how the questionnaire is working.
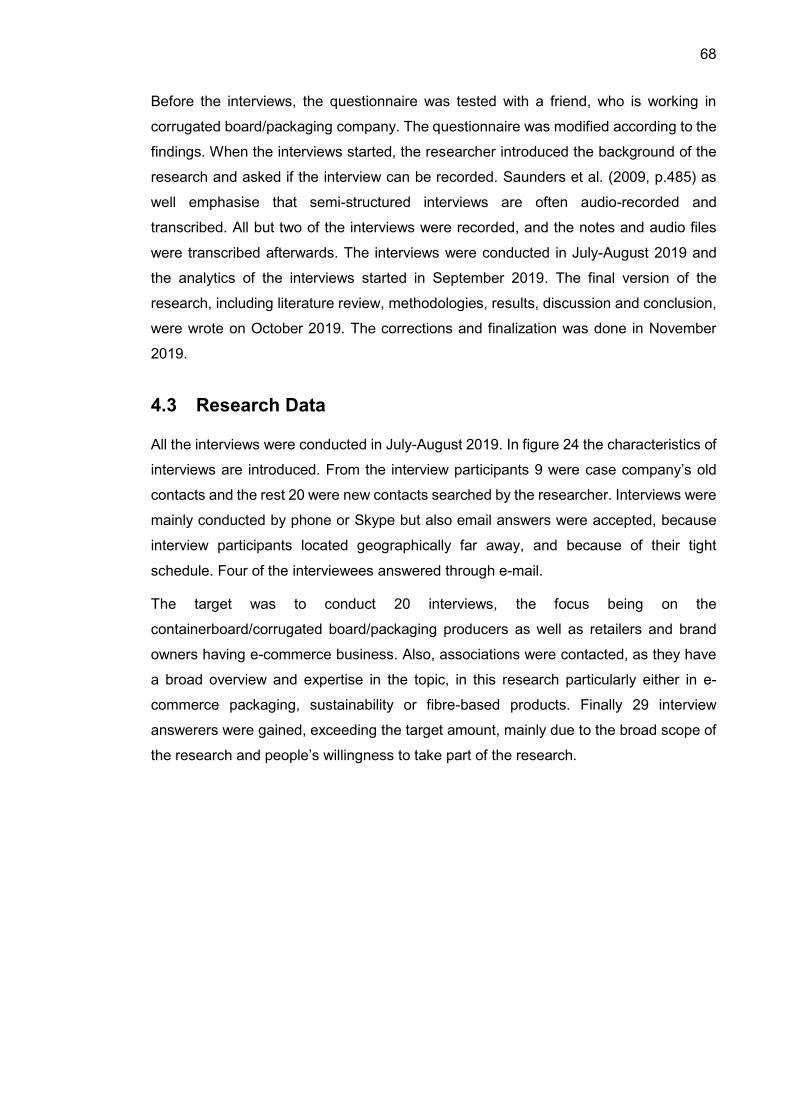
68
Before the interviews, the questionnaire was tested with a friend, who is working in
corrugated board/packaging company. The questionnaire was modified according to the
findings. When the interviews started, the researcher introduced the background of the
research and asked if the interview can be recorded. Saunders et al. (2009, p.485) as
well emphasise that semi-structured interviews are often audio-recorded and
transcribed. All but two of the interviews were recorded, and the notes and audio files
were transcribed afterwards. The interviews were conducted in July-August 2019 and
the analytics of the interviews started in September 2019. The final version of the
research, including literature review, methodologies, results, discussion and conclusion,
were wrote on October 2019. The corrections and finalization was done in November
2019.
4.3 Research Data
All the interviews were conducted in July-August 2019. In figure 24 the characteristics of
interviews are introduced. From the interview participants 9 were case company’s old
contacts and the rest 20 were new contacts searched by the researcher. Interviews were
mainly conducted by phone or Skype but also email answers were accepted, because
interview participants located geographically far away, and because of their tight
schedule. Four of the interviewees answered through e-mail.
The target was to conduct 20 interviews, the focus being on the
containerboard/corrugated board/packaging producers as well as retailers and brand
owners having e-commerce business. Also, associations were contacted, as they have
a broad overview and expertise in the topic, in this research particularly either in e-
commerce packaging, sustainability or fibre-based products. Finally 29 interview
answerers were gained, exceeding the target amount, mainly due to the broad scope of
the research and people’s willingness to take part of the research.
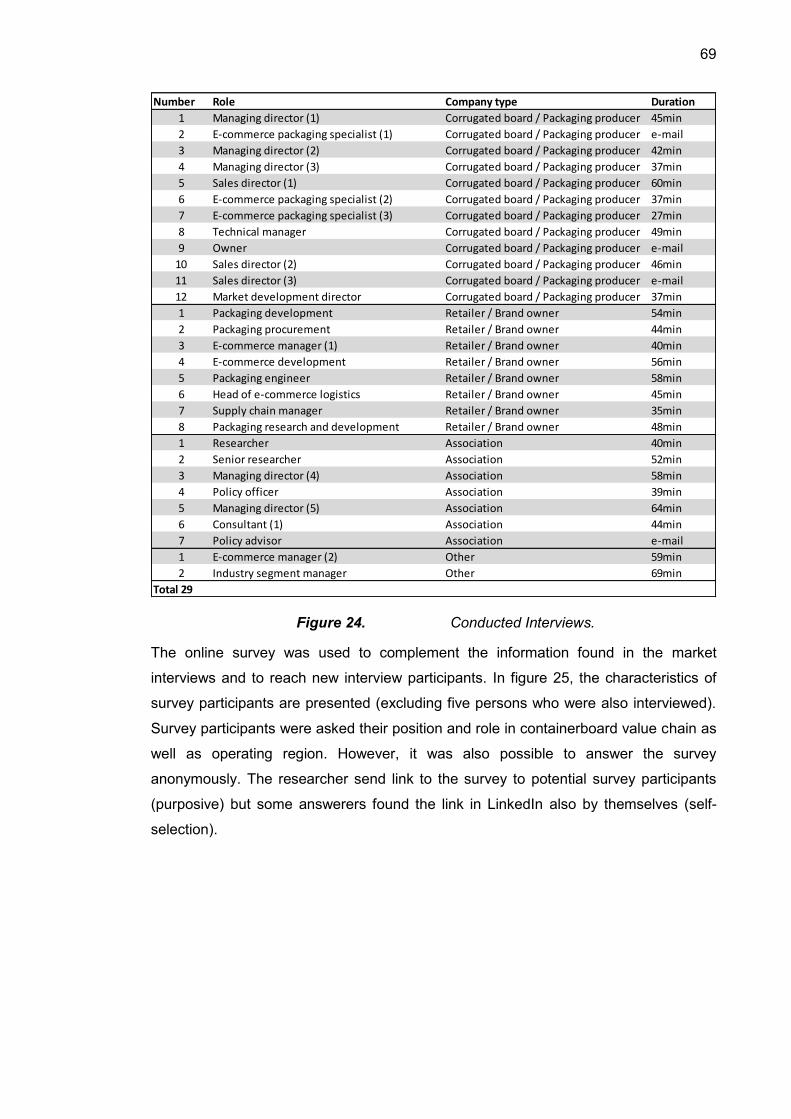
69
Figure 24. Conducted Interviews.
The online survey was used to complement the information found in the market
interviews and to reach new interview participants. In figure 25, the characteristics of
survey participants are presented (excluding five persons who were also interviewed).
Survey participants were asked their position and role in containerboard value chain as
well as operating region. However, it was also possible to answer the survey
anonymously. The researcher send link to the survey to potential survey participants
(purposive) but some answerers found the link in LinkedIn also by themselves (self-
selection).
Number Role Company type Duration
1 Managing director (1) Corrugated board / Packaging producer 45min
2 E-commerce packaging specialist (1) Corrugated board / Packaging producer e-mail
3 Managing director (2) Corrugated board / Packaging producer 42min
4 Managing director (3) Corrugated board / Packaging producer 37min
5 Sales director (1) Corrugated board / Packaging producer 60min
6 E-commerce packaging specialist (2) Corrugated board / Packaging producer 37min
7 E-commerce packaging specialist (3) Corrugated board / Packaging producer 27min
8 Technical manager Corrugated board / Packaging producer 49min
9 Owner Corrugated board / Packaging producer e-mail
10 Sales director (2) Corrugated board / Packaging producer 46min
11 Sales director (3) Corrugated board / Packaging producer e-mail
12 Market development director Corrugated board / Packaging producer 37min
1 Packaging development Retailer / Brand owner 54min
2 Packaging procurement Retailer / Brand owner 44min
3 E-commerce manager (1) Retailer / Brand owner 40min
4 E-commerce development Retailer / Brand owner 56min
5 Packaging engineer Retailer / Brand owner 58min
6 Head of e-commerce logistics Retailer / Brand owner 45min
7 Supply chain manager Retailer / Brand owner 35min
8 Packaging research and development Retailer / Brand owner 48min
1 Researcher Association 40min
2 Senior researcher Association 52min
3 Managing director (4) Association 58min
4 Policy officer Association 39min
5 Managing director (5) Association 64min
6 Consultant (1) Association 44min
7 Policy advisor Association e-mail
1 E-commerce manager (2) Other 59min
2 Industry segment manager Other 69min
Total 29
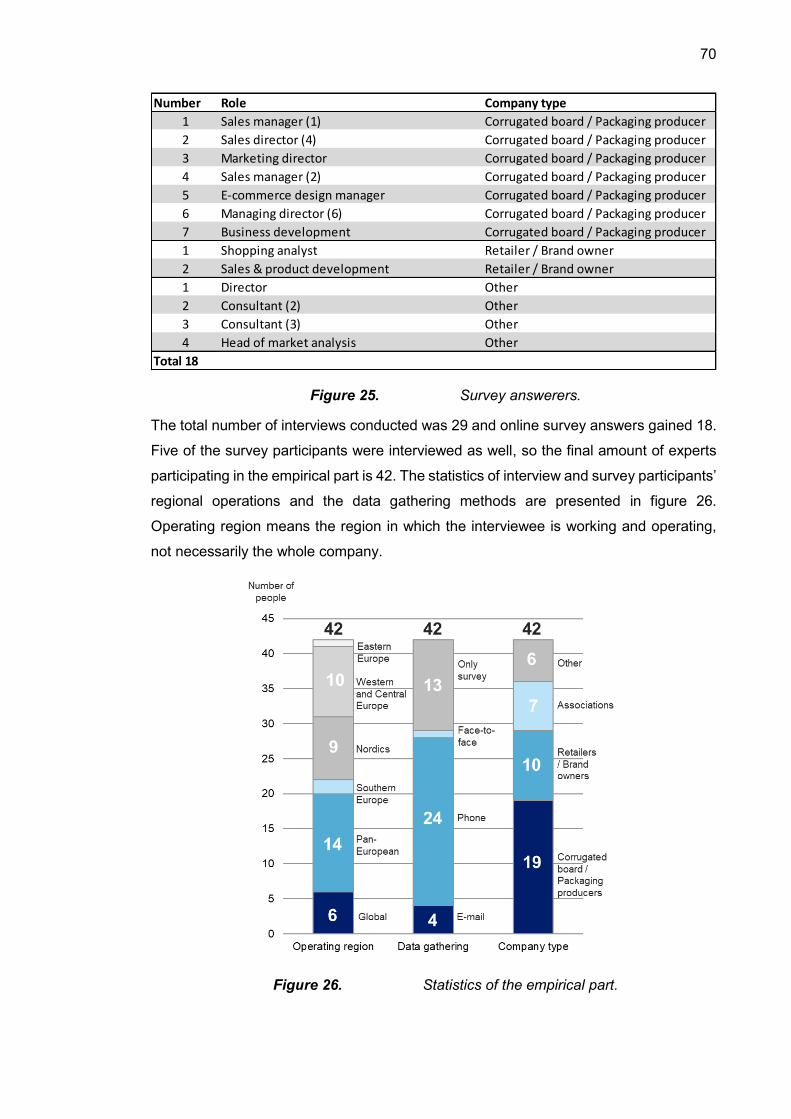
70
Figure 25. Survey answerers.
The total number of interviews conducted was 29 and online survey answers gained 18.
Five of the survey participants were interviewed as well, so the final amount of experts
participating in the empirical part is 42. The statistics of interview and survey participants’
regional operations and the data gathering methods are presented in figure 26.
Operating region means the region in which the interviewee is working and operating,
not necessarily the whole company.
Figure 26. Statistics of the empirical part.
Number Role Company type
1 Sales manager (1) Corrugated board / Packaging producer
2 Sales director (4) Corrugated board / Packaging producer
3 Marketing director Corrugated board / Packaging producer
4 Sales manager (2) Corrugated board / Packaging producer
5 E-commerce design manager Corrugated board / Packaging producer
6 Managing director (6) Corrugated board / Packaging producer
7 Business development Corrugated board / Packaging producer
1 Shopping analyst Retailer / Brand owner
2 Sales & product development Retailer / Brand owner
1 Director Other
2 Consultant (2) Other
3 Consultant (3) Other
4 Head of market analysis Other
Total 18
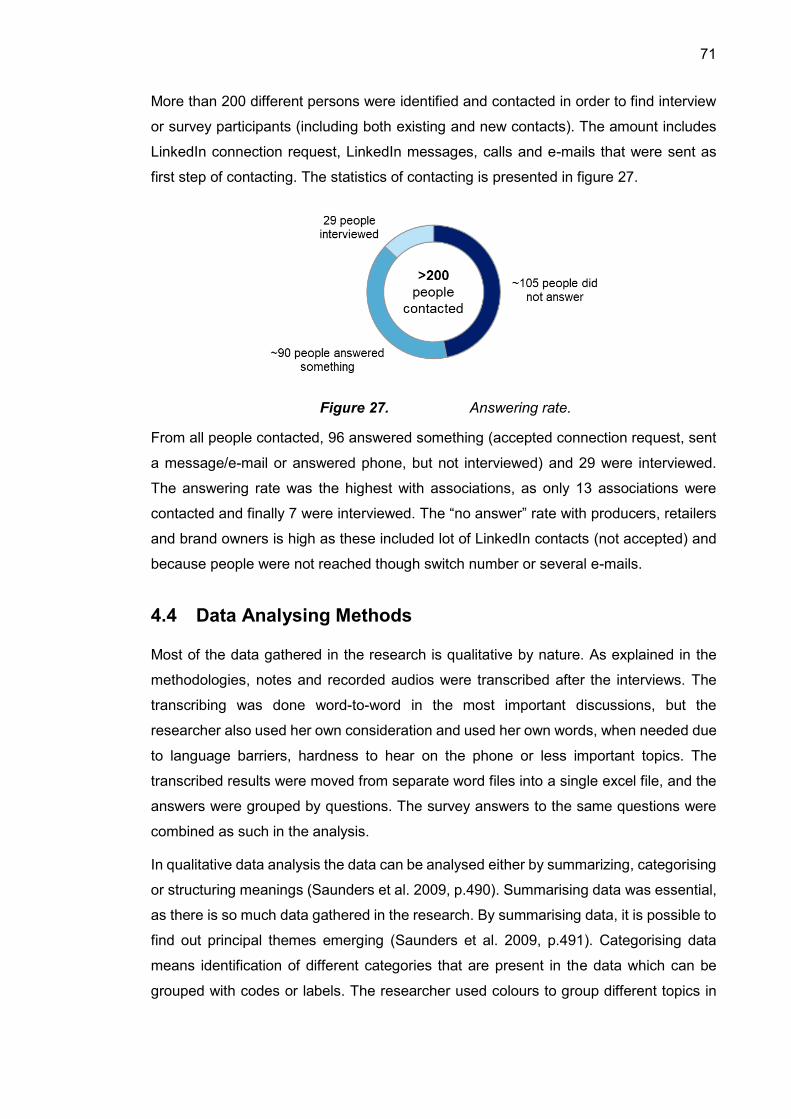
71
More than 200 different persons were identified and contacted in order to find interview
or survey participants (including both existing and new contacts). The amount includes
LinkedIn connection request, LinkedIn messages, calls and e-mails that were sent as
first step of contacting. The statistics of contacting is presented in figure 27.
Figure 27. Answering rate.
From all people contacted, 96 answered something (accepted connection request, sent
a message/e-mail or answered phone, but not interviewed) and 29 were interviewed.
The answering rate was the highest with associations, as only 13 associations were
contacted and finally 7 were interviewed. The “no answer” rate with producers, retailers
and brand owners is high as these included lot of LinkedIn contacts (not accepted) and
because people were not reached though switch number or several e-mails.
4.4 Data Analysing Methods
Most of the data gathered in the research is qualitative by nature. As explained in the
methodologies, notes and recorded audios were transcribed after the interviews. The
transcribing was done word-to-word in the most important discussions, but the
researcher also used her own consideration and used her own words, when needed due
to language barriers, hardness to hear on the phone or less important topics. The
transcribed results were moved from separate word files into a single excel file, and the
answers were grouped by questions. The survey answers to the same questions were
combined as such in the analysis.
In qualitative data analysis the data can be analysed either by summarizing, categorising
or structuring meanings (Saunders et al. 2009, p.490). Summarising data was essential,
as there is so much data gathered in the research. By summarising data, it is possible to
find out principal themes emerging (Saunders et al. 2009, p.491). Categorising data
means identification of different categories that are present in the data which can be
grouped with codes or labels. The researcher used colours to group different topics in
72
an Excel file, to find out emerging topics. Structuring meanings was essential, while trying
to understand a big picture. As the research approach is abductive, both testing theories
and creating theories are aimed. The aim of this research was to gain a broad overview
of e-commerce packaging market and by combining meanings from individual answers,
the researcher structured a broad view of a specific topic (i.e. corrugated box
development or impact of e-commerce on packaging supply). This was essential as
single answers were not enough to describe the broad view and cause-relationship.
As well, quantitative data was gathered in the research by asking quantitative question
such as shares (%) and different parameters from non-important (1) to very important
(5). This data is numerical, so it was analysed quantitatively with the help of Excel. With
numerical and continuous data, it is useful to present the central tendency and dispersion
of the answers to understand and compare the values (Saunders et al. 2009, p.447).
With average answers and deviation, the common view of the topic and numerical results
were presented.
Qualitative research data was analysed both qualitatively and quantitatively. By
categorising qualitative data, it is possible to analyse the results quantitatively and thus
create quantitative results (Saunders et al. 2009, p. 492). Categorical data can be
dichotomous data (only two categories), nominal data (multiple categories) or ordinal
data (possible to create ranked order between categories). Dichotomous data was
gathered from questions where was only two possible answers. For example, when
asking “Do you see that corrugator hubs need to follow online giants to be able to react
to faster delivery times?” it was possible to find two answers – “yes” and “no”. On the
other hand, when asking ”What are the preferred properties for liners used in e-
commerce?” it was possible to gain nominal data and multiple categories. Ordinal and
categorised data was gained with question “In your opinion, is corrugated packaging
going to lose or gain share for substitute materials in e-commerce packaging?”. These
types of qualitative research answers were analysed and presented quantitatively.
The simplest way of presenting quantitative data is table (Saunders et al. 2009, pp.431-
435). For example, importance of packaging parameters from 1-5 in different end uses
was practical to present in a table. In this case, contingency table was useful, to compare
values in different categories (Saunders et al. 2009, pp.431-439). Also bar charts and
pie charts were used to present categorised or numerical quantitative data. Bar chart
represent frequency occurrence with length of each bar. By representing relative values,
the bars may be put into descending or ascending order. Pie charts on the other hand,
can be used to show proportions of a total value. (Saunders et al. 2009, pp.431-435).
These are practical to use, when there is fewer amount of categories and the proportions
73
of answers are visualised. Percentage amounts are useful when presenting and
comparing values both in pie charts and bar charts (Saunders et al. 2009, p.430).
To the question “What are the preferred properties for liners used in e-commerce?” the
answers varied a lot, so there were many different categories. Even though it may not
be useful to quantitatively analyse such a broad question, the answers were visualised
in this research. To visualise all of the categories quantitatively, word cloud technique
was used. Work cloud technique works by categorising results into simple words and by
presenting the words with different fonts. The size of the font represent the number of
times the topic was mentioned, being bigger with those categories that were mentioned
more. As well, colouring different words helps to differentiate categories.
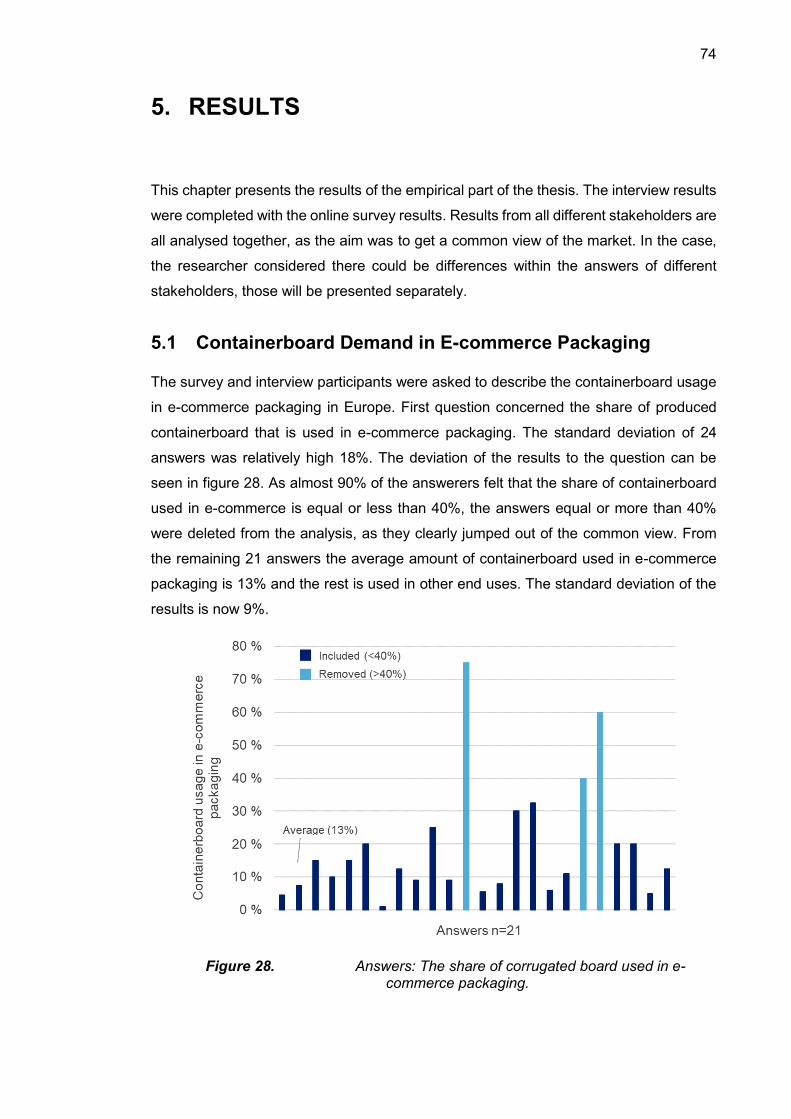
74
5. RESULTS
This chapter presents the results of the empirical part of the thesis. The interview results
were completed with the online survey results. Results from all different stakeholders are
all analysed together, as the aim was to get a common view of the market. In the case,
the researcher considered there could be differences within the answers of different
stakeholders, those will be presented separately.
5.1 Containerboard Demand in E-commerce Packaging
The survey and interview participants were asked to describe the containerboard usage
in e-commerce packaging in Europe. First question concerned the share of produced
containerboard that is used in e-commerce packaging. The standard deviation of 24
answers was relatively high 18%. The deviation of the results to the question can be
seen in figure 28. As almost 90% of the answerers felt that the share of containerboard
used in e-commerce is equal or less than 40%, the answers equal or more than 40%
were deleted from the analysis, as they clearly jumped out of the common view. From
the remaining 21 answers the average amount of containerboard used in e-commerce
packaging is 13% and the rest is used in other end uses. The standard deviation of the
results is now 9%.
Figure 28. Answers: The share of corrugated board used in e-commerce packaging.
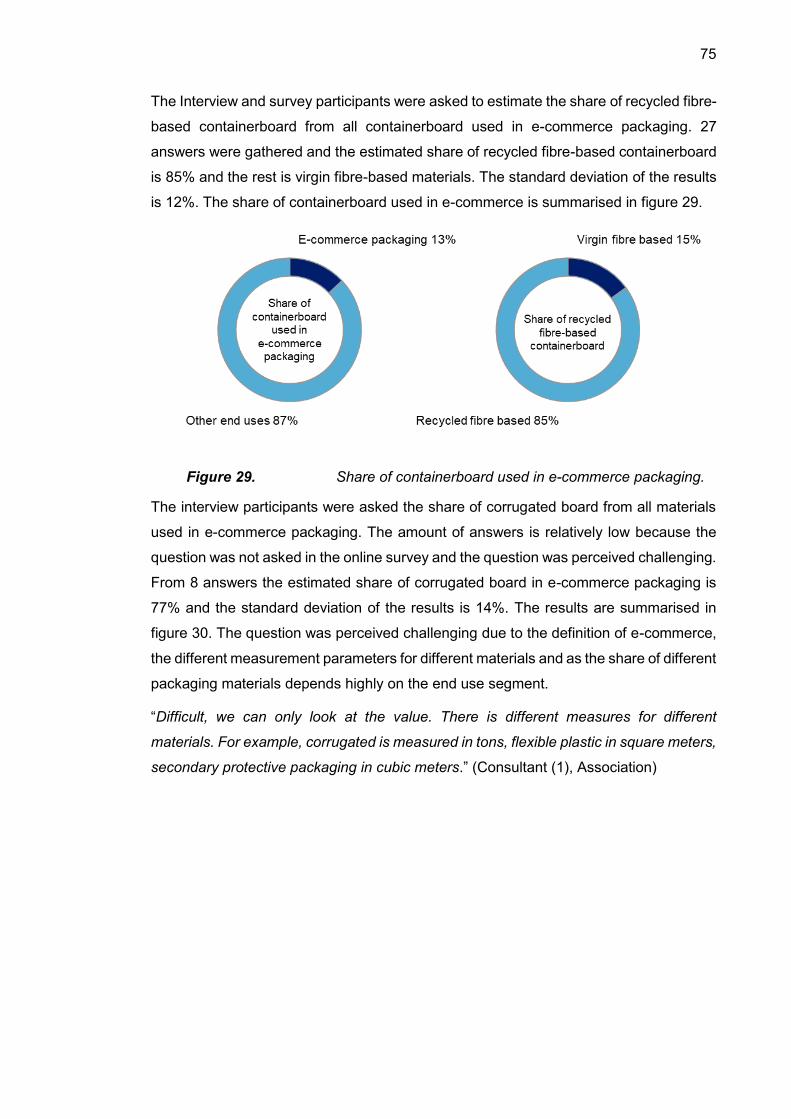
75
The Interview and survey participants were asked to estimate the share of recycled fibre-
based containerboard from all containerboard used in e-commerce packaging. 27
answers were gathered and the estimated share of recycled fibre-based containerboard
is 85% and the rest is virgin fibre-based materials. The standard deviation of the results
is 12%. The share of containerboard used in e-commerce is summarised in figure 29.
Figure 29. Share of containerboard used in e-commerce packaging.
The interview participants were asked the share of corrugated board from all materials
used in e-commerce packaging. The amount of answers is relatively low because the
question was not asked in the online survey and the question was perceived challenging.
From 8 answers the estimated share of corrugated board in e-commerce packaging is
77% and the standard deviation of the results is 14%. The results are summarised in
figure 30. The question was perceived challenging due to the definition of e-commerce,
the different measurement parameters for different materials and as the share of different
packaging materials depends highly on the end use segment.
“Difficult, we can only look at the value. There is different measures for different
materials. For example, corrugated is measured in tons, flexible plastic in square meters,
secondary protective packaging in cubic meters.” (Consultant (1), Association)
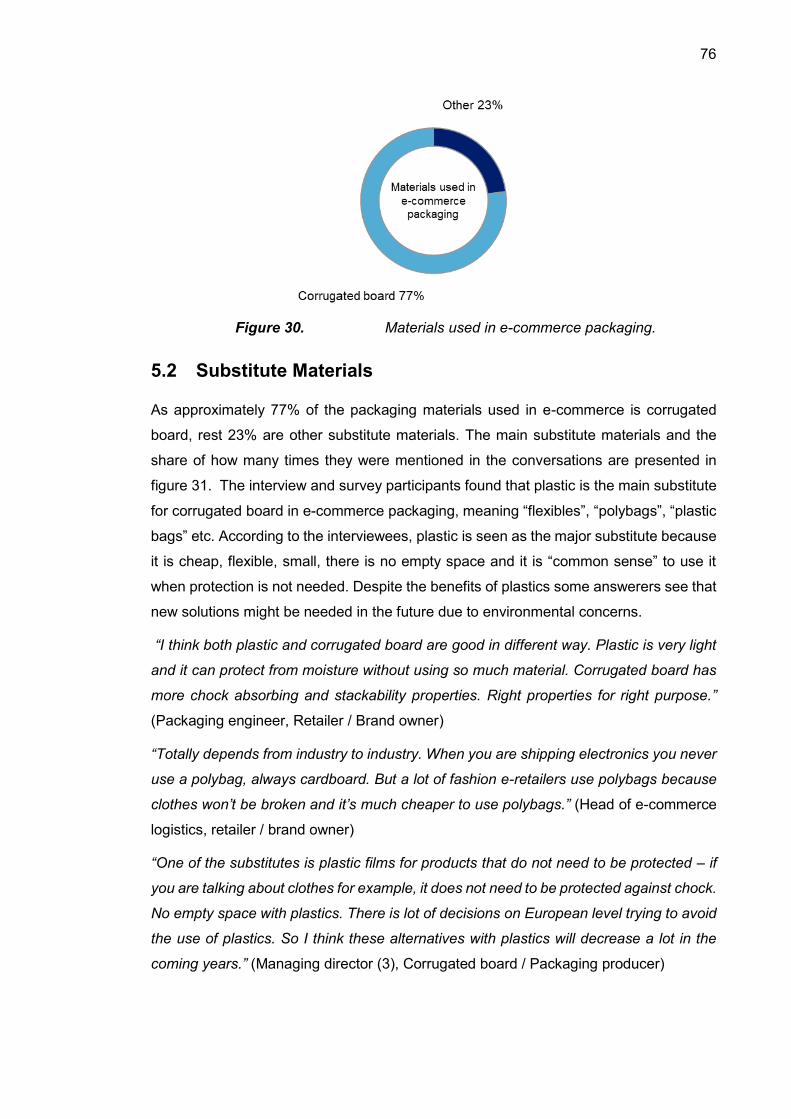
76
Figure 30. Materials used in e-commerce packaging.
5.2 Substitute Materials
As approximately 77% of the packaging materials used in e-commerce is corrugated
board, rest 23% are other substitute materials. The main substitute materials and the
share of how many times they were mentioned in the conversations are presented in
figure 31. The interview and survey participants found that plastic is the main substitute
for corrugated board in e-commerce packaging, meaning “flexibles”, “polybags”, “plastic
bags” etc. According to the interviewees, plastic is seen as the major substitute because
it is cheap, flexible, small, there is no empty space and it is “common sense” to use it
when protection is not needed. Despite the benefits of plastics some answerers see that
new solutions might be needed in the future due to environmental concerns.
“I think both plastic and corrugated board are good in different way. Plastic is very light
and it can protect from moisture without using so much material. Corrugated board has
more chock absorbing and stackability properties. Right properties for right purpose.”
(Packaging engineer, Retailer / Brand owner)
“Totally depends from industry to industry. When you are shipping electronics you never
use a polybag, always cardboard. But a lot of fashion e-retailers use polybags because
clothes won’t be broken and it’s much cheaper to use polybags.” (Head of e-commerce
logistics, retailer / brand owner)
“One of the substitutes is plastic films for products that do not need to be protected – if
you are talking about clothes for example, it does not need to be protected against chock.
No empty space with plastics. There is lot of decisions on European level trying to avoid
the use of plastics. So I think these alternatives with plastics will decrease a lot in the
coming years.” (Managing director (3), Corrugated board / Packaging producer)
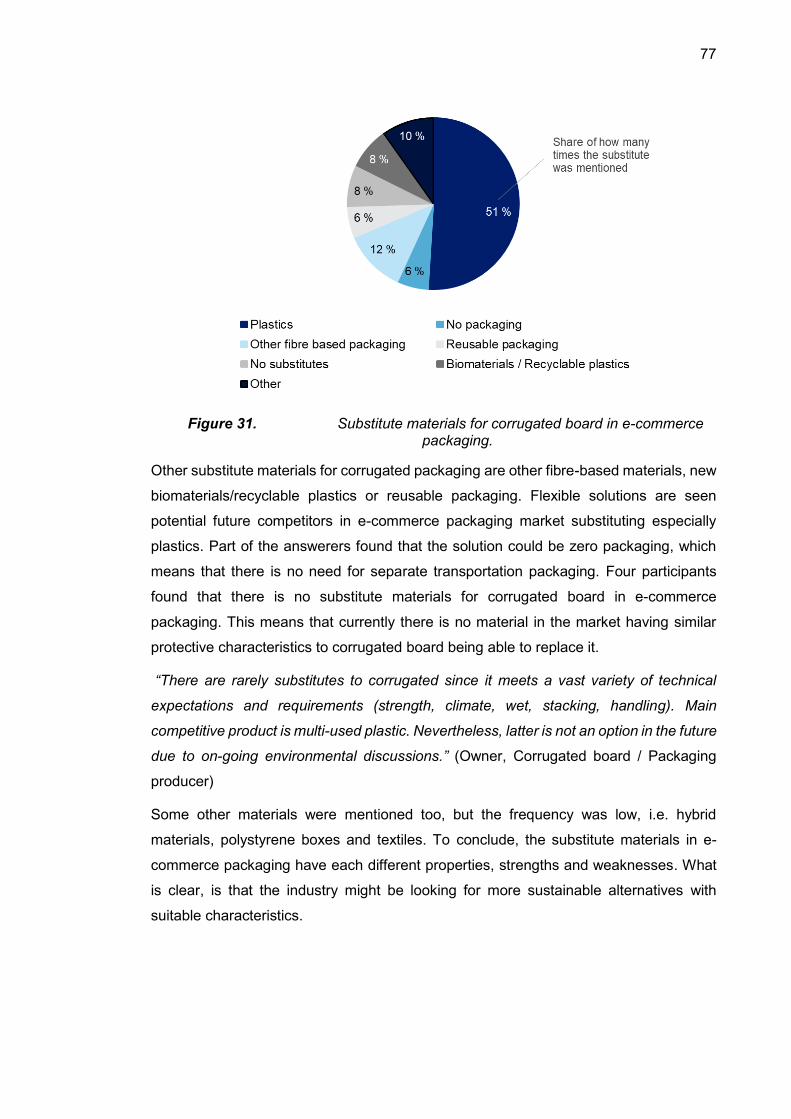
77
Figure 31. Substitute materials for corrugated board in e-commerce packaging.
Other substitute materials for corrugated packaging are other fibre-based materials, new
biomaterials/recyclable plastics or reusable packaging. Flexible solutions are seen
potential future competitors in e-commerce packaging market substituting especially
plastics. Part of the answerers found that the solution could be zero packaging, which
means that there is no need for separate transportation packaging. Four participants
found that there is no substitute materials for corrugated board in e-commerce
packaging. This means that currently there is no material in the market having similar
protective characteristics to corrugated board being able to replace it.
“There are rarely substitutes to corrugated since it meets a vast variety of technical
expectations and requirements (strength, climate, wet, stacking, handling). Main
competitive product is multi-used plastic. Nevertheless, latter is not an option in the future
due to on-going environmental discussions.” (Owner, Corrugated board / Packaging
producer)
Some other materials were mentioned too, but the frequency was low, i.e. hybrid
materials, polystyrene boxes and textiles. To conclude, the substitute materials in e-
commerce packaging have each different properties, strengths and weaknesses. What
is clear, is that the industry might be looking for more sustainable alternatives with
suitable characteristics.
78
5.3 E-commerce Packaging Trends and Drivers
The interview participants were asked the major trends, opportunities and challenges
that are impacting corrugated packaging and containerboard demand in e-commerce
packaging. In this section, the trends and demand drivers in the e-commerce packaging
market are introduced. First market trends are explained, and then corrugated packaging
development is introduced.
Market Trends
According to the discussions, market drivers impacting containerboard demand in e-
commerce packaging are:
economic situation
substitution with plastics
price competition
development of e-commerce market
growth of e-food
policies
power of big retailers
sustainability.
The overall economic situation is a driver that have both positive and negative impact on
corrugated packaging and containerboard demand. GDP growth indicates more
consumption and more packaging demand, while recession means that less packaging
is needed.
“If Europe maintains GDP growth – corrugated will grow. Threat is the upcoming 2020
recession – companies will be requiring less packaging.” (Sales director (1) / Corrugated
board / Packaging producer)
Substitution and competition in the market are having an impact on containerboard
demand. Corrugated packaging is most often competing with plastics, and it is seen that
anti-plastic movement (due to plastics littering) is impacting the competition between
packaging materials. Price competition is a driver that always has an impact on
packaging demand. Cheaper packaging solutions with similar performance could be
threat. As well, if the market is maturing, the cost pressure might have an effect on the
whole supply chain.
“E-commerce is growing and maturing market – cost pressure on all parts of the supply
chain. We will see cost pressure on materials, including corrugated board” (Supply chain
manager, Retailer / Brand owner)
79
E-commerce market development is one of the most important drivers in e-commerce
packaging demand. This means simply that people moving from B&M to e-commerce,
creates the e-commerce packaging demand. Future end use development in different
product categories was asked from the interview participants, and they noticed that
especially clothes and electronics maintain their growth, but future potential could lie in
groceries business. The total sales volumes in groceries and food are high, so even
slight increase in groceries e-commerce will affect the demand greatly. Two interview
participants, who had knowledge on food business, explained that e-food business is
only some percentages of total sales of groceries in Europe. With share of 5-6% of total
sales in France and 6-8% in UK, Western European countries are leading in e-food sales.
In other countries online sales of groceries and food is often less, being 0.5-3% of sales
in countries such as Sweden, Finland, Germany and Italy. However, what seems to be
challenging e-food business is the need of preservation in supply chain and the trust of
customers, as they cannot feel or see the product before the purchase.
Policies are most likely going to have an impact on containerboard demand, and this
concerns especially sustainability issues. The impacts could be both positive and
negative, depending on the focus of the policies. It is seen that the current European
level packaging discussion is about recyclability of materials as well as decrease of
packaging waste. Some of the measures may advance corrugated packaging demand
as it is recyclable, but at the same time the regulations may force to plastic industry to
create more sustainable or recyclable packaging alternatives and thus create threat for
corrugated packaging.
Amazon was mentioned in some point in almost all the interviews conducted for the
research, even though there was no questions about the players in the market. This
explains how big role Amazon has in the market and how big impact their choices and
decisions have in people’s mind. Big online retailers have power in the market and their
packaging development and decisions are followed. Big online retailers also create
pressure and bargaining power over packaging suppliers, as they may have so big
volumes.
Sustainability
Sustainability was mentioned mostly when asking about drivers impacting corrugated
packaging demand. The trend is also strongly linked to anti-plastic movement, as there
are environmental concerns going on about plastics polluting the environment. In
general, the survey and interview participants were seeing that the ongoing sustainability
issues and discussion are benefitting corrugated packaging demand. Corrugated
80
packaging has better image in people’s mind in terms of environment and sustainability.
Big driver affecting this view is the recycling rate of the material, especially compared to
the plastic alternative.
“When you are looking into sustainability aspects, it becomes a big advance for
corrugated industry. The difference between plastics and corrugated is recycling. We are
producing 100% recycled paper, so we recycle corrugated effectively. Plastic, it is
possible to recycle, but in fact it’s not recycled as it’s not collected, and when it’s collected
it’s not really separated. Plastic is recycled to 15-20%.” (Managing director (3),
Corrugated board / Packaging producer)
“Paper and cardboard have very good track record in terms of been separately collected
and recycled. Plastic is one of the materials with the lowest recycling rates – tempting to
go towards cardboard in the future.” (Policy officer, Associations)
“Corrugated board have advantage in sustainable development and circular economy. It
has already 93% rate of recycled content. Hardly any material can compete with that.”
(Managing director (4), Association)
There are still challenges, when it comes to corrugated packaging and sustainability.
Answerers mentioned that customers are more and more critical about the materials and
overpackaging. In the future, this may result reduction in packaging size and material
usage. Also, one challenge linked to the recyclability, is that there should not be too many
elements in corrugated packaging material, because it makes the recycling more
challenging. Regarding the overpacking, some of the interview participants were asked
how they see the development of void fill usage. The trend is to try to minimize the
packaging size so that less void fill would be needed. Some participants also answered
that the plastic based void fill could be replaced by fibre-based one.
What came up in couple of the conversations, is that the assumptions of what is
environmentally friendly and what is not, are not the whole truth. When looking at the
whole life cycle of corrugated packaging, it requires energy, water and trees to be
produced. The material seems sustainable because it is recyclable and it is recycled, but
what is really the most sustainable alternative in terms of LCA remains a question mark.
On the other hand, it was mentioned that product protection is part of sustainability, as
product damage is the least sustainable option.
“When you talk about sustainability, you never ever should look only the pure material
and recyclability. You should look also LCA. With LCA approach the aim is to reduce
carbon, gasoline, energy, food waste etc. That is sustainable.” (E-commerce manager /
Other)
81
Some answerers reminded that the situation with anti-plastic movement has been
received free, and it does not mean that corrugated board is automatically the best
alternative. Answerers also found that plastics are not as bad as they are perceived by
consumers, and that plastic industry might be seeking their solutions to overcome the
current littering problems.
“The fact that your competitor is in trouble, does it make you better? Relatively yes, but
absolutely no. Therefore, the industry should be ambitious to strive for better all the time.”
(Managing director (5), Association)
“Forest industry has cleaned its mess. Same has not happened with plastic industry,
and that’s why we have this plastic trash problem. At this point, in short term, fibre is the
winner. But plastics will learn to solve its problems too, when it is forced to.” (Managing
director (4), Association)
“Right now the debate about plastics is a little bit wrong. People are scared of plastics
and they don’t understand plastics. They see plastics only as one material even though
there are many materials. Some are really bad and some really good.” (Packaging
engineer, Retailer / Brand owner)
Circular economy is as well linked to sustainability. Circular economy means the increase
of closed loop material usage, potentially benefitting reusable (and recyclable)
packaging. New reusable packaging might be a threat for corrugated packaging, as
reusable packaging is used multiple times. On the other hand, it was mentioned that in
European level interest is more in the recyclable materials than in circular economy. The
challenge with reusable packaging will be its cost (cleaning, non-returning).
“Packaging waste is increasing – growing problem. If we want to limit the amount, it’s
quite clear that from the environmental point of view this can’t continue. Increase and
improve of recycling is needed, but still the problem is in the absolute amount of waste
being generated.” (Policy officer, Association)
What is challenging in terms of sustainability is the cost-sustainability relationship. This
is challenging especially plastics, as plastics are cost competitive and flexible, but at the
same time more sustainable alternatives are required. One retailer answered the
question about the sustainability as:
“Have 100% influence on packaging decision in every degree. Solutions will be found,
but the question is that how you want to pay for that? Sustainability is not free, you have
to pay.” (Packaging procurement, Retailer / Brand owner)
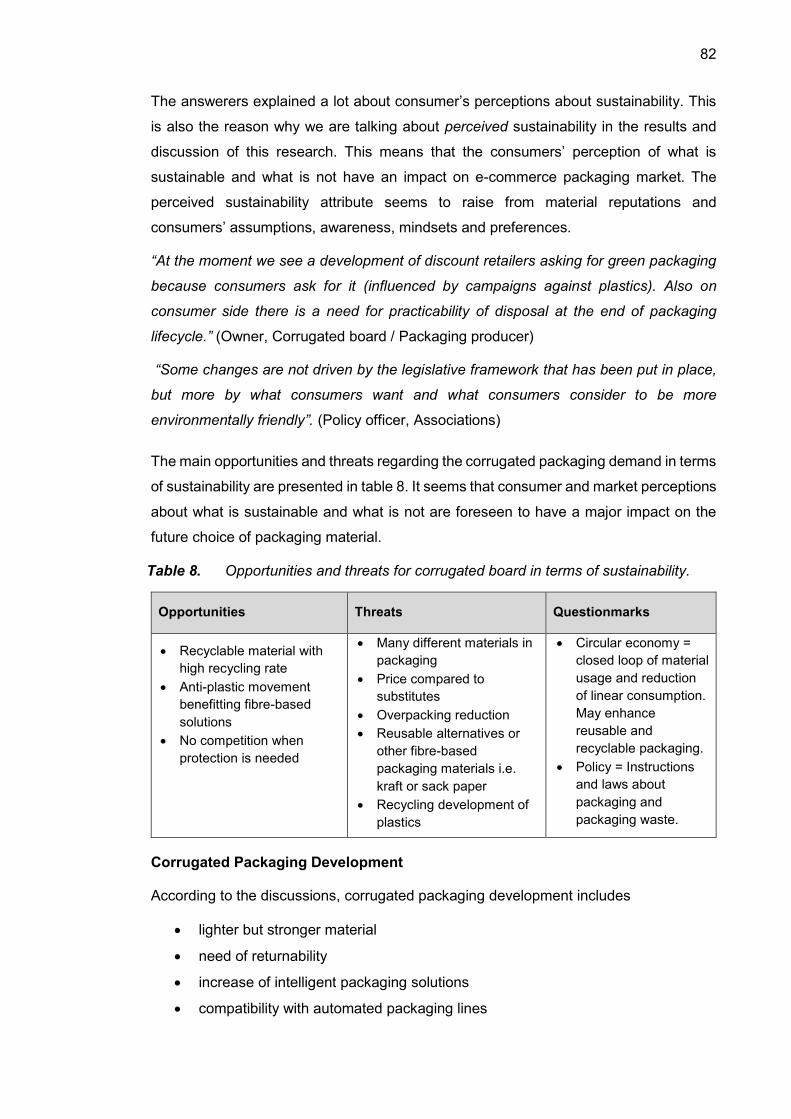
82
The answerers explained a lot about consumer’s perceptions about sustainability. This
is also the reason why we are talking about perceived sustainability in the results and
discussion of this research. This means that the consumers’ perception of what is
sustainable and what is not have an impact on e-commerce packaging market. The
perceived sustainability attribute seems to raise from material reputations and
consumers’ assumptions, awareness, mindsets and preferences.
“At the moment we see a development of discount retailers asking for green packaging
because consumers ask for it (influenced by campaigns against plastics). Also on
consumer side there is a need for practicability of disposal at the end of packaging
lifecycle.” (Owner, Corrugated board / Packaging producer)
“Some changes are not driven by the legislative framework that has been put in place,
but more by what consumers want and what consumers consider to be more
environmentally friendly”. (Policy officer, Associations)
The main opportunities and threats regarding the corrugated packaging demand in terms
of sustainability are presented in table 8. It seems that consumer and market perceptions
about what is sustainable and what is not are foreseen to have a major impact on the
future choice of packaging material.
Opportunities Threats Questionmarks
Recyclable material with
high recycling rate
Anti-plastic movement
benefitting fibre-based
solutions
No competition when
protection is needed
Many different materials in
packaging
Price compared to
substitutes
Overpacking reduction
Reusable alternatives or
other fibre-based
packaging materials i.e.
kraft or sack paper
Recycling development of
plastics
Circular economy =
closed loop of material
usage and reduction
of linear consumption.
May enhance
reusable and
recyclable packaging.
Policy = Instructions
and laws about
packaging and
packaging waste.
Corrugated Packaging Development
According to the discussions, corrugated packaging development includes
lighter but stronger material
need of returnability
increase of intelligent packaging solutions
compatibility with automated packaging lines
Table 8. Opportunities and threats for corrugated board in terms of sustainability.
83
need of appearance and printability
overpackaging reduction/right size packaging.
Lighter but stronger material is a trend which means that more properties are required
from containerboard without adding material, or even less material. This requires
improvements on packaging strength. If lighter weight containerboard is required in e-
commerce packaging, this could affect the demand negatively. E-commerce creates
need of packaging returnability, as products cannot be experienced before purchase.
This means that easy opening and reclosing properties are needed from e-commerce
packaging.
In e-commerce, retailers are increasingly requiring packaging that is possible to adapt
into automated packaging processes. The aim is to reduce manual work. As well, there
is aim to find packaging solutions and technologies that are able to connect systems and
packaging. This means intelligent packaging solutions, for example order tracking.
Packaging appearance and printing requirements divided options in the interviews. Part
of the people see that packaging will become more part of the product and more
appearance and printability will be required:
“The inside will be the new outside.” (Sales Director (1), Corrugated board / Packaging
producer)
“The boxes used to be just for shipping – now things have changed: packaging is part
of the product – it is more than what we asked five years ago and is less that what we
are going to ask in five years from now” (E-commerce packaging specialist (1),
Corrugated board / Packaging producer)
Yet, some of the answerers find that there is no need for visual appearance or printing,
for example due to low marketing role of the packaging or sustainability aspects. There
is no right or wrong answer to the question, and most likely both options will be seen in
the future: simple brown box for transportation purposes, as well as branded and printed
boxes enhancing marketing and consumer experience.
“At this point there is no more need of an e.g. colourful designed sales packaging since
sales decision has already been done.” (Owner, Corrugated board / Packaging producer)
“Sustainability – that means that it has to be 100% recycled, no colour, no print, no glue,
100% green.” (Head of e-commerce logistics, Retailer / Brand owner)
Overpackaging reduction is one of the most important future trends for corrugated
packaging. The challenge with corrugated packaging is often shipping empty air and
having too much packaging material. This means that packaging should be smaller,
84
include less material and less empty space. Often, consumers does not like if their
products are shipped in too big boxes:
“Consumers are being more critical on what they are receiving home so it’s more
important not to under pack or over pack but do the right size packaging.” (E-commerce
packaging specialist (2), Corrugated board / Packaging producer)
Standard sized boxes are often a challenge when it comes to overpackaging, but they
are valued due to their stackability and ease of transporting. They are also cheaper as
they are bulk boxes. Still, more packaging size options and fit-to-product packaging could
be seen in the future and the trend is driven by sustainability discussion and
customization. Challenge with fit-to-product packaging is that it can be hard to predict
what the consumer orders.
“Standard sized is for small side businesses. Bigger businesses will not use standard
sized - they will have a lot of sizes. The more e-commerce is used, the more people are
requiring special sizes for their products.” (Managing director (2), Corrugated board /
Packaging producer)
“We have standard sized, but looking at our range of products, it is very difficult to have
standardized – you never know what the customer will order” (Packaging development,
Retailer / Brand owner)
With fit-to-product cases, the aim is to reduce this empty air and need for void fill to
prevent the movement in the packaging. Fit-to-product solutions and machines could be
seen more in the future. This can be for example a machine that measures the
dimensions of the product and creates packaging accordingly. Answerers emphasize
that some of the solutions of multiple packaging sizes or fit-to-product solutions are
making sense only for larger scale companies. One reason is cost, because machines
and packaging development require investments.
“Boxes can be made fit-to-product with packaging line that measures the product and
cuts the package accordingly. I think much more of these will develop in the future. There
will be also more standard packaging options for smaller retailers with few products. But
if it is a big retailer like Amazon, they are able to develop packaging according to the
measures.” (Managing director (4), Association)
“Only if the offer change and it will become clearly cheaper to use various sizes instead
of just one standard format, and if the the technical solutions for on-demand boxes
become more affordable.” (Policy advisor, Association)
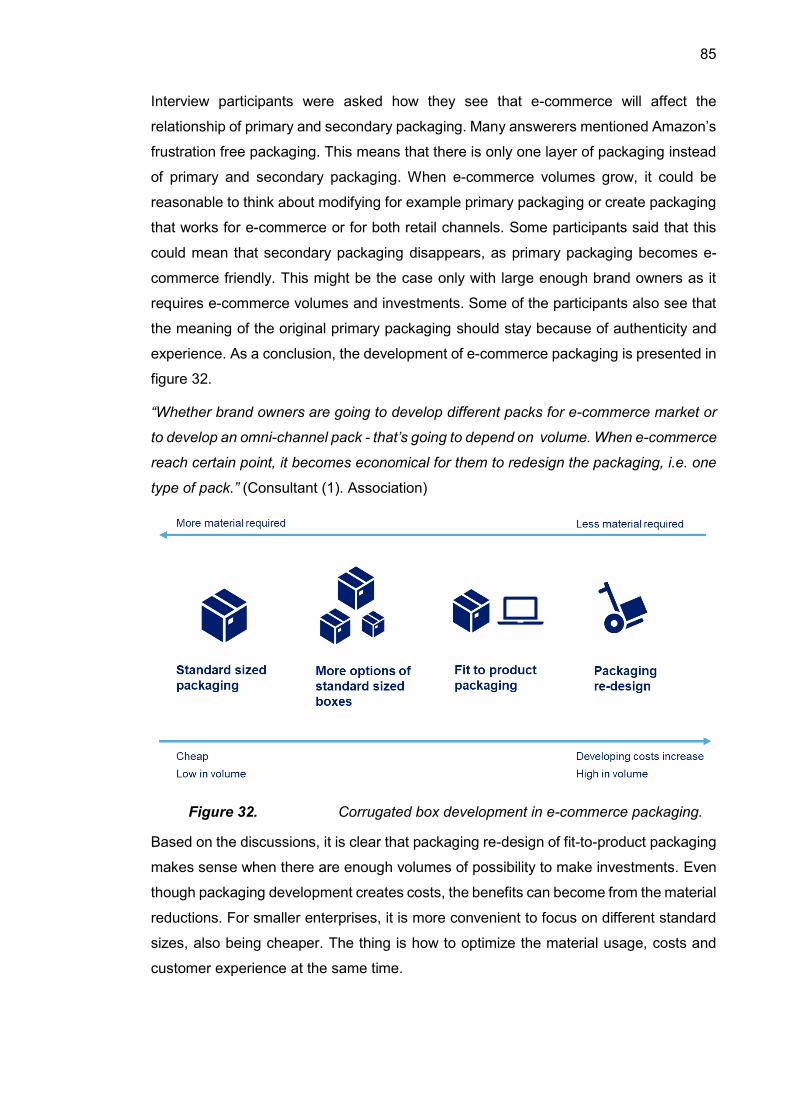
85
Interview participants were asked how they see that e-commerce will affect the
relationship of primary and secondary packaging. Many answerers mentioned Amazon’s
frustration free packaging. This means that there is only one layer of packaging instead
of primary and secondary packaging. When e-commerce volumes grow, it could be
reasonable to think about modifying for example primary packaging or create packaging
that works for e-commerce or for both retail channels. Some participants said that this
could mean that secondary packaging disappears, as primary packaging becomes e-
commerce friendly. This might be the case only with large enough brand owners as it
requires e-commerce volumes and investments. Some of the participants also see that
the meaning of the original primary packaging should stay because of authenticity and
experience. As a conclusion, the development of e-commerce packaging is presented in
figure 32.
“Whether brand owners are going to develop different packs for e-commerce market or
to develop an omni-channel pack - that’s going to depend on volume. When e-commerce
reach certain point, it becomes economical for them to redesign the packaging, i.e. one
type of pack.” (Consultant (1). Association)
Figure 32. Corrugated box development in e-commerce packaging.
Based on the discussions, it is clear that packaging re-design of fit-to-product packaging
makes sense when there are enough volumes of possibility to make investments. Even
though packaging development creates costs, the benefits can become from the material
reductions. For smaller enterprises, it is more convenient to focus on different standard
sizes, also being cheaper. The thing is how to optimize the material usage, costs and
customer experience at the same time.
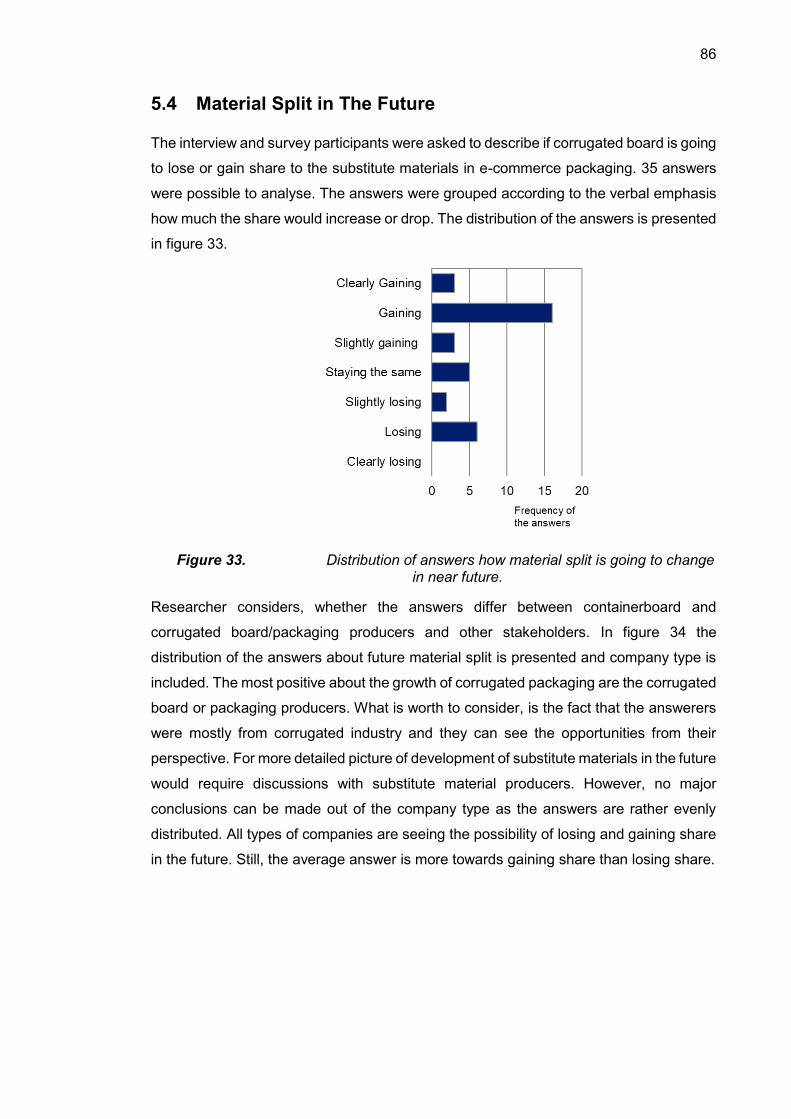
86
5.4 Material Split in The Future
The interview and survey participants were asked to describe if corrugated board is going
to lose or gain share to the substitute materials in e-commerce packaging. 35 answers
were possible to analyse. The answers were grouped according to the verbal emphasis
how much the share would increase or drop. The distribution of the answers is presented
in figure 33.
Figure 33. Distribution of answers how material split is going to change in near future.
Researcher considers, whether the answers differ between containerboard and
corrugated board/packaging producers and other stakeholders. In figure 34 the
distribution of the answers about future material split is presented and company type is
included. The most positive about the growth of corrugated packaging are the corrugated
board or packaging producers. What is worth to consider, is the fact that the answerers
were mostly from corrugated industry and they can see the opportunities from their
perspective. For more detailed picture of development of substitute materials in the future
would require discussions with substitute material producers. However, no major
conclusions can be made out of the company type as the answers are rather evenly
distributed. All types of companies are seeing the possibility of losing and gaining share
in the future. Still, the average answer is more towards gaining share than losing share.
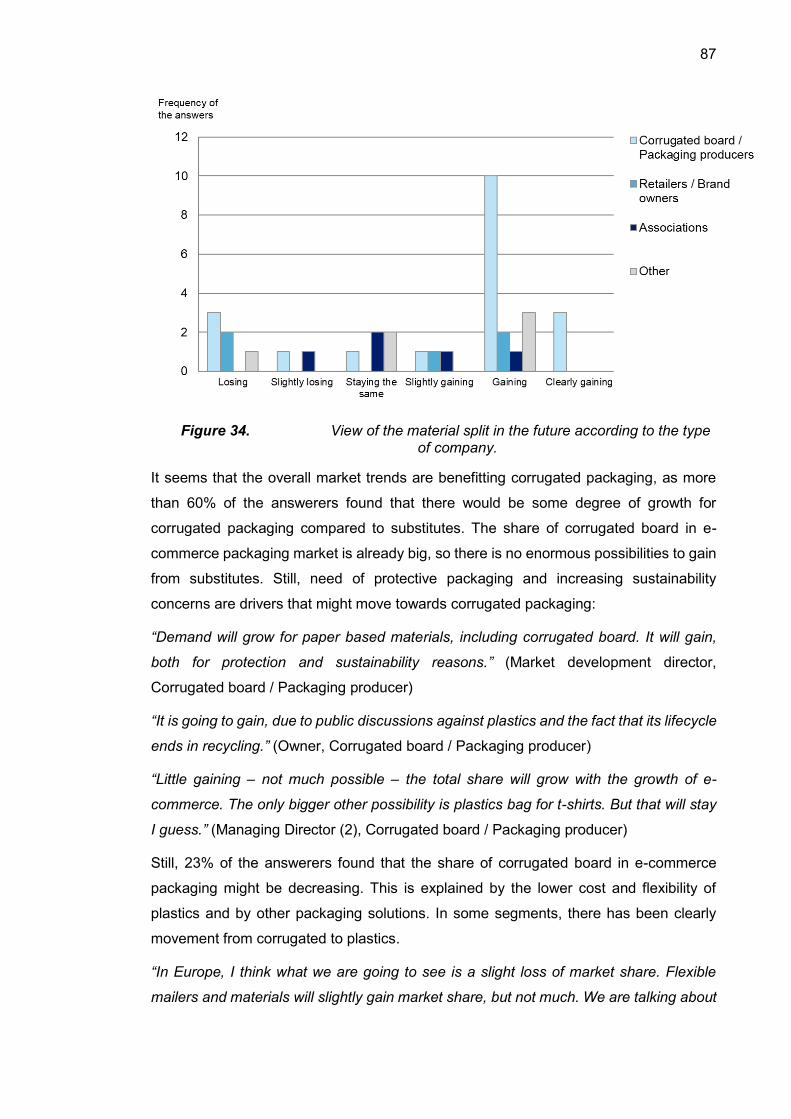
87
Figure 34. View of the material split in the future according to the type of company.
It seems that the overall market trends are benefitting corrugated packaging, as more
than 60% of the answerers found that there would be some degree of growth for
corrugated packaging compared to substitutes. The share of corrugated board in e-
commerce packaging market is already big, so there is no enormous possibilities to gain
from substitutes. Still, need of protective packaging and increasing sustainability
concerns are drivers that might move towards corrugated packaging:
“Demand will grow for paper based materials, including corrugated board. It will gain,
both for protection and sustainability reasons.” (Market development director,
Corrugated board / Packaging producer)
“It is going to gain, due to public discussions against plastics and the fact that its lifecycle
ends in recycling.” (Owner, Corrugated board / Packaging producer)
“Little gaining – not much possible – the total share will grow with the growth of e-
commerce. The only bigger other possibility is plastics bag for t-shirts. But that will stay
I guess.” (Managing Director (2), Corrugated board / Packaging producer)
Still, 23% of the answerers found that the share of corrugated board in e-commerce
packaging might be decreasing. This is explained by the lower cost and flexibility of
plastics and by other packaging solutions. In some segments, there has been clearly
movement from corrugated to plastics.
“In Europe, I think what we are going to see is a slight loss of market share. Flexible
mailers and materials will slightly gain market share, but not much. We are talking about
88
1-2% slight shift in favour for flexible plastic and mailer applications.” (Consultant (1),
Association)
“I think it will lose share to companies delivering with no packaging. And to the incredibly
cheap bags that will become recycled and recyclable.” (Sales manager (2) / Corrugated
board / Packaging producer)
In 2015, we had the share of 7% flexible and rest rigid, and now 30% flexible and rest
rigid. I’m sure that we will increase that next couple of months or years. Mainly because
of cost driver. When you are procuring flexible packaging you are able to save 3-4 times
against rigid. Also logistical efficiency, in connection to too much air topic. (Packaging
procurement, retailer / brand owner)
As plastics are facing problems, new substitute materials replacing them are most
probably seen in the future. These can be fibre-based solutions or new innovations that
have similar properties to flexible plastics (i.e. small size, flexibility). Corrugated board
have different properties as it is rigid and often more expensive. If plastics would lose
share in the market, it would benefit corrugated only marginally. Plastics would be mainly
replaced by other materials than corrugated board.
“It depend who find the best solution, it has to be flexible and similar to polybags.” (Head
of e-commerce logistics, Retailer / Brand owner)
“It is always a competition, but you have got this situation for free now. If you are using
this situation it’s a gain of 20% of the market of polybags or poly-solutions, which can be
taken over. The rest 80% will go to paper bags etc.” (Head of e-commerce logistics”
(Retailer / Brand owner)
“It might be that fibre-based materials, or some kinds of biomaterials may arise and
replace plastic. Not necessarily corrugated board, at least it is not benefitting the same
share plastic is losing.” (Sales director (2), Corrugated board / Packaging producer)
“Very good spot – you can gain some of share from polybags. But you have to be careful,
because the new upcoming companies can do similar type of solutions to polybags and
try to take part of the industry.” (Head of e-commerce logistics, Retailer / Brand owner)
“Only organic based materials will have an advantage over corrugated and plastic.”
(Supply chain manager, Retailer / Brand owner)
“Even the envelope market is changing by having more fibre-based products. I have
difficulty to see in future some plastic based packaging that could replace or have bigger
development versus fibre-based packaging, because of the very bad image of plastic.”
(Managing director (1), Corrugated board / Packaging producer)
89
“Big volumes will come from paper bags – substituting plastic bags.” (Sales director (1),
Corrugated board / Packaging producer)
“We try to replace plastic packaging with fibre-based, if it makes sense.” (Packaging
development, Brand owner / Retailer)
5.5 Packaging Material Selection Criteria
One of the aim of the research was to gain an understanding on packaging material
selection criteria, so preferred liner properties, retailers’ and brand owners’ packaging
selection criteria and end use specific packaging requirements were identified in the
empirical part of the research.
Liner Properties in E-commerce Packaging
The interview and survey participants were asked to list preferred properties for liners or
corrugated board used in e-commerce packaging. Approximately 39 different properties
were mentioned 90 times by 35 interview and survey answerers. The question was open
so lot of different properties were covered, and they were grouped according to their
nature to mechanical properties and functionality, sustainability, appearance, cost, and
convenience of handling. The mentioned properties are presented in figure 35. The
larger the size of the font, the more often the property was mentioned. From the grouped
functions, mechanical properties are the most important, followed by visual appearance
and sustainability. The interview and survey participants listed both containerboard
properties (i.e. quality requirements) and packaging properties (i.e. stackability and
oversize reduction). Most often mentioned liner properties found in the research are
strength, printability, recyclability and protection. Cost is having also great importance,
but it is not a liner or corrugated board property, but more a selection criteria.
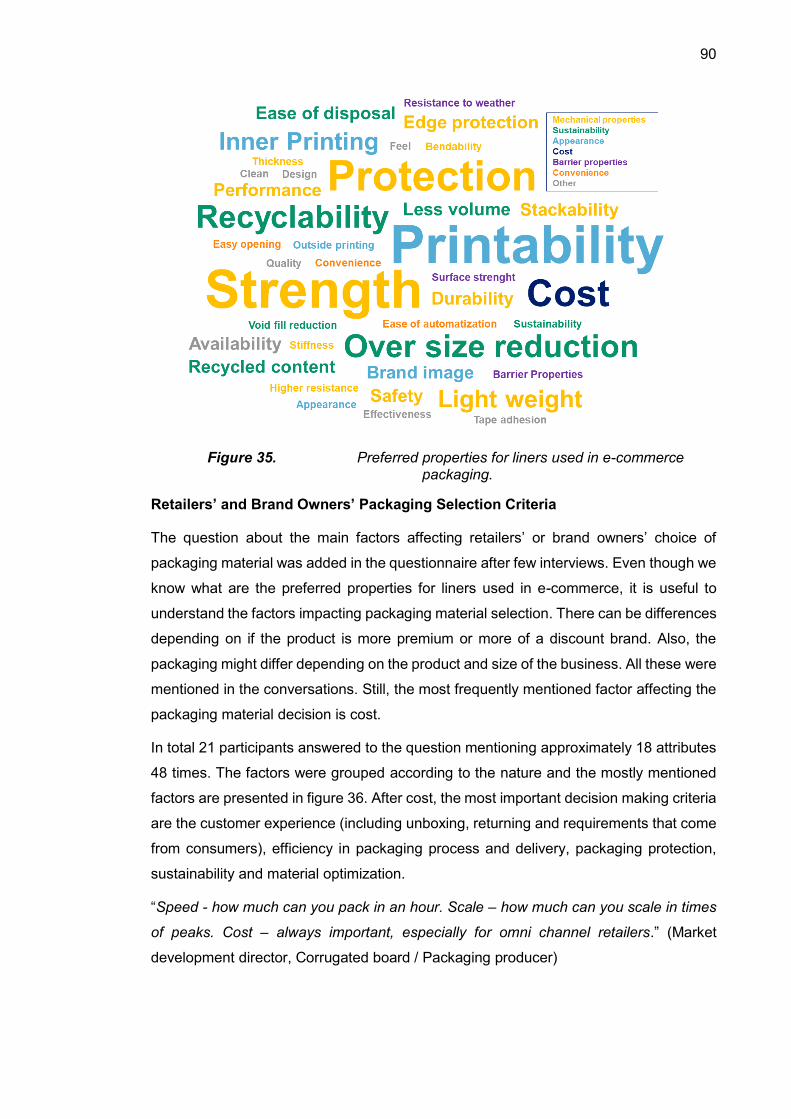
90
Figure 35. Preferred properties for liners used in e-commerce packaging.
Retailers’ and Brand Owners’ Packaging Selection Criteria
The question about the main factors affecting retailers’ or brand owners’ choice of
packaging material was added in the questionnaire after few interviews. Even though we
know what are the preferred properties for liners used in e-commerce, it is useful to
understand the factors impacting packaging material selection. There can be differences
depending on if the product is more premium or more of a discount brand. Also, the
packaging might differ depending on the product and size of the business. All these were
mentioned in the conversations. Still, the most frequently mentioned factor affecting the
packaging material decision is cost.
In total 21 participants answered to the question mentioning approximately 18 attributes
48 times. The factors were grouped according to the nature and the mostly mentioned
factors are presented in figure 36. After cost, the most important decision making criteria
are the customer experience (including unboxing, returning and requirements that come
from consumers), efficiency in packaging process and delivery, packaging protection,
sustainability and material optimization.
“Speed - how much can you pack in an hour. Scale – how much can you scale in times
of peaks. Cost – always important, especially for omni channel retailers.” (Market
development director, Corrugated board / Packaging producer)
91
“Delivery time – priority one! When we go down to packaging – the convenience aspect:
no tooling and easy returning. Also right quality – broken boxes are the worst case.”
(Packaging procurement, Retailer / Brand owner)
“Product protection coupled with perceived sustainability.” (Consultant (1), Association)
What is notable is that the visual appearance seems to be less valued than what was
seen in the preferred properties for liners used in the e-commerce packaging.
Sustainability was rated high by retailers, and it is a strong factor affecting the decision
of retailers. Again, it seems that the driving factor towards more sustainable packaging
is the end consumer.
Figure 36. Factors affecting the choice of packaging material.
End Use Specific Packaging Requirements
The interview participants were asked to estimate certain corrugated packaging
parameters from 1 (not important) to 5 (very important) in different end uses. These
answers were collected and the average importance for each parameter in each end use
was analysed. Summary of the analysis is presented in figure 37. The categories chosen
to the analysis were clothes, electronics, groceries/food, cosmetics/health care, furniture
and books. These categories were chosen because of different types of product
characteristics. According to literature most of them are often sold through e-commerce.
Most of the parameters were asked since the beginning, but after few interviews,
parameters about barrier/surface properties, brand communication, unboxing
experience and returnability were added and informativeness was removed. In total 19
interview participants gave their opinions, of which 9 were producers. Retailers and
brand owners were only asked about the end use they were familiar with.
92
In all categories, production runnability is rated very important. The least important
aspect on average is the virgin fibre content, which on the other hand means that
recycled fibre-based materials are favoured. Similar conclusion can be made out of the
importance of sustainability in all categories. Cost is seen one of the most important
factors in e-commerce packaging. The highly valued cheap price and efficient runnability
implies that the e-commerce packaging production needs to have high performance and
be cost-efficient in order to compete in the market.
Figure 37. End use specific importance of packaging parameters.
Biggest differences among the end uses can be seen in the need of printability,
appearance and brand communication, being the most important for electronics and
cosmetics. The reason can be highly branded and quality products in cosmetics and
electronics segment. It seems that when appearance and marketing become more
important for packaging, the cost attribute reduces. This could mean that when brand
communication becomes more important, there is more willingness to pay for the
packaging. It can be seen from the results that in general, appearance, printability, brand
communication and unboxing experience are often perceived similarly.
The requirements of light weight is quite important for all materials (2.9<), being the most
important for clothes and cosmetics. These are often light weight products, so also lighter
93
weight is wanted from packaging. For heavier products such as electronics, books and
furniture, light weight is not seen as important. The importance of returnability varies
across the end uses, being the most important for clothes and least important for
groceries and furniture.
Strength and stiffness have variance among the end uses. For electronics, furniture and
groceries high protection is often required and this supports the demand of corrugated
packaging. Cosmetics and health care products need average protection and products
are relatively light weight. Both corrugated packaging and flexible packaging can be seen
with cosmetics, depending on product needs and brand communication. Books are
having low protection requirements, which indicates that other than corrugated
packaging would be sufficient in terms of protection. On the other hand, books are
relatively heavy weight, which often implies that more protection is needed. Fashion and
clothing have low protection requirements and cheap packaging is needed. These
attributes are favouring demand of plastics or other flexible packaging solutions. What
can be seen from the overall picture of these parameters is that strength properties and
importance of virgin fibre content grow hand in hand. This could mean that more virgin
fibre-based containerboard is needed, when protection requirements increase.
The barrier and surface properties (i.e. moisture) is having fluctuation, being the most
important for food/groceries and electronics and least important for clothes, furniture and
books. Food might need preservation from external influences and electronics can be
sensitive to for example moisture. Barrier properties and preservation could benefit
plastics while protection requirements are benefitting corrugated. Sustainability is
important, but according to the interviews, food protection always comes first.
Even though the end use specific criteria give hints on what kinds of materials are
required, size and weight of the products also define the needs for protection. For
example, small electronics or home decoration might need only padded envelopes and
when combining multiple fashion or cosmetics items in one order, corrugated box can
become more convenient.
5.6 Impact of E-commerce on Corrugated Packaging Supply
The interview and survey participants were asked, whether e-commerce retail creates
new requirements for packaging deliveries from producers to brand owners and retailers.
From the answers, it is evident that e-commerce creates need for faster fulfilments and
greater optimization for the whole supply chain. Some hints about the future development
of the corrugated packaging supply chain was gathered in the survey and interviews.
94
The lead time from retailers to consumers should be fast. Amazon has been
implementing same day deliveries, while other online giants are pushing delivery times
shorter as well. This has an indirect effect on packaging producers and retailers require
efficient and just in time replenishments from producers, not only because of fast delivery
times for consumers, but also because they do not want to have huge stocks of
packaging in their hubs. The reasons can be related to warehousing costs, warehousing
space or more lean operations.
“E-retailers are competing by speed of deliveries – you can expect deliveries from
Amazon in UK in 8h, so they expect 24h delivery time from packaging. Very lean
operations with limited stocks as possible – they will be challenging corrugated suppliers
with flexible and effective delivery models. They will be trying to push away packaging
related costs – i.e. warehousing costs” (Sales director (1), Corrugated board / Packaging
producer)
“What I see, is that we have to improve – to be much more efficient and just in time.
Retailers don’t want to have a stock in the store. We have to reduce the lead time.” (E-
commerce packaging specialist (3), Corrugated board / Packaging producer)
“If you deliver 50 000 parcels in a week, you can’t just store empty boxes. It requires
space. Corrugated industry, more or less running longer series of production and storing
in between, where you make call of with short lead times. It’s quite hard to produce
directly to order. (Packaging development, Retailer / Brand owner)
Producers need to be flexible and precise in terms of deliveries as e-commerce cannot
stop. There might also be fluctuations in customer requirements due to seasons or sales
promotions. As retailers must react to these fluctuations within their short lead times, this
might indirectly require more flexible supply from packaging producer. In any situation
the orders should be delivered fast to consumers, so the worst case is if the packaging
supplier cannot react to the fluctuating needs.
“When you order something, they are producing 10-15% more and it will be stored and
it will cover any crisis if there are production or delivery problems. E-commerce can’t
stop!” (Head of e-commerce logistics, Retailer / Brand owner)
“Worst case: when our stock is going down and supplier can’t react, we have to shut
down because we don’t have cardboard. Reflects to the delivery times to our customers.”
(Packaging procurement, Retailer / Brand owner)
The summary of corrugated packaging supply chain in e-commerce is presented in figure
38. The example of how e-commerce affects the whole corrugated packaging supply
does not necessarily affect all companies and the whole demand. As was figured out,
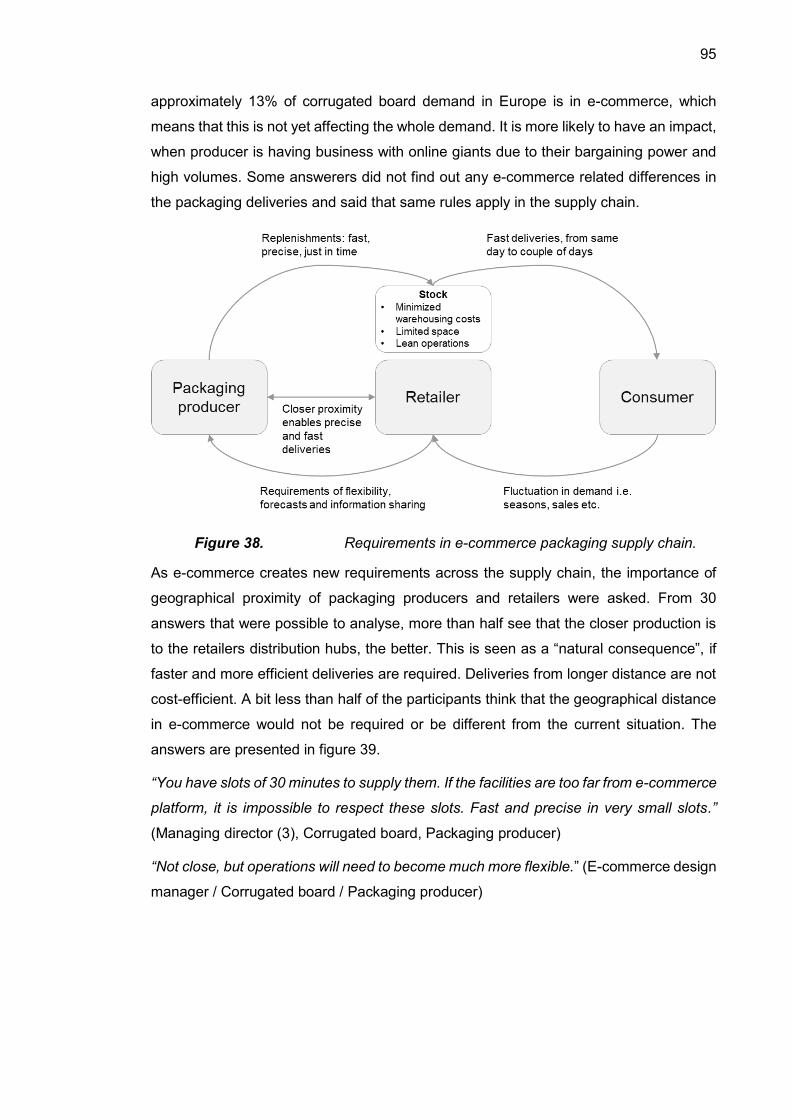
95
approximately 13% of corrugated board demand in Europe is in e-commerce, which
means that this is not yet affecting the whole demand. It is more likely to have an impact,
when producer is having business with online giants due to their bargaining power and
high volumes. Some answerers did not find out any e-commerce related differences in
the packaging deliveries and said that same rules apply in the supply chain.
Figure 38. Requirements in e-commerce packaging supply chain.
As e-commerce creates new requirements across the supply chain, the importance of
geographical proximity of packaging producers and retailers were asked. From 30
answers that were possible to analyse, more than half see that the closer production is
to the retailers distribution hubs, the better. This is seen as a “natural consequence”, if
faster and more efficient deliveries are required. Deliveries from longer distance are not
cost-efficient. A bit less than half of the participants think that the geographical distance
in e-commerce would not be required or be different from the current situation. The
answers are presented in figure 39.
“You have slots of 30 minutes to supply them. If the facilities are too far from e-commerce
platform, it is impossible to respect these slots. Fast and precise in very small slots.”
(Managing director (3), Corrugated board, Packaging producer)
“Not close, but operations will need to become much more flexible.” (E-commerce design
manager / Corrugated board / Packaging producer)
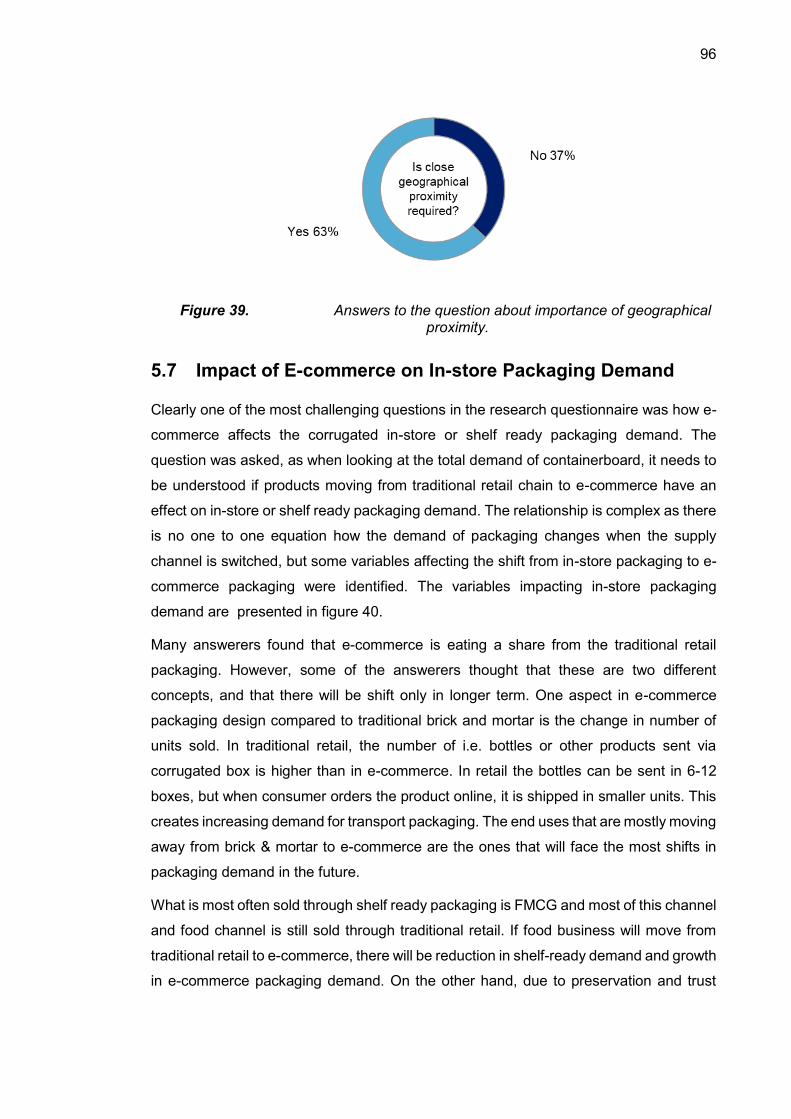
96
Figure 39. Answers to the question about importance of geographical proximity.
5.7 Impact of E-commerce on In-store Packaging Demand
Clearly one of the most challenging questions in the research questionnaire was how e-
commerce affects the corrugated in-store or shelf ready packaging demand. The
question was asked, as when looking at the total demand of containerboard, it needs to
be understood if products moving from traditional retail chain to e-commerce have an
effect on in-store or shelf ready packaging demand. The relationship is complex as there
is no one to one equation how the demand of packaging changes when the supply
channel is switched, but some variables affecting the shift from in-store packaging to e-
commerce packaging were identified. The variables impacting in-store packaging
demand are presented in figure 40.
Many answerers found that e-commerce is eating a share from the traditional retail
packaging. However, some of the answerers thought that these are two different
concepts, and that there will be shift only in longer term. One aspect in e-commerce
packaging design compared to traditional brick and mortar is the change in number of
units sold. In traditional retail, the number of i.e. bottles or other products sent via
corrugated box is higher than in e-commerce. In retail the bottles can be sent in 6-12
boxes, but when consumer orders the product online, it is shipped in smaller units. This
creates increasing demand for transport packaging. The end uses that are mostly moving
away from brick & mortar to e-commerce are the ones that will face the most shifts in
packaging demand in the future.
What is most often sold through shelf ready packaging is FMCG and most of this channel
and food channel is still sold through traditional retail. If food business will move from
traditional retail to e-commerce, there will be reduction in shelf-ready demand and growth
in e-commerce packaging demand. On the other hand, due to preservation and trust
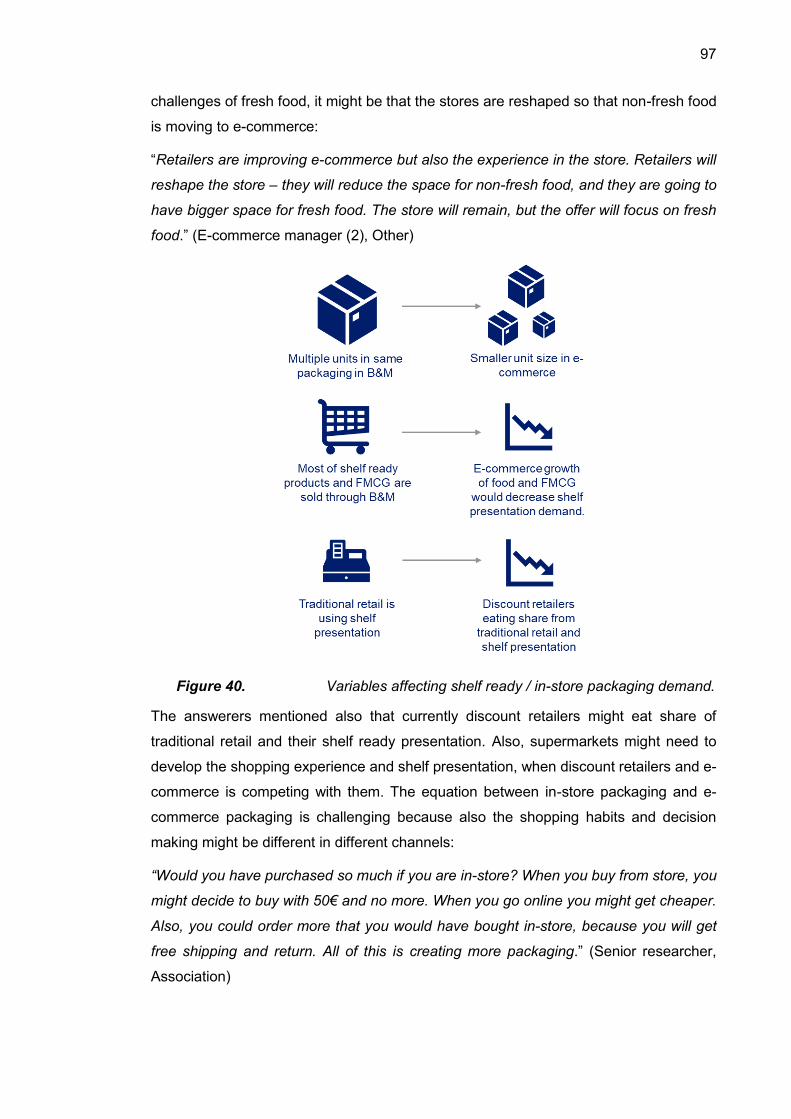
97
challenges of fresh food, it might be that the stores are reshaped so that non-fresh food
is moving to e-commerce:
“Retailers are improving e-commerce but also the experience in the store. Retailers will
reshape the store – they will reduce the space for non-fresh food, and they are going to
have bigger space for fresh food. The store will remain, but the offer will focus on fresh
food.” (E-commerce manager (2), Other)
Figure 40. Variables affecting shelf ready / in-store packaging demand.
The answerers mentioned also that currently discount retailers might eat share of
traditional retail and their shelf ready presentation. Also, supermarkets might need to
develop the shopping experience and shelf presentation, when discount retailers and e-
commerce is competing with them. The equation between in-store packaging and e-
commerce packaging is challenging because also the shopping habits and decision
making might be different in different channels:
“Would you have purchased so much if you are in-store? When you buy from store, you
might decide to buy with 50€ and no more. When you go online you might get cheaper.
Also, you could order more that you would have bought in-store, because you will get
free shipping and return. All of this is creating more packaging.” (Senior researcher,
Association)
98
6. DISCUSSION
In this chapter, the main findings of the research are presented. The main research
questions are answered by presenting the analysed results and discussing them in the
light of the theoretical background. The presented key findings are:
Containerboard demand in e-commerce packaging
Containerboard demand drivers in e-commerce packaging, including
o market trends
o packaging material decision making factors
o containerboard and corrugated packaging development
Different drivers of containerboard demand are introduced separately, but they may have
an impact on each other and be partly overlapping. For example, some drivers in the
market may impact which materials are preferred (i.e. sustainability), and on the other
hand, packaging material decision making factors are at the same time drivers for
demand (i.e. need of protection). One of the main research questions was to gain an
understanding how sustainability issues impact containerboard demand in e-commerce
packaging. Sustainability is a demand driver that has an impact on market development,
packaging material decision as well as corrugated box development. The impact of
sustainability issues on containerboard demand is thus explained in the demand drivers.
6.1 Containerboard Demand in E-commerce Packaging
One application of market research is to understand markets or qualitatively estimate the
market size (Hague et al. 2013, p.15). According to the interview and survey answers,
the share of containerboard demand in e-commerce packaging is approximately 13%.
According to FEFCO (2018) e-commerce packaging accounts less than 3% of total
containerboard demand, but this number exclude big e-commerce markets of France
and UK. More realistic estimation would be a share that is less than 13% but more than
3%. After consideration, in this research and calculations, the estimated share of
containerboard used in e-commerce packaging is 10% of the total demand.
To find out the answer to the title of the thesis “the impact of e-commerce on European
containerboard demand”, the impact of e-commerce on the market size is analysed. As
we know from case company’s earlier market research, European demand for
containerboard was approximately 32 Mt/a in 2018. If e-commerce packaging accounts
for 10% of this demand, the amount of e-commerce packaging demand would have been
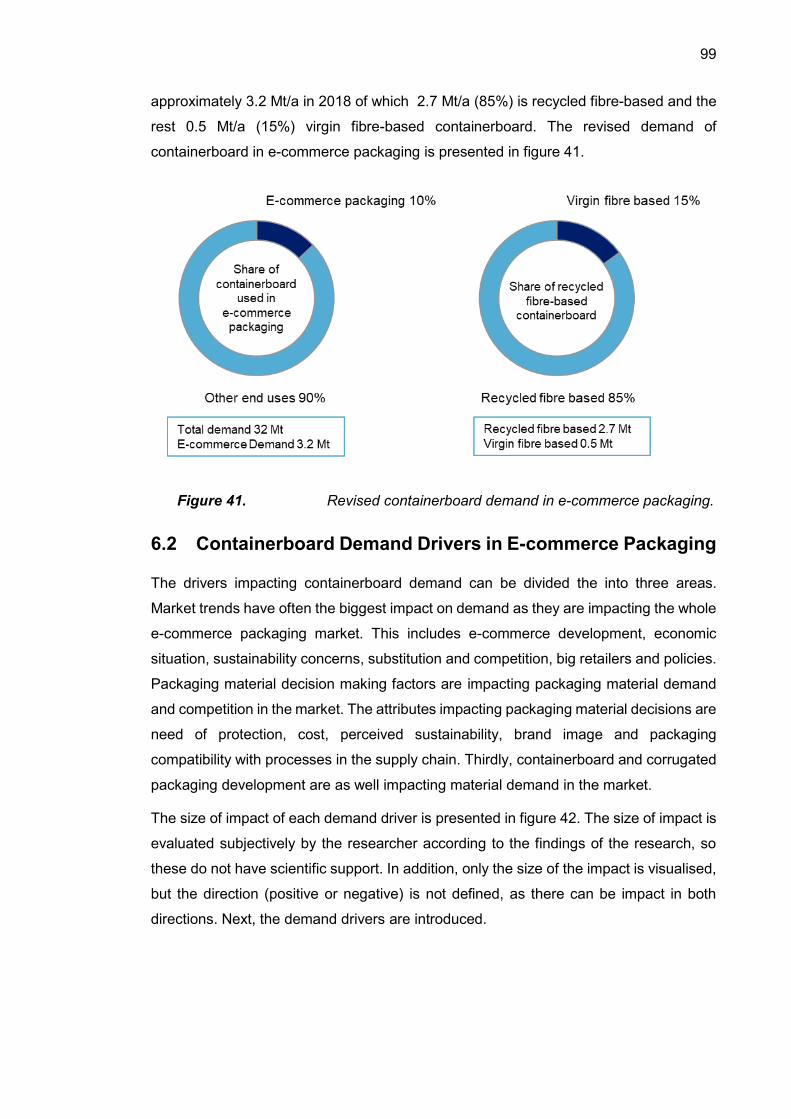
99
approximately 3.2 Mt/a in 2018 of which 2.7 Mt/a (85%) is recycled fibre-based and the
rest 0.5 Mt/a (15%) virgin fibre-based containerboard. The revised demand of
containerboard in e-commerce packaging is presented in figure 41.
Figure 41. Revised containerboard demand in e-commerce packaging.
6.2 Containerboard Demand Drivers in E-commerce Packaging
The drivers impacting containerboard demand can be divided the into three areas.
Market trends have often the biggest impact on demand as they are impacting the whole
e-commerce packaging market. This includes e-commerce development, economic
situation, sustainability concerns, substitution and competition, big retailers and policies.
Packaging material decision making factors are impacting packaging material demand
and competition in the market. The attributes impacting packaging material decisions are
need of protection, cost, perceived sustainability, brand image and packaging
compatibility with processes in the supply chain. Thirdly, containerboard and corrugated
packaging development are as well impacting material demand in the market.
The size of impact of each demand driver is presented in figure 42. The size of impact is
evaluated subjectively by the researcher according to the findings of the research, so
these do not have scientific support. In addition, only the size of the impact is visualised,
but the direction (positive or negative) is not defined, as there can be impact in both
directions. Next, the demand drivers are introduced.
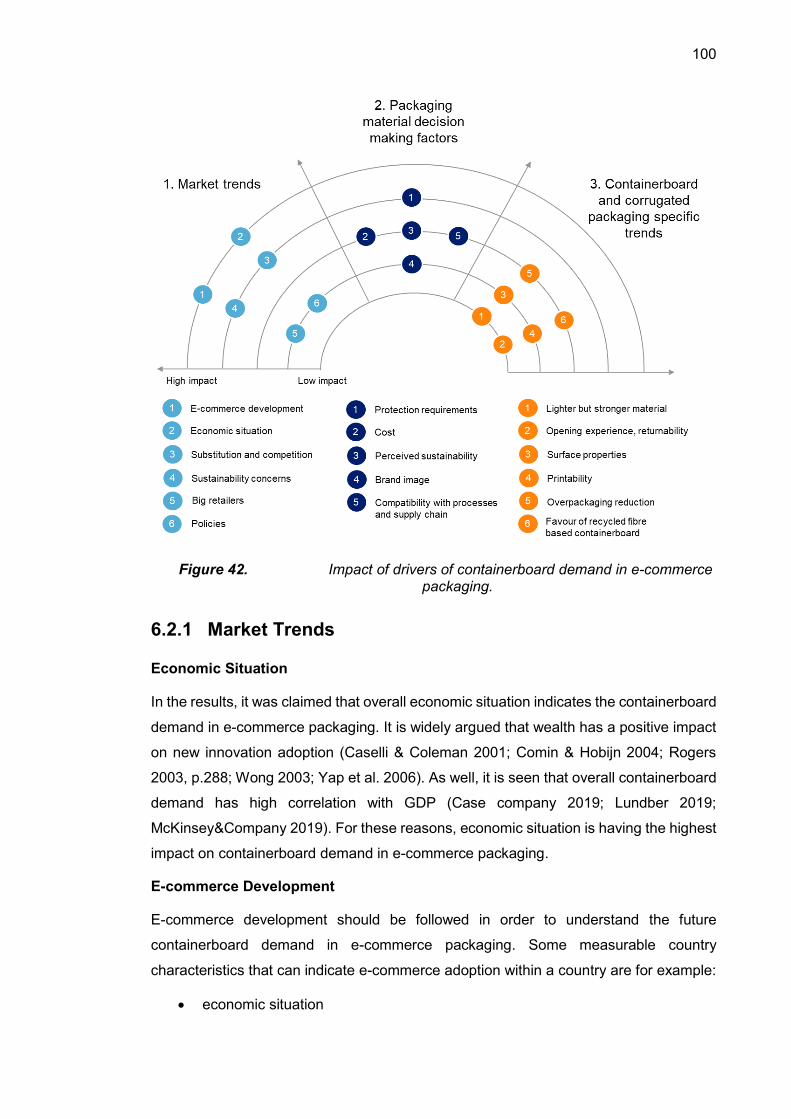
100
Figure 42. Impact of drivers of containerboard demand in e-commerce packaging.
6.2.1 Market Trends
Economic Situation
In the results, it was claimed that overall economic situation indicates the containerboard
demand in e-commerce packaging. It is widely argued that wealth has a positive impact
on new innovation adoption (Caselli & Coleman 2001; Comin & Hobijn 2004; Rogers
2003, p.288; Wong 2003; Yap et al. 2006). As well, it is seen that overall containerboard
demand has high correlation with GDP (Case company 2019; Lundber 2019;
McKinsey&Company 2019). For these reasons, economic situation is having the highest
impact on containerboard demand in e-commerce packaging.
E-commerce Development
E-commerce development should be followed in order to understand the future
containerboard demand in e-commerce packaging. Some measurable country
characteristics that can indicate e-commerce adoption within a country are for example:
economic situation
101
Internet (and other prior technology) penetration
educational level
e-commerce adoption rate.
As economic situation impacts technology adoption, it can be argued that it impacts e-
commerce adoption. Eurostat data (2018) about Internet penetration and e-commerce
activity strongly indicate that higher Internet penetration often means higher e-commerce
activity within a country. Similarly it is seen that existing technology foundation within
businesses (San Martín et al. 2012; Zhu et al. 2006) and IT infrastructure in country (Ho
et al. 2007) positively impacts new technology adoption. In addition to Internet, prior
technologies enhancing e-commerce adoption could be also mobile phones, computers
and online banking (Gibbs et al. 2003; Oxley & Yeung 2001; Wong 2003).
Ecommerce adoption seems to grow faster in those countries where e-commerce still
has relatively low adoption rate, and on the other hand, grow slower in those regions
where e-commerce activity is already high (Ecommerce foundation 2018; Eurostat
2018). This is in line with Rogers’ (2003, pp.272-280) innovation diffusion theory, in which
rate of adoption slows down when there is fewer remaining individuals that have not
adopted the technology. More educated people seem to be more active online shoppers
(Ecommerce foundation). This is in line with the fact that generally higher level of
education within a country indicates higher technology adoption (Ho et al. 2007; Gibbs
et al. 2003; Yap et al. 2006; Wong 2003). Factor that seems to not have usually
correlation with e-commerce adoption rate is the amount of population (E-commerce
foundation 2018).
Substitution and Competition
Corrugated packaging is competing with flexible plastics, reusable packaging, other
fibre-based packaging and a few other materials in e-commerce packaging market. As
well, containerboard grades are competing with each other. When there is competitors
in the market, companies are more willing to adopt new innovations to maintain their
position (Iacovou et al. 1995; Kuan & Chau 2001; Lin 2014). This forces to maintain
continuous development and find competitive packaging solutions.
To identify which attributes are critical in the competition and which are creating relative
advantage for materials, the packaging material decision making factors were identified.
In the literature, the main functions of packaging are protection, communication and
convenience (Lindh et al. 2016). As well in e-commerce packaging, protection, brand
communication and convenience are important functions of packaging. In addition, cost
and perceived sustainability have high impact on packaging material competition, even
102
though these are not packaging functions. Price competition is seen as an important
demand driver in the market. Most cost-effective solution that provides the needed
functionalities is often the option in e-commerce packaging. More detailed presentation
about attributes impacting the material competition is described in section 6.2.2.
Sustainability Concerns
According to the empirical part, sustainability is one of the biggest trend and driver in e-
commerce packaging market. Sustainability concerns have an effect on competition in
the market, packaging material decision and corrugated packaging development.
Sustainability is a strategy by which the environmental impacts can be minimized (Lindh
et al. 2016). Thus, sustainability of packaging is increasingly important, even though it is
not a fundamental function what packaging should provide.
In the literature, it is emphasised that packaging material is often discussed in terms of
sustainability, as it is the most visible part of it and easy to understand by consumers
(Kirwan 2013, p.336). Also in e-commerce packaging, the sustainability discussion is
mostly concerning the material and its recovery. It is worth to note that according to
literature, sustainable packaging includes wide variety of functions throughout the whole
value chain, including production, energy usage and sources, materials and recovery
(Sustainable Packaging Coalition 2011). This enhances the fact that sustainability
discussion in the market concerns mostly the material recovery, and not the sustainability
of the whole product life cycle.
Policies
Policies can act as drivers and inhibitors in innovation diffusion (Gibbs et al. 2003).
Current European level discussion about packaging and sustainability are mostly
concerning circular economy, ban on some single used plastics and reduction of
packaging waste (European Commission 2015; 2018; 2019). The potential increase of
regulatory measures was also emphasised in the literature by Thompson et al. (2009b)
and Hopewell et al. (2009) who argued that there would be increasing amount of
regulatory measures and requirements of recyclability of packaging. Currently there is
no legislation concerning e-commerce packaging, but the regulatory measures may have
an impact on packaging markets in the future. Still, it is seen that bigger driver towards
sustainability comes from consumers. It can be only guessed whether potential
regulatory measures about sustainability and recyclability are having an impact on
containerboard demand. It can either boost the demand due to recyclability of fibre-
based materials, or force to plastics recyclability, which is a threat for containerboard
103
demand in e-commerce packaging. For these reasons, policies are rated having
relatively small impact on containerboard demand.
Big Retailers
In the empirical part of the research almost all of the experts mentioned Amazon and
referred to their packaging decisions and development. Observability and visibility of the
results of new idea often drives towards the innovation adoption (Rogers 2003, pp. 258-
259). When big online retailers develop their packaging solutions, other player are
following and observing the development. For example, Amazon’s frustration free
packaging was mentioned multiple times in the interviews. The visibility and observability
of the results may enhance similar type of packaging solutions to arise. This concerns
especially big online retailers, as they often have volumes and money to develop
packaging. Big online retailers’ power in the market has minor impact on containerboard
demand.
6.2.2 Packaging Material Decision Making Factors
When looking from Rogers’ (2003) innovation characteristics perspective, the major
importance in packaging decision lies on relative advantage, cost and compatibility of
the packaging. Trialability or complexity are not major determinants or drivers of
packaging decision. As noted earlier, observability may have a small impact, because
competitors and big online retailers’ packaging decisions are followed.
Relative advantage includes functionality, sustainability, quality, image and convenience
aspects that the packaging can provide for the product and for the end consumer, and
thus enhance the demand. Cost on the other hand, act as a means of valuing the
packaging attributes. Packaging should be also increasingly compatible with supply
chain requirements, with automation and with intelligent packaging solutions. These
factors are impacting which material is chosen as transport packaging. Understanding
the determinants of packaging decision help to identify the strengths and weaknesses
compared to substitute materials.
Functionality
Superior physical or technical attributes can create relative advantage for an innovation
(Flight et al. 2011). The factor that is creating relative advantage for corrugated
packaging over plastics and other substitute materials is the degree of protection.
Corrugated is a very strong and shock absorbing material (Järvi-Kääriainen & Ollila 2007,
p.151) and by adding layers or changing fluting type, strength can be adjusted to
requirements set (Kirwan 2013, p. 313). Corrugated board has superior protection
104
properties, which flexible materials do not have, and thus protection is the main reason
corrugated board is competing and having big market share over plastics and other
secondary packaging materials.
However, not all products are requiring the same amount of protection and for this reason
there are substituting materials in e-commerce packaging. As Natarajan et al. (2014,
p.9), Regattieri et al. (2014), Hellström & Saghir (2007) and BillerudKorsnäs (2014)
noted, the degree of protective functions depends on the fragile nature of the product,
as well as the weight and size of the product. However, what was not indicated strongly
in the literature, is that this often leads to completely different types of materials. From
the interview results, it was possible to see that products that do not need much
protection (i.e. textiles, clothes) are often packed in plastics, as it is cheaper and takes
less space. Plastics have incredibly good properties and relative advantage in terms of
light weight, durability, strength, barrier characteristics and cost (Hopewell et al. 2009;
Lewis et al. 2010; Thompson et al. 2009a; Thompson et al. 2009b) making plastics very
attractive for e-commerce packaging.
As a conclusion, what needs to be first considered when choosing the e-commerce
packaging material is the amount of needed protection for the product and the desired
functionalities of packaging. Relative advantage is one of the strongest factors impacting
the innovation’s rate of adoption (Flight et al 2011; Premkumar & Roberts 1999; Rogers
2003, p.233), and for this reason, need of protection is one of the biggest drivers
impacting containerboard demand in e-commerce packaging. From the results of the
empirical part, corrugated packaging seems to not have any major competitor in terms
of protection, but when protection is not needed, plastics and other substitute materials
are increasingly favoured.
Cost
The packaging alternative that enables safe delivery with minimal overall costs is often
the option (Natarajan et al. 204, p.2). Often, the lower the cost of the innovation is the
more likely that it will be quickly diffused (Tornatzky & Klein 1982). In competition of
packaging material, cost attribute should be benefitting flexible plastics and other more
cost-efficient packaging material than corrugated board. Direct material costs impact the
packaging material decision, but also indirect costs such as warehousing and logistics
costs are taken into account. Corrugated board takes more space in warehousing than
many flexible materials, which can mean an additional cost. For this reason minimal
stocks are often held by retailers.
105
However, cost does not alone define which packaging material is chosen. Similarly in
the literature, there is evidence that cost is not always having only negative impact on
innovation adoption (Damanpour & Schneider 2009; Fliegel & Kivlin 1966; Tornatzky &
Klein 1982). This means that even though cost is one of the most important decision
making factors in e-commerce packaging, there are attributes that can be more
important. The research results indicates that in some cases retailers and brand owners
are willing to pay for better appearance, functionality or sustainability. Still, if protection
is needed, corrugated packaging is often chosen as there is no cheaper packaging
material providing similar functionality. Damage of the whole product-packaging system
becomes more wasteful in terms of sustainability and cost.
Perceived Sustainability
Consumer readiness to engage in new innovation adoption has an impact on businesses’
willingness to adopt new innovation (Barua et al. 2004). Perceived sustainability attribute
is driven from consumers’ readiness to have more sustainable packaging solutions. This
impacts retailer’s and brand owners packaging material decision and willingness to adopt
new packaging materials.
Currently, perceived sustainability is creating relative advantage for fibre-based
packaging materials, including containerboard, due to recyclability. On the other hand,
overpackaging is considered as a challenge for corrugated packaging in terms of
sustainability. In current discussion found from literature and from interviews, the
sustainability issues are highly challenging plastics as they are littering the environment
(Thompson et al. 2009a; Thompson et al. 2009b). Practical packaging disposal and
material recovery is increasingly demanded by consumers. Fibre-based bags (i.e. kraft
papers) may be seen substituting plastics in the future, as more sustainable packaging
materials are demanded. The perceived sustainability attribute can change, if plastics
recycling is developed or if new more sustainable alternatives are invented.
Using more sustainable materials not only benefit the consumer, but the businesses as
well. If adopting the new idea create benefits for the company, the adoption is more likely
(Lin 2014). Innovation can also enhance adopters’ social status and thus positively
impact the adoption (Moore & Benbasat 1991; Rogers 2003, p.229). In this case, usage
of more sustainable packaging materials may enhance company’s image. On the other
hand, sustainable materials are competitive in the market only if they have reasonable
price and required functionality. This means that other packaging attributes should be
taken into account. The balance between reasonable price and sustainability is
evaluated by the retailer or brand owner. In business reality, the value-cost ratio in terms
106
of sustainability is important (Wever & Vogtländer 2013). This explains, why interview
and survey participants emphasised that fibre-based bags or new alternatives with
similar characteristics to polybags are going to be seen in the future. As corrugated could
be more expensive compared to its flexible substitutes, it is not the most competitive
alternative for plastics.
Image
Similarly to perceived sustainability, also packaging outlook and opening experience can
create relative advantage by improving company’s social status (Moore & Benbasat
1991; Rogers 2003, p.229). Secondary packaging appearance does not have a major
role in e-commerce business, but it can act as a communication tool about brand quality
(BillerudKorsnäs 2014; Järvi-Kääriainen & Ollila 2007, p.9; Visser 2002). This means
that by creating better image about the brand, the retailer or brand owner may achieve
advantage over competitors. The increasing importance of brand communication and
packages role as part of the product was emphasised in the results. Brand image and
quality can be communicated by appearance, opening experience, easy opening and
returning, and sustainability which are experienced by consumer. These may also have
a minor impact on what material is chosen in e-commerce. The driver is smaller than
other packaging decision making factors, but depending on the brand and product, it is
increasingly demanded.
Compatibility
Packaging compatibility with the requirements of supply chain are considered when
choosing the packaging material. Compatibility refers to the degree to which the
innovation is seen compatible or incompatible with previous innovations or ideas,
sociocultural values and beliefs or needs (Rogers 2003, p.440). The results indicates
that increase of automation in packaging and warehousing processes is one of the
objectives in the future. This means that the packaging should be working with the
automated machinery. Also increase of intelligent packaging requires possibility to
include items that enable system-packaging interaction. Packaging should be also
compatible with the supply chain requirements. For example, if good stackability is
required, packaging should be providing it. The innovations with higher rate of
compatibility are often diffused more rapidly (Agarwal & Prasad 1997; Rogers 2003,
p.245). Similarly businesses are more likely to adopt new technology, if they are
compatible with existing technology and skills (Zhu et al. 2003; Zhu et al. 2006) or
resources (Iacovou et al. 1995). The better the packaging alternative can fulfil the future
requirements, the more likely it is adopted.
107
6.2.3 Containerboard and Corrugated Packaging Development
Not only market trends or competition between packaging materials are impacting the
demand of containerboard, but also corrugated packaging and containerboard
development. These drivers include:
Printing and appearance
Surface properties
Favour of recycled fibre-based containerboard
Lighter but stronger material
Design and overpackaging reduction
Printable surface and good quality are increasingly demanded in e-commerce
packaging. This attribute is part of communication function of packaging, as brand and
product image can be communicated through appearance (Emblem & Emblem 2012,
p.48; Järvi-Kääriainen & Ollila 2007, p.11). It may also enhance consumer enjoyment,
which is seen being an intrinsic motivator enhancing the technology adoption (Childers
et al. 2001; Ha & Stoel 2009; Shang et al. 2005). Other surface properties required from
e-commerce packaging can be for example moisture or thermal properties in certain end
uses. With preservation, the aim is to extend the shelf life of the product (Emblem &
Emblem 2012, p.41; Järvi-Kääriainen & Ollila 2007, p.11) which is important in terms of
protection and sustainability. Surface properties and printability can indicate what type
of containerboard is needed (i.e. virgin vs. recycled fibre-based). Still, the common trends
in the market indicate that recycled fibre-based corrugated board and containerboard are
highly favoured, as they provide needed functionality with lower cost than virgin fibre-
based alternatives.
Lighter but stronger material refers to the same trend that has been seen earlier by case
company in overall containerboard market. When lighter material is able to provide
needed properties, there will be less demand of containerboard. It was seen from the
end use specific characteristics that light weight is almost always average important (~3),
and many other factors come first (i.e. cost, protection, sustainability), so this could be a
minor trend impacting the demand. As cost reductions may enhance innovation adoption
(Rogers 2003, p.330), cost may be the driving factor towards lighter materials, as these
are often cheaper to purchase or transport. However, the heavier the product is, the
actual weight of the packaging matters less. There was only small emphasise in the
empirical part of the research towards this trends, so lighter but stronger material is
estimated to have small negative impact on containerboard demand in e-commerce
packaging.
108
Overpackaging reduction is becoming more important in e-commerce packaging. This
can be achieved with multiple packaging sizes, fit-to-product packaging and packaging
re-design. The trend is driven from sustainability and aim of reducing amount of
packaging (Kirwan 2013, p.336) as well as from efficiency in transportation and supply
chain (Järvi-Kääriainen & Ollila 2007, p.11; Natarajan et al. 2014, p.10). In the empirical
part of the research, it was often emphasised that consumers are critical and do not like
if their orders are overpacked. On the other hand, standard sized boxes are valued by
retailers as they are cost competitive when bought as bulk. The driver has relatively big
impact on containerboard demand in e-commerce packaging, as if smaller boxes are
used, less material is needed. Naturally, this would have a downside impact on
containerboard demand, but at the same time, it can boost the demand of
containerboard, as it is perceived more efficiently used and more sustainable. As noted
in results, fit-to-product packaging often needs investments so most probably there will
be still standard sized bulk boxes in the future, even though the trend is towards smaller
boxes.
109
7. CONLUSIONS
This chapter concludes the main findings of the research and how the objectives were
reached. The reliability and validity of the results are evaluated, managerial implications
are presented, and finally, potential future research directions are suggested.
7.1 Main Findings
The main objective of this master’s thesis was to gain an understanding of the drivers
impacting the future containerboard demand in e-commerce packaging. To learn the
current state of e-commerce packaging market, 42 people were reached through
interviews and online survey. The participants included people from containerboard,
corrugated board and packaging producers, retailers, brand owners, associations and
few other stakeholders in the field. The geographical coverage focus was on the largest
e-commerce markets in Europe. To conclude the research findings, answers to the
research questions are presented. The main research question was following:
RQ1: What are the most important drivers impacting the demand of
containerboard used in e-commerce packaging?
The drivers impacting containerboard demand in e-commerce packaging are divided into
market trends, packaging material decision making factors and containerboard specific
trends. Market drivers are:
Economic situation
E-commerce development
Substitution and competition
Sustainability concerns
Power of big retailers
Policies.
The biggest drivers considering the future containerboard demand in e-commerce
packaging are the development of e-commerce market and overall economic situation.
As products cannot be delivered to the consumer without packaging, the demand of e-
commerce packaging is created, when consumers order online rather than buy the same
product in physical store. For this reason, it is essential to understand and follow the e-
commerce diffusion in Europe. Economic situation is often the biggest factor driving new
110
innovation adoption, so it is driving both e-commerce development and containerboard
demand in e-commerce packaging.
Due to increasing sustainability concerns, consumers are requiring more sustainable and
recyclable packaging solutions. Price competition and substitution are always big drivers,
as materials are competing in the market, and the most cost-efficient packaging solution
providing safe delivery and needed functionality is preferred. Policies can act both as
drivers and inhibitors for containerboard demand in e-commerce packaging. Currently,
there is no regulation for e-commerce packaging, but there are discussion about material
recyclability and aim to reduce packaging waste. Big retailers have impact on
containerboard demand, as their packaging decisions and development are followed in
the market.
Packaging decision making factors are as well important drivers for containerboard
demand in e-commerce packaging. By presenting the drivers, it is possible to investigate
the answer to the second research question, which was following:
RQ2: What are the most important variables affecting the packaging decisions in
e-commerce?
The packaging material decision making factors are:
Need of protection
Perceived sustainability
Cost
Compatibility
Brand image.
The main function of e-commerce packaging is protection, as products need to be
delivered undamaged. Product damage is the worst scenario when it comes to cost,
sustainability and brand image. As corrugated packaging have relative advantage over
its substitute materials in terms of protection, it is often the option when protection is
needed. For example, electronics, furniture and food require high protection. However,
not all products are requiring the same degree of protection. For example, fashion
business and books are needing low protection. Flexible plastics are an attractive
alternative in e-commerce packaging when protection is not needed, as it is light weight,
flexible, durable, takes less space and it is often cheaper.
The impact of perceived sustainability on packaging material decision helps to answer
the third research question which was:
111
RQ3: How sustainability issues are impacting containerboard demand in e-
commerce packaging?
Consumer perceptions about packaging materials’ sustainability impact the packaging
material decision. Currently perceived sustainability is benefitting corrugated packaging
and other fibre-based packaging solutions due to recyclability. Plastics are often
perceived less sustainable due to littering problems, and this may drive the demand of
fibre-based substitutes for plastics. This means that the competition in the future would
not only be between corrugated board and plastics but also new more sustainable
packaging solutions with similar characteristics to polybags. Sustainability and cost-
effectiveness are driving towards overpackaging reduction. Generally, this means less
containerboard demand as less packaging material is required. On the other hand, it
could boost the demand of corrugated packaging, when overpackaging is reduced and
it is perceived more environmentally friendly.
Packaging should be cost-efficient in order to compete in the market, as cost is one of
the major attributes impacting packaging material decision. Often higher material costs
and additional costs caused by warehousing and logistics could be seen as challenges
for corrugated packaging compared to its substitutes. Still, there is no competition when
protective packaging is needed, and corrugated packaging is the preferred packaging
solution. Sometimes also brand communication is valued over costs, so more
convenient, sustainable and good-looking packaging is needed. Currently, more
sustainable packaging solutions are often more expensive, so balance between
reasonable cost and required sustainability should be evaluated. Packaging needs to be
also compatible with the requirements of the supply chain, i.e. automated processes or
with intelligent packaging solutions.
Containerboard and corrugated packaging development drivers impacting the demand
are:
Overpackaging reduction
Favour of recycled fibre-based containerboard
Printability & surface properties
Lighter but stronger material
Convenience, i.e. opening experience and returnability.
Recycled fibre-based containerboard is favoured in e-commerce packaging, mainly
because it provides needed functionalities with lower cost than virgin fibre-based
alternative. Printability, appearance, opening experience and overall convenience are
increasingly demanded from e-commerce packaging, and the packaging may act as tool
112
of brand communication. Need of surface properties may increase in end uses in which
humidity resistance is required, i.e. food. Finally, need lighter but stronger material is a
minor trend that has been seen impacting containerboard demand.
As part of market research, the last research question was:
RQ4: How much containerboard is used in e-commerce packaging?
Currently, the e-commerce packaging represents approximately 10% of the total
containerboard demand in Europe. As the market demand of containerboard in Europe
was approximately 32 Mt in 2018, it can be estimated that 3.2 Mt of this demand was e-
commerce packaging. Approximately, 85% of this demand is recycled fibre-based
containerboard and rest is virgin fibre-based. This would mean that 2.7 Mt of
containerboard demand in e-commerce packaging is recycled fibre-based
containerboard and rest 0.5 Mt is virgin fibre-based.
To conclude, growth of e-commerce and overall consumption, as well as need of
protective packaging creates the need for demand of containerboard. Drivers may
enhance the demand of more sustainable, good-looking, convenient and smaller
corrugated box. Still, some end uses are requiring just a plain, simple and low-cost box.
Wide variety of businesses, end uses, brands and needs make e-commerce packaging
a broad concept.
7.2 Reliability and Validity
To evaluate the credibility of the research findings, reliability and validity need to be
assessed. Reliability and validity are ways of demontrating how trustworth or rigour the
findings are. The trustworthiness of the finding depends on the initial research question,
how data is collected, and when and who is collecting and analysing the data (Roberts
& Priest 2006). Reliability refers to the extent to which the methods used in the research
would yield consistent findings, if used by another researcher (Roberts & Priest 2006;
Saunders et al. 2009, p.156). There could be a reliability issue when it comes to the
generalisability of the interview results, due to small number of cases (Saunders et al.
2009, p.327). The reliability and generalisability in this research is improved by large
sample size of 42 people and the geographical diversity of the answerers. As well,
answerers from multiple different types of companies and associations with all different
speciality or product, increases the reliability and gives a broad view of the market. Still,
it is seen that semi-sructured or in-depth interviews are not repeatable by nature as they
are reflecting only the time they are conducted (Marshall & Rossman 1999; cited by
Saunders et al. 2009, p.327). The findings of this research are reflecting the market only
113
during the time of the research in May-October 2019. If conducting the same research
again later, the findings could be different as the demand and market dynamics are
developing.
Research generalisability can be enhanced by connecting the research findings into
existing theories, and thus, demonstrate that the results have wider theoretical
significance (Marshall & Rossman 1999; cited by Saunders et al. 2009, p.335). In this
research, there is no possibility to connect the results in existing e-commerce packaging
research, but it is possible to concern what are the most important functions in e-
commerce packaging and which innovation characteristics are driving the demand of
containerboard. In order to generalise the results, further research in e-commerce
packaging market would be required. What the researcher considers as reducing the
reliability when looking at the whole e-commerce packaging market, is than in this
research the focus is on containerboard and corrugated board, so the results may be
somewhat subjective from this industry perspective (even though there are also
associations and retailers/brand owners interviewed, which enhances the reliability). To
be able to analyse the whole e-commerce packaging market, also plastic packaging, and
other substitute material providers and producers should be included in the future.
Robson (2002; cited by Saunders et al. 2009, p.156) argues that there are three major
threats to reliability. First is subject or participant error, which concerns the possibility of
having different results if the questionnaire would have been conducted in different time.
Second threat is subject or participant bias, which means that the interviewees are
answering what they are expected to say. The interview participants got to decide when
would be suitable time for the interview, which means that they could reserve enough
time and be prepared. The interview participants were confirmed that the results are
analysed anonymously, and background of the research was sent to them by e-mail,
which enhanced the trust between interviewer and answerer. These actions increased
the reliability. The third issue regarding reliability is observer error, which means that the
results may differ depending on who is the interviewer. Observer error was reduced by
semi-structured questionnaire that was sent to the participants beforehand if they
wanted. As well, the discussions were recorded and transcribed to minimize the errors
and misunderstandings. Interview participant may also feel not answering too sensitive
questions, which could create a partial picture of the situation (Sauders et al. 2009,
p.327). In some cases, the interview participants were not willing to tell detailed
information about their future development ideas, which is understandable as this is part
of their competitive advantage. No details about future development are shared for a
researcher outside of the company, which must be understood, when reading the results.
114
Validity on the other hand evaluates if the findings are really what they appear to be or
what is measured (Roberts & Priest 2006; Saunders et al. 2009, p.157). Robson (2002;
cited by Saunders et al. 2009, pp.157-158) evaluates that history, expected
consequences that the answerer would face, and ambiguilty about causal direction may
affect the validity. The results are anonymously analysed for non-commercial use, so it
is expected that the answeres did not face any positive or negative consequences when
answering the questions. However, one can expect that the faced issues (history) in the
markets (i.e. power on big e-retailers) are affecting the answers. This was not a problem
in this research, as the market, including the historical experiences and hints about
possible drivers in the market, were all valuable information to create a big picture of the
market. On the other hand, the historical events could have impacted the attitude of the
answerers, which in turn could reduce the validity. Ambiguilty about the causal direction
was not strongly present in the interviews, but one may evaluate for example are the
benefits corrugated board and containerboard are facing in the market caused by the
fact that it is better material, or by the fact that competitors are suffering. These were
considered in the results, but it is also important to critically evaluate the main findings
when reading this thesis because there is no other theoretical background for the
findings. The researcher’s previous knowledge on the field could impact the validity, if
certain nuances are overlooked in the analysis (Roberts & Priest 2006). The interviews
were recorded and transcribed to collect all the information from the discussions, and to
reduce the missing information. As well, the researcher did not have educational or work
related background in e-commerce packaging, so there was not much previous
knowledge creating preassumptions. Still, sustainability and e-commerce are seen in the
media and also personally when ordering products, and these could impact the
preassumptions about the topic. The researcher tried to kept in mind that everything
should be evaluated as objectively as possible in order to avoid errors.
7.3 Managerial Implications
As market research is often conducted to provide reliable information for organisation,
which can help making better decisions (Hamersveld & Bont 2008, p. 37), the main
managerial implication of this research is to help evaluating the containerboard demand
in the European market. What can be evaluated with the main results are for example:
Potential containerboard demand development in Europe in the foreseen
future.
115
Decision making factors in e-commerce packaging: benefits and challenges
for containerboard and corrugated board. Understanding of material
substitution.
End use specific requirements from packaging.
Understanding of how current sustainability discussion is affecting the
perceived views of materials and how this may impact the demand.
The findings are giving a broad overview of the market demand and help in
understanding of the overall containerboard demand in Europe. The findings can be used
to help a wide variety of stakeholders within the corrugated packaging value chain.
7.4 Future Research Directions
It needs to be understood that the results of this research are valid only in European
containerboard market in May-October 2019 when the research was conducted. The
results may differ when the market region is different or when the time is different. Due
to the unresearched nature of e-commerce packaging, the results of this research cannot
be widely generalised. To have a more robust research about e-commerce packaging,
more research about demand drivers and e-commerce packaging functions should be
done in the future. It would be worth to define in the future research, which of the findings
can be generalised and which are non-generalisable.
This research can act as basis for new, more detailed research in e-commerce
packaging. If European containerboard or e-commerce packaging market is researched
again in the future, different types of packaging providers (including substitutes) could
be added into the research to increase the reliability. As well, if more detailed picture
about the market is needed, regional differences or end use specific differences in e-
commerce packaging could be evaluated. As well, the logistical aspect of e-commerce
was often asked from the researcher. Logistics may impact packaging requirements and
similarly packaging may impact logistical efficiency or sustainability. In the future, the
relationship of e-commerce packaging and logistics could be evaluated in more detail.
The demand drivers and perceived attributes are likely to change in the future, when
market is developing. To understand development in European e-commerce packaging
market, similar type of research could be repeated in the future.
116
REFERENCES
Adner, R. & Kapoor, R. (2010). Value Creation in Innovation Ecosystems: How the Structure of Technological Interdependence Affects Firm Performance in New Technology Generations, Strategic Management Journal, Vol. 31(3), pp. 306-333.
Adner, R. (2002). When Are Technologies Disruptive? A Demand-Based View of the Emergence of Competition, Strategic Management Journal, Vol. 23(8), pp. 667-688.
Adner, R. (2006). Match your innovation strategy to your innovation ecosystem, Harvard Business Review, Vol. 84(4), pp. 148.
Agarwal, R. & Prasad, J. (1997). The role of innovation characteristics and perceived voluntariness in the acceptance of information technologies, Decision Sciences, Vol. 28(3), pp. 557-579.
Ajzen, I. (1991). The theory of planned behavior, Organizational behavior and human decision processes, Vol. 50(2), pp. 179-211.
Ajzen, I. (2011). The theory of planned behaviour: Reactions and reflections, Psychology & Health, Vol. 26(9), pp. 1113-1127.
Ameripen. (2017). Optimizing Packaging for an E-commerce World, American Institute for Packaging and the Environment, Available online: https://cdn.ymaws.com/www.ameripen.org/resource/resmgr/PDFs/White-Paper-Optimizing-Packa.pdf [read on 27.6.2019].
Anderson, P. & Tushman, M.L. (1990). Technological Discontinuities and Dominant Designs: A Cyclical Model of Technological Change, Administrative Science Quarterly, Vol. 35(4), pp. 604-633.
Bandura, A. (1982). Self-efficacy mechanism in human agency, American Psychologist, Vol. 37(2), pp. 122-147.
Barua, A., Konana, P., Whinston, A.B. & Yin, F. (2004). An Empirical Investigation of Net-Enabled Business Value, MIS Quarterly, Vol. 28(4), pp. 585-620.
BillerudKorsnäs. (2014). How packaging can add value in e-commerce?, Available online: https://www.billerudkorsnas.com/globalassets/billerudkorsnas/about-us/stories/five-ways-to-boost-online-sales-with-packaging/how_packaging_can_add_value_report.pdf [read on 24.5.2019].
Brancheau, J.C. & Wetherbe, J.C. (1990). The Adoption of Spreadsheet Software: Testing Innovation Diffusion Theory in the Context of End-User Computing, Information Systems Research, Vol. 1(2), pp. 115-143.
Carter, L. & Weerakkody, V. (2008). E-government adoption: A cultural comparison, Information Systems Frontiers, Vol. 10(4), pp. 473-482.
Case company (2019). Background material and earlier research, Limited Availability. The name of the case company is hidden due to confidentiality.
117
Caselli, F. & Coleman, W.J. (2001). Cross-Country Technology Diffusion: The Case of Computers, The American Economic Review, Vol. 91(2), pp. 328-335.
Chen, L. & Tan, J. (2004). Technology Adaptation in E-commerce: Key Determinants of Virtual Stores Acceptance, European Management Journal, Vol. 22(1), pp. 74-86.
Childers, T.L., Carr, C.L., Peck, J. & Carson, S. (2001). Hedonic and utilitarian motivations for online retail shopping behavior, Journal of Retailing, Vol. 77(4), pp. 511-535.
Chwelos, P., Benbasat, I. & Dexter, A.S. (2001). Research Report: Empirical Test of an EDI Adoption Model, Information Systems Research, Vol. 12(3), pp. 304-321.
Ciganek, A.P., Haseman, W. & Ramamurthy, K. (2014). Time to decision: the drivers of innovation adoption decisions, Enterprise Information Systems, Vol. 8(2), pp. 279-308.
Comin, D. & Hobijn, B. (2004). Cross-country technology adoption: making the theories face the facts, Journal of Monetary Economics, Vol. 51(1), pp. 39-83.
D'Alesio, S. & Vandichel, R. (2015). A Secondary Packaging Solution Development Suitable for E-groceries through the Identification of Food Product and Logistic Requirement,. Master's Thesis, Division of Packaging Logistics, Department of Design Sciences, Faculty of Engineering, Lund University.
Damanpour, F. & Schneider, M. (2009). Characteristics of Innovation and Innovation Adoption in Public Organizations: Assessing the Role of Managers, Journal of Public Administration Research and Theory: J-PART, Vol. 19(3), pp. 495-522.
Davis, F.D. (1989). Perceived Usefulness, Perceived Ease of Use, and User Acceptance of Information Technology, MIS Quarterly, Vol. 13(3), pp. 319-340.
Davis, F.D., Bagozzi, R.P. & Warshaw, P.R. (1989). User Acceptance of Computer Technology: A Comparison of Two Theoretical Models, Management Science, Vol. 35(8), pp. 982-1003.
Deloitte (2016). Global Powers of Retailing 2016 Navigating the new digital divide, Available online: https://www2.deloitte.com/content/dam/Deloitte/global/Documents/Consumer-Business/gx-cb-global-powers-of-retailing-2016.pdf. [read on 22.5.2019].
DeLone, W.H. & McLean, E.R. (2004). Measuring e-Commerce Success: Applying the DeLone & McLean Information Systems Success Model, International Journal of Electronic Commerce, Vol. 9(1), pp. 31-47.
Downs, G.W. & Mohr, L.B. (1976). Conceptual Issues in the Study of Innovation, Administrative Science Quarterly, Vol. 21(4), pp. 700-714.
Eastin, M.S. (2002). Diffusion of e-commerce: an analysis of the adoption of four e-commerce activities, Telematics and Informatics, Vol. 19(3), pp. 251-267.
Ecommerce foundation. (2018). European Ecommerce Report 2018 Edition, Source: www.EcommerceOperations.org
Ecommerce News. (2019). Ecommerce in Europe: €621 billion in 2019, Available online: https://ecommercenews.eu/ecommerce-in-europe-e621-billion-in-2019/ [read on 13.6.2019].
118
Edwards-Schachter, M. (2018). The nature and variety of innovation, International Journal of Innovation Studies, Vol. 2(2), pp. 65-79.
Emblem, A. & Emblem, H. (2012). Packaging technology: fundamentals, materials and processes, Woodhead Pub, Cambridge; Philadelphia.
EMOTA & FEPE. (2018). eCommerce Opportunities for the European Envelope Industry, European Envelope Manufacturers’ Association & The European eCommerce & Omni-Channel Trade Association, Limited availability.
Enterprise Europe Network. (2018). A guide to e-commerce in Europe, Available online: https://een.ec.europa.eu/sites/default/files/een_guide_ecommerce_2018.pdf [read on 14.6.2019].
E-shopper barometer (2017). Global report – Europe, Dpdgroup, Available online: https://www.emota.eu/media/1225/global_report_e-shopper_barometer_2017-pdf.pdf [read on 14.6.2019].
European Commission. (2015). Proposal for a Directive of the European Parliament and of the Council amending directive 94/62/EC on packaging and packaging waste, Available online: https://eur-lex.europa.eu/resource.html?uri=cellar:b68494d2-999f-11e5-b3b7-01aa75ed71a1.0019.02/DOC_1&format=PDF [read on 24.10.2019].
European Commission. (2018). Communication from the commission to the European Parliament, the Council, the European Economic and Social Committee and the Committee of the Regions. A European Strategy for Plastics in an Circular Economy. Available online: https://eur-lex.europa.eu/resource.html?uri=cellar:2df5d1d2-fac7-11e7-b8f5-01aa75ed71a1.0001.02/DOC_1&format=PDF [read on 24.10.2019]
European Commission. (2019). Circular Economy: Commission welcomes European Parliament adoption of new rules on single-use plastics to reduce marine litter, Available online: http://europa.eu/rapid/press-release_STATEMENT-19-1873_en.htm [read on 27.5.2019].
Eurostat, E.C. (2018) Main tables - Eurostat - Digital Economy and Society, Available online: https://ec.europa.eu/eurostat/web/digital-economy-and-society/data/main-tables [read on 20.8.2019].
Falk, M. & Hagsten, E. (2015). E-commerce trends and impacts across Europe, International Journal of Production Economics, Vol. 170 pp. 357-369.
FEFCO & CEPI ContainerBoard. (2018). European Database for Corrugated Board Life Cycle Studies.
FEFCO. (2018). Annual Report 2018 Key Statistics, Limited Availability.
Fishbein, M. & Ajzen, I. (1980). Understanding attitudes and predicting social behavior, Prentice-Hall, Englewood Cliffs, NJ.
Fliegel, F.C. & Kivlin, J.E. (1966). Attributes of Innovations as Factors in Diffusion, American Journal of Sociology, Vol. 72(3), pp. 235-248.
Flight, R.L., D'Souza, G. & Allaway, A.W. (2011). Characteristics-based innovation adoption: scale and model validation, Journal of Product & Brand Management, Vol. 20(5), pp. 343-355.
119
Forbes Insight. (2018). The empty space economy: Discover the world's most valuable commodity, Available online: https://www.euractiv.com/wp-content/uploads/sites/2/2018/11/DSSmith_REPORT-FINAL-PRINT_EN_V03.pdf [read on 14.6.2019].
Gefen, D. & Straub, D.W. (2000). The relative importance of perceived ease of use in IS adoption: A study of e-commerce adoption, Journal of the association for Information Systems, Vol. 1(1), pp. 8.
Gefen, D., Karahanna, E. & Straub, D.W. (2003). Trust and TAM in Online Shopping: An Integrated Model, MIS Quarterly, Vol. 27(1), pp. 51-90.
Gibbs, J., Kraemer, K.L. & Dedrick, J. (2003). Environment and Policy Factors Shaping Global E-Commerce Diffusion: A Cross-Country Comparison, The Information Society, Vol. 19(1), pp. 5-18.
Grandon, E.E. & Pearson, J.M. (2004). Electronic commerce adoption: an empirical study of small and medium US businesses, Information & Management, Vol. 42(1), pp. 197-216.
Grönman, K., Soukka, R., Järvi‐Kääriäinen, T., Katajajuuri, J., Kuisma, M., Koivupuro, H., Ollila, M., Pitkänen, M., Miettinen, O., Silvenius, F., Thun, R., Wessman, H. & Linnanen, L. (2013). Framework for Sustainable Food Packaging Design, Packaging Technology and Science, Vol. 26(4), pp. 187-200.
Ha, S. & Stoel, L. (2009). Consumer e-shopping acceptance: Antecedents in a technology acceptance model, Journal of Business Research, Vol. 62(5), pp. 565-571.
Hague, P.N., Hague, N. & Morgan, C. (2004). Market research in practice: a guide to the basics, Kogan Page Publishers.
Hague, P.N., Hague, N. & Morgan, C. (2013). Market research in practice: How to get greater insight from your market, Kogan Page Publishers.
Hamersveld, M.v. & Bont, C.d. (2008). Market research handbook, 5th; 5. Aufl. ed. John Wiley & Sons, Hoboken, N.J; Chichester, West Sussex, England.
Harrod, S. (2019). e-Commerce Packaging, Smithers Pira, E-Pack Europe, Berlin, 26th March 2019, Limited Availability.
Hartwick, J. & Barki, H. (1994). Explaining the Role of User Participation in Information System Use, Management Science, Vol. 40(4), pp. 440-465.
Hellström, D., Saghir, M., Packaging Logistics, Förpackningslogistik, Lund University & Lunds universitet (2007). Packaging and logistics interactions in retail supply chains, Packaging Technology and Science, Vol. 20(3), pp. 197-216.
Ho, S., Kauffman, R.J. & Liang, T. (2007). A growth theory perspective on B2C e-commerce growth in Europe: An exploratory study, Electronic Commerce Research and Applications, Vol. 6(3), pp. 237-259.
Hoffman, D., Novak, T. & Peralta, M. (1999). Building consumer trust online, Communications of the ACM, Vol. 42(4), pp. 85.
Hofstede, G. (1984). Culture's consequences: international differences in work-related values, Abridg ed. Sage, Newbury Park (Calif.).
120
Hopewell, J., Dvorak, R. & Kosior, E. (2009). Plastics recycling: challenges and opportunities, Philosophical Transactions of the Royal Society B: Biological Sciences, Vol. 364(1526), pp. 2115-2126.
Iacovou, C.L., Benbasat, I. & Dexter, A.S. (1995). Electronic Data Interchange and Small Organizations: Adoption and Impact of Technology, MIS Quarterly, Vol. 19(4), pp. 465-485.
Isaksson, P., Gradin, P., Mittuniversitetet, Institutionen för naturvetenskap, teknik och matematik & Fakulteten för naturvetenskap, teknik och medier (2009). Shear buckling in the core of a corrugated board structure, Composite Structures, Vol. 88(4), pp. 610-614.
Järvi-Kääriäinen, T. & Ollila, M. (2007). Toimiva Pakkaus, Tekijät ja Pakkausteknologia ry, Helsinki 2007.
Johansson, C., Bras, J., Mondragon, I., Nechita, P., Plackett, D., Simon, P., Gregor Svetec, D., Virtanen, S., Giacinti Baschetti, M., Breen, C., Clegg, F., Aucejo, S., Fakulteten för teknik- och naturvetenskap, Avdelningen för kemiteknik & Karlstads universitet (2012). Renewable fibers and bio-based materials for packaging applications-a reveiw of recent developments, BioResources, Vol. 7(2), pp. 2506.
Julkaisufoorumi. (2019). Julkaisukanavahaku, Available online: https://www.tsv.fi/julkaisufoorumi/haku.php.
Keller, W. (2004). International Technology Diffusion, Journal of Economic Literature, Vol. 42(3), pp. 752-782.
Kirwan, M.J. (2013). Handbook of paper and paperboard packaging technology, 2nd; 2. Aufl. ed. Wiley-Blackwell, Ames, Iowa; Chichester, West Sussex.
Kopf, M. (2018). A guide to e-commerce Europe, Book 1: Understanding the European market dynamics, Available online: http://www.iberglobal.com/files/2018-2/e_commerce_europe.pdf [read on 24.6.2019].
Korhonen, J., Koskivaara, A. & Toppinen, A. (2018). Riding a Trojan horse? Future pathways of the fiber-based packaging industry in the bioeconomy, Forest Policy and Economics, pp. 101799.
Korzeniowsk, A. & Jasiczak, J. (2005). Accomplishment of selected package functions in e-commerce. LogForum 1, 1, 2, URL: http://www.logforum.net/vol1/issue1/no2 Accepted, Vol. 3
Kuan, K.K.Y. & Chau, P.Y.K. (2001). A perception-based model for EDI adoption in small businesses using a technology–organization–environment framework, Information & Management, Vol. 38(8), pp. 507-521.
Leidner, D.E. & Kayworth, T. (2006). Review: A Review of Culture in Information Systems Research: Toward a Theory of Information Technology Culture Conflict, MIS Quarterly, Vol. 30(2), pp. 357-399.
Lewis, H., Verghese, K. & Fitzpatrick, L. (2010). Evaluating the sustainability impacts of packaging: The plastic carry bag dilemma, Packaging Technology and Science, Vol. 23(3), pp. 145-160.
121
Lin, H. (2014). Understanding the determinants of electronic supply chain management system adoption: Using the technology–organization–environment framework, Technological Forecasting & Social Change, Vol. 86(-), pp. 80-92.
Lindh, H., Williams, H., Olsson, A., Wikström, F., Karlstads universitet, Institutionen för ingenjörs- och kemivetenskaper & Fakulteten för hälsa, natur- och teknikvetenskap (from 2013) (2016). Elucidating the Indirect Contributions of Packaging to Sustainable Development: A Terminology of Packaging Functions and Features, Packaging Technology and Science, Vol. 29(4-5), pp. 225-246.
Logistiikan maailma. (2019). Electronic commerce and logistics, Available online: http://www.logistiikanmaailma.fi/en/logistics/digitalization/electronic-commerce-and-logistics/ [read on 5.9.2019].
Lohse, G. L., & Spiller, P. (1998). Electronic shopping. Communications of the ACM, 41(7), 81-87.
Lorenzini, R., Biedermann, M., Grob, K., Garbini, D., Barbanera, M. & Braschi, I. (2013). Migration kinetics of mineral oil hydrocarbons from recycled paperboard to dry food: Monitoring of two real cases, Food Additives and Contaminants - Part A Chemis-try, Analysis, Control, Exposure and Risk Assessment, Vol. 30(4), pp. 760-770.
Lundberg, U. (2018). Paper360, The European Containerboard Market, Available online: https://paper360.tappi.org/2018/09/25/the-european-containerboard-market/ [Read on 8.7.2019].
Mallat, N. (2007). Exploring consumer adoption of mobile payments – A qualitative study, Journal of Strategic Information Systems, Vol. 16(4), pp. 413-432.
Manners-Bell, J. (2016). Introduction to global logistics: delivering the goods, Second ed. Kogan Page, Philadelphia, PA.
Marsh, K. & Bugusu, B. (2007). Food Packaging—Roles, Materials, and Environmental Issues, Journal of Food Science, Vol. 72(3), pp. R55.
Mastercard. (2017). Masterindex 2017, Pan-European e-commerce and new payment trends, Available online: https://newsroom.mastercard.com/wp-content/uploads/2017/03/Masterindex-2017.pdf [read on 22.5.2019].
McKinsey&Company. (2019). No ordinary disruption, Winning with new models in packaging 2030. Limited availability.
Moore, G.C. & Benbasat, I. (1991). Development of an Instrument to Measure the Perceptions of Adopting an Information Technology Innovation, Information Systems Research, Vol. 2(3), pp. 192-222.
Moore, G.C. (1987). End User Computing and Office Automation: A Diffusion of Innovation Perspective. INFOR: Information Systems and Operational Research, Vol. 25(3), pp. 214-235.
Murillo, L. (2001). Supply chain management and the international dissemination of e-commerce, Industrial Management & Data Systems, Vol. 101(7), pp. 370-377.
Natarajan, S., Govindarajan, M. & Kumar, B. (2014). Fundamentals of packaging technology, PHI Learning Pvt. Ltd.
122
Neidoni, N. (2015). Contributions on the Design of Unconventional Corrugated Board Structures, Journal of Industrial Design and Engineering Graphics, Vol. 10(10), pp. 95.
Niemelä-Nyrhinen, J. & Uusitalo, O. (2013). Identifying potential sources of value in a packaging value chain, Journal of Business & Industrial Marketing, Vol. 28(2), pp. 76-85.
Nykänen, T. (2018). Adapting to e-commerce, Metsä Board, Available online: https://www.metsaboard.com/Media/Trends-and-inspiration/Pages/Adapting-to-e-commerce.aspx [read on 26.9.2019].
OECD. (2019). Unpacking E-Commerce: Business Models, Trends and Policies, OECD Publishing, Paris, Available online: https://doi.org/10.1787/23561431-en [read on 7.6.2019].
Ostlund, L.E. (1974). Perceived Innovation Attributes as Predictors of Innovativeness, Journal of Consumer Research, Vol. 1(2), pp. 23-29.
Oxley, J.E. & Yeung, B. (2001). E-Commerce Readiness: Institutional Environment and International Competitiveness, Journal of International Business Studies, Vol. 32(4), pp. 705-723.
Paper Industry Technical Association. (2019). Annual Review 2018-2019, Available online: http://edition.pagesuite-professional.co.uk/launch.aspx?pbid=ca713441-18fa-4035-931a-46dec4c65db9 [read on 23.4.2019].
Parasuraman, A., Zeithaml, V.A. & Berry, L.L.6. (1988). SERVQUAL: a multiple-item scale for measuring consumer perceptions of service quality, Journal of Retailing, Vol. 64(1), pp. 12.
Pavlou, P.A. (2003). Consumer Acceptance of Electronic Commerce: Integrating Trust and Risk with the Technology Acceptance Model, International Journal of Electronic Commerce, Vol. 7(3), pp. 101-134.
Pavlou, P.A., Liang, H. & Xue, Y. (2007). Understanding and Mitigating Uncertainty in Online Exchange Relationships: A Principal-Agent Perspective, MIS Quarterly, Vol. 31(1), pp. 105-136.
Pirkkalainen, H. (2019) Tutkimusasetelmat ja menetelmävalinnat, Kurssin Tutkimusmetodologia TTA-15090 luentomateriaali 10.1.2019, Tampereen Yliopisto, Limited Availability.
PlasticsEurope. (2018). Plastics - the Facts 2018, An analysis of European plastics production, demand and waste data. Association of Plastics Manufacturers. Available online:https://www.plasticseurope.org/application/files/6315/4510/9658/Plastics_the_facts_2018_AF_web.pdf [read on 6.11.2019].
PMMI. (2018). E-commerce: Think Inside the Box, Executive Summary, The Association for Packaging and Processing Technologies, Available online: https://pmmi.docsend.com/view/qnnup7v [read on 1.7.2019].
Poll, H. (2014). Sealed Air e-Commerce Survey: Packaging for e-Commerce Success, Executive Summary.
Premkumar, G. & Roberts, M. (1999). Adoption of new information technologies in rural small businesses, Omega, Vol. 27(4), pp. 467-484.
123
Regattieri, A., Santarelli, G., Gamberi, M. & Mora, C. (2014). A New Paradigm for Packaging Design in Web-Based Commerce, International Journal of Engineering Business Management, Vol. 6(1), pp. 1-11.
Retail-Index. (2019). E-commerce retail, Available online: https://www.retail-index.com/E-commerceretail.aspx [read on 24.10.2019].
Riggins, F.J. & Rhee, H.S. (1998). Toward a unified view of electronic commerce, Communications of the ACM, Vol. 41(10), pp. 88-95.
Roberts, P. & Priest, H. (2006). Reliability and validity in research, Nursing standard (Royal College of Nursing (Great Britain) : 1987), Vol. 20(44), pp. 41-45.
Rogers, E.M. (2003). Diffusion of innovations, 5th Edition, Free Press, New York.
Ryan, R.M. & Deci, E.L. (2000). Self-determination theory and the facilitation of intrinsic motivation, social development, and well-being, The American Psychologist, Vol. 55(1), pp. 68-78.
San Martín, S., López-Catalán, B. & Ramón-Jerónimo, M.A. (2012). Factors determining firms' perceived performance of mobile commerce, Industrial Management & Data Systems, Vol. 112(6), pp. 946-963.
Sanguinetti, A., Karlin, B. & Ford, R. (2018). Understanding the path to smart home adoption: Segmenting and describing consumers across the innovation-decision process, Energy Research & Social Science, Vol. 46 pp. 274-283.
Sarkis, J., Meade, L.M. & Talluri, S. (2004). E-logistics and the natural environment, Supply Chain Management: An International Journal, Vol. 9(4), pp. 303-312.
Saunders, M., Lewis, P., Thornhill, A. (2009). Research methods for Business Students, 5th edition. Prentice Hall.
Shang, R., Chen, Y. & Shen, L. (2005). Extrinsic versus intrinsic motivations for consumers to shop on-line, Information & Management, Vol. 42(3), pp. 401-413.
Silvenius, F., Grönman, K., Katajajuuri, J., Soukka, R., Koivupuro, H. & Virtanen, Y. (2014). The Role of Household Food Waste in Comparing Environmental Impacts of Packaging Alternatives, Packaging Technology and Science, Vol. 27(4), pp. 277-292.
Smithers. (n.a.). Five approaches to make e-commerce packaging sustainable, Available online: https://www.smithers.com/resources/2018/nov/sustainable-packaging-materials-in-e-commerce [read on 15.10.2019].
Statista. (2019). E-commerce revenue forecast in Europe from 2017 to 2023 by segment (in billion U.S. dollars), Available online: https://www.statista.com/statistics/715678/e-commerce-revenue-in-europe-fashion-by-segments/ [read on 10.9.2019].
Sundqvist, S., Frank, L. & Puumalainen, K. (2005). The effects of country characteristics, cultural similarity and adoption timing on the diffusion of wireless communications, Journal of Business Research, Vol. 58(1), pp. 107-110.
Sustainable Packaging Coalition. (2011). Definition of Sustainable Packaging, Available online: https://sustainablepackaging.org/wp-content/uploads/2017/09/Definition-of-Sustainable-Packaging.pdf [read on 22.8.2019].
124
Taylor, S. & Todd, P.A. (1995). Understanding Information Technology Usage: A Test of Competing Models, Information Systems Research, Vol. 6(2), pp. 144-176.
The International Organization for Standardization. (2006). ISO 14044, International Standard, Environmental management – life cycle assessment – Requirements and guidelines. Available at: https://www.iso.org/obp/ui/#iso:std:iso:14044:ed-1:v1:en [read on 22.8.2019]
THIMM. (n.a.). E-commerce & Logistics, Available online: https://www.thimm.com/products-services/sectors/e-commerce-logistics/ [read on 26.9.2019].
Thompson, R.C., Moore, C.J., Frederick S. vom Saal & Swan, S.H. (2009). Plastics, the environment and human health: current consensus and future trends, Philosophical Transactions of the Royal Society B: Biological Sciences, Vol. 364(1526), pp. 2153-2166.
Thompson, R.C., Swan, S.H., Moore, C.J. & Frederick S. vom Saal (2009). Our plastic age, Philosophical Transactions of the Royal Society B: Biological Sciences, Vol. 364(1526), pp. 1973-1976.
Tornatzky, L.G. & Klein, K.J. (1982). Innovation characteristics and innovation adoption-implementation: A meta-analysis of findings, IEEE Transactions on Engineering Management, Vol. EM-29(1), pp. 28-45.
Tornatzky, L.G., Fleischer, M. & Chakrabarti, A.K. (1990). Processes of technological innovation, Lexington books, Lexington, MA.
Twede, D., Selke, S.E., Kamdem, D. & Shires, D. (2005). Cartons, Crates and Corrugated Board, Handbook of Paper and Wood Packaging Technology.pg, pp. 155-163.
United Nations. (2015). Information Economy Report, Unlocking the Potential of e-commerce for Developing Countries, United Nations Conference on Trade and Development, Available online: https://unctad.org/en/PublicationsLibrary/ier2015_en.pdf [read on 25.6.2019].
Venkatesh, V. & Bala, H. (2008). Technology acceptance model 3 and a research agenda on interventions, Decision Sciences, Vol. 39(2), pp. 273-315.
Venkatesh, V. & Davis, F.D. (1996). A model of the antecedents of perceived ease of use: Development and test, Decision Sciences, Vol. 27(3), pp. 451-477.
Venkatesh, V. & Davis, F.D. (2000). A Theoretical Extension of the Technology Acceptance Model: Four Longitudinal Field Studies, Management Science, Vol. 46(2), pp. 186-204.
Venkatesh, V. & Morris, M.G. (2000). Why Don't Men Ever Stop to Ask for Directions? Gender, Social Influence, and Their Role in Technology Acceptance and Usage Behavior, MIS Quarterly, Vol. 24(1), pp. 115-139.
Venkatesh, V. (2000). Determinants of Perceived Ease of Use: Integrating Control, Intrinsic Motivation, and Emotion into the Technology Acceptance Model, Information Systems Research, Vol. 11(4), pp. 342-365.
125
Verghese, K. & Lewis, H. (2007). Environmental innovation in industrial packaging: a supply chain approach, International Journal of Production Research, Vol. 45(18-19), pp. 4381-4401.
Vijayasarathy, L.R. (2004). Predicting consumer intentions to use on-line shopping: the case for an augmented technology acceptance model, Information & Management, Vol. 41(6), pp. 747-762.
Visser, E. (2002). Packaging on the Web: an underused resource, Design Management Review, Vol. 13(1), pp. 62-67.
Walczuch, R., Van Braven, G. & Lundgren, H. (2000). Internet adoption barriers for small firms in The Netherlands, European Management Journal, Vol. 18(5), pp. 561-572.
Wejnert, B. (2002). Integrating Models of Diffusion of Innovations: A Conceptual Framework, Annual Review of Sociology, Vol. 28(1), pp. 297-326.
Wever, R. & Vogtländer, J. (2013). Eco‐efficient Value Creation: An Alternative Perspective on Packaging and Sustainability, Packaging Technology and Science, Vol. 26(4), pp. 229-248.
Williams, H., Wikström, F., Avdelningen för energi-, miljö- och byggteknik, Fakulteten för teknik- och naturvetenskap & Karlstads universitet, (2011). Environmental impact of packaging and food losses in a life cycle perspective: a comparative analysis of five food items, Journal of Cleaner Production, Vol. 19(1), pp. 43-48.
Wong, P. (2003). Global and National Factors Affecting E-Commerce Diffusion in Singapore, The Information Society, Vol. 19(1), pp. 19-32.
Yap, A.Y., Das, J., Burbridge, J. & Cort, K. (2006). A Composite-Model for E-Commerce Diffusion: Integrating Cultural and Socio-Economic Dimensions to the Dynamics of Diffusion, Journal of Global Information Management (JGIM), Vol. 14(3), pp. 17-38.
Yu, Y., Wang, X., Zhong, R.Y. & Huang, G.Q. (2017). E-commerce logistics in supply chain management Implementations and future perspective in furniture industry, Industrial Management and Data Systems, Vol. 117(10), pp. 2263-2286.
Zhang, X. (2010). Dimensions of E-commerce Benefits as Perceived by Businesses, Springer Berlin Heidelberg, Berlin, Heidelberg, pp. 52-57.
Zhu, K. & Kraemer, K.L. (2005). Post-Adoption Variations in Usage and Value of E-Business by Organizations: Cross-Country Evidence from the Retail Industry, Information Systems Research, Vol. 16(1), pp. 61-84.
Zhu, K., Dong, S., Xu, S.X. & Kraemer, K.L. (2006). Innovation diffusion in global contexts: determinants of post-adoption digital transformation of European companies, European Journal of Information Systems, Vol. 15(6), pp. 601-616.
Zhu, K., Kraemer, K. & Xu, S. (2003). Electronic business adoption by European firms: a cross-country assessment of the facilitators and inhibitors, European Journal of Information Systems, Vol. 12(4), pp. 251-268.
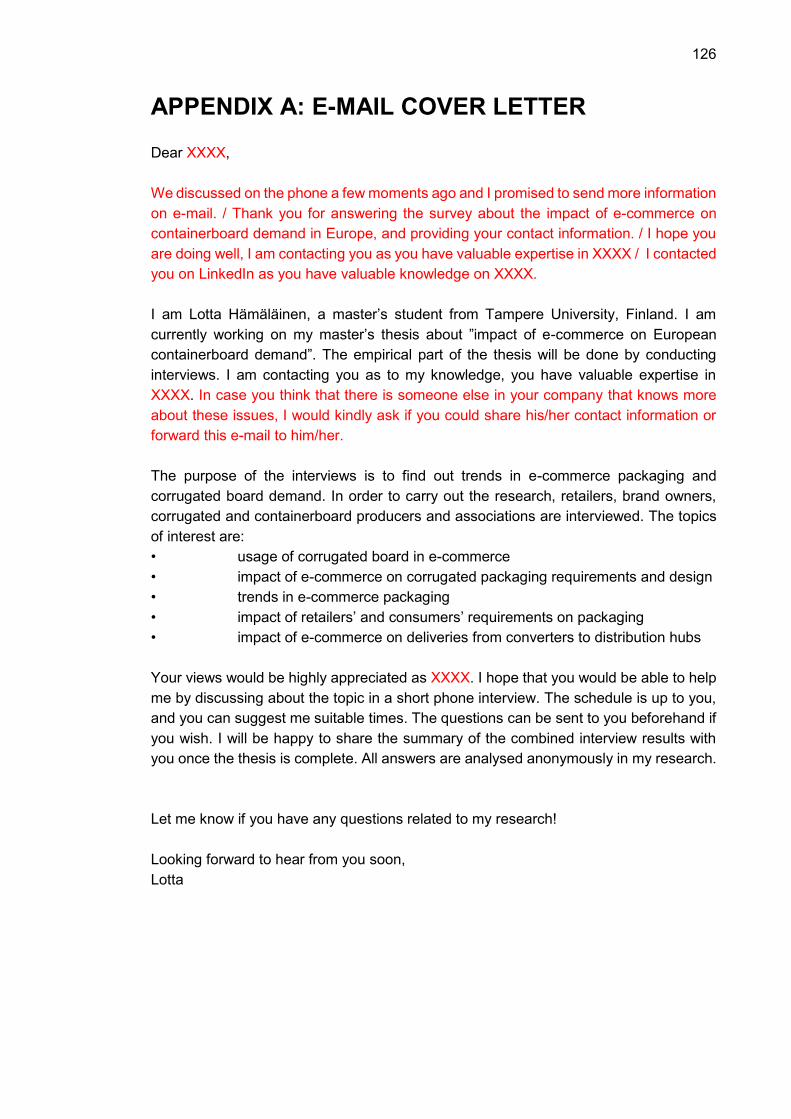
126
APPENDIX A: E-MAIL COVER LETTER
Dear XXXX,
We discussed on the phone a few moments ago and I promised to send more information
on e-mail. / Thank you for answering the survey about the impact of e-commerce on
containerboard demand in Europe, and providing your contact information. / I hope you
are doing well, I am contacting you as you have valuable expertise in XXXX / I contacted
you on LinkedIn as you have valuable knowledge on XXXX.
I am Lotta Hämäläinen, a master’s student from Tampere University, Finland. I am
currently working on my master’s thesis about ”impact of e-commerce on European
containerboard demand”. The empirical part of the thesis will be done by conducting
interviews. I am contacting you as to my knowledge, you have valuable expertise in
XXXX. In case you think that there is someone else in your company that knows more
about these issues, I would kindly ask if you could share his/her contact information or
forward this e-mail to him/her.
The purpose of the interviews is to find out trends in e-commerce packaging and
corrugated board demand. In order to carry out the research, retailers, brand owners,
corrugated and containerboard producers and associations are interviewed. The topics
of interest are:
• usage of corrugated board in e-commerce
• impact of e-commerce on corrugated packaging requirements and design
• trends in e-commerce packaging
• impact of retailers’ and consumers’ requirements on packaging
• impact of e-commerce on deliveries from converters to distribution hubs
Your views would be highly appreciated as XXXX. I hope that you would be able to help
me by discussing about the topic in a short phone interview. The schedule is up to you,
and you can suggest me suitable times. The questions can be sent to you beforehand if
you wish. I will be happy to share the summary of the combined interview results with
you once the thesis is complete. All answers are analysed anonymously in my research.
Let me know if you have any questions related to my research!
Looking forward to hear from you soon,
Lotta
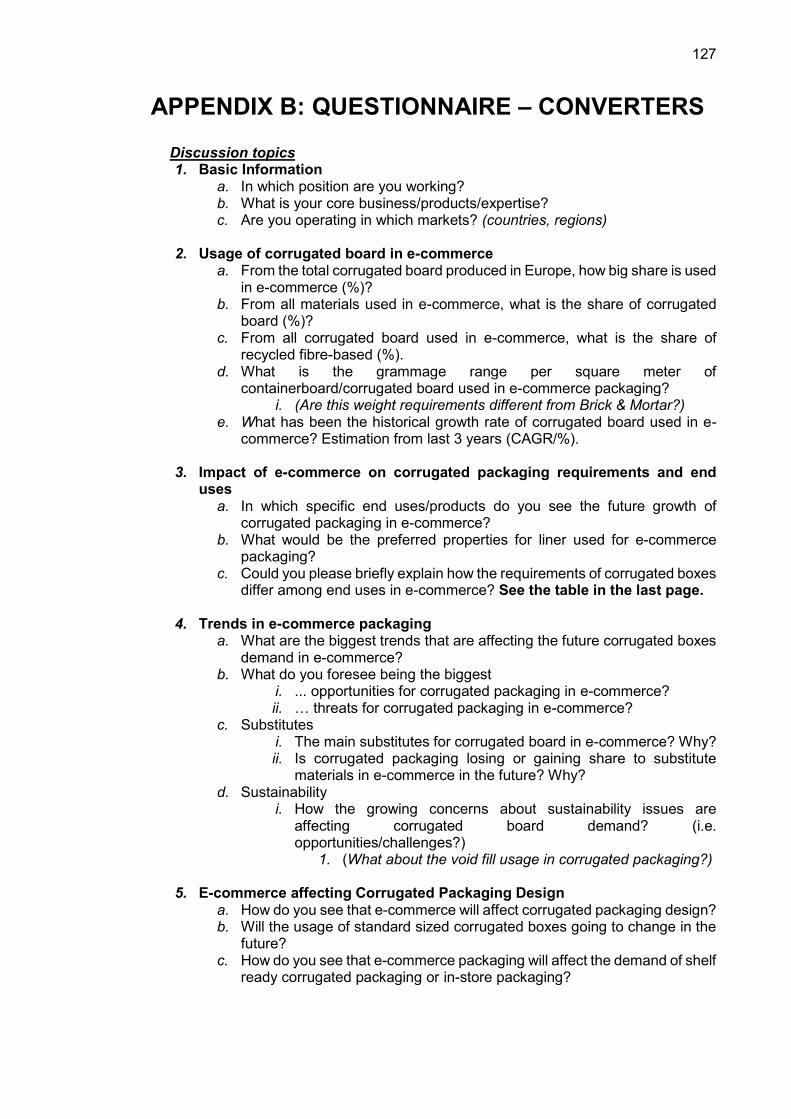
127
APPENDIX B: QUESTIONNAIRE – CONVERTERS
Discussion topics 1. Basic Information
a. In which position are you working? b. What is your core business/products/expertise? c. Are you operating in which markets? (countries, regions)
2. Usage of corrugated board in e-commerce
a. From the total corrugated board produced in Europe, how big share is used in e-commerce (%)?
b. From all materials used in e-commerce, what is the share of corrugated board (%)?
c. From all corrugated board used in e-commerce, what is the share of recycled fibre-based (%).
d. What is the grammage range per square meter of containerboard/corrugated board used in e-commerce packaging?
i. (Are this weight requirements different from Brick & Mortar?) e. What has been the historical growth rate of corrugated board used in e-
commerce? Estimation from last 3 years (CAGR/%).
3. Impact of e-commerce on corrugated packaging requirements and end uses
a. In which specific end uses/products do you see the future growth of corrugated packaging in e-commerce?
b. What would be the preferred properties for liner used for e-commerce packaging?
c. Could you please briefly explain how the requirements of corrugated boxes differ among end uses in e-commerce? See the table in the last page.
4. Trends in e-commerce packaging
a. What are the biggest trends that are affecting the future corrugated boxes demand in e-commerce?
b. What do you foresee being the biggest i. ... opportunities for corrugated packaging in e-commerce? ii. … threats for corrugated packaging in e-commerce?
c. Substitutes i. The main substitutes for corrugated board in e-commerce? Why? ii. Is corrugated packaging losing or gaining share to substitute
materials in e-commerce in the future? Why? d. Sustainability
i. How the growing concerns about sustainability issues are affecting corrugated board demand? (i.e. opportunities/challenges?)
1. (What about the void fill usage in corrugated packaging?)
5. E-commerce affecting Corrugated Packaging Design a. How do you see that e-commerce will affect corrugated packaging design? b. Will the usage of standard sized corrugated boxes going to change in the
future? c. How do you see that e-commerce packaging will affect the demand of shelf
ready corrugated packaging or in-store packaging?
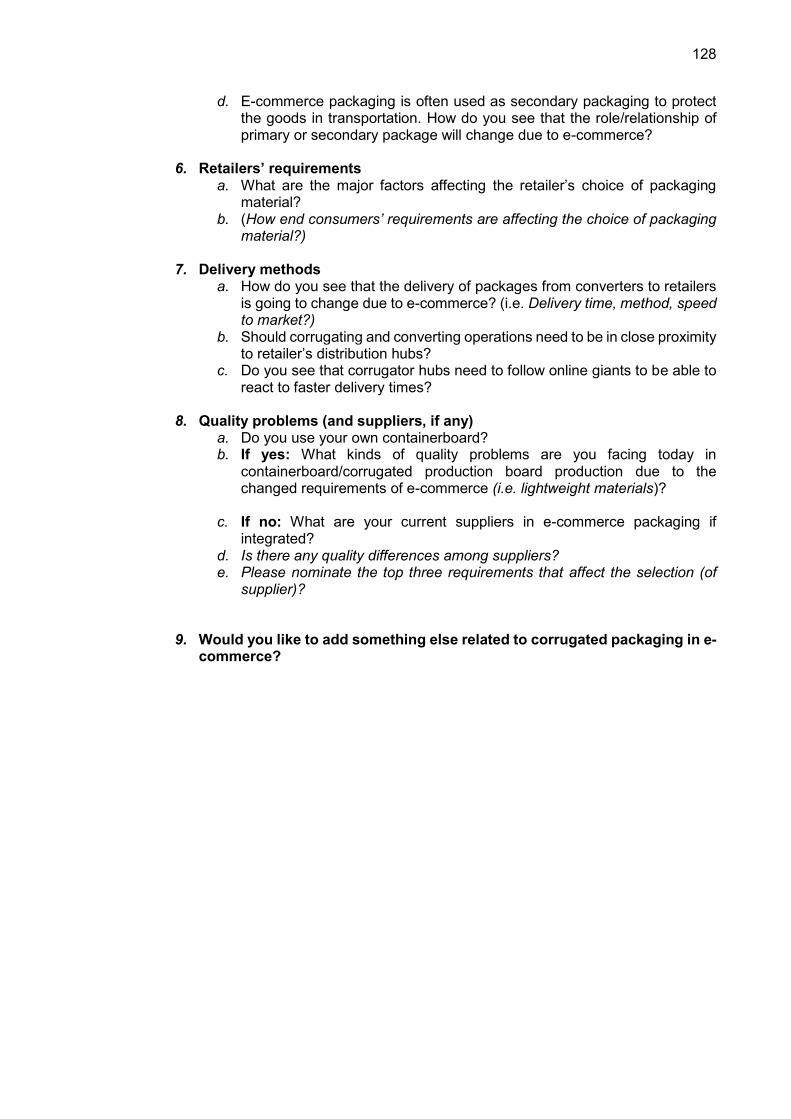
128
d. E-commerce packaging is often used as secondary packaging to protect the goods in transportation. How do you see that the role/relationship of primary or secondary package will change due to e-commerce?
6. Retailers’ requirements
a. What are the major factors affecting the retailer’s choice of packaging material?
b. (How end consumers’ requirements are affecting the choice of packaging material?)
7. Delivery methods
a. How do you see that the delivery of packages from converters to retailers is going to change due to e-commerce? (i.e. Delivery time, method, speed to market?)
b. Should corrugating and converting operations need to be in close proximity to retailer’s distribution hubs?
c. Do you see that corrugator hubs need to follow online giants to be able to react to faster delivery times?
8. Quality problems (and suppliers, if any)
a. Do you use your own containerboard? b. If yes: What kinds of quality problems are you facing today in
containerboard/corrugated production board production due to the changed requirements of e-commerce (i.e. lightweight materials)?
c. If no: What are your current suppliers in e-commerce packaging if
integrated? d. Is there any quality differences among suppliers? e. Please nominate the top three requirements that affect the selection (of
supplier)?
9. Would you like to add something else related to corrugated packaging in e-
commerce?
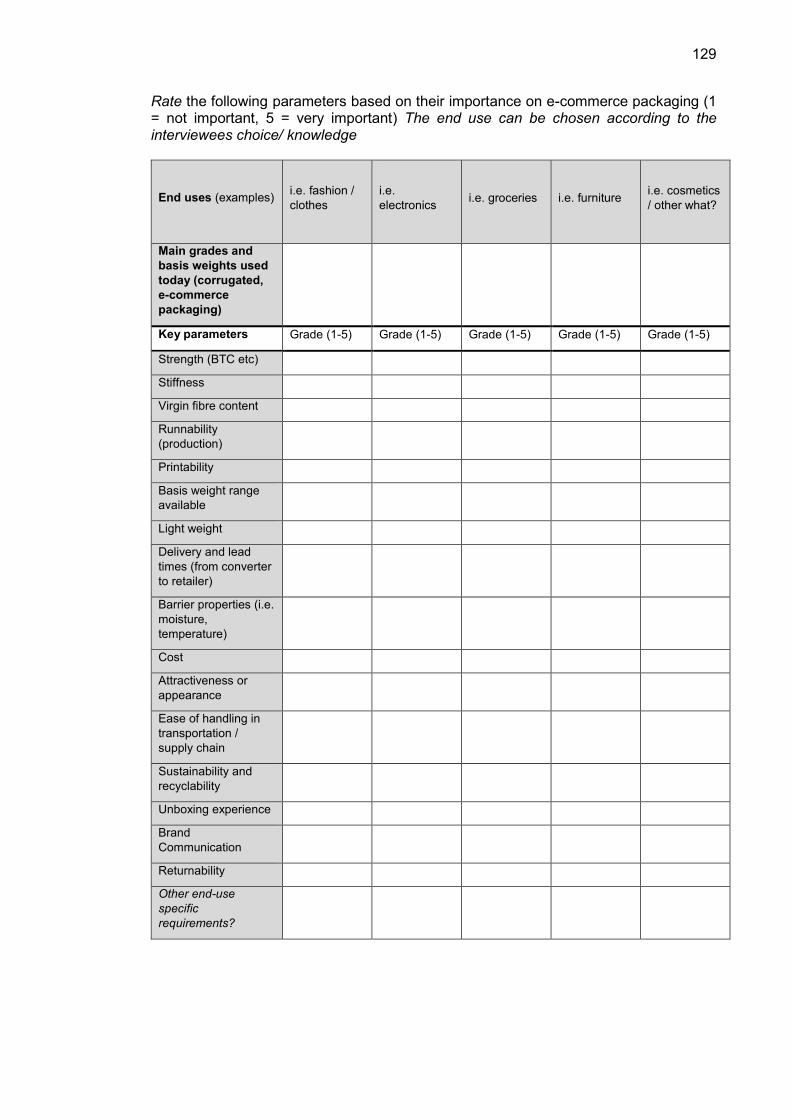
129
Rate the following parameters based on their importance on e-commerce packaging (1 = not important, 5 = very important) The end use can be chosen according to the interviewees choice/ knowledge
End uses (examples) i.e. fashion /
clothes
i.e.
electronics
i.e. groceries
i.e. furniture
i.e. cosmetics
/ other what?
Main grades and
basis weights used
today (corrugated,
e-commerce
packaging)
Key parameters Grade (1-5) Grade (1-5) Grade (1-5) Grade (1-5) Grade (1-5)
Strength (BTC etc)
Stiffness
Virgin fibre content
Runnability
(production)
Printability
Basis weight range
available
Light weight
Delivery and lead
times (from converter
to retailer)
Barrier properties (i.e.
moisture,
temperature)
Cost
Attractiveness or
appearance
Ease of handling in
transportation /
supply chain
Sustainability and
recyclability
Unboxing experience
Brand
Communication
Returnability
Other end-use
specific
requirements?
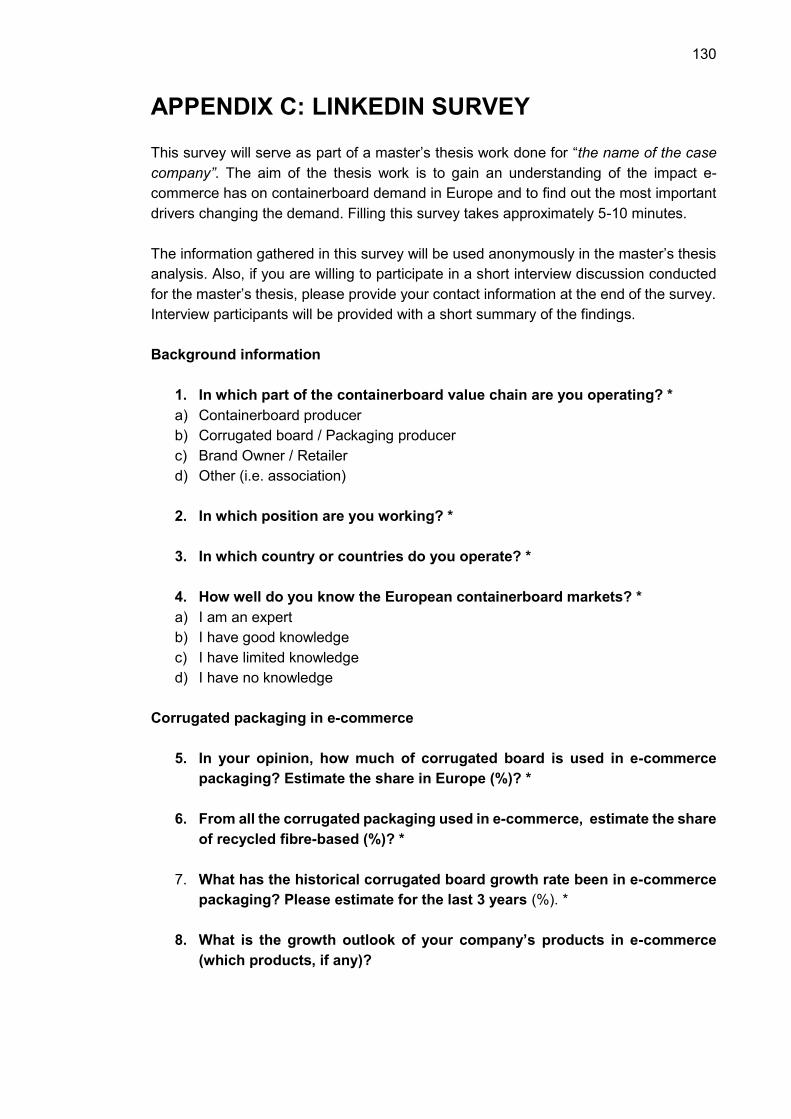
130
APPENDIX C: LINKEDIN SURVEY
This survey will serve as part of a master’s thesis work done for “the name of the case
company”. The aim of the thesis work is to gain an understanding of the impact e-
commerce has on containerboard demand in Europe and to find out the most important
drivers changing the demand. Filling this survey takes approximately 5-10 minutes.
The information gathered in this survey will be used anonymously in the master’s thesis
analysis. Also, if you are willing to participate in a short interview discussion conducted
for the master’s thesis, please provide your contact information at the end of the survey.
Interview participants will be provided with a short summary of the findings.
Background information
1. In which part of the containerboard value chain are you operating? *
a) Containerboard producer
b) Corrugated board / Packaging producer
c) Brand Owner / Retailer
d) Other (i.e. association)
2. In which position are you working? *
3. In which country or countries do you operate? *
4. How well do you know the European containerboard markets? *
a) I am an expert
b) I have good knowledge
c) I have limited knowledge
d) I have no knowledge
Corrugated packaging in e-commerce
5. In your opinion, how much of corrugated board is used in e-commerce
packaging? Estimate the share in Europe (%)? *
6. From all the corrugated packaging used in e-commerce, estimate the share
of recycled fibre-based (%)? *
7. What has the historical corrugated board growth rate been in e-commerce
packaging? Please estimate for the last 3 years (%). *
8. What is the growth outlook of your company’s products in e-commerce
(which products, if any)?
131
9. Please name the main substitutes for corrugated packaging in e-
commerce. *
10. In your opinion, is corrugated packaging to lose or to gain share from its
substitutes in e-commerce? Please explain briefly. *
11. How do you see that the growing sustainability concerns are affecting
corrugated board demand? *
12. How do you see that the delivery of packages will change, e.g. delivery
methods, speed to market, package distribution hubs? *
13. Would corrugating operations need to be in close proximity to distribution
hubs? *
Containerboard quality and selection criteria
14. What do you consider the most important properties for liners in e-
commerce? Please name 3 (most important first, least important last) *
15. Will the liners used in e-commerce packaging be different in the future? If
so, how? *
Willingness to participate in a short interview discussion (15-30min)
Interview participants will be provided a short summary of the findings. Please leave your
contact details:
16. Name
17. Company / Association
18. Email / Phone number
19. Suitable time (date, time)
Thank you for participating in the survey!