The Total Economic Impact™ Of SAP Commerce Cloud (for ...
22
A Forrester Total Economic Impact™ Study Commissioned By SAP June 2017 The Total Economic Impact ™ Of SAP Commerce Cloud (for B2B) Cost Savings And Business Benefits Enabled By SAP Commerce Cloud (for B2B)
-
Upload
khangminh22 -
Category
Documents
-
view
5 -
download
0
Transcript of The Total Economic Impact™ Of SAP Commerce Cloud (for ...
A Forrester Total Economic Impact™
Study Commissioned By SAP
June 2017
The Total Economic Impact™ Of SAP Commerce Cloud (for B2B)
Cost Savings And Business Benefits Enabled By SAP Commerce Cloud (for B2B)
Table Of Contents Executive Summary 1
Key Findings 1
TEI Framework And Methodology 4
The SAP Commerce Cloud Customer Journey 5
Interviewed Organizations 5
Composite Organization 5
Key Challenges 6
Solution Requirements 6
Key Results 7
Financial Analysis 8
Benefit 1: Increased Net-New Revenue Due to Improving AOV 8
Benefit 2: Improved Margins Due to Reduction in Order Processing and Customer Acquisition Costs 10
Benefit 3: Improved Marketing / Ecommerce Team Productivity 11
Unquantified Benefits 12
Flexibility 13
Cost 1: License or Subscription Fees 14
Cost 2: Ongoing Costs 15
Cost 3: Initial Implementation Costs 16
Financial Summary 18
SAP Commerce Cloud 19
Appendix A: Total Economic Impact 20
Project Director:
Anish Shah
June 2017
ABOUT FORRESTER CONSULTING
Forrester Consulting provides independent and objective research-based
consulting to help leaders succeed in their organizations. Ranging in scope from a
short strategy session to custom projects, Forrester’s Consulting services connect
you directly with research analysts who apply expert insight to your specific
business challenges. For more information, visit forrester.com/consulting.
© 2017, Forrester Research, Inc. All rights reserved. Unauthorized reproduction
is strictly prohibited. Information is based on best available resources.
Opinions reflect judgment at the time and are subject to change. Forrester®,
Technographics®, Forrester Wave, RoleView, TechRadar, and Total Economic
Impact are trademarks of Forrester Research, Inc. All other trademarks are the
property of their respective companies. For additional information, go to
forrester.com
1 | The Total Economic Impact™ Of SAP Commerce Cloud (for B2B)
Executive Summary
SAP Hybris Commerce Cloud (for B2B), now part of SAP Commerce Cloud,
provides the industry-leading commerce platform that enables organizations
of all sizes to engage and transact with their customers via any digital and
physical channels. Our commerce platform supports all go-to-market
models, including B2C, B2B, and B2B2C. SAP commissioned Forrester
Consulting to conduct a Total Economic Impact™ (TEI) study and examine
the potential return on investment (ROI) enterprises may realize by
deploying the SAP Commerce Cloud. The purpose of this study is to provide
readers with a framework to evaluate the potential financial impact of the
SAP Commerce Cloud solution on their organizations.
SAP Commerce Cloud enables companies to deliver personalized digital
commerce experiences. Our feature-rich and comprehensive commerce
platform simplifies digital transformation, reduces TCO, and accelerates
time-to-value which differentiates customer experiences and grows revenue.
Interviewed organizations realized improved conversion rates and increased
average order value from its customers by having the ability to provide
customized pricing, deliver sophisticated merchandizing, incorporate
increased analytics into insights, and promote more frequent and bulk
ordering.
To better understand the benefits, costs, and risks associated with this
investment, Forrester surveyed and interviewed 40 customers with years of
experience using SAP Commerce Cloud. To reflect the Total Economic
Impact that SAP Commerce Cloud could have on an organization, Forrester
developed a composite or representative organization based on benefits
and cost data gathered from the customer surveys and interviews. The
composite organization profile is comprised of the characteristics of the
companies Forrester surveyed and interviewed, and is used to present the
aggregate financial analysis in this study.
Prior to using SAP Commerce Cloud, the composite organization delivered
a large portion of their sales via account managers assigned to specific
regions; however, each market had its own backend system for invoicing,
collecting data, and processing orders. This made reconciliation between
different systems a manual effort, and led to inconsistent user interface and
experience for customers. Additionally, customers started expecting the
composite organization to develop an Ecommerce platform to match the
experience, usability, and features of B2C Ecommerce platforms.
Key Findings
Quantified benefits. The following risk-adjusted quantified benefits are
representative of those experienced by the organizations surveyed and
interviewed, and reflect the financial analysis associated with the composite
organization. All values are reported in three-year Net Present Value (NPV):
› Improving Average Order Value (AOV), resulting in increased net-
new revenue of $15.9 million. SAP Commerce Cloud created a
seamless system interface across all product areas for their B2B clients.
For example, B2B clients were now able to view past orders, automate
recurring orders, and view recommended products. This benefit in effect
resulted in improved AOV.
Benefits And Costs
Increased Net-New Revenue due to Improving Average Order Value:
$15.9 million
Improved margins due to Reduction in Processing Costs:
$7.1 million
Increased Revenue through the Digital Channel by:
50%
2 | The Total Economic Impact™ Of SAP Commerce Cloud (for B2B)
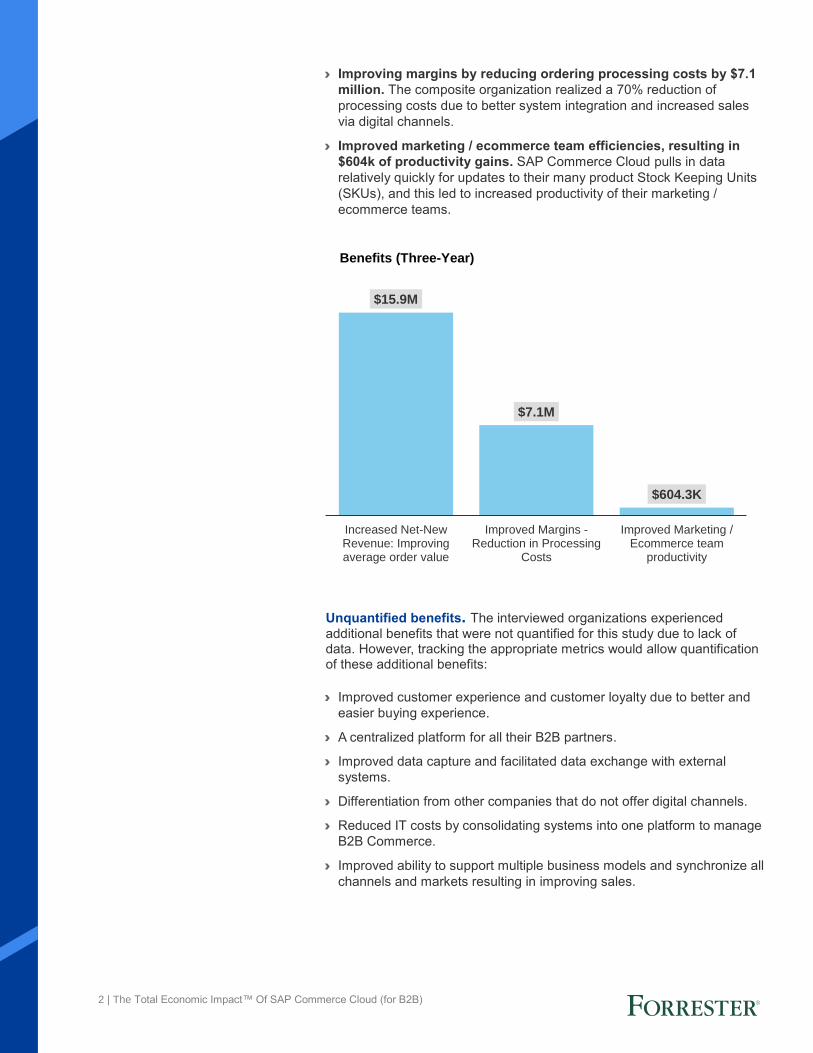
› Improving margins by reducing ordering processing costs by $7.1
million. The composite organization realized a 70% reduction of
processing costs due to better system integration and increased sales
via digital channels.
› Improved marketing / ecommerce team efficiencies, resulting in
$604k of productivity gains. SAP Commerce Cloud pulls in data
relatively quickly for updates to their many product Stock Keeping Units
(SKUs), and this led to increased productivity of their marketing /
ecommerce teams.
Unquantified benefits. The interviewed organizations experienced
additional benefits that were not quantified for this study due to lack of data. However, tracking the appropriate metrics would allow quantification of these additional benefits:
› Improved customer experience and customer loyalty due to better and
easier buying experience.
› A centralized platform for all their B2B partners.
› Improved data capture and facilitated data exchange with external
systems.
› Differentiation from other companies that do not offer digital channels.
› Reduced IT costs by consolidating systems into one platform to manage
B2B Commerce.
› Improved ability to support multiple business models and synchronize all
channels and markets resulting in improving sales.
$15.9M
$7.1M
$604.3K
Increased Net-NewRevenue: Improvingaverage order value
Improved Margins -Reduction in Processing
Costs
Improved Marketing /Ecommerce team
productivity
Benefits (Three-Year)

3 | The Total Economic Impact™ Of SAP Commerce Cloud (for B2B)
Costs. The following risk-adjusted cost is representative of those
experienced by the companies interviewed, and reflect the financial analysis
associated with the composite organization. All values are reported in three-
year NPV:
› License or subscription fees, totaling $1.3 million. These are based
on the number of core processors using the SAP Commerce Cloud
platform.
› Ongoing costs, totaling $3.6 million. The ongoing costs were modeled
as 12 internal FTEs to support SAP Commerce Cloud, and ongoing
professional services to maintain the solution.
› Initial implementation costs, totaling $880k. Implementation took 8
months for 20 staff at 30% utilization, with annual fully-burdened salaries
of $100,000 each, in addition to professional services totaling $400,000.
Forrester’s surveys and interviews with 40 existing clients and subsequent
financial analysis found that an organization based on these interviewed
organizations experienced benefits of $23.5 million over three years versus
costs of $5.8 million, adding up to a net present value (NPV) of $17.7 million
and an ROI of 307%.
ROI 307%
Benefits PV $23.5 million
NPV $17.7 million
Payback < 1 year
4 | The Total Economic Impact™ Of SAP Commerce Cloud (for B2B)
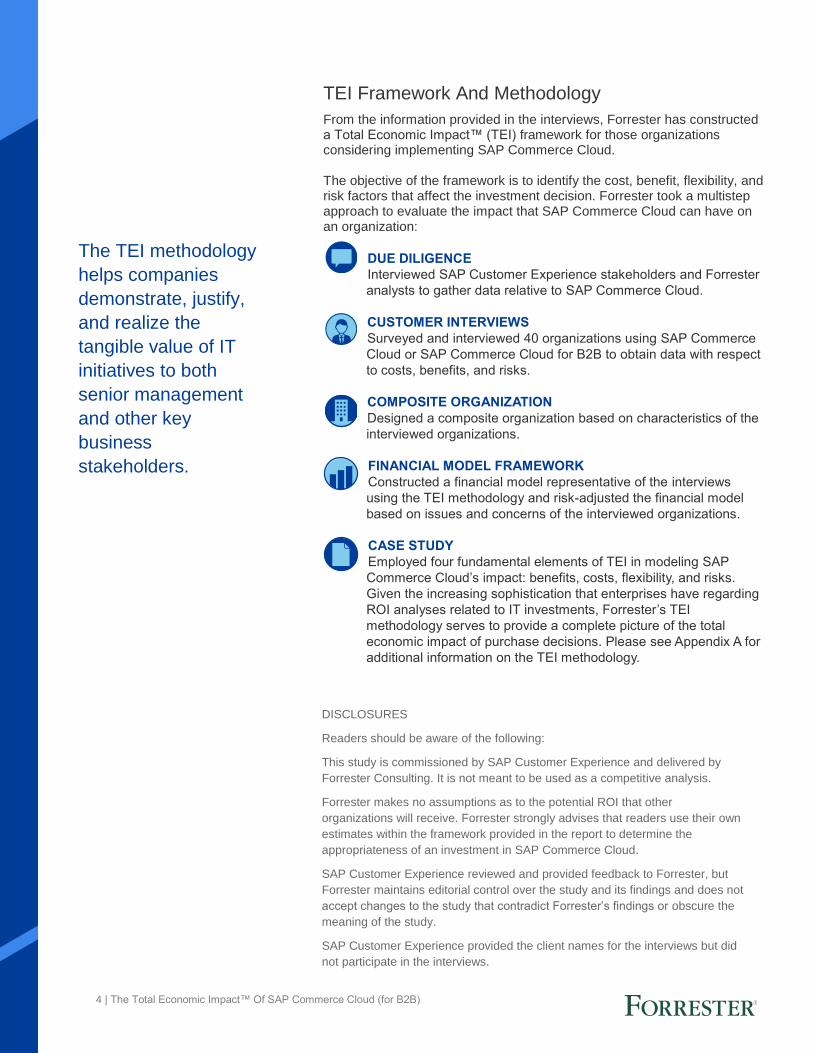
TEI Framework And Methodology
From the information provided in the interviews, Forrester has constructed a Total Economic Impact™ (TEI) framework for those organizations considering implementing SAP Commerce Cloud. The objective of the framework is to identify the cost, benefit, flexibility, and risk factors that affect the investment decision. Forrester took a multistep approach to evaluate the impact that SAP Commerce Cloud can have on an organization:
DUE DILIGENCE
Interviewed SAP Customer Experience stakeholders and Forrester
analysts to gather data relative to SAP Commerce Cloud.
CUSTOMER INTERVIEWS
Surveyed and interviewed 40 organizations using SAP Commerce
Cloud or SAP Commerce Cloud for B2B to obtain data with respect
to costs, benefits, and risks.
COMPOSITE ORGANIZATION
Designed a composite organization based on characteristics of the
interviewed organizations.
FINANCIAL MODEL FRAMEWORK
Constructed a financial model representative of the interviews
using the TEI methodology and risk-adjusted the financial model
based on issues and concerns of the interviewed organizations.
CASE STUDY
Employed four fundamental elements of TEI in modeling SAP
Commerce Cloud’s impact: benefits, costs, flexibility, and risks.
Given the increasing sophistication that enterprises have regarding
ROI analyses related to IT investments, Forrester’s TEI
methodology serves to provide a complete picture of the total
economic impact of purchase decisions. Please see Appendix A for
additional information on the TEI methodology.
The TEI methodology
helps companies
demonstrate, justify,
and realize the
tangible value of IT
initiatives to both
senior management
and other key
business
stakeholders.
DISCLOSURES
Readers should be aware of the following:
This study is commissioned by SAP Customer Experience and delivered by
Forrester Consulting. It is not meant to be used as a competitive analysis.
Forrester makes no assumptions as to the potential ROI that other
organizations will receive. Forrester strongly advises that readers use their own
estimates within the framework provided in the report to determine the
appropriateness of an investment in SAP Commerce Cloud.
SAP Customer Experience reviewed and provided feedback to Forrester, but
Forrester maintains editorial control over the study and its findings and does not
accept changes to the study that contradict Forrester’s findings or obscure the
meaning of the study.
SAP Customer Experience provided the client names for the interviews but did
not participate in the interviews.

5 | The Total Economic Impact™ Of SAP Commerce Cloud (for B2B)
The SAP Commerce Cloud Customer
Journey
BEFORE AND AFTER THE SAP COMMERCE CLOUD INVESTMENT
Interviewed Organizations
For this study, Forrester surveyed and interviewed 40 clients using SAP
Commerce Cloud or SAP Commerce Cloud. Interviewed clients include
the following:
Composite Organization
Based on the interviews, Forrester constructed a TEI framework, a
composite company, and an associated ROI analysis that illustrates the
areas financially affected. The composite organization is representative of
the 40 companies that Forrester surveyed and interviewed and is used to
present the aggregate financial analysis in the next section. The composite
organization that Forrester synthesized from the client surveys and
interviews has the following characteristics:
› Description of composite. The composite organization is an
international organization based in North America, with $1 billion in
annual revenues and 200k customers. Prior to implementing SAP
Commerce Cloud, each market had its own backend system for
invoicing, collecting data, and processing orders; a large portion of
their sales were delivered by account managers and sales reps within
their specific regions. B2B organizations invest highly in field sales
reps to make relationships and process orders, and the clients
surveyed and interviewed are looking to taking that and transfer to an
online environment similar to the B2C approach. The composite
organization had an AOV of $5k, with 30% of their revenue coming via
their digital sales channel.
INDUSTRY REGION INTERVIEWEE Key Goals
Polymers International Organization based in Europe
Senior Software Engineer
• Provide a centralized platform for all your B2B partners
• Improve customer experience
• Reduce operational costs
Biotechnology International Organization based in Europe
Head of Digital Accelerator IT • Improve user experience
• Streamline processing and order fulfillment
Ophthalmology International Organization based in North America
Head of Global Digital • Deliver increased revenue through
digital channel
• Reduce integration and IT costs
Retail Organization based in North America
Director of Customer Intelligence and Marketing Analytics
• Provide customers with personalized interface, navigation, and search capabilities
• Capture data and facilitate data exchange with external systems
Key assumptions
200,000 customers
$5000 AOV
30% revenue via digital
sales channel prior to SAP
Commerce Cloud

6 | The Total Economic Impact™ Of SAP Commerce Cloud (for B2B)
› Deployment characteristics. The composite organization used SAP
Commerce Cloud to create a consistent system interface across their
functional products, allowing their B2B customers to experience a B2C
customer experience (e.g., viewing past orders, automate recurring
orders, view recommended products, etc.).
Key Challenges
Prior to their investment in SAP Commerce Cloud, the composite organization had the following challenges:
› Each market has its own backend system for invoicing, collecting data,
and processing orders. This made for an overly complicated system,
and there were missed opportunities to consolidate and act on
customer data.
› High training costs and challenges with customer relationship building
due to sales team attrition.
› Smaller B2B customers receiving a low frequency of touchpoints
compared to the large B2B customers.
› Managing cost of errors from the field service representatives (order
entry, invoicing, etc.).
› Inconsistent user interface and experience for customers.
› Inconsistent content and pricing across all channels.
› Bulky order management and fulfillment process.
› Low customer loyalty and retention rates.
› Inefficient and sluggish metrics availability to inform business
decisions.
Solution Requirements
The composite organization searched for a solution that could:
› Provide a single, consolidated, and consistent platform for back-end
processes.
› Provide a B2C experience for their B2B clients.
› Manage ecosystem of suppliers, distributors, and partners.
› Provide a centralized platform for all their B2B customers and partners.
› Ensure there is content and pricing consistency across all channels.
› Streamline order management and fulfillment processes.
› Reduce burden on internal resources to continually updated database
with new product SKUs, features, and pricing.
› Help reduce errors due to manual processes.
› Improve margins and average order value of each sale.
“We have been able to almost
completely move away from
manual invoicing due to SAP
Commerce Cloud. This saves
our resources time, reduces
errors, and helps us deliver a
better customer experience.
Software Engineer, Polymers
Organization
“Our customers can now buy
something when they need
something. They do not have
to wait for the sales rep to call
and take their order. SAP
Commerce Cloud makes it
easy, convenient, and
transparent for our customers
to do business with us.”
Head of IT Digital Accelerator,
Biotechnology Company

7 | The Total Economic Impact™ Of SAP Commerce Cloud (for B2B)
› Capture data and facilitate data exchange with multiple internal and
external systems.
› Develop fast reporting and metrics to share results and make improved
business decisions.
Key Results
Key quantified results from the SAP Commerce Cloud investment for the
composite organization include:
› Increased net-new revenue due to improved AOV.
› Improved margin due to reduced processing costs.
› Increased productivity due to improved marketing / ecommerce team
efficiencies.
“Hands down SAP Commerce
Cloud provides the best B2B
Ecommerce solution. It is
analogous to what Amazon
has done for the B2C market.”
Director of Customer Intelligence and Marketing Analytics, Retail
Company
8 | The Total Economic Impact™ Of SAP Commerce Cloud (for B2B)
Financial Analysis
QUANTIFIED BENEFIT AND COST DATA AS APPLIED TO THE COMPOSITE
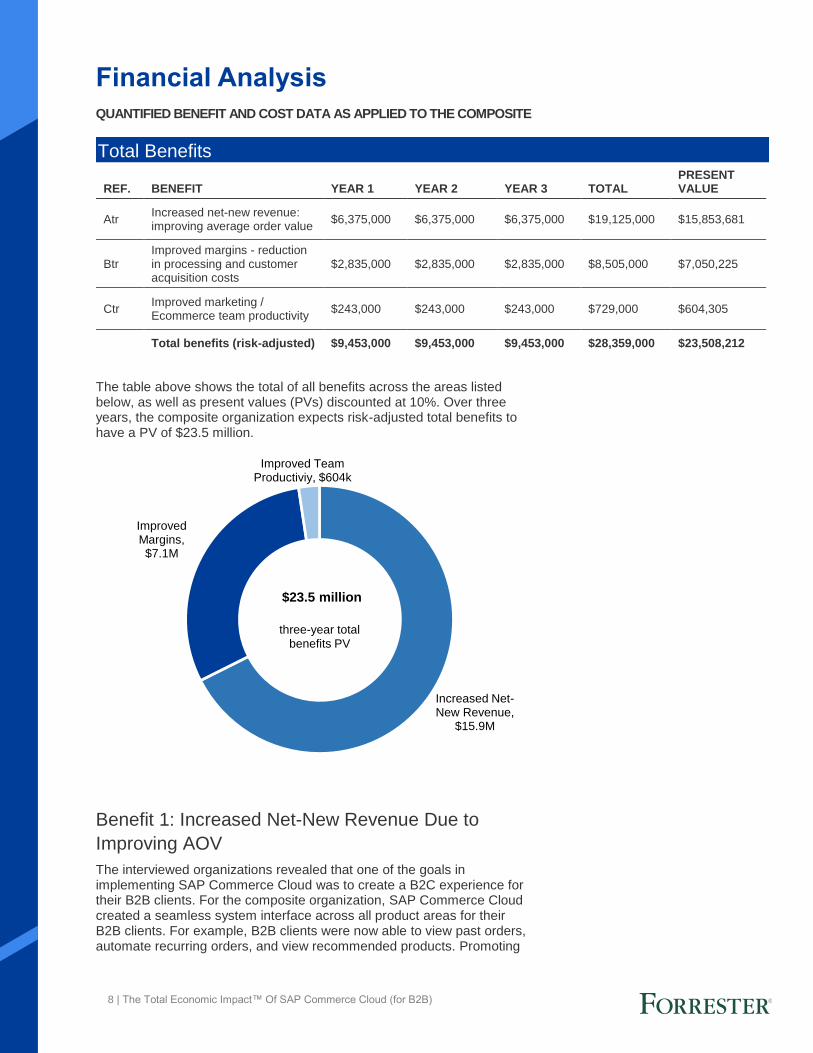
The table above shows the total of all benefits across the areas listed below, as well as present values (PVs) discounted at 10%. Over three years, the composite organization expects risk-adjusted total benefits to have a PV of $23.5 million.
Benefit 1: Increased Net-New Revenue Due to
Improving AOV
The interviewed organizations revealed that one of the goals in implementing SAP Commerce Cloud was to create a B2C experience for their B2B clients. For the composite organization, SAP Commerce Cloud created a seamless system interface across all product areas for their B2B clients. For example, B2B clients were now able to view past orders, automate recurring orders, and view recommended products. Promoting
Total Benefits
REF. BENEFIT YEAR 1 YEAR 2 YEAR 3 TOTAL PRESENT VALUE
Atr Increased net-new revenue: improving average order value
$6,375,000 $6,375,000 $6,375,000 $19,125,000 $15,853,681
Btr Improved margins - reduction in processing and customer acquisition costs
$2,835,000 $2,835,000 $2,835,000 $8,505,000 $7,050,225
Ctr Improved marketing / Ecommerce team productivity
$243,000 $243,000 $243,000 $729,000 $604,305
Total benefits (risk-adjusted) $9,453,000 $9,453,000 $9,453,000 $28,359,000 $23,508,212
Increased Net-New Revenue,
$15.9M
Improved Margins,$7.1M
Improved Team Productiviy, $604k
three-year total
benefits PV
$23.5 million
9 | The Total Economic Impact™ Of SAP Commerce Cloud (for B2B)
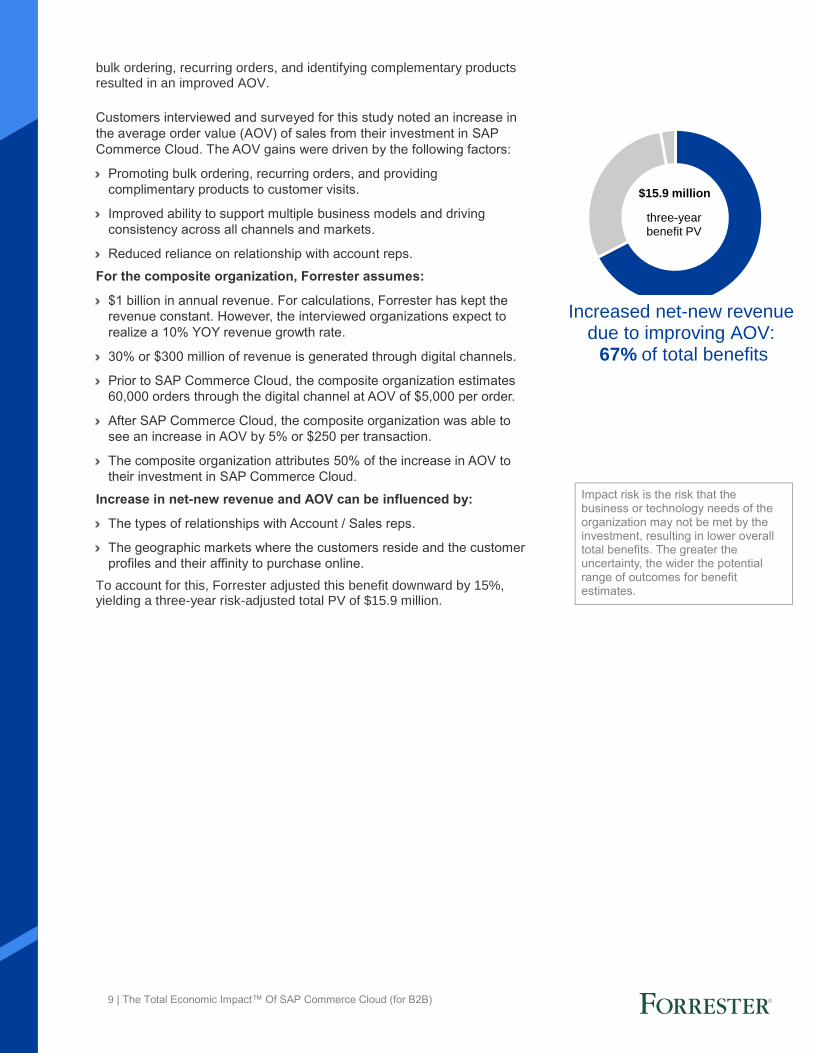
three-year benefit PV
$15.9 million
bulk ordering, recurring orders, and identifying complementary products resulted in an improved AOV.
Customers interviewed and surveyed for this study noted an increase in
the average order value (AOV) of sales from their investment in SAP
Commerce Cloud. The AOV gains were driven by the following factors:
› Promoting bulk ordering, recurring orders, and providing
complimentary products to customer visits.
› Improved ability to support multiple business models and driving
consistency across all channels and markets.
› Reduced reliance on relationship with account reps.
For the composite organization, Forrester assumes:
› $1 billion in annual revenue. For calculations, Forrester has kept the
revenue constant. However, the interviewed organizations expect to
realize a 10% YOY revenue growth rate.
› 30% or $300 million of revenue is generated through digital channels.
› Prior to SAP Commerce Cloud, the composite organization estimates
60,000 orders through the digital channel at AOV of $5,000 per order.
› After SAP Commerce Cloud, the composite organization was able to
see an increase in AOV by 5% or $250 per transaction.
› The composite organization attributes 50% of the increase in AOV to
their investment in SAP Commerce Cloud.
Increase in net-new revenue and AOV can be influenced by:
› The types of relationships with Account / Sales reps.
› The geographic markets where the customers reside and the customer
profiles and their affinity to purchase online.
To account for this, Forrester adjusted this benefit downward by 15%, yielding a three-year risk-adjusted total PV of $15.9 million.
Impact risk is the risk that the business or technology needs of the organization may not be met by the investment, resulting in lower overall total benefits. The greater the uncertainty, the wider the potential range of outcomes for benefit estimates.
Increased net-new revenue due to improving AOV: 67% of total benefits
10 | The Total Economic Impact™ Of SAP Commerce Cloud (for B2B)
three-year benefit PV
$7.1 million
Benefit 2: Improved Margins Due to Reduction in
Order Processing and Customer Acquisition Costs
In addition to increasing AOV, SAP Commerce Cloud helped interviewed organizations drive an additional 50% of revenue from their digital sales channel. This results in improved margins as the digital sales channel has the following benefits:
› Lower order processing costs. There are fewer defects and errors
via the digital sales channel, faster integration with the backend
databases, and overall better invoicing processes and timing.
› Lower customer acquisition costs. The digital sales channel is
easier for customers to find (e.g., via a web search), and it is easier for
existing customer to refer prospective customers to a website.
For the composite organization, Forrester assumes:
› $1 billion in annual revenue. For calculations, Forrester has kept the
revenue constant. However, the interviewed organizations expect to
realize a 10% YOY revenue growth rate.
› 45% or $450 million of revenue is generated through digital channel
after investment in SAP Commerce Cloud.
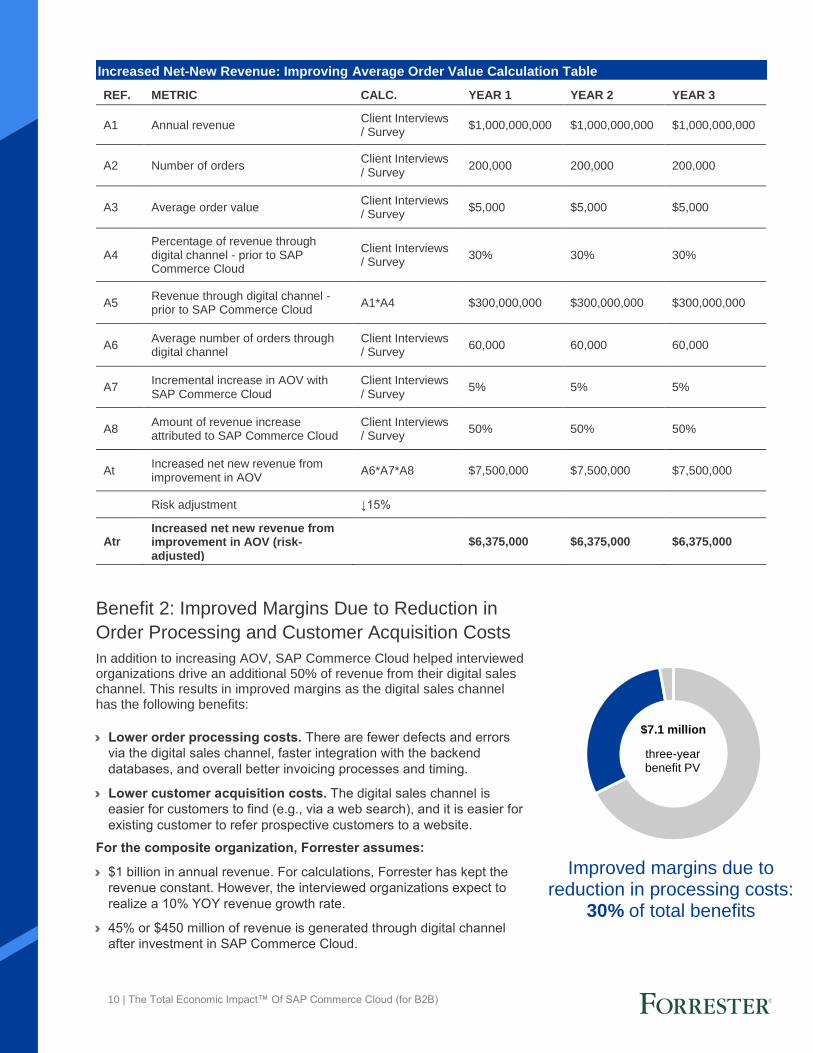
Increased Net-New Revenue: Improving Average Order Value Calculation Table
REF. METRIC CALC. YEAR 1 YEAR 2 YEAR 3
A1 Annual revenue Client Interviews / Survey
$1,000,000,000 $1,000,000,000 $1,000,000,000
A2 Number of orders Client Interviews / Survey
200,000 200,000 200,000
A3 Average order value Client Interviews / Survey
$5,000 $5,000 $5,000
A4 Percentage of revenue through digital channel - prior to SAP Commerce Cloud
Client Interviews / Survey
30% 30% 30%
A5 Revenue through digital channel - prior to SAP Commerce Cloud
A1*A4 $300,000,000 $300,000,000 $300,000,000
A6 Average number of orders through digital channel
Client Interviews / Survey
60,000 60,000 60,000
A7 Incremental increase in AOV with SAP Commerce Cloud
Client Interviews / Survey
5% 5% 5%
A8 Amount of revenue increase attributed to SAP Commerce Cloud
Client Interviews / Survey
50% 50% 50%
At Increased net new revenue from improvement in AOV
A6*A7*A8 $7,500,000 $7,500,000 $7,500,000
Risk adjustment ↓15%
Atr Increased net new revenue from improvement in AOV (risk-adjusted)
$6,375,000 $6,375,000 $6,375,000
Improved margins due to reduction in processing costs:
30% of total benefits
11 | The Total Economic Impact™ Of SAP Commerce Cloud (for B2B)
› Processing costs averaging 1% of the sale value, due to reconciliation
with the backend system, processing and invoicing, and mistakes in
field inputs.
› SAP Commerce Cloud reduced processing costs by 70% due to better
system integration and increased sales via digital channels.
Increase in margin and reduced processing and customer
acquisition costs can be influenced by:
› Differing initial processing costs.
› Lower impact of cost reduction depending on existing backend
configuration.
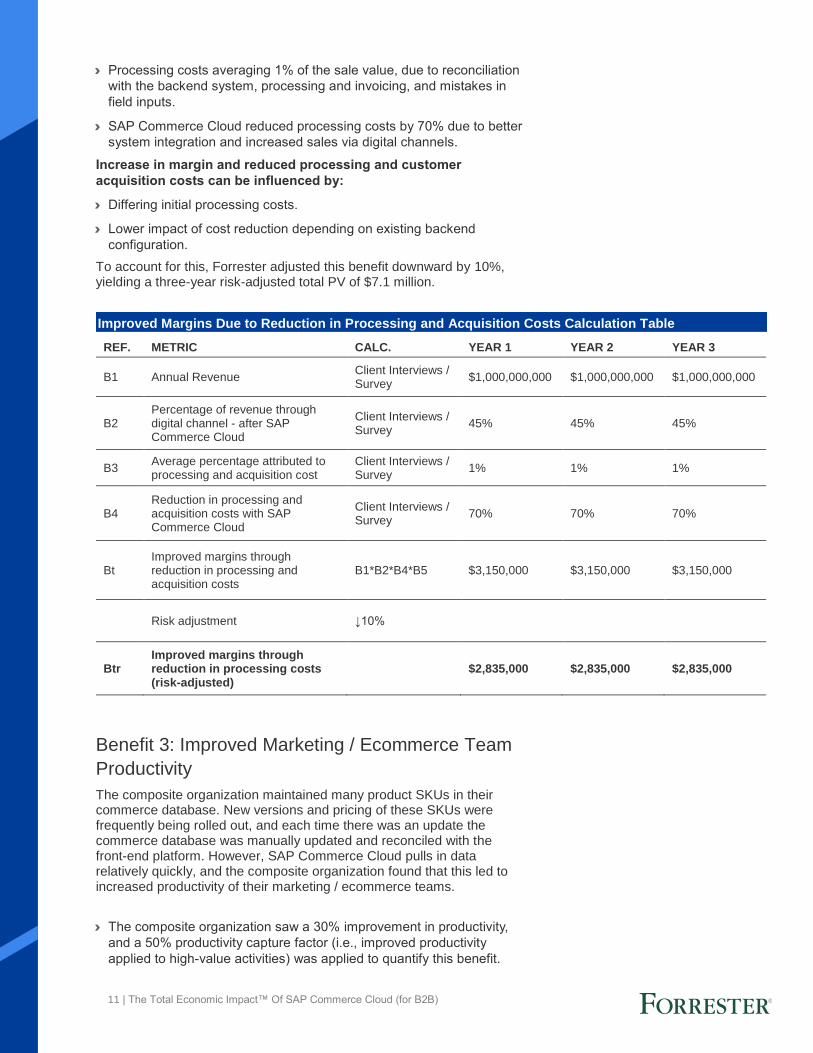
To account for this, Forrester adjusted this benefit downward by 10%, yielding a three-year risk-adjusted total PV of $7.1 million.
Benefit 3: Improved Marketing / Ecommerce Team
Productivity
The composite organization maintained many product SKUs in their commerce database. New versions and pricing of these SKUs were frequently being rolled out, and each time there was an update the commerce database was manually updated and reconciled with the front-end platform. However, SAP Commerce Cloud pulls in data relatively quickly, and the composite organization found that this led to increased productivity of their marketing / ecommerce teams.
› The composite organization saw a 30% improvement in productivity,
and a 50% productivity capture factor (i.e., improved productivity
applied to high-value activities) was applied to quantify this benefit.
Improved Margins Due to Reduction in Processing and Acquisition Costs Calculation Table
REF. METRIC CALC. YEAR 1 YEAR 2 YEAR 3
B1 Annual Revenue Client Interviews / Survey
$1,000,000,000 $1,000,000,000 $1,000,000,000
B2 Percentage of revenue through digital channel - after SAP Commerce Cloud
Client Interviews / Survey
45% 45% 45%
B3 Average percentage attributed to processing and acquisition cost
Client Interviews / Survey
1% 1% 1%
B4 Reduction in processing and acquisition costs with SAP Commerce Cloud
Client Interviews / Survey
70% 70% 70%
Bt Improved margins through reduction in processing and acquisition costs
B1*B2*B4*B5 $3,150,000 $3,150,000 $3,150,000
Risk adjustment ↓10%
Btr Improved margins through reduction in processing costs (risk-adjusted)
$2,835,000 $2,835,000 $2,835,000
12 | The Total Economic Impact™ Of SAP Commerce Cloud (for B2B)
three-year benefit PV
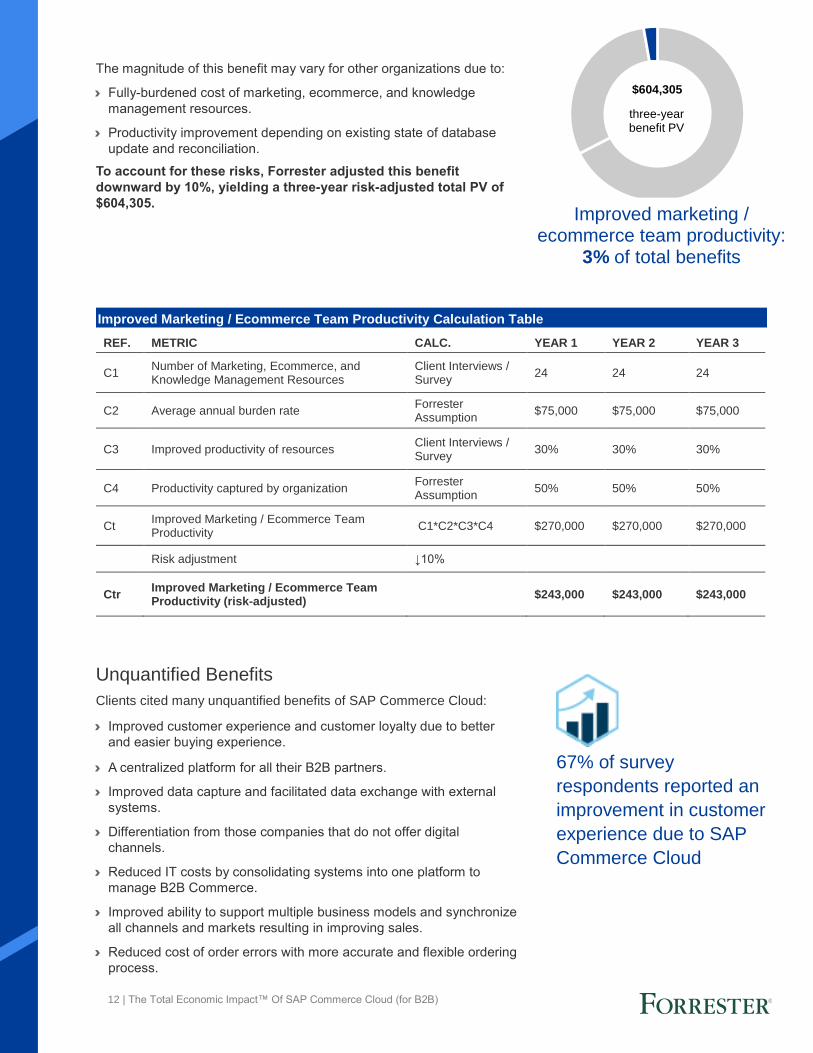
$604,305
The magnitude of this benefit may vary for other organizations due to:
› Fully-burdened cost of marketing, ecommerce, and knowledge
management resources.
› Productivity improvement depending on existing state of database
update and reconciliation.
To account for these risks, Forrester adjusted this benefit
downward by 10%, yielding a three-year risk-adjusted total PV of
$604,305.
Unquantified Benefits
Clients cited many unquantified benefits of SAP Commerce Cloud:
› Improved customer experience and customer loyalty due to better
and easier buying experience.
› A centralized platform for all their B2B partners.
› Improved data capture and facilitated data exchange with external
systems.
› Differentiation from those companies that do not offer digital
channels.
› Reduced IT costs by consolidating systems into one platform to
manage B2B Commerce.
› Improved ability to support multiple business models and synchronize
all channels and markets resulting in improving sales.
› Reduced cost of order errors with more accurate and flexible ordering
process.
67% of survey
respondents reported an
improvement in customer
experience due to SAP
Commerce Cloud
Improved Marketing / Ecommerce Team Productivity Calculation Table
REF. METRIC CALC. YEAR 1 YEAR 2 YEAR 3
C1 Number of Marketing, Ecommerce, and Knowledge Management Resources
Client Interviews / Survey
24 24 24
C2 Average annual burden rate Forrester Assumption
$75,000 $75,000 $75,000
C3 Improved productivity of resources Client Interviews / Survey
30% 30% 30%
C4 Productivity captured by organization Forrester Assumption
50% 50% 50%
Ct Improved Marketing / Ecommerce Team Productivity
C1*C2*C3*C4 $270,000 $270,000 $270,000
Risk adjustment ↓10%
Ctr Improved Marketing / Ecommerce Team Productivity (risk-adjusted)
$243,000 $243,000 $243,000
Improved marketing / ecommerce team productivity:
3% of total benefits
13 | The Total Economic Impact™ Of SAP Commerce Cloud (for B2B)
Flexibility
The value of flexibility is clearly unique to each client, and the measure
of its value varies from organization to organization. There are multiple
scenarios in which a client might choose to implement SAP
Commerce Cloud and later realize additional uses and business
opportunities, including:
› The addition of SAP Marketing Cloud. Clients interviewed and
surveyed for this study were already using or planned to use SAP
Marketing Cloud. Those that add this product to their suite of
applications benefit from the integrations with SAP back office
systems, such as product and supplier information that enables
smooth end-to-end customer service.
› The addition of SAP Sales and Service Cloud. Several clients
interviewed and surveyed for this study were already using or planned
to use SAP Sales Cloud and / or SAP Service Cloud. Because this
application for sales automation is based on the same platform as
Service Cloud, it is very easy for organizations to use both. The
combined platforms offer centralized access to customer and product
data and enables both service and sales team members to take into
account customer service issues or inquiries underway when selling to
their customers and prospects.
Flexibility would also be quantified when evaluated as part of a specific
project (described in more detail in Appendix A).
Flexibility, as defined by TEI, represents an investment in additional capacity or capability that could be turned into business benefit for a future additional investment. This provides an organization with the "right" or the ability to engage in future initiatives but not the obligation to so.

14 | The Total Economic Impact™ Of SAP Commerce Cloud (for B2B)
The table above shows the total of all costs across the areas listed below,
as well as present values (PVs) discounted at 10%. Over three years, the
composite organization expects risk-adjusted total costs to have a PV of
$5.8 million.
Cost 1: License or Subscription Fees
› The license fees for the composite organization is based on the
number of core processors using the SAP Commerce Cloud platform.
› These costs may vary based on number of cores utilized.
› To account for these risks, Forrester adjusted this cost upward by
10%, yielding a three-year risk-adjusted total PV of $1,340,413.
Total Costs
Implementation risk is the risk that a proposed investment may deviate from the original or expected requirements, resulting in higher costs than anticipated. The greater the uncertainty, the wider the potential range of outcomes for cost estimates.
REF. COST INITIAL YEAR 1 YEAR 2 YEAR 3 TOTAL PRESENT VALUE
Dtr License or subscription fees
$0 $539,000 $539,000 $539,000 $1,617,000 $1,340,413
Etr Ongoing costs $0 $1,430,000 $1,430,000 $1,430,000 $4,290,000 $3,556,198
Ftr Initial implementation costs $880,000 $0 $0 $0 $880,000 $880,000
Total costs (risk-adjusted)
$880,000 $1,969,000 $1,969,000 $1,969,000 $6,787,000 $5,776,611
License fees, $1,340,413
Ongoing Costs, $3,556,198
Initial Implementation Costs, $880,000
three-year total costs
PV
$5.8 million

15 | The Total Economic Impact™ Of SAP Commerce Cloud (for B2B)
three-year cost PV
$1.3 millionLicense/Subscription fees:
23% of total costs
three-year cost PV
$3.6 million
Cost 2: Ongoing Costs
Interviewed and surveyed organizations identified several ongoing costs
associated with the use of SAP Commerce Cloud. For the composite
organization, these ongoing costs were modeled as:
› 12 internal FTEs to support SAP Commerce Cloud.
› Ongoing professional services to maintain the solution.
These costs may vary due to the scope required for SAP Commerce Cloud
support and maintenance or other organizations and their specific
implementation.
To account for these risks, Forrester adjusted this cost upward by 10%,
yielding a three-year risk-adjusted total PV of $3,556,198.
12 FTEs
spend 100% of their
time on ongoing
management of SAP
Commerce Cloud
License/Subscription Fees Calculation Table
REF. METRIC CALC. INITIAL YEAR 1 YEAR 2 YEAR 3
D1 Number of Core Processors Used
Client Interviews / Survey
14 14 14
D2 Yearly license cost per core processor
Client Interviews / Survey
$35,000 $35,000 $35,000
Dt License fees D1*D2 $490,000 $490,000 $490,000
Risk adjustment ↑10%
Dtr License fees (risk-adjusted) $0 $539,000 $539,000 $539,000
Ongoing costs: 62% of total costs
16 | The Total Economic Impact™ Of SAP Commerce Cloud (for B2B)
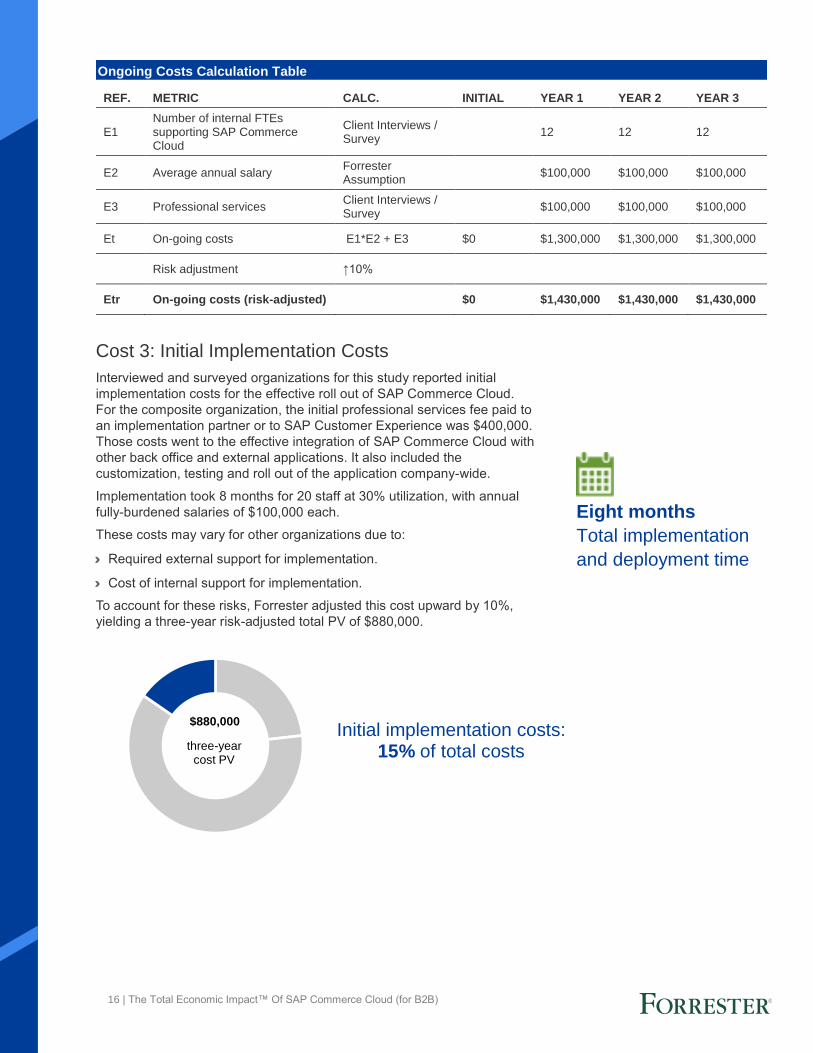
three-year cost PV
$880,000
Cost 3: Initial Implementation Costs
Interviewed and surveyed organizations for this study reported initial
implementation costs for the effective roll out of SAP Commerce Cloud.
For the composite organization, the initial professional services fee paid to
an implementation partner or to SAP Customer Experience was $400,000.
Those costs went to the effective integration of SAP Commerce Cloud with
other back office and external applications. It also included the
customization, testing and roll out of the application company-wide.
Implementation took 8 months for 20 staff at 30% utilization, with annual
fully-burdened salaries of $100,000 each.
These costs may vary for other organizations due to:
› Required external support for implementation.
› Cost of internal support for implementation.
To account for these risks, Forrester adjusted this cost upward by 10%,
yielding a three-year risk-adjusted total PV of $880,000.
Eight months
Total implementation
and deployment time
Ongoing Costs Calculation Table
REF. METRIC CALC. INITIAL YEAR 1 YEAR 2 YEAR 3
E1 Number of internal FTEs supporting SAP Commerce Cloud
Client Interviews / Survey
12 12 12
E2 Average annual salary Forrester Assumption
$100,000 $100,000 $100,000
E3 Professional services Client Interviews / Survey
$100,000 $100,000 $100,000
Et On-going costs E1*E2 + E3 $0 $1,300,000 $1,300,000 $1,300,000
Risk adjustment ↑10%
Etr On-going costs (risk-adjusted) $0 $1,430,000 $1,430,000 $1,430,000
Initial implementation costs: 15% of total costs
17 | The Total Economic Impact™ Of SAP Commerce Cloud (for B2B)
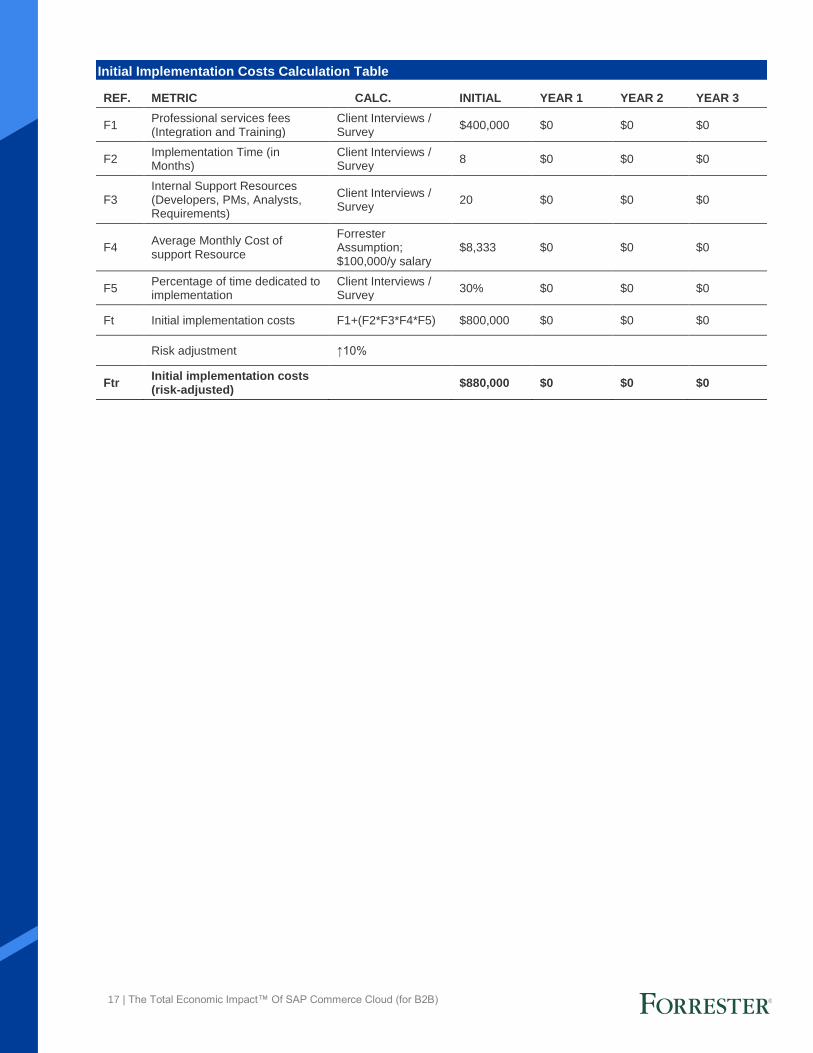
Initial Implementation Costs Calculation Table
REF. METRIC CALC. INITIAL YEAR 1 YEAR 2 YEAR 3
F1 Professional services fees (Integration and Training)
Client Interviews / Survey
$400,000 $0 $0 $0
F2 Implementation Time (in Months)
Client Interviews / Survey
8 $0 $0 $0
F3 Internal Support Resources (Developers, PMs, Analysts, Requirements)
Client Interviews / Survey
20 $0 $0 $0
F4 Average Monthly Cost of support Resource
Forrester Assumption; $100,000/y salary
$8,333 $0 $0 $0
F5 Percentage of time dedicated to implementation
Client Interviews / Survey
30% $0 $0 $0
Ft Initial implementation costs F1+(F2*F3*F4*F5) $800,000 $0 $0 $0
Risk adjustment ↑10%
Ftr Initial implementation costs (risk-adjusted)
$880,000 $0 $0 $0
18 | The Total Economic Impact™ Of SAP Commerce Cloud (for B2B)
Financial Summary
CONSOLIDATED THREE-YEAR RISK-ADJUSTED METRICS
Cash Flow Chart (Risk-Adjusted)
-$5.0 M
$5.0 M
$10.0 M
$15.0 M
$20.0 M
$25.0 M
Initial Year 1 Year 2 Year 3
Cashflows
Total costs
Total benefits
Cumulative net benefits
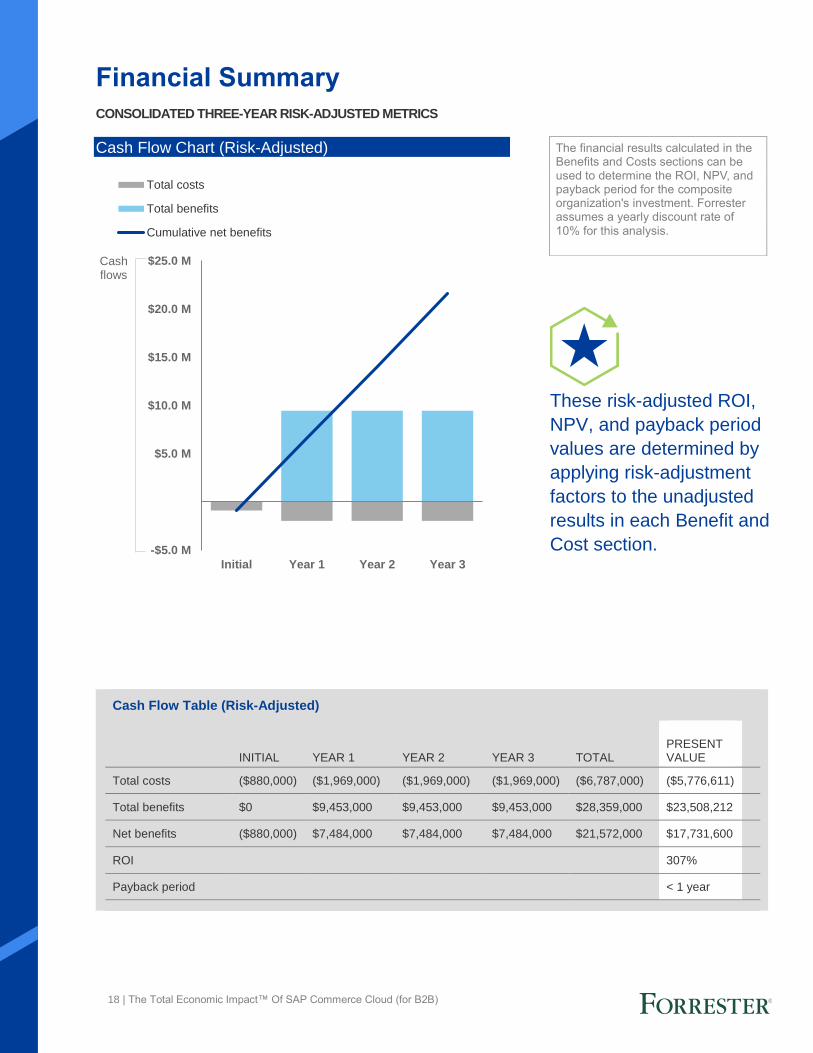
The financial results calculated in the Benefits and Costs sections can be used to determine the ROI, NPV, and payback period for the composite organization's investment. Forrester assumes a yearly discount rate of
10% for this analysis.
These risk-adjusted ROI,
NPV, and payback period
values are determined by
applying risk-adjustment
factors to the unadjusted
results in each Benefit and
Cost section.
Cash Flow Table (Risk-Adjusted)
INITIAL YEAR 1 YEAR 2 YEAR 3 TOTAL PRESENT VALUE
Total costs ($880,000) ($1,969,000) ($1,969,000) ($1,969,000) ($6,787,000) ($5,776,611)
Total benefits $0 $9,453,000 $9,453,000 $9,453,000 $28,359,000 $23,508,212
Net benefits ($880,000) $7,484,000 $7,484,000 $7,484,000 $21,572,000 $17,731,600
ROI 307%
Payback period < 1 year
19 | The Total Economic Impact™ Of SAP Commerce Cloud (for B2B)
SAP Commerce CloudThe following information is provided by SAP. Forrester has not validated any claims and does not endorse SAP or
its offerings.
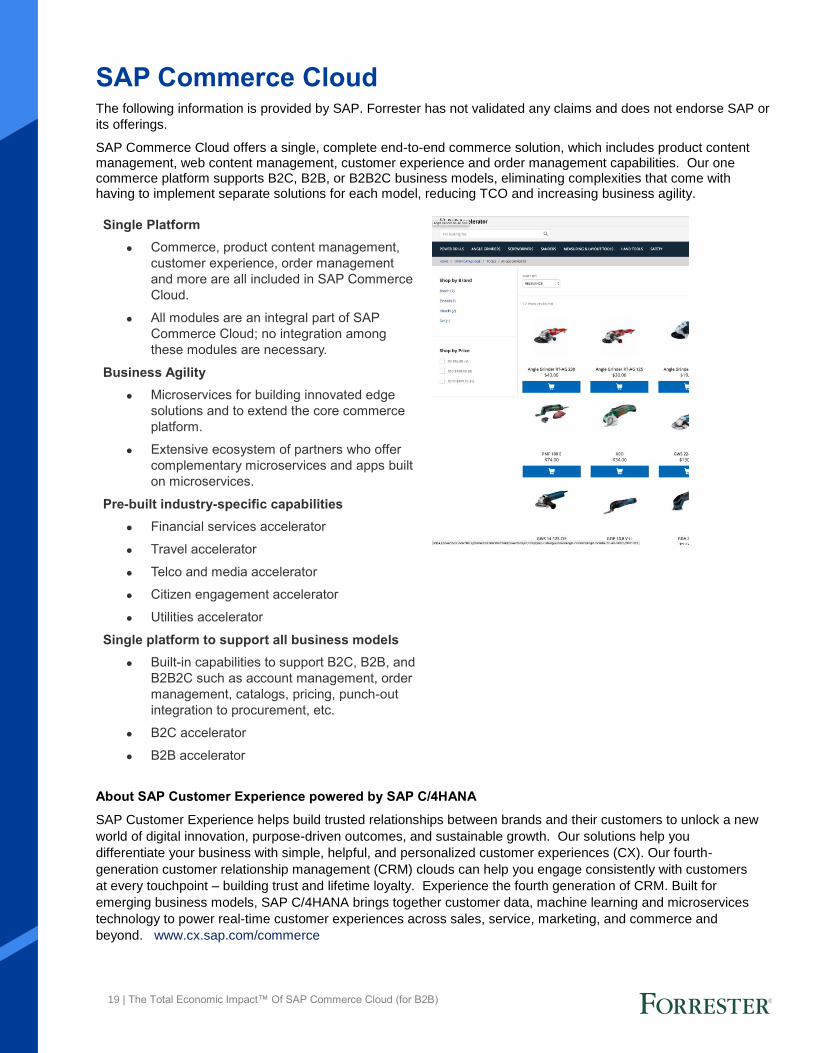
SAP Commerce Cloud offers a single, complete end-to-end commerce solution, which includes product content management, web content management, customer experience and order management capabilities. Our one commerce platform supports B2C, B2B, or B2B2C business models, eliminating complexities that come with having to implement separate solutions for each model, reducing TCO and increasing business agility.
Single Platform
• Commerce, product content management,
customer experience, order management
and more are all included in SAP Commerce
Cloud.
• All modules are an integral part of SAP
Commerce Cloud; no integration among
these modules are necessary.
Business Agility
• Microservices for building innovated edge
solutions and to extend the core commerce
platform.
• Extensive ecosystem of partners who offer
complementary microservices and apps built
on microservices.
Pre-built industry-specific capabilities
• Financial services accelerator
• Travel accelerator
• Telco and media accelerator
• Citizen engagement accelerator
• Utilities accelerator
Single platform to support all business models
• Built-in capabilities to support B2C, B2B, and
B2B2C such as account management, order
management, catalogs, pricing, punch-out
integration to procurement, etc.
• B2C accelerator
• B2B accelerator
About SAP Customer Experience powered by SAP C/4HANA
SAP Customer Experience helps build trusted relationships between brands and their customers to unlock a new
world of digital innovation, purpose-driven outcomes, and sustainable growth. Our solutions help you
differentiate your business with simple, helpful, and personalized customer experiences (CX). Our fourth-
generation customer relationship management (CRM) clouds can help you engage consistently with customers
at every touchpoint – building trust and lifetime loyalty. Experience the fourth generation of CRM. Built for
emerging business models, SAP C/4HANA brings together customer data, machine learning and microservices
technology to power real-time customer experiences across sales, service, marketing, and commerce and
beyond. www.cx.sap.com/commerce
20 | The Total Economic Impact™ Of SAP Commerce Cloud (for B2B)
Appendix A: Total Economic Impact
Total Economic Impact is a methodology developed by Forrester
Research that enhances a company’s technology decision-making
processes and assists vendors in communicating the value
proposition of their products and services to clients. The TEI
methodology helps companies demonstrate, justify, and realize the
tangible value of IT initiatives to both senior management and
other key business stakeholders.
Total Economic Impact Approach
Benefits represent the value delivered to the business by the
product. The TEI methodology places equal weight on the
measure of benefits and the measure of costs, allowing for a
full examination of the effect of the technology on the entire
organization.
Costs consider all expenses necessary to deliver the
proposed value, or benefits, of the product. The cost category
within TEI captures incremental costs over the existing
environment for ongoing costs associated with the solution.
Flexibility represents the strategic value that can be
obtained for some future additional investment building on
top of the initial investment already made. Having the ability
to capture that benefit has a PV that can be estimated.
Risks measure the uncertainty of benefit and cost estimates
given: 1) the likelihood that estimates will meet original
projections and 2) the likelihood that estimates will be
tracked over time. TEI risk factors are based on “triangular
distribution.”
The initial investment column contains costs incurred at “time 0” or at the
beginning of Year 1 that are not discounted. All other cash flows are discounted
using the discount rate at the end of the year. PV calculations are calculated for
each total cost and benefit estimate. NPV calculations in the summary tables are
the sum of the initial investment and the discounted cash flows in each year.
Sums and present value calculations of the Total Benefits, Total Costs, and
Cash Flow tables may not exactly add up, as some rounding may occur.
PRESENT VALUE (PV)
The present or current value of (discounted) cost and benefit estimates given at an interest rate (the discount rate). The PV of costs and benefits feed into the total NPV of cash flows.
NET PRESENT VALUE (NPV)
The present or current value of (discounted) future net cash flows given an interest rate (the discount rate). A positive project NPV normally indicates that the investment should be made, unless other projects have higher NPVs.
RETURN ON INVESTMENT (ROI)
A project’s expected return in percentage terms. ROI is calculated by dividing net benefits (benefits less costs) by costs.
DISCOUNT RATE
The interest rate used in cash flow analysis to take into account the time value of money. Organizations typically use discount rates between 8% and 16%.
PAYBACK PERIOD
The breakeven point for an investment. This is the point in time at which net benefits (benefits minus costs) equal initial investment or cost.