Impact of changing DOC concentrations on the potential distribution of acid sensitive biota in a...
11
Hydrol. Earth Syst. Sci., 12, 425–435, 2008 www.hydrol-earth-syst-sci.net/12/425/2008/ © Author(s) 2008. This work is licensed under a Creative Commons License. Hydrology and Earth System Sciences Impact of changing DOC concentrations on the potential distribution of acid sensitive biota in a boreal stream network H. Laudon 1 and I. Buffam 2 1 Department of Ecology and Environmental Sciences, Ume˚ a University, Ume˚ a, Sweden 2 Department of Forest Ecology, Swedish University of Agricultural Sciences, Ume˚ a, Sweden Received: 2 November 2006 – Published in Hydrol. Earth Syst. Sci. Discuss.: 11 September 2007 Revised: 28 November 2007 – Accepted: 5 February 2008 – Published: 5 March 2008 Abstract. DOC concentrations have increased in many sur- face waters in Europe and North America over the past few decades. As DOC exudes a strong influence on pH this DOC increase could have detrimental effects on acid sensi- tive biota in many streams and lakes. To investigate the po- tential implications of changes in the DOC concentration on stream water biota, we have used a mesoscale boreal stream network in northern Sweden as a case study. The network was sampled for stream water chemistry at 60 locations dur- ing both winter base flow and spring flood periods, represent- ing the extremes experienced annually in these streams both in terms of discharge and acidity. The effect of changing DOC on pH was modeled for all sampling locations using an organic acid model, with input DOC concentrations for dif- ferent scenarios adjusted by between -30% and +50% from measured present concentrations. The resulting effect on pH was then used to quantify the proportion of stream length in the catchment with pH below the acid thresholds of pH 5.5 and pH 5.0. The results suggest that a change in stream wa- ter DOC during base flow would have only a limited effect on pH and hence on the stream length with pH below the acid thresholds. During the spring flood on the other hand a change in DOC would strongly influence pH and the stream length with pH below the acid thresholds. For example an increase in DOC concentration of 30% at all sites would in- crease the proportion of stream length with pH below 5.5 from 37% to 65%, and the proportion of stream length with pH below 5.0 would increase from 18% to 27%. The results suggest that in high DOC waters, even a marginal change in the DOC concentration could impact acid sensitive biota in a large portion of the aquatic landscape. Correspondence to: H. Laudon ([email protected]) 1 Introduction The snow melt period is a recurring ecological challenge for aquatic organisms in many boreal surface waters. The re- sulting spring flood is an occasion for transient hydrochem- ical changes that profoundly affect aquatic ecosystems due to changes in pH and inorganic aluminium concentrations (Laudon et al., 2005; Simonin et al., 1993). The snow melt period is also susceptible to anthropogenic perturbations to water quality that can further impact the biota of surface wa- ters. The mean annual temperature in Sweden is expected to increase by 3 to 5 ◦ C during the coming century as a result of the burning of fossil fuels (Kjellstr¨ om, 2004). This in- crease is predicted to be more prominent in the northern part of the country and biased towards the winter season. Re- cent predictions also suggest that these northern ecosystems are among the regions that will be most affected in terms of surface water hydrology and biogeochemistry (Barnett et al., 2005). Another important implication of climate change for northern ecosystems is the expected change in the tim- ing, extent and duration of the snow cover (Ven¨ al¨ ainen et al., 2001; Mellander et al., 2007). The snow not only provides a major fraction of the annual water budget, but also plays a fundamental role in regulating the winter biogeochemistry of forest soils (Groffman et al., 2001). How the predicted change in winter conditions will affect the water quality of streams, rivers and lakes in the boreal region is presently not well understood. Besides contributing the largest component of the ion bal- ance in many boreal surface waters, dissolved organic carbon (DOC) is important for complexing and transporting metals (Rember and Trefry, 2004) as well as a carbon and energy Published by Copernicus Publications on behalf of the European Geosciences Union.
-
Upload
independent -
Category
Documents
-
view
2 -
download
0
Transcript of Impact of changing DOC concentrations on the potential distribution of acid sensitive biota in a...
Hydrol. Earth Syst. Sci., 12, 425–435, 2008www.hydrol-earth-syst-sci.net/12/425/2008/© Author(s) 2008. This work is licensedunder a Creative Commons License.
Hydrology andEarth System
Sciences
Impact of changing DOC concentrations on the potentialdistribution of acid sensitive biota in a boreal stream network
H. Laudon1 and I. Buffam2
1Department of Ecology and Environmental Sciences, Umea University, Umea, Sweden2Department of Forest Ecology, Swedish University of Agricultural Sciences, Umea, Sweden
Received: 2 November 2006 – Published in Hydrol. Earth Syst. Sci. Discuss.: 11 September 2007Revised: 28 November 2007 – Accepted: 5 February 2008 – Published: 5 March 2008
Abstract. DOC concentrations have increased in many sur-face waters in Europe and North America over the past fewdecades. As DOC exudes a strong influence on pH thisDOC increase could have detrimental effects on acid sensi-tive biota in many streams and lakes. To investigate the po-tential implications of changes in the DOC concentration onstream water biota, we have used a mesoscale boreal streamnetwork in northern Sweden as a case study. The networkwas sampled for stream water chemistry at 60 locations dur-ing both winter base flow and spring flood periods, represent-ing the extremes experienced annually in these streams bothin terms of discharge and acidity. The effect of changingDOC on pH was modeled for all sampling locations using anorganic acid model, with input DOC concentrations for dif-ferent scenarios adjusted by between−30% and +50% frommeasured present concentrations. The resulting effect on pHwas then used to quantify the proportion of stream length inthe catchment with pH below the acid thresholds of pH 5.5and pH 5.0. The results suggest that a change in stream wa-ter DOC during base flow would have only a limited effecton pH and hence on the stream length with pH below theacid thresholds. During the spring flood on the other hand achange in DOC would strongly influence pH and the streamlength with pH below the acid thresholds. For example anincrease in DOC concentration of 30% at all sites would in-crease the proportion of stream length with pH below 5.5from 37% to 65%, and the proportion of stream length withpH below 5.0 would increase from 18% to 27%. The resultssuggest that in high DOC waters, even a marginal change inthe DOC concentration could impact acid sensitive biota in alarge portion of the aquatic landscape.
Correspondence to:H. Laudon([email protected])
1 Introduction
The snow melt period is a recurring ecological challenge foraquatic organisms in many boreal surface waters. The re-sulting spring flood is an occasion for transient hydrochem-ical changes that profoundly affect aquatic ecosystems dueto changes in pH and inorganic aluminium concentrations(Laudon et al., 2005; Simonin et al., 1993). The snow meltperiod is also susceptible to anthropogenic perturbations towater quality that can further impact the biota of surface wa-ters.
The mean annual temperature in Sweden is expected toincrease by 3 to 5◦C during the coming century as a resultof the burning of fossil fuels (Kjellstrom, 2004). This in-crease is predicted to be more prominent in the northern partof the country and biased towards the winter season. Re-cent predictions also suggest that these northern ecosystemsare among the regions that will be most affected in termsof surface water hydrology and biogeochemistry (Barnett etal., 2005). Another important implication of climate changefor northern ecosystems is the expected change in the tim-ing, extent and duration of the snow cover (Venalainen et al.,2001; Mellander et al., 2007). The snow not only providesa major fraction of the annual water budget, but also playsa fundamental role in regulating the winter biogeochemistryof forest soils (Groffman et al., 2001). How the predictedchange in winter conditions will affect the water quality ofstreams, rivers and lakes in the boreal region is presently notwell understood.
Besides contributing the largest component of the ion bal-ance in many boreal surface waters, dissolved organic carbon(DOC) is important for complexing and transporting metals(Rember and Trefry, 2004) as well as a carbon and energy
Published by Copernicus Publications on behalf of the European Geosciences Union.
426 H. Laudon and I. Buffam: Impact of changing DOC concentrations
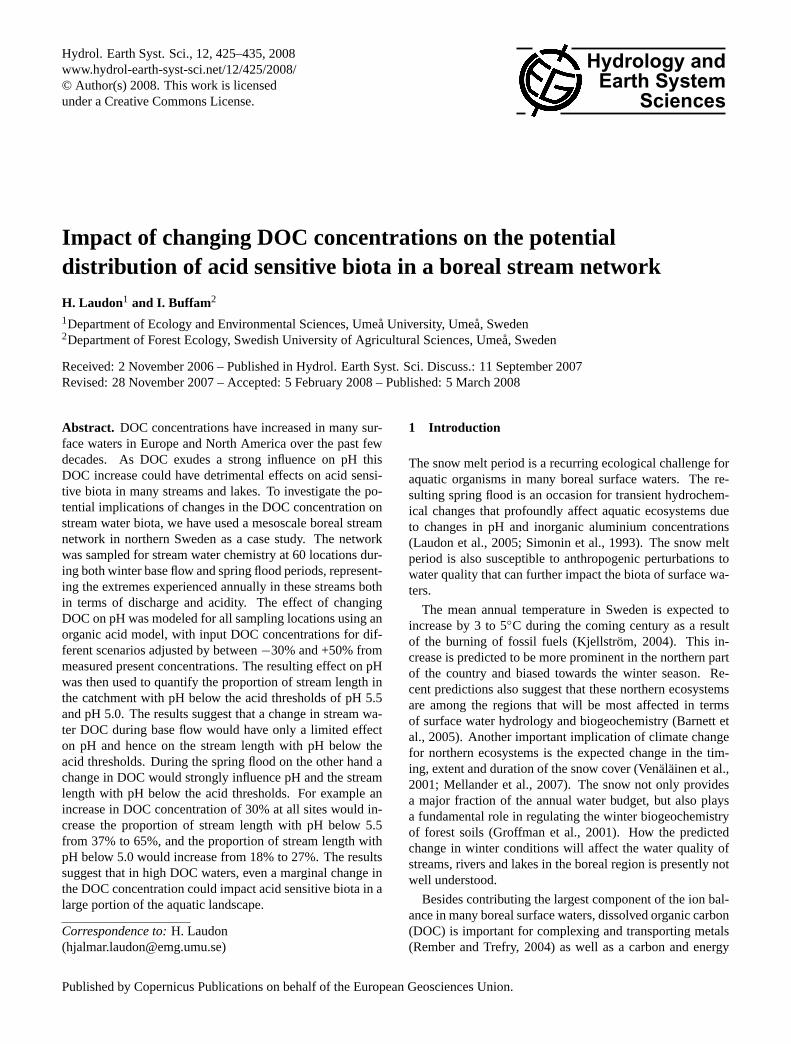
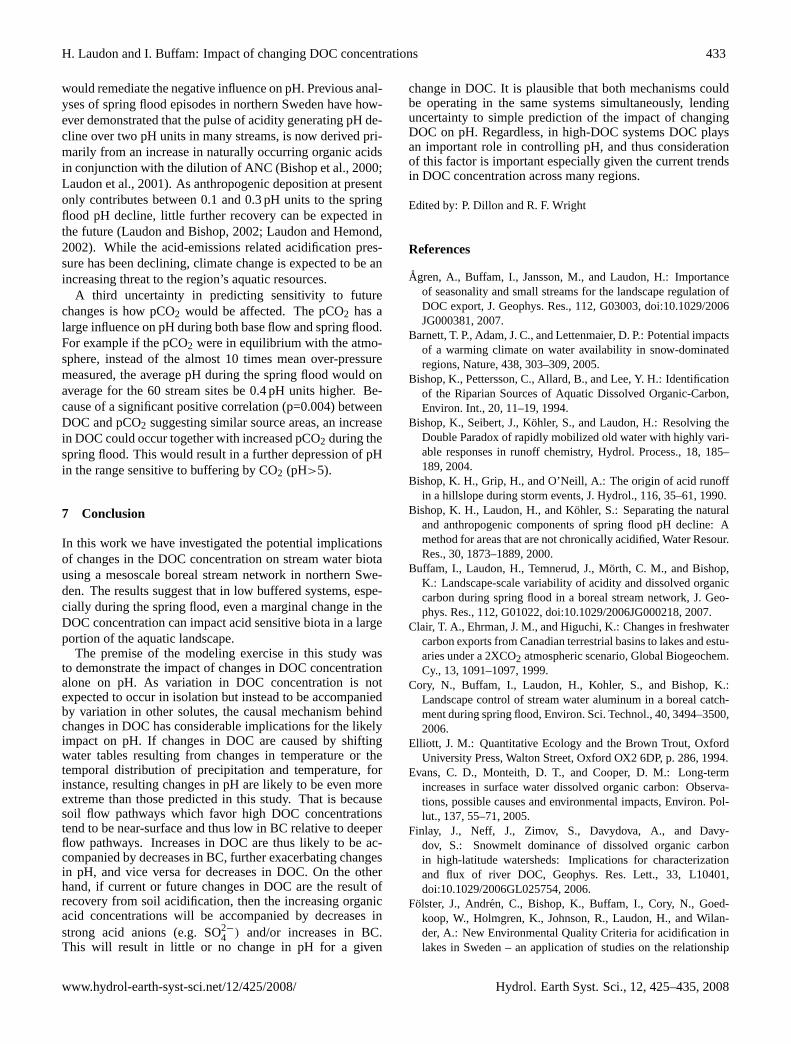
Fig. 1. (A) Location of the Krycklan catchment in Sweden and(B) location of 60 stream sampling sites within the catchment.
source in the aquatic food web (Jansson et al., 2000). Innorthern Sweden the spring flood DOC concentration is ofparticular interest because many surface waters experiencea pH decline of one to two pH units driven primarily by atransient increase in DOC during snow melt (Laudon et al.,2001). A change in the DOC concentration during the springflood could hence affect the pH decline occurring in the re-gion and alter the suitability for acid sensitive organisms todwell in certain streams in the future.
Recent studies in Europe have reported increasing concen-trations of DOC in many surface waters. For example, sev-eral trend analyses investigations in the UK have shown sig-nificantly increasing concentrations the last decades (Evanset al., 2005; Worrall et al., 2004). Similar trends have alsobeen reported from Norway (Hongve et al., 2004) and Fin-land (Vuorenmaa et al., 2006). Although no single causalmechanism for this wide spread increase in DOC has beenidentified, several plausible explanations have been pro-posed, including rising temperatures (Freeman et al., 2001)and long-term variability in hydrological conditions (Tranvikand Jansson, 2002). Recent work by Monteith et al. (2007)demonstrate that this increase in DOC could be caused by
a reduction in atmospherically deposited anthropogenic sul-phur.
Long and snow rich winters followed by large snowmeltdriven hydrological episodes are defining features of north-ern boreal regions. A change in winter conditions is likelyto affect the spring flood in terms of both runoff and soluteexport. It has been demonstrated that the DOC concentra-tion in streams in northern Sweden is controlled by the soilsolution chemistry of the riparian zone in combination withhillslope hydrology (Bishop et al., 2004). Thus, a change inthe condition of the near stream zone or in water table levelcan be expected to change the DOC concentration in adja-cent streams during snow melt. Monitoring and modelingstudies from other northern regions also suggest that surfacewater DOC is sensitive to changes in climate, but that thecharacteristics of the change will vary depending on whetherincreased temperature or change in precipitation is the dom-inant response to a warmer climate (Clair et al., 1999; Pastoret al., 2003; Schindler, 2001).
As DOC exudes a strong influence on the pH of many bo-real surface waters, the objective of this study was to quantifyhow the acidity status of a mesoscale (67 km2) boreal stream
Hydrol. Earth Syst. Sci., 12, 425–435, 2008 www.hydrol-earth-syst-sci.net/12/425/2008/
H. Laudon and I. Buffam: Impact of changing DOC concentrations 427
Table 1. Median (and 5th–95th percentiles in parentheses) catchment characteristics for the stream sites used in the study (N=60 sites) andfor all stream cells in the Krycklan catchment (N=1654).
Variable Sampling sites (N=60) All stream cells (N=1654)
SOILS (%)Till 62.5 (45.4–95.9) 62.9 (42.9–97.4)Peat 13.5 (0.0–29.8) 12.6 (0.0–32.2)Sediment (sorted) 7.4 (0.0–35.9) 1.4 (0.0–37.0)Thin soils 8.7 (2.6–27.1) 7.7 (0.0–26.6)Exposed rock 0.9 (0.0–4.6) 0.4 (0.0–4.4)
LAND COVER (%)Forest 82.3 (58.1–96.6) 83.3 (61.4–100.0)Wetland 12.0 (2.5–28.8) 11.1 (0.0–30.3)Clearcut 2.1 (0.0–10.0) 1.1 (0.0–14.3)Open or arable 0.6 (0.0–3.7) 0.0 (0.0–4.1)Lake 0.1 (0.0–4.1) 0.0 (0.0–4.2)
OTHERMean catchment slope (%) 9 (6–14) 9 (6–14)Mean catchment altitude (m) 272 (224–295) 277 (215–312)Site altitude (m) 198 (133–263) 218 (146–288)Catchment area (km2) 3.3 (0.2–41.9) 1.5 (0.1–30.5)
network would be affected by a future change in DOC con-centrations. To do this, we modeled the effect of changingDOC concentration (ranging from 30% decrease to 50% in-crease) on pH at sites distributed throughout the stream net-work. These data were used to estimate the proportion of thetotal stream length that would become unsuitable for acidsensitive biota due to changes in DOC concentration, duringboth base flow conditions and the spring flood.
2 Study site
The Krycklan Catchment Study is a multidisciplinary projectin the upper 67 km2 of the Krycklan River catchment innorthern Sweden (Fig. 1). The catchment includes the Vin-deln Experimental Forests (64◦14′ N, 19◦46′ E), where cli-mate data have been monitored at the Svartberget ResearchStation since 1980. Annual mean air temperature is 1◦Cwith 600 mm annual mean precipitation, of which one-thirdfalls as snow (Ottosson-Lofvenius et al., 2003). Snowcoveris present for 171 days on average (1980–1999), and springsnowmelt is the dominant hydrological event of the year, ex-porting up to 50% of the annual stream flow during a 3–6week period in April–May. Both stream water chemistry anddischarge have been monitored regularly at one of the smallstreams, Kallkallsbacken for the past 25 years (Bishop et al.,1990). Current acid deposition in the catchment is approxi-mately 2 kg ha−1 y−1 each of S-SO2−
4 and N-NO−
3 .The Krycklan catchment ranges from 130 to 369 meters
above sea level. The bedrock consists of gneiss with an upto tens of meters of till overburden. Iron-podzol soils are themost common soil type in the catchment, with organic rich
soils in the riparian near stream zones (Bishop et al., 1994).In the lower reaches of the catchment, larger streams havedeeply incised channels carving through fine-grained flood-plain sediments. Except for patches of sphagnum-dominatedpeat wetlands, making up 9% of the entire catchment area(and up to 50% in some small sub-catchments), the catch-ment is forested primarily with mature Scots Pine (Pinussylvestris) in dry upslope areas and Norway Spruce (Piceaabies) in wetter, low-lying areas. Deciduous shrubs andtrees, primarily birch (Betula spp.) but also alder (Alnusincana) and willow (Salix spp.), are found in the riparianforest along larger streams. Brown trout (Salmo trutta) andBrook trout (Salvelinus fontinalis) are common in many ofthe streams.
The Krycklan stream network (Fig. 1) from the 1:100 000scale Swedish topography map (Lantmateriet, Gavle, Swe-den) was used for calculations of stream length. Characteris-tics of the 60 subcatchments (Table 1) were based on a flownetwork (N=1654 cells total) for Krycklan developed withinIDRISI v. 14 (Clark Labs, Worcester, MA, USE) using grid-ded elevation data (DEM) with a grid resolution of 50m. Forsoil type characteristics a 1:100 000 digital soil coverage map(Geological Survey of Sweden, Uppsala, Sweden) and forland cover type a 1:12 500 scale digital land-cover map wasused (Lantmateriet, Gavle, Sweden). From the soils map, thecategories silt, glaciofluvial sediment, sand and gravel werelumped to create a “sorted sediment” soil category. From theland cover map, the categories open and arable were lumpedto create an “open or arable” land cover category.
www.hydrol-earth-syst-sci.net/12/425/2008/ Hydrol. Earth Syst. Sci., 12, 425–435, 2008
428 H. Laudon and I. Buffam: Impact of changing DOC concentrations
3 Field and laboratory measurements
Stream water sampling consisted of grab samples, with mul-tiple rinses of stream water, collected in acid-washed 250 mlhigh-density polyethylene bottles. Additional samples forpCO2 analysis were collected in N2-filled 60 mL glass vialssealed with bromobutyl rubber septa. For each pCO2 sam-ple, a 15-mL aliquot of bubble-free stream water was injectedinto the glass vial, subsequently acidified to pH 2–3 with 1drop of 30% ultrapure HCl (0.5% v/v) and stored cold untilanalysis.
Throughout the Krycklan stream network, 60 locations(Fig. 1) were sampled on two separate occasions, during win-ter base flow and close to peak discharge during spring flood.Samples were collected 5–10 m above and 25–50 m belowjunctions in the stream network. The junction samples weresupplemented with samples from sites near the middle ofparticularly long (>2 km) stream reaches, and from 15 siteswhich are part of a long-term monitoring program (Cory etal., 2006; Buffam et al., 2007).
The winter base flow sampling occasion was collectedfrom 17–28 February 2005. Discharge during this periodwas stable at 0.21–0.22 mm day−1 at the reference site, typ-ical for winter low-flow discharge with a 25-year averageJanuary-March flow of 0.18 mm day−1. The spring floodsampling occasion on 22 April 2004 was on the rising limb ofthe snow melt hydrograph, concurrent with maximum DOCconcentration and minimum pH (Buffam et al., 2007). Dis-charge at the reference site on that day was 3.0 mm day−1,while peak flood was reached two weeks later on 4 Maywith 7.1 mm day−1 of flow during a rain-on-snow event.Peak spring flow in 2004 was within the typical range of9.7±3.4 mm day−1 for the 25-year mean of the daily peakspring flow at the reference site.
All water samples were kept dark and cool after collec-tion until they were subsampled for chemical analyses. pHat field condition was measured at laboratory temperatureusing a Ross 8102 low-conductivity combination electrode(ThermoOrion) in the laboratory immediately after collec-tion. Water samples for DOC analysis were filtered using0.45µm MCE membrane filters (spring flood sampling) orleft unfiltered (winter base flow sampling) and then frozenuntil analysis. No measurable difference in filtered and un-filtered DOC concentration was detected in this study or inother inter-comparisons in Swedish surface waters (Ivarssonand Jansson, 1994; Kohler et al., 1999). DOC was measuredby combustion and analysis as CO2 using a Shimadzu DOC-VPCH analyser after acidification and sparging to removeinorganic carbon. Instrument precision based on replicate in-jections averaged 2% and was always better than 5%.
Partial pressure of headspace CO2 was analyzed byGC-FID (Perkin Elmer Autosystem Gas chromatograph)equipped with a methanizer operating at 375◦C. Separa-tion was carried out on a Haysep N column using He(70 ml min−1) as carrier gas. Duplicate injections of 0.5 mL
were performed for all samples, with additional injections asnecessary to attain a coefficient of variation of less than 5%.Stream water pCO2 was calculated from sample headspacepCO2 using temperature-dependant equations for carbonateequilibria (Gelbrecht et al., 1998) and Henry’s Law (Weiss,1974), together with measured stream water pH and temper-ature. For three of the spring flood samples the average pCO2of the remaining 57 was used as no analyses were available.
Samples for major cation analyses (K+, Mg2+, Na+,Ca2+) were filtered (0.45µm MCE membrane filters), pre-served with ultrapure HNO−3 (1% v/v) and stored cool untilelemental analysis by ICP-OES (inductively-coupled plasmaoptical emission spectroscopy) on a Varian Vista Ax Pro in-strument. Samples for strong acid anions (SO2−
4 and Cl−)
were stored at 6◦C (2004 samples) or frozen (2005 sam-ples) until analysis, utilizing a Dionex DX-300 or DX-320ion chromatograph system. The typical precision in anionand cation analyses based on measurements of certified stan-dards was better than 2%. Analysis of NO−
3 by flow injectionanalysis on selected samples which had been preserved byfiltration and freezing until analysis (one-third of samples)revealed that concentrations were so low as to contribute in-significantly to the charge balance.
4 Calculations
Base cation (BC) concentration was calculated as the sumof K+, Mg2+, Na+ and Ca2+ concentrations expressed asµeq L−1 of charge, with the assumption that these elementswere present in their free ionized form. Strong acid anion(SAA) concentration was calculated as the sum of SO2−
4and Cl− expressed asµeq L−1 of charge. Acid neutraliz-ing capacity (ANC) was calculated from the charge balancedefinition as the difference between strong bases and strong(mineral) acid anions (e.g., Munson and Gherini, 1993), ex-pressed here as molar quantities:
ANC = [K+] + 2[Mg2+
] + [Na+] + 2[Ca2+
] − [Cl−]
− 2[SO2−
4 ] = BC− SAA (1)
An alternative way to express ANC is as (Eq. 2);
ANC = [HCO−
3 ] + 2[CO2−
3 ] + [RCOO−] + [OH−
]
− [H+] − n[Aln+
] (2)
where HCO−3 is calculated from pCO2 using Henry’s law andthe carbonate equilibria equations. CO2−
3 was excluded fromthe calculation, as pH always was below 7.0 and hence CO2−
3does not affect the pH modeling. RCOO− denotes dissoci-ated organic acid anions, including both the strong and weakacid anions, and is calculated from DOC and pH using anorganic acid model presented by Hruska et al. (2003). Aln+
denotes positively charged inorganic monomeric Al-species.As previous studies have shown that the inclusion of Aln+
Hydrol. Earth Syst. Sci., 12, 425–435, 2008 www.hydrol-earth-syst-sci.net/12/425/2008/

H. Laudon and I. Buffam: Impact of changing DOC concentrations 429
does not significantly improve the agreement between mea-sured and model-predicted pH over the range of Al concen-trations, DOC and pH found in these stream water samples(Kohler et al., 2000), Aln+ was also excluded from the cal-culations. H+ can hence be calculated as (Eq. 3):
[H+] = [HCO−
3 ] + [RCOO−] + [OH−
] − BC + SAA (3)
Because HCO−3 , RCOO− and OH− are pH dependent Eq. (3)was solved iteratively.
The effect of a change in DOC on stream water pH wascalculated using Eqs. (4–7), where the first step was to modelthe field proton concentration (H+modeled−field) using mea-sured pCO2, DOC, BC and SAA concentrations (Eq. 4). Theeffect of a change in DOC concentration on the H+ (H+
1DOC)
was then calculated, by adjusting DOC and hence RCOO−
accordingly, then re-establishing charge balance while main-taining the measured concentrations of pCO2, BC, and SAA(Eq. 5). After calculating1H+ as the difference betweenmodeled field H+ and the new H+ (H+
1DOC) after DOC ad-justment (Eq. 6) the final pH value (pHnew) used in the streamsensitivity analyses was calculated using Eq. (7).
H+
modeled−field =[HCO−
3 ] + [RCOO−] + [OH−
] − BC + SAA (4)
H+
1DOC = [HCO−
3 ]1DOC + [RCOO−]1DOC
+ [OH−]1DOC− BC + SAA (5)
1H+ = H+
1DOC− H+
modeled−field (6)
pHnew = −log(H+
measured+ 1H+) (7)
This procedure was repeated for all 60 stream sites using bothwinter base flow and spring flood chemistry as the startingpoint for changes in DOC ranging from−30% to +50%. Thereason for calculating1H+, which is than added to the mea-sured H+
modeled−field concentration instead of using modeledpH with a DOC change directly, was to minimize the uncer-tainty in the organic acid modeling. By using the suite ofequations (Eqs. 4–7) much of the uncertainty cancels out.
4.1 Stream length
The chemistry of each site was associated with its respectivestream segment, both for purposes of illustrative mappingand to express the chemical status of the stream network interms of proportion of stream length, rather than as propor-tion of sites. The length of each stream segment was de-termined by extending from a given site to the halfway point(distance measured along stream) between adjacent samplingsites, both upstream and downstream. In the case of head-water sites, stream segments were extended halfway to thefurthest upstream extent of the perennial stream, as indicatedon the 1:100 000 scale map. Stream segments were not ex-tended beyond major junctions. The length of the resultingstream segments varied between 68 m and 2874 m, with a
mean length of 941 m. From this calculation, we estimatedthat our 60 sampling sites represented a total of 56 km ofstream length, out of a total of 96 km in the whole network.For the remainder of the study, stream lengths are expressedas a percentage of total measured stream length, i.e., 56 km.
4.2 pH range of interest for acid sensitive species
Toxicity of water quality to fish and aquatic invertebrate pop-ulations in acidic systems has been linked to both low pH andelevated inorganic aluminium (Ali). Al toxicity (e.g., Gense-mer and Playle, 1999) is frequently the primary cause of acidimpacts on biota in low DOC aquatic systems. In aquaticsystems such as those covering much of northern Sweden,high DOC concentrations bind aluminium reducing its toxiceffects (Laudon et al., 2005; Simonin et al., 1993; Witters etal., 1990). For example, Atlantic salmon are limited by pHwith no clear physiological or toxicological response to Alconcentrations in high DOC streams of Nova Scotia, Canada(Lacroix, 1989). In a recent study conducted by the SwedishEPA reviewing all available national lake and stream waterquality and biological data, pH rather than Ali was recom-mended as preferred acidity index. This was because pHwas found to correlate as well as or better than Ali to pres-ence/absence of acid-sensitive fish species and stages (Holm-gren and Buffam, 2005), and better than Ali to the pres-ence/absence of acid-sensitive invertebrate species (Folsteret al., 2007). Furthermore these studies suggested that themost critical pH interval for many acid sensitive species gen-erally is between pH 5.5 and 5.0. Based on these results weused two thresholds in this study; pH 5.5 and pH 5.0 to as-sess the potential change in biological status due to changesin DOC concentration during the spring flood.
5 Results
The sampling conducted during both winter and spring rep-resents a stream length of 56 km out of the total 96 km ofstream length in the Krycklan catchment. The gaps in cov-erage were primarily due to under-sampling of the smallestfirst order tributaries. This gave a distribution of sample siteswith a median of 3.3 km2 as compared to 1.5 km2 for theentire network of potential sampling sites (Table 1). Thisunder-representation of the smallest streams can mainly beattributed to inaccessibility or frozen stream channels dur-ing winter sampling. Due to this tendency to under-representthe headwaters there was also an over-representation of ar-eas with sorted sediments and open or arable land, whichoccurred mostly along larger streams in the lower reaches ofthe catchment. Otherwise, the distributions of subcatchmentcharacteristics (soil, land-cover parameters) for the 60 sitesreplicated well the distribution of potential sampling pointsfrom the entire stream network (Table 1). This is of impor-tance because much of the inter-stream variation in stream
www.hydrol-earth-syst-sci.net/12/425/2008/ Hydrol. Earth Syst. Sci., 12, 425–435, 2008
430 H. Laudon and I. Buffam: Impact of changing DOC concentrations
4.00
4.50
5.00
5.50
6.00
6.50
7.00
1 4 7 10 13 16 19 22 25 28 31 34 37 40 43 46 49 52 55 58Site (ordered after spring flood pH)
Stre
am p
H (b
asef
low
-spr
ing
flood
)
Observed pH change +30% DOC
Acid sensitive
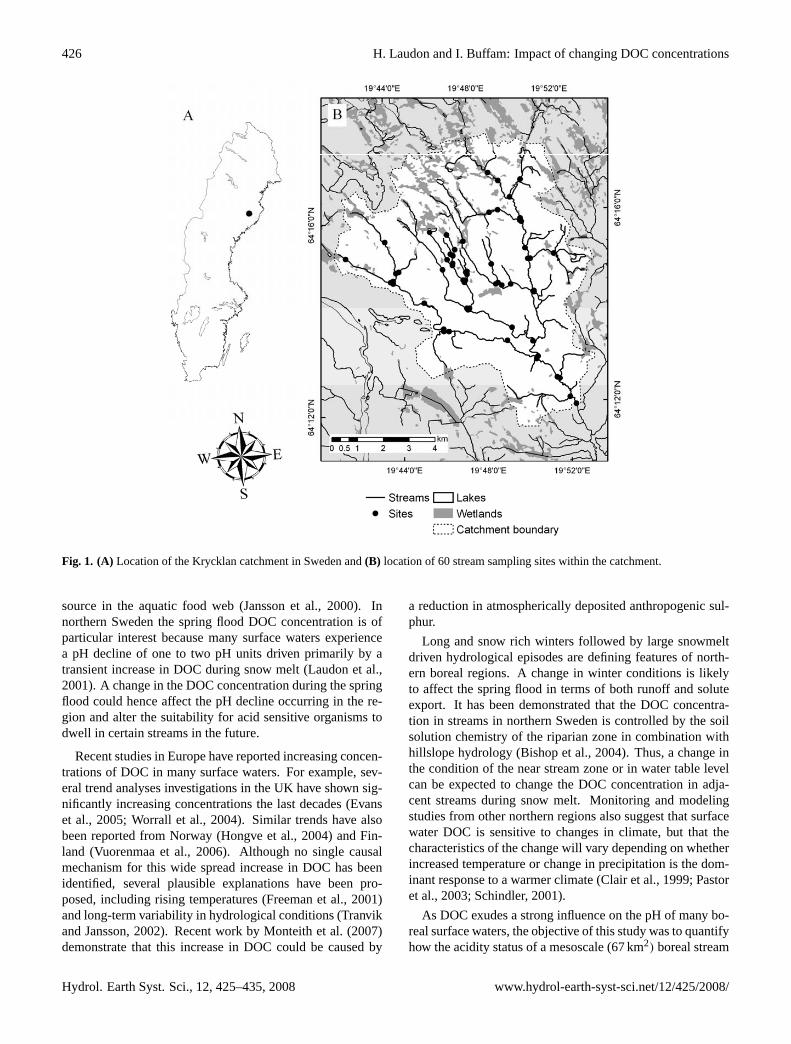
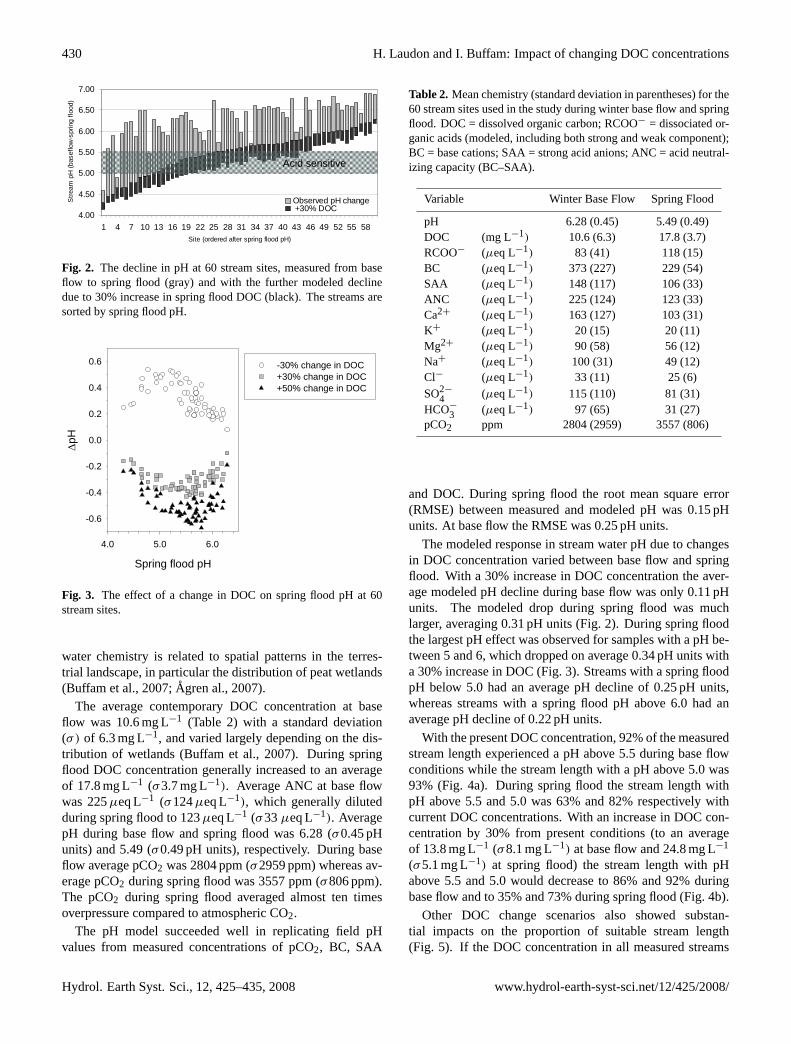
Fig. 2. The decline in pH at 60 stream sites, measured from baseflow to spring flood (gray) and with the further modeled declinedue to 30% increase in spring flood DOC (black). The streams aresorted by spring flood pH.
Spring flood pH
4.0 5.0 6.0
ΔpH
-0.6
-0.4
-0.2
0.0
0.2
0.4
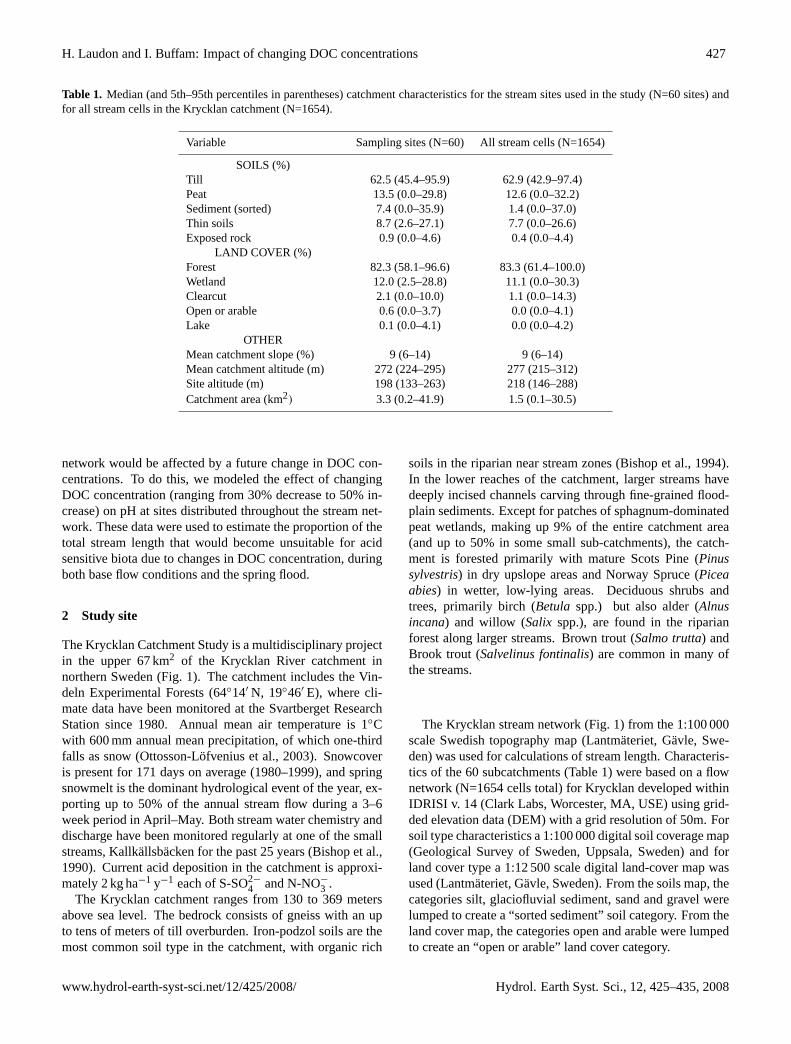
0.6 -30% change in DOC +30% change in DOC +50% change in DOC
Fig. 3. The effect of a change in DOC on spring flood pH at 60stream sites.
water chemistry is related to spatial patterns in the terres-trial landscape, in particular the distribution of peat wetlands(Buffam et al., 2007;Agren al., 2007).
The average contemporary DOC concentration at baseflow was 10.6 mg L−1 (Table 2) with a standard deviation(σ) of 6.3 mg L−1, and varied largely depending on the dis-tribution of wetlands (Buffam et al., 2007). During springflood DOC concentration generally increased to an averageof 17.8 mg L−1 (σ3.7 mg L−1). Average ANC at base flowwas 225µeq L−1 (σ124µeq L−1), which generally dilutedduring spring flood to 123µeq L−1 (σ33µeq L−1). AveragepH during base flow and spring flood was 6.28 (σ0.45 pHunits) and 5.49 (σ0.49 pH units), respectively. During baseflow average pCO2 was 2804 ppm (σ2959 ppm) whereas av-erage pCO2 during spring flood was 3557 ppm (σ806 ppm).The pCO2 during spring flood averaged almost ten timesoverpressure compared to atmospheric CO2.
The pH model succeeded well in replicating field pHvalues from measured concentrations of pCO2, BC, SAA
Table 2. Mean chemistry (standard deviation in parentheses) for the60 stream sites used in the study during winter base flow and springflood. DOC = dissolved organic carbon; RCOO− = dissociated or-ganic acids (modeled, including both strong and weak component);BC = base cations; SAA = strong acid anions; ANC = acid neutral-izing capacity (BC–SAA).
Variable Winter Base Flow Spring Flood
pH 6.28 (0.45) 5.49 (0.49)DOC (mg L−1) 10.6 (6.3) 17.8 (3.7)RCOO− (µeq L−1) 83 (41) 118 (15)BC (µeq L−1) 373 (227) 229 (54)SAA (µeq L−1) 148 (117) 106 (33)ANC (µeq L−1) 225 (124) 123 (33)Ca2+ (µeq L−1) 163 (127) 103 (31)K+ (µeq L−1) 20 (15) 20 (11)Mg2+ (µeq L−1) 90 (58) 56 (12)Na+ (µeq L−1) 100 (31) 49 (12)Cl− (µeq L−1) 33 (11) 25 (6)SO2−
4 (µeq L−1) 115 (110) 81 (31)HCO−
3 (µeq L−1) 97 (65) 31 (27)pCO2 ppm 2804 (2959) 3557 (806)
and DOC. During spring flood the root mean square error(RMSE) between measured and modeled pH was 0.15 pHunits. At base flow the RMSE was 0.25 pH units.
The modeled response in stream water pH due to changesin DOC concentration varied between base flow and springflood. With a 30% increase in DOC concentration the aver-age modeled pH decline during base flow was only 0.11 pHunits. The modeled drop during spring flood was muchlarger, averaging 0.31 pH units (Fig. 2). During spring floodthe largest pH effect was observed for samples with a pH be-tween 5 and 6, which dropped on average 0.34 pH units witha 30% increase in DOC (Fig. 3). Streams with a spring floodpH below 5.0 had an average pH decline of 0.25 pH units,whereas streams with a spring flood pH above 6.0 had anaverage pH decline of 0.22 pH units.
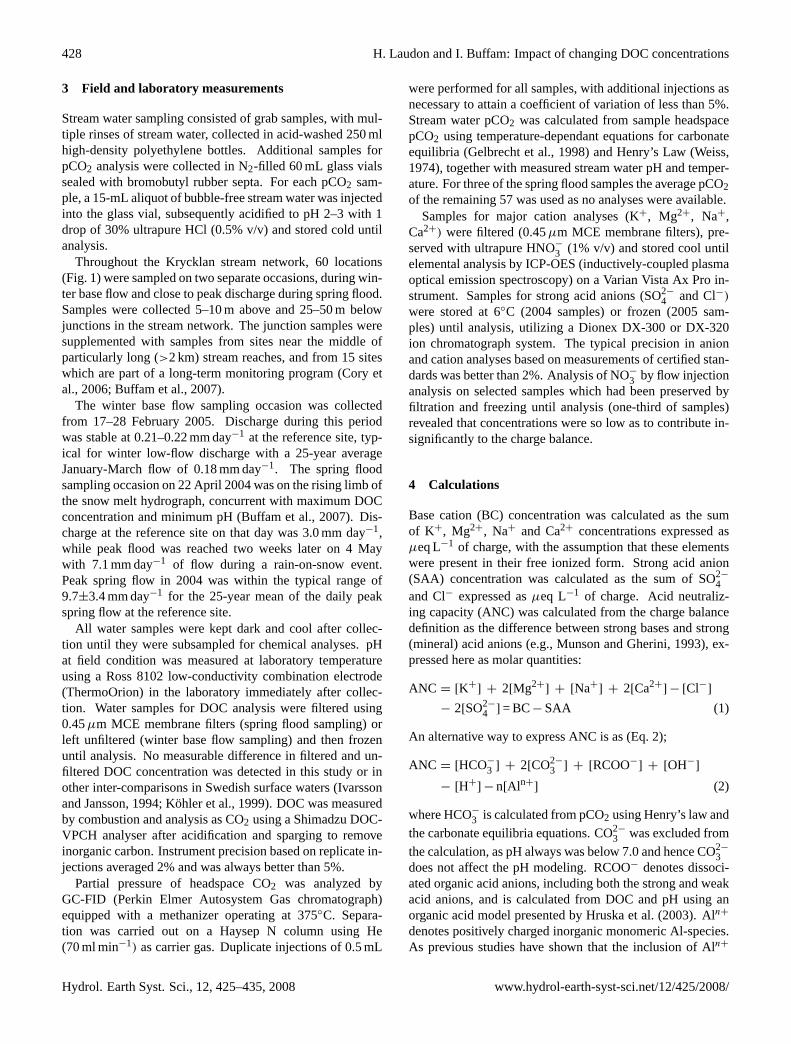
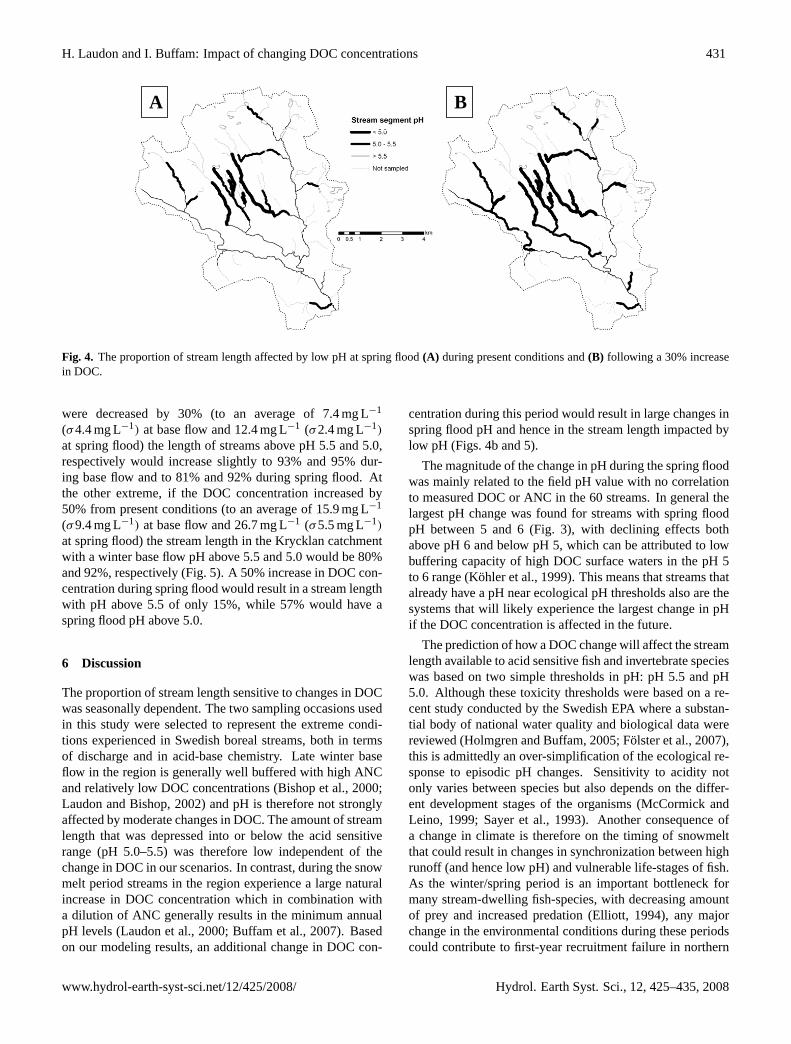
With the present DOC concentration, 92% of the measuredstream length experienced a pH above 5.5 during base flowconditions while the stream length with a pH above 5.0 was93% (Fig. 4a). During spring flood the stream length withpH above 5.5 and 5.0 was 63% and 82% respectively withcurrent DOC concentrations. With an increase in DOC con-centration by 30% from present conditions (to an averageof 13.8 mg L−1 (σ8.1 mg L−1) at base flow and 24.8 mg L−1
(σ5.1 mg L−1) at spring flood) the stream length with pHabove 5.5 and 5.0 would decrease to 86% and 92% duringbase flow and to 35% and 73% during spring flood (Fig. 4b).
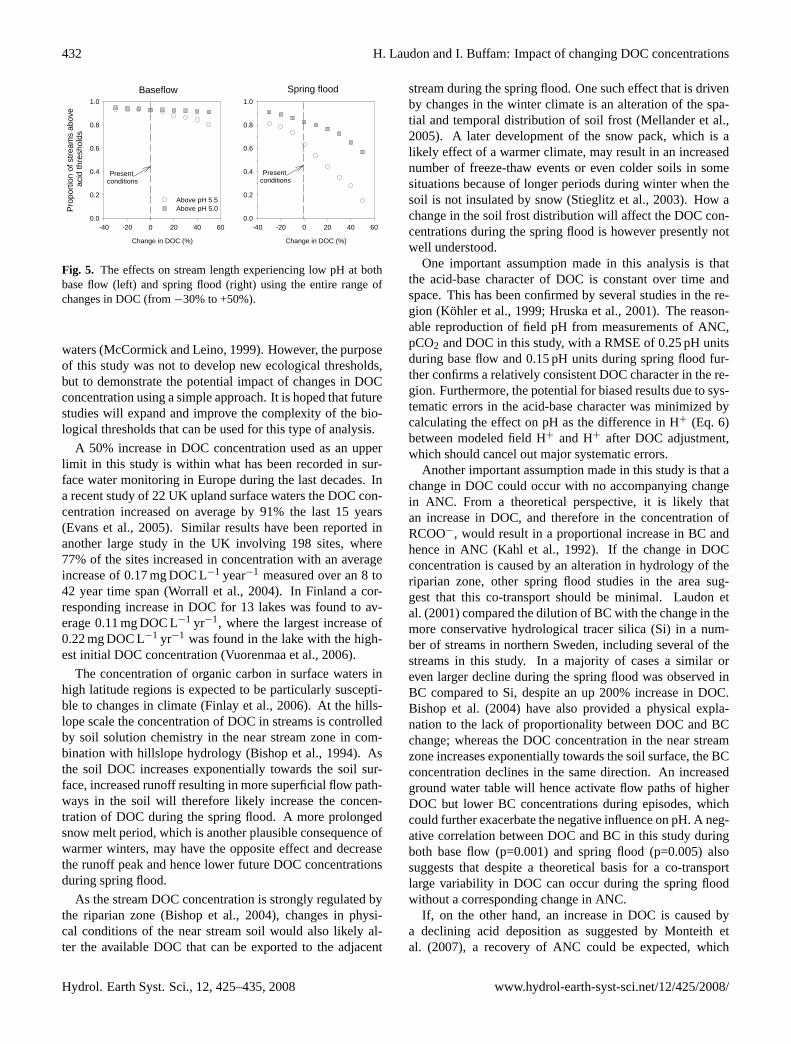
Other DOC change scenarios also showed substan-tial impacts on the proportion of suitable stream length(Fig. 5). If the DOC concentration in all measured streams
Hydrol. Earth Syst. Sci., 12, 425–435, 2008 www.hydrol-earth-syst-sci.net/12/425/2008/
H. Laudon and I. Buffam: Impact of changing DOC concentrations 431
A B
Fig. 4. The proportion of stream length affected by low pH at spring flood(A) during present conditions and(B) following a 30% increasein DOC.
were decreased by 30% (to an average of 7.4 mg L−1
(σ4.4 mg L−1) at base flow and 12.4 mg L−1 (σ2.4 mg L−1)
at spring flood) the length of streams above pH 5.5 and 5.0,respectively would increase slightly to 93% and 95% dur-ing base flow and to 81% and 92% during spring flood. Atthe other extreme, if the DOC concentration increased by50% from present conditions (to an average of 15.9 mg L−1
(σ9.4 mg L−1) at base flow and 26.7 mg L−1 (σ5.5 mg L−1)
at spring flood) the stream length in the Krycklan catchmentwith a winter base flow pH above 5.5 and 5.0 would be 80%and 92%, respectively (Fig. 5). A 50% increase in DOC con-centration during spring flood would result in a stream lengthwith pH above 5.5 of only 15%, while 57% would have aspring flood pH above 5.0.
6 Discussion
The proportion of stream length sensitive to changes in DOCwas seasonally dependent. The two sampling occasions usedin this study were selected to represent the extreme condi-tions experienced in Swedish boreal streams, both in termsof discharge and in acid-base chemistry. Late winter baseflow in the region is generally well buffered with high ANCand relatively low DOC concentrations (Bishop et al., 2000;Laudon and Bishop, 2002) and pH is therefore not stronglyaffected by moderate changes in DOC. The amount of streamlength that was depressed into or below the acid sensitiverange (pH 5.0–5.5) was therefore low independent of thechange in DOC in our scenarios. In contrast, during the snowmelt period streams in the region experience a large naturalincrease in DOC concentration which in combination witha dilution of ANC generally results in the minimum annualpH levels (Laudon et al., 2000; Buffam et al., 2007). Basedon our modeling results, an additional change in DOC con-
centration during this period would result in large changes inspring flood pH and hence in the stream length impacted bylow pH (Figs. 4b and 5).
The magnitude of the change in pH during the spring floodwas mainly related to the field pH value with no correlationto measured DOC or ANC in the 60 streams. In general thelargest pH change was found for streams with spring floodpH between 5 and 6 (Fig. 3), with declining effects bothabove pH 6 and below pH 5, which can be attributed to lowbuffering capacity of high DOC surface waters in the pH 5to 6 range (Kohler et al., 1999). This means that streams thatalready have a pH near ecological pH thresholds also are thesystems that will likely experience the largest change in pHif the DOC concentration is affected in the future.
The prediction of how a DOC change will affect the streamlength available to acid sensitive fish and invertebrate specieswas based on two simple thresholds in pH: pH 5.5 and pH5.0. Although these toxicity thresholds were based on a re-cent study conducted by the Swedish EPA where a substan-tial body of national water quality and biological data werereviewed (Holmgren and Buffam, 2005; Folster et al., 2007),this is admittedly an over-simplification of the ecological re-sponse to episodic pH changes. Sensitivity to acidity notonly varies between species but also depends on the differ-ent development stages of the organisms (McCormick andLeino, 1999; Sayer et al., 1993). Another consequence ofa change in climate is therefore on the timing of snowmeltthat could result in changes in synchronization between highrunoff (and hence low pH) and vulnerable life-stages of fish.As the winter/spring period is an important bottleneck formany stream-dwelling fish-species, with decreasing amountof prey and increased predation (Elliott, 1994), any majorchange in the environmental conditions during these periodscould contribute to first-year recruitment failure in northern
www.hydrol-earth-syst-sci.net/12/425/2008/ Hydrol. Earth Syst. Sci., 12, 425–435, 2008
432 H. Laudon and I. Buffam: Impact of changing DOC concentrations
Change in DOC (%)
-40 -20 0 20 40 60
Pro
porti
on o
f stre
ams
abov
e a
cid
thre
shol
ds
0.0
0.2
0.4
0.6
0.8
1.0
Above pH 5.5Above pH 5.0
Change in DOC (%)
-40 -20 0 20 40 600.0
0.2
0.4
0.6
0.8
1.0
Present conditions
Present conditions
Baseflow Spring flood
Fig. 5. The effects on stream length experiencing low pH at bothbase flow (left) and spring flood (right) using the entire range ofchanges in DOC (from−30% to +50%).
waters (McCormick and Leino, 1999). However, the purposeof this study was not to develop new ecological thresholds,but to demonstrate the potential impact of changes in DOCconcentration using a simple approach. It is hoped that futurestudies will expand and improve the complexity of the bio-logical thresholds that can be used for this type of analysis.
A 50% increase in DOC concentration used as an upperlimit in this study is within what has been recorded in sur-face water monitoring in Europe during the last decades. Ina recent study of 22 UK upland surface waters the DOC con-centration increased on average by 91% the last 15 years(Evans et al., 2005). Similar results have been reported inanother large study in the UK involving 198 sites, where77% of the sites increased in concentration with an averageincrease of 0.17 mg DOC L−1 year−1 measured over an 8 to42 year time span (Worrall et al., 2004). In Finland a cor-responding increase in DOC for 13 lakes was found to av-erage 0.11 mg DOC L−1 yr−1, where the largest increase of0.22 mg DOC L−1 yr−1 was found in the lake with the high-est initial DOC concentration (Vuorenmaa et al., 2006).
The concentration of organic carbon in surface waters inhigh latitude regions is expected to be particularly suscepti-ble to changes in climate (Finlay et al., 2006). At the hills-lope scale the concentration of DOC in streams is controlledby soil solution chemistry in the near stream zone in com-bination with hillslope hydrology (Bishop et al., 1994). Asthe soil DOC increases exponentially towards the soil sur-face, increased runoff resulting in more superficial flow path-ways in the soil will therefore likely increase the concen-tration of DOC during the spring flood. A more prolongedsnow melt period, which is another plausible consequence ofwarmer winters, may have the opposite effect and decreasethe runoff peak and hence lower future DOC concentrationsduring spring flood.
As the stream DOC concentration is strongly regulated bythe riparian zone (Bishop et al., 2004), changes in physi-cal conditions of the near stream soil would also likely al-ter the available DOC that can be exported to the adjacent
stream during the spring flood. One such effect that is drivenby changes in the winter climate is an alteration of the spa-tial and temporal distribution of soil frost (Mellander et al.,2005). A later development of the snow pack, which is alikely effect of a warmer climate, may result in an increasednumber of freeze-thaw events or even colder soils in somesituations because of longer periods during winter when thesoil is not insulated by snow (Stieglitz et al., 2003). How achange in the soil frost distribution will affect the DOC con-centrations during the spring flood is however presently notwell understood.
One important assumption made in this analysis is thatthe acid-base character of DOC is constant over time andspace. This has been confirmed by several studies in the re-gion (Kohler et al., 1999; Hruska et al., 2001). The reason-able reproduction of field pH from measurements of ANC,pCO2 and DOC in this study, with a RMSE of 0.25 pH unitsduring base flow and 0.15 pH units during spring flood fur-ther confirms a relatively consistent DOC character in the re-gion. Furthermore, the potential for biased results due to sys-tematic errors in the acid-base character was minimized bycalculating the effect on pH as the difference in H+ (Eq. 6)between modeled field H+ and H+ after DOC adjustment,which should cancel out major systematic errors.
Another important assumption made in this study is that achange in DOC could occur with no accompanying changein ANC. From a theoretical perspective, it is likely thatan increase in DOC, and therefore in the concentration ofRCOO−, would result in a proportional increase in BC andhence in ANC (Kahl et al., 1992). If the change in DOCconcentration is caused by an alteration in hydrology of theriparian zone, other spring flood studies in the area sug-gest that this co-transport should be minimal. Laudon etal. (2001) compared the dilution of BC with the change in themore conservative hydrological tracer silica (Si) in a num-ber of streams in northern Sweden, including several of thestreams in this study. In a majority of cases a similar oreven larger decline during the spring flood was observed inBC compared to Si, despite an up 200% increase in DOC.Bishop et al. (2004) have also provided a physical expla-nation to the lack of proportionality between DOC and BCchange; whereas the DOC concentration in the near streamzone increases exponentially towards the soil surface, the BCconcentration declines in the same direction. An increasedground water table will hence activate flow paths of higherDOC but lower BC concentrations during episodes, whichcould further exacerbate the negative influence on pH. A neg-ative correlation between DOC and BC in this study duringboth base flow (p=0.001) and spring flood (p=0.005) alsosuggests that despite a theoretical basis for a co-transportlarge variability in DOC can occur during the spring floodwithout a corresponding change in ANC.
If, on the other hand, an increase in DOC is caused bya declining acid deposition as suggested by Monteith etal. (2007), a recovery of ANC could be expected, which
Hydrol. Earth Syst. Sci., 12, 425–435, 2008 www.hydrol-earth-syst-sci.net/12/425/2008/
H. Laudon and I. Buffam: Impact of changing DOC concentrations 433
would remediate the negative influence on pH. Previous anal-yses of spring flood episodes in northern Sweden have how-ever demonstrated that the pulse of acidity generating pH de-cline over two pH units in many streams, is now derived pri-marily from an increase in naturally occurring organic acidsin conjunction with the dilution of ANC (Bishop et al., 2000;Laudon et al., 2001). As anthropogenic deposition at presentonly contributes between 0.1 and 0.3 pH units to the springflood pH decline, little further recovery can be expected inthe future (Laudon and Bishop, 2002; Laudon and Hemond,2002). While the acid-emissions related acidification pres-sure has been declining, climate change is expected to be anincreasing threat to the region’s aquatic resources.
A third uncertainty in predicting sensitivity to futurechanges is how pCO2 would be affected. The pCO2 has alarge influence on pH during both base flow and spring flood.For example if the pCO2 were in equilibrium with the atmo-sphere, instead of the almost 10 times mean over-pressuremeasured, the average pH during the spring flood would onaverage for the 60 stream sites be 0.4 pH units higher. Be-cause of a significant positive correlation (p=0.004) betweenDOC and pCO2 suggesting similar source areas, an increasein DOC could occur together with increased pCO2 during thespring flood. This would result in a further depression of pHin the range sensitive to buffering by CO2 (pH>5).
7 Conclusion
In this work we have investigated the potential implicationsof changes in the DOC concentration on stream water biotausing a mesoscale boreal stream network in northern Swe-den. The results suggest that in low buffered systems, espe-cially during the spring flood, even a marginal change in theDOC concentration can impact acid sensitive biota in a largeportion of the aquatic landscape.
The premise of the modeling exercise in this study wasto demonstrate the impact of changes in DOC concentrationalone on pH. As variation in DOC concentration is notexpected to occur in isolation but instead to be accompaniedby variation in other solutes, the causal mechanism behindchanges in DOC has considerable implications for the likelyimpact on pH. If changes in DOC are caused by shiftingwater tables resulting from changes in temperature or thetemporal distribution of precipitation and temperature, forinstance, resulting changes in pH are likely to be even moreextreme than those predicted in this study. That is becausesoil flow pathways which favor high DOC concentrationstend to be near-surface and thus low in BC relative to deeperflow pathways. Increases in DOC are thus likely to be ac-companied by decreases in BC, further exacerbating changesin pH, and vice versa for decreases in DOC. On the otherhand, if current or future changes in DOC are the result ofrecovery from soil acidification, then the increasing organicacid concentrations will be accompanied by decreases instrong acid anions (e.g. SO2−
4 ) and/or increases in BC.This will result in little or no change in pH for a given
change in DOC. It is plausible that both mechanisms couldbe operating in the same systems simultaneously, lendinguncertainty to simple prediction of the impact of changingDOC on pH. Regardless, in high-DOC systems DOC playsan important role in controlling pH, and thus considerationof this factor is important especially given the current trendsin DOC concentration across many regions.
Edited by: P. Dillon and R. F. Wright
References
Agren, A., Buffam, I., Jansson, M., and Laudon, H.: Importanceof seasonality and small streams for the landscape regulation ofDOC export, J. Geophys. Res., 112, G03003, doi:10.1029/2006JG000381, 2007.
Barnett, T. P., Adam, J. C., and Lettenmaier, D. P.: Potential impactsof a warming climate on water availability in snow-dominatedregions, Nature, 438, 303–309, 2005.
Bishop, K., Pettersson, C., Allard, B., and Lee, Y. H.: Identificationof the Riparian Sources of Aquatic Dissolved Organic-Carbon,Environ. Int., 20, 11–19, 1994.
Bishop, K., Seibert, J., Kohler, S., and Laudon, H.: Resolving theDouble Paradox of rapidly mobilized old water with highly vari-able responses in runoff chemistry, Hydrol. Process., 18, 185–189, 2004.
Bishop, K. H., Grip, H., and O’Neill, A.: The origin of acid runoffin a hillslope during storm events, J. Hydrol., 116, 35–61, 1990.
Bishop, K. H., Laudon, H., and Kohler, S.: Separating the naturaland anthropogenic components of spring flood pH decline: Amethod for areas that are not chronically acidified, Water Resour.Res., 30, 1873–1889, 2000.
Buffam, I., Laudon, H., Temnerud, J., Morth, C. M., and Bishop,K.: Landscape-scale variability of acidity and dissolved organiccarbon during spring flood in a boreal stream network, J. Geo-phys. Res., 112, G01022, doi:10.1029/2006JG000218, 2007.
Clair, T. A., Ehrman, J. M., and Higuchi, K.: Changes in freshwatercarbon exports from Canadian terrestrial basins to lakes and estu-aries under a 2XCO2 atmospheric scenario, Global Biogeochem.Cy., 13, 1091–1097, 1999.
Cory, N., Buffam, I., Laudon, H., Kohler, S., and Bishop, K.:Landscape control of stream water aluminum in a boreal catch-ment during spring flood, Environ. Sci. Technol., 40, 3494–3500,2006.
Elliott, J. M.: Quantitative Ecology and the Brown Trout, OxfordUniversity Press, Walton Street, Oxford OX2 6DP, p. 286, 1994.
Evans, C. D., Monteith, D. T., and Cooper, D. M.: Long-termincreases in surface water dissolved organic carbon: Observa-tions, possible causes and environmental impacts, Environ. Pol-lut., 137, 55–71, 2005.
Finlay, J., Neff, J., Zimov, S., Davydova, A., and Davy-dov, S.: Snowmelt dominance of dissolved organic carbonin high-latitude watersheds: Implications for characterizationand flux of river DOC, Geophys. Res. Lett., 33, L10401,doi:10.1029/2006GL025754, 2006.
Folster, J., Andren, C., Bishop, K., Buffam, I., Cory, N., Goed-koop, W., Holmgren, K., Johnson, R., Laudon, H., and Wilan-der, A.: New Environmental Quality Criteria for acidification inlakes in Sweden – an application of studies on the relationship
www.hydrol-earth-syst-sci.net/12/425/2008/ Hydrol. Earth Syst. Sci., 12, 425–435, 2008
434 H. Laudon and I. Buffam: Impact of changing DOC concentrations
between biota and water chemistry, Water Air Soil Poll., 7, 331–338, 2007.
Freeman, C., Evans, C. D., Monteith, D. T., Reynolds, B., and Fen-ner, N.: Export of organic carbon from peat soils, Nature, 412,785–785, 2001.
Gelbrecht, J., Fait, M., Dittrich, M., and Steinberg, C.: Use of GCand equilibrium calculations of CO2 saturation index to indi-cate whether freshwater bodies in north-eastern Germany are netsources or sinks for atmospheric CO2, Fresen, J. Anal. Chem.,361, 47–53, 1998.
Gensemer, R. W. and Playle, R. C.: The bioavailability and toxicityof aluminum in aquatic environments, Crit. Rev. Env. Sci. Tech.,29, 315–450, 1999.
Groffman, P. M., Driscoll, C. T., Fahey, T. J., Hardy, J. P., Fitzhugh,R. D., and Tierney, G. L.: Colder soils in a warmer world: Asnow manipulation study in a northern hardwood forest ecosys-tem, Biogeochemistry, 56, 135–150, 2001.
Holmgren, K. and Buffam, I.: Critical values of different acidityindices – as shown by fish communities in Swedish lakes, Verh.Internat. Verein. Limnol., 29, 654–660, 2005.
Hongve, D., Riise, G., and Kristiansen, J. F.: Increased colour andorganic acid concentrations in Norwegian forest lakes and drink-ing water – a result of increased precipitation?, Aquat. Sci., 66,231–238, 2004.
Hruska, J., Kohler, S., Laudon, H., and Bishop, K.: Is a universalmodel of organic acidity possible: Comparison of the acid/baseproperties of dissolved organic carbon in the boreal and temper-ate zones, Environ. Sci. Technol., 37, 1726–1730, 2003.
Hruska, J., Laudon, H., Johnson, C. E., Kohler, S., and Bishop, K.:Acid/base character of organic acids in a boreal stream duringsnowmelt, Water Resour. Res., 37, 1043–1056, 2001.
Ivarsson, H. and Jansson, M.: Temporal variations in the concen-tration and character of dissolved Organic-matter in a highly col-ored stream in the coastal zone of northern Sweden, Arch. Hy-drobiol., 132, 45–55, 1994.
Jansson, M., Bergstrom, A. K., Blomqvist, P., and Drakare, S.: Al-lochthonous organic carbon and phytoplankton/bacterioplanktonproduction relationships in lakes, Ecology, 81, 3250–3255, 2000.
Kahl, J. S., Norton, S. A., Haines, T. A., Rochette, E. A., Heath, R.H., and Nodvin, S. C.: Mechanisms of episodic acidification inlow-order streams in Maine, USA, Environ. Pollut., 78, 37–44,1992.
Kjellstrom, E.: Recent and future signatures of climate change inEurope, Ambio, 33, 193–198, 2004.
Kohler, S., Hruska, J., and Bishop, K.: Influence of organic acid sitedensity on pH modeling of Swedish lakes, Can. J. Fish. Aquat.Sci., 56, 1461–1470, 1999.
Kohler, S., Laudon, H., Wilander, A., and Bishop, K.: Estimatingorganic acid dissociation in natural surface waters using total al-kalinity and TOC, Water Res., 34, 1425–1434, 2000.
Lacroix, G. L.: Ecological and Physiological Responses of AtlanticSalmon in Acidic Organic Rivers of Nova Scotia, Canada, WaterAir Soil Poll., 46, 375–386, 1989.
Laudon, H. and Bishop, K. H.: The rapid and extensive re-covery from episodic acidification in northern Sweden due todeclines in SO42-deposition, Geophys. Res. Lett., 29, 1594,doi:10.1029/2001GL014211, 2002.
Laudon, H. and Hemond, H. F.: Recovery of streams from episodicacidification in northern Sweden, Environ. Sci. Technol., 36,
921–928, 2002.Laudon, H., Poleo, A. B. S., Vollestad, L. A., and Bishop, K.: Sur-
vival of brown trout during spring flood in DOC-rich streams innorthern Sweden: the effect of present acid deposition and mod-eled pre-industrial water quality, Environ. Pollut., 135, 121–130,2005.
Laudon, H., Westling, O., and Bishop, K.: Cause of pH decline instream water during spring melt runoff in northern Sweden, Can.J. Fish. Aquat. Sci., 57, 1888–1900, 2000.
Laudon, H., Westling, O., Lofgren, S., and Bishop, K.: Modelingpreindustrial ANC and pH during the spring flood in northernSweden, Biogeochemistry, 54, 171–195, 2001.
McCormick, J. H. and Leino, R. L.: Factors contributing to first-year recruitment failure of fishes in acidified waters with someimplications for environmental research, T. Am. Fish. Soc., 128,265–277, 1999.
Mellander, P. E., Ottosson, M., and Laudon, H.: Climate changeimpact on snow and soil temperature in boreal Scots pine stands,Climatic Change, 85(1–2), 179–193, doi:10.1007/s10584-007-9254-3, 2007.
Mellander, P. E., Laudon, H., and Bishop, K.: Modeling variabilityof snow depths and soil temperatures in Scots pine stands, Agr.Forest Meteorol., 133, 109–118, 2005.
Monteith, D. T., Stoddard, J. L., Evans, C. D., de Wit, H. A.,Forsius, M., Høgasen, T., Wilander, A., Skjelkvale, B. L.,Jeffries, D. S., Vourenmaa, J., Keller, B., Kopacek, J., andVesely, J.: Dissolved organic carbon trends resulting fromchanges in atmospheric deposition chemistry, Nature, 450,doi:10.1038/nature06316, 2007.
Munson, R. K. and Gherini, S. A.: Influence of Organic-Acids onthe pH and Acid-Neutralizing Capacity of Adirondack Lakes,Water Resour. Res., 29, 891–899, 1993.
Ottosson-Lofvenius, M. O., Kluge, M., and Lundmark, T.: Snowand soil frost depth in two types of shelterwood and a clear-cutarea, Scand. J. Forest Res., 18, 54–63, 2003.
Pastor, J., Solin, J., Bridgham, S. D., Updegraff, K., Harth, C.,Weishampel, P., and Dewey, B.: Global warming and the exportof dissolved organic carbon from boreal peatlands, Oikos, 100,380–386, 2003.
Rember, R. D. and Trefry, J. H.: Increased concentrations of dis-solved trace metals and organic carbon during snowmelt in riversof the Alaskan Arctic, Geochim. Cosmochim. Acta, 68, 477–489, 2004.
Sayer, M. D. J., Reader, J. P., and Dalziel, T. R. K.: Fresh-WaterAcidification – Effects on the Early-Life Stages of Fish, Rev. FishBiol. Fisher., 3, 95–132, 1993.
Schindler, D. W.: The cumulative effects of climate warming andother human stresses on Canadian freshwaters in the new millen-nium, Can. J. Fish. Aquat. Sci., 58, 18–29, 2001.
Simonin, H. A., Kretser, W. A., Bath, D. W., Olson, M., and Gal-lagher, J.: In-situ bioassays of brook trout (Salvelinus-Fontinalis)and blacknose dace (Rhinichthys-Atratulus) in Adirondackstreams affected by episodic acidification, Can. J. Fish. Aquat.Sci., 50, 902–912, 1993.
Stieglitz, M., Dery, S. J., Romanovsky, V. E., and Osterkamp, T. E.:The role of snow cover in the warming of arctic permafrost, Geo-phys. Res. Lett., 30, 1721, doi:10.1029/2003GL017337, 2003.
Tranvik, L. J. and Jansson, M.: Climate change – Terrestrial exportof organic carbon, Nature, 415, 861–862, 2002.
Hydrol. Earth Syst. Sci., 12, 425–435, 2008 www.hydrol-earth-syst-sci.net/12/425/2008/

H. Laudon and I. Buffam: Impact of changing DOC concentrations 435
Venalainen, A., Tuomenvirta, H., Heikinheimo, M., Kellomaki, S.,Peltola, H., Strandman, H., and Vaisanen, H.: Impact of climatechange on soil frost under snow cover in a forested landscape,Climate Res., 17, 63–72, 2001.
Vuorenmaa, J., Forsius, M., and Mannio, J.: Increasing trends of to-tal organic carbon concentrations in small forest lakes in Finlandfrom 1987 to 2003, Sci. Total Environ., 365, 47–65, 2006.
Weiss, R. F.: Carbon dioxide in water and seawater: the solubilityof a non-ideal gas, Mar. Chem., 2, 203–215, 1974.
Witters, H. E., Van Puymbroeck, S., Vangenechten, J. H. D., andVanderborght, O. L. J.: The effect of humic substances on thetoxicity of aluminium to adult rainbow trout, Oncorhynchusmykiss (Walbaum), J. Fish Biol., 37, 45–53,1990.
Worrall, F., Harriman, R., Evans, C. D., Watts, C. D., Adamson, J.,Neal, C., Tipping, E., Burt, T., Grieve, I., Monteith, D., Naden,P. S., Nisbet, T., Reynolds, B., and Stevens, P.: Trends in dis-solved organic carbon in UK rivers and lakes, Biogeochemistry,70, 369–402, 2004.
www.hydrol-earth-syst-sci.net/12/425/2008/ Hydrol. Earth Syst. Sci., 12, 425–435, 2008