IMMOBILIZATION-INDUCED ADAPTATIONS IN SKELETAL MUSCLE: CONTRACTILE PROPERTIES AND CALCIUM DYNAMICS
38
111Equation Chapter 1 Section 1 IMMOBILIZATION-INDUCED ADAPTATIONS IN SKELETAL MUSCLE: CONTRACTILE PROPERTIES AND CALCIUM DYNAMICS Matthew J. Conaway 1,2 and Brian C. Clark 1,2,3 . 1 Ohio Musculoskeletal and Neurological Institute (OMNI), 2 Department of Biomedical Sciences, and 3 Department of Geriatric Medicine and Gerontology at Ohio University, Athens, Ohio 45701 Address for Correspondence : Dr. Matthew J Conaway Ohio University OMNI & the Dept. of Biomedical Sciences, 228 Irvine Hall Athens, OH 45701 mjconaway68@ gmail.com
-
Upload
independent -
Category
Documents
-
view
0 -
download
0
Transcript of IMMOBILIZATION-INDUCED ADAPTATIONS IN SKELETAL MUSCLE: CONTRACTILE PROPERTIES AND CALCIUM DYNAMICS

111Equation Chapter 1 Section 1
IMMOBILIZATION-INDUCED ADAPTATIONS IN SKELETAL MUSCLE: CONTRACTILE PROPERTIES AND CALCIUM DYNAMICS
Matthew J. Conaway1,2 and Brian C. Clark1,2,3.
1Ohio Musculoskeletal and Neurological Institute (OMNI),
2Department of Biomedical Sciences, and 3Department of Geriatric
Medicine and Gerontology at Ohio University, Athens, Ohio 45701
Address for Correspondence:Dr. Matthew J ConawayOhio UniversityOMNI & the Dept. of Biomedical Sciences, 228 Irvine HallAthens, OH 45701mjconaway68@ gmail.com

ABSTRACT
The purpose of this work was to examine the intramuscular
mechanisms of muscle weakness by quantifying changes in evoked
muscle force-time curves following 4-weeks of cast
immobilization, and use mathematical models to predict muscle
force generation based on the dynamics of Ca2+ described by a
Riccati differential equation. Fourteen young, healthy adults
were assigned to either a experimental wrist-hand cast-
immobilization group (n=7) or a control group (n=7). Before and
after a 4-week intervention period study participants peak evoked
force from supramaximal doublet electrical stimulation and the
relative rates of evoked force development between 10 and 40% and
50 and 90% of peak force (+dF/dt) were determined along with the
relative rate of force relaxation between 90 and 50% of peak
force (-dF/dt). Mathematical modeling was used to predict muscle
force generation based on the dynamics of Ca2+described by a
Riccati differential equation. We observed that the majority of
the evoked and modeled contractile properties were unchanged
following immobilization. The most notable findings were group x
time interactions indicating immobilization resulted in a slowing
in the relative +dF/dt during the latter part of the evoked phase
of contraction (p=0.02) and a 25% longer time constant τc
(p<0.01), which qualitatively describes the rate-limiting step
before the actin and myosin mechanically translate across each
other and generate force. These findings suggest that one of the
most significant alterations in skeletal muscle contractile
properties associated with prolonged disuse is a slowing in the
latter phases of muscle force development that is likely due to a
prolonged time of action in the calcium-troponin mechanism.
Key Words: Disuse, Muscle, Weakness, Dynapenia, Excitation-
Contraction Coupling
INTRODUCTION
Prolonged disuse of skeletal muscle results in many adverse
consequences, such as muscle atrophy and weakness. These losses
in muscle strength are mediated by changes in both muscular and

neural properties (3). For instance, it has previously been
reported that a substantial amount of the between-subject loss of
muscle strength following prolonged disuse is attributable to
impairments in voluntary (i.e., neural) activation (4, 5, 22).
Similarly, our work—along with that of others–-clearly indicates
that alterations in skeletal muscle form and function are also
key contributors to disuse-induced muscle weakness (4, 24-26, 28,
29). For instance, we have previously reported that four weeks of
lower limb muscle unweighting results in a reduction in in vivo
specific doublet force, alters the force-frequency relationship
(e.g., increases the twitch-to-doublet force ratio), and results
in a slowing in the rate of evoked for development (4). Findings
of this nature suggest that disuse alters the physiological
properties involved in the excitation-contraction coupling
process, but our overall understanding of these changes in human
skeletal muscle is particularly limited. Accordingly, the purpose
of this work was to examine the intramuscular mechanisms of
muscle weakness by quantifying changes in evoked muscle force-
time curves following four weeks of cast immobilization, and use
mathematical models to predict muscle force generation based on

the dynamics of calcium (Ca2+) described by a Riccati-Bass
differential equation. Understanding the specific mechanisms
underlying the loss of strength is critical as it could lead to
novel rehabilitation strategies specifically targeted to these
mechanisms.
METHODS
Study Participants. A total of 14 individuals (7 men, 7 women)
participated in this study. To be eligible for the study subjects
had to be between 18-40 years of age, and be apparently healthy
(i.e., free of neurological disorders, report no musculoskeletal
injuries or limitations in the non-dominant limb, no history of
blood or cardiovascular disorders, report no contraindications to
resistance exercise training, have a BMI < 32.0). Seven of these
subjects (20.3±0.8 yrs; 75.7±9.7 kg; 176.9±7.5 cm) were assigned
to undergo four weeks of wrist hand cast immobilization, and
seven were assigned to a control group that did not receive an
intervention (21.8±3.3 yrs; 73.0±15.1 kg, 168.7±8.5 cm). Subjects
were not randomly assigned per se, but were assigned based on
their schedule availability and willingness to undergo the
immobilization procedures. The Ohio University Institutional
Review Board approved the study protocol and all subjects
provided informed consent prior to participating.
Cast Immobilization Procedures. Subjects in the immobilization
group were fitted with a rigid wrist-hand cast on the non-
dominant forearm (Model 1101-1103, Orthomerica, Orlando,
Florida). The casts were made of lightweight polyethylene and
extended from just below the elbow all the way past the fingers.
This cast does not permit wrist flexion/extension movements nor
does it permit finger usage (e.g., because the cast extends well
beyond the fingers, holding a glass with the immobilized fingers
is not possible). Casts were removed 2–3 times/week under
supervision to wash the arm and inspect it for complications
(e.g., skin lesions, edema). We ensured compliance of the casting
protocol at all other times by securing athletic tape around the
cast and marking the exterior layers with a custom signature

stamp to allow us to tell if the subjects attempted to remove the
cast.
Voluntary and Evoked Contractile Properties. To quantify wrist flexion
forces subjects were seated with the elbow at 90°, the hand
pronated, and the forearm supported and restricted while the head
rested on a pad (Biodex System 4, Biodex Medical Systems,
Shirley, NY). The wrist joint’s axis of rotation was aligned with
the axis of rotation of a torque motor to which a lever arm was
attached. The signal was scaled to maximize its resolution (208.7
mV per N-M; Biodex Researchers Tool Kit Software) and sampled at
625 Hz (MP150, BioPac Systems).
To assess maximal wrist flexion strength, subjects performed
a minimum of three maximal voluntary isometric contractions (MVC)
with a 1–2-min rest period between each contraction. If subjects
continually recorded more force with increasing trials, or if the
two highest trials were not within 5% of each other, additional
trials were performed until a plateau was reached. Verbal
encouragement was provided during testing. The highest value was
considered the MVC.
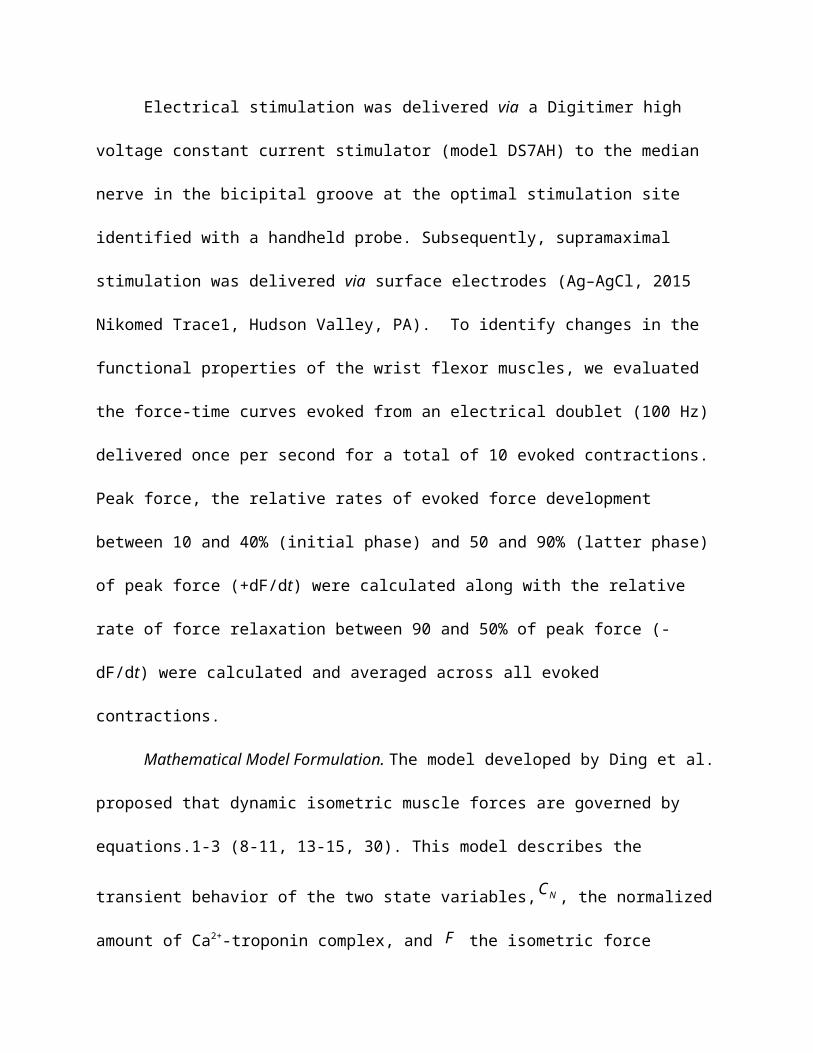
Electrical stimulation was delivered via a Digitimer high
voltage constant current stimulator (model DS7AH) to the median
nerve in the bicipital groove at the optimal stimulation site
identified with a handheld probe. Subsequently, supramaximal
stimulation was delivered via surface electrodes (Ag–AgCl, 2015
Nikomed Trace1, Hudson Valley, PA). To identify changes in the
functional properties of the wrist flexor muscles, we evaluated
the force-time curves evoked from an electrical doublet (100 Hz)
delivered once per second for a total of 10 evoked contractions.
Peak force, the relative rates of evoked force development
between 10 and 40% (initial phase) and 50 and 90% (latter phase)
of peak force (+dF/dt) were calculated along with the relative
rate of force relaxation between 90 and 50% of peak force (-
dF/dt) were calculated and averaged across all evoked
contractions.
Mathematical Model Formulation. The model developed by Ding et al.
proposed that dynamic isometric muscle forces are governed by
equations.1-3 (8-11, 13-15, 30). This model describes the
transient behavior of the two state variables, , the normalized
amount of Ca2+-troponin complex, and the isometric force
NC
F

produced by muscle stimulation. The state variable behaves as
a Michaelis-Menten process (27). The variables are governed by
the free parameters τc, A, , τ1, and τ2. The parameter τc is
the time constant that modulates CN. The parameter is the
sensitivity of voltage-gated channels to the change in Ca2+
current. The parameter τ1 is the time constant of the decline in
force due to the absence of strongly bound cross-bridges, and τ2
is the time constant of decline in force due to the extra
friction between actin and myosin resulting from the presence of
cross-bridges. The parameter A is the scaled gain.
22\* MERGEFORMAT ()
33\* MERGEFORMAT ()
44\* MERGEFORMAT ()
Equation 1 represents the time-varying change in developed
force as a function of the time-varying Ca2+-troponin binding
throughout a contraction. Equation 2 represents the global
summation of nonlinear activation of individual muscle fibers in
NC
mk
mk
1 2
()() ()()()()
N
Nm N
m N
C tdF t F tA C tdt k C tk C t
1( )
01 ( 1)i i
c
t t
iR R e
N N1
1
C () C ()1 exp( )n
iic c c
d t tt tRdt

response to an input train. Equation 3 represents the dynamics of
Ca2+-troponin binding, captured in the unitless variable and
modulated by the time constant τc, which qualitatively describes
the rate-limiting step before the actin and myosin mechanically
translate across each other and generate force (12).
To account for the nonlinear summation of Ca2+ transients in
single muscle bers stimulated with doublets, Ding et al fi
proposed the R-model in Eq. 2 (8), which was based on the earlier
work of Duchateau and Hainaut who investigated the force
summation from human adductor pollicis muscles triggered by
paired stimuli at different interpulse intervals (IPIs) ranging
from 5-ms to 200-ms (17). The results showed that the forces
generated by the doublet trains were greater than the sum of two
individual twitches. Furthermore, the force enhancement from the
second pulse was highest when the IPI was 5-ms and declined
exponentially with increases of the IPI. The enhanced force of
the paired stimuli was suggested to be due to the enhanced
release of divalent Ca2+ by the second pulse (9). Ding et al.
modi ed the two-step model by adding a factor wherefi is a
NC
iR

scaling term that accounts for the differences in the degree of
activation by each pulse relative to the rst pulse of the trainfi
(8). The magnitude of the enhancement is characterized by a
scalar , and its duration is characterized by . Furthermore,
Ding et al suggest that R0 may indeed be a function of km (8-11,
13-15, 30). Hence, to transform the parameter to make it
congruent with the physiological reality of equilibrating
chemical reactions that occur within a contracting muscle, we
extended the model by modeling km in Eq. 4 with a form of the
Riccati-Bass differential equation (1).
55\* MERGEFORMAT ()
The differential equation must be negative to model the change in
Ca2+-troponin binding from subsequent pulses in a stimulus train
as a decaying process. Further, the R0-km relationship is modeled
as a power law.
R0=akmb+c (5)
From this, a more accurate estimate of the initial may then
be used to calculate Ri and, ultimately, the rate-limiting state
variable CN during later stages of force generation at higher
0R c
0R

stimulate on frequencies and in response to special pulse forms
such as doublets. The numerical values of the model coefficients
were determined by parameter estimation (1, 18).
Model Validation and Data Analysis. Table 1 contains the parameter
sets for the Ding and Experimental muscle force models. For each
model, the subset of free parameters, as well as the subset of
fixed parameters with initial values, is given. Our model of
muscle force was validated using supramaximal doublet stimuli.
In addition, the model was shown to be robust using force data
from immobilized and non-immobilized muscles in different
subjects.
---INSERT TABLE 1 HERE---
We used the Levenburg-Marquardt unconstrained optimization
algorithm to estimate model parameters. Model agreement with the
data was calculated by minimizing the residual difference between
the force predicted from the model and the force measured from
test subjects. The Akaike Final Prediction Error (FPE) criterion
provides a measure of model quality by testing the model on
different parameter sets. After several different models are
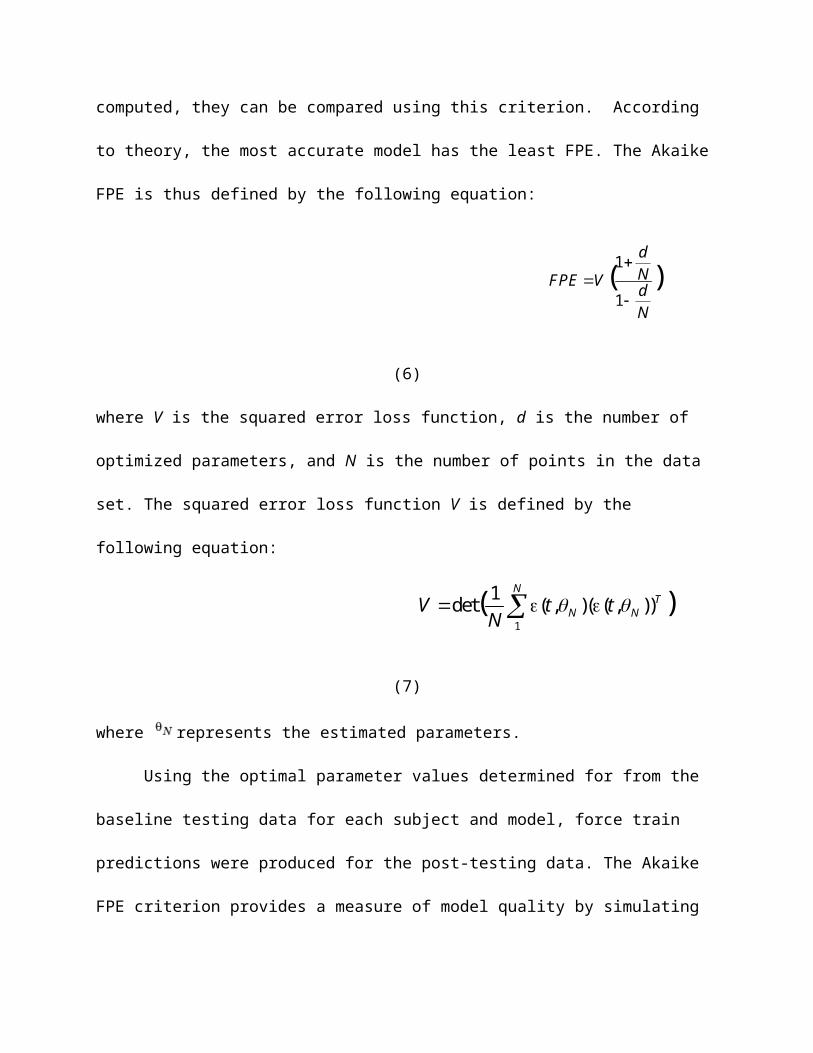
computed, they can be compared using this criterion. According
to theory, the most accurate model has the least FPE. The Akaike
FPE is thus defined by the following equation:
(6)
where V is the squared error loss function, d is the number of
optimized parameters, and N is the number of points in the data
set. The squared error loss function V is defined by the
following equation:
(7)
where represents the estimated parameters.
Using the optimal parameter values determined for from the
baseline testing data for each subject and model, force train
predictions were produced for the post-testing data. The Akaike
FPE criterion provides a measure of model quality by simulating
1
1( )
dNFPE V dN
1
1det (, )( (, ))( )NT
N NV t tN

the situation where the model is tested on different parameter
sets. After several different models were computed, they were
compared using this criterion. According to theory, the most
accurate model has the least FPE as agreement, not correlation,
between a model and experimental data is what is sought. Actual
numerical values of force are not important for this component of
the study per se, but rather the question to be answered is ‘How
well does a model agree with the experiment?’— which leads to the
question fundamental to this study: ‘Which model agrees best with
experiment?’ Accordingly, we used the Akaike FPE from the MATLAB
7.8 Optimization Toolbox (The Mathworks, Natick, MA) to evaluate
the fit of each optimization of each model relative to the
experiment for both test states. Therefore, the Akaike FPE was
determined for each candidate optimal parameter set against data
from the post-testing session for both groups. In all cases, the
optimal parameter set is the one that generates the least Akaike
FPE while returning the most realistic parameter values. We
validated our model of muscle force based on the evoked force
from a supramaximal 100-Hz doublet in both immobilized and non-
immobilized muscles obtained from preliminary data from the

experimental and control groups. Optimization of these ten free
parameters were subsequently used to calculate agreement between
the model and data. Specifically, to compare behavior between
groups over time, parameter values (τc=20, τ1=28.3, τ2=62.7,
µ1=0.38, µ2=0.5, a=0.5, b=2, c=0.5), were optimized for the
respective groups and the Akaike FPE was used to identify the
optimal parameter set for each experimental condition as well as
for the entire series of evoked contractions. Parametric trends
were ascertained from this analysis.
Statistical Analysis. Two-way mixed-model ANOVA tests were used to
compare differences between groups over time (between-subjects
factor: group; within-subjects factor: time). For all analyses a
two-tailed preset alpha-level of significance equal to 0.05 was
required for statistical significance, and Sidak post-hoc tests
were used to investigate significant main effects or
interactions. Eta-squared effect sizes (η2) are also reported to
provide an estimate of the magnitude of an effect. Data are
presented as mean±standard deviation. The SPSS statistical
package (v. 19.0 for Mac, Chicago, Illinois) was used for data
analysis.

Results
Voluntary muscle strength decreased 40% in the
immobilization group (26.0±5.9 to 15.5±9.3 Nm), but did not
change in the control group (21.3±12.3 to 21.2±12.4 Nm) (group x
time interaction p=0.02, η2=0.43). We observed a significant
group x time interaction term for the latter phase +dF/dt
(p=0.02, η2=0.41) indicating that the immobilization group

exhibited a slight slowing in the latter phase +dF/dt following
immobilization when compared to the slightly faster latter phase
+dF/dt observed in the control group at post-testing. We did not
observe significant interaction terms for evoked doublet peak
force (p=0.72, η2=0.01), or the initial +dF/dt (p=0.64, η2=0.02)
or –dF/dt (p=0.71, η2=0.01). Data on changes in the contractile
properties are provided in table 2.
We observed a significant group x time interaction term for
τc (Figure 1, p<0.01, η2=0.72) indicating that the immobilization
group exhibited a 25% increase in this time constant when
compared to no change in the control group at post-testing. We
did not observe significant interaction terms for the other
modeled parameters (τ1 p=0.70, η2=0.01; µ1 p=0.64, η2=0.02; µ2
p=0.30 , η2=0.10; a p=0.89, η2=0.00; Akaike FPE p=0.45, η2=0.05).
Data on these modeled parameters are provided in table 3.

Discussion
The purpose of this work was to examine the intramuscular
mechanisms of muscle weakness by quantifying changes in evoked
muscle force-time curves following four weeks of cast
immobilization, and use mathematical models to predict muscle
force generation based on the dynamics of Ca2+described by a
Riccati-Bass differential equation. To our knowledge, this
represents the first systematic evaluation of a model that
includes Ca2+ dynamics for predicting changes in electrically-
evoked force properties of human skeletal muscle following
immobilization. We observed that, by including a Riccati-Bass
diffusion function for km in our force model (1), the structure
of our model accurately predicts changes in the Ca2+-troponin
reaction rates (τc) following cast immobilization. Additionally,
we observed a slowing in the latter part of the relative rate of
force development. Below we discuss these findings in further
detail.
Our findings indicate that while four weeks of cast

immobilization results in a dramatic reduction in voluntary
muscle strength, the maximal doublet force generating capacity of
the muscular itself is relatively resistant to adaptation as we
did not observe any change in the peak doublet evoked force.
Additionally, we did not observe any changes in the initial phase
of evoked force development, the rate of relaxation, or the
majority of the modeled parameters. Likely similar to previous
modeling work in chronically paralyzed human soleus, the lack of
difference in the modeled parameters between the test states may
be because the stimulation frequency is less than 5 pulses per
second (7). Our observation of the wrist flexor muscles being
relatively resistant to immobilization-induced adaptations is
reasonably consistent with that reported by Fuglevand and
colleagues for the intrinsic hand musculature as well as Yue and
colleagues for the elbow flexor muscles (19, 31). In both of
these prior experiments, it was reported that 3-5 weeks of cast
immobilization slightly increased evoked twitch force without
altering the twitch contraction time. Similarly, our findings are
congruent with our previous report on changes in the evoked
contractile properties of the wrist flexor muscles following

three weeks of cast immobilization (2). In our prior work, we
noted no changes in evoked doublet force or the rate of force
relaxation, but we did observe a slowing in the rate of evoked
force relaxation when averaged across the entire force
development time interval. Accordingly, the collective findings
from the present study suggest that healthy human wrist flexion
musculature is generally resistant to functional adaptation of
the contractile properties when its use has been reduced for four
weeks by immobilization. However, it should be noted that we
observed a dramatic decrease in voluntary muscle strength, which
suggests that negative adaptations are occurring in the
neuromuscular force production pathway that contribute to the
development of muscle weakness. Based on our prior work, we
speculate that a large proportion of the weakness is associated
with impairments in voluntary, neural activation of the
musculature (2-6). However, it should be noted that we did not
obtain evoked tetanic forces, and immobilization has been shown
to dramatically reduce tetanic force (16). This suggests that
prolonged high-frequency activation of muscle may be more
impaired in comparison to evoked twitch or doublet responses.

The finding of an altered τc following immobilization is
interesting. This parameter was a fixed parameter in the pre-test
data, and was estimated from the post-test data to optimize the
model according to the model/error trade-off that the Akaike FPE
demands. This increase in τc likely explains our observed slowing
of the rate of evoked force development during the latter phase
of contraction. Specifically, a larger τc is considered to
indicate an increase in the binding and dissociation times as
well as sarcoplasmic aggregate of the Ca2+-troponin complex (9,
11, 14). In turn, increased binding and dissociation times may
explain the mechanism of a slowing in the rate of force
development. Our modeling findings suggesting a longer binding
and disassociation time of the Ca2+-troponin complex could
explain the recently reported reduction in Ca2+ sensitivity in
single skeletal muscle fibers following two weeks of cast-
immobilization (21). Below, to facilitate a more complete
understanding of our findings, we discuss in further details the
development and conceptual basis of our force model.
The Force Model. The force model was developed by decomposing
the contractile response into distinct physiological steps: Ca2+

release and reabsorption by the sarcoplasmic reticulum (SR), Ca2+
binding and unbinding to troponin, and force mechanics including
cross-bridge cycling along with the friction and elasticity of
the muscle fibers (10, 30). Although the binding process is
usually considered to be a two-step reaction, Wexler et al. only
considered its overall effect of the forward and backward
reaction rates (30). From basic chemical kinetics and membrane
transport, the two differential equations that describe the
calcium transient in the sarcoplasm and the Ca2+-troponin binding
processes are in the muscle. In the first chemical equation, the
first two terms represent the dissociation of Ca2+-troponin
complex (Ta) and binding of Ca2+ to troponin, respectively. The
third term is the rate of concentration increase due to diffusion
from the SR and the fourth term corresponds to diffusion and
reabsorption of Ca2+ back into the SR. In the second equation,
the first term represents the binding of Ca2+ to troponin and the
second term represents the dissociation of the Ca2+-troponin
complex. Finally, formation of Ta causes a conformational change
of actin and consequently results in the exposure of the cross-
bridge binding sites on actin. Then cross-bridges attach to actin

and pull the thin filaments toward the center of the thick
filaments. The macroscopic result of this process is the
generation of force, which is modeled by a linear spring, a
damper, and a motor in series. The damper represents the viscous
resistance of the contractile and connective tissue. The force
exerted by the damper is given by F=b(V-dx/dt), where b is the
damping coefficient, x is the length of the spring, and V is the
contractile velocity of the motor (30). For simplicity, a linear
spring was considered to represent the tendinous portion and the
series elastic component of the muscle (30). The force exerted by
the spring is given by F=Kx, where K is the spring constant.
Differentiating Hooke’s law with respect to time and the
subsequent algebra gives dF/dt=KB[Ta](1-F/Fm)-F/b/K. The term b/K
represents the time constant over which the force decays. The
model assumes that the friction between actin and myosin fibers
is higher during cross-bridge recycling due to chemical bonds
between the fibers so the term b/K=τ1+τ2[Ta]/[T0], where τ1 is the
value of the time constant in the absence of cross-bridges and is
the additional frictional component due to the actin-myosin bonds
(30). Making additional substitutions for KB and b/K gives

dF/dt=[Ta](1-F/Fm)-F/(τ1+τ2[Ta]/[T0]).
Ding and colleagues decomposed the contractile response to
account for the distinct physiological step of cross-bridge
activation (8). To model cross-bridge activation, it was shown
that the force-prediction ability of the model is relatively
insensitive to the specific curvature and amplitude of the
calcium and calcium-troponin complex transient. This implied that
the first two steps in the earlier model (30) could be combined
into one by the unitless factor, CN. From the following
differential equation, the dynamics of CN are modulated by the
time constant, τc, which describes qualitative the rate-limiting
step before the actin and myosin mechanically translate across
each other and generate force (8). Our force model structure is
the first to incorporate Riccati-Bass diffusion functions to
characterize the calcium channel voltage sensitivity in force
summation from individual muscle fibers (1). These functions are
used for making predictions of the continuation of ongoing
diffusion processes. In this study, the problem is one of
parameter estimation for specific diffusion function coefficients

at the beginning of actual physiologic processes and then making
predictions about the future behavior of the processes by
optimizing the estimated functions at different points in time
(20). Furthermore, the two influences on the calcium diffusion
process are distinguished as probability of activation and
probability of inactivation (18). These phenomena are reflected
by µ1 and µ2 in our model.
The R0–km relationship has the following physiological
rationale. Repetitive stimulation of muscles elicits
contractions that summate nonlinearly, especially when tension
saturates at the high-frequency tetanic level (23). The force-
frequency curve under isometric conditions is generally sigmoidal
(7). This indicates an additional nonlinearity at low
frequencies. It has also been found that the force from two
closely spaced stimuli could be significantly larger and more
prolonged compared to a twitch (27). At low frequencies that
generate twitches without fusion, staircase phenomena in both
mathematical directions have been observed (23). This implies a
facilitation or depression of the force profiles from successive
inputs, as well as post-tetanic potentiation of twitches (23).

Since a larger τc indicates an increase in the binding and
dissociation times as well as sarcoplasmic aggregate of the Ca2+-
troponin complex (9, 11, 14), this implies that muscle disuse
that results from immobilization may disrupt the processes of
facilitation or post-tetanic potentiation that occurs when
additional pulses are applied. Upon immobilization of a muscle,
disrupted facilitation and post-tetanic potentiation may slow
rates of force development. Indeed, such a disruption in the
contractile process may underlie decreased probabilities of
calcium channel activation as well as inactivation in single
immobilized skeletal muscle fibers, and it would be interesting
for future work to investigate these potential changes as a
function of muscle stimulation frequency in the range of 1 to 10
pulses per second.
Limitations of the Present Work and Conclusions. There are several
limitations of this study, which should be noted. First, the
population studied was a relatively small number of young,
healthy individuals, and the data is only from one muscle group
(wrist flexors). Accordingly, care should be taken to not
extrapolate these findings to other cohorts (e.g., the

interactive effects of immobilization with age could differ),
other disuse and/or muscle wasting conditions (e.g., post-
surgery, cancer cachexia, microgravity, etc.), and other muscle
groups. Additionally, our data are based on a series of ten
evoked doublets; hence, to ascertain more generalizable dynamics
of immobilized muscle, the modified Ding model needs to be
investigated using stimulated forces evoked with higher
frequencies. Lastly, another limitation of this study is that
there is no demonstrable modeling of the transition between pre-
immobilized and post-immobilized states within a muscle. In the
present study, muscle behavior has been inferred solely from
differences in parameter sets that generated the least Akaike
Final Prediction Error, which assumes that pre-immobilization and
post-immobilization are distinct physiological states. It would
likely be more realistic to model muscle behavior along the time
course of immobilization in order to understand the changes in
the contractile processes as a function of time.
In conclusion, we quantified changes in evoked muscle force-
time curves of the wrist-flexor muscles following 4-weeks of cast

immobilization, and used mathematical models to predict muscle
force generation based on the dynamics of Ca2+described by a
Riccati-Bass differential equation. The majority of the evoked
and modeled contractile properties were unchanged following
immobilization (e.g., peak doublet force, rate of evoked force
relaxation), although voluntary muscle strength was dramatically
reduced. The most notable findings were an immobilization-induced
slowing in the relative rate of evoked force development during
the latter part of the evoked phase of contraction and a 25%
longer time constant τc, which qualitatively describes the rate-
limiting step before the actin and myosin mechanically translate
across each other and generate force. The collective findings
from the present study suggest that healthy human wrist flexion
musculature is generally resistant to functional adaptation of
the contractile properties when its use has been reduced after
four weeks of immobilization. The observed loss of voluntary
muscle strength clearly indicates that negative adaptations are
occurring in the neuromuscular force production pathway that
contributes to the development of muscle weakness, and it is
likely that this is due to impairments in voluntary, neural

activation of the musculature as well as maladaptations in
excitation-contraction coupling processes involved in high-
frequency activation of muscle, with our findings of a slowing in
the latter phases of muscle force development that we hypothesize
was due to a prolonged time of action in the calcium-troponin
mechanism being one likely contributor. Future work is needed to
better delineate the neural and muscular mechanisms of muscle
weakness associated with models of disuse as well as weakness
associated with disease states so that targeted effective
interventions to promote muscle function can be developed.
-
ACKNOWLEDGEMENT

The extensive MATLAB programming work of Mr. Robert Conatser
is heartily acknowledged. His retooling of the code made it
easier for MJC to complete this project.
GRANTS
The project described was supported by Award Number
R15HD065552 from the Eunice Kennedy Shriver National Institute of
Child Health & Human Development. The content is solely the
responsibility of the authors and does not necessarily represent
the official views of the Eunice Kennedy Shriver National Institute of
Child Health & Human Development or the National Institutes of
Health.
DISCLOSURES
B.C. Clark has received consulting fees from Regeneron
Pharmaceuticals, Inc. and Abbott Laboratories. No other conflicts
were reported.

Figure 1. A 25% longer time constant for τc was observed following immobilization, which qualitatively describes the rate-limiting step before the actin and myosin mechanically translate across each other and generate force. *Group x Time Interaction p<0.01; Eta2 Effect Size=0.72.
*

Table 1. Initial values of parameter sets for force models. Free parameters were estimated for the post-testing data by Levenburg-Marquardt unconstrained optimization.
Model Fixed Parameterswith Initial Values
Free Parameters
Ding τc=20.0 msR0=6.9
A, km, τ1, τ2
Experimental
τc=20.0 ms km, τ1, τ2, µ1, µ2, a, b, c
A is scaled
Table 2. Changes in contractile properties before and after 4-weeks of cast immobilization (immobilization group) or

before and after a 4-week period with no interventions (control group).
Peak Force(Nm)
InitialPhase+dF/dt
(%/msec)
LatterPhase+dF/dt
(%/msec)
-dF/dt(%/msec)
Pre Post Pre Post Pre Post Pre Post
ImmobilizationGroup
2.322
±0.881
2.516
±0.869
0.193
±0.028
0.190
±0.029
0.146
±0.014
0.138*±0.013
-0.143
±0.044
-0.131
±0.032
Control Group
2.243
±0.536
2.619
±1.425
0.205
±0.033
0.187
±0.059
0.137
±0.009
0.155
±0.017
-0.132
±0.039
-0.108
±0.048
Initial Phase +dF/dt: Relative rate of evoked force development between 10-40% of peak doublet force. Latter Phase +dF/dt: Relative rate of evoked force development between 50-90% of peak doublet force. -dF/dt: Relative rate of evoked force relaxation between 90-50% of peak doublet force. *Group x Time Interaction p=0.02, Eta2 Effect Size=0.41.
Table 3. No changes were observed for the majority of muscle force model parameters before and after 4-weeks of cast immobilization (immobilization group) or before and after a 4-week period with no interventions (control group). The one notable significant effect is illustrated in Figure 1.
τ1 µ1 µ2 a Akaike FPEPre Post Pre Post Pre Post Pre Post Pre Post
Immobilization Group
34.2±9.7
41.9±18.1
0.39±0.02
0.39±0.02
0.50±0.00
0.50±0.00
28.6±25.2
27.9±25.9
0.014
±0.02
0.021
±0.01
ControlGroup
36.4±16.7
41.6±14.6
0.38±0.12
0.36±0.12
0.49±0.00
0.49±0.02
31.0±21.6
33.5±18.1
0.010
±0.01
0.012
±0.12

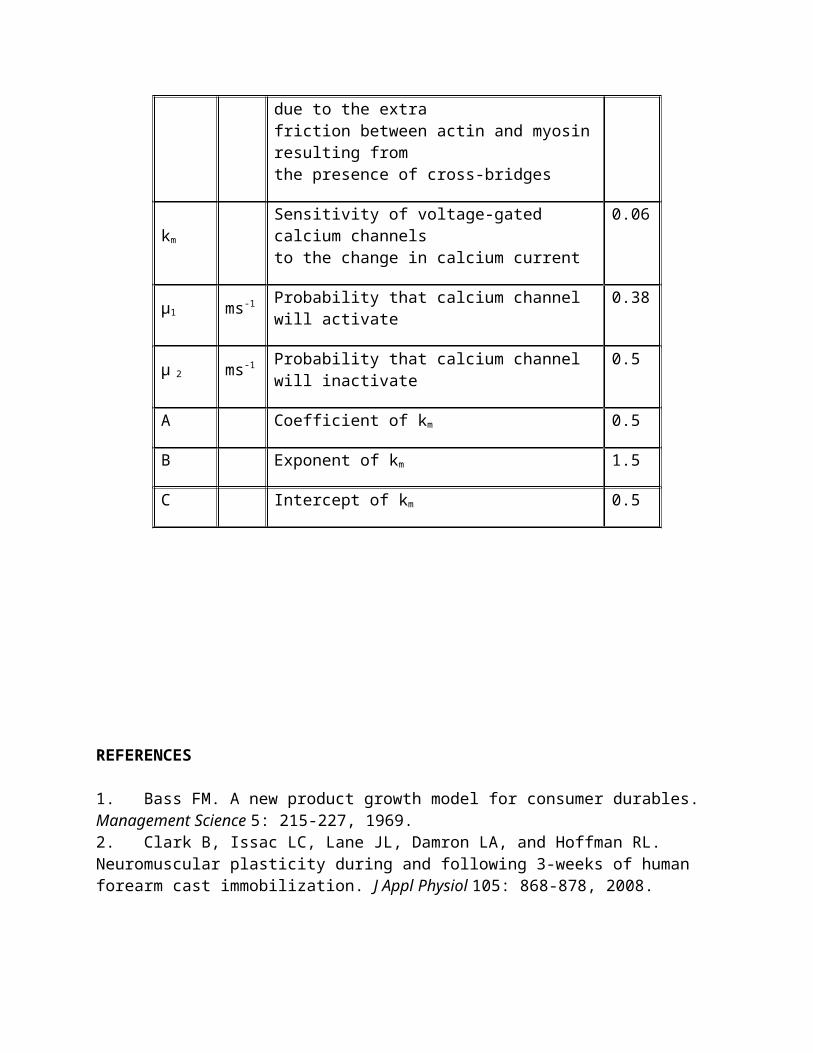
APPENDIX: List of parameters for muscle force model.
Symbol
Unit Definition Valu
e
CNNormalized amount of Ca2+-troponincomplex
Varies
F N Mechanical force Varies
ti ms Time of the ith stimulation Varies
N Total number of stimuli in the train before time t
Varies
tp ms Time of the pth data point Varies
tq ms Time of the qth set of force model parameter set
Varies
τc ms Time constant controlling the rise and decay of CN
20
A N/ms Scaling factor Vari
es
τ1 msTime constant of force decline atthe absence ofstrongly bound cross-bridges
28.3
τ2 ms Time constant of force decline 62.7
due to the extrafriction between actin and myosinresulting fromthe presence of cross-bridges
km
Sensitivity of voltage-gated calcium channelsto the change in calcium current
0.06
µ1 ms-1 Probability that calcium channel will activate
0.38
µ 2 ms-1 Probability that calcium channel will inactivate
0.5
A Coefficient of km 0.5
B Exponent of km 1.5
C Intercept of km 0.5
REFERENCES
1. Bass FM. A new product growth model for consumer durables. Management Science 5: 215-227, 1969.2. Clark B, Issac LC, Lane JL, Damron LA, and Hoffman RL. Neuromuscular plasticity during and following 3-weeks of human forearm cast immobilization. J Appl Physiol 105: 868-878, 2008.

3. Clark BC. In Vivo Alterations in Skeletal Muscle Form and Function after Disuse Atrophy. Medicine and science in sports and exercise 2009.4. Clark BC, Fernhall B, and Ploutz-Snyder LL. Adaptations in human neuromuscular function following prolonged unweighting: I. Skeletal muscle contractile properties and applied ischemia efficacy. J Appl Physiol 101: 256-263, 2006.5. Clark BC, Manini TM, Bolanowski SJ, and Ploutz-Snyder LL. Adaptations in human neuromuscular function following prolonged unweighting: II. Neurological properties and motor imagery efficacy. J Appl Physiol 101: 264-272, 2006.6. Clark BC, Taylor JL, Hoffman RL, Dearth DJ, and Thomas JS. Cast immobilization increases long-interval intracortical inhibition. Muscle & nerve 42: 363-372, 2010.7. Conaway MJ. Calcium dynamics in paralyzed soleus. Berlin: VDM Springer, 2010.8. Ding J, Binder-Macleod SA, and Wexler AS. Two-step, predictive, isometric force model tested on data from human and rat muscles. Journal of applied physiology 85: 2176-2189, 1998.9. Ding J, Lee SC, Johnston TE, Wexler AS, Scott WB, and Binder-Macleod SA. Mathematical model that predicts isometric muscle forces for individuals with spinal cord injuries. Muscle & nerve 31: 702-712, 2005.10. Ding J, Wexler AS, and Binder-Macleod SA. Development of a mathematical model that predicts optimal muscle activation patterns by using brief trains. . J Appl Physiol 88: 917-925, 2000.11. Ding J, Wexler AS, and Binder-Macleod SA. A mathematical model that predicts the force-frequency relationship of human skeletal muscle. Muscle & nerve 26: 477-485, 2002.12. Ding J, Wexler AS, and Binder-Macleod SA. Mathematical models for fatigue minimization during functional electrical stimulation. Journal of electromyography and kinesiology : official journal of the International Society of Electrophysiological Kinesiology 13: 575-588, 2003.13. Ding J, Wexler AS, and Binder-Macleod SA. A predictive fatigue model--I: Predicting the effect of stimulation frequency and pattern on fatigue. IEEE transactions on neural systems and rehabilitation engineering : a publication of the IEEE Engineering in Medicine and Biology Society 10:48-58, 2002.

14. Ding J, Wexler AS, and Binder-Macleod SA. A predictive fatigue model--II: Predicting the effect of resting times on fatigue. IEEE transactions on neural systems and rehabilitation engineering : a publication of the IEEE Engineering in Medicine and Biology Society 10: 59-67, 2002.15. Ding J, Wexler AS, and Binder-Macleod SA. A predictive modelof fatigue in human skeletal muscles. J Appl Physiol 89: 1322-1332, 2000.16. Duchateau J, and Hainaut K. Electrical and mechanical changes in immobilized human muscle. J Appl Physiol 62: 2168-2173, 1987.17. Duchateau J, and Hainaut K. Nonlinear summation of contractions in striated muscle. I. Twitch potentiation in human muscle. Journal of muscle research and cell motility 7: 11-17, 1986.18. Frey Law LA, and Shields RK. Predicting human chronically paralyzed muscle force: a comparison of three mathematical models. J Appl Physiol 100: 1027-1036, 2006.19. Fuglevand AJ, Bilodeau M, and Enoka RM. Short-term immobilization has a minimal effect on the strength and fatigability of a human hand muscle. J Appl Physiol 78: 847-855, 1995.20. Hernes G. Diffusion and growth of the non-homogenous case. Scan J Econ 78: 427-434, 1976.21. Hvid LG, Ortenblad N, Aagaard P, Kjaer M, and Suetta C. Effects of ageing on single muscle fibre contractile function following short-term immobilisation. The Journal of physiology 589: 4745-4757, 2011.22. Kawakami Y, Akima H, Kubo K, Muraoka Y, Hasegawa H, Kouzaki M, Imai M, Suzuki Y, Gunji A, Kanehisa H, and Fukunaga T. Changesin muscle size, architecture, and neural activation after 20 daysof bed rest with and without resistance exercise. Eur J Appl Physiol 84: 7-12, 2001.23. Parmiggiani F, and Stein RB. Nonlinear summation of contractions in cat muscles. II. Later facilitation and stiffnesschanges. The Journal of general physiology 78: 295-311, 1981.24. Pathare NC, Stevens JE, Walter GA, Shah P, Jayaraman A, Tillman SM, Scarborough MT, Parker Gibbs C, and Vandenborne K. Deficit in human muscle strength with cast immobilization:

contribution of inorganic phosphate. Eur J Appl Physiol 98: 71-78, 2006.25. Riley DA, Bain JL, Thompson JL, Fitts RH, Widrick JJ, TrappeSW, Trappe TA, and Costill DL. Decreased thin filament density and length in human atrophic soleus muscle fibers after spaceflight. Journal of applied physiology 88: 567-572, 2000.26. Salanova M, Schiffl G, Rittweger J, Felsenberg D, and Blottner D. Ryanodine receptor type-1 (RyR1) expression and protein S-nitrosylation pattern in human soleus myofibres following bed rest and exercise countermeasure. Histochemistry and cell biology 130: 105-118, 2008.27. Stein RB, and Parmiggiani F. Nonlinear summation of contractions in cat muscles. I. Early depression. The Journal of general physiology 78: 277-293, 1981.28. Takekura H, Kasuga N, Kitada K, and Yoshioka T. Morphological changes in the triads and sarcoplasmic reticulum ofrat slow and fast muscle fibres following denervation and immobilization. Journal of muscle research and cell motility 17: 391-400, 1996.29. Trappe S, Creer A, Minchev K, Slivka D, Louis E, Luden N, and Trappe T. Human soleus single muscle fiber function with exercise or nutrition countermeasures during 60 days of bed rest.American journal of physiology Regulatory, integrative and comparative physiology 294: R939-947, 2008.30. Wexler AS, Ding J, and Binder-Macleod SA. A mathematical model that predicts skeletal muscle force. IEEE transactions on bio-medical engineering 44: 337-348, 1997.31. Yue GH, Bilodeau M, Hardy PA, and Enoka RM. Task-dependent effect of limb immobilization on the fatigability of the elbow flexor muscles in humans. Experimental physiology 82: 567-592, 1997.