I僧i 嗌 {芍墒闵荷 荷芃蓗x缮 B射E +缮艬蒃戒 - BPRD
165
-
Upload
khangminh22 -
Category
Documents
-
view
0 -
download
0
Transcript of I僧i 嗌 {芍墒闵荷 荷芃蓗x缮 B射E +缮艬蒃戒 - BPRD

£ÉÉ®iÉ àÉå {ÉÖÉÊãÉºÉ ºÉÆMÉ~xÉÉå BÉäE +ÉÉÆBÉE½ä
1 VÉxÉ´É®ÉÒ, 2013 iÉBÉE
Data on PoliceOrganisations in India
As on January 1, 2013
{ÉÖÉÊãÉºÉ +ÉxÉÖºÉÆvÉÉxÉ A´ÉÆ ÉÊ´ÉBÉEÉºÉ ¤ªÉÚ®ÉäxÉ<Ç ÉÊnããÉÉÒ
Bureau of Police research & DeveloPment
new Delhi

Note for readersThis booklet contain informations from data received from various Police Forces. However, user is cautioned to exercise his discreation, judgement and verification about facts & figures.
© 2013 BPR&D, New Delhi
Published by: Harihar Prasad Pathak, Statistical Investigator Grade-I on behalf of BPR&D, Block No. 11, 3rd & 4th Floor, CGO Complex, Lodhi Road, New Delhi-110003 & printed at Chandu Press, D-97, Shakarpur, Delhi-110092
ISBN 978-93-81798-01-0


OFFICERS & OFFICIAL ASSOCIATED WITH THE PUBLICATION
Guidance
Shri Rajan Gupta, IPS Director General
Supervision
Shri Radhakrishna Kini A, IPS Addl. Director General
Editorial Board
Smt. Nirmal Kaur, IPS IG/Director
Shri Sunil Kapur DIG/Dy. Director
Shri Harihar Prasad Pathak Statistical Investigator Grade-I
Professional and Technical Personnel
Dr. Rita Tiwari Statistical Assistant
Shri Harjeet Singh Personal Assistant (PA)
Shri Sumit Kumar Tomar Data Entry Operator

i
CONTENTS
Data on Police Organizations in India
Table No. Description Page No.
Basic Police Data 1
1.1 Basic Police Data (State/UT-wise). 5
1.2 Area and Projected Population (State/UT-wise). 12
1.3 Population per Policeman / Comparative Area of Responsibility / Transport Facility Per 100 Policemen.
13
Police Administrative Offices 19
2.1 Number of Police Zones, Ranges, Districts, Sub-Divisions, Circles and Police Stations.
21
2.2 Number of Sanctioned & Actual Police Stations (Rural and Urban).
22
2.3 Number of Sanctioned & Actual Police Posts (Rural and Urban).
23
2.4 Number of Special Purpose Police Stations. 25
2.5 Number of Armed Police Battalions. 26
2.6 Women Police Stations and their Locations. 27
2.7 Cities with Police Commissioner System. 34
Police Strength and Ratio 35
3.1 Sanctioned and Actual Strength of Total Police Force. 38
3.2 Police - Population and Area Ratio (Sanctioned & Actual). 39
3.3 Sanctioned and Actual Strength of Civil Police including District Armed Reserve Police.
41
3.4 Officers to Constabulary Ratio of Sanctioned and Actual Strength of Civil Police including District Armed Reserve Police.
44
3.5 Sanctioned and Actual Strength of State Armed Police. 45
3.6 Sanctioned and Actual Strength of Total Police Force (Civil + Armed Police).
49

ii
CONTENTS
3.7 Actual Strength of Women Police (Rank-wise). 53
3.8 Actual Strength of Traffic Police (Rank-wise). 54
3.9 Sanctioned and Actual Strength of Special Branch dealing with 55
3.10 Sanctioned and Actual Strength of CID of Crime Branch dealing with Investigation of Crime.
59
3.11 Sanctioned and Actual Strength of Special Task Force to deal with insurgents/extremists/terrorists/organized criminal gangs.
63
3.12 Sanctioned Strength of Civil Police in Metro Cities with Police Commissioner System/Cities where population is more than 10 lakhs (One Million) (Rank-wise).
67
3.13 Sanctioned Strength of Armed Police in Metro Cities with Police Commissioner System/Cities where population is more than 10 lakhs (One Million) (Rank-wise).
68
3.14 Officers to Constabulary Ratio of Civil Police in Metro Cities with Police Commissioner System/Cities where population is more than 10 lakhs (One Million).
69
3.15 Sanctioned & Actual Strength of Central Armed Police Forces (CAPFs) as on 1.1.2013 (Rank-wise).
70
3.16 Actual Strength of Women Police in Central Armed Police Forces (CAPFs) as on 1.1.2013 (Rank-wise).
75
Representation of Scheduled Castes (SCs), Scheduled Tribes (STs) and Other Backward Classes (OBCs) in Police Force
76
4.1 Representation of Scheduled Castes (SCs) vis-à-vis %age of Reservation for SCs Approved by the Government in the Police Force.
78
4.2 Representation of Scheduled Tribes (STs) vis-à-vis %age of Reservation for STs Approved by the Government in the Police Force.
79
4.3 Representation of Other Backward Classes (OBCs) vis-à-vis %age of Reservation for OBCs Approved by the Government in the Police Force.
80
Police Budget 81
5.1 Total Budget for State, Police Expenditure and Expenditure on Police Training for the Financial Year 2012-13.
85
5.2 Expenditure of Central Armed Police Forces from 2004-05 to 2012-13. 86

iii
CONTENTS
5.3 Increase/Decrease in Total Police Expenditure and Training Expenditure as compared to the Previous Year and percentage thereof.
87
5.4 Amount of Modernization Grant made available to the Police in Financial Year 2012-13 by the Central & State Governments and total amount utilized thereof.
88
5.5 Increase/Decrease in Police Housing Expenditure in 2012-13 as compared to 2011-12 & percentage Level of Satisfaction of Family Accommodation.
89
Police Housing 90
6.1 Family Quarters Available for Gazetted Officers (GOs), Inspectors to Assistant Sub-Inspector(ASI), Head Constables and Constables as on 1.1.2013 and Family Quarters Constructed during the year 2012.
92
6.2 Police Housing Corporations. 93
6.3 Police Office Buildings operated from Government or Hired Buildings. 94
Transport Facilities 96
7.1 Transport Facilities (Vehicles) Available with Police. 100
7.2 Transport Resources Per 100 Policemen as on 1.1.2013. 101
Police Recruitment and Training 102
8.1 Number of Police Personnel Recruited during 2011 & 2012. 104
8.2 Number of Newly Recruited Police Personnel Trained during 2012. 105
8.3 Number of Police Personnel given In-service Training during 2012. 106
8.4 Data position relating to IPS officers as on 1.1.2013. 107
Departmental Proceedings Against Policemen and Crime in India 108
9.1 Number of Departmental Proceedings Initiated and Disposed off against Police personnel during 2012.
111
9.2 Incidence & Rate of Total Cognizable Crimes - Indian Penal Code (IPC) during 2012.
112
9.3 Incidence & Rate of Total Cognizable Crimes – Special and Local Laws (SLL) in 2012.
115
9.4 Disposal of Cases under the Indian Penal Code (IPC) by Courts During 2012.
118
9.5 Disposal of Cases under Special and Local Laws (SLL) by Courts During 2012.
119
iv
CONTENTS
9.6 Number of Exhibits Awaiting Examination in the State and Regional Forensic Science Laboratories (RFSLs) as on 1.1.2013.
120
Agitations
10.1 Number of Agitations during 2012. 121
10.2 Number of Different Types of Agitations during 2012. 123
10.3 Number of Different Types of Agitations during 2011. 124
10.4 Details of Agitations during 2012 (State/UT-wise). 125
Other Informations of Interest 135
11.1 Police Medals for Gallantry awarded to police personnel of States/UTs/ Central Armed Police Forces during 2012.
138
11.2 Pay Scales from the rank of Constable to Deputy Superintendent of Police as on 1.1.2013(State/UT-wise).
139
11.3 Terrorists/Extremists affected Police Districts during 2012. 140
11.4 Number of Police Officers Transferred within less than one & two years in 2012.
141
11.5 Number of Mobile Forensic Science Vans held by the State Police Forces as on 1.1.2013.
142
11.6 Number of Computers available with the State Police Forces as on 1.1.2013.
143
11.7 Number of Firearms Looted / Stolen from the Police / Police Stations during 2012.
144
11.8 Number of Criminal Courts (State/UT-wise) 145

v
AT A GLANCE (As on 01.01.2013)
Chapter 1-Basic Police Data for the CountryArea (Sq. Kms.)• 31,66,414
Population (Ist October - 2012) in thousands• 12,17,327
Sanctioned Civil Police Force• 17,65,404
Sanctioned strength of State Armed Police Force• 4,43,623
Total State Police Force• 22,09,027
Population per Policemen• 551
Police Ratio per lakh (one hundred thousand) of population• 181.5
Police Ratio per hundred square kms. area• 69.8
Number of Police Stations• 14,360
Number of Police -Posts• 8,583
State Armed Police Battalions• 430+4 Coys
Chapter 2 - Police Administrative OfficeNumber of :
Police Zones• 100
Police Ranges• 178
Police Districts• 711
Police Sub-Divisions• 2,053
Police Circles• 2,447
Police Stations•
- Rural
- Urban
- Railway
Police-Posts •
14,360
9,347
4,513
500
8583
Cities with Police Commissionerates • 47

vi
AT A GLANCE (As on 01.01.2013)
Chapter 3 - State Police Strength and RatioRank-wise Sanctioned Strength of Total Police Force•
(Civil Police + Armed Police) 22,09,027 DGP-
Addl. DGP -
90292
IGP- 566DIG- 609AIGP/SSP/SP- 2793Addl. SP/Dy. Commandant- 2098ASP/Dy. SP- 11,741Inspector- 30,341Sub-Inspector (SI)- 1,22,693Assistant Sub-Inspector (ASI)- 1,21,282Head Constables- 3,88,968Constables- 15,27,554
Officers to Constabulary Ratio • - for Sanctioned Police Strength - for Women Police Strength - for Civil Police in Metro cities
1:5.81:9.01:4.7
Actual Strength of Women Police• 97,518Police Stations in Metro Cities• 1,623Civil Police in Metro Cities• 3,31,898Armed Police in Metro Cities• 64,723Strength of Some CAPFs (BSF, CRPF, CISF etc.)•- Gazetted Officers
- Non- Gazetted Officers
17,015
967,766
Chapter 4 -Representation of SCs/STs/OBCs in Police ForceNumber of Representation of :
l Scheduled Castes in Police 2,35,483
l Scheduled Tribes in the Police 1,88,377
l Other Backward Classes in the Police 3,74,303
l Percentage of Total Police Force
- Scheduled Castes
- Scheduled Tribes
- Other Backward Classes
10.66 %
8.53%
16.94 %
vii
AT A GLANCE (As on 01.01.2013)
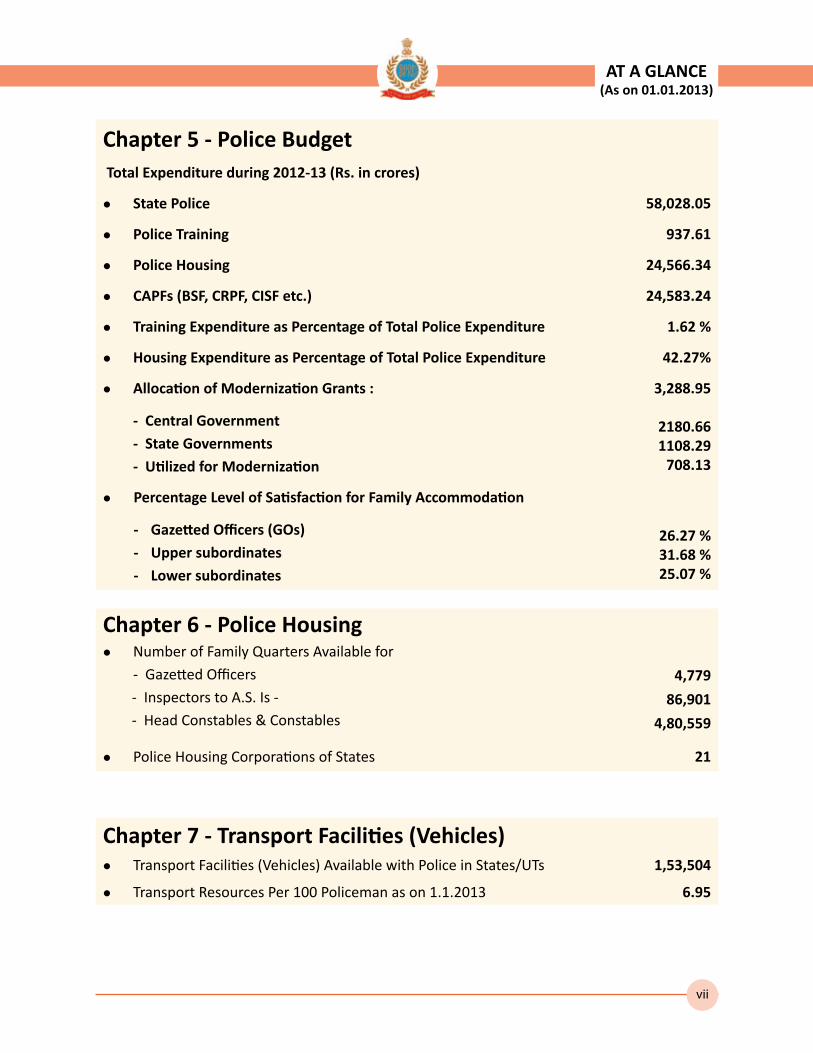
Chapter 5 - Police Budget Total Expenditure during 2012-13 (Rs. in crores)
l State Police 58,028.05
l Police Training 937.61
l Police Housing 24,566.34
l CAPFs (BSF, CRPF, CISF etc.) 24,583.24
l Training Expenditure as Percentage of Total Police Expenditure 1.62 %
l Housing Expenditure as Percentage of Total Police Expenditure 42.27%
l Allocation of Modernization Grants :
- Central Government
- State Governments
- Utilized for Modernization
3,288.95
2180.661108.29
708.13
l Percentage Level of Satisfaction for Family Accommodation
- Gazetted Officers (GOs)
- Upper subordinates
- Lower subordinates
26.27 %31.68 %25.07 %
Chapter 6 - Police Housingl Number of Family Quarters Available for
- Gazetted Officers
- Inspectors to A.S. Is -
- Head Constables & Constables
4,779
86,901
4,80,559
l Police Housing Corporations of States 21
Chapter 7 - Transport Facilities (Vehicles)l Transport Facilities (Vehicles) Available with Police in States/UTs 1,53,504
l Transport Resources Per 100 Policeman as on 1.1.2013 6.95
viii
AT A GLANCE (As on 01.01.2013)
Chapter 8 - Police Recruitment and Training
Number of :
Police Personnel Recruited in 2012• 72,234
Newly Recruited Police Personnel Trained in 2012• 1,13,116
Police Personnel Given In-service Training in 2012• 1,03,352
Chapter 9 - Departmental Proceedings Against Policemen & Crime In India
Number of Departmental Proceedings Initiated and disposed off in 2012• 49,006
Incidence & Rate of Total Cognizable Crimes (IPC) during 2012• - Incidence
- Rate of Crime (per one hundred Thousand of population)
23,87,188
196.7
Incidence & Rate of Total Cognizable Crimes under Special and Local •Laws (SLL) in 2012
- Incidence
- Rate of Crime (per one hundred Thousand of population)
36,54,371
301.2
Disposal of IPC Cases by Courts During 2012• - Disposed off
- Pending
- Conviction rate
12,52,138
78,88,408
38.5 %
Disposal of SLL Cases by Courts During 2012• - Disposed off
- Pending
- Conviction rate
29,21,119
52,80,087
88.6 %
Number of Exhibits awaiting Examination in the State and Regional FSLs •As on 1.1.2013
7,95,513
Chapter 10 - Agitations
Number of :Total agitations during 2012• 78,444
ix
AT A GLANCE (As on 01.01.2013)
Chapter 11 - Other Information of InterestGallantry Medals awarded •
- President Police Medal for Gallantry
- Police Medal for Gallantry
20
203
Police Districts affected by Terrorists/Extremists• 176
Mobile Forensic Science Vans• 420
= Computers available with Police 66,752
= Firearms Looted / Stolen from Police/Police Stations 753
= Total Strength of National Disaster Response Force 8,633
x
AT A GLANCE (As on 01.01.2013)

1
CHAPTER 1
BASIC POLICE DATA
State Wise Basic Police Data• Police–PopulationRatio• Police–AreaRatio(NumberofPolicemenper100Sq.Kms.)
• NumberofVehiclesper100Policemen
This chapter attempts to provide you with the collated data on basic police issues in the country, which you may not find through normal published sources. The information in this chapter is as on 01.01.2013 along with the analysis thereof for eleven years from 2002 to 2012 for alternate years. The data covers all the States and the Union Territories of the country.
The basic police data gives the information on Sanctioned Strength of Civil & Armed Police, Population per Policeman i.e. Police - Population Ratio, Area per Policeman, Number of Police Zones, Ranges, Districts, Circles, Police Stations, Police Posts and Number of Armed Police Battalions in the country.
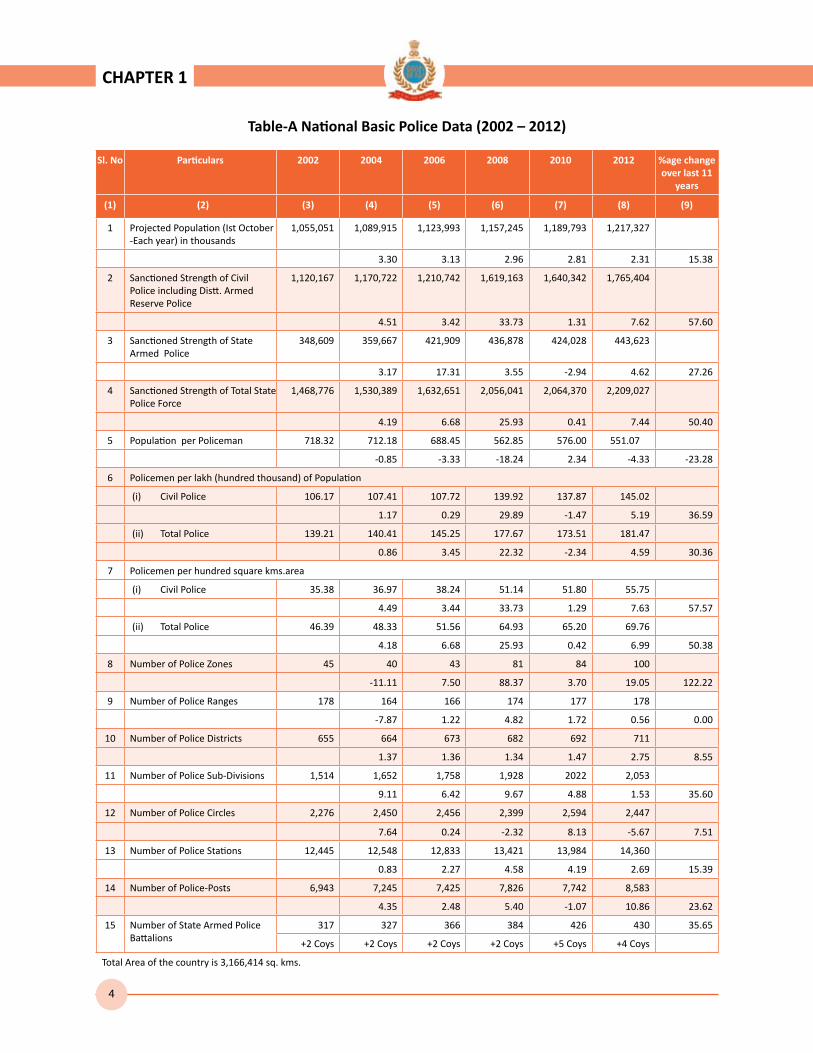
An analysis of national data on police for the period of last eleven years for alternate years is given in Table-A which gives percentage wise changes with reference to the preceding year and also with reference to eleven years period from 2002 to 2012. Thus the percentage change shall be for 2 years block.
Police-Population Ratio
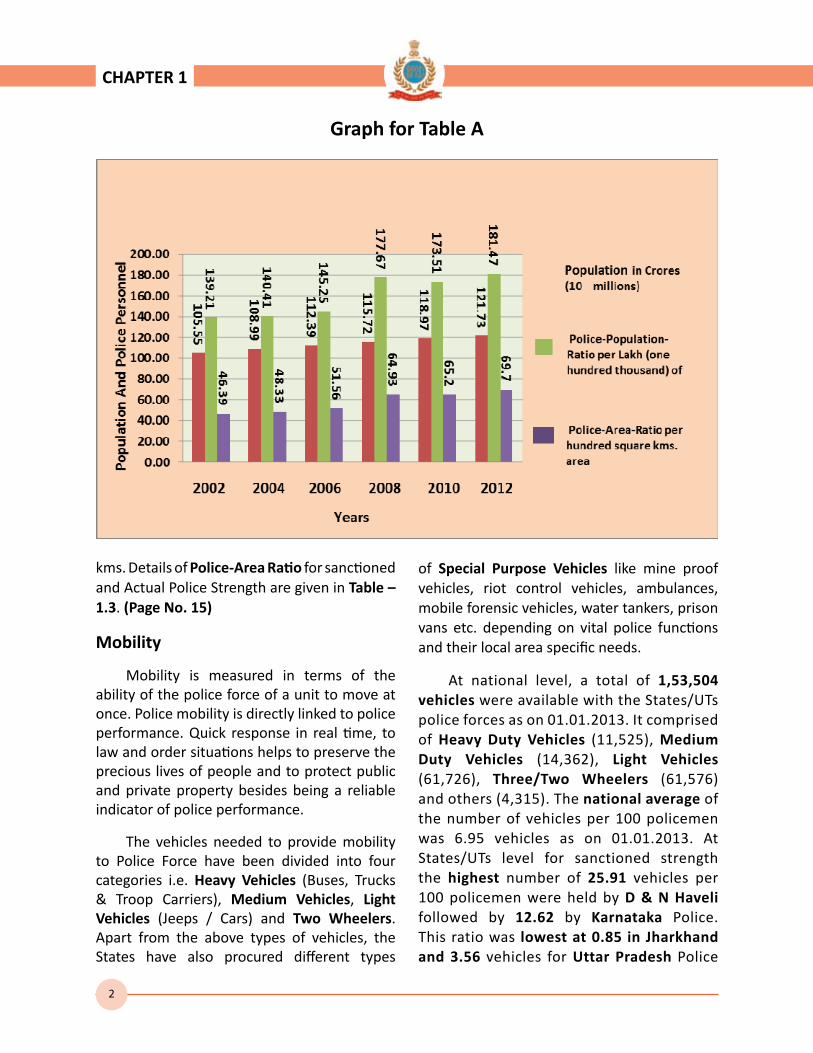
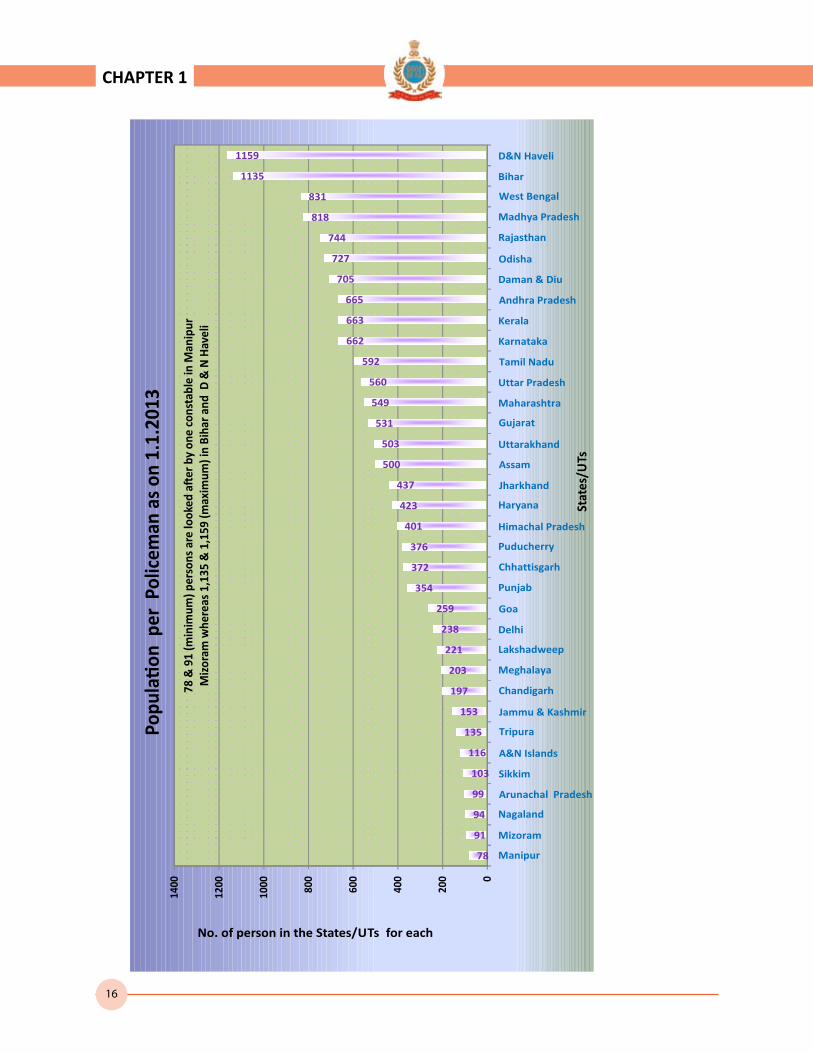
It shows that percentage wise growth in the sanctioned police strength in our country has shown increase of 50.40% whereas the growth in population was 15.38% during the last eleven years. As a result thereof, it is seen that 718 people were being looked after by one constable in the year 2002, which has
decreased to 551 people required to be looked after by one constable in the year 2012 despite many fold increase in challenges faced by police forces in the country and significant increase in the incidence of terrorism, communal violence, naxalism, security threats etc.
The actual availability of Policemen gets further reduced owing to vacancies running upto 24.82% as on 1.1.2013. During this eleven year period the State Armed Police Forces have shown an increase of 27.26% from 3.48 lakhs i.e (0.348 million) in the year 2002 to 4.62 lakhs i.e (0.462 million) in the year 2012. Details of Population per Policeman for the Sanctioned as well as the Actual Police Strength are shown in the Table – 1.3. (Page No. 15)
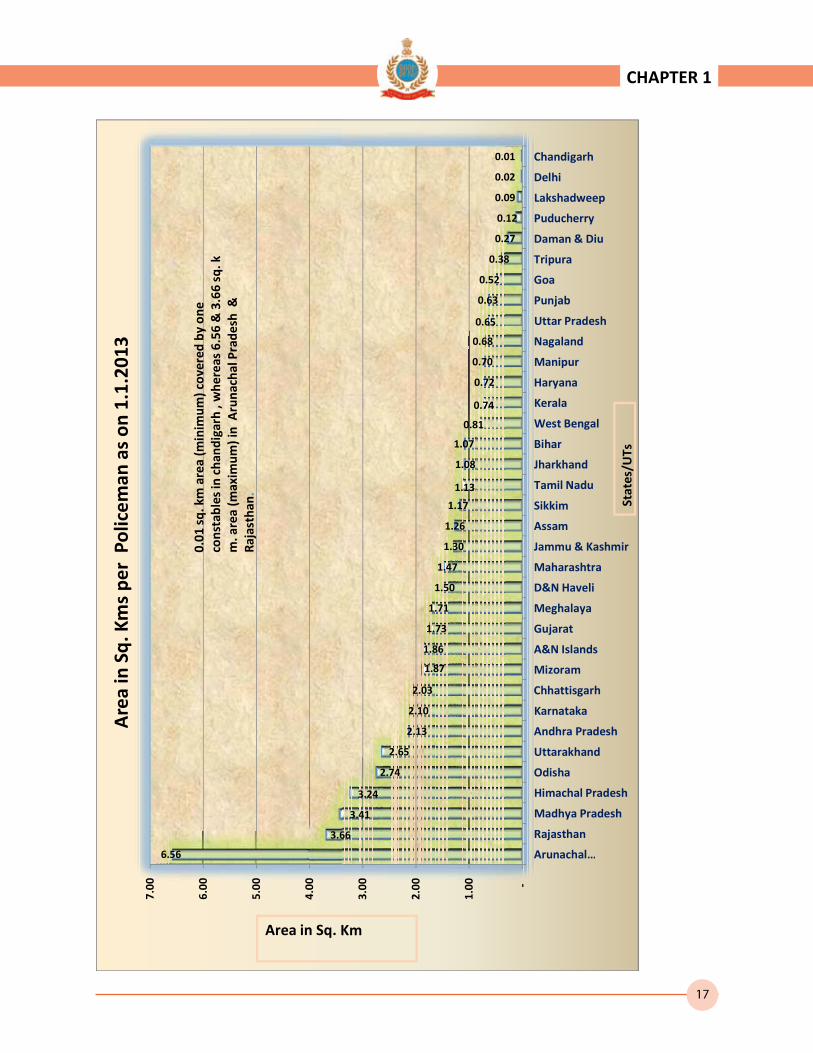
Area of Supervision (from 46.39 policemen per 100 Sq. Km. in 2002 to 69.76 Policemen in 2012)
The Police - Area Ratio (number of policemen per 100 sq. kms.) has increased by 50.38% during eleven years period of 2002 to 2012. At national level, as on 01.01.2013, we had an average of one constable for every 1.43 sq. kms. of our geographical area. In the less populous states like Arunachal Pradesh, for the Sanctioned Strength this ratio was highest at 1:6.56 sq. kms. followed by Rajasthan with 1:3.66 sq. kms. and in the densely populated States/UTs it was lowest in Chandigarh at 1:0.01 sq. kms followed by Delhi at 1:0.02 sq.
Year 2002 2012 % increase
Total population (In crores) 105.50 121.73 15.38
(in millions) 1055.50 1217.32
Total Police Strength
(In lakhs) 14.68 22.09 50.40
(in millions) 1.47 2.21
2
kms. Details of Police-Area Ratio for sanctioned and Actual Police Strength are given in Table – 1.3. (Page No. 15)
Mobility
Mobility is measured in terms of the ability of the police force of a unit to move at once. Police mobility is directly linked to police performance. Quick response in real time, to law and order situations helps to preserve the precious lives of people and to protect public and private property besides being a reliable indicator of police performance.
The vehicles needed to provide mobility to Police Force have been divided into four categories i.e. Heavy Vehicles (Buses, Trucks & Troop Carriers), Medium Vehicles, Light Vehicles (Jeeps / Cars) and Two Wheelers. Apart from the above types of vehicles, the States have also procured different types
of Special Purpose Vehicles like mine proof vehicles, riot control vehicles, ambulances, mobile forensic vehicles, water tankers, prison vans etc. depending on vital police functions and their local area specific needs.
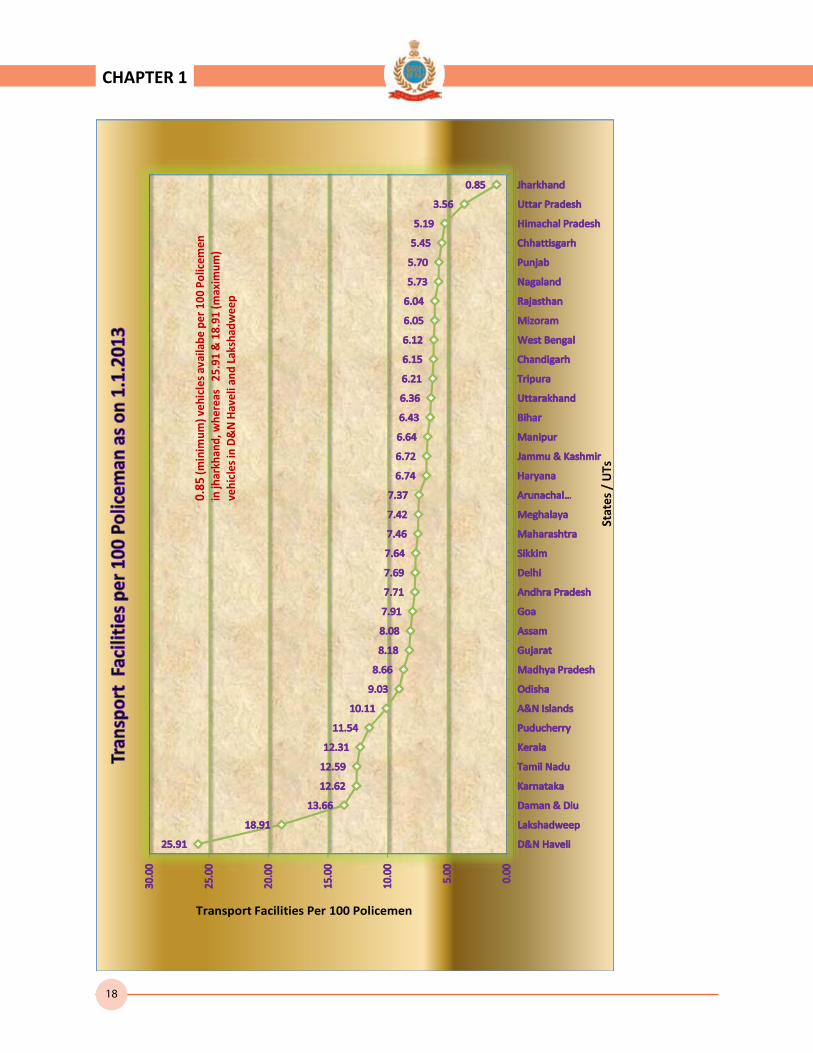
At national level, a total of 1,53,504 vehicles were available with the States/UTs police forces as on 01.01.2013. It comprised of Heavy Duty Vehicles (11,525), Medium Duty Vehicles (14,362), Light Vehicles (61,726), Three/Two Wheelers (61,576) and others (4,315). The national average of the number of vehicles per 100 policemen was 6.95 vehicles as on 01.01.2013. At States/UTs level for sanctioned strength the highest number of 25.91 vehicles per 100 policemen were held by D & N Haveli followed by 12.62 by Karnataka Police. This ratio was lowest at 0.85 in Jharkhand and 3.56 vehicles for Uttar Pradesh Police
Graph for Table A
CHAPTER 1

3
followed by 5.19 vehicles for Himachal Pradesh Police. Details of transport facilities per 100 Policemen for sanctioned as well as actual strength are given in Table – 1.3. (Page No. 15)
It can be observed that the major chunk of police vehicles (87,613) are four wheelers, which account for about 57.08% of the total holding of vehicles with Police. Four Wheelers cater to the police mobility needs
both of the Police Stations and supervisory officers.
Data on rank wise Actual Strength of Civil Police, Armed Police and Traffic Police received from States/UTs have been tabulated at its respective place. It has been analyzed with reference to the Sanctioned Strength vis-à-vis Actual Strength. According to this at National level following trends are visible from this data:-
CHAPTER 1
Sr. No.
Items Sanctioned Actual
(i) Population-per-policeman 551 733
(ii) Area in Sq. Km. per policeman 1.43 1.91
(iii) Transport Facility per 100 policemen 6.95 9.24
State-wise details are given in Table – 1.3. (Page No. 15)
4
Table-A National Basic Police Data (2002 – 2012)
Sl. No Particulars 2002 2004 2006 2008 2010 2012 %age change over last 11
years
(1) (2) (3) (4) (5) (6) (7) (8) (9)
1 Projected Population (Ist October -Each year) in thousands
1,055,051 1,089,915 1,123,993 1,157,245 1,189,793 1,217,327
3.30 3.13 2.96 2.81 2.31 15.38
2 Sanctioned Strength of Civil Police including Distt. Armed Reserve Police
1,120,167 1,170,722 1,210,742 1,619,163 1,640,342 1,765,404
4.51 3.42 33.73 1.31 7.62 57.60
3 Sanctioned Strength of State Armed Police
348,609 359,667 421,909 436,878 424,028 443,623
3.17 17.31 3.55 -2.94 4.62 27.26
4 Sanctioned Strength of Total State Police Force
1,468,776 1,530,389 1,632,651 2,056,041 2,064,370 2,209,027
4.19 6.68 25.93 0.41 7.44 50.40
5 Population per Policeman 718.32 712.18 688.45 562.85 576.00 551.07
-0.85 -3.33 -18.24 2.34 -4.33 -23.28
6 Policemen per lakh (hundred thousand) of Population
(i) Civil Police 106.17 107.41 107.72 139.92 137.87 145.02
1.17 0.29 29.89 -1.47 5.19 36.59
(ii) Total Police 139.21 140.41 145.25 177.67 173.51 181.47
0.86 3.45 22.32 -2.34 4.59 30.36
7 Policemen per hundred square kms.area
(i) Civil Police 35.38 36.97 38.24 51.14 51.80 55.75
4.49 3.44 33.73 1.29 7.63 57.57
(ii) Total Police 46.39 48.33 51.56 64.93 65.20 69.76
4.18 6.68 25.93 0.42 6.99 50.38
8 Number of Police Zones 45 40 43 81 84 100
-11.11 7.50 88.37 3.70 19.05 122.22
9 Number of Police Ranges 178 164 166 174 177 178
-7.87 1.22 4.82 1.72 0.56 0.00
10 Number of Police Districts 655 664 673 682 692 711
1.37 1.36 1.34 1.47 2.75 8.55
11 Number of Police Sub-Divisions 1,514 1,652 1,758 1,928 2022 2,053
9.11 6.42 9.67 4.88 1.53 35.60
12 Number of Police Circles 2,276 2,450 2,456 2,399 2,594 2,447
7.64 0.24 -2.32 8.13 -5.67 7.51
13 Number of Police Stations 12,445 12,548 12,833 13,421 13,984 14,360
0.83 2.27 4.58 4.19 2.69 15.39
14 Number of Police-Posts 6,943 7,245 7,425 7,826 7,742 8,583
4.35 2.48 5.40 -1.07 10.86 23.62
15 Number of State Armed Police Battalions
317 327 366 384 426 430 35.65
+2 Coys +2 Coys +2 Coys +2 Coys +5 Coys +4 Coys
Total Area of the country is 3,166,414 sq. kms.
CHAPTER 1

5
TABLE 1.1-BASIC POLICE DATA ( STATE/UT-WISE) - AS ON 1.1.2013
Sl. No.
Particulars Andhra Pradesh
Arunachal Pradesh
Assam Bihar
(1) (2) (3) (4) (5) (6)
1 Area (Square Kms.) 275,069 83,743 78,438 94,163
2 Projected Population (Ist October - 2012) in thousands
85,935 1,263 31,166 99,786
3 Sanctioned Strength of Civil Police including Distt. Armed Reserve Police
107,208 8,141 32,156 69,615
4 Actual Strength of Civil Police including Distt. Armed Reserve Police
82,040 7,078 28,189 54,617
5 Sanctioned Strength of State Armed Police 22017 4622 30184 18298
6 Actual Strength of State Armed Police 14938 3988 27201 14045
7 Actual Strength of Women Police 2,218 581 635 2,340
8 Sanctioned Strength of Total State Police Force as on 1.1.2013
129225 12763 62340 87913
9 Actual Strength of Total State Police Force as on 1.1.2013
96978 11066 55390 68662
10 Population per Policeman
(i) Sanctioned Police Strength 665 99 500 1135
(ii) Actual Police Strength 886 114 563 1453
11 Policemen per lakh of Population (Police-Population-Ratio)
(a) Civil Police
(i) Sanctioned Police Strength 124.8 644.6 103.2 69.8
(ii) Actual Police Strength 95.47 560.41 90.45 54.73
(b) Total Police
(i) Sanctioned Police Strength 150.38 1010.53 200.03 88.10
(ii) Actual Police Strength 112.85 876.17 177.73 68.81
12 Policemen per 100 Sq. Kms. Area (Police-Area-Ratio)
(a) Civil Police
(i) Sanctioned Police Strength 38.97 9.72 41.00 73.93
(ii) Actual Police Strength 29.8 8.5 35.9 58.0
(b) Total Police
(i) Sanctioned Police Strength 46.98 15.24 79.48 93.36
(ii) Actual Police Strength 35.26 13.21 70.62 72.92
13 Number of Police Zones 6 1 0 4
14 Number of Police Ranges 9 3 6 11
15 Number of Police Districts 29 18 28 40
16 Number of Police Sub-Divisions 164 9 28 108
17 Number of Police Circles 446 18 48 210
18 Number of Police Stations 1679 72 340 969
19 Number of Police Out-Posts 143 7 221 461
20 Number of State Armed Police Battalions 17 5 28 15+3 coys
CHAPTER 1

6
TABLE 1.1 - (Continued ...)
Sl. No.
Particulars Chhattis- garh
Goa Gujarat Haryana
(1) (2) (7) (8) (9) (10)
1 Area (Square Kms.) 135,191 3,702 196,022 44,212
2 Projected Population (Ist October - 2012) in thousands
24,777 1,847 60,259 26,099
3 Sanctioned Strength of Civil Police including Distt. Armed Reserve Police
46,289 5,330 92,468 56,979
4 Actual Strength of Civil Police including Distt. Armed Reserve Police
31,076 4,120 53,178 35,400
5 Sanctioned Strength of State Armed Police 20341 1788 20912 4702
6 Actual Strength of State Armed Police 14638 1202 15011 3841
7 Actual Strength of Women Police 2,013 342 2,056 2,807
8 Sanctioned Strength of Total State Police Force as on 1.1.2013
66630 7118 113380 61681
9 Actual Strength of Total State Police Force as on 1.1.2013
45714 5322 68189 39241
10 Population per Policeman
(i) Sanctioned Police Strength 372 259 531 423
(ii) Actual Police Strength 542 347 884 665
11 Policemen per lakh of Population (Police-Population-Ratio)
(a) Civil Police
(i) Sanctioned Police Strength 186.8 288.6 153.5 218.3
(ii) Actual Police Strength 125.42 223.06 88.25 135.64
(b) Total Police
(i) Sanctioned Police Strength 268.92 385.38 188.15 236.33
(ii) Actual Police Strength 184.50 288.14 113.16 150.35
12 Policemen per 100 Sq. Kms. Area (Police-Area-Ratio)
(a) Civil Police
(i) Sanctioned Police Strength 34.24 143.98 47.17 128.88
(ii) Actual Police Strength 23.0 111.3 27.1 80.1
(b) Total Police
(i) Sanctioned Police Strength 49.29 192.27 57.84 139.51
(ii) Actual Police Strength 33.81 143.76 34.79 88.76
13 Number of Police Zones 0 0 0 0
14 Number of Police Ranges 5 0 7 4
15 Number of Police Districts 28 2 33 21
16 Number of Police Sub-Divisions 86 8 96 47
17 Number of Police Circles 0 0 85 0
18 Number of Police Stations 416 25 593 269
19 Number of Police Out-Posts 108 33 1255 322
20 Number of State Armed Police Battalions 18 2 18 9
CHAPTER 1
7
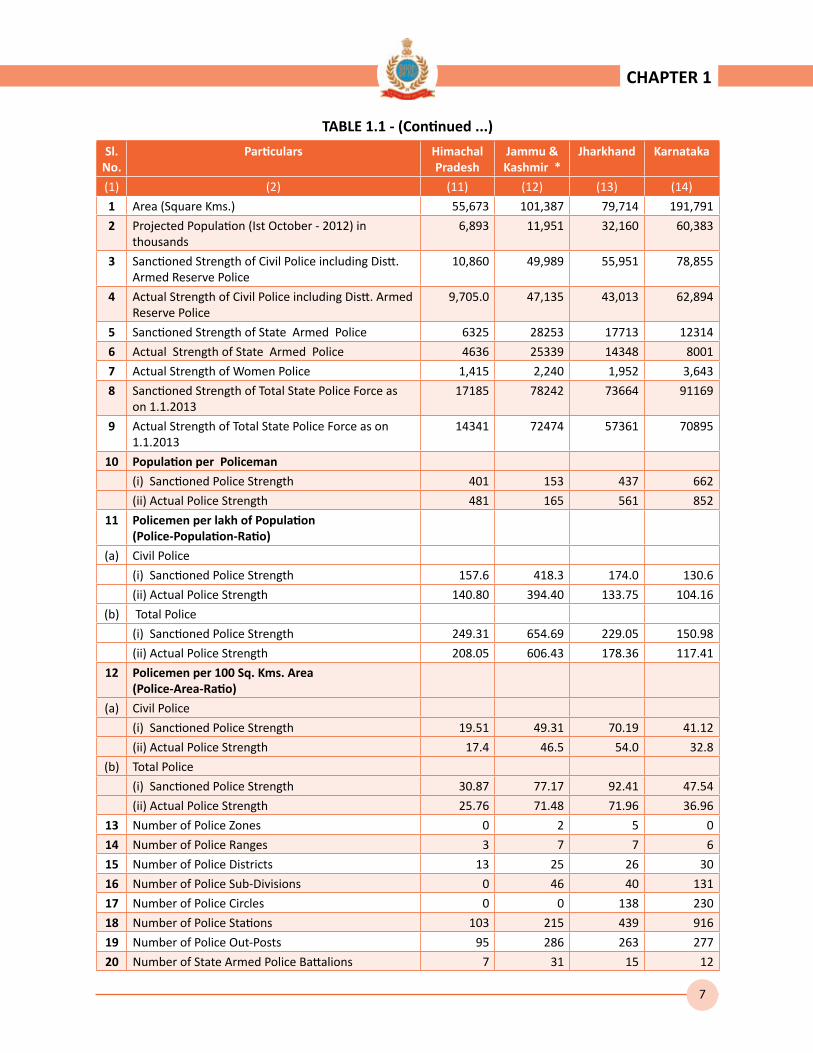
TABLE 1.1 - (Continued ...)
Sl. No.
Particulars Himachal Pradesh
Jammu & Kashmir *
Jharkhand Karnataka
(1) (2) (11) (12) (13) (14)
1 Area (Square Kms.) 55,673 101,387 79,714 191,791
2 Projected Population (Ist October - 2012) in thousands
6,893 11,951 32,160 60,383
3 Sanctioned Strength of Civil Police including Distt. Armed Reserve Police
10,860 49,989 55,951 78,855
4 Actual Strength of Civil Police including Distt. Armed Reserve Police
9,705.0 47,135 43,013 62,894
5 Sanctioned Strength of State Armed Police 6325 28253 17713 12314
6 Actual Strength of State Armed Police 4636 25339 14348 8001
7 Actual Strength of Women Police 1,415 2,240 1,952 3,643
8 Sanctioned Strength of Total State Police Force as on 1.1.2013
17185 78242 73664 91169
9 Actual Strength of Total State Police Force as on 1.1.2013
14341 72474 57361 70895
10 Population per Policeman
(i) Sanctioned Police Strength 401 153 437 662
(ii) Actual Police Strength 481 165 561 852
11 Policemen per lakh of Population (Police-Population-Ratio)
(a) Civil Police
(i) Sanctioned Police Strength 157.6 418.3 174.0 130.6
(ii) Actual Police Strength 140.80 394.40 133.75 104.16
(b) Total Police
(i) Sanctioned Police Strength 249.31 654.69 229.05 150.98
(ii) Actual Police Strength 208.05 606.43 178.36 117.41
12 Policemen per 100 Sq. Kms. Area (Police-Area-Ratio)
(a) Civil Police
(i) Sanctioned Police Strength 19.51 49.31 70.19 41.12
(ii) Actual Police Strength 17.4 46.5 54.0 32.8
(b) Total Police
(i) Sanctioned Police Strength 30.87 77.17 92.41 47.54
(ii) Actual Police Strength 25.76 71.48 71.96 36.96
13 Number of Police Zones 0 2 5 0
14 Number of Police Ranges 3 7 7 6
15 Number of Police Districts 13 25 26 30
16 Number of Police Sub-Divisions 0 46 40 131
17 Number of Police Circles 0 0 138 230
18 Number of Police Stations 103 215 439 916
19 Number of Police Out-Posts 95 286 263 277
20 Number of State Armed Police Battalions 7 31 15 12
CHAPTER 1
8
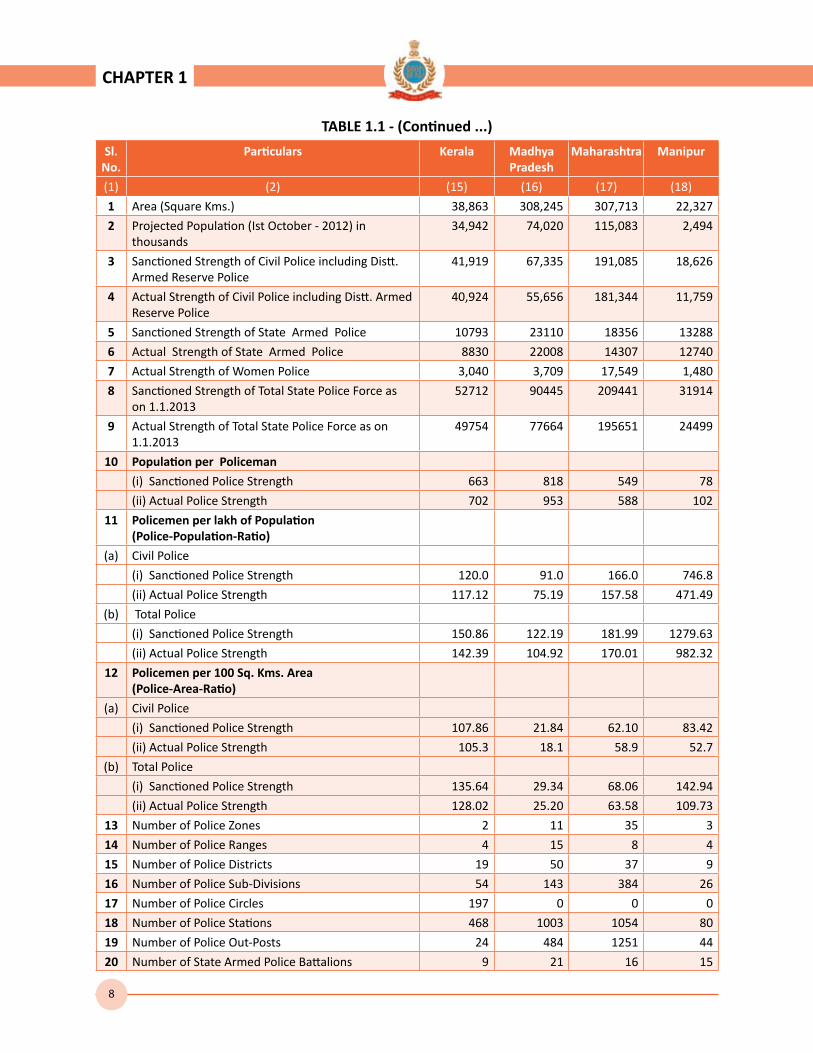
TABLE 1.1 - (Continued ...)
Sl. No.
Particulars Kerala Madhya Pradesh
Maharashtra Manipur
(1) (2) (15) (16) (17) (18)
1 Area (Square Kms.) 38,863 308,245 307,713 22,327
2 Projected Population (Ist October - 2012) in thousands
34,942 74,020 115,083 2,494
3 Sanctioned Strength of Civil Police including Distt. Armed Reserve Police
41,919 67,335 191,085 18,626
4 Actual Strength of Civil Police including Distt. Armed Reserve Police
40,924 55,656 181,344 11,759
5 Sanctioned Strength of State Armed Police 10793 23110 18356 13288
6 Actual Strength of State Armed Police 8830 22008 14307 12740
7 Actual Strength of Women Police 3,040 3,709 17,549 1,480
8 Sanctioned Strength of Total State Police Force as on 1.1.2013
52712 90445 209441 31914
9 Actual Strength of Total State Police Force as on 1.1.2013
49754 77664 195651 24499
10 Population per Policeman
(i) Sanctioned Police Strength 663 818 549 78
(ii) Actual Police Strength 702 953 588 102
11 Policemen per lakh of Population (Police-Population-Ratio)
(a) Civil Police
(i) Sanctioned Police Strength 120.0 91.0 166.0 746.8
(ii) Actual Police Strength 117.12 75.19 157.58 471.49
(b) Total Police
(i) Sanctioned Police Strength 150.86 122.19 181.99 1279.63
(ii) Actual Police Strength 142.39 104.92 170.01 982.32
12 Policemen per 100 Sq. Kms. Area (Police-Area-Ratio)
(a) Civil Police
(i) Sanctioned Police Strength 107.86 21.84 62.10 83.42
(ii) Actual Police Strength 105.3 18.1 58.9 52.7
(b) Total Police
(i) Sanctioned Police Strength 135.64 29.34 68.06 142.94
(ii) Actual Police Strength 128.02 25.20 63.58 109.73
13 Number of Police Zones 2 11 35 3
14 Number of Police Ranges 4 15 8 4
15 Number of Police Districts 19 50 37 9
16 Number of Police Sub-Divisions 54 143 384 26
17 Number of Police Circles 197 0 0 0
18 Number of Police Stations 468 1003 1054 80
19 Number of Police Out-Posts 24 484 1251 44
20 Number of State Armed Police Battalions 9 21 16 15
CHAPTER 1
9
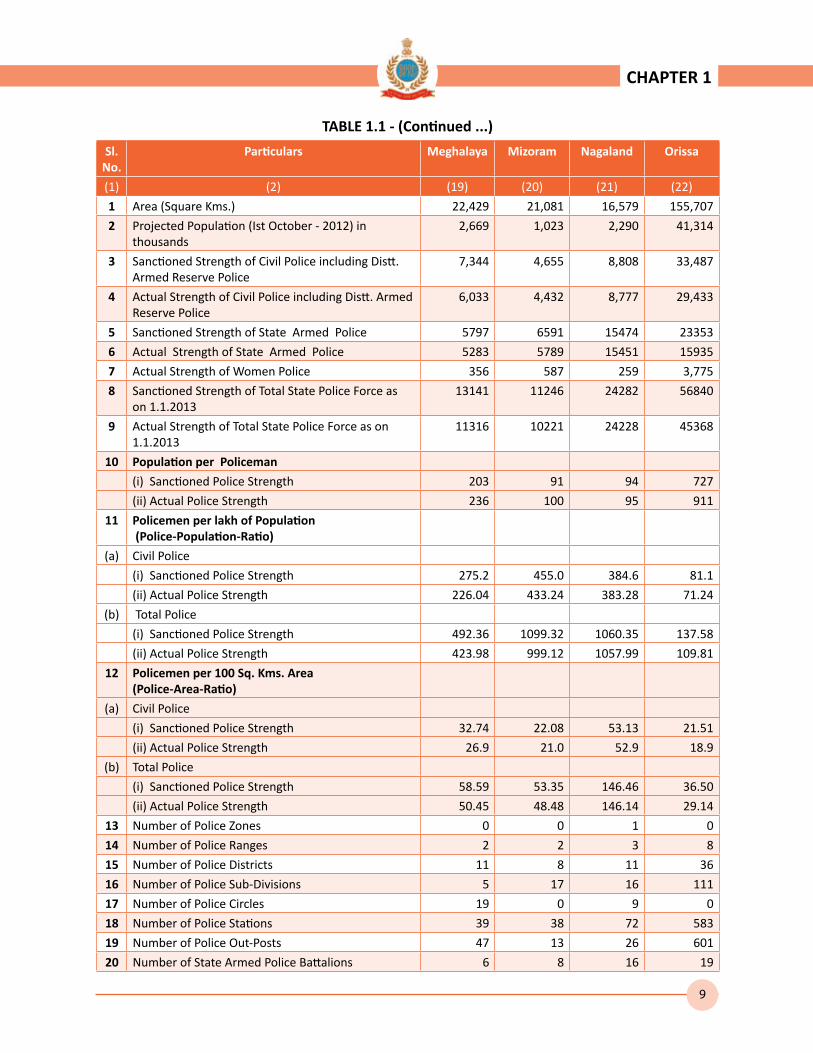
TABLE 1.1 - (Continued ...)
Sl. No.
Particulars Meghalaya Mizoram Nagaland Orissa
(1) (2) (19) (20) (21) (22)
1 Area (Square Kms.) 22,429 21,081 16,579 155,707
2 Projected Population (Ist October - 2012) in thousands
2,669 1,023 2,290 41,314
3 Sanctioned Strength of Civil Police including Distt. Armed Reserve Police
7,344 4,655 8,808 33,487
4 Actual Strength of Civil Police including Distt. Armed Reserve Police
6,033 4,432 8,777 29,433
5 Sanctioned Strength of State Armed Police 5797 6591 15474 23353
6 Actual Strength of State Armed Police 5283 5789 15451 15935
7 Actual Strength of Women Police 356 587 259 3,775
8 Sanctioned Strength of Total State Police Force as on 1.1.2013
13141 11246 24282 56840
9 Actual Strength of Total State Police Force as on 1.1.2013
11316 10221 24228 45368
10 Population per Policeman
(i) Sanctioned Police Strength 203 91 94 727
(ii) Actual Police Strength 236 100 95 911
11 Policemen per lakh of Population (Police-Population-Ratio)
(a) Civil Police
(i) Sanctioned Police Strength 275.2 455.0 384.6 81.1
(ii) Actual Police Strength 226.04 433.24 383.28 71.24
(b) Total Police
(i) Sanctioned Police Strength 492.36 1099.32 1060.35 137.58
(ii) Actual Police Strength 423.98 999.12 1057.99 109.81
12 Policemen per 100 Sq. Kms. Area (Police-Area-Ratio)
(a) Civil Police
(i) Sanctioned Police Strength 32.74 22.08 53.13 21.51
(ii) Actual Police Strength 26.9 21.0 52.9 18.9
(b) Total Police
(i) Sanctioned Police Strength 58.59 53.35 146.46 36.50
(ii) Actual Police Strength 50.45 48.48 146.14 29.14
13 Number of Police Zones 0 0 1 0
14 Number of Police Ranges 2 2 3 8
15 Number of Police Districts 11 8 11 36
16 Number of Police Sub-Divisions 5 17 16 111
17 Number of Police Circles 19 0 9 0
18 Number of Police Stations 39 38 72 583
19 Number of Police Out-Posts 47 13 26 601
20 Number of State Armed Police Battalions 6 8 16 19
CHAPTER 1
10
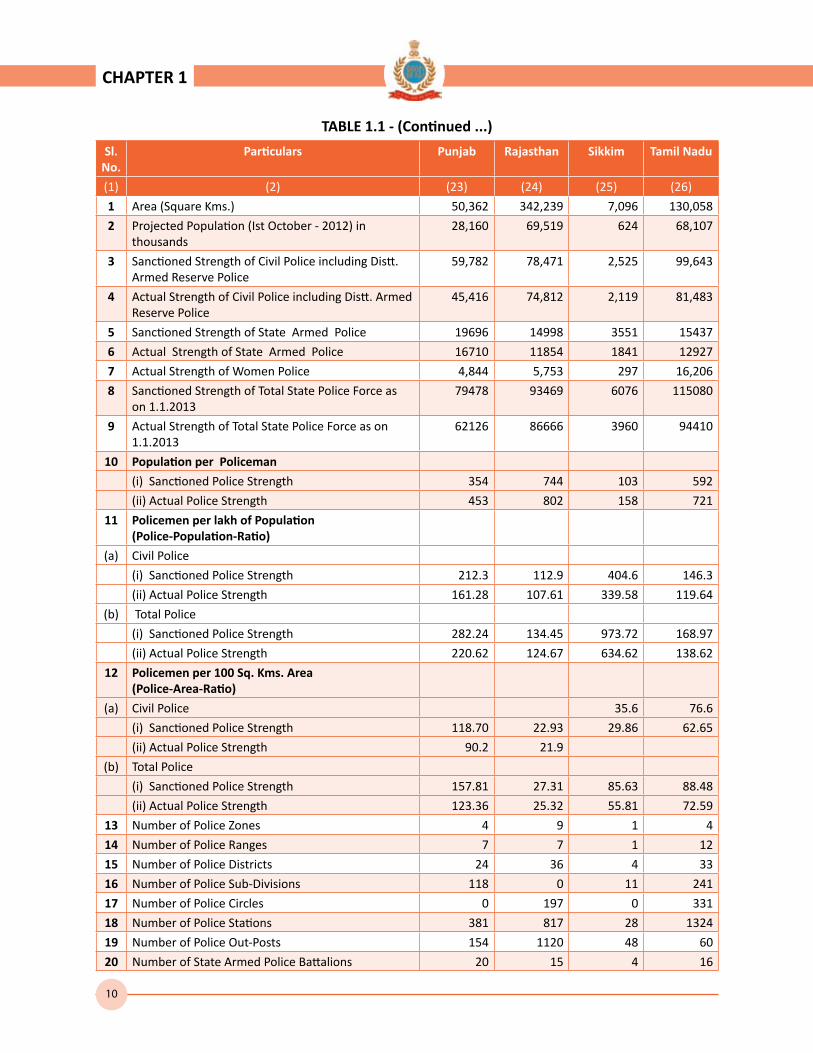
TABLE 1.1 - (Continued ...)
Sl. No.
Particulars Punjab Rajasthan Sikkim Tamil Nadu
(1) (2) (23) (24) (25) (26)
1 Area (Square Kms.) 50,362 342,239 7,096 130,058
2 Projected Population (Ist October - 2012) in thousands
28,160 69,519 624 68,107
3 Sanctioned Strength of Civil Police including Distt. Armed Reserve Police
59,782 78,471 2,525 99,643
4 Actual Strength of Civil Police including Distt. Armed Reserve Police
45,416 74,812 2,119 81,483
5 Sanctioned Strength of State Armed Police 19696 14998 3551 15437
6 Actual Strength of State Armed Police 16710 11854 1841 12927
7 Actual Strength of Women Police 4,844 5,753 297 16,206
8 Sanctioned Strength of Total State Police Force as on 1.1.2013
79478 93469 6076 115080
9 Actual Strength of Total State Police Force as on 1.1.2013
62126 86666 3960 94410
10 Population per Policeman
(i) Sanctioned Police Strength 354 744 103 592
(ii) Actual Police Strength 453 802 158 721
11 Policemen per lakh of Population (Police-Population-Ratio)
(a) Civil Police
(i) Sanctioned Police Strength 212.3 112.9 404.6 146.3
(ii) Actual Police Strength 161.28 107.61 339.58 119.64
(b) Total Police
(i) Sanctioned Police Strength 282.24 134.45 973.72 168.97
(ii) Actual Police Strength 220.62 124.67 634.62 138.62
12 Policemen per 100 Sq. Kms. Area (Police-Area-Ratio)
(a) Civil Police 35.6 76.6
(i) Sanctioned Police Strength 118.70 22.93 29.86 62.65
(ii) Actual Police Strength 90.2 21.9
(b) Total Police
(i) Sanctioned Police Strength 157.81 27.31 85.63 88.48
(ii) Actual Police Strength 123.36 25.32 55.81 72.59
13 Number of Police Zones 4 9 1 4
14 Number of Police Ranges 7 7 1 12
15 Number of Police Districts 24 36 4 33
16 Number of Police Sub-Divisions 118 0 11 241
17 Number of Police Circles 0 197 0 331
18 Number of Police Stations 381 817 28 1324
19 Number of Police Out-Posts 154 1120 48 60
20 Number of State Armed Police Battalions 20 15 4 16
CHAPTER 1
11
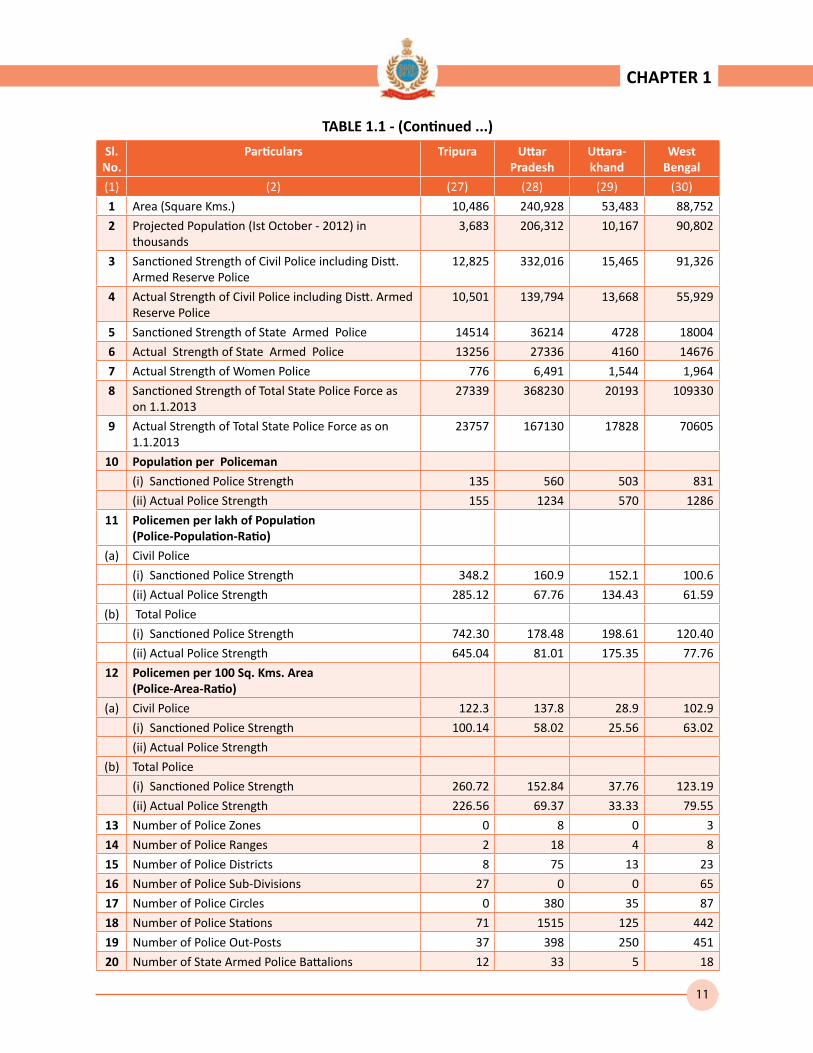
TABLE 1.1 - (Continued ...)
Sl. No.
Particulars Tripura Uttar Pradesh
Uttara-khand
West Bengal
(1) (2) (27) (28) (29) (30)
1 Area (Square Kms.) 10,486 240,928 53,483 88,752
2 Projected Population (Ist October - 2012) in thousands
3,683 206,312 10,167 90,802
3 Sanctioned Strength of Civil Police including Distt. Armed Reserve Police
12,825 332,016 15,465 91,326
4 Actual Strength of Civil Police including Distt. Armed Reserve Police
10,501 139,794 13,668 55,929
5 Sanctioned Strength of State Armed Police 14514 36214 4728 18004
6 Actual Strength of State Armed Police 13256 27336 4160 14676
7 Actual Strength of Women Police 776 6,491 1,544 1,964
8 Sanctioned Strength of Total State Police Force as on 1.1.2013
27339 368230 20193 109330
9 Actual Strength of Total State Police Force as on 1.1.2013
23757 167130 17828 70605
10 Population per Policeman
(i) Sanctioned Police Strength 135 560 503 831
(ii) Actual Police Strength 155 1234 570 1286
11 Policemen per lakh of Population (Police-Population-Ratio)
(a) Civil Police
(i) Sanctioned Police Strength 348.2 160.9 152.1 100.6
(ii) Actual Police Strength 285.12 67.76 134.43 61.59
(b) Total Police
(i) Sanctioned Police Strength 742.30 178.48 198.61 120.40
(ii) Actual Police Strength 645.04 81.01 175.35 77.76
12 Policemen per 100 Sq. Kms. Area (Police-Area-Ratio)
(a) Civil Police 122.3 137.8 28.9 102.9
(i) Sanctioned Police Strength 100.14 58.02 25.56 63.02
(ii) Actual Police Strength
(b) Total Police
(i) Sanctioned Police Strength 260.72 152.84 37.76 123.19
(ii) Actual Police Strength 226.56 69.37 33.33 79.55
13 Number of Police Zones 0 8 0 3
14 Number of Police Ranges 2 18 4 8
15 Number of Police Districts 8 75 13 23
16 Number of Police Sub-Divisions 27 0 0 65
17 Number of Police Circles 0 380 35 87
18 Number of Police Stations 71 1515 125 442
19 Number of Police Out-Posts 37 398 250 451
20 Number of State Armed Police Battalions 12 33 5 18
CHAPTER 1
12
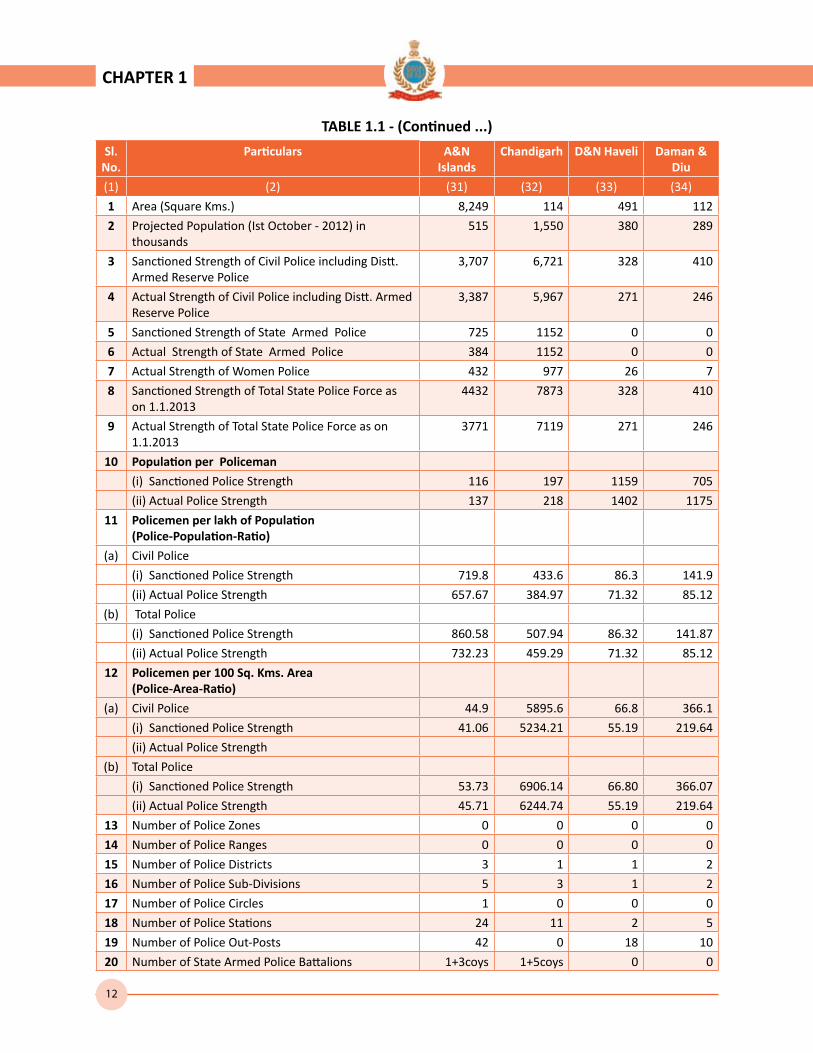
TABLE 1.1 - (Continued ...)
Sl. No.
Particulars A&N Islands
Chandigarh D&N Haveli Daman & Diu
(1) (2) (31) (32) (33) (34)
1 Area (Square Kms.) 8,249 114 491 112
2 Projected Population (Ist October - 2012) in thousands
515 1,550 380 289
3 Sanctioned Strength of Civil Police including Distt. Armed Reserve Police
3,707 6,721 328 410
4 Actual Strength of Civil Police including Distt. Armed Reserve Police
3,387 5,967 271 246
5 Sanctioned Strength of State Armed Police 725 1152 0 0
6 Actual Strength of State Armed Police 384 1152 0 0
7 Actual Strength of Women Police 432 977 26 7
8 Sanctioned Strength of Total State Police Force as on 1.1.2013
4432 7873 328 410
9 Actual Strength of Total State Police Force as on 1.1.2013
3771 7119 271 246
10 Population per Policeman
(i) Sanctioned Police Strength 116 197 1159 705
(ii) Actual Police Strength 137 218 1402 1175
11 Policemen per lakh of Population (Police-Population-Ratio)
(a) Civil Police
(i) Sanctioned Police Strength 719.8 433.6 86.3 141.9
(ii) Actual Police Strength 657.67 384.97 71.32 85.12
(b) Total Police
(i) Sanctioned Police Strength 860.58 507.94 86.32 141.87
(ii) Actual Police Strength 732.23 459.29 71.32 85.12
12 Policemen per 100 Sq. Kms. Area (Police-Area-Ratio)
(a) Civil Police 44.9 5895.6 66.8 366.1
(i) Sanctioned Police Strength 41.06 5234.21 55.19 219.64
(ii) Actual Police Strength
(b) Total Police
(i) Sanctioned Police Strength 53.73 6906.14 66.80 366.07
(ii) Actual Police Strength 45.71 6244.74 55.19 219.64
13 Number of Police Zones 0 0 0 0
14 Number of Police Ranges 0 0 0 0
15 Number of Police Districts 3 1 1 2
16 Number of Police Sub-Divisions 5 3 1 2
17 Number of Police Circles 1 0 0 0
18 Number of Police Stations 24 11 2 5
19 Number of Police Out-Posts 42 0 18 10
20 Number of State Armed Police Battalions 1+3coys 1+5coys 0 0
CHAPTER 1

13
TABLE 1.1 - (Continued ...)
Sl. No.
Particulars Delhi Laksha-dweep
Puducherry All India
(1) (2) (35) (36) (37) (38)
1 Area (Square Kms.) 1,483 32 480 3,166,414
2 Projected Population (Ist October - 2012) in thousands
19,301 77 1,487 1,217,327
3 Sanctioned Strength of Civil Police including Distt. Armed Reserve Police
71,550 349 3,186 1,765,404
4 Actual Strength of Civil Police including Distt. Armed Reserve Police
67,030 276 2,266 1,299,968
5 Sanctioned Strength of State Armed Police 9608 0 765 443,623
6 Actual Strength of State Armed Police 8500 0 371 360,698
7 Actual Strength of Women Police 5,021 16 167 97,518
8 Sanctioned Strength of Total State Police Force as on 1.1.2013
81,158 349 3,951 2,209,027
9 Actual Strength of Total State Police Force as on 1.1.2013
75,530 276 2,637 1,660,666
10 Population per Policeman
(i) Sanctioned Police Strength 238 221 376 551
(ii) Actual Police Strength 256 279 564 733
11 Policemen per lakh of Population (Police-Population-Ratio)
(a) Civil Police
(i) Sanctioned Police Strength 370.7 453.2 214.3 145.0
(ii) Actual Police Strength 347.29 358.44 152.39 106.79
(b) Total Police
(i) Sanctioned Police Strength 420.49 453.25 265.70 181.47
(ii) Actual Police Strength 391.33 358.44 177.34 136.42
12 Policemen per 100 Sq. Kms. Area (Police-Area-Ratio)
(a) Civil Police 4824.7 1090.6 663.8 55.8
(i) Sanctioned Police Strength 4519.89 862.50 472.08 41.05
(ii) Actual Police Strength
(b) Total Police
(i) Sanctioned Police Strength 5472.56 1090.63 823.13 69.76
(ii) Actual Police Strength 5093.05 862.50 549.38 52.45
13 Number of Police Zones 0 1 0 100
14 Number of Police Ranges 4 1 0 178
15 Number of Police Districts 11 1 2 711
16 Number of Police Sub-Divisions 54 1 6 2,053
17 Number of Police Circles 0 1 15 2,447
18 Number of Police Stations 180 16 46 14,360
19 Number of Police Out-Posts 23 3 8 8,583
20 Number of State Armed Police Battalions 15 0 1+5coys 430+4Coys
CHAPTER 1
* Only the operational area out of total area of 2,22,236 Sq. Km. has been considered.
14
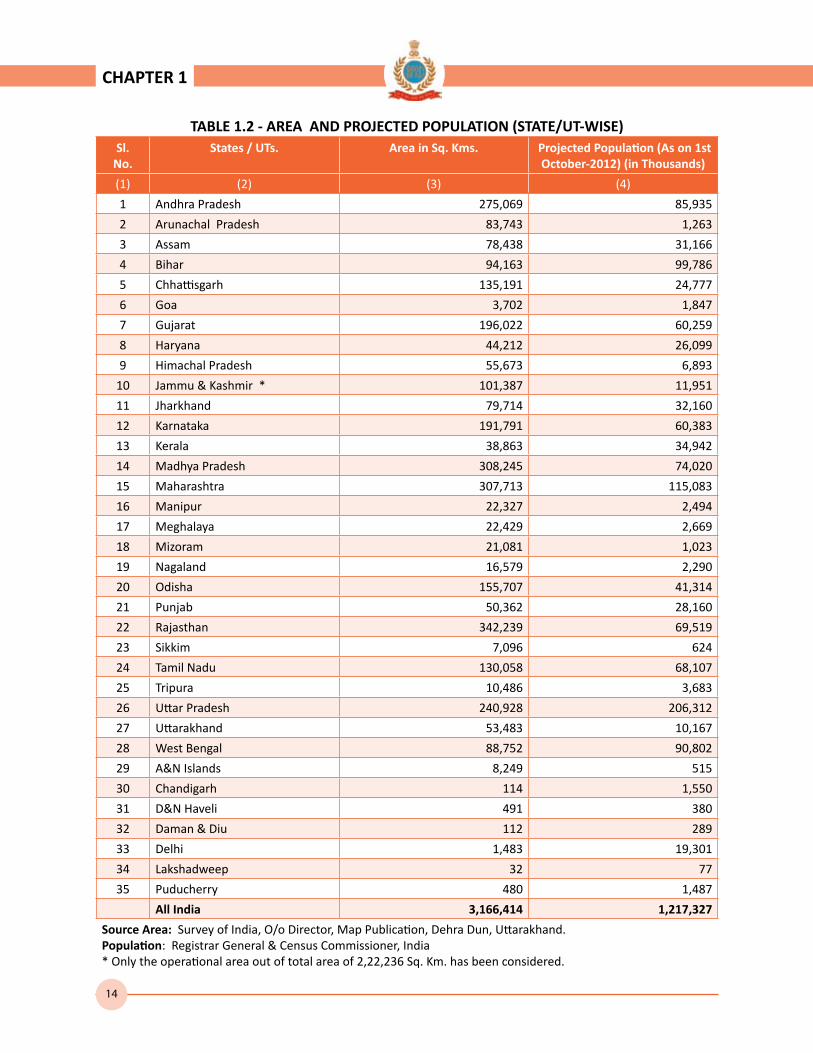
TABLE 1.2 - AREA AND PROJECTED POPULATION (STATE/UT-WISE)Sl.
No. States / UTs. Area in Sq. Kms. Projected Population (As on 1st
October-2012) (in Thousands)
(1) (2) (3) (4)
1 Andhra Pradesh 275,069 85,935
2 Arunachal Pradesh 83,743 1,263
3 Assam 78,438 31,166
4 Bihar 94,163 99,786
5 Chhattisgarh 135,191 24,777
6 Goa 3,702 1,847
7 Gujarat 196,022 60,259
8 Haryana 44,212 26,099
9 Himachal Pradesh 55,673 6,893
10 Jammu & Kashmir * 101,387 11,951
11 Jharkhand 79,714 32,160
12 Karnataka 191,791 60,383
13 Kerala 38,863 34,942
14 Madhya Pradesh 308,245 74,020
15 Maharashtra 307,713 115,083
16 Manipur 22,327 2,494
17 Meghalaya 22,429 2,669
18 Mizoram 21,081 1,023
19 Nagaland 16,579 2,290
20 Odisha 155,707 41,314
21 Punjab 50,362 28,160
22 Rajasthan 342,239 69,519
23 Sikkim 7,096 624
24 Tamil Nadu 130,058 68,107
25 Tripura 10,486 3,683
26 Uttar Pradesh 240,928 206,312
27 Uttarakhand 53,483 10,167
28 West Bengal 88,752 90,802
29 A&N Islands 8,249 515
30 Chandigarh 114 1,550
31 D&N Haveli 491 380
32 Daman & Diu 112 289
33 Delhi 1,483 19,301
34 Lakshadweep 32 77
35 Puducherry 480 1,487
All India 3,166,414 1,217,327
Source Area: Survey of India, O/o Director, Map Publication, Dehra Dun, Uttarakhand. Population: Registrar General & Census Commissioner, India * Only the operational area out of total area of 2,22,236 Sq. Km. has been considered.
CHAPTER 1

15
Table 1.3-- POPULATION PER POLICEMAN / COMPARATIVE AREA OF RESPONSIBILITY/ TRANSPORT FACILITY PER 100 POLICEMEN - AS ON 1.1.2013
Sl. No.
States / UTs.
Population per Policeman
Area in Sq. Kms. per Policeman
Transport Facility per 100 Policemen
Sanctioned Actual Sanctioned Actual Sanctioned Actual
(1) (2) (3) (4) (5) (6) (7) (8)
1 Andhra Pradesh 665 886 2.13 2.84 7.71 10.28
2 Arunachal Pradesh 99 114 6.56 7.57 7.37 8.50
3 Assam 500 563 1.26 1.42 8.08 9.10
4 Bihar 1,135 1,453 1.07 1.37 6.43 8.23
5 Chhattisgarh 372 542 2.03 2.96 5.45 7.94
6 Goa 259 347 0.52 0.70 7.91 10.58
7 Gujarat 531 884 1.73 2.87 8.18 13.59
8 Haryana 423 665 0.72 1.13 6.74 10.60
9 Himachal Pradesh 401 481 3.24 3.88 5.19 6.22
10 Jammu & Kashmir 153 165 1.30 1.40 6.72 7.25
11 Jharkhand 437 561 1.08 1.39 0.85 1.09
12 Karnataka 662 852 2.10 2.71 12.62 16.22
13 Kerala 663 702 0.74 0.78 12.31 13.04
14 Madhya Pradesh 818 953 3.41 3.97 8.66 10.09
15 Maharashtra 549 588 1.47 1.57 7.46 7.99
16 Manipur 78 102 0.70 0.91 6.64 8.65
17 Meghalaya 203 236 1.71 1.98 7.42 8.62
18 Mizoram 91 100 1.87 2.06 6.05 6.65
19 Nagaland 94 95 0.68 0.68 5.73 5.74
20 Odisha 727 911 2.74 3.43 9.03 11.32
21 Punjab 354 453 0.63 0.81 5.70 7.29
22 Rajasthan 744 802 3.66 3.95 6.04 6.51
23 Sikkim 103 158 1.17 1.79 7.64 11.72
24 Tamil Nadu 592 721 1.13 1.38 12.59 15.34
25 Tripura 135 155 0.38 0.44 6.21 7.15
26 Uttar Pradesh 560 1,234 0.65 1.44 3.56 7.85
27 Uttarakhand 503 570 2.65 3.00 6.36 7.20
28 West Bengal 831 1,286 0.81 1.26 6.12 9.48
29 A&N Islands 116 137 1.86 2.19 10.11 11.88
30 Chandigarh 197 218 0.01 0.02 6.15 6.80
31 D&N Haveli 1,159 1,402 1.50 1.81 25.91 31.37
32 Daman & Diu 705 1,175 0.27 0.46 13.66 22.76
33 Delhi 238 256 0.02 0.02 7.69 8.26
34 Lakshadweep 221 279 0.09 0.12 18.91 23.91
35 Puducherry 376 564 0.12 0.18 11.54 17.29
All India 551 733 1.43 1.91 6.95 9.24
CHAPTER 1
16
CHAPTER 1
17
CHAPTER 1
6.56
3.6
4.00
5.00
6.00
7.00
Are
a in
Sq.
Km
s pe
r P
olic
eman
as
on 1
.1.2
013
0.01
sq.
km
are
a (m
inim
um)c
over
ed b
y on
e co
nsta
bles
in c
hand
igar
h , w
here
as 6
.56
& 3
.66
sq. k
m
. are
a (m
axim
um) i
n A
runa
chal
Pra
desh
&
Raja
stha
n.
Area in Sq. K
66
3.41
3.24
2.74
2.65
2.13
2.10
2.03
1.87
1.86
1.73
1.71
1.50
1.47
1.30
1.26
1.17
1.13
1.08
1.07
0.81
0.74
0.72
0.70
0.68
0.65
0.63
0.52
0.38
0.27
0.12
0.09
0.02
0.01
-
1.00
2.00
3.00
Arunachal …
Rajasthan
Madhya Pradesh
Himachal Pradesh
Odisha
Uttarakhand
Andhra Pradesh
Karnataka
Chhattisgarh
Mizoram
A&N Islands
Gujarat
Meghalaya
D&N Haveli
Maharashtra
Jammu & Kashmir
Assam
Sikkim
Tamil Nadu
Jharkhand
Bihar
West Bengal
Kerala
Haryana
Manipur
Nagaland
Uttar Pradesh
Punjab
Goa
Tripura
Daman & Diu
Puducherry
Lakshadweep
Delhi
Chandigarh
Stat
es/U
Ts
Km
18
CHAPTER 1
0.85
(min
imum
) veh
icle
s av
aila
be p
er 1
00 P
olic
emen
in
jhar
khan
d, w
here
as
25.9
1 &
18.
91 (m
axim
um)
vehi
cles
in D
&N
Hav
eli a
nd L
aksh
adw
eep
Transport Facilities Per
Stat
es /
UTs
100 Policemen

19
POLICE ADMINISTRATIVE OFFICES
State Wise Data on:• Police Zones/Ranges & Districts
• Police Sub-Division/Circles
• Sanctioned and Actual Police Stations (Rural & Urban)
• Sanctioned and Actual Police Posts (Rural & Urban)
• Police Stations for special purposes
• Armed Police Battalions
• Women Police Stations
• Cities with Police Commissionerates
This chapter provides a glimpse of state-wise data as on 1.1.2013, on field level administrative Police Units namely Police Zones, Police Ranges, Police Districts, Police Sub-Division/Circles, Police Stations (Rural & Urban), Police Posts (Rural & Urban), Police Stations for special purposes, Number of Armed Police Battalions; Women Police Stations and their locations and Cities with Police Commissioner System.
An analysis of data on police administrative offices shows that the whole of India is divided into 100 Police Zones, 178 Police Ranges covering 711 Police Districts. There were a total of 14,360 Police Stations in the country as on 01.01.2013. The state of Andhra Pradesh had maximum 1679 Police Stations followed by 1515 in Uttar Pradesh and minimum 2 in Union Territory of D&N Haveli & 5 in Daman and Diu. Details are given in Table–2.1. (Page No. 21)
Police Stations
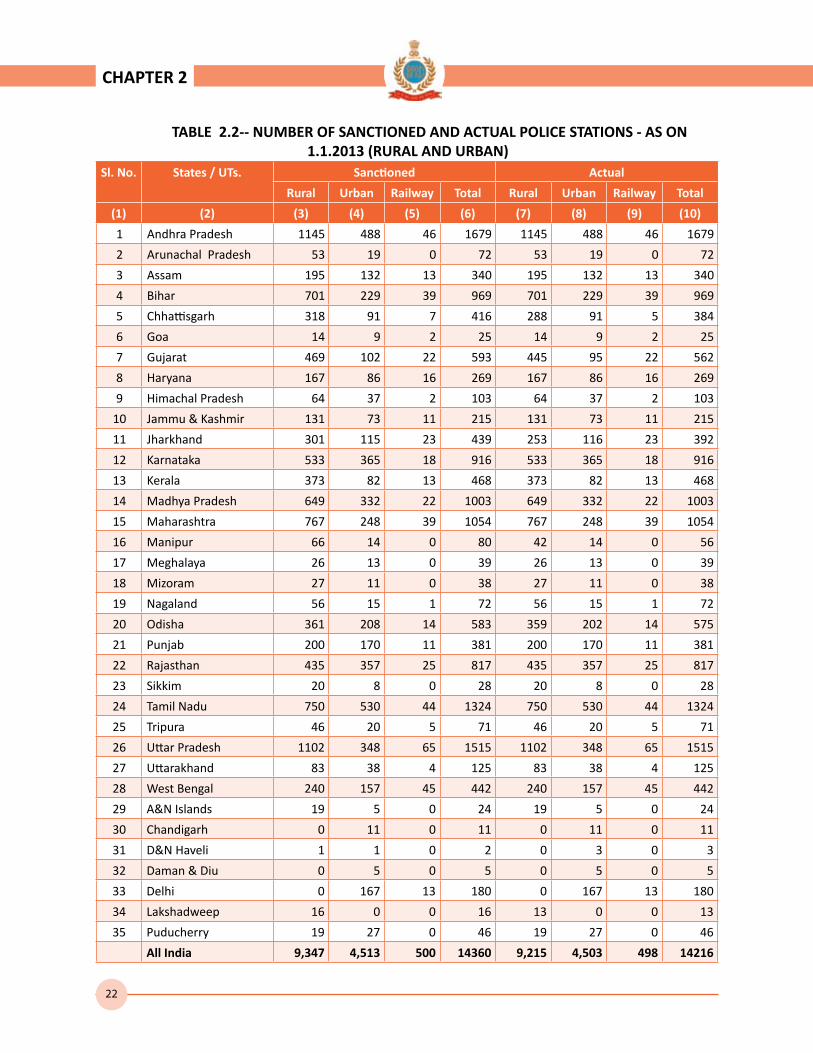
Out of a total of 14,360 Sanctioned Police
Stations, as many as 9,347 (65.09%) were located in rural area while a total of 4,513 (31.43%) were in urban area and the remaining 500 (3.48%) were the Government Railway Police Stations.
The information has been received from all states/UTs. Details are given in Table – 2.2. (Page No. 22)
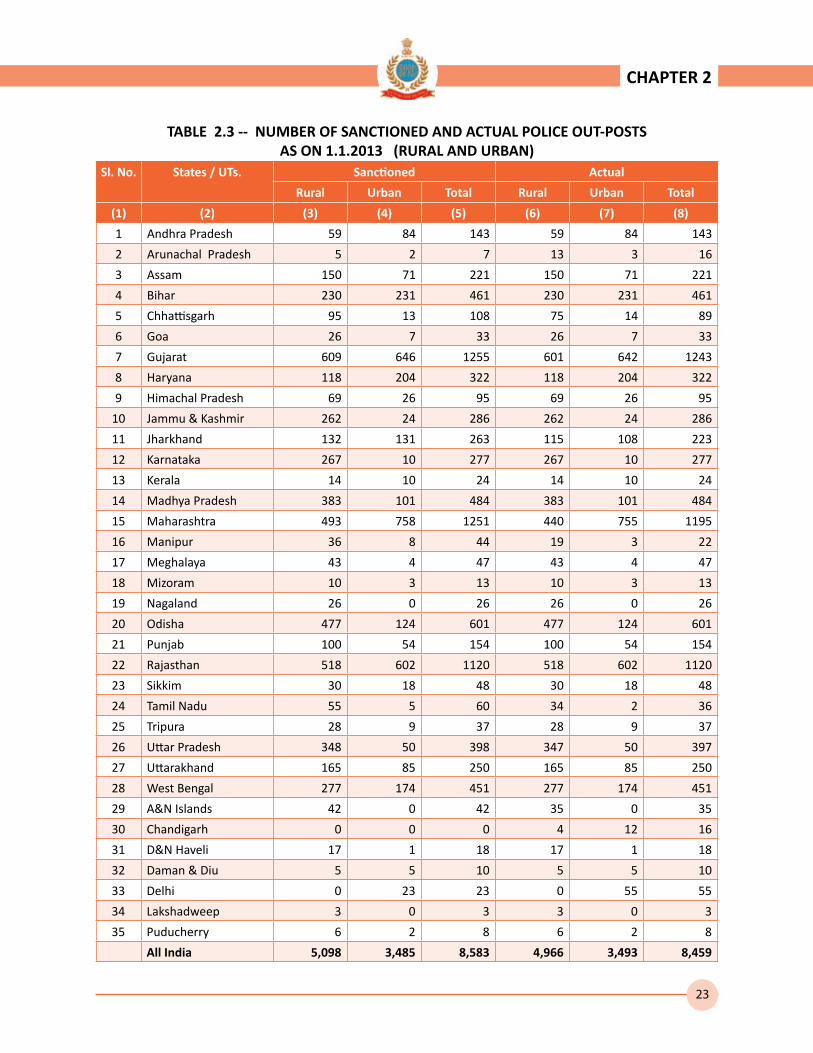
Police-Posts
Like existing Police Stations Data on existing Police Posts has also been collected & compiled. Of the total of 8583 Sanctioned Police Posts in the country as on 01.01.2013, there were 5098 Police Posts in rural area while 3,485 Police Posts were located in urban area.
Data on actual rural & urban Police Posts has been received from all the States/UTs. Details are given in Table 2.3 (Page No. 23)
From Table A
Year 2002 2012 % age increase
Total Police Stations 12,445 14,360 15.39
Total Police -posts 6,943 8,583 23.62
CHAPTER 2
The existence of Police Administrative offices like Zones, Ranges, Sub-Divisions & Circles are not uniform in all the States. Therefore, some of the States have all the above offices while in others states those were either not set up or have since been abolished. Therefore, some variation may be noticed as compared to the information given in the previous years of this document.
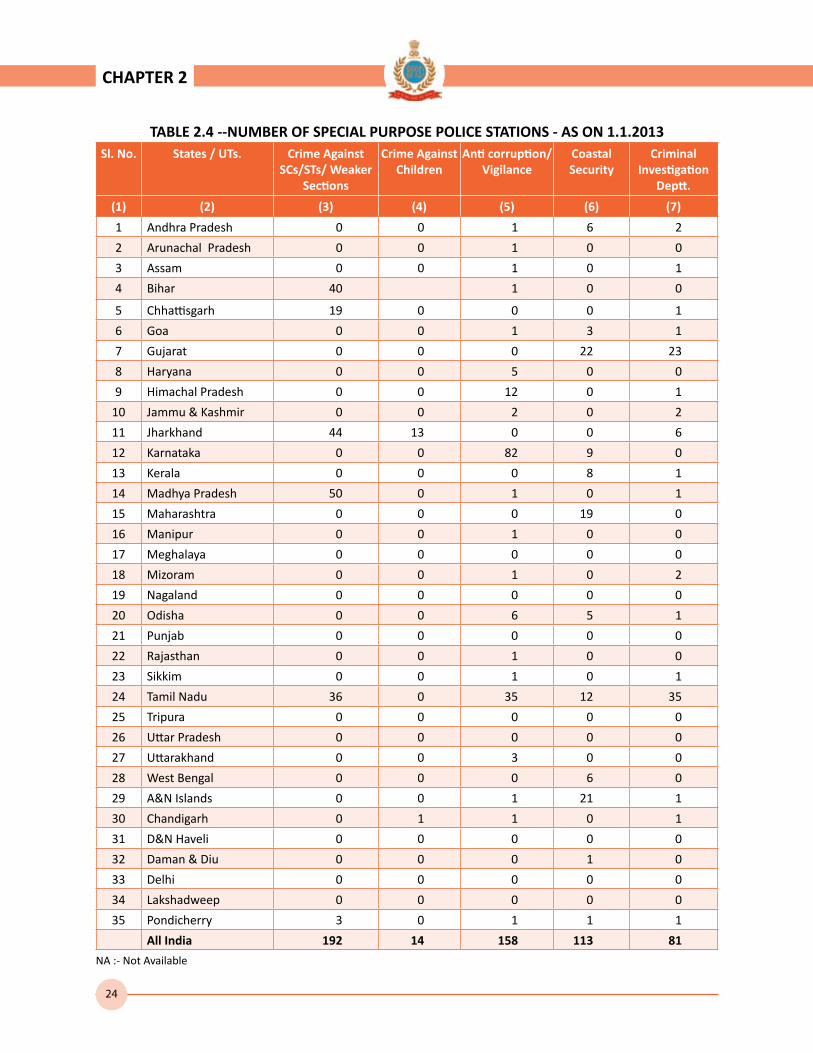
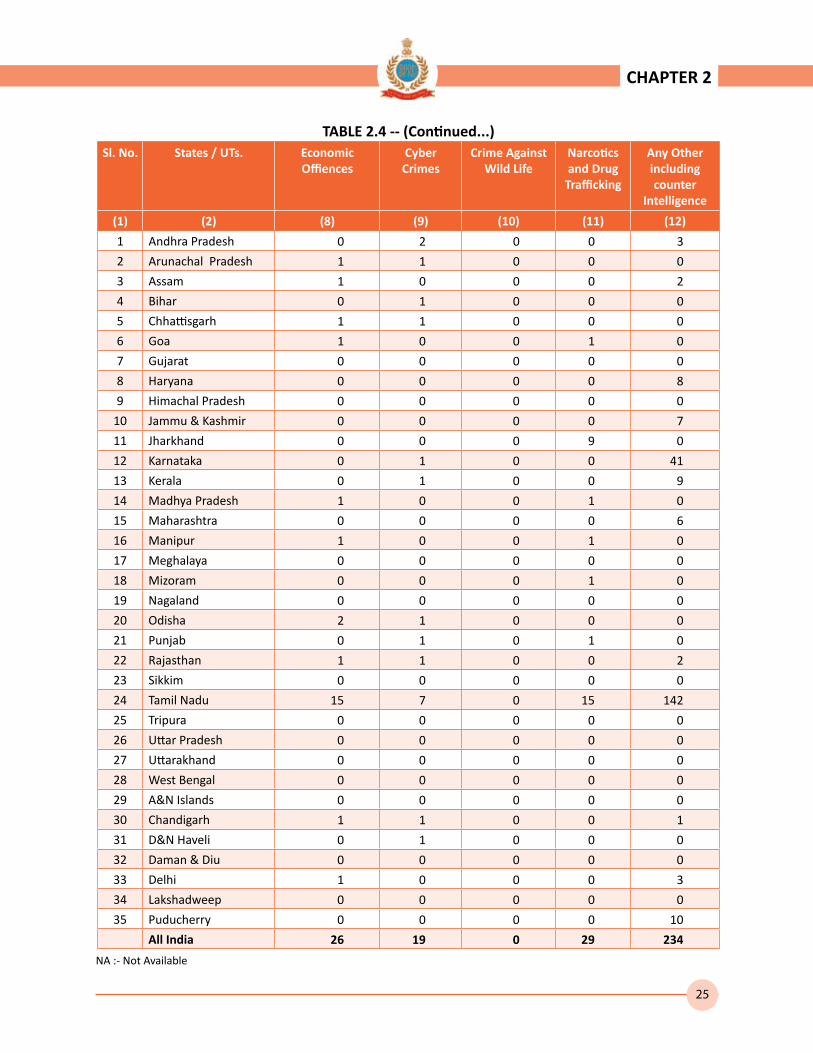
Police Stations for Special Purposes
Data on Police Stations for special

20
purposes namely – Crime against SC/ST/Weaker Section, Crime against children, anti Corruption/Vigilance, Costal Security, Criminal Investigation Deptt., Economic Offences, Cyber Crime, Narcotics and Drug Trafficking etc. has been collected and compiled. However, the received information has been indicated accordingly. Details are given in Table - 2.4 (Page No. 24)
Armed Battalions
The total number of Armed Police Battalions with all the States/UTs in the country was 430+ 4 coys as on 01.01.2013. The highest number of 33 Armed Police Battalions was with Uttar Pradesh Police, followed by 31 with Jammu & Kashmir and 28 with Assam Police as on 01.01.2013. Details are given in Table – 2.5 (Page No. 26)
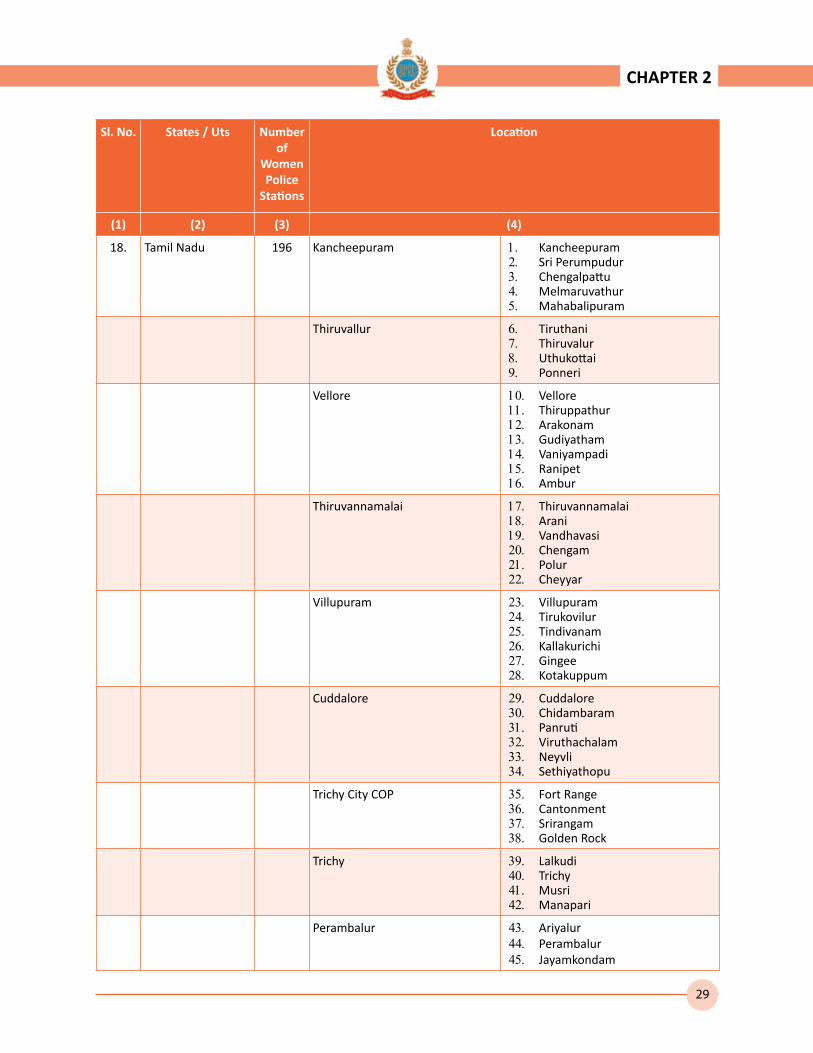
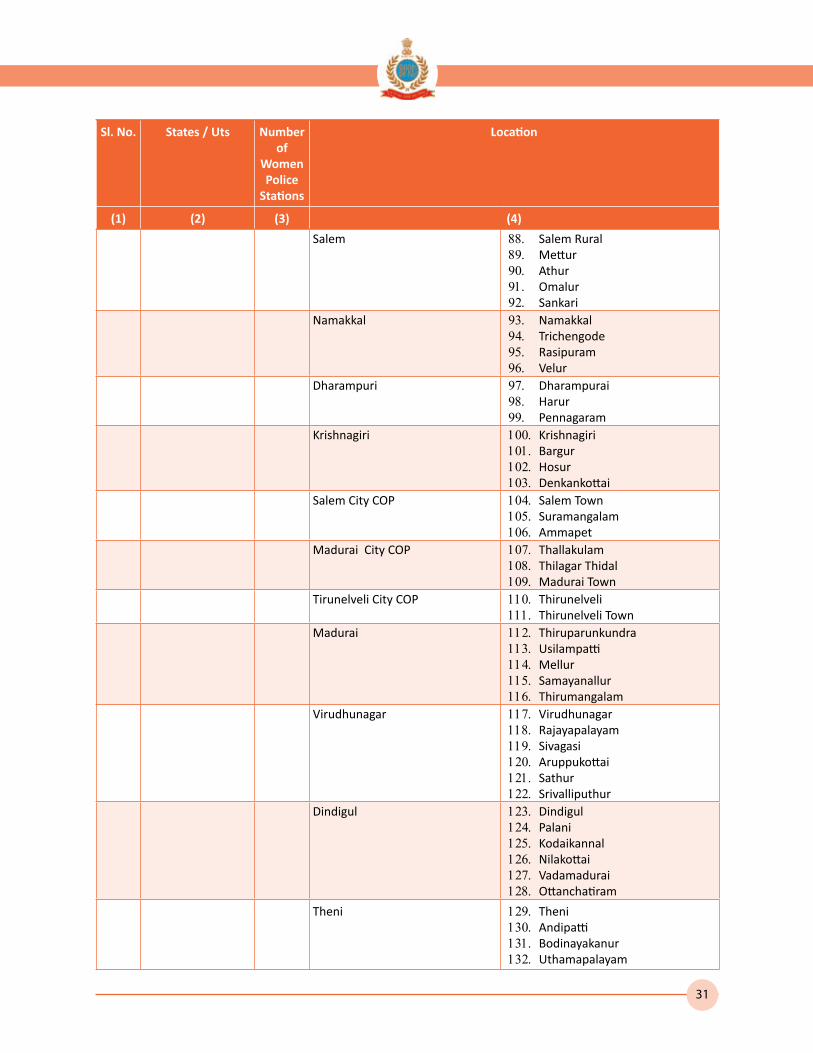
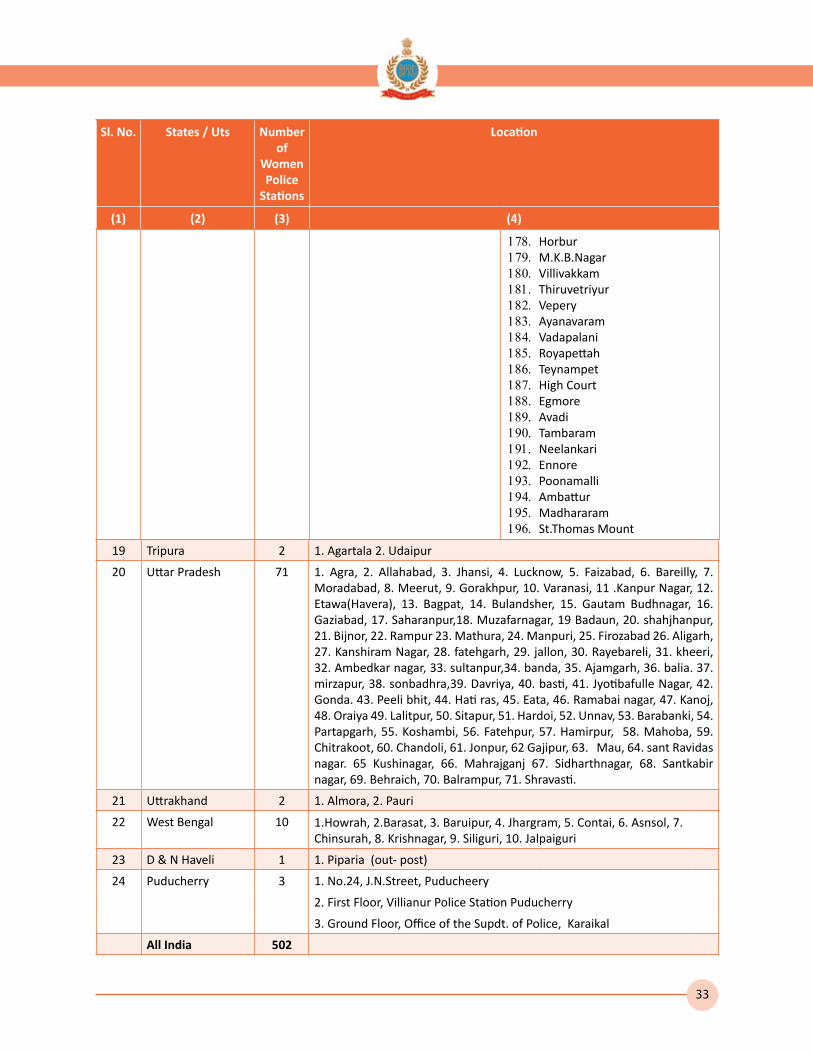
Women Police Stations
There were a total of 502 Women Police
Stations in the country as on 01.01.2013. An overwhelming majority of these i.e. about 39.04% were functioning in Tamil Nadu State alone with a total of 196 Women Police Stations. It was followed by Uttar Pradesh with 71, Bihar with 40 and Andhra Pradesh with 32 Women Police Stations. Details are given in Table – 2.6. (Page No. 27-33)
However, there were 11 such States/UTs where there were no separate Women Police Stations at all as on 01.01.2013.
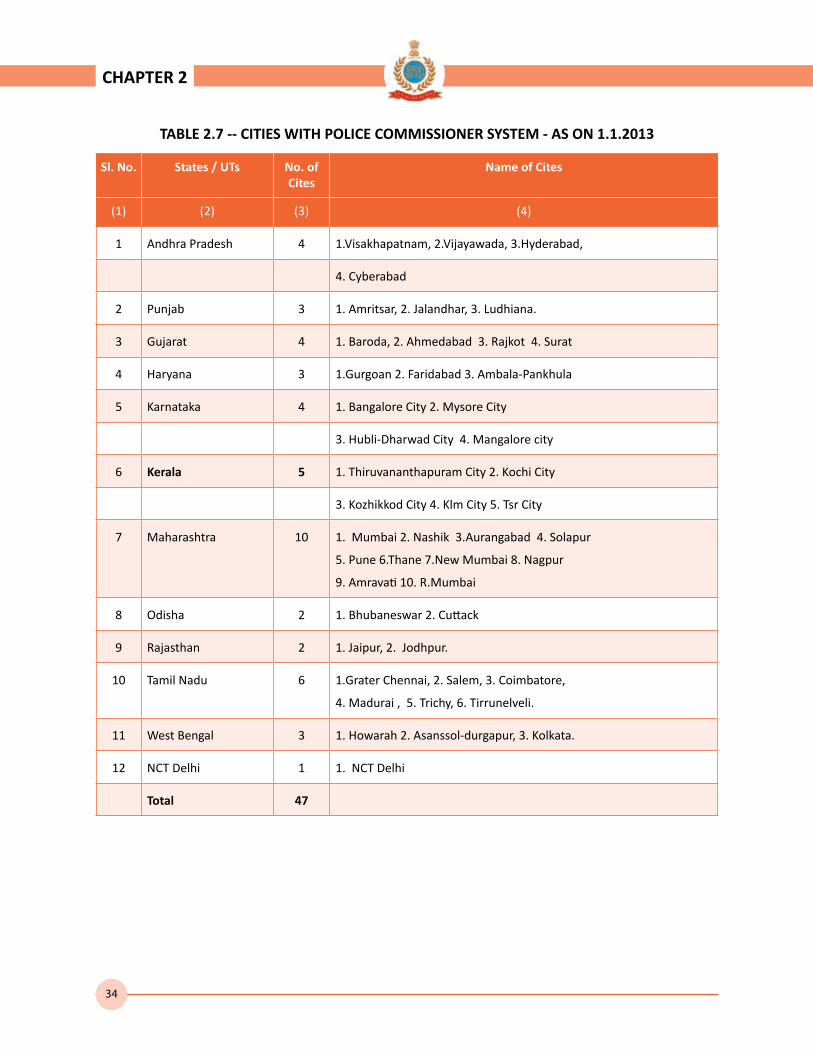
Cities with Police Commissionerates
The number of Cities where Police Commissioner System is functioning in the country was 47 as on 01.01.2013. The highest numbers of 10 cities with Police Commissioner System was in Maharashtra, followed by 6 in Tamil Nadu and 5 in Kerala.
Details are given in Table 2.7 (Page No. 34)
CHAPTER 2

21
TABLE 2.1-- NUMBER OF POLICE ZONES, RANGES, DISTRICTS, SUB-DIVISIONS, CIRCLES AND POLICE STATIONS - AS ON 1.1.2013
Sl. No. States / UTs. Police Zones Police Ranges
Police Distts. Police Sub-Div.
Police Circles Police Stations
(1) (2) (3) (4) (5) (6) (7) (8)
1 Andhra Pradesh 6 9 29 164 446 1679
2 Arunachal Pradesh 1 3 18 9 18 72
3 Assam 0 6 28 28 48 340
4 Bihar 4 11 40 108 210 969
5 Chhattisgarh 0 5 28 86 0 416
6 Goa 0 0 2 8 0 25
7 Gujarat 0 7 33 96 85 593
8 Haryana 0 4 21 47 0 269
9 Himachal Pradesh 0 3 13 0 0 103
10 Jammu & Kashmir 2 7 25 46 0 215
11 Jharkhand 5 7 26 40 138 439
12 Karnataka 0 6 30 131 230 916
13 Kerala 2 4 19 54 197 468
14 Madhya Pradesh 11 15 50 143 0 1003
15 Maharashtra 35 8 37 384 0 1054
16 Manipur 3 4 9 26 0 80
17 Meghalaya 0 2 11 5 19 39
18 Mizoram 0 2 8 17 0 38
19 Nagaland 1 3 11 16 9 72
20 Odisha 0 8 36 111 0 583
21 Punjab 4 7 24 118 0 381
22 Rajasthan 9 7 36 0 197 817
23 Sikkim 1 1 4 11 0 28
24 Tamil Nadu 4 12 33 241 331 1324
25 Tripura 0 2 8 27 0 71
26 Uttar Pradesh 8 18 75 0 380 1515
27 Uttarakhand 0 4 13 0 35 125
28 West Bengal 3 8 23 65 87 442
29 A&N Islands 0 0 3 5 1 24
30 Chandigarh 0 0 1 3 0 11
31 D&N Haveli 0 0 1 1 0 2
32 Daman & Diu 0 0 2 2 0 5
33 Delhi 0 4 11 54 0 180
34 Lakshadweep 1 1 1 1 1 16
35 Puducherry 0 0 2 6 15 46
All India 100 178 711 2,053 2,447 14,360
CHAPTER 2
22
TABLE 2.2-- NUMBER OF SANCTIONED AND ACTUAL POLICE STATIONS - AS ON 1.1.2013 (RURAL AND URBAN)
Sl. No. States / UTs. Sanctioned Actual
Rural Urban Railway Total Rural Urban Railway Total
(1) (2) (3) (4) (5) (6) (7) (8) (9) (10)
1 Andhra Pradesh 1145 488 46 1679 1145 488 46 1679
2 Arunachal Pradesh 53 19 0 72 53 19 0 72
3 Assam 195 132 13 340 195 132 13 340
4 Bihar 701 229 39 969 701 229 39 969
5 Chhattisgarh 318 91 7 416 288 91 5 384
6 Goa 14 9 2 25 14 9 2 25
7 Gujarat 469 102 22 593 445 95 22 562
8 Haryana 167 86 16 269 167 86 16 269
9 Himachal Pradesh 64 37 2 103 64 37 2 103
10 Jammu & Kashmir 131 73 11 215 131 73 11 215
11 Jharkhand 301 115 23 439 253 116 23 392
12 Karnataka 533 365 18 916 533 365 18 916
13 Kerala 373 82 13 468 373 82 13 468
14 Madhya Pradesh 649 332 22 1003 649 332 22 1003
15 Maharashtra 767 248 39 1054 767 248 39 1054
16 Manipur 66 14 0 80 42 14 0 56
17 Meghalaya 26 13 0 39 26 13 0 39
18 Mizoram 27 11 0 38 27 11 0 38
19 Nagaland 56 15 1 72 56 15 1 72
20 Odisha 361 208 14 583 359 202 14 575
21 Punjab 200 170 11 381 200 170 11 381
22 Rajasthan 435 357 25 817 435 357 25 817
23 Sikkim 20 8 0 28 20 8 0 28
24 Tamil Nadu 750 530 44 1324 750 530 44 1324
25 Tripura 46 20 5 71 46 20 5 71
26 Uttar Pradesh 1102 348 65 1515 1102 348 65 1515
27 Uttarakhand 83 38 4 125 83 38 4 125
28 West Bengal 240 157 45 442 240 157 45 442
29 A&N Islands 19 5 0 24 19 5 0 24
30 Chandigarh 0 11 0 11 0 11 0 11
31 D&N Haveli 1 1 0 2 0 3 0 3
32 Daman & Diu 0 5 0 5 0 5 0 5
33 Delhi 0 167 13 180 0 167 13 180
34 Lakshadweep 16 0 0 16 13 0 0 13
35 Puducherry 19 27 0 46 19 27 0 46
All India 9,347 4,513 500 14360 9,215 4,503 498 14216
CHAPTER 2
23
TABLE 2.3 -- NUMBER OF SANCTIONED AND ACTUAL POLICE OUT-POSTS AS ON 1.1.2013 (RURAL AND URBAN)
Sl. No. States / UTs. Sanctioned Actual
Rural Urban Total Rural Urban Total
(1) (2) (3) (4) (5) (6) (7) (8)
1 Andhra Pradesh 59 84 143 59 84 143
2 Arunachal Pradesh 5 2 7 13 3 16
3 Assam 150 71 221 150 71 221
4 Bihar 230 231 461 230 231 461
5 Chhattisgarh 95 13 108 75 14 89
6 Goa 26 7 33 26 7 33
7 Gujarat 609 646 1255 601 642 1243
8 Haryana 118 204 322 118 204 322
9 Himachal Pradesh 69 26 95 69 26 95
10 Jammu & Kashmir 262 24 286 262 24 286
11 Jharkhand 132 131 263 115 108 223
12 Karnataka 267 10 277 267 10 277
13 Kerala 14 10 24 14 10 24
14 Madhya Pradesh 383 101 484 383 101 484
15 Maharashtra 493 758 1251 440 755 1195
16 Manipur 36 8 44 19 3 22
17 Meghalaya 43 4 47 43 4 47
18 Mizoram 10 3 13 10 3 13
19 Nagaland 26 0 26 26 0 26
20 Odisha 477 124 601 477 124 601
21 Punjab 100 54 154 100 54 154
22 Rajasthan 518 602 1120 518 602 1120
23 Sikkim 30 18 48 30 18 48
24 Tamil Nadu 55 5 60 34 2 36
25 Tripura 28 9 37 28 9 37
26 Uttar Pradesh 348 50 398 347 50 397
27 Uttarakhand 165 85 250 165 85 250
28 West Bengal 277 174 451 277 174 451
29 A&N Islands 42 0 42 35 0 35
30 Chandigarh 0 0 0 4 12 16
31 D&N Haveli 17 1 18 17 1 18
32 Daman & Diu 5 5 10 5 5 10
33 Delhi 0 23 23 0 55 55
34 Lakshadweep 3 0 3 3 0 3
35 Puducherry 6 2 8 6 2 8
All India 5,098 3,485 8,583 4,966 3,493 8,459
CHAPTER 2
24
TABLE 2.4 --NUMBER OF SPECIAL PURPOSE POLICE STATIONS - AS ON 1.1.2013Sl. No. States / UTs. Crime Against
SCs/STs/ Weaker Sections
Crime Against Children
Anti corruption/ Vigilance
Coastal Security
Criminal Investigation
Deptt.
(1) (2) (3) (4) (5) (6) (7)
1 Andhra Pradesh 0 0 1 6 2
2 Arunachal Pradesh 0 0 1 0 0
3 Assam 0 0 1 0 1
4 Bihar 40 1 0 0
5 Chhattisgarh 19 0 0 0 1
6 Goa 0 0 1 3 1
7 Gujarat 0 0 0 22 23
8 Haryana 0 0 5 0 0
9 Himachal Pradesh 0 0 12 0 1
10 Jammu & Kashmir 0 0 2 0 2
11 Jharkhand 44 13 0 0 6
12 Karnataka 0 0 82 9 0
13 Kerala 0 0 0 8 1
14 Madhya Pradesh 50 0 1 0 1
15 Maharashtra 0 0 0 19 0
16 Manipur 0 0 1 0 0
17 Meghalaya 0 0 0 0 0
18 Mizoram 0 0 1 0 2
19 Nagaland 0 0 0 0 0
20 Odisha 0 0 6 5 1
21 Punjab 0 0 0 0 0
22 Rajasthan 0 0 1 0 0
23 Sikkim 0 0 1 0 1
24 Tamil Nadu 36 0 35 12 35
25 Tripura 0 0 0 0 0
26 Uttar Pradesh 0 0 0 0 0
27 Uttarakhand 0 0 3 0 0
28 West Bengal 0 0 0 6 0
29 A&N Islands 0 0 1 21 1
30 Chandigarh 0 1 1 0 1
31 D&N Haveli 0 0 0 0 0
32 Daman & Diu 0 0 0 1 0
33 Delhi 0 0 0 0 0
34 Lakshadweep 0 0 0 0 0
35 Pondicherry 3 0 1 1 1
All India 192 14 158 113 81
CHAPTER 2
NA :- Not Available
25
TABLE 2.4 -- (Continued...)Sl. No. States / UTs. Economic
Offiences Cyber Crimes
Crime Against Wild Life
Narcotics and Drug
Trafficking
Any Other including counter
Intelligence
(1) (2) (8) (9) (10) (11) (12)
1 Andhra Pradesh 0 2 0 0 3
2 Arunachal Pradesh 1 1 0 0 0
3 Assam 1 0 0 0 2
4 Bihar 0 1 0 0 0
5 Chhattisgarh 1 1 0 0 0
6 Goa 1 0 0 1 0
7 Gujarat 0 0 0 0 0
8 Haryana 0 0 0 0 8
9 Himachal Pradesh 0 0 0 0 0
10 Jammu & Kashmir 0 0 0 0 7
11 Jharkhand 0 0 0 9 0
12 Karnataka 0 1 0 0 41
13 Kerala 0 1 0 0 9
14 Madhya Pradesh 1 0 0 1 0
15 Maharashtra 0 0 0 0 6
16 Manipur 1 0 0 1 0
17 Meghalaya 0 0 0 0 0
18 Mizoram 0 0 0 1 0
19 Nagaland 0 0 0 0 0
20 Odisha 2 1 0 0 0
21 Punjab 0 1 0 1 0
22 Rajasthan 1 1 0 0 2
23 Sikkim 0 0 0 0 0
24 Tamil Nadu 15 7 0 15 142
25 Tripura 0 0 0 0 0
26 Uttar Pradesh 0 0 0 0 0
27 Uttarakhand 0 0 0 0 0
28 West Bengal 0 0 0 0 0
29 A&N Islands 0 0 0 0 0
30 Chandigarh 1 1 0 0 1
31 D&N Haveli 0 1 0 0 0
32 Daman & Diu 0 0 0 0 0
33 Delhi 1 0 0 0 3
34 Lakshadweep 0 0 0 0 0
35 Puducherry 0 0 0 0 10
All India 26 19 0 29 234
CHAPTER 2
NA :- Not Available

26
TABLE 2.5 -- NUMBER OF ARMED POLICE BATTALIONS - AS ON 1.1.2013Sl. No. States / UTs. Number of Armed Battalions
(1) (2) (3) (4)
1 Andhra Pradesh 17
2 Arunachal Pradesh 5
3 Assam 28
4 Bihar 15 3 COYS
5 Chhattisgarh 18
6 Goa 2
7 Gujarat 18
8 Haryana 9
9 Himachal Pradesh 7
10 Jammu & Kashmir 31
11 Jharkhand 15
12 Karnataka 12
13 Kerala 9
14 Madhya Pradesh 21
15 Maharashtra 16
16 Manipur 15
17 Meghalaya 6
18 Mizoram 8
19 Nagaland 16
20 Odisha 19
21 Punjab 20
22 Rajasthan 15
23 Sikkim 4
24 Tamil Nadu 16
25 Tripura 12
26 Uttar Pradesh 33
27 Uttarakhand 5
28 West Bengal 18
29 A&N Islands 1 3 Coys
30 Chandigarh 1 5 COYS
31 D&N Haveli 0
32 Daman & Diu 0
33 Delhi 15
34 Lakshadweep 0
35 Puducherry 1 5 coys
All India 428
430+4 Coys
CHAPTER 2

27
TABLE-2.6 --STATE/UT-WISE NUMBER OF WOMEN POLICE STATIONS AND THEIR LOCATIONS - AS ON 1.1.2013
CHAPTER 2
Sl. No.
States / Uts Number of
Women Police
Stations
Location
(1) (2) (3) (4)
1 Andhra Pradesh 32 1.Srikakulam, 2. Vizianagaram, 3. VSP City, 4. VSP Rural,
5. West Godavri, 6. East Godavri, 7. Rajahmundry Urban, 8. Krishna,
9. Vijayawada City, 10. Guntur, 11. Guntur Urban, 12. Nellore,
13. Prakasam, 14. Kurnool, 15. Kadapa, 16. Anantapur, 17. Chittoor,
18. Tirupati Urban, 19. Adilabad, 20. Karimnagar, 21. Khammam,
22. Mahabubnagar, 23. Medak, 24. Nalgonda, 25. Nizamabad,
26. Ranga Reddy, 27. Warangal Urban, 28. Warangal Rural,
29. Cyberabad, 30. Hyderabad City (Three).
2 Assam 1 1. Guwahati
3 Bihar 40 1.Patna, 2. Bihar Sharif, 3.Aara ,4.Buxar, 5.Bhabhua,6.Sasaram,
7.Orangabad, 8. Gaya, 9. Arwal, 10. Jahanabad, 11. Nawada,
12. Shekhpura, 13. Lakhisarai, 14. Jamui, 15. Munger, 16.Bagusarai,
17. Khagariya, 18. Navgachhiya, 19. Bhagalpur, 20. Banka, 21. Purniya,
22. Katihar, 23.Kishanganj, 24.Arariya, 25.Madhepura, 26.Saharsa,
27.Supol, 28. Madhubani, 29.Lahariya sarai(Darbhanga), 30. Samastipur,
31. Hazipur(vaishali), 32. Muzaffarpur, 33.Shivhar, 34.Sitamani,
35.Motihari,(East champaran), 36. Batiya(west champaran),
37.Bagaha, 38. Gopalgang, 39. Shiwan, 40.Chhapra(Saran),
4 Chhattisgarh 4 1. Raipur, 2.Durg, 3.Bilaspur, 4. Sarguja,
5 Goa 1 1. Panaji,
6 Gujarat 32 1. Ahemdabad city (East), 2Ahemdabad (West)3. Anand,4. Rajkot city, 5. Surat city
6. Bhavnagar, 7. Baroda city, 8. Junagadh,9. Jamnagar
10. Rajkot rural, 11 Surat rural, 12 Bharuch, 13 Ahemdabad rural
14. Kheda (Nadiad), 15 Mehsana, 16. Gandhinagar, 17 kutch-bhuj (West)
18. Vadodara rural, 19 Valsad, 20 Navasari,
21. Sabarkantha, 22 Patan, 23 Banaskantha, 24 Kutch, Gandhidham.
25. Surendranagar, 26. Amreli, 27. Porbander, 28. Panchmahal.
29. Narmada, 30. Dahod, 31. Ahwa-Dang, 32. Tapi-Vyara.
7 Haryana 2 1. Sonipat 2. Khanpur Kalan (Sonipat)
8 Jammu & Kashmir 2 1. Ram Bagh,Srinagar,
2. Canal Road, Jammu

28
CHAPTER 2
Sl. No.
States / Uts Number of
Women Police
Stations
Location
(1) (2) (3) (4)
9 Jharkhand 22 1. Ranchi, 2. Gumla, 3. Lohardaga, 4. Simdega, 5. Jamshdpur 6. Saraikela, 7. Chaibasa, 8. Palamu, 9. Garhwa 10. Latehar, 11 Hazaribag, 12. Chatra, 13. Kodarma, 14. Giridih, 15 Bokaro, 16. Dhanbad, 17. Dumka18. Deoghar, 19. Godda, 20. Pakur, 21 Sahebganj, 22. Jamtara.
10 Karnataka 10 1. Bangalore city (Two), 3. Mangalore,
4. Hubli-Dharwad City, 5. Mysore City,
6. Belgaum, 7. Shimoga, 8. Gulbarga,
9. Udupi, 10. Davanagere
11 Kerala 4 1. Thiruvananthapuram city, 2. Kochi City,
3. Kozhikkod City, 4. Thrissur City.
12 Madhya Pradesh 9 1. Bhopal, 2. Indore, 3. Gwalior, 4. Jabalpur
5. Sagar, 6. Rewa, 7. Satna, 8. Ujjain, 9. Ratlam
13 Manipur* 9 1. Imphal West, 2. Imphal East,3. Thoubal
4. Bishnupur, 5. Churachandpur, 6. Chandel, 7. Senapati
8. Tamenglong, 9. Ukhrul.
14 Meghalaya 7 1. Shillong, 2. Nongstoin, 3. Jowai, 4. Williamnagar,
5. Tura, 6. Baghmara, 7. Umiam
15 Odisha 6 1. Sambalpur, 2. Rourkela, 3. Cuttack,
4. Bhubaneswar, 5. Joypur, 6. Berhampur
16
Punjab 7 1. Amritsar 2. Ludhiana City, 3. Ludhiana(R), 4. Jalandhar 5. Patiala 6. Bathinda, 7. SAS Nagar
17
Rajasthan 29 1. Jaipur East, 2. Jaipur West, 3. Jaipur North, 4. Jaipur South
5. Sikar, 6. Alwar, 7. Bharatpur, 8. Sawai Madhopur, 9. Ajmer
10. Bhilwara, 11. Nagour, 12. Jodhpur East, 13. Jodhpur Rural
14. Sirohi, 15. Jalore, 16. Pali, 17. Bikaner, 18. Ganganagar
19. Churu, 20. Hanumangarh, 21. Kota city, 22. kota Rural 23. Baran
24. Bundi, 25. Jhalawar, 26. Udaipur, 27. Rajasamand, 28 Banswara
29. Chitttorgarh.
29
CHAPTER 2
Sl. No. States / Uts Number of
Women Police
Stations
Location
(1) (2) (3) (4)
18. Tamil Nadu 196 Kancheepuram Kancheepuram1.Sri Perumpudur2.Chengalpattu3.Melmaruvathur4.Mahabalipuram5.
Thiruvallur Tiruthani6.Thiruvalur7.Uthukottai8.Ponneri9.
Vellore Vellore10.Thiruppathur11.Arakonam12.Gudiyatham13.Vaniyampadi14.Ranipet 15.Ambur16.
Thiruvannamalai Thiruvannamalai17.Arani18.Vandhavasi19.Chengam20.Polur21.Cheyyar22.
Villupuram Villupuram23.Tirukovilur24.Tindivanam25.Kallakurichi26.Gingee27.Kotakuppum28.
Cuddalore Cuddalore29.Chidambaram30.Panruti31.Viruthachalam32.Neyvli33.Sethiyathopu34.
Trichy City COP Fort Range35.Cantonment36.Srirangam37.Golden Rock38.
Trichy Lalkudi39.Trichy40.Musri41.Manapari42.
Perambalur Ariyalur43.Perambalur44.Jayamkondam45.

30
CHAPTER 2
Sl. No. States / Uts Number of
Women Police
Stations
Location
(1) (2) (3) (4)
Karur Karur 46.Kulithalai47.
Pudukottai Pudukottai48.Aranthangi49.Ponnamaravathi50.Keranur51.Alangudi52.
Thanjavur Thanjavur53.Kumbakonam54.Thiruvaiyaru55.Pattukottai56.Papanasam57.Vallam58.
Nagapatinam Nagapatinam59.Myladudurai60.Sirkazhi61.Vedaranayam62.
Thiruvarur Thiruvarur63.Mannarkudi64.Thiruthuraipoondi65.Nannelam66.
Coimbatore City COP Kattur67.R.S. Puram68.Coimbatur Central69.
Coimbatore Thiruppur70.Udumalpet71.Pollachi72.Thudiyalur73.Podanur74.Avinashi75.Palladam76.
Erode Erode77.Dharapuram78.Kangeyam79.Gobichettipallayam80.Bhavani81.Sathiyamangalam82.
The Niligris The Niligris83.Gudalur84.Coonur85.Uthagamandalam Rural86.Devala87.
31
Sl. No. States / Uts Number of
Women Police
Stations
Location
(1) (2) (3) (4)
Salem Salem Rural88.Mettur89.Athur90.Omalur91.Sankari92.
Namakkal Namakkal93.Trichengode94.Rasipuram95.Velur96.
Dharampuri Dharampurai97.Harur98.Pennagaram99.
Krishnagiri Krishnagiri100.Bargur101.Hosur102.Denkankottai103.
Salem City COP Salem Town104.Suramangalam105.Ammapet106.
Madurai City COP Thallakulam107.Thilagar Thidal108.Madurai Town109.
Tirunelveli City COP Thirunelveli110.Thirunelveli Town111.
Madurai Thiruparunkundra112.Usilampatti113.Mellur114.Samayanallur115.Thirumangalam116.
Virudhunagar Virudhunagar117.Rajayapalayam118.Sivagasi119.Aruppukottai120.Sathur121.Srivalliputhur122.
Dindigul Dindigul123.Palani124.Kodaikannal125.Nilakottai126.Vadamadurai127.Ottanchatiram128.
Theni Theni129.Andipatti130.Bodinayakanur131.Uthamapalayam132.

32
Sl. No. States / Uts Number of
Women Police
Stations
Location
(1) (2) (3) (4)
Ramnad Ramanathapuram133.Kamuthi134.Paramakudi135.Keelakari136.Thiruvathanai137.Rameswaram138.
Sivaganagai Sivagangai139.Karikudi140.Thirupathur141.Manamadurai142.Devakottai143.
Thirunelveli Thenkasi144.Valliyur145.Sankarankoil146.Ambasamudram147.Alankulam148.Thirunelveli Rural149.Nanguneri150.
Thoothukudi Thoothukudi151.Kovilpatti152.Srivaikundam153.Triuchendur154.Pudukottai155.Kadambur156.Villathikulam157.
Kanyakumari Nagercoil158.Kuzhithurai159.Kanniya kumari160.Colachel161.
Greater Chennai Thousandlights162.Kothavalsavadi163.Adyar164.Washermenpet165.Anna Nagar166.Guindy167.Ashok Nagar168.T. Nagar169.Sembium170.Pulianthope171.Rayapuram172.Thirumangalam173.Triplicane174.Kilpauk175.Mylapore176.Saidapet177.
33
Sl. No. States / Uts Number of
Women Police
Stations
Location
(1) (2) (3) (4)
Horbur178.M.K.B.Nagar179.Villivakkam180.Thiruvetriyur181.Vepery182.Ayanavaram183.Vadapalani184.Royapettah185.Teynampet186.High Court187.Egmore188.Avadi189.Tambaram190.Neelankari191.Ennore192.Poonamalli193.Ambattur194.Madhararam195.St.Thomas Mount196.
19 Tripura 2 1. Agartala 2. Udaipur
20 Uttar Pradesh 71 1. Agra, 2. Allahabad, 3. Jhansi, 4. Lucknow, 5. Faizabad, 6. Bareilly, 7. Moradabad, 8. Meerut, 9. Gorakhpur, 10. Varanasi, 11 .Kanpur Nagar, 12. Etawa(Havera), 13. Bagpat, 14. Bulandsher, 15. Gautam Budhnagar, 16. Gaziabad, 17. Saharanpur,18. Muzafarnagar, 19 Badaun, 20. shahjhanpur, 21. Bijnor, 22. Rampur 23. Mathura, 24. Manpuri, 25. Firozabad 26. Aligarh, 27. Kanshiram Nagar, 28. fatehgarh, 29. jallon, 30. Rayebareli, 31. kheeri, 32. Ambedkar nagar, 33. sultanpur,34. banda, 35. Ajamgarh, 36. balia. 37. mirzapur, 38. sonbadhra,39. Davriya, 40. basti, 41. Jyotibafulle Nagar, 42. Gonda. 43. Peeli bhit, 44. Hati ras, 45. Eata, 46. Ramabai nagar, 47. Kanoj, 48. Oraiya 49. Lalitpur, 50. Sitapur, 51. Hardoi, 52. Unnav, 53. Barabanki, 54. Partapgarh, 55. Koshambi, 56. Fatehpur, 57. Hamirpur, 58. Mahoba, 59. Chitrakoot, 60. Chandoli, 61. Jonpur, 62 Gajipur, 63. Mau, 64. sant Ravidas nagar. 65 Kushinagar, 66. Mahrajganj 67. Sidharthnagar, 68. Santkabir nagar, 69. Behraich, 70. Balrampur, 71. Shravasti.
21 Uttrakhand 2 1. Almora, 2. Pauri
22
West Bengal 10 1.Howrah, 2.Barasat, 3. Baruipur, 4. Jhargram, 5. Contai, 6. Asnsol, 7. Chinsurah, 8. Krishnagar, 9. Siliguri, 10. Jalpaiguri
23 D & N Haveli 1 1. Piparia (out- post)
24
Puducherry 3 1. No.24, J.N.Street, Puducheery
2. First Floor, Villianur Police Station Puducherry
3. Ground Floor, Office of the Supdt. of Police, Karaikal
All India 502
34
TABLE 2.7 -- CITIES WITH POLICE COMMISSIONER SYSTEM - AS ON 1.1.2013
Sl. No. States / UTs No. of Cites
Name of Cites
(1) (2) (3) (4)
1 Andhra Pradesh 4 1.Visakhapatnam, 2.Vijayawada, 3.Hyderabad,
4. Cyberabad
2 Punjab 3 1. Amritsar, 2. Jalandhar, 3. Ludhiana.
3 Gujarat 4 1. Baroda, 2. Ahmedabad 3. Rajkot 4. Surat
4 Haryana 3 1.Gurgoan 2. Faridabad 3. Ambala-Pankhula
5 Karnataka 4 1. Bangalore City 2. Mysore City
3. Hubli-Dharwad City 4. Mangalore city
6 Kerala 5 1. Thiruvananthapuram City 2. Kochi City
3. Kozhikkod City 4. Klm City 5. Tsr City
7 Maharashtra 10 1. Mumbai 2. Nashik 3.Aurangabad 4. Solapur
5. Pune 6.Thane 7.New Mumbai 8. Nagpur
9. Amravati 10. R.Mumbai
8 Odisha 2 1. Bhubaneswar 2. Cuttack
9 Rajasthan 2 1. Jaipur, 2. Jodhpur.
10 Tamil Nadu 6 1.Grater Chennai, 2. Salem, 3. Coimbatore,
4. Madurai , 5. Trichy, 6. Tirrunelveli.
11 West Bengal 3 1. Howarah 2. Asanssol-durgapur, 3. Kolkata.
12 NCT Delhi 1 1. NCT Delhi
Total 47
CHAPTER 2
35
STATEs/UTs & CAPFs POLICE STRENGTH
State Wise Data on:
• Sanctioned and Actual Police Strength (Civil + Armed)
• Police – Population & Police – Area Ratio
• Officers to Constabulary Ratio
• Women Police Strength (Civil + Armed)
• Traffic Police Strength
• Sanctioned & Actual Strength of Special Branch dealing with Intelligence.
• Sanctioned & Actual Strength of CID of Crime Branch
• Sanctioned & Actual Strength of Special Task Force
• Sanctioned Strength of civil & Armed Police in Metro cities with Police Commissioner System.
• Sanctioned & Actual Strength of Some Central Armed Police Forces (CAPFs)
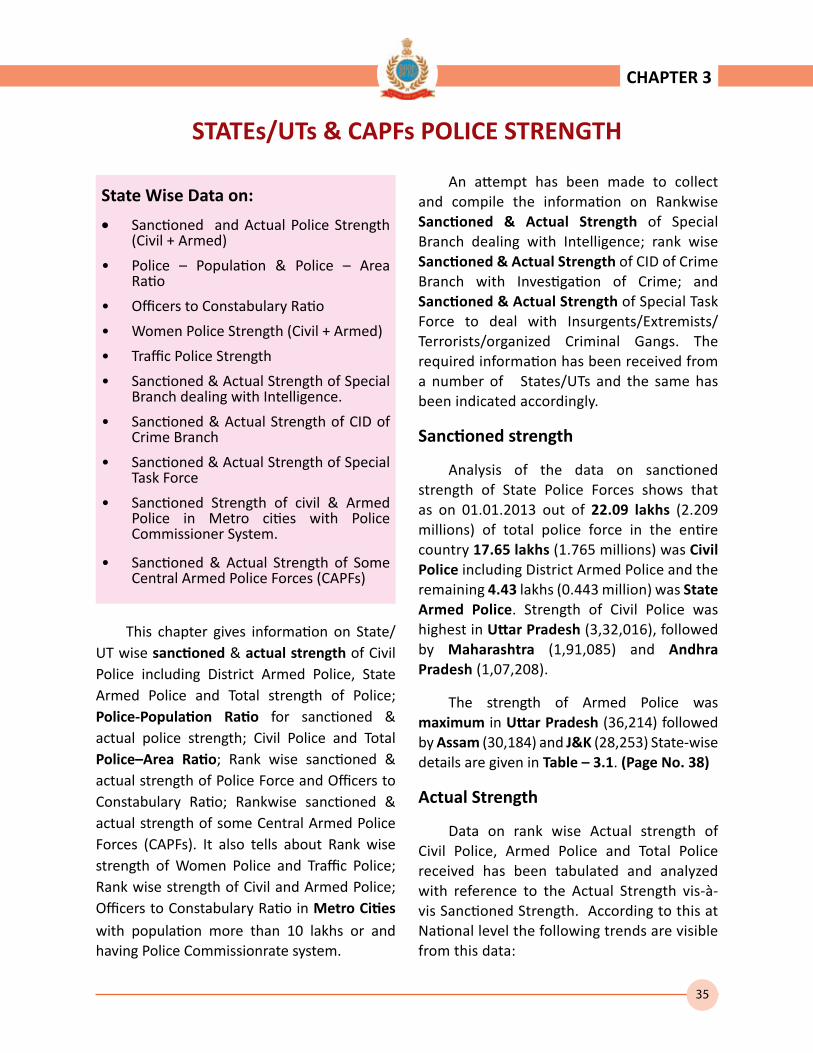
This chapter gives information on State/UT wise sanctioned & actual strength of Civil Police including District Armed Police, State Armed Police and Total strength of Police; Police-Population Ratio for sanctioned & actual police strength; Civil Police and Total Police–Area Ratio; Rank wise sanctioned & actual strength of Police Force and Officers to Constabulary Ratio; Rankwise sanctioned & actual strength of some Central Armed Police Forces (CAPFs). It also tells about Rank wise strength of Women Police and Traffic Police; Rank wise strength of Civil and Armed Police; Officers to Constabulary Ratio in Metro Cities with population more than 10 lakhs or and having Police Commissionrate system.
An attempt has been made to collect and compile the information on Rankwise Sanctioned & Actual Strength of Special Branch dealing with Intelligence; rank wise Sanctioned & Actual Strength of CID of Crime Branch with Investigation of Crime; and Sanctioned & Actual Strength of Special Task Force to deal with Insurgents/Extremists/Terrorists/organized Criminal Gangs. The required information has been received from a number of States/UTs and the same has been indicated accordingly.
Sanctioned strength
Analysis of the data on sanctioned strength of State Police Forces shows that as on 01.01.2013 out of 22.09 lakhs (2.209 millions) of total police force in the entire country 17.65 lakhs (1.765 millions) was Civil Police including District Armed Police and the remaining 4.43 lakhs (0.443 million) was State Armed Police. Strength of Civil Police was highest in Uttar Pradesh (3,32,016), followed by Maharashtra (1,91,085) and Andhra Pradesh (1,07,208).
The strength of Armed Police was maximum in Uttar Pradesh (36,214) followed by Assam (30,184) and J&K (28,253) State-wise details are given in Table – 3.1. (Page No. 38)
Actual Strength
Data on rank wise Actual strength of Civil Police, Armed Police and Total Police received has been tabulated and analyzed with reference to the Actual Strength vis-à-vis Sanctioned Strength. According to this at National level the following trends are visible from this data:
CHAPTER 3

36
Sr. No.
Items Sanctioned Actual
(i) Civil Police per lakh of Population
145.02 106.79
(ii) Total Police per lakh of Population
181.47 136.42
(iii) Civil Police per 100 Sq. Kms. of Area
55.75 41.05
(iv) Total Police per 100 Sq. kms. of Area
69.76 52.45
State-wise details are given in Table – 3.2 (Page No.
39)
Total Police – Population Ratio
The total Police – Population Ratio {total sanctioned number of police personnel available per lakh (one hundred thousand) of state population} has shown wide variations across the country. Sparsely populated States of Manipur (1280), Mizoram (1099) and Nagaland (1060) have the maximum Police-Population Ratio as compared to national average of 181 police personnel per lakh (one hundred thousand) of population.
However, more populous states have relatively much less sanctioned strength of police force than warranted by their total population i.e. D&N Haveli (86) Bihar (88), West Bengal (120), Madhya Pradesh (122) Rajasthan (134) and Odisha (138) per one lakh of population. Details are given in Table – 3.2 (Page No. 39)
Total Police – Area Ratio
An important criteria for effective and efficient police working is the number of policemen available per 100 sq. km. – popularly known as Police – Area Ratio.
As expected smaller States/UTs have higher police-area ratio than bigger States. Consequently for sanctioned strength the
maximum number of policemen available per 100 sq. kms. as on 01.01.2013 was in Chandigarh (6906) followed by Delhi (5473) and Lakshadweep (1091).
This ratio is minimum in Arunachal Pradesh (15), Rajasthan (27) and Madhya Pradesh (29). Details are given in Table – 3.2. (Page No. 39)
Rank wise Sanctioned Strength & Officers to Constabulary Ratio
It is popularly known as teeth to tail ratio. It is an important indicator of the relative strength between rank and officers of a force. It is also an important criteria for management and planning for the correct composition of the Police Force. Officers include Police Officers of the rank of Assistant Sub-Inspector (ASI) and above and constabulary ranks include Head constables and Constables only.
This teeth to tail ratio as on 1.1.2013 for sanctioned strength of Civil Police was 1:5.8 while, for Armed Police was 1:12.0 and for total (civil + armed) police forces it was 1:6.6.
Details are given in Table – 3.4 (Page No. 44) and (3.5) (Page No. 45-48)
Year ASI & above
H.C. & Constables
Ratio
Civil Police 2,57,862 1,50,7542 1: 5.8
Armed Police 34,643 4,08,980 1: 12.0
Total 2,92,505 19,16,522 1: 6.6
Strength of Women Police
There were 97,518 women police personnel as on 01.01.2013, showing a increase of 13,039 (15.4%) women police personnel over the strength of 84,479 as on 01.01.2012. At States/UTs level the maximum 17,549 women police personnel were working
CHAPTER 3
37
in Maharashtra alone, followed by 16,206 in Tamil Nadu and 6,491 in Rajasthan. Details are given in Table – 3.7 (Page No. 53)
Strength of Civil & Armed Police in Metro cities
Out of all the metro cities in the country as on 1.1.2013, 47 such cities are having Police Commissioner System. These 47 metro cities have a total of 1,623 Police Stations. The rank wise strength of Civil Police personnel in all these cities was 3,31,898 and that of Armed Police was 64,723 of 33 metro cities. The maximum Civil Police strength 71,550 was in Delhi followed by 49,711 in Mumbai city and 16,531 in Greater Chennai. Maximum strength of Armed Police 9608 was in Delhi, followed by 9373 in Kolkata and 5974 in Chennai cities. The officers to constabulary ratio of Civil Police in total for all these metro cities works out to be 1:4.7 as against All India average of 1:5.8. Details are given in Table – 3.12 (Page No. 67) 3.13 (Page No.68) & 3.14. (Page No. 69)
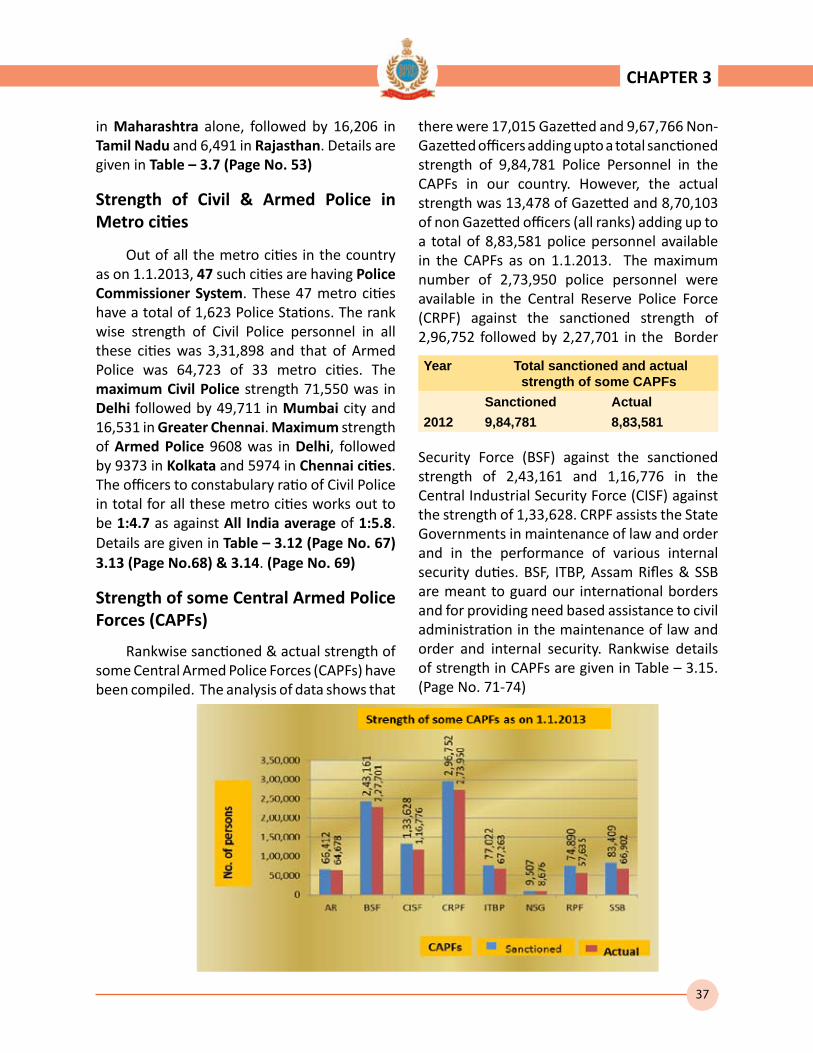
Strength of some Central Armed Police Forces (CAPFs)
Rankwise sanctioned & actual strength of some Central Armed Police Forces (CAPFs) have been compiled. The analysis of data shows that
there were 17,015 Gazetted and 9,67,766 Non-Gazetted officers adding upto a total sanctioned strength of 9,84,781 Police Personnel in the CAPFs in our country. However, the actual strength was 13,478 of Gazetted and 8,70,103 of non Gazetted officers (all ranks) adding up to a total of 8,83,581 police personnel available in the CAPFs as on 1.1.2013. The maximum number of 2,73,950 police personnel were available in the Central Reserve Police Force (CRPF) against the sanctioned strength of 2,96,752 followed by 2,27,701 in the Border
CHAPTER 3
Year Total sanctioned and actual strength of some CAPFs
Sanctioned Actual2012 9,84,781 8,83,581
Security Force (BSF) against the sanctioned strength of 2,43,161 and 1,16,776 in the Central Industrial Security Force (CISF) against the strength of 1,33,628. CRPF assists the State Governments in maintenance of law and order and in the performance of various internal security duties. BSF, ITBP, Assam Rifles & SSB are meant to guard our international borders and for providing need based assistance to civil administration in the maintenance of law and order and internal security. Rankwise details of strength in CAPFs are given in Table – 3.15. (Page No. 71-74)
Data on Actual Strength of Rank wise Women Police in Central Armed Police
Forces (CAPFs) has also been compiled and tabulated. On analysis, it was
observed that out of total 15,981 Women Police, the highest number of 5,793
(36.2%) women Police were available in Central Reserve Police Force(CRPF)
followed by 4,981 (31.2%) in Central Industrial Security Force (CISF). Details are
given in Table 3.16 (Page No……)

38
TABLE 3.1-SANCTIONED AND ACTUAL STRENGTH OF TOTAL POLICE FORCE-AS ON 1.1.2013
Sl. No. States / UTs. Strength of Civil & Distt. Armed Police
Strength of State Armed Police
Total Strength of State Police (Civil & Armed)
Sanctioned Actual Sanctioned Actual Sanctioned Actual
(1) (2) (3) (4) (5) (6) (7) (8)
1 Andhra Pradesh 107,208 82,040 22,017 14,938 129,225 96,978
2 Arunachal Pradesh 8,141 7,078 4,622 3,988 12,763 11,066
3 Assam 32,156 28,189 30,184 27,201 62,340 55,390
4 Bihar 69,615 54,617 18,298 14,045 87,913 68,662
5 Chhattisgarh 46,289 31,076 20,341 14,638 66,630 45,714
6 Goa 5,330 4,120 1,788 1,202 7,118 5,322
7 Gujarat 92,468 53,178 20,912 15,011 113,380 68,189
8 Haryana 56,979 35,400 4,702 3,841 61,681 39,241
9 Himachal Pradesh 10,860 9,705 6,325 4,636 17,185 14,341
10 Jammu & Kashmir 49,989 47,135 28,253 25,339 78,242 72,474
11 Jharkhand 55,951 43,013 17,713 14,348 73,664 57,361
12 Karnataka 78,855 62,894 12,314 8,001 91,169 70,895
13 Kerala 41,919 40,924 10,793 8,830 52,712 49,754
14 Madhya Pradesh 67,335 55,656 23,110 22,008 90,445 77,664
15 Maharashtra 191,085 181,344 18,356 14,307 209,441 195,651
16 Manipur 18,626 11,759 13,288 12,740 31,914 24,499
17 Meghalaya 7,344 6,033 5,797 5,283 13,141 11,316
18 Mizoram 4,655 4,432 6,591 5,789 11,246 10,221
19 Nagaland 8,808 8,777 15,474 15,451 24,282 24,228
20 Odisha 33,487 29,433 23,353 15,935 56,840 45,368
21 Punjab 59,782 45,416 19,696 16,710 79,478 62,126
22 Rajasthan 78,471 74,812 14,998 11,854 93,469 86,666
23 Sikkim 2,525 2,119 3,551 1,841 6,076 3,960
24 Tamil Nadu 99,643 81,483 15,437 12,927 115,080 94,410
25 Tripura 12,825 10,501 14,514 13,256 27,339 23,757
26 Uttar Pradesh 332,016 139,794 36,214 27,336 368,230 167,130
27 Uttarakhand 15,465 13,668 4,728 4,160 20,193 17,828
28 West Bengal 91,326 55,929 18,004 14,676 109,330 70,605
29 A&N Islands 3,707 3,387 725 384 4,432 3,771
30 Chandigarh 6,721 5,967 1,152 1,152 7,873 7,119
31 D&N Haveli 328 271 - - 328 271
32 Daman & Diu 410 246 - - 410 246
33 Delhi 71,550 67,030 9,608 8,500 81,158 75,530
34 Lakshadweep 349 276 - - 349 276
35 Puducherry 3,186 2,266 765 371 3,951 2,637
All India 1,765,404 1,299,968 443,623 360,698 2,209,027 1,660,666
CHAPTER 3
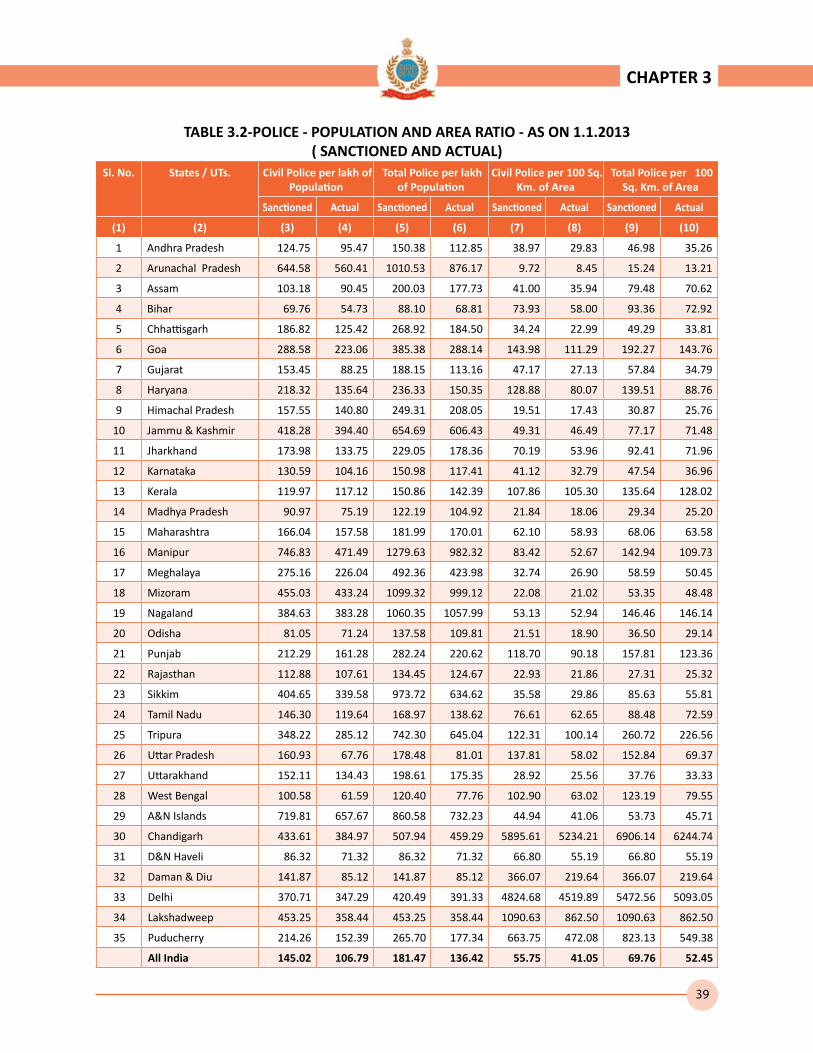
39
TABLE 3.2-POLICE - POPULATION AND AREA RATIO - AS ON 1.1.2013 ( SANCTIONED AND ACTUAL)
Sl. No. States / UTs. Civil Police per lakh of Population
Total Police per lakh of Population
Civil Police per 100 Sq. Km. of Area
Total Police per 100 Sq. Km. of Area
Sanctioned Actual Sanctioned Actual Sanctioned Actual Sanctioned Actual
(1) (2) (3) (4) (5) (6) (7) (8) (9) (10)
1 Andhra Pradesh 124.75 95.47 150.38 112.85 38.97 29.83 46.98 35.26
2 Arunachal Pradesh 644.58 560.41 1010.53 876.17 9.72 8.45 15.24 13.21
3 Assam 103.18 90.45 200.03 177.73 41.00 35.94 79.48 70.62
4 Bihar 69.76 54.73 88.10 68.81 73.93 58.00 93.36 72.92
5 Chhattisgarh 186.82 125.42 268.92 184.50 34.24 22.99 49.29 33.81
6 Goa 288.58 223.06 385.38 288.14 143.98 111.29 192.27 143.76
7 Gujarat 153.45 88.25 188.15 113.16 47.17 27.13 57.84 34.79
8 Haryana 218.32 135.64 236.33 150.35 128.88 80.07 139.51 88.76
9 Himachal Pradesh 157.55 140.80 249.31 208.05 19.51 17.43 30.87 25.76
10 Jammu & Kashmir 418.28 394.40 654.69 606.43 49.31 46.49 77.17 71.48
11 Jharkhand 173.98 133.75 229.05 178.36 70.19 53.96 92.41 71.96
12 Karnataka 130.59 104.16 150.98 117.41 41.12 32.79 47.54 36.96
13 Kerala 119.97 117.12 150.86 142.39 107.86 105.30 135.64 128.02
14 Madhya Pradesh 90.97 75.19 122.19 104.92 21.84 18.06 29.34 25.20
15 Maharashtra 166.04 157.58 181.99 170.01 62.10 58.93 68.06 63.58
16 Manipur 746.83 471.49 1279.63 982.32 83.42 52.67 142.94 109.73
17 Meghalaya 275.16 226.04 492.36 423.98 32.74 26.90 58.59 50.45
18 Mizoram 455.03 433.24 1099.32 999.12 22.08 21.02 53.35 48.48
19 Nagaland 384.63 383.28 1060.35 1057.99 53.13 52.94 146.46 146.14
20 Odisha 81.05 71.24 137.58 109.81 21.51 18.90 36.50 29.14
21 Punjab 212.29 161.28 282.24 220.62 118.70 90.18 157.81 123.36
22 Rajasthan 112.88 107.61 134.45 124.67 22.93 21.86 27.31 25.32
23 Sikkim 404.65 339.58 973.72 634.62 35.58 29.86 85.63 55.81
24 Tamil Nadu 146.30 119.64 168.97 138.62 76.61 62.65 88.48 72.59
25 Tripura 348.22 285.12 742.30 645.04 122.31 100.14 260.72 226.56
26 Uttar Pradesh 160.93 67.76 178.48 81.01 137.81 58.02 152.84 69.37
27 Uttarakhand 152.11 134.43 198.61 175.35 28.92 25.56 37.76 33.33
28 West Bengal 100.58 61.59 120.40 77.76 102.90 63.02 123.19 79.55
29 A&N Islands 719.81 657.67 860.58 732.23 44.94 41.06 53.73 45.71
30 Chandigarh 433.61 384.97 507.94 459.29 5895.61 5234.21 6906.14 6244.74
31 D&N Haveli 86.32 71.32 86.32 71.32 66.80 55.19 66.80 55.19
32 Daman & Diu 141.87 85.12 141.87 85.12 366.07 219.64 366.07 219.64
33 Delhi 370.71 347.29 420.49 391.33 4824.68 4519.89 5472.56 5093.05
34 Lakshadweep 453.25 358.44 453.25 358.44 1090.63 862.50 1090.63 862.50
35 Puducherry 214.26 152.39 265.70 177.34 663.75 472.08 823.13 549.38
All India 145.02 106.79 181.47 136.42 55.75 41.05 69.76 52.45
CHAPTER 3

40
TABLE 3.3 -- SANCTIONED & ACTUAL STRENGTH OF CIVIL POLICE INCLUDING DISTRICTS ARMED RESERVE POLICE - AS ON 1.1.2013
Sl. No. States / UTs. DGP/Spl.DGP Addl.DGP IGP DIG
Sanc-tioned
Actual Vacancy Sanc-tioned
Actual Vacancy Sanc-tioned
Actual Vacancy Sanc-tioned
Actual Vacancy
(1) (2) (3) (4) (5) (6) (7) (8) (9) (10) (11) (12) (13) (14)
1 Andhra Pradesh 4 4 0 20 19 1 22 17 5 29 21 8
2 Arunachal Pradesh 1 1 0 0 0 0 2 4 0 6 1 5
3 Assam 3 3 0 10 10 0 10 5 5 10 7 3
4 Bihar 3 4 0 8 13 0 21 20 1 23 22 1
5 Chhattisgarh 1 1 0 2 1 1 7 6 1 6 5 1
6 Goa 1 1 0 0 0 0 1 1 0 2 0 2
7 Gujarat 4 4 0 17 14 3 20 18 2 33 28 5
8 Haryana 7 3 4 9 9 0 20 14 6 14 8 6
9 Himachal Pradesh 1 2 0 7 5 2 20 13 7 14 13 1
10 Jammu & Kashmir 2 1 1 4 7 0 11 21 0 21 27 0
11 Jharkhand 1 2 0 6 10 0 13 10 3 14 12 2
12 Karnataka 5 5 0 21 18 3 29 28 1 24 24 0
13 Kerala 1 1 0 7 6 1 11 5 6 11 6 5
14 Madhya Pradesh 3 5 0 12 32 0 35 58 0 25 27 0
15 Maharashtra 5 5 0 23 22 1 45 43 2 38 34 4
16 Manipur 1 1 0 3 3 0 9 5 4 9 4 5
17 Meghalaya 1 1 0 7 5 2 6 4 2 7 4 3
18 Mizoram 1 1 0 1 1 0 1 1 0 7 3 4
19 Nagaland 1 1 0 2 2 0 7 6 1 12 7 5
20 Odisha 2 2 0 6 6 0 16 16 0 20 18 2
21 Punjab 3 1 2 9 9 0 29 27 2 20 13 7
22 Rajasthan 2 4 0 8 28 0 22 31 0 19 22 0
23 Sikkim 1 4 0 2 1 1 3 7 -4 4 2 2
24 Tamil Nadu 3 3 0 24 20 4 37 28 9 35 29 6
25 Tripura 1 1 0 1 1 0 4 5 0 7 2 5
26 Uttar Pradesh 10 10 0 36 30 6 56 33 23 61 35 26
27 Uttarakhand 1 2 0 2 2 0 5 4 1 9 5 4
28 West Bengal 8 8 0 25 22 3 43 27 16 56 38 18
29 A&N Islands 1 1 0 0 0 0 1 2 0 2 1 1
30 Chandigarh 0 0 0 0 0 0 1 1 0 1 1 0
31 D&N Haveli 0 0 0 0 0 0 0 0 0 1 1 0
32 Daman & Diu 0 0 0 0 0 0 0 0 0 1 1 0
33 Delhi 11 10 1 0 0 0 20 16 4 19 14 5
34 Lakshadweep 0 0 0 0 0 0 0 0 0 0 0 0
35 Puducherry 0 0 0 0 0 0 1 1 0 1 2 0
All India 89 92 8 272 296 28 528 477 97 561 437 136
Note: In vacancy columns, the States where the Rank wise Police Personnal are surplus, is taken as ‘0’
CHAPTER 3
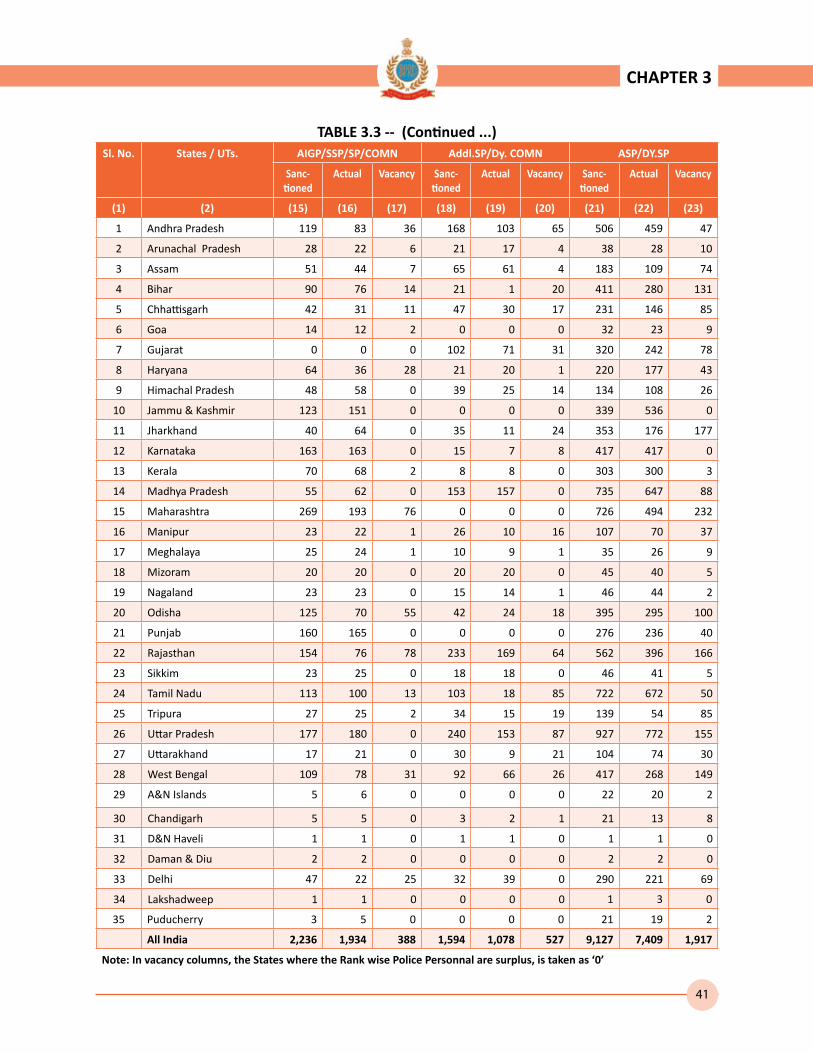
41
TABLE 3.3 -- (Continued ...)Sl. No. States / UTs. AIGP/SSP/SP/COMN Addl.SP/Dy. COMN ASP/DY.SP
Sanc-tioned
Actual Vacancy Sanc-tioned
Actual Vacancy Sanc-tioned
Actual Vacancy
(1) (2) (15) (16) (17) (18) (19) (20) (21) (22) (23)
1 Andhra Pradesh 119 83 36 168 103 65 506 459 47
2 Arunachal Pradesh 28 22 6 21 17 4 38 28 10
3 Assam 51 44 7 65 61 4 183 109 74
4 Bihar 90 76 14 21 1 20 411 280 131
5 Chhattisgarh 42 31 11 47 30 17 231 146 85
6 Goa 14 12 2 0 0 0 32 23 9
7 Gujarat 0 0 0 102 71 31 320 242 78
8 Haryana 64 36 28 21 20 1 220 177 43
9 Himachal Pradesh 48 58 0 39 25 14 134 108 26
10 Jammu & Kashmir 123 151 0 0 0 0 339 536 0
11 Jharkhand 40 64 0 35 11 24 353 176 177
12 Karnataka 163 163 0 15 7 8 417 417 0
13 Kerala 70 68 2 8 8 0 303 300 3
14 Madhya Pradesh 55 62 0 153 157 0 735 647 88
15 Maharashtra 269 193 76 0 0 0 726 494 232
16 Manipur 23 22 1 26 10 16 107 70 37
17 Meghalaya 25 24 1 10 9 1 35 26 9
18 Mizoram 20 20 0 20 20 0 45 40 5
19 Nagaland 23 23 0 15 14 1 46 44 2
20 Odisha 125 70 55 42 24 18 395 295 100
21 Punjab 160 165 0 0 0 0 276 236 40
22 Rajasthan 154 76 78 233 169 64 562 396 166
23 Sikkim 23 25 0 18 18 0 46 41 5
24 Tamil Nadu 113 100 13 103 18 85 722 672 50
25 Tripura 27 25 2 34 15 19 139 54 85
26 Uttar Pradesh 177 180 0 240 153 87 927 772 155
27 Uttarakhand 17 21 0 30 9 21 104 74 30
28 West Bengal 109 78 31 92 66 26 417 268 149
29 A&N Islands 5 6 0 0 0 0 22 20 2
30 Chandigarh 5 5 0 3 2 1 21 13 8
31 D&N Haveli 1 1 0 1 1 0 1 1 0
32 Daman & Diu 2 2 0 0 0 0 2 2 0
33 Delhi 47 22 25 32 39 0 290 221 69
34 Lakshadweep 1 1 0 0 0 0 1 3 0
35 Puducherry 3 5 0 0 0 0 21 19 2
All India 2,236 1,934 388 1,594 1,078 527 9,127 7,409 1,917
Note: In vacancy columns, the States where the Rank wise Police Personnal are surplus, is taken as ‘0’
CHAPTER 3

42
TABLE 3.3 -- (Continued ...)Sl. No. States / UTs. INSPECTOR S.I. A.S.I.
Sanc-tioned
Actual Vacancy Sanc-tioned
Actual Vacancy Sanc-tioned
Actual Vacancy
(1) (2) (24) (25) (26) (27) (28) (29) (30) (31) (32)
1 Andhra Pradesh 2,063 1,665 398 6,359 3,850 2,509 6,076 4,182 1,894
2 Arunachal Pradesh 111 108 3 427 301 126 439 320 119
3 Assam 536 461 75 2,784 2,499 285 2,036 1,996 40
4 Bihar 816 676 140 8,862 6,272 2,590 5,074 4,152 922
5 Chhattisgarh 617 540 77 1,735 694 1,041 2,123 1,403 720
6 Goa 76 61 15 291 126 165 200 187 13
7 Gujarat 1,136 647 489 3,625 1,853 1,772 10,211 7,376 2,835
8 Haryana 800 634 166 2,006 1,325 681 4,595 3,415 1,180
9 Himachal Pradesh 209 188 21 497 412 85 986 910 76
10 Jammu & Kashmir 756 696 60 2452 1,899 553 3340 2,972 368
11 Jharkhand 693 537 156 4,159 2,517 1,642 4,242 3,599 643
12 Karnataka 1,163 1,163 0 3,207 2,055 1,152 4,641 4,228 413
13 Kerala 440 430 10 2,100 1,900 200 1,688 1,500 188
14 Madhya Pradesh 1,548 1,274 274 4,702 2,749 1,953 5,611 4,111 1,500
15 Maharashtra 3,440 3,399 41 9,741 6,707 3,034 19,895 18,568 1,327
16 Manipur 313 254 59 1,163 779 384 1,317 638 679
17 Meghalaya 159 125 34 786 700 86 166 163 3
18 Mizoram 154 153 1 486 468 18 491 476 15
19 Nagaland 78 63 15 413 415 0 420 420 0
20 Odisha 976 679 297 2,694 2,179 515 4,589 3,935 654
21 Punjab 904 838 66 2,173 1,551 622 4,557 4,106 451
22 Rajasthan 1,036 811 225 3,689 2,279 1,410 5,661 3,963 1,698
23 Sikkim 51 57 0 155 156 0 177 239 0
24 Tamil Nadu 2,657 2,571 86 9,061 6,786 2,275 0 0 0
25 Tripura 213 195 18 761 637 124 614 555 59
26 Uttar Pradesh 2,389 739 1,650 19,542 8,122 11,420 0 0 0
27 Uttarakhand 141 120 21 927 889 38 0 0 0
28 West Bengal 1,080 750 330 7,993 4,714 3,279 12,044 8,774 3,270
29 A&N Islands 54 46 8 226 174 52 290 166 124
30 Chandigarh 63 61 2 339 304 35 275 210 65
31 D&N Haveli 3 1 2 16 9 7 8 8 0
32 Daman & Diu 6 6 0 21 5 16 21 21 0
33 Delhi 1,280 1,247 33 5,368 4,649 719 6,490 5,662 828
34 Lakshadweep 5 4 1 20 7 13 28 17 11
35 Puducherry 70 65 5 248 204 44 86 71 15
All India 26,036 21,264 4,778 109,028 70,186 38,845 108,391 88,343 20,110
Note: In vacancy columns, the States where the Rank wise Police Personnal are surplus, is taken as ‘0’
CHAPTER 3

43
TABLE 3.3 -- (Continued ...)Sl. No. States / UTs. H.CONSTABLE CONSTABLE TOTAL
Sanc-tioned
Actual Vacancy Sanc-tioned
Actual Vacancy Sanc-tioned
Actual Vacancy
(1) (2) (33) (34) (35) (36) (37) (38) (39) (40) (41)
1 Andhra Pradesh 16,862 15,221 1,641 74,980 56,416 18,564 107,208 82,040 25,168
2 Arunachal Pradesh 1,589 1,364 225 5,479 4,912 567 8,141 7,078 1,063
3 Assam 3,966 3,634 332 22,502 19,360 3,142 32,156 28,189 3,967
4 Bihar 9,077 4,689 4,388 45,209 38,412 6,797 69,615 54,617 14,998
5 Chhattisgarh 5,881 3,956 1,925 35,597 24,263 11,334 46,289 31,076 15,213
6 Goa 1,034 768 266 3,679 2,941 738 5,330 4,120 1,210
7 Gujarat 14,654 11,283 3,371 62,346 31,642 30,704 92,468 53,178 39,290
8 Haryana 9,230 5,078 4,152 39,993 24,681 15,312 56,979 35,400 21,579
9 Himachal Pradesh 1,722 1,580 142 7,183 6,391 792 10,860 9,705 1,155
10 Jammu & Kashmir 8,282 7,610 672 34,659 33,215 1,444 49,989 47,135 2,854
11 Jharkhand 7,956 4,416 3,540 38,439 31,659 6,780 55,951 43,013 12,938
12 Karnataka 18,273 15,894 2,379 50,897 38,892 12,005 78,855 62,894 15,961
13 Kerala 7,730 7,700 30 29,550 29,000 550 41,919 40,924 995
14 Madhya Pradesh 13,134 10,688 2,446 41,322 35,846 5,476 67,335 55,656 11,679
15 Maharashtra 73,280 71,489 1,791 83,623 80,390 3,233 191,085 181,344 9,741
16 Manipur 2,251 998 1,253 13,404 8,975 4,429 18,626 11,759 6,867
17 Meghalaya 636 586 50 5,506 4,386 1,120 7,344 6,033 1,311
18 Mizoram 741 741 0 2,688 2,508 180 4,655 4,432 223
19 Nagaland 1,612 1,603 9 6,179 6,179 0 8,808 8,777 31
20 Odisha 3,000 2,649 351 21,622 19,560 2,062 33,487 29,433 4,054
21 Punjab 9,664 5,580 4,084 41,987 32,890 9,097 59,782 45,416 14,366
22 Rajasthan 7,759 7,886 0 59,326 59,147 179 78,471 74,812 3,659
23 Sikkim 387 636 0 1,658 933 725 2,525 2,119 406
24 Tamil Nadu 11,165 0 11,165 75,723 71,256 4,467 99,643 81,483 18,160
25 Tripura 1,403 1,152 251 9,621 7,859 1,762 12,825 10,501 2,324
26 Uttar Pradesh 58,918 12,199 46,719 249,660 117,521 132,139 332,016 139,794 192,222
27 Uttarakhand 1,973 1,710 263 12,256 10,832 1,424 15,465 13,668 1,797
28 West Bengal 0 0 0 69,459 41,184 28,275 91,326 55,929 35,397
29 A&N Islands 728 634 94 2,378 2,337 41 3,707 3,387 320
30 Chandigarh 1,439 774 665 4,574 4,596 0 6,721 5,967 754
31 D&N Haveli 76 66 10 221 183 38 328 271 57
32 Daman & Diu 92 89 3 265 120 145 410 246 164
33 Delhi 18,938 17,088 1,850 39,055 38,062 993 71,550 67,030 4,520
34 Lakshadweep 64 50 14 230 194 36 349 276 73
35 Puducherry 598 566 32 2,158 1,333 825 3,186 2,266 920
All India 314,114 220,377 94,113 1,193,428 888,075 305,375 1,765,404 1,299,968 465,436
Note: In vacancy columns, the States where the Rank wise Police Personnal are surplus, is taken as ‘0’
CHAPTER 3

44
TABLE 3.4 -- OFFICERS TO CONSTABULARY RATIO OF SANCTIONED & ACTUAL STRENGTH OFCIVIL POLICE INCLUDING DISTRICTS ARMED RESERVE POLICE - AS ON 1.1.2013
Sl. No. States / UTs. Sanctioned Police Strength Actual Police Strength
D.G. To A.S.I. H.C. & Const. Teeth to Tail Ratio
D.G. To A.S.I. H.C. & Const. Teeth to Tail Ratio
(1) (2) (3) (4) (5) (6) (7) (8)
1 Andhra Pradesh 15,366 91,842 1 : 6.0 10,403 71,637 1 : 6.9
2 Arunachal Pradesh 1,073 7,068 1 : 6.6 802 6,276 1 : 7.8
3 Assam 5,688 26,468 1 : 4.7 5,195 22,994 1 : 4.4
4 Bihar 15,329 54,286 1 : 3.5 11,516 43,101 1 : 3.7
5 Chhattisgarh 4,811 41,478 1 : 8.6 2,857 28,219 1 : 9.9
6 Goa 617 4,713 1 : 7.6 411 3,709 1 : 9.0
7 Gujarat 15,468 77,000 1 : 5.0 10,253 42,925 1 : 4.2
8 Haryana 7,756 49,223 1 : 6.3 5,641 29,759 1 : 5.3
9 Himachal Pradesh 1,955 8,905 1 : 4.6 1,734 7,971 1 : 4.6
10 Jammu & Kashmir 7,048 42,941 1 : 6.1 6,310 40,825 1 : 6.5
11 Jharkhand 9,556 46,395 1 : 4.9 6,938 36,075 1 : 5.2
12 Karnataka 9,685 69,170 1 : 7.1 8,108 54,786 1 : 6.8
13 Kerala 4,639 37,280 1 : 8.0 4,224 36,700 1 : 8.7
14 Madhya Pradesh 12,879 54,456 1 : 4.2 9,122 46,534 1 : 5.1
15 Maharashtra 34,182 156,903 1 : 4.6 29,465 151,879 1 : 5.2
16 Manipur 2,971 15,655 1 : 5.3 1,786 9,973 1 : 5.6
17 Meghalaya 1,202 6,142 1 : 5.1 1,061 4,972 1 : 4.7
18 Mizoram 1,226 3,429 1 : 2.8 1,183 3,249 1 : 2.7
19 Nagaland 1,017 7,791 1 : 7.7 995 7,782 1 : 7.8
20 Odisha 8,865 24,622 1 : 2.8 7,224 22,209 1 : 3.1
21 Punjab 8,131 51,651 1 : 6.4 6,946 38,470 1 : 5.5
22 Rajasthan 11,386 67,085 1 : 5.9 7,779 67,033 1 : 8.6
23 Sikkim 480 2,045 1 : 4.3 550 1,569 1 : 2.9
24 Tamil Nadu 12,755 86,888 1 : 6.8 10,227 71,256 1 : 7.0
25 Tripura 1,801 11,024 1 : 6.1 1,490 9,011 1 : 6.0
26 Uttar Pradesh 23,438 308,578 1 : 13.2 10,074 129,720 1 : 12.9
27 Uttarakhand 1,236 14,229 1 : 11.5 1,126 12,542 1 : 11.1
28 West Bengal 21,867 69,459 1 : 3.2 14,745 41,184 1 : 2.8
29 A&N Islands 601 3,106 1 : 5.2 416 2,971 1 : 7.1
30 Chandigarh 708 6,013 1 : 8.5 597 5,370 1 : 9.0
31 D&N Haveli 31 297 1 : 9.6 22 249 1 : 11.3
32 Daman & Diu 53 357 1 : 6.7 37 209 1 : 5.6
33 Delhi 13,557 57,993 1 : 4.3 11,880 55,150 1 : 4.6
34 Lakshadweep 55 294 1 : 5.3 32 244 1 : 7.6
35 Puducherry 430 2,756 1 : 6.4 367 1,899 1 : 5.2
All India** 257,862 1,507,542 1 : 5.8 191,516 1,108,452 1 : 5.8
Teeth to Tail Ratio: Teeth to Tail Ratio is the ratio of Police Officers from the rank of an Asstt.Sub-Inspector and above to Head Constables and Constables.
CHAPTER 3

45
TABLE 3.5-SANCTIONED & ACTUAL STRENGTH OF STATE ARMED POLICE-AS ON 1.1.2013Sl. No. States / UTs. DGP/Spl.DGP Addl.DGP IGP DIG
Sanc-tioned
Actual Vacancy Sanc-tioned
Actual Vacancy Sanc-tioned
Actual Vacancy Sanc-tioned
Actual Vacancy
(1) (2) (3) (4) (5) (6) (7) (8) (9) (10) (11) (12) (13) (14)
1 Andhra Pradesh 0 0 0 1 1 0 0 0 0 0 0 0
2 Arunachal Pradesh 0 0 0 0 0 0 0 0 0 0 0 0
3 Assam 0 0 0 1 1 0 1 0 1 2 2 0
4 Bihar 0 0 0 1 1 0 1 1 0 2 0 2
5 Chhattisgarh 0 0 0 1 1 0 1 2 0 1 0 1
6 Goa 0 0 0 0 0 0 0 0 0 0 0 0
7 Gujarat 0 0 0 1 1 0 0 0 0 3 3 0
8 Haryana 0 0 0 1 0 1 1 1 0 1 1 0
9 Himachal Pradesh 0 0 0 1 0 1 2 1 1 1 0 1
10 Jammu & Kashmir 0 0 0 1 1 0 2 1 1 4 3 1
11 Jharkhand 0 0 0 1 1 0 1 0 1 1 0 1
12 Karnataka 0 0 0 1 0 1 1 1 0 1 1 0
13 Kerala 0 0 0 1 1 0 1 1 0 1 1 0
14 Madhya Pradesh 0 0 0 1 1 0 5 3 2 0 2 0
15 Maharashtra 0 0 0 1 1 0 2 2 0 1 1 0
16 Manipur 0 0 0 1 1 0 1 1 0 2 2 0
17 Meghalaya 0 0 0 0 0 0 0 0 0 0 0 0
18 Mizoram 0 0 0 0 0 0 0 0 0 0 0 0
19 Nagaland 0 0 0 0 0 0 1 1 0 2 5 0
20 Odisha 0 0 0 0 0 0 0 0 0 0 0 0
21 Punjab 0 0 0 1 1 0 4 4 0 5 5 0
22 Rajasthan 0 0 0 1 1 0 2 1 1 2 2 0
23 Sikkim 0 0 0 0 1 0 1 1 0 0 0 0
24 Tamil Nadu 0 0 0 1 1 0 2 2 0 2 2 0
25 Tripura 0 0 0 1 1 0 1 1 0 4 1 3
26 Uttar Pradesh 0 1 0 1 0 1 5 4 1 8 3 5
27 Uttarakhand 0 0 0 0 0 0 0 0 0 1 0 1
28 West Bengal 1 1 0 1 1 0 2 1 1 4 4 0
29 A&N Islands 0 0 0 0 0 0 1 0 1 0 0 0
30 Chandigarh 0 0 0 0 0 0 0 0 0 0 0 0
31 D&N Haveli 0 0 0 0 0 0 0 0 0 0 0 0
32 Daman & Diu 0 0 0 0 0 0 0 0 0 0 0 0
33 Delhi 0 0 0 0 0 0 0 0 0 0 1 0
34 Lakshadweep 0 0 0 0 0 0 0 0 0 0 0 0
35 Puducherry 0 0 0 0 0 0 0 0 0 0 0 0
All India 1 2 0 20 17 4 38 29 10 48 39 15
Note: In vacancy columns, the States where the Rank wise Police Personnal are surplus, is taken as ‘ 0’
CHAPTER 3
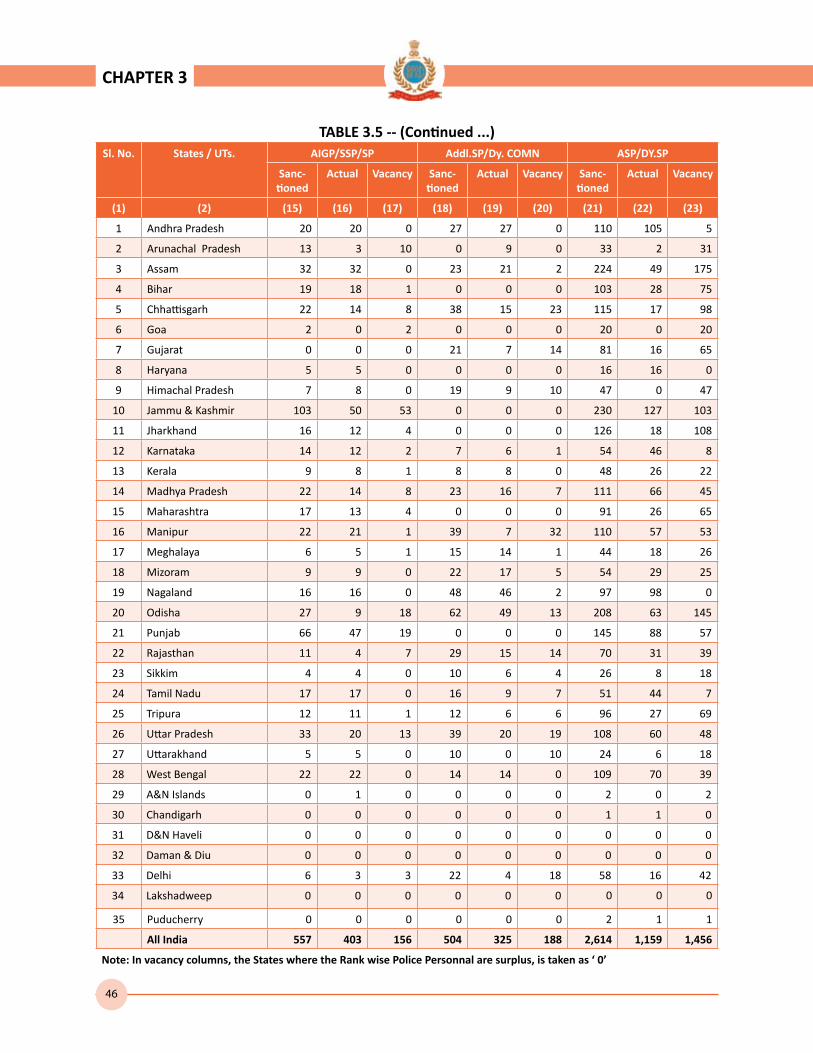
46
TABLE 3.5 -- (Continued ...)Sl. No. States / UTs. AIGP/SSP/SP Addl.SP/Dy. COMN ASP/DY.SP
Sanc-tioned
Actual Vacancy Sanc-tioned
Actual Vacancy Sanc-tioned
Actual Vacancy
(1) (2) (15) (16) (17) (18) (19) (20) (21) (22) (23)
1 Andhra Pradesh 20 20 0 27 27 0 110 105 5
2 Arunachal Pradesh 13 3 10 0 9 0 33 2 31
3 Assam 32 32 0 23 21 2 224 49 175
4 Bihar 19 18 1 0 0 0 103 28 75
5 Chhattisgarh 22 14 8 38 15 23 115 17 98
6 Goa 2 0 2 0 0 0 20 0 20
7 Gujarat 0 0 0 21 7 14 81 16 65
8 Haryana 5 5 0 0 0 0 16 16 0
9 Himachal Pradesh 7 8 0 19 9 10 47 0 47
10 Jammu & Kashmir 103 50 53 0 0 0 230 127 103
11 Jharkhand 16 12 4 0 0 0 126 18 108
12 Karnataka 14 12 2 7 6 1 54 46 8
13 Kerala 9 8 1 8 8 0 48 26 22
14 Madhya Pradesh 22 14 8 23 16 7 111 66 45
15 Maharashtra 17 13 4 0 0 0 91 26 65
16 Manipur 22 21 1 39 7 32 110 57 53
17 Meghalaya 6 5 1 15 14 1 44 18 26
18 Mizoram 9 9 0 22 17 5 54 29 25
19 Nagaland 16 16 0 48 46 2 97 98 0
20 Odisha 27 9 18 62 49 13 208 63 145
21 Punjab 66 47 19 0 0 0 145 88 57
22 Rajasthan 11 4 7 29 15 14 70 31 39
23 Sikkim 4 4 0 10 6 4 26 8 18
24 Tamil Nadu 17 17 0 16 9 7 51 44 7
25 Tripura 12 11 1 12 6 6 96 27 69
26 Uttar Pradesh 33 20 13 39 20 19 108 60 48
27 Uttarakhand 5 5 0 10 0 10 24 6 18
28 West Bengal 22 22 0 14 14 0 109 70 39
29 A&N Islands 0 1 0 0 0 0 2 0 2
30 Chandigarh 0 0 0 0 0 0 1 1 0
31 D&N Haveli 0 0 0 0 0 0 0 0 0
32 Daman & Diu 0 0 0 0 0 0 0 0 0
33 Delhi 6 3 3 22 4 18 58 16 42
34 Lakshadweep 0 0 0 0 0 0 0 0 0
35 Puducherry 0 0 0 0 0 0 2 1 1
All India 557 403 156 504 325 188 2,614 1,159 1,456
Note: In vacancy columns, the States where the Rank wise Police Personnal are surplus, is taken as ‘ 0’
CHAPTER 3
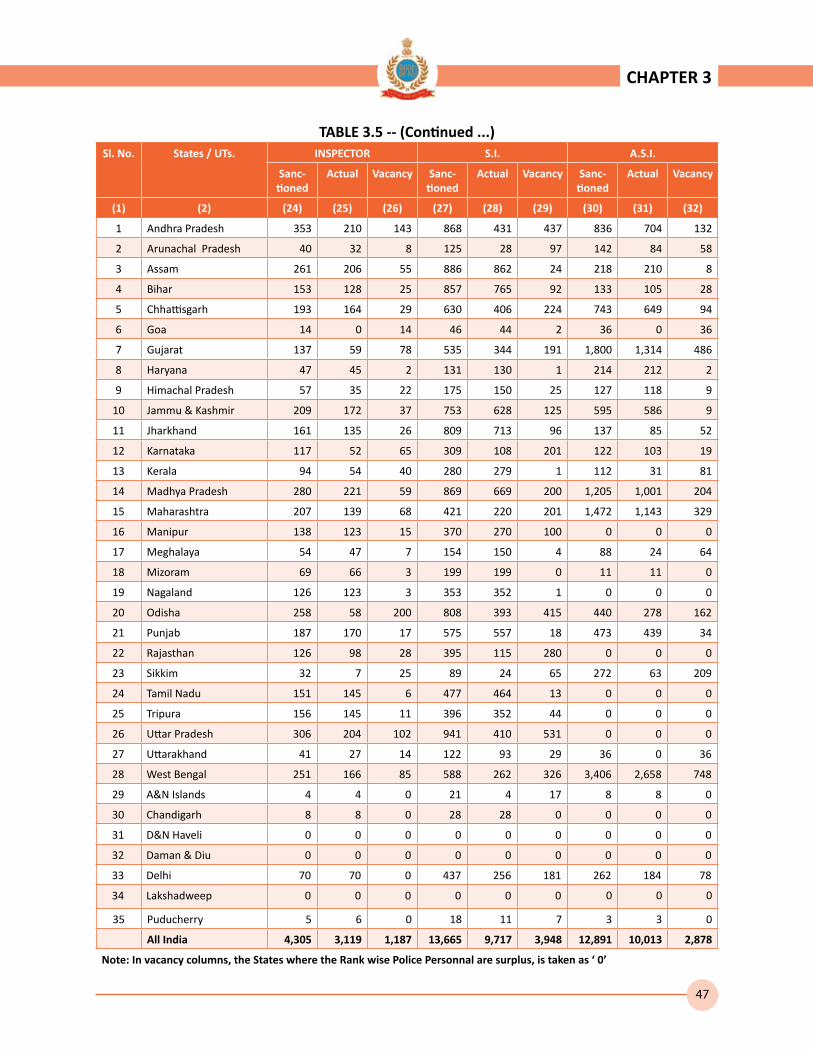
47
TABLE 3.5 -- (Continued ...)Sl. No. States / UTs. INSPECTOR S.I. A.S.I.
Sanc-tioned
Actual Vacancy Sanc-tioned
Actual Vacancy Sanc-tioned
Actual Vacancy
(1) (2) (24) (25) (26) (27) (28) (29) (30) (31) (32)
1 Andhra Pradesh 353 210 143 868 431 437 836 704 132
2 Arunachal Pradesh 40 32 8 125 28 97 142 84 58
3 Assam 261 206 55 886 862 24 218 210 8
4 Bihar 153 128 25 857 765 92 133 105 28
5 Chhattisgarh 193 164 29 630 406 224 743 649 94
6 Goa 14 0 14 46 44 2 36 0 36
7 Gujarat 137 59 78 535 344 191 1,800 1,314 486
8 Haryana 47 45 2 131 130 1 214 212 2
9 Himachal Pradesh 57 35 22 175 150 25 127 118 9
10 Jammu & Kashmir 209 172 37 753 628 125 595 586 9
11 Jharkhand 161 135 26 809 713 96 137 85 52
12 Karnataka 117 52 65 309 108 201 122 103 19
13 Kerala 94 54 40 280 279 1 112 31 81
14 Madhya Pradesh 280 221 59 869 669 200 1,205 1,001 204
15 Maharashtra 207 139 68 421 220 201 1,472 1,143 329
16 Manipur 138 123 15 370 270 100 0 0 0
17 Meghalaya 54 47 7 154 150 4 88 24 64
18 Mizoram 69 66 3 199 199 0 11 11 0
19 Nagaland 126 123 3 353 352 1 0 0 0
20 Odisha 258 58 200 808 393 415 440 278 162
21 Punjab 187 170 17 575 557 18 473 439 34
22 Rajasthan 126 98 28 395 115 280 0 0 0
23 Sikkim 32 7 25 89 24 65 272 63 209
24 Tamil Nadu 151 145 6 477 464 13 0 0 0
25 Tripura 156 145 11 396 352 44 0 0 0
26 Uttar Pradesh 306 204 102 941 410 531 0 0 0
27 Uttarakhand 41 27 14 122 93 29 36 0 36
28 West Bengal 251 166 85 588 262 326 3,406 2,658 748
29 A&N Islands 4 4 0 21 4 17 8 8 0
30 Chandigarh 8 8 0 28 28 0 0 0 0
31 D&N Haveli 0 0 0 0 0 0 0 0 0
32 Daman & Diu 0 0 0 0 0 0 0 0 0
33 Delhi 70 70 0 437 256 181 262 184 78
34 Lakshadweep 0 0 0 0 0 0 0 0 0
35 Puducherry 5 6 0 18 11 7 3 3 0
All India 4,305 3,119 1,187 13,665 9,717 3,948 12,891 10,013 2,878
Note: In vacancy columns, the States where the Rank wise Police Personnal are surplus, is taken as ‘ 0’
CHAPTER 3

48
TABLE 3.5 -- (Continued ...)Sl. No. States / UTs. H. CONSTABLE CONSTABLE TOTAL
Sanc-tioned Actual Vacancy
Sanc-tioned Actual Vacancy
Sanc-tioned Actual Vacancy
(1) (2) (33) (34) (35) (36) (37) (38) (39) (40) (41)
1 Andhra Pradesh 4,855 3,544 1,311 14,947 9,896 5,051 22,017 14,938 7,079
2 Arunachal Pradesh 899 479 420 3,370 3,351 19 4,622 3,988 634
3 Assam 4,371 4,281 90 24,165 21,537 2,628 30,184 27,201 2,983
4 Bihar 3,353 3,169 184 13,676 9,830 3,846 18,298 14,045 4,253
5 Chhattisgarh 3,337 2,611 726 15,260 10,759 4,501 20,341 14,638 5,703
6 Goa 320 0 320 1,350 1,158 192 1,788 1,202 586
7 Gujarat 1,916 1,538 378 16,418 11,729 4,689 20,912 15,011 5,901
8 Haryana 688 292 396 3,598 3,139 459 4,702 3,841 861
9 Himachal Pradesh 1,142 847 295 4,747 3,468 1,279 6,325 4,636 1,689
10 Jammu & Kashmir 5,010 4,864 146 21,346 18,907 2,439 28,253 25,339 2,914
11 Jharkhand 3,229 2,783 446 13,232 10,601 2,631 17,713 14,348 3,365
12 Karnataka 2,318 2,136 182 9,370 5,536 3,834 12,314 8,001 4,313
13 Kerala 1660 1,420 240 8579 7,001 1,578 10,793 8,830 1,963
14 Madhya Pradesh 4,073 3,660 413 16,521 16,355 166 23,110 22,008 1,102
15 Maharashtra 6,528 2,019 4,509 9,616 10,743 0 18,356 14,307 4,049
16 Manipur 2,664 2,593 71 9,941 9,665 276 13,288 12,740 548
17 Meghalaya 903 762 141 4,533 4,263 270 5,797 5,283 514
18 Mizoram 1,155 1,113 42 5,072 4,345 727 6,591 5,789 802
19 Nagaland 1,301 1,298 3 13,530 13,512 18 15,474 15,451 23
20 Odisha 3,598 1,762 1,836 17,952 13,323 4,629 23,353 15,935 7,418
21 Punjab 3,510 3,194 316 14,730 12,205 2,525 19,696 16,710 2,986
22 Rajasthan 2,274 1,767 507 12,088 9,820 2,268 14,998 11,854 3,144
23 Sikkim 660 328 332 2,457 1,399 1,058 3,551 1,841 1,710
24 Tamil Nadu 1,580 1,597 0 13,140 10,646 2,494 15,437 12,927 2,510
25 Tripura 4,056 3,692 364 9,780 9,020 760 14,514 13,256 1,258
26 Uttar Pradesh 6,315 4,268 2,047 28,458 22,346 6,112 36,214 27,336 8,878
27 Uttarakhand 854 683 171 3,635 3,346 289 4,728 4,160 568
28 West Bengal 0 0 0 13,606 11,477 2,129 18,004 14,676 3,328
29 A&N Islands 127 84 43 562 283 279 725 384 341
30 Chandigarh 179 179 0 936 936 0 1,152 1,152 0
31 D&N Haveli 0 0 0 0 0 0 0 0 0
32 Daman & Diu 0 0 0 0 0 0 0 0 0
33 Delhi 1,879 1,496 383 6,874 6,470 404 9,608 8,500 1,108
34 Lakshadweep 0 0 0 0 0 0 0 0 0
35 Puducherry 100 96 4 637 254 383 765 371 394
All India 74,854 58,555 16,316 334,126 277,320 57,933 443,623 360,698 82,925
Note: In vacancy columns, the States where the Rank wise Police Personnal are surplus, is taken as ‘ 0’
CHAPTER 3
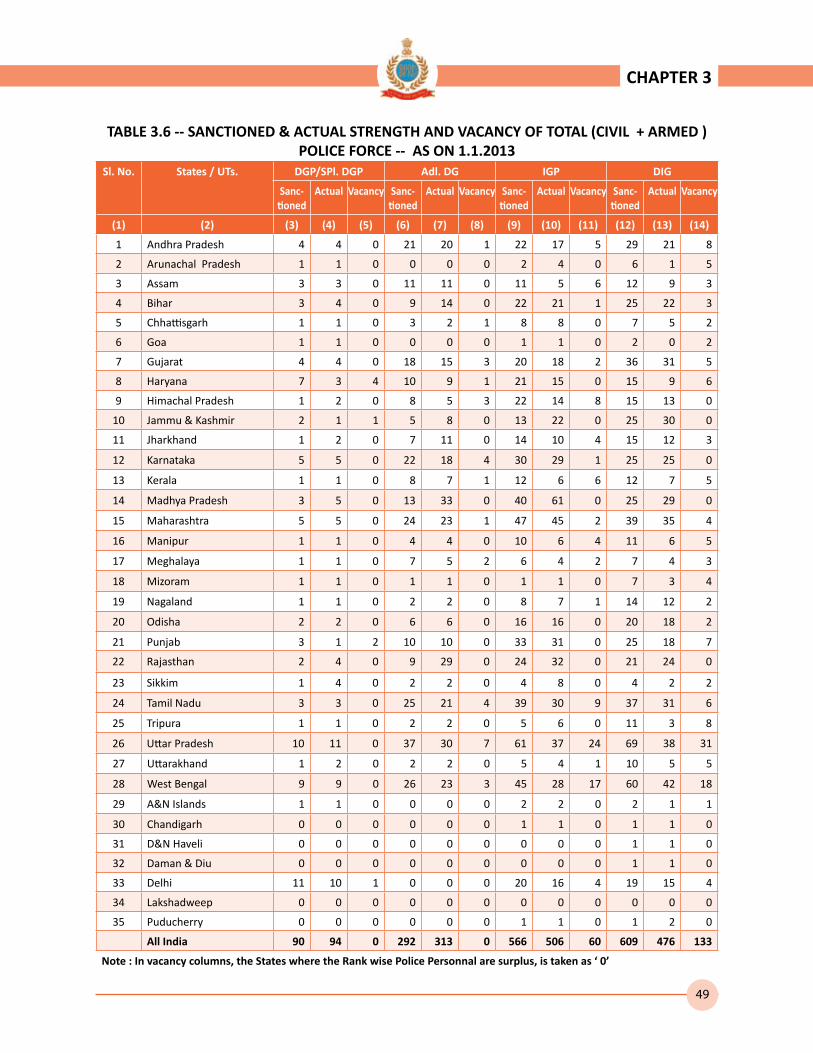
49
CHAPTER 3
TABLE 3.6 -- SANCTIONED & ACTUAL STRENGTH AND VACANCY OF TOTAL (CIVIL + ARMED ) POLICE FORCE -- AS ON 1.1.2013
Sl. No. States / UTs. DGP/SPl. DGP Adl. DG IGP DIG
Sanc-tioned
Actual Vacancy Sanc-tioned
Actual Vacancy Sanc-tioned
Actual Vacancy Sanc-tioned
Actual Vacancy
(1) (2) (3) (4) (5) (6) (7) (8) (9) (10) (11) (12) (13) (14)
1 Andhra Pradesh 4 4 0 21 20 1 22 17 5 29 21 8
2 Arunachal Pradesh 1 1 0 0 0 0 2 4 0 6 1 5
3 Assam 3 3 0 11 11 0 11 5 6 12 9 3
4 Bihar 3 4 0 9 14 0 22 21 1 25 22 3
5 Chhattisgarh 1 1 0 3 2 1 8 8 0 7 5 2
6 Goa 1 1 0 0 0 0 1 1 0 2 0 2
7 Gujarat 4 4 0 18 15 3 20 18 2 36 31 5
8 Haryana 7 3 4 10 9 1 21 15 0 15 9 6
9 Himachal Pradesh 1 2 0 8 5 3 22 14 8 15 13 0
10 Jammu & Kashmir 2 1 1 5 8 0 13 22 0 25 30 0
11 Jharkhand 1 2 0 7 11 0 14 10 4 15 12 3
12 Karnataka 5 5 0 22 18 4 30 29 1 25 25 0
13 Kerala 1 1 0 8 7 1 12 6 6 12 7 5
14 Madhya Pradesh 3 5 0 13 33 0 40 61 0 25 29 0
15 Maharashtra 5 5 0 24 23 1 47 45 2 39 35 4
16 Manipur 1 1 0 4 4 0 10 6 4 11 6 5
17 Meghalaya 1 1 0 7 5 2 6 4 2 7 4 3
18 Mizoram 1 1 0 1 1 0 1 1 0 7 3 4
19 Nagaland 1 1 0 2 2 0 8 7 1 14 12 2
20 Odisha 2 2 0 6 6 0 16 16 0 20 18 2
21 Punjab 3 1 2 10 10 0 33 31 0 25 18 7
22 Rajasthan 2 4 0 9 29 0 24 32 0 21 24 0
23 Sikkim 1 4 0 2 2 0 4 8 0 4 2 2
24 Tamil Nadu 3 3 0 25 21 4 39 30 9 37 31 6
25 Tripura 1 1 0 2 2 0 5 6 0 11 3 8
26 Uttar Pradesh 10 11 0 37 30 7 61 37 24 69 38 31
27 Uttarakhand 1 2 0 2 2 0 5 4 1 10 5 5
28 West Bengal 9 9 0 26 23 3 45 28 17 60 42 18
29 A&N Islands 1 1 0 0 0 0 2 2 0 2 1 1
30 Chandigarh 0 0 0 0 0 0 1 1 0 1 1 0
31 D&N Haveli 0 0 0 0 0 0 0 0 0 1 1 0
32 Daman & Diu 0 0 0 0 0 0 0 0 0 1 1 0
33 Delhi 11 10 1 0 0 0 20 16 4 19 15 4
34 Lakshadweep 0 0 0 0 0 0 0 0 0 0 0 0
35 Puducherry 0 0 0 0 0 0 1 1 0 1 2 0
All India 90 94 0 292 313 0 566 506 60 609 476 133
Note : In vacancy columns, the States where the Rank wise Police Personnal are surplus, is taken as ‘ 0’
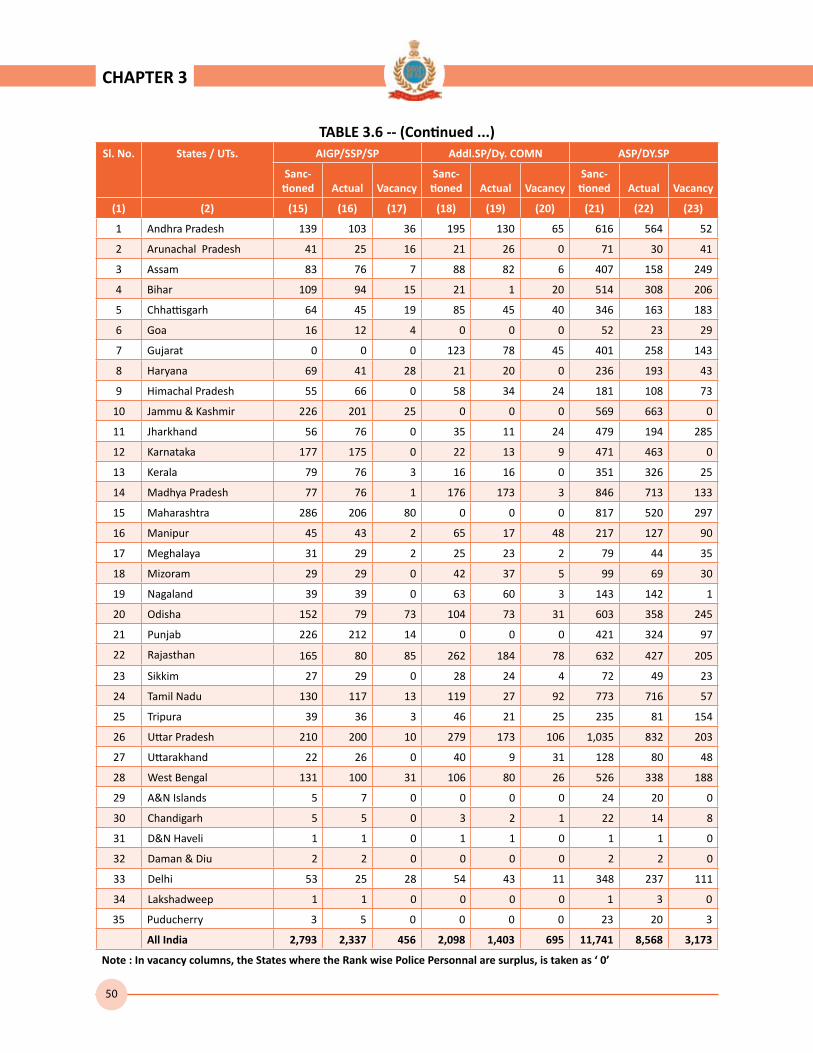
50
TABLE 3.6 -- (Continued ...)Sl. No. States / UTs. AIGP/SSP/SP Addl.SP/Dy. COMN ASP/DY.SP
Sanc-tioned Actual Vacancy
Sanc-tioned Actual Vacancy
Sanc-tioned Actual Vacancy
(1) (2) (15) (16) (17) (18) (19) (20) (21) (22) (23)
1 Andhra Pradesh 139 103 36 195 130 65 616 564 52
2 Arunachal Pradesh 41 25 16 21 26 0 71 30 41
3 Assam 83 76 7 88 82 6 407 158 249
4 Bihar 109 94 15 21 1 20 514 308 206
5 Chhattisgarh 64 45 19 85 45 40 346 163 183
6 Goa 16 12 4 0 0 0 52 23 29
7 Gujarat 0 0 0 123 78 45 401 258 143
8 Haryana 69 41 28 21 20 0 236 193 43
9 Himachal Pradesh 55 66 0 58 34 24 181 108 73
10 Jammu & Kashmir 226 201 25 0 0 0 569 663 0
11 Jharkhand 56 76 0 35 11 24 479 194 285
12 Karnataka 177 175 0 22 13 9 471 463 0
13 Kerala 79 76 3 16 16 0 351 326 25
14 Madhya Pradesh 77 76 1 176 173 3 846 713 133
15 Maharashtra 286 206 80 0 0 0 817 520 297
16 Manipur 45 43 2 65 17 48 217 127 90
17 Meghalaya 31 29 2 25 23 2 79 44 35
18 Mizoram 29 29 0 42 37 5 99 69 30
19 Nagaland 39 39 0 63 60 3 143 142 1
20 Odisha 152 79 73 104 73 31 603 358 245
21 Punjab 226 212 14 0 0 0 421 324 97
22 Rajasthan 165 80 85 262 184 78 632 427 205
23 Sikkim 27 29 0 28 24 4 72 49 23
24 Tamil Nadu 130 117 13 119 27 92 773 716 57
25 Tripura 39 36 3 46 21 25 235 81 154
26 Uttar Pradesh 210 200 10 279 173 106 1,035 832 203
27 Uttarakhand 22 26 0 40 9 31 128 80 48
28 West Bengal 131 100 31 106 80 26 526 338 188
29 A&N Islands 5 7 0 0 0 0 24 20 0
30 Chandigarh 5 5 0 3 2 1 22 14 8
31 D&N Haveli 1 1 0 1 1 0 1 1 0
32 Daman & Diu 2 2 0 0 0 0 2 2 0
33 Delhi 53 25 28 54 43 11 348 237 111
34 Lakshadweep 1 1 0 0 0 0 1 3 0
35 Puducherry 3 5 0 0 0 0 23 20 3
All India 2,793 2,337 456 2,098 1,403 695 11,741 8,568 3,173
Note : In vacancy columns, the States where the Rank wise Police Personnal are surplus, is taken as ‘ 0’
CHAPTER 3
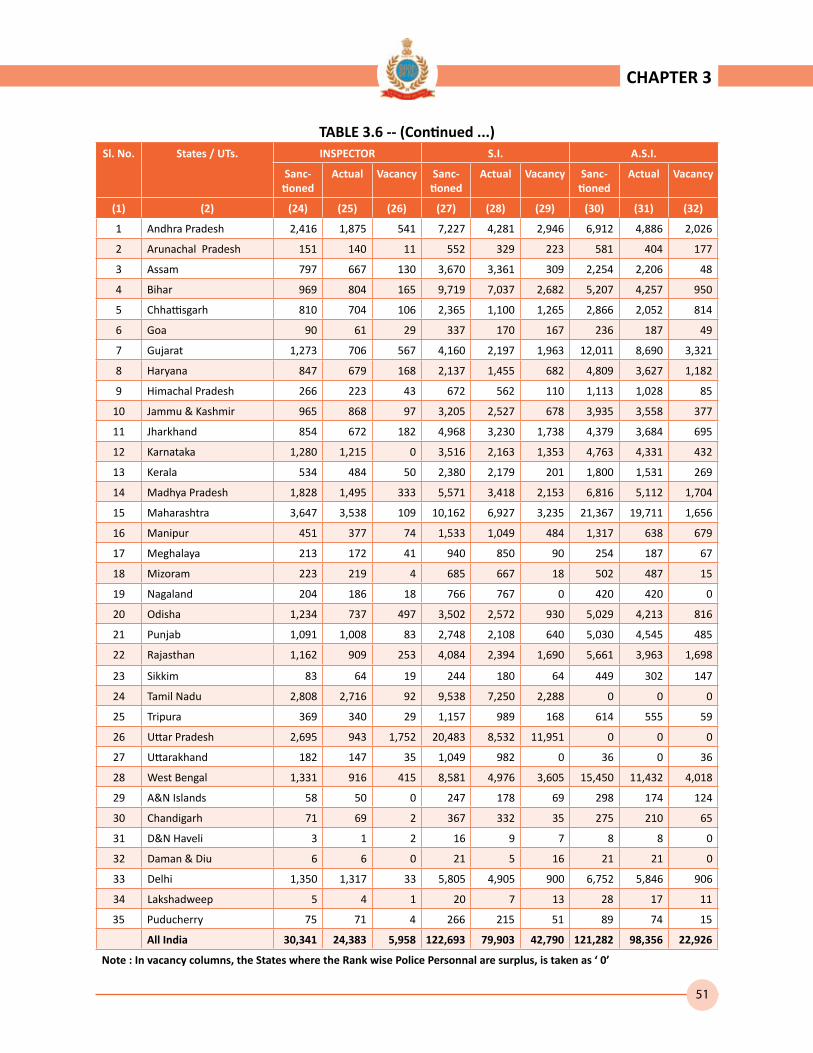
51
TABLE 3.6 -- (Continued ...)Sl. No. States / UTs. INSPECTOR S.I. A.S.I.
Sanc-tioned
Actual Vacancy Sanc-tioned
Actual Vacancy Sanc-tioned
Actual Vacancy
(1) (2) (24) (25) (26) (27) (28) (29) (30) (31) (32)
1 Andhra Pradesh 2,416 1,875 541 7,227 4,281 2,946 6,912 4,886 2,026
2 Arunachal Pradesh 151 140 11 552 329 223 581 404 177
3 Assam 797 667 130 3,670 3,361 309 2,254 2,206 48
4 Bihar 969 804 165 9,719 7,037 2,682 5,207 4,257 950
5 Chhattisgarh 810 704 106 2,365 1,100 1,265 2,866 2,052 814
6 Goa 90 61 29 337 170 167 236 187 49
7 Gujarat 1,273 706 567 4,160 2,197 1,963 12,011 8,690 3,321
8 Haryana 847 679 168 2,137 1,455 682 4,809 3,627 1,182
9 Himachal Pradesh 266 223 43 672 562 110 1,113 1,028 85
10 Jammu & Kashmir 965 868 97 3,205 2,527 678 3,935 3,558 377
11 Jharkhand 854 672 182 4,968 3,230 1,738 4,379 3,684 695
12 Karnataka 1,280 1,215 0 3,516 2,163 1,353 4,763 4,331 432
13 Kerala 534 484 50 2,380 2,179 201 1,800 1,531 269
14 Madhya Pradesh 1,828 1,495 333 5,571 3,418 2,153 6,816 5,112 1,704
15 Maharashtra 3,647 3,538 109 10,162 6,927 3,235 21,367 19,711 1,656
16 Manipur 451 377 74 1,533 1,049 484 1,317 638 679
17 Meghalaya 213 172 41 940 850 90 254 187 67
18 Mizoram 223 219 4 685 667 18 502 487 15
19 Nagaland 204 186 18 766 767 0 420 420 0
20 Odisha 1,234 737 497 3,502 2,572 930 5,029 4,213 816
21 Punjab 1,091 1,008 83 2,748 2,108 640 5,030 4,545 485
22 Rajasthan 1,162 909 253 4,084 2,394 1,690 5,661 3,963 1,698
23 Sikkim 83 64 19 244 180 64 449 302 147
24 Tamil Nadu 2,808 2,716 92 9,538 7,250 2,288 0 0 0
25 Tripura 369 340 29 1,157 989 168 614 555 59
26 Uttar Pradesh 2,695 943 1,752 20,483 8,532 11,951 0 0 0
27 Uttarakhand 182 147 35 1,049 982 0 36 0 36
28 West Bengal 1,331 916 415 8,581 4,976 3,605 15,450 11,432 4,018
29 A&N Islands 58 50 0 247 178 69 298 174 124
30 Chandigarh 71 69 2 367 332 35 275 210 65
31 D&N Haveli 3 1 2 16 9 7 8 8 0
32 Daman & Diu 6 6 0 21 5 16 21 21 0
33 Delhi 1,350 1,317 33 5,805 4,905 900 6,752 5,846 906
34 Lakshadweep 5 4 1 20 7 13 28 17 11
35 Puducherry 75 71 4 266 215 51 89 74 15
All India 30,341 24,383 5,958 122,693 79,903 42,790 121,282 98,356 22,926
Note : In vacancy columns, the States where the Rank wise Police Personnal are surplus, is taken as ‘ 0’
CHAPTER 3

52
TABLE 3.6 -- (Continued ...)Sl. No. States / UTs. H.CONSTABLE CONSTABLE TOTAL
Sanc-tioned Actual Vacancy
Sanc-tioned Actual Vacancy
Sanc-tioned Actual Vacancy
(1) (2) (33) (34) (35) (36) (37) (38) (39) (40) (41)
1 Andhra Pradesh 21,717 18,765 2,952 89,927 66,312 23,615 129,225 96,978 32,247
2 Arunachal Pradesh 2,488 1,843 645 8,849 8,263 586 12,763 11,066 1,697
3 Assam 8,337 7,915 422 46,667 40,897 5,770 62,340 55,390 6,950
4 Bihar 12,430 7,858 4,572 58,885 48,242 10,643 87,913 68,662 19,251
5 Chhattisgarh 9,218 6,567 2,651 50,857 35,022 15,835 66,630 45,714 20,916
6 Goa 1,354 768 586 5,029 4,099 930 7,118 5,322 1,796
7 Gujarat 16,570 12,821 3,749 78,764 43,371 35,393 113,380 68,189 45,191
8 Haryana 9,918 5,370 4,548 43,591 27,820 15,771 61,681 39,241 22,440
9 Himachal Pradesh 2,864 2,427 437 11,930 9,859 2,071 17,185 14,341 2,844
10 Jammu & Kashmir 13,292 12,474 818 56,005 52,122 3,883 78,242 72,474 5,768
11 Jharkhand 11,185 7,199 3,986 51,671 42,260 9,411 73,664 57,361 16,303
12 Karnataka 20,591 18,030 0 60,267 44,428 15,839 91,169 70,895 20,274
13 Kerala 9,390 9,120 270 38,129 36,001 2,128 52,712 49,754 2,958
14 Madhya Pradesh 17,207 14,348 2,859 57,843 52,201 5,642 90,445 77,664 12,781
15 Maharashtra 79,808 73,508 6,300 93,239 91,133 2,106 209,441 195,651 13,790
16 Manipur 4,915 3,591 1,324 23,345 18,640 4,705 31,914 24,499 7,415
17 Meghalaya 1,539 1,348 191 10,039 8,649 1,390 13,141 11,316 1,825
18 Mizoram 1,896 1,854 42 7,760 6,853 907 11,246 10,221 1,025
19 Nagaland 2,913 2,901 12 19,709 19,691 18 24,282 24,228 54
20 Odisha 6,598 4,411 2,187 39,574 32,883 6,691 56,840 45,368 11,472
21 Punjab 13,174 8,774 4,400 56,717 45,095 11,622 79,478 62,126 17,352
22 Rajasthan 10,033 9,653 380 71,414 68,967 2,447 93,469 86,666 6,803
23 Sikkim 1,047 964 0 4,115 2,332 1,783 6,076 3,960 2,116
24 Tamil Nadu 12,745 1,597 11,148 88,863 81,902 6,961 115,080 94,410 20,670
25 Tripura 5,459 4,844 615 19,401 16,879 2,522 27,339 23,757 3,582
26 Uttar Pradesh 65,233 16,467 48,766 278,118 139,867 138,251 368,230 167,130 201,100
27 Uttarakhand 2,827 2,393 434 15,891 14,178 1,713 20,193 17,828 2,365
28 West Bengal 0 0 0 83,065 52,661 30,404 109,330 70,605 38,725
29 A&N Islands 855 718 137 2,940 2,620 320 4,432 3,771 661
30 Chandigarh 1,618 953 665 5,510 5,532 0 7,873 7,119 754
31 D&N Haveli 76 66 10 221 183 38 328 271 57
32 Daman & Diu 92 89 3 265 120 145 410 246 164
33 Delhi 20,817 18,584 2,233 45,929 44,532 1,397 81,158 75,530 5,628
34 Lakshadweep 64 50 14 230 194 36 349 276 73
35 Puducherry 698 662 36 2,795 1,587 1,208 3,951 2,637 1,314
All India 388,968 278,932 110,036 1,527,554 1,165,395 362,159 2,209,027 1,660,666 548,361
Note : In vacancy columns, the States where the Rank wise Police Personnal are surplus, is taken as ‘ 0’
CHAPTER 3

53
TABLE 3.7 -- ACTUAL STRENGTH OF WOMEN POLICE (RANK- WISE) AS ON 1.1.2013Sl.No. States / UTs. DGP/
Spl DG/
ADGP
IGP DIG AIGP/SSP/SP/
COM
ADDLSP/ Dy. COM
ASP/ Dy.SP/ Asst. COM
INSP. S.I. A.S.I. Head Const.
Const. Total
(1) (2) (3) (4) (5) (6) (7) (8) (9) (10) (11) (12) (13) (14)
1 Andhra Pradesh 2 1 4 1 3 1 29 54 54 548 1521 2,218
2 Arunachal Pradesh 0 1 0 2 0 0 5 16 5 14 538 581
3 Assam 0 0 0 6 6 20 3 60 30 78 432 635
4 Bihar 0 3 2 2 0 9 11 137 55 130 1,991 2,340
5 Chhattisgarh 0 0 0 3 5 23 57 35 40 130 1,720 2,013
6 Goa 0 0 0 0 0 2 7 13 0 146 174 342
7 Gujarat 1 0 2 0 6 6 6 100 254 565 1,116 2,056
8 Haryana 0 0 1 6 0 20 22 92 103 382 2,181 2,807
9 Himachal Pradesh 0 0 1 9 0 4 9 16 14 93 1269 1,415
10 Jammu & Kashmir 1 0 0 4 0 27 33 75 36 219 1,845 2,240
11 Jharkhand 1 2 2 4 1 6 7 37 80 182 1,630 1,952
12 Karnataka 1 1 0 10 0 17 28 82 191 533 2,780 3,643
13 Kerala 2 0 0 3 0 1 24 96 0 175 2739 3,040
14 Madhya Pradesh 2 4 3 7 18 64 130 431 449 324 2277 3,709
15 Maharashtra 2 3 0 16 0 33 95 410 417 2,849 13,724 17,549
16 Manipur 0 0 0 7 1 13 1 83 83 159 1,133 1,480
17 Meghalaya 0 0 0 2 2 3 11 75 10 23 230 356
18 Mizoram 0 0 0 1 0 10 19 116 106 168 167 587
19 Nagaland 0 0 0 7 8 15 11 24 35 11 148 259
20 Odisha 0 2 5 4 2 11 84 398 87 8 3174 3,775
21 Punjab 0 2 1 7 0 23 27 85 77 289 4,333 4,844
22 Rajasthan 0 2 3 11 2 41 10 146 35 92 5,411 5,753
23 Sikkim 0 0 0 3 0 13 12 21 4 8 236 297
24 Tamil Nadu 2 1 3 35 4 62 227 1,575 0 0 14,297 16,206
25 Tripura 0 0 0 3 1 4 5 43 52 58 610 776
26 Uttar Pradesh 1 5 3 10 10 65 4 212 0 112 6069 6,491
27 Uttarakhand 0 0 0 6 0 10 1 83 0 60 1,384 1,544
28 West Bengal 0 0 1 4 7 12 22 92 94 0 1,732 1,964
29 A&N Islands 0 0 0 2 0 0 9 9 2 42 368 432
30 Chandigarh 0 0 0 0 0 0 15 17 6 12 927 977
31 D&N Haveli 0 0 0 0 0 0 0 2 0 11 13 26
32 Daman & Diu 0 0 0 0 0 0 0 0 0 7 0 7
33 Delhi 0 1 0 2 2 20 87 262 625 522 3,500 5,021
34 Lakshadweep 0 0 0 0 0 0 0 1 0 1 14 16
35 Puducherry 0 0 0 0 0 2 1 11 3 2 148 167
All India 15 28 31 177 78 537 1,012 4,909 2,947 7,953 79,831 97,518
CHAPTER 3

54
TABLE 3.8 -- ACTUAL STRENGTH OF TRAFFIC POLICE (RANK-WISE) AS ON 1.1.2013Sl.No. States / UTs. DGP/
Spl DG/
ADGP
IGP DIG AIGP/SSP/SP/
COM
ADDLSP/Dy. COM
ASP/ Dy.SP/ Asst. COM
INSP. S.I. A.S.I. Head Const.
Const. Total
(1) (2) (3) (4) (5) (6) (7) (8) (9) (10) (11) (12) (13) (14)
1 Andhra Pradesh 0 0 0 1 1 5 35 77 107 331 1,423 1,980
2 Arunachal Pradesh 0 0 0 0 0 0 2 6 0 11 80 99
3 Assam 0 0 0 1 1 1 7 48 72 135 890 1,155
4 Bihar 0 0 0 1 0 3 7 19 37 51 200 318
5 Chhattisgarh 0 1 0 0 1 4 17 6 35 109 430 603
6 Goa 0 0 0 1 0 2 8 16 39 118 185 369
7 Gujarat 0 0 2 1 0 4 17 88 392 806 867 2,177
8 Haryana 0 0 0 1 0 6 26 28 173 133 1,124 1,491
9 Himachal Pradesh 0 1 0 1 1 0 2 6 8 10 49 78
10 Jammu & Kashmir 0 1 2 7 0 16 43 96 115 142 765 1,187
11 Jharkhand 0 0 0 1 0 2 7 54 108 145 736 1,053
12 Karnataka 1 1 0 2 0 11 59 361 450 1,398 3,691 5,974
13 Kerala 0 1 0 2 0 13 14 128 62 653 2093 2,966
14 Madhya Pradesh 1 1 0 1 0 5 37 88 115 401 1141 1,790
15 Maharashtra 1 0 0 4 0 23 134 198 754 4,299 3,814 9,227
16 Manipur 0 0 0 0 0 1 2 14 29 19 161 226
17 Meghalaya 0 0 0 0 0 2 6 46 0 100 226 380
18 Mizoram 0 0 0 1 1 1 2 6 2 20 204 237
19 Nagaland 0 0 0 1 0 2 3 7 13 2 258 286
20 Odisha 0 0 0 0 0 2 3 6 34 95 718 858
21 Punjab 0 1 0 1 5 6 16 26 125 383 1,070 1,633
22 Rajasthan 1 0 0 1 3 4 29 118 171 557 2,978 3,862
23 Sikkim 0 0 0 0 0 1 3 4 4 21 50 83
24 Tamil Nadu 1 1 1 7 0 24 184 508 0 3,398 2,031 6,155
25 Tripura 0 0 0 1 1 1 8 6 8 24 207 256
26 Uttar Pradesh 1 0 0 0 10 7 13 90 0 677 2,926 3,724
27 Uttarakhand 0 0 0 0 0 1 4 15 0 66 234 320
28 West Bengal 2 1 1 4 0 11 45 126 441 0 1,831 2,462
29 A&N Islands 0 0 0 0 0 1 4 2 2 13 118 140
30 Chandigarh 0 0 0 1 0 1 6 17 16 61 311 413
31 D&N Haveli 0 0 0 0 0 0 0 0 0 0 0 0
32 Daman & Diu 0 0 0 1 0 0 0 1 0 2 7 11
33 Delhi 1 1 1 1 2 16 65 214 256 1,225 4,063 5,845
34 Lakshadweep 0 0 0 0 0 0 0 0 0 0 0 0
35 Puducherry 0 0 0 0 0 1 4 10 1 13 130 159
All India 9 10 7 43 26 177 812 2,435 3,569 15,418 35,011 57,517
CHAPTER 3

55
CHAPTER 3
TABLE 3.9 -- SANCTIONED & ACTUAL STRENGTH OF SPECIAL BRANCH DEALING WITH INTELLIGENCE- AS ON 1.1.2013
Sl. No.
States / UTs. DGP/Addl. DGP IGP DIG
Sanc-tioned
Actual Sanc-tioned
Actual Sanc-tioned
Actual
(1) (2) (3) (4) (5) (6) (7) (8)
1 Andhra Pradesh 1 1 2 1 4 3
2 Arunachal Pradesh 0 0 0 0 0 0
3 Assam 2 2 2 0 2 1
4 Bihar 1 1 2 1 2 1
5 Chhattisgarh 1 1 1 0 2 0
6 Goa 0 0 0 0 0 0
7 Gujarat 1 0 2 3 4 3
8 Haryana 2 1 2 2 3 2
9 Himachal Pradesh 1 1 1 0 1 1
10 Jammu & Kashmir 1 0 1 1 2 2
11 Jharkhand 1 1 1 0 1 1
12 Karnataka 0 0 1 1 2 2
13 Kerala 1 1 3 3 2 1
14 Madhya Pradesh 1 1 4 4 0 0
15 Maharashtra 4 1 2 3 4 0
16 Manipur 1 1 1 1 1 0
17 Meghalaya 1 1 1 1 2 0
18 Mizoram 0 0 0 0 1 0
19 Nagaland 0 0 1 1 1 0
20 Odisha 1 1 1 1 1 1
21 Punjab 1 1 2 2 3 4
22 Rajasthan 1 1 2 1 3 1
23 Sikkim 1 0 1 1 0 0
24 Tamil Nadu 1 1 2 2 1 1
25 Tripura 0 0 0 0 0 0
26 Uttar Pradesh 1 1 3 2 1 1
27 Uttarakhand 0 1 1 0 1 0
28 West Bengal 1 1 2 2 2 2
29 A&N Islands 0 0 0 0 0 0
30 Chandigarh 0 0 0 0 0 0
31 D&N Haveli 0 0 0 0 0 0
32 Daman & Diu 0 0 0 0 0 0
33 Delhi 1 1 0 0 1 1
34 Lakshadweep 0 0 0 0 0 0
35 Puducherry 0 0 0 0 0 0
All India 27 21 41 33 47 28
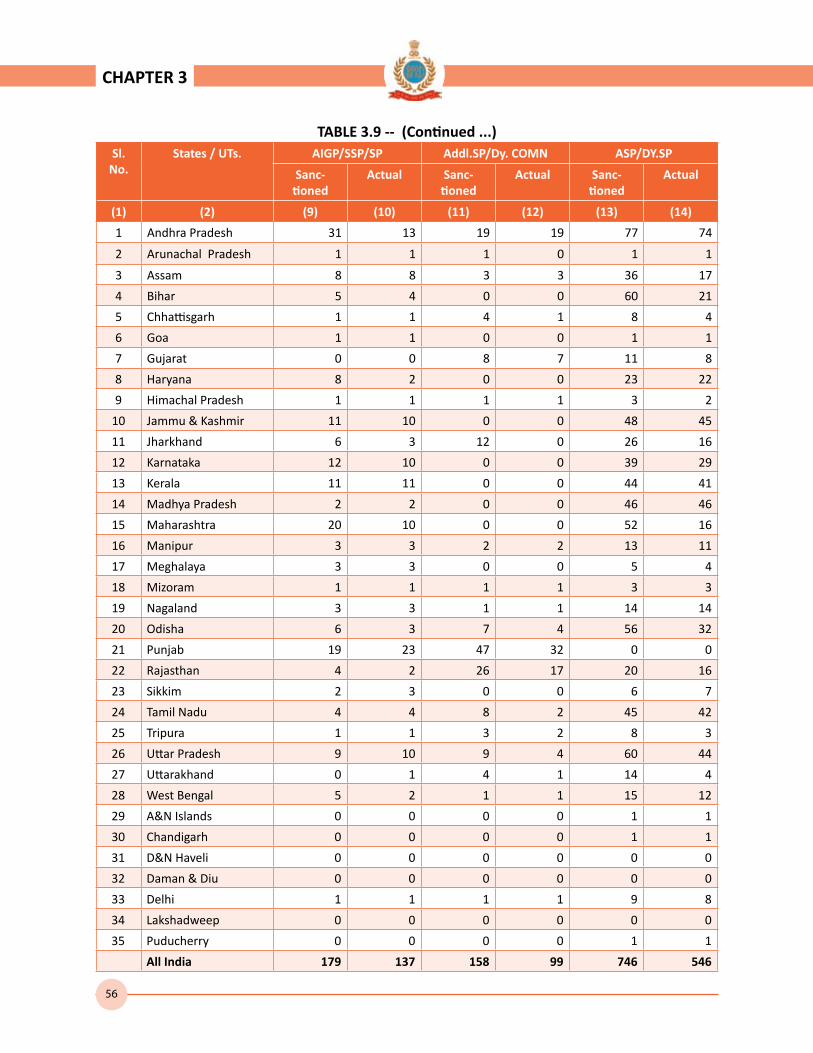
56
TABLE 3.9 -- (Continued ...)Sl.
No. States / UTs. AIGP/SSP/SP Addl.SP/Dy. COMN ASP/DY.SP
Sanc-tioned
Actual Sanc-tioned
Actual Sanc-tioned
Actual
(1) (2) (9) (10) (11) (12) (13) (14)
1 Andhra Pradesh 31 13 19 19 77 74
2 Arunachal Pradesh 1 1 1 0 1 1
3 Assam 8 8 3 3 36 17
4 Bihar 5 4 0 0 60 21
5 Chhattisgarh 1 1 4 1 8 4
6 Goa 1 1 0 0 1 1
7 Gujarat 0 0 8 7 11 8
8 Haryana 8 2 0 0 23 22
9 Himachal Pradesh 1 1 1 1 3 2
10 Jammu & Kashmir 11 10 0 0 48 45
11 Jharkhand 6 3 12 0 26 16
12 Karnataka 12 10 0 0 39 29
13 Kerala 11 11 0 0 44 41
14 Madhya Pradesh 2 2 0 0 46 46
15 Maharashtra 20 10 0 0 52 16
16 Manipur 3 3 2 2 13 11
17 Meghalaya 3 3 0 0 5 4
18 Mizoram 1 1 1 1 3 3
19 Nagaland 3 3 1 1 14 14
20 Odisha 6 3 7 4 56 32
21 Punjab 19 23 47 32 0 0
22 Rajasthan 4 2 26 17 20 16
23 Sikkim 2 3 0 0 6 7
24 Tamil Nadu 4 4 8 2 45 42
25 Tripura 1 1 3 2 8 3
26 Uttar Pradesh 9 10 9 4 60 44
27 Uttarakhand 0 1 4 1 14 4
28 West Bengal 5 2 1 1 15 12
29 A&N Islands 0 0 0 0 1 1
30 Chandigarh 0 0 0 0 1 1
31 D&N Haveli 0 0 0 0 0 0
32 Daman & Diu 0 0 0 0 0 0
33 Delhi 1 1 1 1 9 8
34 Lakshadweep 0 0 0 0 0 0
35 Puducherry 0 0 0 0 1 1
All India 179 137 158 99 746 546
CHAPTER 3
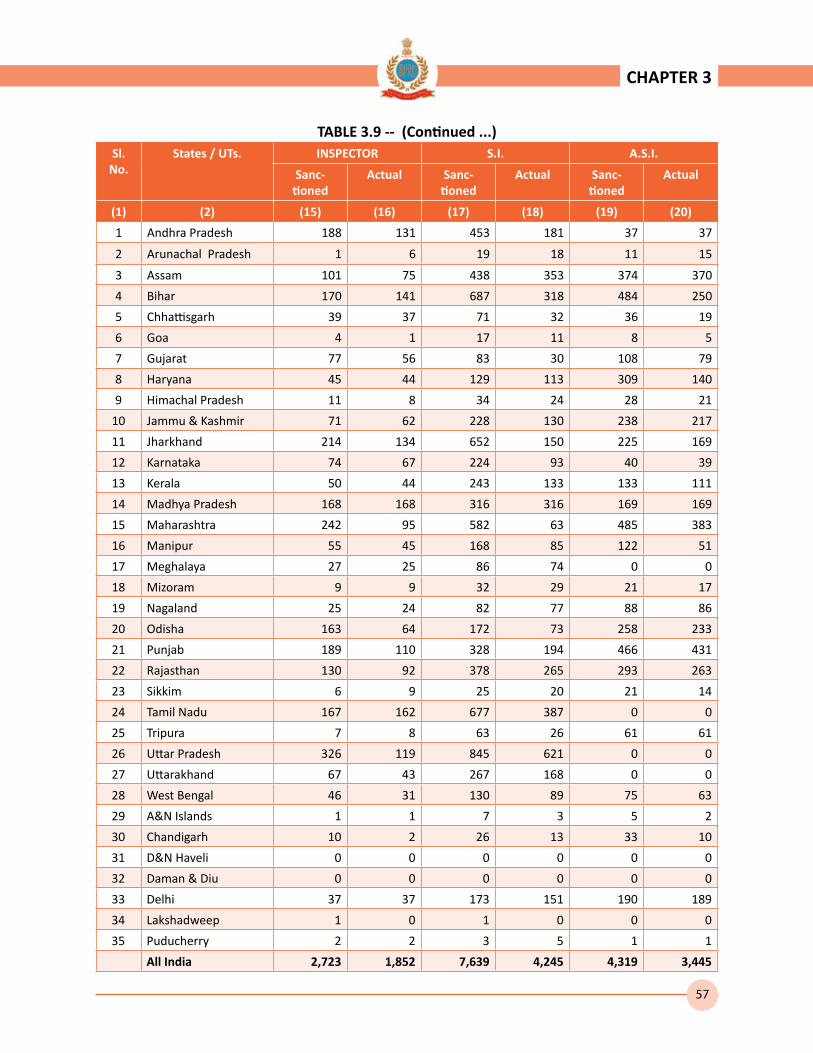
57
TABLE 3.9 -- (Continued ...)Sl.
No. States / UTs. INSPECTOR S.I. A.S.I.
Sanc-tioned
Actual Sanc-tioned
Actual Sanc-tioned
Actual
(1) (2) (15) (16) (17) (18) (19) (20)
1 Andhra Pradesh 188 131 453 181 37 37
2 Arunachal Pradesh 1 6 19 18 11 15
3 Assam 101 75 438 353 374 370
4 Bihar 170 141 687 318 484 250
5 Chhattisgarh 39 37 71 32 36 19
6 Goa 4 1 17 11 8 5
7 Gujarat 77 56 83 30 108 79
8 Haryana 45 44 129 113 309 140
9 Himachal Pradesh 11 8 34 24 28 21
10 Jammu & Kashmir 71 62 228 130 238 217
11 Jharkhand 214 134 652 150 225 169
12 Karnataka 74 67 224 93 40 39
13 Kerala 50 44 243 133 133 111
14 Madhya Pradesh 168 168 316 316 169 169
15 Maharashtra 242 95 582 63 485 383
16 Manipur 55 45 168 85 122 51
17 Meghalaya 27 25 86 74 0 0
18 Mizoram 9 9 32 29 21 17
19 Nagaland 25 24 82 77 88 86
20 Odisha 163 64 172 73 258 233
21 Punjab 189 110 328 194 466 431
22 Rajasthan 130 92 378 265 293 263
23 Sikkim 6 9 25 20 21 14
24 Tamil Nadu 167 162 677 387 0 0
25 Tripura 7 8 63 26 61 61
26 Uttar Pradesh 326 119 845 621 0 0
27 Uttarakhand 67 43 267 168 0 0
28 West Bengal 46 31 130 89 75 63
29 A&N Islands 1 1 7 3 5 2
30 Chandigarh 10 2 26 13 33 10
31 D&N Haveli 0 0 0 0 0 0
32 Daman & Diu 0 0 0 0 0 0
33 Delhi 37 37 173 151 190 189
34 Lakshadweep 1 0 1 0 0 0
35 Puducherry 2 2 3 5 1 1
All India 2,723 1,852 7,639 4,245 4,319 3,445
CHAPTER 3
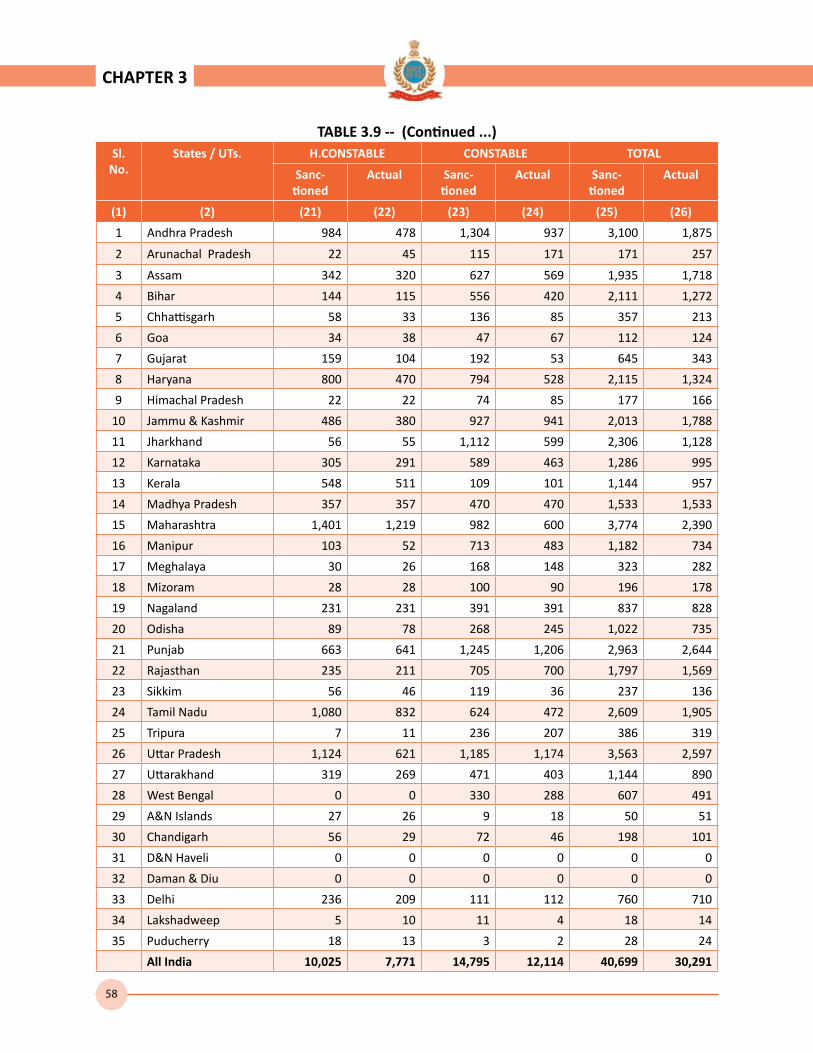
58
TABLE 3.9 -- (Continued ...)Sl.
No. States / UTs. H.CONSTABLE CONSTABLE TOTAL
Sanc-tioned
Actual Sanc-tioned
Actual Sanc-tioned
Actual
(1) (2) (21) (22) (23) (24) (25) (26)
1 Andhra Pradesh 984 478 1,304 937 3,100 1,875
2 Arunachal Pradesh 22 45 115 171 171 257
3 Assam 342 320 627 569 1,935 1,718
4 Bihar 144 115 556 420 2,111 1,272
5 Chhattisgarh 58 33 136 85 357 213
6 Goa 34 38 47 67 112 124
7 Gujarat 159 104 192 53 645 343
8 Haryana 800 470 794 528 2,115 1,324
9 Himachal Pradesh 22 22 74 85 177 166
10 Jammu & Kashmir 486 380 927 941 2,013 1,788
11 Jharkhand 56 55 1,112 599 2,306 1,128
12 Karnataka 305 291 589 463 1,286 995
13 Kerala 548 511 109 101 1,144 957
14 Madhya Pradesh 357 357 470 470 1,533 1,533
15 Maharashtra 1,401 1,219 982 600 3,774 2,390
16 Manipur 103 52 713 483 1,182 734
17 Meghalaya 30 26 168 148 323 282
18 Mizoram 28 28 100 90 196 178
19 Nagaland 231 231 391 391 837 828
20 Odisha 89 78 268 245 1,022 735
21 Punjab 663 641 1,245 1,206 2,963 2,644
22 Rajasthan 235 211 705 700 1,797 1,569
23 Sikkim 56 46 119 36 237 136
24 Tamil Nadu 1,080 832 624 472 2,609 1,905
25 Tripura 7 11 236 207 386 319
26 Uttar Pradesh 1,124 621 1,185 1,174 3,563 2,597
27 Uttarakhand 319 269 471 403 1,144 890
28 West Bengal 0 0 330 288 607 491
29 A&N Islands 27 26 9 18 50 51
30 Chandigarh 56 29 72 46 198 101
31 D&N Haveli 0 0 0 0 0 0
32 Daman & Diu 0 0 0 0 0 0
33 Delhi 236 209 111 112 760 710
34 Lakshadweep 5 10 11 4 18 14
35 Puducherry 18 13 3 2 28 24
All India 10,025 7,771 14,795 12,114 40,699 30,291
CHAPTER 3

59
TABLE 3.10-- SANCTIONED & ACTUAL STRENGTH OF C.I.D. OF CRIME BRANCH DEALING WITH INVESTIGATION OF CRIME - AS ON 1.1.2013
Sl. No.
States / UTs. DGP/Addl. DGP IGP DIG
Sanc-tioned
Actual Sanc-tioned
Actual Sanc-tioned
Actual
(1) (2) (3) (4) (5) (6) (7) (8)
1 Andhra Pradesh 1 1 5 2 3 1
2 Arunachal Pradesh 0 0 0 0 0 0
3 Assam 1 1 1 0 1 1
4 Bihar 1 1 3 2 2 2
5 Chhattisgarh 1 0 1 1 1 1
6 Goa 0 0 0 0 0 0
7 Gujarat 1 1 3 2 5 4
8 Haryana 1 1 1 1 1 1
9 Himachal Pradesh 1 0 1 0 1 1
10 Jammu & Kashmir 0 0 1 1 1 1
11 Jharkhand 1 1 2 2 1 1
12 Karnataka 3 2 0 0 2 2
13 Kerala 1 1 2 1 0 0
14 Madhya Pradesh 2 2 3 3 1 1
15 Maharashtra 1 1 4 2 2 2
16 Manipur 0 0 0 0 0 0
17 Meghalaya 1 1 1 1 1 1
18 Mizoram 0 0 0 0 0 0
19 Nagaland 0 0 1 1 1 0
20 Odisha 1 1 1 1 2 0
21 Punjab 1 1 2 2 2 2
22 Rajasthan 3 2 4 4 4 3
23 Sikkim 0 1 1 1 0 0
24 Tamil Nadu 1 1 1 0 1 1
25 Tripura 0 0 1 1 1 1
26 Uttar Pradesh 1 1 2 2 1 1
27 Uttarakhand 1 1 0 0 1 0
28 West Bengal 2 2 2 0 4 2
29 A&N Islands 0 0 0 0 0 0
30 Chandigarh 0 0 0 0 0 0
31 D&N Haveli 0 0 0 0 0 0
32 Daman & Diu 0 0 0 0 0 0
33 Delhi 1 1 1 2 2 0
34 Lakshadweep 0 0 0 0 0 0
35 Puducherry 0 0 0 0 0 0
All India 27 24 44 32 41 29
CHAPTER 3
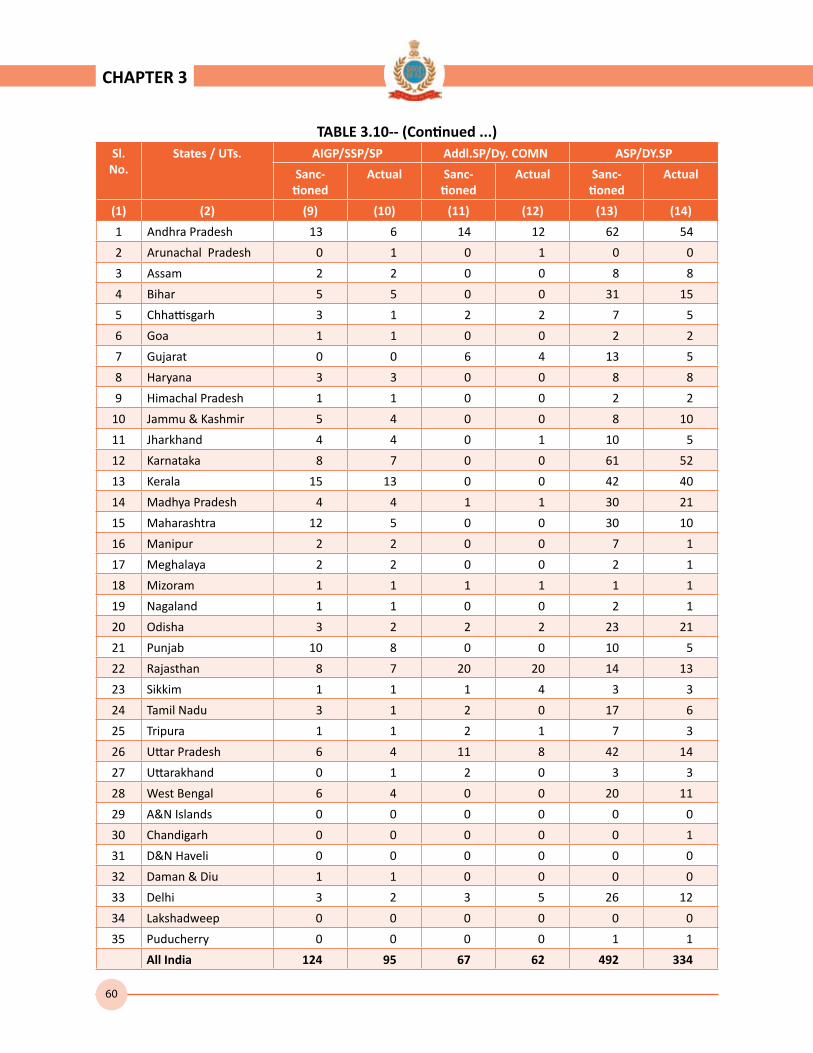
60
TABLE 3.10-- (Continued ...)Sl.
No. States / UTs. AIGP/SSP/SP Addl.SP/Dy. COMN ASP/DY.SP
Sanc-tioned
Actual Sanc-tioned
Actual Sanc-tioned
Actual
(1) (2) (9) (10) (11) (12) (13) (14)
1 Andhra Pradesh 13 6 14 12 62 54
2 Arunachal Pradesh 0 1 0 1 0 0
3 Assam 2 2 0 0 8 8
4 Bihar 5 5 0 0 31 15
5 Chhattisgarh 3 1 2 2 7 5
6 Goa 1 1 0 0 2 2
7 Gujarat 0 0 6 4 13 5
8 Haryana 3 3 0 0 8 8
9 Himachal Pradesh 1 1 0 0 2 2
10 Jammu & Kashmir 5 4 0 0 8 10
11 Jharkhand 4 4 0 1 10 5
12 Karnataka 8 7 0 0 61 52
13 Kerala 15 13 0 0 42 40
14 Madhya Pradesh 4 4 1 1 30 21
15 Maharashtra 12 5 0 0 30 10
16 Manipur 2 2 0 0 7 1
17 Meghalaya 2 2 0 0 2 1
18 Mizoram 1 1 1 1 1 1
19 Nagaland 1 1 0 0 2 1
20 Odisha 3 2 2 2 23 21
21 Punjab 10 8 0 0 10 5
22 Rajasthan 8 7 20 20 14 13
23 Sikkim 1 1 1 4 3 3
24 Tamil Nadu 3 1 2 0 17 6
25 Tripura 1 1 2 1 7 3
26 Uttar Pradesh 6 4 11 8 42 14
27 Uttarakhand 0 1 2 0 3 3
28 West Bengal 6 4 0 0 20 11
29 A&N Islands 0 0 0 0 0 0
30 Chandigarh 0 0 0 0 0 1
31 D&N Haveli 0 0 0 0 0 0
32 Daman & Diu 1 1 0 0 0 0
33 Delhi 3 2 3 5 26 12
34 Lakshadweep 0 0 0 0 0 0
35 Puducherry 0 0 0 0 1 1
All India 124 95 67 62 492 334
CHAPTER 3

61
TABLE 3.10-- (Continued ...)Sl.
No. States / UTs. INSPECTOR S.I. A.S.I.
Sanc-tioned
Actual Sanc-tioned
Actual Sanc-tioned
Actual
(1) (2) (15) (16) (17) (18) (19) (20)
1 Andhra Pradesh 170 142 262 84 0 0
2 Arunachal Pradesh 0 3 0 1 0 0
3 Assam 78 63 75 73 57 53
4 Bihar 89 62 304 103 112 75
5 Chhattisgarh 34 24 43 22 1 1
6 Goa 3 3 7 1 3 3
7 Gujarat 71 37 54 42 103 67
8 Haryana 22 22 53 53 89 89
9 Himachal Pradesh 7 5 12 8 13 9
10 Jammu & Kashmir 23 20 59 32 71 66
11 Jharkhand 53 50 118 53 58 49
12 Karnataka 60 54 70 22 0 0
13 Kerala 64 61 80 70 90 79
14 Madhya Pradesh 100 87 44 34 3 2
15 Maharashtra 127 113 28 2 92 47
16 Manipur 11 10 21 13 11 4
17 Meghalaya 18 16 28 26 0 0
18 Mizoram 9 9 7 7 5 4
19 Nagaland 1 1 2 2 3 3
20 Odisha 56 29 27 25 86 85
21 Punjab 25 11 9 9 9 9
22 Rajasthan 63 61 83 81 30 30
23 Sikkim 8 4 14 9 7 2
24 Tamil Nadu 48 44 49 23 0 0
25 Tripura 30 17 11 10 1 3
26 Uttar Pradesh 184 57 5 5 0 0
27 Uttarakhand 20 14 3 11 0 0
28 West Bengal 105 57 229 124 145 90
29 A&N Islands 0 1 1 3 0 0
30 Chandigarh 0 1 0 8 0 3
31 D&N Haveli 0 0 0 0 0 0
32 Daman & Diu 0 0 0 1 0 0
33 Delhi 114 97 249 220 184 173
34 Lakshadweep 0 0 0 0 0 0
35 Puducherry 3 6 3 5 0 0
All India 1,596 1,181 1,950 1,182 1,173 946
CHAPTER 3

62
TABLE 3.10 -- (Continued ...)Sl.
No. States / UTs. H.CONSTABLE CONSTABLE TOTAL
Sanc-tioned Actual
Sanc-tioned Actual
Sanc-tioned Actual
(1) (2) (21) (22) (23) (24) (25) (26)
1 Andhra Pradesh 254 166 398 256 1,182 724
2 Arunachal Pradesh 0 1 0 9 0 16
3 Assam 23 21 150 106 396 328
4 Bihar 61 43 280 223 888 531
5 Chhattisgarh 32 14 64 35 189 106
6 Goa 15 14 20 31 51 55
7 Gujarat 180 180 380 349 816 691
8 Haryana 186 186 255 255 619 619
9 Himachal Pradesh 22 24 35 32 95 82
10 Jammu & Kashmir 197 202 452 373 817 709
11 Jharkhand 34 21 226 184 507 371
12 Karnataka 106 87 294 153 604 379
13 Kerala 269 252 300 280 863 797
14 Madhya Pradesh 58 55 136 123 382 333
15 Maharashtra 333 309 44 37 673 528
16 Manipur 4 0 36 32 92 62
17 Meghalaya 7 7 35 32 95 87
18 Mizoram 11 11 35 33 70 67
19 Nagaland 3 3 8 10 22 22
20 Odisha 0 0 48 46 249 212
21 Punjab 22 21 27 24 117 92
22 Rajasthan 180 180 701 701 1,110 1,102
23 Sikkim 11 8 40 18 86 51
24 Tamil Nadu 243 118 218 83 583 277
25 Tripura 22 22 21 6 97 65
26 Uttar Pradesh 38 34 248 248 538 374
27 Uttarakhand 8 14 60 54 98 98
28 West Bengal 0 0 310 219 823 509
29 A&N Islands 4 5 13 23 18 32
30 Chandigarh 0 13 0 44 0 70
31 D&N Haveli 0 0 0 0 0 0
32 Daman & Diu 2 2 1 1 4 5
33 Delhi 767 549 1,076 1,012 2,426 2,073
34 Lakshadweep 0 0 0 0 0 0
35 Puducherry 3 9 2 7 12 28
All India 3,095 2,571 5,913 5,039 14,522 11,495
CHAPTER 3

63
TABLE 3.11 -- SANCTIONED & ACTUAL STRENGTH OF SPECIAL TASK FORCE TO DEAL WITHINSERGENTS/EXTREMISTS/TERRORISTS/ORGANISED CRIMINAL GANGS-AS ON 1.1.2013
Sl. No.
States / UTs. DGP/Addl. DGP IGP DIG
Sanc-tioned
Actual Sanc-tioned
Actual Sanc-tioned
Actual
(1) (2) (3) (4) (5) (6) (7) (8)
1 Andhra Pradesh 1 0 1 0 1 1
2 Arunachal Pradesh 0 0 0 0 0 0
3 Assam 1 1 1 0 0 0
4 Bihar 0 0 1 1 1 0
5 Chhattisgarh 0 0 0 0 1 1
6 Goa 0 0 0 0 0 0
7 Gujarat 1 1 0 0 1 1
8 Haryana 0 0 0 0 0 09 Himachal Pradesh 0 0 0 0 0 0
10 Jammu & Kashmir 0 0 0 0 0 0
11 Jharkhand 0 0 1 0 1 1
12 Karnataka 1 1 3 2 2 213 Kerala 0 0 0 0 0 0
14 Madhya Pradesh 0 1 0 0 0 015 Maharashtra 2 1 2 2 3 2
16 Manipur 0 0 0 0 0 017 Meghalaya 0 0 0 0 0 0
18 Mizoram 0 0 0 0 0 019 Nagaland 0 0 0 0 0 0
20 Odisha 0 0 0 0 1 021 Punjab 0 0 1 1 0 1
22 Rajasthan 1 1 1 0 2 2
23 Sikkim 0 0 0 0 0 024 Tamil Nadu 0 0 1 1 0 025 Tripura 0 0 0 0 0 026 Uttar Pradesh 1 1 1 1 2 027 Uttarakhand 0 0 0 0 0 0
28 West Bengal 0 0 0 0 0 029 A&N Islands 0 0 0 0 0 030 Chandigarh 0 0 0 0 0 031 D&N Haveli 0 0 0 0 0 032 Daman & Diu 0 0 0 0 0 0
33 Delhi 0 1 2 0 0 034 Lakshadweep 0 0 0 0 0 035 Puducherry 0 0 0 0 0 0
All India 8 8 15 8 15 11
CHAPTER 3

64
TABLE 3.11 -- (Continued ...)Sl.
No. States / UTs. AIGP/SSP/SP Addl.SP/Dy. COMN ASP/DY.SP
Sanc-tioned Actual
Sanc-tioned Actual
Sanc-tioned Actual
(1) (2) (9) (10) (11) (12) (13) (14)
1 Andhra Pradesh 8 1 7 4 44 32
2 Arunachal Pradesh 0 0 0 0 0 0
3 Assam 0 0 2 2 4 2
4 Bihar 2 0 16 16 25 13
5 Chhattisgarh 3 2 3 0 23 1
6 Goa 0 0 0 0 0 0
7 Gujarat 0 0 2 1 5 4
8 Haryana 1 1 0 0 2 1
9 Himachal Pradesh 0 0 0 0 0 0
10 Jammu & Kashmir 0 0 0 0 0 0
11 Jharkhand 2 2 0 0 44 44
12 Karnataka 14 3 5 2 14 12
13 Kerala 0 0 0 0 0 0
14 Madhya Pradesh 0 1 0 0 0 0
15 Maharashtra 8 7 0 0 21 0
16 Manipur 0 0 0 0 8 4
17 Meghalaya 0 1 0 2 0 0
18 Mizoram 0 0 0 0 0 0
19 Nagaland 0 0 0 0 0 0
20 Odisha 5 3 10 6 49 16
21 Punjab 0 0 0 0 0 0
22 Rajasthan 2 0 4 3 17 14
23 Sikkim 0 0 0 0 1 0
24 Tamil Nadu 2 1 1 0 4 3
25 Tripura 0 0 0 0 0 0
26 Uttar Pradesh 1 1 10 3 19 11
27 Uttarakhand 1 1 1 1 1 0
28 West Bengal 0 0 0 0 0 0
29 A&N Islands 0 0 0 0 0 0
30 Chandigarh 1 0 0 0 2 1
31 D&N Haveli 0 0 0 0 0 0
32 Daman & Diu 0 0 0 0 0 0
33 Delhi 2 0 0 1 7 6
34 Lakshadweep 0 0 0 0 0 0
35 Puducherry 0 0 0 0 0 0
All India 52 24 61 41 290 164
CHAPTER 3

65
TABLE 3.11 -- (Continued ...)Sl.
No. States / UTs. INSPECTOR S.I. A.S.I.
Sanc-tioned Actual
Sanc-tioned Actual
Sanc-tioned Actual
(1) (2) (15) (16) (17) (18) (19) (20)
1 Andhra Pradesh 115 60 280 150 29 10
2 Arunachal Pradesh 0 0 0 0 0 0
3 Assam 7 6 22 20 10 10
4 Bihar 0 0 76 73 0 0
5 Chhattisgarh 40 17 54 21 87 84
6 Goa 0 0 0 0 0 0
7 Gujarat 12 10 76 37 61 58
8 Haryana 9 9 17 17 48 21
9 Himachal Pradesh 0 0 0 0 0 0
10 Jammu & Kashmir 0 0 0 0 0 0
11 Jharkhand 48 39 304 68 107 64
12 Karnataka 44 39 97 3 20 3
13 Kerala 0 0 0 0 0 0
14 Madhya Pradesh 8 8 32 16 0 0
15 Maharashtra 60 50 154 74 117 45
16 Manipur 16 16 82 110 54 16
17 Meghalaya 0 4 0 0 0 5
18 Mizoram 0 1 0 2 0 0
19 Nagaland 0 0 0 119 0 20
20 Odisha 94 11 254 153 50 20
21 Punjab 0 0 0 0 0 0
22 Rajasthan 33 22 69 34 14 3
23 Sikkim 0 0 2 2 0 0
24 Tamil Nadu 9 8 27 27 0 0
25 Tripura 0 0 0 0 0 0
26 Uttar Pradesh 20 8 82 36 16 15
27 Uttarakhand 0 3 5 5 0 1
28 West Bengal 0 0 0 0 0 0
29 A&N Islands 0 0 0 0 0 0
30 Chandigarh 4 2 12 6 12 3
31 D&N Haveli 0 0 0 0 0 0
32 Daman & Diu 0 0 0 0 0 0
33 Delhi 40 35 183 167 176 155
34 Lakshadweep 0 0 0 0 0 0
35 Puducherry 0 0 0 0 0 0
All India 559 348 1,828 1,140 801 533
CHAPTER 3

66
TABLE 3.11 -- (Continued ...)Sl.
No. States / UTs. H.CONSTABLE CONSTABLE TOTAL
Sanc-tioned Actual
Sanc-tioned Actual
Sanc-tioned Actual
(1) (2) (21) (22) (23) (24) (25) (26)
1 Andhra Pradesh 643 320 2,201 1,602 3,330 2,180
2 Arunachal Pradesh 0 0 0 0 0 0
3 Assam 8 8 37 23 92 72
4 Bihar 150 8 718 740 989 851
5 Chhattisgarh 303 189 1,196 1,160 1,710 1,475
6 Goa 0 0 0 0 0 0
7 Gujarat 153 145 470 321 781 578
8 Haryana 72 70 420 340 569 459
9 Himachal Pradesh 54 21 486 276 540 297
10 Jammu & Kashmir 0 0 0 0 0 0
11 Jharkhand 659 212 2,559 1,451 3,725 1,881
12 Karnataka 88 23 369 111 657 201
13 Kerala 0 0 0 0 0 0
14 Madhya Pradesh 21 10 65 59 126 95
15 Maharashtra 446 44 744 211 1,557 436
16 Manipur 108 165 1,592 1,424 1,860 1,735
17 Meghalaya 0 181 0 193 0 386
18 Mizoram 0 10 0 78 0 91
19 Nagaland 0 521 0 4,211 0 4,871
20 Odisha 332 253 2,320 1,859 3,115 2,321
21 Punjab 0 0 0 0 1 2
22 Rajasthan 39 15 216 150 398 244
23 Sikkim 0 1 27 27 30 30
24 Tamil Nadu 52 19 143 174 239 233
25 Tripura 0 0 0 0 0 0
26 Uttar Pradesh 56 46 209 95 417 217
27 Uttarakhand 2 6 25 22 35 39
28 West Bengal 0 0 0 0 0 0
29 A&N Islands 0 0 0 0 0 0
30 Chandigarh 16 12 53 115 100 139
31 D&N Haveli 0 0 0 0 0 0
32 Daman & Diu 0 0 0 0 0 0
33 Delhi 137 152 234 283 781 800
34 Lakshadweep 0 0 0 0 0 0
35 Puducherry 0 0 0 0 0 0
All India 3,339 2,431 14,084 14,925 21,052 19,633
CHAPTER 3
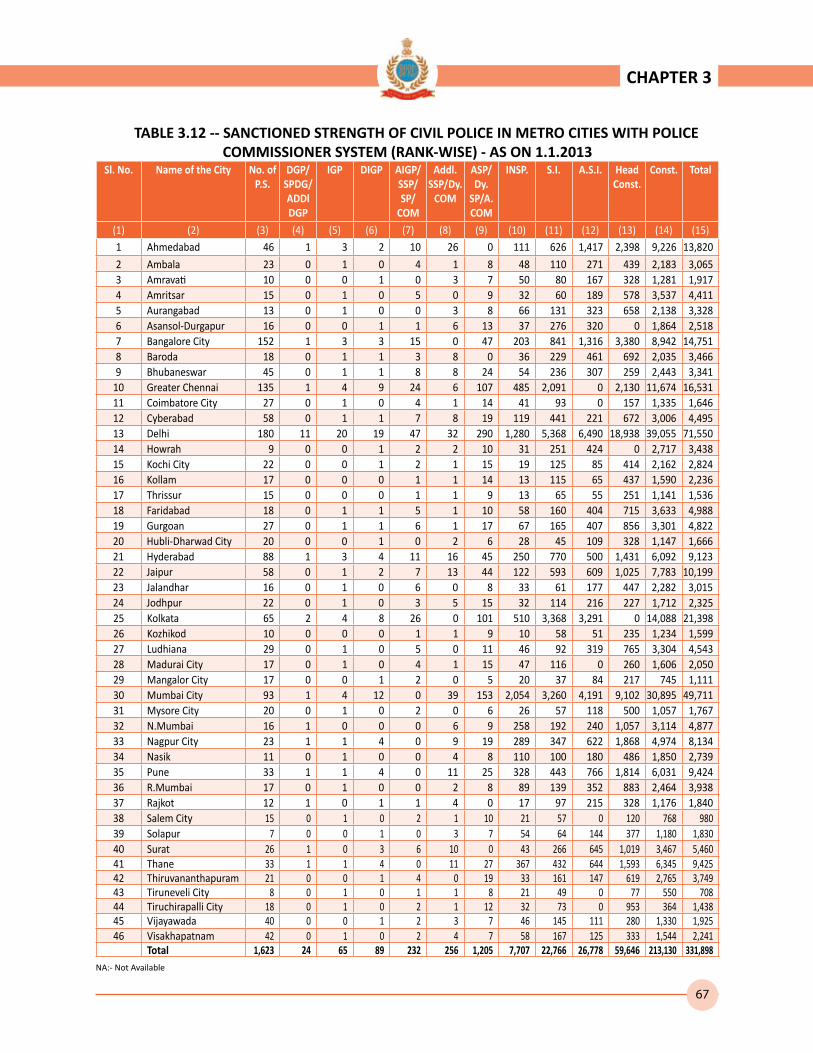
67
TABLE 3.12 -- SANCTIONED STRENGTH OF CIVIL POLICE IN METRO CITIES WITH POLICE COMMISSIONER SYSTEM (RANK-WISE) - AS ON 1.1.2013
Sl. No. Name of the City No. of P.S.
DGP/ SPDG/ADDl DGP
IGP DIGP AIGP/ SSP/ SP/
COM
Addl.SSP/Dy.
COM
ASP/ Dy.
SP/A. COM
INSP. S.I. A.S.I. Head Const.
Const. Total
(1) (2) (3) (4) (5) (6) (7) (8) (9) (10) (11) (12) (13) (14) (15) 1 Ahmedabad 46 1 3 2 10 26 0 111 626 1,417 2,398 9,226 13,820
2 Ambala 23 0 1 0 4 1 8 48 110 271 439 2,183 3,0653 Amravati 10 0 0 1 0 3 7 50 80 167 328 1,281 1,9174 Amritsar 15 0 1 0 5 0 9 32 60 189 578 3,537 4,4115 Aurangabad 13 0 1 0 0 3 8 66 131 323 658 2,138 3,3286 Asansol-Durgapur 16 0 0 1 1 6 13 37 276 320 0 1,864 2,5187 Bangalore City 152 1 3 3 15 0 47 203 841 1,316 3,380 8,942 14,7518 Baroda 18 0 1 1 3 8 0 36 229 461 692 2,035 3,4669 Bhubaneswar 45 0 1 1 8 8 24 54 236 307 259 2,443 3,341
10 Greater Chennai 135 1 4 9 24 6 107 485 2,091 0 2,130 11,674 16,53111 Coimbatore City 27 0 1 0 4 1 14 41 93 0 157 1,335 1,64612 Cyberabad 58 0 1 1 7 8 19 119 441 221 672 3,006 4,49513 Delhi 180 11 20 19 47 32 290 1,280 5,368 6,490 18,938 39,055 71,55014 Howrah 9 0 0 1 2 2 10 31 251 424 0 2,717 3,43815 Kochi City 22 0 0 1 2 1 15 19 125 85 414 2,162 2,82416 Kollam 17 0 0 0 1 1 14 13 115 65 437 1,590 2,23617 Thrissur 15 0 0 0 1 1 9 13 65 55 251 1,141 1,53618 Faridabad 18 0 1 1 5 1 10 58 160 404 715 3,633 4,98819 Gurgoan 27 0 1 1 6 1 17 67 165 407 856 3,301 4,82220 Hubli-Dharwad City 20 0 0 1 0 2 6 28 45 109 328 1,147 1,66621 Hyderabad 88 1 3 4 11 16 45 250 770 500 1,431 6,092 9,12322 Jaipur 58 0 1 2 7 13 44 122 593 609 1,025 7,783 10,19923 Jalandhar 16 0 1 0 6 0 8 33 61 177 447 2,282 3,01524 Jodhpur 22 0 1 0 3 5 15 32 114 216 227 1,712 2,32525 Kolkata 65 2 4 8 26 0 101 510 3,368 3,291 0 14,088 21,39826 Kozhikod 10 0 0 0 1 1 9 10 58 51 235 1,234 1,59927 Ludhiana 29 0 1 0 5 0 11 46 92 319 765 3,304 4,54328 Madurai City 17 0 1 0 4 1 15 47 116 0 260 1,606 2,05029 Mangalor City 17 0 0 1 2 0 5 20 37 84 217 745 1,11130 Mumbai City 93 1 4 12 0 39 153 2,054 3,260 4,191 9,102 30,895 49,71131 Mysore City 20 0 1 0 2 0 6 26 57 118 500 1,057 1,76732 N.Mumbai 16 1 0 0 0 6 9 258 192 240 1,057 3,114 4,87733 Nagpur City 23 1 1 4 0 9 19 289 347 622 1,868 4,974 8,13434 Nasik 11 0 1 0 0 4 8 110 100 180 486 1,850 2,73935 Pune 33 1 1 4 0 11 25 328 443 766 1,814 6,031 9,42436 R.Mumbai 17 0 1 0 0 2 8 89 139 352 883 2,464 3,93837 Rajkot 12 1 0 1 1 4 0 17 97 215 328 1,176 1,84038 Salem City 15 0 1 0 2 1 10 21 57 0 120 768 98039 Solapur 7 0 0 1 0 3 7 54 64 144 377 1,180 1,83040 Surat 26 1 0 3 6 10 0 43 266 645 1,019 3,467 5,46041 Thane 33 1 1 4 0 11 27 367 432 644 1,593 6,345 9,42542 Thiruvananthapuram 21 0 0 1 4 0 19 33 161 147 619 2,765 3,74943 Tiruneveli City 8 0 1 0 1 1 8 21 49 0 77 550 70844 Tiruchirapalli City 18 0 1 0 2 1 12 32 73 0 953 364 1,43845 Vijayawada 40 0 0 1 2 3 7 46 145 111 280 1,330 1,92546 Visakhapatnam 42 0 1 0 2 4 7 58 167 125 333 1,544 2,241
Total 1,623 24 65 89 232 256 1,205 7,707 22,766 26,778 59,646 213,130 331,898
CHAPTER 3
NA:- Not Available

68
TABLE 3.13 -- SANCTIONED STRENGTH OF ARMED POLICE IN METRO CITIESWITH POLICE COMMISSIONER SYSTEM (RANK-WISE) - AS ON 1.1.2013
Sl. No. Name of the City DGP/ SPDG/ADDl DGP
IGP DIGP AIGP/ SSP/ SP/
COM
Addl. SSP/ Dy.
COM
ASP/ Dy.
SP/A. COM
INSP. S.I. A.S.I. Head Const.
Const. Total
(1) (2) (3) (4) (5) (6) (7) (8) (9) (10) (11) (12) (13) (14)
1 Ahmedabad 0 0 0 1 3 0 8 25 311 563 2,376 3,287
2 Ambala 0 0 1 1 5 16 47 131 214 688 3,598 4,701
3 Asansol-Durgapur 0 0 0 0 0 1 9 37 104 0 535 686
4 Amristrar 0 0 0 0 6 0 0 0 0 0 0 6
5 Bangalore City 0 0 0 4 13 0 25 74 135 1,311 2,813 4,375
6 Baroda 0 0 1 2 0 0 1 14 75 113 494 700
7 Bhubaneswar 0 0 0 2 4 17 16 55 71 381 1,626 2,172
8 Greater Chennai 0 0 0 3 1 10 30 145 0 764 5,021 5,974
9 Coimbatore City 0 1 0 1 1 3 4 37 0 73 872 992
10 Cyberabad 0 0 0 1 1 4 11 24 72 216 936 1,265
11 Delhi 0 0 0 6 22 58 70 437 262 1,879 6,874 9,608
12 Gurgoan 0 0 1 1 5 16 47 131 214 688 3,598 4,701
13 Faridabad 0 0 1 1 5 16 47 131 214 688 3,598 4,701
14 Howrah 0 0 0 0 0 1 8 46 88 0 546 689
16 Hubli-Dharwad City
0 0 0 1 0 0 2 12 27 132 442 616
18 Hyderabad 0 0 0 1 3 6 28 78 186 558 2,418 3,278
19 Jalandhar 0 0 0 0 5 0 0 0 0 0 0 5
20 Jodhpur 0 0 0 0 0 0 2 10 0 66 410 488
21 Kolkata 0 0 1 9 0 44 111 362 1,617 0 7,229 9,373
23 Ludhaina 0 0 0 6 0 0 0 0 0 0 0 6
24 Madurai 0 0 0 1 0 3 11 37 0 86 872 1,010
25 Mangalor City 0 0 0 1 0 1 2 9 21 53 133 220
26 Mysore City 0 0 0 1 0 4 6 22 25 144 662 864
27 Rajkot 0 0 1 1 0 0 2 5 66 102 548 725
28 Salem 0 0 0 0 0 2 4 16 0 24 317 363
29 Surat 0 0 0 2 0 0 1 16 99 177 794 1,089
30 Tirunelveli City 0 0 0 1 0 1 4 17 0 35 439 497
31 Triuchirapalli City 0 0 0 0 0 3 5 22 0 58 480 568
32 Vijaywada 0 0 0 1 0 2 7 17 48 144 624 843
33 Visakhapatnam 0 0 0 1 1 2 7 19 54 162 702 948
Total 0 1 5 47 67 194 515 1,929 3,903 9,105 48,957 64,723
CHAPTER 3

69
TABLE 3.14 -- OFFICERS TO CONSTABULARY RATIO OF CIVIL POLICE IN METRO CITIES WITH POLICE COMMISSIONER SYSTEM - AS ON 1.1.2013
Sl. No.
Name of the City Teeth to Tail Ratio DG to ASI HC & Const. Ratio
(1) (2) (3) (4) (5)
1 Ahmedabad 2,196 11,624 1 : 5.32 Ambala 443 2,622 1 : 5.93 Amravati 636 1,281 1 : 2.04 Amritsar 296 4,115 1 : 13.95 Aurangabad 532 2,796 1 : 5.36 Asansol 654 1,864 1 : 2.97 Bangalore 2,429 12,322 1 : 5.18 Baroda 1,431 2,035 1 : 1.49 Bhubaneswar 639 2,702 1 : 4.2
10 Greater Chennai 2,727 13,804 1 : 5.111 Coimbatore City 154 1,492 1 : 9.712 Cyberabad 817 3,678 1 : 4.513 Delhi 13,557 57,993 1 : 4.314 Howrah 721 2,717 1 : 3.815 Kochi City 248 2,576 1 : 10.416 Kollam 209 2,027 1 : 9.717 Thrissur 144 1,392 1 : 9.718 Faridabad 640 4,348 1 : 6.819 Gurgoan 665 4,157 1 : 6.320 Hubli-Dharwad City 519 1,147 1 : 2.221 Hyderabad 1,600 7,523 1 : 4.722 Jaipur 1,391 8,808 1 : 6.323 Jalandhar 286 2,729 1 : 9.524 Jodhpur 386 1,939 1 : 5.025 Kolkala 4,019 14,088 1 : 3.526 Kozhikod 130 1,469 1 : 11.327 Ludhiana 474 4,069 1 : 8.628 Madurai City 184 1,866 1 : 10.129 Mangalor City 366 745 1 : 2.030 Mumbai City 9,714 39,997 1 : 4.131 Mysore 210 1,557 1 : 7.432 N.Mumbai 706 4,171 1 : 5.933 Nagpur City 1,292 6,842 1 : 5.334 Nasik 403 2,336 1 : 5.835 Pune 1,579 7,845 1 : 5.036 R.Mumbai 591 3,347 1 : 5.737 Rajkot 336 1,504 1 : 4.538 Salem City 92 888 1 : 9.739 Solapur 273 1,557 1 : 5.740 Surat 974 4,486 1 : 4.641 Thane 1,487 7,938 1 : 5.342 Thiruvananthapuram 984 2,765 1 : 2.843 Tiruneveli City 81 627 1 : 7.744 Tiruchirapalli City 121 1,317 1 : 10.945 Vijayawada 315 1,610 1 : 5.146 Visakhapatnam 364 1,877 1 : 5.2
Total 58,015 270,592 1 : 4.7
Teeth to Tail Ratio: Teeth to Tail Ratio is the ratio of Police Officers from the rank of an A.S.I. and above to head Constables and Constables.
CHAPTER 3

70
TABLE 3.15 -- SANCTIONED AND ACTUAL STRENGTH OF CENTRAL ARMED POLICE FORCES (CAPFs) AS ON 1.1.2013 (RANK-WISE)
Sl.No. Name of the Central Police Forces
Total No. of Battalion
DGP/ Spl.DG Addl.DG IGP DIG
Sanc-tioned
Actual Sanc-tioned
Actual Sanc-tioned
Actual Sanc-tioned
Actual
(1) (2) (3) (4) (5) (6) (7) (8) (9) (10) (11)
1 Assam Rifles (AR) 46 1 1 1 1 3 3 22 20
2 Border Security Force (BSF)*
172 4 2 4 3 28 26 191 178
3 Central Industrial Security Force (CISF)
12 Bns &352 Units
1 1 2 1 9 9 51 40
4 Central Reserve Police Force (CRPF)
226 4 1 4 3 34 34 168 148
5 Indo-Tibetan Border Police (ITBP)*
53 1 1 2 2 12 10 73 60
6 National Security Guard (NSG)
0 1 1 0 0 3 2 7 6
7 Railway Protection Force (RPF)
12 1 1 1 0 7 7 21 21
8 Sashastra Seema Bal (SSB)
61 1 1 1 1 12 11 51 25
All India 14 9 15 11 108 102 584 498
CHAPTER 3
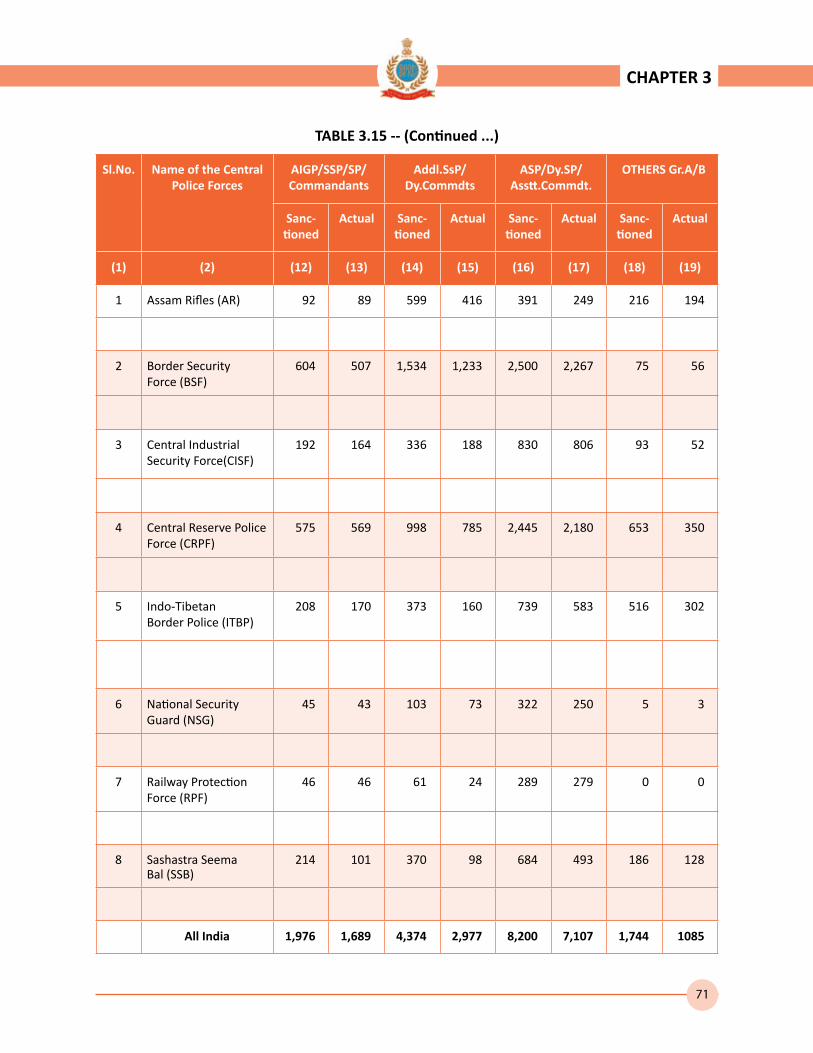
71
TABLE 3.15 -- (Continued ...)
Sl.No. Name of the Central Police Forces
AIGP/SSP/SP/Commandants
Addl.SsP/ Dy.Commdts
ASP/Dy.SP/ Asstt.Commdt.
OTHERS Gr.A/B
Sanc-tioned
Actual Sanc-tioned
Actual Sanc-tioned
Actual Sanc-tioned
Actual
(1) (2) (12) (13) (14) (15) (16) (17) (18) (19)
1 Assam Rifles (AR) 92 89 599 416 391 249 216 194
2 Border Security Force (BSF)
604 507 1,534 1,233 2,500 2,267 75 56
3 Central Industrial Security Force(CISF)
192 164 336 188 830 806 93 52
4 Central Reserve Police Force (CRPF)
575 569 998 785 2,445 2,180 653 350
5 Indo-Tibetan Border Police (ITBP)
208 170 373 160 739 583 516 302
6 National Security Guard (NSG)
45 43 103 73 322 250 5 3
7 Railway Protection Force (RPF)
46 46 61 24 289 279 0 0
8 Sashastra Seema Bal (SSB)
214 101 370 98 684 493 186 128
All India 1,976 1,689 4,374 2,977 8,200 7,107 1,744 1085
CHAPTER 3

72
TABLE 3.15 -- (Continued ...)
Sl.No. Name of the Central Police Forces
INSP. S.I. A.S.I.
Sanc-tioned
Actual Sanc-tioned
Actual Sanc-tioned
Actual
(1) (2) (20) (21) (22) (23) (24) (25)
1 Assam Rifles (AR) 1,382 1,153 2,600 2,246 2,892 1,768
2 Border Security Force (BSF)
4,310 3,807 9,240 7,318 18,762 15,523
3 Central Industrial Security Force(CISF)
2,355 2,088 12,549 9,737 8,200 6,502
4 Central Reserve Police Force (CRPF)
4,653 4,065 12,735 12,004 20,932 18,191
5 Indo-Tibetan Border Police (ITBP)
2,666 1,618 4,278 2,959 4,206 3,512
6 National Security Guard (NSG)
1,568 1,181 - - - -
7 Railway Protection Force (RPF)
1,847 1,460 3,119 2,157 5,702 4,166
8 Sashastra Seema Bal (SSB)
1,199 497 2,817 1,878 6,535 1,681
All India 19,980 15,869 47,338 38,299 67,229 51,343
CHAPTER 3
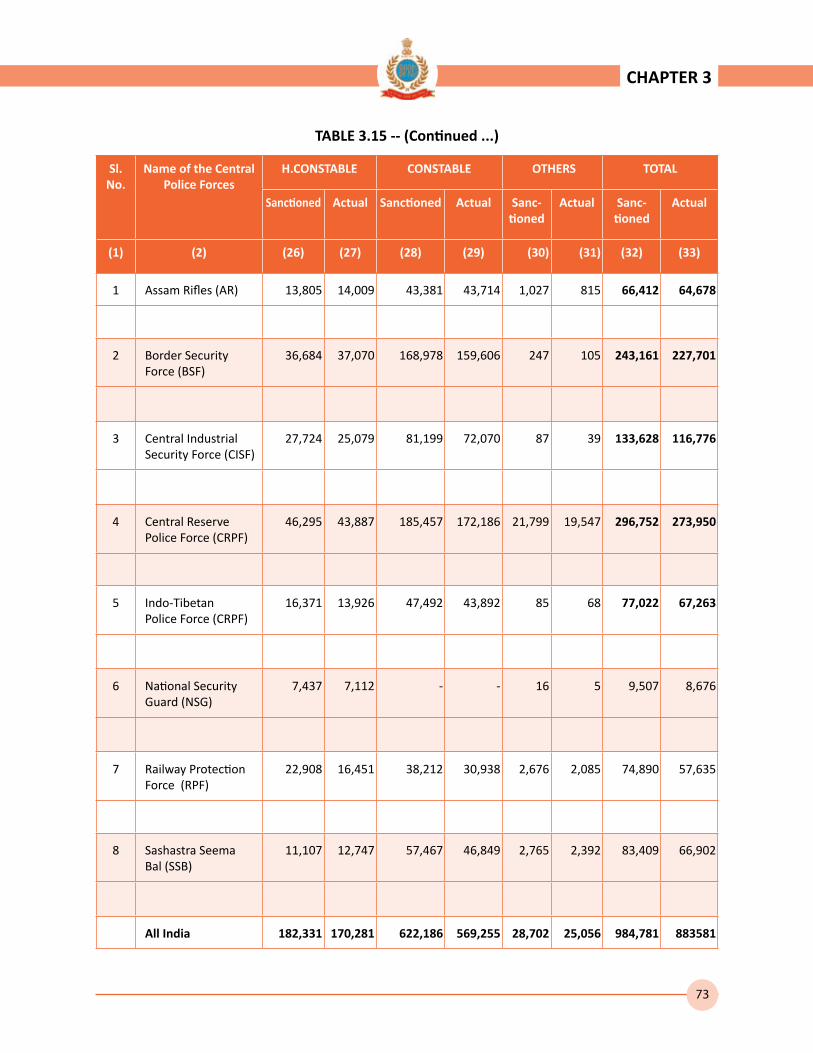
73
TABLE 3.15 -- (Continued ...)
Sl. No.
Name of the Central Police Forces
H.CONSTABLE CONSTABLE OTHERS TOTAL
Sanctioned Actual Sanctioned Actual Sanc-tioned
Actual Sanc-tioned
Actual
(1) (2) (26) (27) (28) (29) (30) (31) (32) (33)
1 Assam Rifles (AR) 13,805 14,009 43,381 43,714 1,027 815 66,412 64,678
2 Border Security Force (BSF)
36,684 37,070 168,978 159,606 247 105 243,161 227,701
3 Central Industrial Security Force (CISF)
27,724 25,079 81,199 72,070 87 39 133,628 116,776
4 Central Reserve Police Force (CRPF)
46,295 43,887 185,457 172,186 21,799 19,547 296,752 273,950
5 Indo-Tibetan Police Force (CRPF)
16,371 13,926 47,492 43,892 85 68 77,022 67,263
6 National Security Guard (NSG)
7,437 7,112 - - 16 5 9,507 8,676
7 Railway Protection Force (RPF)
22,908 16,451 38,212 30,938 2,676 2,085 74,890 57,635
8 Sashastra Seema Bal (SSB)
11,107 12,747 57,467 46,849 2,765 2,392 83,409 66,902
All India 182,331 170,281 622,186 569,255 28,702 25,056 984,781 883581
CHAPTER 3

74
TABLE 3.15 -- (Continued ...)
Sl.No. Name of the Central Police Forces
Sanctioned strength Actual Strength
Gazetted Non-Gazetted
Total Gazetted Non-Gazetted
Total
(1) (2) (34) (35) (36) (37) (38) (39)
1 Assam Rifles (AR) 1,325 65,087 66,412 973 63,705 64,678
2 Border Security Force (BSF)
4,940 238,221 243,161 4,272 223,429 227,701
3 Central Industrial Security Force (CISF)
1,514 132,114 133,628 1,261 115,515 116,776
4 Central Reserve Police Force (CRPF)
4,881 291,871 296,752 4,070 269,880 273,950
5 Indo-Tibetan Border Police (ITBP)
1,924 75,098 77,022 1,288 65,975 67,263
6 National Security Guard (NSG)
486 9,021 9,507 378 8,298 8,676
7 Railway Protection Force (RPF)
426 74,464 74,890 378 57,257 57,635
8 Sashastra Seema Bal (SSB)
1,519 81,890 83,409 858 66,044 66,902
All India 17,015 967,766 984,781 13,478 870,103 883,581
CHAPTER 3

75
TABLE 3.16 - ACTUAL STRENGTH OF WOMEN POLICE IN CENTRAL ARMED POLICE FORCES (CAPFs) AS ON 1.1.2013 (RANK-WISE)
Sl.No. Name of the Central Police Forces
Total No. of
Battalions
DGP/SplDG
Addl DG
IGP DIG AIGP/SSP/
Comm
ADSP/ DY.
Comm
ASP/Dy SP/
ACom
Others Gr. A&B
INSP. S.I. A.S.I. Head Const.
Const. Oth-ers
Total
(1) (2) (3) (4) (5) (6) (7) (8) (9) (10) (11) (12) (13) (14) (15) (16) (17) (18)
1 Assam Rifles (AR) 46 0 0 0 0 0 9 12 54 15 91 27 26 186 70 490
2 Border Security Force (BSF)
172 0 0 0 0 25 17 21 17 44 209 137 199 1123 13 1805
3 Central Industrial Security Force (CISF)
12 Bns & 352 Units
0 0 0 2 14 5 7 11 57 569 182 198 3935 1 4981
4 Central Reserve Police Force (CRPF)
226 0 0 0 5 11 29 84 79 196 567 480 733 3,159 450 5793
5 Indo-Tibetan Border Police (ITBP)
53 0 0 0 0 0 4 56 7 64 83 45 148 584 18 1009
6 National Security Guard (NSG)
0 0 0 0 0 0 1 5 0 23 21 0 50
7 Railway Protection Force (RPF)
12 0 0 1 0 6 0 0 0 40 20 75 564 0 0 706
8 Sashastra Seema Bal (SSB)
61 0 0 0 0 0 2 2 17 0 22 0 10 862 232 1147
All India 0 0 1 7 56 67 187 185 439 1561 946 1899 9849 784 15981
CHAPTER 3
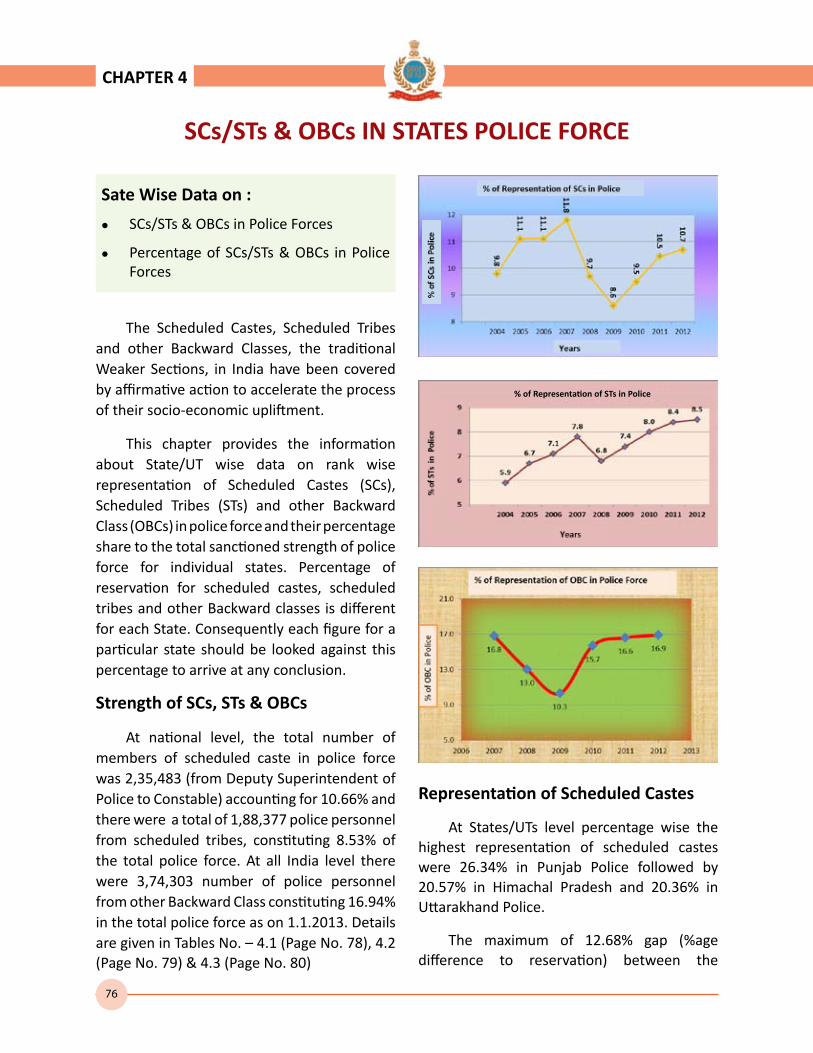
76
SCs/STs & OBCs IN STATES POLICE FORCE
Sate Wise Data on :
l SCs/STs & OBCs in Police Forces
l Percentage of SCs/STs & OBCs in Police Forces
The Scheduled Castes, Scheduled Tribes and other Backward Classes, the traditional Weaker Sections, in India have been covered by affirmative action to accelerate the process of their socio-economic upliftment.
This chapter provides the information about State/UT wise data on rank wise representation of Scheduled Castes (SCs), Scheduled Tribes (STs) and other Backward Class (OBCs) in police force and their percentage share to the total sanctioned strength of police force for individual states. Percentage of reservation for scheduled castes, scheduled tribes and other Backward classes is different for each State. Consequently each figure for a particular state should be looked against this percentage to arrive at any conclusion.
Strength of SCs, STs & OBCs
At national level, the total number of members of scheduled caste in police force was 2,35,483 (from Deputy Superintendent of Police to Constable) accounting for 10.66% and there were a total of 1,88,377 police personnel from scheduled tribes, constituting 8.53% of the total police force. At all India level there were 3,74,303 number of police personnel from other Backward Class constituting 16.94% in the total police force as on 1.1.2013. Details are given in Tables No. – 4.1 (Page No. 78), 4.2 (Page No. 79) & 4.3 (Page No. 80)
Representation of Scheduled Castes
At States/UTs level percentage wise the highest representation of scheduled castes were 26.34% in Punjab Police followed by 20.57% in Himachal Pradesh and 20.36% in Uttarakhand Police.
The maximum of 12.68% gap (%age difference to reservation) between the
CHAPTER 4
% of Representation of STs in Police

77
CHAPTER 4
actual percentage of scheduled castes police personnel in State Police Force as against the prescribed percentage of reservation approved for them by the State Governments was observed in Uttar Pradesh followed by 9.66% in West Bengal and 8.91% in Puducherry Police, as shown below :
Representation of Other Backward Classes
In the case of other Backward Classes, out of all States/UTs the highest representations of 55.21% were in Karnataka Police followed by 48.86% in Tamil Nadu and 33.86% in Kerala Police Force.
The maximum 29.79% gap (%age difference to reservation) between the actual percentage of Other Backward Classes police personnel in State Police Force as against the prescribed percentage of reservation approved for them by the State/UTs Government in Union Territory of A & N Islands followed by 20.74% in Puducherry and 17.04% in Uttar Pradesh Police as shown below:
% of Representation of OBC in police force as on 01.01.2013
State State Govts Approved
Policemen in-Service
% Difference
A & N Island 38.00% 8.21% 29.79%
Puducherry 34.00% 13.26% 20.74%
Uttar Pradesh 27.00% 9.96% 17.04%
% of Representation of SC in police force as on 01.01.2013
State State Govts Approved
Policemen in-Service
% Difference
Uttar Pradesh 21.00% 8.32% 12.68%
West Bengal 22.00% 12.34% 9.66%
Puducherry 16.00% 7.09% 8.91%
Representation of Scheduled Tribes
In the case of scheduled tribes 124.99% Meghalaya and 95.54% Nagaland have the highest representation in Police Force followed by 91.29% in Mizoram and 76.17% in Arunachal Pradesh Police.
The maximum gap (%age difference to reservation) between the total scheduled tribes police personnel actually in place in State Police Force and the percentage of reservation approved for them by the State Governments was observed in Lakshadweep at 29.51%, followed by 25.00% in Punjab and 15.04% in Chhattisgarh Police, as shown below :
% of Representation of OBC in police force as on 01.01.2013
State State Govts Approved
Policemen in-Service
% Difference
Lakshadweep 100.00% 70.49% 29.51%
Punjab 25.00% 0.00% 25.00%
Chhattisgarh 32.00% 16.96% 15.04%

78
CHAPTER 4
TABLE 4.1--REPRESENTATION OF SCHEDULED CASTES (SCs) VIS-A-VIS %age OF RESERVATIONFOR SCs APPROVED BY THE GOVT IN THE POLICE FORCE - AS ON 1.1.2013
Sl. No.
States / UTs. Dy.S.P INSP. S.I. A.S.I. H.Const. Const. TOTAL % of (9) to Total Police Force
% of reser-vation of SC
% Differ-ence to Reser-vation
(1) (2) (3) (4) (5) (6) (7) (8) (9) (10) (11) (12)
1 Andhra Pradesh 43 229 408 476 1926 7847 10929 8.46% 15.00% 6.54%
2 Arunachal Pradesh 0 2 3 3 10 45 63 0.49% 0.00% -0.49%
3 Assam 19 34 307 137 605 3549 4651 7.46% 7.00% -0.46%
4 Bihar 65 160 1296 663 0 8575 10759 12.24% 16.00% 3.76%
5 Chhattisgarh 23 48 109 148 572 2178 3078 4.62% 12.00% 7.38%
6 Goa 0 0 15 8 16 59 98 1.38% 2.00% 0.62%
7 Gujarat 18 55 183 1208 2059 3900 7423 6.55% 7.00% 0.45%
8 Haryana 14 93 370 450 947 6279 8153 13.22% 20.00% 6.78%
9 Himachal Pradesh 0 38 134 238 544 2581 3535 20.57% 22.00% 1.43%
10 Jammu & Kashmir 45 50 152 104 535 2447 3333 4.26% 8.00% 3.74%
11 Jharkhand 27 122 454 351 1007 5459 7420 10.07% 10.00% -0.07%
12 Karnataka 84 182 404 859 2983 8268 12780 14.02% 15.00% 0.98%
13 Kerala 46 48 263 188 745 2287 3577 6.79% 8.00% 1.21%
14 Madhya Pradesh 98 280 670 880 2260 6530 10718 11.85% 16.00% 4.15%
15 Maharashtra 81 540 922 4651 7918 9114 23226 11.09% 13.00% 1.91%
16 Manipur 5 11 22 16 84 335 473 1.48% 2.00% 0.52%
17 Meghalaya 0 2 9 3 19 83 116 0.88% 0.00 -0.88%
18 Mizoram 4 12 12 8 69 139 244 2.17% 0.00 -2.17%
19 Nagaland 0 0 0 0 0 0 0 0.00% 0.00 0.00%
20 Odisha 64 84 398 604 643 6125 7918 13.93% 16.25% 2.32%
21 Punjab 26 190 306 812 2875 16729 20938 26.34% 25.00% -1.34%
22 Rajasthan 63 137 374 606 1275 9053 11508 12.31% 16.00% 3.69%
23 Sikkim 2 3 8 15 48 105 181 2.98% 6.00% 3.02%
24 Tamil Nadu 96 258 1497 0 0 17012 18863 16.39% 18.00% 1.61%
25 Tripura 20 59 176 102 873 2961 4191 15.33% 17.00% 1.67%
26 Uttar Pradesh 150 152 1689 0 2739 25906 30636 8.32% 21.00% 12.68%
27 Uttarakhand 15 33 237 0 590 3237 4112 20.36% 19.00% -1.36%
28 West Bengal 56 58 570 1583 0 11224 13491 12.34% 22.00% 9.66%
29 A&N Islands 0 0 0 0 0 0 0 0.00% 0.00% 0.00%
30 Chandigarh 0 9 41 30 97 778 955 12.13% 18.00% 5.87%
31 D&N Haveli 0 0 0 1 10 13 24 7.32% 15.00% 7.68%
32 Daman & Diu 0 2 2 12 31 29 76 18.54% 3.00% -15.54%
33 Delhi 35 225 657 930 3294 6593 11734 14.46% 15.00% 0.54%
34 Lakshadweep 0 0 0 0 0 0 0 0.00% 0.00% 0.00%
35 Puducherry 5 5 25 2 45 198 280 7.09% 16.00% 8.91%
All India 1,104 3,121 11,713 15,088 34,819 69,638 235483 10.66%

79
CHAPTER 4
TABLE 4.2 -- REPRESENTATION OF SCHEDULED TRIBES (STs) VIS-A-VIS %age OF RESERVATIONFOR STs APPROVED BY THE GOVT IN THE POLICE FORCE - AS ON 1.1.2013
Sl. No.
States / UTs. Dy.S.P. INSP. S.I. A.S.I. H.Const. Const. TOTAL % of (9) to Total Police Force
% of reser-
vation of ST
% Differ-ence to Reser-vation
(1) (2) (3) (4) (5) (6) (7) (8) (9) (10) (11) (12)
1 Andhra Pradesh 16 96 176 229 1104 4345 5966 4.62% 6.00% 1.38%
2 Arunachal Pradesh 23 111 262 323 1474 6609 8802 68.96% 80.00% 11.04%
3 Assam 25 46 424 207 1087 8286 10075 16.16% 15.00% -1.16%
4 Bihar 1 38 155 63 0 548 805 0.92% 1.00% 0.08%
5 Chhattisgarh 38 198 192 358 1293 9220 11299 16.96% 32.00% 15.04%
6 Goa 1 4 12 11 76 190 294 4.13% 12.00% 7.87%
7 Gujarat 27 53 294 1539 1703 5030 8646 7.63% 15.00% 7.37%
8 Haryana 0 0 0 0 0 0 0 0.00% 0.00% 0.00%
9 Himachal Pradesh 0 29 47 78 143 722 1019 5.93% 5.00% -0.93%
10 Jammu & Kashmir 49 46 197 189 797 3191 4469 5.71% 10.00% 4.29%
11 Jharkhand 35 174 573 916 1657 12037 15392 20.89% 26.00% 5.11%
12 Karnataka 23 60 139 220 674 1997 3113 3.41% 3.00% -0.41%
13 Kerala 5 9 36 23 92 425 590 1.12% 2.00% 0.88%
14 Madhya Pradesh 115 206 643 893 2088 6415 10360 11.45% 20.00% 8.55%
15 Maharashtra 42 286 536 2596 4733 6896 15089 7.20% 7.00% -0.20%
16 Manipur 36 119 272 205 873 5029 6534 20.47% 31.00% 10.53%
17 Meghalaya 28 134 639 124 1077 7177 9179 69.85% 85.00% 15.15%
18 Mizoram 67 214 685 489 1824 6988 10267 91.29% 0.00% -91.29%
19 Nagaland 145 132 181 419 2827 19494 23198 95.54% 100.00% 4.46%
20 Odisha 27 112 377 380 732 7664 9292 16.35% 22.50% 6.15%
21 Punjab 0 0 0 0 0 0 0 0.00% 25.00% 25.00%
22 Rajasthan 42 112 219 362 1026 8505 10266 10.98% 12.00% 1.02%
23 Sikkim 23 34 105 112 378 718 1370 22.55% 23.00% 0.45%
24 Tamil Nadu 1 9 74 0 0 703 787 0.68% 1.00% 0.32%
25 Tripura 35 109 318 158 1578 5359 7557 27.64% 31.00% 3.36%
26 Uttar Pradesh 12 8 160 0 200 2076 2456 0.67% 2.00% 1.33%
27 Uttarakhand 5 12 60 0 154 1043 1274 6.31% 4.00% -2.31%
28 West Bengal 13 17 133 316 0 3554 4033 3.69% 6.00% 2.31%
29 A&N Islands 0 9 7 2 35 227 280 6.32% 8.00% 1.68%
30 Chandigarh 1 0 0 0 0 0 1 0.01% 0.00% -0.01%
31 D&N Haveli 0 1 4 4 39 128 176 53.66% 7.50% -46.16%
32 Daman & Diu 0 0 0 0 4 10 14 3.41% 9.00% 5.59%
33 Delhi 21 75 369 402 1507 3144 5518 6.80% 7.50% 0.70%
34 Lakshadweep 1 4 6 13 34 188 246 70.49% 100.00% 29.51%
35 Puducherry 1 2 7 0 0 0 10 0.25% 0.00% -0.25%
All India 858 2,459 7,302 10,631 29,209 137,918 188,377 8.53%

80
CHAPTER 4
TABLE 4.3 --REPRESENTATION OF OTHER BACKWARD CLASSES (OBCs) VIS-A-VIS %age OFRESERVATION FOR (OBCs) APPROVED BY THE GOVT IN THE POLICE FORCE- AS ON 1.1.2013
Sl. No.
States / UTs. Dy.S.P. INSP. S.I. A.S.I. H.Const. Const. TOTAL % of (9) to Total Police Force
% of reservation
of OBC
% of Difference
to Reservation
(1) (2) (3) (4) (5) (6) (7) (8) (9) (10) (11) (12)
1 Andhra Pradesh 121 726 1353 1502 5126 21708 30536 23.63% 25.00% 1.37%
2 Arunachal Pradesh 0 0 0 0 0 0 0 0.00% 0.00% 0.00%
3 Assam 70 230 1290 835 2942 15380 20747 33.28% 27.00% -6.28%
4 Bihar 90 161 1467 1073 1617 18688 23096 26.27% 33.00% 6.73%
5 Chhattisgarh 20 24 136 238 764 4034 5216 7.83% 14.00% 6.17%
6 Goa 10 9 20 10 300 905 1254 17.62% 19.50% 1.88%
7 Gujarat 2 0 675 2065 2257 9809 14808 13.06% 27.00% 13.94%
8 Haryana 36 155 298 510 1396 7447 9842 15.96% 27.00% 11.04%
9 Himachal Pradesh 0 12 51 47 189 1204 1503 8.75% 18.00% 9.25%
10 Jammu & Kashmir 1 15 36 34 75 433 594 0.76% 1.00% 0.24%
11 Jharkhand 21 82 415 518 1875 11169 14080 19.11% 14.00% -5.11%
12 Karnataka 313 909 1594 3340 12770 31407 50333 55.21% 33.00% -22.21%
13 Kerala 88 151 582 575 3378 13072 17846 33.86% 40.00% 6.14%
14 Madhya Pradesh 37 57 325 298 1018 5885 7620 8.43% 14.00% 5.57%
15 Maharashtra 0 56 3312 4053 2932 13024 23377 11.16% 19.00% 7.84%
16 Manipur 2 2 24 20 114 821 983 3.08% 17.00% 13.92%
17 Meghalaya 2 9 31 46 48 290 426 3.24% 0.00% -3.24%
18 Mizoram 2 5 8 10 18 37 80 0.71% 0.00% -0.71%
19 Nagaland 0 0 0 0 0 0 0 0.00% 0.00% 0.00%
20 Odisha 7 70 408 346 456 8486 9773 17.19% 27.00% 9.81%
21 Punjab 0 64 185 568 2,057 9,724 12598 15.85% 12.00% -3.85%
22 Rajasthan 122 72 321 137 228 9223 10103 10.81% 21.00% 10.19%
23 Sikkim 15 27 95 97 314 672 1220 20.08% 14.00% -6.08%
24 Tamil Nadu 473 1731 4210 0 0 49812 56226 48.86% 50.00% 1.14%
25 Tripura 0 0 0 0 0 0 0 0.00% 0.00% 0.00%
26 Uttar Pradesh 221 205 2209 0 3533 30515 36683 9.96% 27.00% 17.04%
27 Uttarakhand 5 4 113 0 96 2651 2869 14.21% 14.00% -0.21%
28 West Bengal 11 8 148 229 0 2664 3060 2.80% 17.00% 14.20%
29 A&N Islands 0 0 17 0 0 347 364 8.21% 38.00% 29.79%
30 Chandigarh 0 4 32 34 118 1305 1493 18.96% 27.00% 8.04%
31 D&N Haveli 0 0 0 0 1 8 9 2.74% 5.00% 2.26%
32 Daman & Diu 0 0 0 0 12 43 55 13.41% 27.00% 13.59%
33 Delhi 6 0 572 16 1935 14455 16984 20.93% 27.00% 6.07%
34 Lakshadweep 0 0 0 0 0 1 1 0.29% 0.00% -0.29%
35 Puducherry 9 0 15 0 0 500 524 13.26% 34.00% 20.74%
All India 1,684 4,788 19,942 16,601 45,569 285,719 374,303 16.94%
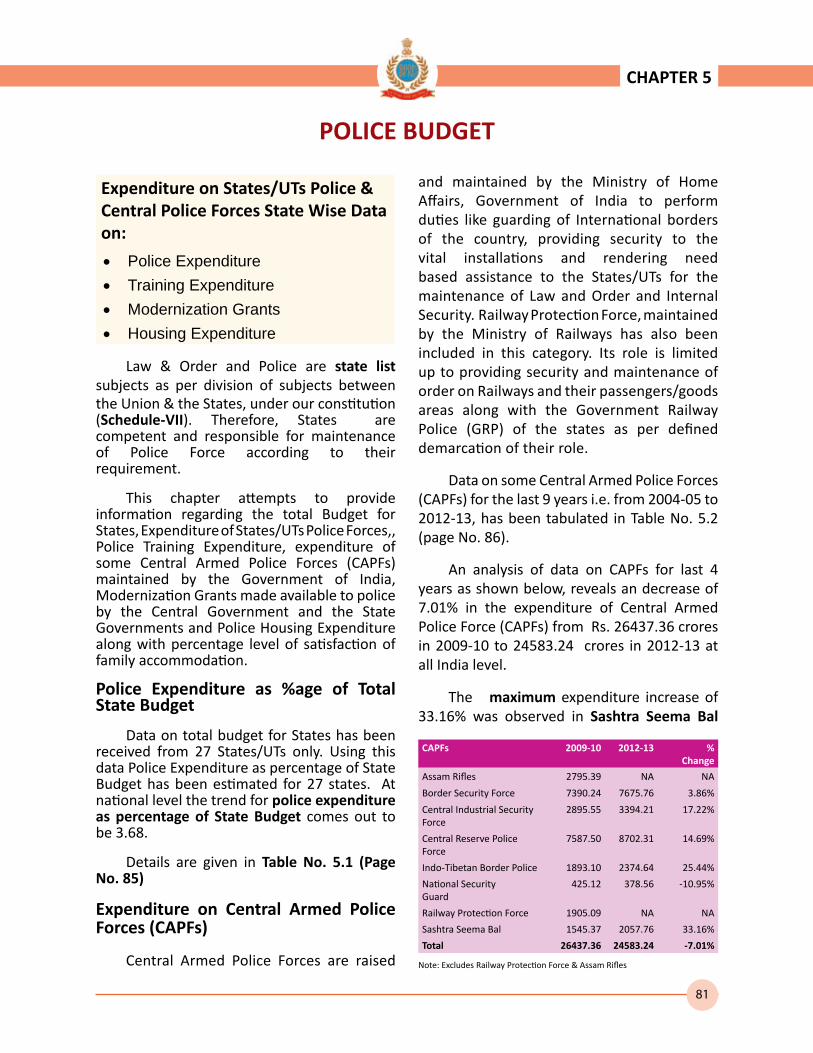
81
Expenditure on States/UTs Police & Central Police Forces State Wise Data on:
Police Expenditure•Training Expenditure•Modernization Grants•Housing Expenditure•
Law & Order and Police are state list subjects as per division of subjects between the Union & the States, under our constitution (Schedule-VII). Therefore, States are competent and responsible for maintenance of Police Force according to their requirement.
This chapter attempts to provide information regarding the total Budget for States, Expenditure of States/UTs Police Forces,, Police Training Expenditure, expenditure of some Central Armed Police Forces (CAPFs) maintained by the Government of India, Modernization Grants made available to police by the Central Government and the State Governments and Police Housing Expenditure along with percentage level of satisfaction of family accommodation.
Police Expenditure as %age of Total State Budget
Data on total budget for States has been received from 27 States/UTs only. Using this data Police Expenditure as percentage of State Budget has been estimated for 27 states. At national level the trend for police expenditure as percentage of State Budget comes out to be 3.68.
Details are given in Table No. 5.1 (Page No. 85)
Expenditure on Central Armed Police Forces (CAPFs)
Central Armed Police Forces are raised
and maintained by the Ministry of Home Affairs, Government of India to perform duties like guarding of International borders of the country, providing security to the vital installations and rendering need based assistance to the States/UTs for the maintenance of Law and Order and Internal Security. Railway Protection Force, maintained by the Ministry of Railways has also been included in this category. Its role is limited up to providing security and maintenance of order on Railways and their passengers/goods areas along with the Government Railway Police (GRP) of the states as per defined demarcation of their role.
Data on some Central Armed Police Forces (CAPFs) for the last 9 years i.e. from 2004-05 to 2012-13, has been tabulated in Table No. 5.2 (page No. 86).
An analysis of data on CAPFs for last 4 years as shown below, reveals an decrease of 7.01% in the expenditure of Central Armed Police Force (CAPFs) from Rs. 26437.36 crores in 2009-10 to 24583.24 crores in 2012-13 at all India level.
The maximum expenditure increase of 33.16% was observed in Sashtra Seema Bal
CHAPTER 5
POLICE BUDGET
CAPFs 2009-10 2012-13 % Change
Assam Rifles 2795.39 NA NA
Border Security Force 7390.24 7675.76 3.86%
Central Industrial Security Force
2895.55 3394.21 17.22%
Central Reserve Police Force
7587.50 8702.31 14.69%
Indo-Tibetan Border Police 1893.10 2374.64 25.44%
National SecurityGuard
425.12 378.56 -10.95%
Railway Protection Force 1905.09 NA NA
Sashtra Seema Bal 1545.37 2057.76 33.16%
Total 26437.36 24583.24 -7.01%
Note: Excludes Railway Protection Force & Assam Rifles
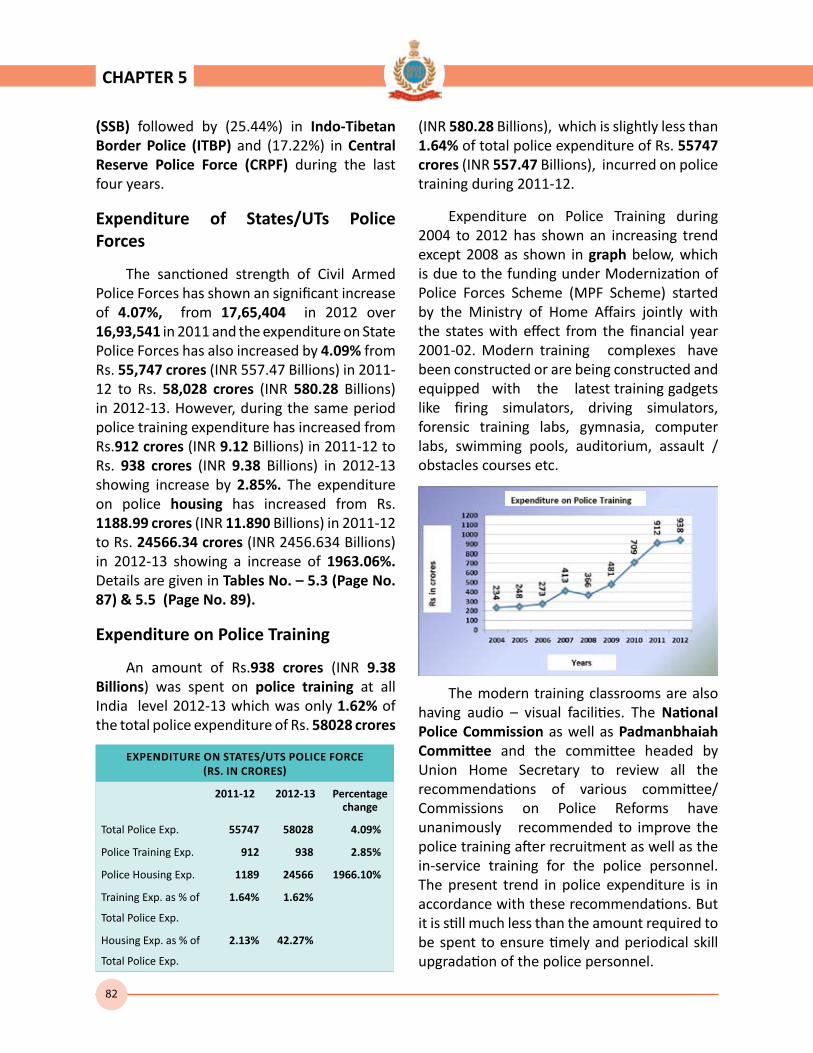
82
(SSB) followed by (25.44%) in Indo-Tibetan Border Police (ITBP) and (17.22%) in Central Reserve Police Force (CRPF) during the last four years.
Expenditure of States/UTs Police Forces
The sanctioned strength of Civil Armed Police Forces has shown an significant increase of 4.07%, from 17,65,404 in 2012 over 16,93,541 in 2011 and the expenditure on State Police Forces has also increased by 4.09% from Rs. 55,747 crores (INR 557.47 Billions) in 2011-12 to Rs. 58,028 crores (INR 580.28 Billions) in 2012-13. However, during the same period police training expenditure has increased from Rs.912 crores (INR 9.12 Billions) in 2011-12 to Rs. 938 crores (INR 9.38 Billions) in 2012-13 showing increase by 2.85%. The expenditure on police housing has increased from Rs. 1188.99 crores (INR 11.890 Billions) in 2011-12 to Rs. 24566.34 crores (INR 2456.634 Billions) in 2012-13 showing a increase of 1963.06%. Details are given in Tables No. – 5.3 (Page No. 87) & 5.5 (Page No. 89).
Expenditure on Police Training
An amount of Rs.938 crores (INR 9.38 Billions) was spent on police training at all India level 2012-13 which was only 1.62% of the total police expenditure of Rs. 58028 crores
EXPENDITURE ON STATES/UTS POLICE FORCE (RS. IN CRORES)
2011-12 2012-13 Percentage change
Total Police Exp. 55747 58028 4.09%
Police Training Exp. 912 938 2.85%
Police Housing Exp. 1189 24566 1966.10%
Training Exp. as % of
Total Police Exp.
1.64% 1.62%
Housing Exp. as % of
Total Police Exp.
2.13% 42.27%
(INR 580.28 Billions), which is slightly less than 1.64% of total police expenditure of Rs. 55747 crores (INR 557.47 Billions), incurred on police training during 2011-12.
Expenditure on Police Training during 2004 to 2012 has shown an increasing trend except 2008 as shown in graph below, which is due to the funding under Modernization of Police Forces Scheme (MPF Scheme) started by the Ministry of Home Affairs jointly with the states with effect from the financial year 2001-02. Modern training complexes have been constructed or are being constructed and equipped with the latest training gadgets like firing simulators, driving simulators, forensic training labs, gymnasia, computer labs, swimming pools, auditorium, assault / obstacles courses etc.
CHAPTER 5
The modern training classrooms are also having audio – visual facilities. The National Police Commission as well as Padmanbhaiah Committee and the committee headed by Union Home Secretary to review all the recommendations of various committee/Commissions on Police Reforms have unanimously recommended to improve the police training after recruitment as well as the in-service training for the police personnel. The present trend in police expenditure is in accordance with these recommendations. But it is still much less than the amount required to be spent to ensure timely and periodical skill upgradation of the police personnel.
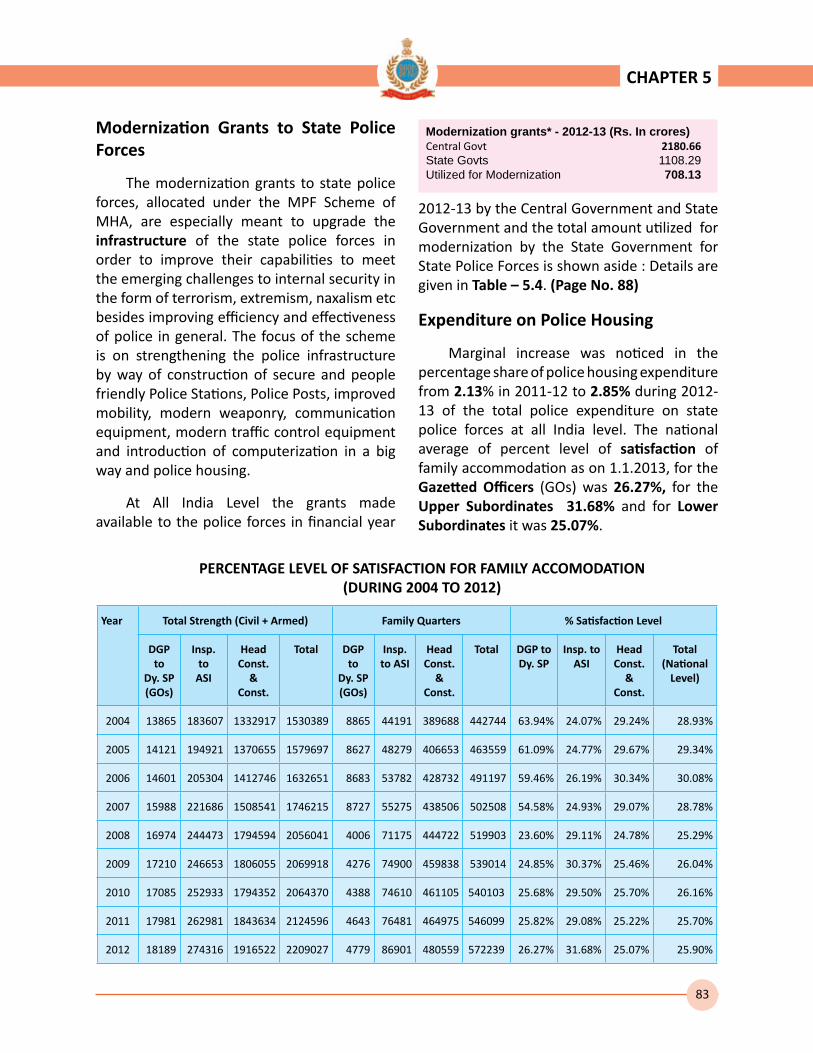
83
Modernization Grants to State Police Forces
The modernization grants to state police forces, allocated under the MPF Scheme of MHA, are especially meant to upgrade the infrastructure of the state police forces in order to improve their capabilities to meet the emerging challenges to internal security in the form of terrorism, extremism, naxalism etc besides improving efficiency and effectiveness of police in general. The focus of the scheme is on strengthening the police infrastructure by way of construction of secure and people friendly Police Stations, Police Posts, improved mobility, modern weaponry, communication equipment, modern traffic control equipment and introduction of computerization in a big way and police housing.
At All India Level the grants made available to the police forces in financial year
CHAPTER 5
Modernization grants* - 2012-13 (Rs. In crores)Central Govt 2180.66State Govts 1108.29Utilized for Modernization 708.13
2012-13 by the Central Government and State Government and the total amount utilized for modernization by the State Government for State Police Forces is shown aside : Details are given in Table – 5.4. (Page No. 88)
Expenditure on Police Housing
Marginal increase was noticed in the percentage share of police housing expenditure from 2.13% in 2011-12 to 2.85% during 2012-13 of the total police expenditure on state police forces at all India level. The national average of percent level of satisfaction of family accommodation as on 1.1.2013, for the Gazetted Officers (GOs) was 26.27%, for the Upper Subordinates 31.68% and for Lower Subordinates it was 25.07%.
PERCENTAGE LEVEL OF SATISFACTION FOR FAMILY ACCOMODATION(DURING 2004 TO 2012)
Year Total Strength (Civil + Armed) Family Quarters % Satisfaction Level
DGP to
Dy. SP (GOs)
Insp.to
ASI
Head Const.
&Const.
Total DGP to
Dy. SP (GOs)
Insp. to ASI
Head Const.
& Const.
Total DGP to Dy. SP
Insp. to ASI
Head Const.
& Const.
Total (National
Level)
2004 13865 183607 1332917 1530389 8865 44191 389688 442744 63.94% 24.07% 29.24% 28.93%
2005 14121 194921 1370655 1579697 8627 48279 406653 463559 61.09% 24.77% 29.67% 29.34%
2006 14601 205304 1412746 1632651 8683 53782 428732 491197 59.46% 26.19% 30.34% 30.08%
2007 15988 221686 1508541 1746215 8727 55275 438506 502508 54.58% 24.93% 29.07% 28.78%
2008 16974 244473 1794594 2056041 4006 71175 444722 519903 23.60% 29.11% 24.78% 25.29%
2009 17210 246653 1806055 2069918 4276 74900 459838 539014 24.85% 30.37% 25.46% 26.04%
2010 17085 252933 1794352 2064370 4388 74610 461105 540103 25.68% 29.50% 25.70% 26.16%
2011 17981 262981 1843634 2124596 4643 76481 464975 546099 25.82% 29.08% 25.22% 25.70%
2012 18189 274316 1916522 2209027 4779 86901 480559 572239 26.27% 31.68% 25.07% 25.90%

84
The percentage level of housing satisfaction for family accommodation over the last nine years is shown in the Tablebelow.
The percentage satisfaction level of family accommodation for Gazetted Officers (GOs) has marginally increased from 25.82% in 2011 to 26.27% in 2012 while the percentage satisfaction level of Upper Subordinates has increased from 29.08% in year 2011 to 31.68% in 2012. The percentage level satisfaction of Lower Subordinates level has decreased from 25.22% in the year 2011
to 25.07% in year 2012. The main reason for the decrease in the percentage level satisfaction and relatively lower satisfaction rate for Lower and Upper Subordinates is due to significant increase in the total strength of Upper Subordinates and Lower Subordinate in the State Police Forces sanctioned by the States/UTs during the last ten years. Overall the rising trend of availability of total number of houses for police personnel is an encouraging development though much more action and at faster pace too, is desired for this purpose. Details are given in Table – 5.5. (Page No. 89)
CHAPTER 5

85
CHAPTER 5
TABLE 5.1 -- TOTAL BUDGET FOR STATE, POLICE EXPENDITURE AND EXPENDITURE ON POLICE TRAINING FOR THE FINANCIAL YEAR 2012-13
(` in Crores)Sl. No. States / UTs. Total Budget for
State Total Police Expenditure
Total Expenditure on Police Training
Police Expenditure as % of State Budget
(1) (2) (3) (4) (5) (6) 1 Andhra Pradesh 129,215.32 3,344.77 44.67 2.592 Arunachal Pradesh 6,360.72 371.32 98.40 5.843 Assam 43,151.79 1,499.54 28.04 3.484 Bihar NA 3,048.20 10.00 NA5 Chhattisgarh 37,573.61 1,598.10 57.90 4.256 Goa NA 244.64 0.64 NA7 Gujarat 98,235.01 1,750.61 31.04 1.788 Haryana 188,299.51 1,841.68 16.23 0.989 Himachal Pradesh 22,991.08 584.32 0.34 2.54
10 Jammu & Kashmir 34,948.64 2,388.30 52.78 6.8311 Jharkhand NA 2,153.41 10.85 NA12 Karnataka 102,741.92 2,157.55 18.35 2.1013 Kerala 58,976.20 1,526.21 35.12 2.5914 Madhya Pradesh 90,842.00 2,686.69 57.55 2.9615 Maharashtra 170110.07 4974.44 50.29 2.9216 Manipur 8,397.98 574.54 0.13 6.8417 Meghalaya NA 295.83 1.90 NA18 Mizoram 5,176.25 311.07 6.28 6.0119 Nagaland 7,911.85 639.21 19.32 8.0820 Odisha 207948.39 1703.97 16.83 0.8221 Punjab NA 2,925.89 34.65 NA22 Rajasthan 7,675.00 2,475.61 34.25 32.2623 Sikkim 4,379.48 167.56 1.92 3.8324 Tamil Nadu 125,619.58 3,733.60 123.99 2.9725 Tripura 8,282.37 658.94 17.98 7.9626 Uttar Pradesh NA 7,128.71 70.77 NA27 Uttarakhand 87,864.00 637.10 10.00 0.7328 West Bengal 118,180.99 2,562.20 12.25 2.1729 A&N Islands 3,092.17 150.07 0.51 4.8530 Chandigarh 2,916.00 219.00 0.57 7.51
31 D&N Haveli NA 12.11 0.32 NA32 Daman & Diu 1,263.60 7.89 0.00 0.6233 Delhi NA 3,544.72 71.21 NA34 Lakshadweep 800.00 16.58 0.000 2.0735 Puducherry 5,540.00 93.67 2.53 1.69
All India ** 1,578,493.53 58,028.05 937.61 3.68NA: Not Available
** All India total of State Budget and average of Police Expenditure as percent of State Budget excludes the States of Bihar, Goa, Jharkhand, Meghalaya Punjab, Uttar Pradesh, Dadra & Nagar Haveli and Delhi.
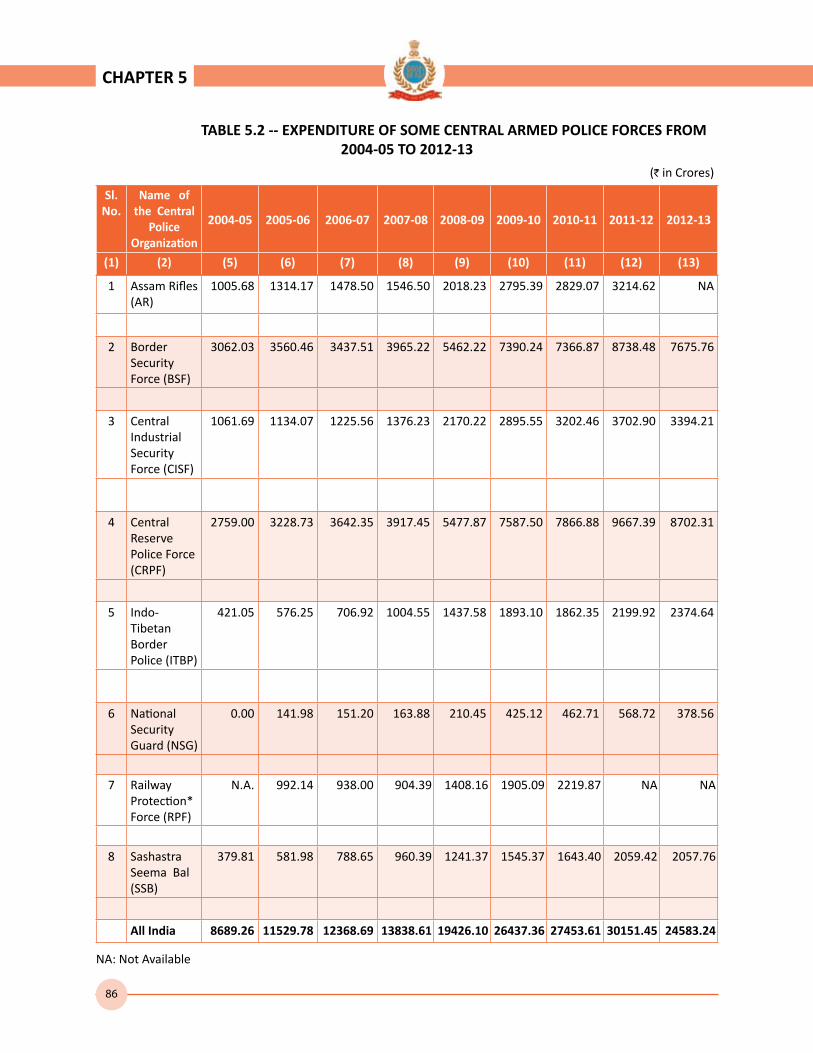
86
CHAPTER 5
TABLE 5.2 -- EXPENDITURE OF SOME CENTRAL ARMED POLICE FORCES FROM 2004-05 TO 2012-13
(` in Crores)
Sl. No.
Name of the Central
Police Organization
2004-05 2005-06 2006-07 2007-08 2008-09 2009-10 2010-11 2011-12 2012-13
(1) (2) (5) (6) (7) (8) (9) (10) (11) (12) (13)
1 Assam Rifles (AR)
1005.68 1314.17 1478.50 1546.50 2018.23 2795.39 2829.07 3214.62 NA
2 Border Security Force (BSF)
3062.03 3560.46 3437.51 3965.22 5462.22 7390.24 7366.87 8738.48 7675.76
3 Central Industrial Security Force (CISF)
1061.69 1134.07 1225.56 1376.23 2170.22 2895.55 3202.46 3702.90 3394.21
4 Central Reserve Police Force (CRPF)
2759.00 3228.73 3642.35 3917.45 5477.87 7587.50 7866.88 9667.39 8702.31
5 Indo-Tibetan Border Police (ITBP)
421.05 576.25 706.92 1004.55 1437.58 1893.10 1862.35 2199.92 2374.64
6 National Security Guard (NSG)
0.00 141.98 151.20 163.88 210.45 425.12 462.71 568.72 378.56
7 Railway Protection*Force (RPF)
N.A. 992.14 938.00 904.39 1408.16 1905.09 2219.87 NA NA
8 Sashastra Seema Bal (SSB)
379.81 581.98 788.65 960.39 1241.37 1545.37 1643.40 2059.42 2057.76
All India 8689.26 11529.78 12368.69 13838.61 19426.10 26437.36 27453.61 30151.45 24583.24
NA: Not Available
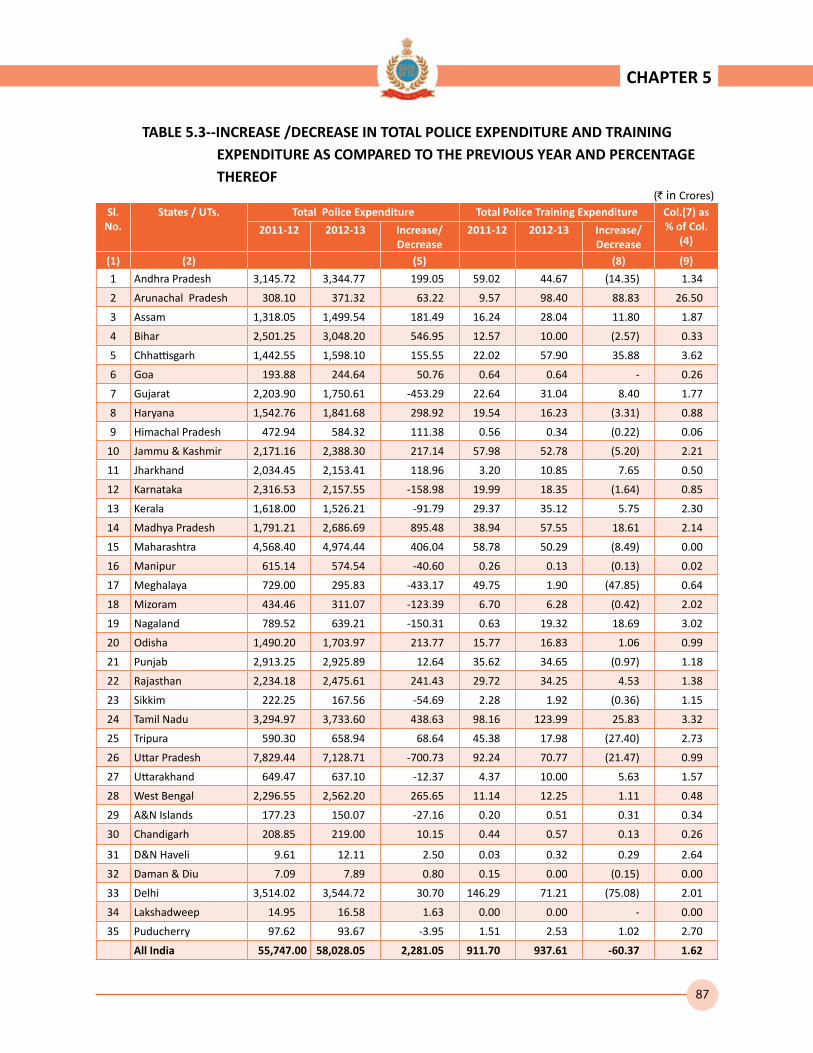
87
CHAPTER 5
TABLE 5.3--INCREASE /DECREASE IN TOTAL POLICE EXPENDITURE AND TRAINING EXPENDITURE AS COMPARED TO THE PREVIOUS YEAR AND PERCENTAGE THEREOF
(` in Crores)Sl.
No.States / UTs. Total Police Expenditure Total Police Training Expenditure Col.(7) as
% of Col. (4)
2011-12 2012-13 Increase/ Decrease
2011-12 2012-13 Increase/ Decrease
(1) (2) (5) (8) (9)
1 Andhra Pradesh 3,145.72 3,344.77 199.05 59.02 44.67 (14.35) 1.34
2 Arunachal Pradesh 308.10 371.32 63.22 9.57 98.40 88.83 26.50
3 Assam 1,318.05 1,499.54 181.49 16.24 28.04 11.80 1.87
4 Bihar 2,501.25 3,048.20 546.95 12.57 10.00 (2.57) 0.33
5 Chhattisgarh 1,442.55 1,598.10 155.55 22.02 57.90 35.88 3.62
6 Goa 193.88 244.64 50.76 0.64 0.64 - 0.26
7 Gujarat 2,203.90 1,750.61 -453.29 22.64 31.04 8.40 1.77
8 Haryana 1,542.76 1,841.68 298.92 19.54 16.23 (3.31) 0.88
9 Himachal Pradesh 472.94 584.32 111.38 0.56 0.34 (0.22) 0.06
10 Jammu & Kashmir 2,171.16 2,388.30 217.14 57.98 52.78 (5.20) 2.21
11 Jharkhand 2,034.45 2,153.41 118.96 3.20 10.85 7.65 0.50
12 Karnataka 2,316.53 2,157.55 -158.98 19.99 18.35 (1.64) 0.85
13 Kerala 1,618.00 1,526.21 -91.79 29.37 35.12 5.75 2.30
14 Madhya Pradesh 1,791.21 2,686.69 895.48 38.94 57.55 18.61 2.14
15 Maharashtra 4,568.40 4,974.44 406.04 58.78 50.29 (8.49) 0.00
16 Manipur 615.14 574.54 -40.60 0.26 0.13 (0.13) 0.02
17 Meghalaya 729.00 295.83 -433.17 49.75 1.90 (47.85) 0.64
18 Mizoram 434.46 311.07 -123.39 6.70 6.28 (0.42) 2.02
19 Nagaland 789.52 639.21 -150.31 0.63 19.32 18.69 3.02
20 Odisha 1,490.20 1,703.97 213.77 15.77 16.83 1.06 0.99
21 Punjab 2,913.25 2,925.89 12.64 35.62 34.65 (0.97) 1.18
22 Rajasthan 2,234.18 2,475.61 241.43 29.72 34.25 4.53 1.38
23 Sikkim 222.25 167.56 -54.69 2.28 1.92 (0.36) 1.15
24 Tamil Nadu 3,294.97 3,733.60 438.63 98.16 123.99 25.83 3.32
25 Tripura 590.30 658.94 68.64 45.38 17.98 (27.40) 2.73
26 Uttar Pradesh 7,829.44 7,128.71 -700.73 92.24 70.77 (21.47) 0.99
27 Uttarakhand 649.47 637.10 -12.37 4.37 10.00 5.63 1.57
28 West Bengal 2,296.55 2,562.20 265.65 11.14 12.25 1.11 0.48
29 A&N Islands 177.23 150.07 -27.16 0.20 0.51 0.31 0.34
30 Chandigarh 208.85 219.00 10.15 0.44 0.57 0.13 0.26
31 D&N Haveli 9.61 12.11 2.50 0.03 0.32 0.29 2.64
32 Daman & Diu 7.09 7.89 0.80 0.15 0.00 (0.15) 0.00
33 Delhi 3,514.02 3,544.72 30.70 146.29 71.21 (75.08) 2.01
34 Lakshadweep 14.95 16.58 1.63 0.00 0.00 - 0.00
35 Puducherry 97.62 93.67 -3.95 1.51 2.53 1.02 2.70
All India 55,747.00 58,028.05 2,281.05 911.70 937.61 -60.37 1.62
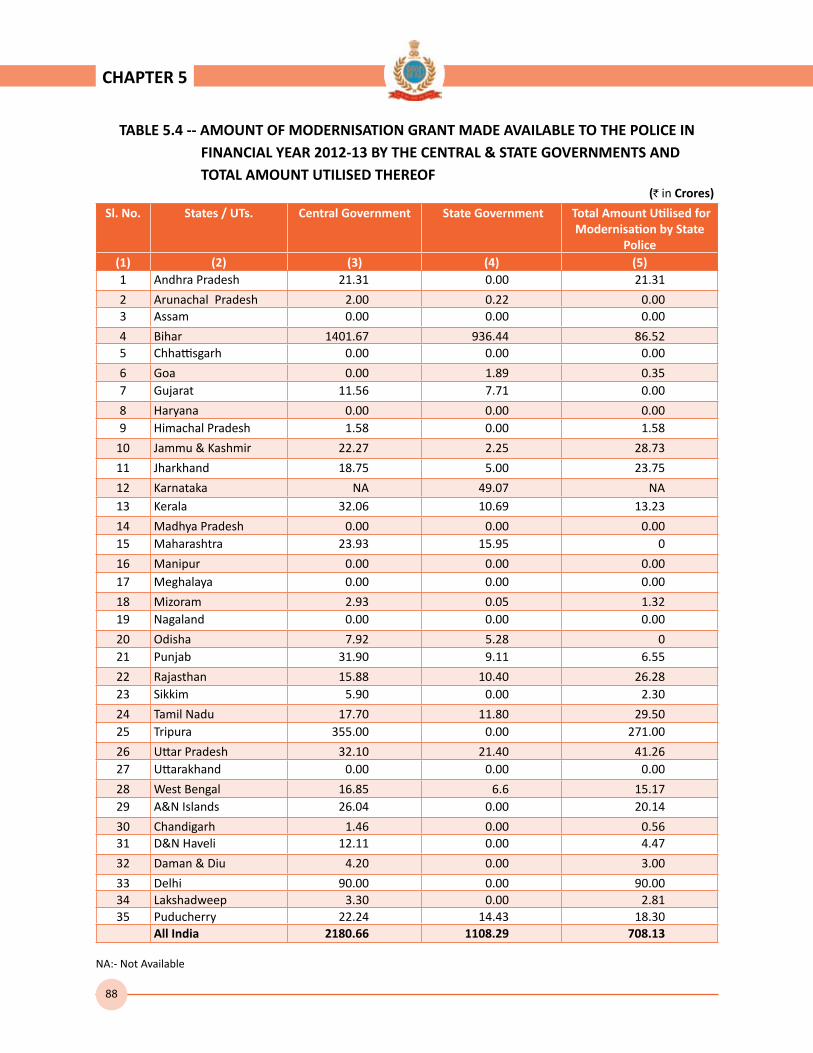
88
CHAPTER 5
TABLE 5.4 -- AMOUNT OF MODERNISATION GRANT MADE AVAILABLE TO THE POLICE INFINANCIAL YEAR 2012-13 BY THE CENTRAL & STATE GOVERNMENTS AND TOTAL AMOUNT UTILISED THEREOF
(` in Crores)
Sl. No. States / UTs. Central Government State Government Total Amount Utilised for Modernisation by State
Police (1) (2) (3) (4) (5) 1 Andhra Pradesh 21.31 0.00 21.31
2 Arunachal Pradesh 2.00 0.22 0.003 Assam 0.00 0.00 0.00
4 Bihar 1401.67 936.44 86.525 Chhattisgarh 0.00 0.00 0.00
6 Goa 0.00 1.89 0.357 Gujarat 11.56 7.71 0.00
8 Haryana 0.00 0.00 0.009 Himachal Pradesh 1.58 0.00 1.58
10 Jammu & Kashmir 22.27 2.25 28.73
11 Jharkhand 18.75 5.00 23.75
12 Karnataka NA 49.07 NA13 Kerala 32.06 10.69 13.23
14 Madhya Pradesh 0.00 0.00 0.0015 Maharashtra 23.93 15.95 0
16 Manipur 0.00 0.00 0.0017 Meghalaya 0.00 0.00 0.00
18 Mizoram 2.93 0.05 1.3219 Nagaland 0.00 0.00 0.00
20 Odisha 7.92 5.28 021 Punjab 31.90 9.11 6.55
22 Rajasthan 15.88 10.40 26.2823 Sikkim 5.90 0.00 2.30
24 Tamil Nadu 17.70 11.80 29.5025 Tripura 355.00 0.00 271.00
26 Uttar Pradesh 32.10 21.40 41.2627 Uttarakhand 0.00 0.00 0.00
28 West Bengal 16.85 6.6 15.1729 A&N Islands 26.04 0.00 20.14
30 Chandigarh 1.46 0.00 0.5631 D&N Haveli 12.11 0.00 4.47
32 Daman & Diu 4.20 0.00 3.00
33 Delhi 90.00 0.00 90.0034 Lakshadweep 3.30 0.00 2.8135 Puducherry 22.24 14.43 18.30
All India 2180.66 1108.29 708.13
NA:- Not Available

89
CHAPTER 5
TABLE 5.5-- INCREASE/DECREASE IN POLICE HOUSING EXPENDITURE IN 2012-13 ASCOMPARED TO 2011-12 & PERCENTAGE LEVEL OF SATISFACTION OF FAMILY ACCOMMODATION
(` in Crores)Sl.
No.States / UTs. Total Police Housing Expenditure (Rs. In
Crores)Percent Level of Satisfaction of
Family Accommodation2011-12 2012-13 Increase/
DecreaseUpper
Subordinates Lower
Subordinate(1) (2) (3) (4) (5) (6) (7) 1 Andhra Pradesh 97.86 22.84 -75.02 50.00 50.002 Arunachal Pradesh 0.53 11.8 11.27 40.77 19.393 Assam 5.70 20.36 14.66 16.69 15.754 Bihar 112.17 12.57 -99.60 18.75 13.265 Chhattisgarh 103.94 201.33 97.39 29.27 23.806 Goa 0.99 0.99 0.00 NA NA7 Gujarat 105.50 193.26 87.76 0.00 0.008 Haryana 0 0 0.00 17.98 13.56
9 Himachal Pradesh 17.35 13.79 -3.56 18.24 29.6510 Jammu & Kashmir 2.14 26.52 24.38 17.00 17.00
11 Jharkhand NA 6511.08 NA 12.00 15.0012 Karnataka 95.62 88 -7.62 31.00 44.00
13 Kerala 20.00 0 -20.00 29.00 20.0014 Madhya Pradesh 40.29 96.62 56.33 29.23 39.44
15 Maharashtra 3.00 16610.53 16607.53 19.59 158.4816 Manipur 76.23 0 -76.23 10.71 4.40
17 Meghalaya 7.59 7.78 0.19 48.34 25.8718 Mizoram 14.28 0.35 -13.93 23.97 22.35
19 Nagaland 0 0 0.00 45.67 17.0020 Odisha 117.98 189.87 71.89 22.16 18.14
21 Punjab 51.49 36.71 -14.78 22.76 17.5922 Rajasthan 97.22 97.43 0.21 29.04 46.38
23 Sikkim 0.4 1.98 1.58 30.00 15.0024 Tamil Nadu 130.68 101.73 -28.95 29.90 43.91
25 Tripura 4.10 0 -4.10 31.75 26.3626 Uttar Pradesh 25.35 283.03 257.68 50.00 65.00
27 Uttarakhand 11.76 0 -11.76 24.00 23.0028 West Bengal 7.59 5.57 -2.02 32.40 23.53
29 A&N Islands 3.72 1.38 -2.34 48.25 38.6030 Chandigarh 3.86 2.26 -1.60 100.00 30.50
31 D&N Haveli 0.00 1.2 1.20 93.75 80.4532 Daman & Diu 0.00 0 0.00 26.00 45.87
33 Delhi 29.25 24.5 -4.75 35.51 15.5834 Lakshadweep 0.00 0 0.00 55.00 53.00
35 Puducherry 2.40 2.86 0.46 32.99 37.54All India 1188.99 24566.34 23377.35 1121.72 1109.40
NA: Not Available
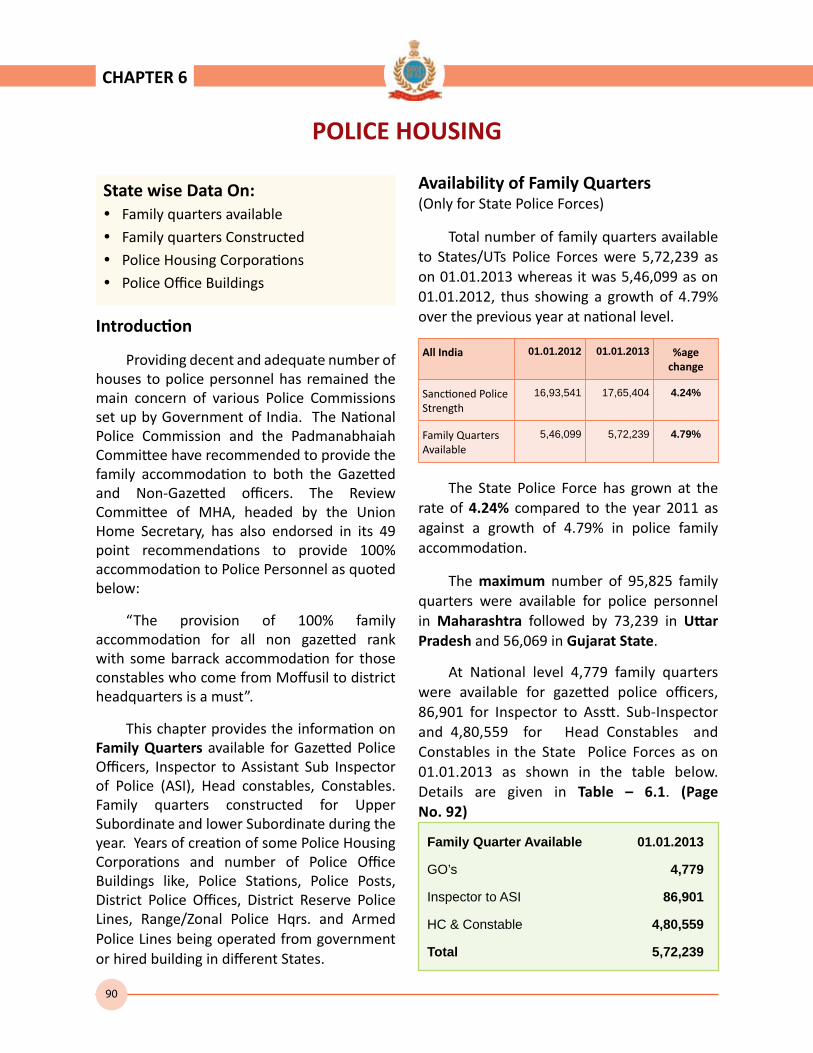
90
CHAPTER 6
Introduction
Providing decent and adequate number of houses to police personnel has remained the main concern of various Police Commissions set up by Government of India. The National Police Commission and the Padmanabhaiah Committee have recommended to provide the family accommodation to both the Gazetted and Non-Gazetted officers. The Review Committee of MHA, headed by the Union Home Secretary, has also endorsed in its 49 point recommendations to provide 100% accommodation to Police Personnel as quoted below:
“The provision of 100% family accommodation for all non gazetted rank with some barrack accommodation for those constables who come from Moffusil to district headquarters is a must”.
This chapter provides the information on Family Quarters available for Gazetted Police Officers, Inspector to Assistant Sub Inspector of Police (ASI), Head constables, Constables. Family quarters constructed for Upper Subordinate and lower Subordinate during the year. Years of creation of some Police Housing Corporations and number of Police Office Buildings like, Police Stations, Police Posts, District Police Offices, District Reserve Police Lines, Range/Zonal Police Hqrs. and Armed Police Lines being operated from government or hired building in different States.
Availability of Family Quarters (Only for State Police Forces)
Total number of family quarters available to States/UTs Police Forces were 5,72,239 as on 01.01.2013 whereas it was 5,46,099 as on 01.01.2012, thus showing a growth of 4.79% over the previous year at national level.
POLICE HOUSING
State wise Data On: Family quarters available
Family quarters Constructed
Police Housing Corporations
Police Office Buildings
Family Quarter Available 01.01.2013
GO’s 4,779
Inspector to ASI 86,901
HC & Constable 4,80,559
Total 5,72,239
All India 01.01.2012 01.01.2013 %age change
Sanctioned Police Strength
16,93,541 17,65,404 4.24%
Family Quarters Available
5,46,099 5,72,239 4.79%
The State Police Force has grown at the rate of 4.24% compared to the year 2011 as against a growth of 4.79% in police family accommodation.
The maximum number of 95,825 family quarters were available for police personnel in Maharashtra followed by 73,239 in Uttar Pradesh and 56,069 in Gujarat State.
At National level 4,779 family quarters were available for gazetted police officers, 86,901 for Inspector to Asstt. Sub-Inspector and 4,80,559 for Head Constables and Constables in the State Police Forces as on 01.01.2013 as shown in the table below. Details are given in Table – 6.1. (Page No. 92)

91
CHAPTER 6
The information on number of family quarters constructed during the year 2012 has also been compiled. At all India level 2,550 family quarters were constructed for Upper Subordinates and 14,276 family quarters were constructed for Lower Subordinates in State Police Force. Details are given in Table -6.1 (Page No. 92)
There are 21 Police Housing Corporations in different states of the country which are mainly responsible for the construction of family quarters and Police Office buildings for the state police forces. Details are given in Table – 6.2. (Page No 93)
As on 01.01.2013 only 5.72 lakhs family quarters were available for over 17.65 lakhs police personnel in the country.
Information has also been compiled on number of Police Office Buildings – Police Stations, Police Posts, Sub-Divisional Police Offices, Districts Police Offices, District Reserve Police Lines, Range and Zonal Police headquarters and District Police Lines being operated from Government or Hired Buildings in different States/UTs as on 1.1.2013.
Details are given in Table – 6.3 (Page No. 94-95)

92
CHAPTER 6
TABLE 6.1--STATE/UT-WISE FAMILY QUARTERS AVAILABLE FOR GAZETTED OFFICERS (GOs),INSPECTORS TO ASIs, H.CONSTABLEs AND CONSTABLEs AND FAMILY QUARTERS CONSTRUCTED DURING YEAR
Sl. No.
States / UTs. Family Quarters Available (as on 1.1.2012)
Family Quarters Constructed during 2011
GO's Inspector to ASI
HC & Const. Total Upper Subordinates
Lower Subordinates
(1) (2) (3) (4) (5) (6) (7) (8)
1 Andhra Pradesh 37 7,560 38,260 45,857 0 0
2 Arunachal Pradesh 100 1,241 1,960 3,301 23 0
3 Assam 105 1,119 7,526 8,750 24 1024 Bihar 310 2,933 9,035 12,278 84 1125 Chhattisgarh 3 2,191 12,414 14,608 0 06 Goa 12 75 1,242 1,329 0 07 Gujarat 203 3095 52771 56,069 115 16828 Haryana 166 1,147 6,678 7,991 28 4369 Himachal Pradesh 66 398 2,506 2,970 6 4410 Jammu & Kashmir 148 1,184 6,095 7,427 0 011 Jharkhand 0 788 1,036 1,824 211 25812 Karnataka 216 3,338 37,323 40,877 32 35713 Kerala 169 1,238 6,996 8,403 33 11614 Madhya Pradesh 0 4,437 29,772 34,209 465 1,99315 Maharashtra 627 15,973 79,225 95,825 953 4,57116 Manipur 115 381 1,301 1,797 0 017 Meghalaya 42 523 2,315 2,880 2 7218 Mizoram 111 245 1,417 1,773 7 1219 Nagaland 157 697 3,510 4,364 0 13120 Odisha 322 2,170 8,331 10,823 20 3621 Punjab 50 1,670 11,238 12,958 0 022 Rajasthan 52 2,892 22,639 25,583 8 11023 Sikkim 13 138 331 482 0 124 Tamil Nadu 372 3,845 45,455 49,672 104 1,26625 Tripura 76 997 3,048 4,121 0 026 Uttar Pradesh 382 16,183 56,674 73,239 372 2,62327 Uttarakhand 79 714 4,267 5,060 52 20828 West Bengal 500 4,170 12,369 17,039 0 029 A&N Islands 24 275 1,199 1,498 11 11030 Chandigarh 11 341 1,834 2,186 0 3631 D&N Haveli 1 31 212 244 0 032 Daman & Diu 1 6 120 127 0 033 Delhi 293 4,762 10,529 15,584 0 034 Lakshadweep 2 34 168 204 0 035 Puducherry 14 110 763 887 0 0
All India 4,779 86,901 480,559 572,239 2,550 14,276
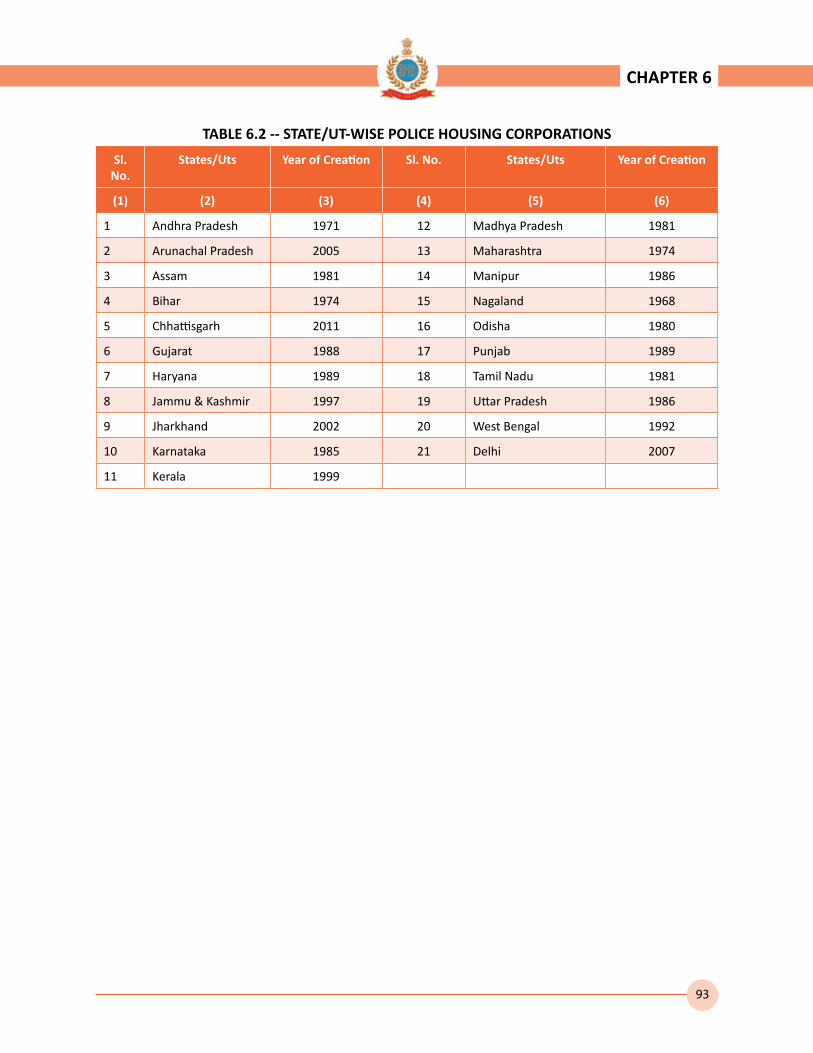
93
CHAPTER 6
TABLE 6.2 -- STATE/UT-WISE POLICE HOUSING CORPORATIONS
Sl. No.
States/Uts Year of Creation Sl. No. States/Uts Year of Creation
(1) (2) (3) (4) (5) (6)
1 Andhra Pradesh 1971 12 Madhya Pradesh 1981
2 Arunachal Pradesh 2005 13 Maharashtra 1974
3 Assam 1981 14 Manipur 1986
4 Bihar 1974 15 Nagaland 1968
5 Chhattisgarh 2011 16 Odisha 1980
6 Gujarat 1988 17 Punjab 1989
7 Haryana 1989 18 Tamil Nadu 1981
8 Jammu & Kashmir 1997 19 Uttar Pradesh 1986
9 Jharkhand 2002 20 West Bengal 1992
10 Karnataka 1985 21 Delhi 2007
11 Kerala 1999
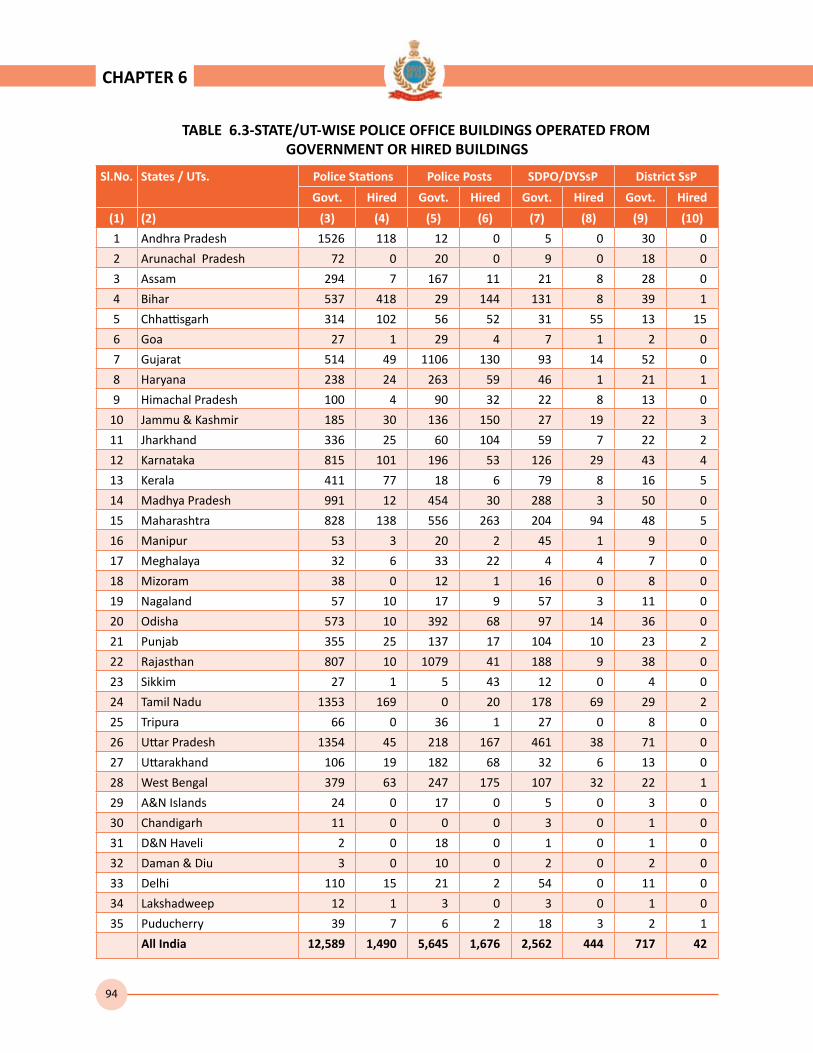
94
TABLE 6.3-STATE/UT-WISE POLICE OFFICE BUILDINGS OPERATED FROM GOVERNMENT OR HIRED BUILDINGS
Sl.No. States / UTs. Police Stations Police Posts SDPO/DYSsP District SsP
Govt. Hired Govt. Hired Govt. Hired Govt. Hired
(1) (2) (3) (4) (5) (6) (7) (8) (9) (10)
1 Andhra Pradesh 1526 118 12 0 5 0 30 0
2 Arunachal Pradesh 72 0 20 0 9 0 18 0
3 Assam 294 7 167 11 21 8 28 0
4 Bihar 537 418 29 144 131 8 39 1
5 Chhattisgarh 314 102 56 52 31 55 13 15
6 Goa 27 1 29 4 7 1 2 0
7 Gujarat 514 49 1106 130 93 14 52 0
8 Haryana 238 24 263 59 46 1 21 1
9 Himachal Pradesh 100 4 90 32 22 8 13 0
10 Jammu & Kashmir 185 30 136 150 27 19 22 3
11 Jharkhand 336 25 60 104 59 7 22 2
12 Karnataka 815 101 196 53 126 29 43 4
13 Kerala 411 77 18 6 79 8 16 5
14 Madhya Pradesh 991 12 454 30 288 3 50 0
15 Maharashtra 828 138 556 263 204 94 48 5
16 Manipur 53 3 20 2 45 1 9 0
17 Meghalaya 32 6 33 22 4 4 7 0
18 Mizoram 38 0 12 1 16 0 8 0
19 Nagaland 57 10 17 9 57 3 11 0
20 Odisha 573 10 392 68 97 14 36 0
21 Punjab 355 25 137 17 104 10 23 2
22 Rajasthan 807 10 1079 41 188 9 38 0
23 Sikkim 27 1 5 43 12 0 4 0
24 Tamil Nadu 1353 169 0 20 178 69 29 2
25 Tripura 66 0 36 1 27 0 8 0
26 Uttar Pradesh 1354 45 218 167 461 38 71 0
27 Uttarakhand 106 19 182 68 32 6 13 0
28 West Bengal 379 63 247 175 107 32 22 1
29 A&N Islands 24 0 17 0 5 0 3 0
30 Chandigarh 11 0 0 0 3 0 1 0
31 D&N Haveli 2 0 18 0 1 0 1 0
32 Daman & Diu 3 0 10 0 2 0 2 0
33 Delhi 110 15 21 2 54 0 11 0
34 Lakshadweep 12 1 3 0 3 0 1 0
35 Puducherry 39 7 6 2 18 3 2 1
All India 12,589 1,490 5,645 1,676 2,562 444 717 42
CHAPTER 6

95
TABLE 6.3 -- (Continued...)Sl.No. States / UTs. District Reserve Police Lines DIG Range Armed Police Lines
Govt. Hired Govt. Hired Govt. Hired
(1) (2) (11) (12) (13) (14) (15) (16)
1 Andhra Pradesh 30 0 10 0 5 0
2 Arunachal Pradesh 17 0 3 0 5 0
3 Assam 28 0 6 1 28 0
4 Bihar 40 0 2 1 18 0
5 Chhattisgarh 19 9 4 1 11 6
6 Goa 0 0 1 0 1 0
7 Gujarat 441 0 12 8 446 0
8 Haryana 22 0 4 0 8 0
9 Himachal Pradesh 13 0 2 1 6 1
10 Jammu & Kashmir 23 2 5 2 22 9
11 Jharkhand 16 5 5 0 26 2
12 Karnataka 32 1 5 1 49 7
13 Kerala 206 0 8 0 119 0
14 Madhya Pradesh 49 1 26 0 12 1
15 Maharashtra 49 10 10 0 2507 0
16 Manipur 9 0 4 0 14 0
17 Meghalaya 7 0 1 1 4 2
18 Mizoram 0 0 2 0 8 0
19 Nagaland 9 2 2 0 15 0
20 Odisha 34 2 7 1 8 0
21 Punjab 20 5 4 3 19 1
22 Rajasthan 38 0 8 0 14 0
23 Sikkim 0 1 1 0 0 0
24 Tamil Nadu 12225 0 11 1 5526 0
25 Tripura 8 0 2 0 12 0
26 Uttar Pradesh 71 0 16 2 71 0
27 Uttarakhand 13 0 2 0 0 0
28 West Bengal 24 9 9 5 28 9
29 A&N Islands 0 0 1 0 1 0
30 Chandigarh 1 0 0 0 1 0
31 D&N Haveli 0 0 0 0 0 0
32 Daman & Diu 0 0 0 0 0 0
33 Delhi 11 0 3 0 15 0
34 Lakshadweep 0 0 0 0 0 0
35 Puducherry 0 0 0 0 0 0
All India 13,455 47 176 28 8,999 38
CHAPTER 6

96
In this Chapter State/UT wise data has been compiled and analyzed respecting Type Wise Transport Facilities (vehicles) available with Police Forces and State Wise Number of Vehicles available per 100 policemen.
Transport facilities (Mobility)
Mobility is measured in terms of the ability of the entire strength of a Police Unit to move at once. Police mobility is directly linked to police performance. Quick response in real time, during law and order situations helps in a significant way to preserve the precious lives of people and to protect public and private property besides being a reliable indicator of police performance.
The vehicles needed to provide mobility to Police Force have been divided into four categories i.e. Heavy Vehicles (Buses/Trucks & Troop Carriers), Medium Vehicles, Light Vehicles (Jeeps/Cars) and Two Wheelers. Apart from the above types of vehicles, the States have also procured different types of Special Purpose Vehicles like mine proof vehicles, riot control vehicles, ambulances, mobile forensic vehicles, water tankers, prison vans etc. depending on vital police functions and their local area specific needs.
It can be observed that the major chunk of police vehicles (87,613) are four wheelers, which account for about 57.8% of the total holding of vehicles with Police. Four Wheeler Vehicles cater to the police mobility needs both of the Field Police Units like Police Stations and Field level Supervisory Police Officers.
The performance in procurement of vehicles from the year 2004 to 2012 is given in the Table below, which shows a significant improvement in the police mobility during this period.
TRANSPORT FACILITIES
State Wise Data on : Heavy Duty Vehicles
Medium Duty Vehicles
Light Vehicles
Three/Two Wheelers
Number of Vehicles per 100 Policemen
VEHICLES AVAILABILITY WITH STATE POLICE
Years Heavy Medium Light Two/ Three Wheelers Others Total
2004 9863 10560 45338 30414 616 96791
2005 10048 11980 46330 34707 1137 104200
2006 10022 12577 48176 40504 1313 112592
.2007 9903 16308 45597 46024 3845 121677
2008 10242 13847 54077 51198 835 130199
2009 10353 14289 56161 56019 849 137671
2010 10710 13456 55889 58070 1037 139162
2011 10863 13811 58180 59856 1255 143965
2012 11525 14362 61726 61576 4315 153504
CHAPTER 7

97
This has been possible due to regular procurement of vehicles under the on going Police Modernization of State Police Forces Scheme (MPF Scheme) launched jointly by the Central Government and the State Governments, with effect from the financial year 2000-01. It has been observed that on an average 15-20% of the modernization funds under this scheme have been utilized in improving the police mobility position. One can see a rising trend in the procurement of all kinds of vehicles for the Police departments across the country which is expected to help improve the quality of police performance.
All the vehicles held by the Police Forces have a fixed life period and these are condemned after attaining un-serviceability stage. The demand for new vehicles comes from, replacement of condemned vehicles and against the creation of new posts and new police units besides for meeting the existing deficiency against the prescribed norms.
Authorization of vehicles for the Police Forces has been standardized by the BPR&D by fixing specific norms for different types of
vehicles for different police units, as mentioned below :
(1) Armed Battalions of States :
(a) Heavy Vehicles – 29; (b) Medium Vehicles – 8;
(c) Light Vehicles – 13; (d) Motor cycles – 5;
(2) District Police Line of States :
(a) Heavy Vehicles – 7; (b) Medium Vehicles 17;
(c) Light Vehicles – 14; (d) Motor cycles – 7; and 2- Heavy Vehicles for District Prison and
1-Medium Vehicle for Sub-Division.
(3) Police Stations :
(a) Light Vehicles – 2; (b) Motor cycles – 3;
(4) Police -Posts :
(a) Motor cycles – 2
(Source : BPR&D Concept paper – Modernization & Up-gradation of Police Infrastructure – A Five Year Projection – 2000)
CHAPTER 7

98
On the basis of the above norms, the requirement of different types of vehicles for Armed Battalions / Districts Police Lines / Police Stations / Police Posts and 15% extra vehicles for Police Head Quarters /Special Cells and Branches, as on 01.01.2013, has been calculated for the whole of country and is shown in the Table below :
in the Police Forces of the States/UTs as on 01.01.2013. It is expected that the with the further extension of the Modernization of State Police Force scheme (MPF scheme) launched in Financial year 2000-01 for five years, the remaining deficiency of Police vehicles and the new one arising out of normal attrition
Types of Vehicles
For Armed Battalions
For Sanctioned Civil Police Strength
For Police
Stations
For Police Posts
Sub-Total
The HQtr.Spl unit/Branches
(15% extra)
Grand Total
Number of units 430 +4Coys
1765404 14360 8583
Heavy Duty 12489 15889 28378 4257 32635
Medium Duty 3445 31777 35222 5283 40505
Light Vehicles 5596 24716 28720 59032 8855 67887
Two/Three Wheelers
2155 12358 43080 17166 74759 11214 85973
Types Heavy Medium Light Two/ThreeWheelers & others
Total
Vehicle Availability 11525 14362 61726 65891 153504
Vehicle Requirement as on 01.01.2013
32235 40395 67707 85904 226241
%age deficiency 64.3% 64.4% 8.8% 23.3% 32.2%
CHAPTER 7
The requirement of police vehicles has been calculated by multiplying the number of police units with the scale of vehicles authorized for holding as per the norms. On an average another 15% have been added to meet the demand for Police Head Quarters and needs of special units like Special Branches, CID etc. The Table below shows the different type of vehicles and availability thereof :
It is seen that in spite of the sizable procurement of vehicles during the last nine years under the MPF scheme, still there was deficiency level of 32.2% percent of vehicles
and sanction of new Police Units shall also be met completely.
The total number of 1,53,504 vehicles available with the States/UTs Police as on 01.01.2013, increased by 6.63% from the availability of 1,43,965 vehicles as on 01.01.2012.
The highest number of vehicles in all categories, were held by :
1. Maharashtra Police 15632 vehicles 2. Tamil Nadu Police 14485 vehicles3. Uttar Pradesh Police 13114 vehicles

99
A total of 11525 heavy duty vehicles, 14362 medium duty vehicles, 61726 light vehicles, 61576 two/three wheelers and 4315 other vehicles were available with State/UTs police forces at national level as on 01.01.2013. Details are given in Table – 7.1. (Page No. 100)
The transport facility available per 100 sanctioned policemen was 6.95 at
national level as on 01.01.2013. Among the States, for sanctioned strength it was highest at 25.91 in D&N Haveli, followed by 18.91 in Lakshadweep and 12.62 in Karnataka. This ratio was lowest at 0.85 vehicles available per 100 policemen in Jharkhand followed by 3.56 vehicles in Uttar Pradesh and 5.19 vehicles in Himachal Pradesh. Details are given in Table – 7.2. (Page No. 101)
CHAPTER 7

100
CHAPTER 7
TABLE 7.1 -- STATE/UT-WISE TRANSPORT FACILITIES (VEHICLES) AVAILABLE WITH POLICE - AS ON 1.1.2013
Sl. No. States / UTs. Heavy Duty
Medium Duty
Light Duty Three/Two Wheelers
Others Total
(1) (2) (3) (4) (5) (6) (7) (8)
1 Andhra Pradesh 583 307 5,098 3,710 267 9,965
2 Arunachal Pradesh 60 194 340 347 0 941
3 Assam 185 670 1,727 2,458 0 5,040
4 Bihar 587 609 3,028 1,423 7 5,654
5 Chhattisgarh 289 489 1,096 1,756 0 3,630
6 Goa 13 64 212 274 0 563
7 Gujarat 1,373 0 2,682 5,051 164 9,270
8 Haryana 394 350 1,667 1,747 0 4,158
9 Himachal Pradesh 60 115 267 450 0 892
10 Jammu & Kashmir 688 977 3,062 529 0 5,256
11 Jharkhand 17 113 408 90 0 628
12 Karnataka 441 846 4,125 5,941 148 11,501
13 Kerala 219 410 3,089 2,682 87 6,487
14 Madhya Pradesh 685 890 3,275 2,987 0 7,837
15 Maharashtra 1218 1477 5540 7064 333 15,632
16 Manipur 202 283 1,272 362 0 2,119
17 Meghalaya 172 144 509 150 0 975
18 Mizoram 43 164 312 161 0 680
19 Nagaland 230 275 704 182 0 1,391
20 Odisha 336 603 1,982 2,200 13 5,134
21 Punjab 220 615 2,183 1,511 0 4,529
22 Rajasthan 192 381 2,124 2,849 98 5,644
23 Sikkim 3 68 242 141 10 464
24 Tamil Nadu 765 1,621 5,250 6,497 352 14,485
25 Tripura 211 248 854 380 5 1,698
26 Uttar Pradesh 1,503 1,064 4,997 5,550 0 13,114
27 Uttarakhand 167 127 541 447 2 1,284
28 West Bengal 321 820 2,773 0 2,782 6,696
29 A&N Islands 19 29 116 284 0 448
30 Chandigarh 27 48 199 210 0 484
31 D&N Haveli 1 5 53 26 0 85
32 Daman & Diu 0 1 21 31 3 56
33 Delhi 278 325 1,815 3,780 44 6,242
34 Lakshadweep 0 1 27 38 0 66
35 Puducherry 23 29 136 268 0 456
All India 11,525 14,362 61,726 61,576 4,315 153,504
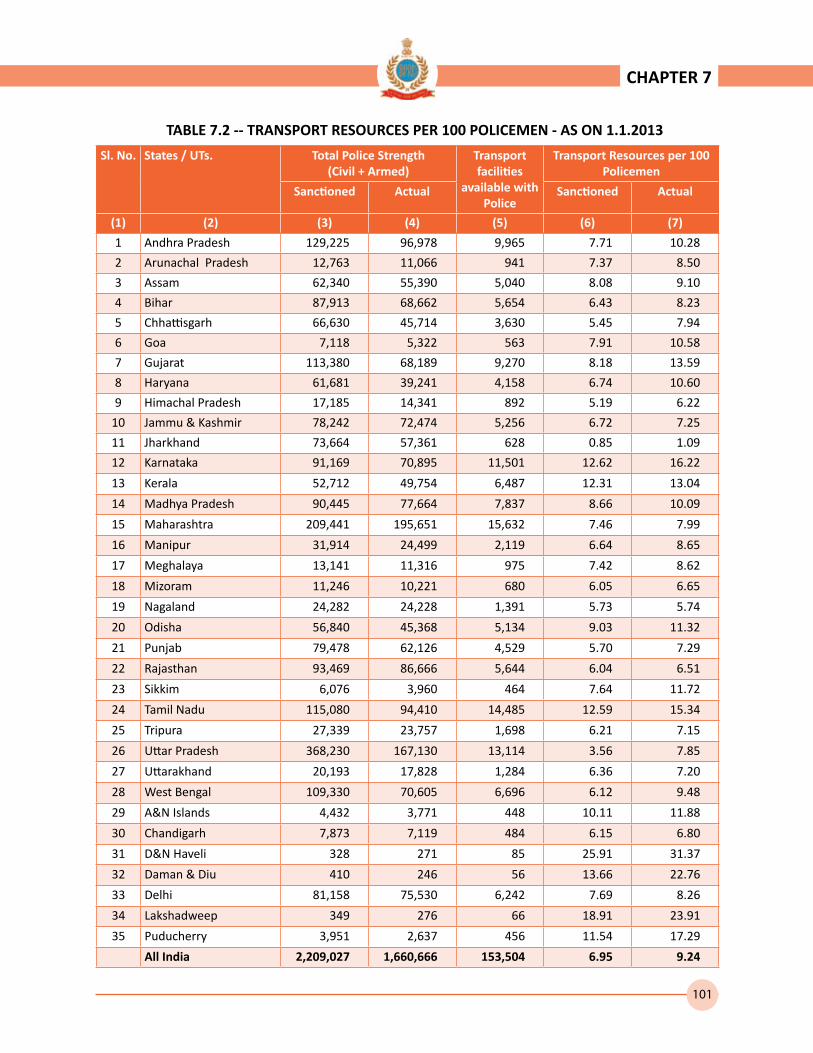
101
CHAPTER 7
TABLE 7.2 -- TRANSPORT RESOURCES PER 100 POLICEMEN - AS ON 1.1.2013
Sl. No. States / UTs. Total Police Strength (Civil + Armed)
Transport facilities
available with Police
Transport Resources per 100 Policemen
Sanctioned Actual Sanctioned Actual
(1) (2) (3) (4) (5) (6) (7)
1 Andhra Pradesh 129,225 96,978 9,965 7.71 10.28
2 Arunachal Pradesh 12,763 11,066 941 7.37 8.50
3 Assam 62,340 55,390 5,040 8.08 9.10
4 Bihar 87,913 68,662 5,654 6.43 8.23
5 Chhattisgarh 66,630 45,714 3,630 5.45 7.94
6 Goa 7,118 5,322 563 7.91 10.58
7 Gujarat 113,380 68,189 9,270 8.18 13.59
8 Haryana 61,681 39,241 4,158 6.74 10.60
9 Himachal Pradesh 17,185 14,341 892 5.19 6.22
10 Jammu & Kashmir 78,242 72,474 5,256 6.72 7.25
11 Jharkhand 73,664 57,361 628 0.85 1.09
12 Karnataka 91,169 70,895 11,501 12.62 16.22
13 Kerala 52,712 49,754 6,487 12.31 13.04
14 Madhya Pradesh 90,445 77,664 7,837 8.66 10.09
15 Maharashtra 209,441 195,651 15,632 7.46 7.99
16 Manipur 31,914 24,499 2,119 6.64 8.65
17 Meghalaya 13,141 11,316 975 7.42 8.62
18 Mizoram 11,246 10,221 680 6.05 6.65
19 Nagaland 24,282 24,228 1,391 5.73 5.74
20 Odisha 56,840 45,368 5,134 9.03 11.32
21 Punjab 79,478 62,126 4,529 5.70 7.29
22 Rajasthan 93,469 86,666 5,644 6.04 6.51
23 Sikkim 6,076 3,960 464 7.64 11.72
24 Tamil Nadu 115,080 94,410 14,485 12.59 15.34
25 Tripura 27,339 23,757 1,698 6.21 7.15
26 Uttar Pradesh 368,230 167,130 13,114 3.56 7.85
27 Uttarakhand 20,193 17,828 1,284 6.36 7.20
28 West Bengal 109,330 70,605 6,696 6.12 9.48
29 A&N Islands 4,432 3,771 448 10.11 11.88
30 Chandigarh 7,873 7,119 484 6.15 6.80
31 D&N Haveli 328 271 85 25.91 31.37
32 Daman & Diu 410 246 56 13.66 22.76
33 Delhi 81,158 75,530 6,242 7.69 8.26
34 Lakshadweep 349 276 66 18.91 23.91
35 Puducherry 3,951 2,637 456 11.54 17.29
All India 2,209,027 1,660,666 153,504 6.95 9.24

102
CHAPTER 8
This chapter depicts the information /data on State/UT in respect of number of police personnel (Constables, S.Is, Sergeants, ASIs, etc.) recruited during 2012; number of newly recruited police personnel trained and number of police personnel given in-service training during 2012.
Police Personnel Recruited
A total of 70,064 police constables were recruited fresh during 2012 as against 78,425 in 2011 in the country. At state level the maximum of 13,231 recruitments were made in Andhra Pradesh State followed by 12,162 in Tamil Nadu and 12,070 in West Bengal.
The number of Sub. Inspectors (SIs) / Assistant Sub. Inspectors (ASIs) recruited during 2012 were 2170 whereas this figure was 3875 during 2011. At state level the maximum of 582 SIs / ASIs were recruited in Madhya Pradesh followed by 404 in Odisha and 329 in Jharkhand.
Details are given in Table – 8.1. (Page No. 104)
Police Personnel Recruited
Year Constables SIs/ASIs/Surgents/ Jamadars
2011 78,425 38752012 70,064 2170
Training of newly recruited Police Personnel
A total of 1,13,116 newly recruited police personnel from the rank of Dy. SPs to constables
(civil & armed police) were trained during 2012 in the State Police Training Institutes. 353 Dy. SsP, 4512 SIs/ ASIs / Sargents, and 108251 Constables of police force were trained during the year 2012.
At state level the maximum of 75 Dy.SPs of J&K Police, followed by 45 Dy.SPs of Uttar Pradesh and 37 of Rajasthan got training during 2012 while 1602 SIs/ASIs from Maharashtra Police Force 1,233 from Andhra Pradesh and 566 from Uttar Pradesh Police were trained during this period. The maximum of 12,167 constables of West Bengal Police Force, 12,162 from Tamil Nadu and 9,041 from Rajasthan Police were trained during the year 2012. Details are given in Table – 8.2. (Page No. 105)
Police in-service training
A total of 1,03,352 police personnel from States/UTs police forces were given in-service training during the year 2012 in the country. Of these, 1,197 IPS, 1988 Dy.SsP, 29,665 SIs/Sergeants/ASIs and 70,502 constables were given in-service training during 2012. Details are given in Table – 8.3. (Page No. 106)
At state level the maximum of 134 IPS Officers from Maharashtra followed by 116 IPS Officers from Madhya Pradesh and 109 from Uttar Pradesh (including some officers having undergone training more than once), were given in-service training during 2012. During this period Gujarat Police has given in-service training to 270 Dy.SsP followed by 188 in J&K and 164 in NCT Delhi. At SIs/Sergeants/ASIs level the highest of 8438 police personnel from Tamil Nadu, 4,699 from Haryana and 3,667 from NCT Delhi were given in-service training during 2012. Some
POLICE RECRUITMENT AND TRAINING
State Wise Data on :• Police Personnel Recruited• Police Personnel Trained• Information on IPS Officers

103
CHAPTER 8
officers, out of all those trained in service, did get training exposure more than once in different programmes. Out of a total of 70,502 constables who were given in-service training, the maximum of 14,626 were from Andhra Pradesh, followed by 1,3544 from Tamil Nadu and 5,656 from Jharkhand Police. Details are given in Table – 8.3. (Page No. 106)
Information on IPS Officers
Data relating to IPS Officers has also
been collected & complied for as on 1.1.2013. The sanctioned strength of IPS officers was 4621 at All India level. Out of 4621, only 3,386 were in position. At National level only 192 officers got training Abroad during 2012. 259 officers were on deputation under the State Governments, 48 officers were on deputation from state to state govt. and 454 officers were on deputation to Central Govt.
Details are given in Table 8.4 (Page 107)

104
TABLE 8.1 -- STATE/UT-WISE NUMBER OF POLICE PERSONNEL RECRUITED DURING 2011 AND 2012
Sl. No.
States / UTs. Constables S.Is./Sergeants/ASIs/Jamadars
2011 2012 2011 2012
(1) (2) (3) (4) (5) (6) 1 Andhra Pradesh 71 13231 1380 0
2 Arunachal Pradesh 0 0 54 54
3 Assam 3060 0 126 0
4 Bihar 1889 7569 8 67
5 Chhattisgarh 5779 371 0 53
6 Goa 344 344 0 0
7 Gujarat 0 0 0 0
8 Haryana 1728 3738 0 0
9 Himachal Pradesh 1475 0 NA 10
10 Jammu & Kashmir 6374 1333 0 5
11 Jharkhand NA 2395 0 329
12 Karnataka 3091 1731 0 242
13 Kerala 4468 3100 0 0
14 Madhya Pradesh 0 4830 462 582
15 Maharashtra 17106 0 NA NA
16 Manipur 211 839 11 15
17 Meghalaya 909 235 0 116
18 Mizoram 6 2 18 0
19 Nagaland 391 962 119 108
20 Odisha 5219 16 0 404
21 Punjab 6524 0 NA 0
22 Rajasthan 6967 564 46 1
23 Sikkim 280 763 0 29
24 Tamil Nadu 8635 12162 1069 0
25 Tripura 0 1111 0 75
26 Uttar Pradesh 0 0 445 0
27 Uttarakhand 2114 0 0 0
28 West Bengal 0 12070 100 54
29 A&N Islands 384 260 0 0
30 Chandigarh 1210 0 0 26
31 D&N Haveli 0 75 0 0
32 Daman & Diu 0 0 0 0
33 Delhi 190 2363 0 0
34 Lakshadweep 0 0 0 0
35 Puducherry 0 0 37 0
All India 78,425 70,064 3875 2170
NA: Not Available
CHAPTER 8

105
TABLE 8.2 -- NUMBER OF NEWLY RECRUITED POLICE PERSONNEL TRAINED DURING 2012
Sl. No.
States / UTs. Constables S.I./Sergeants/ASIs Dy. SsPCivil Armed Total Civil Armed Total
(1) (2) (3) (4) (5) (6) (7) (8) (9)
1 Andhra Pradesh 5,894 2,126 8,020 1,079 154 1,233 7
2 Arunachal Pradesh 1,526 0 1,526 1 0 1 0
3 Assam 0 1,278 1,278 109 3 112 1
4 Bihar 4828 1528 6,356 39 0 39 2
5 Chhattisgarh 1,604 879 2,483 36 5 41 0
6 Goa 226 0 226 0 0 0 0
7 Gujarat 2,474 1,000 3,474 58 9 67 0
8 Haryana 438 0 438 53 6 59 23
9 Himachal Pradesh 0 0 0 5 6 11 10
10 Jammu & Kashmir 6,117 192 6,309 0 0 0 75
11 Jharkhand 5,188 1,146 6,334 0 0 0 1
12 Karnataka 4,034 0 4,034 14 0 14 0
13 Kerala 0 3,100 3,100 0 0 0 0
14 Madhya Pradesh 3,246 930 4,176 0 0 0 13
15 Maharashtra 7,871 992 8,863 1,602 0 1,602 21
16 Manipur 117 45 162 2 0 2 25
17 Meghalaya 0 920 920 0 0 0 6
18 Mizoram 145 0 145 18 0 18 7
19 Nagaland 487 475 962 79 29 108 5
20 Odisha 1,507 0 1,507 224 119 343 1
21 Punjab 2,556 2,031 4,587 40 0 40 4
22 Rajasthan 8,266 775 9,041 37 0 37 37
23 Sikkim 350 413 763 29 0 29 0
24 Tamil Nadu 12,162 0 12,162 0 0 0 0
25 Tripura 1,106 0 1,106 63 12 75 22
26 Uttar Pradesh 4952 37 4,989 566 0 566 45
27 Uttarakhand 1,846 188 2,034 0 0 0 0
28 West Bengal 0 12,167 12,167 44 10 54 19
29 A&N Islands 0 260 260 0 0 0 0
30 Chandigarh 122 0 122 26 0 26 0
31 D&N Haveli 100 0 100 0 0 0 0
32 Daman & Diu 0 0 0 0 0 0 0
33 Delhi 607 0 607 35 0 35 29
34 Lakshadweep 0 0 0 0 0 0 0
35 Puducherry 0 0 0 0 0 0 0
All India 77,769 30,482 108,251 4,159 353 4,512 353
CHAPTER 8

106
TABLE 8.3 -- NUMBER OF POLICE PERSONNEL GIVEN IN-SERVICE TRAINING DURING 2012
Sl. No.
States / UTs. Constables ASIs/Sargents/SIs Dy.Ss.P. IPS
Civil Armed Total Civil Armed Total
(1) (2) (3) (4) (5) (6) (7) (8) (9) (10)
1 Andhra Pradesh 14626 0 14,626 0 0 0 0 63
2 Arunachal Pradesh 21 12 33 18 35 53 10 24
3 Assam 677 2021 2,698 743 130 873 36 22
4 Bihar 2113 191 2,304 129 5 134 18 15
5 Chhattisgarh 60 2801 2,861 118 96 214 14 21
6 Goa 103 0 103 0 0 0 5 2
7 Gujarat 104 129 233 146 121 267 270 52
8 Haryana 4531 411 4,942 4507 192 4,699 89 74
9 Himachal Pradesh 0 0 0 650 410 1,060 41 29
10 Jammu & Kashmir 1064 1594 2,658 1231 643 1,874 188 50
11 Jharkhand 3079 2577 5,656 607 86 693 46 50
12 Karnataka 0 514 514 222 71 293 143 60
13 Kerala 562 412 974 0 0 0 49 0
14 Madhya Pradesh 81 510 591 644 0 644 146 116
15 Maharashtra 1316 23 1,339 76 0 76 87 134
16 Manipur 52 1141 1,193 282 22 304 65 42
17 Meghalaya 442 717 1,159 149 15 164 36 14
18 Mizoram 0 252 252 73 52 125 27 8
19 Nagaland 100 493 593 113 9 122 23 15
20 Odisha 44 0 44 816 21 837 0 8
21 Punjab 449 1265 1,714 452 116 568 53 38
22 Rajasthan 4013 317 4,330 1693 56 1,749 143 62
23 Sikkim 86 21 107 32 2 34 12 7
24 Tamil Nadu 10079 3465 13,544 7776 662 8,438 46 59
25 Tripura 43 73 116 116 17 133 62 12
26 Uttar Pradesh 2387 211 2,598 798 10 808 158 109
27 Uttarakhand 942 467 1,409 460 5 465 23 24
28 West Bengal 0 150 150 1100 42 1,142 24 49
29 A&N Islands 46 0 46 21 0 21 7 21
30 Chandigarh 85 0 85 171 0 171 0 1
31 D&N Haveli 0 0 0 0 0 0 0 0
32 Daman & Diu 0 0 0 0 0 0 0 0
33 Delhi 3354 0 3,354 3667 0 3,667 164 15
34 Lakshadweep 0 0 0 0 0 0 0 0
35 Puducherry 248 38 286 37 0 37 3 0
All India 50,707 19,805 70,512 26,847 2,818 29,665 1,988 1,196
CHAPTER 8

107
CHAPTER 8
Table 8.4 - DATA POSITION RELATING TO IPS OFFICERS (as on 1.1.2013)
Sl. No.
States / UTs. Sanctioned Strength
Actual Strength
Training Abroad
On deputation under the
State Govt.
On deputation from State
to State Govt.
On deputation to Central
Govt.
(1) (2) (3) (4) (5) (6) (7) (8) 1 Andhra Pradesh 258 210 27 8 22 12
2 Arunachal Pradesh 29 26 4 0 0 1
3 Assam 135 98 4 0 2 17
4 Bihar 231 181 9 1 0 25
5 Chhatisgarh 103 71 4 7 1 9
6 Goa 8 6 2 0 0 0
7 Gujarat 195 159 0 4 1 7
8 Haryana 137 102 13 5 0 11
9 Himachal Pradesh 89 66 0 5 0 23
10 Jammu & Kashmir 147 115 0 4 3 14
11 Jharkhand 135 98 11 0 1 13
12 Karnataka 205 135 21 8 1 8
13 Kerala 163 106 0 7 0 28
14 Madhya Pradesh 291 233 25 56 4 37
15 Maharashtra 302 203 0 17 0 18
16 Manipur 91 51 0 3 0 15
17 Meghalaya 54 35 6 0 1 8
18 Mizoram 19 14 0 1 0 0
19 Nagaland 70 31 4 1 1 7
20 Odisha 188 104 0 9 0 21
21 Punjab 172 127 0 15 3 16
22 Rajasthan 205 161 17 3 0 26
23 Sikkim 32 20 0 1 0 7
24 Tamil Nadu 263 202 1 17 5 24
25 Tripura 66 34 2 0 0 18
26 Uttar Pradesh 489 379 28 70 1 52
27 Uttarakhand 69 59 1 17 0 8
28 West Bengal 347 247 8 0 2 29
29 A&N Islands 7 12 0 0 0 0
30 Chandigarh 7 6 0 0 0 0
31 D&N Haveli 1 1 1 0 0 0
32 Daman & Diu 3 3 0 0 0 0
33 Delhi 103 80 3 0 0 0
34 Lakshadweep 2 2 0 0 0 0
35 Puducherry 5 9 1 0 0 0
All India 4,621 3,386 192 259 48 454
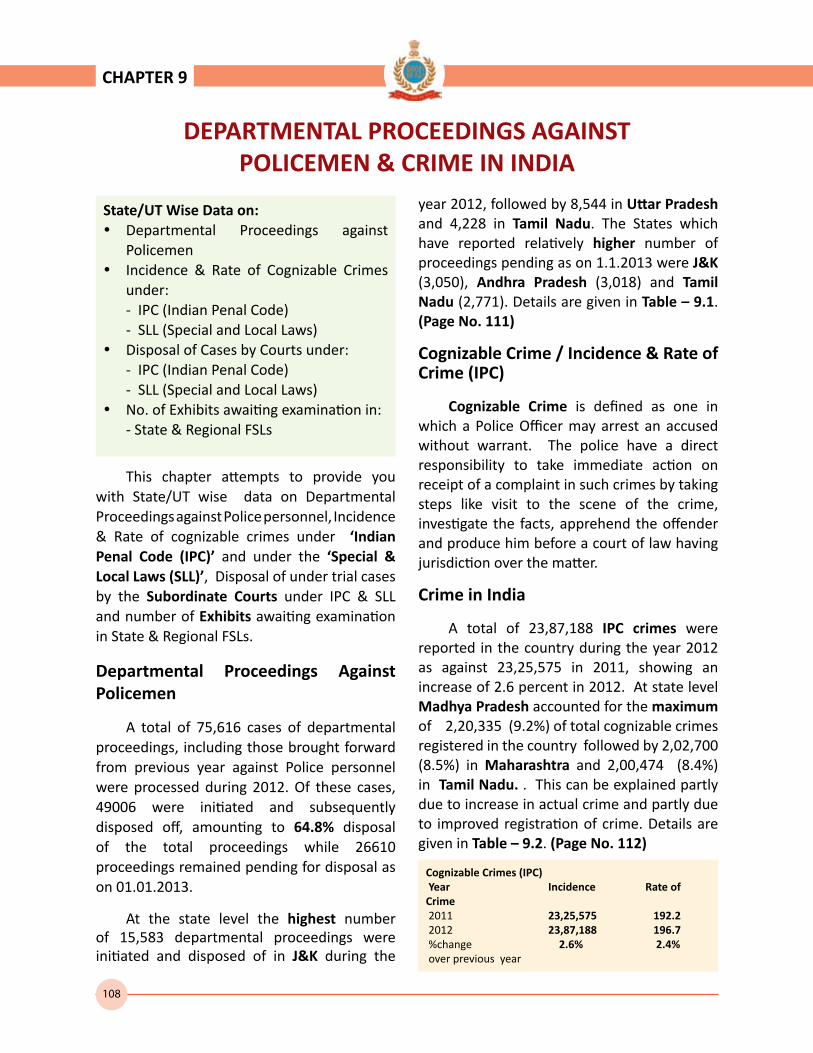
108
CHAPTER 9
This chapter attempts to provide you with State/UT wise data on Departmental Proceedings against Police personnel, Incidence & Rate of cognizable crimes under ‘Indian Penal Code (IPC)’ and under the ‘Special & Local Laws (SLL)’, Disposal of under trial cases by the Subordinate Courts under IPC & SLL and number of Exhibits awaiting examination in State & Regional FSLs.
Departmental Proceedings Against Policemen
A total of 75,616 cases of departmental proceedings, including those brought forward from previous year against Police personnel were processed during 2012. Of these cases, 49006 were initiated and subsequently disposed off, amounting to 64.8% disposal of the total proceedings while 26610 proceedings remained pending for disposal as on 01.01.2013.
At the state level the highest number of 15,583 departmental proceedings were initiated and disposed of in J&K during the
year 2012, followed by 8,544 in Uttar Pradesh and 4,228 in Tamil Nadu. The States which have reported relatively higher number of proceedings pending as on 1.1.2013 were J&K (3,050), Andhra Pradesh (3,018) and Tamil Nadu (2,771). Details are given in Table – 9.1. (Page No. 111)
Cognizable Crime / Incidence & Rate of Crime (IPC)
Cognizable Crime is defined as one in which a Police Officer may arrest an accused without warrant. The police have a direct responsibility to take immediate action on receipt of a complaint in such crimes by taking steps like visit to the scene of the crime, investigate the facts, apprehend the offender and produce him before a court of law having jurisdiction over the matter.
Crime in India
A total of 23,87,188 IPC crimes were reported in the country during the year 2012 as against 23,25,575 in 2011, showing an increase of 2.6 percent in 2012. At state level Madhya Pradesh accounted for the maximum of 2,20,335 (9.2%) of total cognizable crimes registered in the country followed by 2,02,700 (8.5%) in Maharashtra and 2,00,474 (8.4%) in Tamil Nadu. . This can be explained partly due to increase in actual crime and partly due to improved registration of crime. Details are given in Table – 9.2. (Page No. 112)
State/UT Wise Data on:Departmental Proceedings against
PolicemenIncidence & Rate of Cognizable Crimes
under: - IPC (Indian Penal Code) - SLL (Special and Local Laws)Disposal of Cases by Courts under: - IPC (Indian Penal Code) - SLL (Special and Local Laws)No. of Exhibits awaiting examination in: - State & Regional FSLs
DEPARTMENTAL PROCEEDINGS AGAINST POLICEMEN & CRIME IN INDIA
Cognizable Crimes (IPC) Year Incidence Rate of Crime 2011 23,25,575 192.2 2012 23,87,188 196.7 %change 2.6% 2.4% over previous year
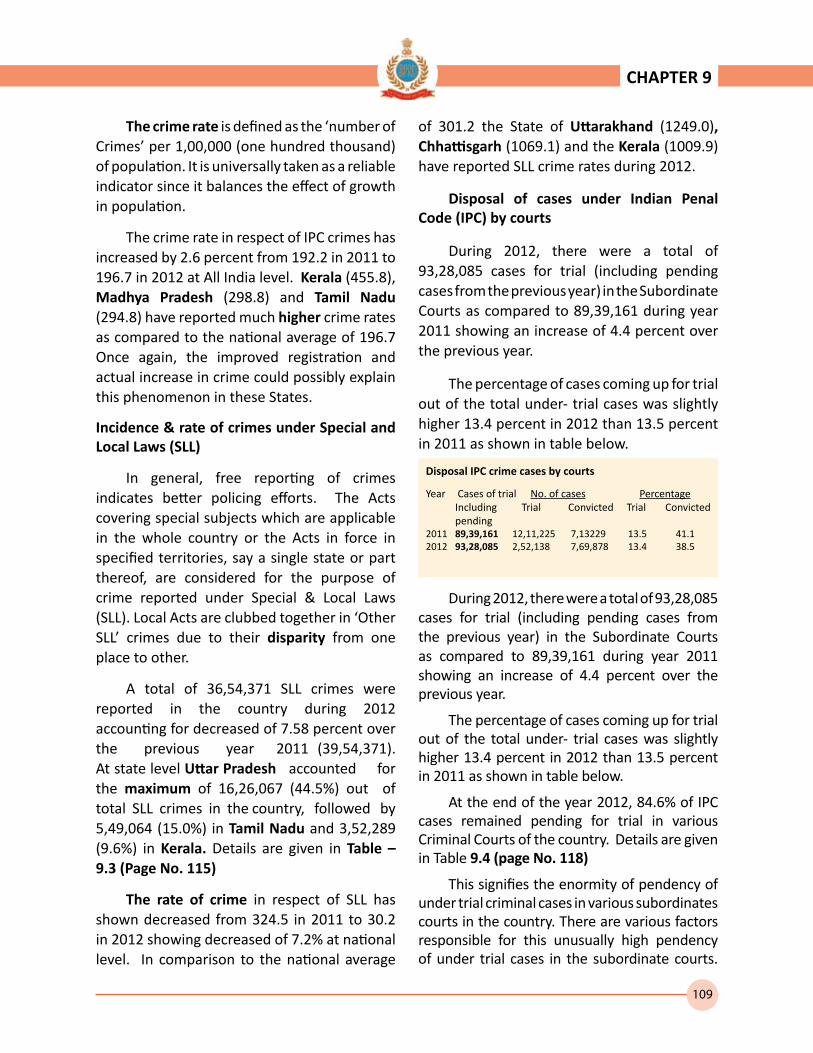
109
CHAPTER 9
The crime rate is defined as the ‘number of Crimes’ per 1,00,000 (one hundred thousand) of population. It is universally taken as a reliable indicator since it balances the effect of growth in population.
The crime rate in respect of IPC crimes has increased by 2.6 percent from 192.2 in 2011 to 196.7 in 2012 at All India level. Kerala (455.8), Madhya Pradesh (298.8) and Tamil Nadu (294.8) have reported much higher crime rates as compared to the national average of 196.7 Once again, the improved registration and actual increase in crime could possibly explain this phenomenon in these States.
Incidence & rate of crimes under Special and Local Laws (SLL)
In general, free reporting of crimes indicates better policing efforts. The Acts covering special subjects which are applicable in the whole country or the Acts in force in specified territories, say a single state or part thereof, are considered for the purpose of crime reported under Special & Local Laws (SLL). Local Acts are clubbed together in ‘Other SLL’ crimes due to their disparity from one place to other.
A total of 36,54,371 SLL crimes were reported in the country during 2012 accounting for decreased of 7.58 percent over the previous year 2011 (39,54,371). At state level Uttar Pradesh accounted for the maximum of 16,26,067 (44.5%) out of total SLL crimes in the country, followed by 5,49,064 (15.0%) in Tamil Nadu and 3,52,289 (9.6%) in Kerala. Details are given in Table – 9.3 (Page No. 115)
The rate of crime in respect of SLL has shown decreased from 324.5 in 2011 to 30.2 in 2012 showing decreased of 7.2% at national level. In comparison to the national average
of 301.2 the State of Uttarakhand (1249.0), Chhattisgarh (1069.1) and the Kerala (1009.9) have reported SLL crime rates during 2012.
Disposal of cases under Indian Penal Code (IPC) by courts
During 2012, there were a total of 93,28,085 cases for trial (including pending cases from the previous year) in the Subordinate Courts as compared to 89,39,161 during year 2011 showing an increase of 4.4 percent over the previous year.
The percentage of cases coming up for trial out of the total under- trial cases was slightly higher 13.4 percent in 2012 than 13.5 percent in 2011 as shown in table below.
Disposal IPC crime cases by courts
Year Cases of trial No. of cases Percentage Including Trial Convicted Trial Convicted pending2011 89,39,161 12,11,225 7,13229 13.5 41.12012 93,28,085 2,52,138 7,69,878 13.4 38.5
During 2012, there were a total of 93,28,085 cases for trial (including pending cases from the previous year) in the Subordinate Courts as compared to 89,39,161 during year 2011 showing an increase of 4.4 percent over the previous year.
The percentage of cases coming up for trial out of the total under- trial cases was slightly higher 13.4 percent in 2012 than 13.5 percent in 2011 as shown in table below.
At the end of the year 2012, 84.6% of IPC cases remained pending for trial in various Criminal Courts of the country. Details are given in Table 9.4 (page No. 118)
This signifies the enormity of pendency of under trial criminal cases in various subordinates courts in the country. There are various factors responsible for this unusually high pendency of under trial cases in the subordinate courts.

110
CHAPTER 9
It calls for total overhauling of the Criminal Justice System itself in order to provide justice to the accused and victims promptly and at a reasonable cost.
The North-Eastern States, in general had higher pendency of under-trial cases. The highest pendency was reported by Manipur & Meghalaya (97.3% each), followed by Arunachal Pradesh (96.2%), West Bengal & A&N Island (94.5% & 94.6) respectively as compared to the total pendency and disposal achieved during the year.
The conviction rate is the percentage of cases convicted to total cases trial and disposed off. In 2012, conviction rate was 38.5% which decreased marginally as compared to 41.1% in 2011. Conviction rate is an indicator of inadequacies in the Criminal Justice System in general and investigation and prosecution in particular. In order to win the faith of citizens in the criminal justice system, all its wings should contribute their efforts to improve the conviction rate. Highest conviction rate was, however, seen in the state of Mizoram during 2012, which recorded 89.5% conviction rate followed by 85.8% in Nagaland and 79.9% in Puducherry.
Disposal of cases under Special and Local Laws (SLL) by Courts
At All India level there were a total of 82,51,289 SLL cases, including those brought forward from the previous year, due for disposal by the Criminal Courts during 2012. The state of Uttar Pradesh has reported the maximum of 26,64,560 cases under SLL category pending for trial, followed by 16,31,112 in Gujarat and 12,86,217 in Maharashtra.
The All India average pendency of SLL cases in courts i.e. net pendency after disposal during the year was at 64.0 percent. The pendency of SLL cases by courts among states was reported to be the highest (97.6%) in Arunachal Pradesh. The next in order was Manipur (96.4%), followed by West Bengal (94.6%). Details are given in Table – 9.5. (Page No. 119)
The conviction rate for SLL crimes was much higher (88.6%) than that of IPC crimes (38.5%) at the national level. The highest conviction rate in SLL crimes among states was reported by Uttrakhand as (99.5%) followed by Chhattisgarh (98.0%) and A&N Island & Chandigarh as (96.5% & 96.4%) respectively.
Exhibits awaiting examination in the State and Regional FSLs
There were a total of 22,77,741 exhibits, including those carried forward from the previous year pending for examination in various Forensic Science Laboratories (FSLs) in the country during 2012. Out of these in 14,82,228 exhibits examination was initiated and these were disposed off, accounting for 65.1% of the total exhibits awaiting examination. As many as 79,55,13 (34.9%) exhibits remained pending for disposal as on 1.1.2013.
At state level the highest number of 3,42,152 exhibits were disposed of during the year 2012 in Gujarat, followed by 2,33,370 in Maharashtra and 2,32,135 in Tamil Nadu. Maharashtra State has reported highest number 1,68,867 of exhibits pending examination as on 1.1.2013. The next in the order was Punjab 16,1791 followed by Odisha 1,15,182. Details are given in Table – 9.6. (Page No. 120)
Slow disposal of exhibits has a whiplash effect on the entire chain of investigation, trial and conviction of criminal cases. It also hampers and slows down the investigation process. Increasing the capacity in our Forensic Science Laboratories (FSL) is called for urgently. Automation of Testing Machines and recruitment of experts in adequate numbers for testing labs (FSLs) is also likely to help and solve this problem significantly which is being attempted under the Modernization of Police Forces Scheme (MPF Scheme) launched by the Central Governments jointly with the State Governments with effect from the financial year 2000-01.
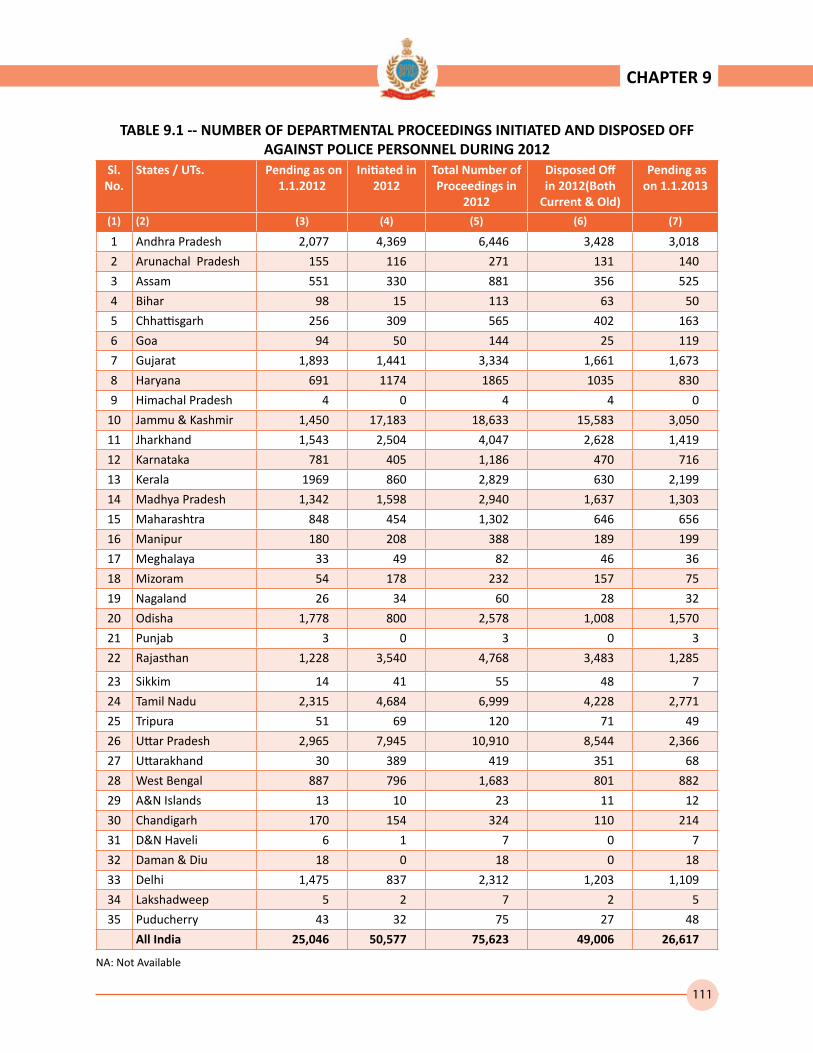
111
CHAPTER 9
TABLE 9.1 -- NUMBER OF DEPARTMENTAL PROCEEDINGS INITIATED AND DISPOSED OFF AGAINST POLICE PERSONNEL DURING 2012
Sl. No.
States / UTs. Pending as on 1.1.2012
Initiated in 2012
Total Number of Proceedings in
2012
Disposed Off in 2012(Both
Current & Old)
Pending as on 1.1.2013
(1) (2) (3) (4) (5) (6) (7)
1 Andhra Pradesh 2,077 4,369 6,446 3,428 3,018
2 Arunachal Pradesh 155 116 271 131 140
3 Assam 551 330 881 356 525
4 Bihar 98 15 113 63 50
5 Chhattisgarh 256 309 565 402 163
6 Goa 94 50 144 25 119
7 Gujarat 1,893 1,441 3,334 1,661 1,673
8 Haryana 691 1174 1865 1035 830
9 Himachal Pradesh 4 0 4 4 0
10 Jammu & Kashmir 1,450 17,183 18,633 15,583 3,050
11 Jharkhand 1,543 2,504 4,047 2,628 1,419
12 Karnataka 781 405 1,186 470 716
13 Kerala 1969 860 2,829 630 2,199
14 Madhya Pradesh 1,342 1,598 2,940 1,637 1,303
15 Maharashtra 848 454 1,302 646 656
16 Manipur 180 208 388 189 199
17 Meghalaya 33 49 82 46 36
18 Mizoram 54 178 232 157 75
19 Nagaland 26 34 60 28 32
20 Odisha 1,778 800 2,578 1,008 1,570
21 Punjab 3 0 3 0 3
22 Rajasthan 1,228 3,540 4,768 3,483 1,285
23 Sikkim 14 41 55 48 7
24 Tamil Nadu 2,315 4,684 6,999 4,228 2,771
25 Tripura 51 69 120 71 49
26 Uttar Pradesh 2,965 7,945 10,910 8,544 2,366
27 Uttarakhand 30 389 419 351 68
28 West Bengal 887 796 1,683 801 882
29 A&N Islands 13 10 23 11 12
30 Chandigarh 170 154 324 110 214
31 D&N Haveli 6 1 7 0 7
32 Daman & Diu 18 0 18 0 18
33 Delhi 1,475 837 2,312 1,203 1,109
34 Lakshadweep 5 2 7 2 5
35 Puducherry 43 32 75 27 48
All India 25,046 50,577 75,623 49,006 26,617
NA: Not Available
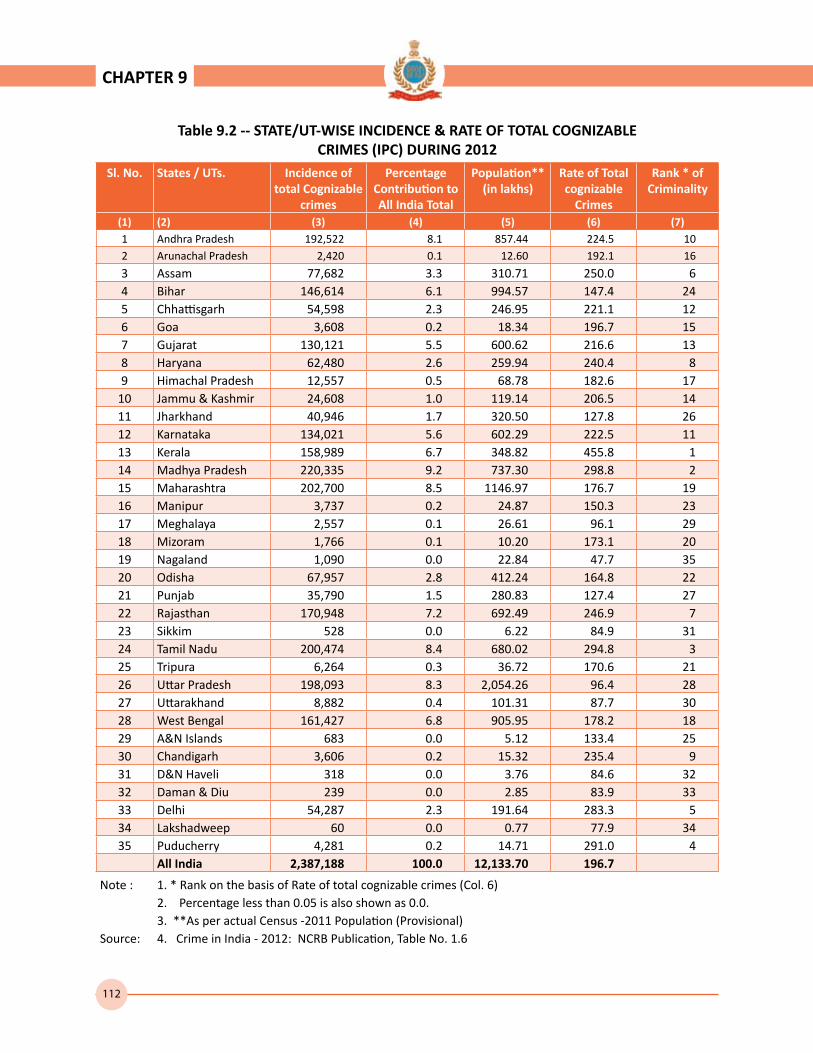
112
CHAPTER 9
Table 9.2 -- STATE/UT-WISE INCIDENCE & RATE OF TOTAL COGNIZABLE CRIMES (IPC) DURING 2012
Sl. No. States / UTs. Incidence of total Cognizable
crimes
Percentage Contribution to All India Total
Population** (in lakhs)
Rate of Total cognizable
Crimes
Rank * of Criminality
(1) (2) (3) (4) (5) (6) (7) 1 Andhra Pradesh 192,522 8.1 857.44 224.5 102 Arunachal Pradesh 2,420 0.1 12.60 192.1 16
3 Assam 77,682 3.3 310.71 250.0 64 Bihar 146,614 6.1 994.57 147.4 245 Chhattisgarh 54,598 2.3 246.95 221.1 126 Goa 3,608 0.2 18.34 196.7 157 Gujarat 130,121 5.5 600.62 216.6 138 Haryana 62,480 2.6 259.94 240.4 89 Himachal Pradesh 12,557 0.5 68.78 182.6 17
10 Jammu & Kashmir 24,608 1.0 119.14 206.5 1411 Jharkhand 40,946 1.7 320.50 127.8 2612 Karnataka 134,021 5.6 602.29 222.5 1113 Kerala 158,989 6.7 348.82 455.8 114 Madhya Pradesh 220,335 9.2 737.30 298.8 215 Maharashtra 202,700 8.5 1146.97 176.7 1916 Manipur 3,737 0.2 24.87 150.3 2317 Meghalaya 2,557 0.1 26.61 96.1 2918 Mizoram 1,766 0.1 10.20 173.1 2019 Nagaland 1,090 0.0 22.84 47.7 3520 Odisha 67,957 2.8 412.24 164.8 2221 Punjab 35,790 1.5 280.83 127.4 2722 Rajasthan 170,948 7.2 692.49 246.9 723 Sikkim 528 0.0 6.22 84.9 3124 Tamil Nadu 200,474 8.4 680.02 294.8 325 Tripura 6,264 0.3 36.72 170.6 2126 Uttar Pradesh 198,093 8.3 2,054.26 96.4 2827 Uttarakhand 8,882 0.4 101.31 87.7 3028 West Bengal 161,427 6.8 905.95 178.2 1829 A&N Islands 683 0.0 5.12 133.4 2530 Chandigarh 3,606 0.2 15.32 235.4 931 D&N Haveli 318 0.0 3.76 84.6 3232 Daman & Diu 239 0.0 2.85 83.9 3333 Delhi 54,287 2.3 191.64 283.3 534 Lakshadweep 60 0.0 0.77 77.9 3435 Puducherry 4,281 0.2 14.71 291.0 4
All India 2,387,188 100.0 12,133.70 196.7
Note : 1. * Rank on the basis of Rate of total cognizable crimes (Col. 6) 2. Percentage less than 0.05 is also shown as 0.0.3. **As per actual Census -2011 Population (Provisional)
Source: 4. Crime in India - 2012: NCRB Publication, Table No. 1.6

113
CHAPTER 9
9.2
8.5
8.4
8.3
8.1
7.2
6.8
6.7
6.1
5.6
5.5
5.0
6.0
7.0
8.0
9.0
10.0
PERC
ENTA
GE
CON
TRIB
UTI
ON
OF
TOTA
L IP
C CR
IMES
DU
RIN
G 2
012
Percentage Con
3.3
2.8
2.6
2.3
2.3
1.7
1.5
1.0
0.5
0.4
0.3
0.2
0.2
0.2
0.2
0.1
0.1
0.1
0.0
0.0
0.0
0.0
0.0
0.0
0.0
1.0
2.0
3.0
4.0
Madhya Pradesh
Maharashtra
Tamil Nadu
Uttar Pradesh
Andhra Pradesh
Rajasthan
West Bengal
Kerala
Bihar
Karnataka
Gujarat
Assam
Odisha
Haryana
Chhattisgarh
Delhi
Jharkhand
Punjab
Jammu & Kashmir
Himachal Pradesh
Uttarakhand
Tripura
Chandigarh
Goa
Manipur
Puducherry
Arunachal Pradesh
Meghalaya
Mizoram
A&N Islands
D&N Haveli
Daman & Diu
Lakshadweep
Nagaland
Sikkim
Stat
es/U
Ts
ntribution
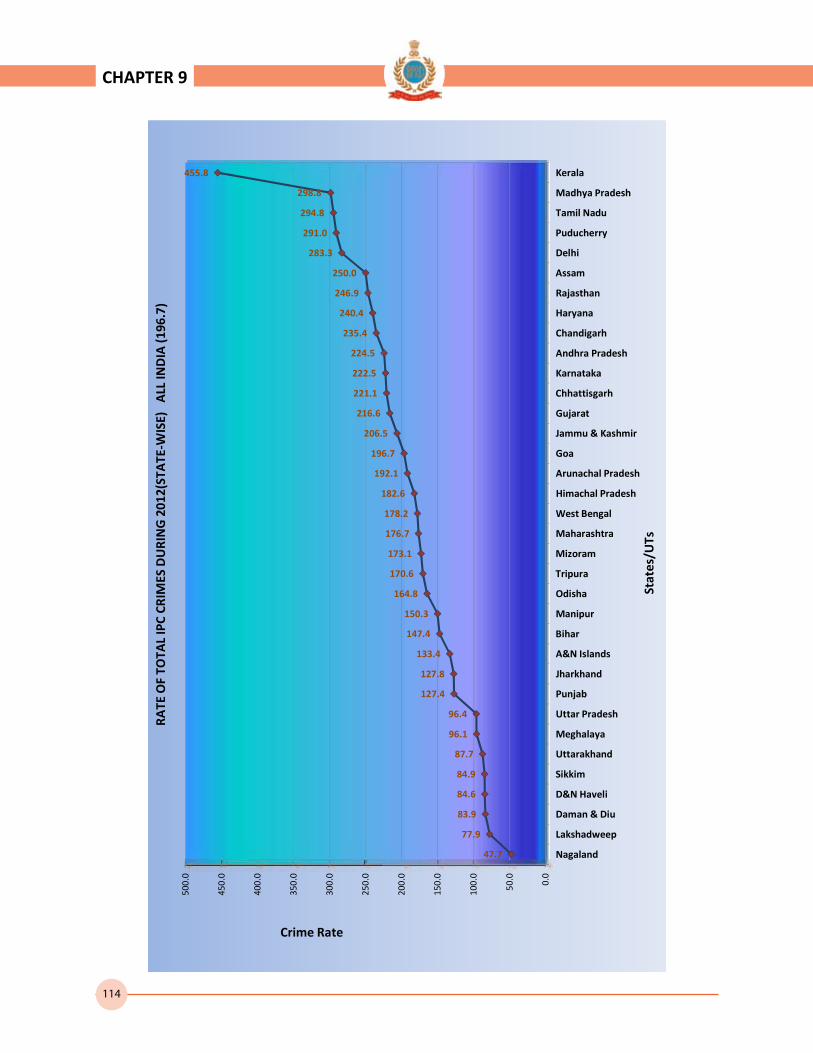
114
CHAPTER 9
1
19
196
206.
216.6
221.1
222.5
224.5
235.4
240.4
246.9
250.0
283.3
291.0
294.8
298.8
455.8
250.0
300.0
350.0
400.0
450.0
500.0
RATE
OF
TOTA
L IP
C CR
IMES
DU
RIN
G 2
012(
STA
TE-W
ISE)
A
LL IN
DIA
(196
.7)
Crime Rate
47.7
77.9
83.9
84.6
84.9
87.7
96.1
96.4
127.4
127.8
133.4
147.4
150.3
164.8
170.6
173.1
176.7
178.2
182.6
92.1
6.7
5
0.0
50.0
100.0
150.0
200.0
Nagaland
Lakshadweep
Daman & Diu
D&N Haveli
Sikkim
Uttarakhand
Meghalaya
Uttar Pradesh
Punjab
Jharkhand
A&N Islands
Bihar
Manipur
Odisha
Tripura
Mizoram
Maharashtra
West Bengal
Himachal Pradesh
Arunachal Pradesh
Goa
Jammu & Kashmir
Gujarat
Chhattisgarh
Karnataka
Andhra Pradesh
Chandigarh
Haryana
Rajasthan
Assam
Delhi
Puducherry
Tamil Nadu
Madhya Pradesh
Kerala
Stat
es/U
Ts
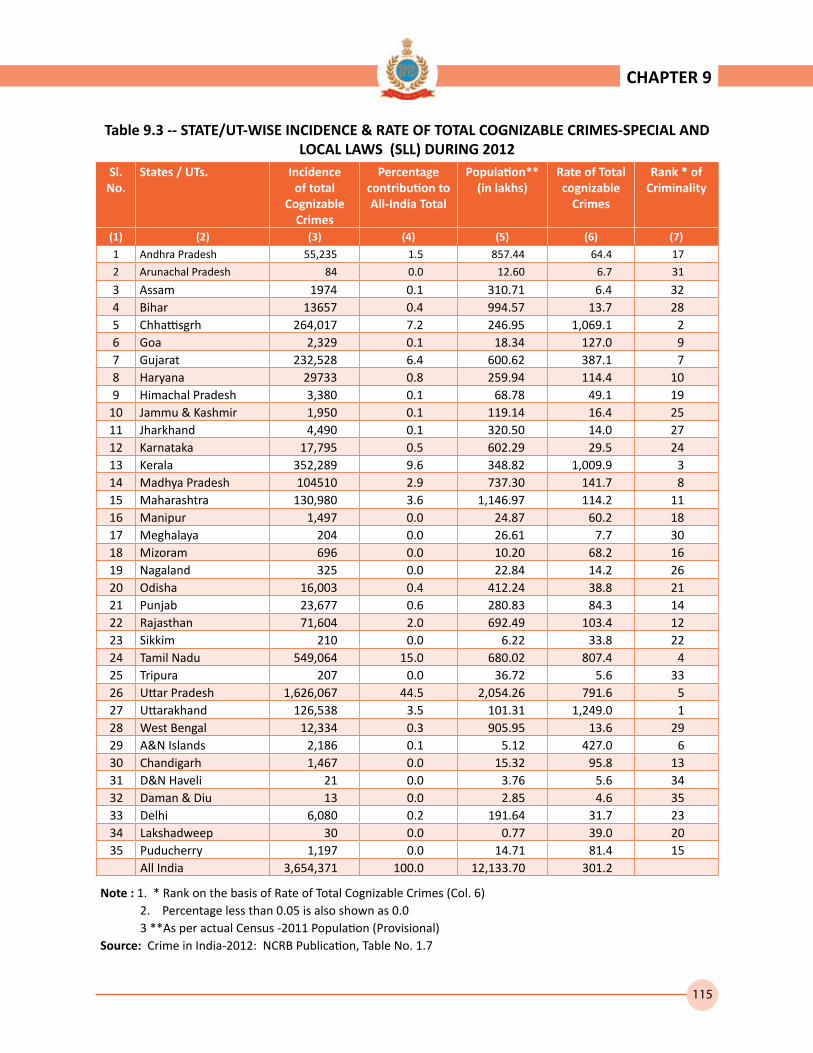
115
CHAPTER 9
Table 9.3 -- STATE/UT-WISE INCIDENCE & RATE OF TOTAL COGNIZABLE CRIMES-SPECIAL AND LOCAL LAWS (SLL) DURING 2012
Sl. No.
States / UTs. Incidence of total
Cognizable Crimes
Percentage contribution to All-India Total
Population** (in lakhs)
Rate of Total cognizable
Crimes
Rank * of Criminality
(1) (2) (3) (4) (5) (6) (7)
1 Andhra Pradesh 55,235 1.5 857.44 64.4 17
2 Arunachal Pradesh 84 0.0 12.60 6.7 31
3 Assam 1974 0.1 310.71 6.4 324 Bihar 13657 0.4 994.57 13.7 285 Chhattisgrh 264,017 7.2 246.95 1,069.1 26 Goa 2,329 0.1 18.34 127.0 97 Gujarat 232,528 6.4 600.62 387.1 78 Haryana 29733 0.8 259.94 114.4 109 Himachal Pradesh 3,380 0.1 68.78 49.1 19
10 Jammu & Kashmir 1,950 0.1 119.14 16.4 2511 Jharkhand 4,490 0.1 320.50 14.0 2712 Karnataka 17,795 0.5 602.29 29.5 2413 Kerala 352,289 9.6 348.82 1,009.9 314 Madhya Pradesh 104510 2.9 737.30 141.7 815 Maharashtra 130,980 3.6 1,146.97 114.2 1116 Manipur 1,497 0.0 24.87 60.2 1817 Meghalaya 204 0.0 26.61 7.7 3018 Mizoram 696 0.0 10.20 68.2 1619 Nagaland 325 0.0 22.84 14.2 2620 Odisha 16,003 0.4 412.24 38.8 2121 Punjab 23,677 0.6 280.83 84.3 1422 Rajasthan 71,604 2.0 692.49 103.4 1223 Sikkim 210 0.0 6.22 33.8 2224 Tamil Nadu 549,064 15.0 680.02 807.4 425 Tripura 207 0.0 36.72 5.6 3326 Uttar Pradesh 1,626,067 44.5 2,054.26 791.6 527 Uttarakhand 126,538 3.5 101.31 1,249.0 128 West Bengal 12,334 0.3 905.95 13.6 2929 A&N Islands 2,186 0.1 5.12 427.0 630 Chandigarh 1,467 0.0 15.32 95.8 1331 D&N Haveli 21 0.0 3.76 5.6 3432 Daman & Diu 13 0.0 2.85 4.6 3533 Delhi 6,080 0.2 191.64 31.7 2334 Lakshadweep 30 0.0 0.77 39.0 2035 Puducherry 1,197 0.0 14.71 81.4 15
All India 3,654,371 100.0 12,133.70 301.2
Note : 1. * Rank on the basis of Rate of Total Cognizable Crimes (Col. 6)2. Percentage less than 0.05 is also shown as 0.03 **As per actual Census -2011 Population (Provisional)
Source: Crime in India-2012: NCRB Publication, Table No. 1.7

116
CHAPTER 9
44.5
25.0
30.0
35.0
40.0
45.0
50.0
Percentage Con
0.0
0.0
0.0
0.0
0.0
0.0
0.0
0.0
0.0
0.0
0.0
0.0
0.1
0.1
0.1
0.1
0.1
0.1
0.2
0.3
0.4
0.4
0.5
0.6
0.8
1.5
2.0
2.9
3.5
3.6
6.4
7.2
9.6
15.0
0.0
5.0
10.0
15.0
20.0
25.0
Arunachal Pradesh
Manipur
Meghalaya
Mizoram
Nagaland
Sikkim
Tripura
Chandigarh
D&N Haveli
Daman & Diu
Lakshadweep
Puducherry
Assam
Goa
Himachal Pradesh
Jammu & Kashmir
Jharkhand
A&N Islands
Delhi
West Bengal
Bihar
Odisha
Karnataka
Punjab
Haryana
Andhra Pradesh
Rajasthan
Madhya Pradesh
Uttarakhand
Maharashtra
Gujarat
Chhattisgrh
Kerala
Tamil Nadu
Uttar Pradesh
tribution
Stat
es/U
Ts
PERC
ENTA
GE
CON
TRIB
UTI
ON
TO
TO
TAL
SLL
CRIM
ES D
URI
NG
201
2

117
CHAPTER 9
791.6
807.4
1,009.9
1,069.1
1,249.0
800.
0
1,00
0.0
1,20
0.0
1,40
0.0
RATE
OF
TOTA
LSL
L CR
IMES
DU
RIN
G 2
012
(STA
TE&
UT-
WIS
E) A
LL IN
DIA
(301
.2)
4.6
5.6
5.6
6.4
6.7
7.7
13.6
13.7
14.0
14.2
16.4
29.5
31.7
33.8
38.8
39.0
49.1
60.2
64.4
68.2
81.4
84.3
95.8
103.4
114.2
114.4
127.0
141.7
387.1
427.0
0.0
200.
0
400.
0
600.
0
Daman & Diu
D&N Haveli
Tripura
Assam
Arunachal Pradesh
Meghalaya
West Bengal
Bihar
Jharkhand
Nagaland
Jammu & Kashmir
Karnataka
Delhi
Sikkim
Odisha
Lakshadweep
Himachal Pradesh
Manipur
Andhra Pradesh
Mizoram
Puducherry
Punjab
Chandigarh
Rajasthan
Maharashtra
Haryana
Goa
Madhya Pradesh
Gujarat
A&N Islands
Uttar Pradesh
Tamil Nadu
Kerala
Chhattisgrh
Uttarakhand
Stat
es/U
Ts

118
TABLE 9.4 -- STATE/UT-WISE DISPOSAL OF CASES UNDER INDIAN PENAL CODE (IPC) BY COURTS DURING 2012
Sl. No.
States / UTs. Total No. of cases for trial
including pending
cases from
previous year
Cases with-
drawn by
Govern-ment
No. of Cases Pending Trial at the end of the year
Pen-dency % age
% age of Pendency
to all India Total
Conviction Rate {(6)/(8)}*100Com-
pounded or
Withdrawn
In Which Trials were completed
Convicted Acquitted or
Discharged
Total{ (6) +(7)}
(1) (2) (3) (4) (5) (6) (7) (8) (9) (10) (11) (12)
1 Andhra Pradesh 485,801 169 38,089 34,043 80,689 114,732 332,980 68.5 4.2 29.7
2 Arunachal Pradesh 17,781 0 149 213 313 526 17,106 96.2 0.2 40.5
3 Assam 127,314 0 639 2,154 18,090 20,244 106,431 83.6 1.3 10.6
4 Bihar 701,476 0 9,295 9,116 48,245 57,361 634,820 90.5 8.0 15.9
5 Chhattisgrh 232,585 30 9,290 17,437 20,464 37,901 185,394 79.7 2.4 46.0
6 Goa 9,634 0 39 312 1,108 1,420 8,175 84.9 0.1 22.0
7 Gujarat 981,700 4 2,231 23,811 43,184 66,995 912,474 92.9 11.6 35.5
8 Haryana 172,923 0 122 13,800 29,543 43,343 129,458 74.9 1.6 31.8
9 Himachal Pradesh 72,664 13 1,010 1,461 4,923 6,384 65,270 89.8 0.8 22.9
10 Jammu & Kashmir 102,319 87 3,454 5,890 10,025 15,915 82,950 81.1 1.1 37.0
11 Jharkhand 91,187 0 1,256 5,739 19,038 24,777 65,154 71.5 0.8 23.2
12 Karnataka 395,199 194 5,756 34,069 74,084 108,153 281,290 71.2 3.6 31.5
13 Kerala 565,282 112 3,764 60,381 31,924 92,305 469,213 83.0 5.9 65.4
14 Madhya Pradesh 758,003 7,755 57,514 58,645 64,303 122,948 577,541 76.2 7.3 47.7
15 Maharashtra 1,480,884 78 24,361 9,807 94,941 104,748 1,351,775 91.3 17.1 9.4
16 Manipur 2,844 0 7 49 21 70 2,767 97.3 0.0 70.0
17 Meghalaya 10,383 0 70 91 119 210 10,103 97.3 0.1 43.3
18 Mizoram 2,780 0 11 1,248 146 1,394 1,375 49.5 0.0 89.5
19 Nagaland 2,073 1 7 455 75 530 1,536 74.1 0.0 85.8
20 Odisha 402,191 0 0 3,922 31,822 35,744 366,447 91.1 4.6 11.0
21 Punjab 117,308 6 36 8,304 13,834 22,138 95,134 81.1 1.2 37.5
22 Rajasthan 545,233 35 16,660 46,382 29,303 75,685 452,888 83.1 5.7 61.3
23 Sikkim 1,515 0 13 111 176 287 1,215 80.2 0.0 38.7
24 Tamil Nadu 438,219 0 1,071 72,675 55,895 128,570 308,578 70.4 3.9 56.5
25 Tripura 20,413 559 150 923 5,283 6,206 14,057 68.9 0.2 14.9
26 Uttar Pradesh 526,848 26 9,213 43,531 39,216 82,747 434,888 82.5 5.5 52.6
27 Uttarakhand 32,308 5 880 5,260 1,635 6,895 24,533 75.9 0.3 76.3
28 West Bengal 773,903 0 2,418 4,160 35,630 39,790 731,695 94.5 9.3 10.5
29 A&N Islands 7,027 0 0 206 174 380 6,647 94.6 0.1 54.2
30 Chandigarh 8,451 0 0 819 802 1,621 6,830 80.8 0.1 50.5
31 D&N Haveli 2,628 0 0 23 208 231 2,397 91.2 0.0 10.0
32 Daman & Diu 611 0 22 13 81 94 495 81.0 0.0 13.8
33 Delhi 228,416 0 0 15,565 14,135 29,700 198,716 87.0 2.5 52.4
34 Lakshadweep 182 0 3 24 41 65 114 62.6 0.0 36.9
35 Puducherry 10,000 8 9 1,621 408 2,029 7,962 79.6 0.1 79.9
All India 9,328,085 9,082 187,539 482,260 769,878 1,252,138 7,888,408 84.6 100.0 38.5
Source: Crime in India - 2011: NCRB Publication, Table No. 4.10
CHAPTER 9
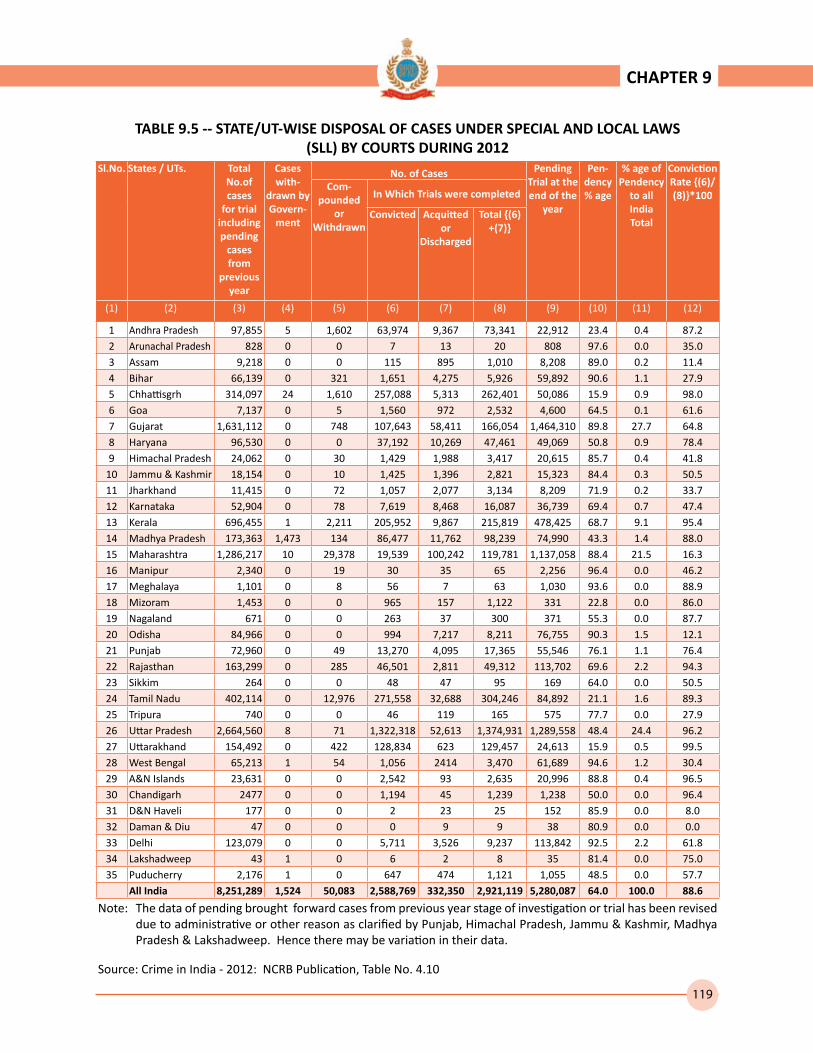
119
TABLE 9.5 -- STATE/UT-WISE DISPOSAL OF CASES UNDER SPECIAL AND LOCAL LAWS (SLL) BY COURTS DURING 2012
Sl.No. States / UTs. Total No.of cases
for trial including pending
cases from
previous year
Cases with-
drawn by Govern-
ment
No. of Cases Pending Trial at the end of the
year
Pen-dency % age
% age of Pendency
to all India Total
Conviction Rate {(6)/(8)}*100
Com-pounded
or Withdrawn
In Which Trials were completed
Convicted Acquitted or
Discharged
Total {(6) +(7)}
(1) (2) (3) (4) (5) (6) (7) (8) (9) (10) (11) (12)
1 Andhra Pradesh 97,855 5 1,602 63,974 9,367 73,341 22,912 23.4 0.4 87.22 Arunachal Pradesh 828 0 0 7 13 20 808 97.6 0.0 35.03 Assam 9,218 0 0 115 895 1,010 8,208 89.0 0.2 11.44 Bihar 66,139 0 321 1,651 4,275 5,926 59,892 90.6 1.1 27.95 Chhattisgrh 314,097 24 1,610 257,088 5,313 262,401 50,086 15.9 0.9 98.06 Goa 7,137 0 5 1,560 972 2,532 4,600 64.5 0.1 61.67 Gujarat 1,631,112 0 748 107,643 58,411 166,054 1,464,310 89.8 27.7 64.88 Haryana 96,530 0 0 37,192 10,269 47,461 49,069 50.8 0.9 78.49 Himachal Pradesh 24,062 0 30 1,429 1,988 3,417 20,615 85.7 0.4 41.8
10 Jammu & Kashmir 18,154 0 10 1,425 1,396 2,821 15,323 84.4 0.3 50.511 Jharkhand 11,415 0 72 1,057 2,077 3,134 8,209 71.9 0.2 33.712 Karnataka 52,904 0 78 7,619 8,468 16,087 36,739 69.4 0.7 47.413 Kerala 696,455 1 2,211 205,952 9,867 215,819 478,425 68.7 9.1 95.414 Madhya Pradesh 173,363 1,473 134 86,477 11,762 98,239 74,990 43.3 1.4 88.015 Maharashtra 1,286,217 10 29,378 19,539 100,242 119,781 1,137,058 88.4 21.5 16.316 Manipur 2,340 0 19 30 35 65 2,256 96.4 0.0 46.217 Meghalaya 1,101 0 8 56 7 63 1,030 93.6 0.0 88.918 Mizoram 1,453 0 0 965 157 1,122 331 22.8 0.0 86.019 Nagaland 671 0 0 263 37 300 371 55.3 0.0 87.720 Odisha 84,966 0 0 994 7,217 8,211 76,755 90.3 1.5 12.121 Punjab 72,960 0 49 13,270 4,095 17,365 55,546 76.1 1.1 76.422 Rajasthan 163,299 0 285 46,501 2,811 49,312 113,702 69.6 2.2 94.323 Sikkim 264 0 0 48 47 95 169 64.0 0.0 50.524 Tamil Nadu 402,114 0 12,976 271,558 32,688 304,246 84,892 21.1 1.6 89.325 Tripura 740 0 0 46 119 165 575 77.7 0.0 27.926 Uttar Pradesh 2,664,560 8 71 1,322,318 52,613 1,374,931 1,289,558 48.4 24.4 96.227 Uttarakhand 154,492 0 422 128,834 623 129,457 24,613 15.9 0.5 99.528 West Bengal 65,213 1 54 1,056 2414 3,470 61,689 94.6 1.2 30.429 A&N Islands 23,631 0 0 2,542 93 2,635 20,996 88.8 0.4 96.530 Chandigarh 2477 0 0 1,194 45 1,239 1,238 50.0 0.0 96.431 D&N Haveli 177 0 0 2 23 25 152 85.9 0.0 8.032 Daman & Diu 47 0 0 0 9 9 38 80.9 0.0 0.033 Delhi 123,079 0 0 5,711 3,526 9,237 113,842 92.5 2.2 61.834 Lakshadweep 43 1 0 6 2 8 35 81.4 0.0 75.035 Puducherry 2,176 1 0 647 474 1,121 1,055 48.5 0.0 57.7
All India 8,251,289 1,524 50,083 2,588,769 332,350 2,921,119 5,280,087 64.0 100.0 88.6
Note: The data of pending brought forward cases from previous year stage of investigation or trial has been revised due to administrative or other reason as clarified by Punjab, Himachal Pradesh, Jammu & Kashmir, Madhya Pradesh & Lakshadweep. Hence there may be variation in their data.
Source: Crime in India - 2012: NCRB Publication, Table No. 4.10
CHAPTER 9
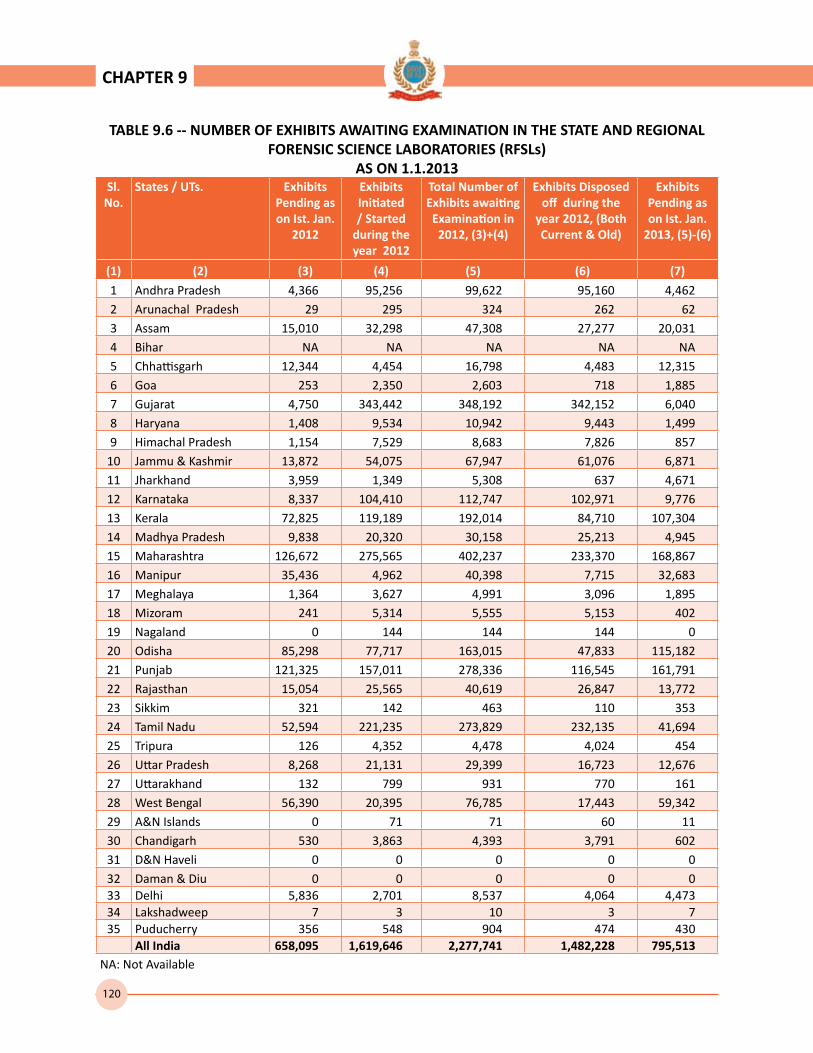
120
TABLE 9.6 -- NUMBER OF EXHIBITS AWAITING EXAMINATION IN THE STATE AND REGIONAL FORENSIC SCIENCE LABORATORIES (RFSLs)
AS ON 1.1.2013Sl.
No.States / UTs. Exhibits
Pending as on Ist. Jan.
2012
Exhibits Initiated / Started
during the year 2012
Total Number of Exhibits awaiting Examination in 2012, (3)+(4)
Exhibits Disposed off during the
year 2012, (Both Current & Old)
Exhibits Pending as on Ist. Jan.
2013, (5)-(6)
(1) (2) (3) (4) (5) (6) (7)
1 Andhra Pradesh 4,366 95,256 99,622 95,160 4,4622 Arunachal Pradesh 29 295 324 262 623 Assam 15,010 32,298 47,308 27,277 20,0314 Bihar NA NA NA NA NA5 Chhattisgarh 12,344 4,454 16,798 4,483 12,3156 Goa 253 2,350 2,603 718 1,8857 Gujarat 4,750 343,442 348,192 342,152 6,0408 Haryana 1,408 9,534 10,942 9,443 1,4999 Himachal Pradesh 1,154 7,529 8,683 7,826 857
10 Jammu & Kashmir 13,872 54,075 67,947 61,076 6,87111 Jharkhand 3,959 1,349 5,308 637 4,67112 Karnataka 8,337 104,410 112,747 102,971 9,77613 Kerala 72,825 119,189 192,014 84,710 107,30414 Madhya Pradesh 9,838 20,320 30,158 25,213 4,94515 Maharashtra 126,672 275,565 402,237 233,370 168,86716 Manipur 35,436 4,962 40,398 7,715 32,68317 Meghalaya 1,364 3,627 4,991 3,096 1,89518 Mizoram 241 5,314 5,555 5,153 40219 Nagaland 0 144 144 144 020 Odisha 85,298 77,717 163,015 47,833 115,18221 Punjab 121,325 157,011 278,336 116,545 161,79122 Rajasthan 15,054 25,565 40,619 26,847 13,77223 Sikkim 321 142 463 110 35324 Tamil Nadu 52,594 221,235 273,829 232,135 41,69425 Tripura 126 4,352 4,478 4,024 45426 Uttar Pradesh 8,268 21,131 29,399 16,723 12,67627 Uttarakhand 132 799 931 770 16128 West Bengal 56,390 20,395 76,785 17,443 59,34229 A&N Islands 0 71 71 60 1130 Chandigarh 530 3,863 4,393 3,791 60231 D&N Haveli 0 0 0 0 032 Daman & Diu 0 0 0 0 033 Delhi 5,836 2,701 8,537 4,064 4,47334 Lakshadweep 7 3 10 3 735 Puducherry 356 548 904 474 430
All India 658,095 1,619,646 2,277,741 1,482,228 795,513NA: Not Available
CHAPTER 9

121
CHAPTER 10
This chapter gives the information on State/UT wise data on number of agitations; agitations during which police had to open fire; agitations during which police did not open fire but applied other methods of use of force; civilian casualties due to police action and police casualties due to the unruly conduct of riotous mobs.
Number and type of agitations
The data on number and type of agitations has been received from all States/UTs. According to Data received, there occurred a total of 78,444 agitations in the country during 2012. The different types of agitations that sum up to the above total are communal, student, labour, Government employees, political etc.
At state level, the maximum number of 21,232 agitations were reported from Tamil Nadu, followed by 9,397 in Madhya Pradesh and 6038 in Uttrakhand during the year 2012. Out of the total of 98 agitations in which police opened fire, at national level, 65 were accounted for by Madhya Pradesh, followed by 16 in West Bengal and 4 in Manipur State. Similarly in case of agitations where police did not open fire but used other methods of force, the state of West Bengal contributed maximum number of 84 such agitations, out of the total of 298 in this category all over the country. Thus in all, in 298 agitations out of total of 78,444 Police had to use force other than firearms like teargas, lathi/baton
charge. Details are given in Table – 10.1. (Page No. 123)
The total number of agitations under different heads for the year 2012 and 2011 are shown in Tables 10.2 and Table 10.3. (Page No. 124 & 125) There has been 6.96% increase in the number of agitations from the year 2011 (73341) to 2012 (78444).
As the data has not been received from all States/UTs so analysis of the agitations under different heads. However, the maximum number of agitations have been accounted for by Political agitations 37.13% followed by the Other Agitations at 25.00%. Government employees related agitations were about 15.63% while the Student agitations were about 9.41% of the total number of agitations during 2012.
All kind of agitations need elaborate law and order arrangements, involving deployment of huge number of police manpower. The present direction of Supreme Court to separate investigation wing from law and order wing, when implemented in full, will go a long way not only in promoting professional skills and specialization to deal with both types of duties but shall also in the long run further the cause of efficient and effective crime investigation and public order management without affecting each other adversely.
Civil causalities due to police action & police casualties due to unruly conduct of riotous mob
During the year 2012 in a total of 78,444 agitations, 13 civilians and 6 policemen were killed whereas 354 civilians and 863
AGITATIONS
State Wise Data on: Details of Agitations
Agitations by type in 2011 & 2012

122
policemen were injured. Details are given in Table – 10.1. (Page No. 123)
Agitations are collective expression of dissatisfaction with the state authorities and others on a variety of issues like education, essential services, transport facilities, wages etc.
In a democratic system expression of protest by the different groups/ sub groups of public is a common feature. Police personnel of the both the States and CAPFs will have to consciously strive for upgradation of their professional and
behavioural skills in order to manage crowds agitated over any perceived, real or unreal, cause of injustice / dissatisfaction against the authorities or some other sections of the society without use of force as far as possible.
The State/UT wise detail of agitations, police firing, civil and police casualties are given in Table 10.4. (Page No. 126-133) Required information has been received from States/UTs indicated accordingly. Therefore the factual position in respect of agitations in the country depicted in this chapter has to be approached accordingly.
CHAPTER 10
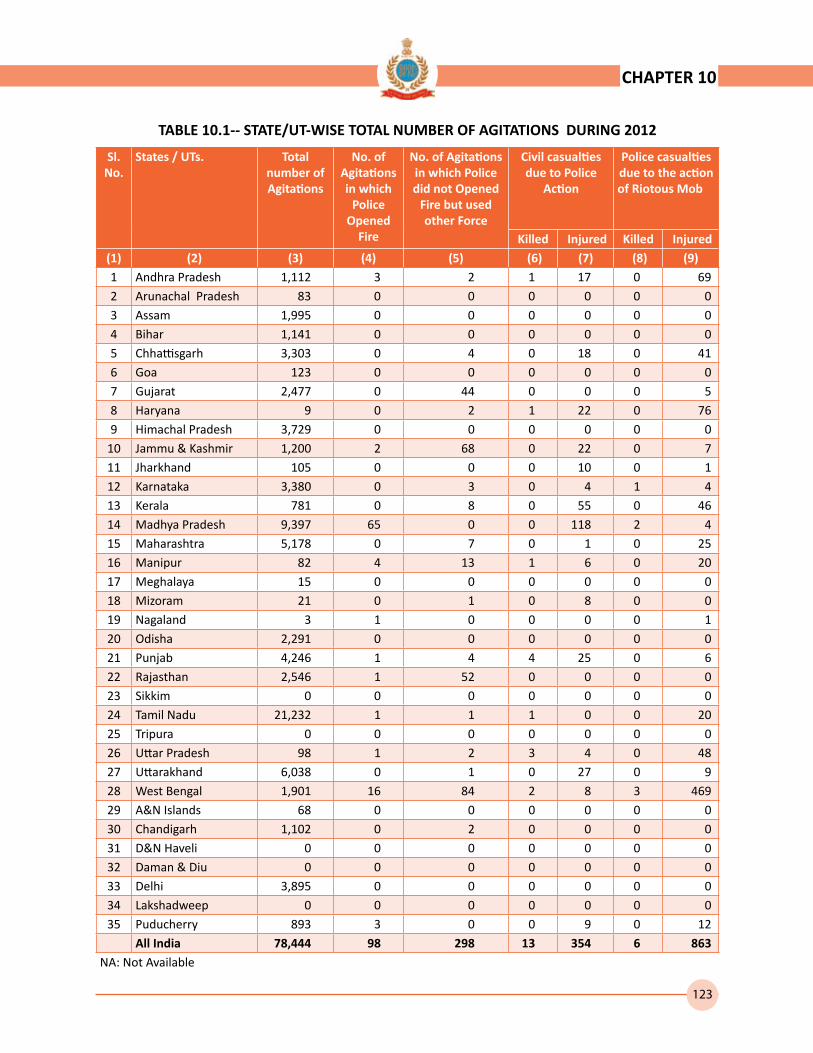
123
TABLE 10.1-- STATE/UT-WISE TOTAL NUMBER OF AGITATIONS DURING 2012
Sl. No.
States / UTs. Total number of Agitations
No. of Agitations in which
Police Opened
Fire
No. of Agitations in which Police did not Opened
Fire but used other Force
Civil casualties due to Police
Action
Police casualties due to the action of Riotous Mob
Killed Injured Killed Injured(1) (2) (3) (4) (5) (6) (7) (8) (9)1 Andhra Pradesh 1,112 3 2 1 17 0 692 Arunachal Pradesh 83 0 0 0 0 0 03 Assam 1,995 0 0 0 0 0 04 Bihar 1,141 0 0 0 0 0 05 Chhattisgarh 3,303 0 4 0 18 0 416 Goa 123 0 0 0 0 0 07 Gujarat 2,477 0 44 0 0 0 58 Haryana 9 0 2 1 22 0 769 Himachal Pradesh 3,729 0 0 0 0 0 0
10 Jammu & Kashmir 1,200 2 68 0 22 0 711 Jharkhand 105 0 0 0 10 0 112 Karnataka 3,380 0 3 0 4 1 413 Kerala 781 0 8 0 55 0 4614 Madhya Pradesh 9,397 65 0 0 118 2 415 Maharashtra 5,178 0 7 0 1 0 2516 Manipur 82 4 13 1 6 0 2017 Meghalaya 15 0 0 0 0 0 018 Mizoram 21 0 1 0 8 0 019 Nagaland 3 1 0 0 0 0 120 Odisha 2,291 0 0 0 0 0 021 Punjab 4,246 1 4 4 25 0 622 Rajasthan 2,546 1 52 0 0 0 023 Sikkim 0 0 0 0 0 0 024 Tamil Nadu 21,232 1 1 1 0 0 2025 Tripura 0 0 0 0 0 0 026 Uttar Pradesh 98 1 2 3 4 0 4827 Uttarakhand 6,038 0 1 0 27 0 928 West Bengal 1,901 16 84 2 8 3 46929 A&N Islands 68 0 0 0 0 0 030 Chandigarh 1,102 0 2 0 0 0 031 D&N Haveli 0 0 0 0 0 0 032 Daman & Diu 0 0 0 0 0 0 033 Delhi 3,895 0 0 0 0 0 034 Lakshadweep 0 0 0 0 0 0 035 Puducherry 893 3 0 0 9 0 12
All India 78,444 98 298 13 354 6 863NA: Not Available
CHAPTER 10
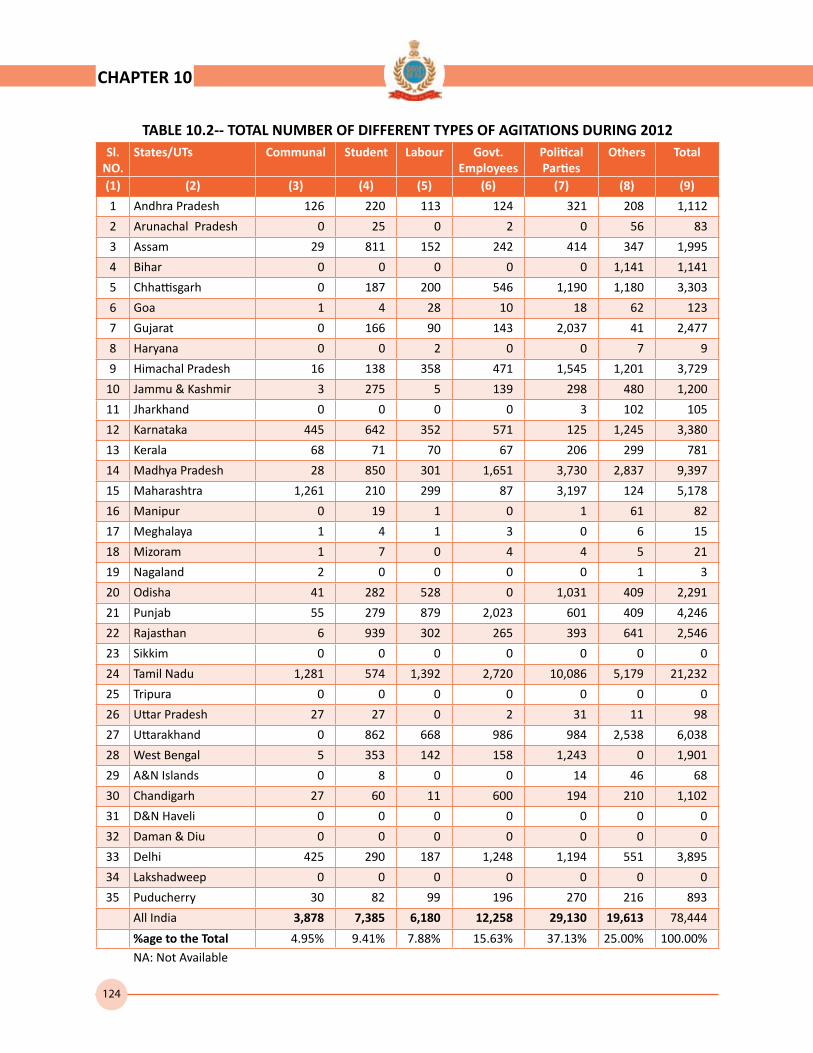
124
CHAPTER 10
TABLE 10.2-- TOTAL NUMBER OF DIFFERENT TYPES OF AGITATIONS DURING 2012Sl.
NO.States/UTs Communal Student Labour Govt.
EmployeesPolitical Parties
Others Total
(1) (2) (3) (4) (5) (6) (7) (8) (9)
1 Andhra Pradesh 126 220 113 124 321 208 1,112
2 Arunachal Pradesh 0 25 0 2 0 56 83
3 Assam 29 811 152 242 414 347 1,995
4 Bihar 0 0 0 0 0 1,141 1,141
5 Chhattisgarh 0 187 200 546 1,190 1,180 3,303
6 Goa 1 4 28 10 18 62 123
7 Gujarat 0 166 90 143 2,037 41 2,477
8 Haryana 0 0 2 0 0 7 9
9 Himachal Pradesh 16 138 358 471 1,545 1,201 3,729
10 Jammu & Kashmir 3 275 5 139 298 480 1,200
11 Jharkhand 0 0 0 0 3 102 105
12 Karnataka 445 642 352 571 125 1,245 3,380
13 Kerala 68 71 70 67 206 299 781
14 Madhya Pradesh 28 850 301 1,651 3,730 2,837 9,397
15 Maharashtra 1,261 210 299 87 3,197 124 5,178
16 Manipur 0 19 1 0 1 61 82
17 Meghalaya 1 4 1 3 0 6 15
18 Mizoram 1 7 0 4 4 5 21
19 Nagaland 2 0 0 0 0 1 3
20 Odisha 41 282 528 0 1,031 409 2,291
21 Punjab 55 279 879 2,023 601 409 4,246
22 Rajasthan 6 939 302 265 393 641 2,546
23 Sikkim 0 0 0 0 0 0 0
24 Tamil Nadu 1,281 574 1,392 2,720 10,086 5,179 21,232
25 Tripura 0 0 0 0 0 0 0
26 Uttar Pradesh 27 27 0 2 31 11 98
27 Uttarakhand 0 862 668 986 984 2,538 6,038
28 West Bengal 5 353 142 158 1,243 0 1,901
29 A&N Islands 0 8 0 0 14 46 68
30 Chandigarh 27 60 11 600 194 210 1,102
31 D&N Haveli 0 0 0 0 0 0 0
32 Daman & Diu 0 0 0 0 0 0 0
33 Delhi 425 290 187 1,248 1,194 551 3,895
34 Lakshadweep 0 0 0 0 0 0 0
35 Puducherry 30 82 99 196 270 216 893
All India 3,878 7,385 6,180 12,258 29,130 19,613 78,444
%age to the Total 4.95% 9.41% 7.88% 15.63% 37.13% 25.00% 100.00%NA: Not Available
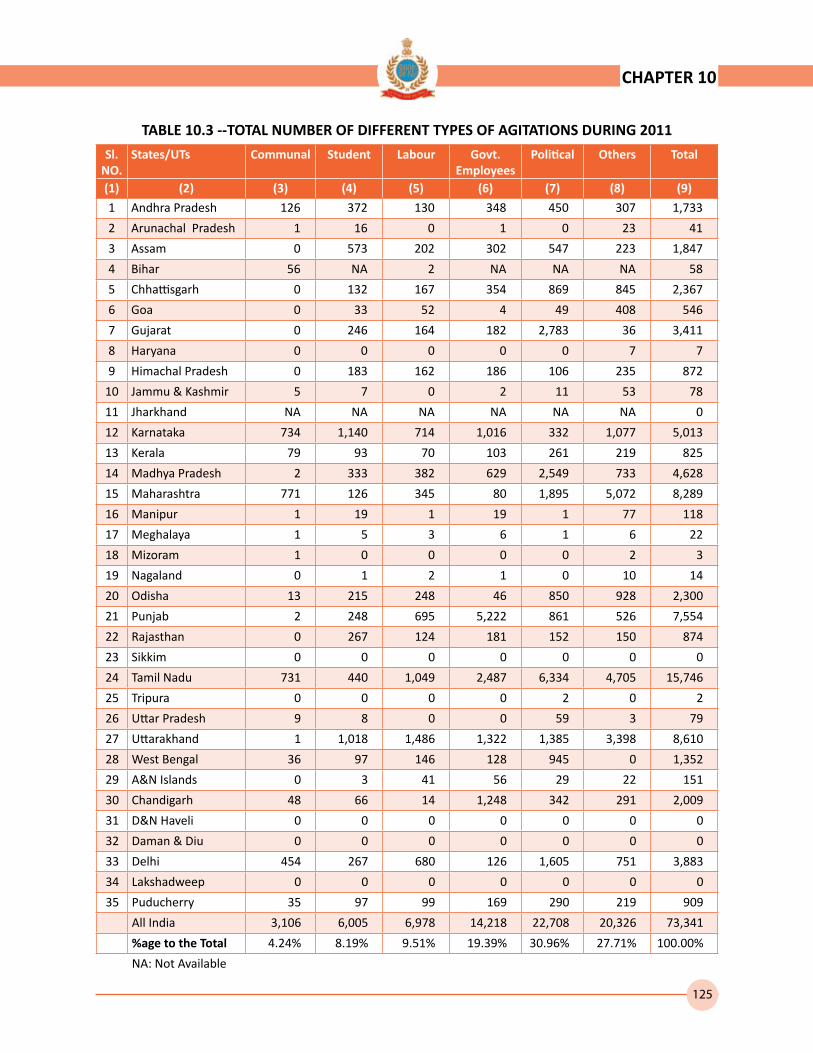
125
CHAPTER 10
TABLE 10.3 --TOTAL NUMBER OF DIFFERENT TYPES OF AGITATIONS DURING 2011
Sl. NO.
States/UTs Communal Student Labour Govt. Employees
Political Others Total
(1) (2) (3) (4) (5) (6) (7) (8) (9)
1 Andhra Pradesh 126 372 130 348 450 307 1,733
2 Arunachal Pradesh 1 16 0 1 0 23 41
3 Assam 0 573 202 302 547 223 1,847
4 Bihar 56 NA 2 NA NA NA 58
5 Chhattisgarh 0 132 167 354 869 845 2,367
6 Goa 0 33 52 4 49 408 546
7 Gujarat 0 246 164 182 2,783 36 3,411
8 Haryana 0 0 0 0 0 7 7
9 Himachal Pradesh 0 183 162 186 106 235 872
10 Jammu & Kashmir 5 7 0 2 11 53 78
11 Jharkhand NA NA NA NA NA NA 0
12 Karnataka 734 1,140 714 1,016 332 1,077 5,013
13 Kerala 79 93 70 103 261 219 825
14 Madhya Pradesh 2 333 382 629 2,549 733 4,628
15 Maharashtra 771 126 345 80 1,895 5,072 8,289
16 Manipur 1 19 1 19 1 77 118
17 Meghalaya 1 5 3 6 1 6 22
18 Mizoram 1 0 0 0 0 2 3
19 Nagaland 0 1 2 1 0 10 14
20 Odisha 13 215 248 46 850 928 2,300
21 Punjab 2 248 695 5,222 861 526 7,554
22 Rajasthan 0 267 124 181 152 150 874
23 Sikkim 0 0 0 0 0 0 0
24 Tamil Nadu 731 440 1,049 2,487 6,334 4,705 15,746
25 Tripura 0 0 0 0 2 0 2
26 Uttar Pradesh 9 8 0 0 59 3 79
27 Uttarakhand 1 1,018 1,486 1,322 1,385 3,398 8,610
28 West Bengal 36 97 146 128 945 0 1,352
29 A&N Islands 0 3 41 56 29 22 151
30 Chandigarh 48 66 14 1,248 342 291 2,009
31 D&N Haveli 0 0 0 0 0 0 0
32 Daman & Diu 0 0 0 0 0 0 0
33 Delhi 454 267 680 126 1,605 751 3,883
34 Lakshadweep 0 0 0 0 0 0 0
35 Puducherry 35 97 99 169 290 219 909
All India 3,106 6,005 6,978 14,218 22,708 20,326 73,341
%age to the Total 4.24% 8.19% 9.51% 19.39% 30.96% 27.71% 100.00%
NA: Not Available
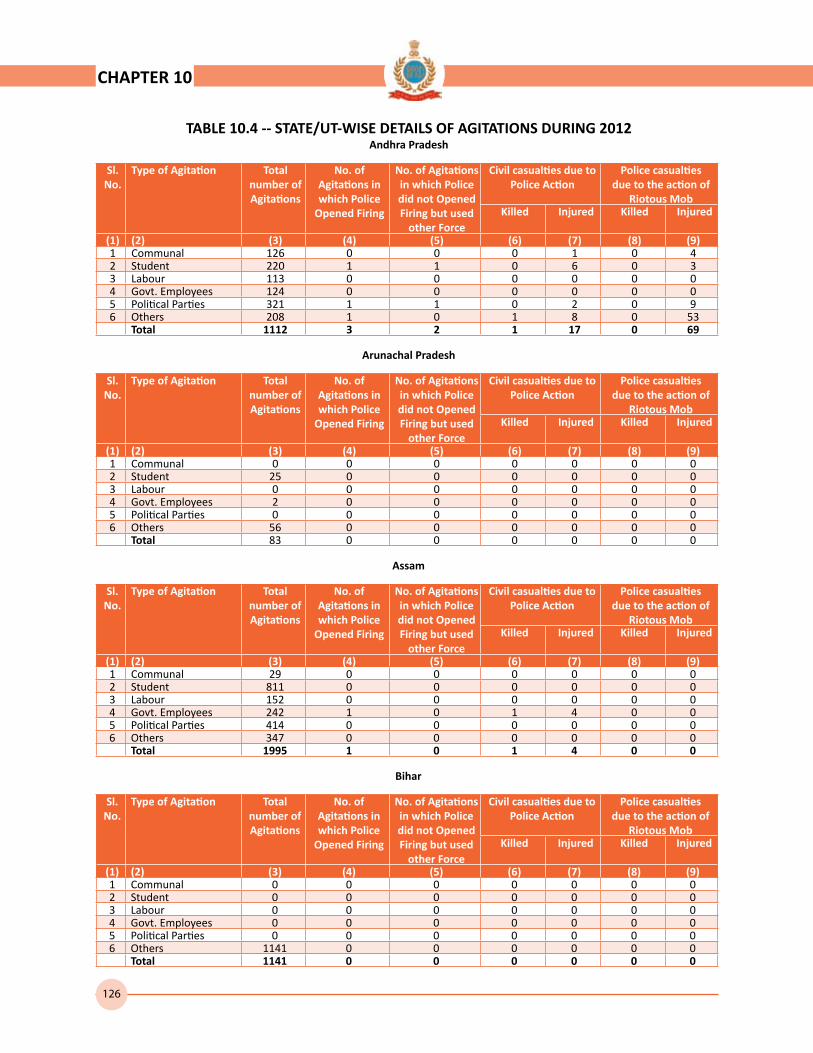
126
CHAPTER 10
TABLE 10.4 -- STATE/UT-WISE DETAILS OF AGITATIONS DURING 2012Andhra Pradesh
Sl. No.
Type of Agitation Total number of Agitations
No. of Agitations in which Police
Opened Firing
No. of Agitations in which Police did not Opened Firing but used
other Force
Civil casualties due to Police Action
Police casualties due to the action of
Riotous MobKilled Injured Killed Injured
(1) (2) (3) (4) (5) (6) (7) (8) (9)1 Communal 126 0 0 0 1 0 42 Student 220 1 1 0 6 0 33 Labour 113 0 0 0 0 0 04 Govt. Employees 124 0 0 0 0 0 05 Political Parties 321 1 1 0 2 0 96 Others 208 1 0 1 8 0 53
Total 1112 3 2 1 17 0 69
Arunachal Pradesh
Sl. No.
Type of Agitation Total number of Agitations
No. of Agitations in which Police
Opened Firing
No. of Agitations in which Police did not Opened Firing but used
other Force
Civil casualties due to Police Action
Police casualties due to the action of
Riotous MobKilled Injured Killed Injured
(1) (2) (3) (4) (5) (6) (7) (8) (9)1 Communal 0 0 0 0 0 0 02 Student 25 0 0 0 0 0 03 Labour 0 0 0 0 0 0 04 Govt. Employees 2 0 0 0 0 0 05 Political Parties 0 0 0 0 0 0 06 Others 56 0 0 0 0 0 0
Total 83 0 0 0 0 0 0
Assam
Sl. No.
Type of Agitation Total number of Agitations
No. of Agitations in which Police
Opened Firing
No. of Agitations in which Police did not Opened Firing but used
other Force
Civil casualties due to Police Action
Police casualties due to the action of
Riotous MobKilled Injured Killed Injured
(1) (2) (3) (4) (5) (6) (7) (8) (9)1 Communal 29 0 0 0 0 0 02 Student 811 0 0 0 0 0 03 Labour 152 0 0 0 0 0 04 Govt. Employees 242 1 0 1 4 0 05 Political Parties 414 0 0 0 0 0 06 Others 347 0 0 0 0 0 0
Total 1995 1 0 1 4 0 0
Bihar
Sl. No.
Type of Agitation Total number of Agitations
No. of Agitations in which Police
Opened Firing
No. of Agitations in which Police did not Opened Firing but used
other Force
Civil casualties due to Police Action
Police casualties due to the action of
Riotous MobKilled Injured Killed Injured
(1) (2) (3) (4) (5) (6) (7) (8) (9)1 Communal 0 0 0 0 0 0 02 Student 0 0 0 0 0 0 03 Labour 0 0 0 0 0 0 04 Govt. Employees 0 0 0 0 0 0 05 Political Parties 0 0 0 0 0 0 06 Others 1141 0 0 0 0 0 0
Total 1141 0 0 0 0 0 0
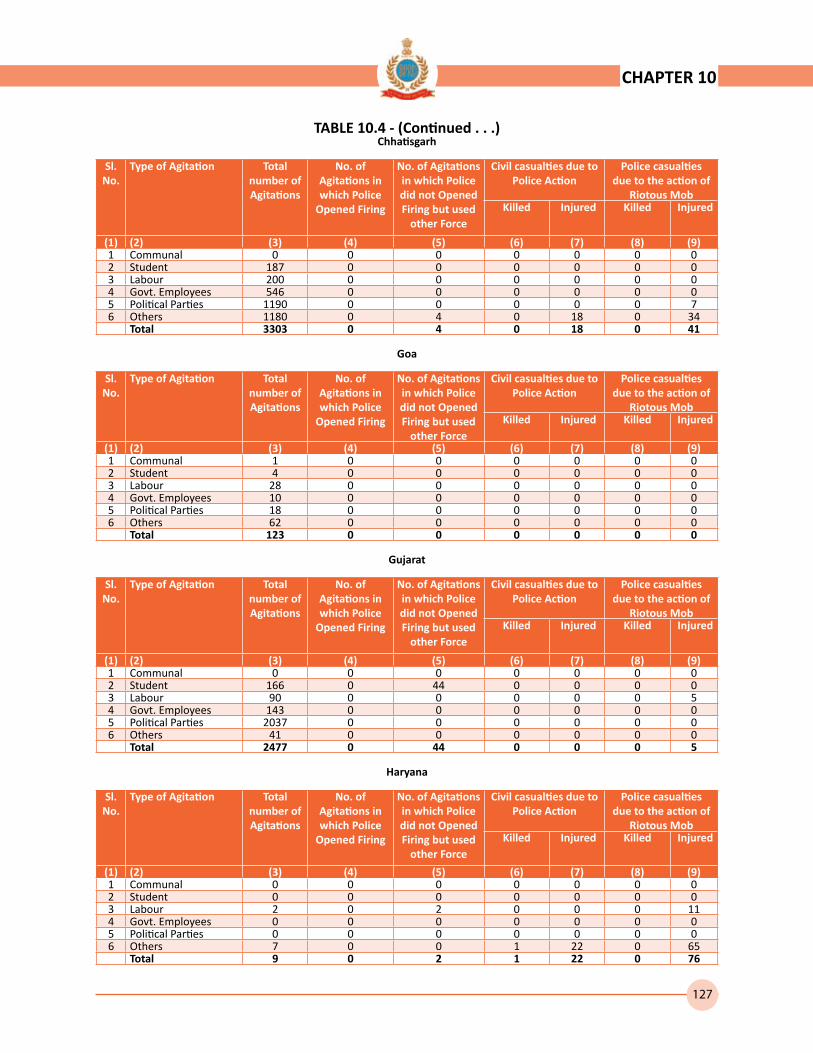
127
CHAPTER 10
TABLE 10.4 - (Continued . . .)Chhatisgarh
Sl. No.
Type of Agitation Total number of Agitations
No. of Agitations in which Police
Opened Firing
No. of Agitations in which Police did not Opened Firing but used
other Force
Civil casualties due to Police Action
Police casualties due to the action of
Riotous MobKilled Injured Killed Injured
(1) (2) (3) (4) (5) (6) (7) (8) (9)1 Communal 0 0 0 0 0 0 02 Student 187 0 0 0 0 0 03 Labour 200 0 0 0 0 0 04 Govt. Employees 546 0 0 0 0 0 05 Political Parties 1190 0 0 0 0 0 76 Others 1180 0 4 0 18 0 34
Total 3303 0 4 0 18 0 41
Goa
Sl. No.
Type of Agitation Total number of Agitations
No. of Agitations in which Police
Opened Firing
No. of Agitations in which Police did not Opened Firing but used
other Force
Civil casualties due to Police Action
Police casualties due to the action of
Riotous MobKilled Injured Killed Injured
(1) (2) (3) (4) (5) (6) (7) (8) (9)1 Communal 1 0 0 0 0 0 02 Student 4 0 0 0 0 0 03 Labour 28 0 0 0 0 0 04 Govt. Employees 10 0 0 0 0 0 05 Political Parties 18 0 0 0 0 0 06 Others 62 0 0 0 0 0 0
Total 123 0 0 0 0 0 0
Gujarat
Sl. No.
Type of Agitation Total number of Agitations
No. of Agitations in which Police
Opened Firing
No. of Agitations in which Police did not Opened Firing but used
other Force
Civil casualties due to Police Action
Police casualties due to the action of
Riotous MobKilled Injured Killed Injured
(1) (2) (3) (4) (5) (6) (7) (8) (9)1 Communal 0 0 0 0 0 0 02 Student 166 0 44 0 0 0 03 Labour 90 0 0 0 0 0 54 Govt. Employees 143 0 0 0 0 0 05 Political Parties 2037 0 0 0 0 0 06 Others 41 0 0 0 0 0 0
Total 2477 0 44 0 0 0 5
Haryana
Sl. No.
Type of Agitation Total number of Agitations
No. of Agitations in which Police
Opened Firing
No. of Agitations in which Police did not Opened Firing but used
other Force
Civil casualties due to Police Action
Police casualties due to the action of
Riotous MobKilled Injured Killed Injured
(1) (2) (3) (4) (5) (6) (7) (8) (9)1 Communal 0 0 0 0 0 0 02 Student 0 0 0 0 0 0 03 Labour 2 0 2 0 0 0 114 Govt. Employees 0 0 0 0 0 0 05 Political Parties 0 0 0 0 0 0 06 Others 7 0 0 1 22 0 65
Total 9 0 2 1 22 0 76

128
TABLE 10.4 - (Continued . . .)Himachal Pradesh
Sl. No.
Type of Agitation Total number of Agitations
No. of Agitations in which Police
Opened Firing
No. of Agitations in which Police did not Opened Firing but used
other Force
Civil casualties due to Police Action
Police casualties due to the action of
Riotous Mob
Killed Injured Killed Injured
(1) (2) (3) (4) (5) (6) (7) (8) (9)1 Communal 16 0 0 0 0 0 02 Student 138 0 0 0 0 0 03 Labour 358 0 0 0 0 0 04 Govt. Employees 471 0 0 0 0 0 05 Political Parties 1545 0 0 0 0 0 06 Others 1201 0 0 0 0 0 0
Total 3729 0 0 0 0 0 0
Jammu and Kashmir
Sl. No.
Type of Agitation Total number of Agitations
No. of Agitations in which Police
Opened Firing
No. of Agitations in which Police did not Opened Firing but used
other Force
Civil casualties due to Police Action
Police casualties due to the action of
Riotous Mob
Killed Injured Killed Injured
(1) (2) (3) (4) (5) (6) (7) (8) (9)1 Communal 3 1 2 0 5 0 32 Student 275 0 0 0 0 0 03 Labour 5 0 0 0 0 0 04 Govt. Employees 139 0 0 0 0 0 05 Political Parties 298 0 0 0 0 0 06 Others 480 1 66 0 17 0 4
Total 1200 2 68 0 22 0 7
Jharkhand
Sl. No.
Type of Agitation Total number of Agitations
No. of Agitations in which Police
Opened Firing
No. of Agitations in which Police did not Opened Firing but used
other Force
Civil casualties due to Police Action
Police casualties due to the action of
Riotous Mob
Killed Injured Killed Injured
(1) (2) (3) (4) (5) (6) (7) (8) (9)1 Communal 0 0 0 0 0 0 02 Student 0 0 0 0 0 0 03 Labour 0 0 0 0 0 0 04 Govt. Employees 0 0 0 0 0 0 05 Political Parties 3 0 0 0 0 0 06 Others 102 0 0 0 10 0 1
Total 105 0 0 0 10 0 1
Karnataka
Sl. No.
Type of Agitation Total number of Agitations
No. of Agitations in which Police
Opened Firing
No. of Agitations in which Police did not Opened Firing but used
other Force
Civil casualties due to Police Action
Police casualties due to the action of
Riotous Mob
Killed Injured Killed Injured
(1) (2) (3) (4) (5) (6) (7) (8) (9)1 Communal 445 0 0 0 0 1 42 Student 642 0 0 0 0 0 03 Labour 352 0 0 0 0 0 04 Govt. Employees 571 0 0 0 0 0 05 Political Parties 125 0 0 0 0 0 06 Others 1245 0 3 0 4 0 0
Total 3380 0 3 0 4 1 4
CHAPTER 10
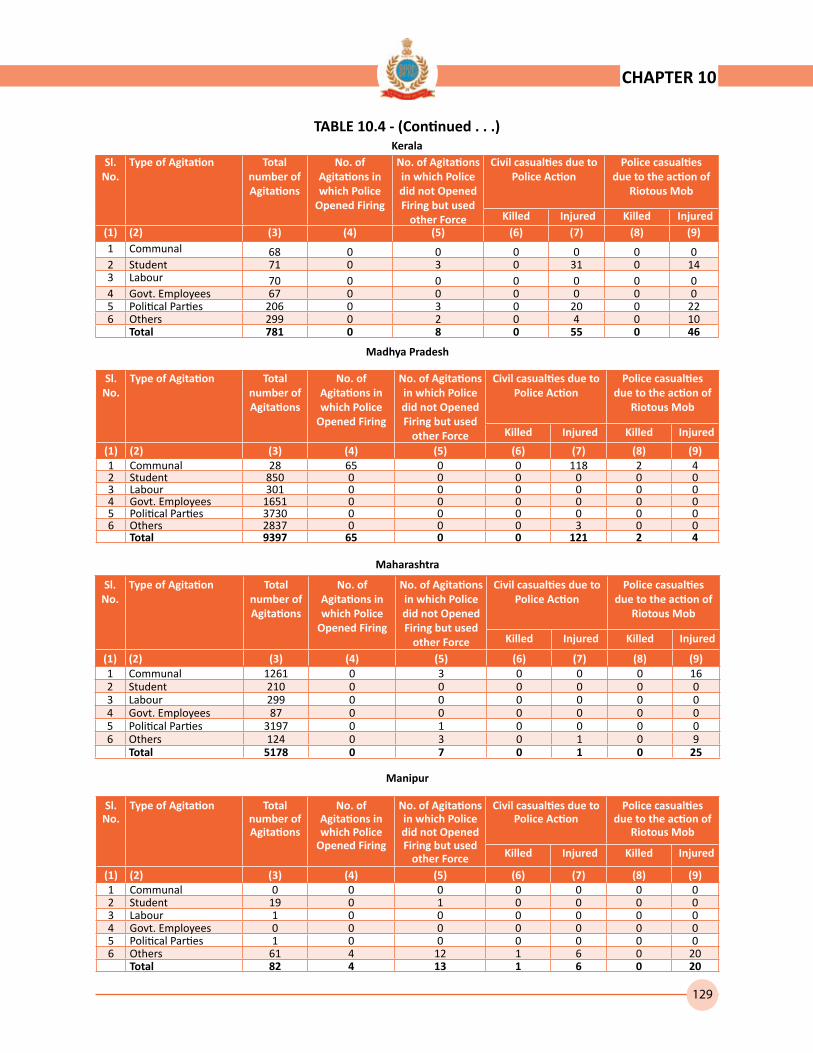
129
Madhya Pradesh
Sl. No.
Type of Agitation Total number of Agitations
No. of Agitations in which Police
Opened Firing
No. of Agitations in which Police did not Opened Firing but used
other Force
Civil casualties due to Police Action
Police casualties due to the action of
Riotous Mob
Killed Injured Killed Injured
(1) (2) (3) (4) (5) (6) (7) (8) (9)1 Communal 28 65 0 0 118 2 42 Student 850 0 0 0 0 0 03 Labour 301 0 0 0 0 0 04 Govt. Employees 1651 0 0 0 0 0 05 Political Parties 3730 0 0 0 0 0 06 Others 2837 0 0 0 3 0 0
Total 9397 65 0 0 121 2 4
Maharashtra
Sl. No.
Type of Agitation Total number of Agitations
No. of Agitations in which Police
Opened Firing
No. of Agitations in which Police did not Opened Firing but used
other Force
Civil casualties due to Police Action
Police casualties due to the action of
Riotous Mob
Killed Injured Killed Injured
(1) (2) (3) (4) (5) (6) (7) (8) (9)1 Communal 1261 0 3 0 0 0 162 Student 210 0 0 0 0 0 03 Labour 299 0 0 0 0 0 04 Govt. Employees 87 0 0 0 0 0 05 Political Parties 3197 0 1 0 0 0 06 Others 124 0 3 0 1 0 9
Total 5178 0 7 0 1 0 25
Manipur
Sl. No.
Type of Agitation Total number of Agitations
No. of Agitations in which Police
Opened Firing
No. of Agitations in which Police did not Opened Firing but used
other Force
Civil casualties due to Police Action
Police casualties due to the action of
Riotous Mob
Killed Injured Killed Injured
(1) (2) (3) (4) (5) (6) (7) (8) (9)1 Communal 0 0 0 0 0 0 02 Student 19 0 1 0 0 0 03 Labour 1 0 0 0 0 0 04 Govt. Employees 0 0 0 0 0 0 05 Political Parties 1 0 0 0 0 0 06 Others 61 4 12 1 6 0 20
Total 82 4 13 1 6 0 20
TABLE 10.4 - (Continued . . .)Kerala
Sl. No.
Type of Agitation Total number of Agitations
No. of Agitations in which Police
Opened Firing
No. of Agitations in which Police did not Opened Firing but used
other Force
Civil casualties due to Police Action
Police casualties due to the action of
Riotous Mob
Killed Injured Killed Injured(1) (2) (3) (4) (5) (6) (7) (8) (9)1 Communal 68 0 0 0 0 0 02 Student 71 0 3 0 31 0 143 Labour 70 0 0 0 0 0 04 Govt. Employees 67 0 0 0 0 0 05 Political Parties 206 0 3 0 20 0 226 Others 299 0 2 0 4 0 10
Total 781 0 8 0 55 0 46
CHAPTER 10

130
Mizoram
Sl. No.
Type of Agitation Total number of Agitations
No. of Agitations in which Police
Opened Firing
No. of Agitations in which Police did not Opened Firing but used
other Force
Civil casualties due to Police Action
Police casualties due to the action of
Riotous Mob
Killed Injured Killed Injured
(1) (2) (3) (4) (5) (6) (7) (8) (9)1 Communal 1 0 0 0 0 0 02 Student 7 0 0 0 0 0 03 Labour 0 0 0 0 0 0 04 Govt. Employees 4 0 0 0 0 0 05 Political Parties 4 0 0 0 0 0 06 Others 5 0 1 0 8 0 0
Total 21 0 1 0 8 0 0
Nagaland
Sl. No.
Type of Agitation Total number of Agitations
No. of Agitations in which Police
Opened Firing
No. of Agitations in which Police did not Opened Firing but used
other Force
Civil casualties due to Police Action
Police casualties due to the action of
Riotous Mob
Killed Injured Killed Injured
(1) (2) (3) (4) (5) (6) (7) (8) (9)1 Communal 2 1 0 0 0 0 12 Student 0 0 0 0 0 0 03 Labour 0 0 0 0 0 0 04 Govt. Employees 0 0 0 0 0 0 05 Political Parties 0 0 0 0 0 0 06 Others 1 0 0 0 0 0 0
Total 3 1 0 0 0 0 1
Odisha
Sl. No.
Type of Agitation Total number of Agitations
No. of Agitations in which Police
Opened Firing
No. of Agitations in which Police did not Opened Firing but used
other Force
Civil casualties due to Police Action
Police casualties due to the action of
Riotous Mob
Killed Injured Killed Injured
(1) (2) (3) (4) (5) (6) (7) (8) (9)1 Communal 41 0 0 0 0 0 02 Student 282 0 0 0 0 0 03 Labour 528 0 0 0 0 0 04 Govt. Employees 409 0 0 0 0 0 05 Political Parties 0 0 0 0 0 06 Others 2291 0 0 0 0 0 0
Total 3551 0 0 0 0 0 0
TABLE 10.4 - (Continued . . .)Meghalaya
Sl. No.
Type of Agitation Total number of Agitations
No. of Agitations in which Police
Opened Firing
No. of Agitations in which Police did not Opened Firing but used
other Force
Civil casualties due to Police Action
Police casualties due to the action of
Riotous Mob
Killed Injured Killed Injured
(1) (2) (3) (4) (5) (6) (7) (8) (9)1 Communal 1 0 0 0 0 0 02 Student 4 0 0 0 0 0 03 Labour 1 0 0 0 0 0 04 Govt. Employees 3 0 0 0 0 0 05 Political Parties 0 0 0 0 0 0 06 Others 6 0 0 0 0 0 0
Total 15 0 0 0 0 0 0
CHAPTER 10

131
Rajasthan
Sl. No.
Type of Agitation Total number of Agitations
No. of Agitations in which Police
Opened Firing
No. of Agitations in which Police did not Opened Firing but used
other Force
Civil casualties due to Police Action
Police casualties due to the action of
Riotous MobKilled Injured Killed Injured
(1) (2) (3) (4) (5) (6) (7) (8) (9)1 Communal 6 1 30 0 0 0 02 Student 939 0 20 0 0 0 03 Labour 302 0 2 0 0 0 04 Govt. Employees 265 0 0 0 0 0 05 Political Parties 393 0 0 0 0 0 06 Others 641 0 0 0 0 0 0
Total 2,546 1 52 0 0 0 0
Tamil Nadu
Sl. No.
Type of Agitation Total number of Agitations
No. of Agitations in which Police
Opened Firing
No. of Agitations in which Police did not Opened Firing but used
other Force
Civil casualties due to Police Action
Police casualties due to the action of
Riotous MobKilled Injured Killed Injured
(1) (2) (3) (4) (5) (6) (7) (8) (9)1 Communal 1281 0 0 0 0 0 02 Student 574 0 0 0 0 0 03 Labour 1392 0 0 0 0 0 04 Govt. Employees 2720 0 0 0 0 0 05 Political Parties 10086 0 0 0 0 0 06 Others 5179 1 1 1 0 0 20
Total 21232 1 1 1 0 0 20
Uttar Pradesh
Sl. No.
Type of Agitation Total number of Agitations
No. of Agitations in which Police
Opened Firing
No. of Agitations in which Police did not Opened Firing but used
other Force
Civil casualties due to Police Action
Police casualties due to the action of
Riotous MobKilled Injured Killed Injured
(1) (2) (3) (4) (5) (6) (7) (8) (9)1 Communal 27 0 0 0 0 0 452 Student 27 0 0 0 0 0 03 Labour 0 0 0 0 0 0 04 Govt. Employees 2 0 1 0 0 0 05 Political Parties 31 0 0 0 0 0 06 Others 11 1 1 3 4 0 3
Total 98 1 2 3 4 0 48
TABLE 10.4 - (Continued . . .)Punjab
Sl. No.
Type of Agitation Total number of Agitations
No. of Agitations in which Police
Opened Firing
No. of Agitations in which Police did not Opened Firing but used
other Force
Civil casualties due to Police Action
Police casualties due to the action of
Riotous MobKilled Injured Killed Injured
(1) (2) (3) (4) (5) (6) (7) (8) (9)1 Communal 55 1 0 1 1 0 02 Student 279 0 0 0 0 0 03 Labour 879 0 0 0 0 0 04 Govt. Employees 2023 0 1 0 2 0 05 Political Parties 601 0 0 0 8 0 26 Others 409 0 3 3 14 0 4
Total 4246 1 4 4 25 0 6
CHAPTER 10
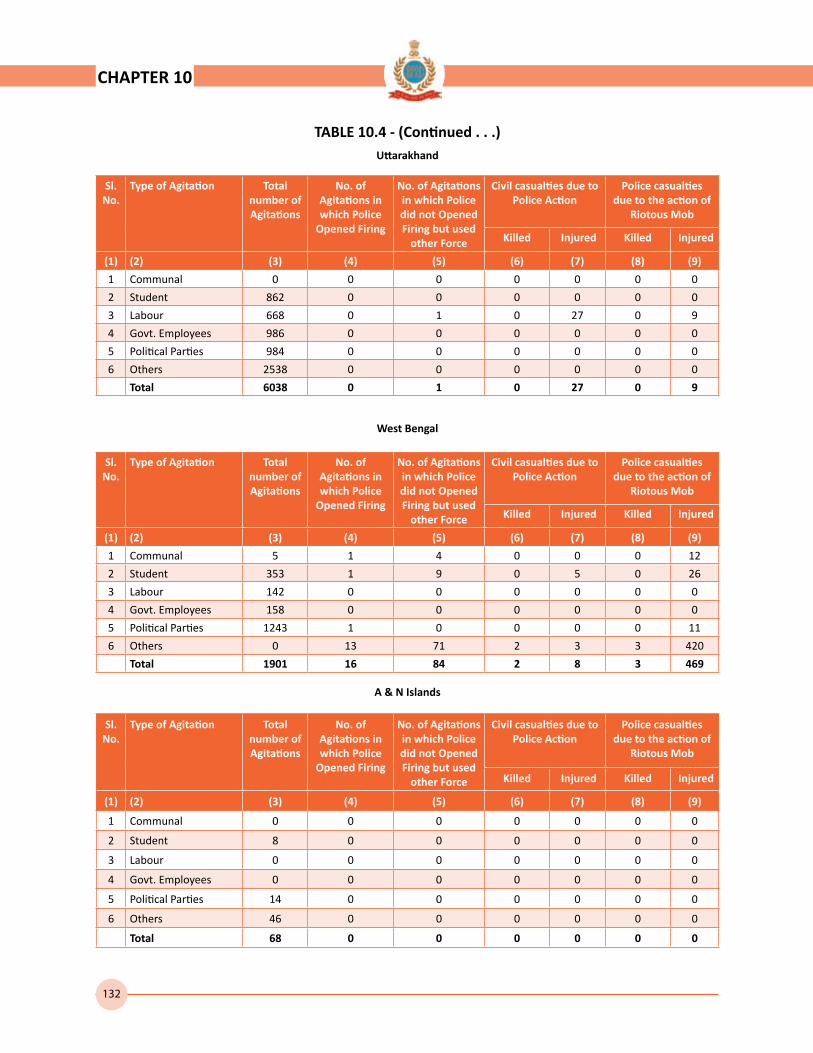
132
TABLE 10.4 - (Continued . . .)Uttarakhand
Sl. No.
Type of Agitation Total number of Agitations
No. of Agitations in which Police
Opened Firing
No. of Agitations in which Police did not Opened Firing but used
other Force
Civil casualties due to Police Action
Police casualties due to the action of
Riotous Mob
Killed Injured Killed Injured
(1) (2) (3) (4) (5) (6) (7) (8) (9)
1 Communal 0 0 0 0 0 0 0
2 Student 862 0 0 0 0 0 0
3 Labour 668 0 1 0 27 0 9
4 Govt. Employees 986 0 0 0 0 0 0
5 Political Parties 984 0 0 0 0 0 0
6 Others 2538 0 0 0 0 0 0
Total 6038 0 1 0 27 0 9
West Bengal
Sl. No.
Type of Agitation Total number of Agitations
No. of Agitations in which Police
Opened Firing
No. of Agitations in which Police did not Opened Firing but used
other Force
Civil casualties due to Police Action
Police casualties due to the action of
Riotous Mob
Killed Injured Killed Injured
(1) (2) (3) (4) (5) (6) (7) (8) (9)
1 Communal 5 1 4 0 0 0 12
2 Student 353 1 9 0 5 0 26
3 Labour 142 0 0 0 0 0 0
4 Govt. Employees 158 0 0 0 0 0 0
5 Political Parties 1243 1 0 0 0 0 11
6 Others 0 13 71 2 3 3 420
Total 1901 16 84 2 8 3 469
A & N Islands
Sl. No.
Type of Agitation Total number of Agitations
No. of Agitations in which Police
Opened Firing
No. of Agitations in which Police did not Opened Firing but used
other Force
Civil casualties due to Police Action
Police casualties due to the action of
Riotous Mob
Killed Injured Killed Injured
(1) (2) (3) (4) (5) (6) (7) (8) (9)
1 Communal 0 0 0 0 0 0 0
2 Student 8 0 0 0 0 0 0
3 Labour 0 0 0 0 0 0 0
4 Govt. Employees 0 0 0 0 0 0 0
5 Political Parties 14 0 0 0 0 0 0
6 Others 46 0 0 0 0 0 0
Total 68 0 0 0 0 0 0
CHAPTER 10
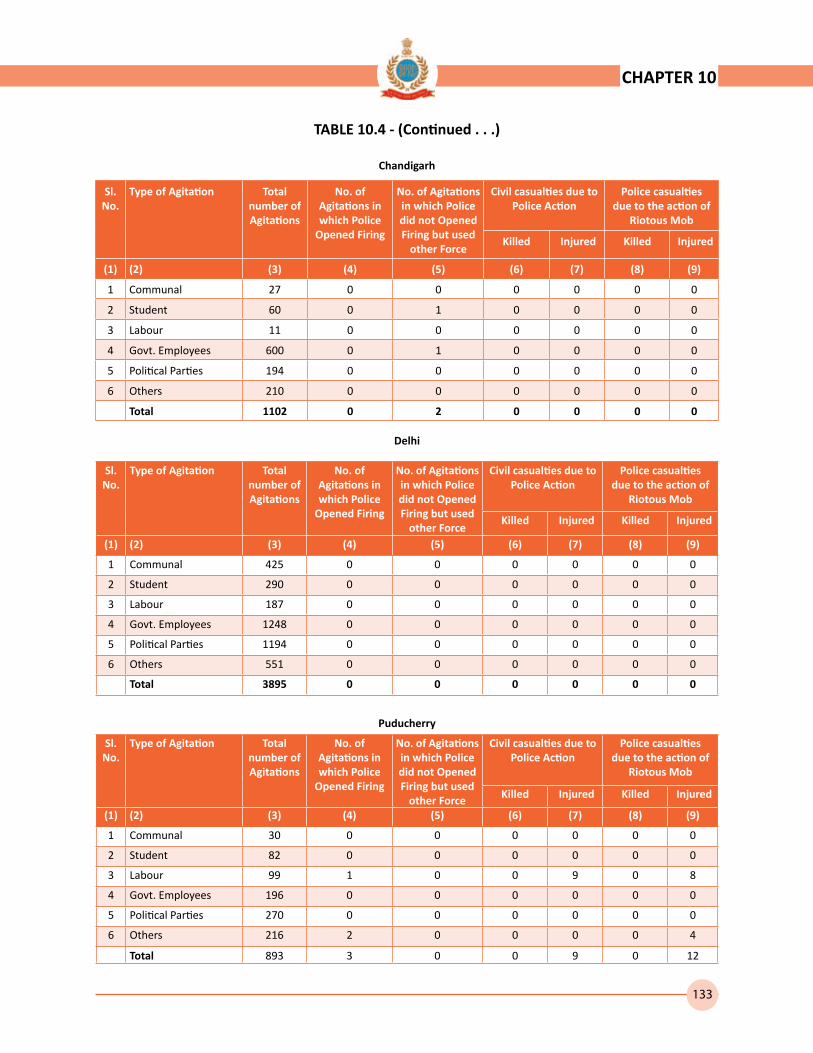
133
TABLE 10.4 - (Continued . . .)
Chandigarh
Sl. No.
Type of Agitation Total number of Agitations
No. of Agitations in which Police
Opened Firing
No. of Agitations in which Police did not Opened Firing but used
other Force
Civil casualties due to Police Action
Police casualties due to the action of
Riotous Mob
Killed Injured Killed Injured
(1) (2) (3) (4) (5) (6) (7) (8) (9)
1 Communal 27 0 0 0 0 0 0
2 Student 60 0 1 0 0 0 0
3 Labour 11 0 0 0 0 0 0
4 Govt. Employees 600 0 1 0 0 0 0
5 Political Parties 194 0 0 0 0 0 0
6 Others 210 0 0 0 0 0 0
Total 1102 0 2 0 0 0 0
Delhi
Sl. No.
Type of Agitation Total number of Agitations
No. of Agitations in which Police
Opened Firing
No. of Agitations in which Police did not Opened Firing but used
other Force
Civil casualties due to Police Action
Police casualties due to the action of
Riotous Mob
Killed Injured Killed Injured
(1) (2) (3) (4) (5) (6) (7) (8) (9)
1 Communal 425 0 0 0 0 0 0
2 Student 290 0 0 0 0 0 0
3 Labour 187 0 0 0 0 0 0
4 Govt. Employees 1248 0 0 0 0 0 0
5 Political Parties 1194 0 0 0 0 0 0
6 Others 551 0 0 0 0 0 0
Total 3895 0 0 0 0 0 0
Puducherry
Sl. No.
Type of Agitation Total number of Agitations
No. of Agitations in which Police
Opened Firing
No. of Agitations in which Police did not Opened Firing but used
other Force
Civil casualties due to Police Action
Police casualties due to the action of
Riotous Mob
Killed Injured Killed Injured
(1) (2) (3) (4) (5) (6) (7) (8) (9)
1 Communal 30 0 0 0 0 0 0
2 Student 82 0 0 0 0 0 0
3 Labour 99 1 0 0 9 0 8
4 Govt. Employees 196 0 0 0 0 0 0
5 Political Parties 270 0 0 0 0 0 0
6 Others 216 2 0 0 0 0 4
Total 893 3 0 0 9 0 12
CHAPTER 10

134
CHAPTER 11
This chapter gives the information on State/UT wise data on the Recipients of Police Medals for Gallantry; Comparison of Pay Scales of Police Personnel in different States; Terrorists/Extremists affected districts; Police Officers transferred; Availability of Mobile Forensic Vans; Computers held by the Police Departments; Firearms looted/stolen from police.
Data on Number of Criminal Courts have also been compiled. Required information has not been received from a large number of States/UTs, hence the same has been indicated accordingly in Tables 11.8 (page No. 145)
Police Medals for Gallantry
These Medals are awarded to the police personnel for exhibiting conspicuous gallantry in saving life and property, or in preventing crime or arresting dangerous criminals. During 2012 a total of 20 President’s Police Medals for Gallantry (PPMG) and 203 Police Medals for Gallantry (PMG) were awarded for outstanding performance to the Police personnel from the
States/UTs and Central Armed Police Forces. Details are given in Table – 11.1. (Page No. 138)
Out of the total of 20 PPMG Medals
Gallantry Medals Awarded to Policemen
Comparison of Pay Scales of Policemen
Terrorists/Extremists affected - Police Districts
State of Mobility, and holding Computers
Incidence of Transfers of Police Officers
Firearms looted/stolen from Police
Number of Criminal Courts
About the National Disaster Response Force
OTHER INFORMATIONS OF INTEREST
Gallantry Medals for 2012
S. No. States/CPOs PPMG PMG
1 Andhra Pradesh 3 6
2 Assam 0 7
3 Bihar 0 2
4 Chhatisgarh 0 4
5 Haryana 0 3
6 J & K 4 37
7 Jharkhand 0 5
8 Karnataka 0 4
9 Madhya Pradesh 0 8
10 Manipur 0 8
11 Meghalaya 1 5
12 Nagaland 0 1
13 Punjab 0 6
14 Rajasthan 0 1
15 Uttar Pradesh 0 29
16 Assam Rifles 0 6
17 BSF 0 10
18 CRPF 12 58
19 ITBP 0 1
20 RPF 0 2
All India 20 203
awarded to 3 States and 1 CPOs only, 2 (60%) have been accounted or the CRPF. In the case of Police Medals for Gallantry(PMG) 203 Medals have been awarded to the deserving Police Personnel of 15 States and 5 CAPFs as shown in the Table aside which maximum of 28.57% for CRPF out of total PMG (58) medal awarded during 2012 in the country.
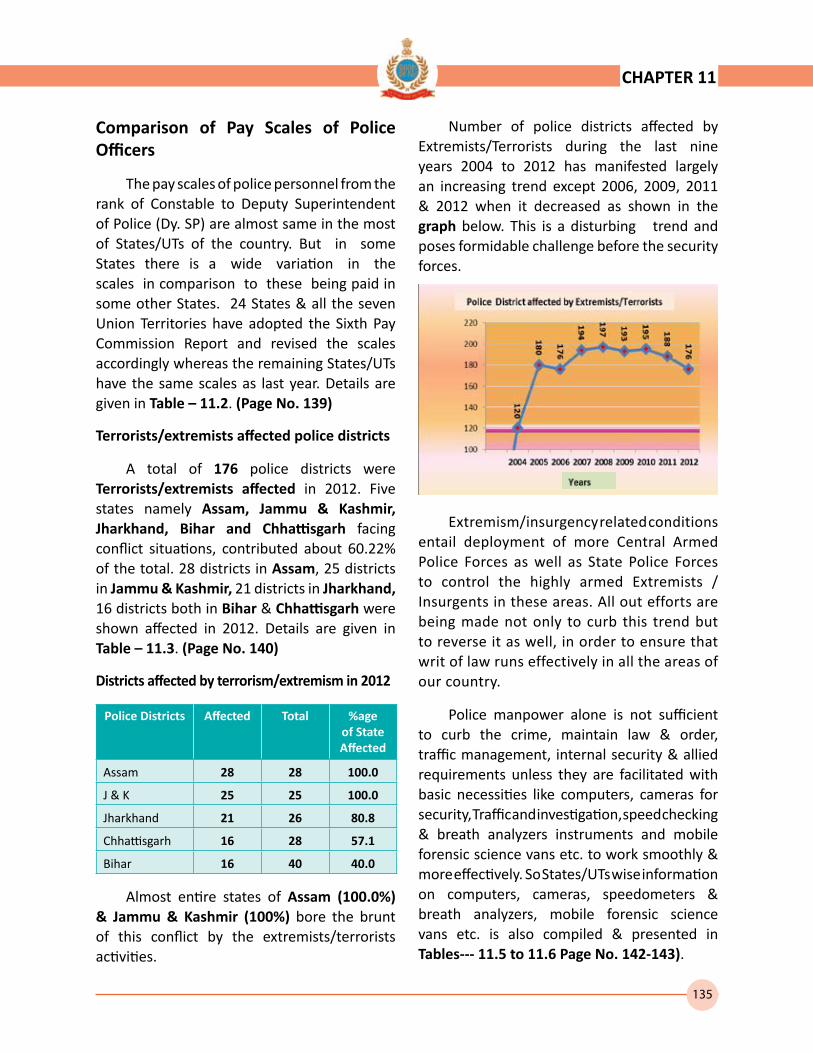
135
CHAPTER 11
Comparison of Pay Scales of Police Officers
The pay scales of police personnel from the rank of Constable to Deputy Superintendent of Police (Dy. SP) are almost same in the most of States/UTs of the country. But in some States there is a wide variation in the scales in comparison to these being paid in some other States. 24 States & all the seven Union Territories have adopted the Sixth Pay Commission Report and revised the scales accordingly whereas the remaining States/UTs have the same scales as last year. Details are given in Table – 11.2. (Page No. 139)
Terrorists/extremists affected police districts
A total of 176 police districts were Terrorists/extremists affected in 2012. Five states namely Assam, Jammu & Kashmir, Jharkhand, Bihar and Chhattisgarh facing conflict situations, contributed about 60.22% of the total. 28 districts in Assam, 25 districts in Jammu & Kashmir, 21 districts in Jharkhand, 16 districts both in Bihar & Chhattisgarh were shown affected in 2012. Details are given in Table – 11.3. (Page No. 140)
Districts affected by terrorism/extremism in 2012
Police Districts Affected Total %age of State Affected
Assam 28 28 100.0
J & K 25 25 100.0
Jharkhand 21 26 80.8
Chhattisgarh 16 28 57.1
Bihar 16 40 40.0
Almost entire states of Assam (100.0%) & Jammu & Kashmir (100%) bore the brunt of this conflict by the extremists/terrorists activities.
Number of police districts affected by Extremists/Terrorists during the last nine years 2004 to 2012 has manifested largely an increasing trend except 2006, 2009, 2011 & 2012 when it decreased as shown in the graph below. This is a disturbing trend and poses formidable challenge before the security forces.
Extremism/insurgency related conditions entail deployment of more Central Armed Police Forces as well as State Police Forces to control the highly armed Extremists / Insurgents in these areas. All out efforts are being made not only to curb this trend but to reverse it as well, in order to ensure that writ of law runs effectively in all the areas of our country.
Police manpower alone is not sufficient to curb the crime, maintain law & order, traffic management, internal security & allied requirements unless they are facilitated with basic necessities like computers, cameras for security, Traffic and investigation, speed checking & breath analyzers instruments and mobile forensic science vans etc. to work smoothly & more effectively. So States/UTs wise information on computers, cameras, speedometers & breath analyzers, mobile forensic science vans etc. is also compiled & presented in Tables--- 11.5 to 11.6 Page No. 142-143).
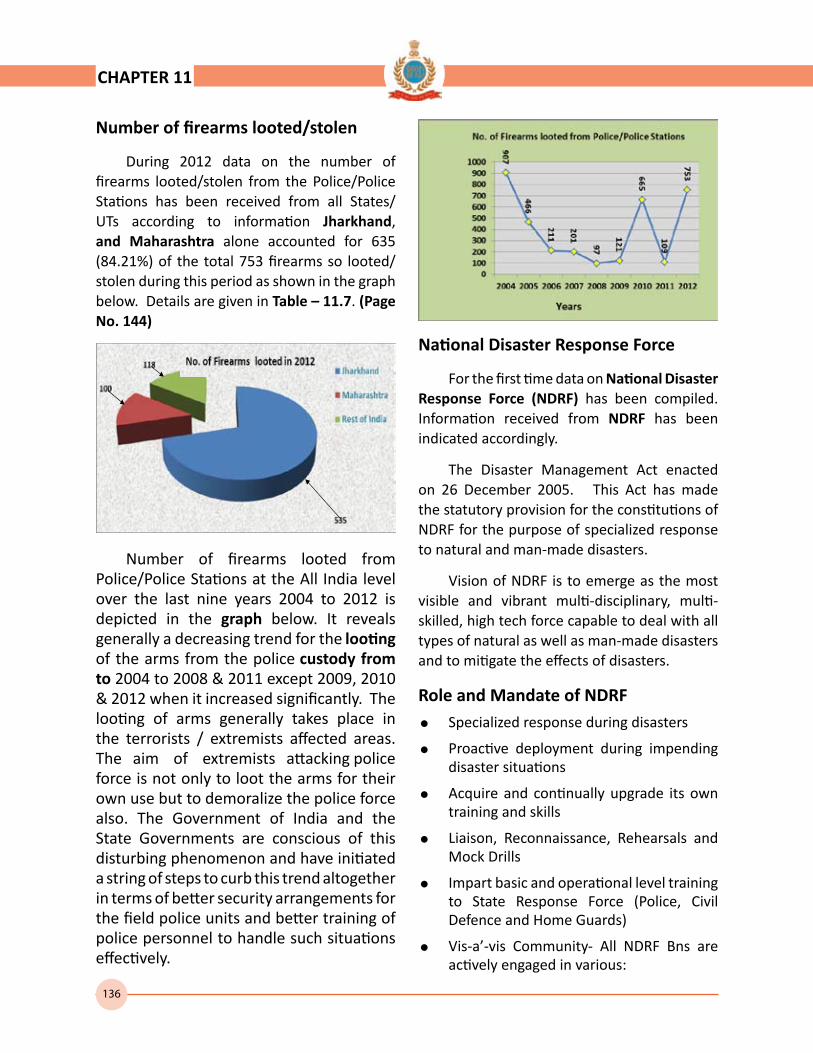
136
Number of firearms looted/stolen
During 2012 data on the number of firearms looted/stolen from the Police/Police Stations has been received from all States/UTs according to information Jharkhand, and Maharashtra alone accounted for 635 (84.21%) of the total 753 firearms so looted/stolen during this period as shown in the graph below. Details are given in Table – 11.7. (Page No. 144)
National Disaster Response Force
For the first time data on National Disaster Response Force (NDRF) has been compiled. Information received from NDRF has been indicated accordingly.
The Disaster Management Act enacted on 26 December 2005. This Act has made the statutory provision for the constitutions of NDRF for the purpose of specialized response to natural and man-made disasters.
Vision of NDRF is to emerge as the most visible and vibrant multi-disciplinary, multi-skilled, high tech force capable to deal with all types of natural as well as man-made disasters and to mitigate the effects of disasters.
Role and Mandate of NDRF= Specialized response during disasters
= Proactive deployment during impending disaster situations
= Acquire and continually upgrade its own training and skills
= Liaison, Reconnaissance, Rehearsals and Mock Drills
= Impart basic and operational level training to State Response Force (Police, Civil Defence and Home Guards)
= Vis-a’-vis Community- All NDRF Bns are actively engaged in various:
CHAPTER 11
Number of firearms looted from Police/Police Stations at the All India level over the last nine years 2004 to 2012 is depicted in the graph below. It reveals generally a decreasing trend for the looting of the arms from the police custody from to 2004 to 2008 & 2011 except 2009, 2010 & 2012 when it increased significantly. The looting of arms generally takes place in the terrorists / extremists affected areas. The aim of extremists attacking police force is not only to loot the arms for their own use but to demoralize the police force also. The Government of India and the State Governments are conscious of this disturbing phenomenon and have initiated a string of steps to curb this trend altogether in terms of better security arrangements for the field police units and better training of police personnel to handle such situations effectively.
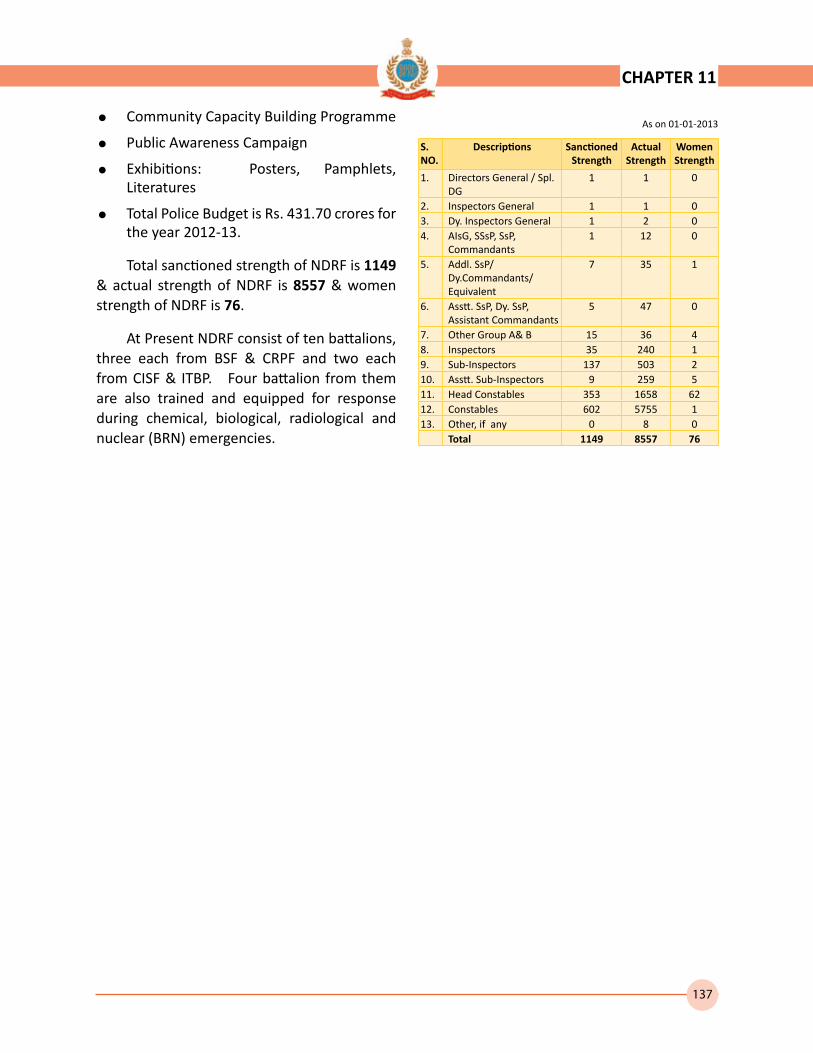
137
= Community Capacity Building Programme
= Public Awareness Campaign
= Exhibitions: Posters, Pamphlets, Literatures
= Total Police Budget is Rs. 431.70 crores for the year 2012-13.
Total sanctioned strength of NDRF is 1149 & actual strength of NDRF is 8557 & women strength of NDRF is 76.
At Present NDRF consist of ten battalions, three each from BSF & CRPF and two each from CISF & ITBP. Four battalion from them are also trained and equipped for response during chemical, biological, radiological and nuclear (BRN) emergencies.
CHAPTER 11
As on 01-01-2013
S.NO.
Descriptions Sanctioned Strength
Actual Strength
Women Strength
1. Directors General / Spl. DG
1 1 0
2. Inspectors General 1 1 03. Dy. Inspectors General 1 2 04. AIsG, SSsP, SsP,
Commandants1 12 0
5. Addl. SsP/Dy.Commandants/Equivalent
7 35 1
6. Asstt. SsP, Dy. SsP, Assistant Commandants
5 47 0
7. Other Group A& B 15 36 48. Inspectors 35 240 19. Sub-Inspectors 137 503 210. Asstt. Sub-Inspectors 9 259 511. Head Constables 353 1658 6212. Constables 602 5755 113. Other, if any 0 8 0
Total 1149 8557 76

138
TABLE 11.1 -- DETAILS OF POLICE MEDALS FOR GALLANTGRY AWARDED TO POLICEPERSONNEL OF STATES/UTs/CENTRAL ARMED POLICE FORCES, ETC. DURING 2012
Sl. No. States / UTs. PPMG PMG
(1) (2) (3) (4)
1 Andhra Pradesh 3 62 Arunachal Pradesh3 Assam 74 Bihar 25 Chhattisgarh 46 Goa7 Gujarat8 Haryana 39 Himachal Pradesh
10 Jammu & Kashmir 4 3711 Jharkhand 512 Karnataka 413 Kerala14 Madhya Pradesh 815 Maharashtra 16 Manipur 817 Meghalaya 1 518 Mizoram19 Nagaland 120 Odisha21 Punjab 622 Rajasthan 123 Sikkim24 Tamil Nadu 25 Tripura26 Uttar Pradesh 2927 Uttarakhand28 West Bengal29 A&N Islands30 Chandigarh31 D&N Haveli32 Daman & Diu33 Delhi34 Lakshadweep35 Puducherry36 Assam Rifles 637 BSF 1038 CISF39 CRPF 12 5840 ITBP 141 RPF 242 Other CPOs
TOTAL 20 203
PPMG: President’s Police Medal for GallantryPMG: Police Medal for GallantrySource: Annual Report 2011-12, MHA
CHAPTER 11
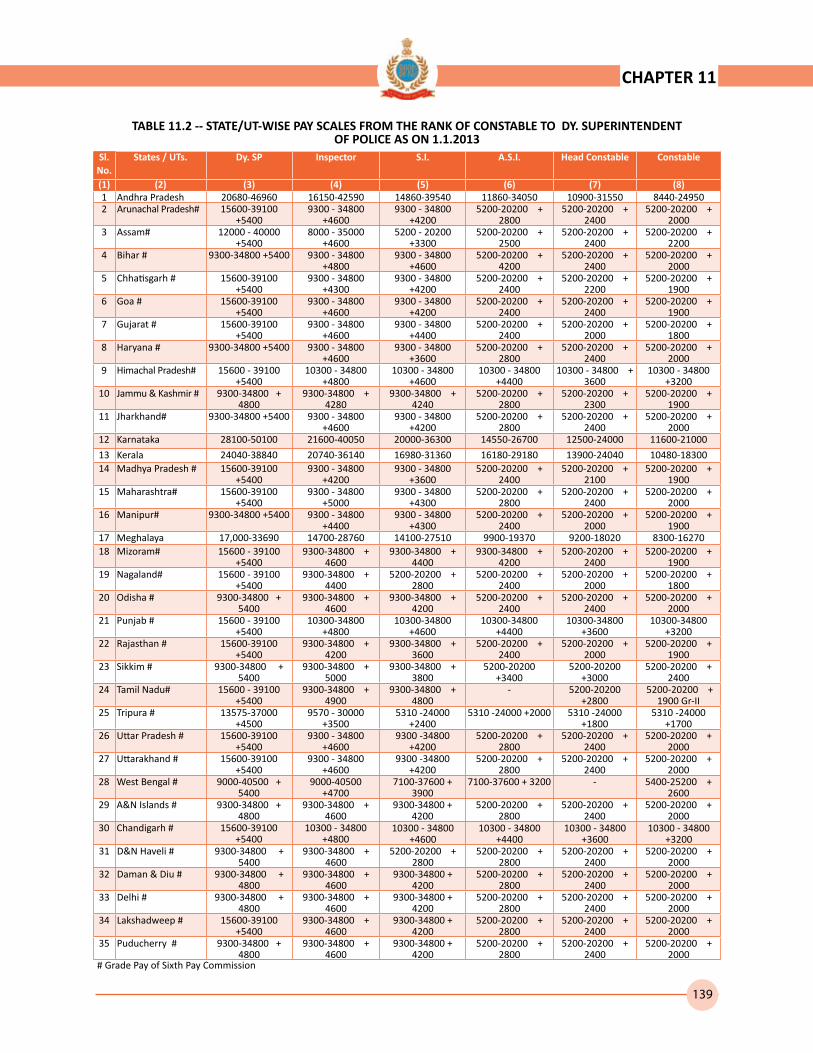
139
TABLE 11.2 -- STATE/UT-WISE PAY SCALES FROM THE RANK OF CONSTABLE TO DY. SUPERINTENDENT OF POLICE AS ON 1.1.2013
Sl. No.
States / UTs. Dy. SP Inspector S.I. A.S.I. Head Constable Constable
(1) (2) (3) (4) (5) (6) (7) (8) 1 Andhra Pradesh 20680-46960 16150-42590 14860-39540 11860-34050 10900-31550 8440-249502 Arunachal Pradesh# 15600-39100
+54009300 - 34800
+46009300 - 34800
+42005200-20200 +
28005200-20200 +
24005200-20200 +
20003 Assam# 12000 - 40000
+54008000 - 35000
+46005200 - 20200
+33005200-20200 +
25005200-20200 +
24005200-20200 +
22004 Bihar # 9300-34800 +5400 9300 - 34800
+48009300 - 34800
+46005200-20200 +
42005200-20200 +
24005200-20200 +
20005 Chhatisgarh # 15600-39100
+54009300 - 34800
+43009300 - 34800
+42005200-20200 +
24005200-20200 +
22005200-20200 +
19006 Goa # 15600-39100
+54009300 - 34800
+46009300 - 34800
+42005200-20200 +
24005200-20200 +
24005200-20200 +
19007 Gujarat # 15600-39100
+54009300 - 34800
+46009300 - 34800
+44005200-20200 +
24005200-20200 +
20005200-20200 +
18008 Haryana # 9300-34800 +5400 9300 - 34800
+46009300 - 34800
+36005200-20200 +
28005200-20200 +
24005200-20200 +
20009 Himachal Pradesh# 15600 - 39100
+540010300 - 34800
+480010300 - 34800
+460010300 - 34800
+440010300 - 34800 +
360010300 - 34800
+320010 Jammu & Kashmir # 9300-34800 +
48009300-34800 +
42809300-34800 +
42405200-20200 +
28005200-20200 +
23005200-20200 +
190011 Jharkhand# 9300-34800 +5400 9300 - 34800
+46009300 - 34800
+42005200-20200 +
28005200-20200 +
24005200-20200 +
200012 Karnataka 28100-50100 21600-40050 20000-36300 14550-26700 12500-24000 11600-21000
13 Kerala 24040-38840 20740-36140 16980-31360 16180-29180 13900-24040 10480-1830014 Madhya Pradesh # 15600-39100
+54009300 - 34800
+42009300 - 34800
+36005200-20200 +
24005200-20200 +
21005200-20200 +
190015 Maharashtra# 15600-39100
+54009300 - 34800
+50009300 - 34800
+43005200-20200 +
28005200-20200 +
24005200-20200 +
200016 Manipur# 9300-34800 +5400 9300 - 34800
+44009300 - 34800
+43005200-20200 +
24005200-20200 +
20005200-20200 +
190017 Meghalaya 17,000-33690 14700-28760 14100-27510 9900-19370 9200-18020 8300-1627018 Mizoram# 15600 - 39100
+54009300-34800 +
46009300-34800 +
44009300-34800 +
42005200-20200 +
24005200-20200 +
190019 Nagaland# 15600 - 39100
+54009300-34800 +
44005200-20200 +
28005200-20200 +
24005200-20200 +
20005200-20200 +
180020 Odisha # 9300-34800 +
54009300-34800 +
46009300-34800 +
42005200-20200 +
24005200-20200 +
24005200-20200 +
200021 Punjab # 15600 - 39100
+540010300-34800
+480010300-34800
+460010300-34800
+440010300-34800
+360010300-34800
+320022 Rajasthan # 15600-39100
+54009300-34800 +
42009300-34800 +
36005200-20200 +
24005200-20200 +
20005200-20200 +
190023 Sikkim # 9300-34800 +
54009300-34800 +
50009300-34800 +
38005200-20200
+34005200-20200
+30005200-20200 +
240024 Tamil Nadu# 15600 - 39100
+54009300-34800 +
49009300-34800 +
4800- 5200-20200
+2800 5200-20200 +
1900 Gr-II25 Tripura # 13575-37000
+45009570 - 30000
+35005310 -24000
+24005310 -24000 +2000 5310 -24000
+18005310 -24000
+170026 Uttar Pradesh # 15600-39100
+54009300 - 34800
+46009300 -34800
+42005200-20200 +
28005200-20200 +
24005200-20200 +
200027 Uttarakhand # 15600-39100
+54009300 - 34800
+46009300 -34800
+42005200-20200 +
28005200-20200 +
24005200-20200 +
200028 West Bengal # 9000-40500 +
54009000-40500
+47007100-37600 +
39007100-37600 + 3200 - 5400-25200 +
260029 A&N Islands # 9300-34800 +
48009300-34800 +
46009300-34800 +
42005200-20200 +
28005200-20200 +
24005200-20200 +
200030 Chandigarh # 15600-39100
+540010300 - 34800
+480010300 - 34800
+460010300 - 34800
+440010300 - 34800
+360010300 - 34800
+320031 D&N Haveli # 9300-34800 +
54009300-34800 +
46005200-20200 +
28005200-20200 +
28005200-20200 +
24005200-20200 +
200032 Daman & Diu # 9300-34800 +
48009300-34800 +
46009300-34800 +
42005200-20200 +
28005200-20200 +
24005200-20200 +
200033 Delhi # 9300-34800 +
48009300-34800 +
46009300-34800 +
42005200-20200 +
28005200-20200 +
24005200-20200 +
200034 Lakshadweep # 15600-39100
+54009300-34800 +
46009300-34800 +
42005200-20200 +
28005200-20200 +
24005200-20200 +
200035 Puducherry # 9300-34800 +
48009300-34800 +
46009300-34800 +
42005200-20200 +
28005200-20200 +
24005200-20200 +
2000# Grade Pay of Sixth Pay Commission
CHAPTER 11
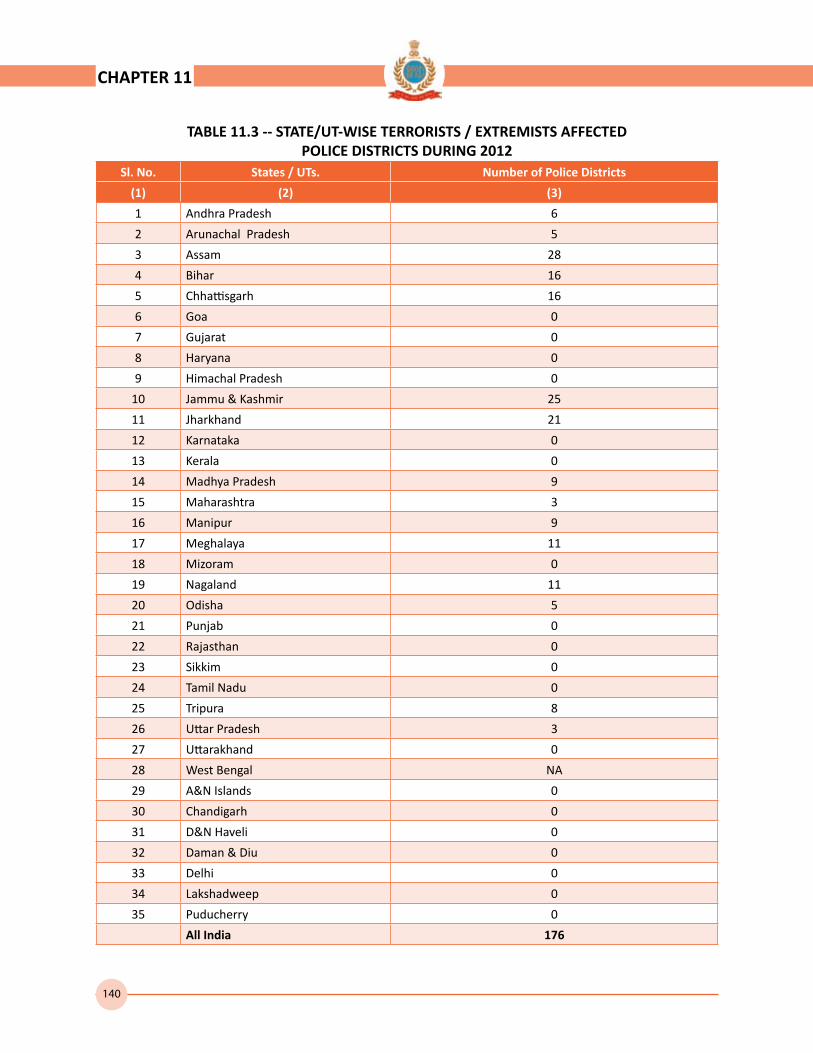
140
TABLE 11.3 -- STATE/UT-WISE TERRORISTS / EXTREMISTS AFFECTED POLICE DISTRICTS DURING 2012
Sl. No. States / UTs. Number of Police Districts
(1) (2) (3)
1 Andhra Pradesh 6
2 Arunachal Pradesh 5
3 Assam 28
4 Bihar 16
5 Chhattisgarh 16
6 Goa 0
7 Gujarat 0
8 Haryana 0
9 Himachal Pradesh 0
10 Jammu & Kashmir 25
11 Jharkhand 21
12 Karnataka 0
13 Kerala 0
14 Madhya Pradesh 9
15 Maharashtra 3
16 Manipur 9
17 Meghalaya 11
18 Mizoram 0
19 Nagaland 11
20 Odisha 5
21 Punjab 0
22 Rajasthan 0
23 Sikkim 0
24 Tamil Nadu 0
25 Tripura 8
26 Uttar Pradesh 3
27 Uttarakhand 0
28 West Bengal NA
29 A&N Islands 0
30 Chandigarh 0
31 D&N Haveli 0
32 Daman & Diu 0
33 Delhi 0
34 Lakshadweep 0
35 Puducherry 0
All India 176
CHAPTER 11
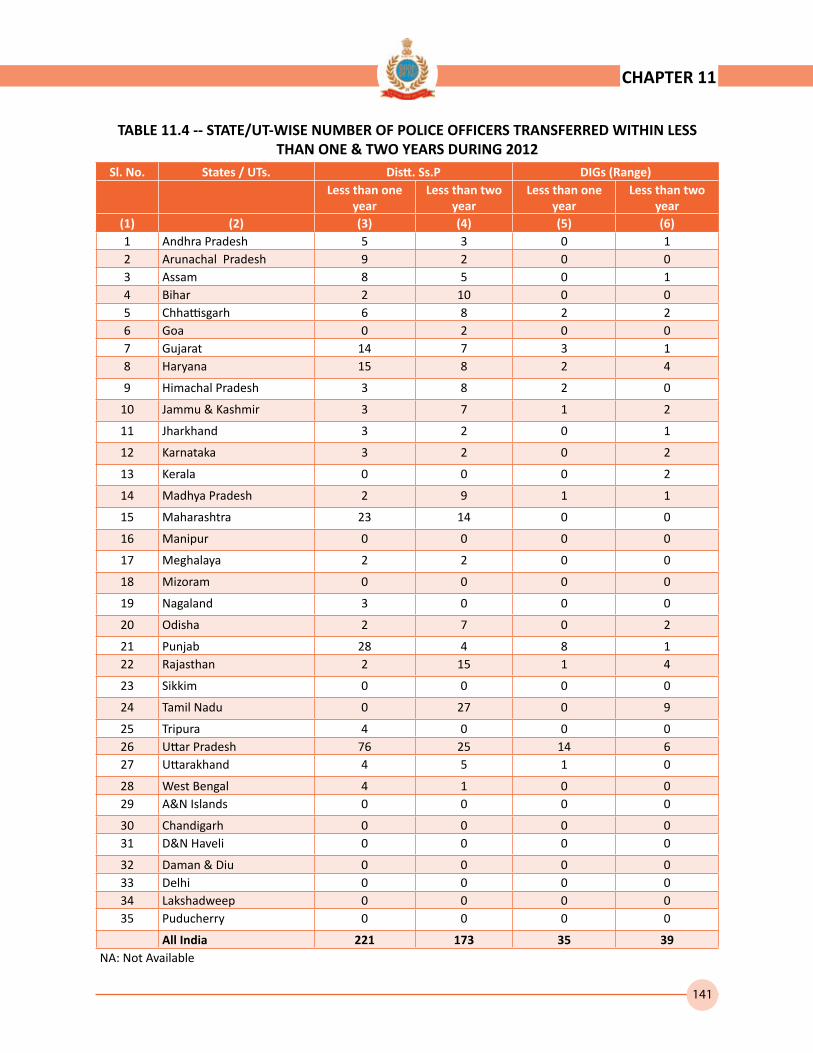
141
TABLE 11.4 -- STATE/UT-WISE NUMBER OF POLICE OFFICERS TRANSFERRED WITHIN LESS THAN ONE & TWO YEARS DURING 2012
Sl. No. States / UTs. Distt. Ss.P DIGs (Range) Less than one
yearLess than two
yearLess than one
yearLess than two
year(1) (2) (3) (4) (5) (6) 1 Andhra Pradesh 5 3 0 12 Arunachal Pradesh 9 2 0 03 Assam 8 5 0 14 Bihar 2 10 0 05 Chhattisgarh 6 8 2 26 Goa 0 2 0 07 Gujarat 14 7 3 18 Haryana 15 8 2 4
9 Himachal Pradesh 3 8 2 0
10 Jammu & Kashmir 3 7 1 2
11 Jharkhand 3 2 0 1
12 Karnataka 3 2 0 2
13 Kerala 0 0 0 2
14 Madhya Pradesh 2 9 1 1
15 Maharashtra 23 14 0 0
16 Manipur 0 0 0 0
17 Meghalaya 2 2 0 0
18 Mizoram 0 0 0 0
19 Nagaland 3 0 0 0
20 Odisha 2 7 0 2
21 Punjab 28 4 8 122 Rajasthan 2 15 1 4
23 Sikkim 0 0 0 0
24 Tamil Nadu 0 27 0 9
25 Tripura 4 0 0 026 Uttar Pradesh 76 25 14 627 Uttarakhand 4 5 1 0
28 West Bengal 4 1 0 029 A&N Islands 0 0 0 0
30 Chandigarh 0 0 0 031 D&N Haveli 0 0 0 0
32 Daman & Diu 0 0 0 033 Delhi 0 0 0 034 Lakshadweep 0 0 0 035 Puducherry 0 0 0 0
All India 221 173 35 39NA: Not Available
CHAPTER 11
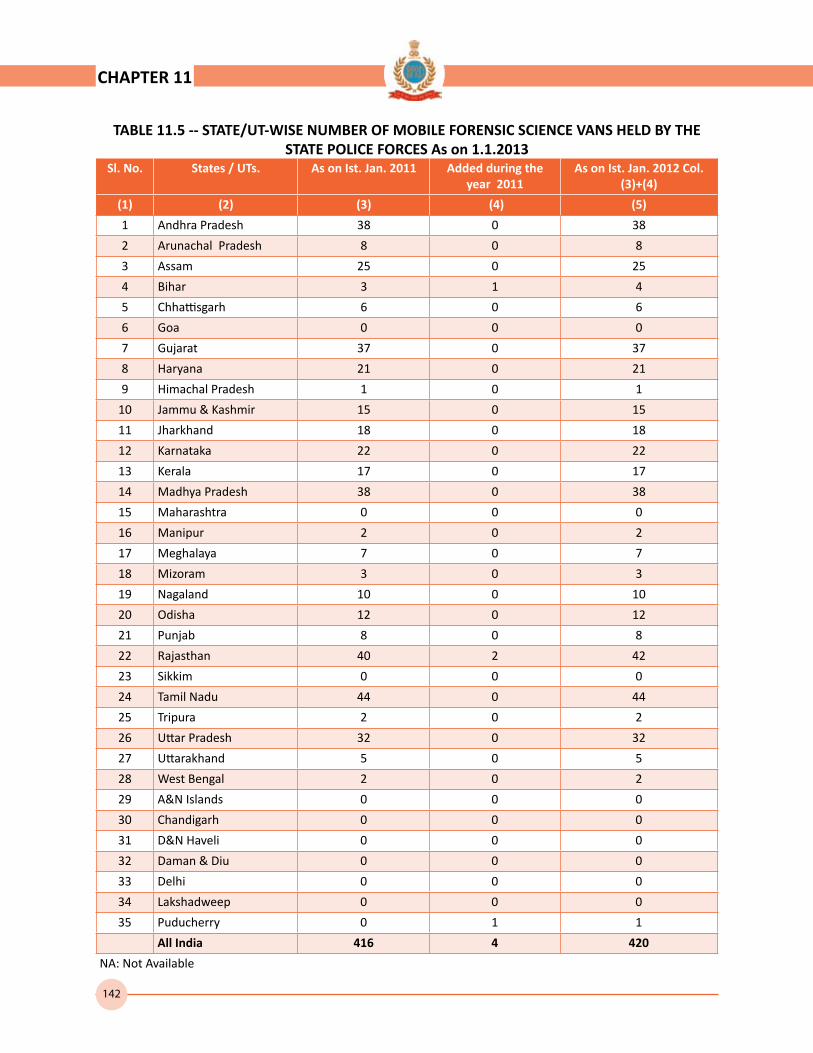
142
TABLE 11.5 -- STATE/UT-WISE NUMBER OF MOBILE FORENSIC SCIENCE VANS HELD BY THE STATE POLICE FORCES As on 1.1.2013
Sl. No. States / UTs. As on Ist. Jan. 2011 Added during the year 2011
As on Ist. Jan. 2012 Col.(3)+(4)
(1) (2) (3) (4) (5)
1 Andhra Pradesh 38 0 38
2 Arunachal Pradesh 8 0 8
3 Assam 25 0 25
4 Bihar 3 1 4
5 Chhattisgarh 6 0 6
6 Goa 0 0 0
7 Gujarat 37 0 37
8 Haryana 21 0 21
9 Himachal Pradesh 1 0 1
10 Jammu & Kashmir 15 0 15
11 Jharkhand 18 0 18
12 Karnataka 22 0 22
13 Kerala 17 0 17
14 Madhya Pradesh 38 0 38
15 Maharashtra 0 0 0
16 Manipur 2 0 2
17 Meghalaya 7 0 7
18 Mizoram 3 0 3
19 Nagaland 10 0 10
20 Odisha 12 0 12
21 Punjab 8 0 8
22 Rajasthan 40 2 42
23 Sikkim 0 0 0
24 Tamil Nadu 44 0 44
25 Tripura 2 0 2
26 Uttar Pradesh 32 0 32
27 Uttarakhand 5 0 5
28 West Bengal 2 0 2
29 A&N Islands 0 0 0
30 Chandigarh 0 0 0
31 D&N Haveli 0 0 0
32 Daman & Diu 0 0 0
33 Delhi 0 0 0
34 Lakshadweep 0 0 0
35 Puducherry 0 1 1
All India 416 4 420
NA: Not Available
CHAPTER 11

143
TABLE 11.6 -- STATE/UT-WISE NUMBER OF COMPUTERS AVAILABLE WITH THE STATE POLICE FORCE AS ON 1.1.2013
Sl. No. States / UTs. As on Ist. Jan. 2012 Added during the year 2012
As on Ist. Jan. 2013 Col.(3)+(4)
(1) (2) (3) (4) (5)
1 Andhra Pradesh 3,630 1,767 5,397
2 Arunachal Pradesh 133 5 138
3 Assam 228 12 240
4 Bihar 361 0 361
5 Chhattisgarh 890 15 905
6 Goa 258 24 282
7 Gujarat 3,279 0 3,279
8 Haryana 3,107 410 3,517
9 Himachal Pradesh 734 0 734
10 Jammu & Kashmir 2,084 290 2,374
11 Jharkhand 1,202 60 1,262
12 Karnataka 4,516 3,596 8,112
13 Kerala 3,076 653 3,729
14 Madhya Pradesh 3,193 0 3,193
15 Maharashtra 7,427 83 7,510
16 Manipur 228 20 248
17 Meghalaya 287 0 287
18 Mizoram 209 39 248
19 Nagaland 220 40 260
20 Odisha 782 470 1,252
21 Punjab 1,230 26 1,256
22 Rajasthan 4,857 164 5,021
23 Sikkim 93 0 93
24 Tamil Nadu 5,888 207 6,095
25 Tripura 163 0 163
26 Uttar Pradesh 4,908 0 4,908
27 Uttarakhand 974 24 998
28 West Bengal 1,270 81 1,351
29 A&N Islands 250 0 250
30 Chandigarh 363 21 384
31 D&N Haveli 10 5 15
32 Daman & Diu 42 0 42
33 Delhi 2,190 262 2,452
34 Lakshadweep 80 0 80
35 Puducherry 316 0 316
All India 58,478 8,274 66,752
NA: Not Available
CHAPTER 11
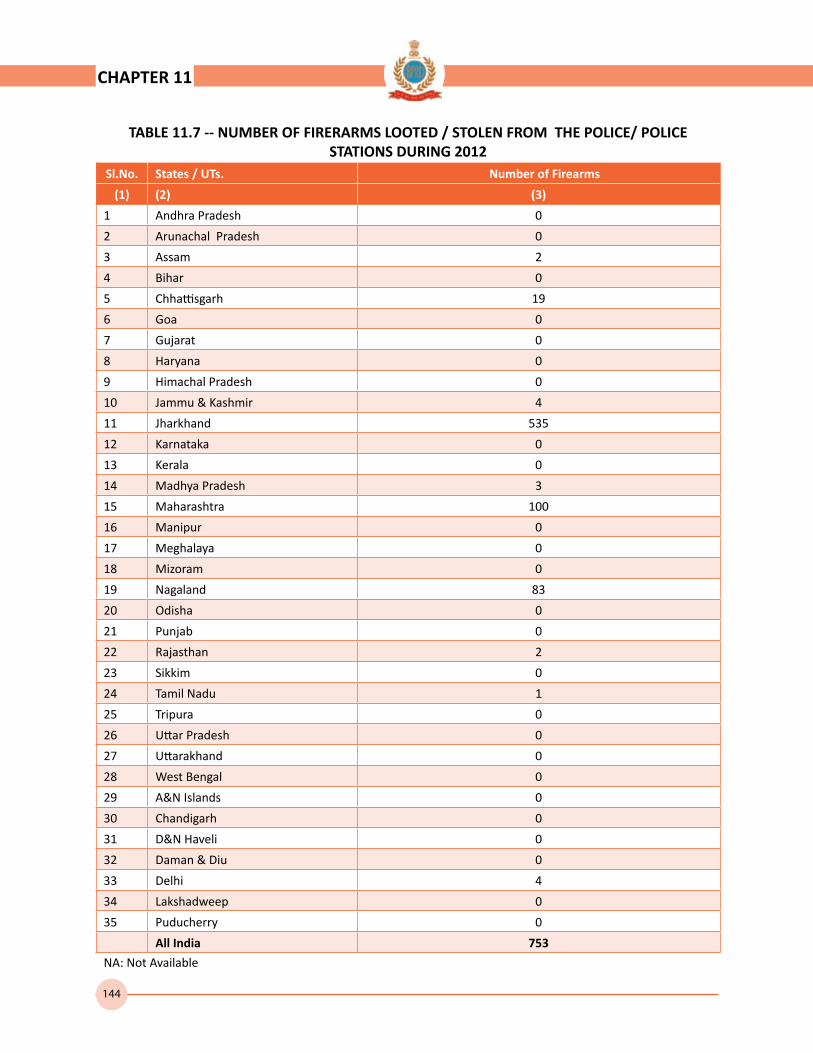
144
TABLE 11.7 -- NUMBER OF FIRERARMS LOOTED / STOLEN FROM THE POLICE/ POLICE STATIONS DURING 2012
Sl.No. States / UTs. Number of Firearms
(1) (2) (3)
1 Andhra Pradesh 0
2 Arunachal Pradesh 0
3 Assam 2
4 Bihar 0
5 Chhattisgarh 19
6 Goa 0
7 Gujarat 0
8 Haryana 0
9 Himachal Pradesh 0
10 Jammu & Kashmir 4
11 Jharkhand 535
12 Karnataka 0
13 Kerala 0
14 Madhya Pradesh 3
15 Maharashtra 100
16 Manipur 0
17 Meghalaya 0
18 Mizoram 0
19 Nagaland 83
20 Odisha 0
21 Punjab 0
22 Rajasthan 2
23 Sikkim 0
24 Tamil Nadu 1
25 Tripura 0
26 Uttar Pradesh 0
27 Uttarakhand 0
28 West Bengal 0
29 A&N Islands 0
30 Chandigarh 0
31 D&N Haveli 0
32 Daman & Diu 0
33 Delhi 4
34 Lakshadweep 0
35 Puducherry 0
All India 753
NA: Not Available
CHAPTER 11

145
TABLE 11.8- STATE/UT-WISE NUMBER OF CRIMINAL COURTS AS ON 01.01.2013
Sl. No. States / UTs. Session Courts Chief Judicial/ Chief Metro. Magistrates
Judicial / Metropolitan Magistrates
Any other Courts
(1) (2) (3) (4) (5) (6)
1 Andhra Pradesh 345 0 328
2 Arunachal Pradesh 17 0 37 3
3 Assam 54 41 85 63
4 Bihar 180 301 451 0
5 Chhattisgarh 80 27 178 0
6 Goa 0 0 0 0
7 Gujarat 195 359 537 0
8 Haryana 72 42 92 23
9 Himachal Pradesh 28 12 70 0
10 Jammu & Kashmir 47 49 87 5
11 Jharkhand 148 48 211 22
12 Karnataka 149 145 370 93
13 Kerala 145 18 128 10
14 Madhya Pradesh 0 0 0 0
15 Maharashtra 235 48 1096 0
16 Manipur 8 9 11 0
17 Meghalaya 5 1 3 0
18 Mizoram 0 0 0 0
19 Nagaland 8 3 8 4
20 Odisha 115 34 95 138
21 Punjab 110 32 166 0
22 Rajasthan 180 234 323 109
23 Sikkim 2 2 4 0
24 Tamil Nadu 157 29 237 64
25 Tripura 19 4 34 0
26 Uttar Pradesh 762 325 342 314
27 Uttarakhand 44 24 45 8
28 West Bengal 117 64 158 22
29 A&N Islands 2 3 4 0
30 Chandigarh 5 2 12 2
31 D&N Haveli 1 1 1 0
32 Daman & Diu 1 1 0 0
33 Delhi NA NA NA NA
34 Lakshadweep 1 0 2 0
35 Puducherry 6 1 8 0
All India 3238 1859 5123 880
NA: Not available with Police Deptt.
CHAPTER 11