New landscapes and new eyes: The role of virtual world design for supply chain education

I International Conference on Sustainability Measurement and ModelingICSMM06
E. Carrera, J. J. de Felipe, B. Sureda, N. Tollin (Eds)© CIMNE, Barcelona, 2006
COMPOSITE INDICATORS: A METHODOLOGICAL PROPOSAL FORALTERNATIVE DESIGN
Uwe Spanger
Universidade Federal do Paraná – Doctorate for Environment andDevelopment
Curitiba, [email protected]
Key words: composite indicators, Human Development Index, dataconstraints, non numerical index representation.
1 INTRODUCTION
Composite indicators are increasingly used as a usefulinformation and communication tool. They are established tomeasure different aspects of human life like well being,quality of life, economic or technical performance,environmental quality, sustainability. The usefulness of theseindicators is multifarious. They permit evaluations of thegovernment performance, comparisons between countries andother entities and are an important information instrument forthe society. Summarized revisions on the state of the art ofcomposite indicators can be found at (Saisana and Tarantola1;Hagerty2; OECD,3; Sharpe4 , Malik5).
While the terms indicator and index are usedinterchangeably in the scientific literature, in the followingthe term “index” will be used simultaneously for compositeindicators.

The controversial discussion about composite indicatorsturns out already apparent taking a look at the definitions.According to the glossary of statistical terms of the OECD6 “acomposite indicator is formed when individual indicators arecompiled into a single number, on the basis of an underlyingmodel of the multi-dimensional concept that is being measured.Composite indicators measure multi-dimensional concepts whichcan not be captured by a single indicator”.
A more mechanistic definition is found in a researchdocument entitled “Knowledge Economy Indicators”, sponsored bythe European Commission: “By an index or composite indicatorwe mean a mathematical combination (or aggregation as it istermed) of a set of single indicators ( KEI¨7).
According to Saisana and Tarantola1 “Composite indicatorsare based on sub- indicators that have no common meaningfulunit of measurement and there is no obvious way of weightingthese sub indicators” The conflicting views about composite indicators turnevident in an OECD paper entitled “Composite indicators – thecontroversy and the way forward” (Saltelli8) where compositeindicators are seen “as confusing entities whereby apples andpeers are added up in the absence of a formal model orjustification”.
Andrew Sharpe4 in its “Literature Review of Frameworks forMacro-indicators” gives a clarifying picture about thesituation in the indicators research community, when he saysthat there is a fundamental division between those whoaggregate indicators into a composite indicator and those whodo not.
Sharpe notes: “The aggregators believe for two majorreasons there is value in combining in some manner to producea bottom line. First, they believe such a summary statisticcan indeed capture reality and is meaningful. Second, theystress that bottom lines are extremely useful in garneringmedia interest and hence the attention of policy makers. Thenon aggregators believe one should stop once an appropriateset of indicators has been created and not go the further stepof producing a composite index. Their key objection to
2
2

aggregation is what they see as the arbitrary nature of theweighting process by which the variables are combined”.
The pros and cons on composite indicators can be summedas follows (Box 1) (Saisana and Tarantola1; EuropeanCommission9):
Box 1. Pros and Cons of Composite Indicators
Pros Cons Summarize complex or
multi-dimensionalissues, in view ofsupporting decisionmakers.
Easier to interpret thantrying to find a trendin many separateindicators.
Facilitate the rankingof countries on complexissues.
Allows assess progressof countries overtime oncomplex issues.
Reduce the size of a setof indicators or includemore information withinthe existing size limit.
Place issues of countryperformance and progressat the centre of thepolicy area.
Facilitate communicationwith general public andpromote accountability.
May send misleading, non robustpolicy messages if they are poorlyconstructed or misinterpreted
May invite simplistic policyconclusions.
May be misused, e.g., to support adesired policy, if the constructionprocess is not transparent and lackssound statistical and/or conceptualprinciples.
May disguise serious failings in somedimensions and increase thedifficulty of identifying properremedial action.
May lead to inappropriate policies ifdimensions of performance that aredifficult to measure are ignored.
The construction of CI involvesstages where judgments have to bemade: the selection of sub-indicators, choice of model,weighting indicators and treatment ofmissing values, etc.
Aggregation denotes trade offsbetween indicators. A shortcoming ofone indicator can be compensated byanother, a pitfall, mainly when theinvolved indicators representdifferent dimensions.
As seen in the above balance composite indicators areeasier to understand than a number of individual indicators.
3
3

On the other hand there are some pitfalls in the constructionprocess that may reduce the validity of an index. There arestages of subjective judgments, when selecting the indicators,treating the missing data, defining the weights of theindicators and deciding about the aggregation process. Thisturns the results to be subjective too and consequentlydeclines their validity. In order to augment the acceptance ofan index by the user the construction process must betransparent and feasible for verification.
The main steps and the most frequent critics of indexconstruction are (Giovannini10):
The theoretical framework: The starting point is thedefinition of a sound theoretical framework for thephenomenon to be measured. Many composite indicators arenot based on a more general accepted concept (Hagarty2).
Selecting variables: The selection should be based onwhat is desirable to measure and not which indicators areavailable. The indicators should be relevant, accessibleat a low cost, be transparent, have analytical soundness,be sensitive to changes and dispose time series. One ofthe mayor problems is the lack of data, mainly ininternational surveys. The lack of relevant global datais compensated by surveys or estimates or otherstatistical procedures (HDR11; Giovannini10; Freudenberg12).The methods for dealing with missing data are deletion orimputation. In the last case values are imputed withstatistical methods, like substitution of mean, median,regression analysis or other more sophisticatedinstruments. The results will be less sound compositeindicators.
Normalization of data: As indicators to compose an indexoften are measured in different units, thereforenormalization is necessary. This procedure transforms theindicators to a common scale with a mean of zero and astandard deviation of one. The normalization method
4
4
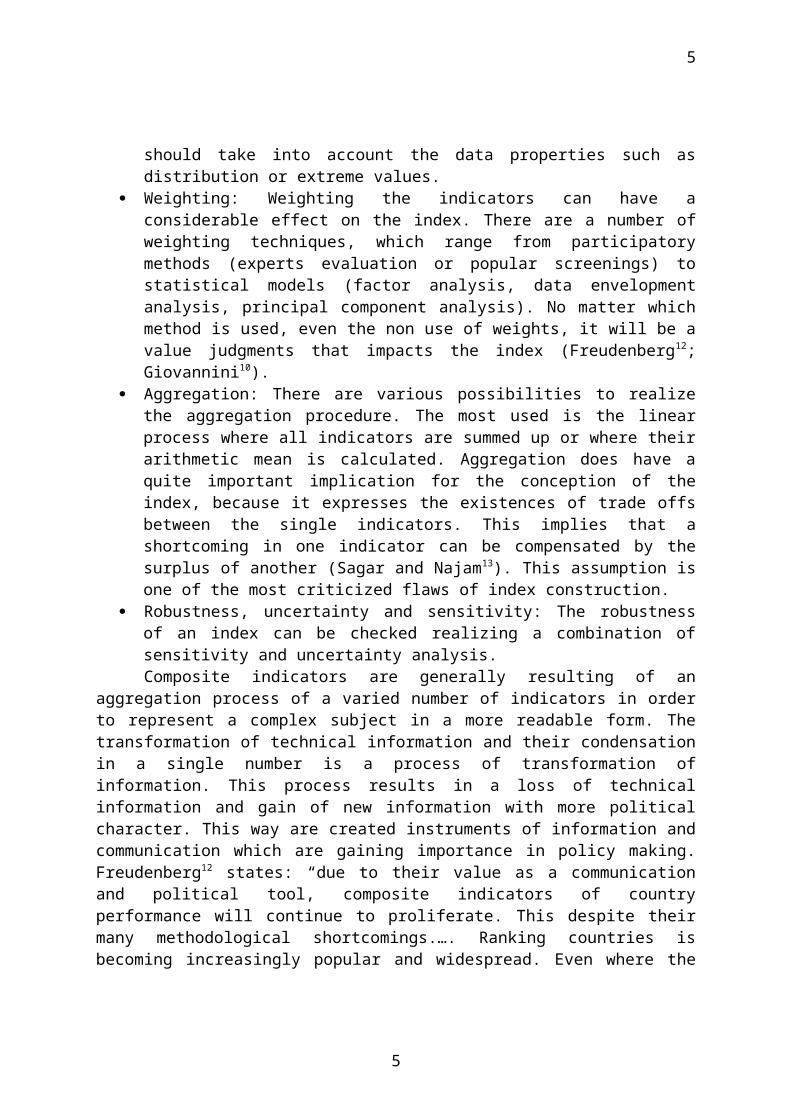
should take into account the data properties such asdistribution or extreme values.
Weighting: Weighting the indicators can have aconsiderable effect on the index. There are a number ofweighting techniques, which range from participatorymethods (experts evaluation or popular screenings) tostatistical models (factor analysis, data envelopmentanalysis, principal component analysis). No matter whichmethod is used, even the non use of weights, it will be avalue judgments that impacts the index (Freudenberg12;Giovannini10).
Aggregation: There are various possibilities to realizethe aggregation procedure. The most used is the linearprocess where all indicators are summed up or where theirarithmetic mean is calculated. Aggregation does have aquite important implication for the conception of theindex, because it expresses the existences of trade offsbetween the single indicators. This implies that ashortcoming in one indicator can be compensated by thesurplus of another (Sagar and Najam13). This assumption isone of the most criticized flaws of index construction.
Robustness, uncertainty and sensitivity: The robustnessof an index can be checked realizing a combination ofsensitivity and uncertainty analysis. Composite indicators are generally resulting of an
aggregation process of a varied number of indicators in orderto represent a complex subject in a more readable form. Thetransformation of technical information and their condensationin a single number is a process of transformation ofinformation. This process results in a loss of technicalinformation and gain of new information with more politicalcharacter. This way are created instruments of information andcommunication which are gaining importance in policy making.Freudenberg12 states: “due to their value as a communicationand political tool, composite indicators of countryperformance will continue to proliferate. This despite theirmany methodological shortcomings.…. Ranking countries isbecoming increasingly popular and widespread. Even where the
5
5
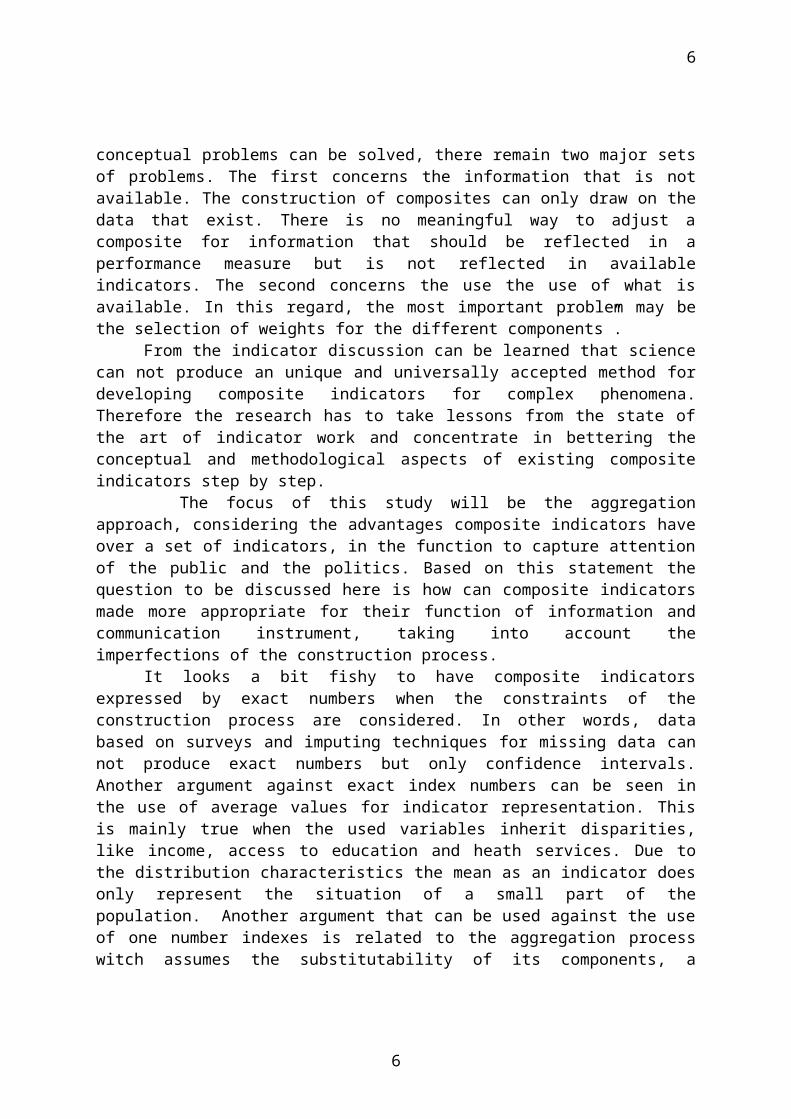
conceptual problems can be solved, there remain two major setsof problems. The first concerns the information that is notavailable. The construction of composites can only draw on thedata that exist. There is no meaningful way to adjust acomposite for information that should be reflected in aperformance measure but is not reflected in availableindicators. The second concerns the use the use of what isavailable. In this regard, the most important problem may bethe selection of weights for the different components”.
From the indicator discussion can be learned that sciencecan not produce an unique and universally accepted method fordeveloping composite indicators for complex phenomena.Therefore the research has to take lessons from the state ofthe art of indicator work and concentrate in bettering theconceptual and methodological aspects of existing compositeindicators step by step.
The focus of this study will be the aggregationapproach, considering the advantages composite indicators haveover a set of indicators, in the function to capture attentionof the public and the politics. Based on this statement thequestion to be discussed here is how can composite indicatorsmade more appropriate for their function of information andcommunication instrument, taking into account theimperfections of the construction process.
It looks a bit fishy to have composite indicatorsexpressed by exact numbers when the constraints of theconstruction process are considered. In other words, databased on surveys and imputing techniques for missing data cannot produce exact numbers but only confidence intervals.Another argument against exact index numbers can be seen inthe use of average values for indicator representation. Thisis mainly true when the used variables inherit disparities,like income, access to education and heath services. Due tothe distribution characteristics the mean as an indicator doesonly represent the situation of a small part of thepopulation. Another argument that can be used against the useof one number indexes is related to the aggregation processwitch assumes the substitutability of its components, a
6
6

critical point when multidimensional indexes are constructed(Freudenberg12).
The objective of this article is to contribute to theimprovement of the quality of composite indicators,considering their weaknesses related to data quality,indicator measuring and aggregation process. The aim here isto propose new forms of design for composite indicators thatconsider in their presentation form the weaknesses relatedabove. In order to turn the work more practical the HumanDevelopment Index (HDI) will be used for demonstration.
2 THE HUMAN DEVELOPMENT INDEXHuman development is the process of enlarging people’s
choices. In principle, these choices can be infinite andchange over time. But at all levels of development, the threeessential ones are to lead people for a long and healthy life,to acquire knowledge and to have access to resources neededfor a decent standard of living (HDR16). Human development thusalso reflects human outcomes in these functioning’s andcapabilities. It represents a process as well as an end(HDR14). The concept of human development, as defined by Anan andSen15 is the development of people. Human beings are the realend of all activities, and development must be centered onpeople’s capabilities to enjoy the life they valorize.
To measure the achievements in human development the HumanDevelopment Index-HDI was created to be a summary measure ofhuman development. Its measures the average achievements in acountry in the three basic dimensions of human development(HDR17):
A long and healthy life, as measured by life expectancyat birth.
Knowledge as measured by the adult literacy rate (withtwo thirds weight) and the combined primary, secondaryand tertiary gross enrolment ratio (with one thirdweight).
7
7

A decent standard of living, as measured by GDP percapita (PPP U$).
For each of these dimensions an index is created, based onminimum and maximum values. Performance of a country in eachdimension is expressed as a value between o and 1 by applyingthe formula:
actual value – minimum value Indicator =
maximum value - minimum value
The HDI is then calculated as a simple average of thethree indicators considering the above values:
Table 1: Minimum and maximum values for the indicators of HDI
Criteria for calculating the HDI
Minimum value Maximum value
Life expectancy at birth (years)
25 85
Adult literacy rate (%)Combined gross enrolment ratio (5)
00
100100
GDP per capita (PPP US$).GDP adjusted with the logarithm
1002
40.0004.602
Source: HDR 2005
The HDI has become, since its first publication in 1990,an important alternative to the traditional GDP. Sagar andNajam13 see the great value of the HDR`s in its philosophy ofexpanding the scope of the development debate beyond theeconomic perspective. But the authors claim, on the otherhand, the ability of the HDI to reflect accurately the visionof human development, consequently they see important flaws inthe concept of the HDI. They argue against “folding the threedimensions into a single index”. They believe that theaggregation process does conflict with the notion that all
8
8

three variables are essential for human development andtherefore non substitutable.
Sagar and Najam see in the omission of the inclusion ofan environmental dimension in the index another flaw when theyask: “human development, but at what cost?” An attempt toconsider the sustainability of human development realized byNeumayer18, stated that human development of 42 countries ispotentially unsustainable. There is a lot more of literaturedealing with critics and proposals for bettering the HDI (SeeNoorbakhsh19, Joolands20; Hicks21, Despotis22,Qizilbash23;Akder24;Anan and Sen15, Verdu25).
2.1 What can the Human Development Index really tell us?The HDI in its publication form consists in a ranking of
countries according to the score of the index value. Thevalues varying between 0 and 1 are presented in the form of athree digit number. This presentation gives to the not expertan impression of accuracy and veracity of the number. Byreading the list he will believe that a certain country L withan index IL = 0,789 is better off in human development than thecountry M whose HDI registers only IM = 0,786. If the readerwants to compare the achievements of his country since thelast year and finds a gain of four positions in the ranking hewill be satisfied. A Portuguese e- mail news letter noticed,after the publication of the HDR 2005: Portugal lost oneposition, Luxembourg raised from position 15 to position 4 ,the Nederland’s lost 7 positions and Brazil has climbed upfrom rank 72 to rank 63. There can be find no other, moredetailed information which could clarify the reasons for thesefacts. This type of evaluation of the HDI is quite common.
The reactions over the results are pretty much the same.Countries who bettered their situation feel happy and publishthe notice, while others, who stepped down will study thebackground of the index to find the reasons, and in manycases, they will not agree with the findings and question thedata or the methodology and other proceedings.
Considering the index expert point of view there arestrong reasons of doubt whether the HDI as a three digit
9
9
number is the more adequate form of an index measuring humandevelopment, considering the flaws in the index construction.The reasons for this skepticism are to be seen primarily inthe concept of human development data situation, the use ofthe arithmetic mean as indicator measure and the aggregationprocess with the supposed existence of trade offs between thethree indicators.
The availability of accurate and complete data is one ofthe important quality criteria for indicator work. Thesituation, mainly when data are needed for country comparisonsis quite deficient. Therefore the UNDP seeks in their HDR´s toprovide always better data. But according to their recentreports the actual data situation is still preoccupant.
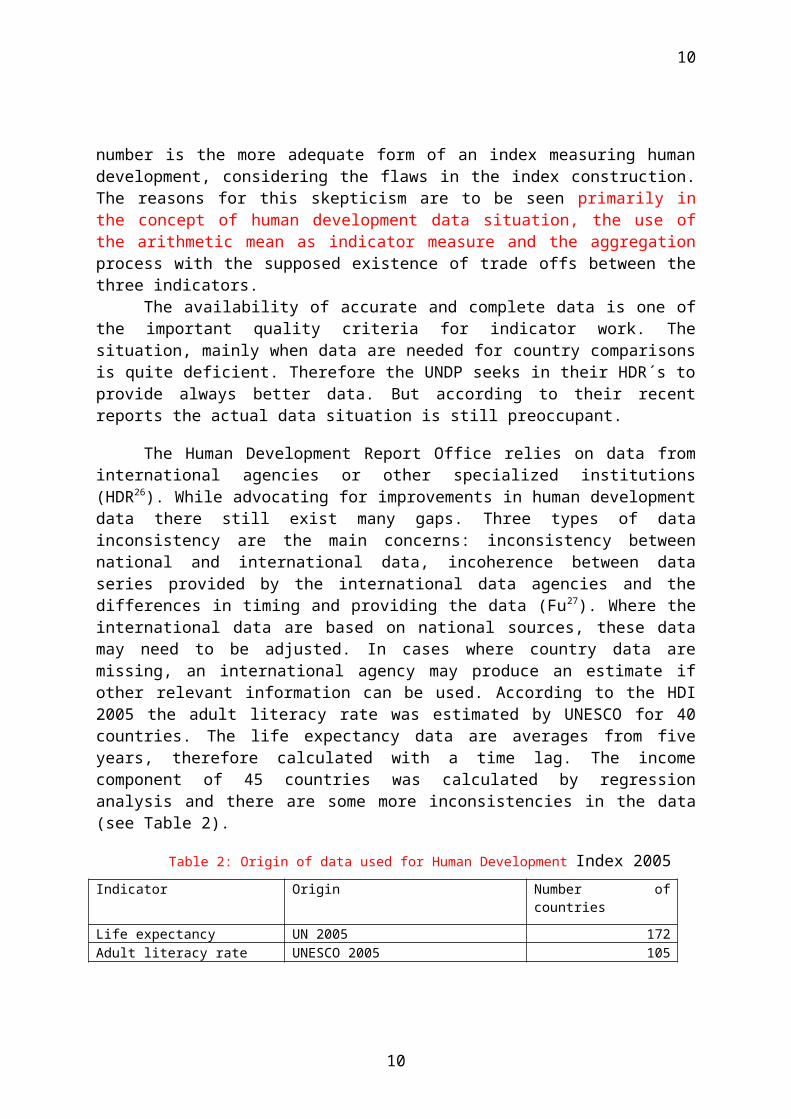
The Human Development Report Office relies on data frominternational agencies or other specialized institutions(HDR26). While advocating for improvements in human developmentdata there still exist many gaps. Three types of datainconsistency are the main concerns: inconsistency betweennational and international data, incoherence between dataseries provided by the international data agencies and thedifferences in timing and providing the data (Fu27). Where theinternational data are based on national sources, these datamay need to be adjusted. In cases where country data aremissing, an international agency may produce an estimate ifother relevant information can be used. According to the HDI2005 the adult literacy rate was estimated by UNESCO for 40countries. The life expectancy data are averages from fiveyears, therefore calculated with a time lag. The incomecomponent of 45 countries was calculated by regressionanalysis and there are some more inconsistencies in the data(see Table 2).
Table 2: Origin of data used for Human Development Index 2005Indicator Origin Number of
countriesLife expectancy UN 2005 172Adult literacy rate UNESCO 2005 105
10
10

Estimate by UNESCO produced2002Data refer to other yearValue applied 99%
412535
Gross enrolment rate UNESCO 2005Preliminary UNESCO estimateData refer to other years
827611
GDP per capita World Bank 2005Estimate based on regressionData refer to other years
1134514
Source: HDR 2005
Data limitations for income measures are threefold.National data are incomplete, or revised frequently. Resultsof surveys between the World Bank, United Nations and MonetaryFund differ at the national level and the transformation ofthese data to an international comparable form, using theParity of Purchase Power (PPP) criteria, is stillunsatisfactory.
The data accuracy is an important criterion of dataquality. As most national data come from sample surveys andrepresent estimates of national data they are imputed witherrors. The errors can be divided between sample errors, whichcan be calculated and the unknowable non sampling errors(Akrididis28). As the true value of an estimated data is notknown the accuracy is also unknowable. While sample errors canbe calculated by statistical methods, it is very difficult andcostly to calculate the non sampling errors (Bailar29).According to data type and proceedings data have differentdegrees of accuracy.
In the literature the question of sample errors istreated often, but it is hard to find statistical analysisabout the accuracy of the data. Murray30 shows e.g. that theestimations of the GDP of Liberia for 1981 between the datafrom UN, Word Bank and FMI differed about 25%. Despite of muchprogress in recent years, the data problems remain substantialand still affect the quality of the international statisticsat a large extent. Lind31 estimated that the bias of censussurveys can vary, according to the situation of a country,over 5% in population estimates. For the HDI he states, as the
11
11

most developed countries do have very close index values,already one per cent of error turns the country rankingmeaningless.
Considering the data situation of HDR 2005 as shown inTable 2 it is apparent that the HDI values have to beconsidered as data with uncertainty. According to Nardo32 “theuncertainty in the imputed data should, be reflected byvariance estimates”. This procedure should be applied to allsurvey data and analysis should be done how these errorsimpact on the resulting index.
While the data problem persists there will be aquestioning of the actual presentation of the HDI. Howaccurate is the index? Should the HDI not have another shape?Foster and Sen33 take it at the point when they say: “if aconcept has some basic ambiguity…., then a preciserepresentation of that ambiguous concept must preserve thatambiguity, rather than try to remove it through some arbitrarycomplete ordering”.
In order to reinforce this position of the ambiguousconcept of the HDI it will be shown in the case of Brazil howdata variations on the input side affect the HDI output. Thedata situation in Brazil has improved to a great extent, butas said for the international level also on the national onestill persist flaws. In household income studies, the richones often reveal lower revenues because they fear the taxcollection office. The education data prepared by themunicipalities are considered to be overestimated because theyreceive funds from the State Governments according to thenumber of students registered. Another argument which may beused against the single number representation is related tothe disparities that exist in Brazil (and in other countriestoo) in income, access to education and health services. Dueto these large disparities e. g in income (Gini = 59,3) it canbe asked how representative is the mean household income of R$1366 (2004) when 76,6% of the households get as average lessthan half of that value (R$ 615), while 23,4 % of the richones have a mean income 5,5 times higher (R$ 3.365)?
12
12

2.2 The Human Development Index for BrazilBrazil with a HDI= 0,792 (HDR 2005) is considered as a
country of medium human development. But within the countrythere are significant disparities among regions, states,municipalities, races, genders and urban and rural areas, asthe Atlas for Human Development of Brazil34 shows. In order toillustrate the situation some examples are presented in Table3. Considering the individual states, Maranhão registers thelowest level, figuring in the lower part of medium humandevelopment (HDI-M = 0,636) while the Federal Districtregisters high human development (HDI-M = 0,844). The reasonfor this differences are mainly due to income, which isalmost 6 times higher in the Federal District than inMaranhão, but education and life expectancy also varyconsiderable.
Table3: Human Development Index for selected states and municipalities -Brazil 2000
HDI- M Lifeexpectan
cy
(years)
Adultliteracy rate
(%)
Enrolment ratio 1o, 2o, 3o schools
Incomeper capita
(R$)Brasil 0,766 68,6 86,4 81,9 297StateFederal District (center)Santa Catarina (south)São Paulo (south– east)Amazonas (north)Maranhão (north - east)
0,8440,8220,8200,7130,636
70,473,771,266,561,7
94,393,793,484,571,6
92,084,483,575,078,2
605349443174110
MunicipalitySão Caetano do Sul (SP)Curitiba (PR)Salvador (BA)Manari (PI)
0,9190,8460,8050,343
78,271,669,655,7
97,096,690,243,0
98,690,489,8
77,7
83462034130
13
13

Source: Atlas de Desenvolvimento Humano do Brasil 2000At municipality level the disparities are even greater.
Here all three levels of human development are present. SãoCaetano do Sul, a city in the metropolitan area of São Paulohas the highest HDI (HDI-M = 0 919), a value similar toGreece. Manari a municipality in the state of Piauí remains onthe other end of the development list (HDI -M= 0,343), a valuewhich can be compared to the less developed countries inAfrica. The life expectancy is only 55,7 years, below the wordmedium (67,1) and the literacy rate is only 43% of the adultpopulation, while in São Caetano almost all adults can writeand read. The biggest difference is again the incomecomponent. While in São Caetano do Sul the medium householdincome is 28% higher than the national mean, Manari with itspoor economic base does register only 10 % of the averagevalue of Brazil. The income difference between these twomunicipalities is almost 300 %, showing the clear evidence ofthe income disparity of Brazil, which is one of the largestbetween all countries (G= 59,3).
Comparing the national averages with the spatiallydisaggregated figures its turns out that the national mean isnot a representative measure. This aspect has been studied byHicks21 who tried to incorporate disparity in the three humandevelopment indicators by using the Gini coefficient. Thedisparity situation can be used as an argument against the useof exact numbers in the HDI.
2.3 How data constraints affect the values of the HumanDevelopment index
Based on the argument that data contain errors and theycan not be estimated exactly, a simulation procedure wasrealized using the data of the HDI for Brazil. The simulationexercise was done because there where no real information ondata errors available. The impacts of data errors on the HDIof Brazil are summed up in table 4. The first observation tobe made concerns the ranking. Considering a reduction of allthree variables by 2%, Brazil would fall from rank 63 to rank
14
14

73. With 5% less the country would loose 26 positions andfigure at rank 89. In case of the underestimation of the real(but unknown) values by 5% Brazil would gain 9 positions andwould therefore be considered a country with high humandevelopment. Concluding can be said that already smallvariation of the input data will change the value and theposition of a country in the ranking of human development(Table 4).
Table 4: Simulation of data variation for Human Development Index Brazil -2005
Variation(%)
Lifeexpectancy
(%)
Adultliteracyrate (%)
Grossenrolmentratio (%)
Income(PPPUS$)
HDI Rank
0 70,5 88,4 91 7790 0,793
63
+1
+2
+5
+10
71,2
71,9
74,0
77,6
89,3
90,2
92,8
97,2
91,9
92,8
95,6
100,1
7868
7946
8180
8569
0,800
0,808
0,830
0,876
58
55
52
32
-1-2-5-10
69,869,167,063,5
87,586,684,079,6
90,189,286,581,9
7712763474007011
0,785
0,778
0,755
0,718
697389108
---
69,570,570,5
88,487,488,4
919091
779077907400
0,787
0,789
0,79
666666
15
15

0Source: author, based on data of HDR 2005Table4: Simulation of data variation for Human Development Index Brazil - 2005
The authors of the HDI consider the three indicators ofequal importance for human development. While this assumptionis criticized by many authors Biswas35, Chen36, there is paidless attention to study the statistical relations between theinput indicators. Although it is defined that health,education and income are considered crucial factors for peoplemake their choices, it is important to see whether thesevariables are interrelated or not, or to what extent.
It is widely accepted that education is an importantfactor for better jobs and therefore higher incomes. Educationand life expectancy certainly are also interdependent.Educated people care more about preventive healthcare and morewealthy people can afford better schools and health services.Certainly all three indicators are interrelated, but thequestion is to what extent. On one hand the causality argumentsays that these factors are considered essential to improvehuman development, on the other hand the statistical argumentwould consider the variables redundant if they would be highlyinterrelated.
The cross correlation statistics between the threecomponents of HDI 2005 applied for 177 countries reveals thatthere is almost the same degree of correlation between thevariables. Between GDP and education on one hand and lifeexpectancy the correlation coefficient is respectively 0,76and 0,77, only slightly higher than between education and thehealth indicator r = 0,68 (Table 5).This means that thevariance of one factor explains between 53% and 59% of thevariation of the other variables.
Table 5: Correlation coefficients between the three indicators of HDI - applied on 17 countries
Expectancy of life index
Education index
GDP index
Expectancy of life 1
16
16

indexEducation index 0,7297 1GDP index 0,7655 0,7582 1Source: data HDR 2005
These statistical findings turn out clear whenconsidered the classification of the countries according totheir degree of human development (table 6). According toHDR26, 57 countries are considered of high development but 105countries have high educational level, while the incomecriteria registers only 46 countries in this group. The lowhuman development index class registers 32 countries, but forincome 44, while low education is presenting only 19 nations.
Table 6: Country classification according to the level of humandevelopment
Classification
criteriaHDI
HDI Lifeexpectancy
index
Education Index
GDP index
High human development
≥ 800 57 58 105 46
Médium human development
800> x ≥500
88 81 53 87
Low human development
> 500 32 38 19 44
Countries 177 177 177 177
Source: HDI 2005
The existence of different patterns of human development,on country level, is quite evident considering the separaterankings of the 177 countries for life expectancy, educationand income as shown in table A1 (annex). Hong Kong, ranked onposition 22 for HDI, registers the second highest lifeexpectancy, while its education level is down on position 72.Saudi Arabia in position 77 has an elevated GDP index ranked
17
17
44 and an extremely low education level on rank 126, while thelife expectancy index equals almost its HDI position. Anexample of a country which represents all three levels ofhuman development is Tajikistan (rank 122), considered ofmedium human development. Disaggregating the HDI into thethree indicators, Tajikistan can be classified, in educationas high developed (rank 42), and in life expectancy as medium(rank 118) and in income as low developed (158). These andother examples make clear that there is not necessary astraight relation between the magnitudes of the HDIindicators, but there exist different development patterns(Table 6 and A1).
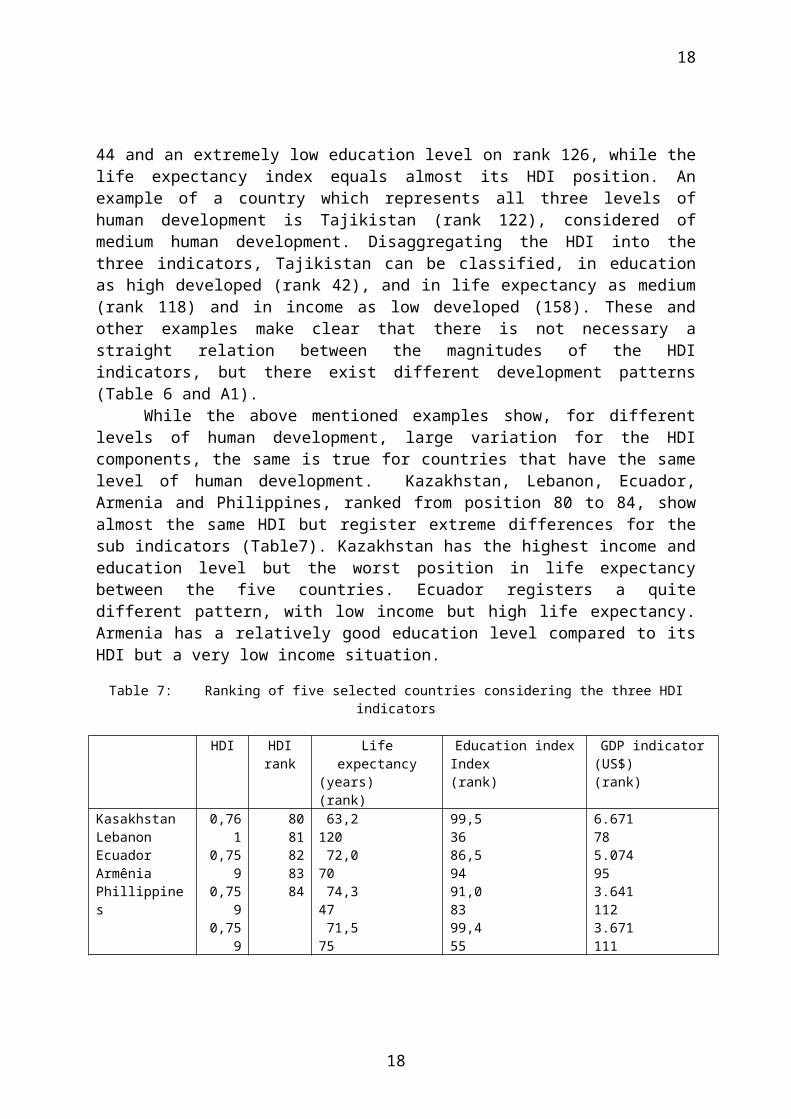
While the above mentioned examples show, for differentlevels of human development, large variation for the HDIcomponents, the same is true for countries that have the samelevel of human development. Kazakhstan, Lebanon, Ecuador,Armenia and Philippines, ranked from position 80 to 84, showalmost the same HDI but register extreme differences for thesub indicators (Table7). Kazakhstan has the highest income andeducation level but the worst position in life expectancybetween the five countries. Ecuador registers a quitedifferent pattern, with low income but high life expectancy.Armenia has a relatively good education level compared to itsHDI but a very low income situation.
Table 7: Ranking of five selected countries considering the three HDIindicators
HDI HDIrank
Lifeexpectancy
(years) (rank)
Education indexIndex (rank)
GDP indicator(US$) (rank)
KasakhstanLebanonEcuadorArmêniaPhillippines
0,761
0,759
0,759
0,759
80 81828384
63,2 120 72,0 70 74,3 47 71,5 75
99,5 3686,5 9491,0 8399,4 55
6.671 785.074 953.641 1123.671 111
18
18

0,758
70,5 87
92,6 63
4.321 103
Source: HDR 2005
It is true, that the aim of human development is toachieve, for all countries, the highest index or the level ofthe most developed country. But it seems that there aredifferent ways to reach that goal. The statistical analysisshows quite clear that there is no uniform pattern for a stageof human development. This can be interpreted in the sensethat some countries are more efficient in their efforts toimprove the living conditions of their people then others.This gives reason to extent the human development analysis toall three indicators and to treat them as significant and notsubstitutable indicators for human development.
3 HOW CAN THE HUMAN DEVELOPMENT INDEX MADE BE LESSAMBIGUOUS?
Composite indicators must be able to communicate apicture about a certain issue to decision-makers and otherend-users in an easily understandable and accurate way. Theprinciple for the design of an alternative Human DevelopmentIndicator is based on the principle that the quality of theoutput can not be better as the correspondent input.
Therefore two main questions have to be made about adequateindex construction:
1. What characteristics a composite indicator should have tobecome an effective information and communication tool,easy to be understood?
2. What characteristics a composite indicators, like theHDI, could have, considering the facts and constraintsexisting in quantitative research in social andenvironmental science?
The premise for this undertaking should be as Einstein said:“Every thing should be as simple as possible, but notsimpler”. The strategy for index construction issimplification, in order to create a new type of information,
19
19

but there are limits for that. The quality of this informationgeneration process depends narrowly from the characteristicsof the input data. In other words, the accuracy of the indexnumbers can not be more precise than the sources used for itsconstruction. Due to the considerable merits the concept ofhuman development has gained, in counter position to the GDP,as a measure of development, the position embraced here is tokeep the actual conception of human development as it is, buttry, with new design ideas, to turn the HDI more adequate toits data restrictions.
The literature offers a variety of representation forms forcomposite indicators (Giovaninni10)
Tabular format: the simplest way to represent numericalinformation. The index and its correspondent indicatorsare displayed for countries in decreasing order. Modelused for the HDI;
Statistic graphics : Bar charts : the value of the indexis expressed via a bar chart. This permits to compare thecountries performance in relation to another units oraverages. Line charts are mainly used for time series andcomparisons of development patterns between countries.
Traffic lights: instrument to show progress. For eachindicator or index one of the three traffic light colorsis associated according to its progress: green meanssignificant progress, yellow reveals no significantchange, red signalizes change, but in other direction notthe intended.
Rankings: An easy to understand way for countryperformance. But it does not reveal the differences ofperformance between the countries.
Dashboard: is a graphical visualization of an index,representing various situations (e.g. economic, socialand environmental performance), where the importance ofan indicator is measured by the size of its segment in acircle and the performance by colors similar to thetraffic lights model.
20
20
Spider diagram: Can be used for the presentation andcomparison between few countries, when the performance ofvarious indicators is intended.
Four sided pyramid: For four selected areas the situationaccording to degree of sustainability is represented.Colors define the degree of sustainability.
Cluster of sub-indicators: Each indicator to compose theindex is represented separately as a one number digit (0-10) according to the degree of attainment of the target.Then the individual indicators are grouped together (see3.1.1).
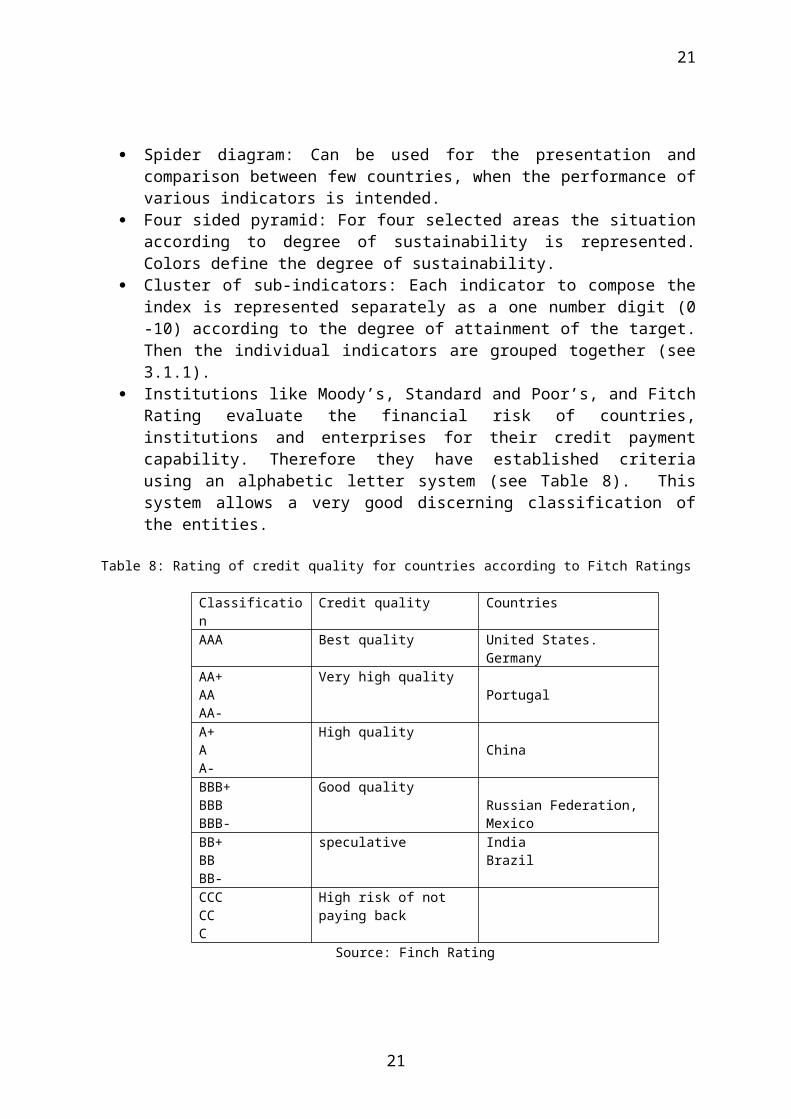
Institutions like Moody’s, Standard and Poor’s, and FitchRating evaluate the financial risk of countries,institutions and enterprises for their credit paymentcapability. Therefore they have established criteriausing an alphabetic letter system (see Table 8). Thissystem allows a very good discerning classification ofthe entities.
Table 8: Rating of credit quality for countries according to Fitch Ratings
Classification
Credit quality Countries
AAA Best quality United States. Germany
AA+AAAA-
Very high qualityPortugal
A+AA-
High qualityChina
BBB+BBBBBB-
Good qualityRussian Federation, Mexico
BB+BBBB-
speculative IndiaBrazil
CCCCCC
High risk of not paying back
Source: Finch Rating
21
21
3.1 NEW DESIGN OPTIONS FOR COMPOSITE INDICATORSThe selection of new design models for composite
indicators was based on the criteria that they shouldconsider the defaults of the HDI and could be applied oninter cross analysis for a large number of countries. Thegraphic models were not considered because they are lessunderstandable when applied for a large number of countries.The options left will be discussed and tested for the data ofHDI 2005.
3.1.1 The HDI as a bundle of the three human development components
The finality of the HDI is to show to the public and thepoliticians how the countries are improving in humandevelopment. As the actual form of HDI gives only summaryinformation, the more interested person has to take a look inthe HDR to see the performance of the three components of theHDI. Considering the data constraints and the critics relatedto the aggregation process it seems quite useful to constructan index which considers these facts and which simultaneouslycan inform about the performance of the HDI components.
The procedure for this design starts from the definitionof a scale for the individual indicators, similar to the oneused in the HDI. Instead of variations between zero and one,the scaling will be from zero to ten. Let’s take an example.Lebanon has a HDI = 0,759 and indicator values for lifeexpectancy of IL = 0, 78, education Ie = 0, 84 and income II =0,66 . The indicators are transformed in a set of ten. Thiscreates a new indicator set with IL = 7, IE = 8, II = 6. Thethree indicators are grouped into a single number and thiscreates a new HDI, which takes now the form HDI- r = 786.
What information can be taken from this index? The HDI~r= 786 points out that Lebanon has reached between 70 and 79%of the maximum value for life expectancy, 80 to 89 % of theeducation level, but only 60 to 69% of the maximum income
22
22

level. This constellation makes clear that Lebanon has arelatively good education level, but still a poor incomesituation. Table 9 shows some examples of countries withdifferent performances in the HDI components. As manycountries do have different development pattern in the threehuman development dimension (see table A2 in the annexes) thisform of index is quite informative for comparisons, but is notperfect. One of the arguments against this shape could be hisrelative reduced precision. But for the politician this indexgives a valid information in two directions:
how far his country is from the best country performanceand
what is the actual development level reached in thefields of human development.
Another argument against this presentation form may berelated to the sequence the indicators are grouped in theindex. A not expert would mean that country A with an indexHDI –r = 876 is better off than country B who’s HDI-r is =788. But this doubt can be cleared by the legend of the index.Besides the impression to be less precise, this index doesconsider the data reality, what is not the case with theactual form of HDI.
Table 9 gives some examples that make clear theinterpretation advantages the HDI~r has against thetraditional HDI, e.g. it is possible to define separatecriteria for all three components. Considering theclassification criteria of HDI, Poland, considered a countryof high human development, shows high development only for thehealth and education indicator, while the income is consideredonly of medium level. Another example to illustrate thebenefits of the new design is Lesotho, a country classified aslow developed, but whose education and income level areconsidered of medium level. Besides these advantages oneproblem still remains: the classification criteria aresubjective. A complete list of all countries classifiedaccording to HDI~r criteria can be found in the annexes tableA1.
23
23

Table 9: Human Development Index, Life expectancy, education and incomeindicator for selected countries
rank Country HDILife
expectancy
Education
indicador
GDPindicat
orHDI~r
High humandevelopment
3649
PolandSaint Kitts
0,858
0,834
87
99
78
897798
Medium human development
6681109110131
GrenadaLebanonKyrgyzstanIndonésiaBotswana
0,787
0,766
0,702
0,697
0,565
67661
98987
76457
697786694685177
Low human development
149157165
LesothoSenegalMalawi
0,497
0,458
0,404
152
636
543
165534263
Source: HDR 2005
3.1.2 The construct of the HDI~α
The feature of the HDI~α is the representation theachievements of human development by alphabetic letters. Theconstruction of the HDI~α permits many options for countryclassifications. This can attend scientists for research aswell as politicians who want to define programs for humandevelopment. The construction may follow these basic steps:
1. Definition of the purpose: As there are many optionsfor classifications it is very important to defineclearly for what purpose the classification will be used.This is the first step of the procedure. The basic line
24
24

for this may just be the ranking of countries accordingto their development pattern or according the (world)average. Other options can be a benchmark, a politicaltarget or the UN millennium goals. 2. Grouping the countries: the aim is to cluster thecountries with similar characteristics in a specificclass. This can be done in a narrow or broader fashion,depending what will be studied. Anyway it will be asubjective definition but this can be accepted whenjustified in view of the intents of the study. Theclassification can be done differently for all variablesto integrate the index.3. Scaling the indicators: This procedure will transformthe numerical values into a certain symbols. Thereforeall numerical values classified in a certain class willget a unique “value”. The aim is to create an ordinalclassification of countries in the sense of decreasingvalues. The symbols for this classification are derivedfrom the alphabet. Similar to the classification schemeused by the credit risk classification companies, thesequence of performance, will accompany the alphabet. Theletter “a” will classify the highest level, the letter“b” the second highest and so on. The number of classesand their limits can be chosen by the researcher andshould vary according to the aim of the study.4. Multiplication of scaling for all variables: In orderto get more information from the data base andconsidering that all three HDI components are consideredimportant for human development, they are classified andevaluated separately.5.Presentaion of the HDI~α: considering the default ofthe aggregation process that the shortcoming of oneindicator can be compensated by the surplus of another,the HDI-α will be presented it the form of a threeletter symbol e.g. HDI~α = aab. This structure permits toanalyze the index as a unity and as a composition ofthree components.
25
25

3.1.3 Testing the HDI-αThe conception of the HDI~α was tested for the data of
the HDR 2005. The 177 counties were grouped, according totable 10 in four classes using the world mean as basis. Twoupper groups were formed above the mean and two under thismeasure. The selection of the class limits can be done in manyways, according to the objective of the study as distance tothe mean, to targets, to benchmarks or other reference values.This procedure, besides being also subjective to a certainextent, is based on development criteria and not, like thecriteria used for HDI only on statistical values.
Table 10: Classification of countries in four classes according to the wordmean values
Criteria for HDI~α
Classification
criteria*)
Lifeexpectancy(years)
EducationIndex(%)
Income
(US$ PPP)
High human development a
x ≥ 75 x ≥ 0,9
x ≥ 20.000High medium human development
b 75> x ≥ 67,2*)0,9> x ≥0,777*)
20.000 > x ≥8.229*)
Low medium human development
c 67,1> x ≥60 0,77> x ≥0,60
8.229 > x ≥2.000
Low human development d 60 > x 0,60> x
2 000 > x*) world mean values, source: HDR2005
The picture of human development using HDI~α is quite avaried one. A summarized view can be seen in table11. At afirst glance its turns out, that there is an inverteddistribution between health and education attainment on oneside and income level on the other. More than 60% of thecountries have values for life expectancy and an educationabove the world mean, while only one third of the countries
26
26
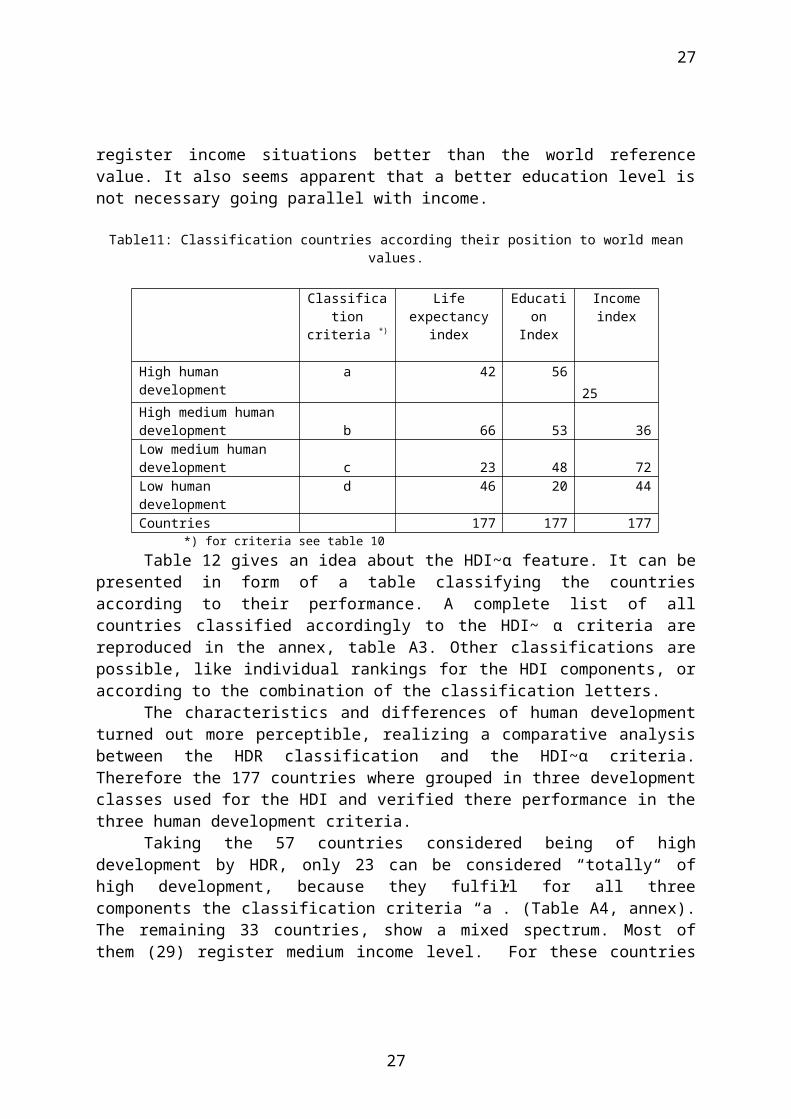
register income situations better than the world referencevalue. It also seems apparent that a better education level isnot necessary going parallel with income.
Table11: Classification countries according their position to world meanvalues.
Classifica
tioncriteria *)
Lifeexpectancy
index
Education
Index
Incomeindex
High human development
a 42 56 25
High medium human development b 66 53 36Low medium human development c 23 48 72Low human development
d 46 20 44
Countries 177 177 177 *) for criteria see table 10
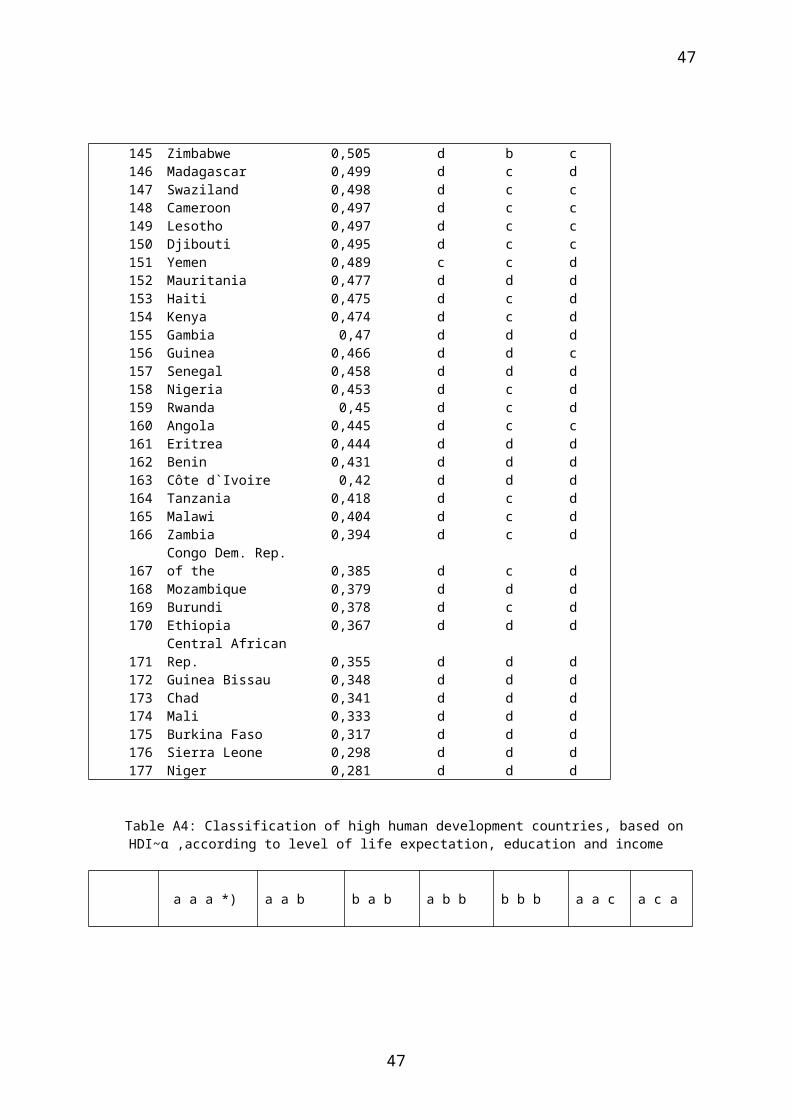
Table 12 gives an idea about the HDI~α feature. It can bepresented in form of a table classifying the countriesaccording to their performance. A complete list of allcountries classified accordingly to the HDI~ α criteria arereproduced in the annex, table A3. Other classifications arepossible, like individual rankings for the HDI components, oraccording to the combination of the classification letters.
The characteristics and differences of human developmentturned out more perceptible, realizing a comparative analysisbetween the HDR classification and the HDI~α criteria.Therefore the 177 countries where grouped in three developmentclasses used for the HDI and verified there performance in thethree human development criteria.
Taking the 57 countries considered being of highdevelopment by HDR, only 23 can be considered “totally“ ofhigh development, because they fulfill for all threecomponents the classification criteria “a”. (Table A4, annex).The remaining 33 countries, show a mixed spectrum. Most ofthem (29) register medium income level. For these countries
27
27

the low income level is compensated by a high educationstandard.
Table12: Classification of selected countries according criteria of HDI~α
Country HDI HDI~α Lifeexpectancy
index
Education index
Incomeindex
NorwaySpainPortugalArgentinaMexicoBulgariaBrazilBelarusSouth AfricaIndiaHaitiEthiopia
0.9630,9280,9040,8630,8140,8060,7920,7860,6580,6020,4750,367
aaaaaaaabbababbbacbbcbacdbbcccdcdddd
aaababbbdcdd
aaaabababccd
aabbbcccbcdd
Source: author, data base don HDR 2005
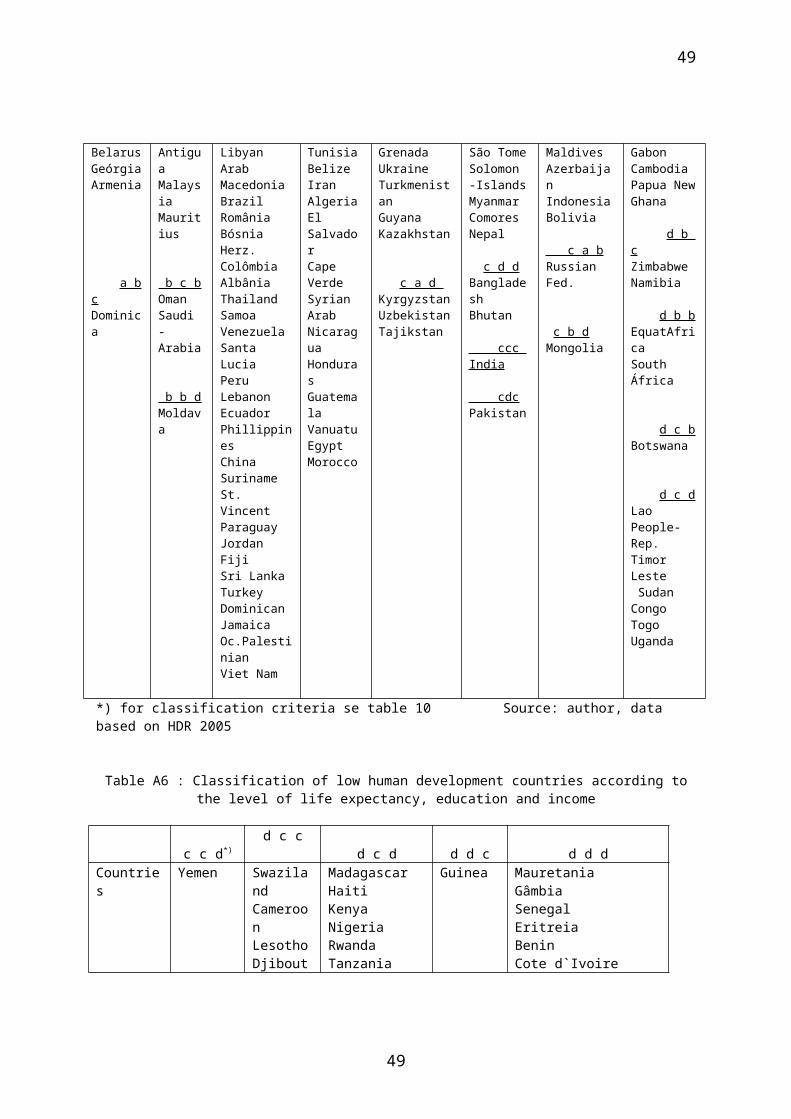
The group of the medium ranked countries (HDI),totalizing 88 unities, shows quite diversified situations.There are two main observations to be made here. First, theincome of almost all of these countries lays, with anexception of 6 countries, under the word mean of US$ 8.229.Second, there are 15 countries whose life expectancy is below60 years, which means low development pattern. Anotherobservation concerns about the east European countries whichformed the Soviet Union. The Russian Federation and nine ofthe now independent republics show high education patterns,which contrast to the low income values. (Table A5 in annex)
The low human development class is, with one exception,composed by 31 non Arab countries, located all in Africa. Thebiggest group, formed by 15 countries, shows very low valuesin all HDI components and can therefore be considered as thepoorest countries of the world. Another group of 6 countries
28
28
shows a very low expectancy of life, which contrasts with themedium income level (table A6, in annex).
These examples show the possibilities the HDI~α offersfor analysis of human development.
The HDI classifies the countries according to theirsummery development patterns, dividing them into threecategories of development, without any substantial criteria.How can it be justified that a country with an HDI above 0,800is developed? The level of human development cannot bemeasured by such numbers who do not have a clarifyingbackground. This article showed that there are many differentpattern of development, which must be considered when takingabout human development. In this sense we do not only shouldpursue our aspiration to enlarge peoples choices to have abetter life, we also have should pursue our aim to enlargeour choices for its measurement.
4 CONCLUSIONS
If the HDR aims to put people back at the center ofdevelopment and the HDI should be the measure for this intent,there are still many open questions to be solved. The HDI hasbeen welcomed as a measure for development in contrast to theGDP. The human development approach and the capability concepthave been discussed to a large extent in the past years andmany critics and suggestion have been made concerning theconception and the methodology used in the creation of the HDIas the “yardstick” of this model. As it was discussed in this article there are manymethodological flaws in the HDI construction which limits thevalidity of the HDI in the actual form. But it is more than astatistical problem when people’s choices are confined in asingle number. Our reality is characterized by greatinequalities which are not only present in the distribution ofincome and wealth but in most facilities of access to theconditions a better life. Many people don’t have access tosafe water to education, to health services and so on.
29
29
Disregarding the increasing inequalities the indicator work isgoing in the opposite direction trying to capture complexsituations or evolutions with single number. What can an indexexpress when used the average is the measure o a certainsubject when the disparities are apparent?
There seem to be two ways out. The first one considersthe inequalities and creates indicator systems composed ofindicators or indexes established for specific groups ofpersons or situations. The second options consider thenecessity to have some general measures which capture, to acertain extent, global characteristics of a country.
The proposal of this article goes in the seconddirection. Based on the data problem and on the fact thataverage values do not say very much were inequality isincreasing, the proposal for the HDI~α was developed and isplaced here for discussion. But as said before, the necessityfor these types of amplified composite indicators is also aright way to go because of the inequalities existing in oursocieties.
The concept presented here can be extended in variousways. There is in the indicator work a discussion about thequestions how to integrate into indicators simultaneouslysituation and tendency. This is mainly important in evaluationanalysis of political and economic projects.
REFERENCES [1] Michaela Saisana , Stefano Tarantola, State of-the-artReport on Current Methodologies and Practices for Composite Indicator Developoment,Joint Research Centre, European Commission, access<farmweb.jrc.cec.eu.int/CI/article_books.htm> .[2] M. Hagarty, et.al., Quality of Life Indexes for NationalPolicy: Review and Agenda for
30
30
Research, Committee for Social Quality of LifeIndexes, ISQLS, (2003).[3] OECD, Aggregated Environmental Índices. Review ofAggregation Methodologies in Use, ENV/EPOC/SE(20001)2/FINAL (2002).[4] Andrew Sharpe, Literature Review of Frameworks for Macro-indicators, CSLS Research Report 2004-03. [5] Adeel Malik, State of the Art in Governance Indicators,HDR Office, Occasional Papers, HDR 2002. (2002), access<hdr.undp.org/docs/publications/background_papers/2002/malik_2002.pdf.>[6] OECD, Glossary os Statistical Terms, access:<stats.oecd.org/glossary>.[7] European Commission, Knowledge Economy Indicators,Workpackage 5, State of the Art on Composite Indicators for the Knowledge-basedEconomy. Access <kei.publicstatistics.net/KEI%2005_1.pdf>.[8] Andrea Saltelli, Michaela Nardo, Michaela Saisana,Stefano Tarantola, Composite Indicators - Controversy and the Way Foreward, (2004), access:< www.oecd.org/dataoecd/40/50/33841312.doc>.[9] European Commission, Knowledge Economy Indicators,Workpackage 5, State of the Art on Composite Indicators for the Knowledge-basedEconomy. Access < kei.publicstatistics.net/KEI%2005_1.pdf>.[10] Enrico Giovaninni, Handbook on Constructing CompositeIndicators, Methodology and User Guide, ,OECD Statistics Working Papers, (2005).[11] UNDP, Human Development Report 2003, Oxford UniversityPress, New York, (2003).[12] Michael Freudenberg, Composite Indicators of CountryPerformance: A Critical Assessment, OECD Science, Tecnology and IndustrieWorking Papers, 2003/16, OECD
31
31

Publishing, (2003).[13] Ambuj Sagar, Adil Najam, The Human Development Index: aCritical Review, Ecological Economics, 25.(1998), 249-264, (1998).[14] UNDP, Human Development Report 2000, Oxford UniversityPress, New York, (2000).[15] Sudhir Anad, Amartya Sen, The Income Component of theHuman Development Index, Journal of Human Development , vol.1, no.1,2000 , (2000).[16] UNDP, Human Development Report 1990, Oxford UniversityPress, New York, (1990).[17] UNDP, Human Development Report 2001, Oxford UniversityPress, New York, (2001).[18] Eric Neumayer, The Human Development Index andSustainability- a Constructive Proposal, Ecological Economics,39,101-114,(2001).[19] Farhad Noorbakhsh, A Modified Human Development Index,World Development,Vol 26,No. 3, 517-528, (1998).[20] Nigel Joolands, J.Lermit, M. Patterson, The Usefullnessof Aggregate Indicators in Policy Making and Evaluation: a Discussion withApplication to Eco-efficiency Indicators in New Zealand, Technical Report ,Economics and Environment Network ANU, (2003).[21] Douglas Hicks, The Inequality Adjusted Human DevelopmentIndex: a Constructive Proposal, World Development vol. 25, no. 6, 1283-1298,(1997).[22] DK DEspotis, A Reassessment of the Human DevelopmentIndex via Data Envelopment Analysis, Journal of the OperactionalResearch Society, vol. 56,no. 8, 969-980, (2000).[23] Mozaffar, Oizilbash, On the Measurement of HumanDevelopment, UNDP Training
32
32

Course (2002),access : www.undp.org/docs/training/oxford/presentations/Qizilbash_HDIcritique.pdf.[24[ Halis Adkar, What does Disaggregation of HumanDevelopment Index Reveals?, First Global Fórum on Human Development July 1999, Ney York,Access www.undp.org/hdro/HDFFakter.html.[25] Rodrigo Garcia Verdú, The Human Development Index andits Application to States in México, Direction de Estúdios Econômicos, Banco deMéxico, (2002).[26] UNDP, Human Development Report 2005, Oxford UniversityPress, New York, (2005).[27] Haishan Fu, Data Inconsistency, Statistical Credibilityand the Human Development Report, paper presented at he Conference on DataQuality for International Organizations, May 2004, Wiesbaden, Germany, access:<hdr.undp.org/docs/statistics/about/paper_on_data_quality.pdf>.[28} Leonides Akritidis, Accuracy Assessment of NationalAccounts Statistics, Economic Trends, no. 589, december 2002, (2002).[29] B. Bailar, Error Profile: uses and abuses, StatisticalMethods and the Improvements of Data quality, Academic Press, Orlando, USA.[30] Christopher J.L.Murray, Development Data Constraints andthe Human Development Index, UNRISD Discussion Paper no. 25, 1991.Access www.unrisd.org/engindex/publ/list/dp/dp25/toc.htm.[31] Niels Lind, Values Reflected in the Human DevelopmentIndex,, Social Indicator Research 66, no. 3, 2004, 283-293, (2004).[32] Michaela Nardo, et al. , Tools for Composite IndicatorsBuilding, Joint Research Center, European Comission, EUR 21682 EM, access
33
33
<farmweb.jrc.cec.eu.int/CI/Document/EUR%2021682%20EN.pdf>.[33] J.Foster , A Sem, On Economic Inequality, ClarendonPrees.[34] PNUD/IPEA, Atlas de Desenvolvimento Humano , access: <www.pnud.org.br/atlas>.[35] Basudeb Biswas, Frank Caliendo, A Multivariate Analysisof the Human Development Index, Indian Economic Journal,vol. 49, no.4, 96-100,(2002).[36] Sheying Chen, et.al., Unidimensionalization in AppliedScience and Social Science: a Multiple and Optimal Approach to a Key Issue inScaling, Department of Sociology/Psychology, City University of New York, inBlasius,J. Hox,J. de Leeuw,E,& Schmidt (eds),Social Science Methodology inthe New Milleneum, CD- ROM, Germany, Leske & Budric, (2000).
Annexes
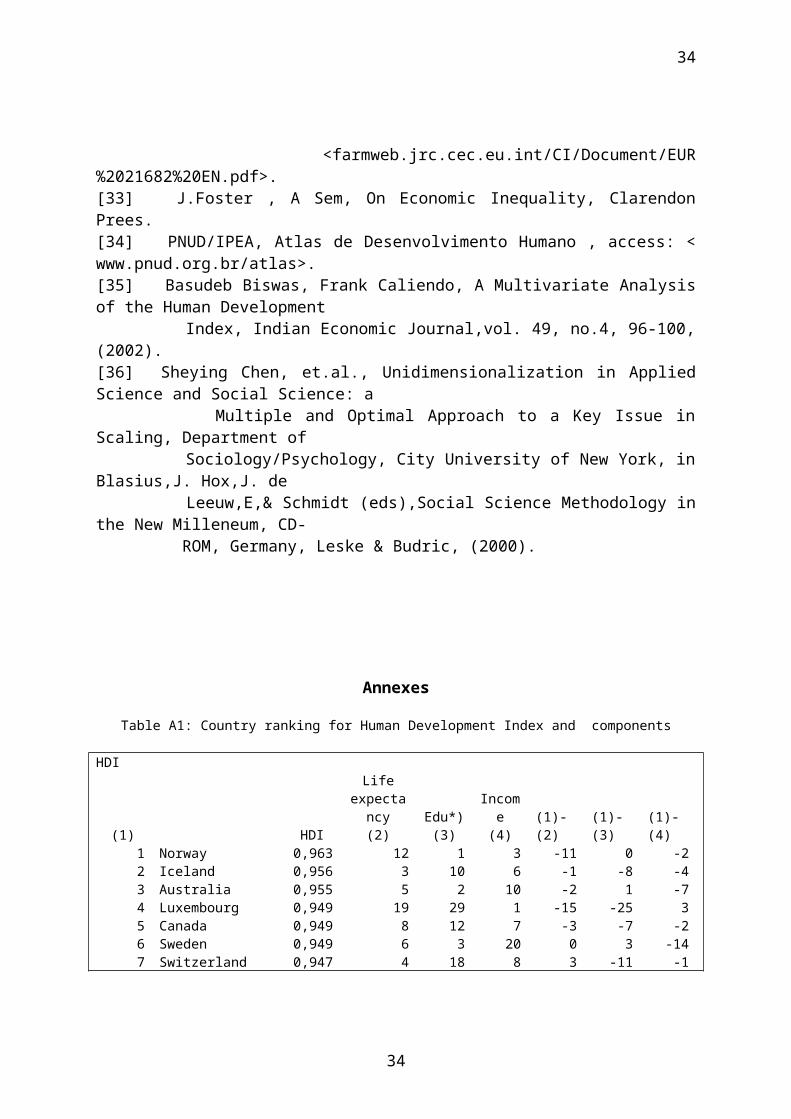
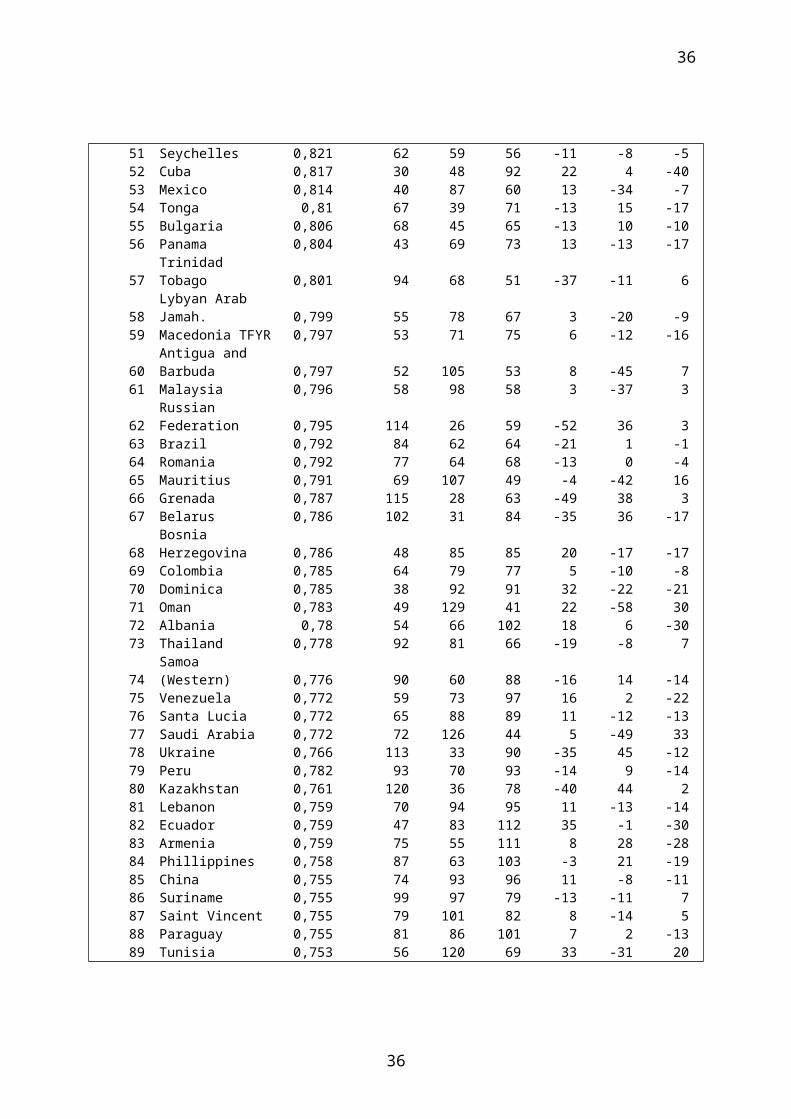
Table A1: Country ranking for Human Development Index and components
HDI
(1) HDI
Lifeexpectancy(2)
Edu*)(3)
Income(4)
(1)-(2)
(1)-(3)
(1)-(4)
1 Norway 0,963 12 1 3 -11 0 -22 Iceland 0,956 3 10 6 -1 -8 -43 Australia 0,955 5 2 10 -2 1 -74 Luxembourg 0,949 19 29 1 -15 -25 35 Canada 0,949 8 12 7 -3 -7 -26 Sweden 0,949 6 3 20 0 3 -147 Switzerland 0,947 4 18 8 3 -11 -1
34
34

8 Ireland 0,946 28 14 2 -20 -6 69 Belgium 0,945 15 4 12 -6 5 -310 United States 0,944 29 15 4 -19 -5 611 Japan 0,943 1 37 13 10 -26 -212 Netherlands 0,943 21 9 11 -9 3 113 Finland 0,941 20 5 16 -7 8 -314 Denmark 0,941 31 6 5 -17 8 915 United Kingdom 0,939 22 7 18 -7 8 -316 France 0,938 10 16 15 6 0 117 Austria 0,936 14 23 9 3 -6 818 Italy 0,934 7 35 19 11 -17 -119 New Zealand 0,933 13 8 22 6 11 -320 Germany 0,93 16 24 14 4 -4 621 Spain 0,928 11 19 24 10 2 -322 Hong Kong 0,916 2 72 17 20 -50 523 Israel 0,915 9 32 25 14 -9 -224 Greece 0,912 24 47 26 0 -23 -225 Singapore 0,907 17 51 21 8 -26 426 Slovenia 0,904 35 11 30 -9 15 -427 Portugal 0,904 32 42 32 -5 -15 -528 Korea Rep. of 0,901 33 25 34 -5 3 -629 Cyprus 0,891 18 52 31 11 -23 -230 Barbados 0,878 41 27 39 -11 3 -931 Czech Rep. 0,874 37 40 38 -6 -9 -732 Malta 0,867 23 89 35 9 -57 -333 Brunei 0,866 36 77 29 -3 -44 434 Argentina 0,863 44 20 46 -10 14 -1235 Hungary 0,862 61 30 40 -26 5 -536 Poland 0,858 45 21 48 -9 15 -1237 Chile 0,854 27 50 54 10 -13 -1738 Estonia 0,853 76 17 42 -38 21 -439 Lithuania 0,852 66 13 47 -27 26 -840 Qatar 0,849 60 74 27 -20 -34 13
41United Arab Emirates 0,849 26 112 23 15 -71 18
42 Slovakia 0,849 50 46 43 -8 -4 -143 Bahrain 0,846 46 84 36 -3 -41 744 Kuwait 0,844 34 106 33 10 -62 1145 Croatia 0,841 42 53 50 3 -8 -546 Uruguay 0,84 39 38 62 7 8 -1647 Costa Rica 0,838 25 76 57 22 -29 -1048 Latvia 0,836 73 22 55 -25 26 -7
49Saint Kitts and Nevis 0,834 91 34 45 -42 15 4
50 Bahamas 0,832 96 61 37 -46 -11 13
35
35
51 Seychelles 0,821 62 59 56 -11 -8 -552 Cuba 0,817 30 48 92 22 4 -4053 Mexico 0,814 40 87 60 13 -34 -754 Tonga 0,81 67 39 71 -13 15 -1755 Bulgaria 0,806 68 45 65 -13 10 -1056 Panama 0,804 43 69 73 13 -13 -17
57Trinidad Tobago 0,801 94 68 51 -37 -11 6
58Lybyan Arab Jamah. 0,799 55 78 67 3 -20 -9
59 Macedonia TFYR 0,797 53 71 75 6 -12 -16
60Antigua and Barbuda 0,797 52 105 53 8 -45 7
61 Malaysia 0,796 58 98 58 3 -37 3
62Russian Federation 0,795 114 26 59 -52 36 3
63 Brazil 0,792 84 62 64 -21 1 -164 Romania 0,792 77 64 68 -13 0 -465 Mauritius 0,791 69 107 49 -4 -42 1666 Grenada 0,787 115 28 63 -49 38 367 Belarus 0,786 102 31 84 -35 36 -17
68Bosnia Herzegovina 0,786 48 85 85 20 -17 -17
69 Colombia 0,785 64 79 77 5 -10 -870 Dominica 0,785 38 92 91 32 -22 -2171 Oman 0,783 49 129 41 22 -58 3072 Albania 0,78 54 66 102 18 6 -3073 Thailand 0,778 92 81 66 -19 -8 7
74Samoa (Western) 0,776 90 60 88 -16 14 -14
75 Venezuela 0,772 59 73 97 16 2 -2276 Santa Lucia 0,772 65 88 89 11 -12 -1377 Saudi Arabia 0,772 72 126 44 5 -49 3378 Ukraine 0,766 113 33 90 -35 45 -1279 Peru 0,782 93 70 93 -14 9 -1480 Kazakhstan 0,761 120 36 78 -40 44 281 Lebanon 0,759 70 94 95 11 -13 -1482 Ecuador 0,759 47 83 112 35 -1 -3083 Armenia 0,759 75 55 111 8 28 -2884 Phillippines 0,758 87 63 103 -3 21 -1985 China 0,755 74 93 96 11 -8 -1186 Suriname 0,755 99 97 79 -13 -11 787 Saint Vincent 0,755 79 101 82 8 -14 588 Paraguay 0,755 81 86 101 7 2 -1389 Tunisia 0,753 56 120 69 33 -31 20
36
36

90 Jordan 0,753 78 82 104 12 8 -1491 Belize 0,753 71 110 72 20 -19 1992 Fiji 0,752 103 80 87 -11 12 593 Sri Lanka 0,751 51 95 110 42 -2 -1794 Turkey 0,75 100 99 76 -6 -5 18
95Dominican Republic 0,749 107 91 74 -12 4 21
96 Maldives 0,745 111 58 98 -15 38 -297 Turkmenistan 0,738 127 49 86 -30 48 1198 Jamaica 0,738 83 96 107 15 2 -999 Iran 0,736 88 119 70 11 -20 29100 Georgia 0,732 85 54 121 15 46 -21101 Azerbaijan 0,729 108 65 113 -7 36 -12
102
Oc. Palestinian Territ. 0,729 63 67 127 39 35 -25
103 Algeria 0,722 80 127 83 23 -24 20104 El Salvador 0,722 82 116 99 22 -12 5105 Cape Verde 0,721 89 118 94 16 -13 11
106Syrian Arab Republic 0,721 57 114 114 49 -8 -8
107 Guyana 0,72 122 56 105 -15 51 2108 Viet Nam 0,704 86 100 124 22 8 -16109 Kyrgyzstan 0,702 109 41 142 0 68 -33110 Indonesia 0,697 110 103 115 0 7 -5111 Uzbekistan 0,694 112 44 143 -1 67 -32112 Nicaragua 0,69 97 121 116 15 -9 -4113 Bolivia 0,687 116 75 122 -3 38 -9114 Mongolia 0,679 117 57 137 -3 57 -23
115Moldova Rep. Of 0,671 105 90 148 10 25 -33
116 Honduras 0,667 104 122 119 12 -6 -3117 Guatemala 0,663 106 135 106 11 -18 11118 Vanuatu 0,659 101 132 117 17 -14 1119 Egypt 0,659 95 142 109 24 -23 10120 South Africa 0,658 150 102 52 -30 18 68
121Equatorial Guinea 0,655 166 109 28 -45 12 93
122 Tajikistan 0,652 118 43 158 4 79 -36123 Gabon 0,635 141 125 80 -18 -2 43124 Morocco 0,631 98 149 108 26 -25 16125 Namibia 0,627 151 104 81 -26 21 44
126São Tomé Principe 0,604 123 113 153 3 13 -27
127 India 0,602 119 145 118 8 -18 9
37
37

128Solomon Islands 0,594 128 133 141 0 -5 -13
129 Myanmar 0,578 131 117 163 -2 12 -34130 Cambodia 0,571 134 131 133 -4 -1 -3131 Botswana 0,565 175 115 61 -44 16 70132 Comoros 0,547 121 150 145 11 -18 -13
133Lao People`s Dem R. 0,545 140 137 140 -7 -4 -7
134 Bhutan 0,536 125 161 134 9 -27 0135 Pakistan 0,527 124 165 130 11 -30 5136 Nepal 0,526 129 124 151 7 12 -15
137Papua New Guinea 0,523 139 153 120 -2 -16 17
138 Ghana 0,52 132 155 128 6 -17 10139 Bangladesh 0,52 126 164 138 13 -25 1140 Timor Leste 0,513 137 139 162 3 1 -22141 Sudan 0,512 133 152 135 8 -11 6142 Congo 0,512 148 128 165 -6 14 -23143 Togo 0,512 142 147 146 1 -4 -3144 Uganda 0,508 155 130 150 -11 14 -6145 Zimbabwe 0,505 174 108 125 -29 37 20146 Madagascar 0,499 138 140 170 8 6 -24147 Swaziland 0,498 177 123 100 -30 24 47148 Cameroon 0,497 159 141 129 -11 7 19149 Lesotho 0,497 176 111 123 -27 38 26150 Djibouti 0,495 146 154 132 4 -4 18151 Yemen 0,489 130 156 166 21 -5 -15152 Mauritania 0,477 147 160 139 5 -8 13153 Haiti 0,475 149 158 144 4 -5 9154 Kenya 0,474 156 136 161 -2 18 -7155 Gambia 0,47 135 167 136 20 -12 19156 Guinea 0,466 145 168 131 11 -12 25157 Senegal 0,458 136 171 147 21 -14 10158 Nigeria 0,453 165 138 160 -7 20 -2159 Rwanda 0,45 162 144 152 -3 15 7160 Angola 0,445 169 148 126 -9 12 34161 Eritreia 0,444 144 159 168 17 2 -7162 Benin 0,431 143 169 157 19 -7 5163 Côte d`Ivoire 0,42 158 162 149 5 1 14164 Tanzania 0,418 157 146 175 7 18 -11165 Malawi 0,404 171 134 176 -6 31 -11166 Zambia 0,394 173 143 167 -7 23 -1
167Cong, Dem. Rep.of 0,385 167 151 173 0 16 -6
168 Mozambique 0,379 168 163 156 0 5 12
38
38
169 Burundi 0,378 163 157 174 6 12 -5170 Ethiopia 0,367 153 170 171 17 0 -1
171Central African Rep. 0,355 172 166 159 -1 5 12
172 Guinea Bissau 0,348 160 172 172 12 0 0173 Chad 0,341 164 174 154 9 -1 19174 Mali 0,333 152 175 164 22 -1 10175 Burkina Faso 0,317 154 177 155 21 -2 20176 Sierra Leone 0,298 170 173 177 6 3 -1177 Niger 0,281 161 176 169 16 1 8
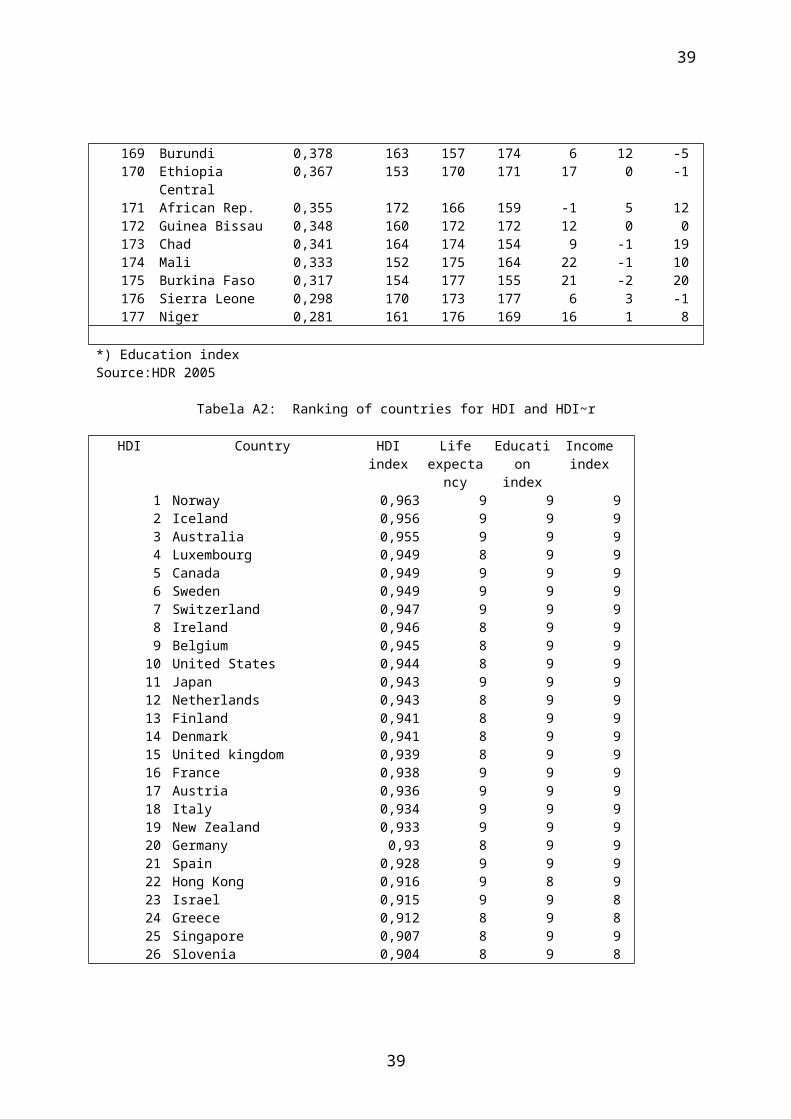
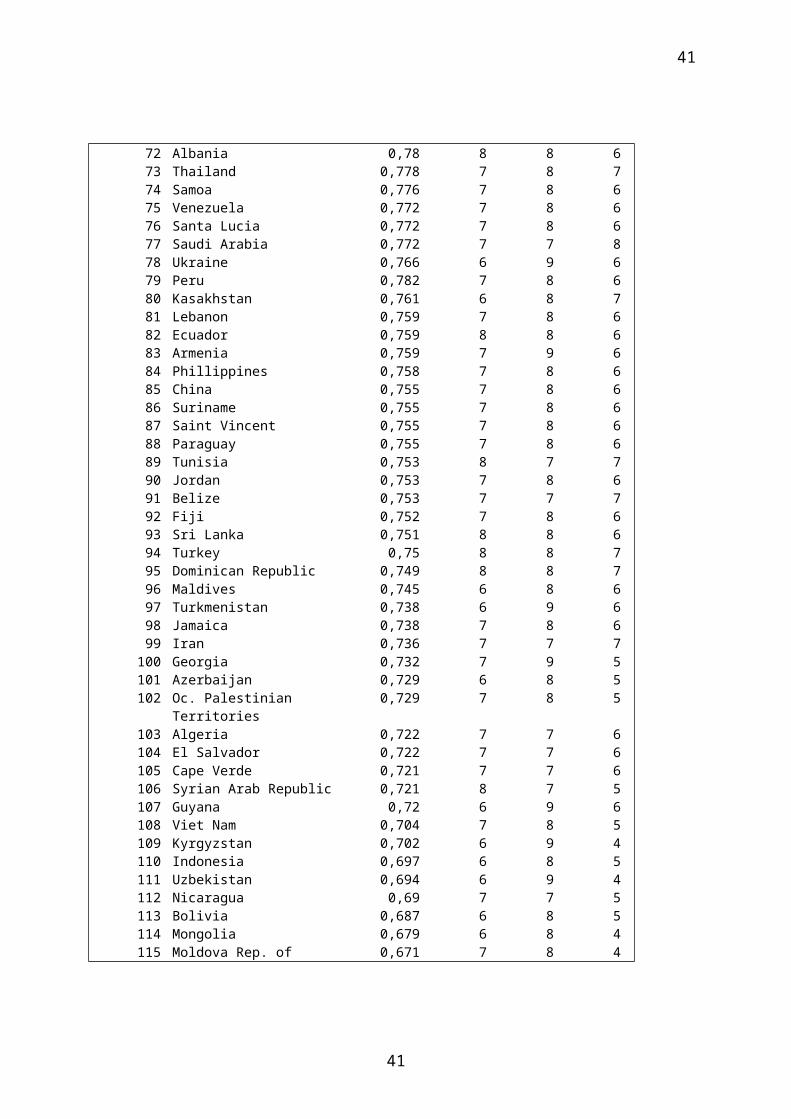
*) Education indexSource:HDR 2005
Tabela A2: Ranking of countries for HDI and HDI~r
HDI Country HDIindex
Lifeexpectancy
Education
index
Incomeindex
1 Norway 0,963 9 9 92 Iceland 0,956 9 9 93 Australia 0,955 9 9 94 Luxembourg 0,949 8 9 95 Canada 0,949 9 9 96 Sweden 0,949 9 9 97 Switzerland 0,947 9 9 98 Ireland 0,946 8 9 99 Belgium 0,945 8 9 910 United States 0,944 8 9 911 Japan 0,943 9 9 912 Netherlands 0,943 8 9 913 Finland 0,941 8 9 914 Denmark 0,941 8 9 915 United kingdom 0,939 8 9 916 France 0,938 9 9 917 Austria 0,936 9 9 918 Italy 0,934 9 9 919 New Zealand 0,933 9 9 920 Germany 0,93 8 9 921 Spain 0,928 9 9 922 Hong Kong 0,916 9 8 923 Israel 0,915 9 9 824 Greece 0,912 8 9 825 Singapore 0,907 8 9 926 Slovenia 0,904 8 9 8
39
39

27 Portugal 0,904 8 9 828 Korea Rep. Of 0,901 8 9 829 Cyprus 0,891 8 9 830 Barbados 0,878 8 9 831 Czech Rep. 0,874 8 9 832 Malta 0,867 8 8 833 Brunei 0,866 8 9 834 Argentina 0,863 8 9 835 Hungary 0,862 7 9 836 Poland 0,858 8 9 737 Chile 0,854 8 9 738 Estonia 0,853 7 9 839 Lithuania 0,852 7 9 740 Qatar 0,849 7 8 841 United Arab Emirates 0,849 8 7 942 Slovakia 0,849 8 9 843 Bahrain 0,846 8 8 844 Kuwait 0,844 8 7 845 Croatia 0,841 8 9 746 Uruguay 0,84 8 9 747 Costa Rica 0,838 8 8 748 Latvia 0,836 7 9 749 Saint Kitts and Nevis 0,834 7 9 850 Bahamas 0,832 7 8 851 Seychelles 0,821 7 8 852 Cuba 0,817 8 9 653 Mexico 0,814 8 8 754 Tonga 0,81 7 9 755 Bulgaria 0,808 7 8 756 Panama 0,804 8 8 757 Trinidad Tobago 0,801 7 8 758 Libyan Arab Jamahirlya 0,799 8 8 759 Macedonia 0,797 8 8 760 Antigua and Barbados 0,797 8 8 761 Malaysia 0,796 8 8 762 Russian Federation 0,795 6 9 763 Brazil 0,792 8 8 764 Romania 0,792 8 8 765 Mauritius 0,791 7 7 766 Grenada 0,787 6 9 767 Belarus 0,786 7 9 668 Bosnia e Herzegovina 0,786 8 8 669 Colombia 0,785 7 8 770 Dominica 0,783 8 8 671 Oman 0,781 8 7 8
40
40
72 Albania 0,78 8 8 673 Thailand 0,778 7 8 774 Samoa 0,776 7 8 675 Venezuela 0,772 7 8 676 Santa Lucia 0,772 7 8 677 Saudi Arabia 0,772 7 7 878 Ukraine 0,766 6 9 679 Peru 0,782 7 8 680 Kasakhstan 0,761 6 8 781 Lebanon 0,759 7 8 682 Ecuador 0,759 8 8 683 Armenia 0,759 7 9 684 Phillippines 0,758 7 8 685 China 0,755 7 8 686 Suriname 0,755 7 8 687 Saint Vincent 0,755 7 8 688 Paraguay 0,755 7 8 689 Tunisia 0,753 8 7 790 Jordan 0,753 7 8 691 Belize 0,753 7 7 792 Fiji 0,752 7 8 693 Sri Lanka 0,751 8 8 694 Turkey 0,75 8 8 795 Dominican Republic 0,749 8 8 796 Maldives 0,745 6 8 697 Turkmenistan 0,738 6 9 698 Jamaica 0,738 7 8 699 Iran 0,736 7 7 7100 Georgia 0,732 7 9 5101 Azerbaijan 0,729 6 8 5102 Oc. Palestinian
Territories0,729 7 8 5
103 Algeria 0,722 7 7 6104 El Salvador 0,722 7 7 6105 Cape Verde 0,721 7 7 6106 Syrian Arab Republic 0,721 8 7 5107 Guyana 0,72 6 9 6108 Viet Nam 0,704 7 8 5109 Kyrgyzstan 0,702 6 9 4110 Indonesia 0,697 6 8 5111 Uzbekistan 0,694 6 9 4112 Nicaragua 0,69 7 7 5113 Bolivia 0,687 6 8 5114 Mongolia 0,679 6 8 4115 Moldova Rep. of 0,671 7 8 4
41
41

116 Honduras 0,667 7 7 5117 Guatemala 0,663 7 6 6118 Vanuatu 0,659 7 6 5119 Egypt 0,659 7 6 6120 South Africa 0,658 3 8 7121 Equatorial Guinea 0,655 3 7 8122 Tajikistan 0,652 6 9 4123 Gabon 0,635 4 7 6124 Morocco 0,631 7 5 6125 Namibia 0,627 3 8 6126 São Tome and Principe 0,604 6 7 4127 India 0,602 6 6 6128 Solomon Islands 0,594 6 6 4129 Myanmar 0,578 5 7 7130 Cambodia 0,571 5 6 5131 Botswana 0,565 1 7 7132 Comoros 0,547 6 5 4133 Lao Peoples Dem Rep. 0,545 4 6 4134 Bhutan 0,536 6 4 4135 Pakistan 0,527 6 4 5136 Nepal 0,526 6 7 4137 Papua Nova Guinea 0,523 5 5 5138 Ghana 0,52 5 5 5139 Bangladesh 0,52 6 4 4140 Timor- Leste 0,513 5 6 3141 Sudan 0,512 5 5 4142 Congo 0,512 4 7 3143 Togo 0,512 4 5 4144 Uganda 0,508 3 7 4145 Zimbabwe 0,505 1 7 5146 Madagascar 0,499 5 6 3147 Swaziland 0,498 1 7 6148 Cameroon 0,497 3 6 5149 Lesotho 0,497 1 7 5150 Djibouti 0,495 4 6 5151 Yemen 0,489 5 5 3152 Mauritania 0,477 4 4 4153 Haiti 0,475 4 5 4154 Kenya 0,474 3 6 3155 Gambia 0,47 5 4 4156 Guinea 0,466 4 4 5157 Senegal 0,458 5 3 4158 Nigeria 0,453 3 6 3159 Rwanda 0,45 3 6 4160 Angola 0,445 2 5 5
42
42

161 Eritrea 0,444 4 4 3162 Benin 0,431 4 4 4163 Côte d`Ivoire 0,42 3 4 4164 Tanzania 0,418 3 5 3165 Malawi 0,404 2 6 3166 Zambia 0,394 2 6 3167 Congo 0,385 3 5 3168 Mozambique 0,379 2 4 4169 Burundi 0,378 3 5 3170 Ethiopia 0,367 3 3 3171 Central African Rep. 0,355 2 4 3172 Guinea Bissau 0,348 3 4 3173 Chad 0,341 3 2 4174 Mali 0,333 3 2 3175 Burkina Faso 0,317 3 1 4176 Sierra Leone 0,298 2 3 2177 Niger 0,281 3 1 3
Table A3: Ranking of countries according HDI and HDI~α
Rank Country HDI
Lifeexpectancyindex
Educationindex
Incomeindex
1 Norway 0,963 a a a2 Iceland 0,956 a a a3 Australia 0,955 a a a4 Luxembourg 0,949 a a a5 Canada 0,949 a a a6 Sweden 0,949 a a a7 Switzerland 0,947 a a a8 Ireland 0,946 a a a9 Belgium 0,945 a a a10 United States 0,944 a a a11 Japan 0,943 a a a12 Netherlands 0,943 a a a13 Finland 0,941 a a a14 Denmark 0,941 a a a15 United kingdom 0,939 a a a16 France 0,938 a a a17 Austria 0,936 a a a18 Italy 0,934 a a a19 New Zealand 0,933 a a a20 Germany 0,93 a a a
43
43

21 Spain 0,928 a a a22 Hong Kong 0,916 a b a23 Israel 0,915 a a a24 Greece 0,912 a a b25 Singapore 0,907 a a a26 Slovenia 0,904 a a b27 Portugal 0,904 a a b28 Korea Rep. Of 0,901 a a b29 Cyprus 0,891 a a b30 Barbados 0,878 a a b31 Czech Rep. 0,874 a a b32 Malta 0,867 a b b33 Brunei 0,866 a b b34 Argentina 0,863 b a b35 Hungary 0,862 b a b36 Poland 0,858 b a b37 Chile 0,854 a a b38 Estonia 0,853 b a b39 Lithuania 0,852 b a b40 Qatar 0,849 b b b
41United Arab Emirates 0,849 a c a
42 Slovakia 0,849 b a b43 Bahrain 0,846 b b b44 Kuwait 0,844 a b b45 Croatia 0,841 a a b46 Uruguay 0,84 a a c47 Costa Rica 0,838 a b b48 Latvia 0,836 b a b
49Saint Kitts and Nevis 0,834 b a b
50 Bahamas 0,832 b b b51 Seychelles 0,821 b b b52 Cuba 0,817 a a c53 Mexico 0,814 a b b54 Tonga 0,81 b a c55 Bulgaria 0,806 b a c56 Panama 0,804 b b c57 Trinidad Tobago 0,801 b b b
58Libyan Arab Jamahirlya 0,799 b b c
59 Macedonia TFYR 0,797 b b c
60Antigua and Barbuda 0,797 b b b
61 Malaysia 0,796 b b b
44
44

62Russian Federation 0,795 c a b
63 Brazil 0,792 b b c64 Romania 0,792 b b c65 Mauritius 0,791 b b b66 Grenada 0,787 c a c67 Belarus 0,786 b a c
68Bosnia e Herzegovina 0,786 b b c
69 Colombia 0,785 b b c70 Dominica 0,785 a b c71 Oman 0,783 b c b72 Albania 0,78 b b c73 Thailand 0,778 b b c74 Samoa 0,776 b b c75 Venezuela 0,772 b b c76 Santa Lucia 0,772 b b c77 Saudi Arabia 0,772 b c b78 Ukraine 0,766 c a c79 Peru 0,782 b b c80 Kazakhstan 0,761 c a c81 Lebanon 0,759 b b c82 Ecuador 0,759 b b c83 Armenia 0,759 b a c84 Phillipines 0,758 b b c85 China 0,755 b b c86 Suriname 0,755 b b c87 Saint Vincent 0,755 b b c88 Paraguay 0,755 b b c89 Tunisia 0,753 b c c90 Jordan 0,753 b b c91 Belize 0,753 b c c92 Fiji 0,752 b b c93 Sri Lanka 0,751 b b c94 Turkey 0,75 b b c
95Dominican Republic 0,749 b b c
96 Maldives 0,745 c b c97 Turkmenistan 0,738 c a c98 Jamaica 0,738 b b c99 Iran 0,736 b c c100 Georgia 0,732 b a c101 Azerbaijan 0,729 c b c
102Oc. Palestinian Territories 0,729 b b c
45
45

103 Algeria 0,722 b c c104 El Salvador 0,722 b c c105 Cape Verde 0,721 b c c
106Syrian Arab Republic 0,721 b c c
107 Guyana 0,72 c a c108 Viet Nam 0,704 b b c109 Kyrgyzstan 0,702 c a d110 Indonesia 0,697 c b c111 Uzbekistan 0,694 c a d112 Nicaragua 0,69 b c c113 Bolivia 0,687 c b c114 Mongolia 0,679 c b d115 Moldova Rep. Of 0,671 b b d116 Honduras 0,667 b c c117 Guatemala 0,663 b c c118 Vanuatu 0,659 b c c119 Egypt 0,659 b c c120 South Africa 0,658 d b b121 Equatorial Guinea 0,655 d b b122 Tajikistan 0,652 c a d123 Gabon 0,635 d c c124 Morocco 0,631 b c c125 Namibia 0,627 d b c
126São Tomé and Principe 0,604 c c d
127 India 0,602 c c c128 Solomon Islands 0,594 c c d129 Myanmar 0,578 c c d130 Cambodia 0,571 d c c131 Botswana 0,565 d c b132 Comoros 0,547 c c d
133Lao Peoples Dem Rep. 0,545 d c d
134 Bhutan 0,536 c d d135 Pakistan 0,527 c d c136 Nepal 0,526 c c d137 Papua New Guinea 0,523 d c c138 Ghana 0,52 d c c139 Bangladesh 0,52 c d d140 Timor Leste 0,513 d c d141 Sudan 0,512 d c d142 Congo 0,512 d c d143 Togo 0,512 d c d144 Uganda 0,508 d c d
46
46
145 Zimbabwe 0,505 d b c146 Madagascar 0,499 d c d147 Swaziland 0,498 d c c148 Cameroon 0,497 d c c149 Lesotho 0,497 d c c150 Djibouti 0,495 d c c151 Yemen 0,489 c c d152 Mauritania 0,477 d d d153 Haiti 0,475 d c d154 Kenya 0,474 d c d155 Gambia 0,47 d d d156 Guinea 0,466 d d c157 Senegal 0,458 d d d158 Nigeria 0,453 d c d159 Rwanda 0,45 d c d160 Angola 0,445 d c c161 Eritrea 0,444 d d d162 Benin 0,431 d d d163 Côte d`Ivoire 0,42 d d d164 Tanzania 0,418 d c d165 Malawi 0,404 d c d166 Zambia 0,394 d c d
167Congo Dem. Rep. of the 0,385 d c d
168 Mozambique 0,379 d d d169 Burundi 0,378 d c d170 Ethiopia 0,367 d d d
171Central African Rep. 0,355 d d d
172 Guinea Bissau 0,348 d d d173 Chad 0,341 d d d174 Mali 0,333 d d d175 Burkina Faso 0,317 d d d176 Sierra Leone 0,298 d d d177 Niger 0,281 d d d
Table A4: Classification of high human development countries, based onHDI~α ,according to level of life expectation, education and income
a a a *) a a b b a b a b b b b b a a c a c a
47
47

Countries
Norway,Iceland,Australia,LuxembourgCanada,Sweden,Switzerland Ireland,Belgium,United StatesJapanNetherlandsFinlandDenmarkUnited -KingdomFranceAustriaItalyNew ZealandGermanySpainIsraelSingapore
GreeceSloveniaPortugalKorea Rep. CyprusBarbadosCzech Rep.ChileCroatia
ArgentinaHungaryPolandEstoniaLithuaniaSlovakiaLatviaSaint Kitts
MaltaBruneiKuwaitCosta RicaMéxico
a b aHongKong
QuatarBahrainBahamasSeychellesTrinidad -Tobago
b b cPanamá
UruguayCuba
b a cTongaBulgaria
United ArabEmirates
*) for classification criteria se table 10- Source: author, data based on HDR 2005Table A5: Classification of medium human development countries, according
to HDI~α and level of life expectancy, education and income
b a c*)
b b b b b c bcc c a c c c d c b c d c c
48
48
BelarusGeórgiaArmenia
a bcDominica
AntiguaMalaysiaMauritius
b c bOmanSaudi -Arabia
b b dMoldava
Libyan ArabMacedoniaBrazilRomâniaBósnia Herz.ColômbiaAlbâniaThailandSamoaVenezuelaSanta LuciaPeruLebanonEcuadorPhillippinesChinaSurinameSt. VincentParaguayJordanFijiSri LankaTurkeyDominicanJamaicaOc.PalestinianViet Nam
TunisiaBelizeIranAlgeriaEl SalvadorCape VerdeSyrian ArabNicaraguaHondurasGuatemalaVanuatuEgyptMorocco
GrenadaUkraineTurkmenistanGuyanaKazakhstan
c a d KyrgyzstanUzbekistanTajikstan
São TomeSolomon -IslandsMyanmarComoresNepal
c d dBangladesh Bhutan
ccc India
cdcPakistan
MaldivesAzerbaijanIndonesiaBolivia
c a bRussian Fed.
c b dMongolia
GabonCambodiaPapua NewGhana
d b cZimbabweNamibia
d b bEquatAfricaSouth África
d c bBotswana
d c dLao People-Rep.Timor Leste SudanCongoTogoUganda
*) for classification criteria se table 10 Source: author, data based on HDR 2005
Table A6 : Classification of low human development countries according tothe level of life expectancy, education and income
c c d*)d c c
d c d d d c d d dCountries
Yemen SwazilandCameroonLesothoDjibout
MadagascarHaitiKenyaNigeriaRwandaTanzania
Guinea MauretaniaGâmbiaSenegalEritreiaBeninCote d`Ivoire
49
49

iAngola
MalawiZambiaCongo Dem. Rep.Burundi
MozambiqueEthiopiaCentral African Rep.Guinea BissauChad , Mali, NigerBurkina FasoSierra Leone
*) for classification criteria see table 10 Source: author, data basedon HDR 2005
50
50
Copyright © 2022 FDOKUMEN