Bacterial Footprints in Elastic Pillared Microstructures - clok ...
Upload
independentCategory
view
2download
0
Please cite this article in press as: Zalloua et al., Identifying Genetic Traces of Historical Expansions: Phoenician Footprints in the Mediter-ranean, The American Journal of Human Genetics (2008), doi:10.1016/j.ajhg.2008.10.012
REPORT
Identifying Genetic Traces of Historical Expansions:Phoenician Footprints in the Mediterranean
Pierre A. Zalloua,1,2,13 Daniel E. Platt,3,13 Mirvat El Sibai,1 Jade Khalife,1 Nadine Makhoul,1 Marc Haber,1
Yali Xue,4 Hassan Izaabel,5 Elena Bosch,6 Susan M. Adams,7 Eduardo Arroyo,8 Ana Marıa Lopez-Parra,8
Mercedes Aler,9 Antonia Picornell,10 Misericordia Ramon,10 Mark A. Jobling,7 David Comas,6
Jaume Bertranpetit,6 R. Spencer Wells,11 Chris Tyler-Smith,4,* and The Genographic Consortium12
The Phoenicians were the dominant traders in the Mediterranean Sea two thousand to three thousand years ago and expanded from
their homeland in the Levant to establish colonies and trading posts throughout the Mediterranean, but then they disappeared from
history. We wished to identify their male genetic traces in modern populations. Therefore, we chose Phoenician-influenced sites on
the basis of well-documented historical records and collected new Y-chromosomal data from 1330 men from six such sites, as well as
comparative data from the literature. We then developed an analytical strategy to distinguish between lineages specifically associated
with the Phoenicians and those spread by geographically similar but historically distinct events, such as the Neolithic, Greek, and Jewish
expansions. This involved comparing historically documented Phoenician sites with neighboring non-Phoenician sites for the identi-
fication of weak but systematic signatures shared by the Phoenician sites that could not readily be explained by chance or by other ex-
pansions. From these comparisons, we found that haplogroup J2, in general, and six Y-STR haplotypes, in particular, exhibited a Phoe-
nician signature that contributed > 6% to the modern Phoenician-influenced populations examined. Our methodology can be applied
to any historically documented expansion in which contact and noncontact sites can be identified.
The Phoenicians were a distinctive and independent civili-
zation that dominated the Mediterranean Sea during the
first millennium BCE, emerging from a coastal section of
the Eastern Mediterranean, including the four main
Bronze Age maritime cities of Tyre, Sidon, Byblos, and Ar-
wad and located in the modern countries of Lebanon and
southern Syria. From here, their maritime expertise al-
lowed them to establish a trading empire throughout the
Mediterranean and beyond.1–6 Their strategy included
the establishment of settled colonies, foremost among
which was Carthage in modern Tunisia, and many trading
posts, where they stayed for shorter periods4 (Figure 1A).
Their activities were recorded by contemporary writers, in-
cluding the Egyptians, the Greeks, Biblical sources, Strabo,
Pliny the Elder, and Avienus, and the remains of their cities
and trading goods have been documented extensively by
archaeologists.6 Thus, we have a good understanding of
their origins and spread from historical sources.
We set out to complement this historical information by
searching for Phoenician genetic traces within modern
populations. We chose the nonrecombining region of the
Y chromosome for this purpose, because its male specific-
ity means that it would have been carried by the predom-
inantly male Phoenician traders, and its high level of geo-
1The Lebanese American University, Chouran, Beirut 1102 2801, Lebanon; 2Ha
Pattern Discovery, IBM Thomas J. Watson Research Centre, Yorktown Heigh
Genome Campus, Hinxton, Cambridge, CB10 1SA, UK; 5Laboratoire de Biolo
Maroc; 6Institute of Evolutionary Biology, Consejo Superior de Investigaciones
ces Experimentals i de la Salut, Universitat Pompeu Fabra, 08003 Barcelona, Ca
Road, Leicester LE1 7RH, UK; 8Universidad Complutense de Madrid, Facultad d
Medicina Legal, Seccion de Biologıa Forense, Facultad de Medicina, Universida
versitari d’Investigacio en Ciencies de la Salut i Departament Biologia, Univers
Project, National Geographic Society, Washington, DC 20036, USA; 12Genogra13These two authors contributed equally to this work
*Correspondence: [email protected]
DOI 10.1016/j.ajhg.2008.10.012. ª2008 by The American Society of Human
The Am
graphical differentiation provides the greatest chance of
recognizing colonization events.7 Human genetic history,
however, can be viewed as a palimpsest, in which multiple
events from different times but with similar geographical
patterns are superimposed. Expansions from the Eastern
Mediterranean could include the initial peopling by mod-
ern humans during the Paleolithic era, the subsequent
Neolithic-era transition originating in the Fertile Crescent
~8000 BCE, and later events, such as the Greek expansion
or the Jewish Diaspora. All of these, and possibly addi-
tional events unrecorded in history, could result in broadly
similar genetic patterns with an origin in or near the Le-
vant and decreasing gradients toward the west. Several pre-
vious studies have identified Y-chromosomal types show-
ing gradients originating in the Near East8–11 and have
sometimes linked them to the Phoenicians,12 but further
work is needed to distinguish between the general pattern
and the specific Phoenician contribution.
Therefore, we have developed a strategy for identifying
a geographical genetic pattern associated with a specific
historical expansion, rather than an overall geographical
gradient. The key to this was the use of historically
documented locations of greater or lesser contact—in our
case, Phoenician locations—matched approximately for
rvard School of Public Health, Boston, MA 02215, USA; 3Bioinformatics and
ts, NY 10598, USA; 4The Wellcome Trust Sanger Institute, Wellcome Trust
gie Cellulaire & Genetique Moleculaire, Universite Ibn Zohr, 8106 Agadir,
Cientıficas, Parc de Recerca Biomedica de Barcelona, Departament de Cien-
talonia, Spain; 7Department of Genetics, University of Leicester, University
e Medicina, Ciudad Universitaria, 28040 Madrid, Spain; 9Unidad Docente de
d de Valencia, 46010 Valencia, Spain; 10Laboratori de Genetica, Institut Uni-
itat de les Illes Balears, 07122 Palma de Mallorca, Spain; 11The Genographic
phic Consortium members are listed fully in the Acknowledgments section
Genetics. All rights reserved.
erican Journal of Human Genetics 83, 1–10, November 7, 2008 1

Figure 1. Geographical context of the Phoenician and Greek expansions(A) Maritime expansions of the Phoenicians (11th century BCE) and Greeks. Red: Phoenicia, Phoenician colonies; pink: Phoenician tradingposts; blue: Greece and Greek colonies.(B) J2 haplogroup frequency comparisons between Phoenician contact regions (thick borders) and nearby non-contact regions (thinborders). Lines indicate paired haplogroup comparisons between two sites. An ellipse indicates a site with multiple population samples.Colored circles indicate the higher haplogroup J2 frequency site in each pair.(C) Phoenician Colonization Signal 1 (PCS1þ) haplotype frequency comparisons between Phoenician contact regions (thick borders) andnearby non-contact regions (thin borders). Lines indicate paired haplotype comparisons between two sites. An ellipse indicates a sitewith multiple population samples. Colored circles represent the higher PCS1þ frequency site in each pair.(D–F) Geographical distribution of the PCS1þ (D), PCS2þ (E), and PCS3þ (F) haplotypes in the Mediterranean region. The PCSþ centralhaplotypes are shown in Table 2. Higher color intensities indicate higher haplotype frequencies; absolute frequencies are given in Table 3.Note the highly enriched coastal and island distribution of these haplotypes and the prominence of all in the Levant.
Please cite this article in press as: Zalloua et al., Identifying Genetic Traces of Historical Expansions: Phoenician Footprints in the Mediter-ranean, The American Journal of Human Genetics (2008), doi:10.1016/j.ajhg.2008.10.012
distance from the source. Such paired locations would be
expected to share general genetic patterns, reflecting the
sum of multiple events, but to differ specifically in their
Phoenician genetic influence if genetic transfer had taken
place. Other historical expansions would have involved
different locations of greater and lesser contact and so
would not have produced a distinct geographically de-
tailed signal in the same populations at this fine level of
resolution. To assess the significance of any pattern that
we might detect, we developed a two-fold analytic ap-
proach: first, a statistical component, the investigation of
whether such a pattern might have originated by chance;
2 The American Journal of Human Genetics 83, 1–10, November 7, 2
and second, an empirical component, the application of
the same analytical strategy to additional data sets not ex-
pected to differ in their Phoenician influence, representing
instead the general Neolithic spread or the independent
Greek expansion. Haplotypes that would not be expected
to exhibit the specific short-ranged variational features
by chance and that did not correspond to other known ex-
pansions could be considered as potentially Phoenician.
With the very active intervening history, we cannot rea-
sonably expect to identify a statistically significant signa-
ture linking the Phoenician homeland to every identified
colonization region. However, colonization is expected to
008

Please cite this article in press as: Zalloua et al., Identifying Genetic Traces of Historical Expansions: Phoenician Footprints in the Mediter-ranean, The American Journal of Human Genetics (2008), doi:10.1016/j.ajhg.2008.10.012
have produced a noisy but systematic trace of signatures.
This study presents a method that identifies significant
geographical preponderance of such signatures in order
to decipher the genetic palimpsest.
In order to apply this strategy, we therefore needed to (1)
choose suitable population sample sites for investigating
Phoenician and other expansions, (2) generate or identify
from available sources Y-chromosomal data sets from the
chosen sites, (3) develop our test methodology, and, fi-
nally, (4) consider the broader significance of any signals
that emerged from the chosen population sites.
When choosing populations, we considered that trade-
driven colonization would have mediated the genetic leg-
acy of the Phoenician expansion. Minor colonization sites
were established for the servicing of ships en route, as well
as for connecting with and guarding interests in foreign
trade centers. This servicing was necessary for the expan-
sion of trade throughout the Mediterranean basin with
the maritime technology of the first millennium BCE
and established the regional variations that we seek to de-
tect. Carthage emerged as the dominant Central Mediterra-
nean colony, connecting western-metals trade to the rest
of the wealthy Mediterranean trading sites. Opportunity
for establishing Phoenician colonization was greatest and
most lasting in minimally occupied regions. Documented
major colonies and trading posts are summarized in
Figure 1A. We constructed pairs of testing sites generally
orthogonal to the anticipated background of the Neolithic
gradient originating in the Levant, resulting in localized
groups of tests. The Phoenician-influenced regions selected
were, thus, the coastal Lebanese Phoenician Heartland and
the broader area of the rest of the Levant (the ‘‘Phoenician
Periphery’’); then Cyprus and South Turkey; then Crete;
then Malta and East Sicily; then South Sardinia, Ibiza,
and Southern Spain; and, finally, Coastal Tunisia and cities
like Tingris in Morocco (Figures 1B and 1C). For each, we
identified nearby sites of lesser or no Phoenician contact.
Examples of the comparisons used thus include heartland
versus periphery, colony versus trading center, and trading
center versus noncontact sites.
In addition, we sought to discriminate Phoenician can-
didate lineages from those spread by other colonization ex-
pansions affecting many of the same islands and regions.
We constructed a Neolithic-expansion test set by choosing
paired sites from the region, both of which lacked known
Phoenician contact, and comparing the site closer to the
Levant with that farther away (Table 1 and Table S3, avail-
able online). The colonization by Greeks and later groups
occurred largely into regions still unoccupied by the Phoe-
nicians, yielding colonial segregation; Greek sites are also
shown in Figure 1A. We wished to design similar tests to
evaluate a potential signature of the Jewish Diaspora.
This, however, proved problematic. At the time of the Ro-
man destruction of Herod’s Temple in 70 CE, there were
already more Jews living outside than within Israel.13
The dispersals through time and space were complex,
with communities being established and dispersed, some-
The Am
times on multiple occasions. It was, thus, difficult to iden-
tify any locality where significant Jewish settlement did
not occur for at least some period.14 Therefore, our ap-
proach was not suitable for identifying lineages associated
with the Jewish Diaspora, which has already been well
studied with the use of other approaches.15
Data from Lebanon were available,16 and we collected
1330 additional DNA samples from Syrian, Palestinian, Tu-
nisian, Moroccan, Cypriote, and Maltese males with at least
three generations of indigenous ancestry. Each provided in-
formation on their geographical origin and gave informed
consent for this study. Samples were typed with 11 STRs
and with 58 Y-SNPs as described elsewhere16 (Table S1).
We augmented our collection with suitable published
data on 5,899 males from 56 sites (Table S2). Desirable sites
that we were unable to include in our analysis included
Libya and southern France, both of which could have pro-
vided more Greek coastal-settlement sites. The Y-chromo-
somal data were of two types: haplogroup data based on
Y-SNPs and haplotype data based on Y-STRs. Although
both types are carried on the same chromosome and are
correlated,17 they were analyzed separately, because they
have different mutational properties and because some
data sets contain only one of the two data types. A reduced
set of haplogroups that captured most of the SNP informa-
tion was used as previously.16 It was also necessary to de-
velop a similar procedure for the STR information by enu-
merating the regions and sizes of samples captured by
various combinations of STR subsets, through a process in-
formed by association-discovery methods.18 We identified
subsets containing seven STRs that maximized regional
coverage and sample number, yielding the STRs DYS19,
DYS389I, DYS389b (consisting of DYS389II–DYS389I),
DYS390, DYS391, DYS392, and DYS393. We lost STR cover-
age of some regions, reducing the number of tests that were
applied to the STR set. The geographical coverage of the STR
samples and the SNP samples was not identical, and the re-
gional tests that could be constructed from historical refer-
ences were not identical for both genetic marker types. For
example, Moroccan samples were included and tested in
the STR set but not in the SNP-typed set.
The tests were constructed and validated in several ways.
First, a noncontact test-pair matrix was constructed for de-
tecting general east-to-west background variation reflect-
ing Neolithic migrations, and the data were evaluated for
significant results reflecting general non-Phoenician back-
ground variation against which the Phoenician pattern
must be identified. Second, a colonization test-pair matrix
for identification of gross features of the subsequent and
more widespread Greek colonization event was applied.
The Greek test sought to identify features typical of the
Greek expansion but focused on those characteristics dis-
tinct from the Phoenician expansion. Third, the Phoeni-
cian colonization of Tunisia presented a unique test be-
tween the colonized coastal regions and interior Berber
and Arab populations, because it has a different Neolithic
history19 and no intervening Greek-colonization events.
erican Journal of Human Genetics 83, 1–10, November 7, 2008 3

Table 1. Y-SNP Haplogroup Colonization-Site Gradient Tests with Aggregate Scores for Phoenician Colonies, NeolithicBackgrounda, and Greek Colonies
Tests E3b G I J*(xJ2) J2 K2 L R1a R1b
Phoenician Test Sites
Heartland versus Periphery 0.574 0.986 0.012 1.000 0.011 0.137 0.0002 0.894 0.003
�1 �1 þ1 �1 þ1 þ1 þ1 �1 þ1
Homeland versus Levant 0.968 0.833 0.260 1.000 0.000 0.188 0.0002 0.033 0.001
�1 �1 þ1 �1 þ1 þ1 þ1 þ1 þ1
Cyprus versus S. Turkey 0.249 1.0 0.337 0.963 0.150 0.586 � 0.957 0.973
þ1 �1 þ1 �1 þ1 þ1 � �1 �1
S. Turkey versus N. Turkey 0.278 0.860 0.794 0.233 0.449 0.541 1.000 0.194 0.417
þ1 �1 �1 þ1 þ1 þ1 �1 þ1 þ1
Lowland Crete versus Lasithi Plateau 0.211 0.685 0.436 0.858 0.000 0.905 � 0.988 1.000
þ1 �1 þ1 �1 þ1 �1 � �1 �1
Crete versus Greece 0.994 0.783 0.989 0.624 0.0003 0.338 � 0.897 0.145
�1 �1 �1 þ1 þ1 þ1 � �1 þ1
Malta versus Sicily 1.000 0.561 0.434 1.000 0.016 1.000 � 0.083 0.653
�1 0 þ1 �1 þ1 �1 � þ1 �1
W. Sicily versus E. Sicily 0.962 0.035 0.0711 0.0893 0.973 0.814 � 0.666 0.131
�1 þ1 þ1 �1 �1 �1 � 0 þ1
Sicily versus S. Italy 0.816 0.936 0.376 0.573 0.208 0.570 � 0.788 0.692
�1 �1 þ1 þ1 þ1 þ1 � �1 þ1
S. Sardinia versus N. Sardinia 0.736 0.935 0.123 0.141 0.206 � � 0.677 0.561
�1 �1 þ1 þ1 þ1 � � þ1 �1
Ibiza versus Mallorca & Minorca 0.846 0.046 0.956 1.000 0.842 0.000 � 1.000 0.941
�1 þ1 �1 �1 �1 þ1 � �1 �1
S. Spain versus Valencia 0.767 0.317 0.896 0.738 0.142 1.000 � 0.738 0.539
�1 þ1 �1 �1 �1 �1 � �1 þ1
Contact Spain versus Iberia 0.879 0.988 0.259 0.807 0.176 0.385 � 0.141 0.197
�1 �1 þ1 0 þ1 þ1 � þ1 þ1
Coastal Tunisa versus Inland Tunisia 0.890 � � � 0.0013 0.863 � 1.000 0.952
�1 � � � þ1 �1 � �1 �1
a ¼ 0.05 1.000 0.135 0.486 1.000 3.3 3 10�5 0.486 0.0073 0.512 0.153
a ¼ 0.30 0.839 0.936 0.579 0.798 2.5 3 10�4 0.420 0.216 0.839 0.644
Df 0.993 0.987 0.133 0.927 0.0287 0.290 0.5 0.910 0.395
Control Test Sites
Turkey #5 versus Turkey #3 0.555 0.691 0.421 0.794 0.275 0.421 1.000 0.148 0.557
þ1 �1 þ1 þ1 þ1 þ1 �1 þ1 þ1
Turkey #8 versus Turkey #1 0.941 0.0252 0.866 0.987 0.982 0.366 0.601 0.750 0.315
�1 þ1 �1 �1 �1 þ1 þ1 �1 þ1
Greece versus Albania 0.578 0.655 0.988 0.944 0.735 0.605 0.605 0.499 0.157
0 þ1 �1 �1 �1 þ1 þ1 þ1 þ1
Serbia versus Croatia 0.013 0.724 1.000 � 0.022 � � 0.484 0.181
þ1 þ1 �1 � þ1 � � þ1 þ1
Italy WCL versus Italy NWA 0.058 0.760 0.553 0.580 0.036 � � 0.963 0.990
þ1 �1 þ1 þ1 þ1 � � �1 �1
Italy WCP versus Italy CMA 0.007 0.285 0.316 0.602 0.987 � � 0.570 0.725
þ1 þ1 þ1 þ1 �1 � � þ1 �1
Italy SLA versus Italy NEL 0.999 0.671 0.458 � 0.121 � � 0.471 0.617
�1 �1 þ1 � þ1 � � þ1 �1
Italy TLB versus Italy EBL 0.257 0.244 0.999 � 0.034 � � 0.840 0.960
þ1 þ1 �1 � þ1 � � �1 �1
S. Portugal versus N. Portugal 0.998 0.377 0.601 0.031 0.223 � � 0.246 0.583
�1 þ1 0 þ1 þ1 � � þ1 �1
S. Greece versus N. Greece 0.229 0.511 0.071 0.974 0.418 0.694 1.000 1.000 0.3000
þ1 þ1 þ1 �1 þ1 0 �1 �1 þ1
S. Egypt versus N. Egypt 0.984 0.164 0.402 0.153 0.931 0.176 � 1.000 0.409
�1 þ1 þ1 þ1 �1 þ1 � �1 þ1
a ¼ 0.05 0.102 0.432 0.432 0.337 0.015 1.000 1.000 1.000 1.000
a ¼ 0.30 0.210 0.828 0.980 0.748 0.078 0.760 1.000 0.887 0.887
Df 0.377 0.113 0.377 0.363 0.274 0.688 0.688 0.500 0.500
4 The American Journal of Human Genetics 83, 1–10, November 7, 2008
Please cite this article in press as: Zalloua et al., Identifying Genetic Traces of Historical Expansions: Phoenician Footprints in the Mediter-ranean, The American Journal of Human Genetics (2008), doi:10.1016/j.ajhg.2008.10.012
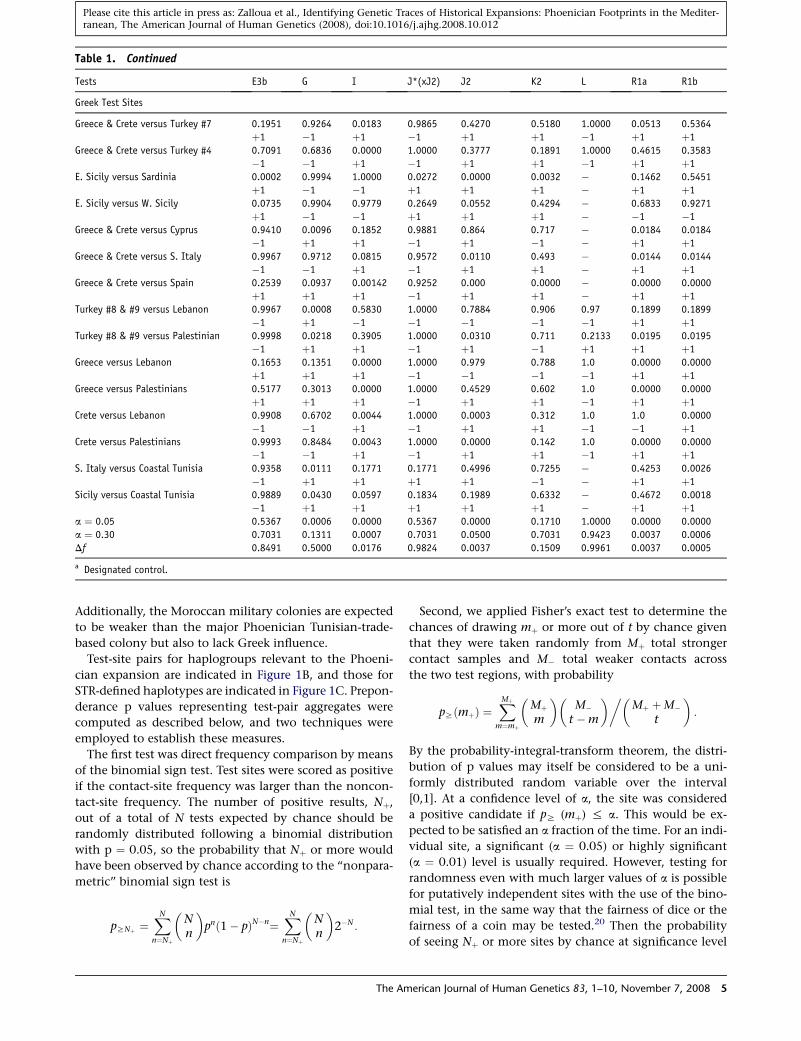
Table 1. Continued
Tests E3b G I J*(xJ2) J2 K2 L R1a R1b
Greek Test Sites
Greece & Crete versus Turkey #7 0.1951 0.9264 0.0183 0.9865 0.4270 0.5180 1.0000 0.0513 0.5364
þ1 �1 þ1 �1 þ1 þ1 �1 þ1 þ1
Greece & Crete versus Turkey #4 0.7091 0.6836 0.0000 1.0000 0.3777 0.1891 1.0000 0.4615 0.3583
�1 �1 þ1 �1 þ1 þ1 �1 þ1 þ1
E. Sicily versus Sardinia 0.0002 0.9994 1.0000 0.0272 0.0000 0.0032 � 0.1462 0.5451
þ1 �1 �1 þ1 þ1 þ1 � þ1 þ1
E. Sicily versus W. Sicily 0.0735 0.9904 0.9779 0.2649 0.0552 0.4294 � 0.6833 0.9271
þ1 �1 �1 þ1 þ1 þ1 � �1 �1
Greece & Crete versus Cyprus 0.9410 0.0096 0.1852 0.9881 0.864 0.717 � 0.0184 0.0184
�1 þ1 þ1 �1 þ1 �1 � þ1 þ1
Greece & Crete versus S. Italy 0.9967 0.9712 0.0815 0.9572 0.0110 0.493 � 0.0144 0.0144
�1 �1 þ1 �1 þ1 þ1 � þ1 þ1
Greece & Crete versus Spain 0.2539 0.0937 0.00142 0.9252 0.000 0.0000 � 0.0000 0.0000
þ1 þ1 þ1 �1 þ1 þ1 � þ1 þ1
Turkey #8 & #9 versus Lebanon 0.9967 0.0008 0.5830 1.0000 0.7884 0.906 0.97 0.1899 0.1899
�1 þ1 �1 �1 �1 �1 �1 þ1 þ1
Turkey #8 & #9 versus Palestinian 0.9998 0.0218 0.3905 1.0000 0.0310 0.711 0.2133 0.0195 0.0195
�1 þ1 þ1 �1 þ1 �1 þ1 þ1 þ1
Greece versus Lebanon 0.1653 0.1351 0.0000 1.0000 0.979 0.788 1.0 0.0000 0.0000
þ1 þ1 þ1 �1 �1 �1 �1 þ1 þ1
Greece versus Palestinians 0.5177 0.3013 0.0000 1.0000 0.4529 0.602 1.0 0.0000 0.0000
þ1 þ1 þ1 �1 þ1 þ1 �1 þ1 þ1
Crete versus Lebanon 0.9908 0.6702 0.0044 1.0000 0.0003 0.312 1.0 1.0 0.0000
�1 �1 þ1 �1 þ1 þ1 �1 �1 þ1
Crete versus Palestinians 0.9993 0.8484 0.0043 1.0000 0.0000 0.142 1.0 0.0000 0.0000
�1 �1 þ1 �1 þ1 þ1 �1 þ1 þ1
S. Italy versus Coastal Tunisia 0.9358 0.0111 0.1771 0.1771 0.4996 0.7255 � 0.4253 0.0026
�1 þ1 þ1 þ1 þ1 �1 � þ1 þ1
Sicily versus Coastal Tunisia 0.9889 0.0430 0.0597 0.1834 0.1989 0.6332 � 0.4672 0.0018
�1 þ1 þ1 þ1 þ1 þ1 � þ1 þ1
a ¼ 0.05 0.5367 0.0006 0.0000 0.5367 0.0000 0.1710 1.0000 0.0000 0.0000
a ¼ 0.30 0.7031 0.1311 0.0007 0.7031 0.0500 0.7031 0.9423 0.0037 0.0006
Df 0.8491 0.5000 0.0176 0.9824 0.0037 0.1509 0.9961 0.0037 0.0005
a Designated control.
Please cite this article in press as: Zalloua et al., Identifying Genetic Traces of Historical Expansions: Phoenician Footprints in the Mediter-ranean, The American Journal of Human Genetics (2008), doi:10.1016/j.ajhg.2008.10.012
Additionally, the Moroccan military colonies are expected
to be weaker than the major Phoenician Tunisian-trade-
based colony but also to lack Greek influence.
Test-site pairs for haplogroups relevant to the Phoeni-
cian expansion are indicated in Figure 1B, and those for
STR-defined haplotypes are indicated in Figure 1C. Prepon-
derance p values representing test-pair aggregates were
computed as described below, and two techniques were
employed to establish these measures.
The first test was direct frequency comparison by means
of the binomial sign test. Test sites were scored as positive
if the contact-site frequency was larger than the noncon-
tact-site frequency. The number of positive results, Nþ,
out of a total of N tests expected by chance should be
randomly distributed following a binomial distribution
with p ¼ 0.05, so the probability that Nþ or more would
have been observed by chance according to the ‘‘nonpara-
metric’’ binomial sign test is
pRNþ ¼XN
n¼Nþ
�Nn
�pnð1� pÞN�n¼
XN
n¼Nþ
�Nn
�2�N :
The Am
Second, we applied Fisher’s exact test to determine the
chances of drawing mþ or more out of t by chance given
that they were taken randomly from Mþ total stronger
contact samples and M� total weaker contacts across
the two test regions, with probability
pRðmþÞ ¼XMþ
m¼mþ
�Mþm
��M�
t �m
���Mþ þM�
t
�:
By the probability-integral-transform theorem, the distri-
bution of p values may itself be considered to be a uni-
formly distributed random variable over the interval
[0,1]. At a confidence level of a, the site was considered
a positive candidate if pR (mþ) % a. This would be ex-
pected to be satisfied an a fraction of the time. For an indi-
vidual site, a significant (a ¼ 0.05) or highly significant
(a ¼ 0.01) level is usually required. However, testing for
randomness even with much larger values of a is possible
for putatively independent sites with the use of the bino-
mial test, in the same way that the fairness of dice or the
fairness of a coin may be tested.20 Then the probability
of seeing Nþ or more sites by chance at significance level
erican Journal of Human Genetics 83, 1–10, November 7, 2008 5
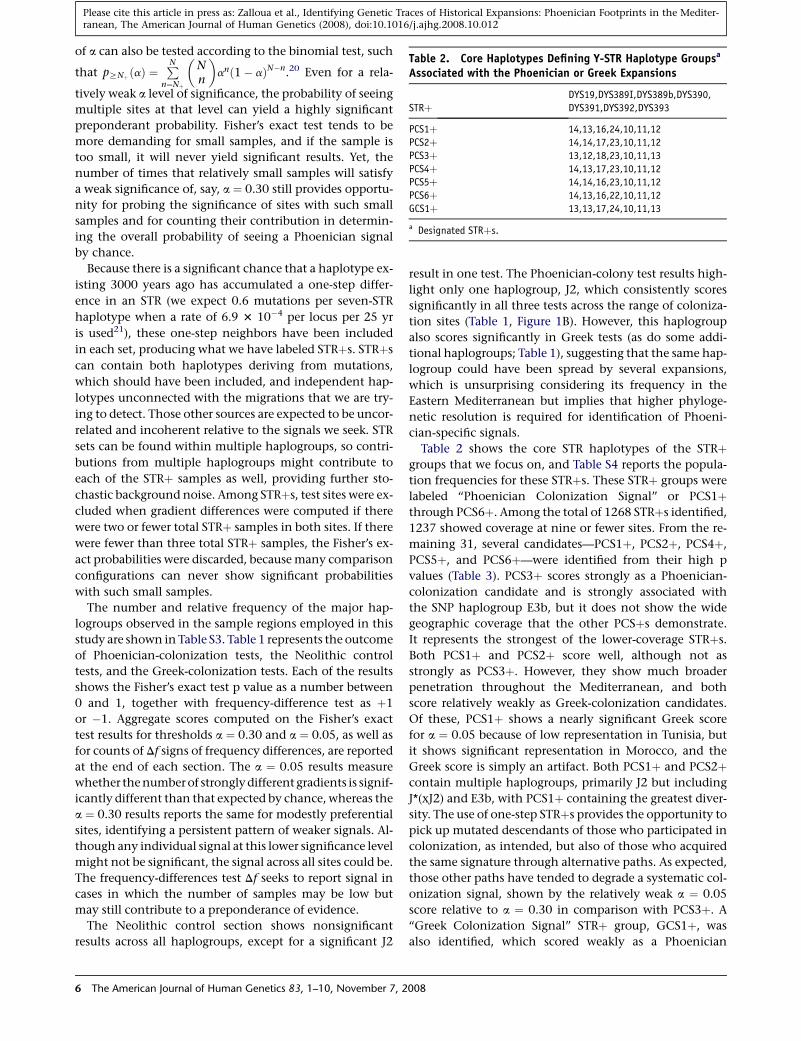
Table 2. Core Haplotypes Defining Y-STR Haplotype Groupsa
Associated with the Phoenician or Greek Expansions
STRþDYS19,DYS389I,DYS389b,DYS390,
DYS391,DYS392,DYS393
PCS1þ 14,13,16,24,10,11,12
PCS2þ 14,14,17,23,10,11,12
PCS3þ 13,12,18,23,10,11,13
PCS4þ 14,13,17,23,10,11,12
PCS5þ 14,14,16,23,10,11,12
PCS6þ 14,13,16,22,10,11,12
GCS1þ 13,13,17,24,10,11,13
a Designated STRþs.
Please cite this article in press as: Zalloua et al., Identifying Genetic Traces of Historical Expansions: Phoenician Footprints in the Mediter-ranean, The American Journal of Human Genetics (2008), doi:10.1016/j.ajhg.2008.10.012
of a can also be tested according to the binomial test, such
that pRNþðaÞ ¼PN
n¼Nþ
�Nn
�anð1� aÞN�n.20 Even for a rela-
tively weak a level of significance, the probability of seeing
multiple sites at that level can yield a highly significant
preponderant probability. Fisher’s exact test tends to be
more demanding for small samples, and if the sample is
too small, it will never yield significant results. Yet, the
number of times that relatively small samples will satisfy
a weak significance of, say, a ¼ 0.30 still provides opportu-
nity for probing the significance of sites with such small
samples and for counting their contribution in determin-
ing the overall probability of seeing a Phoenician signal
by chance.
Because there is a significant chance that a haplotype ex-
isting 3000 years ago has accumulated a one-step differ-
ence in an STR (we expect 0.6 mutations per seven-STR
haplotype when a rate of 6.9 3 10�4 per locus per 25 yr
is used21), these one-step neighbors have been included
in each set, producing what we have labeled STRþs. STRþs
can contain both haplotypes deriving from mutations,
which should have been included, and independent hap-
lotypes unconnected with the migrations that we are try-
ing to detect. Those other sources are expected to be uncor-
related and incoherent relative to the signals we seek. STR
sets can be found within multiple haplogroups, so contri-
butions from multiple haplogroups might contribute to
each of the STRþ samples as well, providing further sto-
chastic background noise. Among STRþs, test sites were ex-
cluded when gradient differences were computed if there
were two or fewer total STRþ samples in both sites. If there
were fewer than three total STRþ samples, the Fisher’s ex-
act probabilities were discarded, because many comparison
configurations can never show significant probabilities
with such small samples.
The number and relative frequency of the major hap-
logroups observed in the sample regions employed in this
study are shown in Table S3. Table 1 represents the outcome
of Phoenician-colonization tests, the Neolithic control
tests, and the Greek-colonization tests. Each of the results
shows the Fisher’s exact test p value as a number between
0 and 1, together with frequency-difference test as þ1
or �1. Aggregate scores computed on the Fisher’s exact
test results for thresholds a ¼ 0.30 and a ¼ 0.05, as well as
for counts of Df signs of frequency differences, are reported
at the end of each section. The a ¼ 0.05 results measure
whether the number of strongly different gradients is signif-
icantly different than that expected by chance, whereas the
a ¼ 0.30 results reports the same for modestly preferential
sites, identifying a persistent pattern of weaker signals. Al-
though any individual signal at this lower significance level
might not be significant, the signal across all sites could be.
The frequency-differences test Df seeks to report signal in
cases in which the number of samples may be low but
may still contribute to a preponderance of evidence.
The Neolithic control section shows nonsignificant
results across all haplogroups, except for a significant J2
6 The American Journal of Human Genetics 83, 1–10, November 7, 2
result in one test. The Phoenician-colony test results high-
light only one haplogroup, J2, which consistently scores
significantly in all three tests across the range of coloniza-
tion sites (Table 1, Figure 1B). However, this haplogroup
also scores significantly in Greek tests (as do some addi-
tional haplogroups; Table 1), suggesting that the same hap-
logroup could have been spread by several expansions,
which is unsurprising considering its frequency in the
Eastern Mediterranean but implies that higher phyloge-
netic resolution is required for identification of Phoeni-
cian-specific signals.
Table 2 shows the core STR haplotypes of the STRþgroups that we focus on, and Table S4 reports the popula-
tion frequencies for these STRþs. These STRþ groups were
labeled ‘‘Phoenician Colonization Signal’’ or PCS1þthrough PCS6þ. Among the total of 1268 STRþs identified,
1237 showed coverage at nine or fewer sites. From the re-
maining 31, several candidates—PCS1þ, PCS2þ, PCS4þ,
PCS5þ, and PCS6þ—were identified from their high p
values (Table 3). PCS3þ scores strongly as a Phoenician-
colonization candidate and is strongly associated with
the SNP haplogroup E3b, but it does not show the wide
geographic coverage that the other PCSþs demonstrate.
It represents the strongest of the lower-coverage STRþs.
Both PCS1þ and PCS2þ score well, although not as
strongly as PCS3þ. However, they show much broader
penetration throughout the Mediterranean, and both
score relatively weakly as Greek-colonization candidates.
Of these, PCS1þ shows a nearly significant Greek score
for a ¼ 0.05 because of low representation in Tunisia, but
it shows significant representation in Morocco, and the
Greek score is simply an artifact. Both PCS1þ and PCS2þcontain multiple haplogroups, primarily J2 but including
J*(xJ2) and E3b, with PCS1þ containing the greatest diver-
sity. The use of one-step STRþs provides the opportunity to
pick up mutated descendants of those who participated in
colonization, as intended, but also of those who acquired
the same signature through alternative paths. As expected,
those other paths have tended to degrade a systematic col-
onization signal, shown by the relatively weak a ¼ 0.05
score relative to a ¼ 0.30 in comparison with PCS3þ. A
‘‘Greek Colonization Signal’’ STRþ group, GCS1þ, was
also identified, which scored weakly as a Phoenician
008

Table 3. STRþ Colonization Site Gradient Tests, with Aggregate Scores for Phoenician Colonies and Greek Colonies
STRþ Tests PCS1þ PCS2þ PCS3þ PCS4þ PCS5þ PCS6þ PCS1þ through PCS3þ GCS1þ
Phoenician Test Sites
Phoenician Heartland versus Phoenician Periphery 0.425 0.609 0.922 0.819 0.467 0.098 0.606 0.725
þ1 �1 �1 �1 �1 þ1 �1 �1
Phoenician Heartland versus Palestinians 0.000 0.078 0.370 0.156 0.004 0.014 0.000 0.983
þ1 þ1 þ1 þ1 þ1 þ1 þ1 �1
Phoenician Periphery versus Palestinians 0.000 0.079 0.080 0.042 0.012 0.272 0.000 0.943
þ1 þ1 þ1 þ1 þ1 þ1 þ1 �1
Syria versus Palestinians 0.241 0.034 � 0.858 0.247 0.969 0.022 0.961
þ1 þ1 þ1 �1 þ1 �1 þ1 �1
Cyprus versus N and S Turkey � � � � � � � �� � � � � � � �
S Turkey versus N Turkey � � � � � � � �� � � � � � � �
Crete versus Greece 0.093 0.194 � 0.030 0.257 0.016 0.040 0.876
þ1 þ1 � þ1 þ1 þ1 þ1 �1
Malta versus W Sicily and S Italy 0.498 0.029 � 0.005 � � 0.063 1.000
þ1 þ1 � þ1 � � þ1 �1
W Sicily versus E Sicily � � � � � � � �� � � � � � � �
All Sicily versus All Italy 0.926 0.411 0.248 0.805 0.850 0.956 0.623 0.574
�1 þ1 þ1 �1 �1 �1 �1 �1
S Spain versus Noncontact Iberia 0.337 0.841 � 0.872 0.679 1.000 0.519 0.981
þ1 �1 � �1 �1 �1 þ1 �1
Sardinia versus Italy 0.165 � � 0.220 0.136 0.179 0.219 1.000
þ1 �1 � þ1 þ1 þ1 þ1 �1
Sardinia versus Noncontact Iberia 0.053 1.000 � 0.069 0.045 0.037 0.104 1.000
þ1 �1 � þ1 þ1 þ1 þ1 �1
Coastal Tunisia versus Inland Tunisia � 0.177 0.006 0.021 � � 0.001 0.304
� þ1 þ1 þ1 þ1 � þ1 þ1
All Tunisia versus Morocco 1.000 0.059 0.000 0.868 1.000 1.000 0.245 0.039
�1 þ1 þ1 �1 �1 �1 þ1 þ1
a ¼ 0.05 0.102 0.101 0.032 0.0022 0.012 0.012 0.0002 0.460
a ¼ 0.30 0.078 0.022 0.070 0.039 0.047 0.047 0.0017 0.986
Df 0.033 0.193 0.063 0.387 0.274 0.377 0.019 0.997
Greek Test Sites
Crete and Greece versus Cyprus 1.0000 0.9954 1.0000 1.0000 1.0000 1.0000 1.0000 0.0000
�1 �1 �1 �1 �1 �1 �1 þ1
Crete and Greece versus Sicily 0.4261 0.0590 1.0000 0.3608 0.7137 0.9429 0.3181 0.0000
þ1 þ1 �1 þ1 �1 �1 þ1 þ1
Crete and Greece versus S Italy 0.734 0.046 � 0.490 0.731 0.869 0.188 0.000
�1 þ1 � þ1 �1 �1 þ1 þ1
S Italy versus N Italy 0.939 � � 0.933 0.951 0.990 0.620 0.362
�1 � � �1 �1 �1 �1 þ1
Crete and Greece versus Malta 0.871 0.908 � 1.000 0.294 0.443 0.934 0.000
�1 �1 � �1 þ1 þ1 �1 þ1
Crete and Greece versus Iberia 0.477 0.400 � 0.249 0.600 0.713 0.184 0.006
þ1 þ1 � þ1 þ1 �1 þ1 þ1
Turkey versus Phoenician Heartland and Periphery � � � � � � � �� � � � � � � �
Turkey versus Syria � � � � � � � �� � � � � � � �
Crete versus Phoenician Heartland and Periphery 0.815 0.390 1.0 0.862 0.939 0.949 0.759 0.000
�1 þ1 �1 �1 �1 �1 �1 þ1
Crete versus Syria 0.272 0.618 � 0.367 0.754 0.349 0.408 0.000
þ1 �1 � þ1 �1 þ1 þ1 þ1
Sicily versus Tunisia 0.014 0.605 1.000 0.749 0.053 0.004 0.906 0.426
þ1 �1 �1 �1 þ1 þ1 �1 þ1
S Italy versus Coastal Tunisia 0.1255 1.0000 1.000 0.9171 0.4131 0.1802 0.9936 0.6772
þ1 �1 �1 �1 þ1 þ1 �1 �1
a ¼ 0.05 0.4013 0.3698 1.0000 1.0000 1.0000 0.4013 1.0000 0.0000
a ¼ 0.30 0.6172 0.8040 1.0000 0.9718 0.8507 0.9718 0.8507 0.0106
Df 0.6230 0.7461 1.0000 0.8281 0.8281 0.8281 0.8281 0.0107
The American Journal of Human Genetics 83, 1–10, November 7, 2008 7
Please cite this article in press as: Zalloua et al., Identifying Genetic Traces of Historical Expansions: Phoenician Footprints in the Mediter-ranean, The American Journal of Human Genetics (2008), doi:10.1016/j.ajhg.2008.10.012

Please cite this article in press as: Zalloua et al., Identifying Genetic Traces of Historical Expansions: Phoenician Footprints in the Mediter-ranean, The American Journal of Human Genetics (2008), doi:10.1016/j.ajhg.2008.10.012
candidate but showed a strong score on the complemen-
tary Greek test matrix.
All of the PCS1þ through PCS3þ candidate central hap-
lotypes are more than two steps away from each other,
so the STRþs share no STR haplotypes. Therefore, their
frequencies can be combined if sample counts are added
together row by row to represent an aggregate PCS1þthrough PCS3þ group. In general, across most geographi-
cal sites, the PCS1þ, PCS2þ, and PCS3þ groups combined
to reinforce each other’s Phoenician signals, boosting their
aggregate scores but not their Greek scores (Table 3). The
PCS1þ, PCS2þ, and PCS3þ frequencies in the Mediterra-
nean region are represented in Figures 1D–1F.
PCS4þ through PCS6þ are all closely related to PCS1þand PCS2þ. Both PCS4þ and PCS5þ overlap PCS2þ;
PCS6þ does not, but shares a bridge PCSþ group (core
14,13,16,23,10,11,12) with both PCS1þ and PCS2þ. Com-
bining PCS4þ through PCS6þ with PCS1þ or PCS2þwould thus yield overcounting of some groups. Therefore,
these are not included in the aggregate PCS1þ through
PCS3þ group. It is notable that the range of STRþs in the
cluster associated with PCS1þ and PCS2þ spans a range
of five or six STR mutations, far in excess of that expected
to emerge in the time since the Phoenician expansion. Al-
though each STRþ covers geographically distinct colonies,
each is rooted in the Phoenician heartland. This argues for
a common source of related lineages rooted in Lebanon.
It can be deduced from the structure of the tests that ad-
mixture from other occupation of both Phoenician non-
contact sites and contact sites would tend to systematically
wash out the significance of a Phoenician signal through-
out the range of the Phoenician Colony Specific test sites.
For example, one of the five samples from Sardinia was
PCS1þ. Compared to Italy, at five out of 187, the probabil-
ity of drawing this fraction by chance was 0.258, as re-
ported in Table 3. If only 20% of the samples found in Italy
were added to Sardinia’s signal, this would have yielded
two out of 47 for Sardinia, yielding a probability of
0.378, outside the a ¼ 0.30 threshold. Likewise, 30% of
the Greek contribution of Crete in PCS1þ would raise
the Fisher’s exact probability from 0.173 to 0.328. The
fact that this dilution did not systematically destroy a pre-
ponderant Phoenician signal argues that such admixture
has been low enough to allow the isolation of components
that were systematically Phoenician. The results presented
here suggest that any additional expansions, such as the
Jewish Diaspora, and subsequent population effects
showed sufficiently low admixture or drift into both colo-
nization sites and surrounding populations for a Phoeni-
cian signal to remain significant.
Haplogroup J2, in general, and haplotypes PCS1þthrough PCS6þ therefore represent lineages that might
have been spread by the Phoenicians; but could the patterns
that we observe be accounted for by other events, particu-
larly the Jewish Diaspora, for which we could not develop
a formal test? Note that this is a separate question from
that of whether they could also have been spread by other
8 The American Journal of Human Genetics 83, 1–10, November 7, 2
expansions: indeed, we expect that Jews of the Diaspora car-
ried some of the same STRþ and SNP lineages with them as
did Phoenicians of Phoenician expansion. Two lines of rea-
soning suggest to us that we must be detecting a distinct sig-
nal. First, the frequency of Jews in the Mediterranean region
over almost all of our sample sites is currently less than 0.1%,
and our own collection of samples contained no individuals
who identified themselves as bearing Jewish heritage in
a number of sites, such as Tunisia and Morocco.22,23 Al-
though historical admixture is expected to have occurred
to some extent, recent studies tend to show strikingly low
admixture in modern Jewish populations.15 Second, any
such admixture is likely to have contributed to both Phoeni-
cian contact and noncontact populations and thus could
not explain a systematically differential signal. The excess
of J2 (Figure 1B), PCS1þ (Figures 1C and 1D), PCS2þ(Figure 1E), and PCS3þ (Figure 1F) in coastal Tunisia, the
site of Carthage, compared with inland Tunisia is particu-
larly salient, because these lineages are considerably more
rare in North Africa than in Southern Europe. It also suggests
that the Roman destruction of Carthage did not eliminate
the Carthaginian gene pool. Further support for the PCSþhaplotypes’ spread with the Phoenicians is illustrated by
their generally high frequency among the Phoenician con-
tact sites across the Mediterranean basin (Figures 1D–1F).
The Greek expansion was not the focus of this study, but
it nevertheless revealed several signals. In this case, two ex-
pansions from Western Europe that probably spread R1b
chromosomes could potentially yield a ‘‘Greek’’ profile. Ac-
cording to Strabo, Brennus ‘‘the second’’ of the Prausi was
attracted to Greece by internecine conflicts in 281 BCE.
Subsequently, some of these people moved to Thracia in
the north, with 20,000 of those moving to Galatia in the
north-central Anatolian peninsula in 279–277 BCE.24 Sub-
sequent European genetic transfer occurred with the Cru-
sades16 and with European trade, leaving a general north-
to-south gradient of R1b chromosomes, with a substantial
concentration in Greece and Turkey, yielding a pattern
that could resemble Greek colonization.
This study presents a methodology for constructing sys-
tematic tests identifying local signatures of colonization
and for constructing aggregate scores measuring a consen-
sus across all of the colonization sites. We have shown that
the methodology does not produce significant signal for
arbitrary sampling in noncolonization regions, and multi-
ple markers that do not show patterns consistent with
Phoenician colonization have been presented. Tests con-
structed to isolate Greek-colonization events from the
Phoenician samples can show positive and weak scores
both for Phoenician candidates and for non-Phoenician
candidates, indicating that information is presented in
those tests distinct from the Phoenician-colonization tests.
Application of this methodology to STR samples was
more problematic as a result of prohibitively small samples
at some sites and of nonuniform sample collection
throughout the Mediterranean at this level of resolution,
even when STR-only data were included. Smaller
008

Table 4. Number of Sites, k, with p Value Stronger thanSignificance Level a out of a Total of N Sites Tested that AreRequired for the Aggregate to Pass at the 5% SignificanceLevel
N k (a ¼ 0.30) k (a ¼ 0.05)
1 - 1
2 - 2
3 3 2
4 4 2
5 4 2
6 5 2
7 5 2
8 6 3
9 6 3
10 6 3
11 7 3
12 7 3
13 8 3
14 8 3
15 9 3
Please cite this article in press as: Zalloua et al., Identifying Genetic Traces of Historical Expansions: Phoenician Footprints in the Mediter-ranean, The American Journal of Human Genetics (2008), doi:10.1016/j.ajhg.2008.10.012
collections limit the statistical power to resolve signals at
any of the particular sites. With the possibility of single-
step STR mutations in the intervening time allowed for,
identification of candidate groups (STRþs) was possible. Al-
though true mutated descendants will systematically aug-
ment the strength of the statistical resolution, this expan-
sion of samples will also allow inclusion of identical-by-
state haplotypes with distinct histories that might even de-
rive from other haplogroups. In conclusion, there are
many ways in which a colonization signal could be diluted
to undetectable levels, but statistically robust signals
should represent biologically meaningful events.
We do not suggest that the Phoenicians spread only or
predominantly J2 and PCS1þ through PCS6þ lineages.
They are likely to have spread many lineages from multiple
haplogroups, but the lineages we highlight are the most
highly differentiated ones providing the most readily de-
tectable signals. Signals can only be detected when the
same or related haplotypes were transmitted to multiple lo-
cations. Because most haplotypes are rare, the use of STRþs
rather than individual haplotypes, and perhaps the prefer-
ential spread of a subset of pioneering or influential Phoe-
nician families, might have enhanced our signal. The mag-
nitude of the Phoenician contribution to the populations
investigated was estimated from the candidate STRþ’s
prevalence in colony versus noncolony sites. Although
the total fraction of colony samples contained within the
PCS1þ through PCS3þ group is around 10%, it is the frac-
tion above background, or the difference in frequencies be-
tween contact and noncontact sites (Table S4), that actu-
ally represents Phoenician signal. The mean difference in
frequency was ~6%, providing a minimum estimate of
the Phoenician input.
Given that these same lineages, including the STR haplo-
types, were clearly spread in other ways as well, their identi-
fication in additional subjects would not in itself provide ev-
idence that such people were of Phoenician descent. This,
however, is a reflection of the limited phylogenetic resolu-
tion used, and it is reasonable to expect that future thor-
ough searches for SNPs or STR combinations could lead to
the discovery of rare but reliable markers of such descent.
The technology for resequencing individual genomes at
ever-decreasing cost makes this a realistic prospect.24
Finally, our work underscores the effectiveness of Y-chro-
mosomal variability when combined with appropriate
computational analysis for studying complex patterns of
human migration, as well as the utility of wide geographi-
cal sampling with the use of a uniform marker set. This
method is applicable to any type of genetic information
from which descent could be inferred, such as mtDNA or
autosomal regions with limited recombination, and within
which enough markers are available to establish phylog-
eny. The numbers of sites passing at a ¼ 0.3 and a ¼ 0.05
levels to produce aggregates significant at the 5% level
for various numbers of sites tested are outlined in Table 4.
Therefore, even rather small sets at relatively low levels of
significance can yield useful signal. Further applications
The Am
could include systematic investigations of military expan-
sions, such as the Greek signal, from the time of Alexander
the Great in central and south Asia;25 or the Mongol signal,
carried through the military and trade-regulation activities
to regions from China to Moscow26 and south through
North India, Iran, and Iraq. Trade and colonization with-
out substantial military intervention also drove wealth
and technological and cultural development. Examples
of ways that genetic migration was mediated might in-
clude the silk and spice roads, which connected China
with the Middle East through to Europe, as well as to spice
sources in India and Indonesia, and the Incense Road,
which connected India through the southern Arabian Pen-
insula. The Viking expansion involved not only raids but
also significant trade and colonization, in multiple
waves.27 Important African centers of trade include Tim-
buktu, with archaeological evidence showing that Great
Zimbabwe enjoyed goods from as far away as China. To
complement investigations of known migrations, our
methodology could also be used to search systematically
for signals of expansion within a data set, starting from
each site in turn, and could thus potentially discover unre-
corded migrations as well.
Supplemental Data
Supplemental Data include four tables and can be found with this
paper online at http://www.ajhg.org/.
Acknowledgments
We thank the sample donors for taking part in this study, R. John
Mitchell, Tad Schurr and other Genographic Project members for
comments. We also thank Janet Ziegle and Applied Biosystems
for genotyping support and Rabih Hosri for help with Figure 1.
Y.X. and C.T.S. were supported by The Wellcome Trust, and
M.A.J. by a Wellcome Trust Senior Fellowship in Basic Biomedical
Science (057559). The Genographic Project is supported by
erican Journal of Human Genetics 83, 1–10, November 7, 2008 9

Please cite this article in press as: Zalloua et al., Identifying Genetic Traces of Historical Expansions: Phoenician Footprints in the Mediter-ranean, The American Journal of Human Genetics (2008), doi:10.1016/j.ajhg.2008.10.012
funding from the National Geographic Society, IBM and the Waitt
Family Foundation.
Genographic Consortium members: Theodore G. Schurr (Uni-
versity of Pennsylvania, Philadelphia, PA, USA), Fabrıcio R. Santos
(Universidade Federal de Minas Gerais, Belo Horizonte, Minas Ger-
ais, Brazil), Lluis Quintana-Murci (Institut Pasteur, Paris, France),
Jaume Bertranpetit (Universitat Pompeu Fabra, Barcelona, Catalo-
nia, Spain), David Comas (Universitat Pompeu Fabra, Barcelona,
Catalonia, Spain), Chris Tyler-Smith (The Wellcome Trust Sanger
Institute, Hinxton, UK), Pierre A. Zalloua (Lebanese American Uni-
versity, Chouran, Beirut, Lebanon), Elena Balanovska (Russian
Academy of Medical Sciences, Moscow, Russia), Oleg Balanovsky
(Russian Academy of Medical Sciences, Moscow, Russia), R. John
Mitchell (La Trobe University, Melbourne, Victoria, Australia), Li
Jin (Fudan University, Shanghai, China), Himla Soodyall (National
Health Laboratory Service, Johannesburg, South Africa), Ramas-
amy Pitchappan (Madurai Kamaraj University, Madurai, Tamil
Nadu, India), Alan Cooper (University of Adelaide, South Aus-
tralia, Australia), Lisa Matisoo-Smith (University of Auckland,
Auckland, New Zealand), Ajay K. Royyuru (IBM, Yorktown
Heights, New York, USA), Daniel E. Platt (IBM, Yorktown Heights,
New York, USA), Laxmi Parida (IBM, Yorktown Heights, New York,
USA), Jason Blue-Smith (National Geographic Society, Washing-
ton, D.C., USA), David F. Soria Hernanz (National Geographic So-
ciety, Washington, D.C., USA), and R. Spencer Wells (National
Geographic Society, Washington, D.C., USA).
Received: September 11, 2008
Revised: October 11, 2008
Accepted: October 14, 2008
Published online: October 30, 2008
References
1. Stieglitz, R.R. (1990). The geopolitics of the Phoenician Littoral
in the Early Iron Age. Bull. Am. Schools Orient. Res. 279, 9–12.
2. Moscati, S. (1973). The World of Phoenicians (London: Wei-
denfeld and Nicolson Ltd.).
3. Markoe,G. (2000).Phoenicians (London:BritishMuseumPress).
4. Aubet, M.E. (2001). The Phoenicians and the West: Politics,
Colonies and Trade (Cambridge: Cambridge University Press).
5. Marston, E. (2002). The Phoenicians (New York: Benchmark
Books).
6. Harden, D. (1971). The Phoenicians (London: Penguin Books).
7. Jobling, M.A., and Tyler-Smith, C. (2003). The human Y chro-
mosome: an evolutionary marker comes of age. Nat. Rev.
Genet. 4, 598–612.
8. Rosser, Z.H., Zerjal, T., Hurles, M.E., Adojaan, M., Alavantic,
D., Amorim, A., Amos, W., Armenteros, M., Arroyo, E.,
Barbujani, G., et al. (2000). Y-chromosomal diversity in Eu-
rope is clinal and influenced primarily by geography, rather
than by language. Am. J. Hum. Genet. 67, 1526–1543.
9. Semino, O., Magri, C., Benuzzi, G., Lin, A.A., Al-Zahery, N.,
Battaglia, V., Maccioni, L., Triantaphyllidis, C., Shen, P.,
Oefner, P.J., et al. (2004). Origin, diffusion, and differentiation
of Y-chromosome haplogroups E and J: inferences on the Neo-
lithization of Europe and later migratory events in the Medi-
terranean area. Am. J. Hum. Genet. 74, 1023–1034.
10. Semino,O.,Passarino,G.,Brega,A., Fellous,M., andSantachiara-
Benerecetti, A.S. (1996). A view of the Neolithic demic diffusion
in Europe through two Y chromosome-specific markers. Am. J.
Hum. Genet. 59, 964–968.
10 The American Journal of Human Genetics 83, 1–10, November 7,
11. Semino, O., Passarino, G., Oefner, P.J., Lin, A.A., Arbuzova, S.,
Beckman, L.E., De Benedictis, G., Francalacci, P., Kouvatsi, A.,
Limborska, S., et al. (2000). The genetic legacy of Paleolithic
Homo sapiens sapiens in extant Europeans: a Y chromosome
perspective. Science 290, 1155–1159.
12. Mitchell, R.J., Earl, L., and Fricke, B. (1997). Y-chromosome
specific alleles and haplotypes in European and Asian popula-
tions: linkage disequilibrium and geographic diversity. Am. J.
Phys. Anthropol. 104, 167–176.
13. Tripolitis, A. (2001). Religions of the Hellenistic-Roman age
(Michigan: Wm. B. Eerdmans Publishing Company).
14. Barnavi E., ed. (1994). A Historical Atlas of the Jewish People:
From the Time of the Patriarchs to the Present (New York:
Schocken).
15. Behar, D.M., Garrigan, D., Kaplan, M.E., Mobasher, Z.,
Rosengarten, D., Karafet, T.M., Quintana-Murci, L., Ostrer,
H., Skorecki, K., and Hammer, M.F. (2004). Contrasting patterns
of Y chromosome variation in Ashkenazi Jewish and host non-
Jewish European populations. Hum. Genet. 114, 354–365.
16. Zalloua, P.A., Xue, Y., Khalife, J., Makhoul, N., Debiane, L.,
Platt, D.E., Royyuru, A.K., Herrera, R.J., Hernanz, D.F., Blue-
Smith, J., et al. (2008). Y-chromosomal diversity in Lebanon
is structured by recent historical events. Am. J. Hum. Genet.
82, 873–882.
17. Schlecht, J., Kaplan, M.E., Barnard, K., Karafet, T., Hammer,
M.F., and Merchant, N.C. (2008). Machine-learning ap-
proaches for classifying haplogroup from Y chromosome
STR data. PLoS Comput Biol 4, e1000093.
18. Agrawal, R., and Srikant, R. (1994). Fast Algorithms for Mining
Association Rules. Proceedings of the 20th International Con-
ference on Very Large Data Bases (VLDB ’94), pp 487–499.
19. Arredi, B., Poloni, E.S., Paracchini, S., Zerjal, T., Fathallah, D.M.,
Makrelouf, M., Pascali, V.L., Novelletto, A., and Tyler-Smith, C.
(2004). A predominantly Neolithic origin for Y-chromosomal
DNAvariation in North Africa. Am. J. Hum. Genet. 75, 338–345.
20. Sokal, R.R., and Rohlf, F.J. (1995). Biometry: The Principles
and Practice of Statistics in Biological Research (New York:
W. H. Freeman).
21. Zhivotovsky, L.A., Underhill, P.A., Cinnioglu, C., Kayser, M.,
Morar, B., Kivisild, T., Scozzari, R., Cruciani, F., Destro-Bisol,
G., Spedini, G., et al. (2004). The effective mutation rate at Y
chromosome short tandem repeats, with application to human
population-divergence time. Am. J. Hum. Genet. 74, 50–61.
22. Hanford J.V., ed. (2004). 2004 International Religious Free-
dom Report (Washington: U.S. Department of State).
23. DelaPergola, S. (2002). World Jewish Population 2002. In
American Jewish Yearbook 2002, D. Singer and L. Grossman,
eds. (NY: American Jewish Committee), pp. 247–274.
24. Mardis, E.R. (2008). The impact of next-generation sequenc-
ing technology on genetics. Trends Genet. 24, 133–141.
25. Firasat, S., Khaliq, S., Mohyuddin, A., Papaioannou, M., Tyler-
Smith, C., Underhill, P.A., and Ayub, Q. (2007). Y-chromo-
somal evidence for a limited Greek contribution to the Pathan
population of Pakistan. Eur. J. Hum. Genet. 15, 121–126.
26. Zerjal, T., Xue, Y., Bertorelle, G., Wells, R.S., Bao, W., Zhu, S., Qa-
mar, R., Ayub, Q., Mohyuddin, A., Fu, S., et al. (2003). The ge-
netic legacy of the Mongols. Am. J. Hum. Genet. 72, 717–721.
27. Bowden, G.R., Balaresque, P., King, T.E., Hansen, Z., Lee, A.C.,
Pergl-Wilson, G., Hurley, E., Roberts, S.J., Waite, P., Jesch, J.,
et al. (2008). Excavating past population structures by sur-
name-based sampling: the genetic legacy of the Vikings in
northwest England. Mol. Biol. Evol. 25, 301–309.
2008

ARTICLE
Y-Chromosomal Diversity in LebanonIs Structured by Recent Historical Events
Pierre A. Zalloua,1 Yali Xue,2 Jade Khalife,1 Nadine Makhoul,1 Labib Debiane,1 Daniel E. Platt,3
Ajay K. Royyuru,3 Rene J. Herrera,4 David F. Soria Hernanz,5 Jason Blue-Smith,5 R. Spencer Wells,5
David Comas,6 Jaume Bertranpetit,6 Chris Tyler-Smith,2,* and The Genographic Consortium7
Lebanon is an eastern Mediterranean country inhabited by approximately four million people with a wide variety of ethnicities and
religions, including Muslim, Christian, and Druze. In the present study, 926 Lebanese men were typed with Y-chromosomal SNP and
STR markers, and unusually, male genetic variation within Lebanon was found to be more strongly structured by religious affiliation
than by geography. We therefore tested the hypothesis that migrations within historical times could have contributed to this situation.
Y-haplogroup J*(xJ2) was more frequent in the putative Muslim source region (the Arabian Peninsula) than in Lebanon, and it was also
more frequent in Lebanese Muslims than in Lebanese non-Muslims. Conversely, haplogroup R1b was more frequent in the putative
Christian source region (western Europe) than in Lebanon and was also more frequent in Lebanese Christians than in Lebanese non-
Christians. The most common R1b STR-haplotype in Lebanese Christians was otherwise highly specific for western Europe and was un-
likely to have reached its current frequency in Lebanese Christians without admixture. We therefore suggest that the Islamic expansion
from the Arabian Peninsula beginning in the seventh century CE introduced lineages typical of this area into those who subsequently
became Lebanese Muslims, whereas the Crusader activity in the 11th–13th centuries CE introduced western European lineages into
Lebanese Christians.
Introduction
Compared with other ape species, humans show little
genetic variation, despite their much larger population
size and wider distribution, and this limited variation can
mostly be explained by geographical factors.1 Human pop-
ulations, however, can be classified in many other ways,
such as by language, ethnicity, or religion. Populations in
which these alternative factors have had a greater influ-
ence than geography on the distribution of genetic varia-
tion are unusual and merit particular attention. Here, we
describe the genetic structure of the peoples of Lebanon,
show that religion has had a strong influence on current
patterns of patrilineal variation, and identify historical
events that might underlie this unusual situation.
Lebanon is a small country on the eastern coast of the
Mediterranean (Figure 1). Just 4,015 square miles in area,
it is 1/60th the size of Texas and half the size of Wales.
This region was first occupied by fully modern humans
~47,000 years ago1 and appears to have remained habitable
even during the unfavorable conditions of the last glacial
maximum 18,000–21,000 years ago.2 It is close to the Fertile
Crescent where the West Asian Neolithic transition began
~10,000 years ago1, was conquered by the Assyrians, Bab-
ylonians, Persians, and Romans, and was visited by the
Egyptians and Greeks.3–6 Among well-documented events
within more recent historical times, three could potentially
The
have involved significant immigration into the country.
First, the Muslim expansion beginning in the 7th century
CE introduced the Islamic faith from its origin in the
Arabian Peninsula.7 Second, in the 11th–13th centuries CE,
the Crusades resulted in the establishment of enclaves by sub-
stantial numbers of European Christians. 3–5,7,8 Finally, in the
16th century CE, the Ottoman Empire expanded into this
region and remained until the early part of the 20th century.3
The current Lebanese population of almost four million peo-
ple thus consists of a wide variety of ethnicities and religions,
including Muslim, Christian, Druze, and others.
The Y chromosome carries the largest nonrecombining
segment in the human genome, and consequently its hap-
lotypes provide a rich source of information about male
history.9 We set out to establish the extent of Y-chromo-
somal variation in Lebanon to determine whether this
varies between subpopulations identified on the basis of
geographical origin or religious affiliation and, if it does,
to what extent such variation could be related to known
historic or prehistoric events.
Material and Methods
Subjects and Comparative DatasetsWe sampled 926 Lebanese men who had three generations of
paternal ancestry in the country and who gave informed consent
for this study, which was approved by the American University of
1The Lebanese American University, Chouran, Beirut 1102 2801, Lebanon; 2The Wellcome Trust Sanger Institute, Wellcome Trust Genome Campus, Hinx-
ton, Cambs, CB10 1SA, UK; 3Bioinformatics and Pattern Discovery, IBM T. J. Watson Research Center, Yorktown Hgts, NY 10598, USA; 4Department of
Biological Sciences, Florida International University, Miami, FL 33199, USA; 5The Genographic Project, National Geographic Society, Washington, DC
20036, USA; 6Unitat de Biologia Evolutiva, Departament de Ciences Experimentals i de la Salut, Universitat Pompeu Fabra, Doctor Aiguader 88, 08003
Barcelona, Catalonia, Spain7See Supplemental Data.
*Correspondence: [email protected]
DOI 10.1016/j.ajhg.2008.01.020. ª2008 by The American Society of Human Genetics. All rights reserved.
American Journal of Human Genetics 82, 873–882, April 2008 873

Figure 1. Map of Lebanon and Its Surrounding Regions Showing Historically Documented Migrations into Lebanon
Beirut IRB Committee. Each provided information on his geo-
graphical origin, classified into five regions: (1) Beirut (the capital
city), (2) Mount Lebanon in the center, (3) the Bekaa Valley in the
east, (4) the north, and (5) the south. Each also provided informa-
tion on his religious affiliation: (1) Muslim, including the sects
Shiite and Sunnite, (2) Christian, including the major sects Maro-
nite, Orthodox, and Catholic, and (3) Druze, a distinct religion
that has a 1000-year history and whose followers live mainly in
Syria and Lebanon.
Comparative data on haplogroup frequencies were obtained
from published sources and consenting individuals from the
Genographic Public Participation dataset, whose participants can
choose to make their data available for subsequent studies. For
the Arabian Peninsula, published data from Omani Arabs10, Qatar,
United Arab Emirates, and Yemen11 were used; in addition, we
used data from the Genographic Public Participation dataset for
individuals originating from Oman, Qatar, United Arab Emirates,
Yemen, and Saudi Arabia (Table S2 in the Supplemental Data).
Data from France12, Germany13, England14, and Italy15 were
used to construct a representative western European sample as
described below, and data from Turkey were also available.16
Combined Y-SNP plus Y-STR datasets were available from the
Arabian Peninsula10,11 and Turkey16. European data were extracted
from the consented Genographic Project Public Participation
database (Table S2).
Historical DataIn addition to the contemporary subjects, we needed estimates
of the likely genetic composition of the Crusaders. Historical
874 The American Journal of Human Genetics 82, 873–882, April 20
sources17–19 show that four Crusades reached Lebanon—the first,
second, third, and sixth—and that the main populations contrib-
uting were the French, Germans, English, and Italians; these sour-
ces suggest that the approximate numbers of men participating
from the four countries were similar (Table 1). Y haplogroup fre-
quencies are known in each of these modern populations12–15,
so if we assume that haplogroup frequencies were similar at the
time of the Crusades, a weighted average western European hap-
logroup composition can be constructed (Table 2). This needed
to be provided as numbers rather than frequencies for the tests de-
scribed below. We therefore first scaled the total contribution from
each country according to the smallest sample (the French12,
n ¼ 45) to produce the ‘‘weighted total’’ column in Table 2. We
then divided each weighted total by the haplogroup frequency
in that country to give a weighted number for each haplogroup
from each country. Finally, we calculated the sum of these
weighted numbers for each haplogroup and used the closest
integer (bottom row in Table 2) in the analyses below.
GenotypingSamples were genotyped with a set of 58 Y-chromosomal binary
markers by standard methods20 (Figure 2). These markers define
53 haplogroups (including paragroups), 27 of which were present
in the Lebanese sample. We also typed a subset (the first 587 indi-
viduals collected, and thus with unbiased ascertainment) with 11
Y-STRs by using standard methods21,22 (Table S1). STR alleles were
named according to current recommendations23, except that
‘‘389b’’ was used in place of ‘‘DYS389II’’; 398b ¼ (DYS389II �DYS389I).
08

General Statistical AnalysesAnalysis of molecular variance (AMOVA)24, population pairwise
genetic distances, and Mantel tests25 were performed with the
package Arlequin 3.11.26 Admixture analyses were carried out
with Admix2_0.27 Median-joining networks28 were calculated
with Network 4.2 (Fluxus-Engineering). Such networks were
highly reticulated, and we reduced reticulations by first weighting
the loci according to the inverse of their variance in the dataset
used29 and subsequently constructing a reduced-median net-
work30 to form the input of the median-joining network. Male
effective population sizes were calculated with BATWING31 with
a demographic model that assumed a period of constant size
followed by exponential growth; prior values were set for other
parameters as described previously.20
Computation of Drift ProbabilitiesWe wished to calculate the probability that a haplotype could in-
crease from a deduced initial frequency to an observed current fre-
quency by chance over a period specified by the historical record.
In addition, we wished to evaluate the influence that admixture
with an outside population might have on this probability. We
had detailed data consisting of Y-SNP and Y-STR sets for some
relevant groups and relied upon the YHRD database for data
from other populations. A number of applications are available
for estimating migration rates; these applications account for coa-
lescence, mutation, and migration, including estimates of varia-
tion of migration, over a period of time.32–38 However, none of
Table 1. Numbers of Men Contributing to Each of theCrusades that Reached Lebanon According to HistoricalSources17–19
Country
1st
Crusade
2nd
Crusade
3rd
Crusade
6th
Crusade Total Proportion
French 40,000 15,000 20,000 0 75,000 0.28
German 23,000 15,000 1,000 25,000 64,000 0.24
English 23,000 15,000 30,000 0 68,000 0.26
Italian 59,000 0 0 0 59,000 0.22
Total 145,000 45,000 51,000 25,000 266,000 1.00
The
the packages address the specific question of testing whether drift
alone could reasonably account for the emergence of modern
levels of haplogroup or haplotype frequencies in the population
or how much migration for a specified epoch could affect these
rates if the available historical information is incorporated. We
have therefore chosen to directly employ a Wright-Fisher model
with sampled migration to compute the effects of drift given an
admixture event of known duration.
The Wright-Fisher model39,40 entirely replaces each generation
with each succeeding one. The offspring select their parents ran-
domly. The following calculation outlines the Wright-Fisher drift
model, describing how the probability of seeing some particular
number of members of a population carrying a haplotype will
evolve over time. Then it considers the following circumstance:
Two populations are evolving according to the Wright-Fisher
model and the island model of Haldane41. First, a European popu-
lation carrying a particular haplotype of interest described below
(Western European Specific 1, WES1) experiences drift freely.
Over some period of time, some number of this population is se-
lected randomly and travels to Lebanon. Each generation, the chil-
dren randomly select their parents from the mixed Lebanese and
migrant European populations.
Given that a proportion p parents are of some particular
haplotype, the probability that the selected number X(t þ 1) of l
children out of an effective population of size N is
PðXðt þ 1Þ ¼ lÞ ¼ ðNlÞplð1� pÞN�l. Given that j out of N parents
are of the haplotype of interest, then p ¼ j/N. Therefore, the prob-
ability of finding l children of the haplotype of interest given j
parents is PðXðt þ 1Þ ¼ ljXðtÞ ¼ jÞ ¼ ðNlÞð j
NÞlð1� j
NÞN�l.
Given a distribution of probabilities P(X(t) ¼ j) of finding j
children of the haplotype of interest at some generation t, the
probability P(X(t þ 1) ¼ l) of finding l of the haplotype at time t þ 1
is PðXðt þ 1Þ ¼ lÞ ¼PN
j¼0 PðXðt þ 1Þ ¼ ljXðtÞ ¼ jÞPðXðtÞ ¼ jÞ. The
chances pf of finding at least some fraction f of that haplotype after
t ¼ T generations is pf ¼P
jRf ,N PðXðTÞ ¼ jÞ.We can extend the above argument to include the admixture
of one population with another if we replace the population
sampled by the children with an expanded pool that includes
contributions from the incoming population. In this case, a pop-
ulation labeled W carrying among them members of the WES1
haplotype mixes with a native Lebanese population labeled L.
Table 2. Construction of a Western European Y Haplogroup Sample Weighted According to the Relative Contribution from EachCountry
E3b G I J*(xJ2) J2 K2 L R1b Other Total Weighted total
European Y-Chromosomal Haplogroup Numbers from Previous Studies
French12 2 0 6 - 4 0 0 31 2 45 45
Germans13 75 -a 287 - 49 - - 473 331 1215 38.4
English14 24 - 163 3 25 - - 616 45 876 40.8
Italians15 88 75 52 14 140 - - 280 50 699 35.4
159.6
Weighted Numbers Used
French 2 0 6 0 4 0 0 31 2 45
German 2.4 0 9.1 0 1.5 0 0 14.9 10.5 38.4
English 1.1 0 7.6 0.1 1.2 0 0 28.7 2.1 40.8
Italy 4.5 3.8 2.6 0.7 7.1 0 0 14.2 2.5 35.4
Western European combined 9.9 3.8 25.3 0.8 13.8 0 0 88.8 17.1 159.6
Western European (integer) 10 4 25 1 14 0 0 89 17 160
a Rare haplogroup not typed in the relevant study; value set to zero.
American Journal of Human Genetics 82, 873–882, April 2008 875

Figure 2. Y-Chromosomal Haplogroups Identified in Lebanese SubpopulationsThe phylogenetic tree defined by the markers used is shown on the left, and the haplogroup names are given in the middle. Nomenclatureis based on the 2003 YCC tree9, with departures indicated by ‘‘/-’’. The absolute number of chromosomes within each haplogroup in theentire sample is shown in the ‘‘Lebanon’’ column, and the relative frequency within each of the three religious groups is shown on the rightby the relative sizes of the circles.
Given an effective population NL of Lebanese Christians and an
effective population NW of Europeans, the fraction of migrants
from which the next generation can choose will be m ¼ NW
NLþNW.
The fraction of Lebanese Christians bearing the WES1 marker
will be pL ¼ jLNL
, and that of Europeans will be pW ¼ jWNW
. The total
admixed fraction of WES1 presented to the next generation will
be pAðjL,jWÞ ¼ ð1�mÞpLþ mpW ¼ jL þ jWNL þNW
.
The number of WES1 individuals, jW, that traveled to Lebanon is
a random variable XW(t) that will have a distribution determined
by sampling NW admixing WES1 members from the European
population, which itself is experiencing drift with probability
876 The American Journal of Human Genetics 82, 873–882, April 20
P(XE(t) ¼ jE) in an effective European population NE. Therefore,
the distribution of jW will be determined by PðXWðtÞ ¼ jWÞ ¼PNE
jE¼0ðNW
jWÞð jE
NEÞjW ð1� jE
NEÞNW�jW PðXEðtÞ ¼ jEÞ. Then the admixed
probability PðXLðt þ 1Þ ¼ ljXLðtÞ ¼ jL,XWðtÞ ¼ jWÞ that l children
will have selected WES1 parents from NL Lebanese and NW
WES1 parents is PðXLðt þ 1Þ ¼ ljXLðtÞ ¼ jL,XWðtÞ ¼ jWÞ ¼ðNL
lÞðpAðjL,jWÞÞlð1� pAðjL,jWÞÞNL�l. If we sum over the distribu-
tions of jL and jL, the final probability distribution of possible
future selections of WES1 by the children will be
PðXLðtþ1Þ¼lÞ¼PNL
jL¼0
PNW
jW¼0 PðXLðtþ1Þ¼ljXLðtÞ¼ jL,XWðtÞ¼jWÞ3fPðXLðtÞ¼ jLÞPðXWðtÞ¼jWÞg. The initial condition of finding p0
08

assumed as an initial Lebanese fraction of the WES1 marker is
specified by requiring Pðj,0Þ¼ 1 where j¼Pp0NR
0 elsewhere
�.
Computations were performed in Cþþwith the binomial distri-
bution function implemented in the Gnu Scientific Library.42
Results
Genetic Structure within Lebanon
The Lebanese sample was subdivided geographically into
five subpopulations: one from the capital city, Beirut, and
four from other geographically distinct regions that in-
cluded the Bekaa in the east, the north, the south, and
the central Mount Lebanon. After excluding the Beirut
individuals because of their diverse recent origins, we esti-
mated the proportions of variation within and between
the geographical subpopulations on the basis of the hap-
logroup frequencies (Table 3). Even within this small
geographical area, a highly significant proportion of the
variation (0.39%, p< 0.01) was found between the regions,
a conclusion reinforced by the finding that genetic dis-
tances were significantly greater than zero between several
of the pairs of subpopulations when either Y-SNPs or Y-STRs
were used (Table 4). The total Lebanese sample could also be
subdivided according to religion (Muslim, Christian, or
Druze) or religious sect (Shiite, Sunnite, Maronite, or
Druze). Using these categories, we found that the propor-
tion of variation between the subpopulations was more
than three times higher (1.42%, 1.32%, both p<0.01; Table
3) than between the geographic regions. Again, many of the
genetic distances between religious groups or sects were
significant (Table 4). The divisions are not independent
because the religious communities show geographical clus-
tering, and when allowance was made for religious affilia-
tion (Muslim, Christian, Druze), a Mantel test25 showed
that no additional variation was explained by geographical
factors (the four regions).
Identification of Potential Sources for Lebanese
Genetic Structure
Because religious affiliation has the greatest impact on the
patterns of genetic variation in Lebanese populations, and
Table 3. Variation in Y-Chromosomal HaplogroupFrequencies between Subpopulations within Lebanon
Basis of Division Populations
Percentage of Variation
Within
Populations
Among
Populations
Geography Bekaa, Mt. Lebanon,
North, South
99.61 0.39a
Religious affiliation Muslim, Christian,
Druze
98.58 1.42a
Sect Shiite, Sunnite,
Maronite, Druze
98.68 1.32a
Variation was determined by an analysis of molecular variance.a p < 0.01.
The
because these religions have originated within historical
times, we first sought explanations for the genetic differ-
ences from the documented historical migrations: Muslim,
Crusader, and Ottoman (Figure 1). Using historical evi-
dence, we identified source regions for these migrations
in the Arabian Peninsula, western Europe, and Turkey,
respectively. We then collected suitable Y-chromosomal
SNP datasets from these areas. For the Arabian Peninsula
and Turkey this was simple, and data from France, Ger-
many, England, and Italy15 were used to construct a suit-
able western European sample as described in the Material
and Methods section. Because we needed to compare the
Lebanese data with the same haplogroups in these addi-
tional datasets, we combined some related haplogroups
to form eight haplogroups [E3b, G, I, J*(xJ2), J2, K2, L,
and R1b] that were each present in Lebanon at > 4%, to-
gether accounted for 90% of the Lebanese sample, and
could be compared with the categories used by other
authors (Table 5).
A standard approach to determining whether migration
from these countries might have contributed to the Leba-
nese population would be to perform an admixture analysis
with the putative source as one parental population. Taking
such an approach, we could identify possible contributions
Table 4. Pairwise Genetic Distances between LebaneseSubpopulations
Pairwise FST (SNPs)
Geographical
region
Beirut Bekaa Mt. Lebanon North
Bekaa �0.0028
Mt. Lebanon 0.0075b 0.0012
North 0.0086b 0.0004 0.0033b
South �0.0020 �0.0029 0.0101b 0.0047b
Religion Christian Druze
Druze 0.0117b
Muslim 0.0147b 0.0145b
Sect Druze Maronite Shiite
Maronite 0.0166b
Shiite 0.0186b 0.0195b
Sunnite 0.0115b 0.0145b 0.0000
Pairwise FST (STRs)
Geographical
region
Beirut Bekaa Mt. Lebanon North
Bekaa 0.0071
Mt. Lebanon 0.0099a 0.0056
North 0.0063 0.0037 0.0042
South 0.0001 0.0001 0.0081a 0.0061a
Religion Christian Druze
Druze 0.0060
Muslim 0.0117a 0.0073
Sect Druze Maronite Shiite
Maronite 0.0041
Shiite 0.0071 0.0179b
Sunnite 0.0134 0.0133b �0.0001
a p < 0.05.b p < 0.01.
American Journal of Human Genetics 82, 873–882, April 2008 877

Table 5. Haplogroup Fequencies in Lebanon and Potential Source Populations
E3b G I J*(xJ2) J2 K2 L R1b Other Total
Lebanon (number) 148 60 44 184 237 43 48 74 97 935
Lebanon (frequency) 0.158 0.064 0.047 0.197 0.253 0.046 0.051 0.079 0.104
Arabian Peninsula (number) 51 12 0 196 43 18 8 9 96 433
Arabian Peninsula (frequency) 0.118 0.028 0.000 0.453 0.099 0.042 0.018 0.021 0.222
p value Arabian Peninsula v Lebanon 0.0481 0.0049 0.0000 0.0000a 0.0000 0.7126 0.0043 0.0000
Western Europeans (estimated number) 10 4 25 1 14 0 0 89 17 160
Western Europeans (estimated frequency) 0.063 0.025 0.156 0.006 0.088 0.000 0.000 0.556 0.106
p value W. Europeans vs. Lebanon 0.0014 0.0274 0.0000a 0.0000 0.0000 0.0056 0.0033 0.0000a
Turkey (number) 56 57 28 48 127 13 22 83 89 523
Turkey (frequency) 0.107 0.109 0.054 0.092 0.243 0.025 0.042 0.159 0.170
p value Turkey vs. Lebanon 0.0068 0.0025 0.5839 0.0000 0.6523 0.0440 0.4270 0.0000a
a Significantly higher in source after Bonferroni correction.
from the Arabian Peninsula to Lebanese Muslims and from
western Europe to Lebanese Christians, but the uncer-
tainties in the estimates were large, and no meaningful
result was obtained when Turkey was used as a potential
source (Table 6). In order to investigate further, we then
compared individual haplogroup frequencies in Lebanon
and the putative source regions, and we identified hap-
logroups that differed significantly in frequency by using
a Chi-square test with a Bonferroni correction for multiple
testing. A number of haplogroups were found at signifi-
cantly higher frequency in the potential source region
than in Lebanon: J*(xJ2) in the Arabian Peninsula, I and
R1b in the western European sample, and R1b in Turkey
(Table 5). Because the extent to which the western European
sample used here might represent the Crusaders is uncer-
tain, we investigated the sensitivity of our conclusion to
the composition of this sample. Haplogroups I and R1b
were both present at higher frequency in each of the indi-
vidual populations, and the difference was significant for
R1b in all four populations and for I in two of them (Ger-
mans and English). No other haplogroup was at a signifi-
cantly higher frequency in any of the individual popula-
tions than in Lebanon. We therefore conclude that this is
a robust finding.
These observations, together with the historical infor-
mation, led us to formulate three specific hypotheses:
that many J*(xJ2) chromosomes were introduced into Leb-
anese Muslims by the Muslim expansion from the Arabian
Peninsula; that some I and R1b chromosomes were intro-
duced into Lebanese Christians by immigrating European
Christians, perhaps during the time of the Crusades; and
Table 6. Admixture Analyses
Parental 1 Parental 2 Admixed
Parental 1
Contribution
Arabian
Peninsula
Lebanese
non-Muslims
Lebanese Muslims 37%, SD 11%
Western
Europe
Lebanese
non-Christians
Lebanese Christians 10%, SD 7%
Turkey Lebanese
non-Muslims
Lebanese Muslims 38%, SD 68%
878 The American Journal of Human Genetics 82, 873–882, April 20
that additional R1b chromosomes were introduced into
Lebanese Muslims during the Ottoman expansion. We
do not, of course, imply that these migrations carried
only these haplogroups; obviously, they would have in-
volved populations containing multiple haplogroups.
The signal of migration, however, should be most readily
detected in the highly differentiated haplogroups. J*(xJ2)
Figure 3. Network of STR Variation within Haplogroup R1bCircles represent haplotypes defined by nine STRs; area is propor-tional to frequency, and color indicates the region of origin. Linesrepresent the mutational differences between haplotypes.
08

Figure 4. Geographical Distribution of WES1, the Most Common R1b Haplotype in Lebanese ChristiansThis haplotype is DYS19, DYS389I, DYS389b, DYS390, DYS391, DYS392, DYS393 14, 12, 16, 24, 10, 13, 13. Population samples containingthe haplotype are shown in red, and those lacking it are shown in blue. Note the highly specific western European distribution and theabsence of the haplotype from populations near Lebanon. Data are from YHRD.
was found to be much more frequent in Lebanese Muslims
than in Lebanese non-Muslims (25% vs. 15%, p < 0.0001).
The combined I þ R1b frequency was higher in Lebanese
Christians than in Lebanese non-Christians (16% vs.
10%, p¼ 0.01), as were both of the individual haplogroups
(I: 5.8% vs. 4.0%, p ¼ 0.21; R1b 10% vs. 6.3%, p ¼ 0.03),
although the difference for haplogroup I alone did not
reach statistical significance. The R1b frequency was,
however, significantly lower in Lebanese Muslims than in
Lebanese non-Muslims (4.7% vs. 11%, p ¼ 0.0005). The
hypotheses of male-mediated gene flow accompanying
the earlier Muslim and Crusader migrations are therefore
supported, but our data provide no evidence for a differen-
tial genetic impact of the Ottoman expansion.
Evidence for Migration from Haplotype Structure
Finally, we investigated the possible origins of the J*(xJ2), I,
and R1b chromosomes in more detail by using information
from the STR haplotypes. We visualized STR haplotypes
within each haplogroup by using networks28 constructed
with the nine Y-STRs common to all datasets. Geographical
structure was seen in the I and R1b networks (Figure 3), but
not in the J*(xJ2) network. The geographical distributions of
Lebanese haplotypes were then investigated in the Y chro-
mosome Haplotype Reference Database43 (YHRD, release
21) with seven Y-STRs so that 51,253 entries from 447
populations could be interrogated. Of the 30 Lebanese
R1b haplotypes, six (representing seven individuals) were
absent from the database, and 22 of the remaining 24
The
showed distributions that included Europe and western
Asia, as would generally be expected. Most of these haplo-
types thus did not provide more precise subregional
information about their likely place of origin.
One haplotype (WES1, Western European Specific 1),
however, stood out for two reasons. First, it showed a com-
mon but strictly western European distribution among the
indigenous populations in the YHRD; it was present in
26/81 European populations west of Hungary and in zero
populations east of this longitude (Figure 4). Second, and
in contrast to its distribution in the database, it was the
most common R1b haplotype in the Lebanese Christians
tested (5/27, 19% of R1b, or about 2% of the total Lebanese
Christian haplotypes).
Because this Lebanese occurrence lies far outside the nor-
mal range of this haplotype, we investigated how likely
a haplotype was to rise to this frequency by chance. The first
test considered the chances of observing modern levels of
the WES1 haplotype among Lebanese Christians without
any migration. No WES1 members were found in >1,000
Middle Eastern individuals in the YHRD. Making the highly
conservative assumption that its frequency p0 in the Middle
East outside the Lebanese Christians was ~0.1% (the maxi-
mum observed size consistent with zero in the sample) and
a male effective population size of NL z1000 for the Leba-
nese Christians estimated from our data with BATWING,
we calculated the probability of observing the modern
fraction f of 2% or more as <0.02 (Material and Methods).
In contrast, given an input of western Europeans, selected
American Journal of Human Genetics 82, 873–882, April 2008 879

from an evolving effective population NE z5000, who were
carrying WES1 at 0.21% (the weighted average of the YHRD
frequencies from England, France, Germany, and Italy), the
probability of reaching 2% or more among Lebanese Chris-
tians exceeded 0.05 for an admixing population fraction m
of ~10.6% or greater (Table 7). It has been assumed that a
total of 32 generations have passed since the start of the
admixture event44, with mixing only during the first seven
generations. Thus, WES1 is likely to have originated in
western Europe and shows exactly the pattern expected
for a European lineage introduced by the Crusaders.
Likewise, one can test the question of whether the differ-
ence in J*(xJ2) frequencies between Muslims (25%) and
non-Muslims (15%) would have emerged by drift without
enhancement during the Islamic expansion from the Ara-
bian Peninsula by considering the probability that the 15%
frequency could have drifted up to 25% or more by chance
in the ~42 generations since the Islamic expansion. For an
assumed effective population size of ~5,000, this is 0.0023,
and thus, again, admixture seems likely to have contrib-
uted.
Discussion
We find a striking correspondence between documented
historical migrations to Lebanon and current patterns of
genetic variation within the country. The variation was
perhaps initially low or structured by geography but was
subsequently accentuated by religion-driven migration
into specific communities within Lebanon. Two of the
three major migrations have left a detectable impact, and
conversely, the main features of the differentiation within
Lebanon can be accounted for by these events. It is likely
that earlier migratory events have also contributed to the
genetic diversity in present-day Lebanese populations,
but because these migrations would have occurred before
the present religious affiliations and communities were
Table 7. Estimated Influence of Historical Western EuropeanAdmixture on the Frequency of WES1 in Modern LebaneseChristians
ma P(l R 0.02 3 NL)b P(l ¼ 0)c
0 0.0189 0.9425
0.0500 0.0325 0.9001
0.1000 0.0482 0.8545
0.1055 0.0500 0.8492
0.1500 0.0656 0.8069
0.2000 0.0857 0.7561
0.3000 0.1347 0.6465
0.4000 0.1998 0.5258
0.5000 0.2889 0.3949
a Level of admixture of a western European population (NW ¼ 5,000)
carrying WES1 at 0.21% for seven generations to a Lebanese Christian
population (NL ¼ 1,000) carrying WES1 at 0.01%.b Probability that WES1 would have reached 2% or more after 32 genera-
tions.c Probability that WES1 would have been extirpated after 32 generations.
880 The American Journal of Human Genetics 82, 873–882, April 20
created, they are expected to have shaped the genetic
makeup of the country as a whole rather than specific
religious subpopulations.
Genetic structuring by religion has been rarely reported
in human populations: it was not detectable, for example,
among Muslim and Hindu paternal45 or maternal46 line-
ages in India. A Y-chromosomal lineage that is rare in India
but common in western Asia was found at unusually high
frequency in an Indian Shiya Muslim sample47, and struc-
turing by religion has been seen among Jewish maternal
(although not paternal) lineages48. Such structure might
only arise when several unusual criteria are met: migrations
based on religion must take place between areas with differ-
ent representative Y-chromosomal types, and they must
establish genetically differentiated communities that re-
main stable over long time periods. In Lebanon, these
conditions appear to have been met for over 1,300 years.
Supplemental Data
Two additional tables are available online at http://www.ajhg.org/.
Acknowledgments
We thank all volunteers for participating in this project and Oleg
Balanovsky, R. John Mitchell, Fabrıcio R. Santos, Theodore G.
Schurr, and Himla Soodyall for helpful comments. This project
was supported in part by a grant from the National Geographic
Committee for Research and Exploration; Y.X. and C.T.S. were sup-
ported by The Wellcome Trust. We thank Janet Ziegle and Applied
Biosystems for providing STR genotyping and QA support. The
Genographic Project is supported by funding from the National
Geographic Society, IBM, and the Waitt Family Foundation.
Received: November 28, 2007
Revised: January 25, 2008
Accepted: January 28, 2008
Published online: March 27, 2008
Web Resources
The URLs for data presented herein are as follows:
Arlequin, http://lgb.unige.ch/arlequin/
Genographic Project, https://www.nationalgeographic.com/
genographic/index.html
Network, http://www.fluxus-engineering.com/sharenet.htm
Y Chromosome Haplotype Reference Database (YHRD), http://
www.yhrd.org/index.html
References
1. Jobling, M.A., Hurles, M.E., and Tyler-Smith, C. (2004).
Human Evolutionary Genetics (New York:: Garland Science).
2. Ray, N., and Adams, J.M. (2001) A GIS-based vegetation map
of the world at the Last Glacial Maximum. Internet Archaeol-
ogy 11. http://intarch.ac.uk/journal/issue11/raycdams_toc.
html.
3. Hitti, P.K. (1957). Lebanon in History: From the Earliest Times
to the Present (New York: St. Martin’s Press).
4. Harden, D. (1971). The Phoenicians (London: Penguin Books).
08

5. Hourani, A.H. (1946). Syria and Lebanon (London: Oxford
University Press).
6. Edwards, I.E.S. (1973–1982). The Cambridge Ancient History,
vol. 2–3 (Cambridge, UK: Cambridge University Press).
7. Lapidus, I.M. (1999). The Cambridge Illustrated History of the
Islamic World (Cambridge: Cambridge University Press).
8. Lamb, H. (1930). The Crusades (New York: Doubleday).
9. Jobling, M.A., and Tyler-Smith, C. (2003). The human Y
chromosome: An evolutionary marker comes of age. Nat.
Rev. Genet. 4, 598–612.
10. Luis, J.R., Rowold, D.J., Regueiro, M., Caeiro, B., Cinnioglu, C.,
Roseman, C., Underhill, P.A., Cavalli-Sforza, L.L., and Herrera,
R.J. (2004). The Levant versus the Horn of Africa: Evidence for
bidirectional corridors of human migrations. Am. J. Hum.
Genet. 74, 532–544.
11. Cadenas, A.M., Zhivotovsky, L.A., Cavalli-Sforza, L.L., Under-
hill, P.A., and Herrera, R.J. (2007). Y-chromosome diversity
characterizes the Gulf of Oman. Eur. J. Hum. Genet. 16,
374–386.
12. Semino, O., Passarino, G., Oefner, P.J., Lin, A.A., Arbuzova, S.,
Beckman, L.E., De Benedictis, G., Francalacci, P., Kouvatsi, A.,
Limborska, S., et al. (2000). The genetic legacy of Paleolithic
Homo sapiens sapiens in extant Europeans: A Y chromosome
perspective. Science 290, 1155–1159.
13. Kayser, M., Lao, O., Anslinger, K., Augustin, C., Bargel, G., Edel-
mann, J., Elias, S., Heinrich, M., Henke, J., Henke, L., et al.
(2005). Significant genetic differentiation between Poland
and Germany follows present-day political borders, as revealed
by Y-chromosome analysis. Hum. Genet. 117, 428–443.
14. Capelli, C., Redhead, N., Abernethy, J.K., Gratrix, F., Wilson,
J.F., Moen, T., Hervig, T., Richards, M., Stumpf, M.P., Under-
hill, P.A., et al. (2003). A Y chromosome census of the British
Isles. Curr. Biol. 13, 979–984.
15. Capelli, C., Brisighelli, F., Scarnicci, F., Arredi, B., Caglia, A.,
Vetrugno, G., Tofanelli, S., Onofri, V., Tagliabracci, A., Paoli,
G., and Pascali, V.L. (2007). Y chromosome genetic variation
in the Italian peninsula is clinal and supports an admixture
model for the Mesolithic-Neolithic encounter. Mol. Phyloge-
net. Evol. 44, 228–239.
16. Cinnioglu, C., King, R., Kivisild, T., Kalfoglu, E., Atasoy, S.,
Cavalleri, G.L., Lillie, A.S., Roseman, C.C., Lin, A.A., Prince,
K., et al. (2004). Excavating Y-chromosome haplotype strata
in Anatolia. Hum. Genet. 114, 127–148.
17. Heath, I. (1978). Armies and Enemies of the Crusades 1096–
1291 (Sussex, UK: Wargames Research Group).
18. Riley-Smith, J. (1991). The Atlas of the Crusades (New York,
Oxford: Facts on File).
19. Runciman, S. (1964). A History of the Crusades, 3 vols (New
York: Harper Torchbooks).
20. Xue, Y., Zerjal, T., Bao, W., Zhu, S., Shu, Q., Xu, J., Du, R., Fu, S.,
Li, P., Hurles, M.E., et al. (2006). Male demography in East
Asia: A north-south contrast in human population expansion
times. Genetics 172, 2431–2439.
21. Ayub, Q., Mohyuddin, A., Qamar, R., Mazhar, K., Zerjal, T.,
Mehdi, S.Q., and Tyler-Smith, C. (2000). Identification and
characterisation of novel human Y-chromosomal microsatel-
lites from sequence database information. Nucleic Acids Res.
28, e8.
22. Thomas, M.G., Bradman, N., and Flinn, H.M. (1999). High
throughput analysis of 10 microsatellite and 11 diallelic poly-
morphisms on the human Y-chromosome. Hum. Genet. 105,
577–581.
The
23. Gusmao, L., Butler, J.M., Carracedo, A., Gill, P., Kayser, M.,
Mayr, W.R., Morling, N., Prinz, M., Roewer, L., Tyler-Smith,
C., and Schneider, P.M. (2006). DNA Commission of the Inter-
national Society of Forensic Genetics (ISFG): an update of the
recommendations on the use of Y-STRs in forensic analysis.
Int. J. Legal Med. 120, 191–200.
24. Excoffier, L., Smouse, P.E., and Quattro, J.M. (1992). Analysis
of molecular variance inferred from metric distances among
DNA haplotypes: Application to human mitochondrial DNA
restriction data. Genetics 131, 479–491.
25. Mantel, N. (1967). The detection of disease clustering and
a generalized regression approach. Cancer Res. 27, 209–220.
26. Schneider, S., Roessli, D., and Excoffier, L. (2000). Arelquin:
a software for population genetics data analysis release 2 (Ge-
neva, Switzerland: Genetics and Biometry Lab, Department of
Anthropology, University of Geneva).
27. Dupanloup, I., and Bertorelle, G. (2001). Inferring admixture
proportions from molecular data: extension to any number
of parental populations. Mol. Biol. Evol. 18, 672–675.
28. Bandelt, H.J., Forster, P., and Rohl, A. (1999). Median-joining
networks for inferring intraspecific phylogenies. Mol. Biol.
Evol. 16, 37–48.
29. Qamar, R., Ayub, Q., Mohyuddin, A., Helgason, A., Mazhar, K.,
Mansoor, A., Zerjal, T., Tyler-Smith, C., and Mehdi, S.Q.
(2002). Y-chromosomal DNA variation in Pakistan. Am. J.
Hum. Genet. 70, 1107–1124.
30. Bandelt, H.J., Forster, P., Sykes, B.C., and Richards, M.B.
(1995). Mitochondrial portraits of human populations using
median networks. Genetics 141, 743–753.
31. Wilson, I.J., Weale, M.E., and Balding, D.J. (2003). Inferences
from DNA data: population histories, evolutionary processes
and forensic match probabilities. J. R. Stat. Soc. Ser. A Stat.
Soc. 166, 155–188.
32. Beerli, P. (1998). Estimation of migration rates and population
sizes in geographically structured populations. In Advances in
Molecular Ecology; NATO-ASI Workshop Series, G. Carvalho,
ed. (Amsterdam: IOS Press), pp. 39–53.
33. Beerli, P., and Felsenstein, J. (1999). Maximum-likelihood esti-
mation of migration rates and effective population numbers
in two populations using a coalescent approach. Genetics
152, 763–773.
34. Beerli, P., and Felsenstein, J. (2001). Maximum likelihood esti-
mation of a migration matrix and effective population sizes in
n subpopulations by using a coalescent approach. Proc. Natl.
Acad. Sci. USA 98, 4563–4568.
35. Hey, J., and Nielsen, R. (2007). Integration within the Felsen-
stein equation for improved Markov chain Monte Carlo
methods in population genetics. Proc. Natl. Acad. Sci. USA
104, 2785–2790.
36. Kuhner, M.K. (2006). LAMARC 2.0: Maximum likelihood and
Bayesian estimation of population parameters. Bioinformatics
22, 768–770.
37. Kuhner, M.K., and Smith, L.P. (2007). Comparing likelihood
and Bayesian coalescent estimation of population parameters.
Genetics 175, 155–165.
38. Nielsen, R., and Wakeley, J. (2001). Distinguishing migration
from isolation: A Markov chain Monte Carlo approach.
Genetics 158, 885–896.
39. Fisher, R.A. (1930). The Genetical Theory of Natural Selection
(New York: Oxford University Press).
40. Wright, S. (1931). Evolution in Mendelian populations.
Genetics 16, 97–159.
American Journal of Human Genetics 82, 873–882, April 2008 881
41. Haldane, J.B.S. (1930). A mathematical theory of natural and
artificial selection: VI. Isolation. Proc. Camb. Philol. Soc. 26,
220–230.
42. GSL Gnu Scientific Library. ver 1.10. Free Software Founda-
tion, http://www.gnu.org/software/gsl/.
43. Willuweit, S., and Roewer, L. (2007). Y chromosome haplo-
type reference database (YHRD): update. FSI Genet. 1, 83–87.
44. Fenner, J.N. (2005). Cross-cultural estimation of the human
generation interval for use in genetics-based population diver-
gence studies. Am. J. Phys. Anthropol. 128, 415–423.
45. Gutala, R., Carvalho-Silva, D.R., Jin, L., Yngvadottir, B., Avad-
hanula, V., Nanne, K., Singh, L., Chakraborty, R., and Tyler-
Smith, C. (2006). A shared Y-chromosomal heritage between
Muslims and Hindus in India. Hum. Genet. 120, 543–551.
882 The American Journal of Human Genetics 82, 873–882, April 20
46. Terreros, M.C., Rowold, D., Luis, J.R., Khan, F., Agrawal, S., and
Herrera, R.J. (2007). North Indian Muslims: enclaves of for-
eign DNA or Hindu converts? Am. J. Phys. Anthropol. 133,
1004–1012.
47. Agrawal, S., Khan, F., Pandey, A., Tripathi, M., and
Herrera, R.J. (2005). YAP, signature of an African-Middle
Eastern migration into northern India. Curr. Sci. 88,
1977–1980.
48. Thomas, M.G., Weale, M.E., Jones, A.L., Richards, M., Smith,
A., Redhead, N., Torroni, A., Scozzari, R., Gratrix, F., Tarekegn,
A., et al. (2002). Founding mothers of Jewish communities:
geographically separated Jewish groups were independently
founded by very few female ancestors. Am. J. Hum. Genet.
70, 1411–1420.
08
Copyright © 2022 FDOKUMEN