Identifying and ascribing the relative significance of introduction pathways for non-native plants...
10
28 Environmental & Socio-economic Studies Environmental & Socio-economic Studies ______________________________________________________________________________________ 2014, 2, 4: 28-37 Identifying and ascribing the relative significance of introduction pathways for non-native plants into Iceland Pawel Wasowicz Icelandic Institute of Natural History, Borgir vid Nordurslod, P.O. Box 180, 602 Akureyri, Iceland E–mail address: [email protected] ________________________________________________________________________________________________________________________________________________ ABSTRACT The study is aimed at identifying pathways frequently used by non-native plant species, assessing their relative significance and development in time. Pathways were defined following NOBANIS framework (Madsen et al., 2014). Species assessments were based on HARMONIA scheme (Branquart, 2007). Four categories of environmental hazards were assessed plus two additional categories summarizing impacts on health and economy. Temporal development of pathways was assessed using cumulative per annum taxa records. To quantify the activity of investigated pathways over time an index (δ10) showing the number of new species introduced during the period of 10 years was calculated. The study shows that horticulture, landscaping and agriculture can be pointed out as pathways of concern in Iceland. A set of species of concern is also proposed. Two plant taxa are included in A list (high risk species): Anthriscus sylvestis and Lupinus nootkatensis. Three taxa are placed in B list (watch list): Heracleum mantegazzianum, Heracleum persicum and Pinus contorta. Results of the present study are compared with similar studies carried out in Denmark, Scandinavia and Baltic countries. Different measures to prevent introductions of new and potentially dangerous non-native species are also discussed including selection of good practices that may significantly reduce the threat from non-native species used in agriculture and horticulture. KEY WORDS: non-native species, pathway analysis, invasive species, Iceland, vascular plants ________________________________________________________________________________________________________________________________________________ 1. Introduction Introduction of plant and animal species beyond their native ranges was a relatively slow human- driven process that started hundreds years ago (MEYERSON & MOONEY, 2007). More recently globalization has sharply increased the frequency by which non-native species are introduced into new areas and changed natural biogeographical patterns at an unprecedented scale (LOCKWOOD ET AL., 2007). An increasing number of studies attempt to investigate the phenomenon of alien species invasion by identification of the manners and routes by which non-native species reach their destination (HULME ET AL., 2008; PYSEK ET AL., 2011). This type of research is now considered as a powerful instrument of alien species management and biosecurity that is based on precautionary principle (PYSEK & RICHARDSON, 2010; RUIZ ET AL., 2003). It is widely accepted that biological invasions start with a few individuals intentionally or unintentionally transported from their native region to a novel environment. This process consists of two essential parts: the vector and the pathway. The vector can be defined as a manner by which a species is carried out along a pathway, whereas the route from the source region to the region of destination can be defined as the pathway (LOCKWOOD ET AL., 2007). Previous research showed that vectors and pathways used by non- native species are far more diverse and dynamic that those enabling natural colonization processes (LOCKWOOD ET AL., 2007). Analysis of pathways and vectors is essential in limiting contamination of vectors, monitoring pathways of most dangerous pests and generic management measures (PYSEK ET AL., 2011). Elucidation of introduction pathways is also crucial for developing effective biosecurity strategies that aim to reduce propagule pressure, likelihood of establishment and uncontrolled spread that results in invasions.
Transcript of Identifying and ascribing the relative significance of introduction pathways for non-native plants...

28
Environmental & Socio-economic Studies
Environmental & Socio-economic Studies ______________________________________________________________________________________ 2014, 2, 4: 28-37
Identifying and ascribing the relative significance of introduction pathways for
non-native plants into Iceland
Pawel Wasowicz
Icelandic Institute of Natural History, Borgir vid Nordurslod, P.O. Box 180, 602 Akureyri, Iceland E–mail address: [email protected] ________________________________________________________________________________________________________________________________________________
ABS TR AC T
The study is aimed at identifying pathways frequently used by non-native plant species, assessing their relative significance and development in time. Pathways were defined following NOBANIS framework (Madsen et al., 2014). Species assessments were based on HARMONIA scheme (Branquart, 2007). Four categories of environmental hazards were assessed plus two additional categories summarizing impacts on health and economy. Temporal development of pathways was assessed using cumulative per annum taxa records. To quantify the activity of investigated pathways over time an index (δ10) showing the number of new species introduced during the period of 10 years was calculated. The study shows that horticulture, landscaping and agriculture can be pointed out as pathways of concern in Iceland. A set of species of concern is also proposed. Two plant taxa are included in A list (high risk species): Anthriscus sylvestis and Lupinus nootkatensis. Three taxa are placed in B list (watch list): Heracleum mantegazzianum, Heracleum persicum and Pinus contorta. Results of the present study are compared with similar studies carried out in Denmark, Scandinavia and Baltic countries. Different measures to prevent introductions of new and potentially dangerous non-native species are also discussed including selection of good practices that may significantly reduce the threat from non-native species used in agriculture and horticulture. KEY WORDS: non-native species, pathway analysis, invasive species, Iceland, vascular plants ________________________________________________________________________________________________________________________________________________
1. Introduction Introduction of plant and animal species beyond
their native ranges was a relatively slow human-driven process that started hundreds years ago (MEYERSON & MOONEY, 2007). More recently globalization has sharply increased the frequency by which non-native species are introduced into new areas and changed natural biogeographical patterns at an unprecedented scale (LOCKWOOD ET AL., 2007). An increasing number of studies attempt to investigate the phenomenon of alien species invasion by identification of the manners and routes by which non-native species reach their destination (HULME ET AL., 2008; PYSEK ET AL., 2011). This type of research is now considered as a powerful instrument of alien species management and biosecurity that is based on precautionary principle (PYSEK & RICHARDSON, 2010; RUIZ ET AL., 2003).
It is widely accepted that biological invasions start with a few individuals intentionally or
unintentionally transported from their native region to a novel environment. This process consists of two essential parts: the vector and the pathway. The vector can be defined as a manner by which a species is carried out along a pathway, whereas the route from the source region to the region of destination can be defined as the pathway (LOCKWOOD ET AL., 2007). Previous research showed that vectors and pathways used by non-native species are far more diverse and dynamic that those enabling natural colonization processes (LOCKWOOD ET AL., 2007).
Analysis of pathways and vectors is essential in limiting contamination of vectors, monitoring pathways of most dangerous pests and generic management measures (PYSEK ET AL., 2011). Elucidation of introduction pathways is also crucial for developing effective biosecurity strategies that aim to reduce propagule pressure, likelihood of establishment and uncontrolled spread that results in invasions.

29
Data on non-native plant species in Iceland have been collected for decades (e.g. DAVIDSSON, 1967), but the first study that went beyond purely descriptive inventories was published only recently (WASOWICZ ET AL., 2013). The study showed that influx of non-native plants to Iceland is increasing through time or perhaps even accelerating (WASOWICZ ET AL., 2013) and that the need to prioritize efforts aimed to reduce the pressure from non-native species became essential if the country is to mitigate some of the adverse effects to the environment and the society. In order to achieve that the present study was designed and aimed at:
1) Identifying pathways frequently used by non- native species
2) Assessing the development of pathways use in time
3) Assessing the relative significance of pathways.
2. Materials and methods 2.1. Data sources
Data on the occurrence of non-native plant
species in Iceland were obtained from the database of the Icelandic Institute of Natural History. The database covers the time span between 1840 and 2014. The species set, species nomenclature and status (casual, established, invasive) used in the present study largely agrees with the checklist of alien plant species in Iceland published by WASOWICZ ET AL. (2013). After five newly registered species were added to 336 already listed by WASOWICZ ET AL. (2013) a total of 341 non-native taxa were included in the present study (282 casuals, 57 established and 2 invasive). 2.2. Temporal trends
The year of the first record for each species was retrieved from the database and cumulative number of species introduced by each pathway was plotted against time. To quantify the activity of investigated pathways over time we calculated an index (δ10) showing the number of new species introduced during the period of 10 years according to the formula:
δ10= Sx-Sx-10
where: Sx - number of species in the year x, Sx-10 - number of species 10 years earlier
All curves were plotted in SigmaPlot using locally weighted regression – LOESS (CLEVELAND, 1979; CLEVELAND & DEVLIN, 1988), with sampling proportion of 0.1 and polynomial degree set to 1.
2.3. Pathway categories
Categories used to describe pathways used by non-native plant species were based on NOBANIS framework (MADSEN ET AL., 2014) and HULME ET AL. (2008) and focused on human activity that gives rise to an intentional or unintentional introduction. The following set of pathways was used:
1) Agriculture – plants for production of food for human and/or animal consumption, including crops, contaminants of hay, grain, fodder and seed mixtures
2) Aquaria – plants used in garden ponds and aquaria
3) Ballast water and sediments – plants transported in ballast water and sediments in tanks, as well as solid ballast, including dispersal via shipping in general
4) Forestry – plants imported for timber and tree production including species introduced via tree hosts
5) Horticulture – plants used for ornamental purpose and in gardening
6) Landscaping – plants introduced to be used as hedge plants, binding of sands and silt, erosion control etc.
7) Medicinal – plants imported to be used for this purpose
8) Transport – plants imported with translocation of machinery, goods, package material, transported along roads by planes etc.
9) Not known – pathway of introduction cannot be determined.
Each investigated species was assigned to one
pathway on the basis of literature data, and other evidence (information from herbarium records, databases, reports from field studies or personal communications). Each pathway was then described in a quantitative way by calculating total number of non-native species introduced through the pathway as well as the number of casual, established and invasive species. 2.4. Species assessments and the scoring system
All investigated species were assessed using
an objective HARMONIA information system (BRANQUART, 2007) in order to provide data necessary for ranking relative significance of pathways (see below). The method is based on simplified environmental impact assessment protocol guidelines – ISEIA (BRANQUART, 2007). Environmental hazards were divided into four areas of interest (categories) according to the HARMONIA system: (I) dispersal potential, (II)

30
colonization of high conservation value habitats, (III) adverse impact on native species and (IV) alteration of ecosystem functions. Two other categories were also added following MADSEN ET
AL. (2014): (V) Economic impacts and (VI) Health impacts. Species were assessed using a scale from 1 to 3 points in each HARMONIA category (maximum of 12 points). Each additional category used a scale of 1 to 3 points, allowing a maximum of 6 points. Assessments were based on available scientific peer-reviewed journals, books, so called “grey sources” (reports etc.) and on-line databases focused on non-native and invasive plant species in Europe. Data from field surveys were also used especially with respect to naturalization process
and habitat preferences. Fields were left blank if no information could be retrieved from available sources. The overall sum of points for each species was based on the available information and blanks were considered “0”. The total score for each species was, therefore, a minimum score based on available information. Criteria used to assign values for all the assessed categories followed MADSEN ET AL. (2014) (Table 1).
Species were allocated within different risk categories according to their total ISEIA score (BRANQUART, 2007): A (black list) 11-12 points, B (watch list) 9-10 points and C 8-4 points in order to prioritize non-native species.
Table 1. Criteria used to assign values for categories of environmental hazards according to HARMONIA system (I-IV) and
additional categories following Madsen et al. (2014). Wording slightly edited from that of Madsen et al. (2014)
Value Description
I. Dispersal potential
1 No or little dispersal potential. No spread in the environment due to a low potential for dispersal and/or low fecundity.
2 Medium dispersal potential. Low potential for dispersal, except when assisted by man. Medium to high fecundity.
3 High dispersal potential. High potential for dispersal and high fecundity.
II. Colonization of high conservation value habitats
1 No or little colonization. Colonization is restricted to man‐made habitats.
2 Medium colonization. Colonization is usually restricted to low or medium conservation value habitats.
3 High colonization. High conservation value habitats are often colonized.
III. Adverse impacts on native species (Predation, competition, spread of disease to native species, genetic effects etc.)
1 No or negligible impact.
2 Medium impact. Causes local changes but the effect is often reversible.
3 High impact. Causes severe local changes that often are considered irreversible.
IV. Alteration of ecosystem functions
1 No or little alteration. Negligible impact on ecosystem processes and structures.
2 Medium alteration. Moderate impact on ecosystem processes and structures that are considered reversible.
3 High alteration. Strong impact on ecosystem processes and structure that are considered irreversible.
V. Economic impacts
1 No or little impact.
2 Medium but limited impact.
3 High impact.
VI. Health impacts
1 None or merely weak symptoms that do not require treatment.
2 Medium impact. Moderate symptoms, that are easily treated and do not cause permanent damage.
3 High impact. Serious symptoms, treatment is difficult or impossible causing permanent damage or death. Highly frequent and contact allergies are included.
31
2.5. Relative significance of pathways Relative significance of pathways was determined
using quantitative criteria (listed in order of importance): number of introduced invasive species by the pathway, total number of introductions through the pathway, number of high risk (list A) and medium risk (list B) species introduced through the pathway, number of high risk species (evaluation containing economical and health hazard criteria) and the temporal development of the pathway (quantified as value of δ10 index for 2014). The final list showing pathway priority was prepared by sorting pathways according to the above mentioned criteria from largest to smallest values.
3. Results
Two analysed pathways: horticulture and agriculture had the highest number of non-native species - 106 and 96, respectively. It was shown that almost 60% of alien plant taxa were introduced using these two most active pathways (Table 2). Other pathways were significantly less productive in terms of the total number of introductions. Similarly, both pathways (horticulture and agriculture) were responsible for introduction of the highest number of casual and established species. Ballast waters and medicinal were found to be least frequently used: 1 and 2 non-native taxa introduced, respectively (Table 2). Invasive species were introduced by two pathways: horticulture and landscaping (Table 2).
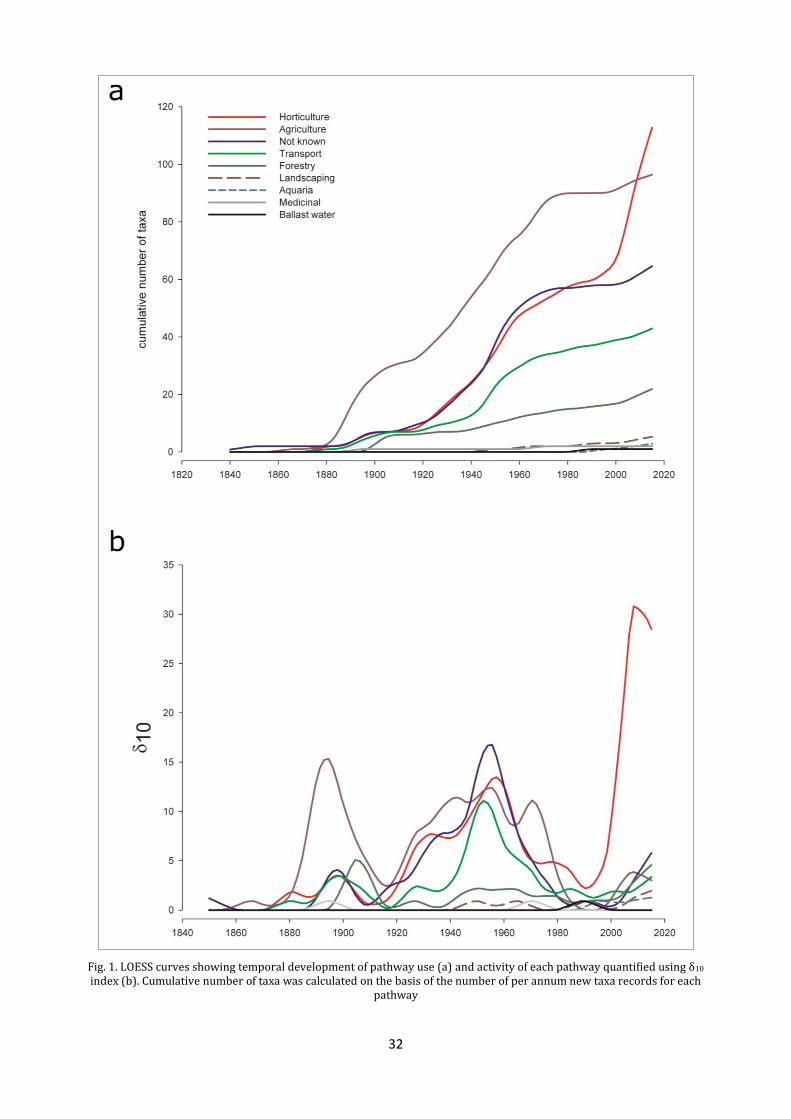
The analysis of temporal development of pathways showed that agriculture and horticulture were the most frequently used pathways in the
analysed time period (1840-2014) (Fig. 1a). Other pathways showed intermediate (transport, forestry) or low performance (remaining pathways in terms of the total number of species introduced (Fig. 1a). Number of introductions through agriculture pathway was high and almost linear between 1880 and 1970 (Fig. 1a). Significant activity of this pathway was recorded as early as in the last decades of the 19th century (Fig. 1b) and was relatively high during almost all 20th century (Fig. 1b). Activity of this pathway measured by δ10 index decreased significantly after 1980. The sharpest and historically unprecedented increase in activity was recorded for horticulture pathway (Fig. 1b). This pathway became dominant over the last two decades (1994-2014) both in terms of the total number of species (Fig. 1a) and activity (Fig. 1b). Generally, after a period of decreased activity between 1980 and 2000, all pathways showed increased activity over the first decade of the 21st century (Fig. 1b). The activity, however, was much lower in most cases, than the historical maxima that were reached for most productive pathways in the mid-20th century. Horticulture pathway is here a notable exception.
Distribution of analysed species according to their HARMONIA score showed that two taxa should be included in A list (high risk): Anthriscus sylvestris and Lupinus nootkatensis. Three taxa: Heracleum mantegazzianum, Heracleum persicum and Pinus contorta were placed in B list (watch list) and 78 species were placed on C list (Table 3). When economic and health impact were taken into account, four taxa (Heracleum mantegazzianum, H. persicum, Anthriscus sylvestris and Lupinus nootkatensis) were classified as “high risk species”.
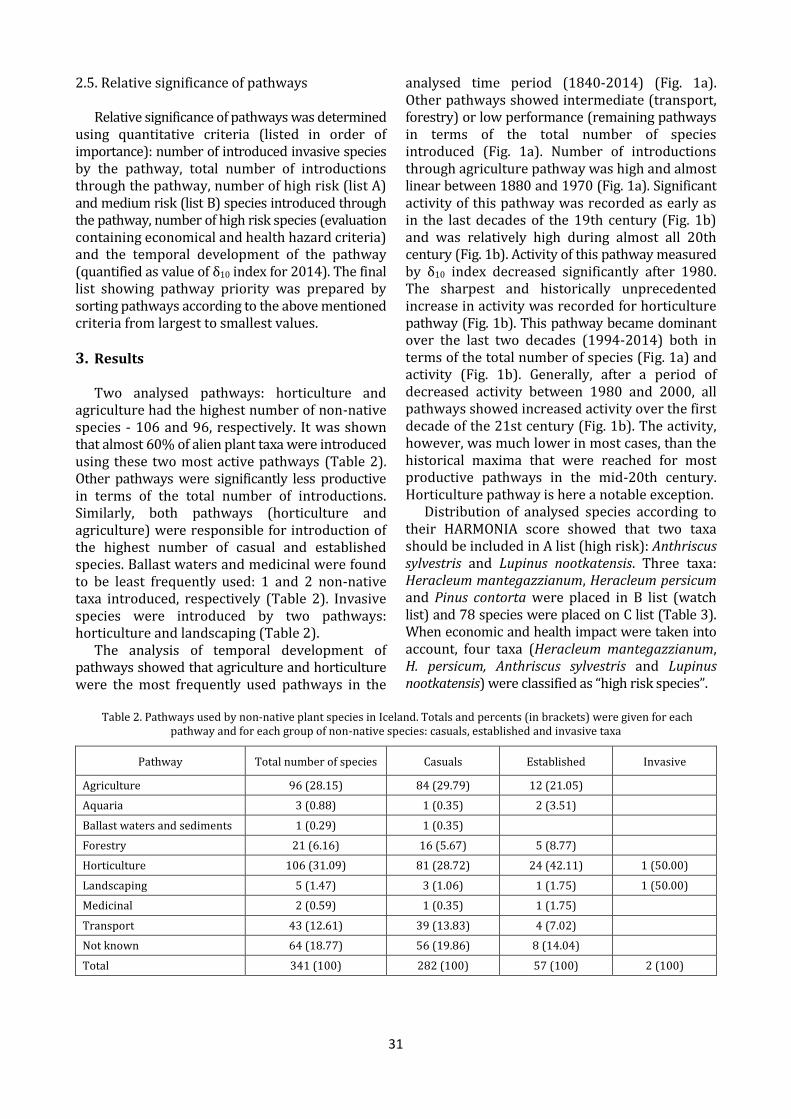
Table 2. Pathways used by non-native plant species in Iceland. Totals and percents (in brackets) were given for each
pathway and for each group of non-native species: casuals, established and invasive taxa
Pathway Total number of species Casuals Established Invasive
Agriculture 96 (28.15) 84 (29.79) 12 (21.05)
Aquaria 3 (0.88) 1 (0.35) 2 (3.51)
Ballast waters and sediments 1 (0.29) 1 (0.35)
Forestry 21 (6.16) 16 (5.67) 5 (8.77)
Horticulture 106 (31.09) 81 (28.72) 24 (42.11) 1 (50.00)
Landscaping 5 (1.47) 3 (1.06) 1 (1.75) 1 (50.00)
Medicinal 2 (0.59) 1 (0.35) 1 (1.75)
Transport 43 (12.61) 39 (13.83) 4 (7.02)
Not known 64 (18.77) 56 (19.86) 8 (14.04)
Total 341 (100) 282 (100) 57 (100) 2 (100)
32
Fig. 1. LOESS curves showing temporal development of pathway use (a) and activity of each pathway quantified using δ10
index (b). Cumulative number of taxa was calculated on the basis of the number of per annum new taxa records for each pathway

33
Table 3. The distribution of species according to their HARMONIA score and dispersion potential score (n= 341). Non-native species were allocated to different risk categories based on ISEIA score: 11-12 Black list, 9-10 Watch/observation list, 4-8 C list
Har
mo
nia
sco
re
9 2
8
7 3
6 1
5 1 1
4 3 4 2
3 31 15 17
2 8 1
1 3 2
blank 202 25 16 4
blank 1 2 3
Dispersion potential
Table 4. The distribution of species by ‘Total sum of impacts’ and ‘Dispersion potential’ (n=2079). The ‘Total sum of impacts’
are the sum of scores from ‘Adverse impact on native species’, ‘Alteration of ecosystem functions’, ‘Economical effect’ and ‘Public health effects’. Blank was used when no information could be retrieved. Species receiving 14 points or more in total
sum of impact are shaded grey
To
tal s
um
of
imp
acts
15
14
13 2
12
11 2
10
9 1
8 1
7 1 3
6 3 4 1
5 28 14 15
4
3 3 1 1
2 8 1
1 3 2
Blank 202 25 16 4
blank 1 2 3
Dispersion potential

34
Table 5. Relative significance of pathways based on the following indicators: I- number of invasive species introduced through the pathway, T – total number of non-native species, HR – number of high risk species, MR – number of medium risk
species, TD – temporal development (δ10 value calculated for the year 2014)
Pathways of concern were selected and ordered
on the basis of qualitative criteria (Table 5). Horticulture pathway seemed to be of highest concern due to the presence of invasive species introduction, high number of total introductions and highest activity (temporal development). Landscaping and agriculture pathways, although characterized by the presence of invasive species (landscaping) or high number of total introductions, showed only low activity in recent years (low δ10
values).
4. Discussion
Knowledge on pathways in invasion process was pointed out by different authors as an important part of research focused on non-native and invasive taxa (HULME, 2009; ISCC, 2013; KELLY ET AL., 2013; NENTWIG, 2007). Identification of pathways for many species could be, however, a challenging task. The information available is usually very limited and sometimes restricted only to so-called “grey sources” or personal communications. Very often pathways have to be deduced from very limited evidence (such as herbarium labels, short notes in floras etc.). The general lack of literature on pathways of introductions for many species has been identified as a one of the main obstacles in research focusing on that problem (MADSEN
ET AL., 2014). Limited sources accessible for the researcher examining pathways of non-native taxa result often in significant percent of species classified under “not known” pathway. In case of the present study almost 19% of the total number of non-native species recorded fell under this category. Similar limitations were also encountered by other recent studies (MADSEN ET AL., 2014; NOBANIS, 2015).
A scoring system was used in the present study to rank species according to their impact on environment and assess their relative significance pathways. Scoring system is a convenient tool to compare impact where the quantity, quality and data structure varies (NENTWIG ET AL., 2010; KUMSCHICK ET AL., 2013). It should be stressed, however, that scoring system is no alternative to direct studies measuring the impact of alien species directly, but a tool to compare or rank variable data (KUMSCHICK ET AL., 2015). Numerous studies used scoring systems for different purposes: for risk assessments and preparation of black lists (GEDERAAS ET AL., 2012), species prioritization (KUMSCHNICK ET AL., 2012) and policy development (ESSL ET AL., 2011).
The notion that islands are more prone to invasion by alien species (ELTON, 1958; CARLQUIST, 1965; WILSON, 1965) due to lack of natural competitors and predators, as well as due to the fact that some ecological niches in islands may have not been filled became a conventional wisdom. This view, however, was challenged by more recent studies showing that increased susceptibility to invasions in islands ecosystems is only poorly supported (D’ANTONIO & DUDLEY, 1995; DENSLOW, 2003; GASTON ET AL., 2003). On the other hand, it has been shown that susceptibility to biological invasion does not coincide with vulnerability to the effects of invasive taxa, and islands are more susceptible to the effects of invaders (D’ANTONIO & DUDLEY, 1995). Invasion susceptibility of terrestrial ecosystems in Iceland can be further enhanced by ongoing climate change that may facilitate establishment of new non-native species and the spread of those that are already present (LASSUY & LEIWS, 2013). In light of these findings it seems that increased and targeted
Pathway I T HR MR TD
Horticulture 1 106 1 2 16
Landscaping 1 5 1 0 1
Agriculture 0 96 0 0 2
Not known 0 64 0 0 5
Transport 0 43 0 0 3
Forestry 0 21 0 1 4
Aquaria 0 3 0 0 2
Medicinal 0 2 0 0 0
Ballast waters and sediments 0 1 0 0 0

35
prevention efforts are needed to limit the influx of non-native species in Iceland. Identification of main pathways of introductions greatly facilitates planning of targeted preventions strategies.
Main pathways of introductions in Iceland are similar to those identified in other countries. Data published hitherto suggest that horticulture is one of the main pathways used by non-native plant species also in Denmark (MADSEN ET AL., 2014), Scandinavia and Baltic countries (NOBANIS, 2015). Agriculture, as one of the main sources of alien plant species was also pointed out for the regions mentioned above. Horticulture and agriculture have been recognised as main pathways of plant invasions worldwide (DEHENEN-SCHMUTZ ET AL., 2004; REICHARD & WHITE, 2001). It is estimated that ca. 80% of current invasive plants in Europe were originally used as ornamental or agricultural plants (HULME, 2007).
Landscaping pathway was also pointed out as a pathway of concern. Low activity of this pathway throughout the study period did not prevent the introduction of the one of most invasive species in Iceland L. nootkatensis. Species introduced though this pathway, although relatively few, are usually well selected for environmental matching and other characters making them suitable to specific Icelandic conditions. It seems that special attention should be paid during species selection for future use in landscaping activities.
It is evident in our study that activity of analysed pathways shows considerable fluctuations. The interpretation of this pattern is not easy in terms of scientific evidence. The first major peak, indicating influx of non-native species, is registered around 1880-1900. This period coincides with preparation (data collection) and subsequent publication of the first work describing the Icelandic flora that meets scientific standards (STEFANSSON, 1900). This may explain relatively high number of introductions connected with agriculture that was predominant source of non-native species at that time. Also first attempts of forestry in Iceland, dating back to the beginning of 20th century, are also well mirrored by our data. Almost all pathways were very active between 1940 and 1970. This period of increased introductions may be associated with good condition of Icelandic economy at that time resulting with increased trade and import of different commodities. This economic recovery was mainly due to the influx of foreign capital into the country at that time (SIGURDARDOTTIR ET AL., 2008). It seems also that so called “Oil crisis”, and economic decline connected with this event (SIGURDARDOTTIR ET AL., 2008), resulted in sharp decrease (in 1970’s)
and subsequent low rate of species introductions (1980-1990). It is also evident that new wave of introductions is now underway in Iceland. The present influx is dominated by horticultural species, what mirrors fairly well the transition from agriculture-based traditional economy and increased well-being that results i.a. with increased consumption of goods such as ornamental plant species. The interpretation presented here is, however, only preliminary and has to be treated as a working hypothesis that needs to be investigated further.
The number of international visitors to Iceland have more than tripled since 2000 and influx of tourists measured as total number of foreign passengers through Keflavik airport reached 781.016 in 2013 (GUDJONSDOTTIR, 2014). When we take into account that in January 2014 total population of Iceland was around 325.000 (GUDJONSDOTTIR, 2014) we can easily see that this extraordinary increase in touristic industry may also contribute to increased introductions of new non-native plant taxa. Increased temporary human immigration and import of different goods (including food and commodities connected with developing touristic sector) may lead to increased activity of “transport” pathway in the future.
It seems that apart from invasion potential also genetic effects on native species (introgression) should be carefully assessed. Restoration activities along roads in Iceland often involve the use of imported species (especially grasses). Sowing of roadsides poses threat that locally adapted native taxa or sub-taxa will be genetically contaminated (ELVEN ET AL., 2012). The extent of genetic contamination from non-native seed mixtures used in restoration activities have never been studied, but is probably considerable (ELVEN ET AL., 2012). The same precautionary measures should be also applied to newly imported GMO.
The present study confirmed the general notion that most introduced species do not pose a risk to the environment, economy or society (BAAGØE & WEIDEMA, 2001). It was shown, that very few alien species were classified as high risk or medium risk taxa. These problematic species, although few, show extraordinary ability to establish populations in new locations and to reproduce and spread quickly and in uncontrollable fashion. It should be mentioned that significant proportion of high risk species is still only locally distributed (e.g. Heracleum spp.), what gives a unique opportunity to eradicate them before vast distribution will make eradication efforts difficult and very expensive.

36
5. Conclusions and recommendations
The study showed that horticulture, landscaping and agriculture can be pointed out as pathways of concern in Iceland and evidenced that activity of investigated pathways shows significant fluctuations over longer periods (decades). It can be hypothesised that these fluctuations are associated with economic factors. A set of species of concern was also proposed. Two plant taxa were included in A list (high risk species): Anthriscus sylvestis and Lupinus nootkatensis. Three taxa were placed in B list (watch list): Heracleum mantegazzianum, Heracleum persicum and Pinus contorta.
Cost-effective measures can be implemented in order to reduce potentially dangerous introductions including restrictions on import and trade of different horticultural and agricultural species. Introduction of a code of conduct for governmental institutions, horticultural industry and trade, as well as for those who play a role in deciding what species are grown in particular areas (HEYWOOD & BRUNEL, 2011) could play an important role in raising awareness on the topic among professionals and preventing a spread and new introductions of possible plant invaders.
It is clear that efforts should not be aimed to prevent all introductions, to control all spread and to eradicate all established species. They should be rather targeted on introduced species that are likely to cause ecological, economic or public health problems. The assessment scheme used in the present study could be therefore a method of choice to objectify the process of prioritization of non-native species and pathways and compiling lists of taxa that are harmful and should be eliminated. Assessments involving so called “door knockers” (or alien species that have the potential to establish themselves and reproduce in Icelandic nature) should also be conducted and based on expert knowledge.
There is a selection of good practices that may significantly reduce the threat from non-native species used in agriculture and horticulture (HEYWOOD & BRUNEL, 2011) such as: (i) avoiding the use of invasive or potentially invasive plant species in large-scale public plantings and as ornamentals in public places, (ii) good labelling practices (labels should include information where non-native species should not be planted and how to avoid their spread from gardens), (iii) introduction of substitutes of invasive plant species that will be available in nurseries and garden centres (these maybe native species or
other exotic but non-invasive species) (iv) regulations concerning plant waste disposal and treatment etc. Acknowledgements The author would like to thank all those recorders (both professional and amateur botanists) who contributed data to the dataset of the Icelandic Institute of Natural History that was analysed here. Anonymous reviewers are acknowledged for insightful comments that helped to improve the manuscript.
References Baagøe J., Weidema I. 2001. Biologisk invasion I Danmark – en
oversigt. Invasisve arter og GMO’er – nye trusler mod naturen. Temarapport nr. 1, Naturrådet, Copenhagen.
Branquart E. 2007. ISEIA guidelines, Harmonia information system: Guidelines for environmental impact assessment and list classification of non‐native organisms in Belgium. Version 2.6 (07/12/2009). http://ias.biodiversity.be/ documents/ISEIA_ protocol.pdf accessed: 18.02.2015
Carlquist S. 1965. Island life. Natural History Press, Garden City, New York.
Cleveland W.S. 1979. Robust locally weighted regression and smoothing scatterplots. J. Amer. Statist. Assn., 74: 829-836.
Cleveland W.S., Delvin S.J. 1988. Locally weighted regression: an approach to regression analysis by local fitting. J. Amer. Statist. Assn., 83: 596-610.
D’Antonio C.M., Dudley T.L. 1995. Biological invasions as agents of change on islands compared with mainlands. [in:] Vitousek P.M., Loope L., Adserson H. (eds.) Biological Diversity and Ecosystem Function. Springer-Verlag, Berlin: 103-121.
Davíðsson I. 1967. The immigration and naturalization of flowering plants in Iceland since 1900. Greinar, 4: 1-35.
Dehnen-Schmutz K., Perrings C., Williamson M. 2004. Controlling Rhododendron ponticum in the British Isles: an economic analysis. J. Environ. Manage., 70: 323-332.
Denslow J.S. 2003. Weeds in paradise: thoughts on the invisibility of tropical islands. Ann. Missouri Bot. Gard., 90: 119-127.
Elton C.S. 1958. The ecology of invasions by animals and plants. Methuen, London.
Elven R., Ødegaard F., Oug E., Sandvik H. 2012. Alien species: introduction, establishment and spread [in:] Gederaas L., Moen T.L., Skjelseth S., Larsen L.K. (eds.) Alien species in Norway – with the Norwegian Black List 2012. The Norwegian Biodiversity Information Centre, Norway, 17-56.
Essl F., Nehring S., Klingenstein F., Milasowszky N., Nowack C., Rabitsch W. 2011. Review of risk assessment systems of IAS in Europe and introducing the German Austrian Black List Information System (GABLIS). J. Nature Cons., 19: 339-350.
Gaston K.J., Jones A.G., Hanel C., Chown S.L. 2003. Rates of species introduction to a remote oceanic island. Proc. R. Soc. Lond., B, Biol. Sci., 270: 1091-1098.
Gederaas L., Moen T.L., Skjelseth S., Larsen L.K. 2012. Alien species in Norway – with the Norwegian Black List. The Norwegian Biodiversity Information Centre, Norway.
Gudjonsdottir S. 2014. Iceland in figures 2014. Statistics Iceland, Reykjavik.
Heywood V., Brunel S. 2011. Code of conduct on horticulture and invasive alien plants. Council of Europe Publ., Strasbourg.
Hulme P.E. 2007. Biological Invasions in Europe: Drivers, Pressures, States, Impacts and Responses. [in:] Hester R., Harrison R.M. (eds.) Biodiversity Under Threat. Iss, Environ. Sci. and Techn., Royal Soc. of Chem., Cambridge: 55-79.

37
Hulme P.E. 2009. Trade, transport and trouble: managing invasive species pathways in an era of globalization. J. App. Ecol., 46: 10‐18.
Hulme P.E., Bacher S., Kenis M., Klotz S., Kühn I., Minchin D., Nentwig W., Olenin S., Panov V., Pergl J., Pyšek P., Roques A., Sol D., Solarz W.,Vilà M. 2008. Grasping at the routes of biological invasions: a framework for integrating pathways into policy. J. Appl. Ecol., 45: 403-414.
ISCC (Invasive Species Council of California) 2013. Invasive Species Pathway Risk Analysis for California. http://www.iscc.ca.gov/docs/reports/CISAC‐Pathway‐Report‐July‐2013‐web.pdf. accessed 18‐02‐2015.
Kelly J., O’Flynn C., Maguire C. 2013. Risk analysis and prioritisation for invasive and non-native species in Ireland and Northern Ireland. A report prepared for the Northern Ireland Environment Agency and National Parks and Wildlife Service as part of Invasive Species Ireland.
Kumschick S., Bacher S., Dawson W., Heikkilä J., Sendek A., Pluess T., Robinson T.B., Kühn I. 2012. A conceptual framework for prioritization of invasive alien species for management according to their impact. NeoBiota, 15: 69-100.
Kumschick S., Bacher S., Evans T., Markova Z., Pergl J, Pysek P., Vaes-Petignat S., van der Veer G., Vila M., Nentwig W. 2015. Comparing impacts of alien plants and animals in Europe using a standard scoring system. J. Appl. Ecol., (in press) DOI: 10.1111/1365-2664.12427.
Kumschick S., Richardson D.M. 2013. Species-based risk assessments for biological invasions: Advances and challenges. Divers. Distrib., 19: 1095-1105.
Lassuy D.R., Lewis P.N. 2013. Invasive species: human-induced. [in:] Meltofte H. (ed.) Arctic Biodiversity Assessment. Status and trends in Arctic biodiversity. Conservation of Arctic Flora and Fauna, Akureyri, 558-565.
Lockwood J.L., Hoopes M.F., Marchetti M.P. 2007. Invasion Ecology. Blackwell Publ..
Madsen C.L., Dahl C.M., Thirslund K.B., Grousset F., Johannsen V. K., Ravn H.P. 2014. Pathways for non-native
species in Denmark. Depart. of Geosci. and Natural Res. Manage., Univ. of Copenhagen, Frederiksberg.
Meyerson L.A., Mooney H.A. 2007. Invasive alien species in an era of globalization. Front. Ecol. Environ., 5: 199-208.
Nentwig W. 2007. Pathways in Animal Invasions. Biological Invasions. Ecological Stud., 193: 11‐27.
Nentwig W., Kühnel E., Bacher S. 2010. A generic impact-scoring system applied to alien mammals in Europe. Cons. Biol., 24: 302-311.
NOBANIS, 2015. Alien Invasive species – pathway analysis and horizon scanning for countries in the Northern Europe. Nordic Council of Ministers (in press).
Pysek P., Jarosík V., Pergl J. 2011. Alien Plants Introduced by Different Pathways Differ in Invasion Success: Unintentional Introductions as a Threat to Natural Areas. PLoS ONE, 6(9):e24890.
Pysek P., Richardson D.M. 2010. Invasive species, environmental change and management, and health. Ann. Rev. Environ. Res., 35: 25-55.
Reichard S.H., White P. 2001. Horticulture as a pathway of invasive plant introductions in the United States. BioScience, 51: 1103-1113.
Ruiz G., Carlton J.T. (eds.) 2003. Invasive Species: Vectors and Management Strategies. Island Press, Washington D.C.
Sigurdardottir R., Thordarson J., Alfredsdóttir L., Bjarnadóttir R., Gudmundsdottir H. 2008. The Economy of Iceland. The Central Bank of Iceland, Reykjavik, Iceland.
Stefansson S. 1901. Flora Islands. Hid Islenzka bokmenntafelag, Copenhagen.
Wasowicz P., Przedpelska-Wasowicz E., Kristinsson H. 2013. Alien vascular plants in Iceland: diversity, spatial patterns, temporal trends, and the impact of climate change. Flora, 208: 648-673.
Wilson E.O. 1965. The challenge from related species. [in:] Baker H. G., Stebbins G. L. (eds.) The genetics of colonizing species. Academic Press, New York: 7-24.