Identification of the mechanism of mixotrophy in ...
215
HAL Id: tel-01685787 https://tel.archives-ouvertes.fr/tel-01685787 Submitted on 16 Jan 2018 HAL is a multi-disciplinary open access archive for the deposit and dissemination of sci- entific research documents, whether they are pub- lished or not. The documents may come from teaching and research institutions in France or abroad, or from public or private research centers. L’archive ouverte pluridisciplinaire HAL, est destinée au dépôt et à la diffusion de documents scientifiques de niveau recherche, publiés ou non, émanant des établissements d’enseignement et de recherche français ou étrangers, des laboratoires publics ou privés. Identification of the mechanism of mixotrophy in Phaeodactylum tricornutum Valeria Villanova To cite this version: Valeria Villanova. Identification of the mechanism of mixotrophy in Phaeodactylum tricornutum. Cellular Biology. Université Grenoble Alpes, 2016. English. NNT: 2016GREAV053. tel-01685787
-
Upload
khangminh22 -
Category
Documents
-
view
3 -
download
0
Transcript of Identification of the mechanism of mixotrophy in ...
HAL Id: tel-01685787https://tel.archives-ouvertes.fr/tel-01685787
Submitted on 16 Jan 2018
HAL is a multi-disciplinary open accessarchive for the deposit and dissemination of sci-entific research documents, whether they are pub-lished or not. The documents may come fromteaching and research institutions in France orabroad, or from public or private research centers.
L’archive ouverte pluridisciplinaire HAL, estdestinée au dépôt et à la diffusion de documentsscientifiques de niveau recherche, publiés ou non,émanant des établissements d’enseignement et derecherche français ou étrangers, des laboratoirespublics ou privés.
Identification of the mechanism of mixotrophy inPhaeodactylum tricornutum
Valeria Villanova
To cite this version:Valeria Villanova. Identification of the mechanism of mixotrophy in Phaeodactylum tricornutum.Cellular Biology. Université Grenoble Alpes, 2016. English. �NNT : 2016GREAV053�. �tel-01685787�
THÈSE
Pour obtenir le grade de
DOCTEUR DE LA COMMUNAUTE UNIVERSITE GRENOBLE ALPES
Spécialité : Biologie Végétale
Arrêté ministériel : 7 août 2006
Présentée par
Valeria VILLANOVA
Thèse dirigée par Giovanni FINAZZI et codirigée par Julien PAGLIARDINI préparée au sein du Laboratoire de Physiologie Cellulaire et Végétale dans l'École Doctorale Chimie et Science du Vivant
Identification du mécanisme de la mixotrophie chez Phaeodactylum tricornutum Thèse soutenue publiquement le 12/09/2016, devant le jury composé de :
M, Thomas, PFANNSCHMIDT Professeur, Université de Grenoble (Président) M, Michel, GOLDSCHMIDT-CLERMONT Professeur, Université de Genève (Examinateur) Mme, Fayza, DABOUSSI Directrice de Recherche, INSA Toulouse (Rapporteur) M, Tomas, MOROSINOTTO Professeur, Università di Padova (Rapporteur) M, Giovanni, FINAZZI Directeur de Recherche, CNRS-iRTSV Grenoble (Directeur de thèse) M, Julien, PAGLIARDINI Chef du Département, Fermentalg (Co-Directeur de thèse)

Contents
Résumé....................................................................................................................................... 5
Abstract ...................................................................................................................................... 6
Preface ....................................................................................................................................... 7
1. General introduction .............................................................................................................. 9
1.1 Diatoms ............................................................................................................................. 9
1.2. Photosynthesis and primary metabolism in diatoms .................................................... 13
1.2.1 Oxygenic Photosynthesis ......................................................................................... 13
1.2.2 Photoprotection ....................................................................................................... 16
1.2.3 Carbon fixation ......................................................................................................... 17
1.2.4 Photorespiration ...................................................................................................... 17
1.2.5 Central Carbon metabolism ..................................................................................... 19
1.3 Trophic variability in diatoms ......................................................................................... 22
1.3.1 Phototrophy ............................................................................................................. 22
1.3.2 Heterotrophy ............................................................................................................ 22
1.3.3 Mixotrophy ............................................................................................................... 23
1.4 Lipid metabolism in microalgae ...................................................................................... 24
1.4.1 PUFAs biosynthetic pathway .................................................................................... 25
1.4.2 TAGs biosynthetic pathways .................................................................................... 27
1.4.3 Strategies for enhancing lipid production ................................................................ 29
2. Cross-talk chloroplast-mitochondria in diatoms ................................................................. 30
2.1 Preface ............................................................................................................................ 30
2.2 Electron flow pathways that produce extra ATP ............................................................ 31
2.3 AOX pathway .................................................................................................................. 32
2.4 Biophysical analysis of photosynthesis........................................................................... 33
2.5 Energetic coupling between plastids and mitochondria drives CO2 assimilation in diatoms ................................................................................................................................. 36
2.6 Conclusions and remarks ................................................................................................ 67
3. Characterisation and optimisation of mixotrophy in Phaeodactylum tricornutum ............ 69
3.1 Preface ............................................................................................................................ 69
Résumé
3.2 Characterisation of mixotrophic metabolism in Phaeodactylum tricornutum .............. 70
3.2.1 Previous investigations of glycerol metabolism in Phaeodactylum tricornutum .... 70
3.2.2 Omics analysis .......................................................................................................... 71
3.3 Optimisation of mixotrophic metabolism by improving culture conditions .................. 73
3.3.1 Culture medium/ nutrients ...................................................................................... 73
3.3.2 Light and NaHCO3 effect .......................................................................................... 74
3.3.3 Scale-up in fermentor .............................................................................................. 75
3.4 Boosting biomass quantity and quality by improved mixotrophic cultivation of the diatom Phaeodactylum tricornutum. ................................................................................... 76
3.5 Conclusions and remarks .............................................................................................. 129
4. Effect of nitrogen and phosphorus starvation in Phaeodactylum tricornutum. ............... 131
4.1 Preface .......................................................................................................................... 131
4.2 Nitrogen and Phosphorous starvation in Phaeodactylum ........................................... 132
4.3 Lipidomic analysis ......................................................................................................... 133
4.4 Biodiversity on the ecotypes of Phaeodactylum .......................................................... 135
4.5 Membrane Glycerolipid Remodeling Triggered by Nitrogen and Phosphorus Starvation in Phaeodactylum tricornutum1 ......................................................................................... 136
4.6 Conclusion and remarks ............................................................................................... 190
5. Final Conclusions and remarks .......................................................................................... 192
References ............................................................................................................................. 197

Résumé
5
Résumé
Les diatomées jouent un rôle primordial dans l'écologie de la planète, car elles sont
responsables du 20-40% de la productivite mondial d’oxygène. Elles figurent parmi les
organismes à fort potentiel biotechnologique pour des applications biocarburant. Les diatomées
sont des organismes symbiotiques issus de la fusion d'un ancêtre hétérotrophe avec une ou
plusieurs micro-algues photosynthétiques. Grace à cette histoire évolutive complexe, les
diatomées ont un métabolisme très flexible. Comme la plus part des microalgues elles peuvent
utiliser la photosynthèse pour leur croissance, mais aussi la mixotrophie, i.e. la capacité de croître
en présence de lumière et d’une source de carbone réduit. L'utilisation simultanée de la
photosynthèse et de la respiration peut augmenter la productivité de la biomasse des
microalgues et réduire ainsi le coût de leur exploitation industrielle. Dans cette thèse j’ai étudié
le mécanisme et les conséquences du métabolisme mixotrophique chez la diatomée modèle
Phaeodactylum tricornutum. J’ai contribué à étudier le mécanisme moléculaire à la base des
interactions énérgétiques entre chloroplaste et mitochondrie. Dans ce travail, nous avons
démontré que le NADPH généré dans le chloroplaste est exporté vers la mitochondrie pour
générer de l’ATP requis pour la fixation du CO2 dans le chloroplaste. Cette interaction entre les
deux organites cellulaires augmente la croissance de diatomées, et suggère que l'utilisation
simultanée d’une source de carbone et de l'énergie lumineuse (mixotrophie) devrait augmenter
la productivité de la biomasse chez les diatomées. Cette hypothèse a été testée dans la deuxième
partie de ma thèse, où j’ai etudié les conséquences de la mixotrophie sur le métabolisme de
Phaeodactylum. Grace à une approche métabolomique, transcriptomique, lipidomiques et de
physiologie j’ai contribué à éclaircir les principales voies métaboliques (métabolisme centrale,
métabolisme des lipides, métabolisme des polymères de réserve) concerné la mixotrophie. Dans
la dernière partie de ce travail j’ai optimisé les conditions de culture et la composition du milieu
afin d’améliorer la productivité en croissance mixotrophe chez Phaeodactylum. Ce résultat a été
validé dans des photobioréacteurs à l'échelle labo pour tester le potentiel de l'exploitation
industrielle de cet organisme.
Abstract
6
Abstract
Diatoms are photosynthetic organisms with a strong influence on the global
biogeochemistry. Moreover, they are extremely interesting as potential feedstocks for the
production of high-value molecules and biofuel. They are endosymbiotic organisms originated by
the fusion of a heterotrophic ancestor with one or more photosynthetic microalgae. This has led
to an extremely flexible cell metabolism. Like other microalgae, diatoms are able to grow in the
presence of both light and of a reduced carbon source. The simultaneous use of photosynthesis
and respiration can increase biomass productivity and reduce the energy cost of the industrial
exploitation of diatoms.
In this project, the mechanism and the consequences of mixotrophic metabolism have
been studied in the model diatom Phaeodactylum tricornutum. In the first part, I have studied
the molecular mechanism governing the interactions between chloroplast and mitochondrion.
We have demonstrated that the NADPH generated in the plastid is exported to the
mitochondrion to generate additional ATP, which, once back to the plastid, is used for carbon
fixation. Overall, this work shows that the interaction between these two organelles increases
carbon fixation and growth in diatoms. We hence suggest that the simultaneous use of carbon
and light energy sources (i.e. mixotrophy) should enhance biomass productivity in diatoms. This
hypothesis has been tested in the second part of my thesis, where I focused on the consequences
of mixotrophy on metabolism. By combining metabolomic, transcriptomic, lipidomic and
physiology approaches, I have contributed to elucidate the main pathways targeted by
mixotrophy (central carbon, lipid and storage carbon metabolism). In the last part of this work, I
have worked on improving the culture conditions and medium composition to boost microalgal
productivity by mixotrophy. These conditions have been scaled-up in lab scale photobioreactors,
revealing the industrial exploitation potential of Phaeodactylum.
Preface
7
Preface
This work was funded by a European grant (Marie Curie ITN "Accliphot") for a period of
three years. The project involved the collaboration of 13 different partners between theoretical
and experimental researchers from both academia and industry. The overall aim of Accliphot
consortium is to study the acclimation process of photosynthetic organisms (i.e. Arabidopsis
thaliana, Chlamydomonas reinhardtii, Phaeodactylum tricornutum) in order to optimise their
exploitation for the production of biofuels and high-value molecules.
In particular, my project involved working in between basic research and industrial R&D.
The first part of my PhD thesis took place at LPCV laboratory (CEA, Grenoble) under the
direction of Dr. Giovanni Finazzi and Dr. Dimitris Petroutsos. The second part was done in
Fermentalg, a start-up committed to the development of fermentation processes in microalgae,
under the direction of Dr. Julien Pagliardini and Adeline Le Monnier. The aim of this research was
to characterise and optimise the mixotrophic growth of Phaeodactylum tricornutum considered
a potential source of triacylglicerols (i.e. TAGs) for the production of biofuel.
To achieve this aim different objectives were pursued:
- Characterisation of the mechanism and the consequences of mixotrophic growth in
Phaeodactylum tricornutum combining omics analyses and biophysical approach.
- Characterisation and comparison of the mechanism of TAG accumulation under nutrient
starvation and in presence of a carbon source (mixotrophic growth) in Phaeodactylum
tricornutum;
- Increase of mixotrophic performances (biomass and lipid productivity) by the
optimisation of medium composition and culture conditions;
- Test the potential of the industrial exploitation of Phaeodactylum: Up-scale in lab scale
photobiorectors and optimisation of fermentation processes.
This PhD thesis is organized in 5 chapters. The first chapter is a general introduction,
followed from 3 experimental chapter, which contain three scientific manscripts, and a final
conclusion.
The aims of the three experimental chapters are:
Preface
8
Chapter 2: Chloroplast-mitochondria cross-talk in diatoms.
The aim of this work (Bailleul et al., 2015) was to evaluate the interplay between the chloroplast
(where the photosynthesis take place) and the mitochondria (site of respiration metabolism)
using a biophysical approach in wild type and respiratory mutants in Phaeodactylum. The
elucidation of the energetic exchanges between these key organelles in diatoms is a crucial step
for the characterisation of the mechanism of mixotrophic growth in these organisms.
Chapter 3: Characterisation and optimisation of mixotrophy in Phaeodactylum tricornutum.
This research (Villanova et al., paper in preparation) is divided in two main subjects: i)
characterization of glycerol metabolism in Phaeodactylum and ii) optimisation of mixotrophic
metabolism by improving culture conditions. In the first part of this research, several omics
analyses (i.e. metabolomic, transcriptomic and lipidomic) have been used to identify the change
in the metabolism during the mixotrophic growth of Phaeodactylum. The main purpose of the
second part of this work was to enhance the performance of mixotrophy by improving medium
composition and culture conditions. The optimised conditions have been then scaled-up in
photobioreactors to test the potential of the industrial exploitation of Phaeodactylum.
Chapter 4: Effects of Nitrogen and Phosphate starvation on lipid content of Phaeodactylum
tricornutum.
The aim of this work (Abida et al., 2015) was to evaluate the effect of Nitrogen and Phosphate
starvation on lipid content of the different ecotypes of Phaeodactylum. It represents the first
reference of the glycerolipidomic of Phaeodactylum that allowed to characterize and dissect the
lipid metabolic routes under various levels of nitrogen or phosphorus supplies.
General introduction
9
Chapter 1
General introduction
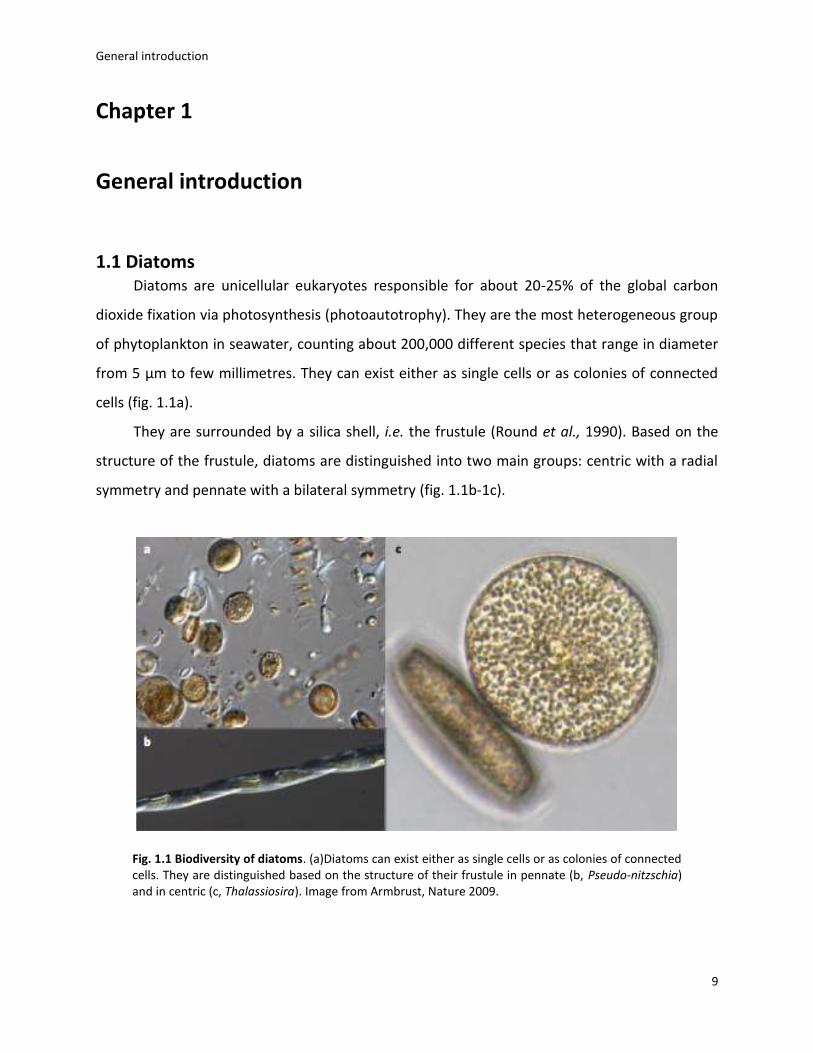
1.1 Diatoms Diatoms are unicellular eukaryotes responsible for about 20-25% of the global carbon
dioxide fixation via photosynthesis (photoautotrophy). They are the most heterogeneous group
of phytoplankton in seawater, counting about 200,000 different species that range in diameter
from 5 μm to few millimetres. They can exist either as single cells or as colonies of connected
cells (fig. 1.1a).
They are surrounded by a silica shell, i.e. the frustule (Round et al., 1990). Based on the
structure of the frustule, diatoms are distinguished into two main groups: centric with a radial
symmetry and pennate with a bilateral symmetry (fig. 1.1b-1c).
Fig. 1.1 Biodiversity of diatoms. (a)Diatoms can exist either as single cells or as colonies of connected cells. They are distinguished based on the structure of their frustule in pennate (b, Pseudo-nitzschia) and in centric (c, Thalassiosira). Image from Armbrust, Nature 2009.
General introduction
10
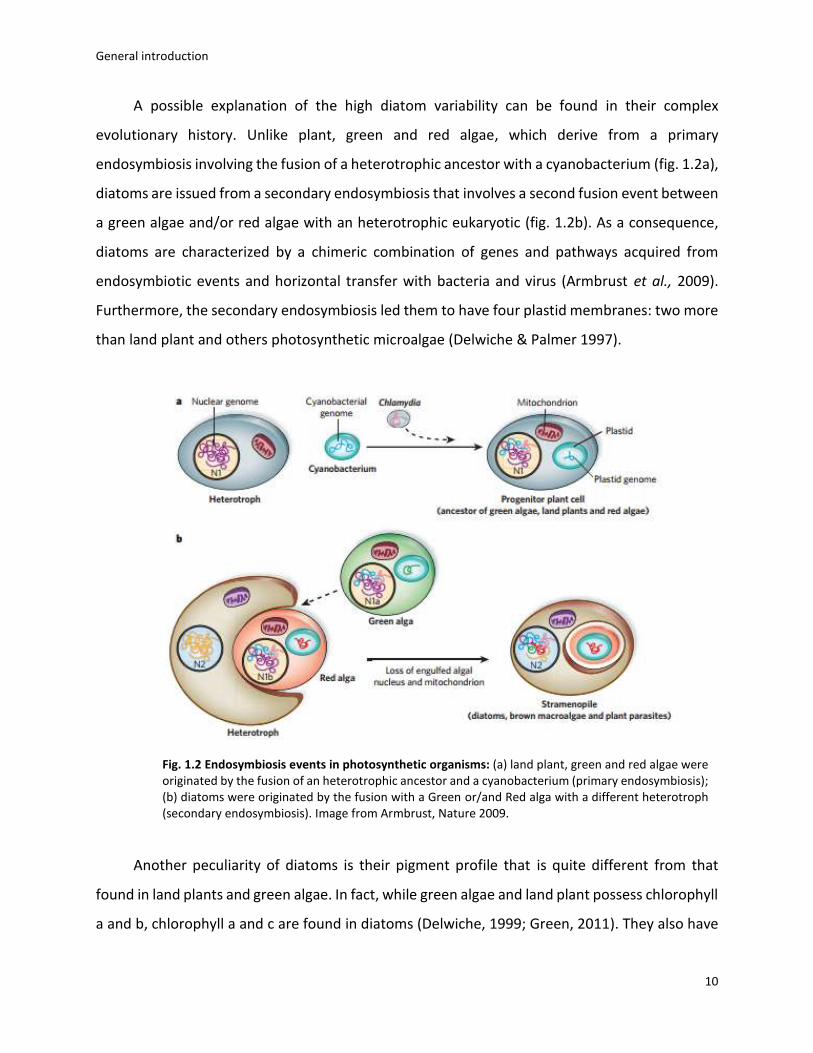
A possible explanation of the high diatom variability can be found in their complex
evolutionary history. Unlike plant, green and red algae, which derive from a primary
endosymbiosis involving the fusion of a heterotrophic ancestor with a cyanobacterium (fig. 1.2a),
diatoms are issued from a secondary endosymbiosis that involves a second fusion event between
a green algae and/or red algae with an heterotrophic eukaryotic (fig. 1.2b). As a consequence,
diatoms are characterized by a chimeric combination of genes and pathways acquired from
endosymbiotic events and horizontal transfer with bacteria and virus (Armbrust et al., 2009).
Furthermore, the secondary endosymbiosis led them to have four plastid membranes: two more
than land plant and others photosynthetic microalgae (Delwiche & Palmer 1997).
Another peculiarity of diatoms is their pigment profile that is quite different from that
found in land plants and green algae. In fact, while green algae and land plant possess chlorophyll
a and b, chlorophyll a and c are found in diatoms (Delwiche, 1999; Green, 2011). They also have
Fig. 1.2 Endosymbiosis events in photosynthetic organisms: (a) land plant, green and red algae were originated by the fusion of an heterotrophic ancestor and a cyanobacterium (primary endosymbiosis); (b) diatoms were originated by the fusion with a Green or/and Red alga with a different heterotroph (secondary endosymbiosis). Image from Armbrust, Nature 2009.
General introduction
11
a large amount of the carotenoid fucoxanthin that give them their golden-brown colour. These
pigments are involved in the light harvesting, being embedded in pigment containing protein
complexes called fucoxanthin-chlorophyll-proteins (FCPs) (Green, 1996). Diatoms also possess
accessory pigments such as diadinoxanthin (Ddx), diatoxanthin (Dtx), violaxanthin (Vx),
antheraxanthin (Ax), and zeaxanthin (Zx) with the main function of protecting the cells from
oxidative stress via photoprotection (see paragraph 1.2.2) (reviewed in Kuczynska et al., 2015).
Diatoms are considered an emerging model for the study of photosynthesis and
photoprotection mechanisms in the sea (see paragraphs 1.2.1-1.2.2). Furthermore, their ability
to accumulate lipid as storage energy (i.e. 20%–30% of dry weight) makes them industrially
attractive for the production of biofuels and high value products (see paragraph 1.4). In this
project, almost all the experiments have been performed using the pennate Phaeodactylum
tricornutum (see paragraph 1.1.1).
1.1.1 Phaeodactylum tricornutum
Bohlin described this microalaga for the first time in 1897 as the unique specie of the genus
Phaeodactylum. It was wrongly assigned first to the classes Chrysophyceae (Hendey 1954) and
then to Chrysococcalian (Bourrelly & Dragesco 1955) as consequence of its unusual
characteristics. In fact, Phaeodactylum possesses an atypical frustule structure that is only poorly
silicified, and at variance with other diatoms, it does not require silicic acid to grow (Lewin et al.,
1958). Various ecotypes have been collected around the world and more than ten different
accessions of P. tricornutum have been characterised (De Martino et al., 2007, Abida et al., 2015).
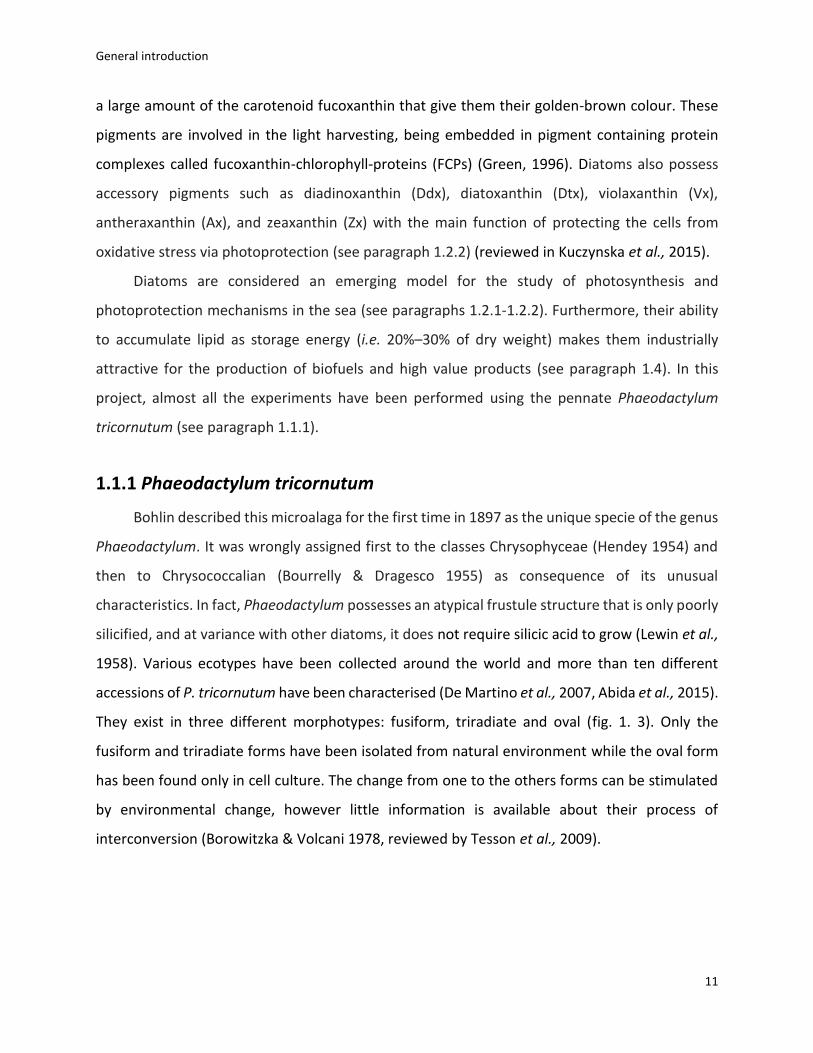
They exist in three different morphotypes: fusiform, triradiate and oval (fig. 1. 3). Only the
fusiform and triradiate forms have been isolated from natural environment while the oval form
has been found only in cell culture. The change from one to the others forms can be stimulated
by environmental change, however little information is available about their process of
interconversion (Borowitzka & Volcani 1978, reviewed by Tesson et al., 2009).
General introduction
12
Furthermore, Phaeodactylum is the second diatom (after the centric diatom Thalassiosira
pseudonana) in which the genome was sequenced (Bowler et al., 2008). This genome sequencing
revealed interesting information such as the presence of hundreds of genes from bacteria as well
as of animal-derived pathways, i.e. the ornithine-urea cycle. This pathway, absent in land plant
and green algae, seems to be essential for diatom growth and carbon fixation (Allen et al., 2011).
The availability of genome sequence and of molecular tools makes P. tricornutum a model
organism for biotech purposes. It is possible to transform its genome by biolistic method (Apt et
al., 1996; Falciatore et al., 1999) or by electroporation (Zhang & Hu 2014). More recently a high-
throughput genetic transfer from E. coli to P. tricornutum via conjugation has been reported
(Karas et al., 2015). These methods allow to generate mutant lines, i.e. introducing either
exogenous or endogenous genes controlled, e.g. by the strong light-induced promoters of the
FCP proteins (Falciatore et al., 1999). Moreover, different diatom expression vectors based on
Invitrogen Gateway TM technology are available in P. tricornutum. This technology has been used
for either functional analyses of overexpressed genes or subcellular localization by fusion to
fluorescent proteins (Siaut et al., 2007). Instead, knock-down (KD) mutants can be generated in
Phaeodactylum via antisense RNA (asRNA) or RNA interference (RNAi) technology (De Riso et al.,
2009). These technologies are based on the expression of small complementary RNA that
interacts with target mRNAs. This interaction leads to the downregulation of the gene of interest
Triradiate Oval
Fusiform
Fig. 1.3 The three morphotypes of Phaoedactylum.
General introduction
13
either via mRNAs degradation or translation inhibition. Both RNAi and asRNA do not change the
genetic code and are only able to reduce (not to eliminate) the gene function. However, recent
advances in genome editing technologies (i.e. TALEN or CRISPR-Cas) in Phaeodactylum allow to
the permanent elimination of gene function, i.e. generation of Knock-out (KO) mutant lines
(Daboussi et al., 2014).
Thanks to the development of these molecular tools in Phaeodactylum, now is possible to
modify specific pathways leading to more efficient use of this organism for the production of
high-value metabolites, e.g. triacylglycerols (TAGs) and polyunsaturated fatty acids (PUFAs) (see
paragraph 1.4.3).
1.2. Photosynthesis and primary metabolism in diatoms
1.2.1 Oxygenic Photosynthesis
Photosynthesis is the process carried out by plant, algae, and some bacteria that involves
the conversion of light energy into chemical energy. During this process, water and CO2 are
converted in carbohydrates and O2. It comprises two different phases: the light and the dark
reactions. The light reactions produce i.e. ATP and NADPH, which are consumed in the dark
reactions to convert CO2 to carbohydrates.
In plants, the light reaction begins with the absorption of light at the level of the antenna
complex, i.e. FCPs (see paragraph 1.1.1), and the transfer of this energy to a reaction centre.
Here, light energy is used for charge separation and electron flow through the photosynthetic
electron transport chain constituted by: Photosynthems II (PSII), plastoquinone (PQ),
Cytochrome b6f (Cytb6 f), plastocyanin (PC), Photosynthems I (PSI), ferrodoxin (Fd), Fd-NADP+-
oxidoreductase (FNR) and ATP synthase. The basis of this process are explained in the Z-scheme
(Hill & Bendall 1960).
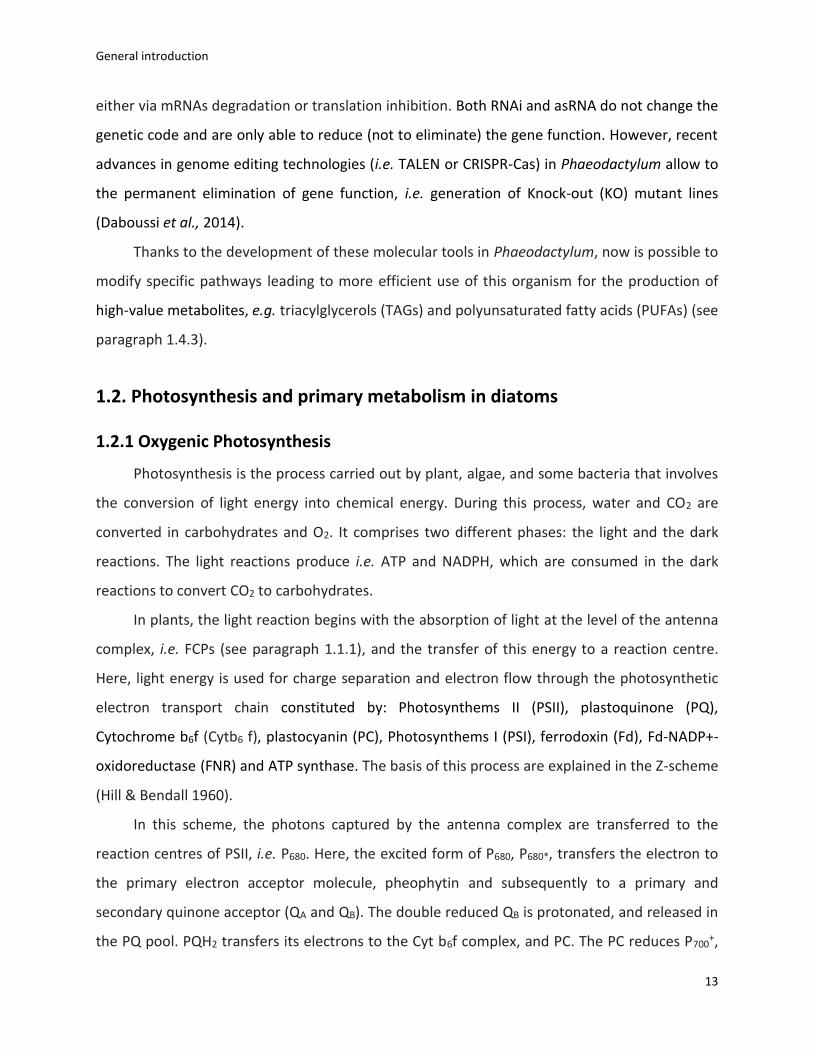
In this scheme, the photons captured by the antenna complex are transferred to the
reaction centres of PSII, i.e. P680. Here, the excited form of P680, P680*, transfers the electron to
the primary electron acceptor molecule, pheophytin and subsequently to a primary and
secondary quinone acceptor (QA and QB). The double reduced QB is protonated, and released in
the PQ pool. PQH2 transfers its electrons to the Cyt b6f complex, and PC. The PC reduces P700+,
General introduction
14
the oxidised chlorophyll donor of PSI. P700+ is generated by excitation of P700 upon reduction of
the A0 and A1 acceptors by P700*. A1 is in turn oxidised by the soluble electron carrier Fd, which
ultimately reduces NADP+ to NADPH via the ferredoxion NADP reductase, FNR, protein (fig. 1.4).
The process is similar in diatoms, however, they contain the cytochrome c6 instead of PC
(Bohme & Kunert 1980).
The electron transfer reactions resulting in the generation of a protons gradient across
thylakoid membranes, which is used to produce ATP through the proton pump ATP-synthase.
Finally, the ATP and NADPH generated by photosynthesis are used for CO2 fixation and other
cellular processes, as discussed in paragraphs 1.2.3-1.2.5.
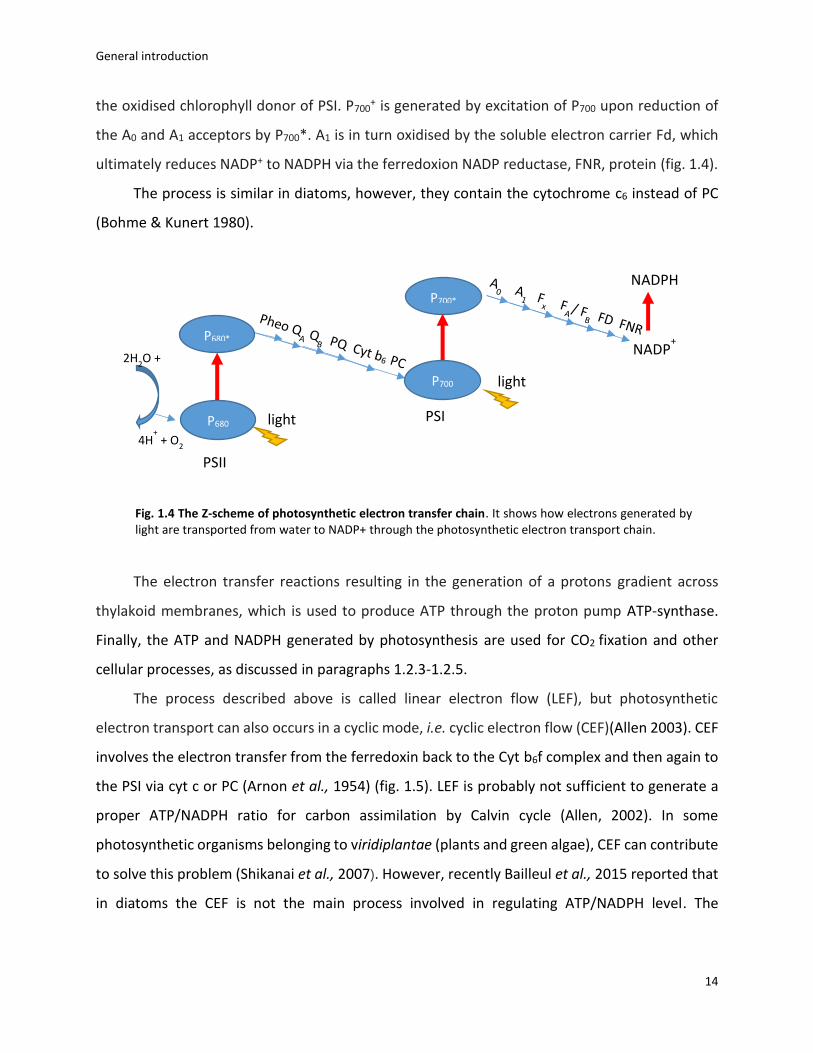
The process described above is called linear electron flow (LEF), but photosynthetic
electron transport can also occurs in a cyclic mode, i.e. cyclic electron flow (CEF)(Allen 2003). CEF
involves the electron transfer from the ferredoxin back to the Cyt b6f complex and then again to
the PSI via cyt c or PC (Arnon et al., 1954) (fig. 1.5). LEF is probably not sufficient to generate a
proper ATP/NADPH ratio for carbon assimilation by Calvin cycle (Allen, 2002). In some
photosynthetic organisms belonging to viridiplantae (plants and green algae), CEF can contribute
to solve this problem (Shikanai et al., 2007). However, recently Bailleul et al., 2015 reported that
in diatoms the CEF is not the main process involved in regulating ATP/NADPH level. The
PSI light
light
NADPH
NADP+
P700*
P700
PSII
P680
P680* 2H
2O +
4H+ + O
2
Fig. 1.4 The Z-scheme of photosynthetic electron transfer chain. It shows how electrons generated by light are transported from water to NADP+ through the photosynthetic electron transport chain.
General introduction
15
alternative pathways for producing extra ATP in photosynthetic organisms will be discussed in
paragraph 2.1.
Fig. 1.5 Schematic representation of the linear (LEF) and cyclic electron transfer (CEF) in diatoms. The LEF goes from PSII to the NADP+ (black dotted lines); The CEF represents the electron transfer around the PSI (dotted red lines).
e-
PS II PS I Cyt b6f PQ
Cyt c
e-
e-
e- e-
e-
H2O O2
fd
NADP+ NADPH
e-
e-
General introduction
16
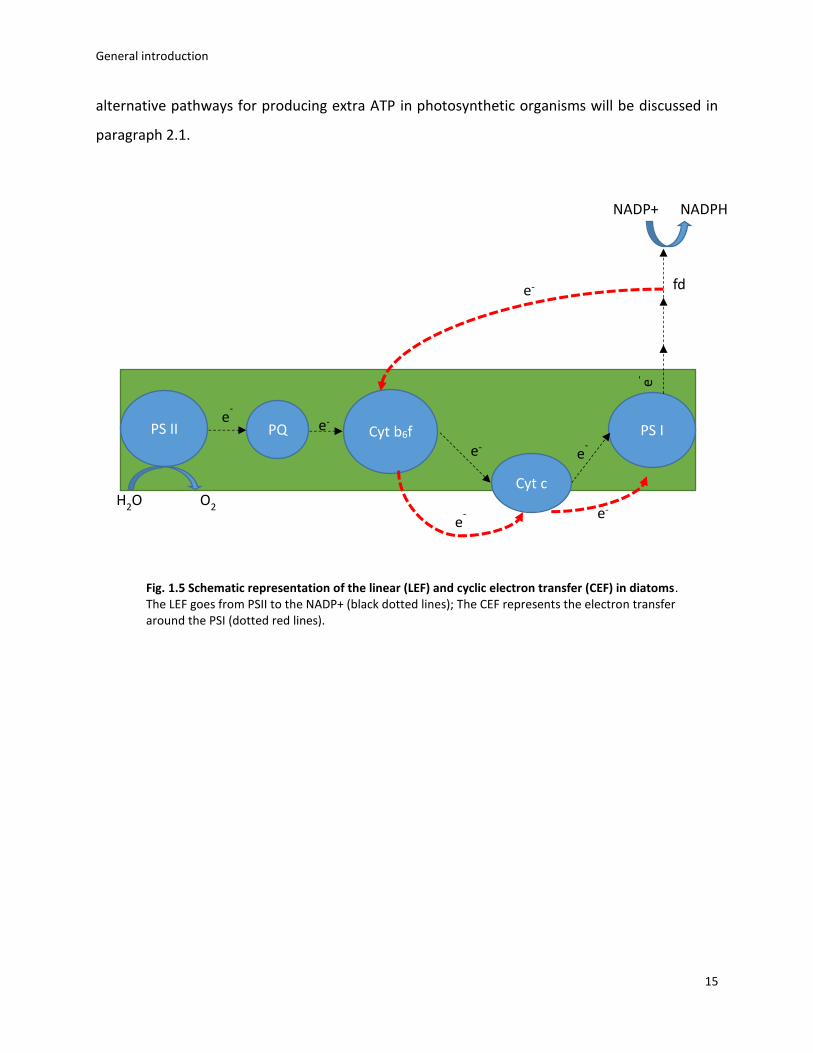
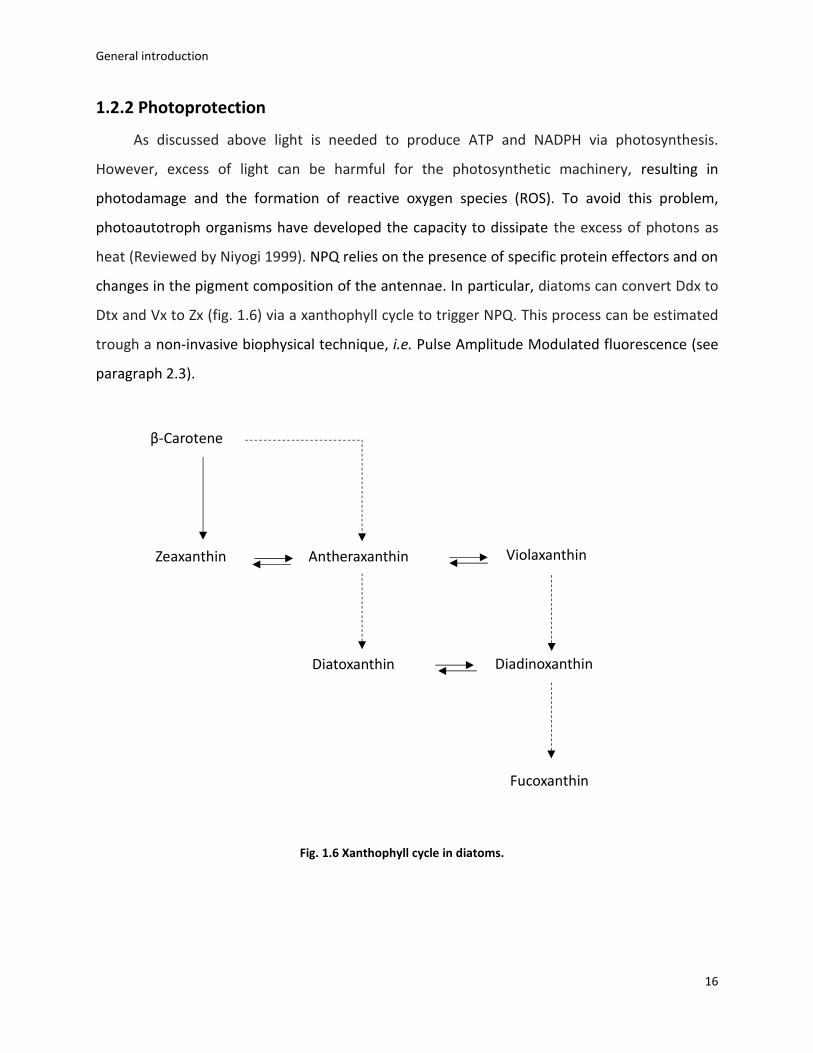
1.2.2 Photoprotection
As discussed above light is needed to produce ATP and NADPH via photosynthesis.
However, excess of light can be harmful for the photosynthetic machinery, resulting in
photodamage and the formation of reactive oxygen species (ROS). To avoid this problem,
photoautotroph organisms have developed the capacity to dissipate the excess of photons as
heat (Reviewed by Niyogi 1999). NPQ relies on the presence of specific protein effectors and on
changes in the pigment composition of the antennae. In particular, diatoms can convert Ddx to
Dtx and Vx to Zx (fig. 1.6) via a xanthophyll cycle to trigger NPQ. This process can be estimated
trough a non-invasive biophysical technique, i.e. Pulse Amplitude Modulated fluorescence (see
paragraph 2.3).
β-Carotene
Zeaxanthin Antheraxanthin Violaxanthin
Diatoxanthin Diadinoxanthin
Fucoxanthin
Fig. 1.6 Xanthophyll cycle in diatoms.
General introduction
17
1.2.3 Carbon fixation
As mentioned above, the NADPH and ATP generated during the first part of photosynthesis
are then used for carbon fixation within the dark phase. In phototrophs, two types of
photosynthesis are possible: C3 photosynthesis, with the formation of the 3 carbon compound
phosphoglyceric acid (PGA) and C4 with the formation of the 4 carbon compound oxaloacetic
acid (OAA). Both types of products were found in diatoms, suggesting that probably both
pathways are present (Roberts et al., 2007).
The key enzyme for carbon fixation (C3) is the ribulose-1,5-bisphosphate
carboxylase/oxygenase (Rubisco). This enzyme catalyses the carboxylation of D-ribulose-1,5-
bisphosphate (RuBP) via Calvin-Benson-Bassham cycle. However, Rubisco it is also capable of
performing an oxygenation of RuBP. This process is known as photorespiration. The two reactions
are competitive (oxygenation and carboxylation) but at high CO2 concentration (and low O2
concentration) the Rubisco preferentially performs the Calvin-Benson-Bassham cycle instead of
the photorespiration and vice versa. To increase the relative CO2 concentration and reduce
photorespiration, some algae (including diatoms) have developed CO2 concentrating
mechanisms (CCM) based on the transport of bicarbonate (HCO3-) into the chloroplast and the
activity of the enzyme carbonic anhydrase (CA). This enzyme catalyses the conversion of the
HCO3- in CO2 increasing the concentration of the latter near the catalytic site of Rubisco
(Reinfelder et al., 2000).
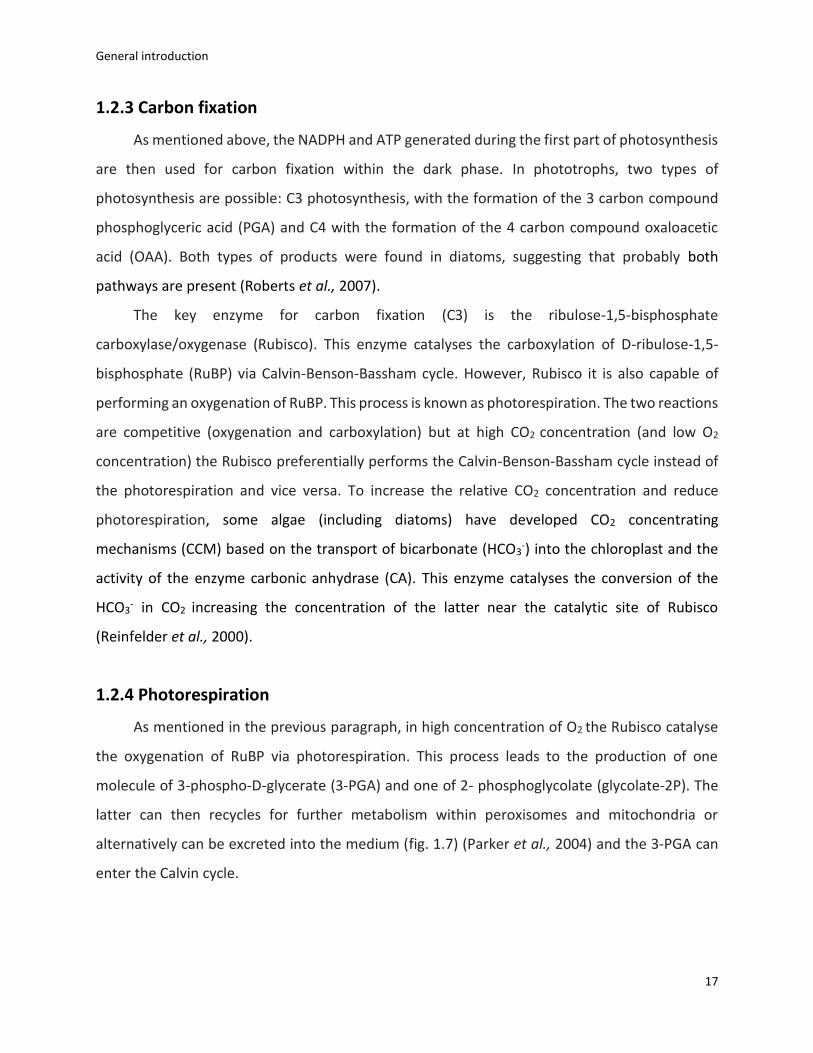
1.2.4 Photorespiration
As mentioned in the previous paragraph, in high concentration of O2 the Rubisco catalyse
the oxygenation of RuBP via photorespiration. This process leads to the production of one
molecule of 3-phospho-D-glycerate (3-PGA) and one of 2- phosphoglycolate (glycolate-2P). The
latter can then recycles for further metabolism within peroxisomes and mitochondria or
alternatively can be excreted into the medium (fig. 1.7) (Parker et al., 2004) and the 3-PGA can
enter the Calvin cycle.
General introduction
18
Peroxisome
Mitochondrion
Excretion
RuBp O
2
CO2
3-PGA
glycolate-2P
+ 3-PGA
Plastid
RUBISCO
Calvin Cycle
glycolate
Carbon fixation
Phosphorespiration
GAP
Others sugars
Fig. 1.7 Schematic representation of Photorespiration and Carbon fixation. The RUBISCO can catalyse both the carboxylation (carbon fixation) and the oxidation (Phosphorespiration) of the Rubilose-1-5-biphosphate (RuBp). The photorespiration pathway (Red box) forms the glycolate that can be directed in others cellular districts or excreted outside the cell. The Carbon fixation (Blue box) brings to the formation of 3-phospho-D-glycerate (3-PGA) that enters the Calvin cycle and forms the glyceraldeyde-3-phosphate (GAP). The latter can take part to different metabolic pathway leading to the formation of others carbohydrates.
General introduction
19
1.2.5 Central Carbon metabolism
The central carbon metabolism includes all the pathways involve in the transport and
oxidation of main carbon sources within the cells. In all photoautotrophic organisms, the principal
pathways involved in the regulation of the carbon flux are glycolysis, gluconeogenesis, pyruvate
metabolism and tricarboxylic acid (TCA) cycle.
The glycolysis is the degradation of glucose to produce ATP and pyruvate that can enter
different metabolic pathways. In diatoms, several isoenzymes involved in glycolysis occur in
different cellular compartment, i.e. chloroplast, mitochondrion, cytosol. Kroth et al., 2008
showed that in these organisms a complete glycolysis pathway could occur in the chloroplast.
However, diatoms possess also an atypical glycolytic pathway, i.e. the Embden–Meyerhof-Parnas
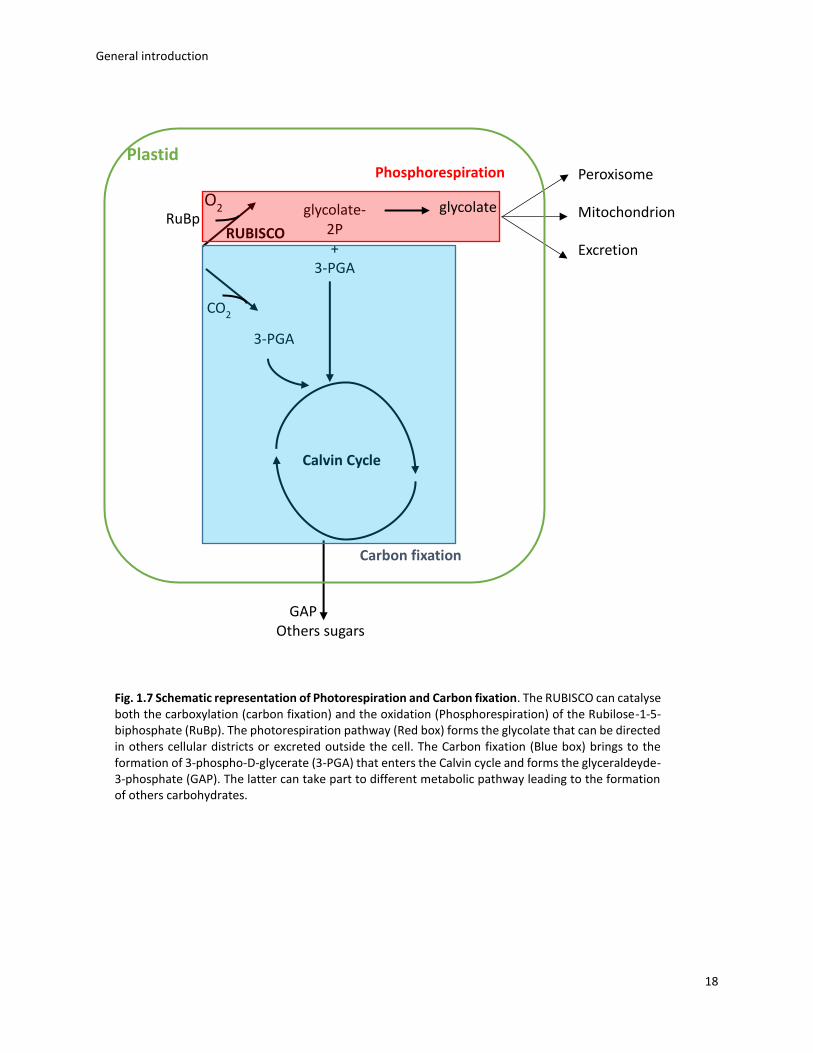
pathway (EMP) (Fabris et al., 2012). Bioinformatics and experimental evidences showed that in
Phaeodactylum, the upper phase of EMP pathway is located in the cytosol while the lower phase
is located in the mitochondria (Liaud et al., 2000; Kroth et al., 2008). The presence of the
glycolysis pathway in the mitochondrion could provide intermediates for the TCA cycle. Indeed,
the glycolytic end-product, i.e. pyruvate, can enter either the TCA cycle (mitochondria) or the
fatty acids synthesis metabolism (chloroplast) (fig. 1. 8). The fatty acid synthesis will be described
in the paragraph 1.4.1. The pyruvate can enter the TCA cycle trough conversion either to i) acetyl-
CoA by pyruvate dehydrogenase, or ii) oxaloacetate by pyruvate carboxylase.
General introduction
20
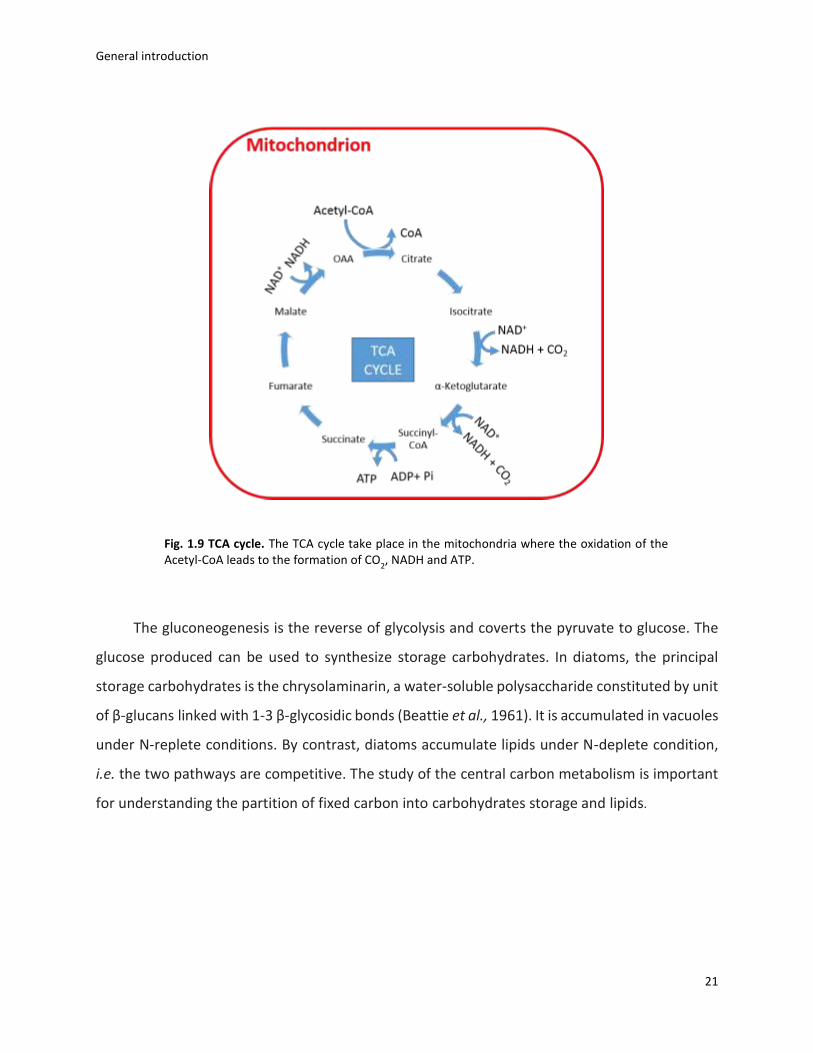
TCA cycle takes place in the mitochondria and involves the oxidation of Acetyl-coA to
produce CO2, ATP and NADH (fig. 1. 9). However, in plant and yeast, some isoenzymes of TCA
cycle are localised in cytoplasm (Millar et al., 2011; Catoni et al., 2003; Pallotta et al., 1999) and
this may be possible also in diatoms (Kroth et al., 2008; Smith et al., 2012). This pathway plays a
key role in the cellular metabolism, i) providing intermediates important for biosynthetic
reactions (e.g. lipids and carbohydrates); ii) supplying ATP and NADPH for cytoplasm and
chloroplast and iii) regulating the redox state of the cell. The latter is regulated by specific
metabolites shuttle in both chloroplasts and mitochondria that allows the exchanging of reducing
equivalents between these organelles (Weber and Linka, 2010; Hempel et al., 2010). This
mechanism is only poorly understood in diatoms, the identification and subcellular localisation
of transporters and enzymes involved in this process should be addressed (Prihoda et al., 2012;
Bailleul et al., 2015).
Fig. 1.8 Embden-Meyerhof-Parnas pathway in diatoms. The EMP pathway is dived in two phases upper (cytosol) and lower phases (mitochondria). The end-product pyruvate is then converted to the Acetyl-coA that can enter either in the TCA cycle or in the fatty acid synthesis.
Glucose
Glu6P
Fru6P
Fru1,6bisP
GAP
1,3 bis PG
3PG
2PG
PEP
Pyruvate
DHA
Up
per p
hase
Lo
we
r ph
ase
Acetyl-coA
TCA cycle Fatty acid synthesis
General introduction
21
The gluconeogenesis is the reverse of glycolysis and coverts the pyruvate to glucose. The
glucose produced can be used to synthesize storage carbohydrates. In diatoms, the principal
storage carbohydrates is the chrysolaminarin, a water-soluble polysaccharide constituted by unit
of β-glucans linked with 1-3 β-glycosidic bonds (Beattie et al., 1961). It is accumulated in vacuoles
under N-replete conditions. By contrast, diatoms accumulate lipids under N-deplete condition,
i.e. the two pathways are competitive. The study of the central carbon metabolism is important
for understanding the partition of fixed carbon into carbohydrates storage and lipids.
Fig. 1.9 TCA cycle. The TCA cycle take place in the mitochondria where the oxidation of the Acetyl-CoA leads to the formation of CO
2, NADH and ATP.
General introduction
22
1.3 Trophic variability in diatoms
Diatoms exhibit trophic flexibility. The larger group of diatoms are photoautotrophs.
However, some of them are also able to use organic carbon via respiration either in the dark
(heterotrophs) or in presence of light (mixotrophs).
1.3.1 Phototrophy
Almost all diatoms are photosynthetic organisms, capable of fixing CO2 via photosynthesis
as described in the paragraph 1.2.1 and 1.2.3. Diatoms are considered amongst the most
productive organisms in the ocean thanks to their capacity to adapt to environmental changes.
(see paragraph 1.2.2). Moreover, it is possible to increase biomass productivity by increasing the
CO2 concentration in different algal species, including Phaeodactylum (Yongmanitchai & Ward
1991, Wu et al., 2015). Similar results were obtained by Gardner et al., 2012. The authors
demonstrated that the addition of NaHCO3 can stimulate the accumulation of TAGs in both
Scenedesmus and Phaeodactylum. The use of NaHCO3 as inorganic carbon source results to be a
cheaper and more suitable alternative to the CO2 (Chi et al., 2011). The use of organic carbon
source for diatoms cultivation will be discuss in the next paragraphs (1.3.2 and 1.3.3).
1.3.2 Heterotrophy
A few species of diatoms can grow in heterotrophy by utilizing organic carbon substrates in
the dark (Lewin & Lewin, 1960).
Two different categories of heterotrophs can be distinguished: i) obligate heterotrophs
(e.g. Nitzchia alba) that lack photosynthetic pigments and are not able to perform photosynthesis
and ii) facultative heterotrophs (e.g. Cyclotella cryptica) that can perform separately
photosynthesis and respiration metabolism.
Three different species of Nitzschia belong to the first group. They are colourless pennate
diatoms that are probably originated from a mutation of a photosynthetic progenitor that lost its
chloroplast (Lewin et al., 1967). It was reported that some of them are capable of heterotrophic
growth on both simple (i.e. lactate, acetate and glucose) and complex carbohydrates with high
productivity (Lewin et al., 1960; Armstrong et al., 2000).
General introduction
23
Amongst facultative heterotrophs, the centric diatom Cyclotella cryptica is able to grow in
presence of glucose in the dark, but it shows a lower productivity than in photoautotrophic
conditions (Hellebust et al., 1971). Some microalgae are obligate photoautotrophs because they
possess an inefficient uptake of carbon sources (reviewed in Chen and Chen 2006). Therefore,
metabolic engineering is a potential solution for a biotechnological utilization of these organisms.
For example, the introduction of the gene encoding for the human glucose transporter (GLUT1)
in Phaeodactylum tricornutum allowed the uptake of glucose in the dark (Zaslavskaia et al., 2001)
and consequent heterotrophic growth.
In some case, the use of the heterotrophic metabolism is economically more convenient
than the phototrophic metabolism, resulting in higher lipids and biomass productivity. However,
another economic aspect that has to be taken into account is the additional cost of organic
carbon supplementation. To solve this problem wastewater and biodiesel waste (i.e. glycerol) are
often used for the industrial exploitation of microalgae.
1.3.3 Mixotrophy
As described in the previous paragraph 1.3.2, only few species of diatoms are able to grow
in heterotrophy and this process is not always convenient. For this reason, the mixotrophic
metabolism is of major interest for biofuel production in diatoms (Wang et al., 2012). Mixotrophy
is the growth in presence of both light and organic carbon when both respiration and
photosynthesis are simultaneously active. Different diatoms such as Phaeodactylum tricornutum
(Cerón-García et al., 2000; 2005; 2006), Navicula saprophila, and some species of Nitzschia
species (Kitano et al., 1997) can grow in mixotrophy. However, these diatoms show some
differences in their mixotrophic growth.
Navicula saprophila is able to growth in acetic acid in presence and absence of light as well
as in photrotophic mode. However, N. saprophila shows the highest growth capacity in
mixotrophy, where its growth rate corresponds to the sum of the heterotrophic plus phototrophy
growth. In addition, the growth in mixotrophy allowed obtaining the highest eicosapentaenoic
acid (EPA, see paragraph 1.4.1) productivity comparing with the use of others trophic modes
(Kitano et al., 1997). On the other hand, the diatom Nitzschia showed higher EPA production in
heterotrophy than in mixotrophy.
General introduction
24
Finally, P. tricornutum is a facultative mixotroph that is not able to grow in absence of light.
Previous works have shown that it is capable to grow in mixotrophy in presence of different
carbon sources such as glycerol, acetate, glucose and fructose (Cerón-García et al., 2000; 2005;
Liu et al., 2008; Wang et al., 2012). So far, the glycerol is the best candidate for biomass and lipids
productivity (Cerón-García et al., 2005; 2006; 2013). However, information is still scarce on how
glycerol is involved in central carbon and lipid metabolism. This has been one of the main
objective of this PhD work.
1.4 Lipid metabolism in microalgae
As described above, phototrophic organisms are able to convert light energy to different
cellular metabolites, including high-value products. In particular, microalgae, i.e. diatoms, are
considered a promising source of lipids for the production of triacylglycerols (TAGs) and
polyunsaturated fatty acids (PUFAs). The Fatty acid and lipid biosynthetic pathways in these
organisms are similar to the ones present in higher plant and consisting of both a eukaryotic and
a prokaryotic pathways (Hu et al., 2008). These pathways are present in different compartments
of algal cells: chloroplast, cytosol and endoplasmic reticulum and will discuss in paragraphs 1.4.1.
and 1.4.2. However, we still do not know how these organisms prioritize carbon toward the
production of these molecules. Usually, phototrophs use almost all the energy derived from the
carbon fixation for growth and for the biosynthesis of carbohydrates under optimum growth
condition (Melis 2013). By contrast, under adverse conditions, they stop growing and start
accumulating storage molecules (i.e. lipids) (Cheng & He 2014). Because growth is arrested the
biomass productivity of microalgae is highly reduced. The different strategies to overcome this
problem will be discussed in paragraph 1.4.3.
General introduction
25
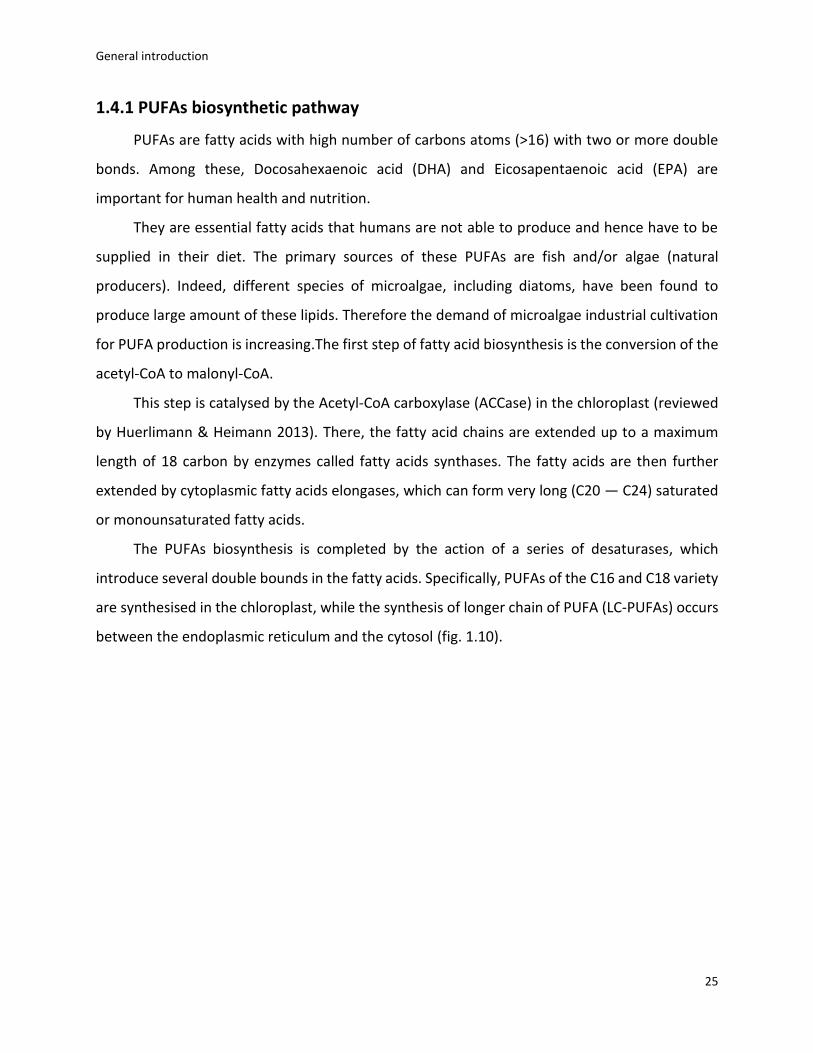
1.4.1 PUFAs biosynthetic pathway
PUFAs are fatty acids with high number of carbons atoms (>16) with two or more double
bonds. Among these, Docosahexaenoic acid (DHA) and Eicosapentaenoic acid (EPA) are
important for human health and nutrition.
They are essential fatty acids that humans are not able to produce and hence have to be
supplied in their diet. The primary sources of these PUFAs are fish and/or algae (natural
producers). Indeed, different species of microalgae, including diatoms, have been found to
produce large amount of these lipids. Therefore the demand of microalgae industrial cultivation
for PUFA production is increasing.The first step of fatty acid biosynthesis is the conversion of the
acetyl-CoA to malonyl-CoA.
This step is catalysed by the Acetyl-CoA carboxylase (ACCase) in the chloroplast (reviewed
by Huerlimann & Heimann 2013). There, the fatty acid chains are extended up to a maximum
length of 18 carbon by enzymes called fatty acids synthases. The fatty acids are then further
extended by cytoplasmic fatty acids elongases, which can form very long (C20 — C24) saturated
or monounsaturated fatty acids.
The PUFAs biosynthesis is completed by the action of a series of desaturases, which
introduce several double bounds in the fatty acids. Specifically, PUFAs of the C16 and C18 variety
are synthesised in the chloroplast, while the synthesis of longer chain of PUFA (LC-PUFAs) occurs
between the endoplasmic reticulum and the cytosol (fig. 1.10).
General introduction
26
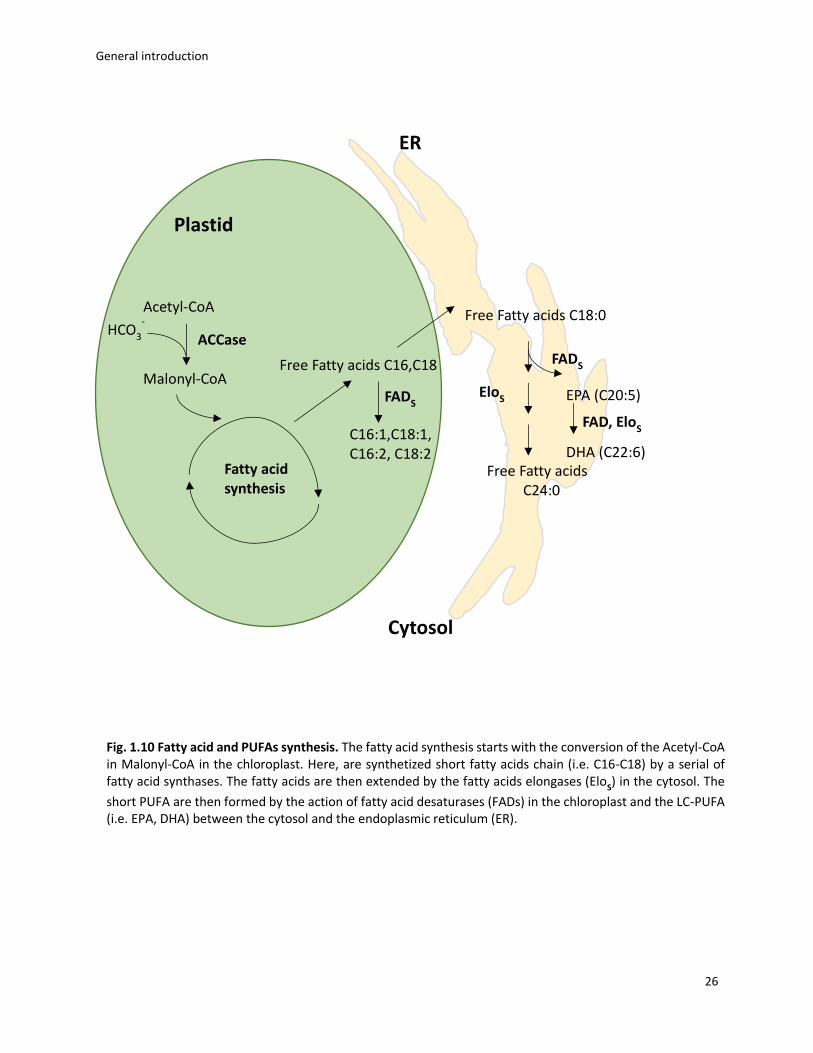
Fig. 1.10 Fatty acid and PUFAs synthesis. The fatty acid synthesis starts with the conversion of the Acetyl-CoA in Malonyl-CoA in the chloroplast. Here, are synthetized short fatty acids chain (i.e. C16-C18) by a serial of fatty acid synthases. The fatty acids are then extended by the fatty acids elongases (Elo
S) in the cytosol. The
short PUFA are then formed by the action of fatty acid desaturases (FADs) in the chloroplast and the LC-PUFA (i.e. EPA, DHA) between the cytosol and the endoplasmic reticulum (ER).
Plastid
Acetyl-CoA
Malonyl-CoA
HCO3
-
Fatty acid
synthesis
EloS
Free Fatty acids C18:0
Free Fatty acids
C24:0
ACCase
Free Fatty acids C16,C18
C16:1,C18:1, C16:2, C18:2
FADS
ER
Cytosol
FADS
EPA (C20:5)
FAD, EloS
DHA (C22:6)
General introduction
27
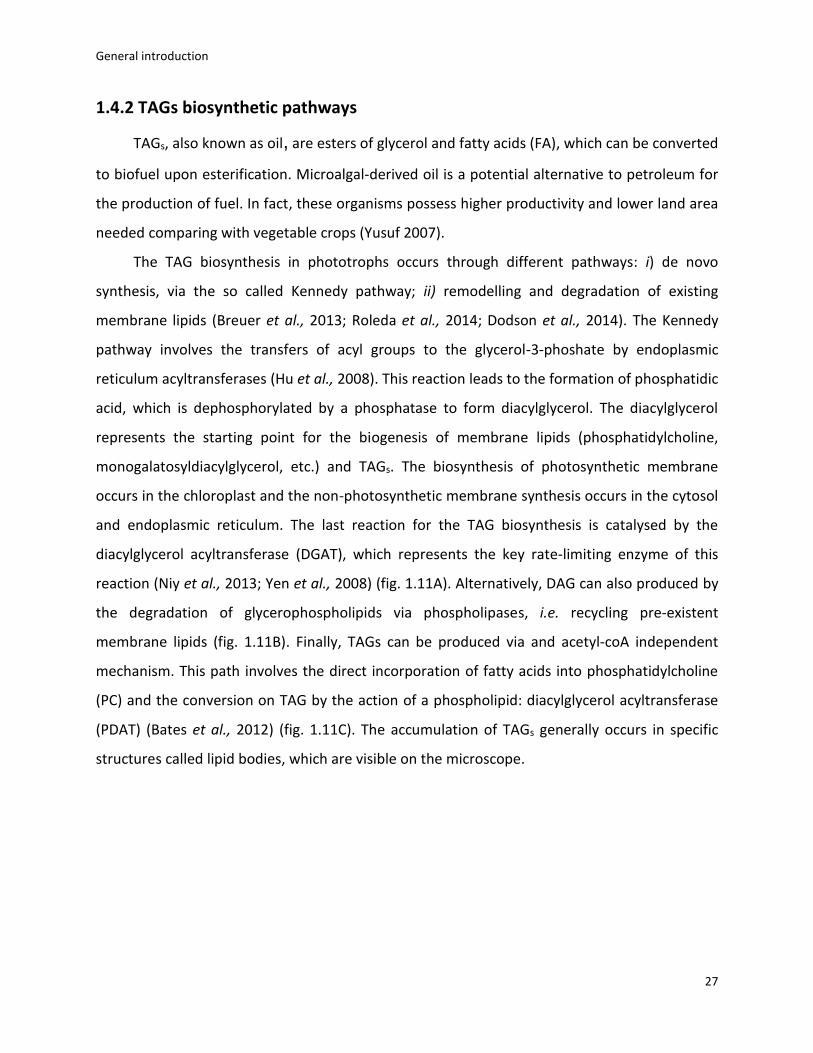
1.4.2 TAGs biosynthetic pathways
TAGs, also known as oil, are esters of glycerol and fatty acids (FA), which can be converted
to biofuel upon esterification. Microalgal-derived oil is a potential alternative to petroleum for
the production of fuel. In fact, these organisms possess higher productivity and lower land area
needed comparing with vegetable crops (Yusuf 2007).
The TAG biosynthesis in phototrophs occurs through different pathways: i) de novo
synthesis, via the so called Kennedy pathway; ii) remodelling and degradation of existing
membrane lipids (Breuer et al., 2013; Roleda et al., 2014; Dodson et al., 2014). The Kennedy
pathway involves the transfers of acyl groups to the glycerol-3-phoshate by endoplasmic
reticulum acyltransferases (Hu et al., 2008). This reaction leads to the formation of phosphatidic
acid, which is dephosphorylated by a phosphatase to form diacylglycerol. The diacylglycerol
represents the starting point for the biogenesis of membrane lipids (phosphatidylcholine,
monogalatosyldiacylglycerol, etc.) and TAGs. The biosynthesis of photosynthetic membrane
occurs in the chloroplast and the non-photosynthetic membrane synthesis occurs in the cytosol
and endoplasmic reticulum. The last reaction for the TAG biosynthesis is catalysed by the
diacylglycerol acyltransferase (DGAT), which represents the key rate-limiting enzyme of this
reaction (Niy et al., 2013; Yen et al., 2008) (fig. 1.11A). Alternatively, DAG can also produced by
the degradation of glycerophospholipids via phospholipases, i.e. recycling pre-existent
membrane lipids (fig. 1.11B). Finally, TAGs can be produced via and acetyl-coA independent
mechanism. This path involves the direct incorporation of fatty acids into phosphatidylcholine
(PC) and the conversion on TAG by the action of a phospholipid: diacylglycerol acyltransferase
(PDAT) (Bates et al., 2012) (fig. 1.11C). The accumulation of TAGs generally occurs in specific
structures called lipid bodies, which are visible on the microscope.
General introduction
28
ER
GPAT
LPAT
DGAT
LIPID BODY
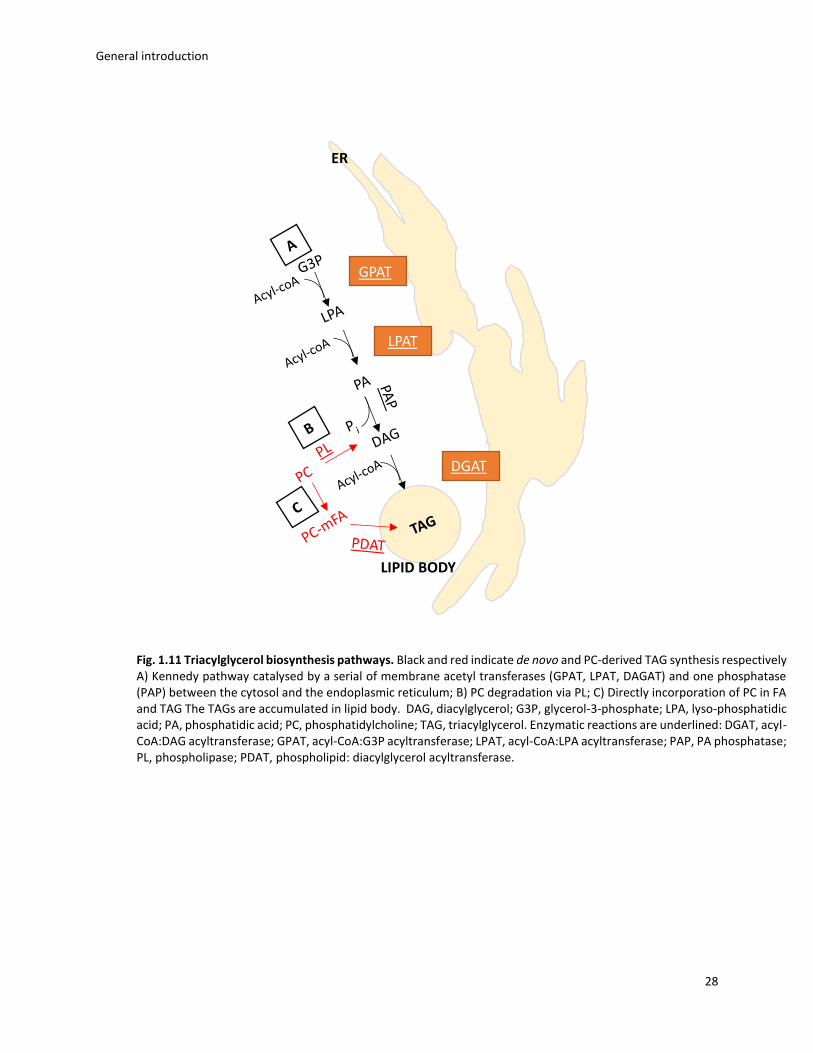
Fig. 1.11 Triacylglycerol biosynthesis pathways. Black and red indicate de novo and PC-derived TAG synthesis respectively A) Kennedy pathway catalysed by a serial of membrane acetyl transferases (GPAT, LPAT, DAGAT) and one phosphatase (PAP) between the cytosol and the endoplasmic reticulum; B) PC degradation via PL; C) Directly incorporation of PC in FA and TAG The TAGs are accumulated in lipid body. DAG, diacylglycerol; G3P, glycerol-3-phosphate; LPA, lyso-phosphatidic acid; PA, phosphatidic acid; PC, phosphatidylcholine; TAG, triacylglycerol. Enzymatic reactions are underlined: DGAT, acyl-CoA:DAG acyltransferase; GPAT, acyl-CoA:G3P acyltransferase; LPAT, acyl-CoA:LPA acyltransferase; PAP, PA phosphatase; PL, phospholipase; PDAT, phospholipid: diacylglycerol acyltransferase.

General introduction
29
1.4.3 Strategies for enhancing lipid production
Different strategies exist to enhance lipid productivity in microalgae. The most diffused one
is the exposure of target organisms to environmental or nutrient stress. However, in these
conditions the biomass productivity is very low.
One possibility to solve this problem is metabolic engineering. In fact, thanks to the
development of genomic and molecular tools, it is now possible to transform the genome of
some microalgae and direct their metabolism towards the lipid biosynthesis. Different
approaches are possible to achieve this goal such as: i) the overexpression of fatty acids or lipids
biosynthesis genes, ii) the inhibition of competitive pathways of lipid biosynthesis, i.e. lipid
catabolism and synthesis of storage carbohydrates. The characterization of these pathways is an
essential step to target the right genes for the metabolic engineering and to increase the lipids
productivity. For instance, the insertion of the Δ5-elongase gene from the green alga
Ostreococcus tauri in Phaeodactylum tricornutum enhanced the production of omega-3 fatty acid
(Hamilton et al., 2014). The metabolic engineering has been used also for increasing the
triacylglycerols in Phaeodactyulum. For example, the overexpression of glycerol-3-phosphate
dehydrogenase (involved in the Kennedy pathway, see paragraph 1.4.2) enhanced the neutral
fatty acid production (Yao et al., 2014). Finally, it has been possible to induce the TAG production
in Phaedactylum inhibiting the carbon storage pathway via TALENS technology (Daboussi et al.,
2014).
An alternative possibility is the addition of carbon sources that in some microalgae can
result in the increase of both lipids and biomass productivity, as discussed in paragraphs 1.3.1-
1.3.3. In this study the effect on lipid production of both nutrient starvation (i.e. phosphorus and
nitrogen) and carbonic organic and inorganic supplies have been investigated in P. tricornutum,
see chapter 4 and 3 respectively.
Cross-talk chloroplast-mitochondria in diatoms
30
Chapter 2
Cross-talk chloroplast-mitochondria in diatoms
2.1 Preface
This chapter describes the article “Energetic coupling between plastids and mitochondria
drives CO2 assimilation in diatoms” (Bailleul et al., 2015). The first paragraphs present the
electron flow pathways that produce extra ATP (2.2-2.3), the alternative oxidase pathway (AOX)
and the biophysical analysis of photosynthesis. The paragraph 2.4 contains the published paper
and finally, the paragraph 2.5 represents the conclusions and remarks of this work.
The aim of this study was to elucidate the molecular mechanisms of photosynthesis and
respiration in diatoms. This is a fundamental prerequisite to understand the basis of mixotrophy.
In photosynthesis, efficient carbon fixation requires a balanced input of energy (ATP) and
reducing power (NADPH), i.e. ATP/NADPH ratio (Allen 2002). As already discussed in paragraph
1.2.1, some photosynthetic organisms (mostly belonging to Viridiplantae), regulate the
NADP/ATP ratio by processes occurring within the chloroplast (e.g. CEF). However, our work
suggests that diatoms modulate this ratio by constitutive energetic interactions between
mitochondria and plastids. We demonstrated that the NADPH generated in the plastid is
exported to the mitochondria to generate additional ATP. The produced ATP is then imported
into the chloroplast, where it is used for carbon fixation. Consistent with this conclusion,
respiratory mutants of P. tricornutum show a reduced photosynthetic capacity and phototrophic
growth, demonstrating the crucial role of mitochondria for carbon fixation and growth in
diatoms. Electron micrograph suggests that these energetic exchanges are likely mediated by
physical contacts between plastidic and mitochondrial membranes. Overall, this work shows that
the interaction between these two organelles increases the photosynthesis efficiency, likely
explaining the ecological success of diatoms worldwide. As a corollary, this study also provides
an indication that the simultaneous use of carbon and light energy sources (i.e. mixotrophic
metabolism) should enhance biomass productivity in diatoms, making them more attractive and
Cross-talk chloroplast-mitochondria in diatoms
31
competitive for biotech application. This is the working hypothesis that I have tested during my
PhD.
2.2 Electron flow pathways that produce extra ATP
As described in the paragraph 1.2.1, oxygenic photosynthesis converts light into ATP and
NADPH, by linear electron flow (LEF). However, the ATP/NADPH ratio produced by this process is
not sufficient to support the energetic requirements of the carbon fixation. Different mechanisms
exist in photosynthetic organism to provide extra ATP. They include the cyclic electron flow (as
described in paragraph 1.2.1), the Mehler reaction, the plastoquinol terminal oxidase reaction
(PTOX) and mitochondrial respiration (Ort 2002; Asada 1999; Laisk et al., 2006; Zehr and Kudela
2009).
The Mehler reaction is the reduction of molecular oxygen by photosynthetic electrons to
produce superoxide (O2-) at PSI level, which is converted by the superoxide dismutase (SOD) into
H2O2 and O2. The H2O2 is then reconverted to H2O by the ascorbate peroxidase (APX) (Asada
1999). This reaction not only protect the cells from the ROS (i.e. H2O2 and O2-) but also produces
a monodehydroascorbate radical (MDA) (Miyake and Asada 1992), which can accept electrons
from PSI and is coupled to an ATP synthase (Forti and Ehrenheim 1993). At the PSII level, an
analogue reaction can occur, where molecular oxygen is reduced by the plastid terminal oxidase,
PTOX, enzyme (Kuntz 2004). This process generates a proton gradient that can be used for by the
ATP-synthase to produce ATP independently to the NADPH. In plant and green algae, the CEF
results to be the most important pathway to regulate the ATP/NADPH ratio, while in
cyanobacteria and the prasinophyte Ostreococcus, the PTOX pathway prevails. Instead, in
diatoms these pathways seems to be only poorly active (Wilhelm et al., 2006; Lepetit et al., 2011).
Besides chloroplast localized processes, oxidative respiration can also affect carbon fixation
(Curien et al., 2016). In plants, this effect is mostly indirect (Raghavendra and Padmasree, 2003),
and involves exchange of metabolites but does not affect photosynthesis under normal
physiological steady state conditions (Dutilleul et al., 2003; Cardol et al., 2010). In
Phaeodactylum, the presence of several transporters in both chloroplast and mitochondria, as
well as the physical connection of the two organelles, suggests an intense exchange, which could

Cross-talk chloroplast-mitochondria in diatoms
32
provide the mitochondrial ATP to the chloroplast. Moreover, the overexpression of the
alternative oxidase (AOX) (i.e. alternative pathway of cytochrome) in iron-depleted diatoms cells
suggests that mitochondrion plays an important role in dissipate excess reductants produced by
photosynthesis (Allen et al., 2008). ).
2.3 AOX pathway
The mitochondrial electron transport chain (ETC) contains 5 different complexes: i) the
NADH dehydrogenase (complex I), ii) the succinate dehydrogenase (complex II) iii) the
cytochrome bc1 (CYTC, complex III) iv) the cytochrome oxidase (COX, complex IV) and v) the ATP
synthase (complex V). The transfer of electrons within the ETC, coupled with proton
translocation, generates a proton motive force (PMF) that is used by complex V to form ATP. In
addition to these complexes, a cytochrome-independent alternative oxidase (AOX) is present in
the mitochondrial membrane, to transfer electrons from the ubiquinol to O2, producing H2O.
(Millar 2011). In principle, the AOX shunts electrons between the complex III and IV, therefore
reducing the proton motive force and, hence, the production of ATP. However, this enzyme is
also involved in the regulation of excess reductants derived from photosynthesis during
conditions of stress. In fact, it was reported that the AOX is overexpressed in iron-depleted cells
in Phaeodactylum (Allen et al., 2008).
The AOX activity can be measured by using an oxygen isotope discrimination technique. It
is able to discriminate the respiration rate in cytochrome oxidase and alternative oxidase based
on their differential use of oxygen isotopes (18O16O) (Guy et al., 1989). In particular, the two
enzymes possess a different mechanism for breaking the oxygen-oxygen bond and, hence, they
produce different products that can be discriminate by mass spectroscopy analysis. Alternately,
the generation of mutant with reduced AOX capacity can be used to examine the role of this
complex in photosynthesis and growth (Florez-Carbo et al., 2011; Yoshida et al., 2011; Gandin et
al., 2012). Finally, the effect of AOX activity can be studied by using the salicylhydroxamic acid
(SHAM), a competitive inhibitor of ubiquinol and therefore of AOX.
Cross-talk chloroplast-mitochondria in diatoms
33
In this study, the activity of AOX was evaluated by measuring the effect of different
respiratory inhibitors, such as antimycin A (i.e. inhibitor of Complex III) and SHAM (i.e. inhibitor
of AOX) on wt and Knock-Down AOX mutants.
2.4 Biophysical analysis of photosynthesis
The development of non-invasive biophysical techniques have led to relevant progresses in
photosynthesis research. The main techniques used in this field are: i) polarographic approach
for oxygen detection (Joliot 1956, 1968) ii) Pulse Amplitude Modulated (PAM) fluorescence (Joliot
et al., 1980, 2004), iii) time resolved spectroscopy and in particular, measurements of the
electrochromic shift (ECS) in vivo (Bailleul et al., 2010; Klughammer et al., 2013).
The polarographic approach is used to monitor the consumption/ production of O2 in vivo
experiment. This instrument is composed of a semi-hermetic chamber where a golden or
platinum cathode and an Ag/AgCl anode are separated from the sample by O2-permeable
membrane. At the cathode, the O2 is reduced to water. At the anode, the oxidation generates a
potential difference between the two electrodes that can be measured. Constant stirring of the
sample allows to equilibrate the oxygen consumed at the cathode so that the change on O2
concentration is restricted to the sample. The potential difference is proportional to the oxygen
tension in the sample after calibration with air-saturated solution.
The PAM fluorescence allows to monitor photosynthetic activity in algae and plants
through the evaluation of photosynthetic parameters such as Fv/Fm, electron transfer rate (ETR)
and non-photochemical quenching (NPQ). Furthermore, it allows to determine the physiological
status of photosynthetic organism, CO2 assimilation in vivo, etc.
The instrument is based on the use of three different types of light: i) measuring beam ii)
saturation pulse and iii) actinic light. The first is a low intensity light that is not able to stimulate
photosynthesis. The saturating light is a high-intensity light that saturates all reaction centres.
Finally, the actinic light is a light of variable intensity that drives photosynthetic activity.
In the darkness, the plastoquinone molecules Qa are maximally oxidized and the PSII
reaction centres are “opened” (i.e. they are able to utilize the light energy for photosynthesis).
When dark-adapted photosynthetic organisms are exposed to measuring beam light, a minimal
Cross-talk chloroplast-mitochondria in diatoms
34
level of fluorescence is observed, F0. The further exposition to short pulse of saturating light leads
to the reduction of Qa (i.e. reaction centres are “closed”) and the maximum fluorescence is
reached, Fm.
The difference between Fm and F0 is defined as fluorescence Fv. The ratio of Fv / Fm
determines the maximum efficiency of PSII photochemistry (if all the reaction centres were
opened) and gives an estimation of the physiological status of the studied organism. Different
photosynthetic organisms display specific Fv / Fm values. For instance, non-stressed diatoms
possess a Fv / Fm of about 0.6 but this value can drop dramatically under stress conditions. Thus,
Fv / Fm can be used as a non-invasive probe to monitor stress response in photosynthetic
organisms. Others photosynthetic parameters can be measured using different exposure times
and intensities of the actinic light. ETR is calculated as (Fm'-F)/Fm' x PAR x 0.5 where Fm' and F
represent the maximum and the minimum fluorescence upon saturating light during illumination
with actinic light; PAR (photosynthetically active radiation) is the intensity of actinic light used to
stimulated the photosynthesis and the term 0.5 represents the 50% of probability that one
electron goes to the PSII (instead to the PSI). (Fm'-F)/Fm' is similar to the Fv / Fm value but in this
case is an indicator of the real amount of energy that can be used by PS II during the
photosynthesis.
The non-photochemical quenching, NPQ is calculated as (Fm-Fm’)/ Fm’. This method allows
to estimate the amount of energy that is dissipated by heat in presence of excess of light by
subtracting the amount of energy that is used for photochemistry.
The measurement of Electro Chromic Shift (ECS) can provide a wide range of information
in photosynthetic study (reviewed in Bailleul et al., 2010).
During the photosynthesis, the movement of electrons and protons within the thylakoid
membrane generates a PMF that is constituted by a gradient of proton concentration (ΔpH) and
of electric potential (ΔΨ). The generation of the PMF allows to activate the ATP synthase and to
produce ATP. The formation of ΔΨ leads to the shift on pigments absorption, i.e.
electrochromism. The analysis of this phenomenon is the basis of ECS measurement. The ECS
signal can provide information on the function of photosynthetic complexes, and on alternative
electron flow process. For instance, the analysis of ECS signal can be used to distinguish the
Cross-talk chloroplast-mitochondria in diatoms
35
contribution of CEF and LEF (measured in light) or, of oxidative respiration (measured in dark) on
the generation of ΔΨ and hence on ATP production. The analysis of ECS in dark can use to
elucidate the mechanism of respiration and photosynthesis interactions.
Cross-talk chloroplast-mitochondria in diatoms
36
2.5 Energetic coupling between plastids and mitochondria
drives CO2 assimilation in diatoms Benjamin Bailleul1,2,3,4, Nicolas Berne1, Omer Murik4, Dimitris Petroutsos5, Judit Prihoda4,
Atsuko Tanaka4, Valeria Villanova6, Richard Bligny5, Serena Flori5, Denis Falconet5, Anja Krieger-
Liszkay7, Stefano Santabarbara8, Fabrice Rappaport3, Pierre Joliot3, Leila Tirichine4, Paul G.
Falkowski2, Pierre Cardol1, Chris Bowler4 & Giovanni Finazzi5
1Genetique et Physiologie des Microalgues, Département des Sciences de la vie and PhytoSYSTEMS, Université de
Liège, B-4000 Liège, Belgium.
2Environmental Biophysics and Molecular Ecology Program, Departments of Marine and Coastal Sciences and of
Earth and Planetary Sciences, Rutgers University, New Brunswick, New Jersey 08901, USA.
3Institut de Biologie Physico-Chimique (IBPC), UMR 7141, Centre National de la Recherche Scientifique (CNRS),
Université Pierre et Marie Curie, 13 Rue Pierre et Marie Curie, F-75005 Paris, France.
4Ecology and Evolutionary Biology Section, Institut de Biologie de l’Ecole Normale Superieure (IBENS), Centre
National de la Recherche Scientifique (CNRS), UMR 8197, INSERM U1024, 46 Rue d’Ulm, F-75005 Paris, France.
5Laboratoire de Physiologie Cellulaire et Végétale, UMR 5168, Centre National de la Recherche Scientifique (CNRS),
Commissariat a` l’Energie Atomique et aux Energies Alternatives (CEA), Université Grenoble Alpes, Institut National
Recherche Agronomique (INRA), Institut de Recherche en Sciences et Technologies pour le Vivant (iRTSV), CEA
Grenoble, F-38054 Grenoble cedex 9, France.
6Fermentalg SA, F-33500 Libourne, France.
7Institute for Integrative Biology of the Cell (I2BC), Commissariat a` l’Energie Atomique et aux Energies Alternatives
(CEA), Centre National de la Recherche Scientifique (CNRS), Universite´ Paris-Sud, Institut de Biologie et de
Technologie de Saclay, F-91191 Gif-sur-Yvette cedex, France.
8Istituto di Biofisica, Consiglio Nazionale delle Ricerche, Via Celoria 26, I-20133 Milan, Italy.
Cross-talk chloroplast-mitochondria in diatoms
37
ABSTRACT
Diatoms are one of the most ecologically successful classes of photosynthetic marine
eukaryotes in the contemporary oceans. Over the past 30 million years, they have helped to
moderate Earth’s climate by absorbing carbon dioxide from the atmosphere, sequestering it via
the biological carbon pump and ultimately burying organic carbon in the lithosphere1. The
proportion of planetary primary production by diatoms in the modern oceans is roughly
equivalent to that of terrestrial rainforests2. In photosynthesis, the efficient conversion of carbon
dioxide into organic matter requires a tight control of the ATP/NADPH ratio which, in other
photosynthetic organisms, relies principally on a range of plastid-localized ATP generating
processes3–6. Here we show that diatoms regulate ATP/NADPH through extensive energetic
exchanges between plastids and mitochondria. This interaction comprises the re-routing of
reducing power generated in the plastid towards mitochondria and the import of mitochondrial
ATP into the plastid, and is mandatory for optimised carbon fixation and growth. We propose
that the process may have contributed to the ecological success of diatoms in the ocean.
In oxygenic photosynthesis, light drives a linear electron flow from water to NADPH by the
two photosystems (PS I and PS II), and the generation of an electrochemical proton gradient (or
proton motive force, PMF) across the thylakoid membranes, which fuels ATP synthesis by an ATP
synthase. Although the ratio of ATP/NADPH generated by linear electron flow is not entirely
resolved7,8, it is considered to be insufficient to fuel CO2 import into the plastid and assimilation
by the Calvin cycle8,9. Therefore, to make up the shortfall, additional ATP must be produced by
alternative pathways that do not generate NADPH. In Viridiplantae (including green algae and
higher plants) these alternative electron pathways have been found in the chloroplast and mostly
comprise cyclic electron flow (CEF) around PS I (ref. 3) and/or the water-to-water cycles10; that
is, flows of electrons resulting from the oxidation of water at PS II that are re-routed to an oxidase
activity. This last group of oxidases include the Mehler reaction at the PS I acceptor side4,11,12, the
activity of the plastoquinone terminal oxidase downstream of PS II (ref. 5) and the oxygenase
activity of ribulose 1,5-bisphosphate carboxylase–oxygenase (Rubisco) (photorespiration6).
Although genes encoding most components for these processes appear to be present in
diatoms13–15, it is currently unknown what mechanisms are used to balance the ATP/NADPH ratio.

Cross-talk chloroplast-mitochondria in diatoms
38
We therefore investigated this question using the model species Phaeodactylum tricornutum.
The PMF generated across thylakoid membranes comprises an electric field (ΔΨ) and a proton
gradient (ΔpH). The ΔΨ can be probed in vivo by measuring the electrochromic shift (ECS), that
is the Stark effect, a modification of the absorption spectrum of specific pigments caused by
changes in the transmembrane electric field in the plastid16. An ECS signal is present in P.
tricornutum (Fig. 2.1a), and an analysis of the ECS signal relaxation after light exposure (Extended
Data Fig. 2.1) reveals that it comprises two components displaying different spectra (Fig. 2.1a).
One follows a linear dependence on the amplitude of ΔΨ whereas the other follows a quadratic
relationship (Fig. 2.1b). The existence of a ‘quadratic ECS’ is predicted by theory16 but has only
been observed so far in mutants of green algae with altered pigment composition17. The peculiar
existence of two different ECS probes in wild-type P. tricornutum cells allows an absolute
quantification of the electric field, providing a valuable tool to analyse the PMF in a living cell (see
Methods).
We plotted the amplitude of the quadratic versus linear ECS signals during the relaxation
of a light-induced PMF and obtained a parabolic function (Fig. 2.1c, d and Extended Data Fig. 2.2).
However, the ECS signals did not reach the minimum of the parabola in the dark, but rather
remained positive. This indicates that a PMF is maintained across the thylakoid membrane of
diatoms in the dark (ΔΨ d, Fig. 2.1c). The field ΔΨ d can not only be dissipated by addition of an
uncoupler (carbonyl cyanide-4-(trifluoromethoxy)phenylhydrazone (FCCP)), but also by blocking
mitochondrial electron transport by anaerobiosis or addition of antimycin A (AA) plus
salicylhydroxamic acid (SHAM). The combination of these two inhibitors blocks both the cyanide-
sensitive (complex III) and the cyanide-insensitive (alternative oxidase, AOX) respiratory
pathways (Fig. 2.1d). These results suggest that the residual PMF in the dark is generated in
plastids by the chloroplast ATPase by hydrolysis of ATP derived from mitochondria (Fig. 2.1e)18.
Furthermore, the extent of ΔΨ d observed in P. tricornutum is larger than that previously reported
in green algae19, suggesting that the ATP exchange could be more efficient in diatoms.

Cross-talk chloroplast-mitochondria in diatoms
39
Fig. 2.1 ECS measures the PMF in P. tricornutum. a, Deconvolution of the experimental ECS spectrum (black) into linear (blue) and quadratic (red) spectral components (see Methods); r.u., relative units. b, Schematic representationofpolar(blue)andpolarizable(red) pigments, and their associated linear (blue) and quadratic (red) ECS responses to the electric field. Black: thylakoid lipid bilayer. Green ‘1’ and ‘2’ symbols: ΔΨ. Red arrows: pigment polarization induced by ΔΨ. c, d, Relationship between quadratic and linear ECS in control (c)and in cells treated with uncoupler (8mM FCCP, black squares), anaerobiosis (red circles) and respiratory inhibitors (AA, 5mM, and SHAM, 1 mM; blue circles) (d). Green arrow: extent of the dark electric field (ΔΨd). Representative of five (c) and three (d)
independent biological samples. e, Schematic representation of the energetic interactions between plastid (left) and mitochondria (right) in the dark. Red arrows: respiratory electron flows. Green dashed line: putative ATP/ADP exchange pathway between the organelles. ATPase, ATPase/ synthase; b6f, cytochrome b6f; I/III/IV, respiratory complexes I, III and IV.
Cross-talk chloroplast-mitochondria in diatoms
40
To evaluate what mechanism regulates ATP/NADPH in the light in P. tricornutum, we first
used the linear ECS to probe the CEF capacity (see Methods). CEF turned out to represent only a
very low fraction of the maximum electron flow capacity (Fig. 2.2a and Extended Data Fig. 2.3a,
c) and was insensitive to changes in the photosynthetic flux (Fig. 2.2a). Thus, it appears very
unlikely that CEF could regulate ATP/ NADPH fluxes. Next, we explored the water-to-water cycle
using membrane-inlet mass spectrometry on cells incubated with 18O2. O2 consumption
increased with light, being ~ 2.5-fold higher at saturating light intensities than in the dark
(Extended Data Fig. 2.3b, d). We also found that the light-stimulated O2 consumption was blocked
by 3-(3,4-dichlorophenyl)-1,1-dimethyl-urea (DCMU), which inhibits O2 production by PS II
(Extended Data Fig. 2.3b, d), indicating that this process is fed by electrons generated by PS II. O2
consumption increased linearly with O2 production, in agreement with earlier findings in another
diatom species 20, indicating that a constant proportion (~10%) of the electron flow from
photosynthesis is re-routed to an O2-consuming pathway, regardless of light intensity (Fig. 2.2b).
To test whether the O2-consuming pathway occurs in the plastid or relies on mitochondrial
activity, we used increasing concentrations of inhibitors to titrate respiration and tested possible
consequences on photosynthesis. We reasoned that if respiration consumes reducing
equivalents generated in the plastid to generate additional ATP, any mitochondrial dysfunction
should negatively impact photosynthesis.
We found that this was indeed the case, as photosynthetic electron transfer rate (ETR PS
II) linearly followed changes in respiration (Fig. 2.2c and Extended Data Fig. 2.4). We conclude
that a partial re-routing of the photosynthetic flow towards mitochondrial respiration rather than
CEF optimises photosynthesis in diatoms, providing commensurate ATP per NADPH at all
irradiances (Fig. 2.2d).
Cross-talk chloroplast-mitochondria in diatoms
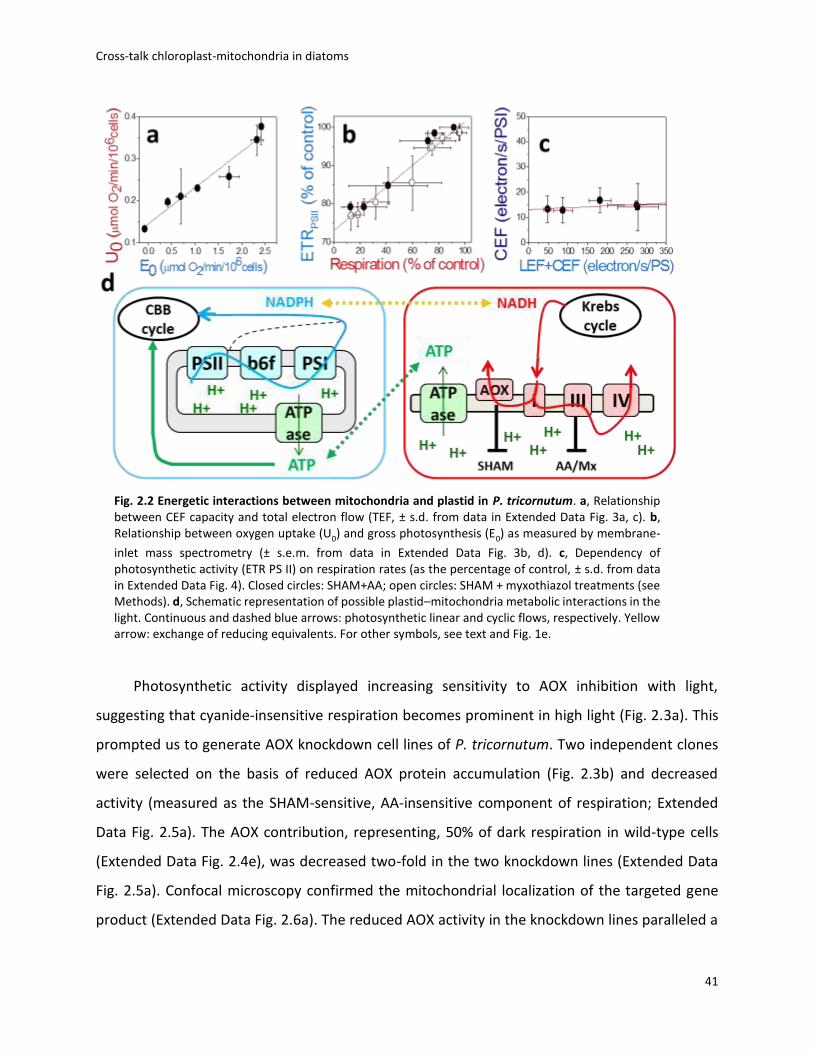
41
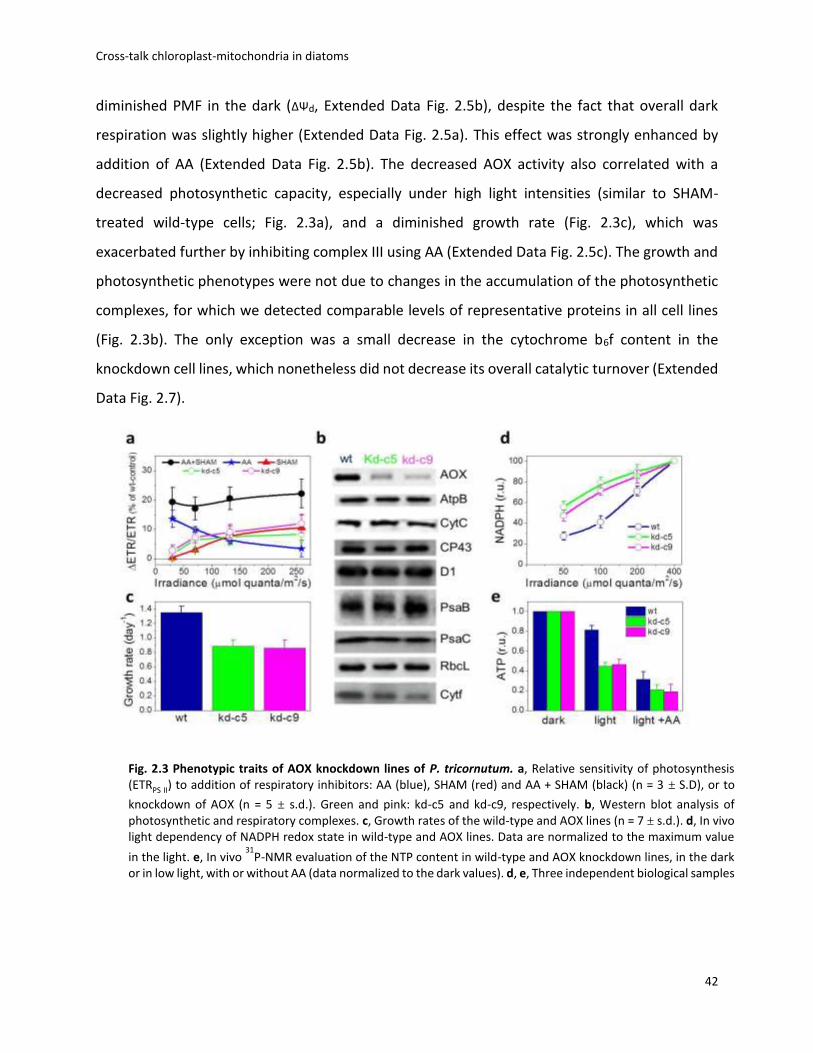
Photosynthetic activity displayed increasing sensitivity to AOX inhibition with light,
suggesting that cyanide-insensitive respiration becomes prominent in high light (Fig. 2.3a). This
prompted us to generate AOX knockdown cell lines of P. tricornutum. Two independent clones
were selected on the basis of reduced AOX protein accumulation (Fig. 2.3b) and decreased
activity (measured as the SHAM-sensitive, AA-insensitive component of respiration; Extended
Data Fig. 2.5a). The AOX contribution, representing, 50% of dark respiration in wild-type cells
(Extended Data Fig. 2.4e), was decreased two-fold in the two knockdown lines (Extended Data
Fig. 2.5a). Confocal microscopy confirmed the mitochondrial localization of the targeted gene
product (Extended Data Fig. 2.6a). The reduced AOX activity in the knockdown lines paralleled a
Fig. 2.2 Energetic interactions between mitochondria and plastid in P. tricornutum. a, Relationship between CEF capacity and total electron flow (TEF, ± s.d. from data in Extended Data Fig. 3a, c). b, Relationship between oxygen uptake (U0) and gross photosynthesis (E0) as measured by membrane-
inlet mass spectrometry (± s.e.m. from data in Extended Data Fig. 3b, d). c, Dependency of photosynthetic activity (ETR PS II) on respiration rates (as the percentage of control, ± s.d. from data in Extended Data Fig. 4). Closed circles: SHAM+AA; open circles: SHAM + myxothiazol treatments (see Methods). d, Schematic representation of possible plastid–mitochondria metabolic interactions in the light. Continuous and dashed blue arrows: photosynthetic linear and cyclic flows, respectively. Yellow arrow: exchange of reducing equivalents. For other symbols, see text and Fig. 1e.
Cross-talk chloroplast-mitochondria in diatoms
42
diminished PMF in the dark (ΔΨd, Extended Data Fig. 2.5b), despite the fact that overall dark
respiration was slightly higher (Extended Data Fig. 2.5a). This effect was strongly enhanced by
addition of AA (Extended Data Fig. 2.5b). The decreased AOX activity also correlated with a
decreased photosynthetic capacity, especially under high light intensities (similar to SHAM-
treated wild-type cells; Fig. 2.3a), and a diminished growth rate (Fig. 2.3c), which was
exacerbated further by inhibiting complex III using AA (Extended Data Fig. 2.5c). The growth and
photosynthetic phenotypes were not due to changes in the accumulation of the photosynthetic
complexes, for which we detected comparable levels of representative proteins in all cell lines
(Fig. 2.3b). The only exception was a small decrease in the cytochrome b6f content in the
knockdown cell lines, which nonetheless did not decrease its overall catalytic turnover (Extended
Data Fig. 2.7).
Fig. 2.3 Phenotypic traits of AOX knockdown lines of P. tricornutum. a, Relative sensitivity of photosynthesis (ETRPS II) to addition of respiratory inhibitors: AA (blue), SHAM (red) and AA + SHAM (black) (n = 3 ± S.D), or to
knockdown of AOX (n = 5 ± s.d.). Green and pink: kd-c5 and kd-c9, respectively. b, Western blot analysis of photosynthetic and respiratory complexes. c, Growth rates of the wild-type and AOX lines (n = 7 ± s.d.). d, In vivo light dependency of NADPH redox state in wild-type and AOX lines. Data are normalized to the maximum value
in the light. e, In vivo 31
P-NMR evaluation of the NTP content in wild-type and AOX knockdown lines, in the dark or in low light, with or without AA (data normalized to the dark values). d, e, Three independent biological samples
Cross-talk chloroplast-mitochondria in diatoms
43
Our working model presented in Fig. 2.2d predicts that disruption of the plastid–
mitochondria interaction in the knockdown cell lines should lead to the accumulation of NADPH
and a decreased cellular content of ATP in the light. Indeed, in vivo assessments of the pools of
NADPH and ATP in wild-type and knockdown cell lines confirmed an increase in the
NADPH/NADP+ ratio with light intensity (Fig. 2.3d and Extended Data Fig. 2.8a), accompanied by
a net decrease of cellular ATP levels (Fig. 2.3e and Extended Data Fig. 2.8b), both of which were
more drastic in AOX knockdown cells than wild-type cells. These observations confirm that
mitochondrial respiration is directly involved in the adjustment of the ATP to NADPH ratio in the
plastid.
We then examined the generality of our findings in other diatom species. The similar ECS
features (linear and quadratic components) in Thalassiosira pseudonana, Thalassiosira
weissflogii, Fragilaria pinnata and Ditylum brightwellii (Fig. 2.4a) were used to confirm the
presence of a PMF in the plastids in the dark at the expense of hydrolysis of ATP supplied by the
mitochondria in all cases (Fig. 2.4b). Moreover, a negligible contribution of CEF (Extended Data
Fig. 2.9) and a significant involvement of mitochondrial respiration to photosynthesis (Extended
Data Fig. 2.10) were found in all these species. The involvement of mitochondrial respiration in
the optimisation of photosynthesis therefore appears to be a general and conserved feature in
diatoms.
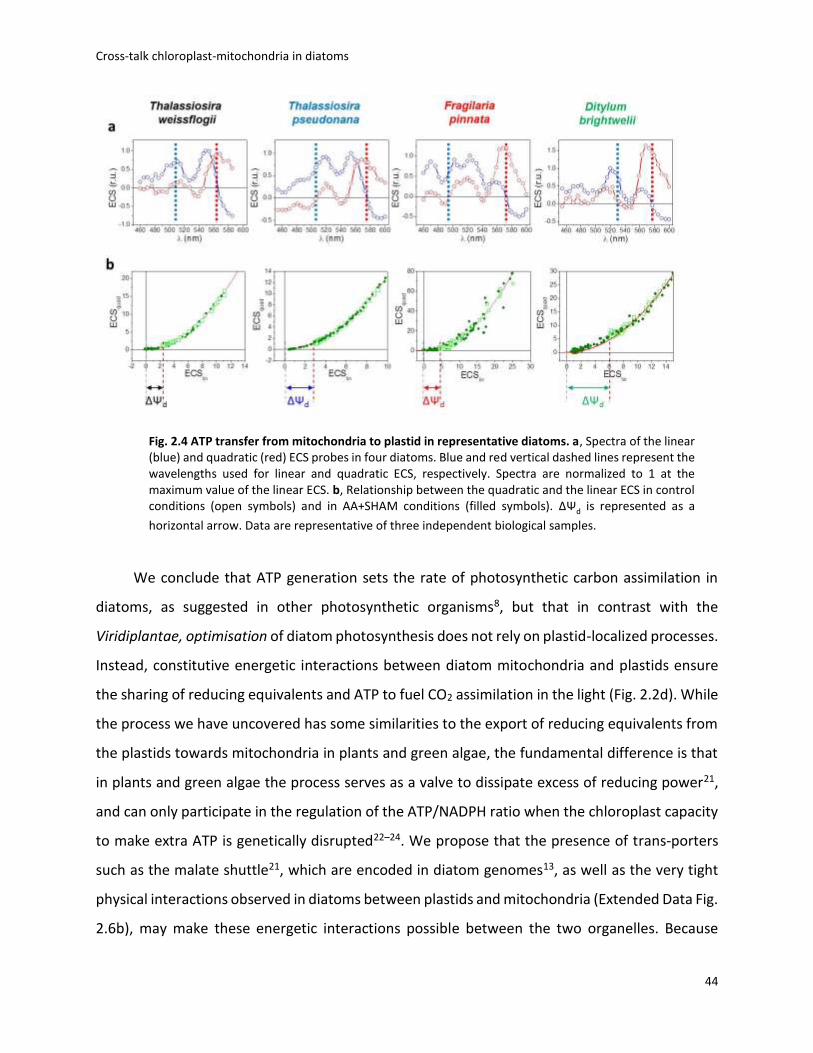
Cross-talk chloroplast-mitochondria in diatoms
44
We conclude that ATP generation sets the rate of photosynthetic carbon assimilation in
diatoms, as suggested in other photosynthetic organisms8, but that in contrast with the
Viridiplantae, optimisation of diatom photosynthesis does not rely on plastid-localized processes.
Instead, constitutive energetic interactions between diatom mitochondria and plastids ensure
the sharing of reducing equivalents and ATP to fuel CO2 assimilation in the light (Fig. 2.2d). While
the process we have uncovered has some similarities to the export of reducing equivalents from
the plastids towards mitochondria in plants and green algae, the fundamental difference is that
in plants and green algae the process serves as a valve to dissipate excess of reducing power21,
and can only participate in the regulation of the ATP/NADPH ratio when the chloroplast capacity
to make extra ATP is genetically disrupted22–24. We propose that the presence of trans-porters
such as the malate shuttle21, which are encoded in diatom genomes13, as well as the very tight
physical interactions observed in diatoms between plastids and mitochondria (Extended Data Fig.
2.6b), may make these energetic interactions possible between the two organelles. Because
Fig. 2.4 ATP transfer from mitochondria to plastid in representative diatoms. a, Spectra of the linear (blue) and quadratic (red) ECS probes in four diatoms. Blue and red vertical dashed lines represent the wavelengths used for linear and quadratic ECS, respectively. Spectra are normalized to 1 at the maximum value of the linear ECS. b, Relationship between the quadratic and the linear ECS in control conditions (open symbols) and in AA+SHAM conditions (filled symbols). ΔΨd is represented as a
horizontal arrow. Data are representative of three independent biological samples.
Cross-talk chloroplast-mitochondria in diatoms
45
diatom plastids are surrounded by four membranes rather than two as in Viridiplantae13, it will
be of interest to elucidate the configuration of such transporters, as well as the ration-ale for the
diminished CEF efficiency in diatoms. More generally, the coupling of respiratory and
photosynthetic activities in diatoms should be explored in the context of resource utilization in
the ocean and as a means to boost the production of useful metabolites for biotechnology.
METHODS
No statistical methods were used to predetermine sample size. The experiments were not
randomized. The investigators were not blinded to allocation during experiments and outcome
assessment.
Growth conditions. Wild-type and AOX transformant lines of P. tricornutum Pt1 8.6 (CCMP 2561)
were grown in artificial sea water (ASW25). T. pseudonana (CCMP 1335), T. weissflogii (CCMP
1336), F. pinnata (CCAP 1029/2) and D. brightwellii (CCMP 359) were grown in F/2 medium,
supplemented with silicate26. All strains were grown at 19 ±1°C in semi-continuous batch culture
(with moderate shaking for P. tricornutum, T. pseudonana and T. weissflogii). The photoperiod
was 12 h light/12 h dark, and light irradiance was 70 µmol quanta m-2 s-1. Cell concentration was
determined daily with a Z2 Coulter Counter analyser (Beckman Coulter) to ensure all the
experiments were performed with cells in exponential phase. For biophysical measurements,
cells were concentrated by centrifugation and resuspended in their growth med-ium
(supplemented with 10% w/v Ficoll to prevent cell sedimentation) and kept in the dark at least
30 min before measurements.
Inhibitors. DCMU, 2,5-dibromo-3-methyl-6-isopropyl-p-benzoquinone (DBMIB), FCCP, AA,
myxothiazol and SHAM (Sigma-Aldrich) were dissolved in ethanol, whereas hydroxylamine,
glucose, glucose oxidase and catalase (Sigma-Aldrich) were dissolved in deionized water. FCCP
was used at a very low concentration (8 µM, Fig. 2.1d) to allow the disruption of the dark PMF
without preventing the light-induced generation of PMF needed to quantify ΔΨ d. AA and
myxothiazol were used at 5 µM, unless otherwise stated. DCMU was used at a concentration of
15 µM. In every measurement involving hydroxylamine or SHAM, the lowest inhibitor
Cross-talk chloroplast-mitochondria in diatoms
46
concentration to induce a full inhibition of PS II activity or maximum inhibition of respiration,
respectively, was used. The range of concentrations used was 30–100 µM and 0.5–1 mM for
hydroxylamine and SHAM, respectively. Anaerobic conditions were obtained through incubation
with catalase (1,000 U ml-1), glucose (10 mM) and glucose oxidase (20,000 U ml-1). AA has been
previously described as an inhibitor of cyclic electron flow, affecting the NDH-independent
pathway27. This potential effect was ruled out in diatoms because no change in cyclic electron
flow was noticed upon addition of AA. Consistent with the fact that genes encoding some
members of the NDH complex are absent in diatom genomes, this indicates that AA does not
affect the NDH-independent CEF pathway in diatoms. AA and myxothiazol were preferred to
potassium cyanide to block the cyanide sensitive pathway of respiration because potassium
cyanide also affects Rubisco activity28, ascorbate peroxidase29 and Cu/ Zn superoxide
dismutase30.
Deconvolution of linear and quadratic ECS components. To deconvolute the linear and quadratic
contributions to the ECS signals, cells were left for an hour in the cuvette to reach complete
anaerobiosis. In these conditions, the ATP synthase activity is slowed down31, and long-living ECS
signals are no longer contaminated with other light-induced absorption changes (principally
associated with c-type cytochromes). Light stimulation of cells was achieved with a series of six
laser single-turnover (duration ,7 ns) saturating flashes, provided by a laser dye (LDS 698)
pumped by a frequency doubled Nd-YAG laser (Quantel). We considered that the relaxation of
the electric field generated by the light stimulus is described by the exponential function ΔΨ =
ΔΨ 0 exp(2t/τ), where t is time, ΔΨ 0 is the initial electric field generated by the light, and τ is the
electric-field decay lifetime. The linear and quadratic components of the ECS are theoretically
proportional to ΔΨ and ΔΨ2, respectively. Therefore, the ΔI/I spectro-temporal matrices (from
460 to 600 nm) can be described by a sum of two exponentials: y(λ,τ) = A(λ) exp (-t/τ)+ B(λ)
exp ((-2t= τ))+C(λ). The kinetics of ECS relaxation were fitted by a global routine, which considers
the lifetime t as a global (wavelength-independent) variable, and the amplitudes of linear and
quadratic components (A and B, respectively) as local (wavelength-dependent) variables. A non-
decaying component (C) was also included in the fit to account for a small fraction of residual
Cross-talk chloroplast-mitochondria in diatoms
47
signal at long delay times. The plot of the A and B amplitudes as a function of the wavelength
provides the decay associated spectra of the linear and quadratic contributions to the ECS signal,
respectively, which are shown in Fig. 2.1a. The fit was performed with homemade software,
which used the MINUIT package, developed and distributed by CERN (Geneva, Switzerland) and
implemented in FORTRAN77. It minimizes the reduced sum of squared residues between the
model function and the experimental data, employing a two-step protocol involving an initial
search that utilizes the Simplex method (Nelder–Mead algorithm) and a refined search using the
Levenberg–Marquardt algorithm as described in ref. 32. The quality of the fit description was
judged on the basis of reduced sum of squared residues statistics, visual inspection of the fit
residuals, residuals autocorrelation and stability of the solutions upon random perturbation of
the best-fit. The deconvolution was performed on two independent biological samples, giving
similar results.
Measurements of c-type cytochromes and linear and quadratic ECS. Absorption difference
signals were measured at different wavelengths with a Joliot-type spectrophotometer (JTS-10,
Biologic), equipped with a white probing LED and the appropriate interference filters (3–8 nm
bandwidth). For ΔΨd measurements, the PMF was increased using an ~10 ms pulse of saturating
(4,500 µmol quanta m-2 s-1) red light (see Extended Data Fig. 2.3 for representative ECS kinetics).
For P. tricornutum, ECS signals were evaluated using three wavelengths, to eliminate contribution
from c-type cytochromes (see Extended Data Fig. 2.2). The latter was calculated as cyt c = [554] -
0.4[520] - 0.4[566], where [554], [520] and [566] are the absorption difference signals at 554 nm,
520 nm and 566 nm, respectively. The very similar relaxation of c-type cytochromes in aerobic
and anaerobic conditions, despite very different ECS relaxations (Extended Data Fig. 2.2b),
demonstrates the validity of the cyt c deconvolution procedure. Then, ecslin and ecsquad (ECS
signals before correction for ΔΨd) were estimated from the following relationships: ecslin = [520]
- 0.25 cyt c and ecsquad = [566] + 0.15 cyt c. For the other diatoms, appropriate wavelengths were
chosen for calculating ecslin and ecsquad (red and blue lines in Fig. 2.4) to minimize the cytochrome
c contributions. The relationships between ecsquad and ecslin were fitted with the parabolic
equation ecsquad + αΔΨd2 = α (ecslin + ΔΨd)2, where ΔΨd is the electrical component of the PMF in
the dark and α is constant for all the conditions in a diatom species (see Extended Data Fig. 2.2c).
Cross-talk chloroplast-mitochondria in diatoms
48
The ecslin and ecsquad values represent ECS changes relative to dark values. Therefore, we
corrected them for the dark electric field. This leads to ECSlin = ecslin + ΔΨd, and ECSquad = ecsquad
+ αΔΨd2, namely absolute values of the ECS signals. This simply corresponds to a shift of the x-
and y-axes to allow the minimum of the parabola to coincide with the origin of the axes (see
Extended Data Fig. 2.2d), and gives ECSquad = αECSlin2. This leads to the evaluation of ΔΨd as the
minimal ECSlin value of the experimental data. In Fig. 2.1c, d, and Extended Data Fig. 2.2c, d, ECS
data were normalized to the ecslin increase upon a saturating laser flash (that is, one charge
separation per photosystem, see ref. 33). This allows the estimation of ΔΨd in P. tricornutum as
approximately five charge separations by PS, namely, 100 mV (ref. 12) (Fig. 2.1c). The presence
of linear and quadratic ECS components allows measurement of the absolute value of ΔΨ in the
dark (ΔΨd). Indeed the amplitude of the linear ECS response (ecslin) observed upon a light
stimulus increasing ΔΨ is constant, namely independent of the value of the field pre-existing the
illumination (ΔΨd). Conversely, the amplitude of the quadratic ECS response (ecsquad) is a function
of the value of ΔΨd. Therefore, plotting the amplitude of the ecsquad versus ecslin allows
quantification of the absolute value of the electric field in the dark (ΔΨd).
Cyt b6f turnover was measured through the slow phase (phase b31) of the linear ECS, which
reflects b6f-catalysed charge transfer across the membranes, and through the reduction rate of
the c-type cytochromes (c6/f), using the three-wave-lengths deconvolution procedure described
above. Measurements were performed after a saturating laser flash.
Measurements of photosynthetic flows. For calculation of the TEF (the sum of linear and cyclic
electron flows) and CEF capacities, we measured the photochemical rates in the absence and
presence, respectively, of DCMU. In brief, under steady-state illumination conditions, the ECS
signal results from concomitant transmembrane potential generation by PS II, the cytochrome
b6f complex and PS I, and from transmembrane potential dissipation by the plastid ATP synthase.
When light is switched off, PS activities stop immediately, while ATP synthase and cytochrome
b6f complex activities remain (transiently) unchanged. Therefore, the difference between the
slopes of the linear ECS signal (ECSlin) measured in the light and after the light is switched off (SD
- SL) is proportional to the rate of PS I and PS II photochemistry (that is, to the rate of ‘total’
electron flow, Extended Data Fig. 2.3a). Because the linear ECS has been normalized to the

Cross-talk chloroplast-mitochondria in diatoms
49
amplitude of the linear ECS signal induced by a saturating laser flash34 (see above), the difference
of slopes evaluates the number of charge separations per photosystem and per second. The rate
of CEF can be evaluated using the same approach under conditions where PS II activity is inhibited
by DCMU, and dividing this slope by the linear ECS signal induced by a saturating laser flash in
the presence of PS II inhibitors (one charge separation per PS I (ref. 34)). This was done using
saturating concentrations of DCMU, which block PS II oxidation, and of hydroxylamine, to avoid
charge recombination within PS II.
Fluorescence-based measurements. Fluorescence-based photosynthetic parameters were
measured with a fluorescence imaging setup described in ref. 35. Photosynthetic electron
transfer rate ETR PS II and NPQ were calculated, respectively, as I(Fm’ - F)/Fm’ and (Fm - Fm’)/Fm’,
where F and Fm’ are the steady-state and maximum fluorescence intensities in light-acclimated
cells (respectively), Fm is the maximal fluorescence intensity in dark-adapted cells, and I is the
light irradiance in µmol quanta m-2 s-1 (refs 36, 37). In Fig. 2.2c and Extended Data Fig. 2.4a, d, the
light irradiance is 30 µmol quanta m-2 s -1. The light saturation curves of ETR PS II were fitted with
the exponential rise function.
P = Pmax(1 - exp(E/Ek)), where Pmax is the maximal photosynthetic electron transport rate and Ek
is the optimal light. ΔETR/ETR (Fig. 2.3a) was calculated as (ETRref - ETR) x 100/ETRref, the
reference being the value measured in wild-type cells in untreated conditions.
Membrane-inlet mass spectrometry measurements. Samples were introduced in a 3 ml
thermostated cuvette, which was connected to a Quadrupole Mass Spectrometer (QMS 200,
Pfeiffer Vacuum Prisma) by a stainless steel vacuum tube (0.125 inches) passing through a water
trap filled with ethanol and dry ice. The sample was separated from the tube via a gas-permeable
inlet system (poly-tetrafluoroethylene (PTFE) membrane). 18O2 was added as a bubble to the algal
suspension, and the bubble was removed before the experiment. The measurements of the
partial pressures of 16O2 (p16O2, m/z = 32), 18O2 (p18O2, m/z = 36) and argon (m/z = 40) were
performed after the cuvette was sealed. A blue light-emitting diode (LED) source was connected
to the cuvette, and the light irradiance was manually adjustable in the 0 to ~ 800 µmol quanta m-
2 s-1 range. The temperature was kept at 19 ± 1 °C in the cuvette during the experiment.
Cross-talk chloroplast-mitochondria in diatoms
50
To calculate gross O2 production (E0) and uptake (U0), respectively production and consumption
by the cells, we adapted the equations from ref. 38:
U0 = (Δ[18O]/Δt+k[18O])(([18O] + [16O]/[18O])
E0 = (Δ[16O]/Δt + k[16O]) + U0(([18O] + [16O]/[16O])
where k is the rate constant of O2 decrease measured in the absence of algae. We normalized O2
to Argon (a biologically inert gas with very similar solubility properties), which decreases the
sensitivity of O2 measurements to fluctuations by ~80% (ref. 39). The gas concentrations were
calibrated by measuring the air-equilibrated O2 concentration (stirring deionized water in the
open cuvette for at least 5 h) and background O2 (bubbling with N2).
Respiration rates. Respiration rates were measured as O2 exchange rates using a Clark-type
oxygen electrode at 19 °C (Hansatech Instruments). AOX capacity was measured as SHAM-
sensitive respiration in conditions where the cyanide-sensitive pathway was inhibited
beforehand (AA, 5 µM).
ATP/NADPH in vivo measurements. NADP+/NADPH redox changes were followed in living cells
using a Dual-PAM (Walz). NADPH fluorescence was measured at 460 nm, upon excitation in the
near ultraviolet. Chlorophyll a concentration was ~5 µg ml-1. ATP content was measured using an
in vivo 31P-AMX 400 NMR spectrometer equipped with a 25-mm multinuclear probe tuned at
161.9 MHz, and a homemade lighting system, as described in ref. 40. The relative ATP content
was estimated in vivo from the surface of α-, β- and γ-phosphorus resonance peaks
corresponding to the three phosphates of NTPs, which dominate the NMR spectra with inorganic
phosphate and polyphosphates41.
Western blots and immunolocalization. Protein samples (5–10 µg) were loaded on 13% SDS–
polyacrylamide gel electrophoresis (PAGE) gels and blotted to nitro-cellulose. Primary AOX
antibody was custom designed (Sdix, 1:4,000 dilution). All other antisera used were obtained
from Agrisera (http://www.agrisera.com/en/ info/catalog.html). The blots were developed with
ECL detection reagent and images of the blots were obtained using a CCD (charge-coupled
device) imager (Chemidock MP Imaging, Bio-Rad). The results presented in Fig. 2.3b are
Cross-talk chloroplast-mitochondria in diatoms
51
representative of a total of five western blots on independent biological samples.
Immunolocalization of AOX was generally done as described in ref. 34. Briefly, cells were fixed
with 2% formaldehyde in culture media for 20 min, washed three times with marine phosphate
buffer (mPBS, see ref. 42) and permeabilized by 1% Triton X-100 in mPBS for 10 min. The cells
were washed again, blocked for 30 min in 1% BSA in mPBS, and incubated overnight at room
temperature (25 °C) with anti-AOX antibody from rabbit (custom design, Sdix, 1:200 dilution in
mPBS). The cells were then rinsed with mPBS and incubated with donkey Alexa 488-conjugated
anti-rabbit IgG antibody (Life Technologies, at 1:100 dilution in mPBS) for 2 h at room
temperature. Cells were then stained with 0.5 µg ml-1 DAPI (49,69-diamidino-2-phenylindole, Life
Technologies) for 10 min and mounted with Vectashield (Vector Laboratories) after a rinse.
Finally the cells were observed using a Leica SP5 confocal microscope (Leica Microsystems).
Electron microscopy. For transmission electron microscopy, P. tricornutum cells were fixed in 0.1
M cacodylate buffer (Sigma-Aldrich), pH 7.4, containing 2.5% glutaraldehyde (TAAB), 2%
formaldehyde (Polysciences) for 1 h at room temperature and then prepared according to a
modified protocol from T. J. Deerinck et al., (http://ncmir.ucsd.edu/sbfsem-protocol.pdf). After
the dehyd-ration steps, the cells were infiltrated with ethanol/Epon resin mixture (2/3–1/3 for 1
h and 1/3–2/3 for 1 h) and finally embedded in Epon in a 60 °C oven for 48 h or longer. Ultrathin
sections (60 nm) were prepared with a diamond knife on an UC6 Leica ultramicrotome and
collected on 200 µM mesh nickel grids before examining on a JEOL 1200 EX electron microscope.
AOX knockdown lines. Partial coding sequence of AOX (identity Phatr2_ bd1075) was amplified
using primers AOXcFwd (TGCTCCGGAGGACAAT GAATTCGC) and AOXcRev
(TGGTCTAGACGTCGCGATGTTC), cut by EcoRI/XbaI (Fermentas) and cloned into an EcoRI/XbaI-
digested antisense construct43, under control of the FcpB promoter. The AOX antisense construct
was introduced into wild-type P. tricornutum cells using the standard microparticle
bombardment procedure with a PDS-1000/He Particle Delivery System (Bio-Rad)43,44. After 2
days, cells were transferred to F/2-supplemented–filtered seawater plates containing 100 µg ml-
1 phleomycin, a selective antibiotic for the Sh ble gene (InvivoGen, 09K30-MM). Putative
antisense lines were verified for the presence of the transformed DNA by PCR screening using
Cross-talk chloroplast-mitochondria in diatoms
52
the primers ShbleFwd (ACCAGTGCCGTTCCGGTG) and ShbleRev (TCGGTCAGTCCTGCTCCTC), and
the most strongly silenced lines were chosen on the basis of reduction of AOX protein levels as
measured by SDS–PAGE western blot with an anti-AOX antibody (see section on western blots
and immunolocalization).
REFERENCES
Falkowski, P. G. The evolution of modern eukaryotic phytoplankton. Science 305, 354–360
(2004).
Field, C. B., Behrenfeld, M. J., Randerson, J. T. & Falkowski, P. G. Primary production of the
biosphere: integrating terrestrial and oceanic components. Science 281, 237–240 (1998).
Shikanai, T. Cyclic electron transport around photosystem I: genetic approaches. Annu. Rev. Plant
Biol. 58, 199–217 (2007).
Asada, K. The water–water cycle as alternative photon and electron sinks. Phil. Trans. R. Soc.
Lond. B 355, 1419–1431 (2000).
Cardol, P. et al. An original adaptation of photosynthesis in the marine green alga Ostreococcus.
Proc. Natl Acad. Sci. USA 105, 7881–7886 (2008).
Ort, D. R. & Baker, N. R. A photoprotective role of O2 as an alternative electron sink in
photosynthesis? Curr. Opin. Plant Biol. 5, 193–198 (2002).
Petersen, J., Fo¨rster, K., Turina, P. & Gra¨ber, P. Comparison of the H1/ATP ratios of the H1-ATP
synthases from yeast and from chloroplast. Proc. Natl Acad. Sci. USA 109, 11150–11155 (2012).
Allen, J. F. Photosynthesis of ATP-electrons, proton pumps, rotors, and poise. Cell 110, 273–276
(2002).
Cross-talk chloroplast-mitochondria in diatoms
53
Lucker, B. & Kramer, D. M. Regulation of cyclic electron flow in Chlamydomonas reinhardtii under
fluctuating carbon availability. Photosynth. Res. 117, 449–459 (2013).
Allen, J. F. Oxygen reduction and optimum production of ATP in photosynthesis. Nature 256, 599–
600 (1975).
Radmer, R. J. & Kok, B. Photoreduction of O2 primes and replaces CO2 assimilation. Plant Physiol.
58, 336–340 (1976).
Badger, M. R. Photosynthetic oxygen exchange. Annu. Rev. Plant Physiol. 36, 27–53 (1985).
Prihoda, J. et al. Chloroplast-mitochondria cross-talk in diatoms. J. Exp. Bot. 63, 1543–1557
(2012).
Bowler, C. et al. The Phaeodactylum genome reveals the evolutionary history of diatom genomes.
Nature 456, 239–244 (2008).
Grouneva, I., Rokka, A. & Aro, E.-M. The thylakoid membrane proteome of two marine diatoms
outlines both diatom-specific and species-specific features of the photosynthetic machinery. J.
Proteome Res. 10, 5338–5353 (2011).
Witt, H. T. Energy conversion in the functional membrane of photosynthesis. Analysis by light
pulse and electric pulse methods. The central role of the electric field. Biochim. Biophys. Acta
505, 355–427 (1979).
Joliot, P. & Joliot, A. Characterization of linear and quadratic electrochromic probes in Chlorella
sorokiniana and Chlamydomonas reinhardtii. Biochim. Biophys. Acta 975, 355–360 (1989).
Diner, B. & Joliot, P. Effect of the transmembrane electric field on the photochemical and
quenching properties of photosystem II in vivo. Biochim. Biophys. Acta 423, 479–498 (1976).
Cross-talk chloroplast-mitochondria in diatoms
54
Finazzi, G. & Rappaport, F. In vivo characterization of the electrochemical proton gradient
generated in darkness in green algae and its kinetics effects on cytochrome b6f turnover.
Biochemistry 37, 9999–10005 (1998).
Waring, J., Klenell, M., Bechtold, U., Underwood, G. J. C. & Baker, N. R. Light-induced responses
of oxygen photo-reduction, reactive oxygen species production and scavenging in two diatom
species. J. Phycol. 46, 1206–1217 (2010).
Kinoshita, H. et al. The chloroplastic 2-oxoglutarate/malate transporter has dual function as the
malate valve and in carbon/nitrogen metabolism. Plant J. 65, 15–26 (2011).
Lemaire, C., Wollman, F. A. & Bennoun, P. Restoration of phototrophic growth in a mutant of
Chlamydomonas reinhardtii in which the chloroplast atpB gene of the ATP synthase has a
deletion: an example of mitochondria-dependent photosynthesis. Proc. Natl Acad. Sci. USA 85,
1344–1348 (1988).
Cardol, P. et al. Impaired respiration discloses the physiological significance of state transitions
in Chlamydomonas. Proc. Natl Acad. Sci. USA 106, 15979–15984 (2009).
Dang, K. V. et al. Combined increases in mitochondrial cooperation and oxygen photoreduction
compensate for deficiency in cyclic electron flow in Chlamydomonas reinhardtii. Plant Cell 26,
3036–3050 (2014).
Vartanian, M., Descle´s, J., Quinet, M., Douady, S. & Lopez, P. J. Plasticity and robustness of
pattern formation in the model diatom Phaeodactylum tricornutum. New Phytol. 182, 429–442
(2009).
Guillard, R. R. L. in Culture of Marine Invertebrate Animals (eds Smith W. L. & Chanley H.) 26–60
(Plenum, 1975).
Joe¨t, T., Cournac, L., Horvath, E. M., Medgyesy, P. & Peltier, G. Increased sensitivity of
photosynthesis to antimycin A induced by inactivation of the chloroplast ndhB gene. Evidence
Cross-talk chloroplast-mitochondria in diatoms
55
for a participation of the NADH-dehydrogenase complex to cyclic electron flow around
photosystem I. Plant Physiol. 125, 1919–1929 (2001).
Wishnick, M. & Lane, M. D. Inhibition of ribulose diphosphate carboxylase by cyanide. Inactive
ternary complex of enzyme, ribulose diphosphate, and cyanide. J. Biol. Chem. 244, 55–59 (1969).
Nakano, Y. & Asada, K. Purification of ascorbate peroxidase in spinach chloroplasts; its
inactivation in ascorbate-depleted medium and reactivation by monodehydroascorbate radical.
Plant Cell Physiol. 28, 131–140 (1987).
Asada, K., Takahashi, M. A. & Nagate, M. Assay and inhibitors of spinach superoxide dismutase.
Agric. Biol. Chem. 38, 471–473 (1974).
Joliot, P. & Delosme, R. Flash induced 529 nm absorption change in green algae. Biochim.
Biophys. Acta 357, 267–284 (1974).
Santabarbara, S., Redding, K. E. & Rappaport, F. Temperature dependence of the reduction of p-
7001 by tightly bound plastocyanin in vivo. Biochemistry 48, 10457–10466 (2009).
Melis, A. Kinetic analysis of P-700 photoconversion: effect of secondary electron donation and
plastocyanin inhibition. Arch. Biochem. Biophys. 217, 536–545 (1982).
Bailleul, B., Cardol, P., Breyton, C. & Finazzi, G. Electrochromism: a useful probe to study algal
photosynthesis. Photosynth. Res. 106, 179–189 (2010).
Johnson, X. et al. A new setup for in vivo fluorescence imaging of photosynthetic activity.
Photosynth. Res. 102, 85–93 (2009).
Genty, B., Briantais, J. M. & Baker, N. R. The relationship between the quantum yield of
photosynthetic electron transport and quenching of chlorophyll fluorescence. Biochim. Biophys.
Acta 990, 87–92 (1989).
Cross-talk chloroplast-mitochondria in diatoms
56
Bilger, W. & Bjo¨rkman, O. Role of the xanthophyll cycle in photoprotection elucidated by
measurements of light-induced absorbance changes, fluorescence and photosynthesis in leaves
of Hedera canariensis. Photosynth. Res. 25, 173–186 (1990).
Peltier, G. & Thibault, P. O2 uptake in the light in Chlamydomonas. Plant Physiol. 79, 225–230
(1985).
Kana, T. M. et al. A membrane inlet mass spectrometer for rapid and high-precision
determination of N2, O2, and Ar in environmental water samples. Anal. Chem. 66, 4166–4170
(1994).
Rivasseau, C. et al. Accumulation of 2-C-methyl-D-erythritol 2,4-cyclodiphosphate in illuminated
plant leaves at supraoptimal temperatures reveals a bottleneck of the prokaryotic
methylerythritol 4-phosphate pathway of isoprenoid biosynthesis. Plant Cell Environ. 32, 82–92
(2009).
Bligny, R. & Douce, R. NMR and plant metabolism. Curr. Opin. Plant Biol. 4, 191–196 (2001).
Van de Meene, A. M. L. & Pickett-Heaps, J. D. Valve morphogenesis in the centric diatom
Rhizosolenia setigera (Bacillariophyceae, Centrales) and its taxonomic implications. Eur. J. Phycol.
39, 93–104 (2004).
De Riso, V. et al. Gene silencing in the marine diatom Phaeodactylum tricornutum. Nucleic Acids
Res. 37, e96 (2009).
Falciatore, A., Casotti, R., Leblanc, C., Abrescia, C. & Bowler, C. Transformation of nonselectable
reporter genes in marine diatoms. Mar. Biotechnol. (NY) 1, 239–251 (1999).
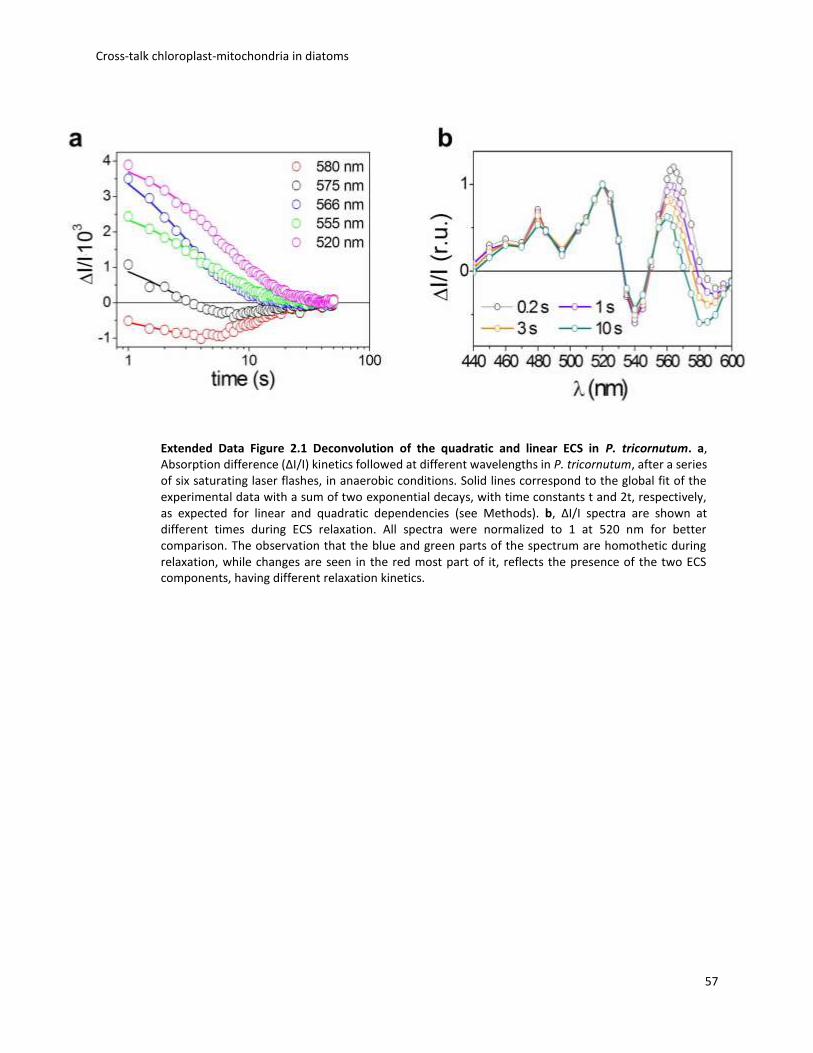
Cross-talk chloroplast-mitochondria in diatoms
57
Extended Data Figure 2.1 Deconvolution of the quadratic and linear ECS in P. tricornutum. a, Absorption difference (ΔI/I) kinetics followed at different wavelengths in P. tricornutum, after a series of six saturating laser flashes, in anaerobic conditions. Solid lines correspond to the global fit of the experimental data with a sum of two exponential decays, with time constants t and 2t, respectively, as expected for linear and quadratic dependencies (see Methods). b, ΔI/I spectra are shown at different times during ECS relaxation. All spectra were normalized to 1 at 520 nm for better comparison. The observation that the blue and green parts of the spectrum are homothetic during relaxation, while changes are seen in the red most part of it, reflects the presence of the two ECS components, having different relaxation kinetics.
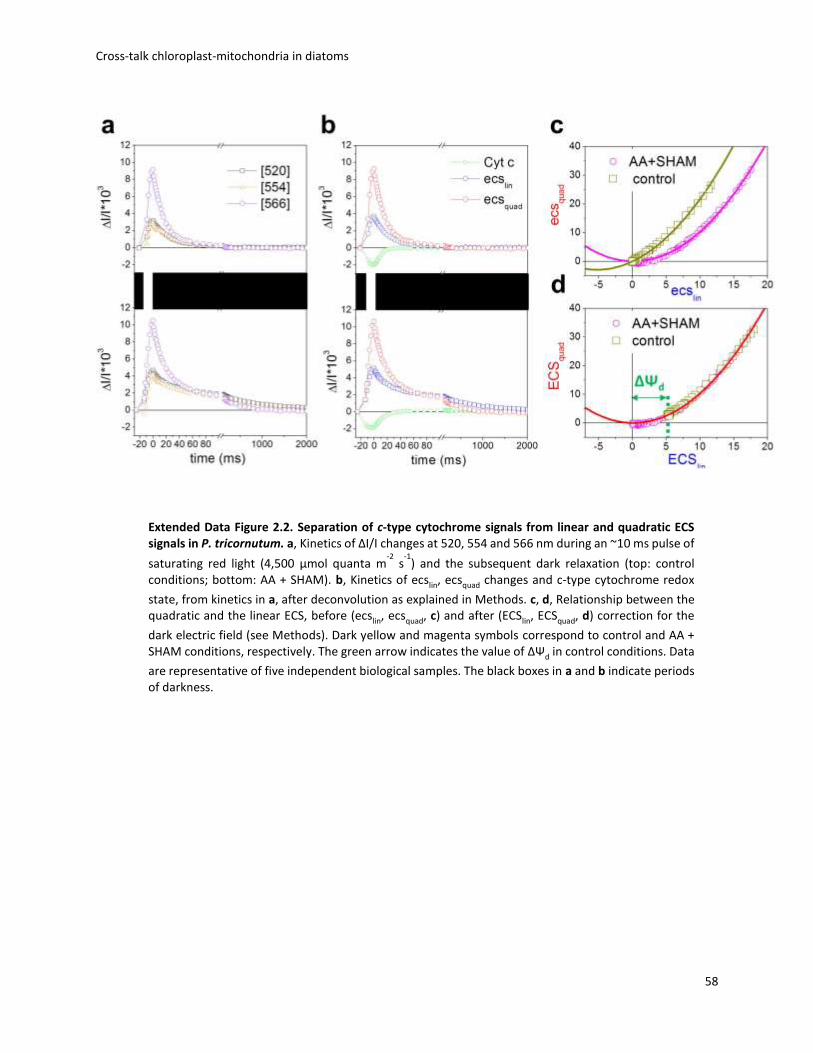
Cross-talk chloroplast-mitochondria in diatoms
58
Extended Data Figure 2.2. Separation of c-type cytochrome signals from linear and quadratic ECS signals in P. tricornutum. a, Kinetics of ΔI/I changes at 520, 554 and 566 nm during an ~10 ms pulse of
saturating red light (4,500 µmol quanta m-2
s-1
) and the subsequent dark relaxation (top: control conditions; bottom: AA + SHAM). b, Kinetics of ecslin, ecsquad changes and c-type cytochrome redox
state, from kinetics in a, after deconvolution as explained in Methods. c, d, Relationship between the quadratic and the linear ECS, before (ecslin, ecsquad, c) and after (ECSlin, ECSquad, d) correction for the
dark electric field (see Methods). Dark yellow and magenta symbols correspond to control and AA + SHAM conditions, respectively. The green arrow indicates the value of ΔΨd in control conditions. Data
are representative of five independent biological samples. The black boxes in a and b indicate periods of darkness.
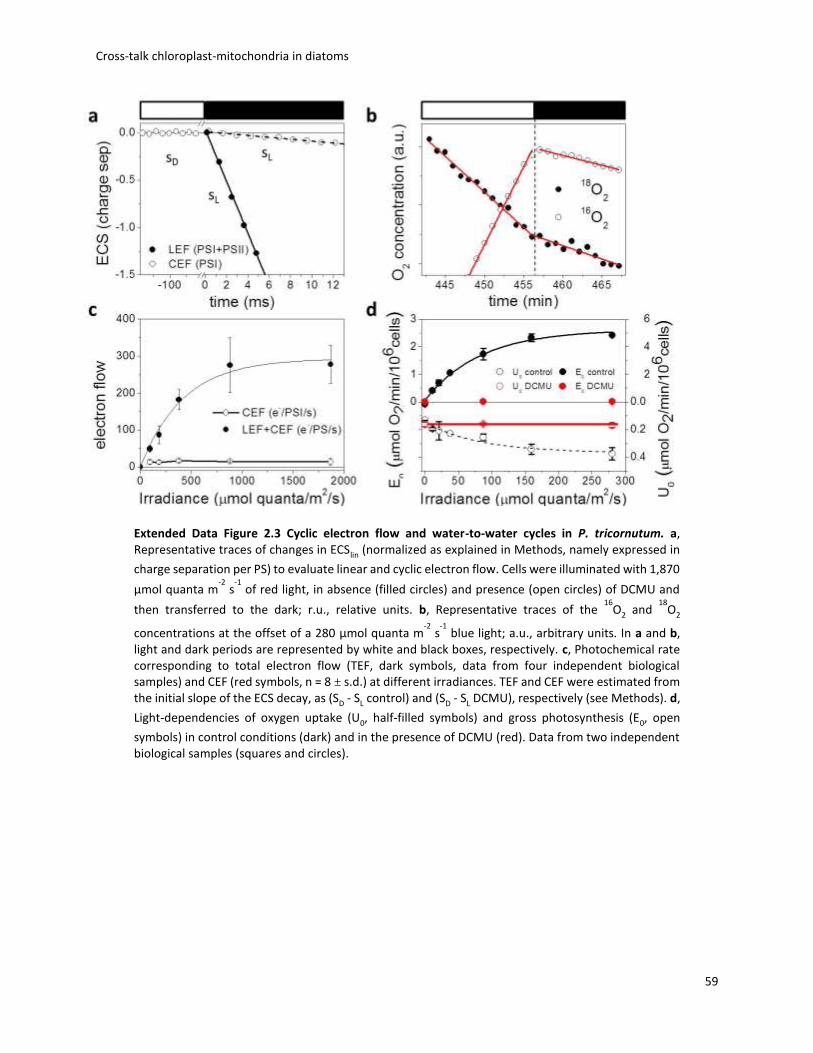
Cross-talk chloroplast-mitochondria in diatoms
59
Extended Data Figure 2.3 Cyclic electron flow and water-to-water cycles in P. tricornutum. a, Representative traces of changes in ECSlin (normalized as explained in Methods, namely expressed in
charge separation per PS) to evaluate linear and cyclic electron flow. Cells were illuminated with 1,870
µmol quanta m-2
s-1
of red light, in absence (filled circles) and presence (open circles) of DCMU and
then transferred to the dark; r.u., relative units. b, Representative traces of the 16
O2 and 18
O2
concentrations at the offset of a 280 µmol quanta m-2
s-1
blue light; a.u., arbitrary units. In a and b, light and dark periods are represented by white and black boxes, respectively. c, Photochemical rate corresponding to total electron flow (TEF, dark symbols, data from four independent biological samples) and CEF (red symbols, n = 8 ± s.d.) at different irradiances. TEF and CEF were estimated from the initial slope of the ECS decay, as (SD - SL control) and (SD - SL DCMU), respectively (see Methods). d,
Light-dependencies of oxygen uptake (U0, half-filled symbols) and gross photosynthesis (E0, open
symbols) in control conditions (dark) and in the presence of DCMU (red). Data from two independent biological samples (squares and circles).
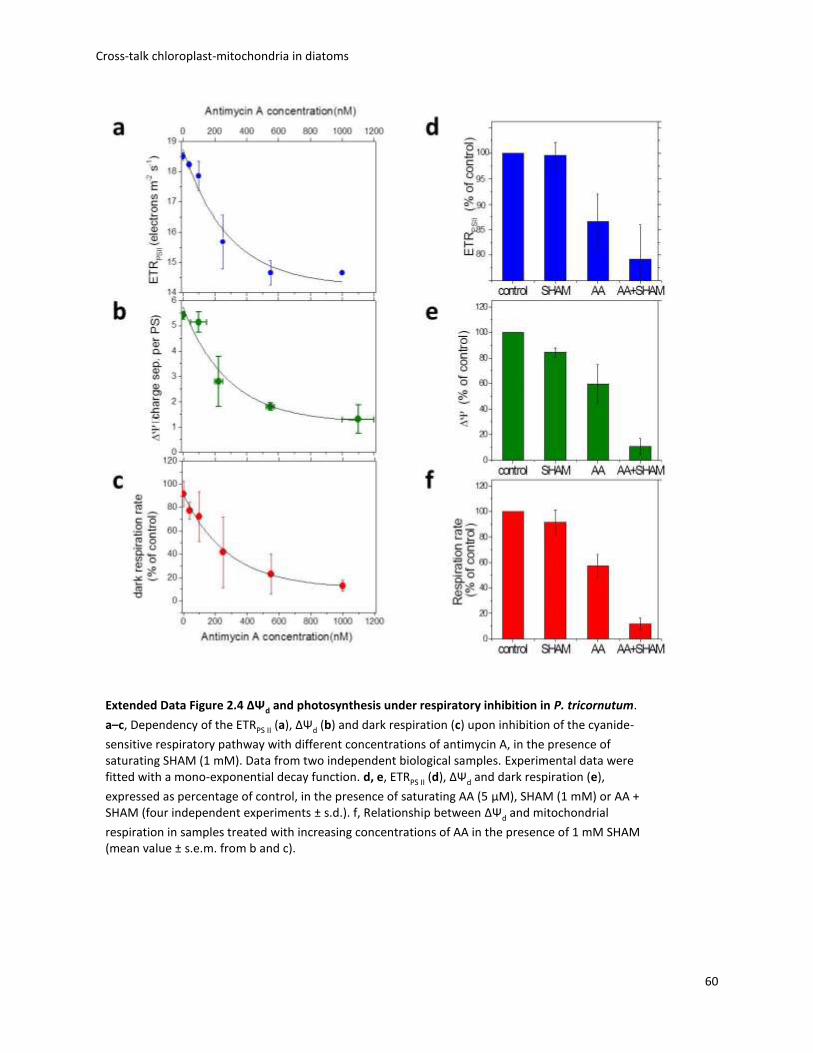
Cross-talk chloroplast-mitochondria in diatoms
60
Extended Data Figure 2.4 ΔΨd and photosynthesis under respiratory inhibition in P. tricornutum.
a–c, Dependency of the ETRPS II (a), ΔΨd (b) and dark respiration (c) upon inhibition of the cyanide-
sensitive respiratory pathway with different concentrations of antimycin A, in the presence of saturating SHAM (1 mM). Data from two independent biological samples. Experimental data were fitted with a mono-exponential decay function. d, e, ETRPS II (d), ΔΨd and dark respiration (e),
expressed as percentage of control, in the presence of saturating AA (5 µM), SHAM (1 mM) or AA + SHAM (four independent experiments ± s.d.). f, Relationship between ΔΨd and mitochondrial
respiration in samples treated with increasing concentrations of AA in the presence of 1 mM SHAM (mean value ± s.e.m. from b and c).
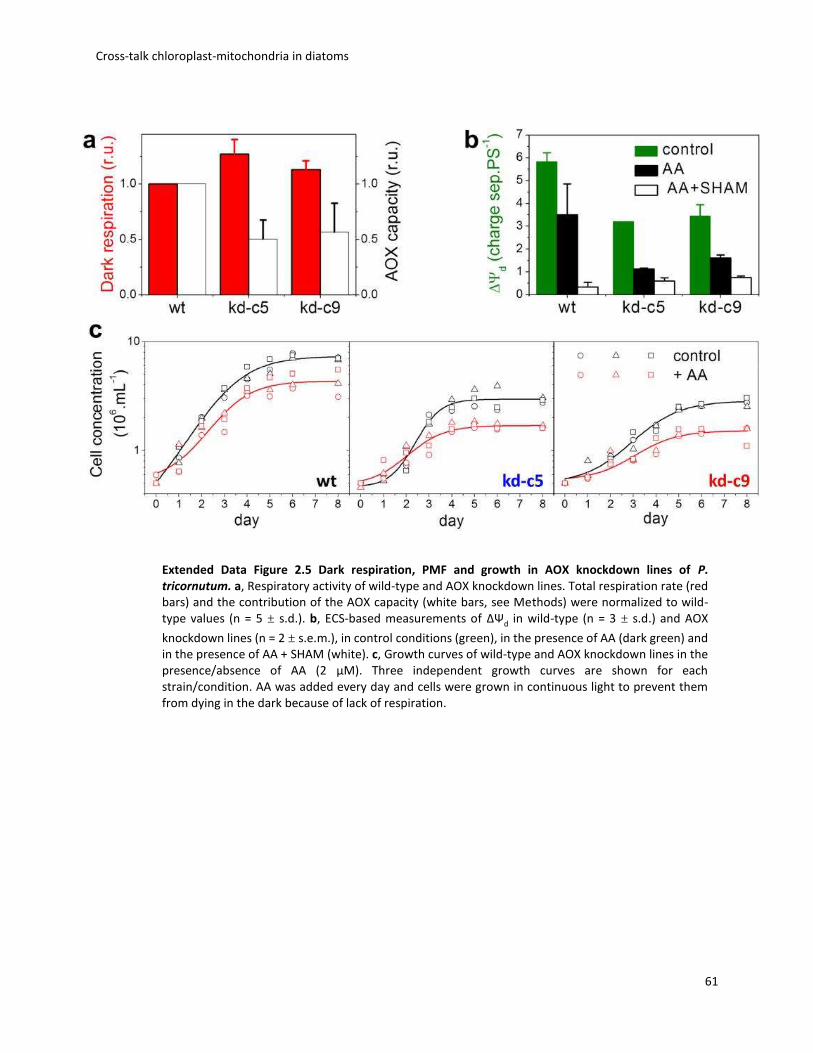
Cross-talk chloroplast-mitochondria in diatoms
61
Extended Data Figure 2.5 Dark respiration, PMF and growth in AOX knockdown lines of P. tricornutum. a, Respiratory activity of wild-type and AOX knockdown lines. Total respiration rate (red bars) and the contribution of the AOX capacity (white bars, see Methods) were normalized to wild-type values (n = 5 ± s.d.). b, ECS-based measurements of ΔΨd in wild-type (n = 3 ± s.d.) and AOX
knockdown lines (n = 2 ± s.e.m.), in control conditions (green), in the presence of AA (dark green) and in the presence of AA + SHAM (white). c, Growth curves of wild-type and AOX knockdown lines in the presence/absence of AA (2 µM). Three independent growth curves are shown for each strain/condition. AA was added every day and cells were grown in continuous light to prevent them from dying in the dark because of lack of respiration.
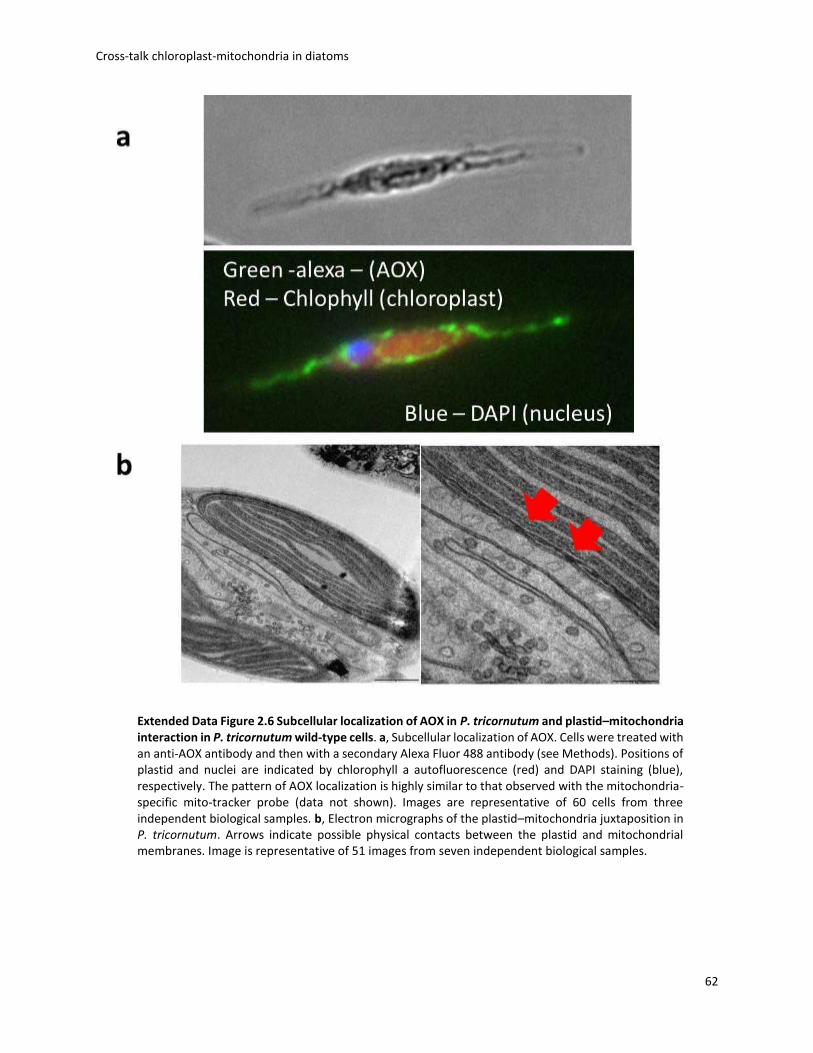
Cross-talk chloroplast-mitochondria in diatoms
62
Extended Data Figure 2.6 Subcellular localization of AOX in P. tricornutum and plastid–mitochondria interaction in P. tricornutum wild-type cells. a, Subcellular localization of AOX. Cells were treated with an anti-AOX antibody and then with a secondary Alexa Fluor 488 antibody (see Methods). Positions of plastid and nuclei are indicated by chlorophyll a autofluorescence (red) and DAPI staining (blue), respectively. The pattern of AOX localization is highly similar to that observed with the mitochondria-specific mito-tracker probe (data not shown). Images are representative of 60 cells from three independent biological samples. b, Electron micrographs of the plastid–mitochondria juxtaposition in P. tricornutum. Arrows indicate possible physical contacts between the plastid and mitochondrial membranes. Image is representative of 51 images from seven independent biological samples.

Cross-talk chloroplast-mitochondria in diatoms
63
Extended Data Figure 2.7 Cytochrome b6f turnover in P. tricornutum wild-type and AOX knockdown
lines. a, Schematic representation of the electron-flow reaction steps in the cytochrome b6f complex,
which can be evaluated by spectroscopic measurements. b, Slow phase of ECSlin indicating cytochrome
b6 activity (top) and time-resolved redox changes of cytochromes c6/f (bottom) in wild-type and AOX
knockdown lines (kd-c5 and kd-c9). P. tricornutum cells were exposed to saturating single-turnover laser flashes given 10 s apart. Data were normalized to the amplitude of the fast phase of the ECSlin
signal. Cytochrome c and ECSlin were deconvoluted as explained in Methods. Three independent
biological samples are shown in red, blue and green colours. Cell concentration was 2 X 10⁷ cells per
millilitre. Note that both the slow phase of the ECSlin and the reduction of cytochromes c6/f were
completely abolished by the plastoquinone competitive inhibitor DBMIB (10 µM; black arrow).
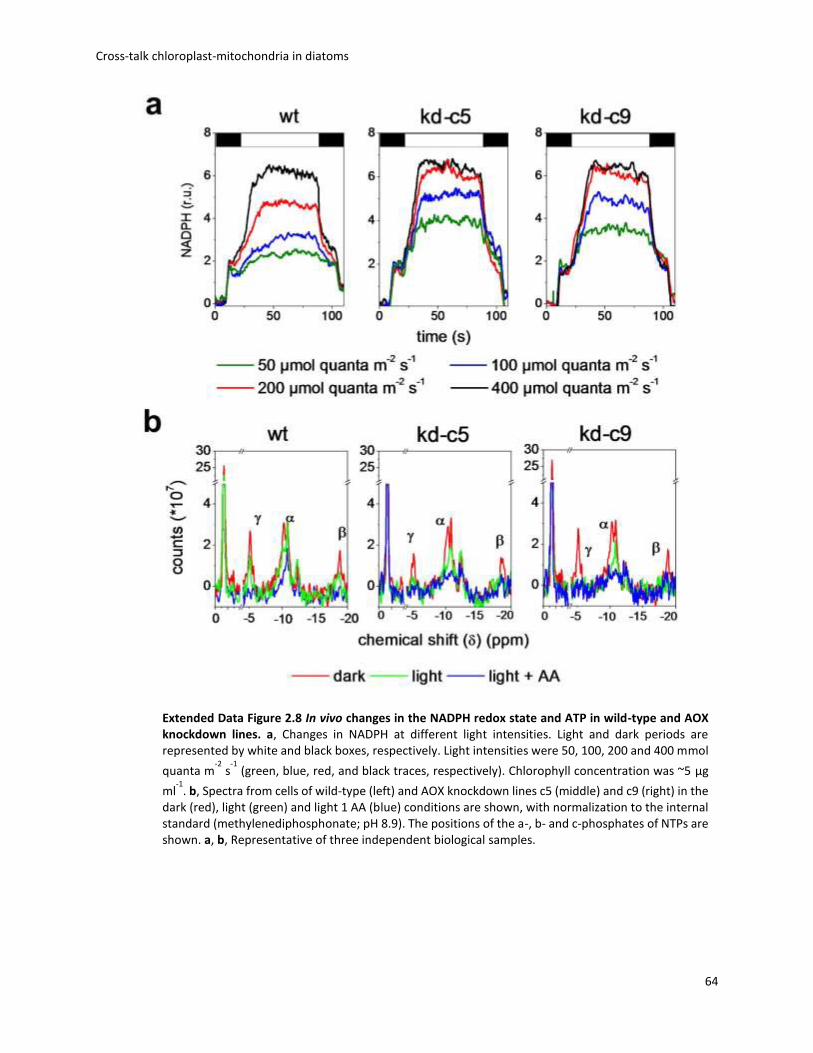
Cross-talk chloroplast-mitochondria in diatoms
64
Extended Data Figure 2.8 In vivo changes in the NADPH redox state and ATP in wild-type and AOX knockdown lines. a, Changes in NADPH at different light intensities. Light and dark periods are represented by white and black boxes, respectively. Light intensities were 50, 100, 200 and 400 mmol
quanta m-2
s-1
(green, blue, red, and black traces, respectively). Chlorophyll concentration was ~5 µg
ml-1
. b, Spectra from cells of wild-type (left) and AOX knockdown lines c5 (middle) and c9 (right) in the dark (red), light (green) and light 1 AA (blue) conditions are shown, with normalization to the internal standard (methylenediphosphonate; pH 8.9). The positions of the a-, b- and c-phosphates of NTPs are shown. a, b, Representative of three independent biological samples.
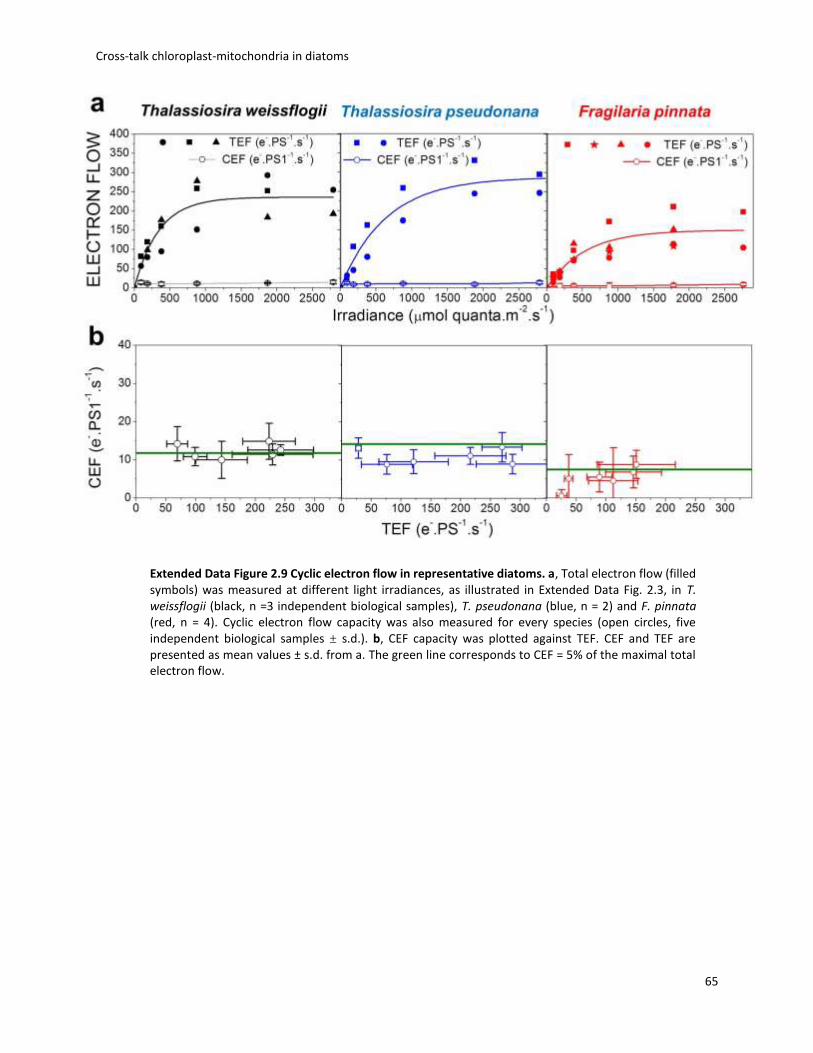
Cross-talk chloroplast-mitochondria in diatoms
65
Extended Data Figure 2.9 Cyclic electron flow in representative diatoms. a, Total electron flow (filled symbols) was measured at different light irradiances, as illustrated in Extended Data Fig. 2.3, in T. weissflogii (black, n =3 independent biological samples), T. pseudonana (blue, n = 2) and F. pinnata (red, n = 4). Cyclic electron flow capacity was also measured for every species (open circles, five independent biological samples ± s.d.). b, CEF capacity was plotted against TEF. CEF and TEF are presented as mean values ± s.d. from a. The green line corresponds to CEF = 5% of the maximal total electron flow.
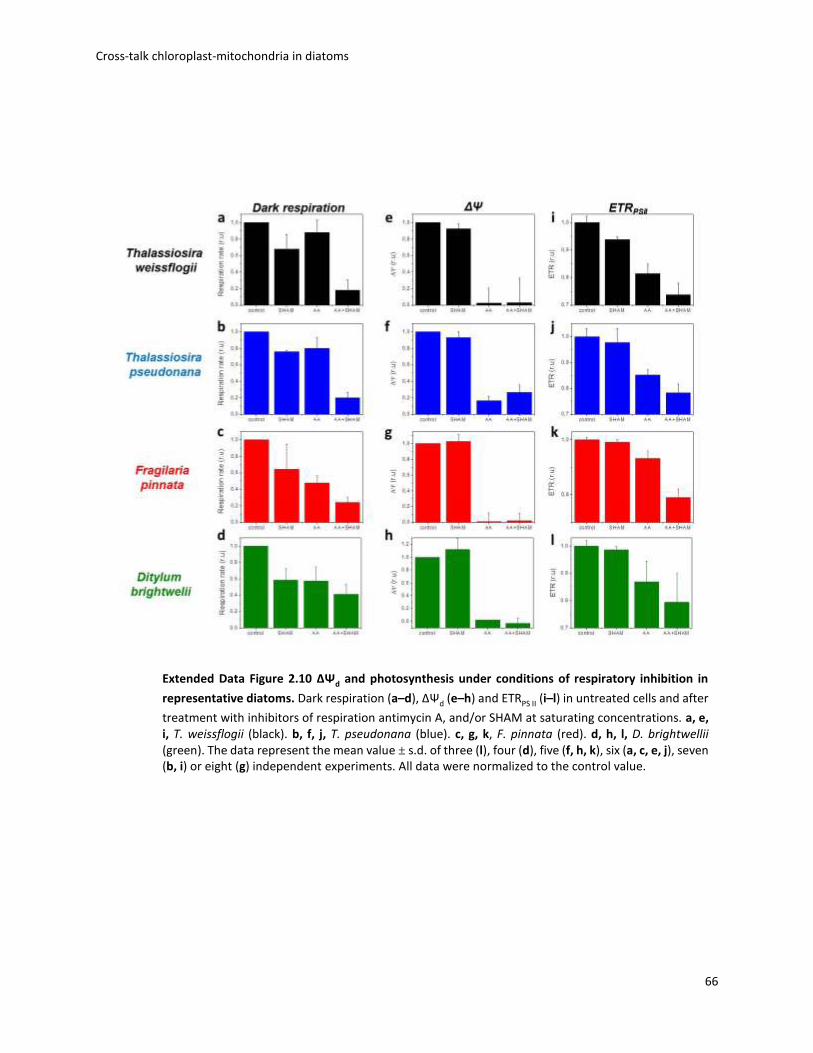
Cross-talk chloroplast-mitochondria in diatoms
66
Extended Data Figure 2.10 ΔΨd and photosynthesis under conditions of respiratory inhibition in
representative diatoms. Dark respiration (a–d), ΔΨd (e–h) and ETRPS II (i–l) in untreated cells and after
treatment with inhibitors of respiration antimycin A, and/or SHAM at saturating concentrations. a, e, i, T. weissflogii (black). b, f, j, T. pseudonana (blue). c, g, k, F. pinnata (red). d, h, l, D. brightwellii (green). The data represent the mean value ± s.d. of three (l), four (d), five (f, h, k), six (a, c, e, j), seven (b, i) or eight (g) independent experiments. All data were normalized to the control value.
Cross-talk chloroplast-mitochondria in diatoms
67
2.6 Conclusions and remarks
In this study a wide range of biophysical tools has been used to evaluate the interplay
between the chloroplast and the mitochondria in diatoms. The possibility to measure the ECS in
Phaeodactylum allows to follow the dynamics of the PFM in different conditions and to reveal
mitochondrial-chloroplast interactions. The presence of ECS signal in dark indicates that the PMF
is maintained across the thylakoid membranes, also when the photosynthetic machinery is not
active. By contrast, the PFM was dissipated in anaerobiosis, or in presence of the respiratory
inhibitors AA and SHAM. These findings suggest that the presence of PMF in the dark was due to
communication between mitochondria and chloroplast (i.e. the exportation of ATP from
mitochondria to chloroplast).
Similar results were obtained in green algae (Finazzi and Rappaport 1988), however in these
organisms, CEF plays the most important role in the regulation of ATP/NADPH ratio (Finazzi et
al., 2005). This was not the case for Phaeodactylum, in which the CEF showed to have a very low
contribution on the total electron flow (TEF). The contribution of chloroplast-mitochondria
interaction, instead, is much more relevant on the production of extra ATP for the carbon
fixation, as demonstrated by several evidences. The determination of oxygen consumption by a
polarographic approach, which was confirmed by a membrane inlet mass spectrometry (MIMS)
approach, revealed that dialog between photosynthesis and respiration is bidirectional, as shown
from a reduced respiration activity in presence of the inhibitor of PSII (i.e. DCMU). In addition,
knock-down AOX mutants have showed reduced growth rate, photosynthetic capacity (i.e. ETR)
and cellular ATP level as well as increased cellular NADPH level comparing with wt. These results
support the hypothesis that the reducing power (i.e. NADPH) generated during the
photosynthesis is exported to the mitochondria, and the ATP produced during the oxidative
respiration is redirected towards to the chloroplast to provide the extra energy needed for the
carbon fixation. Hence, the correct function of both mitochondria and chloroplast, as well as the
exchanges of molecules between the two organelles are crucial for carbon fixation and growth
in Phaeodactylum. In addition, we found similar results in other diatoms (Thalassiosira
pseudonana, T. weissflogii, Fragilaria pinnata and Ditylum brightwellii). Therefore, the
involvement of mitochondrial respiration in the optimisation of photosynthesis is a process
Cross-talk chloroplast-mitochondria in diatoms
68
conserved on this group and could explain their ecological success in the oceans. Future works
should entail the analysis of plastid and mitochondrial transporters in order to understand the
real actors involved in these communications. Furthermore, the analysis of ECS can be also used
to detect changes in the mechanism of photosynthesis and respiration under nutrient
deficiencies or in presence of a carbon source. These analyses could help to further elucidate the
mechanism of lipids accumulation and of mixotrophy (addressed in the chapter 4).
To conclude, we have studied the interactions between the photosynthetic and respiratory
electron chains in Phaeodactylum, and this allowed to elucidate the mechanism of mixotrophy.
Our findings showed that only the optimisation of both respiration and photosynthesis can boost
the growth and productivity in this organism. These hypotheses have been tested in the second
work of my PhD (chapter 3) where the consequences of the mixotrophic growth (using the
glycerol as carbon source) were analysed by combining different omics analyses.
Characterisation and optimisation of mixotrophy in Phaeodactylum tricornutum
69
Chapter 3
Characterisation and optimisation of mixotrophy in
Phaeodactylum tricornutum
3.1 Preface
This chapter contains the main project of my PhD work and it is divided in three sections.
The first section is an introduction of this work and it is further divided in two main paragraphs:
i) Characterisation of mixotrophic metabolism in Phaeodactylum tricornutum and ii) Optimisation
of mixotrophic metabolism by improving culture conditions. The second section contains the
manuscript (Villanova et al.,) that is in preparation for submission. The third part contains the
conclusions of this work and other remarks.
In the article presented in this chapter (“Boosting biomass quantity and quality by improved
mixotrophic culture of the diatom Phaeodactylum tricornutum), we first studied the mechanism
and consequences of mixotrophic growth in the diatom Phaeodactylum tricornutum by
combining omics analyses and physiological approaches. In the second part of this work, we
exploited these knowledges to improve algal biomass productivity. This was done by optimising
the medium composition to increase the efficiency of the mixotrophic metabolism and
consequently enhance the biomass. Eventually, the optimised conditions were scaled-up to 2L-
photobioreactors, where a better system control (temperature, pH, light, aeration/mixing)
allowed a further improvement of the biomass capacity of Phaeodactylum tricornutum.
Characterisation and optimisation of mixotrophy in Phaeodactylum tricornutum
70
3.2 Characterisation of mixotrophic metabolism in Phaeodactylum
tricornutum
As discussed in paragraph 1.3.3, P. tricornutum is a facultative mixotroph that is able to
grow in presence of both light and different carbon sources (Cerón-García et al., 2000; 2005; 2013;
Liu et al., 2008; Wang et al., 2012). Amongst them, the glycerol is the most attractive carbon
source for biotechnological applications because it is abundant and cheap (being a by-product of
biodiesel production) and it has already been reported to enhance biomass and lipid productivity
in P. tricornutum (Cerón-García et al., 2005; 2006; 2013). However, information on how glycerol
addition leads to increase growth and lipid productivity is still scarce. Indeed, its consequences
on central carbon and lipid metabolism in the diatom are not precisely known. This question has
been addressed by the present work, by combining various omics analyses.
3.2.1 Previous investigations of glycerol metabolism in Phaeodactylum tricornutum
Previous work on glycerol metabolism has been done growing Phaeodactylum on 13C-
labeled glycerol (Zheng et al., 2013, Huang et al., 2015). The idea behind these experiments is
that, upon uptake and metabolism, the carbon backbone of the glycerol will be distributed
between different metabolites, where it will become detectable through nuclear magnetic
resonance (NMR) or gas chromatography mass spectrometry (GC-MS). In particular, Zheng et al.,
2013 used this technique to investigate both glucose and glycerol metabolic fluxes. This work
revealed that under mixotrophic growth Phaeodactylum converted the carbon source mostly in
glycine and serine (two amino acids involved in photorespiratory reactions). Similar results were
found in Huang et al., 2015, where it was confirmed that the glycerol is metabolized by
Phaeodactylum and converted in glycine and serine, and this reaction is active mostly in N-
deplete conditions. Isotope labelling experiment allowed to detect the distribution of 13C
enrichments in all the amino acids but not in all the others metabolites. Moreover, the change in
the gene expression level was not investigated. To have a global view of mixotrophic metabolism
in Phaeodactylum, further investigations are needed.
Characterisation and optimisation of mixotrophy in Phaeodactylum tricornutum
71
3.2.2 Omics analysis
The omics technologies are any large-scale analysis, which are available to quantify the
absolute content of differences in the DNA (genomics), RNA (transcriptomics), proteins
(proteomics) and metabolites (metabolomics) levels, within an organism, tissue, cell or organelle.
These analyses are needed to provide a global view of pathways, processes and metabolic
changes in biological systems. In general, only an integrated analysis of different omics
technologies allows having a complete scenario of the cellular behaviour in the studied process
(i.e. from gene to metabolite regulation).
In this paragraph, I will present the transcriptomic and metabolic analyses that have been
used in this study. The lipidomic analysis (a subset of metabolomics) performed on P. tricornutum
cells will be illustrated in the next chapter.
Transcriptomic analysis is commonly used to detect differential gene expression profiles
under different culture conditions. For instance, this analysis has been performed in
Phaeodactylum tricornutum in order to understand its response to different external factors such
as nutrient starvation, silicic acid and stressors contaminants (Allen et al., 2008; Yang et al., 2014;
Levitan et al., 2015; Alipanah et al., 2015, Sapriel et al., 2009; Osborn et al., 2013). Alternately,
the transcriptomic analysis can be used to pinpoint genes for the metabolic engineering (Levitano
et al., 2015).
Two different approaches can be used to do transcriptomic analysis: RNA-sequencing and
microarray analysis. The first one is based on the complete sequencing of the RNA present in a
biological sample by next-generation sequencing (NGS) (Wang et al., 2009). It is able to detect
small differences in expression gene levels and/or in gene sequences. However, the large amount
of data produced by this analysis requires specific facilities to be analysed. Here, we decide
instead to use a microarray analysis, thanks to an ongoing collaboration with another member of
the ITN “AccliPhot”, UPMC in the Angela Falciatore’s laboratory. The microarray, similarly to RNA
sequencing, is able to detect expression profiling within cells. This approach is based on the
hybridisation of fluorescent-labelled RNA (or cDNA after retro transcription) extracted by cells
with a pre-arrayed chip containing the partial or the entire genome of the target organism
(Shalon et al., 1996). This technique allows comparing the gene expression level of samples
Characterisation and optimisation of mixotrophy in Phaeodactylum tricornutum
72
treated in different ways. A very common approach for this purpose is the two-channel
microarray. In this case, the RNA extracted from cells growth in the two conditions are labelled
with different fluorescent dyes (i.e. Cy3 and Cy5) mixed and let hybridised with the chip. The
changes in the expression levels of genes are usually expressed as log2 of the Cy5/Cy3 ratios in
biological replicates. The data are then tested for statistical significance in gene expression
changes. This technology has been used in this study to analyse the change in expression level of
Phaeodactylum cells grown in presence/absence of glycerol. Only when these dataset were
integrated with the others analyses, it was possible to clarify the mixotrophic metabolism in
Phaeodactylum.
The metabolomics approach allows the simultaneous analysis of different type of
molecules, i.e. amino acids, sugars, organic compounds, fatty acids etc. However, due to the
huge number of targeted molecules and the complexity of their chemical structures, it is still
impossible to map the entire metabolome of a given organism simultaneously. The principal
tools available to detect a large number of metabolites are: i) nuclear magnetic resonance
(NMR) and ii) mass spectrometry coupled to a gas or a liquid chromatography (i.e. GC-MS, and
LC-MS). NMR has been used to analyse the metabolism of both plant tissue and microalgae
(Bligny and Douce 2001). This technique allows the detection of metabolites in an organism
and has the advantage of allowing both in vitro and in vivo analysis. The NMR experiments
provide specific fingerprints for different molecules, which can then be analysed thanks to
online databases (i.e. biological magnetic resonance data bank, BMRB and spectral database
for organic compounds, SDBS). However, the disadvantage of NMR is that this technique has
a low sensitivity, and thus requires highly concentrated samples (Shulaev, 2006). Therefore
we did not use it for our study, which targets cells in the early exponential phase. In this case,
extremely large volumes would have been needed to reach the cell concentration required
for NMR analysis.
MS technology, instead, shows higher resolution and it allow to identify a large number
of metabolites even at low cell concentration. Of course, this technique can only be used on
extracts. Normally, the metabolites are first separated by chromatography (i.e. LC or GC) and
then analysed by MS. In our case the metabolomics analysis was performed using a GC-MS

Characterisation and optimisation of mixotrophy in Phaeodactylum tricornutum
73
platform. This technique has already been used in different species of cyanobacteria (Huege
et al., 2011) and microalgae (Fernie et al., 2012; Allen et al., 2008; Obata et al., 2013; Sue et
al., 2014).
To conclude, by combining transcriptomic, metabolomics and lipidomic approaches, we
have provided a rather complete scenario of the metabolic changes associated with the
mixotrophic metabolism in Phaeodactylum tricornutum.
3.3 Optimisation of mixotrophic metabolism by improving culture
conditions
In principle, the metabolism information obtained from the omics approach can be used
to modify, and hence enhance, the specific pathways by metabolic engineering, as described
in paragraph 1.4.3. However, other limiting factors such as nutrients, light, pH,
aeration/mixing, temperature, etc have to be taken into account for the efficient industrial
exploitation of microalgae and will be discussed in the next paragraphs.
3.3.1 Culture medium/ nutrients
The cultivation of microalgae in industrial scale requests higher cell density than those
found in nature to make the process suitable with the market. To obtain higher biomass
concentration, the microalgae need to be grown in media that contains higher concentrations
of specific elements that are limiting growth in seawater. The nutrients that have to be
supplied to microalgal cultures are divided into two main categories based on their final
concentration: macronutrients (i.e. nitrogen, phosphorus and carbon) and micronutrients (i.e.
iron, copper, manganese, zinc etc.). Nitrogen and phosphorus (after carbon) are often the
most important macronutrients required for the growth of microalgae (Wijffels and Barbosa,
2010) and the deprivation of these elements triggers TAG accumulation in Phaeodactylum as
will be discussed in the next chapter (Abida et al., 2015). Also the micronutrients are essential
for algal growth because of their role as cofactors of key enzymes (Morel et al., 2014). For
Characterisation and optimisation of mixotrophy in Phaeodactylum tricornutum
74
instance, iron is a redox active metal present in several metalloproteins involved in
photosynthesis, respiration and nitrogen assimilation and hence is very important in
phototrophs (Moore et al., 2013). Manganese also plays a very important role in the growth
of the diatom Thalassiosira pseudonana (Sunda and Huntsman 1996). Indeed, the manganese
is involved in vital process of phototrophic organism such as the oxidation of water done by
PSII complex, and the conversion of superoxide (O2−) radical into molecular oxygen (O2) and
hydrogen peroxide (H2O2) (Sunda and Huntsman, 1998).
Zinc is also essential, as shown by the examples of the green alga Chlamydomonas
reinhardtii, where it impacts CO2 assimilation and Cu homeostasis (Malasarn et al., 2013), and
of the diatom T. weissflogii, where it seems to be associated with carbonic anhydrase (CA)
regulating the rate of carbon uptake and fixation (Morel et al., 1994).
Finally, the copper is an essential component of the photosynthetic chain of
viridiplantae, being the redox cofactor of the electron carrier plastocyanin (Merchant et al.,
2012). However, too elevated concentrations of these elements may result in oxidative
damage or in decrease of growth rate of cells (Choudhary et al., 2007).
For all these reasons, the optimisation of medium composition is a crucial step for
enhancing the biomass concentration of the selected microalgae. This has been done in this
work by balancing the elemental composition of Phaeodactylum tricornutum with that of
ESAW medium (as reported in others microalgae by Mandalam and Palsson 1998; Danquah et
al., 2010).
3.3.2 Light and NaHCO3 effect
Light is another important parameter to consider for the optimisation of phototrophic
and mixotrophic algal cultivation. Indeed, the light not only affects photosynthesis activity but
it can also changes the biomass composition of microalgae, due to acclimation phenomena
(i.e. pigments and lipids content) (Falkowski and Owens, 1980; Rashid et al., 2015). Increasing
the light intensity usually tends to increment the algal growth rate up to the light saturation
level. However, when light becomes oversaturating, it can lead to the formation of harmful
Characterisation and optimisation of mixotrophy in Phaeodactylum tricornutum
75
products (i.e. ROS) and, hence, decrease algal biomass productivity (Richmond et al., 2000).
To avoid this phenomenon (i.e. photoinhibition, described in paragraph 1.2.2) light intensity
has to be optimised in relation to cell density, so that the culture does not become light limited
or photodamaged (Hu et al., 1998). Following this rationale, in experiments performed in
photobioreactors, the light intensity was gradually increased along cell density enhancement.
Moreover, a carbon source is also needed for growth; depending on phototrophic vs
mixotrophic conditions (see paragraphs 1.3.1-1.3.3) the carbon source can be inorganic (i.e.
CO2 or NaHCO3) or organic (i.e. glycerol). In both cases, an increase of biomass concentration
is observed (Mus et al., 2013). In the experiments presented below, we tested the role of both
inorganic and organic carbon source in Phaeodactylum in order to enhance both
photosynthesis and respiration processes, and hence the mixotrophic metabolism.
3.3.3 Scale-up in fermentor
The last step of the optimisation processes for microalgal cultivation is the up-scaling in
fermentors. Two main alternatives exist for the cultivation of microalgae in larger scale: open
ponds (e.g. natural lakes, lagoons, ponds or artificial ponds/ containers) and photo-bioreactors
(PBRs). Open pond systems are more sensible to contaminations of microorganisms and
hardly allow a control of external parameters such as temperature, pH and light. However,
this system has much lower maintenance costs comparing to PBRs (Darzins et al., 2010). For
all these reasons, the fermentation in open pond is usually the best way to cultivate
microalgae under unusual growth conditions (i.e. high temperature, low pH), in which the
probability of contaminations is reduced. Instead, the cultivation in PBRs, thanks to a better
control of the systems (pH, temperature, light etc…), allows to obtain higher biomass
productivity and to maintain axenic cultures (Sheehan et al., 1998). In this study,
Phaeodactylum was grown in 2L-photobioreactor (Applikon schiedam the Netherlands)
monitoring and controlling pH, temperature, aeration-mixing and pO2. Finally, the light was
supplied continuously with external light panels ranging from 40 to 300 µE m-2 s-1. This allows
growing axenic cultures for about 50 days.
Characterisation and optimisation of mixotrophy in Phaeodactylum tricornutum
76
3.4 Boosting biomass quantity and quality by improved
mixotrophic cultivation of the diatom Phaeodactylum
tricornutum.
Valeria Villanova1,2, Antonio Emidio Fortunato3, Dipali Singh5, Melissa Conte2, Toshihiro
Obata4, Juliette Johuet 2, Alisdair R. Fernie4, Mark Poolman5, Eric Marechal2, Angela
Falciatore3, Adeline Le Monnier1, Julien Pagliardini1, Dimitris Petroutsos2*, Giovanni
Finazzi2*
1Fermentalg SA, F-33500 Libourne, France,
2Laboratoire de Physiologie Cellulaire et Vegetale,UMR5168, Centre National de la Recherche Scientifique
(CNRS), Commissariat à l’Energie Atomique et aux Energies Alternatives (CEA), Université ´ Grenoble Alpes,
Institut National Recherche Agronomique (INRA), Institut de Recherche en Sciences et Technologies pour le
Vivant (iRTSV), CEA Grenoble, F-38054 Grenoble cedex 9, France;
3Universite ´ Pierre et Marie Curie, UMR7238, CNRS-Université Pierre et Marie Curie (UMPC), 75006 Paris,
France.
4Max-Planck Institut für Molekulare Pflanzenphysiologie, Am Mühlenberg 1, 14476 Golm-Potsdam, Germany,
5Department of Biological and Medical Sciences, Oxford Brookes University, Oxford, OX3 0BP, U.K.
*To whom correspondence should be addressed: [email protected]; [email protected]
Characterisation and optimisation of mixotrophy in Phaeodactylum tricornutum
77
ABSTRACT
Diatoms are prominent marine microalgae, attracting attention not only from an ecological
point of view, but also for their possible use for biotech applications. They can be cultivated
in phototrophic conditions, using sunlight as the only energy source, or in mixotrophic mode,
where both light and external reduced carbon contribute to biomass accumulation. In this
study, we investigated the consequences of mixotrophy on the growth and metabolism of the
pennate diatom Phaeodactylum tricornutum, using glycerol as a source of reduced carbon.
Transcriptomic, metabolomic and physiological data indicate that glycerol affects the central-
carbon, the carbon-storage and the lipid metabolisms of the diatom. In particular, glycerol
addition mimics some typical responses of nitrogen limitation on lipid metabolism at the level
of TAG accumulation and fatty acids composition. However, glycerol did not diminish
photosynthetic activity and cell growth, at variance with nutrient limitation, revealing clear
advantages for biotechnological applications. Finally, we show that the benefits of glycerol on
biomass and lipid productivity can be largely enhanced by optimising the micronutrient
content of the growth medium, in both flask and photobioreactor driven cultures.
Characterisation and optimisation of mixotrophy in Phaeodactylum tricornutum
78
INTRODUCTION
Diatoms are unicellular eukaryotes responsible for about 20-25% of the global carbon
dioxide fixation via photosynthesis (photoautotrophy). Issued from a complex
endosymbiotic events in which a red alga (but possibly also a green alga) was engulfed
by heterotrophic eukaryotic host, diatoms display a complex combination of genes and
pathways acquired from endosymbiotic events and horizontal transfer with bacteria and
virus (Armbrust et al., 2009). Ultimately, this metabolic chimeric structure is believed to
be one essential component of the great evolutionary success (Thomas and Dieckmann,
2002; Hutchins et al., 1998) and of the high biotechnological potential of these algae
(Chisti 2007). Diatoms silica shells can be directly incorporated into nanostructures or
used as vectors for drug delivery (Lechner et al., 2015). Diatoms are also targeted
organisms for pharmaceutical, cosmetic and food applications as a natural source of
polyunsaturated fatty acids, pigments and antioxidants (Vinayak et al., 2015). Finally,
diatoms are considered as promising organisms for the production of biofuels, because
of their capacity to accumulate up to 30-40% triacylglycerols (TAG) under stress
conditions (Chisti 2007). TAGs can be synthesised by conversion of membrane
phospholipids that, following hydrolysis of the polar head produces diacylglycerol (DAG)
which is then acylated into TAG. Alternatively, they can be synthesised ex novo under
nitrogen starvation via a route called the Kennedy pathway, involving a diacylglycerol
acyltransferase and de novo DAG and acetyl-CoA synthesis (e.g. Simionato et al., 2013;
Abida et al., 2015). TAG can be readily converted into biodiesel after trans-esterification
(Balat and Balat 2008).
One major drawback related to biofuel production from nutrient starved algae is that
growth is rapidly arrested upon nutrient limitation, because most of the cellular building
blocks (membranes, proteins) are degraded to mobilize nutrients for housekeeping
functions. This difficulty is often circumvented trough a temporal segregation of biomass
production (replete conditions) and TAG production (stress conditions) (Kumar et al.,
2010; Jia et al., 2015). Alternatively, molecular engineering of metabolism can be
employed to enhance lipid productivity in unstarved algae for biofuel application. Fox
Characterisation and optimisation of mixotrophy in Phaeodactylum tricornutum
79
example, diverting metabolism from the generation of other storage molecules, like
sugars, has led to high TAG accumulation in diatoms even in nutrient replete conditions
(Daboussi et al., 2014). Another approach to boost algal productivity consists in
implementing biomass generation during the replete phase, to increase the final yield
(San Pedro et al., 2014; Xiao et al., 2015). This approach is not specifically targeted to a
given metabolite, because the increased biomass can be used for different purposes,
depending on the treatment performed during the starvation phase. Moreover, the
same approach can be applied to metabolic engineered algae, to improve their growth.
Because of their metabolic flexibility, different growth modes can be applied to
microalgae and diatoms in particular. The first one is photoautotrophy, where light
energy directly fuels CO2 assimilation into reduced carbon via photosynthesis. This
requires a photochemical conversion by the two photosystems (PSs), PSI and PSII,
electron flow to generated reducing power (NADPH) and ATP, which are consumed for
CO2 uptake by Rubisco and the Calvin Benson Bassham cycle (CBB cycle).
Earlier experiments have shown that it is possible to increase both lipids and biomass
productivity by increasing the CO2 concentration in various algal species, including
Phaeodactylum (Yongmanitchai and Ward 1991, Wu et al., 2015, Gardner et al., 2012).
In particular, Gardner and colleagues showed that NaHCO3 can actively stimulate TAG
accumulation in both Scenedesmus and Phaeodactylum. The use of NaHCO3 as inorganic
carbon source for growth, can be explained by the existence of carbon concentrating
mechanisms in diatoms (Curien et al., 2016) and represents cheaper alternative to CO2
bubbling (Chi et al., 2011).
The second mode is heterotrophy, in which algae grow without light by fermenting or
respiring exogenous sugars (Lewin and Lewin, 1960). Amongst the heterotrophs, two
different categories can be recognized: i. obligate heterotrophs (i.e. Nitzschia alba) that
lacks photosynthetic pigments and are not able to perform photosynthesis and ii.
facultative heterotrophs (i.e. Cyclotella cryptica) that can perform separately
photosynthesis and respiration. C. cryptica is able to grow in presence of glucose in the
dark, but show lower productivity than using the photoautotrophic metabolism
Characterisation and optimisation of mixotrophy in Phaeodactylum tricornutum
80
(Hellebust et al., 1971). In fact, some microalgae are obligate photoautotrophs because
they possess an inefficient uptake of carbon source (reviewed in Chen and Chen 2006).
Consequently, it was shown that the introduction of the gene encoding for the human
glucose transporter (GLUT1) in Phaeodactylum tricornutum allows the uptake of glucose
in the dark (Zaslavskaia et al., 2001), thereby improving biomass production.
A third mode of cultivation is mixotrophy, i.e. the growth in presence of both light and
organic carbon. This mode, which involves the utilization of respiration and
photosynthesis simultaneously, is of major interest for biofuel production in diatoms
(Wang et al., 2012). Various diatoms such as Phaeodactylum tricornutum (Cerón-García
et al., 2000; 2005; 2006), Navicula saprophila, and some species of Nitzschia (Kitano et
al., 1997) have been reported to grow mixotrophically, although with different
efficiencies and substrate specificity. Navicula saprophila is able to grow in photrotophic
mode as well as in presence of acetic acid, both in the absence or presence of light.
However, the highest growth rate is observed when reduced carbon is added in the light
(mixotrophy), roughly corresponding to the sum of the growth rates obtained in
heterotrophy and phototrophy. In mixotrophic conditions, N. saprophila also showed
the highest EPA productivity when compared to the other trophic modes (Kitano et al.,
1997).
Despite the potential of mixotrophic growth, the metabolic consequences and the
mechanism behind this process are still poorly understood. Model diatoms like P.
tricornutum are also facultative mixotrophs, able to use glycerol, acetate, glucose and
fructose for growth (Cerón-García et al., 2000; 2005; Liu et al., 2009; Wang et al., 2012).
This possibility is extremely interesting as it opens the possibility to investigate the
molecular mechanism of mixotrophy, which is still largely unknown to date. Results
showing that diatoms optimise their photosynthetic efficiency via constitutive energetic
interactions between mitochondria and plastids (Bailleul et al., 2015) have suggested a
molecular interpretation for mixotrophic growth. Indeed, coupling of respiratory and
photosynthetic activities via exchanges of NADPH and ATP provides a tight coordination
of these two processes. This coordination likely allows an efficient utilization of light and
Characterisation and optimisation of mixotrophy in Phaeodactylum tricornutum
81
reduced carbon by mixotrophy. On the other hand, the consequences of mixotrophy on
cell metabolism are still poorly studied. By combining several omics approaches
(lipidomics, transcriptomics and metabolomics) with physiological measurements, our
data provide a comprehensive picture of the metabolic changes induced by this growth
mode. Moreover, we show that mixotrophic growth in both flask and photobioreactor
scales can be further improved by customizing the oligoelement content of standard
media, as required for possible biotech applications.
METHODS
Algal culture.
Strains and growth media. Axenic cultures of Phaeodactylum tricornutum (Pt1, CCAP
1055/3, De Martino et al., 2007) were grown in 250 ml flask either in artificial seawater
ESAW (Berges et al., 2001) supplemented with extra NaNO3 and NaH2PO4 to reach a final
concentration of 0.47 g/L N and 0.03 g/L P (this medium will be referred as E10 from now
on). These increased concentrations avoid N or P depletion during growth (Abida et al.,
2015). For N-depletion experiments, cells were shifted to a N-free medium (called here
E0). Cells were grown in a chamber at 20°C, 40 µE m-2 s-1 irradiance with a 12-h-light /
12-h-dark photoperiod and shaking at 100 rpm. For mixotrophic growth experiments,
filter sterilized glycerol was added at a final concentration of 4,6 g/L to N repleted and N
depleted (E10+GLY, E0+GLY).
Alternatively, the E10 medium was further optimised by comparing the elemental
composition of P. tricornutum (Rebolloso-Fuentes et al., 2001) with that of E10 medium
following an approach previously established in other microalgae (Mandalam and
Palsson, 1998 and Danquah et al., 2010). This revealed that the E10 medium is deficient
in nitrogen, phosphorus, iron, manganese, zinc, and copper at high biomass
concentrations. Thus, a new medium (called ESAW enriched, or EE) was redesigned by
increasing the concentration of NaNO3, NaH2PO4.H20, FeEDTA, ZnSO4.7H2O, MnSO4
Characterisation and optimisation of mixotrophy in Phaeodactylum tricornutum
82
.4H2O and CuSO4. 5H2O to 2.5 g/L, 0.20 g/L, 0.0216 g/L, 0.589 mg/L, 2.55 mg/L and 0.66
mg/L respectively. The amount of others elements was maintained the same as in E10
medium. In some experiments, the EE medium was supplemented with NaHCO3 (1.26
g/L) to test the algal growth capacity in absence and presence of glycerol (i.e. EE+BIC,
EE+BIC+GLY).
To monitor algal growth, samples were taken daily (in the end of the light period) and
growth was estimated by i. cell counting using a LUNA™ instrument (Logos Biosystems,
Inc. USA) or ii. measuring the optical density at 750 nm using a double beam UV/ visible
spectrophotometer. In the latter case, cell concentration was evaluated from a
previously established calibration curve. The initial inoculum was 0.5 and 2x10⁶ cells/mL
for N-replete and N-deplete condition respectively. Cells were collected after 5 days for
metabolomic and transcriptomic analyses.
BiologTM plates assessment of growth and respiration. The consequences of 192
different carbon sources on algal growth was screened to pinpoint possible candidates
for mixotrophic cultivation of P. tricornutum using Phenotype Biolog MicroArrays™. This
microplate assay is based on the use of 96 well plate containing pre-arrayed substrates
such as carbohydrates, amino acids and carboxylic compounds. In this study, 2 x10⁶
cells/mL were resuspended in the E10 medium and 200 µL were deposited into each
well. Growth was followed daily and substrates that improve growth were selected from
a duplicate experiment. The best metabolites were scaled up to 250 mL flask. A
phototrophic control was grown in parallel.
To verify if these substrates were respired by P. tricornutum, different cell
concentrations (2, 4 and 8 x 10⁶ cells/ mL) were dark-grown in a 24-well microplate with
50 mM of the selected molecules in presence of Biolog redox dye mix A. The intensity of
color produced by the reduction of a tetrazolium compound during cell respiration
(Bochner 2003) was determined by estimated with a cell plate reader (infinite, Tecan,
Switzerland) to quantify respiration. Phototrophic control culture was used as negative
control.
Characterisation and optimisation of mixotrophy in Phaeodactylum tricornutum
83
Nitrogen and phosphate concentration. Nitrogen and phosphate concentration in
supernatant were determining using a Merck RQflex reflectometer (E. Merck, 64271
Domsstadt, Germany) with test strips (Reflectoquant nitrate and phosphate).
Scale-up in 2-L photobioreactor. The optimised conditions were carried out in
duplicate in 2-L photo-bioreactors (Applikon Schiedam, The Netherlands). All cultures
were sparged continuously with air at flow rate of 0.5 L/m. The pH was controlled at 8
by automatic on-demand injection of 0.25 N of HNO3. Temperature was controlled at 20
°C by circulating water. Light was supplied continuously with external light panels
ranging from 40 to 300 µE m-2 s-1.
Dry Cell Weight protocol. Millipore membrane filter (diameter 47 mm, µ = 0.45 µm)
placed in an aluminium cup (ø x h = 70 x 6 mm) were dried 24h in an oven at 105 °C and
weighted. From 2 to 10 mL of culture was filtered through dried filter. The filter was
rinsed with sea water (2 x filtered volume). Finally, the filter + biomass was dried for 24h
and weighted again. The dry cell weight (dcw) was calculated as: [weight of
(filter+aluminium cup+biomass)] - [weight of (filter+ aluminium cup)]/ L of filtered
culture and expressed as g/L.
Spectroscopy.
Chlorophyll Fluorescence Measurements. All the photosynthetic parameters were
determined using a Speedzen MX fluorescence imaging setup (JBeamBio, France) as
described in (Johnson et al., 2009). For each sample, 3 x 200 µl of algal culture were
transferred in a 24 well plate. Maximum quantum yield of PSII (Fv/Fm = (Fm-F0)/Fm) was
determined after 15 min of dark incubation, where Fm and F0 are the maximum and
minimum fluorescence of dark-adapted cells, respectively. Non-photochemical
quenching (NPQ) was calculated as (Fm-Fm′)/Fm′, where Fm′ and Fm are maximum
fluorescence of light-adapted and dark-adapted cells respectively. Photosynthetic
electron transfer rate (ETR) was calculated as 0.5 x I x Y(II), where 0.5 represents the
fraction of light absorbed by PSII (half or the total incident light), I is the incident light
intensity and Y(II) is the quantum yield of PSII in the light. The latter is defined as (Fm’-
Characterisation and optimisation of mixotrophy in Phaeodactylum tricornutum
84
Fss)/Fm’, where Fss is the fluorescence emission measured in the presence of the light
(Maxwell and Johnson 2000).
Nile Red analysis. Accumulation of triacyglerols was monitored by Nile Red (Sigma-
Aldrich) fluorescent staining as detailed in (Abida et al., 2015). Shortly, 40 µL of Nile Red
dye (2.5 µg/mL stock concentration, in 100% DMSO) were added to 160 µL cell
suspension (1-5 million cells/mL) in 96-well white microplate and mixed. After 20
minutes of incubation at room temperature into the dark the Nile Red fluorescence was
measured (530/580 nm: excitation/emission). The data were then normalised per
millions of cells.
Metabolite analysis
Glycerol concentration. The glycerol concentration of 2 mL of filtered supernatant
was done on Shimadzu HPLC with a Hi-plex H+ (7.7 X 300 mm) Agilent column. The
analysis was performed using the mobile phase 5 mM H2SO4. The detection wavelength
was set at 880 nm using a RI RID-10A Detector with a flow rate of 0.6 mL/min and a
temperature of 60°C. The peaks quantification was performed by comparison of a range
of 6 standards.
Total lipids extraction. Total lipids are extracted according to Folch et al., 1957. About
20 mg of dried cells were homogenized with 1 mL of Chloroform/Methanol 2:1. The cells
are then lysed using a TissueLyser II (Qiagen) with an agitation of 1 minute and a
frequency of 300 s-1. The lysate is washed with 200 µl of NaCl 0.9 % and vortex for some
seconds in order to form the emulsion. The solution is centrifuged 5 min at 13000 rpm
to separate the two phases and the lower phase is placed in fresh pre-weighed glass
tubes. The upper phase is washed with chloroform; lysis and centrifugation steps are
repeated in order to recovery more lipids. The wash with chloroform is repeated at least
twice. The lower phases (containing lipids) collected in glass tubes are evaporated under
a nitrogen stream at 65°C. The glass tubes are weighed to determine the percentage of
lipids extracted per dry cell weight.
Characterisation and optimisation of mixotrophy in Phaeodactylum tricornutum
85
Separation by TLC, and Analyses by GC-FID and MS. Glycerolipids were extracted
from lipid extract of P. tricornutum cells as described in (Abida et al., 2015). To quantify
the various classes of nonpolar and polar glycerolipids, lipids were separated by TLC onto
glass-backed silica gel plates (Merck) using two distinct resolving systems (Simionato et
al., 2013). To isolate nonpolar lipids including TAG and free FA, lipids were resolved by
TLC run in one dimension with hexane:diethylether:acetic acid (70:30:1, v/v). Lipids were
recovered from the silica powder after the addition of chloroform:methanol (1:2, v/v)
thorough mixing and collection of the chloroform phase (Bligh and Dyer, 1959). Lipids
were then dried under argon and either quantified by methanolysis and GC-FID.
Metabolites extraction and GC-MS Based Metabolite Profiling. Metabolites were
extracted with some modifications of the protocol described in Obata et al 2013. Ten-
millions of cells were harvested on a Durapore-HV membrane filter disk with 2.5 cm
diameter and 0.45 μm pores (Millipore, Billerica, MA) by vacuum filtration. The filter with
the cells was then transferred into a 1.5 ml tube and frozen in liquid nitrogen. Frozen
samples were stored at −80 °C till metabolite extraction. Metabolites were extracted
immersing the filter in 1 ml of 90% (v/v) methanol containing 0.1 μg mL−1. The tubes
were sonicated in a water bath type sonicator for 1 min in the ice cold water and then
incubated at 4 degree for 1 h with shake. The remaining solution was centrifuged at
22,000 × g for 5 min at 4 °C. A 50 μL aliquot of the supernatant was used for Chla
determination and 900 μL was dried by a vacuum concentrator (SpeedVac concentrator,
Thermo, Waltham, MA). Dried samples were stored at −80 °C after filling the tubes with
argon gas. The metabolite profile was determined as described in Obata et al 2013.
Quantification of intracellular pyruvate. The concentration of pyruvate was
evaluated by fluorescence-based method using the pyruvate assay kit (Cayman
chemical).
Microarray analysis and statistics.
RNA extraction and gene expression analysis. The RNA was extracted and gene
expression was analysed as described in Fortunato et al., 2016. Total RNA was extracted
as described in Huysman et al., 2013. For RT-qPCR, 500 ng of total RNA were reverse-
Characterisation and optimisation of mixotrophy in Phaeodactylum tricornutum
86
transcribed using the QuantiTect Reverse Transcription Kit (Qiagen, USA) and the
reaction accomplished with 12.5 ng cDNA as template, following the SsoAdvanced
Universal SYBR Green Supermix instructions (Bio-Rad, USA), in a CFX 96 Real-Time
Detection System (Bio-Rad). Primer efficiencies were determined as described in Pfaffl,
2001. RPS (ribosome binding site) and/or TBP (TATAA-box binding protein) were used as
reference genes and normalization performed as described in Siaut et al., 2007.
For microarray analyses, total RNA was processed with the RNA clean-up protocol of
the RNeasy Mini Kit (Qiagen, USA). 200 ng of total RNA were labeled with fluorescent
Cy3 and Cy5 dyes using the Low Input Quick Amp Labeling Kit, Two-Color (Agilent, USA).
Three biologically independent experiments were tested for each condition, using dye
switch, and hybridized on 8x60K P. tricornutum whole-genome 60-mer oligonucleotide
microarrays (Agilent Technologies) following the Agilent protocol. The microarray chip
(Platform GPL21013) was designed based on the P. tricornutum genome, version Phatr2
(http://genome.jgi.doe.gov/Phatr2/Phatr2.home.html). Slides were scanned using a 2-
micron Agilent microarray scanner and the resulting images analyzed using the Agilent
Feature Extraction 11.5 software. Microarray normalization was performed by global
lowess using Goulphar (Lemoine et al., 2006). For each gene, the Cy5/Cy3 ratios
corresponding to the different probes were averaged and mean of the biological
replicates was calculated.
Statistical analysis. Data form three different experiments were tested for statistical
significance of the variations in gene expression. This was determined using the t-test
implemented in MeV 4.9. The three independent replicates were used to perform a one-
class analysis using a p Value of 0.01. A threshold of expression of absolute Log2 (fold
change) value > 0.8 has been used to select genes differentially expressed between the
test and the control conditions.
Characterisation and optimisation of mixotrophy in Phaeodactylum tricornutum
87
RESULTS
Consequences of mixotrophic growth on biomass production in P. tricornutum cells.
As a first step to optimise the biomass productivity of P. tricornutum, we analyzed the
effect of external reduced carbon sources on the growth and physiological properties of
cells in Erlenmeyer flasks. These culture experiments were performed in artificial
seawater (ESAW) supplemented with 10 X concentration of N and P (E10 medium), to
avoid nitrogen and phosphorous starvation during growth (Abida et al., 2015). To
identify the best respiratory substrate, we first grew P. tricornutum cells in BiologTM
plates supplemented with different carbon sources for 6 days. This allowed monitoring
biomass productivity (via OD changes) and respiration, using a specific dye (see
methods). We found that only few compounds enhanced growth of P. tricornutum cells
by increasing their respiration (Fig. 3.S1). They include acetate, serine, fumarate and
glycerol. Among them, glycerol was chosen as the final substrate, as its availability on
large scale and low cost makes it compatible with industrial cultivation (Cerón-García et
al., 2005; 2006; 2013). When tested in 50 mL erlenmeyers, glycerol increased biomass
production by a factor of 2 (Fig. 3.1A). Its effect was gradual, because of the progressive
consumption of this compound by the algae (Fig. 3.1B), and became clearly visible after
5 days of growth.
The enhanced growth capacity observed in glycerol supplemented cells resulted in a
much faster consumption of nitrogen (Fig. 3.1C) and phosphate (Fig. 3.1D), leading to a
complete depletion by the end of the growth phase.

Characterisation and optimisation of mixotrophy in Phaeodactylum tricornutum
88
Because nutrient starvation (and nitrogen in particular) affects photosynthesis (Saha
et al., 2003; Li et al., 2008), we looked for possible effects of glycerol on photosynthetic
parameters, measuring the quantum yield of PSII (Fv/Fm), the linear electron flow
between PSII and PSI (ETR), and the photoprotective responses of the cells via NPQ. We
found (Fig. 3.2), that glycerol addition had only minor effects on these parameters not
only at the beginning of the experiment (day one), but also at day five, where the
Fig. 3.1 Growth curves and nutrients consumption of P. tricornutum. A. Growth curves of Phaeodactylum tricornutum cells in N-replete and N-deplete condition in the presence/absence of
glycerol. Two different starting cell densities were used in N-replete and N-deplete condition: 106
cells/mL and 2x10⁶ cells/mL respectively. B. Glycerol consumption of P. tricornutum cells in N-replete
conditions. C. Nitrate and D. phosphate consumption kinetics in P. tricornutum cultures in N-replete condition in the presence/absence of glycerol; Each result is the average of two biological replicates ± SD. E10:N-replete condition; E0: N-deplete condition; GLY: glycerol.

Characterisation and optimisation of mixotrophy in Phaeodactylum tricornutum
89
consequences of this compound on growth become evident, as well as at the end of the
growth experiment (day 10). Thus, we conclude that glycerol has no effects on
photosynthesis. As a corollary of this experiment, we confirmed the large decrease in
photosynthesis in P. tricornutum cells upon transfer to -N, which was related to a
diminished cell content of the photosynthetic membranes (Fig. 3.S2).
Fig. 3.2. Photosynthetic activity in P. tricornutum. A. Photosynthetic efficiency represented as Fv/Fm
ratio; B. Non-photochemical quenching (NPQ) and C. Electron transport rate (ETR) of cells cultivated for 1, 5 and 10 days in N- replete or N- deplete conditions (full in both phototrophic and mixotrophic mode (black and red respectively). Each result is the average of two biological replicates ± SD. E10:N-replete condition; E0: N-deplete condition; GLY: glycerol.
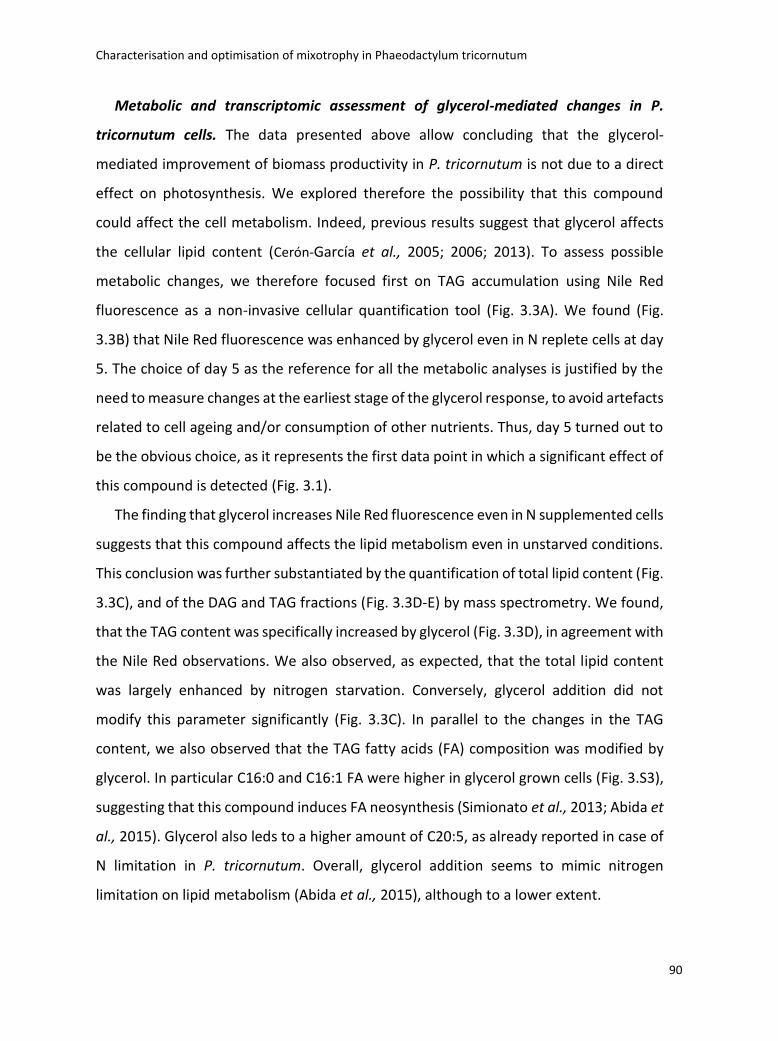
Characterisation and optimisation of mixotrophy in Phaeodactylum tricornutum
90
Metabolic and transcriptomic assessment of glycerol-mediated changes in P.
tricornutum cells. The data presented above allow concluding that the glycerol-
mediated improvement of biomass productivity in P. tricornutum is not due to a direct
effect on photosynthesis. We explored therefore the possibility that this compound
could affect the cell metabolism. Indeed, previous results suggest that glycerol affects
the cellular lipid content (Cerón-García et al., 2005; 2006; 2013). To assess possible
metabolic changes, we therefore focused first on TAG accumulation using Nile Red
fluorescence as a non-invasive cellular quantification tool (Fig. 3.3A). We found (Fig.
3.3B) that Nile Red fluorescence was enhanced by glycerol even in N replete cells at day
5. The choice of day 5 as the reference for all the metabolic analyses is justified by the
need to measure changes at the earliest stage of the glycerol response, to avoid artefacts
related to cell ageing and/or consumption of other nutrients. Thus, day 5 turned out to
be the obvious choice, as it represents the first data point in which a significant effect of
this compound is detected (Fig. 3.1).
The finding that glycerol increases Nile Red fluorescence even in N supplemented cells
suggests that this compound affects the lipid metabolism even in unstarved conditions.
This conclusion was further substantiated by the quantification of total lipid content (Fig.
3.3C), and of the DAG and TAG fractions (Fig. 3.3D-E) by mass spectrometry. We found,
that the TAG content was specifically increased by glycerol (Fig. 3.3D), in agreement with
the Nile Red observations. We also observed, as expected, that the total lipid content
was largely enhanced by nitrogen starvation. Conversely, glycerol addition did not
modify this parameter significantly (Fig. 3.3C). In parallel to the changes in the TAG
content, we also observed that the TAG fatty acids (FA) composition was modified by
glycerol. In particular C16:0 and C16:1 FA were higher in glycerol grown cells (Fig. 3.S3),
suggesting that this compound induces FA neosynthesis (Simionato et al., 2013; Abida et
al., 2015). Glycerol also leds to a higher amount of C20:5, as already reported in case of
N limitation in P. tricornutum. Overall, glycerol addition seems to mimic nitrogen
limitation on lipid metabolism (Abida et al., 2015), although to a lower extent.
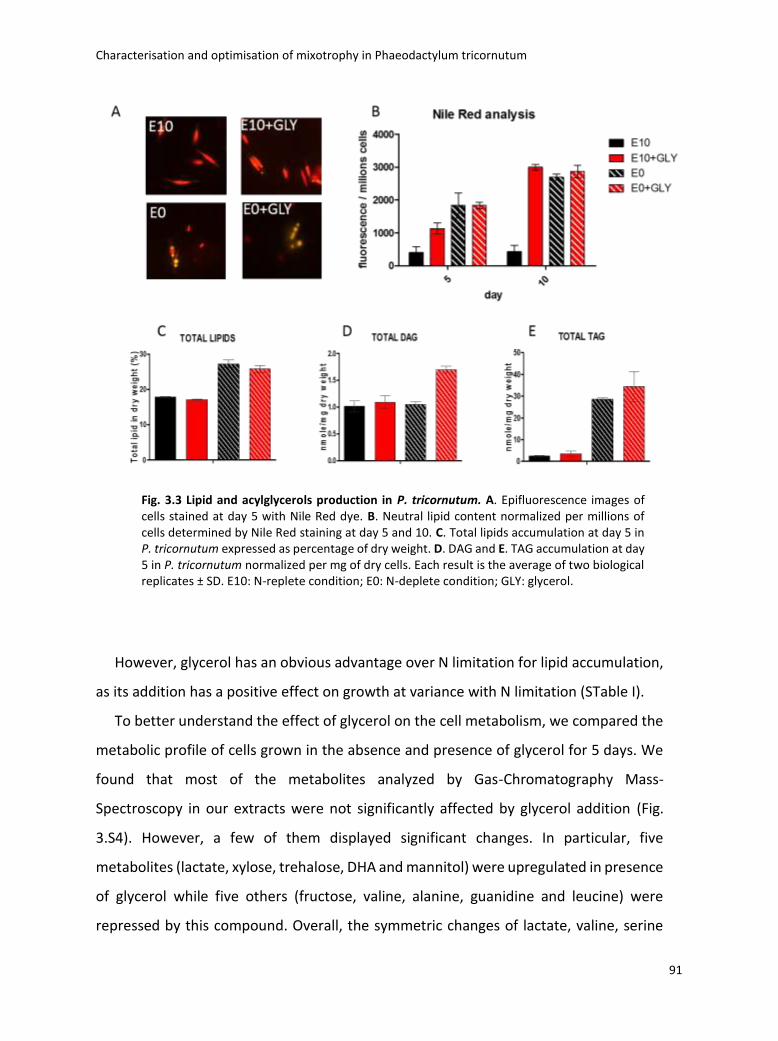
Characterisation and optimisation of mixotrophy in Phaeodactylum tricornutum
91
However, glycerol has an obvious advantage over N limitation for lipid accumulation,
as its addition has a positive effect on growth at variance with N limitation (STable I).
To better understand the effect of glycerol on the cell metabolism, we compared the
metabolic profile of cells grown in the absence and presence of glycerol for 5 days. We
found that most of the metabolites analyzed by Gas-Chromatography Mass-
Spectroscopy in our extracts were not significantly affected by glycerol addition (Fig.
3.S4). However, a few of them displayed significant changes. In particular, five
metabolites (lactate, xylose, trehalose, DHA and mannitol) were upregulated in presence
of glycerol while five others (fructose, valine, alanine, guanidine and leucine) were
repressed by this compound. Overall, the symmetric changes of lactate, valine, serine
Fig. 3.3 Lipid and acylglycerols production in P. tricornutum. A. Epifluorescence images of cells stained at day 5 with Nile Red dye. B. Neutral lipid content normalized per millions of cells determined by Nile Red staining at day 5 and 10. C. Total lipids accumulation at day 5 in P. tricornutum expressed as percentage of dry weight. D. DAG and E. TAG accumulation at day 5 in P. tricornutum normalized per mg of dry cells. Each result is the average of two biological replicates ± SD. E10: N-replete condition; E0: N-deplete condition; GLY: glycerol.
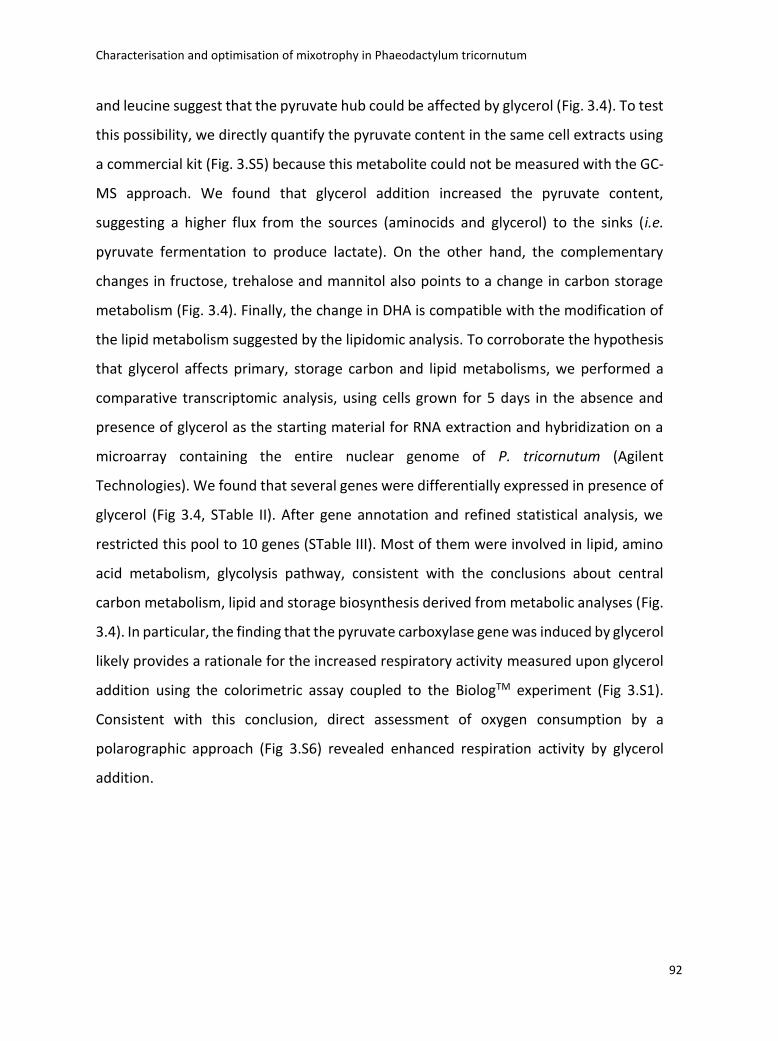
Characterisation and optimisation of mixotrophy in Phaeodactylum tricornutum
92
and leucine suggest that the pyruvate hub could be affected by glycerol (Fig. 3.4). To test
this possibility, we directly quantify the pyruvate content in the same cell extracts using
a commercial kit (Fig. 3.S5) because this metabolite could not be measured with the GC-
MS approach. We found that glycerol addition increased the pyruvate content,
suggesting a higher flux from the sources (aminocids and glycerol) to the sinks (i.e.
pyruvate fermentation to produce lactate). On the other hand, the complementary
changes in fructose, trehalose and mannitol also points to a change in carbon storage
metabolism (Fig. 3.4). Finally, the change in DHA is compatible with the modification of
the lipid metabolism suggested by the lipidomic analysis. To corroborate the hypothesis
that glycerol affects primary, storage carbon and lipid metabolisms, we performed a
comparative transcriptomic analysis, using cells grown for 5 days in the absence and
presence of glycerol as the starting material for RNA extraction and hybridization on a
microarray containing the entire nuclear genome of P. tricornutum (Agilent
Technologies). We found that several genes were differentially expressed in presence of
glycerol (Fig 3.4, STable II). After gene annotation and refined statistical analysis, we
restricted this pool to 10 genes (STable III). Most of them were involved in lipid, amino
acid metabolism, glycolysis pathway, consistent with the conclusions about central
carbon metabolism, lipid and storage biosynthesis derived from metabolic analyses (Fig.
3.4). In particular, the finding that the pyruvate carboxylase gene was induced by glycerol
likely provides a rationale for the increased respiratory activity measured upon glycerol
addition using the colorimetric assay coupled to the BiologTM experiment (Fig 3.S1).
Consistent with this conclusion, direct assessment of oxygen consumption by a
polarographic approach (Fig 3.S6) revealed enhanced respiration activity by glycerol
addition.
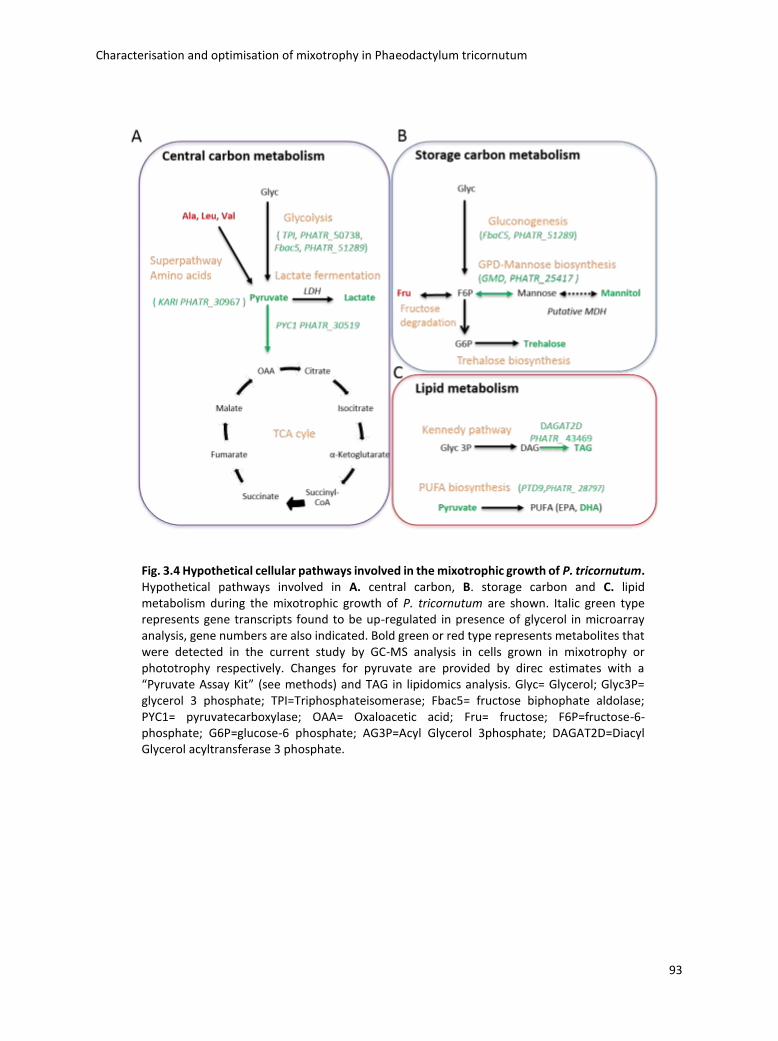
Characterisation and optimisation of mixotrophy in Phaeodactylum tricornutum
93
Fig. 3.4 Hypothetical cellular pathways involved in the mixotrophic growth of P. tricornutum. Hypothetical pathways involved in A. central carbon, B. storage carbon and C. lipid metabolism during the mixotrophic growth of P. tricornutum are shown. Italic green type represents gene transcripts found to be up-regulated in presence of glycerol in microarray analysis, gene numbers are also indicated. Bold green or red type represents metabolites that were detected in the current study by GC-MS analysis in cells grown in mixotrophy or phototrophy respectively. Changes for pyruvate are provided by direc estimates with a “Pyruvate Assay Kit” (see methods) and TAG in lipidomics analysis. Glyc= Glycerol; Glyc3P= glycerol 3 phosphate; TPI=Triphosphateisomerase; Fbac5= fructose biphophate aldolase; PYC1= pyruvatecarboxylase; OAA= Oxaloacetic acid; Fru= fructose; F6P=fructose-6-phosphate; G6P=glucose-6 phosphate; AG3P=Acyl Glycerol 3phosphate; DAGAT2D=Diacyl Glycerol acyltransferase 3 phosphate.
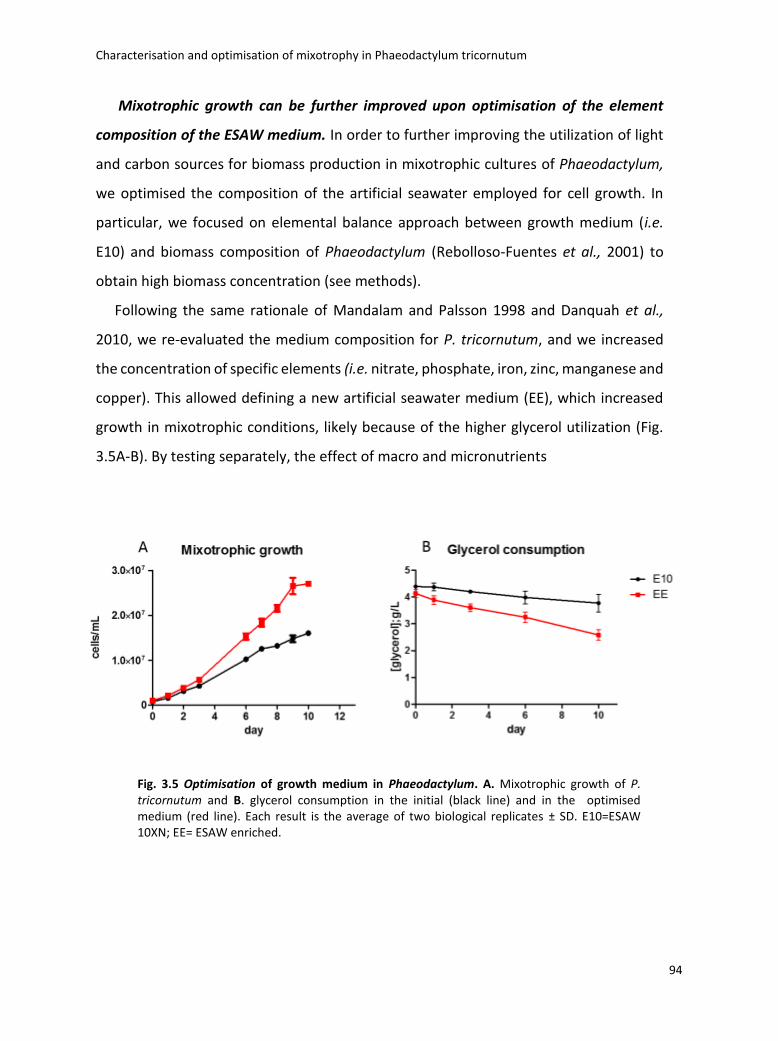
Characterisation and optimisation of mixotrophy in Phaeodactylum tricornutum
94
Mixotrophic growth can be further improved upon optimisation of the element
composition of the ESAW medium. In order to further improving the utilization of light
and carbon sources for biomass production in mixotrophic cultures of Phaeodactylum,
we optimised the composition of the artificial seawater employed for cell growth. In
particular, we focused on elemental balance approach between growth medium (i.e.
E10) and biomass composition of Phaeodactylum (Rebolloso-Fuentes et al., 2001) to
obtain high biomass concentration (see methods).
Following the same rationale of Mandalam and Palsson 1998 and Danquah et al.,
2010, we re-evaluated the medium composition for P. tricornutum, and we increased
the concentration of specific elements (i.e. nitrate, phosphate, iron, zinc, manganese and
copper). This allowed defining a new artificial seawater medium (EE), which increased
growth in mixotrophic conditions, likely because of the higher glycerol utilization (Fig.
3.5A-B). By testing separately, the effect of macro and micronutrients
Fig. 3.5 Optimisation of growth medium in Phaeodactylum. A. Mixotrophic growth of P. tricornutum and B. glycerol consumption in the initial (black line) and in the optimised medium (red line). Each result is the average of two biological replicates ± SD. E10=ESAW 10XN; EE= ESAW enriched.
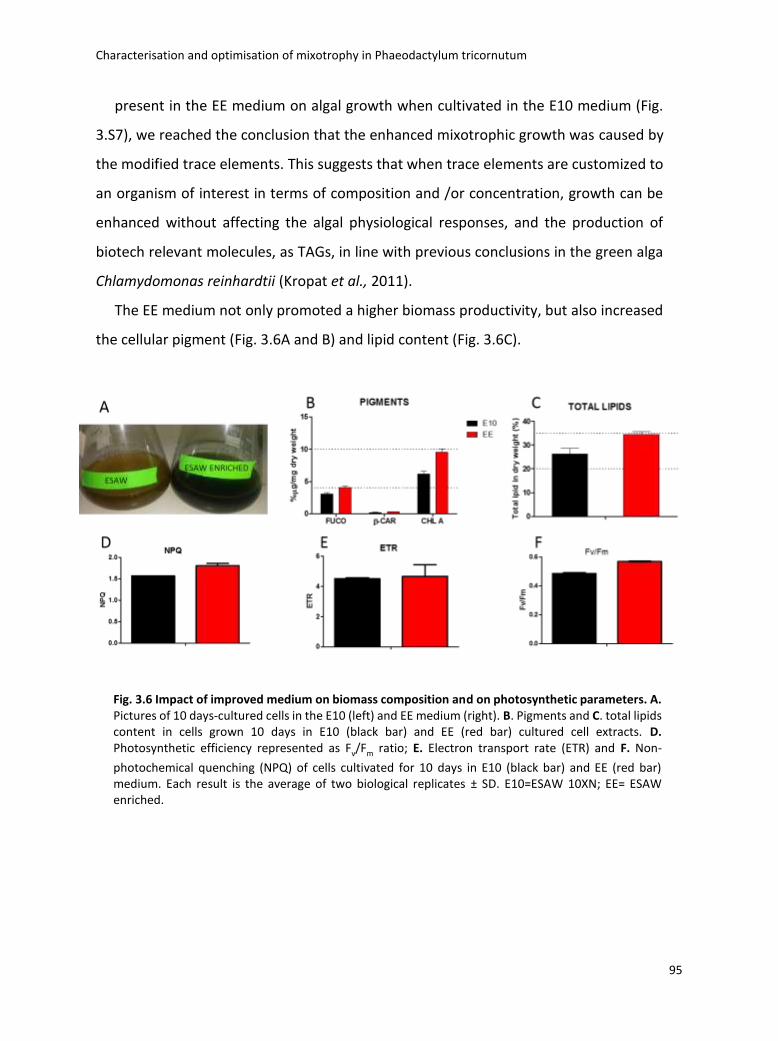
Characterisation and optimisation of mixotrophy in Phaeodactylum tricornutum
95
present in the EE medium on algal growth when cultivated in the E10 medium (Fig.
3.S7), we reached the conclusion that the enhanced mixotrophic growth was caused by
the modified trace elements. This suggests that when trace elements are customized to
an organism of interest in terms of composition and /or concentration, growth can be
enhanced without affecting the algal physiological responses, and the production of
biotech relevant molecules, as TAGs, in line with previous conclusions in the green alga
Chlamydomonas reinhardtii (Kropat et al., 2011).
The EE medium not only promoted a higher biomass productivity, but also increased
the cellular pigment (Fig. 3.6A and B) and lipid content (Fig. 3.6C).
Fig. 3.6 Impact of improved medium on biomass composition and on photosynthetic parameters. A. Pictures of 10 days-cultured cells in the E10 (left) and EE medium (right). B. Pigments and C. total lipids content in cells grown 10 days in E10 (black bar) and EE (red bar) cultured cell extracts. D. Photosynthetic efficiency represented as Fv/Fm ratio; E. Electron transport rate (ETR) and F. Non-
photochemical quenching (NPQ) of cells cultivated for 10 days in E10 (black bar) and EE (red bar) medium. Each result is the average of two biological replicates ± SD. E10=ESAW 10XN; EE= ESAW enriched.
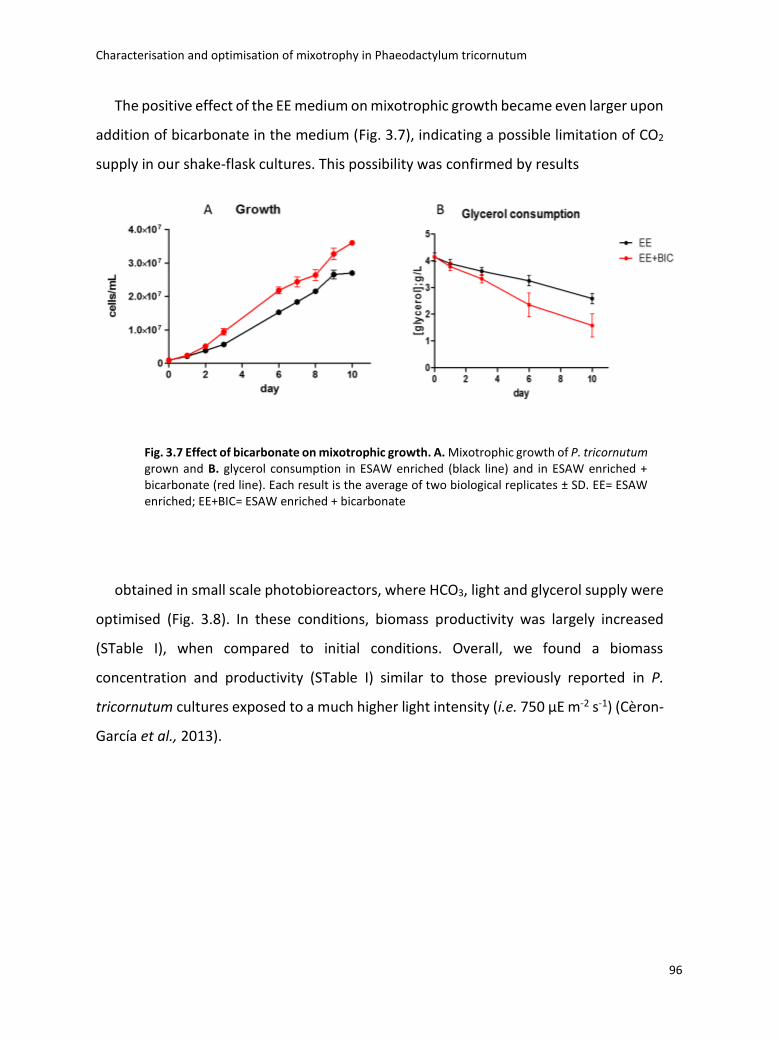
Characterisation and optimisation of mixotrophy in Phaeodactylum tricornutum
96
The positive effect of the EE medium on mixotrophic growth became even larger upon
addition of bicarbonate in the medium (Fig. 3.7), indicating a possible limitation of CO2
supply in our shake-flask cultures. This possibility was confirmed by results
obtained in small scale photobioreactors, where HCO3, light and glycerol supply were
optimised (Fig. 3.8). In these conditions, biomass productivity was largely increased
(STable I), when compared to initial conditions. Overall, we found a biomass
concentration and productivity (STable I) similar to those previously reported in P.
tricornutum cultures exposed to a much higher light intensity (i.e. 750 µE m-2 s-1) (Cèron-
García et al., 2013).
Fig. 3.7 Effect of bicarbonate on mixotrophic growth. A. Mixotrophic growth of P. tricornutum grown and B. glycerol consumption in ESAW enriched (black line) and in ESAW enriched + bicarbonate (red line). Each result is the average of two biological replicates ± SD. EE= ESAW enriched; EE+BIC= ESAW enriched + bicarbonate
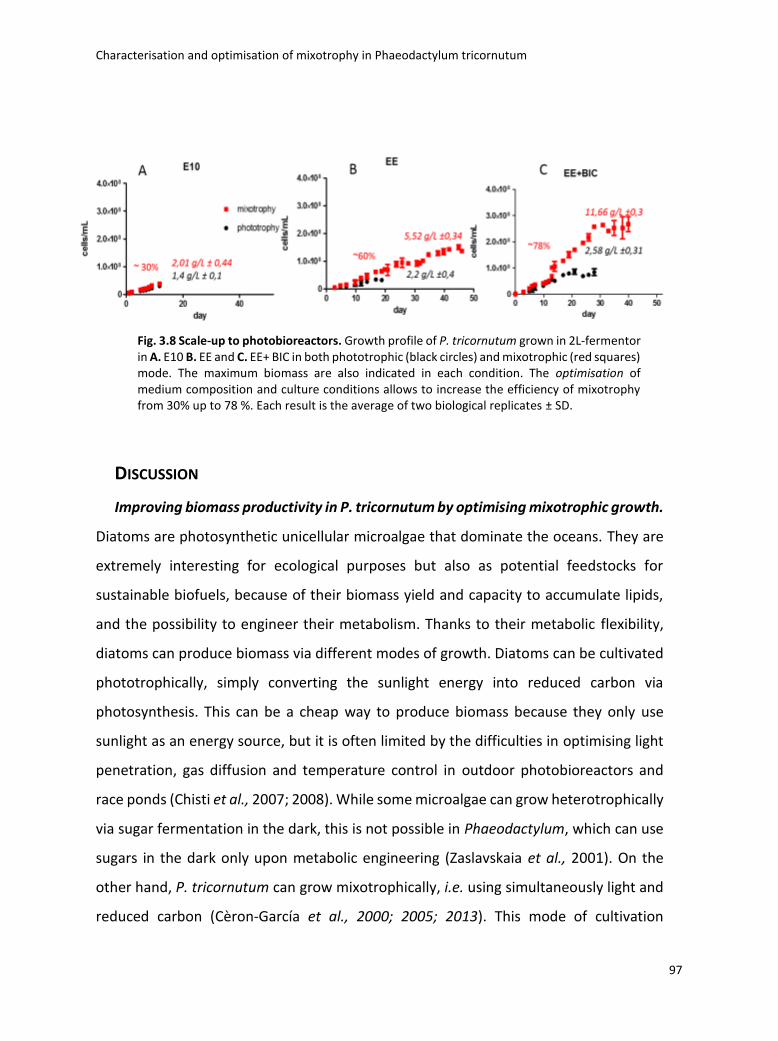
Characterisation and optimisation of mixotrophy in Phaeodactylum tricornutum
97
DISCUSSION
Improving biomass productivity in P. tricornutum by optimising mixotrophic growth.
Diatoms are photosynthetic unicellular microalgae that dominate the oceans. They are
extremely interesting for ecological purposes but also as potential feedstocks for
sustainable biofuels, because of their biomass yield and capacity to accumulate lipids,
and the possibility to engineer their metabolism. Thanks to their metabolic flexibility,
diatoms can produce biomass via different modes of growth. Diatoms can be cultivated
phototrophically, simply converting the sunlight energy into reduced carbon via
photosynthesis. This can be a cheap way to produce biomass because they only use
sunlight as an energy source, but it is often limited by the difficulties in optimising light
penetration, gas diffusion and temperature control in outdoor photobioreactors and
race ponds (Chisti et al., 2007; 2008). While some microalgae can grow heterotrophically
via sugar fermentation in the dark, this is not possible in Phaeodactylum, which can use
sugars in the dark only upon metabolic engineering (Zaslavskaia et al., 2001). On the
other hand, P. tricornutum can grow mixotrophically, i.e. using simultaneously light and
reduced carbon (Cèron-García et al., 2000; 2005; 2013). This mode of cultivation
Fig. 3.8 Scale-up to photobioreactors. Growth profile of P. tricornutum grown in 2L-fermentor in A. E10 B. EE and C. EE+ BIC in both phototrophic (black circles) and mixotrophic (red squares) mode. The maximum biomass are also indicated in each condition. The optimisation of medium composition and culture conditions allows to increase the efficiency of mixotrophy from 30% up to 78 %. Each result is the average of two biological replicates ± SD.
Characterisation and optimisation of mixotrophy in Phaeodactylum tricornutum
98
represents an interesting alternative to phototrophic growth, because algae grown
mixotrophycally have, in principle, a lower requirement for optimum light penetration,
and can make use of cheap and easily available carbon sources, like glycerol, leading to
a high biomass productivity (Cèron-García et al., 2000; 2005; 2013).
Starting from these general considerations, the first goal of this work was to optimise
the simultaneous use of light, CO2 and reduced carbon in mixotrophically grown
Phaeodactylum cells. For this purpose we optimise an artificial seawater based growth
medium (ESAW) by implementing both the macronutrient (phosphate and nitrogen) and
the micronutrient (trace metal elements) components. Eventually, we generated the EE
medium, where biomass productivity was enhanced by a factor of 2 when compared to
the E10 medium (Fig. 3.6). This medium contains 10 times higher concentrations of
phosphate and nitrogen (0.467 g/L of NaNO3 and 0.03 g/L of NaH2PO4.H20) to avoid N or
P depletion during growth. By assessing the consequences of the different fractions of
the EE medium on growth, we demonstrated that changes in the trace metal
components are mostly responsible for the positive effects of the EE on Phaeodactylum,
in agreement with earlier results obtained in different groups of microalgae (Kropat et.
al., 2011; Danquad et al., 2010).
When Phaeodactylum cells are grown in the EE medium, not only the cell number is
increased, but also the quality of the biomass is improved, as indicated by the increased
pigment and lipid content per dry weight. This likely reflects the better physiological
state of the cells in the EE cultures, as suggested by their higher content of triradiate
cells, when compared to ESAW 10X driven cultures (fig. 3.S8). P. tricornutum is a
pleiomorphic alga that displays three major morphotypes: the fusiform, the oval, and
the triradiate one. The first two represent the “normal” and the “stress” morphotype, as
deduced by studies on the responses to temperature or salinity stress (De Martino et al.,
2007). Conversely, the latter form is very rarely observed in laboratory cultures, but is
the most abundant one in the ocean. Therefore, it likely represents the truly
physiological state of the alga.
Characterisation and optimisation of mixotrophy in Phaeodactylum tricornutum
99
In the EE medium we also observed that HCO3 largely increased mixotrophic growth.
This observation can be explained based on our previous observation that
photosynthesis and respiration are tightly linked in diatoms via the active exchange of
reducing power and ATP to optimise carbon assimilation (Bailleul et al., 2015). In the
frame of this hypothesis, one may expect that when photosynthesis is no longer limited
by CO2 availability (i.e. in the presence of external bicarbonate in our case) a higher
amount of ATP is generated by mitochondria. This would be needed for CO2 assimilation,
thus leading to a high respiratory activity and consumption of reduced carbon. In line
with this idea, recent modelling of mixotrophic metabolism ± CO2 based on flux balance
analysis of P. tricornutum (Kim et al., 2015) has suggested that the ATP flux through
mitochondria is around 1.2 times higher than the flux in the plastid. This “extra capacity”
could fulfill the need for “extra” ATP for carbon assimilation, which we estimated in the
range of 10-15% (Bailleul et al., 2015) in P. tricornutum.
On the other hand, another possibility was considered by the authors, namely that
the transport of reductants from the chloroplast to the mitochondria could not only
provide a benefit for the cell energy balance, but also provide carbon skeletons for
anabolic activity. Some of our observation support this conclusion. We found that while
oxygen uptake is stimulated in all conditions by addition of glycerol, indicating enhanced
respiration, photosynthesis is only enhanced when bicarbonate is added. This indicates
that external reduced carbon can be used in different modes depending on limitation of
the photosynthetic performances of the alga and in particular for anabolic purposes.
Metabolic consequences of glycerol mediated mixotrophic growth. Our
characterization of mixotrophy in diatoms also includes the investigation of the
metabolic consequences of glycerol addition on the cells, via metabolomic and
transcriptomic analysis. The glycerol metabolism of P. tricornutum was previously
investigated by isotope labelling experiments using 13C-glycerol as carbon source (Zheng
et al., 2013; Huang et al., 2015). These studies conclude that under mixotrophic
conditions P. tricornutum cells mostly convert this compound into glycine and serine.
Characterisation and optimisation of mixotrophy in Phaeodactylum tricornutum
100
This stems from enhanced conversion of glyoxylate via the photorespiratory
alanine/glyoxylate aminotransferase and serine hydroxymethyltransferase enzymes
(Zhen et al., 2013; Kim et al., 2015). In our analysis no significant changes in the serine
and glycine cellular content were seen, while other amino acids show significant
modifications upon glycerol addition. A possible explanation for this apparent
contradiction is that the authors of these studies specifically focused on mixotrophic
growth cells, where serine and glycine are synthesised from glycerol. Conversely, we
compared phototrophically and mixotrophically grown cells. Therefore, it appears that
while both phototrophy and mixotrophy lead to production of glycine and serine via
photorespiration, the efficiency rate of this metabolic path is not specifically enhanced
by glycerol addition.
On the other hand, the combination of omics analyses (lipidomics, transcriptomics
and metabolomics) employed here pinpoint several metabolic changes, which are
specifically induced by glycerol driven mixotrophy. They include changes in central-
carbon, carbon-storage and lipid metabolisms in Phaeodactylum (Fig. 3.4). Overall, we
propose a model in which glycerol is firstly degraded to the dihydroxyacetone
phosphate (DHAP) via glycerol-3-phosphate (gly 3P) by a glycerol kinase and a glycerol-
3-P dehydrogenase. Then, the DHAP enters into glycolysis pathway, consistent with the
overexpression of two enzymes in the microarray analysis (i.e. TPI, PHATR_50738 and
Fbac5, PHATR_51289). At the same time, the level of pyruvate (i.e. end-product of
glycolysis) increases, likely because of the enhanced flux from the amino acids alanine,
leucine, and valine (Fig. 3.4). The changes in the pyruvate metabolic hub affect several
metabolic pathways. First, we see that glycerol enhances pyruvate fermentation to
lactate via lactic dehydrogenase (i.e. LDH). However, pyruvate can also converted by the
pyruvate carboxylase to oxaloacetic acid and enter the TCA cycle, as shown by the
increased respiratory rate, and by the upregulation of the pyruvate carboxylase enzyme
(i.e. PYC1, PHATR_30519). According to our data, glycerol can also be converted to
fructose-6-phosphate (F6P) and glucose-6-phosphate (G6P) via gluconeogenesis. These
sugars can be transformed into carbon storage carbohydrates, as observed here in the
Characterisation and optimisation of mixotrophy in Phaeodactylum tricornutum
101
case of trehalose and mannitol. This finding is particularly interesting because it suggests
that besides chrysolaminarin (1,3-β-D-glucan), which are the most abundant storage
form of sugars in diatoms (Kroth et al., 2008), P. tricornutum can accumulate other
storage sugars. Consistent with this, P. tricornutum possesses a complete set of enzymes
for synthesis of trehalose and mannose and we observe in our analysis that one of them
was up-regulated by glycerol (i.e. GDP-mannose 4,6-dehydratase, PHATR_25417).
Moreover, we identified a putative mannitol dehydrogenase in the genome of
Phaeodactylum (i.e. PHATH_30246) that is involved in the conversion of the mannose
into mannitol. This gene showed some homologies (c. 37, 2%) with the mannose
dehydrogenase enzyme M1PDH from the brown algae Ectocarpus siliculosus. Both the
trehalose and mannitol pathway have been already identified in brown algae, where
they seem to be inherited by red algal progenitor and lateral gene transfer from
Actinobacteria respectively (Michel at al. 2010). Thus, it is reasonable to assume that a
similar situation may be present in P. tricornutum.
Finally, glycerol addition also affects the lipid metabolism, consistent with previous
reports (Cèron-García et al., 2006). In particular, our analysis indicates that its addition
enhances both the PUFA (i.e. DHA) and TAG production, as evidenced by the
metabolomics and lipidomics analysis, respectively. These conclusions are also
corroborated by our microarray analysis, which reveals an up-regulation of the fatty
acids desaturases PTD9 (PHATR_ 28797) as well as the acetyl-transferase DAGAT2D
(PHATR_ 43469) involved in the PUFA and TAG biosynthesis respectively. Moreover, our
analysis of the fatty acids composition of TAGs in glycerol treated cells also suggests that
their accumulation is due to neosynthesis but also to some degradation of pre-existing
membrane lipids. In general, TAGs can be produced by two main routes in a cell: i. de
novo synthesis of fresh fatty acids directly incorporated into TAGs via the Kennedy
pathway or ii. conversion of preexisting polar glycerolipids (Li-Beisson et al., 2013). TAGs
generated by the first route contain newly generated fatty acids, i.e., high levels of C16:0
and C16:1 fatty acids. Conversely, TAGs obtained from recycling of membrane lipids
contain fatty acids with a substantial proportion of elongated and polyunsaturated
Characterisation and optimisation of mixotrophy in Phaeodactylum tricornutum
102
molecular species such as C20:5 fatty acids. Our data indicate that glycerol-grown cells
contain a higher amount of 16:0 and 16:1 fatty acids, consistent with the occurrence of
neosynthesis. However, this compound also leads to an increased accumulation of C20:5
fatty acids, consistent with the occurrence of some membrane lipids turnover. This
behavior is very similar to the one observed in P. tricornutum cells upon exposure to
nutrient (nitrogen) starvation.
However, at variance with N limited cells, glycerol, supplemented do not display any
i. significant degradation of the most abundant thylakoids lipids, i.e. MGDG and DGDG
(fig. 3.S9), and ii. any loss of photosynthetic activity. Thus, although the consequences of
glycerol addition of lipids are reminding of those of nitrogen starvation (Abida et al.,
2015) in terms of TAG accumulation and changes in the fatty acids profile, this compound
seems to act mainly at the level of lipid biosynthesis than degradation.
CONCLUSIONS
This work highlights the potential of mixotrophic growth for biotechnology
applications. Indeed this growth mode can largely enhances biomass productivity, using
available carbon sources. This mode of growth also has advantages in terms of lipid
accumulation, as glycerol reproduces some typical response of nitrogen limited cells, in
terms of TAG accumulation and fatty acids composition. Moreover, it does not diminish
(and in some cases increase) photosynthetic activity (at variance with nitrogen
limitation). However, another economic aspect that has to be taken into account is the
additional cost of organic carbon supplementation. To solve this problem wastewater
and biodiesel waste (i.e. glycerol) can be used for the industrial exploitation of
microalgae. Interestingly we show that the optimised medium (i.e. by implementing
micronutrients/HCO3 supply) largely enhances mixotrophy and allows to reach state of
the art productivity levels also in the presence of relatively low light intensities, when
compared to previous experiments (≤300µE, this work vs 750 µE, Cèron-García et al.,
Characterisation and optimisation of mixotrophy in Phaeodactylum tricornutum
103
2013). This also shows the potential of this approach in terms of the reduction of the
energy input required for high biomass productivity.
Finally, our deep characterization of mixotrophic metabolism reveals the main
metabolic pathways targeted by glycerol. This information indicates possible targets for
metabolic engineering, to enhance the efficiency of this phenomenon. Typically,
inhibition of the biosynthesis of storage carbohydrates (i.e. trehalose and mannitol)
could potentially direct the carbon (derived from glycerol) towards TAG production (as
already reported in the case of the main sugar storage polymer, chrysolaminarin in
Daboussi et al., 2014). Ongoing integration of our data into a mathematical model will
reveal other possible target to further increase the algal production capabilities.
Characterisation and optimisation of mixotrophy in Phaeodactylum tricornutum
104
REFERENCES
Abida, H. et al., Membrane Glycerolipid Remodeling Triggered by Nitrogen and
Phosphorus Starvation in Phaeodactylum tricornutum. Plant Physiol. 167, 118–36 (2015).
Balat, M. & Balat, H. A critical review of bio-based diesel as avehicular fuel. Energiy
Convers. Manag. 49, 2727–2741 (2008).
Berges, J. A., Franklin, D. J. & Harrison, P. J. Evolution of an artificial seawater medium:
Improvements in enriched seawater, artificial water over the last two decades. J. Phycol.
37, 1138–1145 (2001).
Bligh, E. G. & Dyer, W. J. A rapid method of total lipid extraction and purification. Can. J.
Biochem. Physiol. 37, 911–917 (1959).
Cèron-García C M, Fernández Sevilla, J., Acién Fernández, F., Molina Grima, E. & García
Camacho, F. Mixotrophic growth of Phaeodactylum tricornutum on glycerol: growth rate
and fatty acid profile. J. Appl. Phycol. 12, 239–248 (2000).
Cèron-García C M, Fernández-Sevilla J, Sánchez-Mirón A, García-Camacho F, Contreras-
Gómez A, Molina-Grima E. Mixotrophic production of marine microalga Phaeodactylum
tricornutum on various carbon sources. J. Microbiol. Biotechnol. 16, 689–694 (2006).
Cèron-García C M, Fernández-Sevilla J, Sánchez-Mirón A, García-Camacho F, Contreras-
Gómez A, Molina-Grima E. Mixotrophic growth of Phaeodactylum tricornutum on fructose
and glycerol in fed-batch and semi-continuous modes. Bioresource Technology 147, 569-
576 (2013).
Cèron-García C M, Sánchez Mirón, A., Fernández Sevilla, J. M., Molina Grima, E. & García
Camacho, F. Mixotrophic growth of the microalga Phaeodactylum tricornutum: Influence
Characterisation and optimisation of mixotrophy in Phaeodactylum tricornutum
105
of different nitrogen and organic carbon sources on productivity and biomass composition.
Process Biochem. 40, 297- 305 (2005).
Chen, G.-Q. & Chen, F. Growing phototrophic cells without light. Biotechnol. Lett. 28,
607–616 (2006).
Chi, Z., O’Fallon, J. V. & Chen, S. Bicarbonate produced from carbon capture for algae
culture. Trends in Biotechnology 29, 537–541 (2011).
Chisti, Y. Biodiesel from microalgae beats bioethanol. Trends Biotechnol. 26, 126–131
(2008).
Chisti, Y. Biodiesel from microalgae. Biotechnology Advances 25(3), 294-306 (2007).
Daboussi F., Leduc S, Maréchal A, Dubois G, Guyot V, Perez-Michaut C, Amato A,
Falciatore A, Juillerat A, Beurdeley M, Voytas D, Cavarec L, Duchateau P. Genome
engineering empowers the diatom Phaeodactylum tricornutum for biotechnology. Nat.
Commun. 5, 3831 (2014).
Danquah, M. K., R. Harun, R. H. Cultivation Medium Design Via Elemental Balancing for
Tetraselmis suecisa. Chem. Biochem. Eng. 24, 361–369 (2010).
De Martino, A. , Meichenin, A., Shi, J., Pan, K. & Bowler, C. Genetic and phenotypic
characterization of Phaeodactylum tricornutum (Bacillariophyceae) accessions. J. Phycol.
(2007). doi:10.1111/j.1529-8817.2007.00384.x
Folch, J., Less, M. & Sloane Stanley, G. H. A simple method for the isolation and
purification of total lipides from animal tissues. J. Biol. Chem. 226, 497–509 (1957).
Gardner, R. D. et al., Use of sodium bicarbonate to stimulate triacylglycerol
accumulation in the chlorophyte Scenedesmus sp. and the diatom Phaeodactylum
tricornutum. J. Appl. Phycol. 24, 1311–1320 (2012).
Characterisation and optimisation of mixotrophy in Phaeodactylum tricornutum
106
Hellebust, J. A. Glucose uptake by Cyclotella cryptica: dark induction and light
inactivation of transport system. J. Phycol. 7, 345–349 (1971).
Hutchins, D. a., DiTullio, G. R., Zhang, Y. & Bruland, K. W. An iron limitation mosaic in the
California upwelling regime. Limnol. Oceanogr. 43, 1037–1054 (1998).
Huysman, M. J. J. et al., AUREOCHROME1a-Mediated Induction of the Diatom-Specific
Cyclin dsCYC2 Controls the Onset of Cell Division in Diatoms (Phaeodactylum tricornutum).
Plant Cell Online 25, 215–228 (2013).
Huysman, M.J., et al., (2013). AUREOCHROME1a-mediated induction of the diatom-
specific cyclin dsCYC2 controls the onset of cell division in diatoms (Phaeodactylum
tricornutum). Plant Cell 25, 215–228 (2013).
Jia, J. et al., Molecular mechanisms for photosynthetic carbon partitioning into storage
neutral lipids in Nannochloropsis oceanica under nitrogen-depletion conditions. Algal Res.
7, 66–77 (2015).
Johnson, X. et al., A new setup for in vivo fluorescence imaging of photosynthetic
activity.
Kim, J. et al., Flux balance analysis of primary metabolism in the diatom Phaeodactylum
tricornutum. Plant J. (2015). doi:10.1111/tpj.13081
Kitano, M., Matsukawa, R. & Karube, I. Changes in eicosapentaenoic acid content of
Navicula saprophila, Rhodomonas salina and Nitzschia sp. under mixotrophic conditions. J.
Appl. Phycol. (1997). doi:10.1023/A:1007908618017
Kropat, J. et al., A revised mineral nutrient supplement increases biomass and growth
rate in Chlamydomonas reinhardtii. Plant J. 66, 770–780 (2011).
Characterisation and optimisation of mixotrophy in Phaeodactylum tricornutum
107
Kroth, P. G. et al., A model for carbohydrate metabolism in the diatom Phaeodactylum
tricornutum deduced from comparative whole genome analysis. PLoS One 3, e1426 (2008).
Kumar, A. et al., Enhanced CO2 fixation and biofuel production via microalgae: Recent
developments and future directions. Trends in Biotechnology 28, 371–380 (2010).
Lechner, C. C. & Becker, C. F. W. Silaffins in silica biomineralization and biomimetic silica
precipitation. Marine Drugs 13, 5297–5333 (2015).
Lemoine, S., Combes, F., Servant, N., and Le Crom, S.. Goulphar: rapid access and
expertise for standard two-color microarray normalization methods. BMC Bioinformatics
7, 467 (2006).
Lewin, J. C. & Lewin, R. A. Auxotrophy and heterotrophy in marine littoral diatoms. Can.
J. Microbiol 6, 127–134 (1960).
Li, Y., Horsman, M., Wang, B., Wu, N., and Lan, C. Q.. Effects of nitrogen sources on cell
growth and lipid accumulation of green alga Neochloris oleoabundans.Appl. Microbiol.
Biotechnol 81, 629–636 (2008). doi:10.1007/s00253-008-1681-1
Li-Beisson, Y. et al., Acyl-lipid metabolism. Arabidopsis Book 11, e0133 (2013).
Liu X, Duan S, Li A, Xu N, Cai Z, Hu Z. Effects of organic carbon sources on growth,
photosynthesis, and respiration of Phaeodactylum tricornutum. Journal of Applied
Phycology 21, 239-246 (2009).
Mandalam, R. K. & Palsson, B. Ø. Elemental balancing of biomass and medium
composition enhances growth capacity in high-density Chlorella vulgaris cultures.
Biotechnol. Bioeng 59, 605–611 (1998).
Maxwell, K. & Johnson, G. N. Chlorophyll fluorescence--a practical guide. J. Exp. Bot. 51,
659–668 (2000).
Characterisation and optimisation of mixotrophy in Phaeodactylum tricornutum
108
Michel, G., Tonon, T., Scornet, D., Cock, J. M. & Kloareg, B. Central and storage carbon
metabolism of the brown alga Ectocarpus siliculosus: Insights into the origin and evolution
of storage carbohydrates in Eukaryotes. New Phytol. (2010). doi:10.1111/j.1469-
8137.2010.03345.x
Parkinson, J. & Gordon, R. Beyond micromachining: The potential of diatoms. Trends in
Biotechnology 17, 190–196 (1999).
Pfaffl, M. W. A new mathematical model for relative quantification in real-time RT–PCR.
Nucleic Acids Res. 29, e45 (2001).
Pfaffl, M.W.. A new mathematical model for relative quantification in real-time RT-PCR.
Nucleic Acids Res. 29: e45.(2001).
Rebolloso-Fuentes, M. M., Navarro-Pérez, A., García-Camacho, F., Ramos-Miras, J. J. &
Guil-Guerrero, J. L. Biomass nutrient profiles of the microalga Phaeodactylum tricornutum.
J. Agric. Food Chem. (2001). doi:10.1021/jf0010376
Saha, S. K., Uma, L., and Subramanian, G.. Nitrogen stress induced changes in the marine
cyanobacteriumOscillatoria willeiBDU 130511. FEMS Microbiol. Ecol. 45, 263–272 (2003).
doi:10.1016/S0168-6496(03)00162-4
San Pedro, A., Gonzalez-Lopez, C. V., Acien, F. G. & Molina-Grima, E. Outdoor pilot-scale
production of Nannochloropsis gaditana: Influence of culture parameters and lipid
production rates in tubular photobioreactors. Bioresour. Technol. 169, 667–676 (2014).
Siaut, M., Heijde, M., Mangogna, M., Montsant, A., Coesel, S., Allen, A., Manfredonia,
A., Falciatore, A., and Bowler, C. Molecular toolbox for studying diatom biology in
Phaeodactylum tricornutum. Gene 406: 23–35(2007).
Simionato, D., Basso, S., Giacometti, G. M. & Morosinotto, T. Optimisation of light use
efficiency for biofuel production in algae. Biophys. Chem. 182, 71–78 (2013).
Characterisation and optimisation of mixotrophy in Phaeodactylum tricornutum
109
Thomas, D. N. & Dieckmann, G. S. Antarctic Sea ice--a habitat for extremophiles. Science.
295, 641–644 (2002).
Vinayak, V. et al., Diatom milking? A review and new approaches. Marine Drugs 13,
2629–2665 (2015).
Wang H. A study on lipid production of the mixotrophic microalgae Phaeodactylum
tricornutum on various carbon sources. African Journal of Microbiology Research 6, 1041-
1047 (2012).
Wu, S. et al., Enzyme activity highlights the importance of the oxidative pentose
phosphate pathway in lipid accumulation and growth of Phaeodactylum tricornutum under
CO2 concentration. Biotechnol. Biofuels 8, 78 (2015).
Xiao, Y. et al., Simultaneous accumulation of neutral lipids and biomass in
Nannochloropsis oceanica IMET1 under high light intensity and nitrogen replete conditions.
Algal Res. 11, 55–62 (2015).
Yongmanitchai, W. & Ward, O. P. Growth of and omega-3 fatty acid production by
Phaeodactylum tricornutum under different culture conditions. Appl. Environ. Microbiol.
57, 419–425 (1991).
Zaslavskaia, L. A. et al., Trophic Conversion of an Obligate Photoautotrophic Organism
Through Metabolic Engineering. Science. 292, 2073–2075 (2001).
Zheng, Y., Quinn, A. H. & Sriram, G. Experimental evidence and isotopomer analysis of
mixotrophic glucose metabolism in the marine diatom Phaeodactylum tricornutum.
Microbial cell factories 12, (2013).
Characterisation and optimisation of mixotrophy in Phaeodactylum tricornutum
110
Figure Legends
Fig. 3.1 Growth curves and nutrients consumption of Phaeodactylum tricornutum.
A. Growth curves of Phaeodactylum tricornutum cells in N-replete and N-deplete
condition in the presence/absence of glycerol. Two different starting cell density were
used in N-replete and N-deplete condition: 106 cells/mL and 2x10⁶ cells/mL respectively.
B. Glycerol consumption of P. tricornutum cells in N-replete conditions. C. Nitrate and D.
phosphate consumption kinetics in P. tricornutum cultures in N-replete condition in the
presence/absence of glycerol; Each result is the average of two biological replicates ±
SD. E10:N-replete condition; E0: N-deplete condition; GLY: glycerol.
Fig. 3.2. Photosynthetic activity in P. tricornutum. A. Photosynthetic efficiency
represented as Fv/Fm ratio; B. Non-photochemical quenching (NPQ) and C. Electron
transport rate (ETR) of cells cultivated for 5 and 10 days in N- replete or N- deplete
conditions in both phototrophic and mixotrophic mode. Each result is the average of two
biological replicates ± SD. E10: N-replete condition; E0: N-deplete condition; GLY:
glycerol.
Fig. 3.3 Lipid and acylglycerols production in P. tricornutum. A. Epifluorescence
images of cells stained 5 days with Nile Red dye. B. Neutral lipid content normalized per
millions of cells determined by Nile Red staining at day 5 and 10. C. Total lipids
accumulation at day 5 in P. tricornutum expressed as percentage of dry weight. D. DAG
and E. TAG accumulation at day 5 in P. tricornutum normalized per mg of dry cells. Each
result is the average of two biological replicates ± SD. E10: N-replete condition; E0: N-
deplete condition; GLY: glycerol.
Fig. 3.4 Hypothetical cellular pathways involved in the mixotrophic growth of P.
tricornutum. Hypothetical pathways involved in A. central carbon, B. storage carbon and
C. lipid metabolism during the mixotrophic growth of P. tricornutum are shown. Italic
green type represents gene transcripts found to be up-regulated in presence of glycerol
in microarray analysis, gene numbers are also indicated. Bold green or red type
Characterisation and optimisation of mixotrophy in Phaeodactylum tricornutum
111
represents metabolites that were detected in the current study by GC-MS analysis in
cells grown in mixotrophy or phototrophy respectively. Changes for pyruvate are
provided by direct estimates with a “Pyruvate Assay Kit” (see methods) and TAG in
lipidomics analysis. Glyc= Glycerol; Glyc3P= glycerol 3 phosphate;
TPI=Triphosphateisomerase; Fbac5= fructose biphophate aldolase; PYC1=
pyruvatecarboxylase; OAA= Oxaloacetic acid; Fru= fructose; F6P=fructose-6-phosphate;
G6P=glucose-6 phosphate; AG3P=Acyl Glycerol 3phosphate; DAGAT2D=Diacyl Glycerol
acyltransferase 3 phosphate.
Fig. 3.5 Optimisation of growth medium in Phaeodactylum. A. Mixotrophic growth
of P. tricornutum and B. glycerol consumption in the initial (black line) and in the
optimised medium (red line). Each result is the average of two biological replicates ± SD.
E10=ESAW 10XN; EE= ESAW enriched.
Fig. 3.6 Impact of improved medium on biomass composition and on photosynthetic
parameters. A. Pictures of 10 days-cultured cells in the E10 (left) and EE medium (right).
B. Pigment and C. total lipids content in cells grown 10 days in E10 (black bar) and EE
(red bar) cultured cell extracts. D. Photosynthetic efficiency represented as Fv/Fm ratio;
E. Non-photochemical quenching (NPQ) and F. Electron transport rate (ETR) of cells
cultivated 10 days in E10 (black bar) and EE (red bar) medium. Each result is the average
of two biological replicates ± SD. E10=ESAW 10XN; EE= ESAW enriched.
Fig. 3.7 Effect of bicarbonate on mixotrophic growth. A. Mixotrophic growth of P.
tricornutum grown and B. glycerol consumption in ESAW enriched (black line) and in
ESAW enriched + bicarbonate (red line). Each result is the average of two biological
replicates ± SD. EE= ESAW enriched; EE+BIC= ESAW enriched + bicarbonate.
Fig. 3.8 Scale-up to photobioreactors. Growth profile of P. tricornutum grown in 2L-
fermentor in A. E10 B. EE and C. EE+ BIC in both phototrophic (black circles) and
Characterisation and optimisation of mixotrophy in Phaeodactylum tricornutum
112
mixotrophic (red squares) mode. The maximum biomass are also indicated in each
condition. The optimisation of medium composition and culture conditions allows to
increase the efficiency of mixotrophy from 30% up to 78 %. Each result is the average of
two biological replicates ± SD.
Fig. 3.S1 Screening of mixotrophic efficiency by biolog and redox dye assay in
Phaeodactylum tricornutum. A. OD changes of P. tricornutum cells grown for 6 days in
BiologTM plates that contains about 200 different compounds (see methods). Blue and
red dots represent compounds that show a decrease or an increase on growth
comparing with the phototrophic control. Black dots represent the compounds that does
not affect the growth of Phaeodactylum. B. Fluorescent based-assay to monitoring the
changes in respiration using the Redox Dye A in presence of the selected compounds
(see methods). C. Growth profile of P. tricornutum on some selected compounds and a
phototrophic control in 250 mL flask; gly= glycerol, Ser=serine, NaAc= Sodium Acetate,
Fum= fumarate.
Fig. 3.S2 EM pictures of P. tricornutum cells under starved (A) and replete (B)
conditions. The degradation of the photosynthetic membranes, and the appearance of
lipid bodies in -N condition is shown by a red arrow.
Fig. 3.S3 Quantitative analysis of P. tricornutum glycerolipids. TAG profile in a total
lipid extract from cells grown in replete conditions (A) and deplete conditions (B) in both
mixotrophic and phototrophic mode. Glycerolipids are expressed in nmol / mg of dry
cells. Each result is the average of two biological replicates ± SD. E10:N-replete condition;
E0: N-deplete condition; GLY: glycerol.
Fig. 3.S4 Metabolomic analysis of P. tricornutum grown in N-replete condition. The
ratio log2 mixo/photo> 0 represents all the metabolites that were over-expressed in
Characterisation and optimisation of mixotrophy in Phaeodactylum tricornutum
113
mixotrophy in replete condition, while the ratio log2 mixo/photo< 0 the metabolites
down-regulate in this condition. Each result is the average of six biological replicates.
Fig. 3.S5 Quantification of intracellular pyruvate by fluorescence-based method. A.
Pyruvate standard curve. B. Quantification of intracellular pyruvate in cells grown in
phototrophy (E10) and mixotrophy (E10+GLY).
Fig. 3.S6 Respiration and photosynthesis analysis in P. tricornutum. Direct
assessment of oxygen consumption by a polarographic approach in A. E10, B. EE, C. EE +
BIC in both phototrophy (black bar) and mixotrophy (red bar).
Fig. 3.S7 Optimisation of growth medium in Phaeodactylum tricornutum. Growth
profiles of cells grown in E10 (black); EE (red); E10 supplemented with 2.50 g/L of NaNO3
and 0.20 g/L of NaH2PO4.H20 (green); E10 supplemented with 0.0216 g/L of Fe-EDTA
(yellow) and E10 supplemented with 0.589 mg/L of ZnSO4.7H2O, 2.55 mg/L of MnSO4
.4H2O and 0.66 mg/L of CuSO4. 5H2O (blue).
Fig. 3.S8 Morphotypes in Phaeodactylum cells. Transmission Microscope pictures of
cells grown in A. E10 and B. EE. Red arrows indicate triradiate morphotype detected.
Fig. 3.S9 Membrane lipid composition in Phaeodactylum. Lipid analysis of cells grow
in N-replete conditions and N-deplete conditions in both mixotrophic and phototrophic
mode. Each result is the average of two biological replicates ± SD. SQDG,
sulfoquinovosyldiacylglycerol; DGDG, digalactosyldiacylglycerol; MGDG,
monogalactosyldiacylglycerol; PC, phosphatidylcholine; E10:N-replete condition; E0: N-
deplete condition; GLY: glycerol.
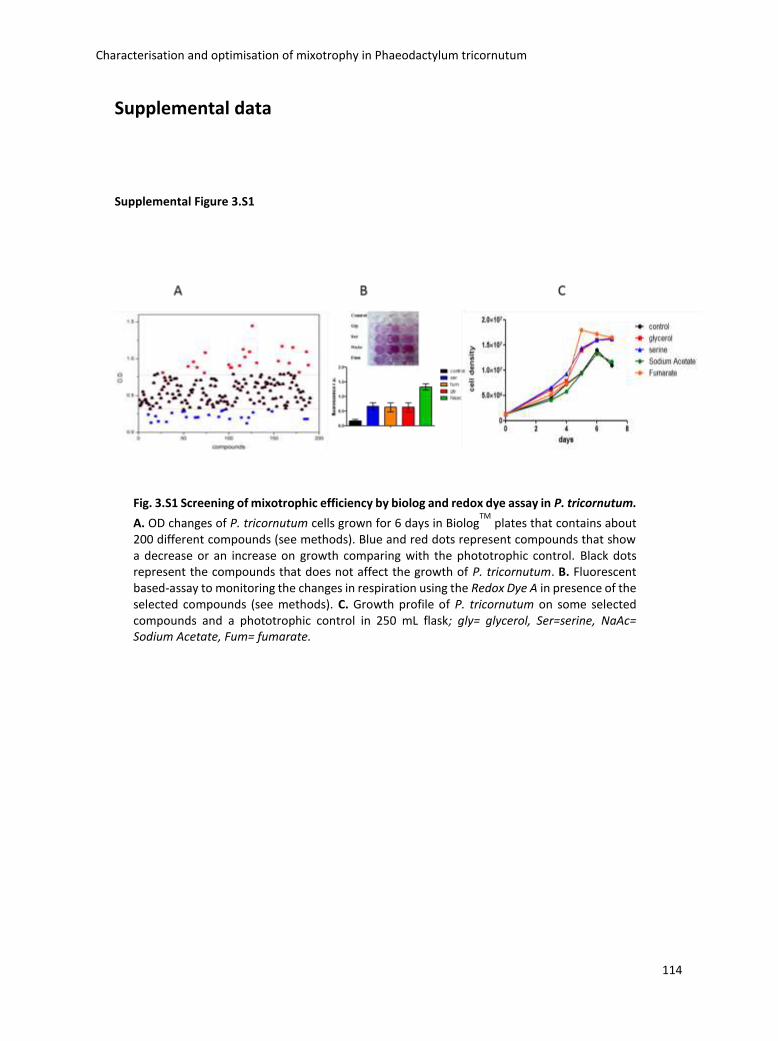
Characterisation and optimisation of mixotrophy in Phaeodactylum tricornutum
114
Supplemental data Supplemental Figure 3.S1
Fig. 3.S1 Screening of mixotrophic efficiency by biolog and redox dye assay in P. tricornutum.
A. OD changes of P. tricornutum cells grown for 6 days in BiologTM
plates that contains about 200 different compounds (see methods). Blue and red dots represent compounds that show a decrease or an increase on growth comparing with the phototrophic control. Black dots represent the compounds that does not affect the growth of P. tricornutum. B. Fluorescent based-assay to monitoring the changes in respiration using the Redox Dye A in presence of the selected compounds (see methods). C. Growth profile of P. tricornutum on some selected compounds and a phototrophic control in 250 mL flask; gly= glycerol, Ser=serine, NaAc= Sodium Acetate, Fum= fumarate.
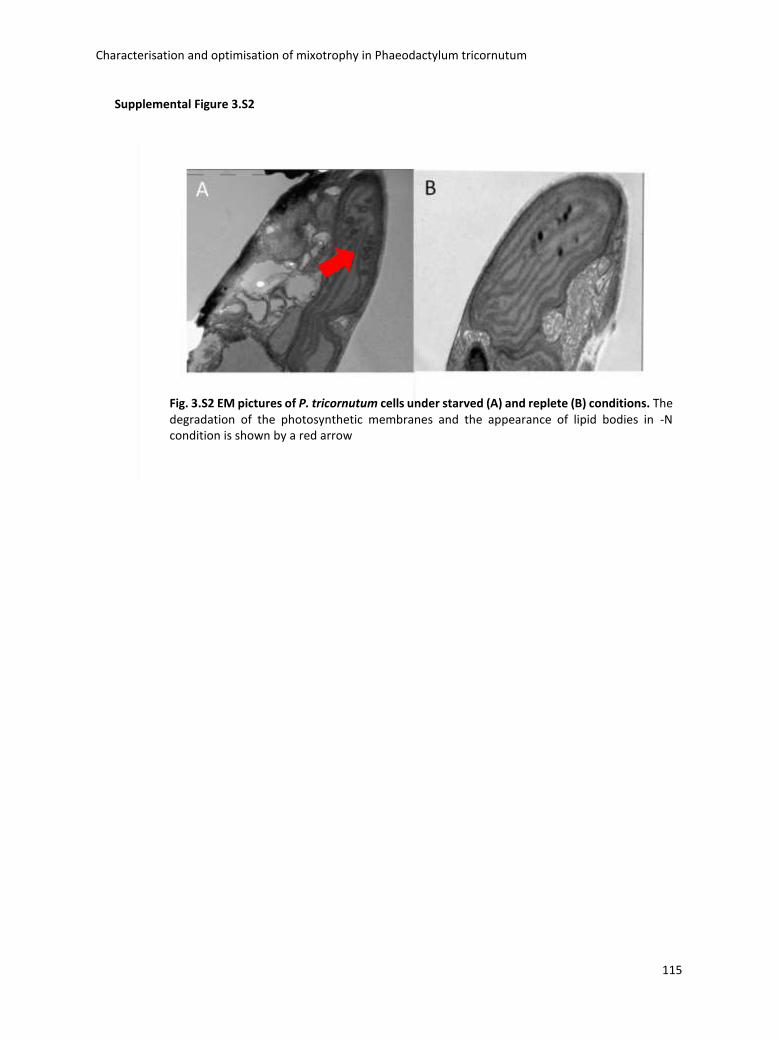
Characterisation and optimisation of mixotrophy in Phaeodactylum tricornutum
115
Supplemental Figure 3.S2
Fig. 3.S2 EM pictures of P. tricornutum cells under starved (A) and replete (B) conditions. The degradation of the photosynthetic membranes and the appearance of lipid bodies in -N condition is shown by a red arrow
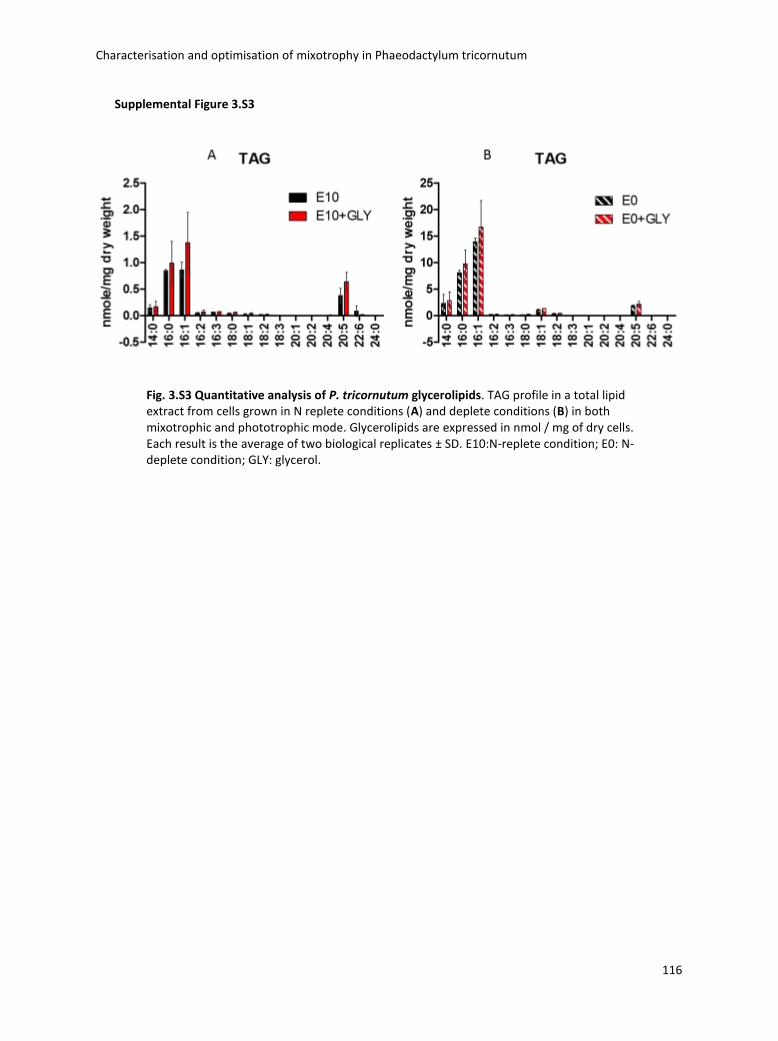
Characterisation and optimisation of mixotrophy in Phaeodactylum tricornutum
116
Supplemental Figure 3.S3
Fig. 3.S3 Quantitative analysis of P. tricornutum glycerolipids. TAG profile in a total lipid extract from cells grown in N replete conditions (A) and deplete conditions (B) in both mixotrophic and phototrophic mode. Glycerolipids are expressed in nmol / mg of dry cells. Each result is the average of two biological replicates ± SD. E10:N-replete condition; E0: N-deplete condition; GLY: glycerol.
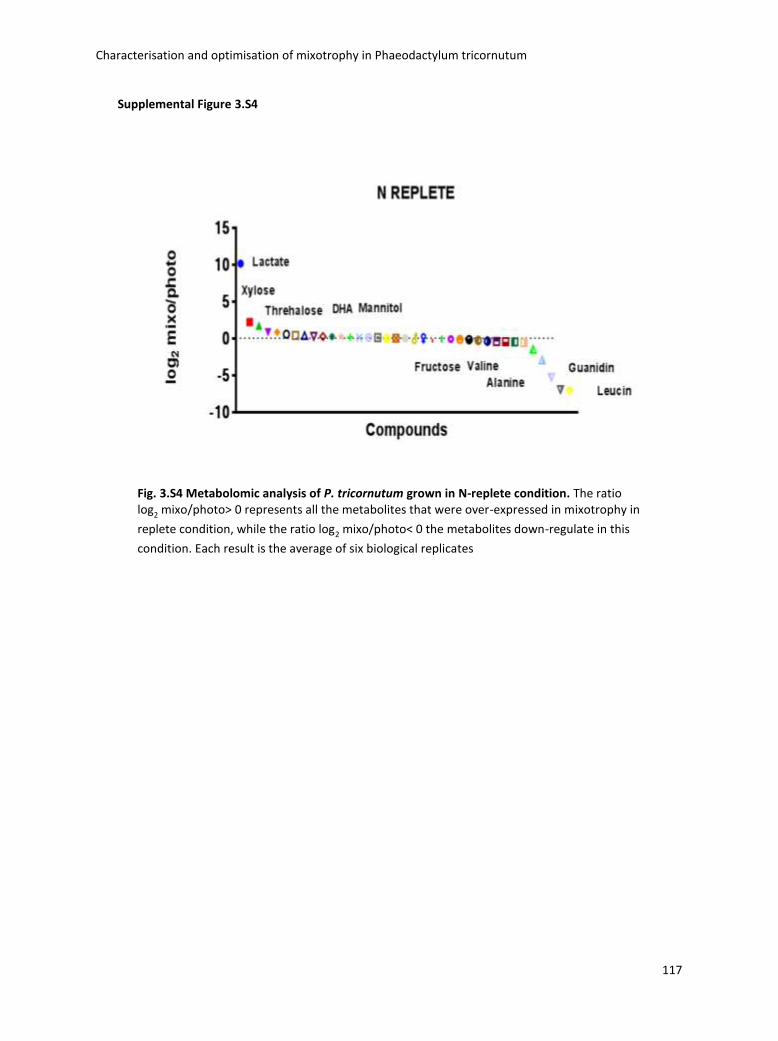
Characterisation and optimisation of mixotrophy in Phaeodactylum tricornutum
117
Supplemental Figure 3.S4
Fig. 3.S4 Metabolomic analysis of P. tricornutum grown in N-replete condition. The ratio log2 mixo/photo> 0 represents all the metabolites that were over-expressed in mixotrophy in
replete condition, while the ratio log2 mixo/photo< 0 the metabolites down-regulate in this
condition. Each result is the average of six biological replicates
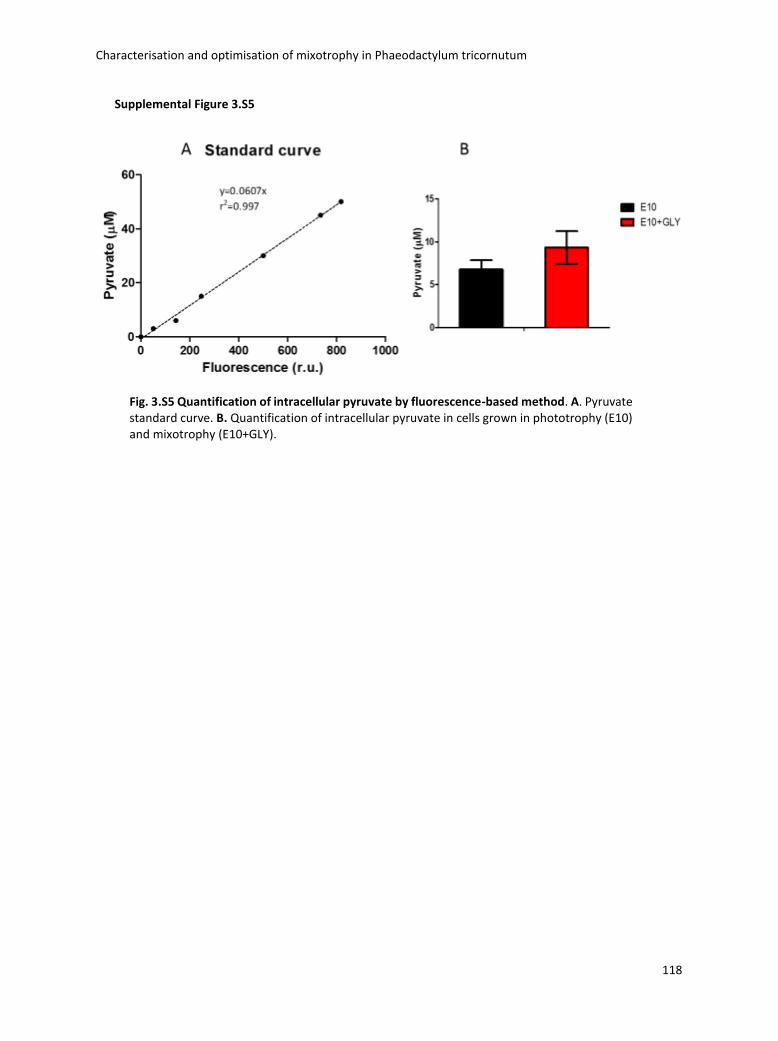
Characterisation and optimisation of mixotrophy in Phaeodactylum tricornutum
118
Supplemental Figure 3.S5
Fig. 3.S5 Quantification of intracellular pyruvate by fluorescence-based method. A. Pyruvate standard curve. B. Quantification of intracellular pyruvate in cells grown in phototrophy (E10) and mixotrophy (E10+GLY).
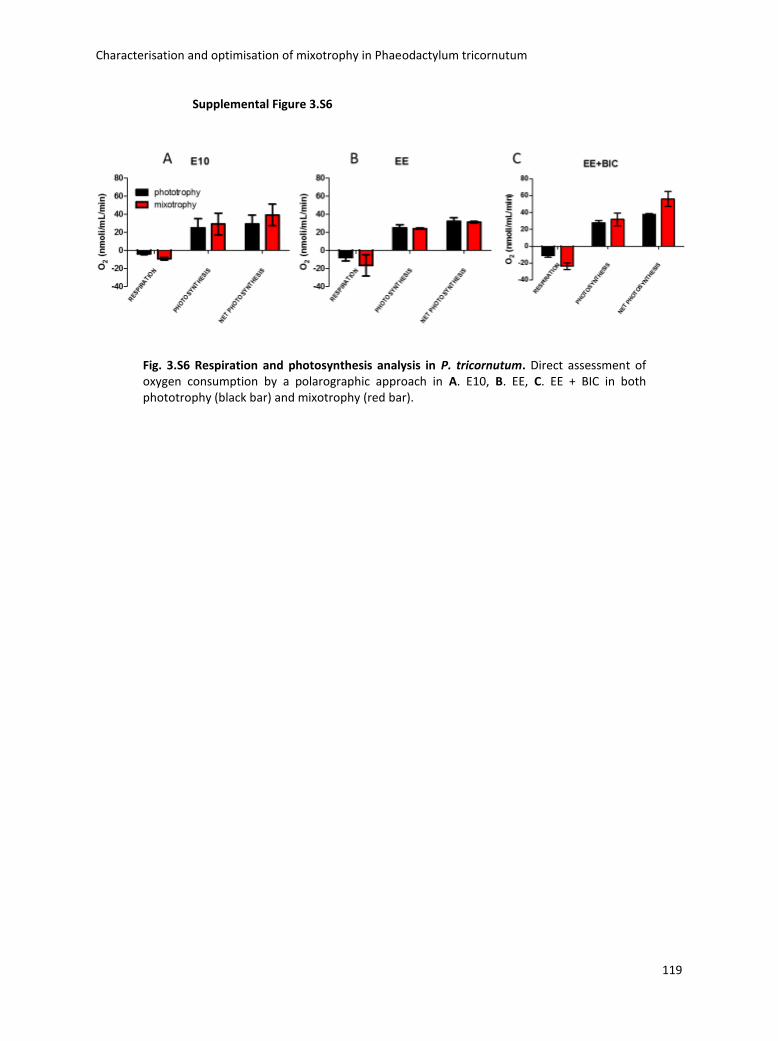
Characterisation and optimisation of mixotrophy in Phaeodactylum tricornutum
119
Supplemental Figure 3.S6
Fig. 3.S6 Respiration and photosynthesis analysis in P. tricornutum. Direct assessment of oxygen consumption by a polarographic approach in A. E10, B. EE, C. EE + BIC in both phototrophy (black bar) and mixotrophy (red bar).
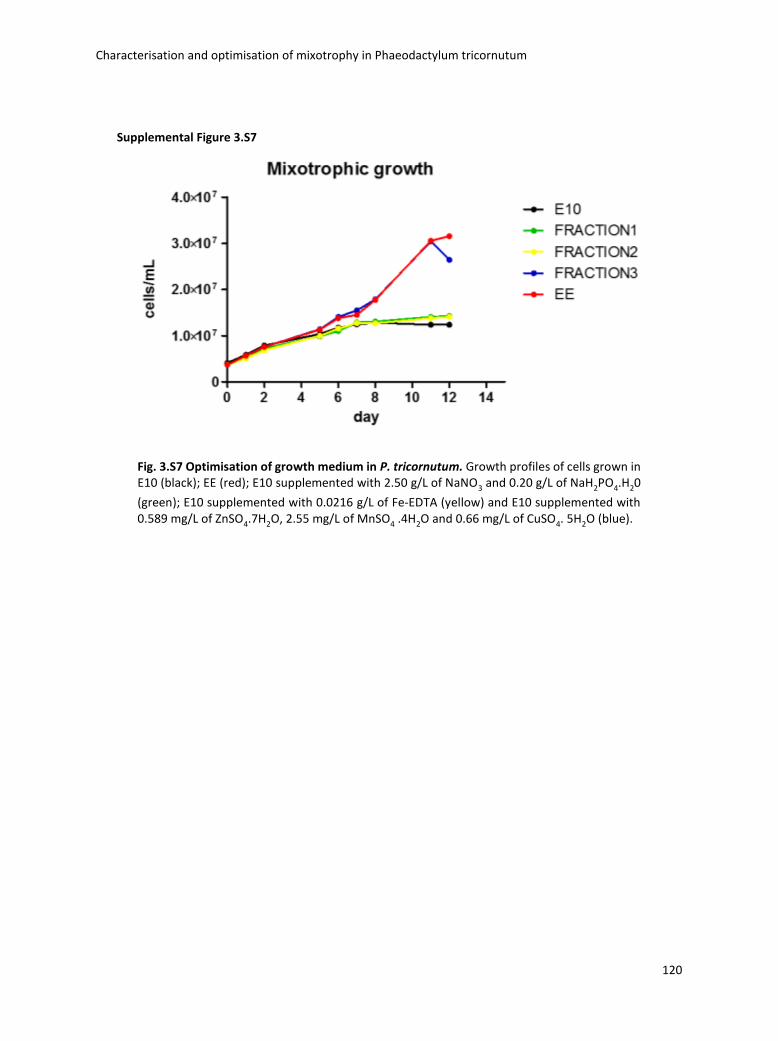
Characterisation and optimisation of mixotrophy in Phaeodactylum tricornutum
120
Fig. 3.S7 Optimisation of growth medium in P. tricornutum. Growth profiles of cells grown in E10 (black); EE (red); E10 supplemented with 2.50 g/L of NaNO3 and 0.20 g/L of NaH2PO4.H20
(green); E10 supplemented with 0.0216 g/L of Fe-EDTA (yellow) and E10 supplemented with 0.589 mg/L of ZnSO4.7H2O, 2.55 mg/L of MnSO4 .4H2O and 0.66 mg/L of CuSO4. 5H2O (blue).
Supplemental Figure 3.S7

Characterisation and optimisation of mixotrophy in Phaeodactylum tricornutum
121
Supplemental Figure 3.S8
Fig. 3.S8 Morphotypes in P. tricornutum cells. Transmission Microscope pictures of cells grown in A. E10 and B. EE. Red arrows indicated triradiate morphotype detected.
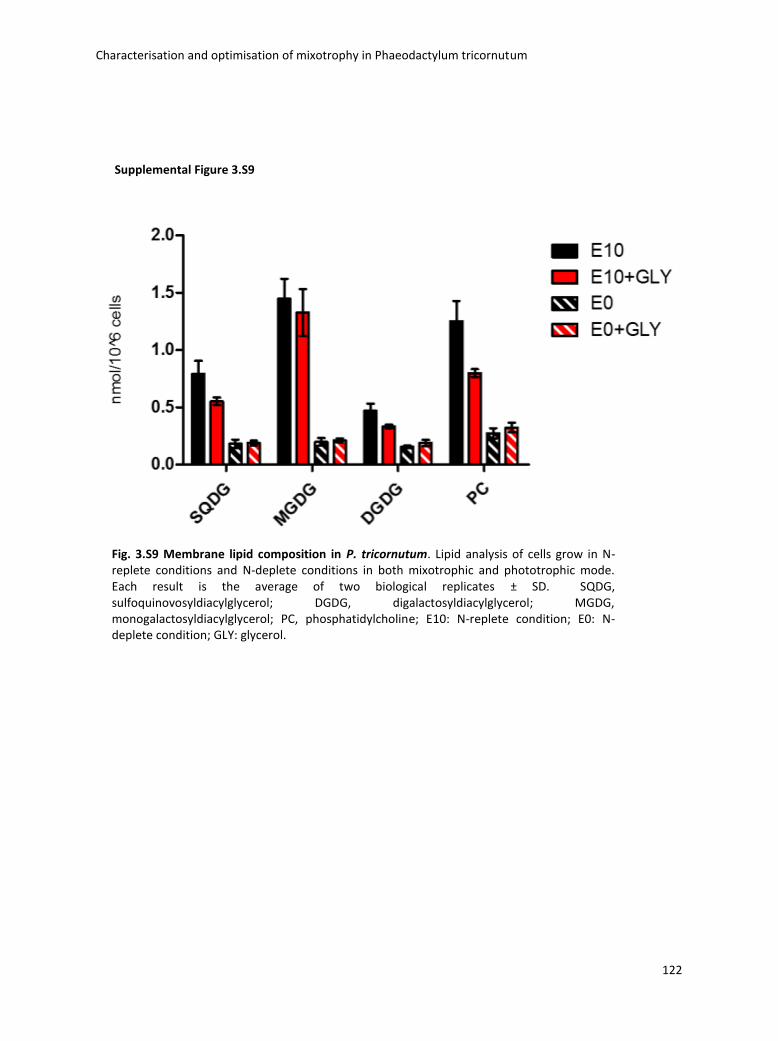
Characterisation and optimisation of mixotrophy in Phaeodactylum tricornutum
122
Supplemental Figure 3.S9
Fig. 3.S9 Membrane lipid composition in P. tricornutum. Lipid analysis of cells grow in N-replete conditions and N-deplete conditions in both mixotrophic and phototrophic mode. Each result is the average of two biological replicates ± SD. SQDG, sulfoquinovosyldiacylglycerol; DGDG, digalactosyldiacylglycerol; MGDG, monogalactosyldiacylglycerol; PC, phosphatidylcholine; E10: N-replete condition; E0: N-deplete condition; GLY: glycerol.
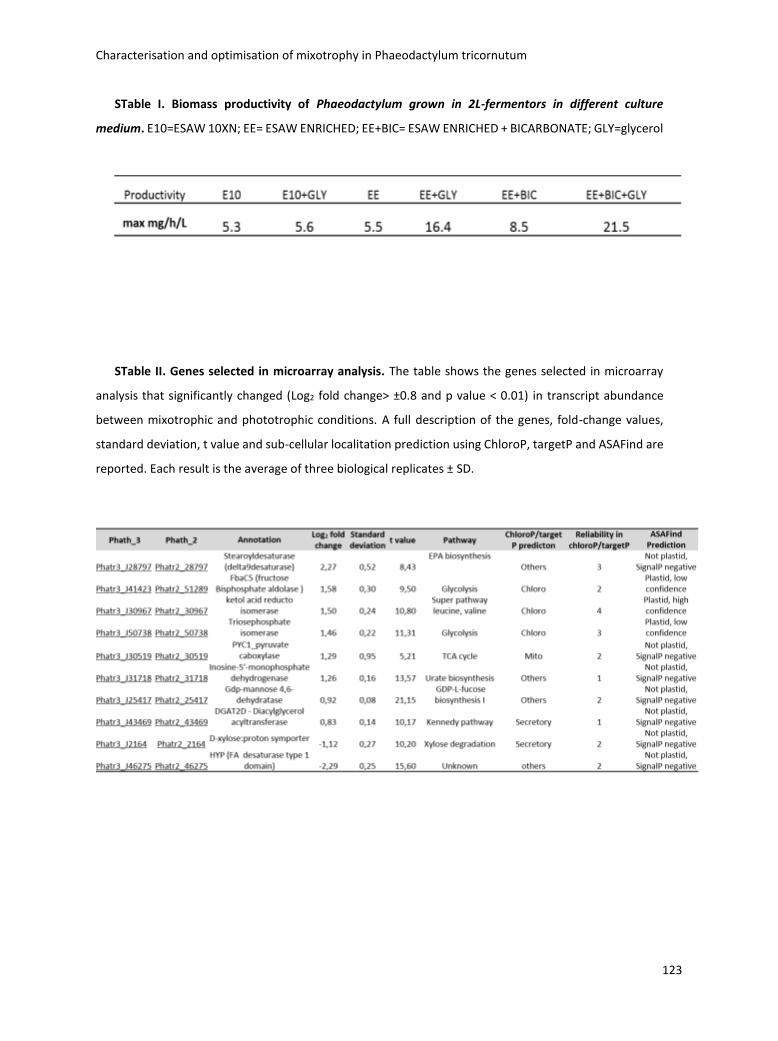
Characterisation and optimisation of mixotrophy in Phaeodactylum tricornutum
123
STable I. Biomass productivity of Phaeodactylum grown in 2L-fermentors in different culture
medium. E10=ESAW 10XN; EE= ESAW ENRICHED; EE+BIC= ESAW ENRICHED + BICARBONATE; GLY=glycerol
STable II. Genes selected in microarray analysis. The table shows the genes selected in microarray
analysis that significantly changed (Log2 fold change> ±0.8 and p value < 0.01) in transcript abundance
between mixotrophic and phototrophic conditions. A full description of the genes, fold-change values,
standard deviation, t value and sub-cellular localitation prediction using ChloroP, targetP and ASAFind are
reported. Each result is the average of three biological replicates ± SD.
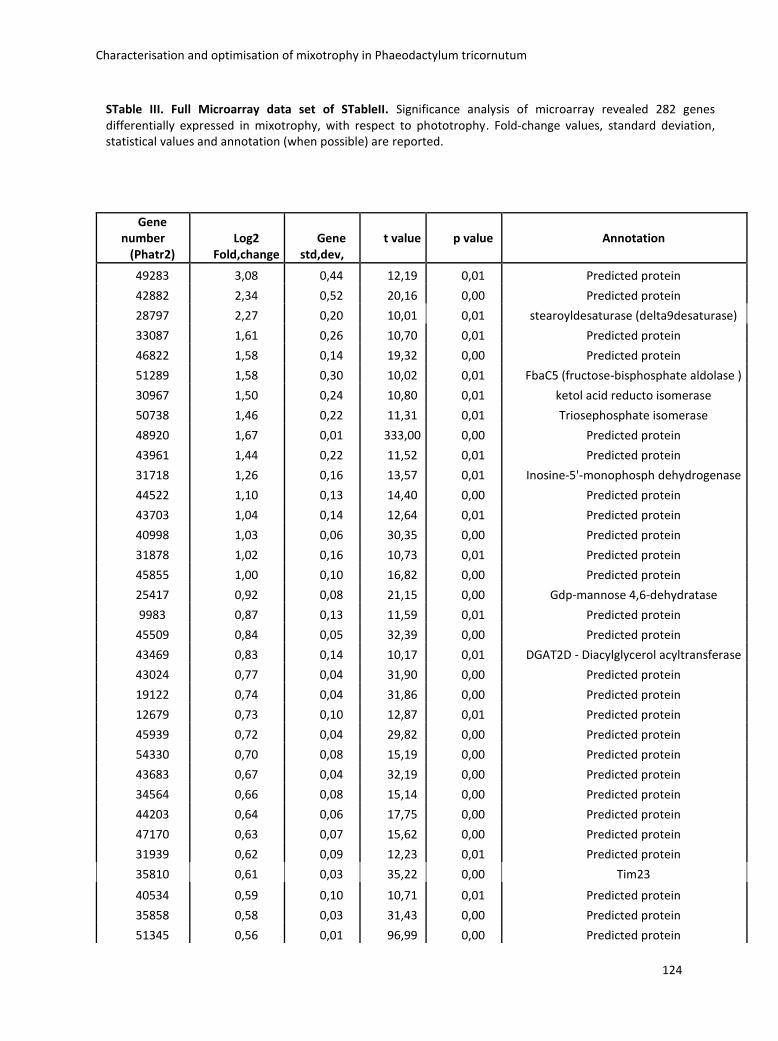
Characterisation and optimisation of mixotrophy in Phaeodactylum tricornutum
124
Gene number
(Phatr2) Log2
Fold,change Gene
std,dev, t value p value Annotation
49283 3,08 0,44 12,19 0,01 Predicted protein
42882 2,34 0,52 20,16 0,00 Predicted protein
28797 2,27 0,20 10,01 0,01 stearoyldesaturase (delta9desaturase)
33087 1,61 0,26 10,70 0,01 Predicted protein
46822 1,58 0,14 19,32 0,00 Predicted protein
51289 1,58 0,30 10,02 0,01 FbaC5 (fructose-bisphosphate aldolase )
30967 1,50 0,24 10,80 0,01 ketol acid reducto isomerase
50738 1,46 0,22 11,31 0,01 Triosephosphate isomerase
48920 1,67 0,01 333,00 0,00 Predicted protein
43961 1,44 0,22 11,52 0,01 Predicted protein
31718 1,26 0,16 13,57 0,01 Inosine-5'-monophosph dehydrogenase
44522 1,10 0,13 14,40 0,00 Predicted protein
43703 1,04 0,14 12,64 0,01 Predicted protein
40998 1,03 0,06 30,35 0,00 Predicted protein
31878 1,02 0,16 10,73 0,01 Predicted protein
45855 1,00 0,10 16,82 0,00 Predicted protein
25417 0,92 0,08 21,15 0,00 Gdp-mannose 4,6-dehydratase
9983 0,87 0,13 11,59 0,01 Predicted protein
45509 0,84 0,05 32,39 0,00 Predicted protein
43469 0,83 0,14 10,17 0,01 DGAT2D - Diacylglycerol acyltransferase
43024 0,77 0,04 31,90 0,00 Predicted protein
19122 0,74 0,04 31,86 0,00 Predicted protein
12679 0,73 0,10 12,87 0,01 Predicted protein
45939 0,72 0,04 29,82 0,00 Predicted protein
54330 0,70 0,08 15,19 0,00 Predicted protein
43683 0,67 0,04 32,19 0,00 Predicted protein
34564 0,66 0,08 15,14 0,00 Predicted protein
44203 0,64 0,06 17,75 0,00 Predicted protein
47170 0,63 0,07 15,62 0,00 Predicted protein
31939 0,62 0,09 12,23 0,01 Predicted protein
35810 0,61 0,03 35,22 0,00 Tim23
40534 0,59 0,10 10,71 0,01 Predicted protein
35858 0,58 0,03 31,43 0,00 Predicted protein
51345 0,56 0,01 96,99 0,00 Predicted protein
STable III. Full Microarray data set of STableII. Significance analysis of microarray revealed 282 genes differentially expressed in mixotrophy, with respect to phototrophy. Fold-change values, standard deviation, statistical values and annotation (when possible) are reported.
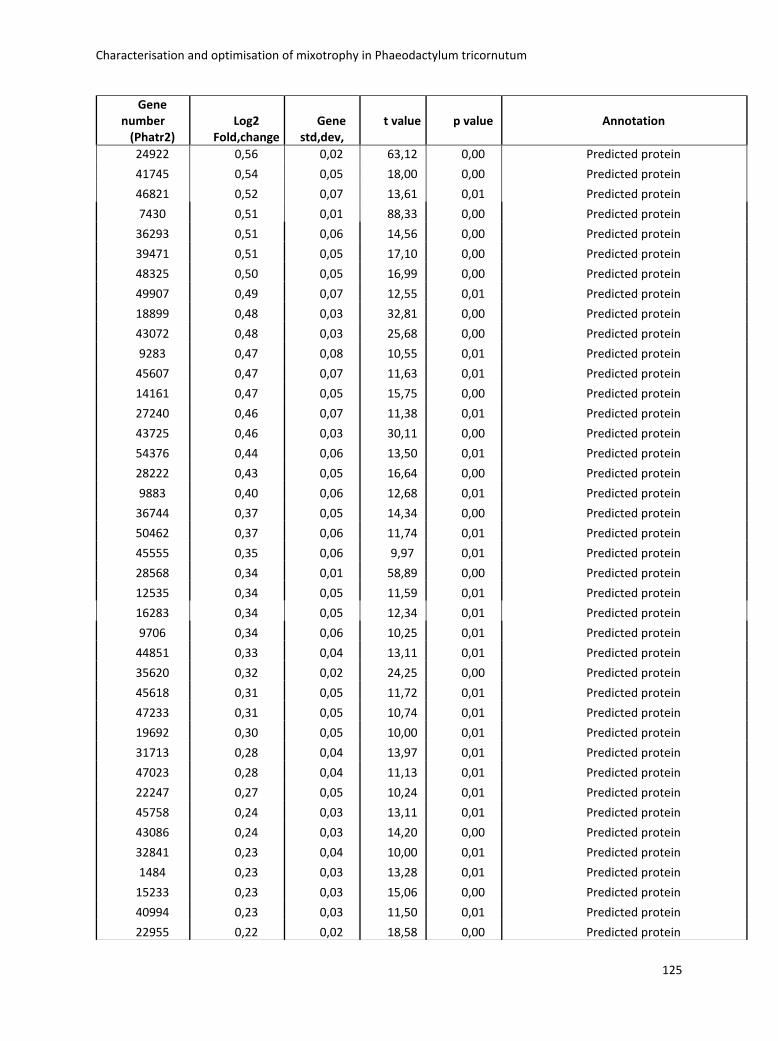
Characterisation and optimisation of mixotrophy in Phaeodactylum tricornutum
125
Gene number
(Phatr2) Log2
Fold,change Gene
std,dev, t value p value Annotation
24922 0,56 0,02 63,12 0,00 Predicted protein
41745 0,54 0,05 18,00 0,00 Predicted protein
46821 0,52 0,07 13,61 0,01 Predicted protein
7430 0,51 0,01 88,33 0,00 Predicted protein
36293 0,51 0,06 14,56 0,00 Predicted protein
39471 0,51 0,05 17,10 0,00 Predicted protein
48325 0,50 0,05 16,99 0,00 Predicted protein
49907 0,49 0,07 12,55 0,01 Predicted protein
18899 0,48 0,03 32,81 0,00 Predicted protein
43072 0,48 0,03 25,68 0,00 Predicted protein
9283 0,47 0,08 10,55 0,01 Predicted protein
45607 0,47 0,07 11,63 0,01 Predicted protein
14161 0,47 0,05 15,75 0,00 Predicted protein
27240 0,46 0,07 11,38 0,01 Predicted protein
43725 0,46 0,03 30,11 0,00 Predicted protein
54376 0,44 0,06 13,50 0,01 Predicted protein
28222 0,43 0,05 16,64 0,00 Predicted protein
9883 0,40 0,06 12,68 0,01 Predicted protein
36744 0,37 0,05 14,34 0,00 Predicted protein
50462 0,37 0,06 11,74 0,01 Predicted protein
45555 0,35 0,06 9,97 0,01 Predicted protein
28568 0,34 0,01 58,89 0,00 Predicted protein
12535 0,34 0,05 11,59 0,01 Predicted protein
16283 0,34 0,05 12,34 0,01 Predicted protein
9706 0,34 0,06 10,25 0,01 Predicted protein
44851 0,33 0,04 13,11 0,01 Predicted protein
35620 0,32 0,02 24,25 0,00 Predicted protein
45618 0,31 0,05 11,72 0,01 Predicted protein
47233 0,31 0,05 10,74 0,01 Predicted protein
19692 0,30 0,05 10,00 0,01 Predicted protein
31713 0,28 0,04 13,97 0,01 Predicted protein
47023 0,28 0,04 11,13 0,01 Predicted protein
22247 0,27 0,05 10,24 0,01 Predicted protein
45758 0,24 0,03 13,11 0,01 Predicted protein
43086 0,24 0,03 14,20 0,00 Predicted protein
32841 0,23 0,04 10,00 0,01 Predicted protein
1484 0,23 0,03 13,28 0,01 Predicted protein
15233 0,23 0,03 15,06 0,00 Predicted protein
40994 0,23 0,03 11,50 0,01 Predicted protein
22955 0,22 0,02 18,58 0,00 Predicted protein

Characterisation and optimisation of mixotrophy in Phaeodactylum tricornutum
126
Gene
number (Phatr2)
Log2 Fold,change
Gene std,dev,
t value p value Annotation
46132 0,22 0,04 10,57 0,01 Predicted protein
47165 0,18 0,01 55,00 0,00 Predicted protein
38587 0,18 0,03 11,78 0,01 Predicted protein
11799 0,17 0,02 19,65 0,00 Predicted protein
31841 0,17 0,02 12,50 0,01 Predicted protein
50139 0,16 0,02 17,76 0,00 Predicted protein
46307 0,14 0,01 21,50 0,00 Predicted protein
20331 0,13 0,02 11,09 0,01 Predicted protein
38662 0,13 0,01 19,00 0,00 Predicted protein
43387 0,12 0,02 13,23 0,01 Predicted protein
48362 0,11 0,02 12,85 0,01 Predicted protein
6076 0,09 0,02 10,58 0,01 Predicted protein
37368 0,06 0,01 10,39 0,01 Predicted protein
43885 0,06 0,01 17,00 0,00 Predicted protein
47059 0,04 0,00 Infinity 0,00 Predicted protein
49943 -0,05 0,00 Infinity 0,00 Predicted protein
41386 -0,11 0,02 11,00 0,01 Predicted protein
15286 -0,11 0,02 12,85 0,01 Predicted protein
40610 -0,12 0,01 35,00 0,00 Predicted protein
39244 -0,18 0,00 Infinity 0,00 Predicted protein
46813 -0,12 0,02 10,39 0,01 Predicted protein
36531 -0,15 0,02 16,63 0,00 Predicted protein
36377 -0,15 0,02 15,00 0,00 Predicted protein
9157 -0,15 0,02 12,76 0,01 Predicted protein
44738 -0,16 0,01 27,71 0,00 Predicted protein
37232 -0,16 0,02 12,25 0,01 Predicted protein
46580 -0,16 0,01 49,00 0,00 Predicted protein
49457 -0,18 0,02 14,70 0,00 Predicted protein
40760 -0,18 0,02 15,59 0,00 Predicted protein
49481 -0,20 0,01 34,64 0,00 Predicted protein
32453 -0,23 0,02 23,00 0,00 Predicted protein
7181 -0,23 0,04 11,51 0,01 Predicted protein
49576 -0,24 0,01 35,50 0,00 Predicted protein
49529 -0,24 0,01 36,50 0,00 Predicted protein
15399 -0,25 0,02 20,52 0,00 Predicted protein
45393 -0,27 0,05 10,24 0,01 Predicted protein
39214 -0,27 0,04 11,69 0,01 Predicted protein
45438 -0,27 0,04 10,73 0,01 Predicted protein
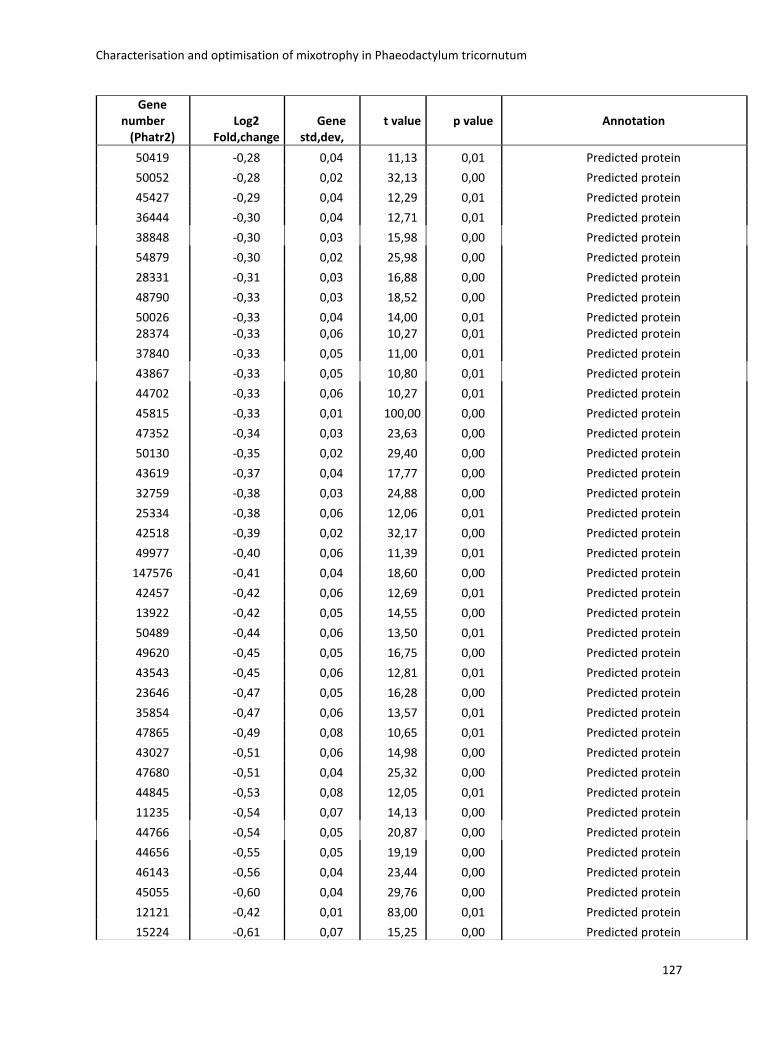
Characterisation and optimisation of mixotrophy in Phaeodactylum tricornutum
127
Gene number
(Phatr2) Log2
Fold,change Gene
std,dev, t value p value Annotation
50419 -0,28 0,04 11,13 0,01 Predicted protein
50052 -0,28 0,02 32,13 0,00 Predicted protein
45427 -0,29 0,04 12,29 0,01 Predicted protein
36444 -0,30 0,04 12,71 0,01 Predicted protein
38848 -0,30 0,03 15,98 0,00 Predicted protein
54879 -0,30 0,02 25,98 0,00 Predicted protein
28331 -0,31 0,03 16,88 0,00 Predicted protein
48790 -0,33 0,03 18,52 0,00 Predicted protein
50026 -0,33 0,04 14,00 0,01 Predicted protein 28374 -0,33 0,06 10,27 0,01 Predicted protein
37840 -0,33 0,05 11,00 0,01 Predicted protein
43867 -0,33 0,05 10,80 0,01 Predicted protein
44702 -0,33 0,06 10,27 0,01 Predicted protein
45815 -0,33 0,01 100,00 0,00 Predicted protein
47352 -0,34 0,03 23,63 0,00 Predicted protein
50130 -0,35 0,02 29,40 0,00 Predicted protein
43619 -0,37 0,04 17,77 0,00 Predicted protein
32759 -0,38 0,03 24,88 0,00 Predicted protein
25334 -0,38 0,06 12,06 0,01 Predicted protein
42518 -0,39 0,02 32,17 0,00 Predicted protein
49977 -0,40 0,06 11,39 0,01 Predicted protein
147576 -0,41 0,04 18,60 0,00 Predicted protein
42457 -0,42 0,06 12,69 0,01 Predicted protein
13922 -0,42 0,05 14,55 0,00 Predicted protein
50489 -0,44 0,06 13,50 0,01 Predicted protein
49620 -0,45 0,05 16,75 0,00 Predicted protein
43543 -0,45 0,06 12,81 0,01 Predicted protein
23646 -0,47 0,05 16,28 0,00 Predicted protein
35854 -0,47 0,06 13,57 0,01 Predicted protein
47865 -0,49 0,08 10,65 0,01 Predicted protein
43027 -0,51 0,06 14,98 0,00 Predicted protein
47680 -0,51 0,04 25,32 0,00 Predicted protein
44845 -0,53 0,08 12,05 0,01 Predicted protein
11235 -0,54 0,07 14,13 0,00 Predicted protein
44766 -0,54 0,05 20,87 0,00 Predicted protein
44656 -0,55 0,05 19,19 0,00 Predicted protein
46143 -0,56 0,04 23,44 0,00 Predicted protein
45055 -0,60 0,04 29,76 0,00 Predicted protein
12121 -0,42 0,01 83,00 0,01 Predicted protein
15224 -0,61 0,07 15,25 0,00 Predicted protein
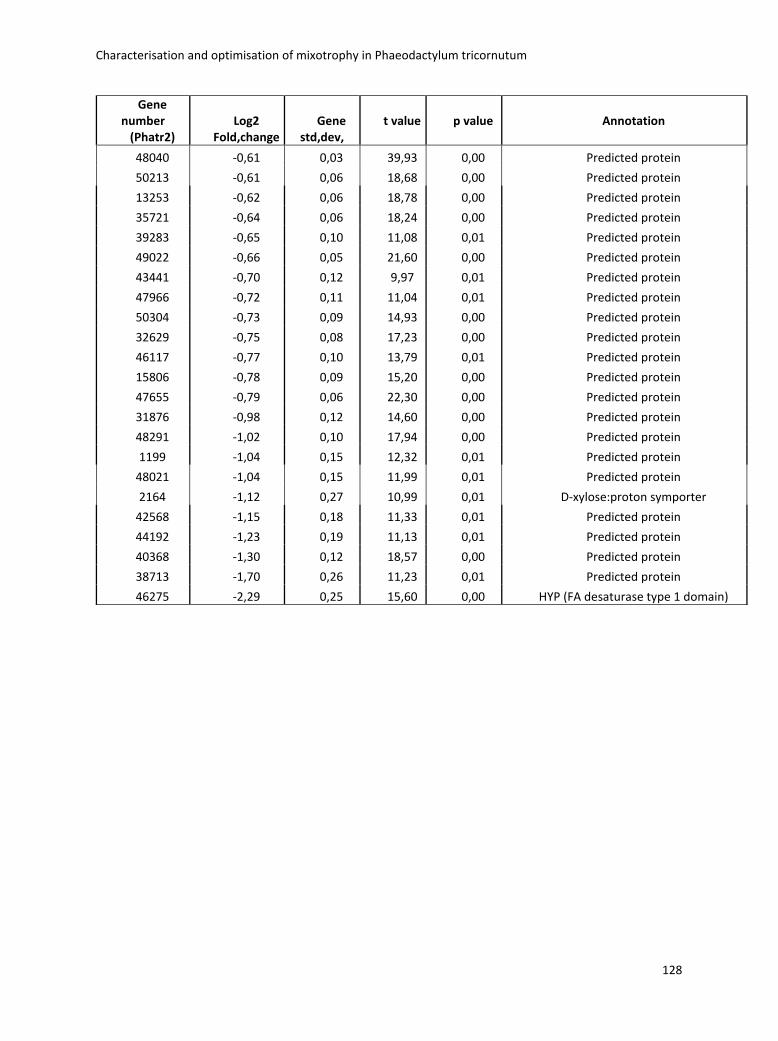
Characterisation and optimisation of mixotrophy in Phaeodactylum tricornutum
128
Gene number
(Phatr2) Log2
Fold,change Gene
std,dev, t value p value Annotation
48040 -0,61 0,03 39,93 0,00 Predicted protein
50213 -0,61 0,06 18,68 0,00 Predicted protein
13253 -0,62 0,06 18,78 0,00 Predicted protein
35721 -0,64 0,06 18,24 0,00 Predicted protein
39283 -0,65 0,10 11,08 0,01 Predicted protein
49022 -0,66 0,05 21,60 0,00 Predicted protein
43441 -0,70 0,12 9,97 0,01 Predicted protein
47966 -0,72 0,11 11,04 0,01 Predicted protein
50304 -0,73 0,09 14,93 0,00 Predicted protein
32629 -0,75 0,08 17,23 0,00 Predicted protein
46117 -0,77 0,10 13,79 0,01 Predicted protein
15806 -0,78 0,09 15,20 0,00 Predicted protein
47655 -0,79 0,06 22,30 0,00 Predicted protein
31876 -0,98 0,12 14,60 0,00 Predicted protein
48291 -1,02 0,10 17,94 0,00 Predicted protein
1199 -1,04 0,15 12,32 0,01 Predicted protein
48021 -1,04 0,15 11,99 0,01 Predicted protein
2164 -1,12 0,27 10,99 0,01 D-xylose:proton symporter
42568 -1,15 0,18 11,33 0,01 Predicted protein
44192 -1,23 0,19 11,13 0,01 Predicted protein
40368 -1,30 0,12 18,57 0,00 Predicted protein
38713 -1,70 0,26 11,23 0,01 Predicted protein
46275 -2,29 0,25 15,60 0,00 HYP (FA desaturase type 1 domain)
Characterisation and optimisation of mixotrophy in Phaeodactylum tricornutum
129
3.5 Conclusions and remarks
In this chapter, we performed an in depth characterization of mixotrophic growth in
P. tricornutum using the glycerol as carbon source. We found that glycerol enhanced cell
growth and lipid production without altering its photosynthesis capacity. Therefore, this
study supports the idea that the glycerol can be used to boost lipids and biomass, and
resulting in a good alternative to nitrogen starvation stress.
Furthermore, the combination of omics analyses revealed the main pathways used
by the glycerol to support growth and lipid production. In this study, the glycerol is involved
in carbon central, lipid and carbon storage metabolism. The latter results to be a
competitive pathway of lipids metabolism and it was already showed that blocking the
production of chrysolaminarin by metabolic engineering is possible to increase the TAG
accumulation (Daboussi et al., 2014). In the presented study, the metabolomics analysis
showed that Phaeodactylum can accumulate others storage carbohydrates (i.e. trehalose
and mannitol) in mixotrophy, suggesting that the inhibition of the biosynthesis of these
compounds could direct the carbon (derived from glycerol) towards lipid production.
Alternately, the overexpression of genes involved in glycerol degradation pathway (i.e.
glycerol kinase, PHATR_50770) or codifying for glycerol receptors (i.e. glycerol-3-phosphate
carrier, PHATRDRAFT_43611 and glycerol uptake protein PHATRDRAFT_4871) could
enhance the glycerol metabolism and increase the biomass productivity of Phaeodactylum.
The second part of the presented work focused on the optimisation of mixotrophy by
improving medium composition and culture conditions. By balancing the ESAW medium
(previously used) with the elementary composition of Phaeodactylum it was possible to
pinpoint those elements that were limited in the growth medium. This analysis showed that
the microelements (i.e. Cu, Zn, Mn) were mostly limiting the growth of the diatom. Indeed,
the increasing of their concentration in the growth medium (ESAW enriched) improved the
performance of the mixotrophic growth in Phaeodactylum. Here, Cu, Zn and Mn showed to
be essential for the algal growth most likely because they are involved in key reactions of
photosynthesis, respiration, and carbon fixation (see paragraph 3.2.1).
Characterisation and optimisation of mixotrophy in Phaeodactylum tricornutum
130
In addition, the supplementation of bicarbonate together with the glycerol in the
optimised medium further enhanced the mixotrophic metabolism most likely thanks to the
simultaneous optimisation of both photosynthesis and respiration processes (as confirmed
by the analysis done with the oxigraph). These findings confirmed the results obtained in
the article presented in the previous chapter (Bailleul et al., 2015) showing that there is an
energetic coupling between chloroplast and mitochondria and the communication
between the two organelles is crucial for optimising carbon fixation and growth. Finally, the
up-scaling on photo-bioreactors allowed a better control of the algae culture and to obtain
higher biomass concentration.
In conclusion, this work highlighted the potential of mixotrophic growth for the
industrial exploitation of microalgae. Indeed, the pennate Phaeodactylum could be used as
a model for better understand the processes behind this growth mode in others more
competitive microalgae. Moreover, the combination of different optimisation processes,
i.e. metabolic engineering, process design and mathematical model, can result in
cumulative effect and further increase the algal production capabilities.
Effect of nitrogen and phosphorus starvation in Phaeodactylum tricornutum.
131
Chapter 4
Effect of nitrogen and phosphorus starvation in
Phaeodactylum tricornutum.
4.1 Preface
This chapter describes the article “Membrane Glycerolipid Remodeling Triggered by
Nitrogen and Phosphorus Starvation in Phaeodactylum tricornutum” (Abida et al., 2015).
The first paragraphs (4.2-4.3) introduce nitrogen and phosphorus starvation effects in
Phaeodactylum, lipidomic analysis and biodiversity on the ecotypes of Phaeodactylum.
The paragraph 4.4 contains the published article and paragraph 4.5 presents the
conclusions and remarks of this work.
The aim of this work was to evaluate the effect of nitrogen and phosphate starvation
on lipid content in the different ecotypes of Phaeodactylum. However, the effect of nutrient
starvation was investigated in depth only on the Pt1 strain (the fully sequenced reference
strain for P. tricornutum). In this strain, lipidomic analysis was performed in order to
characterize and dissect the lipid metabolic routes under various levels of nitrogen or
phosphorus supplies. These analyses revealed that the nitrogen deprivation has a more
severe effect on cell physiology (decrease of Fv/Fm and growth arrest) and leads to a faster
TAG accumulation when comparing with phosphorus deprivation. Overall, this work
defined for the first time a reference for the glycerolipidome in Phaeodactylum.
Effect of nitrogen and phosphorus starvation in Phaeodactylum tricornutum.
132
4.2 Nitrogen and Phosphorous starvation in Phaeodactylum
Nitrogen (N) and phosphorus (P) are main components of biological macromolecules
such as proteins, nucleic acids and lipids and are involved in several metabolic processes
within cells. Therefore, they are key nutrients for microalgae growth (Wijffels and Barbosa,
2010), and their limitation may cause morphological and physiological changes of cells
(Litchman et al., 2009). Due to the potential applications for biofuels production the
mechanism of TAG triggered by the starvation of these nutrients has been investigated in
detail combining different approaches in Phaeodactylum tricornutum (Alonso et al., 2000;
Yu et al., 2009; Levitan et al., 2014). Under these stress conditions, the cells try to obtain
the limiting element by the degradation of N-or P-containing cellular components (i.e.
protein, nucleic acid and membrane lipid) and consequently they alter their metabolism.
However, some differences are present between the mechanism of response to N and P
starvation in Phaeodactylum as it will be described below.
N starvation causes severe alteration on the physiology of Phaeodactylum. Nitrogen-
depleted cells tend to degrade proteins in order to mobilize the nitrogen that is needed for
basal metabolism. N deprivation affects also the photosynthetic apparatus (i.e. decrease of
LHC proteins levels) and inhibits the synthesis of pigment leading to decreased
photosynthetic efficiency (Geider et al., 1993; Alipanah et al., 2015). In addition, under this
stress condition, Phaeodactylum cells stop to grow and the energy derived from the carbon
fixation is redirected to lipid accumulation, mainly TAG. In particular, amino acids and
nucleic acids metabolism are decreased in favor of glycolysis and TCA cycle (Yang et al.,
2013; Ge et al., 2014; Alipanah et al., 2015; Levitan et al., 2015). These pathways lead to
the production of some intermediates (i.e. NADPH, malate, pyruvate etc.) that are involved
into the fatty acid biosynthesis (Falkowski et al., 1985). As discussed on paragraph 1.4.2,
TAG can be produced by different pathways: i) de novo synthesis using the glycerol-3
phosphate as a precursor (i.e. Kennedy pathways) or ii) via degradation of membrane lipids.
In the second pathway, the TAG are synthesised by phospholipid:DAG acyltransferases that
transfer a fatty acyl moiety from a phospholipid to the intermediate DAG (Yoon et al., 2012).
Effect of nitrogen and phosphorus starvation in Phaeodactylum tricornutum.
133
Different results showed that under N starvation Phaeodactylum accumulates TAG
either via de novo biosynthesis (Simionato et al., 2013) or by recycling plastid membrane
lipids (Levitan et al., 2015), or using both pathways (Alipanah et al., 2015).
P starvation has minor effect on the physiology of Phaeodactylum. Under this
condition, the cells continue to grow and the photosynthetic efficiency is not affected
(Venezuela et al., 2012). Indeed, Phaeodactylum cells possess an internal reserve of
phosphate (i.e. polyphosphate storage) and do not need to degrade others cellular
components for recycling the nutrient (Leitao et al., 1995). However, phosphate-depleted
cells re-adapt their metabolism, i.e. up-regulation of TCA and glycolysis and down-
regulation of transcription factors (Yang et al., 2014). Moreover, transmission electron
microscopy images reveals that the intracellular membrane are partially degraded while
the structure of chloroplast remains unaltered in P-deprived cells (Yang et al., 2014). This
suggests that probably the TAG are produced by recycling extraplastic membrane lipids in
this condition. The complete profile of lipid composition in Phaeodactylum can help to
confirm and implement the previous knowledge on the mechanism of lipids accumulation
under nutrients starvation. In the presented study, we investigated this process via
lipidomic analysis.
4.3 Lipidomic analysis
In the previous chapter were described the main principles of the “omics” analyses,
specially transcriptomic and metabolomic. Here, I will present the lipidomic analysis that is
a branch of metabolomics based on the analysis of the complete lipid profile in biological
systems (Han and Gross 2003). The lipids can be divided in neutral lipids (i.e. DAG and TAG),
polar lipids (i.e. phosphoglycerolipids and glycoglycerolipids) and apolar lipids. The class of
polar lipids includes glycoglycerolipids and phosphoglycerolipds. The first are the mains
constituent of photosynthetic membranes and are dived in galactoglycerolipds with one or
two galactose residues, i.e. MGDG (monogalactosyldiacylglycerol) and DGDG
(digalactosyldiacylglycerol) (Allen et al., 1996) and sulfurous-containing lipids, i.e. SQDG
(sulfoquinovosyldiacylglycerol) (Benson et al., 1966). Although in a smaller percentage, the
Effect of nitrogen and phosphorus starvation in Phaeodactylum tricornutum.
134
photosynthetic membranes (thylakoids) also contain one phospholipid, i.e. phosphatidyl
glycerol (PG). Finally, phosphatidyl choline (PC) and phosphatidyl ethanolamine (PE) are the
two most abundant phospholipid species found in in extraplastidic membranes of
eukaryotic cells (Henneberry et al., 2001). Due to the large variability on their physical-
chemical properties, different types of analysis are needed to characterize the various
classes. The TLC (thin layer chromatography) allows to separate lipid classes based on their
hydrophobicity. In general, this technique separates a mixture of compounds that are
dissolved in a hydrophobic solvent (mobile phase) according to their mobility on a thin
surface usually made of silica or alumina (stationary phase). Hydrophilic compounds have
high affinity for the stationary phase and will not move very far and hydrophobic
compounds show opposite behavior. In lipidomic analysis, one-dimensional and two-
dimensional TLC systems are used to separate neutrals lipids and free fatty acids (DAG, TAG,
FFA) and polar glycerolipids (i.e. MGDG, DGDG, SQDG, PC, PG, PE etc.) respectively. These
species can then be analyzed by mass spectrometry and/ or by gas chromatography to
determine and quantify the corresponding fatty acids profiles. The detailed fatty acids
profile is also very important to elucidate the lipid metabolism. For instance, an increase of
short chain fatty acids (i.e. 16:0, 16:1) is usually the signature of a neo synthesis of lipids by
an organism. Indeed, these are synthesised by a serial of enzymes (fatty acid synthases)
into the chloroplast up to a maximum length of 18 carbon. The short chain fatty acids are
then extended up to 24 carbon between the cytoplasm and endoplasmic reticulum. Here,
specific desaturases can transform the long chain fatty acids in PUFA (i.e. 20:5), the main
component of cellular membrane (see paragraph 1.4.1 for more details). Hence, the
increase of long chain fatty acids (i.e. 20:5) corresponds to lipids obtained from recycling of
membrane lipids (i.e. MGDG, DGDG, SQDG etc.).
Lipidomics analysis has been used in different microalgae such as Nannochloropsis,
Chlamydomonas, Nitzschia (Simionato et al., 2013; Yang et al., 2015; Su et al., 2013; Li et
al., 2015). In the following manuscript, we provided a reference for the glycerolipidome of
Phaeodactylum.
Effect of nitrogen and phosphorus starvation in Phaeodactylum tricornutum.
135
4.4 Biodiversity on the ecotypes of Phaeodactylum
Different ecotypes of Phaeodactylum tricornutum (Pt1-Pt10) have been identified and
characterized morphologically and genetically (De Martino et al., 2007). Based on the
genetic variability of the molecular marker ITS2 they were divided on 4 genetic classes (i.e.
A-D). They are originated from different geographic area and show different shapes and
physiological characteristics. P. tricornutum is a pleiomorphic alga that displays three major
morphotypes depending on environmental conditions, i.e. fusiform, oval, and triradiate.
The first two represent the “normal” and the “stress” morphotype in laboratory cultures,
as deduced by studies on the responses to temperature or salinity stress (De Martino et al.,
2007). Conversely, the latter form is very rarely observed in laboratory cultures, but it has
been found in different field samples (Bohlin 1897, Wilson 1946, Johansen 1991). Most of
the ecotypes studied in laboratory so far are predominantly fusiform, while two of them
are oval (Pt3 and Pt9) and one triradiate (Pt8). They also show differential cells size. Most
of the ecotypes range from 19 to 24 µm, however the ecotype Pt 5 show bigger cells (25-
30 µm) and the ecotypes Pt6 and Pt7 smaller (15-19 µm). So far, no significant correlation
has been observed between geographic origin, morphology and genotype (De Martino et
al., 2007).
So far one ecotype (Pt1) was fully sequenced (i.e. Pt1.86) (Bowler et al., 2008) and
only two ecotypes (i.e. Pt1 and Pt4) were genetically transformed (Falciatore et al., 1999;
Siaut et al., 2007; Apt et al., 1996; Zaslavskaia et al., 2000; Kilian and Kroth 2005). The latter
(i.e. Pt4) has been clustered alone in genotype B (De Martino et al., 2007), and is a natural
mutant of LHCX1 and shows reduced NPQ capacity (Bailleul et al., 2010). This genetic
variation is probably due to the adaptation of the strain to the environment. More detailed
characterization of these ecotypes could help to understand some important mechanisms
of Phaeodactylum taking advantage of its natural biodiversity.
In this study the accumulation of TAG has been investigated in the different ecotypes
of Phaeodactylum.
Effect of nitrogen and phosphorus starvation in Phaeodactylum tricornutum.
136
4.5 Membrane Glycerolipid Remodeling Triggered by
Nitrogen and Phosphorus Starvation in Phaeodactylum
tricornutum1
Heni Abida2, Lina-Juana Dolch 2, Coline Meï2, Valeria Villanova, Melissa Conte,
Maryse A. Block, Giovanni Finazzi, Olivier Bastien, Leïla Tirichine, Chris Bowler, Fabrice
Rébeillé, Dimitris Petroutsos *, Juliette Jouhet*, and Eric Maréchal*
Environmental and Evolutionary Genomics Section, Institut de Biologie de l’École Normale
Supérieure, Centre National de la Recherche Scientifique Unité Mixte de Recherche 8197, Institut National
de la Santé et de la Recherche Médicale, U1024, 75005 Paris, France (H.A., L.T., C.B.);
Laboratoire de Physiologie Cellulaire et Végétale, Unité Mixte de Recherche 5168 Centre National de
la Recherche Scientifique-Commissariat à l’Energie Atomique-Université Grenoble Alpes, Institut de
Recherche en Sciences et Technologies pour le Vivant, Commissariat à l’Energie Atomique Grenoble, 38054
Grenoble cedex 9, France (L.-J.D., C.M., M.C., M.A.B., G.F., O.B., F.R., D.P., J.J., E.M.);
Fermentalg SA, F–33500 Libourne, France (V.V.).
This work was supported by the Agence Nationale de la Recherche (grant no. ANR–12–BIME–0005
[DiaDomOil] to C.B., G.F., D.P., and E.M.), the Commissariat à l’Energie Atomique Life Science Division
(bioenergy grant EliciTAG to M.C. and E.M.), a European Research Council Advanced Grant (Diatomite; to
C.B.), the Centre National de la Recherche Scientifique (Défi Transition Energétique grant to L.T. and G.F.), the
OCEANOMICS program from the French Ministry of Research (to E.M.), and the Institut Carnot Lipides pour la
Santé et l’Industrie (to E.M.).
1These authors contributed equally to the article.
2Address correspondence to [email protected], juliette. [email protected], and
Effect of nitrogen and phosphorus starvation in Phaeodactylum tricornutum.
137
ABSTRACT
Diatoms constitute a major phylum of phytoplankton biodiversity in ocean water and
freshwater ecosystems. They are known to respond to some chemical variations of the
environment by the accumulation of triacylglycerol, but the relative changes occurring in
membrane glycerolipids have not yet been studied. Our goal was first to define a reference
for the glycerolipidome of the marine model diatom Phaeodactylum tricornutum, a
necessary prerequisite to characterize and dissect the lipid metabolic routes that are
orchestrated and regulated to build up each subcellular membrane compartment. By
combining multiple analytical techniques, we determined the glycerolipid profile of P.
tricornutum grown with various levels of nitrogen or phosphorus supplies. In different P.
tricornutum accessions collected worldwide, a deprivation of either nutrient triggered an
accumulation of triacylglycerol, but with different time scales and magnitudes. We
investigated in depth the effect of nutrient starvation on the Pt1 strain (Culture Collection
of Algae and Protozoa no. 1055/3). Nitrogen deprivation was the more severe stress,
triggering thylakoid senescence and growth arrest. By contrast, phosphorus deprivation
induced a stepwise adaptive response. The time scale of the glycerolipidome changes and
the comparison with large-scale transcriptome studies were consistent with an exhaustion
of unknown primary phosphorus-storage molecules (possibly polyphosphate) and a
transcriptional control of some genes coding for specific lipid synthesis enzymes. We
propose that phospholipids are secondary phosphorus-storage molecules broken down
upon phosphorus deprivation, while nonphosphorus lipids are synthesised consistently
with a phosphatidylglycerol-to-sulfolipid and a phosphatidycholine-to-betaine lipid
replacement followed by a late accumulation of triacylglycerol.

Effect of nitrogen and phosphorus starvation in Phaeodactylum tricornutum.
138
Diatoms are a major component of phytoplankton communities, believed to be
responsible for up to one-fourth of global primary productivity (Scala and Bowler, 2001).
They live in an environment where light, temperature, pH, oxygen, carbon dioxide,
nutrients, and all kinds of physicochemical parameters can vary dramatically. Nitrogen (N),
phosphorus (P), and iron are the most often limiting or colimiting nutrients (Mills et al.,
2004; Moore et al., 2013), and N is more often limiting than P in marine systems, with the
reverse in freshwaters (Hecky and Kilham, 1988). As a selection pressure, the relative
fluctuations of N and P have been proposed to be responsible for the differences of size
distributions of diatoms, freshwater species being smaller than marine ones due to the
ambient scarcity of P (Litchman et al., 2009). Nutrient scarcity is a criterion to define
oligotrophic areas in oceans. A study by Van Mooy et al., (2009) on phytoplanktonic
communities in an oligotrophic marine region, where P is scarce (less than 10 nM), observed
that diatoms reduced their P requirements by synthesizing less phosphoglycerolipids, in
particular phosphatidyl-choline (PC) and phosphatidylglycerol (PG), and more
nonphosphorus lipids, such as sulfoquinovosyldiacylglycerol (SQDG) and betaine lipids (BL),
as compared with communities growing in a P-rich region (more than 100 nM). However,
that study did not consider the levels of two other nonphosphorus lipid classes (i.e. the
chloroplast galactoglycerolipids, in particular monogalactosyldiacyl-glycerol [MGDG]) and
digalactosyldiacylglycerol (DGDG), and triacylglycerol (TAG). When Van Mooy et al., (2009)
examined planktonic membrane lipids at the two locations, their observations were
consistent with a PG-to-SQDG and a PC-to-BL replacement triggered by P shortage. In a
complementary set of experiments, they cultivated the di-atom Thalassiosira pseudonana
in a P-depleted or P-replete artificial medium and found variations of the SQDG-PG and BL-
PC ratios in line with their on-site observations (Van Mooy et al., 2009), supporting that
lipid remodeling could be one of the most essential mechanisms allowing a given species to
acclimate and populate oligotrophic areas.
Phospholipid-to-nonphosphorus lipid replacement has been studied in depth in the
plant Arabidopsis (Arabidopsis thaliana; Benning and Ohta, 2005; Shimojima and Ohta,
Effect of nitrogen and phosphorus starvation in Phaeodactylum tricornutum.
139
2011; Boudière et al., 2012; Dubots et al., 2012; Nakamura, 2013; Petroutsos et al., 2014).
In Arabidopsis, PC and PG contents decrease upon P starvation, and the synthesis of plastid
glycolipids (i.e. MGDG, DGDG, and SQDG) increases coincidentally. Based on the acyl
profiles of glycerolipids, it is possible to identify the metabolic routes that are mobilized in
this remodeling. In Arabidopsis, MGDG can be synthesised using diacylglycerol (DAG)
generated locally inside the plastid, via the so-called prokaryotic pathway, or using diacyl
precursors diverted from nonplastid phospholipids, via the so-called eukaryotic pathway
(Browse et al., 1986). The prokaryotic structure is characterized by a 16-carbon (C16) fatty
acid (FA) at position sn-2 of the glycerol backbone, like cyanobacterial lipids, whereas the
eukaryotic structure contains an 18-carbon (C18) FA at position sn-2. Thus, in Arabidopsis,
(1) 18:3/16:3-MGDG originates from the stepwise galactosylation of prokaryotic 18:1/16:0-
DAG followed by a rapid desaturation into the trienoic form; and (2) 18:3/18:3-MGDG relies
on the import and galactosylation of eukaryotic precursors derived from phospholipids,
most notably having 18:2/18:2 structures (Maréchal et al., 1994), also followed by a
desaturation into the trienoic form. Upon P shortage, the eukaryotic pathway is activated;
PC hydrolysis releases a diacyl intermediate, which is then transferred to the plastid to
synthesize MGDG and DGDG (Jouhet et al., 2003), creating a virtuous recycling of lipid
intermediates between phospholipid breakdown and galactolipid increase. The Arabidopsis
response to low P combines a rapid metabolic regulation, coupling MGDG synthesis to the
phospholipid status (Dubots et al., 2010, 2012), with a longer term genomic reprogramming
(Misson et al., 2005; Morcuende et al., 2007) characterized by the up-regulation of
phospholipases C and D (hydrolyzing phospholipids) and of monogalactosyldiacyl and
digalactosyldiacyl isoforms (the galactosyltransferases synthesizing MGDG and DGDG,
respectively). In P-starved conditions, a PG-to-SQDG re-placement is observed and is
considered to be a ubiquitous phenomenon in photosynthetic organisms, enabling the
preservation of an anionic lipid environment to the photosystems in the thylakoids
(Boudière et al., 2014). No intense trafficking is required for this replacement, as SQDG and
PG are both chloroplast lipids. The most spectacular feature of Arabidopsis lipid remodeling
consists in the replacement of PC in a variety of subcellular locations, such as the plasma

Effect of nitrogen and phosphorus starvation in Phaeodactylum tricornutum.
140
membrane, the tonoplast, and the mitochondria (but not observed in the endoplasmic
reticulum [ER]), by DGDG synthesised in the chloroplast, using still uncharacterized lipid
export sys-tems (Andersson et al., 2003, 2005; Jouhet et al., 2003, 2004, 2007, 2010;
Sandelius et al., 2007; Tjellström et al., 2008).
Lipid modifications triggered in Arabidopsis by a deprivation of N have not been
studied as extensively. Upon N shortage, the quantity of N-containing lipids, in particular
PC and phosphatidylethanolamine (PE), seems to be unaffected (Gaude et al., 2007). On
the other hand, the main response includes a relative decrease of MGDG and an increase
of DGDG, concomitant with an up-regulation of the genes encoding both digalactosyldiacyl
isoforms, and a small increase of TAG synthesis (Gaude et al., 2007). It is not known whether
any lipid trafficking can be triggered by N shortage, nor whether there are any changes in
the lipid composition of cell compartments, like those documented in cells exposed to P
shortage.
No such comprehensive study has been made in a diatom model. Acyl profiles of all
glycerolipid classes and quantifications still have to be determined. The existence of
redundant metabolic routes, similar to the prokaryotic and eukaryotic pathways dissected
in Arabidopsis, also requires assessment. The conservation of some processes occurring in
plants, such as a decrease of MGDG and an increase of DGDG in N-depleted conditions or
an increase of MGDG and DGDG and a putative PC-to-DGDG replacement in P-depleted
conditions, also should be investigated.
Studies in diatoms have benefited from developments in two model species, the
centric diatom T. pseudonana (Coscinodiscophyceae) and the pennate diatom
Phaeodactylum tricornutum (Bacillariophyceae), for which intense efforts have resulted in
fully sequenced genomes (Armbrust et al., 2004; Bowler et al., 2008) and provided
reference data for transcriptomic (Maheswari et al., 2005, 2009; Allen et al., 2008; Sapriel
et al., 2009; Shrestha et al., 2012; Chauton et al., 2013) and whole-cell proteomic (Montsant
Effect of nitrogen and phosphorus starvation in Phaeodactylum tricornutum.
141
et al., 2005; Nunn et al., 2009) analyses. P. tricornutum is pleiomorphic, with three major
morphotypes (fusiform, triradiate, and oval). A series of axenic strains have been collected
in various marine environments worldwide, denoted Pt1 to Pt10 (De Martino et al., 2007),
allowing analyses of phenotypic variations and the adaptation to various habitats.
In photosynthetic organisms, it is usually considered that, in standard conditions,
phospholipids are mostly present in the endomembrane system, whereas non-phosphorus
glycolipids are in the plastid. However, this distinction might be more complex in diatoms
due to the physical connection between some membranes limiting the plastid with the
endomembrane system and/or mitochondria. Briefly, like all eukaryotes, diatoms contain a
conventional endomembrane system comprising the ER, nuclear envelope, Golgi, trans-
Golgi network, plasma membrane, etc., which are connected to each other by vesicular
shuttles or tubular structures (Brighouse et al., 2010). In addition, two semiautonomous
organelles of endosymbiotic origins are present, a mitochondrion limited by two
membranes and a plastid bounded by four membranes, which originate from a secondary
endosymbiosis (Dorrell and Smith, 2011; Petroutsos et al., 2014). A continuum occurs
between the ER and the outermost membrane of the plastid (Kroth et al., 2008). The
glycerolipid composition of each of the four membranes that surround the plastid is simply
unknown. Therefore, it is difficult to speculate on the location of MGDG and DGDG
synthesis and whether any export of DGDG to other locations of the cell could be plausible,
like that observed in plants. Given the current state of membrane fractionation techniques,
only global analyses can be performed. By contrast with other omics data, and although
previous targeted studies have allowed the structural determination of some isolated
glycerolipid classes (Arao et al., 1987; Yongmanitchai and Ward, 1993; Naumann et al.,
2011), the complete membrane glycerolipidome of P. tricornutum has not been fully
characterized. The analyses of membrane glycerolipid remodeling in diatoms should also
consider the accumulation of TAG triggered by nutrient shortage, which has been
scrutinized in much more detail due to the potential applications for biofuels and green
Effect of nitrogen and phosphorus starvation in Phaeodactylum tricornutum.
142
chemistry (Alonso et al., 2000; Rezanka et al., 2011; Zendejas et al., 2012; Levitan et al.,
2014).
In this article, by combining multiple analytical techniques, we sought to characterize
comprehensively the major membrane glycerolipid classes in P. tricornutum, together with
TAG. FA profiles of each class have been determined, providing acyl signatures that can be
used as markers for diacyl moiety origins and fluxes. With a fully characterized
glycerolipidome in hand, we then analyzed changes triggered by N and/or P depletion and
deduced from lipid class and acyl signature variations the dynamic processes driving the
observed lipid remodeling.
RESULTS
Comparison of P. tricornutum Ecotypes in Nutrient-Replete and Nutrient-Limiting
Batch Cultivation
We examined the responses of all available P. tricornutum accessions, collected
originally in various geographical regions and covering all known morphotypes (i.e. the
fusiform shape commonly observed in laboratory conditions, the triradiate shape thought
to be more abundant in nature, and the oval shape, indicative of a temperature or salinity
stress; De Martino et al., 2007; Fig. 4.1A). In our growth conditions, most accessions were
fusiform except Pt8, which is mainly triradiate, and Pt3 and Pt9, which are oval. Cells grown
in nutrient-replete conditions (0.55 mM N and 0.0224 mM P, called here 1N1P) were shifted
to 2N (0N1P) or 2P (1N0P) medium.
Nonpolar lipid accumulation (mainly TAG), known to be triggered by nutrient
shortage in phytoplankton, was monitored using Nile Red fluorescence staining. N
depletion triggered a faster TAG accumulation as compared with P depletion; therefore,
the comparison of the response of the different ecotypes to 2N or 2P was made 3 d after N
Effect of nitrogen and phosphorus starvation in Phaeodactylum tricornutum.
143
depletion (Fig. 4.1B) and 8 d after P depletion (Fig. 4.1C). All accessions showed a marked
accumulation of TAG shortly after N depletion, except Pt4, which exhibited a relatively
modest increase (a representative experiment is shown in Figure 4.1B). The detection of
nonpolar lipid accumulation in response to low P required a much longer cultivation time
in P-depleted medium, and no significant TAG accumulation could be detected after 3 to 5
d. After 8 d of growth in a P-limited medium, a contrasting phenotype in the series of Pt
accessions could be observed (a representative experiment is shown in Figure 4.1C), with a
substantial accumulation of nonpolar lipid in all accessions except Pt4, Pt10, and PtHK, in
which the Nile Red staining was lower than a 2-fold increase, as compared with cells grown
in a replete medium.
We did not observe any correlation between the magnitude of response to N or P
depletion and the corresponding morphotypes. Phenotypic variations might be related,
rather, to the efficiency of N or P storage systems in the different accessions and/or to the
signaling and metabolic processes activated by the lack of nutrients. In all cases, an increase
of Nile Red fluorescence, even moderate, was always detected, thus demonstrating that
TAG accumulation is a marker of nutrient shortage. We decided to pursue our experiments
on Pt1, the most commonly used strain in laboratories, which responded significantly to
both N and P deprivations.
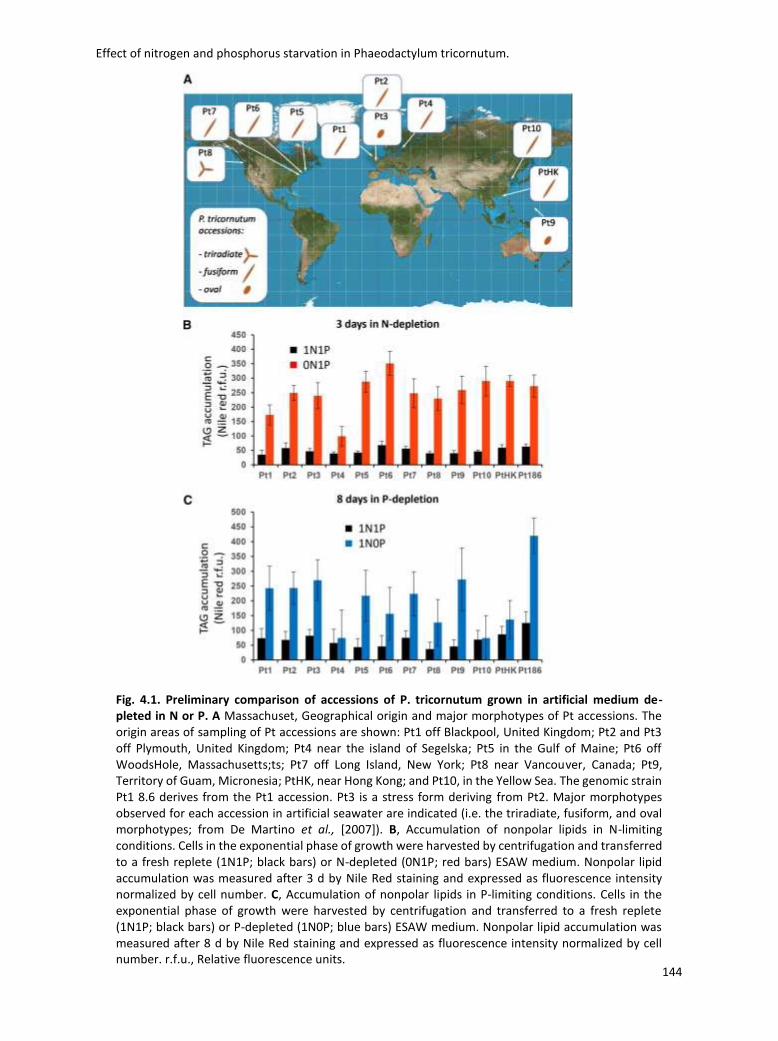
Effect of nitrogen and phosphorus starvation in Phaeodactylum tricornutum.
144
Fig. 4.1. Preliminary comparison of accessions of P. tricornutum grown in artificial medium de- pleted in N or P. A Massachuset, Geographical origin and major morphotypes of Pt accessions. The origin areas of sampling of Pt accessions are shown: Pt1 off Blackpool, United Kingdom; Pt2 and Pt3 off Plymouth, United Kingdom; Pt4 near the island of Segelska; Pt5 in the Gulf of Maine; Pt6 off WoodsHole, Massachusetts;ts; Pt7 off Long Island, New York; Pt8 near Vancouver, Canada; Pt9, Territory of Guam, Micronesia; PtHK, near Hong Kong; and Pt10, in the Yellow Sea. The genomic strain Pt1 8.6 derives from the Pt1 accession. Pt3 is a stress form deriving from Pt2. Major morphotypes observed for each accession in artificial seawater are indicated (i.e. the triradiate, fusiform, and oval morphotypes; from De Martino et al., [2007]). B, Accumulation of nonpolar lipids in N-limiting conditions. Cells in the exponential phase of growth were harvested by centrifugation and transferred to a fresh replete (1N1P; black bars) or N-depleted (0N1P; red bars) ESAW medium. Nonpolar lipid accumulation was measured after 3 d by Nile Red staining and expressed as fluorescence intensity normalized by cell number. C, Accumulation of nonpolar lipids in P-limiting conditions. Cells in the exponential phase of growth were harvested by centrifugation and transferred to a fresh replete (1N1P; black bars) or P-depleted (1N0P; blue bars) ESAW medium. Nonpolar lipid accumulation was measured after 8 d by Nile Red staining and expressed as fluorescence intensity normalized by cell number. r.f.u., Relative fluorescence units.
Effect of nitrogen and phosphorus starvation in Phaeodactylum tricornutum.
145
Effects of N and P Depletion on the Growth and Photosynthesis of P. tricornutum
Since P depletion exerted an effect after a longer time period than N depletion, we
had to be sure, when studying the effect of P shortage, that no exhaustion of N occurred
during the time of observation and that control conditions were indeed kept replete. To
avoid such issues, we adjusted the initial nutrient-replete conditions to concentrations 10
times higher than that applied in our comparative study of ecotypes (i.e. 5.5 mM N and 0.22
mM P [a medium called 10N10P]). We checked that the 10N10P medium supported the
growth of P. tricornutum Pt1 at higher cell densities compared with the 1N1P medium
(Supplemental Fig. 4.S1A). Most importantly, the photosynthetic capacity of cells, probed
as photosynthetic capacity (Fv/Fm), remained unaltered for 10 d in the 10N10P medium, in
stark contrast with cells grown in 1N1P medium, where Fv/Fm dropped quickly during the
growth period (Supplemental Fig. 4.S1B). After 5 d of cultivation in 1N1P medium, a
decrease of Fv/Fm and an increase of nonpolar lipid content were measured (Supplemental
Fig. 4.S1C), reflecting a nutrient limitation in the 1N1P medium that did not occur in the
10N10P condition.
We then evaluated the time scale of the Pt1 response after transfer to nutrient-
limiting conditions. For this, the diatoms were grown in 10N10P medium until they reached
a cell density of 6 to 7 million cells mL-1. Cells were centrifuged, washed with 0N0P medium,
and resuspended in 10N10P, 0N10P, and 10N0P media at a starting cell density of 3 to 3.5
million cells mL-1. N depletion resulted in growth arrest after 1 d (Supplemental Fig. 4.S2A)
and led to an accumulation of nonpolar lipids after 4 d (based on Nile Red fluorescence;
Supplemental Fig. 4.S2B). P depletion affected neither growth nor lipid accumulation
between days 0 and 4 (Supplemental Fig. 4.S2, A and B), consistent with the delay observed
for the different accessions grown in 0N1P or 1N0P medium, before any visible effect could
be measured (Fig. 4.1, B and C).
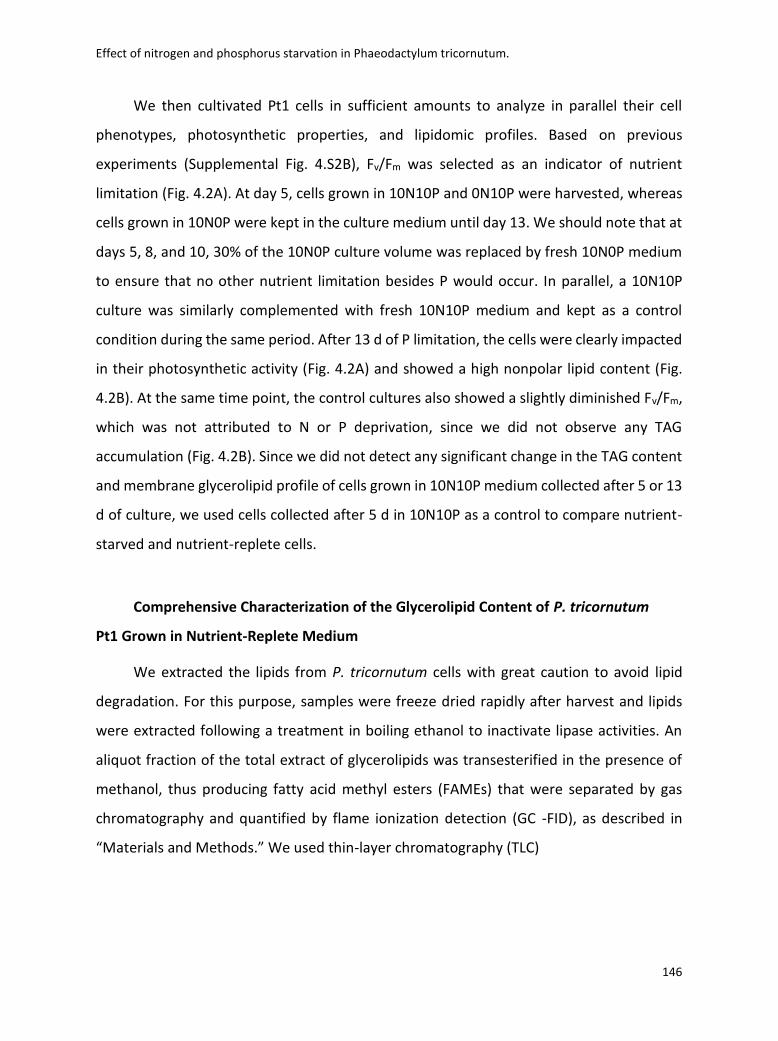
Effect of nitrogen and phosphorus starvation in Phaeodactylum tricornutum.
146
We then cultivated Pt1 cells in sufficient amounts to analyze in parallel their cell
phenotypes, photosynthetic properties, and lipidomic profiles. Based on previous
experiments (Supplemental Fig. 4.S2B), Fv/Fm was selected as an indicator of nutrient
limitation (Fig. 4.2A). At day 5, cells grown in 10N10P and 0N10P were harvested, whereas
cells grown in 10N0P were kept in the culture medium until day 13. We should note that at
days 5, 8, and 10, 30% of the 10N0P culture volume was replaced by fresh 10N0P medium
to ensure that no other nutrient limitation besides P would occur. In parallel, a 10N10P
culture was similarly complemented with fresh 10N10P medium and kept as a control
condition during the same period. After 13 d of P limitation, the cells were clearly impacted
in their photosynthetic activity (Fig. 4.2A) and showed a high nonpolar lipid content (Fig.
4.2B). At the same time point, the control cultures also showed a slightly diminished Fv/Fm,
which was not attributed to N or P deprivation, since we did not observe any TAG
accumulation (Fig. 4.2B). Since we did not detect any significant change in the TAG content
and membrane glycerolipid profile of cells grown in 10N10P medium collected after 5 or 13
d of culture, we used cells collected after 5 d in 10N10P as a control to compare nutrient-
starved and nutrient-replete cells.
Comprehensive Characterization of the Glycerolipid Content of P. tricornutum
Pt1 Grown in Nutrient-Replete Medium We extracted the lipids from P. tricornutum cells with great caution to avoid lipid
degradation. For this purpose, samples were freeze dried rapidly after harvest and lipids
were extracted following a treatment in boiling ethanol to inactivate lipase activities. An
aliquot fraction of the total extract of glycerolipids was transesterified in the presence of
methanol, thus producing fatty acid methyl esters (FAMEs) that were separated by gas
chromatography and quantified by flame ionization detection (GC -FID), as described in
“Materials and Methods.” We used thin-layer chromatography (TLC)
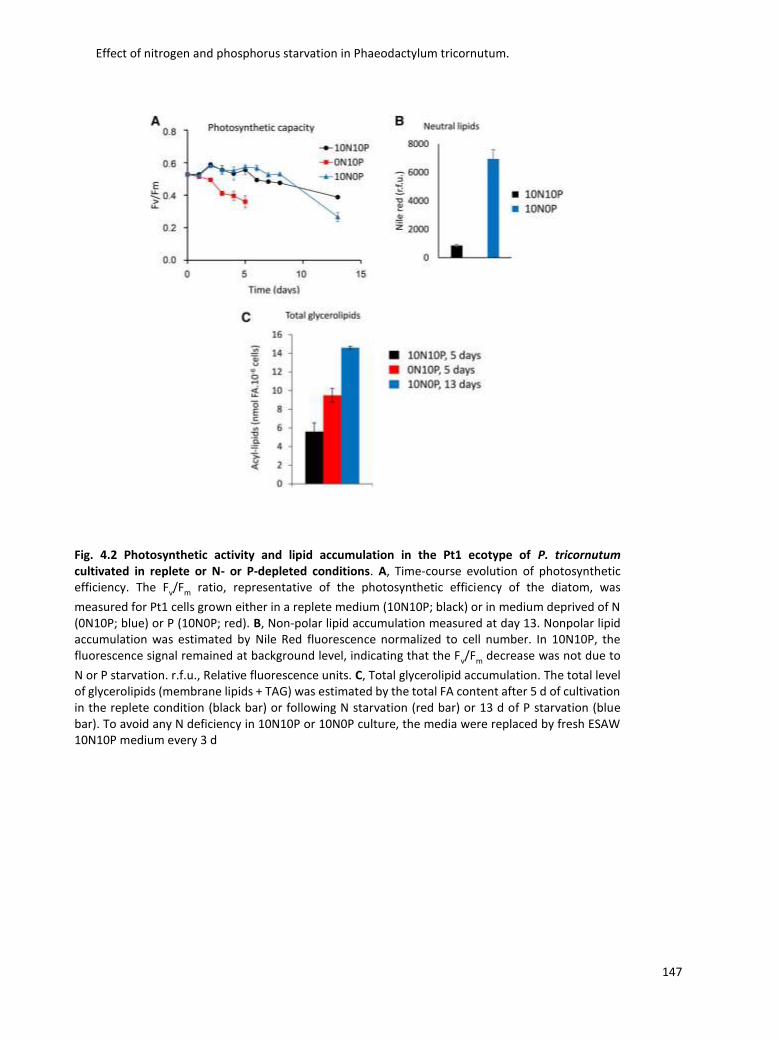
Effect of nitrogen and phosphorus starvation in Phaeodactylum tricornutum.
147
Fig. 4.2 Photosynthetic activity and lipid accumulation in the Pt1 ecotype of P. tricornutum cultivated in replete or N- or P-depleted conditions. A, Time-course evolution of photosynthetic efficiency. The Fv/Fm ratio, representative of the photosynthetic efficiency of the diatom, was
measured for Pt1 cells grown either in a replete medium (10N10P; black) or in medium deprived of N (0N10P; blue) or P (10N0P; red). B, Non-polar lipid accumulation measured at day 13. Nonpolar lipid accumulation was estimated by Nile Red fluorescence normalized to cell number. In 10N10P, the fluorescence signal remained at background level, indicating that the Fv/Fm decrease was not due to
N or P starvation. r.f.u., Relative fluorescence units. C, Total glycerolipid accumulation. The total level of glycerolipids (membrane lipids + TAG) was estimated by the total FA content after 5 d of cultivation in the replete condition (black bar) or following N starvation (red bar) or 13 d of P starvation (blue bar). To avoid any N deficiency in 10N10P or 10N0P culture, the media were replaced by fresh ESAW 10N10P medium every 3 d
Effect of nitrogen and phosphorus starvation in Phaeodactylum tricornutum.
148
to separate the different classes of glycerolipids, combining robust one-dimensional
and two dimensional TLC systems to separate, on the one hand, nonpolar glycerolipids and
free FA, and on the other hand, polar glycerolipids (phosphoglycerolipids and
nonphosphorus glycerolipids; Fig. 4.3; Supplemental Fig. 4.S3). We analyzed the structure
of lipids in each spot revealed on the TLC plate (see “Materials and Methods”) by mass
spectrometry (MS; Tables I–III) and determined the corresponding FAME profiles by GC-FID.
The total glycerolipid extract from P. tricornutum grown in a 10N10P medium had a
FA composition similar to those already reported in the literature for diatoms (Guschina
and Harwood, 2006; Liang et al., 2014) and eustigmatophytes such as Nannochloropsis
graditana (Simionato et al., 2013): that is, strikingly enriched in C16 molecular species (16:0,
16:1, 16:2, and 16:3) and eicosapentaenoic acid (20:5) and poor in C18 FAs (Fig. 4.4A).
We analyzed the different classes of glycerolipids in the extract (Fig. 4.4B), providing,
to our knowledge, the first reference for a complete glycerolipidome of P. tricornutum in
unstressed conditions. The profile is dominated by MGDG, SQDG, and PC, which together
represent more than 75% of the total content. We also confirmed the presence of 20:5 acyl-
SQDG, as reported previously (Naumann et al., 2011; Supplemental Fig. 4.S4). We identified
a spot corresponding to diacylglyceryl-hydroxy-methyl-N,N,N-trimethyl-b-alanine (DGTA;
Figs. 4.3 and 4.4B; Supplemental Fig. 4.S3), a betaine glycerolipid that had not yet been
reported for P. tricornutum but has been reported for other algae such as Phaeocystis sp.
(Haptophycea), Ochromonas danica (Chrysophyceae), and some brown algae such as Fucus
vesiculus (Phaeophyceae; Dembitsky, 1996). DGTA has the same mass as diacylglyceryl-
N,N,N-trimethylhomoserine (DGTS) but could be discriminated by a different migration
position on two-dimensional TLC (Vogel and Eichenberger, 1992) and, following tandem
mass spectrometry (MS2) fragmentation, by the absence of a fragment
Effect of nitrogen and phosphorus starvation in Phaeodactylum tricornutum.
149
corresponding to a loss of mass-to-charge ratio (m/z 87; Armada et al., 2013). We did
not detect the presence of DGTS in P. tricornutum.
Nonpolar lipids, DAG and TAG, are also present but in minor amounts (e.g. TAG
represented only 1%– 3% of the total glycerolipids when cells were grown in the 10N10P
medium; Fig. 4.4B). We were not able to identify in our TLC system any spot corresponding
to phosphatidic acid, diphosphatidylglycerol, and phosphatidylSer. This does not mean that
these phospholipids are absent in P. tricornutum but indicates that they each represent less
than 1% of the total glycerolipid content. Overall, the main lipids are the four chloroplast
lipids present in every photosynthetic membrane (i.e. MGDG, SQDG, DGDG, and PG)
together with PC, which is usually the main glycerolipid in nonplastid membranes, although
in diatoms its abundance in the four membranes surrounding the chloroplast cannot be
excluded.
Fig. 4.3 Separation by TLC of the glycerolipids from P. tricornutum. Lipids from Pt1 cells grown in a replete medium (10N10P) were extracted and resolved following the procedures described in “Materials and Methods.” The cross indicates the initial deposit. A, One-dimensional separation of nonpolar lipids (DAG and TAG) and free FA (FFA). Migration was performed in hexane: diethylether:acetic acid (70:30:1, v/v). B, Two-dimensional separation of polar (membrane) lipids. Migration was performed in chloroform:methanol:water (65:25:4, v/v) for the first dimension (arrow 1) and chloroform:acetone:methanol:acetic acid:water (50:20:10:10:5, v/v) for the second migration (arrow 2). Lipids were visualized under UV light, after spraying with 2% 8-anilino-1-naphthalenesulfonic acid in methanol, and scraped off the plate for analyses. Identification of the lipid in each spot was performed by MS2 analyses. The spot circled in white is an unknown compound with a structure that differs from a glycerolipid.
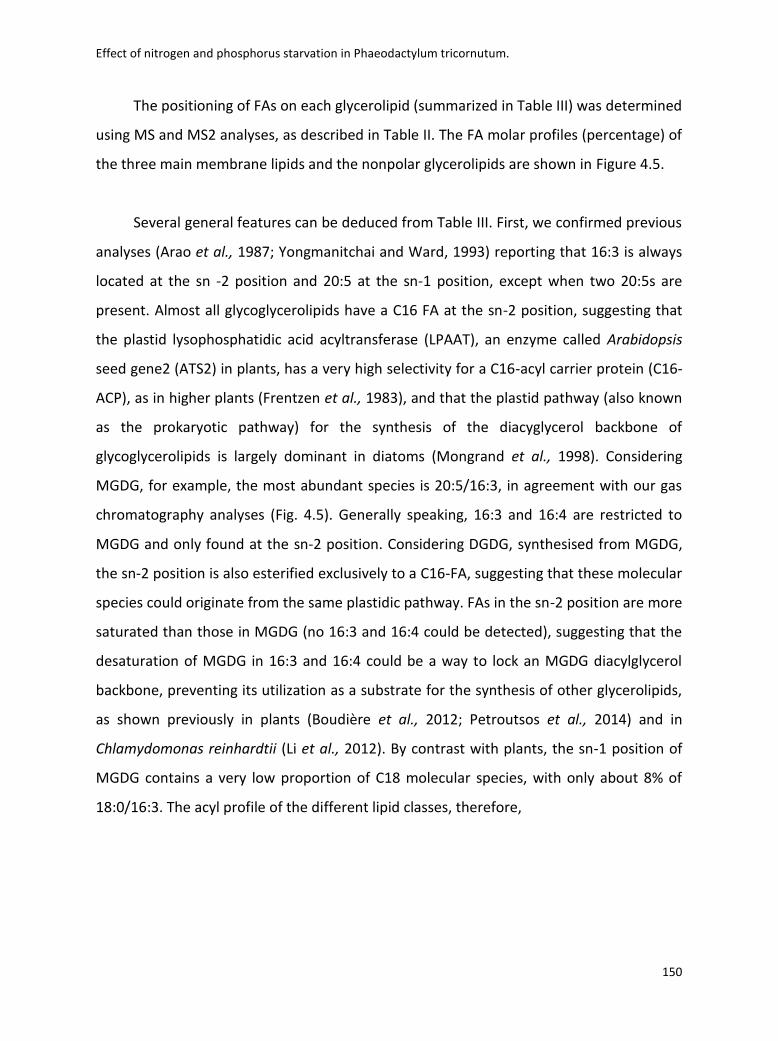
Effect of nitrogen and phosphorus starvation in Phaeodactylum tricornutum.
150
The positioning of FAs on each glycerolipid (summarized in Table III) was determined
using MS and MS2 analyses, as described in Table II. The FA molar profiles (percentage) of
the three main membrane lipids and the nonpolar glycerolipids are shown in Figure 4.5.
Several general features can be deduced from Table III. First, we confirmed previous
analyses (Arao et al., 1987; Yongmanitchai and Ward, 1993) reporting that 16:3 is always
located at the sn -2 position and 20:5 at the sn-1 position, except when two 20:5s are
present. Almost all glycoglycerolipids have a C16 FA at the sn-2 position, suggesting that
the plastid lysophosphatidic acid acyltransferase (LPAAT), an enzyme called Arabidopsis
seed gene2 (ATS2) in plants, has a very high selectivity for a C16-acyl carrier protein (C16-
ACP), as in higher plants (Frentzen et al., 1983), and that the plastid pathway (also known
as the prokaryotic pathway) for the synthesis of the diacyglycerol backbone of
glycoglycerolipids is largely dominant in diatoms (Mongrand et al., 1998). Considering
MGDG, for example, the most abundant species is 20:5/16:3, in agreement with our gas
chromatography analyses (Fig. 4.5). Generally speaking, 16:3 and 16:4 are restricted to
MGDG and only found at the sn-2 position. Considering DGDG, synthesised from MGDG,
the sn-2 position is also esterified exclusively to a C16-FA, suggesting that these molecular
species could originate from the same plastidic pathway. FAs in the sn-2 position are more
saturated than those in MGDG (no 16:3 and 16:4 could be detected), suggesting that the
desaturation of MGDG in 16:3 and 16:4 could be a way to lock an MGDG diacylglycerol
backbone, preventing its utilization as a substrate for the synthesis of other glycerolipids,
as shown previously in plants (Boudière et al., 2012; Petroutsos et al., 2014) and in
Chlamydomonas reinhardtii (Li et al., 2012). By contrast with plants, the sn-1 position of
MGDG contains a very low proportion of C18 molecular species, with only about 8% of
18:0/16:3. The acyl profile of the different lipid classes, therefore,
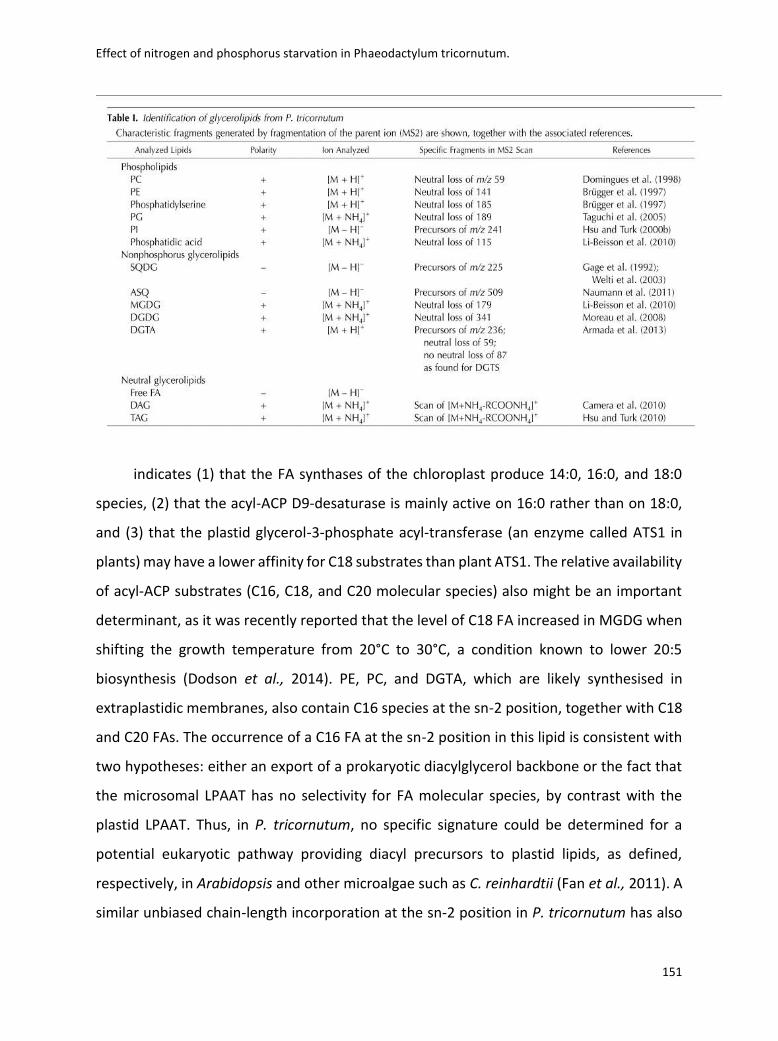
Effect of nitrogen and phosphorus starvation in Phaeodactylum tricornutum.
151
indicates (1) that the FA synthases of the chloroplast produce 14:0, 16:0, and 18:0
species, (2) that the acyl-ACP D9-desaturase is mainly active on 16:0 rather than on 18:0,
and (3) that the plastid glycerol-3-phosphate acyl-transferase (an enzyme called ATS1 in
plants) may have a lower affinity for C18 substrates than plant ATS1. The relative availability
of acyl-ACP substrates (C16, C18, and C20 molecular species) also might be an important
determinant, as it was recently reported that the level of C18 FA increased in MGDG when
shifting the growth temperature from 20°C to 30°C, a condition known to lower 20:5
biosynthesis (Dodson et al., 2014). PE, PC, and DGTA, which are likely synthesised in
extraplastidic membranes, also contain C16 species at the sn-2 position, together with C18
and C20 FAs. The occurrence of a C16 FA at the sn-2 position in this lipid is consistent with
two hypotheses: either an export of a prokaryotic diacylglycerol backbone or the fact that
the microsomal LPAAT has no selectivity for FA molecular species, by contrast with the
plastid LPAAT. Thus, in P. tricornutum, no specific signature could be determined for a
potential eukaryotic pathway providing diacyl precursors to plastid lipids, as defined,
respectively, in Arabidopsis and other microalgae such as C. reinhardtii (Fan et al., 2011). A
similar unbiased chain-length incorporation at the sn-2 position in P. tricornutum has also
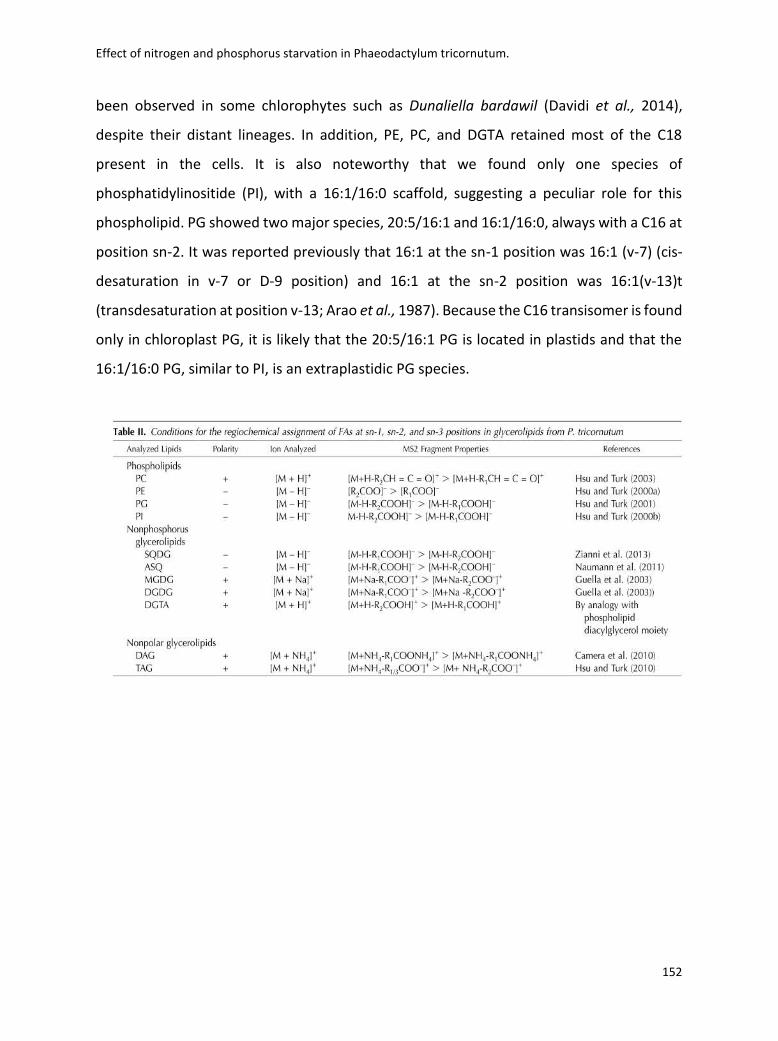
Effect of nitrogen and phosphorus starvation in Phaeodactylum tricornutum.
152
been observed in some chlorophytes such as Dunaliella bardawil (Davidi et al., 2014),
despite their distant lineages. In addition, PE, PC, and DGTA retained most of the C18
present in the cells. It is also noteworthy that we found only one species of
phosphatidylinositide (PI), with a 16:1/16:0 scaffold, suggesting a peculiar role for this
phospholipid. PG showed two major species, 20:5/16:1 and 16:1/16:0, always with a C16 at
position sn-2. It was reported previously that 16:1 at the sn-1 position was 16:1 (v-7) (cis-
desaturation in v-7 or D-9 position) and 16:1 at the sn-2 position was 16:1(v-13)t
(transdesaturation at position v-13; Arao et al., 1987). Because the C16 transisomer is found
only in chloroplast PG, it is likely that the 20:5/16:1 PG is located in plastids and that the
16:1/16:0 PG, similar to PI, is an extraplastidic PG species.
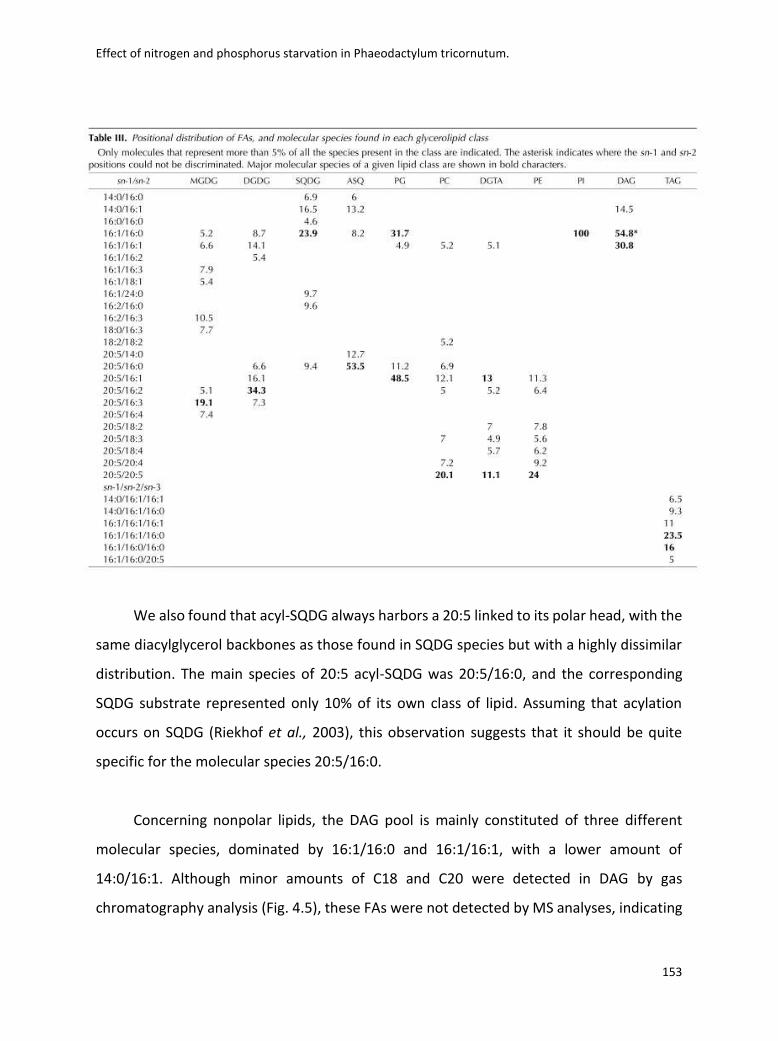
Effect of nitrogen and phosphorus starvation in Phaeodactylum tricornutum.
153
We also found that acyl-SQDG always harbors a 20:5 linked to its polar head, with the
same diacylglycerol backbones as those found in SQDG species but with a highly dissimilar
distribution. The main species of 20:5 acyl-SQDG was 20:5/16:0, and the corresponding
SQDG substrate represented only 10% of its own class of lipid. Assuming that acylation
occurs on SQDG (Riekhof et al., 2003), this observation suggests that it should be quite
specific for the molecular species 20:5/16:0.
Concerning nonpolar lipids, the DAG pool is mainly constituted of three different
molecular species, dominated by 16:1/16:0 and 16:1/16:1, with a lower amount of
14:0/16:1. Although minor amounts of C18 and C20 were detected in DAG by gas
chromatography analysis (Fig. 4.5), these FAs were not detected by MS analyses, indicating
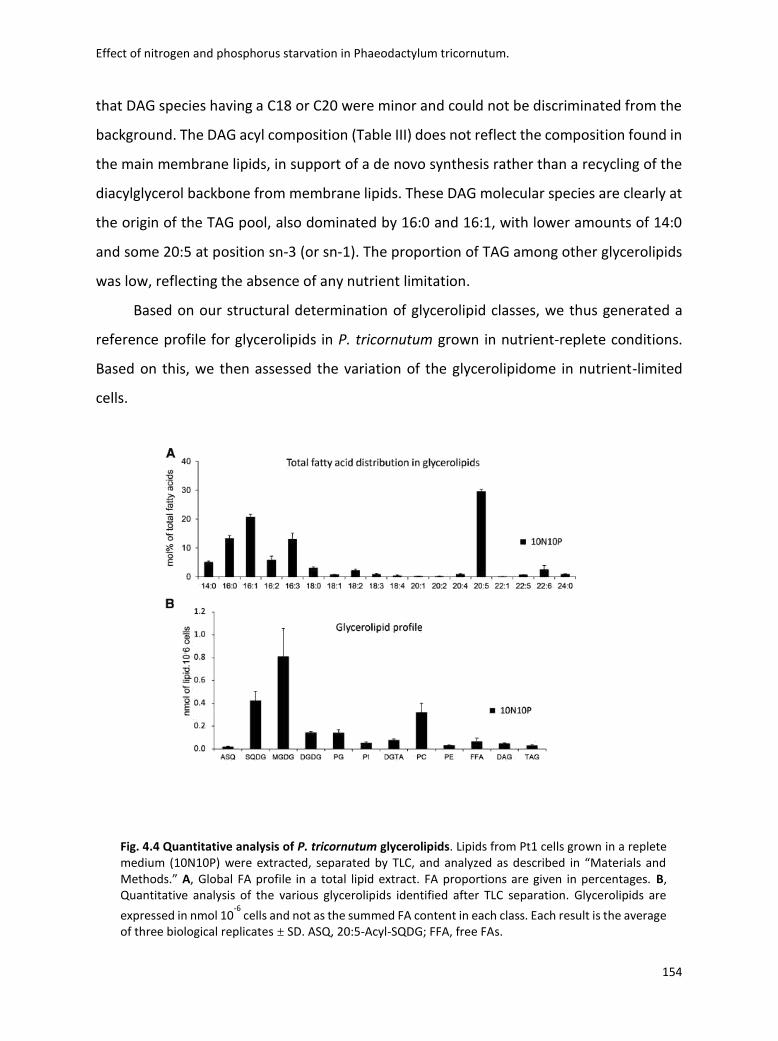
Effect of nitrogen and phosphorus starvation in Phaeodactylum tricornutum.
154
that DAG species having a C18 or C20 were minor and could not be discriminated from the
background. The DAG acyl composition (Table III) does not reflect the composition found in
the main membrane lipids, in support of a de novo synthesis rather than a recycling of the
diacylglycerol backbone from membrane lipids. These DAG molecular species are clearly at
the origin of the TAG pool, also dominated by 16:0 and 16:1, with lower amounts of 14:0
and some 20:5 at position sn-3 (or sn-1). The proportion of TAG among other glycerolipids
was low, reflecting the absence of any nutrient limitation.
Based on our structural determination of glycerolipid classes, we thus generated a
reference profile for glycerolipids in P. tricornutum grown in nutrient-replete conditions.
Based on this, we then assessed the variation of the glycerolipidome in nutrient-limited
cells.
Fig. 4.4 Quantitative analysis of P. tricornutum glycerolipids. Lipids from Pt1 cells grown in a replete medium (10N10P) were extracted, separated by TLC, and analyzed as described in “Materials and Methods.” A, Global FA profile in a total lipid extract. FA proportions are given in percentages. B, Quantitative analysis of the various glycerolipids identified after TLC separation. Glycerolipids are
expressed in nmol 10-6
cells and not as the summed FA content in each class. Each result is the average of three biological replicates ± SD. ASQ, 20:5-Acyl-SQDG; FFA, free FAs.
Effect of nitrogen and phosphorus starvation in Phaeodactylum tricornutum.
155
Impact of N and P Shortage on the Glycerolipid Content of P. tricornutum Pt1
We analyzed the glycerolipid profile in P. tricornutum Pt1 cells after 5 d of N starvation
and 13 d of P starvation: that is, when strong impacts on both the photosynthetic capacity
(based on the Fv/Fm ratio) and the nonpolar lipid content (based on Nile Red staining) could
be observed (Figs.1 and 2). Figure 4.6A shows the glycerolipid profile in the three contexts:
control (10N10P), N oligotrophic (0N10P), and P oligotrophic (10N0P). We observed the
following trends. (1) A considerable increase of TAG content, on a per cell basis, was
observed in both N- and P-limiting conditions, reaching 40 and 60%, respectively, of the
total glycerolipid content (i.e. a 45 -fold and a 100-fold increase when compared with
control conditions). (2) The MGDG content decreased in both conditions. This decrease was
more pronounced in the case of N shortage, whereas the levels of the other membrane
lipids remained almost unchanged, except for PG, which also decreased by a factor of 2. (3)
A total disappearance of the phospholipids was observed in the P-starved condition,
including the major phospholipids PC and PG, coinciding with a strong increase of DGTA and
slight increases of DGDG and SQDG.
The nature and amounts of FA, measured as a whole (Fig. 4.6B), were also affected
by nutrient limitation, with marked increases of 16:0 and 16:1 and a smaller albeit
significant increase of 14:0, in support of an induced FA neosynthesis. Interestingly, the
total amount of 20:5, the dominant FA in the control condition, remained almost
unchanged. Thus, in the nutrient-limiting conditions, the dominant FA is no longer 20:5 but
16:1. Generally speaking, with the notable exception of TAG, the FA composition remained
unchanged in the different glycerolipids (data not shown). A specific focus on TAG (Fig. 4.6C)
indicated that not only 14:0, 16:0, and 16:1 but also 20:5 increased. In fact, the proportion
of 20:5 in this class of lipids increased from about 1% in the control conditions to 8% in the
N-starved and 6% in the P-starved conditions, suggesting a specific enrichment of 20:5 in
TAG. MS analysis indicated that 20:5, as observed in control cells, was esterified at the sn-
3 (or sn-1) position, indicating that this FA had been incorporated during the latter phases
of TAG biosynthesis.
Effect of nitrogen and phosphorus starvation in Phaeodactylum tricornutum.
156
In order to better understand the origin of these FAs accumulating in TAGs, we
measured the amount of 16:1 and 20:5 in each glycerolipid (Fig. 4.7A). The level of 16:1
remained approximately constant in all glycerolipids except in TAG, indicating that the
observed increase of 16:1 (Fig. 4.6B) was mainly, if not only, correlated to the increase of
TAG synthesis and reflected FA neosynthesis. In the N -starved condition, the level of 20:5
increased in TAG and decreased in MGDG by about the same amount (Fig. 4.7B). Because
it almost remained constant in the other glycerolipids, this result suggests a 20:5 transfer
from MGDG to TAG, as observed previously in N. graditana (Simionato et al., 2013) and C.
reinhardtii (Fan et al., 2011).
In the P-limiting conditions, the situation was more complex. A stronger increase of
20:5 was observed in the TAG pool, together with a smaller decrease in the MGDG pool
than was observed in N-starved cells. No phospholipid, containing initially a high proportion
of 20:5, could be detected. Recycling of phospholipid FAs, therefore, also could contribute
to the 20:5 enrichment of TAG. Furthermore, an increase of SQDG and DGTA was observed
(Fig. 4.6A), consistent with (1) a PG replacement by SQDG in the plastid and (2) a possible
recycling of the PC diacylglycerol moiety into DGTA, taking place in an extraplastidic
membrane. This hypothesis is based on the strong increase of 20:5 in DGTA, likely reflecting
the quantitative increase of the DGTA pool (Fig. 4.6A) rather than a specific 20:5
enrichment, because the global FA composition remained largely unaffected.
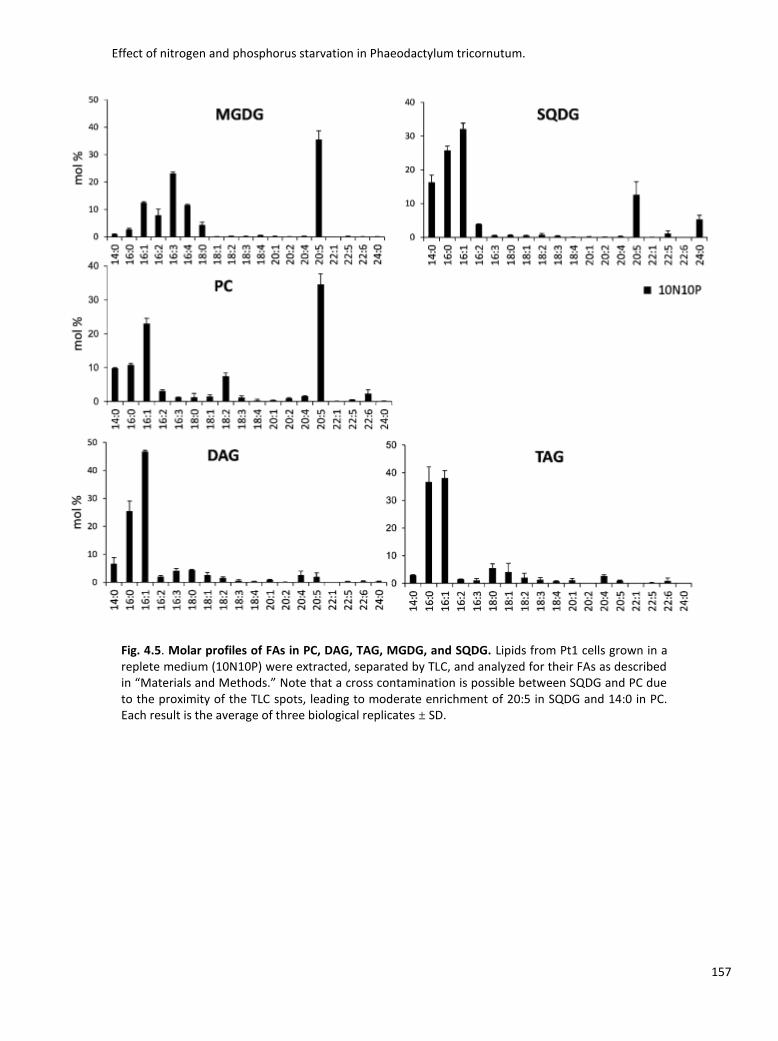
Effect of nitrogen and phosphorus starvation in Phaeodactylum tricornutum.
157
Fig. 4.5. Molar profiles of FAs in PC, DAG, TAG, MGDG, and SQDG. Lipids from Pt1 cells grown in a replete medium (10N10P) were extracted, separated by TLC, and analyzed for their FAs as described in “Materials and Methods.” Note that a cross contamination is possible between SQDG and PC due to the proximity of the TLC spots, leading to moderate enrichment of 20:5 in SQDG and 14:0 in PC. Each result is the average of three biological replicates ± SD.
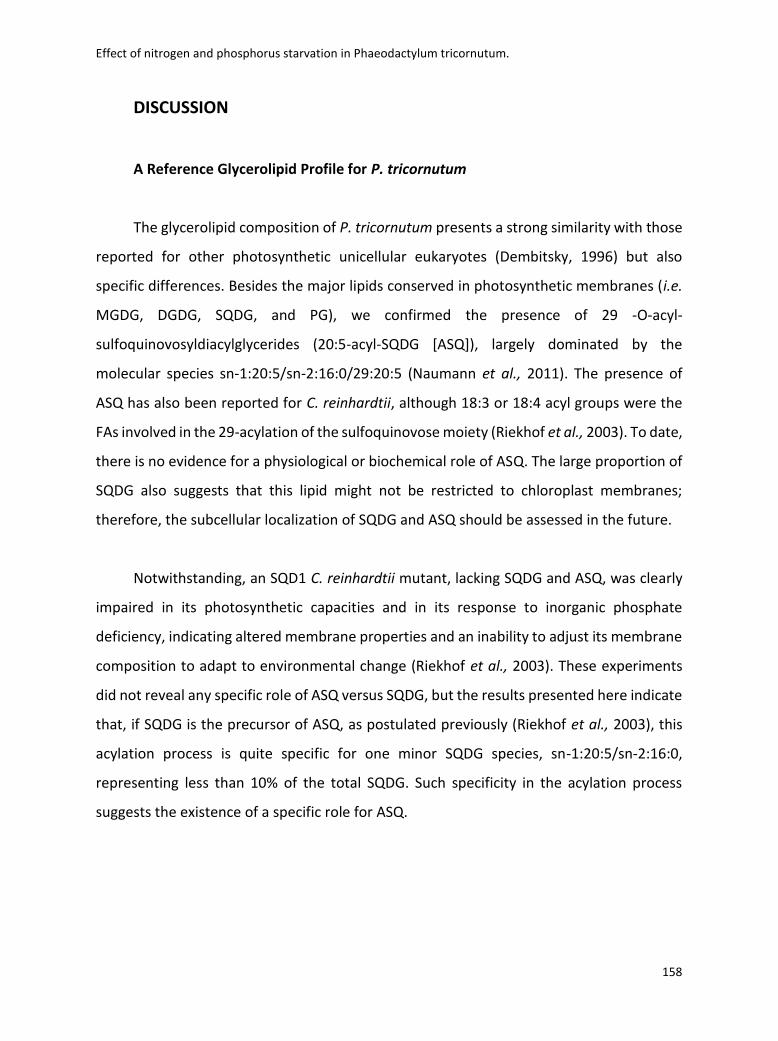
Effect of nitrogen and phosphorus starvation in Phaeodactylum tricornutum.
158
DISCUSSION
A Reference Glycerolipid Profile for P. tricornutum
The glycerolipid composition of P. tricornutum presents a strong similarity with those
reported for other photosynthetic unicellular eukaryotes (Dembitsky, 1996) but also
specific differences. Besides the major lipids conserved in photosynthetic membranes (i.e.
MGDG, DGDG, SQDG, and PG), we confirmed the presence of 29 -O-acyl-
sulfoquinovosyldiacylglycerides (20:5-acyl-SQDG [ASQ]), largely dominated by the
molecular species sn-1:20:5/sn-2:16:0/29:20:5 (Naumann et al., 2011). The presence of
ASQ has also been reported for C. reinhardtii, although 18:3 or 18:4 acyl groups were the
FAs involved in the 29-acylation of the sulfoquinovose moiety (Riekhof et al., 2003). To date,
there is no evidence for a physiological or biochemical role of ASQ. The large proportion of
SQDG also suggests that this lipid might not be restricted to chloroplast membranes;
therefore, the subcellular localization of SQDG and ASQ should be assessed in the future.
Notwithstanding, an SQD1 C. reinhardtii mutant, lacking SQDG and ASQ, was clearly
impaired in its photosynthetic capacities and in its response to inorganic phosphate
deficiency, indicating altered membrane properties and an inability to adjust its membrane
composition to adapt to environmental change (Riekhof et al., 2003). These experiments
did not reveal any specific role of ASQ versus SQDG, but the results presented here indicate
that, if SQDG is the precursor of ASQ, as postulated previously (Riekhof et al., 2003), this
acylation process is quite specific for one minor SQDG species, sn-1:20:5/sn-2:16:0,
representing less than 10% of the total SQDG. Such specificity in the acylation process
suggests the existence of a specific role for ASQ.
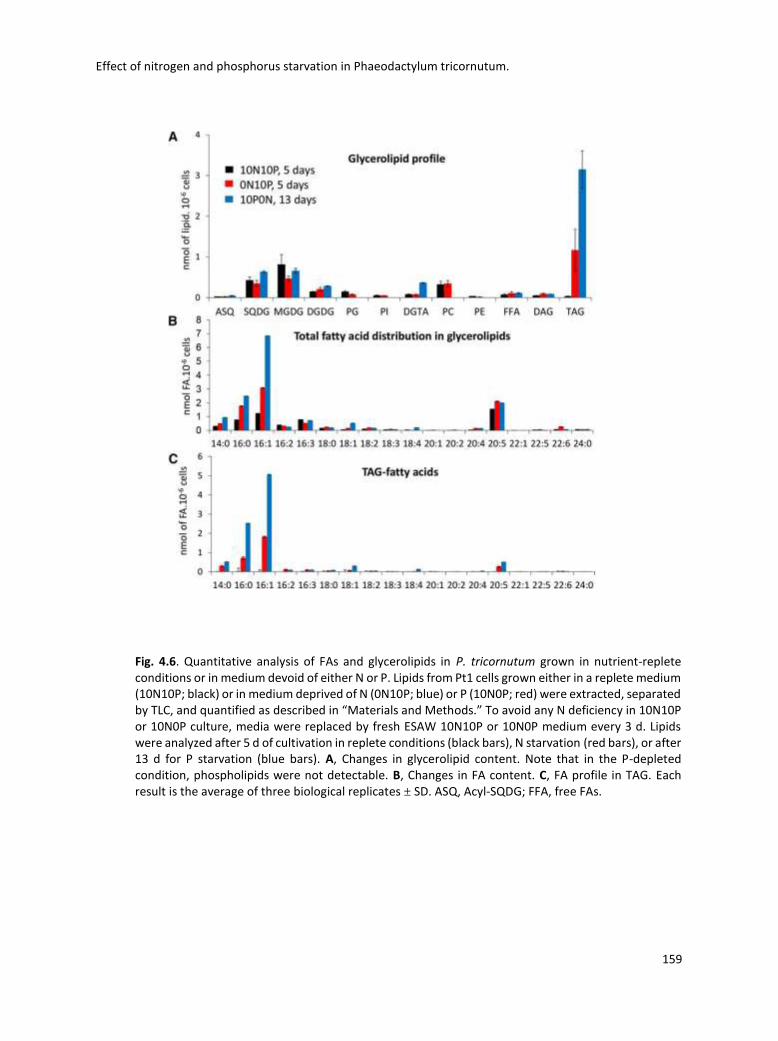
Effect of nitrogen and phosphorus starvation in Phaeodactylum tricornutum.
159
Fig. 4.6. Quantitative analysis of FAs and glycerolipids in P. tricornutum grown in nutrient-replete conditions or in medium devoid of either N or P. Lipids from Pt1 cells grown either in a replete medium (10N10P; black) or in medium deprived of N (0N10P; blue) or P (10N0P; red) were extracted, separated by TLC, and quantified as described in “Materials and Methods.” To avoid any N deficiency in 10N10P or 10N0P culture, media were replaced by fresh ESAW 10N10P or 10N0P medium every 3 d. Lipids were analyzed after 5 d of cultivation in replete conditions (black bars), N starvation (red bars), or after 13 d for P starvation (blue bars). A, Changes in glycerolipid content. Note that in the P-depleted condition, phospholipids were not detectable. B, Changes in FA content. C, FA profile in TAG. Each result is the average of three biological replicates ± SD. ASQ, Acyl-SQDG; FFA, free FAs.
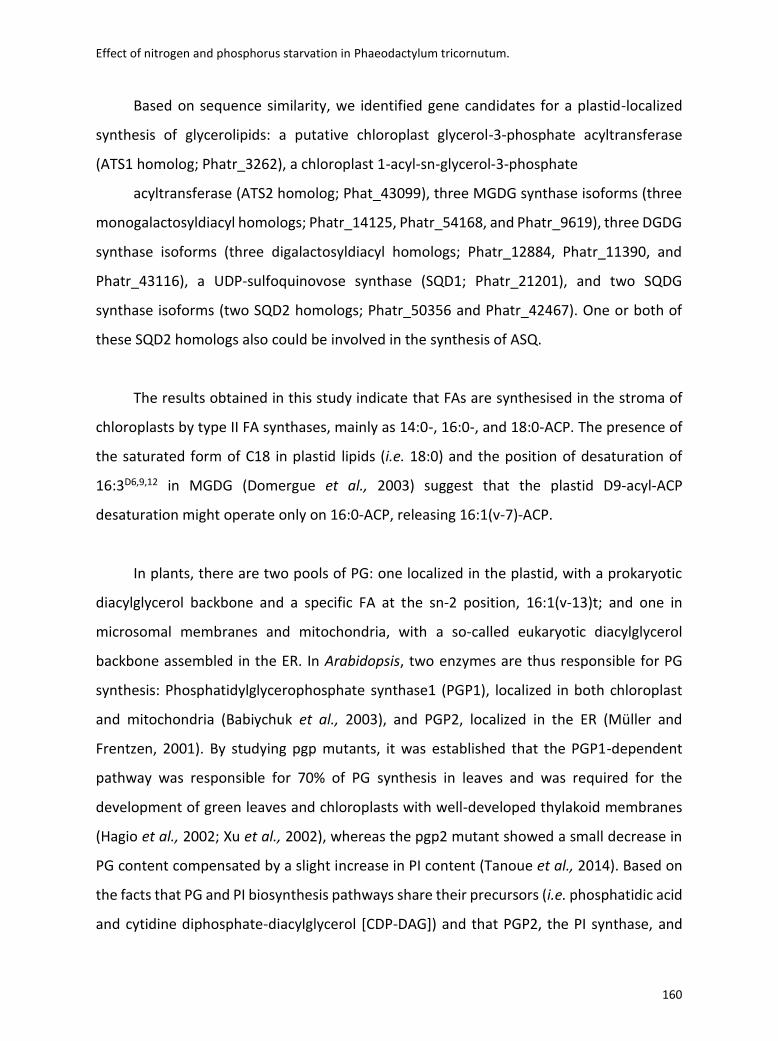
Effect of nitrogen and phosphorus starvation in Phaeodactylum tricornutum.
160
Based on sequence similarity, we identified gene candidates for a plastid-localized
synthesis of glycerolipids: a putative chloroplast glycerol-3-phosphate acyltransferase
(ATS1 homolog; Phatr_3262), a chloroplast 1-acyl-sn-glycerol-3-phosphate
acyltransferase (ATS2 homolog; Phat_43099), three MGDG synthase isoforms (three
monogalactosyldiacyl homologs; Phatr_14125, Phatr_54168, and Phatr_9619), three DGDG
synthase isoforms (three digalactosyldiacyl homologs; Phatr_12884, Phatr_11390, and
Phatr_43116), a UDP-sulfoquinovose synthase (SQD1; Phatr_21201), and two SQDG
synthase isoforms (two SQD2 homologs; Phatr_50356 and Phatr_42467). One or both of
these SQD2 homologs also could be involved in the synthesis of ASQ.
The results obtained in this study indicate that FAs are synthesised in the stroma of
chloroplasts by type II FA synthases, mainly as 14:0-, 16:0-, and 18:0-ACP. The presence of
the saturated form of C18 in plastid lipids (i.e. 18:0) and the position of desaturation of
16:3D6,9,12 in MGDG (Domergue et al., 2003) suggest that the plastid D9-acyl-ACP
desaturation might operate only on 16:0-ACP, releasing 16:1(v-7)-ACP.
In plants, there are two pools of PG: one localized in the plastid, with a prokaryotic
diacylglycerol backbone and a specific FA at the sn-2 position, 16:1(v-13)t; and one in
microsomal membranes and mitochondria, with a so-called eukaryotic diacylglycerol
backbone assembled in the ER. In Arabidopsis, two enzymes are thus responsible for PG
synthesis: Phosphatidylglycerophosphate synthase1 (PGP1), localized in both chloroplast
and mitochondria (Babiychuk et al., 2003), and PGP2, localized in the ER (Müller and
Frentzen, 2001). By studying pgp mutants, it was established that the PGP1-dependent
pathway was responsible for 70% of PG synthesis in leaves and was required for the
development of green leaves and chloroplasts with well-developed thylakoid membranes
(Hagio et al., 2002; Xu et al., 2002), whereas the pgp2 mutant showed a small decrease in
PG content compensated by a slight increase in PI content (Tanoue et al., 2014). Based on
the facts that PG and PI biosynthesis pathways share their precursors (i.e. phosphatidic acid
and cytidine diphosphate-diacylglycerol [CDP-DAG]) and that PGP2, the PI synthase, and
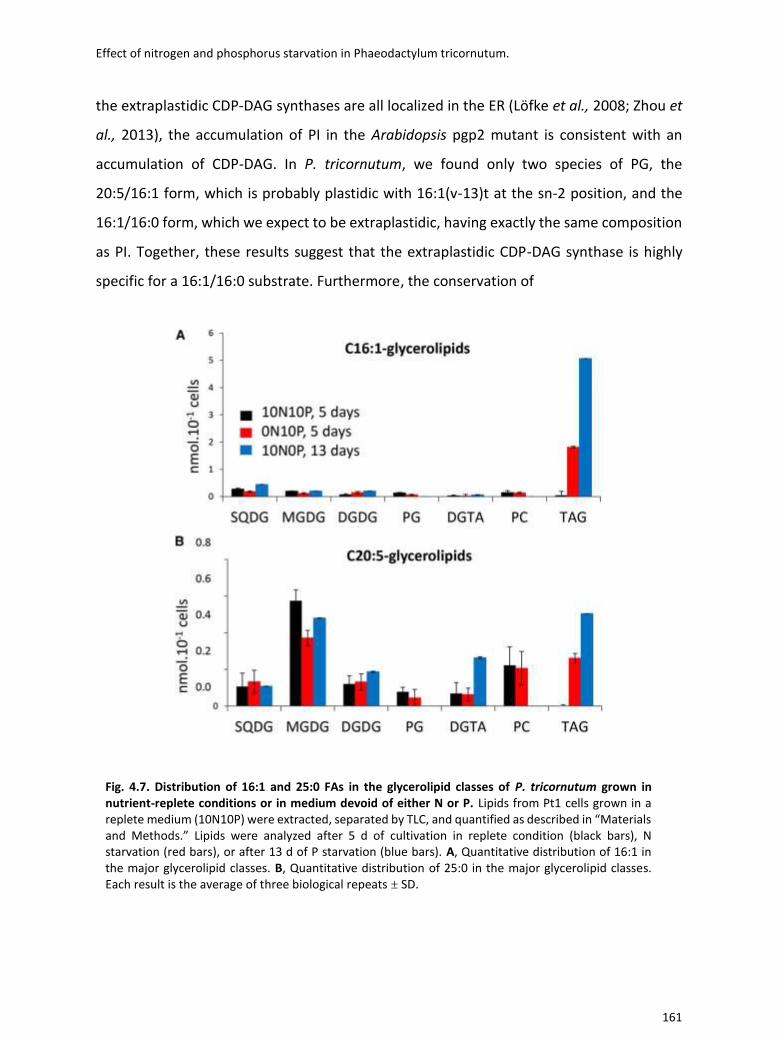
Effect of nitrogen and phosphorus starvation in Phaeodactylum tricornutum.
161
the extraplastidic CDP-DAG synthases are all localized in the ER (Löfke et al., 2008; Zhou et
al., 2013), the accumulation of PI in the Arabidopsis pgp2 mutant is consistent with an
accumulation of CDP-DAG. In P. tricornutum, we found only two species of PG, the
20:5/16:1 form, which is probably plastidic with 16:1(v-13)t at the sn-2 position, and the
16:1/16:0 form, which we expect to be extraplastidic, having exactly the same composition
as PI. Together, these results suggest that the extraplastidic CDP-DAG synthase is highly
specific for a 16:1/16:0 substrate. Furthermore, the conservation of
Fig. 4.7. Distribution of 16:1 and 25:0 FAs in the glycerolipid classes of P. tricornutum grown in nutrient-replete conditions or in medium devoid of either N or P. Lipids from Pt1 cells grown in a replete medium (10N10P) were extracted, separated by TLC, and quantified as described in “Materials and Methods.” Lipids were analyzed after 5 d of cultivation in replete condition (black bars), N starvation (red bars), or after 13 d of P starvation (blue bars). A, Quantitative distribution of 16:1 in the major glycerolipid classes. B, Quantitative distribution of 25:0 in the major glycerolipid classes. Each result is the average of three biological repeats ± SD.
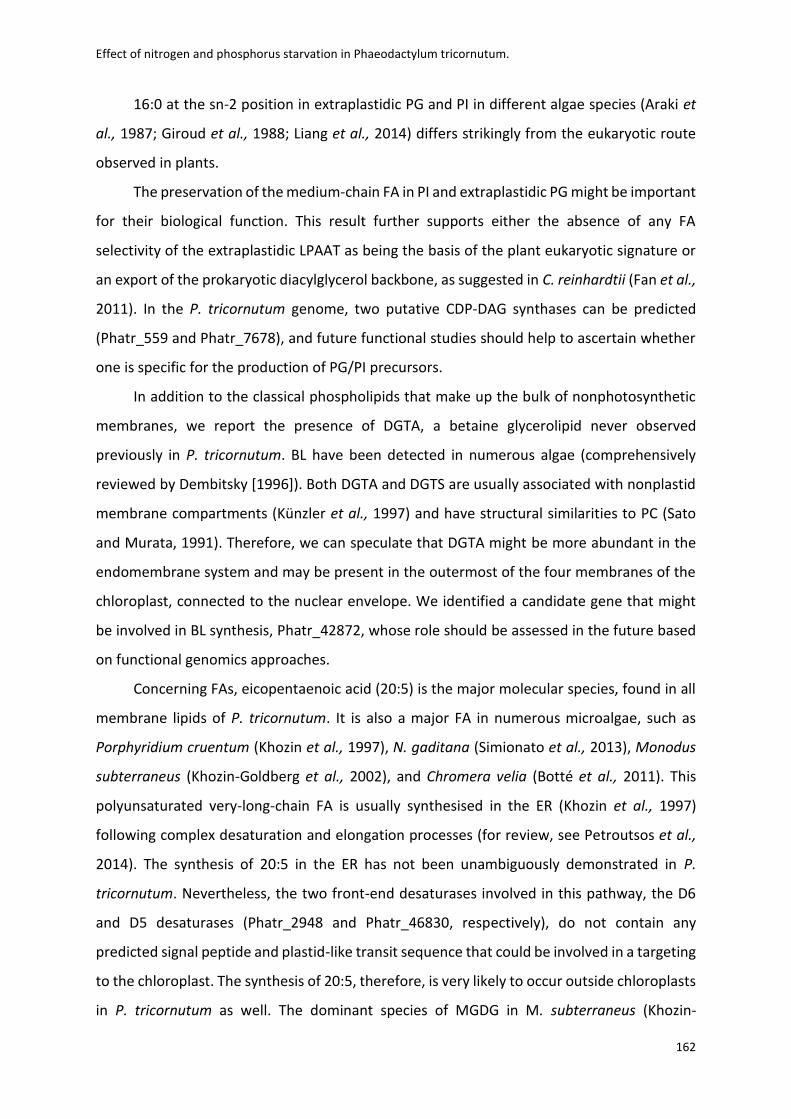
Effect of nitrogen and phosphorus starvation in Phaeodactylum tricornutum.
162
16:0 at the sn-2 position in extraplastidic PG and PI in different algae species (Araki et
al., 1987; Giroud et al., 1988; Liang et al., 2014) differs strikingly from the eukaryotic route
observed in plants.
The preservation of the medium-chain FA in PI and extraplastidic PG might be important
for their biological function. This result further supports either the absence of any FA
selectivity of the extraplastidic LPAAT as being the basis of the plant eukaryotic signature or
an export of the prokaryotic diacylglycerol backbone, as suggested in C. reinhardtii (Fan et al.,
2011). In the P. tricornutum genome, two putative CDP-DAG synthases can be predicted
(Phatr_559 and Phatr_7678), and future functional studies should help to ascertain whether
one is specific for the production of PG/PI precursors.
In addition to the classical phospholipids that make up the bulk of nonphotosynthetic
membranes, we report the presence of DGTA, a betaine glycerolipid never observed
previously in P. tricornutum. BL have been detected in numerous algae (comprehensively
reviewed by Dembitsky [1996]). Both DGTA and DGTS are usually associated with nonplastid
membrane compartments (Künzler et al., 1997) and have structural similarities to PC (Sato
and Murata, 1991). Therefore, we can speculate that DGTA might be more abundant in the
endomembrane system and may be present in the outermost of the four membranes of the
chloroplast, connected to the nuclear envelope. We identified a candidate gene that might
be involved in BL synthesis, Phatr_42872, whose role should be assessed in the future based
on functional genomics approaches.
Concerning FAs, eicopentaenoic acid (20:5) is the major molecular species, found in all
membrane lipids of P. tricornutum. It is also a major FA in numerous microalgae, such as
Porphyridium cruentum (Khozin et al., 1997), N. gaditana (Simionato et al., 2013), Monodus
subterraneus (Khozin-Goldberg et al., 2002), and Chromera velia (Botté et al., 2011). This
polyunsaturated very-long-chain FA is usually synthesised in the ER (Khozin et al., 1997)
following complex desaturation and elongation processes (for review, see Petroutsos et al.,
2014). The synthesis of 20:5 in the ER has not been unambiguously demonstrated in P.
tricornutum. Nevertheless, the two front-end desaturases involved in this pathway, the D6
and D5 desaturases (Phatr_2948 and Phatr_46830, respectively), do not contain any
predicted signal peptide and plastid-like transit sequence that could be involved in a targeting
to the chloroplast. The synthesis of 20:5, therefore, is very likely to occur outside chloroplasts
in P. tricornutum as well. The dominant species of MGDG in M. subterraneus (Khozin-
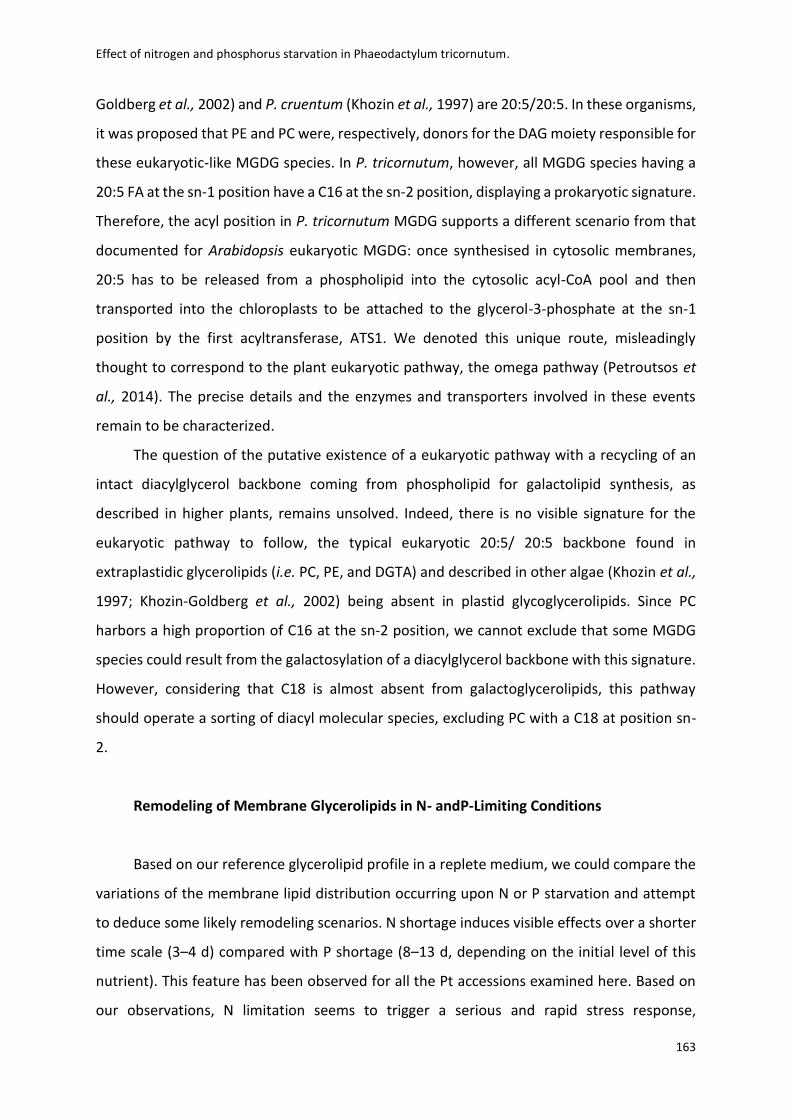
Effect of nitrogen and phosphorus starvation in Phaeodactylum tricornutum.
163
Goldberg et al., 2002) and P. cruentum (Khozin et al., 1997) are 20:5/20:5. In these organisms,
it was proposed that PE and PC were, respectively, donors for the DAG moiety responsible for
these eukaryotic-like MGDG species. In P. tricornutum, however, all MGDG species having a
20:5 FA at the sn-1 position have a C16 at the sn-2 position, displaying a prokaryotic signature.
Therefore, the acyl position in P. tricornutum MGDG supports a different scenario from that
documented for Arabidopsis eukaryotic MGDG: once synthesised in cytosolic membranes,
20:5 has to be released from a phospholipid into the cytosolic acyl-CoA pool and then
transported into the chloroplasts to be attached to the glycerol-3-phosphate at the sn-1
position by the first acyltransferase, ATS1. We denoted this unique route, misleadingly
thought to correspond to the plant eukaryotic pathway, the omega pathway (Petroutsos et
al., 2014). The precise details and the enzymes and transporters involved in these events
remain to be characterized.
The question of the putative existence of a eukaryotic pathway with a recycling of an
intact diacylglycerol backbone coming from phospholipid for galactolipid synthesis, as
described in higher plants, remains unsolved. Indeed, there is no visible signature for the
eukaryotic pathway to follow, the typical eukaryotic 20:5/ 20:5 backbone found in
extraplastidic glycerolipids (i.e. PC, PE, and DGTA) and described in other algae (Khozin et al.,
1997; Khozin-Goldberg et al., 2002) being absent in plastid glycoglycerolipids. Since PC
harbors a high proportion of C16 at the sn-2 position, we cannot exclude that some MGDG
species could result from the galactosylation of a diacylglycerol backbone with this signature.
However, considering that C18 is almost absent from galactoglycerolipids, this pathway
should operate a sorting of diacyl molecular species, excluding PC with a C18 at position sn-
2.
Remodeling of Membrane Glycerolipids in N- andP-Limiting Conditions
Based on our reference glycerolipid profile in a replete medium, we could compare the
variations of the membrane lipid distribution occurring upon N or P starvation and attempt
to deduce some likely remodeling scenarios. N shortage induces visible effects over a shorter
time scale (3–4 d) compared with P shortage (8–13 d, depending on the initial level of this
nutrient). This feature has been observed for all the Pt accessions examined here. Based on
our observations, N limitation seems to trigger a serious and rapid stress response,
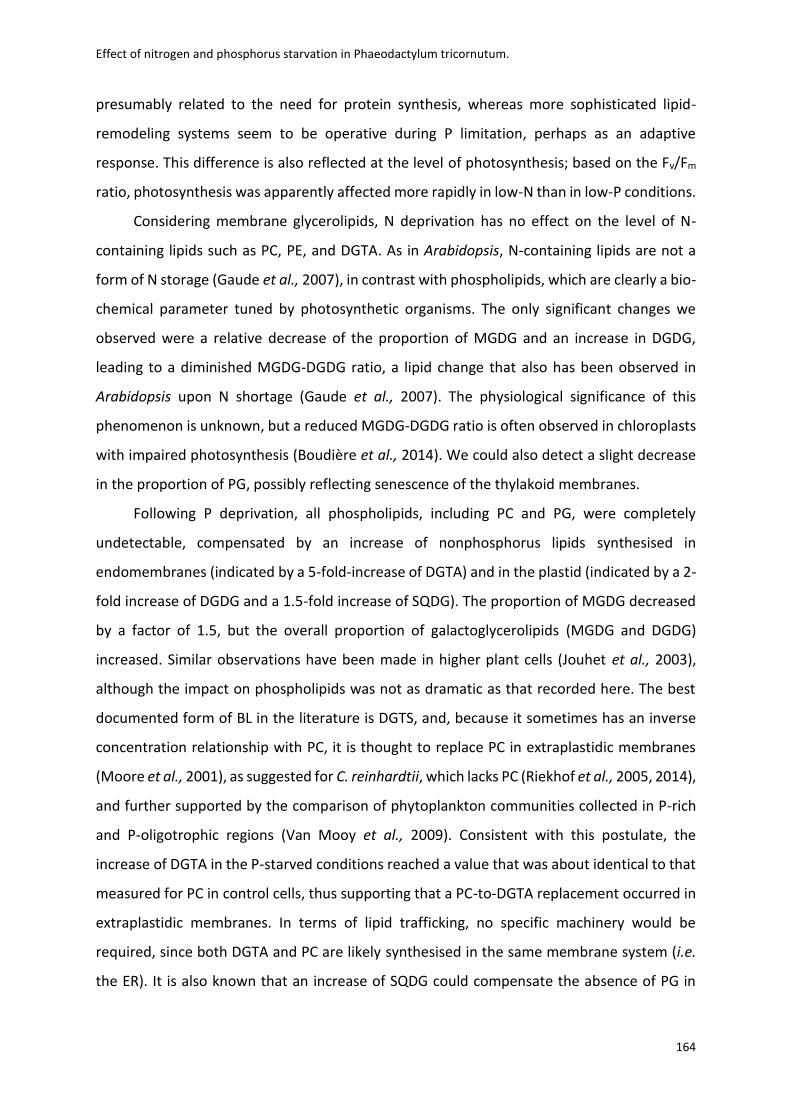
Effect of nitrogen and phosphorus starvation in Phaeodactylum tricornutum.
164
presumably related to the need for protein synthesis, whereas more sophisticated lipid-
remodeling systems seem to be operative during P limitation, perhaps as an adaptive
response. This difference is also reflected at the level of photosynthesis; based on the Fv/Fm
ratio, photosynthesis was apparently affected more rapidly in low-N than in low-P conditions.
Considering membrane glycerolipids, N deprivation has no effect on the level of N-
containing lipids such as PC, PE, and DGTA. As in Arabidopsis, N-containing lipids are not a
form of N storage (Gaude et al., 2007), in contrast with phospholipids, which are clearly a bio-
chemical parameter tuned by photosynthetic organisms. The only significant changes we
observed were a relative decrease of the proportion of MGDG and an increase in DGDG,
leading to a diminished MGDG-DGDG ratio, a lipid change that also has been observed in
Arabidopsis upon N shortage (Gaude et al., 2007). The physiological significance of this
phenomenon is unknown, but a reduced MGDG-DGDG ratio is often observed in chloroplasts
with impaired photosynthesis (Boudière et al., 2014). We could also detect a slight decrease
in the proportion of PG, possibly reflecting senescence of the thylakoid membranes.
Following P deprivation, all phospholipids, including PC and PG, were completely
undetectable, compensated by an increase of nonphosphorus lipids synthesised in
endomembranes (indicated by a 5-fold-increase of DGTA) and in the plastid (indicated by a 2-
fold increase of DGDG and a 1.5-fold increase of SQDG). The proportion of MGDG decreased
by a factor of 1.5, but the overall proportion of galactoglycerolipids (MGDG and DGDG)
increased. Similar observations have been made in higher plant cells (Jouhet et al., 2003),
although the impact on phospholipids was not as dramatic as that recorded here. The best
documented form of BL in the literature is DGTS, and, because it sometimes has an inverse
concentration relationship with PC, it is thought to replace PC in extraplastidic membranes
(Moore et al., 2001), as suggested for C. reinhardtii, which lacks PC (Riekhof et al., 2005, 2014),
and further supported by the comparison of phytoplankton communities collected in P-rich
and P-oligotrophic regions (Van Mooy et al., 2009). Consistent with this postulate, the
increase of DGTA in the P-starved conditions reached a value that was about identical to that
measured for PC in control cells, thus supporting that a PC-to-DGTA replacement occurred in
extraplastidic membranes. In terms of lipid trafficking, no specific machinery would be
required, since both DGTA and PC are likely synthesised in the same membrane system (i.e.
the ER). It is also known that an increase of SQDG could compensate the absence of PG in
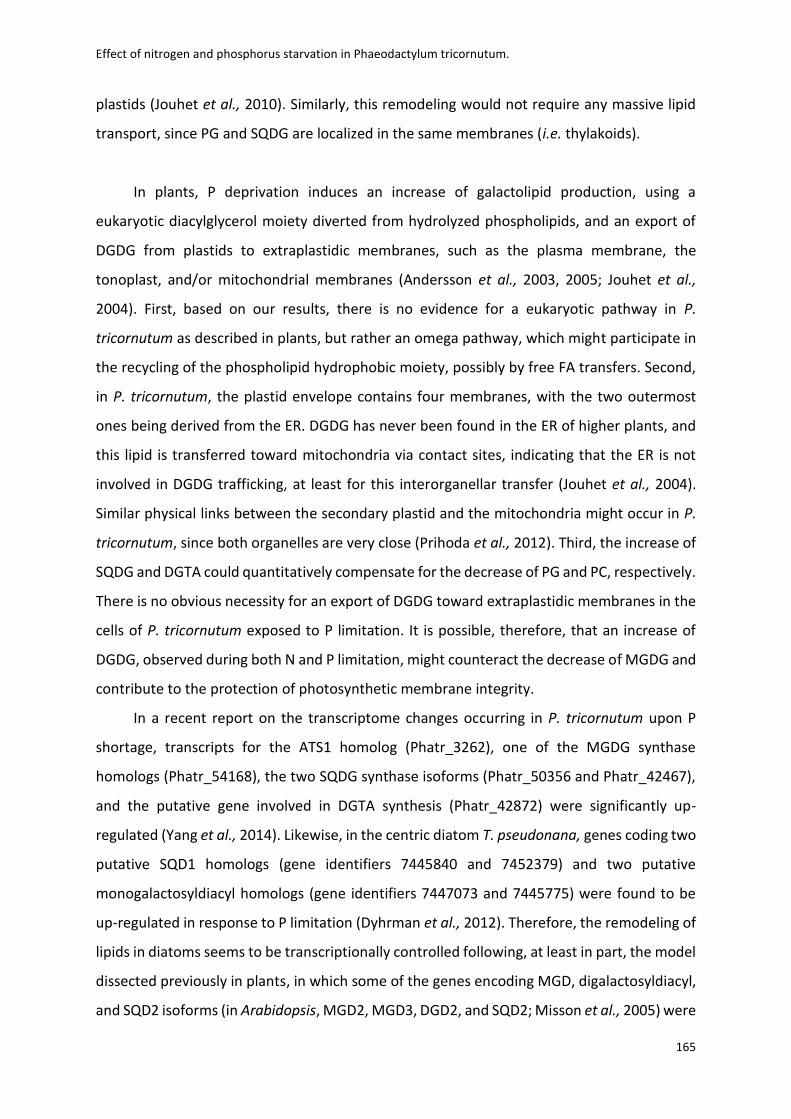
Effect of nitrogen and phosphorus starvation in Phaeodactylum tricornutum.
165
plastids (Jouhet et al., 2010). Similarly, this remodeling would not require any massive lipid
transport, since PG and SQDG are localized in the same membranes (i.e. thylakoids).
In plants, P deprivation induces an increase of galactolipid production, using a
eukaryotic diacylglycerol moiety diverted from hydrolyzed phospholipids, and an export of
DGDG from plastids to extraplastidic membranes, such as the plasma membrane, the
tonoplast, and/or mitochondrial membranes (Andersson et al., 2003, 2005; Jouhet et al.,
2004). First, based on our results, there is no evidence for a eukaryotic pathway in P.
tricornutum as described in plants, but rather an omega pathway, which might participate in
the recycling of the phospholipid hydrophobic moiety, possibly by free FA transfers. Second,
in P. tricornutum, the plastid envelope contains four membranes, with the two outermost
ones being derived from the ER. DGDG has never been found in the ER of higher plants, and
this lipid is transferred toward mitochondria via contact sites, indicating that the ER is not
involved in DGDG trafficking, at least for this interorganellar transfer (Jouhet et al., 2004).
Similar physical links between the secondary plastid and the mitochondria might occur in P.
tricornutum, since both organelles are very close (Prihoda et al., 2012). Third, the increase of
SQDG and DGTA could quantitatively compensate for the decrease of PG and PC, respectively.
There is no obvious necessity for an export of DGDG toward extraplastidic membranes in the
cells of P. tricornutum exposed to P limitation. It is possible, therefore, that an increase of
DGDG, observed during both N and P limitation, might counteract the decrease of MGDG and
contribute to the protection of photosynthetic membrane integrity.
In a recent report on the transcriptome changes occurring in P. tricornutum upon P
shortage, transcripts for the ATS1 homolog (Phatr_3262), one of the MGDG synthase
homologs (Phatr_54168), the two SQDG synthase isoforms (Phatr_50356 and Phatr_42467),
and the putative gene involved in DGTA synthesis (Phatr_42872) were significantly up-
regulated (Yang et al., 2014). Likewise, in the centric diatom T. pseudonana, genes coding two
putative SQD1 homologs (gene identifiers 7445840 and 7452379) and two putative
monogalactosyldiacyl homologs (gene identifiers 7447073 and 7445775) were found to be
up-regulated in response to P limitation (Dyhrman et al., 2012). Therefore, the remodeling of
lipids in diatoms seems to be transcriptionally controlled following, at least in part, the model
dissected previously in plants, in which some of the genes encoding MGD, digalactosyldiacyl,
and SQD2 isoforms (in Arabidopsis, MGD2, MGD3, DGD2, and SQD2; Misson et al., 2005) were
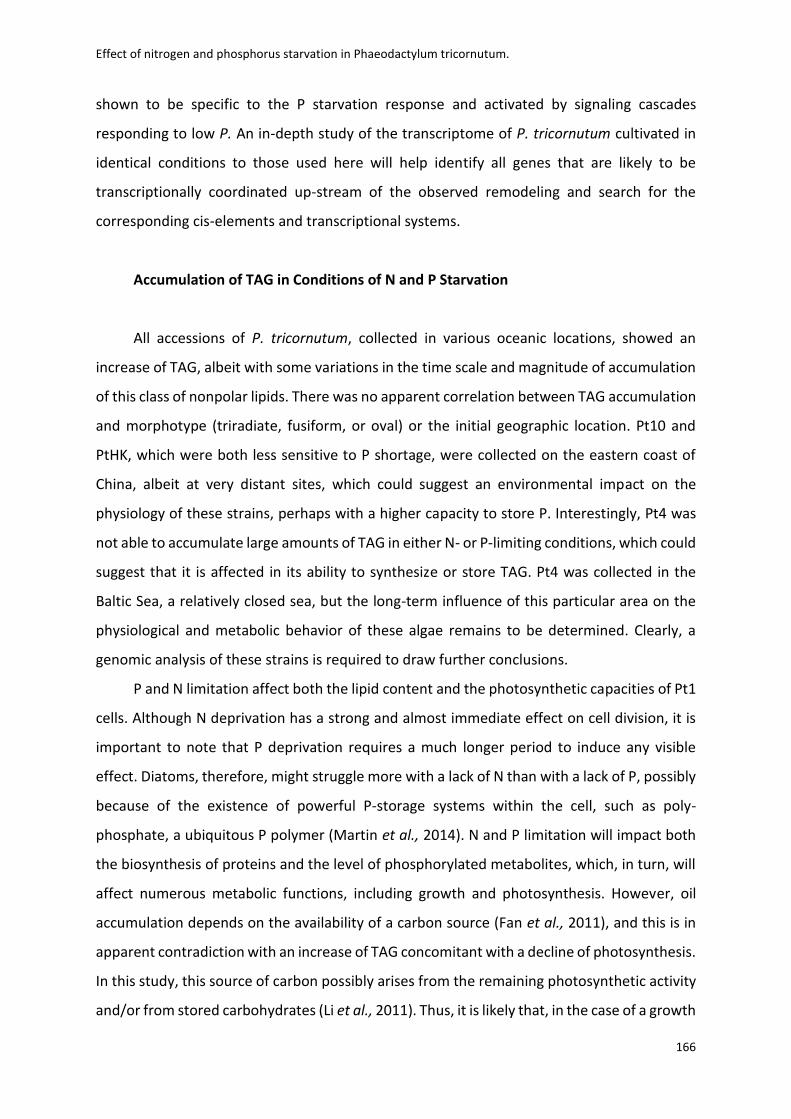
Effect of nitrogen and phosphorus starvation in Phaeodactylum tricornutum.
166
shown to be specific to the P starvation response and activated by signaling cascades
responding to low P. An in-depth study of the transcriptome of P. tricornutum cultivated in
identical conditions to those used here will help identify all genes that are likely to be
transcriptionally coordinated up-stream of the observed remodeling and search for the
corresponding cis-elements and transcriptional systems.
Accumulation of TAG in Conditions of N and P Starvation
All accessions of P. tricornutum, collected in various oceanic locations, showed an
increase of TAG, albeit with some variations in the time scale and magnitude of accumulation
of this class of nonpolar lipids. There was no apparent correlation between TAG accumulation
and morphotype (triradiate, fusiform, or oval) or the initial geographic location. Pt10 and
PtHK, which were both less sensitive to P shortage, were collected on the eastern coast of
China, albeit at very distant sites, which could suggest an environmental impact on the
physiology of these strains, perhaps with a higher capacity to store P. Interestingly, Pt4 was
not able to accumulate large amounts of TAG in either N- or P-limiting conditions, which could
suggest that it is affected in its ability to synthesize or store TAG. Pt4 was collected in the
Baltic Sea, a relatively closed sea, but the long-term influence of this particular area on the
physiological and metabolic behavior of these algae remains to be determined. Clearly, a
genomic analysis of these strains is required to draw further conclusions.
P and N limitation affect both the lipid content and the photosynthetic capacities of Pt1
cells. Although N deprivation has a strong and almost immediate effect on cell division, it is
important to note that P deprivation requires a much longer period to induce any visible
effect. Diatoms, therefore, might struggle more with a lack of N than with a lack of P, possibly
because of the existence of powerful P-storage systems within the cell, such as poly-
phosphate, a ubiquitous P polymer (Martin et al., 2014). N and P limitation will impact both
the biosynthesis of proteins and the level of phosphorylated metabolites, which, in turn, will
affect numerous metabolic functions, including growth and photosynthesis. However, oil
accumulation depends on the availability of a carbon source (Fan et al., 2011), and this is in
apparent contradiction with an increase of TAG concomitant with a decline of photosynthesis.
In this study, this source of carbon possibly arises from the remaining photosynthetic activity
and/or from stored carbohydrates (Li et al., 2011). Thus, it is likely that, in the case of a growth
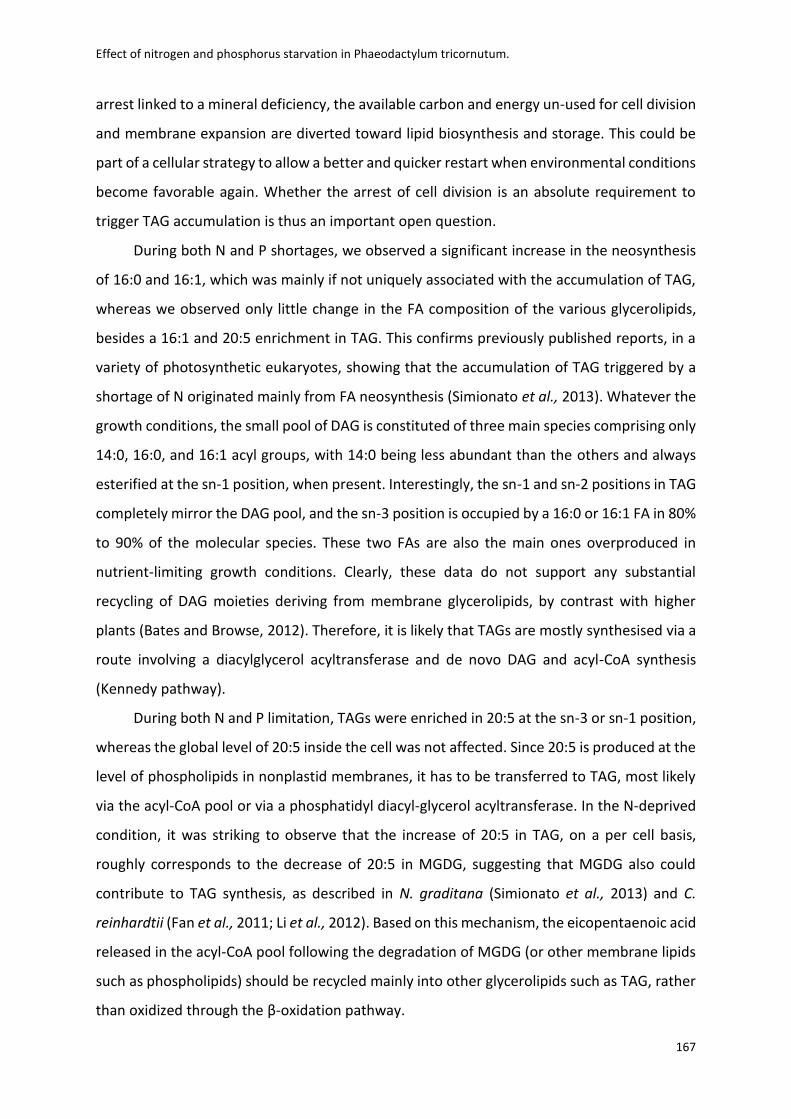
Effect of nitrogen and phosphorus starvation in Phaeodactylum tricornutum.
167
arrest linked to a mineral deficiency, the available carbon and energy un-used for cell division
and membrane expansion are diverted toward lipid biosynthesis and storage. This could be
part of a cellular strategy to allow a better and quicker restart when environmental conditions
become favorable again. Whether the arrest of cell division is an absolute requirement to
trigger TAG accumulation is thus an important open question.
During both N and P shortages, we observed a significant increase in the neosynthesis
of 16:0 and 16:1, which was mainly if not uniquely associated with the accumulation of TAG,
whereas we observed only little change in the FA composition of the various glycerolipids,
besides a 16:1 and 20:5 enrichment in TAG. This confirms previously published reports, in a
variety of photosynthetic eukaryotes, showing that the accumulation of TAG triggered by a
shortage of N originated mainly from FA neosynthesis (Simionato et al., 2013). Whatever the
growth conditions, the small pool of DAG is constituted of three main species comprising only
14:0, 16:0, and 16:1 acyl groups, with 14:0 being less abundant than the others and always
esterified at the sn-1 position, when present. Interestingly, the sn-1 and sn-2 positions in TAG
completely mirror the DAG pool, and the sn-3 position is occupied by a 16:0 or 16:1 FA in 80%
to 90% of the molecular species. These two FAs are also the main ones overproduced in
nutrient-limiting growth conditions. Clearly, these data do not support any substantial
recycling of DAG moieties deriving from membrane glycerolipids, by contrast with higher
plants (Bates and Browse, 2012). Therefore, it is likely that TAGs are mostly synthesised via a
route involving a diacylglycerol acyltransferase and de novo DAG and acyl-CoA synthesis
(Kennedy pathway).
During both N and P limitation, TAGs were enriched in 20:5 at the sn-3 or sn-1 position,
whereas the global level of 20:5 inside the cell was not affected. Since 20:5 is produced at the
level of phospholipids in nonplastid membranes, it has to be transferred to TAG, most likely
via the acyl-CoA pool or via a phosphatidyl diacyl-glycerol acyltransferase. In the N-deprived
condition, it was striking to observe that the increase of 20:5 in TAG, on a per cell basis,
roughly corresponds to the decrease of 20:5 in MGDG, suggesting that MGDG also could
contribute to TAG synthesis, as described in N. graditana (Simionato et al., 2013) and C.
reinhardtii (Fan et al., 2011; Li et al., 2012). Based on this mechanism, the eicopentaenoic acid
released in the acyl-CoA pool following the degradation of MGDG (or other membrane lipids
such as phospholipids) should be recycled mainly into other glycerolipids such as TAG, rather
than oxidized through the β-oxidation pathway.
Effect of nitrogen and phosphorus starvation in Phaeodactylum tricornutum.
168
CONCLUSION
The overall goal of this work was first to define a reference for the glycerolipidome of
P. tricornutum, with MGDG, DGDG, SQDG, and PG as conserved lipids in photosynthetic
membranes and PC and DGTA as major lipids in extraplastidic membranes. We also detected
the presence of ASQ. Based on this reference, we could deduce that the FAs were most likely
synthesised de novo in the stroma of chloroplasts as 14:0-, 16:0-, and 18:0-ACP species. We
identified only one gene candidate coding for a putative palmitoyl-ACP D9-desaturase
(Phatr_9316). When exported to the cytosol, FAs can be elongated and desaturated to
generate 20:5. Acyl-ACP can be used in the plastid for the production of MGDG, DGDG, SQDG,
and part of PG via a canonical prokaryotic pathway, and acyl-CoA can be used in the cytosol
and endomembranes to generate PC, DGTA, or TAG. We could identify gene candidates
coding for putative enzymes involved in these pathways. Extraplastidic PG and PI seem to
share a common CDP-DAG precursor with a 16:1/16:0 signature. We could not detect any
specific signature for an extraplastidic eukaryotic pathway as in plants and could not assess
the possibility of the import of eukaryotic precursors inside the chloroplast. Rather, the
plastid lipid profiles we obtained would be consistent with an import of 20:5 FAs, hydrolyzed
from extraplastidic phospholipids, to serve as precursors for plastid acyltransferases,
eventually producing MGDG, DGDG, and SQDG. We called this pathway the omega pathway,
and future challenges include the deciphering of the machinery importing 20:5 FA into the
chloroplast.
We compared the remodeling triggered by the deprivation of two major nutrients
fluctuating in the oceans, N and P. On the one hand, N oligotrophy is apparently a severe
stress for P. tricornutum, triggering a rapid senescence of chloroplast membranes, an arrest
of cell division, and an accumulation of TAG. By contrast, a complex adaptation to P
deprivation is observed, with a first phase of consumption of specific P-storage forms, most
likely polyphosphate, followed by a breakdown of phospholipids, behaving like a secondary
form of P storage, and their replacement by nonphosphorous lipids, most likely following PG-
to-SQDG and PC-to-DGTA replacements. A phospholipid-to-DGDG replacement cannot be
ruled out in some of the membranes limiting the chloroplast, but this has to be confirmed.
Effect of nitrogen and phosphorus starvation in Phaeodactylum tricornutum.
169
Future work should entail the characterization of the enzyme isoforms and the
machineries for lipid synthesis, lipid breakdown, and lipid trafficking involved in the lipid
changes described here and the systems controlling them. A survey of transcriptome
variations occurring in P. tricornutum or T. pseudonana supports a transcriptional control,
which should be studied further in the future. The task is as complex as that in plants, since
some pathways, like the omega pathway, are apparently specific to chromalveolates, and
their components cannot be deduced from previous studies. Nevertheless, the possibility to
perform large-scale omics studies and to characterize the function of gene products is among
the advantages of the P. tricornutum model. Future work starting with the gene candidates
listed here will hopefully help to unravel the adaptive system of this diatom to cope with a
fluctuating environment.
Effect of nitrogen and phosphorus starvation in Phaeodactylum tricornutum.
170
MATERIALS AND METHODS
Strains and Culture Conditions
Phaeodactylum tricornutum strains were obtained from the culture collections of the
Pravosali-Guillard National Centre for Culture of Marine Phytoplankton (CCMP) and the
Culture Collection of Algae and Protozoa (CCAP), using axenic accessions characterized by De
Martino et al., (2007): Pt1, CCAP 1055/3; Pt2, CCMP2558; Pt3, CCMP2559; Pt4, CCAP 1055/2;
Pt5, CCMP630, Pt6 (fusiform), CCAP 1054/4; Pt7, CCAP 1055/6; Pt8, CCAP 1055/7; Pt9, CCAP
1055/5; Pt10, CCAP 1055/8. We completed this series of accessions with the fully sequenced
reference strain for P. tricornutum, derived from Pt1, Pt1.8.6 (Bowler et al., 2008;
CCAP1055/1), and with an axenic strain isolated in Hong Kong, PtHK. Cells were maintained
and grown in enriched seawater, artificial water (ESAW) medium, as described by Falciatore
et al., (2000). The different cell shapes described here are those of algae grown and
maintained in artificial medium. In the preliminary comparative study of Pt1 to Pt10 ecotypes
by microscopic imaging, cells were grown either in the presence of 0.55 mM N and 0.0224
mM P or in the absence of one or both of these nutrients. Cultures were grown in exponential
phase in 50-mL single-use flasks with 100 rpm shaking, an irradiance of 100 µmol photons m-
2 s-1, and a 12-h-light/ 12-h-dark photoperiod at 19°C.
For the Nile Red measurements, 50-mL cultures were grown in exponential phase
before being centrifuged at 1,500g for 30 min and suspended in 10 mL of replete or deficient
medium. Initial cell densities for P-deficient and N-deficient experiments were 104 and 105
cells mL-1, respectively. In the in-depth analysis performed on the Pt1 strain, cells were grown
in batch conditions in 250-mL flasks containing 50 mL of ESAW medium with or without N or
P. Replete conditions consisted of 5.5 mM N and 0.22 mM P, in order to avoid nutrient
exhaustion in the batch culture over the observation period and to increase the contrast in
the analyzed lipid profiles between nutrient-rich and -depleted conditions. Cells were
cultivated in an artificial climate incubator, with 100 rpm shaking, under an irradiance of 40
µmol photons m-2 s-1 and with a 12-h-light/ 12-h-dark photoperiod at 19°C. The initial
Effect of nitrogen and phosphorus starvation in Phaeodactylum tricornutum.
171
inoculum was 0.5 to 1x10⁶ cells mL-1. Cells were collected after 5 or 13 d and counted with a
Malassez chamber using an aliquot fraction before any further manipulations.
Chlorophyll Fluorescence Measurements
The parameter Fv/Fm was used as an indicator of PSII activity in a dark-adapted state.
For this, in vivo chlorophyll fluorescence was determined using a Speedzen MX fluorescence
imaging setup (JBeamBio). Excitation was done in the blue range (l = 450 nm) using short
pulses (10 ms). Emission was measured in the near far red. Saturating pulses (duration of 250
ms) were provided by a green (l = 520 nm) light-emitting diode array. Measurements were
done 15 min after dark adaptation of the samples.
The variable fluorescence (Fv) was calculated as Fv = Fm 2 Fo, where Fm is the maximum
fluorescence in the dark-adapted state and Fo is the minimal fluorescence in the dark-adapted
state (Genty et al., 1990).
Nile Red Staining of Nonpolar Lipids
Accumulation of nonpolar lipids and oil droplets was monitored by Nile Red (Sigma-
Aldrich) fluorescent staining (excitation wavelength at 532 nm and emission at 565 nm), as
described previously (Cooksey et al., 1987). In brief, 200 µL of culture was stained with 50 µL
of a Nile Red stock solution (2.5 µg mL-1 in dimethyl sulfoxide), and fluorescence was
measured by flow cytometry using a Partec Cube8 device equipped with a 532-nm green
laser. When the number of cells was estimated, specific fluorescence was determined by
dividing Nile Red fluorescence intensity by the number of cells.
Glycerolipid Extraction, Separation by TLC, and Analyses by GC-FID and MS
Glycerolipids were extracted from freeze-dried P. tricornutum cells grown in 50 mL of
ESAW medium with variable initial supplies of P and/or N. First, cells were harvested by
centrifugation and then immediately frozen in liquid N. Once freeze dried, the pellet was
suspended in 4 mL of boiling ethanol for 5 min to prevent lipid degradation, and lipids were
Effect of nitrogen and phosphorus starvation in Phaeodactylum tricornutum.
172
extracted according to Simionato et al., (2013) by the addition of 2 mL of methanol and 8 mL
of chloroform at room temperature. The mixture was then saturated with argon and stirred
for 1 h at room temperature. After filtration through glass wool, cell debris was rinsed with 3
mL of chloroform:methanol (2:1, v/v), and 5 mL of 1% (w/v) NaCl was then added to the
filtrate to initiate biphase formation. The chloroform phase was dried under argon before
solubilizing the lipid extract in pure chloroform.
Total glycerolipids were quantified from their FAs: in an aliquot fraction, a known
quantity of 15:0 was added and the FAs present were transformed as FAMEs by a 1-h
incubation in 3 mL of 2.5% (v/v) H2SO4 in pure methanol at 100°C (Jouhet et al., 2003). The
reaction was stopped by the addition of 3 mL of water and 3 mL of hexane. The hexane phase
was analyzed by a GC-FID (Perkin-Elmer) on a BPX70 (SGE) column. FAMEs were identified by
comparison of their retention times with those of standards (Sigma-Aldrich) and quantified
by the surface peak method using 15:0 for calibration. Extraction and quantification were
performed at least three times.
To quantify the various classes of nonpolar and polar glycerolipids, lipids were
separated by TLC onto glass-backed silica gel plates (Merck) using two distinct resolving
systems (Simionato et al., 2013). To isolate nonpolar lipids including TAG and free FA, lipids
were resolved by TLC run in one dimension with hexane:diethylether:acetic acid (70:30:1,
v/v). To isolate membrane glycerolipids, lipids were resolved by two-dimensional TLC. The
first solvent was chloroform:methanol:water (65:25:4, v/v) and the second was
chloroform:acetone:methanol:acetic acid:water (50:20:10:10:5, v/v). Lipids were then
visualized under UV light, after spraying with 2% (v/v) 8-anilino-1-naphthalenesulfonic acid in
methanol, and scraped off the plate. No phosphatidylethanol could be detected after TLC or
following MS analyses, indicating that the boiling ethanol treatment did not give rise to this
category of glycerolipid derivative by non-specific chemical reactions. Lipids were recovered
from the silica powder after the addition of 1.35 mL of chloroform:methanol (1:2, v/v)
thorough mixing, the addition of 0.45 mL of chloroform and 0.8 mL of water, and collection
of the chloroform phase (Bligh and Dyer, 1959). Lipids were then dried under argon and either
quantified by methanolysis and GC-FID as described above or analyzed by MS.
Effect of nitrogen and phosphorus starvation in Phaeodactylum tricornutum.
173
For MS analyses, purified lipid classes were dissolved in 10 mM ammonium acetate in
pure methanol. They were introduced by direct infusion (electrospray ionization-MS) into a
trap-type mass spectrometer (LTQ-XL; Thermo Scientific) and identified by comparison with
standards. In these conditions, the produced ions were mainly present as H2, H+, NH4+, or Na+
adducts. Lipids were identified by MS2 analysis with their precursor ion or by neutral loss
analyses as indicated in Table I. All experiments were performed in triplicate.
Positional Distribution of FAs Esterified to Glycerolipids
The positions of FA molecular species esterified to the glycerol backbone of the various
glycerolipids were determined based on MS2 analyses. Glycerol carbons were numbered
following the stereospecific number (sn) nomenclature. Depending on the nature of the
glycerolipid and the type of adduct, the substituents at the sn-1 (or sn-3) and sn-2 positions
are differently cleaved when subjected to low-energy collision-induced dissociation. This is
reflected in MS2 analyses by the preferential loss of one of the two FAs, leading to a
dissymmetrical abundance of the collision fragments. The patterns of MS2 fragments for all
glycerolipids have been described in previous studies (Table II), except for DGTA. In this study,
we hypothesized that the loss of FAs in DGTA following low-energy collision-induced
dissociation is similar to that observed for other polar lipids, such as PC.
ACKNOWLEDGMENTS
We thank Yahui Gao (Xiamen University), who kindly provided the PtHK strain isolated
in Hong Kong Harbor in October 2010, and Catherine Cantrel (Institut de Biologie de l’École
Normale Supérieure), Mathilde Cussac, Valérie Gros, and Guillaume Tourcier (Laboratoire de
Physiologie Cellulaire et Végétale) for helpful technical support.
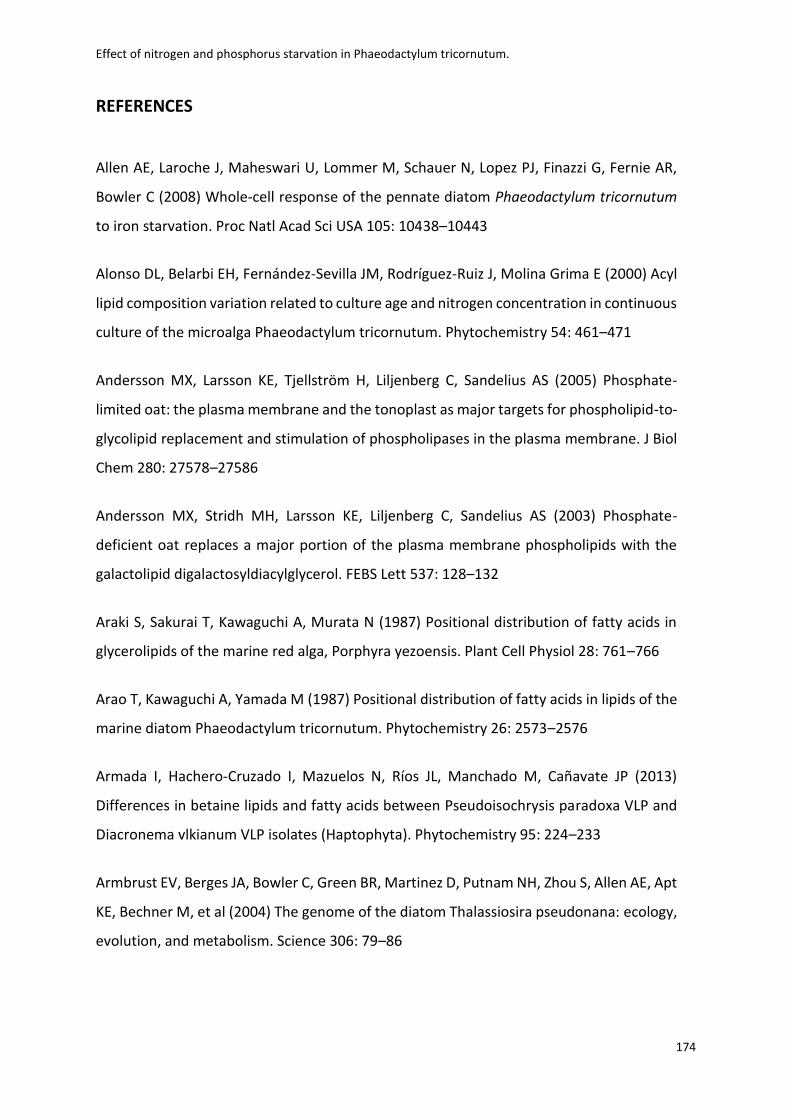
Effect of nitrogen and phosphorus starvation in Phaeodactylum tricornutum.
174
REFERENCES
Allen AE, Laroche J, Maheswari U, Lommer M, Schauer N, Lopez PJ, Finazzi G, Fernie AR,
Bowler C (2008) Whole-cell response of the pennate diatom Phaeodactylum tricornutum
to iron starvation. Proc Natl Acad Sci USA 105: 10438–10443
Alonso DL, Belarbi EH, Fernández-Sevilla JM, Rodríguez-Ruiz J, Molina Grima E (2000) Acyl
lipid composition variation related to culture age and nitrogen concentration in continuous
culture of the microalga Phaeodactylum tricornutum. Phytochemistry 54: 461–471
Andersson MX, Larsson KE, Tjellström H, Liljenberg C, Sandelius AS (2005) Phosphate-
limited oat: the plasma membrane and the tonoplast as major targets for phospholipid-to-
glycolipid replacement and stimulation of phospholipases in the plasma membrane. J Biol
Chem 280: 27578–27586
Andersson MX, Stridh MH, Larsson KE, Liljenberg C, Sandelius AS (2003) Phosphate-
deficient oat replaces a major portion of the plasma membrane phospholipids with the
galactolipid digalactosyldiacylglycerol. FEBS Lett 537: 128–132
Araki S, Sakurai T, Kawaguchi A, Murata N (1987) Positional distribution of fatty acids in
glycerolipids of the marine red alga, Porphyra yezoensis. Plant Cell Physiol 28: 761–766
Arao T, Kawaguchi A, Yamada M (1987) Positional distribution of fatty acids in lipids of the
marine diatom Phaeodactylum tricornutum. Phytochemistry 26: 2573–2576
Armada I, Hachero-Cruzado I, Mazuelos N, Ríos JL, Manchado M, Cañavate JP (2013)
Differences in betaine lipids and fatty acids between Pseudoisochrysis paradoxa VLP and
Diacronema vlkianum VLP isolates (Haptophyta). Phytochemistry 95: 224–233
Armbrust EV, Berges JA, Bowler C, Green BR, Martinez D, Putnam NH, Zhou S, Allen AE, Apt
KE, Bechner M, et al (2004) The genome of the diatom Thalassiosira pseudonana: ecology,
evolution, and metabolism. Science 306: 79–86
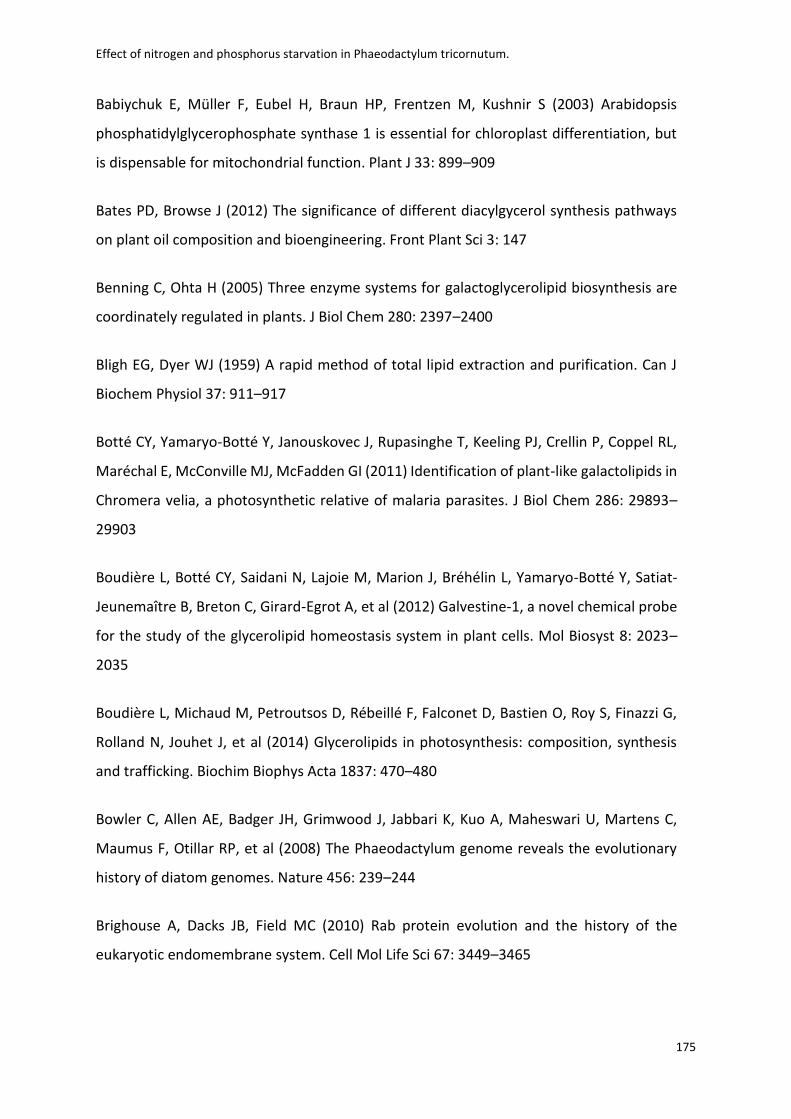
Effect of nitrogen and phosphorus starvation in Phaeodactylum tricornutum.
175
Babiychuk E, Müller F, Eubel H, Braun HP, Frentzen M, Kushnir S (2003) Arabidopsis
phosphatidylglycerophosphate synthase 1 is essential for chloroplast differentiation, but
is dispensable for mitochondrial function. Plant J 33: 899–909
Bates PD, Browse J (2012) The significance of different diacylgycerol synthesis pathways
on plant oil composition and bioengineering. Front Plant Sci 3: 147
Benning C, Ohta H (2005) Three enzyme systems for galactoglycerolipid biosynthesis are
coordinately regulated in plants. J Biol Chem 280: 2397–2400
Bligh EG, Dyer WJ (1959) A rapid method of total lipid extraction and purification. Can J
Biochem Physiol 37: 911–917
Botté CY, Yamaryo-Botté Y, Janouskovec J, Rupasinghe T, Keeling PJ, Crellin P, Coppel RL,
Maréchal E, McConville MJ, McFadden GI (2011) Identification of plant-like galactolipids in
Chromera velia, a photosynthetic relative of malaria parasites. J Biol Chem 286: 29893–
29903
Boudière L, Botté CY, Saidani N, Lajoie M, Marion J, Bréhélin L, Yamaryo-Botté Y, Satiat-
Jeunemaître B, Breton C, Girard-Egrot A, et al (2012) Galvestine-1, a novel chemical probe
for the study of the glycerolipid homeostasis system in plant cells. Mol Biosyst 8: 2023–
2035
Boudière L, Michaud M, Petroutsos D, Rébeillé F, Falconet D, Bastien O, Roy S, Finazzi G,
Rolland N, Jouhet J, et al (2014) Glycerolipids in photosynthesis: composition, synthesis
and trafficking. Biochim Biophys Acta 1837: 470–480
Bowler C, Allen AE, Badger JH, Grimwood J, Jabbari K, Kuo A, Maheswari U, Martens C,
Maumus F, Otillar RP, et al (2008) The Phaeodactylum genome reveals the evolutionary
history of diatom genomes. Nature 456: 239–244
Brighouse A, Dacks JB, Field MC (2010) Rab protein evolution and the history of the
eukaryotic endomembrane system. Cell Mol Life Sci 67: 3449–3465
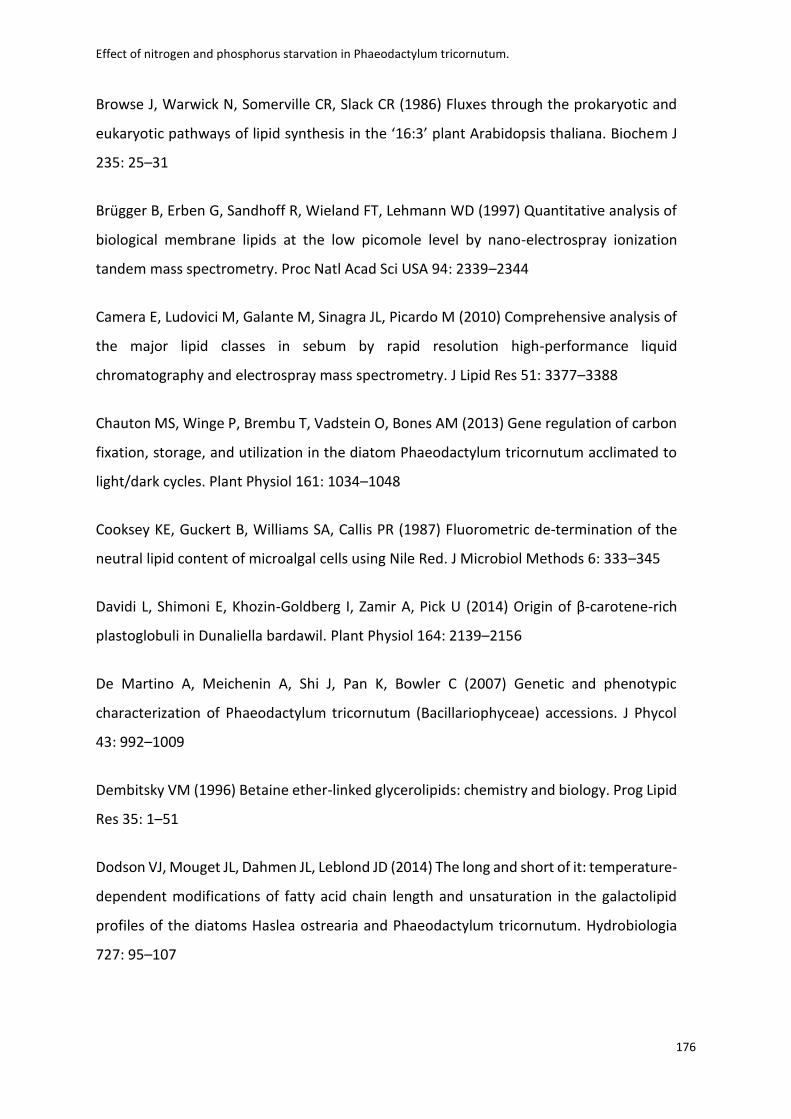
Effect of nitrogen and phosphorus starvation in Phaeodactylum tricornutum.
176
Browse J, Warwick N, Somerville CR, Slack CR (1986) Fluxes through the prokaryotic and
eukaryotic pathways of lipid synthesis in the ‘16:3’ plant Arabidopsis thaliana. Biochem J
235: 25–31
Brügger B, Erben G, Sandhoff R, Wieland FT, Lehmann WD (1997) Quantitative analysis of
biological membrane lipids at the low picomole level by nano-electrospray ionization
tandem mass spectrometry. Proc Natl Acad Sci USA 94: 2339–2344
Camera E, Ludovici M, Galante M, Sinagra JL, Picardo M (2010) Comprehensive analysis of
the major lipid classes in sebum by rapid resolution high-performance liquid
chromatography and electrospray mass spectrometry. J Lipid Res 51: 3377–3388
Chauton MS, Winge P, Brembu T, Vadstein O, Bones AM (2013) Gene regulation of carbon
fixation, storage, and utilization in the diatom Phaeodactylum tricornutum acclimated to
light/dark cycles. Plant Physiol 161: 1034–1048
Cooksey KE, Guckert B, Williams SA, Callis PR (1987) Fluorometric de-termination of the
neutral lipid content of microalgal cells using Nile Red. J Microbiol Methods 6: 333–345
Davidi L, Shimoni E, Khozin-Goldberg I, Zamir A, Pick U (2014) Origin of β-carotene-rich
plastoglobuli in Dunaliella bardawil. Plant Physiol 164: 2139–2156
De Martino A, Meichenin A, Shi J, Pan K, Bowler C (2007) Genetic and phenotypic
characterization of Phaeodactylum tricornutum (Bacillariophyceae) accessions. J Phycol
43: 992–1009
Dembitsky VM (1996) Betaine ether-linked glycerolipids: chemistry and biology. Prog Lipid
Res 35: 1–51
Dodson VJ, Mouget JL, Dahmen JL, Leblond JD (2014) The long and short of it: temperature-
dependent modifications of fatty acid chain length and unsaturation in the galactolipid
profiles of the diatoms Haslea ostrearia and Phaeodactylum tricornutum. Hydrobiologia
727: 95–107
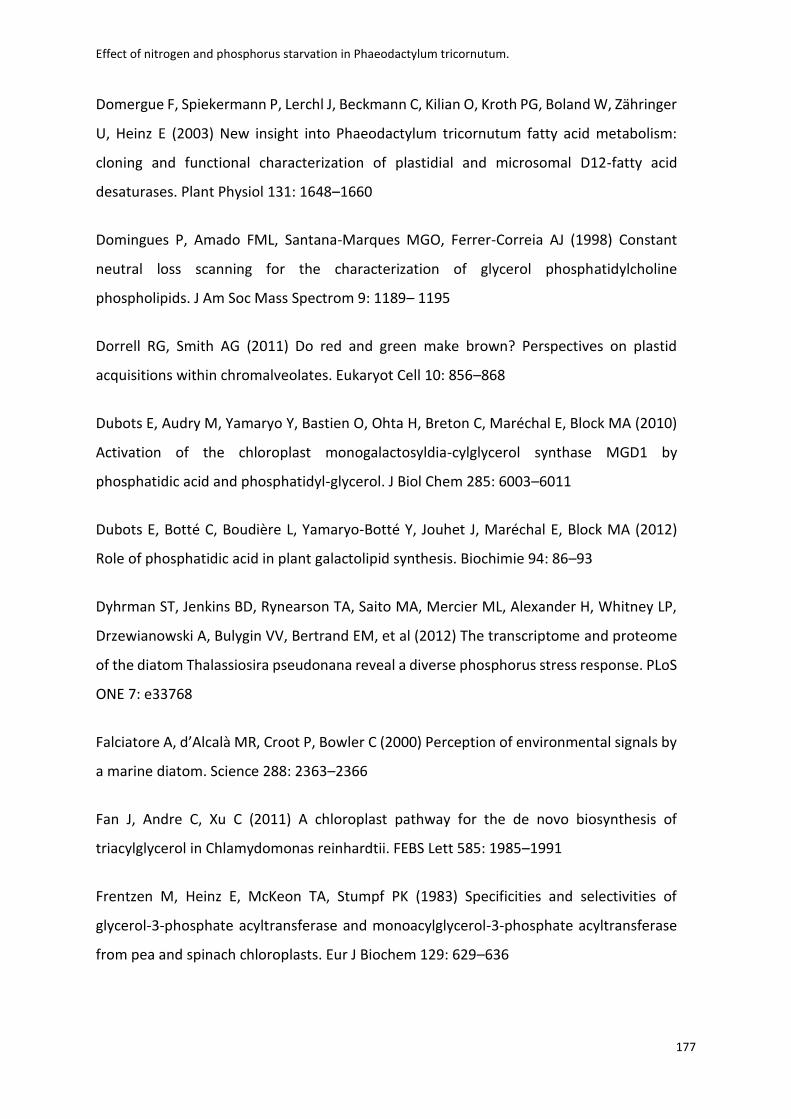
Effect of nitrogen and phosphorus starvation in Phaeodactylum tricornutum.
177
Domergue F, Spiekermann P, Lerchl J, Beckmann C, Kilian O, Kroth PG, Boland W, Zähringer
U, Heinz E (2003) New insight into Phaeodactylum tricornutum fatty acid metabolism:
cloning and functional characterization of plastidial and microsomal D12-fatty acid
desaturases. Plant Physiol 131: 1648–1660
Domingues P, Amado FML, Santana-Marques MGO, Ferrer-Correia AJ (1998) Constant
neutral loss scanning for the characterization of glycerol phosphatidylcholine
phospholipids. J Am Soc Mass Spectrom 9: 1189– 1195
Dorrell RG, Smith AG (2011) Do red and green make brown? Perspectives on plastid
acquisitions within chromalveolates. Eukaryot Cell 10: 856–868
Dubots E, Audry M, Yamaryo Y, Bastien O, Ohta H, Breton C, Maréchal E, Block MA (2010)
Activation of the chloroplast monogalactosyldia-cylglycerol synthase MGD1 by
phosphatidic acid and phosphatidyl-glycerol. J Biol Chem 285: 6003–6011
Dubots E, Botté C, Boudière L, Yamaryo-Botté Y, Jouhet J, Maréchal E, Block MA (2012)
Role of phosphatidic acid in plant galactolipid synthesis. Biochimie 94: 86–93
Dyhrman ST, Jenkins BD, Rynearson TA, Saito MA, Mercier ML, Alexander H, Whitney LP,
Drzewianowski A, Bulygin VV, Bertrand EM, et al (2012) The transcriptome and proteome
of the diatom Thalassiosira pseudonana reveal a diverse phosphorus stress response. PLoS
ONE 7: e33768
Falciatore A, d’Alcalà MR, Croot P, Bowler C (2000) Perception of environmental signals by
a marine diatom. Science 288: 2363–2366
Fan J, Andre C, Xu C (2011) A chloroplast pathway for the de novo biosynthesis of
triacylglycerol in Chlamydomonas reinhardtii. FEBS Lett 585: 1985–1991
Frentzen M, Heinz E, McKeon TA, Stumpf PK (1983) Specificities and selectivities of
glycerol-3-phosphate acyltransferase and monoacylglycerol-3-phosphate acyltransferase
from pea and spinach chloroplasts. Eur J Biochem 129: 629–636
Effect of nitrogen and phosphorus starvation in Phaeodactylum tricornutum.
178
Gage DA, Huang ZH, Benning C (1992) Comparison of sulfoquinovosyl diacylglycerol from
spinach and the purple bacterium Rhodobacter spaeroides by fast atom bombardment
tandem mass spectrometry. Lipids 27: 632–636
Gaude N, Bréhélin C, Tischendorf G, Kessler F, Dörmann P (2007) Nitrogen deficiency in
Arabidopsis affects galactolipid composition and gene expression and results in
accumulation of fatty acid phytyl esters. Plant J 49: 729–739
Genty B, Harbinson J, Briantais JM, Baker NR (1990) The relationship between non-
photochemical quenching of chlorophyll fluorescence and the rate of photosystem 2
photochemistry in leaves. Photosynth Res 25: 249–257
Giroud C, Gerber A, Eichenberger W (1988) Lipids of Chlamydomonas reinhardtii: analysis
of molecular species and intracellular site(s) of biosynthesis. Plant Cell Physiol 29: 587–595
Guella G, Frassanito R, Mancini I (2003) A new solution for an old problem: the
regiochemical distribution of the acyl chains in galactolipids can be established by
electrospray ionization tandem mass spectrometry. Rapid Commun Mass Spectrom 17:
1982–1994
Guschina IA, Harwood JL (2006) Lipids and lipid metabolism in eukaryotic algae. Prog Lipid
Res 45: 160–186
Hagio M, Sakurai I, Sato S, Kato T, Tabata S, Wada H (2002) Phosphatidylglycerol is essential
for the development of thylakoid membranes in Arabidopsis thaliana. Plant Cell Physiol 43:
1456–1464
Hecky RE, Kilham P (1988) Nutrient limitation of phytoplankton in freshwater and marine
environments. Limnol Oceanogr 33: 786–822
Hsu FF, Turk J (2000a) Characterization of phosphatidylethanolamine as a lithiated adduct
by triple quadrupole tandem mass spectrometry with electrospray ionization. J Mass
Spectrom 35: 595–606
Effect of nitrogen and phosphorus starvation in Phaeodactylum tricornutum.
179
Hsu FF, Turk J (2000b) Characterization of phosphatidylinositol, phosphatidylinositol-4-
phosphate, and phosphatidylinositol-4,5-bisphosphate by electrospray ionization tandem
mass spectrometry: a mechanistic study. J Am Soc Mass Spectrom 11: 986–999
Hsu FF, Turk J (2001) Studies on phosphatidylglycerol with triple quadrupole tandem mass
spectrometry with electrospray ionization: fragmentation processes and structural
characterization. J Am Soc Mass Spectrom 12: 1036–1043
Hsu FF, Turk J (2003) Electrospray ionization/tandem quadrupole mass spectrometric
studies on phosphatidylcholines: the fragmentation processes. J Am Soc Mass Spectrom
14: 352–363
Hsu FF, Turk J (2010) Electrospray ionization multiple-stage linear ion-trap mass
spectrometry for structural elucidation of triacylglycerols: assignment of fatty acyl groups
on the glycerol backbone and location of double bonds. J Am Soc Mass Spectrom 21: 657–
669
Jouhet J, Dubots E, Maréchal E, Block MA (2010) Lipid trafficking in plant photosynthetic
cells. In H Wada, N Murata, eds, Lipids in Photosynthesis, Vol 30. Springer, Dordrecht, The
Netherlands, pp 349–372
Jouhet J, Maréchal E, Baldan B, Bligny R, Joyard J, Block MA (2004) Phosphate deprivation
induces transfer of DGDG galactolipid from chloroplast to mitochondria. J Cell Biol 167:
863–874
Jouhet J, Maréchal E, Bligny R, Joyard J, Block MA (2003) Transient increase of
phosphatidylcholine in plant cells in response to phosphate deprivation. FEBS Lett 544: 63–
68
Jouhet J, Maréchal E, Block MA (2007) Glycerolipid transfer for the building of membranes
in plant cells. Prog Lipid Res 46: 37–55
Effect of nitrogen and phosphorus starvation in Phaeodactylum tricornutum.
180
Khozin I, Adlerstein D, Bigongo C, Heimer YM, Cohen Z (1997) Elucidation of the
biosynthesis of eicosapentaenoic acid in the microalga Porphyridium cruentum: II. Studies
with radiolabeled precursors. Plant Physiol 114: 223–230
Khozin-Goldberg I, Didi-Cohen S, Shayakhmetova I, Cohen Z (2002) Biosynthesis of
eicopentaenoic acid (EPA) in the fresh water eustigmatophyte Monodus subterraneaus
(Eustigmatophyceae). J Phycol 38: 745–756
Kroth PG, Chiovitti A, Gruber A, Martin-Jezequel V, Mock T, Parker MS, Stanley MS, Kaplan
A, Caron L, Weber T, et al (2008) A model for carbohydrate metabolism in the diatom
Phaeodactylum tricornutum deduced from comparative whole genome analysis. PLoS ONE
3: e1426
Künzler K, Eichenberger W, Radunz A (1997) Intracellular localization of two betaine lipids
by cell fractionation and immunomicroscopy. Z Naturforsch C 52: 487–495
Levitan O, Dinamarca J, Hochman G, Falkowski PG (2014) Diatoms: a fossil fuel of the
future. Trends Biotechnol 32: 117–124
Li X, Moellering ER, Liu B, Johnny C, Fedewa M, Sears BB, Kuo MH, Benning C (2012) A
galactoglycerolipid lipase is required for triacylglycerol accumulation and survival following
nitrogen deprivation in Chlamydomonas reinhardtii. Plant Cell 24: 4670–4686
Li Y, Han D, Sommerfeld M, Hu Q (2011) Photosynthetic carbon partitioning and lipid
production in the oleaginous microalga Pseudochlorococcum sp. (Chlorophyceae) under
nitrogen-limited conditions. Bioresour Technol 102: 123–129
Liang Y, Maeda Y, Yoshino T, Matsumoto M, Tanaka T (2014) Profiling of polar lipids in
marine oleaginous diatom Fistulifera solaris JPCC DA0580: prediction of the potential
mechanism for eicosapentaenoic acid-incorporation into triacylglycerol. Mar Drugs 12:
3218–3230
Effect of nitrogen and phosphorus starvation in Phaeodactylum tricornutum.
181
Li-Beisson Y, Shorrosh B, Beisson F, Andersson MX, Arondel V, Bates PD, Baud S, Bird D,
Debono A, Durrett TP, et al (2010) Acyl-lipid metabolism. The Arabidopsis Book 8: e0133,
doi/10.1199/tab.0161
Litchman E, Klausmeier CA, Yoshiyama K (2009) Contrasting size evolution in marine and
freshwater diatoms. Proc Natl Acad Sci USA 106: 2665–2670
Löfke C, Ischebeck T, König S, Freitag S, Heilmann I (2008) Alternative metabolic fates of
phosphatidylinositol produced by phosphatidylinositol synthase isoforms in Arabidopsis
thaliana. Biochem J 413: 115–124
Maheswari U, Mock T, Armbrust EV, Bowler C (2009) Update of the Diatom EST Database:
a new tool for digital transcriptomics. Nucleic Acids Res 37: D1001–D1005
Maheswari U, Montsant A, Goll J, Krishnasamy S, Rajyashri KR, Patell VM, Bowler C (2005)
The Diatom EST Database. Nucleic Acids Res 33: D344–D347
Maréchal E, Block MA, Joyard J, Douce R (1994) Kinetic properties of
monogalactosyldiacylglycerol synthase from spinach chloroplast envelope membranes. J
Biol Chem 269: 5788–5798
Martin P, Dyhrman ST, Lomas MW, Poulton NJ, Van Mooy BAS (2014) Accumulation and
enhanced cycling of polyphosphate by Sargasso Sea plankton in response to low
phosphorus. Proc Natl Acad Sci USA 111: 8089–8094
Mills MM, Ridame C, Davey M, La Roche J, Geider RJ (2004) Iron and phosphorus co-limit
nitrogen fixation in the eastern tropical North Atlantic. Nature 429: 292–294
Misson J, Raghothama KG, Jain A, Jouhet J, Block MA, Bligny R, Ortet P, Creff A, Somerville
S, Rolland N, et al (2005) A genome-wide transcriptional analysis using Arabidopsis thaliana
Affymetrix gene chips determined plant responses to phosphate deprivation. Proc Natl
Acad Sci USA 102: 11934–11939
Mongrand S, Bessoule JJ, Cabantous F, Cassagne C (1998) The C16:3/C18: 3 fatty acid
balance in photosynthetic tissues from 468 plant species. Phytochemistry 49: 1049–1064
Effect of nitrogen and phosphorus starvation in Phaeodactylum tricornutum.
182
Montsant A, Maheswari U, Bowler C, Lopez PJ (2005) Diatomics: toward diatom functional
genomics. J Nanosci Nanotechnol 5: 5–14
Moore C, Mills M, Arrigo K, Berman-Frank I, Bopp L, Boyd P, Galbraith E, Geider R, Guieu
C, Jaccard S, et al (2013) Processes and patterns of oceanic nutrient limitation. Nat Geosci
6: 701–710
Moore TS, Du Z, Chen Z (2001) Membrane lipid biosynthesis in Chlamydomonas reinhardtii:
in vitro biosynthesis of diacylglyceryltrimethylhomoserine. Plant Physiol 125: 423–429
Morcuende R, Bari R, Gibon Y, Zheng W, Pant BD, Bläsing O, Usadel B, Czechowski T,
Udvardi MK, Stitt M, et al (2007) Genome-wide re-programming of metabolism and
regulatory networks of Arabidopsis in response to phosphorus. Plant Cell Environ 30: 85–
112
Moreau RA, Doehlert DC, Welti R, Isaac G, Roth M, Tamura P, Nuñez A (2008) The
identification of mono-, di-, tri-, and tetragalactosyl-diacylglycerols and their natural
estolides in oat kernels. Lipids 43: 533–548
Müller F, Frentzen M (2001) Phosphatidylglycerophosphate synthases from Arabidopsis
thaliana. FEBS Lett 509: 298–302
Nakamura Y (2013) Phosphate starvation and membrane lipid remodeling in seed plants.
Prog Lipid Res 52: 43–50
Naumann I, Klein BC, Bartel SJ, Darsow KH, Buchholz R, Lange HA (2011) Identification of
sulfoquinovosyldiacyglycerides from Phaeodactylum tricornutum by matrix-assisted laser
desorption/ionization QTrap time-of-flight hybrid mass spectrometry. Rapid Commun
Mass Spectrom 25: 2517– 2523
Nunn BL, Aker JR, Shaffer SA, Tsai S, Strzepek RF, Boyd PW, Freeman TL, Brittnacher M,
Malmström L, Goodlett DR (2009) Deciphering diatom biochemical pathways via whole-
cell proteomics. Aquat Microb Ecol 55: 241–253
Effect of nitrogen and phosphorus starvation in Phaeodactylum tricornutum.
183
Petroutsos D, Amiar S, Abida H, Dolch LJ, Bastien O, Rébeillé F, Jouhet J, Falconet D, Block
MA, McFadden GI, et al (2014) Evolution of galactoglycerolipid biosynthetic pathways:
from cyanobacteria to primary plastids and from primary to secondary plastids. Prog Lipid
Res 54: 68–85
Prihoda J, Tanaka A, de Paula WBM, Allen JF, Tirichine L, Bowler C (2012) Chloroplast-
mitochondria cross-talk in diatoms. J Exp Bot 63: 1543–1557
Rezanka T, LukavskýJ, Nedbalová L, Sigler K (2011) Effect of nitrogen and phosphorus
starvation on the polyunsaturated triacylglycerol composition, including positional isomer
distribution, in the alga Trachydiscus minutus. Phytochemistry 72: 2342–2351
Riekhof WR, Naik S, Bertrand H, Benning C, Voelker DR (2014) Phosphate starvation in fungi
induces the replacement of phosphatidylcholine with the phosphorus-free betaine lipid
diacylglyceryl-N,N,N-trimethylhomoserine. Eukaryot Cell 13: 749–757
Riekhof WR, Ruckle ME, Lydic TA, Sears BB, Benning C (2003) The sulfolipids 29-O-acyl-
sulfoquinovosyldiacylglycerol and sulfoquinovo-syldiacylglycerol are absent from a
Chlamydomonas reinhardtii mutant deleted in SQD1. Plant Physiol 133: 864–874
Riekhof WR, Sears BB, Benning C (2005) Annotation of genes involved in glycerolipid
biosynthesis in Chlamydomonas reinhardtii: discovery of the betaine lipid synthase
BTA1Cr. Eukaryot Cell 4: 242–252
Sandelius AS, Andersson MX, Goksor M, Tjellstrom H, Wellander R (2007) Membrane
contact sites: physical attachment between chloro-plasts and endoplasmic reticulum
revealed by optical manipulation. Chem Phys Lipids 149: S42–S43
Sapriel G, Quinet M, Heijde M, Jourdren L, Tanty V, Luo G, Le Crom S, Lopez PJ (2009)
Genome-wide transcriptome analyses of silicon metabolism in Phaeodactylum
tricornutum reveal the multilevel regulation of silicic acid transporters. PLoS ONE 4: e7458
Sato N, Murata N (1991) Transition of lipid phase in aqueous dispersions of
diacylglyceryltrimethylhomoserine. Biochim Biophys Acta 1082: 108–111
Effect of nitrogen and phosphorus starvation in Phaeodactylum tricornutum.
184
Scala S, Bowler C (2001) Molecular insights into the novel aspects of diatom biology. Cell
Mol Life Sci 58: 1666–1673
Shimojima M, Ohta H (2011) Critical regulation of galactolipid synthesis controls
membrane differentiation and remodeling in distinct plant organs and following
environmental changes. Prog Lipid Res 50: 258–266
Shrestha RP, Tesson B, Norden-Krichmar T, Federowicz S, Hildebrand M, Allen AE (2012)
Whole transcriptome analysis of the silicon response of the diatom Thalassiosira
pseudonana. BMC Genomics 13: 499
Simionato D, Block MA, La Rocca N, Jouhet J, Maréchal E, Finazzi G, Morosinotto T (2013)
The response of Nannochloropsis gaditana to nitrogen starvation includes de novo
biosynthesis of triacylglycerols, a decrease of chloroplast galactolipids, and reorganization
of the photo-synthetic apparatus. Eukaryot Cell 12: 665–676
Taguchi R, Houjou T, Nakanishi H, Yamazaki T, Ishida M, Imagawa M, Shimizu T (2005)
Focused lipidomics by tandem mass spectrometry. J Chromatogr B Analyt Technol Biomed
Life Sci 823: 26–36
Tanoue R, Kobayashi M, Katayama K, Nagata N, Wada H (2014) Phosphati-dylglycerol
biosynthesis is required for the development of embryos and normal membrane structures
of chloroplasts and mitochondria in Arabidopsis. FEBS Lett 588: 1680–1685
Tjellström H, Andersson MX, Larsson KE, Sandelius AS (2008) Membrane phospholipids as
a phosphate reserve: the dynamic nature of phospholipid-to-digalactosyl diacylglycerol
exchange in higher plants. Plant Cell Environ 31: 1388–1398
Van Mooy BAS, Fredricks HF, Pedler BE, Dyhrman ST, Karl DM, Koblízek M, Lomas MW,
Mincer TJ, Moore LR, Moutin T, et al (2009) Phytoplankton in the ocean use non-
phosphorus lipids in response to phosphorus scarcity. Nature 458: 69–72
Effect of nitrogen and phosphorus starvation in Phaeodactylum tricornutum.
185
Vogel G, Eichenberger W (1992) Betaine lipids in lower plants: biosynthesis of DGTS and
DGTA in Ochromonas danica (Chrysophyceae) and the possible role of DGTS in lipid
metabolism. Plant Cell Physiol 33: 427–436
Welti R, Wang X, Williams TD (2003) Electrospray ionization tandem mass spectrometry
scan modes for plant chloroplast lipids. Anal Biochem 314: 149–152
Xu C, Härtel H, Wada H, Hagio M, Yu B, Eakin C, Benning C (2002) The pgp1 mutant locus
of Arabidopsis encodes a phosphatidylglycerolphosphate synthase with impaired activity.
Plant Physiol 129: 594–604
Yang ZK, Zheng JW, Niu YF, Yang WD, Liu JS, Li HY (2014) Systems-level analysis of the
metabolic responses of the diatom Phaeodactylum tricornutum to phosphorus stress.
Environ Microbiol 16: 1793–1807
Yongmanitchai W, Ward OP (1993) Positional distribution of fatty acids, and molecular
species of polar lipids, in the diatom Phaeodactylum tricornutum. J Gen Microbiol 139:
465–472
Zendejas FJ, Benke PI, Lane PD, Simmons BA, Lane TW (2012) Characterization of the
acylglycerols and resulting biodiesel derived from vegetable oil and microalgae
(Thalassiosira pseudonana and Phaeodactylum tricornutum). Biotechnol Bioeng 109:
1146–1154
Zhou Y, Peisker H, Weth A, Baumgartner W, Dörmann P, Frentzen M (2013) Extraplastidial
cytidinediphosphate diacylglycerol synthase activity is required for vegetative
development in Arabidopsis thaliana. Plant J 75: 867–879
Zianni R, Bianco G, Lelario F, Losito I, Palmisano F, Cataldi TR (2013) Fatty acid neutral losses
observed in tandem mass spectrometry with collision-induced dissociation allows
regiochemical assignment of sulfoquinovosyl-diacylglycerols. J Mass Spectrom 48: 205–
215
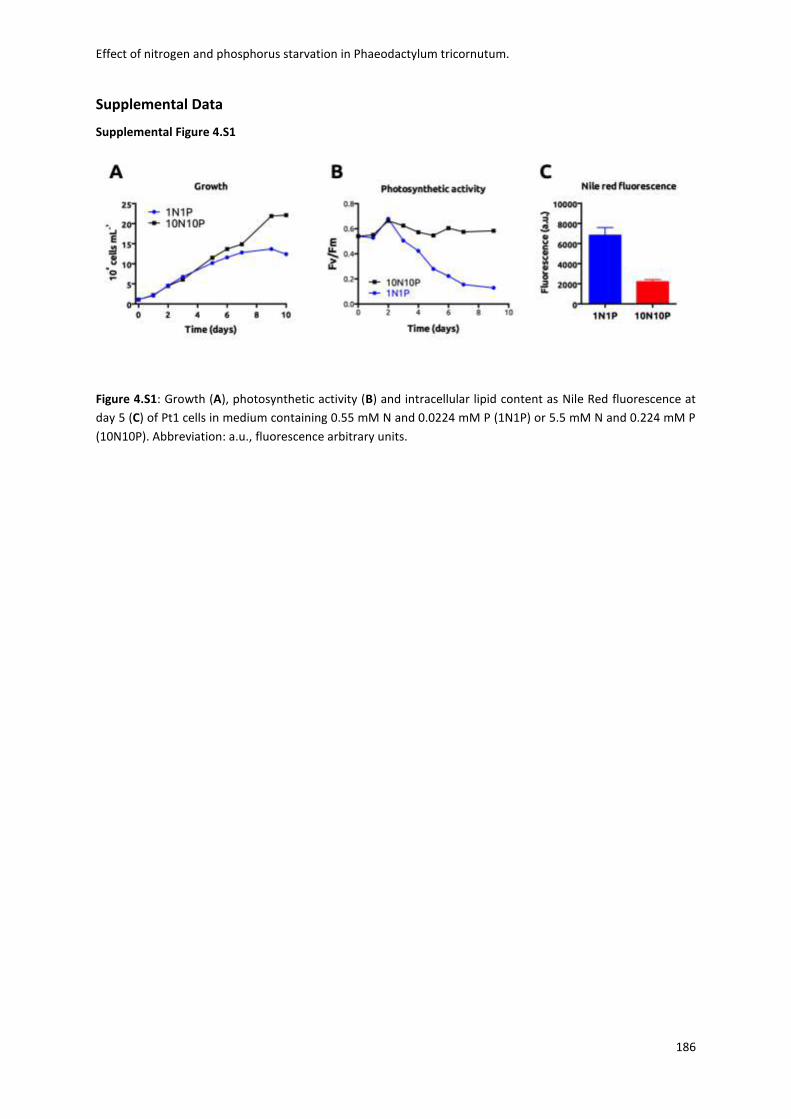
Effect of nitrogen and phosphorus starvation in Phaeodactylum tricornutum.
186
Supplemental Data
Supplemental Figure 4.S1
Figure 4.S1: Growth (A), photosynthetic activity (B) and intracellular lipid content as Nile Red fluorescence at
day 5 (C) of Pt1 cells in medium containing 0.55 mM N and 0.0224 mM P (1N1P) or 5.5 mM N and 0.224 mM P
(10N10P). Abbreviation: a.u., fluorescence arbitrary units.
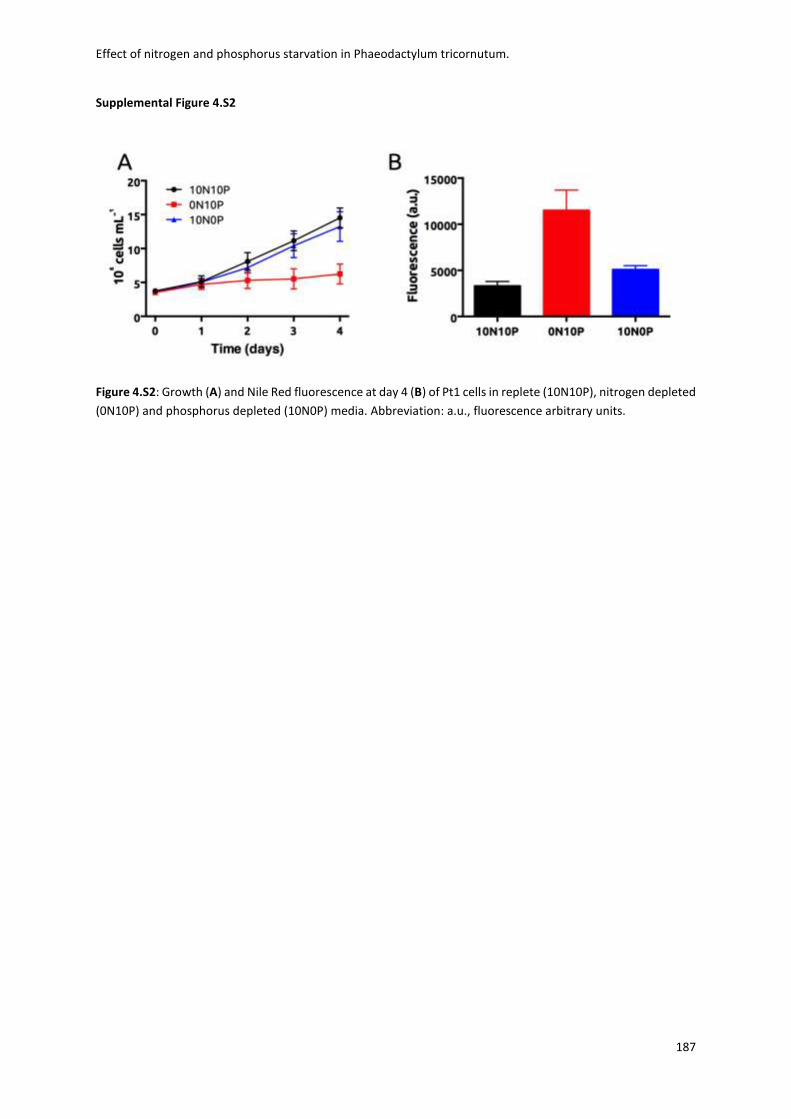
Effect of nitrogen and phosphorus starvation in Phaeodactylum tricornutum.
187
Supplemental Figure 4.S2
Figure 4.S2: Growth (A) and Nile Red fluorescence at day 4 (B) of Pt1 cells in replete (10N10P), nitrogen depleted
(0N10P) and phosphorus depleted (10N0P) media. Abbreviation: a.u., fluorescence arbitrary units.
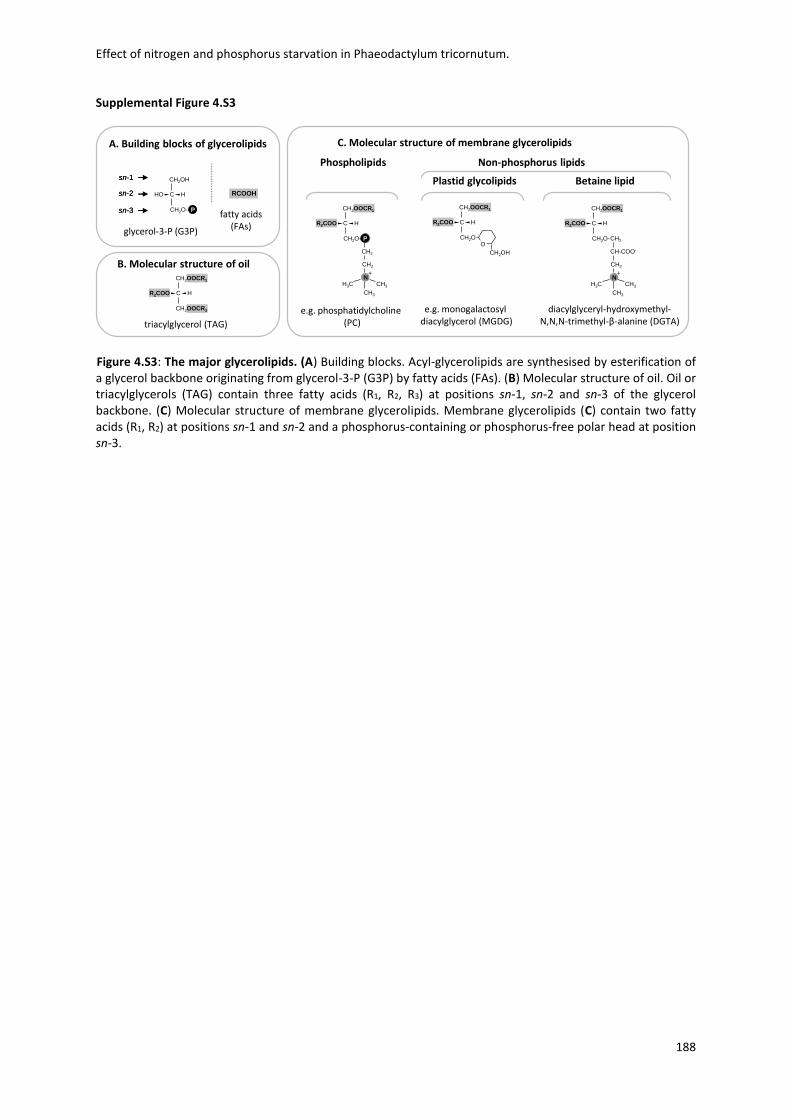
Effect of nitrogen and phosphorus starvation in Phaeodactylum tricornutum.
188
Supplemental Figure 4.S3
Figure 4.S3: The major glycerolipids. (A) Building blocks. Acyl-glycerolipids are synthesised by esterification of a glycerol backbone originating from glycerol-3-P (G3P) by fatty acids (FAs). (B) Molecular structure of oil. Oil or triacylglycerols (TAG) contain three fatty acids (R1, R2, R3) at positions sn-1, sn-2 and sn-3 of the glycerol backbone. (C) Molecular structure of membrane glycerolipids. Membrane glycerolipids (C) contain two fatty acids (R1, R2) at positions sn-1 and sn-2 and a phosphorus-containing or phosphorus-free polar head at position sn-3.
CH2OH
C
CH2O-
HHO
P
sn-1
sn-2
sn-3
CH2OH
C
CH2O-
HHO
P
CH2OH
C
CH2O-
HHO
CH2OH
C
CH2O-
HHO
PP
sn-1
sn-2
sn-3
RCOOHRCOOH
Building blocks of glycerolipids
Glycerol-3-P
Fatty acids
A. Building blocks of glycerolipids
B. Molecular structure of oil
C. Molecular structure of membrane glycerolipids
glycerol-3-P (G3P)
fatty acids(FAs)
triacylglycerol (TAG)
e.g. phosphatidylcholine (PC)
e.g. monogalactosyldiacylglycerol (MGDG)
+
CH-COO-
CH2
N
CH2
H3C
CH3
CH3
CH2OOCR1
C
CH2O-
HR2COO
+
P
CH2
CH2
NH3C
CH3
CH3
CH2OOCR1
C
CH2O-
HR2COO
O
CH2OH
CH2OOCR1
C
CH2O
HR2COO
CH2OH
C
CH2O-
HHO
P
CH2OOCR3
CH2OOCR1
C HR2COO
Phospholipids Non-phosphorus lipids
Plastid glycolipids Betaine lipid
diacylglyceryl-hydroxymethyl-N,N,N-trimethyl-β-alanine (DGTA)
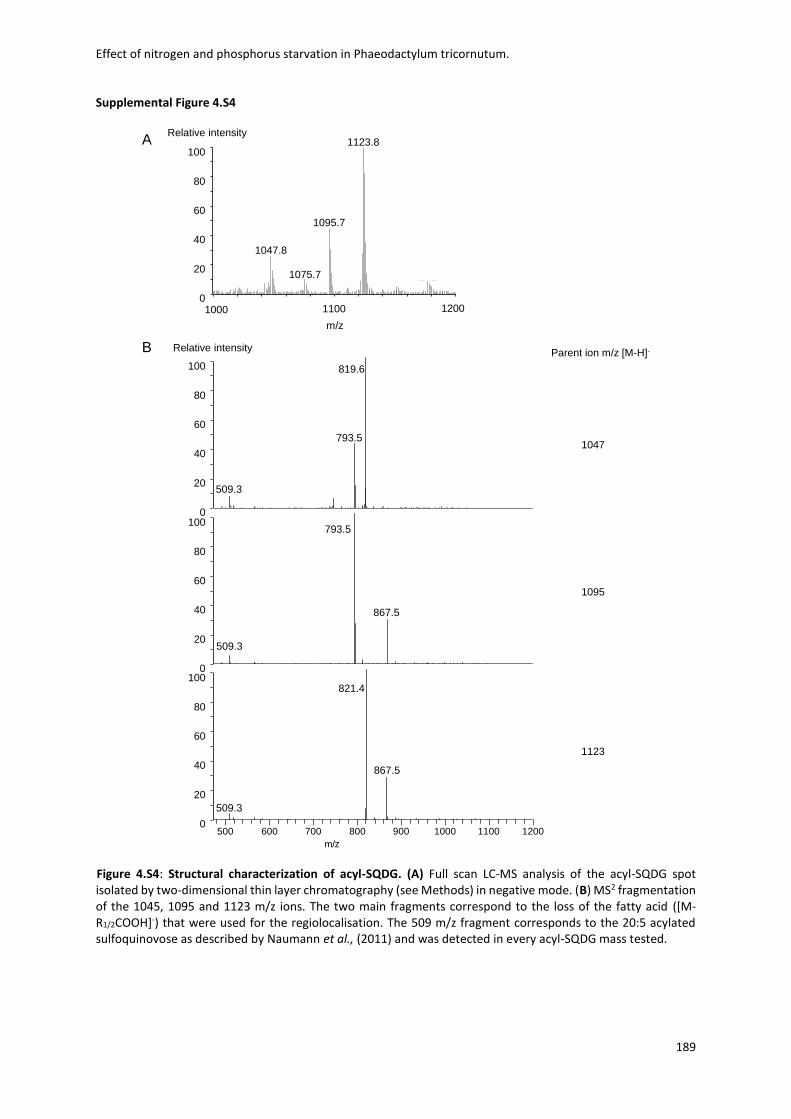
Effect of nitrogen and phosphorus starvation in Phaeodactylum tricornutum.
189
Supplemental Figure 4.S4
Figure 4.S4: Structural characterization of acyl-SQDG. (A) Full scan LC-MS analysis of the acyl-SQDG spot isolated by two-dimensional thin layer chromatography (see Methods) in negative mode. (B) MS2 fragmentation of the 1045, 1095 and 1123 m/z ions. The two main fragments correspond to the loss of the fatty acid ([M-R1/2COOH]-) that were used for the regiolocalisation. The 509 m/z fragment corresponds to the 20:5 acylated sulfoquinovose as described by Naumann et al., (2011) and was detected in every acyl-SQDG mass tested.
Zneg_fullscan_1123_26_11_12_121123144115 #1 RT: 0.00 AV: 1 NL: 3.24E5T: ITMS - c ESI Full ms [305.00-2000.00]
1000 1020 1040 1060 1080 1100 1120 1140 1160 1180 1200
m/z
0
5
10
15
20
25
30
35
40
45
50
55
60
65
70
75
80
85
90
95
100
Rel
ativ
e Ab
unda
nce
1123.78
1095.67
1047.74
1205.25
1075.731177.121042.54
1151.801110.641021.67
1156.53992.48 1190.98
1123.8
1000 1100 1200
1095.7
1075.7
1047.8
0
40
60
80
20
100
m/z
Relative intensityA
B
300 400 500 600 700 800 900 1000 1100 1200
m/z
0
20
40
60
80
1000
20
40
60
80
100
Re
lative
Ab
un
da
nce
0
20
40
60
80
100 NL: 3.10E4
zneg_1047_26_11_12_121123144115#1 RT: 0.00 AV: 1 T: ITMS - c ESI Full ms2 [email protected] [285.00-1200.00]
NL: 7.18E4
zneg_1095_26_11_12_121123144115#1 RT: 0.00 AV: 1 T: ITMS - c ESI Full ms2 [email protected] [300.00-1200.00]
NL: 1.78E5
zneg_ms2_1123_26_11_12_121123144115#1 RT: 0.00 AV: 1 T: ITMS - c ESI Full ms2 [email protected] [305.00-1200.00]
0
40
60
80
20
100
0
40
60
80
20
100
0
40
60
80
20
100
509.3
509.3
509.3
821.4
867.5
793.5
819.6
793.5
867.5
Relative intensityParent ion m/z [M-H]-
1047
1095
1123
Effect of nitrogen and phosphorus starvation in Phaeodactylum tricornutum.
190
4.6 Conclusion and remarks
This work represents the first reference of the glycerolipidomic of Phaeodactylum (i.e.
Pt1) under different nitrogen and phosphorus supplies. Thanks to the lipidomic analysis, the
main lipid classes (i.e. MGDG, DGDG, SQDG, PG, PC etc) were detected and this allows to
implement the knowledges on the mechanism of TAG triggered by nutrients starvation.
Overall, both N and P starvation triggers TAG accumulation but this happens in different
timing and mechanism. In general, the N limitation has a bigger impact in cell physiology (i.e.
arrest of growth and decrease of Fv/Fm) and in a short time the cells start to produce TAGs. In
this condition, the TAG are mostly produced by neo-synthesis pathways (i.e. high levels of
16:0 and 16:1 fatty acids). However, TAG can also be produced from the interconversion of
membrane lipids as shown from the decrease of one of main constituent of thylakoid
membrane, i.e. MGDG (confirming the results in Alipanah et al., 2015). Most interestingly,
cells did not show any decrease in photosynthesis efficiency, under P limitation, and continue
to grow during the first days of culture. This can be explained for the presence of
polyphosphate storage within Phaeodactylum (Leitao et al., 1995). In a second phase (i.e.
after 8 days), the cells start to degrade phospholipids PG, PE, PI and PC (i.e. not detected in
this analysis in cells grown without P) in order to recycle the phosphate and to accumulate
TAG. These results are similar with the finding of the degradation of extraplastic membrane
in –P stressed cells in Yang et al., 2014. We, hence, assume that under P starvation the TAG
are produced by recycling extraplastic membrane lipids (i.e. PG, PE, PI and PC).
TAGs accumulation has been also investigated by comparing the different ecotypes of
Phaeodactylum using Nile Red fluorescence as a proxy for TAG accumulation. This analysis
showed interesting differences on the response to nutrients starvation. Further work should
entail the genetically characterization of these ecotypes in order to help on understanding
these results taking advantage of their natural biodiversity. Indeed, the discovery of a natural
NPQ mutant in Phaeodactylum (i.e. ecotype Pt4) helps to understand the role of LHCX1 in
photoprotection process (Bailleul et al., 2010). Following the same rationale, it would be also
interesting to screen the mixotrophic growth in the different ecotypes of Phaeodactylum.
Ecotypes with increased or decreased mixotrophic capacity could reveal interesting genes
involved in this trophic mode (i.e. sugar transporter) and hence better understand this
mechanism.
Effect of nitrogen and phosphorus starvation in Phaeodactylum tricornutum.
191
This study together with the previous work (Villanova et al.,) provides a detailed
scenario of P. tricornutum acclimation to nutrient deprivation (in both phototrophic and
mixotrophic mode), and can be used as a model for future metabolic engineering to increase
TAG production.
Final Conclusions and remarks
192
Chapter 5
Final Conclusions and remarks
Diatoms play a key role in the ecology of the planet, since they are responsible for 20-
40% of the global carbon fixation. They also represent a potential feedstock for high-value
molecules, since they are able to accumulate large amount of triacylglycerols, which can be
used for the production of biofuel. Indeed, microalgal-derived oil is a possible alternative to
petroleum for the production of fuel, because of the lower land area requirement for
microalgal cultivation, when compared to vegetable crops (Yusuf 2007). However, under strict
phototrophic regime the biomass productivity of diatoms is still not compatible with industrial
standards. Several diatoms, due to their historical evolution, are able to combine
photosynthesis and respiration for growth (mixotrophic metabolism), and to enhance both
lipid and biomass productivity (García et al., 2000; 2005; 2006; Kitano et al., 1997). As shown
in chapter 3, when algae are supplemented with a carbon source the light intensity required
for optimum biomass production is lower. This is a promising result, which could reduce the
industrial costs of growth in photobioreactors.
For all these reasons, the cultivation under mixotrophic regime is of major interest for
biofuel production in diatoms (Wang et al., 2012). However, the metabolic consequences and
the mechanism behind this process are still poorly understood in these organisms. In this
study, the pennate P. tricornutum, for which we have the whole genome sequenced, and
genetic engineering tools, has been used as model organism to explore the potential of
mixotrophic metabolism using a multi-disciplinary approach. In particular, in Bailleul et al.,
2015 (presented in chapter 2) a wide range of biophysical tools have been used to clarify the
base of chloroplast–mitochondria interaction in diatoms. These analyses revealed that the
reducing power (i.e. NADPH) generated during the photosynthesis is exported to the
mitochondria, and the ATP produced during the oxidative respiration is redirected towards to
the chloroplast. The communication between these two organelles is crucial for carbon
fixation and growth in Phaeodactylum. In addition, the involvement of mitochondrial
respiration in optimising the photosynthesis process was confirmed in other diatoms
Final Conclusions and remarks
193
(Thalassiosira pseudonana, T. weissflogii, Fragilaria pinnata and Ditylum brightwellii). These
findings could explain the ecological success of diatoms on the oceans. Based on these results
we decided to study the consequences of the mixotrophic growth on the metabolism of
Phaeodactylum. In Villanova et al., (presented in the chapter 3) the effect of glycerol addition
in the diatom was tested by combining omics and biophysical analyses. Here, we found that
the glycerol (selected because it is cheap and abundant) not only stimulates growth and lipid
production but also the carbon storage metabolism. Since this pathway is in competition with
lipid production, our results suggest that mixotrophy could represent a possible solution to
further increase TAG accumulation in lines engineered with reduced accumulation of
chrysolaminarin (i.e. the main storage carbohydrate of diatoms, Daboussi et al., 2014). In our
study, two others metabolites involved in carbon storage metabolism (i.e. trehalose and
mannitol) were found to be upregulated by glycerol. Therefore, inhibition of the biosynthetic
pathway of these compounds by metabolic engineering could also enhance the effect of
glycerol in TAG accumulation.
Another relevant outcome of this study is the optimisation of the growth medium
based on the elemental balancing of biomass and medium composition (Mandalam and
Palsson 1998; Danquah et al., 2010). This approach allows designing a medium specific for the
microalgae of interest, and obtains higher-density cultures with a relatively low additional
cost. Hence, the optimisation of the medium composition is a crucial step for the industrial
exploitation of microalgae. Here, the new medium (ESAW enriched) enhanced the growth
capacity of Phaeodactylum (in particular under mixotrophic mode) and the production of high
value molecules, i.e. lipids and pigments.
It is interesting to note that the microelements (i.e. Cu, Mn, Zn) are the most limiting
elements for the growth of Phaeodactylum. Indeed, these metals (present only in trace in
seawater) play a vital role as enzyme cofactors in important pathways such as photosynthesis,
respiration and carbon fixation in microalgae. This suggests a potential use of these elements
to others microalgae culture for enhancing their growth capacities. The performances of the
mixotrophic metabolism in Phaeodactylum were further optimised by the addition of both
inorganic (bicarbonate) and organic source (glycerol). In fact, whereas the bicarbonate
addition (converted to CO2 thanks to the presence of concentrating mechanisms in diatoms)
can enhance the photosynthetic activity in the chloroplast, the glycerol can activate the
respiration in the mitochondrion (i.e. via glycolysis and TCA). Our findings demonstrate that
Final Conclusions and remarks
194
the simultaneous optimisation of these two processes is crucial for carbon fixation and growth
in Phaeodactylum, confirming the hypothesis developed in Bailleul et al., 2015. The works
Villanova et al., and Bailleul et al., contribute to the understanding of the possible mechanism
of mixotrophy. However, not all the metabolites and transports involved in the interaction
between mitochondrion and chloroplast have been identified. In particular, all the omics
analyses (Villanova et al.,) have been performed in the initial conditions where glycerol
consumption and mixotrophic efficiency were very low. Repeating these analyses under
optmised conditions could allow detecting a stronger effect of glycerol on metabolism,
helping to a better characterization of this process. Similarly, the biophysical analyses (Bailleul
et al., 2015) have only been perfomed in phototrophic cultures. Based on these new results,
it would be interesting to study the energetic interactions of plastids and mitochondria in
presence of a carbon source. Furthermore, during my Ph.D various mutant lines (both
overexpressing and knock downing) have been generated, which were not been fully
characterized, and hence, are not presented in this Ph.D thesis. The target genes for metabolic
engineering were selected by combining microarray analysis, to genome-based analysis.
Amongst these, two genes are extremely interesting and could play an important role in the
mixotrophic metabolism of Phaeodactylum: i) Glycerol-3P transporter (PHATRDRAFT_43611),
and ii) succinate-fumarate antiporter (PHATRDRAFT_23709). The first has a role in the
transport of cytosolic reducing equivalents to the mitochondria in yeast, animal and plant
systems (Ansell et al., 1997; Larsson et al., 1998; Rigoulet et al., 2004; Shen et al., 2006). This
likely occurs via the action of a cytoplasmic NAD-dependent gly-3P dehydrogenase that
converts the DHAP into gly 3-P by oxidizing one molecule of NADH to NAD+. Gly 3-P can be
imported into the mitochondrion through the gly-3P transporter. The reverse path is
catalysed by a FAD-dependent mitochondrial gly-3-P dehydrogenase that transfers the
electrons to the quinone pool that enter in oxidative phosphorylation. In Phaeodactylum, 2
classes of NAD-gly-3-P dehydrogenases are present in the genome (PHATRDRAFT_8975;
PHATR_36821) but any FAD-gly-3-P dehydrogenase has been identified so far. Moreover, the
subcellular localization of the glycerol-3-P transporter is still unknown. It would be interesting
to determine the localization of this shuttle by generating a transgenic line bearing the fusion
of the gene of interest to cyan fluorescent protein (CFP) or yellow fluorescent protein (YFP).
The characterization of this mutant line and the transporter-overexpressing mutant
Final Conclusions and remarks
195
(generated during this project) could help to understand if similar pathway can be found in
the diatom.
The succinate-fumarate antiporter has been found in both plant and yeast (Catoni et
al., 2003; Pallotta et al., 1999). In particular, in plant this carrier seems to regulate the
conversion of storage lipids to soluble carbohydrates during germination. Pallotta et al., found
that the succinate can be produced by the β-oxidation of fatty acids via glyoxylate cycle that
can enter the mitochondrion trough the succinate-fumarate antiporter and be converted to
fumarate via TCA cycle. The fumarate exported by the mitochondria can be then converted
to malate in the cytosol by a fumarase, and enters the gluconeogenesis pathway. However, it
seems that this shuttle system involves energetic exchanges between cytosol and
mitochondria and not between chloroplast and mitochondria. In Phaedoactylum, the TCA is
localized in the mitochondria but some isoenzymes may have a cytosolic localization (similarly
to plant and yeast metabolism). In fact, 2 classes of fumarases (PHATRDRAFT_36139,
PHATRDRAFT_19708) are present in the genome of Phaeodactylum but their localization has
not been studied. The presence of this transporter, together with our findings that the
fumarate can be used by Phaeodactylum to grow in mixotrophy, suggest that these molecules
could be involved in the regulation of reducing power. The characterization of the knock-
down mutant of this shuttle (generated in this project) via ECS analysis can answer this
question. In addition, the localization of the fumarate isoenzymes is also important to
understand if the pathway described above is conserved in the diatom or a different
mechanism is present.
In this study, it was also showed that the glycerol addition can be used as an alternative
to nutrient starvation for increasing TAG production. In fact, thanks to the comparison of the
results obtained in Abida et al., (see chapter 4) and Villanova et al., (see chapter 3) it was
possible to clarify the pathways that trigger the TAG production in the two conditions:
nutrient starvation vs mixotrophic metabolism. The addition of glycerol leads to an increase
of TAG production (manly derived from neosynthesis pathway) in N replete condition without
altering the photosynthetic performance of the diatom and enhancing growth. By contrast,
in N deplete condition the cells stop to grow, the cellular components are degraded in favor
of basic needs and TAG accumulation is due to both membrane glycerolipids recycling and
neosynthesis pathway. The mixotrophic metabolism leads to increase the biomass
productivity and hence the final lipids quantity. Moreover, both the studies help to elucidate
Final Conclusions and remarks
196
the main routes involved in the TAG biosynthesis and can be used as models for future
metabolic engineering to obtain the targeted fatty acid profile.
The final step of my PhD thesis focused on the up-scaling of the optimised conditions
in lab scale photobioreactors to test the potential of the industrial exploitation of
Phaeodactylum. In these experiments, 2-L photobioreactors cultivation has been selected as
the best way to grow mixotrophically the diatom in axenic conditions and under controlled
system (pH, temperature, mixing/aeration). This system allows to further improving the
performance of the mixotrophic growth of Phaeodactylum, reaching a final biomass
concentration of about 12 g/L. This was obtained growing the diatom to relative low light
intensity (about 300 µE/m²/s), the increase of light could increase the biomass productivity.
Of course, the up-scaling of improved strains is another attractive alternative to be tested.
To conclude, this project brings together several approaches (omics analyses,
biophysical approaches, physiology and culture processes) working in between basic research
and industrial R&D. This experience taught me that only the understanding of the entire
biological system may lead to an efficient optimisation of the process, making possible the
industrial exploitation of microalgae. Moreover, the fact that this project was included in a
European project allowed me to participate to different conferences (e.g. Molecular Life of
Diatoms, Seattle; ENCAPP and YAS, Malta), workshops (e.g. Proteomics; Spectrometric
analysis; Metabolic modelling analysis), to collaborate with others members of the
consortium (e.g. UMPC, Paris; CNRS, Grenoble; Institute Max Plank, Potsdam; University of
Oxford) and to be seconded in others laboratories (e.g. UPMC, Paris and CEA, Grenoble).
These have led to my professional and personal development.
References
197
References
Abida, H. et al., Membrane glycerolipid remodeling triggered by nitrogen and phosphorus
starvation in Phaeodactylum tricornutum. Plant Physiol. 167, 118–36 (2015).
Alipanah, L., Rohloff, J., Winge, P., Bones, A. M. & Brembu, T. Whole-cell response to nitrogen
deprivation in the diatom Phaeodactylum tricornutum. J. Exp. Bot. 66, 6281–6296 (2015).
Allen, A. E. et al., Evolution and metabolic significance of the urea cycle in photosynthetic
diatoms. TL - 473. Nature 473 VN - , 203–207 (2011).
Allen, A. E., Laroche, J, Maheswari, U, Lommer, M, Schauer, N, Lopez, PJ, Finazzi, G., Fernie,
AR, Bowler, C. Whole-cell response of the pennate diatom Phaeodactylum tricornutum to
iron starvation. Proc. Natl. Acad. Sci. U. S. A. 105, 10438–10443 (2008).
Allen, C.F., O. Hirayama, P. Good, Lipid composition in photosynthetic systems. Biochemistry
of Chloroplasts, 1, 195–200 (1966).
Allen, J. F. Cyclic, pseudocyclic and noncyclic photophosphorylation: New links in the chain.
Trends in Plant Science 8, 15–19 (2003).
Allen, J. F. Photosynthesis of ATP-electrons, proton pumps, rotors, and poise. Cell 110, 273–
276 (2002).
Alonso, D. L., Belarbi, E. H., Fernandez-Sevilla, J. M., Rodriguez-Ruiz, J. & Grima, E. M. Acyl
lipid composition variation related to culture age and nitrogen concentration in continuous
culture of the microalga Phaeodactylum tricornutum. Phytochemistry (2000).
doi:10.1016/S0031-9422(00)00084-4
Ansell, R., Granath, K., Hohmann, S., Thevelein, J.M., and Adler, L. The two isoenzyme for
yeast NADþ-dependent glycerol 3-phosphate dehydrogenase encoded by GPD1 and GPD2
have distinct roles in osmoadaptation and redox regulation. EMBO J. 16, 2179–2187 (1997).
Apt, K. E., Grossman, A. R., Kroth-Pancic, P. G. Grossman A. R. Stable nuclear transformation
of the diatom Phaeodactylum tricornutum. Mol Gen Genet. 5, 572–9 (1996).
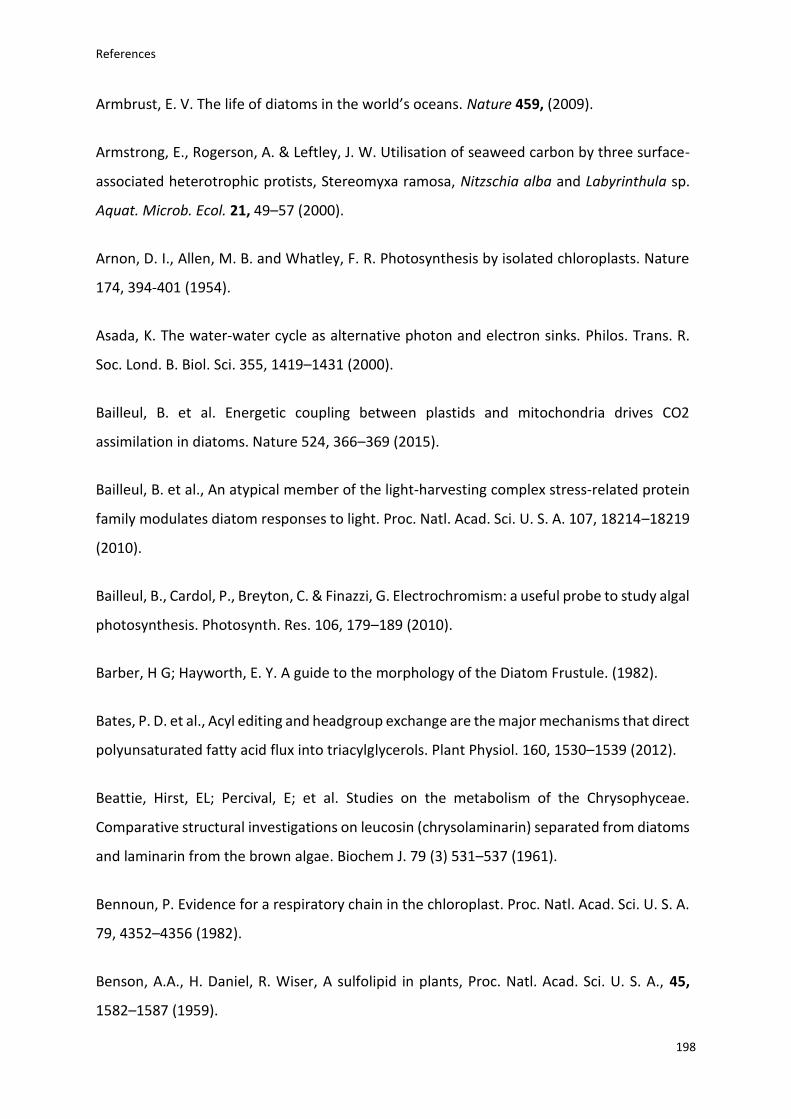
References
198
Armbrust, E. V. The life of diatoms in the world’s oceans. Nature 459, (2009).
Armstrong, E., Rogerson, A. & Leftley, J. W. Utilisation of seaweed carbon by three surface-
associated heterotrophic protists, Stereomyxa ramosa, Nitzschia alba and Labyrinthula sp.
Aquat. Microb. Ecol. 21, 49–57 (2000).
Arnon, D. I., Allen, M. B. and Whatley, F. R. Photosynthesis by isolated chloroplasts. Nature
174, 394-401 (1954).
Asada, K. The water-water cycle as alternative photon and electron sinks. Philos. Trans. R.
Soc. Lond. B. Biol. Sci. 355, 1419–1431 (2000).
Bailleul, B. et al. Energetic coupling between plastids and mitochondria drives CO2
assimilation in diatoms. Nature 524, 366–369 (2015).
Bailleul, B. et al., An atypical member of the light-harvesting complex stress-related protein
family modulates diatom responses to light. Proc. Natl. Acad. Sci. U. S. A. 107, 18214–18219
(2010).
Bailleul, B., Cardol, P., Breyton, C. & Finazzi, G. Electrochromism: a useful probe to study algal
photosynthesis. Photosynth. Res. 106, 179–189 (2010).
Barber, H G; Hayworth, E. Y. A guide to the morphology of the Diatom Frustule. (1982).
Bates, P. D. et al., Acyl editing and headgroup exchange are the major mechanisms that direct
polyunsaturated fatty acid flux into triacylglycerols. Plant Physiol. 160, 1530–1539 (2012).
Beattie, Hirst, EL; Percival, E; et al. Studies on the metabolism of the Chrysophyceae.
Comparative structural investigations on leucosin (chrysolaminarin) separated from diatoms
and laminarin from the brown algae. Biochem J. 79 (3) 531–537 (1961).
Bennoun, P. Evidence for a respiratory chain in the chloroplast. Proc. Natl. Acad. Sci. U. S. A.
79, 4352–4356 (1982).
Benson, A.A., H. Daniel, R. Wiser, A sulfolipid in plants, Proc. Natl. Acad. Sci. U. S. A., 45,
1582–1587 (1959).
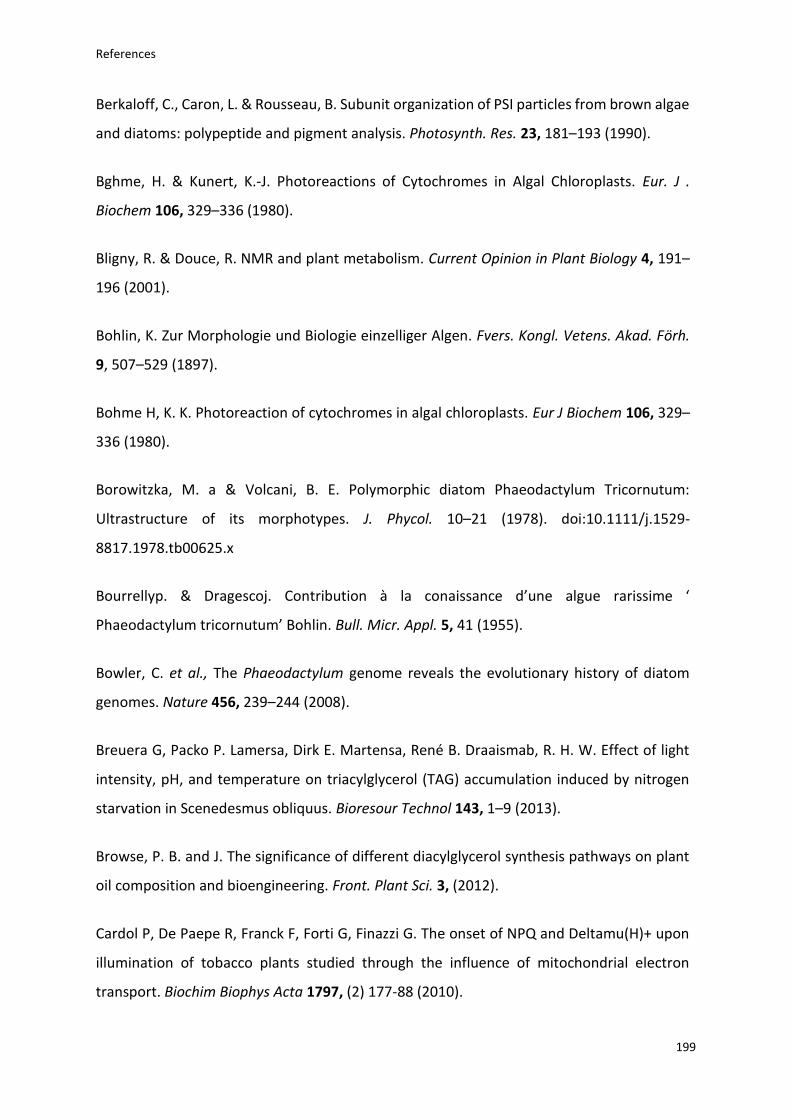
References
199
Berkaloff, C., Caron, L. & Rousseau, B. Subunit organization of PSI particles from brown algae
and diatoms: polypeptide and pigment analysis. Photosynth. Res. 23, 181–193 (1990).
Bghme, H. & Kunert, K.-J. Photoreactions of Cytochromes in Algal Chloroplasts. Eur. J .
Biochem 106, 329–336 (1980).
Bligny, R. & Douce, R. NMR and plant metabolism. Current Opinion in Plant Biology 4, 191–
196 (2001).
Bohlin, K. Zur Morphologie und Biologie einzelliger Algen. Fvers. Kongl. Vetens. Akad. Förh.
9, 507–529 (1897).
Bohme H, K. K. Photoreaction of cytochromes in algal chloroplasts. Eur J Biochem 106, 329–
336 (1980).
Borowitzka, M. a & Volcani, B. E. Polymorphic diatom Phaeodactylum Tricornutum:
Ultrastructure of its morphotypes. J. Phycol. 10–21 (1978). doi:10.1111/j.1529-
8817.1978.tb00625.x
Bourrellyp. & Dragescoj. Contribution à la conaissance d’une algue rarissime ‘
Phaeodactylum tricornutum’ Bohlin. Bull. Micr. Appl. 5, 41 (1955).
Bowler, C. et al., The Phaeodactylum genome reveals the evolutionary history of diatom
genomes. Nature 456, 239–244 (2008).
Breuera G, Packo P. Lamersa, Dirk E. Martensa, René B. Draaismab, R. H. W. Effect of light
intensity, pH, and temperature on triacylglycerol (TAG) accumulation induced by nitrogen
starvation in Scenedesmus obliquus. Bioresour Technol 143, 1–9 (2013).
Browse, P. B. and J. The significance of different diacylglycerol synthesis pathways on plant
oil composition and bioengineering. Front. Plant Sci. 3, (2012).
Cardol P, De Paepe R, Franck F, Forti G, Finazzi G. The onset of NPQ and Deltamu(H)+ upon
illumination of tobacco plants studied through the influence of mitochondrial electron
transport. Biochim Biophys Acta 1797, (2) 177-88 (2010).
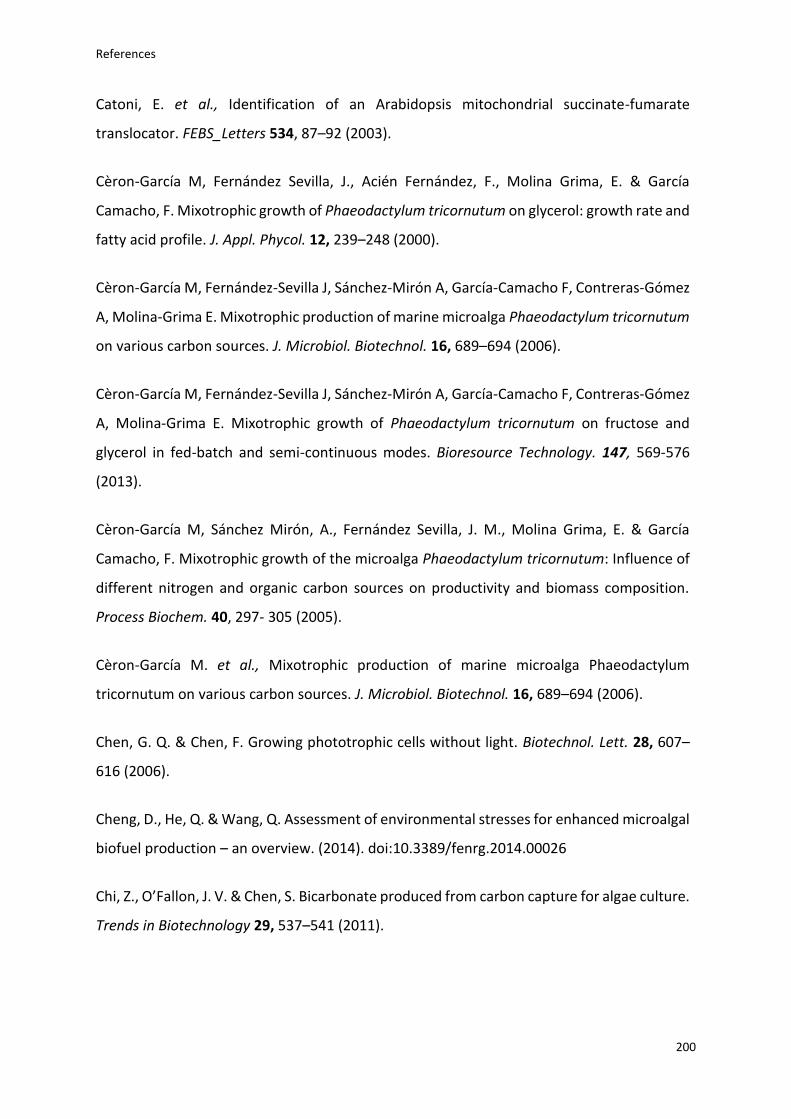
References
200
Catoni, E. et al., Identification of an Arabidopsis mitochondrial succinate-fumarate
translocator. FEBS_Letters 534, 87–92 (2003).
Cèron-García M, Fernández Sevilla, J., Acién Fernández, F., Molina Grima, E. & García
Camacho, F. Mixotrophic growth of Phaeodactylum tricornutum on glycerol: growth rate and
fatty acid profile. J. Appl. Phycol. 12, 239–248 (2000).
Cèron-García M, Fernández-Sevilla J, Sánchez-Mirón A, García-Camacho F, Contreras-Gómez
A, Molina-Grima E. Mixotrophic production of marine microalga Phaeodactylum tricornutum
on various carbon sources. J. Microbiol. Biotechnol. 16, 689–694 (2006).
Cèron-García M, Fernández-Sevilla J, Sánchez-Mirón A, García-Camacho F, Contreras-Gómez
A, Molina-Grima E. Mixotrophic growth of Phaeodactylum tricornutum on fructose and
glycerol in fed-batch and semi-continuous modes. Bioresource Technology. 147, 569-576
(2013).
Cèron-García M, Sánchez Mirón, A., Fernández Sevilla, J. M., Molina Grima, E. & García
Camacho, F. Mixotrophic growth of the microalga Phaeodactylum tricornutum: Influence of
different nitrogen and organic carbon sources on productivity and biomass composition.
Process Biochem. 40, 297- 305 (2005).
Cèron-García M. et al., Mixotrophic production of marine microalga Phaeodactylum
tricornutum on various carbon sources. J. Microbiol. Biotechnol. 16, 689–694 (2006).
Chen, G. Q. & Chen, F. Growing phototrophic cells without light. Biotechnol. Lett. 28, 607–
616 (2006).
Cheng, D., He, Q. & Wang, Q. Assessment of environmental stresses for enhanced microalgal
biofuel production – an overview. (2014). doi:10.3389/fenrg.2014.00026
Chi, Z., O’Fallon, J. V. & Chen, S. Bicarbonate produced from carbon capture for algae culture.
Trends in Biotechnology 29, 537–541 (2011).

References
201
Choudhary, M., Jetley, U. K., Abash Khan, M., Zutshi, S. & Fatma, T. Effect of heavy metal
stress on proline, malondialdehyde, and superoxide dismutase activity in the
cyanobacterium Spirulina platensis-S5. Ecotoxicol. Environ. Saf. 66, 204–9 (2007).
Chunye Zhanga, b, H. H. High-efficiency nuclear transformation of the diatom
Phaeodactylum tricornutum by electroporation. Mar. Genomics 16, 63–66 (2014).
D’Ippolito, G. et al., Potential of lipid metabolism in marine diatoms for biofuel production.
Biotechnol. Biofuels 8, 28 (2015).
Daboussi F, Leduc S, Maréchal A, Dubois G, Guyot V, Perez-Michaut C, Amato A, Falciatore
A, Juillerat A, Beurdeley M, Voytas D, Cavarec L, Duchateau P. Genome engineering
empowers the diatom Phaeodactylum tricornutum for biotechnology. Nat. Commun. 5, 3831
(2014).
Danquah M. K., R. Harun, R. H. design new medium. Chem. Biochem. Eng. 24, 361–369
(2010).
Darzins, A., Pienkos, P. & Edye, L. Current status and potential for algal biofuels production.
Natl. Renew. Energy Lab. NREL A Rep. to Bioenergy Task 39 Report T39, 146 (2010).
De Martino, A., Meichenin, A., Shi, J., Pan, K. & Bowler, C. Genetic and phenotypic
characterization of Phaeodactylum tricornutum (Bacillariophyceae) accessions. J. Phycol.
(2007). doi:10.1111/j.1529-8817.2007.00384.x
De Riso, V. et al., Gene silencing in the marine diatom Phaeodactylum tricornutum. Nucleic
Acids Res. (2009). doi:10.1093/nar/gkp448
Delwiche, C. F. & Palmer, J. D. The origin of plastids and their spread via secondary symbiosis.
Plant Syst. Evol. 53–86 (1997). doi:10.1007/978-3-7091-6542-3_3
Delwiche, C. F. Tracing the Thread of Plastid Diversity through the Tapestry of Life. Am. Nat.
154, S164–S177 (1999).
References
202
Dodson, V. J., Mouget, J. L., Dahmen, J. L. & Leblond, J. D. The long and short of it:
Temperature-dependent modifications of fatty acid chain length and unsaturation in the
galactolipid profiles of the diatoms Haslea ostrearia and Phaeodactylum tricornutum.
Hydrobiologia 727, 95–107 (2014).
Dutilleul C, Driscoll S, Cornic G, De Paepe R, Foyer CH, Noctor G. Functional mitochondrial
complex I is required by tobacco leaves for optimal photosynthetic performance in
photorespiratory conditions and during transients. Plant Physiol. 131, (1) 264-75 (2003).
Fabris, M., Matthijs, M., Rombauts, S., Vyverman, W., Goossens, A., Baart, G J E. The
metabolic blueprint of Phaeodactylum tricornutum reveals a eukaryotic Entner-Doudoroff
glycolytic pathway. Plant J. 70, 1004–14 (2012).
Falciatore, A., Casotti, R., Leblanc, C., Abrescia, C. & Bowler, C. Transformation of
Nonselectable Reporter Genes in Marine Diatoms. Marine Biotechnology 1, 239–251 (1999).
Falkowski P, Owens T. Light-Shade Adaptation: two strategies in marine phytoplankton. Plant
physiology 66, (4) 592-595 (1980).
Falkowski, P. G. & Knoll, A. H. Evolution of primary producers in the sea. Evol. Prim. Prod. Sea
1–6(2007). http://www.sciencedirect.com/science/article/pii/B9780123705181500023
Falkowski, P. G., Dubinsky, Z. & Wyman, K. Growth-irradiance relationships in phytoplankton.
Limnol. Oceanogr. 30, 311–321 (1985).
Fernie, A. R., Obata, T., Allen, A. E., Araújo, W. L. & Bowler, C. Leveraging metabolomics for
functional investigations in sequenced marine diatoms. Trends in Plant Science 17, 395–403
(2012).
Finazzi, G. & Rappaport, F. In vivo characterization of the electrochemical proton gradient
generated in darkness in green algae and its kinetic effects on cytochrome b6f turnover.
Biochemistry 37, 9999–10005 (1998).
Finazzi, G. The central role of the green alga Chlamydomonas reinhardtii in revealing the
mechanism of state transitions. J. Exp. Bot. 56, 383–388 (2005).
References
203
Flores-Sarasa, I. et al., In vivo cytochrome and alternative pathway respiration in leaves of
Arabidopsis thaliana plants with altered alternative oxidase under different light conditions.
Plant, Cell Environ. 34, 1373–1383 (2011).
Forti G, Ehrenheim AM. The role of ascorbic acid in photosynthetic electron transport.
Biochim Biophys Acta 1183, 408-412 (1993).
Gandin, A., Duffes, C., Day, D. A. & Cousins, A. B. The absence of alternative oxidase AOX1A
results in altered response of photosynthetic carbon assimilation to increasing CO2 in
Arabidopsis thaliana. Plant Cell Physiol. 53, 1627–1637 (2012).
Gardner, R. D. et al., Use of sodium bicarbonate to stimulate triacylglycerol accumulation in
the chlorophyte Scenedesmus sp. and the diatom Phaeodactylum tricornutum. J. Appl.
Phycol. 24, 1311–1320 (2012).
Ge, F. et al., Methylcrotonyl-CoA Carboxylase Regulates Triacylglycerol Accumulation in the
Model Diatom Phaeodactylum tricornutum. Plant Cell 26, 1681–1697 (2014).
Geider, R. J., Roche, J., Greene, R. M. & Olaizola, M. Response of the photosynthetic
apparatus of phaeodactylum tricornutum (bacillariophyceae) to nitrate, phosphate, or iron
starvation. J. Phycol. 29, 755–766 (1993).
Green, B. R. & Durnford, D. G. the Chlorophyll-Carotenoid Proteins of Oxygenic
Photosynthesis. Annu. Rev. Plant Physiol. Plant Mol. Biol. 47, 685–714 (1996).
Green, B. R. After the primary endosymbiosis: An update on the chromalveolate hypothesis
and the origins of algae with Chl c. Photosynthesis Research 107, 103–115 (2011).
Guglielmi, G. et al., The light-harvesting antenna of the diatom Phaeodactylum tricornutum:
Evidence for a diadinoxanthin-binding subcomplex. FEBS J. 272, 4339–4348 (2005).
Guy, R. D., Berry, J. A., Fogel, M. L. & Hoering, T. C. Differential fractionation of oxygen
isotopes by cyanide-resistant and cyanide-sensitive respiration in plants. Planta 177, 483–
491 (1989).
References
204
Haimovich-Dayan, M. et al., The role of C4 metabolism in the marine diatom Phaeodactylum
tricornutum. New Phytol. 197, 177–85 (2013).
Haiying Wang. A study on lipid production of the mixotrophic microalgae Phaeodactylum
tricornutum on various carbon sources. African Journal of Microbiology Research 6, (2012).
Hamilton, M. L., Haslam, R. P., Napier, J. A. & Sayanova, O. Metabolic engineering of
Phaeodactylum tricornutum for the enhanced accumulation of omega-3 long chain
polyunsaturated fatty acids. Metab. Eng. 22, 3–9 (2014).
Han, X. & Gross, R. W. Global analyses of cellular lipidomes directly from crude extracts of
biological samples by ESI mass spectrometry: a bridge to lipidomics. J. Lipid Res. 44, 1071–
1079 (2003).
Hellebust, J. A. Glucose uptake by cyclotella cryptica: dark induction and light inactivation of
transport system. J. Phycol. 7, 345–349 (1971).
Hempel F, Bullmann L, Lau J, Zauner S, Maier UG. ERAD- derived preprotein transport across
the second outermost plastid membrane of diatoms. Molecular Biology and Evolution 26,
1781–1790 (2009).
Hendeyn, I. Note on the Plymouth ‘Nitxschia ’ culture. J . mar. biol. Ass. U.K. 33, 335 (1954).
Henneberry, A.L.; Lagace, T.A.; Ridgway, N.D.; McMaster, C.R. Phosphatidylcholine Synthesis
Influences the Diacylglycerol Homeostasis Required for Sec14pdependent Golgi Function
and Cell Growth. Mol. Biol. Cell 12, 511-520 (2001).
Hill R. & F. Bendall. Function of the 2 cytochrome components in chloroplasts—working
hypothesis. Nat. 186, 136 – 137 (1960).
Hopkinson, B. M. A chloroplast pump model for the CO2 concentrating mechanism in the
diatom Phaeodactylum tricornutum. in Photosynthesis Research (2014).
doi:10.1007/s11120-013-9954-7
References
205
Hu, Q. et al., Microalgal triacylglycerols as feedstocks for biofuel production: Perspectives
and advances. Plant Journal 54, 621–639 (2008).
Huang, A., Liu, L., Yang, C. & Wang, G. Phaeodactylum tricornutum photorespiration takes
part in glycerol metabolism and is important for nitrogen-limited response. Biotechnol.
Biofuels 8, 73 (2015).
Huege, J. et al., Sample amount alternatives for data adjustment in comparative
cyanobacterial metabolomics. Anal. Bioanal. Chem. 399, 3503–3517 (2011).
Huerlimann, R. & Heimann, K. Comprehensive guide to acetyl-carboxylases in algae. Crit. Rev.
Biotechnol. 33, 49–65 (2013).
Johansen, J.R. Morphological variability and cell wall composition of Phaeodactylum
tricornutum (Bacillariophyceae). Great Basin Nat. 51, 310–315 (1991).
Joliot P, Béal D, Frilley B. Une nouvelle méthode spectrophotometrique destinée á l’étude
des réactions photosynthetiques. J de Chim Phys. 77(3), 209–216 (1980).
Joliot P, Béal D, Joliot A. Cyclic electron flow under saturating excitation of dark-
adapted Arabidopsis leaves. Biochim Biophys Acta. 1656, 166–176 (2004).
Joliot P. Dispositif ampérométrique de mesure de photosynthèse. CR Acad Sci Paris. 243,
677–690 (1956).
Joliot P. Kinetic studies of photosystem II in photosynthesis. Photochem Photobiol. 8, 451–
463 (1968).
Karas, B. J. et al., ARTICLE Designer diatom episomes delivered by bacterial conjugation. Nat.
Commun. 6, (2015).
Kilian, O. & Kroth, P. G. Identification and characterization of a new conserved motif within
the presequence of proteins targeted into complex diatom plastids. Plant J. 41, 175–183
(2005).
References
206
Kitano, M., Matsukawa, R. & Karube, I. Changes in eicosapentaenoic acid content of Navicula
saprophila, Rhodomonas salina and Nitzschia sp. under mixotrophic conditions. J. Appl.
Phycol. 9, 559–563 (1997).
Klughammer, C., Siebke, K. & Schreiber, U. Continuous ECS-indicated recording of the
proton-motive charge flux in leaves. Photosynth. Res. 117,471–487 (2013).
Kroth, P. G. et al., A model for carbohydrate metabolism in the diatom Phaeodactylum
tricornutum deduced from comparative whole genome analysis. PLoS One 3, e1426 (2008).
Kuczynska, P., Jemiola-Rzeminska, M. & Strzalka, K. Photosynthetic Pigments in Diatoms.
Mar. Drugs (2015). doi:10.3390/md13095847
Kuntz, M. Plastid terminal oxidase and its biological significance. Planta 218, 896–899 (2004).
La Roche J, Geider R J, Graziano L M, Murray H, Lewis K. Induction of specific proteins in
eukaryotic algae grown under iron-, phosphorus-, or nitrogen-deficient conditions. Journal
of Phycology. 29, 767-777 (1993).
Laisk, A., Eichelmann, H., Oja, V., Rasulov, B. & Rämma, H. Photosystem II cycle and
alternative electron flow in leaves. Plant Cell Physiol. 47, 972–983 (2006).
Larsson, C., Pahlman, I.L., Ansell, R., Rigoulet, M., Adler, L., and Gustafsson, L. The importance
of the glycerol 3-phosphate shuttle during aerobic growth of Saccharomyces cerevisiae.
Yeast 14, 347–357 (1998).
Leitao, J. M. et al., Osmotic-stress-induced synthesis and degradation of inorganic
polyphosphates in the alga Phaeodactylum tricornutum. Mar Ecol-Prog Ser 121, 279–288
(1995).
Lepetit, B. et al., Spectroscopic and molecular characterization of the oligomeric antenna of
the diatom Phaeodactylum tricornutum. Biochemistry 46, 9813–9822 (2007).
Lepetit, B., Goss, R., Jakob, T. & Wilhelm, C. Molecular dynamics of the diatom thylakoid
membrane under different light conditions. Photosynthesis Research 111, 245–257 (2012).
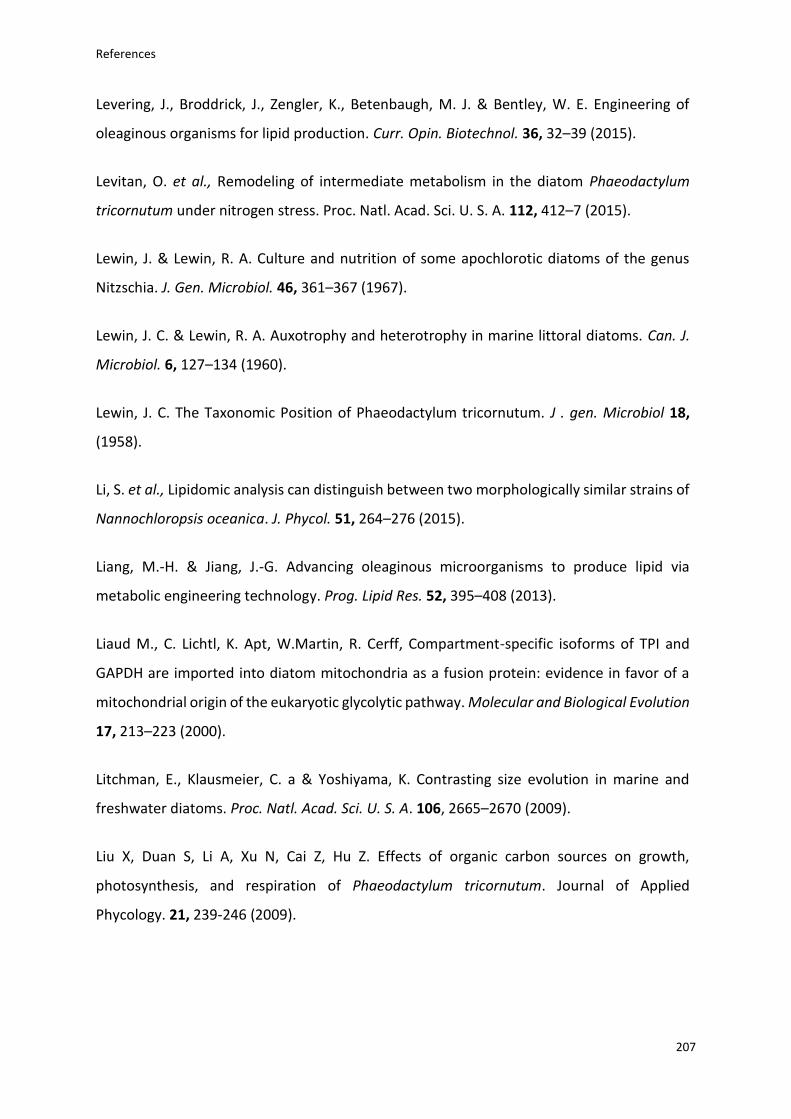
References
207
Levering, J., Broddrick, J., Zengler, K., Betenbaugh, M. J. & Bentley, W. E. Engineering of
oleaginous organisms for lipid production. Curr. Opin. Biotechnol. 36, 32–39 (2015).
Levitan, O. et al., Remodeling of intermediate metabolism in the diatom Phaeodactylum
tricornutum under nitrogen stress. Proc. Natl. Acad. Sci. U. S. A. 112, 412–7 (2015).
Lewin, J. & Lewin, R. A. Culture and nutrition of some apochlorotic diatoms of the genus
Nitzschia. J. Gen. Microbiol. 46, 361–367 (1967).
Lewin, J. C. & Lewin, R. A. Auxotrophy and heterotrophy in marine littoral diatoms. Can. J.
Microbiol. 6, 127–134 (1960).
Lewin, J. C. The Taxonomic Position of Phaeodactylum tricornutum. J . gen. Microbiol 18,
(1958).
Li, S. et al., Lipidomic analysis can distinguish between two morphologically similar strains of
Nannochloropsis oceanica. J. Phycol. 51, 264–276 (2015).
Liang, M.-H. & Jiang, J.-G. Advancing oleaginous microorganisms to produce lipid via
metabolic engineering technology. Prog. Lipid Res. 52, 395–408 (2013).
Liaud M., C. Lichtl, K. Apt, W.Martin, R. Cerff, Compartment-specific isoforms of TPI and
GAPDH are imported into diatom mitochondria as a fusion protein: evidence in favor of a
mitochondrial origin of the eukaryotic glycolytic pathway. Molecular and Biological Evolution
17, 213–223 (2000).
Litchman, E., Klausmeier, C. a & Yoshiyama, K. Contrasting size evolution in marine and
freshwater diatoms. Proc. Natl. Acad. Sci. U. S. A. 106, 2665–2670 (2009).
Liu X, Duan S, Li A, Xu N, Cai Z, Hu Z. Effects of organic carbon sources on growth,
photosynthesis, and respiration of Phaeodactylum tricornutum. Journal of Applied
Phycology. 21, 239-246 (2009).
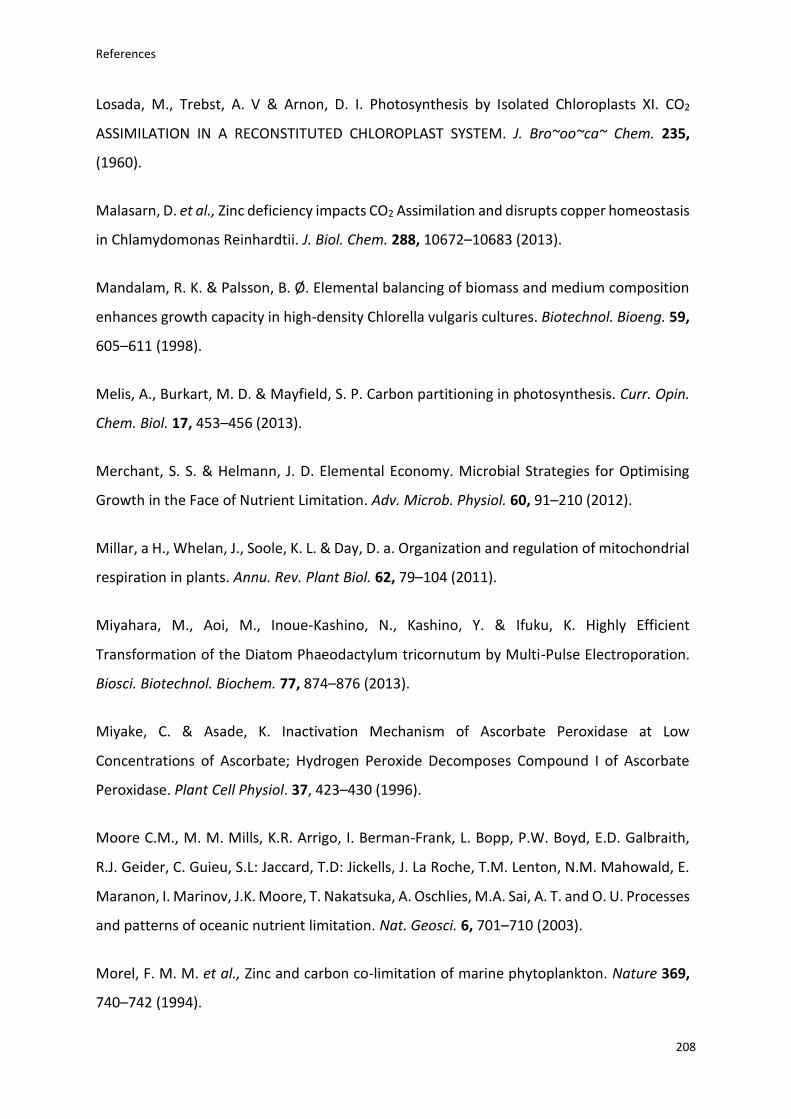
References
208
Losada, M., Trebst, A. V & Arnon, D. I. Photosynthesis by Isolated Chloroplasts XI. CO2
ASSIMILATION IN A RECONSTITUTED CHLOROPLAST SYSTEM. J. Bro~oo~ca~ Chem. 235,
(1960).
Malasarn, D. et al., Zinc deficiency impacts CO2 Assimilation and disrupts copper homeostasis
in Chlamydomonas Reinhardtii. J. Biol. Chem. 288, 10672–10683 (2013).
Mandalam, R. K. & Palsson, B. Ø. Elemental balancing of biomass and medium composition
enhances growth capacity in high-density Chlorella vulgaris cultures. Biotechnol. Bioeng. 59,
605–611 (1998).
Melis, A., Burkart, M. D. & Mayfield, S. P. Carbon partitioning in photosynthesis. Curr. Opin.
Chem. Biol. 17, 453–456 (2013).
Merchant, S. S. & Helmann, J. D. Elemental Economy. Microbial Strategies for Optimising
Growth in the Face of Nutrient Limitation. Adv. Microb. Physiol. 60, 91–210 (2012).
Millar, a H., Whelan, J., Soole, K. L. & Day, D. a. Organization and regulation of mitochondrial
respiration in plants. Annu. Rev. Plant Biol. 62, 79–104 (2011).
Miyahara, M., Aoi, M., Inoue-Kashino, N., Kashino, Y. & Ifuku, K. Highly Efficient
Transformation of the Diatom Phaeodactylum tricornutum by Multi-Pulse Electroporation.
Biosci. Biotechnol. Biochem. 77, 874–876 (2013).
Miyake, C. & Asade, K. Inactivation Mechanism of Ascorbate Peroxidase at Low
Concentrations of Ascorbate; Hydrogen Peroxide Decomposes Compound I of Ascorbate
Peroxidase. Plant Cell Physiol. 37, 423–430 (1996).
Moore C.M., M. M. Mills, K.R. Arrigo, I. Berman-Frank, L. Bopp, P.W. Boyd, E.D. Galbraith,
R.J. Geider, C. Guieu, S.L: Jaccard, T.D: Jickells, J. La Roche, T.M. Lenton, N.M. Mahowald, E.
Maranon, I. Marinov, J.K. Moore, T. Nakatsuka, A. Oschlies, M.A. Sai, A. T. and O. U. Processes
and patterns of oceanic nutrient limitation. Nat. Geosci. 6, 701–710 (2003).
Morel, F. M. M. et al., Zinc and carbon co-limitation of marine phytoplankton. Nature 369,
740–742 (1994).

References
209
Morel, F. M. M., Milligan, A. J. & Saito, M. A. in Treatise on Geochemistry: Second Edition 8,
123–150 (2013).
Mus, F. et al., Physiological and molecular analysis of carbon source supplementation and
pH stress-induced lipid accumulation in the marine diatom Phaeodactylum tricornutum.
Appl. Microbiol. Biotechnol. 97, 3625–42 (2013).
Niu, Y. F. et al., Improvement of neutral lipid and polyunsaturated fatty acid biosynthesis by
overexpressing a type 2 diacylglycerol acyltransferase in marine diatom Phaeodactylum
tricornutum. Mar. Drugs (2013). doi:10.3390/md11114558
Niyogi, K. K. PHOTOPROTECTION REVISITED: Genetic and Molecular Approaches. Annu. Rev.
Plant Physiol. Plant Mol. Biol. 50, 333–359 (1999).
Obata, T., Fernie, A. R. & Nunes-Nesi, A. The central carbon and energy metabolism of marine
diatoms. Metabolites 3, 325–46 (2013).
Ort, D. R. & Baker, N. R. A photoprotective role for O2 as an alternative electron sink in
photosynthesis? Current Opinion in Plant Biology 5, 193–198 (2002).
Osborn, H. L. & Hook, S. E. Using transcriptomic profiles in the diatom Phaeodactylum
tricornutum to identify and prioritize stressors. Aquat. Toxicol. 138-139, 12–25 (2013).
Pallotta, M. L., Fratianni, A. & Passarella, S. Metabolite transport in isolated yeast
mitochondria: Fumarate/malate and succinate/malate antiports. FEBS Lett. 462, 313–316
(1999).
Parker, MS, Armbrust, EV, Piovia-Scott, J, Keil, RG. Induction of photorespiration by light in
the centric diatom Thalassiosira Weissflogii (Bacillariophyceae): molecular characterization
and physiological consequence. J. Phycol. 40, 557–567 (2004).
Prihoda, J. et al. Chloroplast-mitochondria cross-talk in diatoms. Journal of Experimental
Botany 63, 1543–1557 (2012).
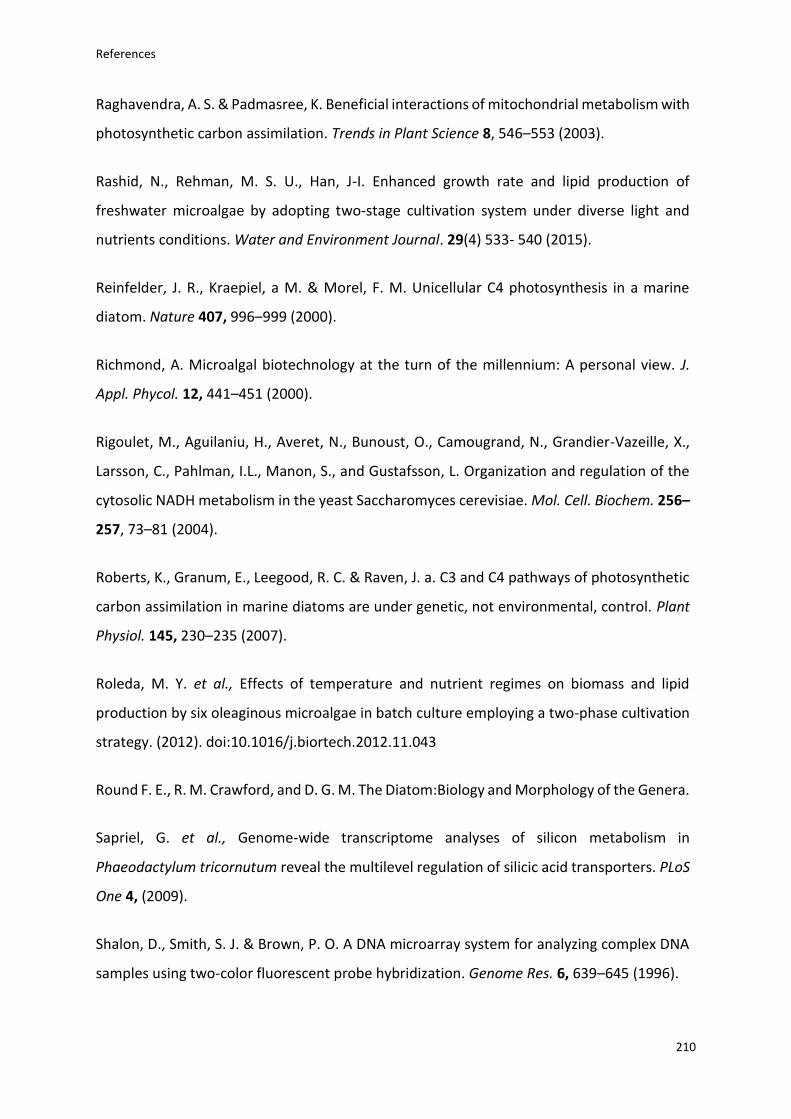
References
210
Raghavendra, A. S. & Padmasree, K. Beneficial interactions of mitochondrial metabolism with
photosynthetic carbon assimilation. Trends in Plant Science 8, 546–553 (2003).
Rashid, N., Rehman, M. S. U., Han, J-I. Enhanced growth rate and lipid production of
freshwater microalgae by adopting two-stage cultivation system under diverse light and
nutrients conditions. Water and Environment Journal. 29(4) 533- 540 (2015).
Reinfelder, J. R., Kraepiel, a M. & Morel, F. M. Unicellular C4 photosynthesis in a marine
diatom. Nature 407, 996–999 (2000).
Richmond, A. Microalgal biotechnology at the turn of the millennium: A personal view. J.
Appl. Phycol. 12, 441–451 (2000).
Rigoulet, M., Aguilaniu, H., Averet, N., Bunoust, O., Camougrand, N., Grandier-Vazeille, X.,
Larsson, C., Pahlman, I.L., Manon, S., and Gustafsson, L. Organization and regulation of the
cytosolic NADH metabolism in the yeast Saccharomyces cerevisiae. Mol. Cell. Biochem. 256–
257, 73–81 (2004).
Roberts, K., Granum, E., Leegood, R. C. & Raven, J. a. C3 and C4 pathways of photosynthetic
carbon assimilation in marine diatoms are under genetic, not environmental, control. Plant
Physiol. 145, 230–235 (2007).
Roleda, M. Y. et al., Effects of temperature and nutrient regimes on biomass and lipid
production by six oleaginous microalgae in batch culture employing a two-phase cultivation
strategy. (2012). doi:10.1016/j.biortech.2012.11.043
Round F. E., R. M. Crawford, and D. G. M. The Diatom:Biology and Morphology of the Genera.
Sapriel, G. et al., Genome-wide transcriptome analyses of silicon metabolism in
Phaeodactylum tricornutum reveal the multilevel regulation of silicic acid transporters. PLoS
One 4, (2009).
Shalon, D., Smith, S. J. & Brown, P. O. A DNA microarray system for analyzing complex DNA
samples using two-color fluorescent probe hybridization. Genome Res. 6, 639–645 (1996).
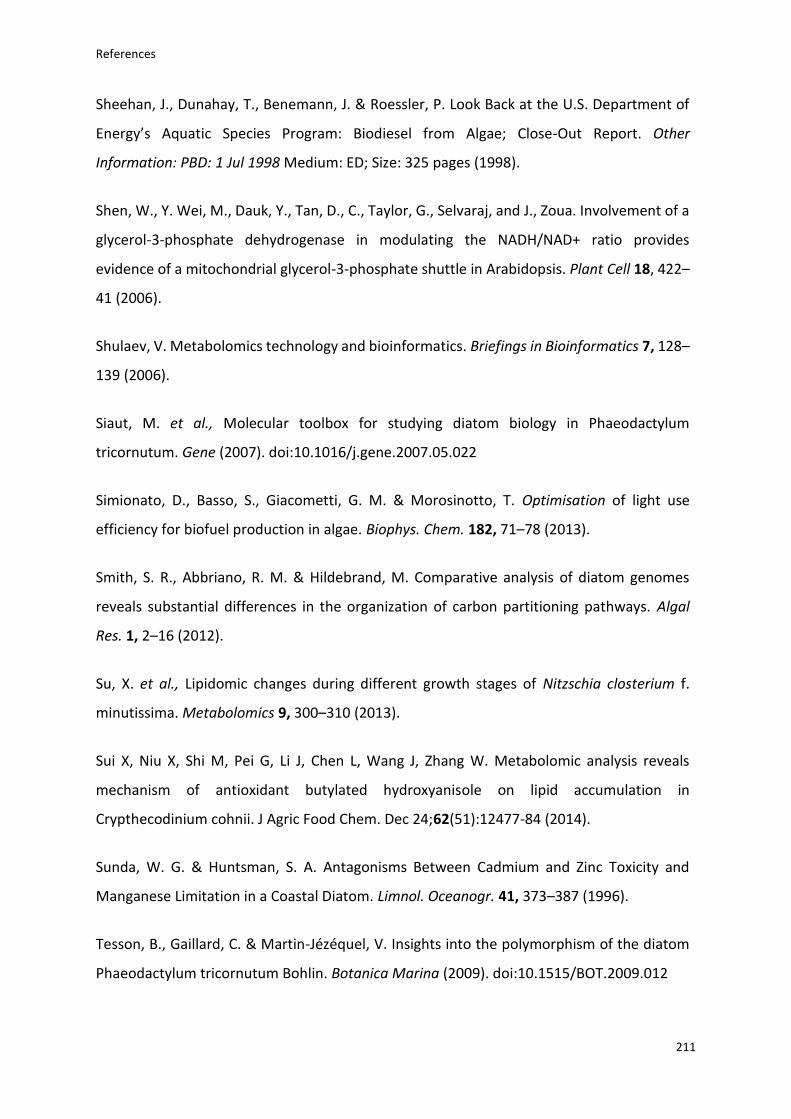
References
211
Sheehan, J., Dunahay, T., Benemann, J. & Roessler, P. Look Back at the U.S. Department of
Energy’s Aquatic Species Program: Biodiesel from Algae; Close-Out Report. Other
Information: PBD: 1 Jul 1998 Medium: ED; Size: 325 pages (1998).
Shen, W., Y. Wei, M., Dauk, Y., Tan, D., C., Taylor, G., Selvaraj, and J., Zoua. Involvement of a
glycerol-3-phosphate dehydrogenase in modulating the NADH/NAD+ ratio provides
evidence of a mitochondrial glycerol-3-phosphate shuttle in Arabidopsis. Plant Cell 18, 422–
41 (2006).
Shulaev, V. Metabolomics technology and bioinformatics. Briefings in Bioinformatics 7, 128–
139 (2006).
Siaut, M. et al., Molecular toolbox for studying diatom biology in Phaeodactylum
tricornutum. Gene (2007). doi:10.1016/j.gene.2007.05.022
Simionato, D., Basso, S., Giacometti, G. M. & Morosinotto, T. Optimisation of light use
efficiency for biofuel production in algae. Biophys. Chem. 182, 71–78 (2013).
Smith, S. R., Abbriano, R. M. & Hildebrand, M. Comparative analysis of diatom genomes
reveals substantial differences in the organization of carbon partitioning pathways. Algal
Res. 1, 2–16 (2012).
Su, X. et al., Lipidomic changes during different growth stages of Nitzschia closterium f.
minutissima. Metabolomics 9, 300–310 (2013).
Sui X, Niu X, Shi M, Pei G, Li J, Chen L, Wang J, Zhang W. Metabolomic analysis reveals
mechanism of antioxidant butylated hydroxyanisole on lipid accumulation in
Crypthecodinium cohnii. J Agric Food Chem. Dec 24;62(51):12477-84 (2014).
Sunda, W. G. & Huntsman, S. A. Antagonisms Between Cadmium and Zinc Toxicity and
Manganese Limitation in a Coastal Diatom. Limnol. Oceanogr. 41, 373–387 (1996).
Tesson, B., Gaillard, C. & Martin-Jézéquel, V. Insights into the polymorphism of the diatom
Phaeodactylum tricornutum Bohlin. Botanica Marina (2009). doi:10.1515/BOT.2009.012
References
212
Valenzuela, J. et al., Potential role of multiple carbon fixation pathways during lipid
accumulation in Phaeodactylum tricornutum. Biotechnology for Biofuels (2012).
doi:10.1186/1754-6834-5-40
Wang H. A study on lipid production of the mixotrophic microalgae Phaeodactylum
tricornutum on various carbon sources. African Journal of Microbiology Research 6, 1041-
1047 (2012).
Wang, Z., Gerstein, M. & Snyder, M. RNA-Seq: a revolutionary tool for transcriptomics. Nat.
Rev. Genet. 10, 57–63 (2009).
Weber APM, Linka N. Connecting the plastid: transporters of the plastid envelope and their
role in linking plastidial with cytosolic metabolism. Annual Review of Plant Biology 62, 53–77
(2011).
Wijffels, R. H. & Barbosa, M. J. An outlook on microalgal biofuels. Science 329, 796–799
(2010).
Wilhelm, C., Buchel, C, Fisahn, J, Goss, R, Jakob, T, LaRoche, J, Lavaud, J, Lohr, M, Riebesell,
U, Stehfest, K, Valentin, K, Kroth, PG. The Regulation of Carbon and Nutrient Assimilation in
Diatoms is Significantly Different from Green Algae. Protist 157, 91–124 (2006).
Wilson, D.P. The triradiate and other forms of Nitzschia closterium (Ehrenberg) Wm. Smith
form a minutissima of Allen and Nelson. J. Mar. Biol. Assoc. UK 26, 235–270 (1946).
Wu, S. et al., Enzyme activity highlights the importance of the oxidative pentose phosphate
pathway in lipid accumulation and growth of Phaeodactylum tricornutum under CO2
concentration. Biotechnol. Biofuels 8, 78 (2015).
Yang, D. et al., Lipidomic analysis of Chlamydomonas reinhardtii under nitrogen and sulfur
deprivation. PLoS One 10, (2015).
Yang, Z. K. et al., Proteomics to reveal metabolic network shifts towards lipid accumulation
following nitrogen deprivation in the diatom Phaeodactylum tricornutum. J. Appl. Phycol.
(2014). doi:10.1007/s10811-013-0050-3
References
213
Yang, Z. K. et al., Systems-level analysis of the metabolic responses of the diatom
Phaeodactylum tricornutum to phosphorus stress. Environ. Microbiol. 16, 1793–1807 (2014).
Yao, Y. et al. Glycerol and neutral lipid production in the oleaginous marine diatom
Phaeodactylum tricornutum promoted by overexpression of glycerol-3-phosphate
dehydrogenase. Biotechnol. Biofuels 7, 110 (2014).
Yen C-LE, Stone SJ, Koliwad S, Harris C & Farese RV. Thematic review series: glycerolipids.
DGAT enzymes and triacylglycerol biosynthesis. Journal of lipid research 49: 2283-301
(2008).
Yongmanitchai, W. & Ward, O. P. Growth of and omega-3 fatty acid production by
Phaeodactylum tricornutum under different culture conditions. Appl. Environ. Microbiol. 57,
419–425 (1991).
Yoon, K., Han, D., Li, Y., Sommerfeld, M. & Hu, Q. Phospholipid:Diacylglycerol Acyltransferase
Is a Multifunctional Enzyme Involved in Membrane Lipid Turnover and Degradation While
Synthesizing Triacylglycerol in the Unicellular Green Microalga Chlamydomonas reinhardtii.
Plant Cell 24, 3708–3724 (2012).
Yoshida, K., Watanabe, C. K., Terashima, I. & Noguchi, K. Physiological impact of
mitochondrial alternative oxidase on photosynthesis and growth in Arabidopsis thaliana.
Plant, Cell Environ. 34, 1890–1899 (2011).
Yu, E. T. et al., Triacylglycerol accumulation and profiling in the model diatoms Thalassiosira
pseudonana and Phaeodactylum tricornutum (Baccilariophyceae) during starvation. J. Appl.
Phycol. (2009). doi:10.1007/s10811-008-9400-y
Yusuf, C. Biodiesel from microalgae. Biotechnol. Adv. 25, 294–306 (2007).
Zaslavskaia L.A., Lippmeier J.C., Kroth P.G., Grossman A.R., Apt K.E. Transformation of the
diatom Phaeodactylum tricornutum (Bacillariophyceae) with a variety of selectable marker
and reporter genes. J. Phycol. 36, 379–986 (2000).
References
214
Zaslavskaia, L. A. et al., Trophic Conversion of an Obligate Photoautotrophic Organism
Through Metabolic Engineering. Science. 292, 2073–2075 (2001).
Zehr, J. P. & Kudela, R. M. Photosynthesis in the Open Ocean. Science, 326, 945–946 (2009).
Zhanga, C. & Hu, H. High-efficiency nuclear transformation of the diatom Phaeodactylum
tricornutum by electroporation. Marine Genomics 16, 63–66 (2014).
Zheng, Y., Quinn, A. H. & Sriram, G. Experimental evidence and isotopomer analysis of
mixotrophic glucose metabolism in the marine diatom Phaeodactylum tricornutum.
Microbial cell factories 12, (2013).