identification of leadership style of
140
IDENTIFICATION OF LEADERSHIP STYLE OF ENROLLMENT MANAGEMENT PROFESSIONALS IN POST SECONDARY INSTITUTIONS IN THE SOUTHERN UNITED STATES by TANYA GWEN HUGHES, B.B.A., M.Ed. A DISSERTATION IN HIGHER EDUCATION Submitted to the Graduate Faculty of Texas Tech University in Partial Fulfillment of the Requirements for the Degree of DOCTOR OF EDUCATION Approved Bonita Butner Chairperson of the Committee Valerie Paton Krista Cohlmia Accepted John Borrelli Dean of the Graduate School AUGUST, 2005
-
Upload
khangminh22 -
Category
Documents
-
view
4 -
download
0
Transcript of identification of leadership style of

IDENTIFICATION OF LEADERSHIP STYLE OF
ENROLLMENT MANAGEMENT PROFESSIONALS
IN POST SECONDARY INSTITUTIONS IN
THE SOUTHERN UNITED STATES
by
TANYA GWEN HUGHES, B.B.A., M.Ed.
A DISSERTATION
IN
HIGHER EDUCATION
Submitted to the Graduate Faculty of Texas Tech University in
Partial Fulfillment of the Requirements for
the Degree of
DOCTOR OF EDUCATION
Approved
Bonita Butner Chairperson of the Committee
Valerie Paton
Krista Cohlmia
Accepted
John Borrelli
Dean of the Graduate School
AUGUST, 2005

Copyright 2005, Tanya Hughes

ii
For my husband, Steve Our children, Heather and Ty
And, the memory of my parents.

iii
ACKNOWLEDGEMENTS
I offer my sincere gratitude to Drs. Bonita Butner (Chairperson), Valerie Paton,
Jo Temple, and Krista Cohlmia. Their guidance and expertise enabled me to complete
this study. Dr. Butner’s unwavering support and encouragement created in me a belief
that I could conquer this project. She is a consummate professional whose dedication to
students is evident. Dr. Butner is truly an asset to the discipline of Higher Education.
Dr. Temple’s faith and insistence that I could indeed perform statistical calculations gave
me the courage to persevere. Dr. Paton’s energy and insight to the enrollment
management concept made this study stronger. She challenged me to think beyond the
obvious and explore alternate explanations as I analyzed results of this study.
Dr. Cohlmia kept me focused on statistical procedures that were pertinent to the study.
She was calm, cheerful, and always confident that I would successfully complete this
venture.
I also wish to acknowledge my employer, Odessa College. Dr. Vance Gipson,
President, supported my educational endeavors by sharing wisdom that comes from years
of educational leadership experience. To my friends and co-workers, Penny Boss, Becky
Miller, Kristi Munoz, Gail Nash, Leslie Neiman, and Dee Nesmith, thank you for your
unfailing support and confidence in me. Just as important as your encouragement, I knew
that I could always count on you guys to keep things going during my absences. I must
also acknowledge many others who had a direct impact on this study. They are: Clayton

iv
Alred, Sue Blair, Virginia Chisum, Ralph Ford, Mike Haynie, Martha Kunkel, Sherrie
Lang, Robert Munoz, Pat Quintero, Mary Roach, and Kim Rodriquez.
For me, the pursuit of higher education was not just an individual commitment,
but also a family commitment. Therefore, I must thank my family for embarking on this
journey with me. To my husband, Steve, thank you for the emotional and financial
support that allowed me to complete this process. To my children, Heather and Ty, I am
so glad that God placed each of you in my life. To Stephenie, Brandon, Garrett, and
Bailea, thank you for making me smile. To my sister and best friend, Carla, thank you
for always listening and believing in me. To my brother, Eddie, you live in my heart. To
my parents, who now watch from Heaven, I am grateful to them for instilling in me a
love of learning. To my granddaddy and extended family, thank you for your support
and encouragement. Last, but not least, I would be remiss if I did not give credit to my
personal Lord and Savior, Jesus Christ.

v
TABLE OF CONTENTS
ABSTRACT....................................................................................................................... ix
LIST OF TABLES............................................................................................................. xi
LIST OF FIGURES .......................................................................................................... xii
CHAPTER
I. INTRODUCTION .......................................................................................1
Enrollment Management..............................................................................2 Enrollment Management Structures and Models.........................................4 Leadership....................................................................................................7 Statement of the Problem.............................................................................9 Purpose of the Study ..................................................................................10 Significance of the Study ...........................................................................10 Research Questions....................................................................................11 Research Hypothesis..................................................................................12 Delimitations of the Study .........................................................................13 Assumptions and Limitations of the Study................................................13 Definition of Terms....................................................................................14 Conclusion .................................................................................................15 Organization of Remaining Chapters.........................................................15

vi
II. REVIEW OF RELATED LITERATURE.................................................16
Enrollment Management............................................................................16 Enrollment Management Defined..............................................................17 Responsibilities of Enrollment Management.............................................18 Leadership..................................................................................................22 Definitions of Leadership ..........................................................................23 Trait Theory ...................................................................................25 Behavioral Theory .........................................................................26 Iowa State University Studies........................................................27 Ohio State Leadership Studies .......................................................27 University of Michigan Studies .....................................................29 Managerial Grid .............................................................................30 Contingency Theories ....................................................................32 Fiedler’s Contingency Model ........................................................33 House and Mitchell Path-Goal Theory ..........................................35 Hersey and Blanchard Situational Leadership Model ...................37 Vroom and Yetton..........................................................................38 Transactional Leadership ...............................................................39 Transformational Leadership .........................................................41 Full-Range Leadership Theory ......................................................43 Leadership Models.........................................................................46 Conclusion .................................................................................................48 III. METHODOLOGY ....................................................................................49
Participants.................................................................................................49 Instrumentation ..........................................................................................50 Validity ......................................................................................................53 Reliability...................................................................................................54 Research Hypotheses .................................................................................54 Procedures for Data Collection..................................................................55

vii
Confidentiality ...........................................................................................55 Data Analysis .............................................................................................56 IV. ANALYSIS OF THE DATA.....................................................................58 Introduction................................................................................................58 Review of the Research Hypotheses..........................................................58 Population and Sample ..............................................................................59 Classification of the Participants ...............................................................59 Summary Statistics.....................................................................................60 Gender............................................................................................61 Two-Year/Four-Year Institutions ..................................................62 Public/Private Institutions..............................................................64 Educational Level ..........................................................................65 Supervisory Experience .................................................................66 Institutional Enrollment .................................................................67 Statistical Findings.....................................................................................68 Hypothesis 1...................................................................................68 Hypothesis 2...................................................................................69 Hypothesis 3...................................................................................71 Hypothesis 4...................................................................................73 Hypothesis 5...................................................................................74 Hypothesis 6...................................................................................77 Hypothesis 7...................................................................................80 Conclusion .................................................................................................81 V. CONCLUSIONS AND RECOMMENDATIONS ....................................83 Summary of the Study ...............................................................................83 Discussion..................................................................................................86 Research Question 1 ......................................................................86 Research Question 2 ......................................................................90 Research Question 3 ......................................................................92 Research Question 4 ......................................................................94 Research Question 5 ......................................................................96

viii
Research Question 6 ......................................................................97 Research Question 7 ....................................................................102 Recommendations for Future Research ...................................................103 Conclusions..............................................................................................106 REFERENCES ................................................................................................................110
APPENDICES
A. PERMISSION TO COPY-THOMPSON PUBLISHING SERVICES....121
B. PERMISSION TO COPY-MIND GARDEN ..........................................123
C. SURVEY LETTER..................................................................................124
D. SURVEY QUESTIONS ..........................................................................125
E. SURVEY FOLLOW-UP LETTER..........................................................127

ix
ABSTRACT
This study evaluated leadership style of enrollment managers employed at post
secondary institutions in the southern United States. Enrollment management seeks to
influence enrollment by analyzing and monitoring the size and characteristics of the
student body. Enrollment managers coordinate numerous functions associated with
recruiting, retaining, funding, and tracking students. Individuals who supervised both the
undergraduate admissions office and student financial aid office were included in the
study. The sample size was 397, of which 203 (51%) responded by submitting a
completed survey. Of the 203 responses, 118 (58%) met the selection criteria and were
used in the data analyses. Participants completed the Multifactor Leadership
Questionnaire (MLQ) Form 5X – Short (Revised), developed by Bruce J. Avolio and
Bernard M. Bass, and were categorized as having either transactional leadership style or
transformational leadership style. Transactional leadership is based on exchange and
uses reward or punishment to manipulate followers into performing tasks.
Transformational leadership seeks to influence the values, attitudes, beliefs, and
behaviors of followers by working with and through them to accomplish the college’s
mission and purpose. Additionally, leadership style was compared with the participant’s
gender, type of employing institution, level of education, years of leadership experience,
and student enrollment at the employing institution. Results gleaned from this study
suggest there is not a statistically significant association between leadership style and the
participant’s gender (p = 0.276), their type of institution (either two-year or four-year, p =

x
0.412; public or private, p = 0.685), and their levels of education (p = 0.635).
Additionally, an independent samples t-test demonstrated that leadership style and fall
2004 student enrollment at the employing institution were not correlated (p = 0.335).
There was, however, statistical support of a dependent relationship between an
enrollment manager’s years of supervisory experience and their leadership style (p =
0.032). This finding supports the theory that leadership behaviors and characteristics can
be learned. It provides a basis upon which administrators may justify the allocation of
resources for leadership development.

xi
LIST OF TABLES
1.1 Percent of Population for Ages 5 to 19........................................................2
1.2 Live Births per 1,000 ...................................................................................2
2.1 Ohio State Leadership Study Quadrants ....................................................28
2.2 Situational Leadership in Eight Octants ....................................................35
2.3 Taxonomy of Decision Processes in the Vroom-Yetton model.................38
4.1 Gender by Leadership Style.......................................................................62
4.2 Highest Academic Credential Offered.......................................................63
4.3 Two-Year or Four-Year Institution by Leadership Style...........................64
4.4 Public or Private Institution by Leadership Style ......................................64
4.5 Educational Level by Leadership Style .....................................................66
4.6 Years of Supervisory Experience by Leadership Style..............................67
4.7 Years of Supervisory Experience by Leadership Style..............................68
4.8 H02 Cell Counts (Expected Cell Counts)...................................................71
4.9 H03 Cell Counts (Expected Cell Counts)...................................................73
4.10 H04 Cell Counts (Expected Cell Counts)...................................................74
4.11 H05 Cell Counts (Expected Cell Counts)...................................................77
4.12 H06 Cell Counts (Expected Cell Counts) – Using a Combined Category of More than 1 But Less than 12 ................................................79 4.13 H06 Cell Counts (Expected Cell Counts) – Omitting Years of Experience Less than Eight........................................................................80
xii
LIST OF FIGURES
2.1 Managerial Leadership...............................................................................30
2.2 The Managerial Grid..................................................................................31
2.3 Contingency Leadership Model.................................................................33
4.1 Leadership Style by Gender.......................................................................70
4.2 Leadership Style by Two or Four-Year Institution....................................72
4.3 Leadership Style by Public or Private Institution ......................................74
4.4 Leadership Style by Educational Level .....................................................76
4.5 Leadership Style by Years of Experience..................................................78
4.6 Headcount by Leadership Style .................................................................81

1
CHAPTER I
INTRODUCTION
Educators have sought to manage enrollment since the establishment of
postsecondary institutions (Black, 2001). The quest to enroll an appropriate student
population is not new to higher education and has for decades caused institutions to
evaluate admission standards and academic programs. Black (2001) explains that
institutions, beginning with colonial colleges, “have wrestled with the twin prongs of the
admission dilemma: the quantity and quality of students” (p. 4). Many colleges and
universities today continue to struggle with maintaining quality, while striving to achieve
the desired quantity of students.
Summerskill (1962) recognized student attrition as a problem for higher education
and advised postsecondary institutions to evaluate admission policies, quality of
instruction, and reasons for student departure prior to graduation. However, it was not
until the early 1970s, when projections of pending enrollment declines began to be made,
that institutions attempted to influence student persistence. Shulman (1976) and Florio
(1976) reported a reduction in population between the ages of 18 and 22 that would have
dire consequences for postsecondary institutions if enrollment patterns remained
unchanged. Between 1990 and 2000, the total population has increased 13.2%, but
college enrollment increased only 10.8% (U.S. Census Bureau).
2
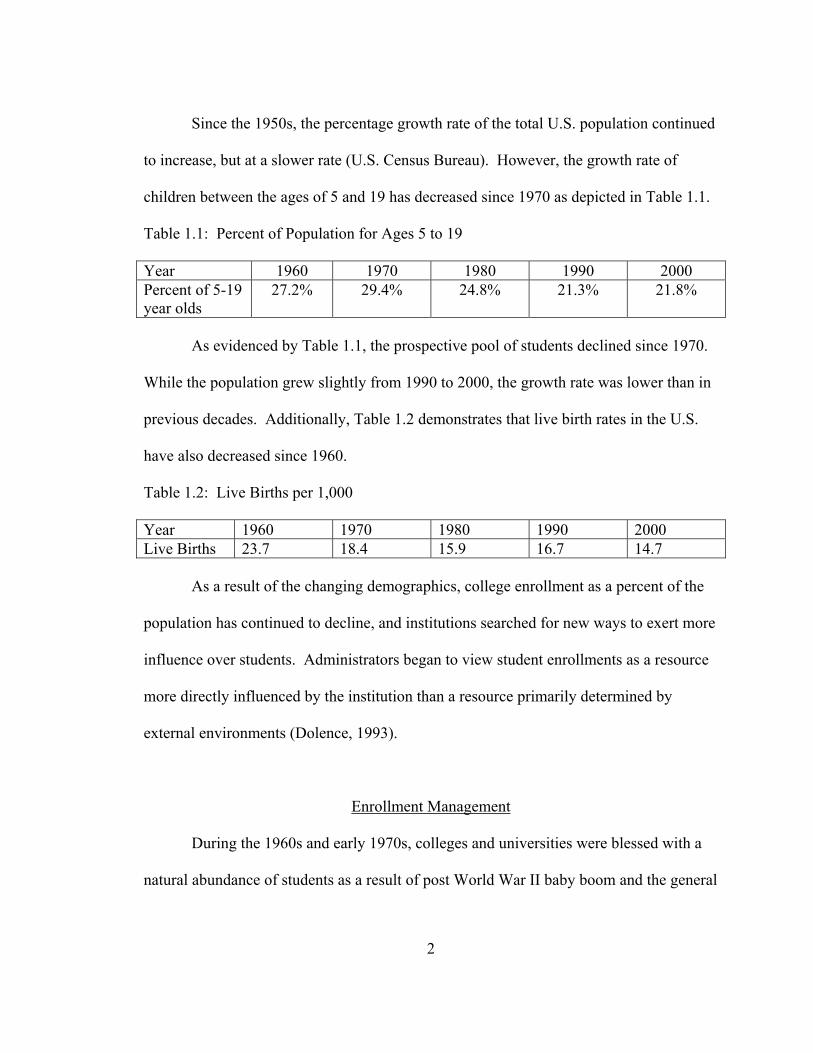
Since the 1950s, the percentage growth rate of the total U.S. population continued
to increase, but at a slower rate (U.S. Census Bureau). However, the growth rate of
children between the ages of 5 and 19 has decreased since 1970 as depicted in Table 1.1.
Table 1.1: Percent of Population for Ages 5 to 19
Year 1960 1970 1980 1990 2000 Percent of 5-19 year olds
27.2% 29.4% 24.8% 21.3% 21.8%
As evidenced by Table 1.1, the prospective pool of students declined since 1970.
While the population grew slightly from 1990 to 2000, the growth rate was lower than in
previous decades. Additionally, Table 1.2 demonstrates that live birth rates in the U.S.
have also decreased since 1960.
Table 1.2: Live Births per 1,000
Year 1960 1970 1980 1990 2000 Live Births 23.7 18.4 15.9 16.7 14.7
As a result of the changing demographics, college enrollment as a percent of the
population has continued to decline, and institutions searched for new ways to exert more
influence over students. Administrators began to view student enrollments as a resource
more directly influenced by the institution than a resource primarily determined by
external environments (Dolence, 1993).
Enrollment Management
During the 1960s and early 1970s, colleges and universities were blessed with a
natural abundance of students as a result of post World War II baby boom and the general

3
admiration of higher education by the public (Hossler, 1986). Colleges and universities
often enjoyed the role of gatekeepers as students competed for admission to selected
schools (Jonas & Popovics, 2000). Many educators characterize this period as one of
significant enrollments with no aggressive efforts necessary in recruitment (Croomes,
2000).
In the early 1970s, enrollment management emerged as an important concept as
college officials began to address the decline in the number of high school graduates who
planned to attend college (Penn, 1999). In the current college climate, enrollment
management is the process of defining enrollment goals and establishing procedures to
reach these goals, thereby providing an institution with the mechanisms to control its
size, shape and character (Mabry, 1987). The essential components of enrollment
management are: (a) knowing why students choose to attend a particular institution;
(b) understanding why students enroll, withdraw, and persist; (c) knowing how students
finance educational expenses; (d) strategically preparing for future enrollment and
financial requirements of an institution; and (e) linking enrollment management with
retention (Dennis, 1998). Enrollment management requires talented and energetic leaders
who must be able to bring out the best in their staffs, to focus on strengths, and “to rise
above campus politics and to never forget to smile” (Dennis, 1998, p. 18).
Enrollment Management Structures and Models
Enrollment management models are generally designed to help an institution
achieve its mission and stated goals. However, Black (2001) states that most
4
organizations are not designed to provide leadership that promotes an optimal enrollment
management atmosphere. Prior to adopting an enrollment management model,
institutions must be cognizant of strategic goals, organizational designs, and desired
outcomes. Adoption of a model should be given careful consideration to ensure that it
provides strategies that strengthen the enrollment management function.
Henderson (2001) explains that the following enrollment structures will facilitate
development of an enrollment management model:
1. Enrollment management committee is noted for its convenience because it is
comprised of representatives from relevant departments; the establishment of a
committee does not require additional funding or the hiring of additional
personnel. While this model does promote discussion, it usually does not have
the authority to affect change. The enrollment management committee serves as a
signal that the institution is beginning to evaluate enrollment in a systematic
manner. The committee’s broad constituency provides a mechanism of
communication to multiple areas of campus. In turn, this informal
communication effort may serve to build support for the enrollment management
plan.
2. Enrollment management coordinator may be more adept in understanding student
theory and enrollment management concepts, but success in implementing
strategies will depend upon support from administration. An enrollment
management coordinator may be a drawn from the enrollment management
committee or a mid-management level employee of the institution. However, the

5
coordinator lacks authority to formally influence institutional policy because
enrollment management is viewed as a concern for a mid-level office and not
senior leadership.
3. Enrollment management matrix appoints administrators from areas that directly
support the enrollment management function; an enrollment manager coordinates
these activities. The matrix is responsible for making enrollment management a
responsibility of administration. However, it usually requires an existing vice
president to assume additional enrollment management duties. While this does
shift emphasis to senior administration, enrollment management must still
compete with other offices for resources.
4. Enrollment management division supervises offices that contribute to the
enrollment function. A shared goal of advancing and maintaining enrollment is
central to all participants. While a division provides the most comprehensive and
concerted effort, it may also create the most problems. The establishment of a
division requires restructuring the organization. Other administrators may view
reorganization as threatening to their jurisdiction and create barriers that impede
the implementation of an enrollment management plan. This resistance may
lower morale and support for the new enrollment management initiative.
Whichever reporting structure is selected, enrollment management must respond
quickly to students and other departments within the organization. Huddleston (2001)
suggests an ideal enrollment management structure should support a model that impacts
students’ decisions to enroll, persist, and graduate (Huddleston, 2001). While the scope

6
of enrollment management structures and subsequent models vary, they should support
the values and needs of the institution.
The following enrollment management models may be established based on the
above-mentioned structures:
1. Vice president of enrollment management. This model approaches enrollment
management as a campus-wide initiative and encompasses a broad range of
activities. This level of commitment ensures institutional marketing, development
of academic programs, research, and all components of enrollment management
are at the forefront of activities. The focus includes market position and
prominence, as opposed to merely supporting enrollment.
2. Dean of enrollment management. This model approaches enrollment
management by providing quality service to students. The dean of enrollment
management coordinates areas such as admission, academic advising, financial
aid, and student activities to provide superior service to prospects and students.
3. Director of enrollment management. The director of enrollment management has
a limited scope of authority. While this individual may coordinate numerous
enrollment management functions, the reporting structure communicates the
institution’s level of commitment to enrollment management. This model serves
to impact daily operations and not market position.
4. Enrollment management committee. This model uses a committee structure to
formulate an institution’s enrollment management plan. It is a loosely coupled
model that does not place great emphasis, at least in structure, on enrollment

7
management. This model does not encourage a concerted enrollment
management effort, but instead allows each function to operate independently.
Leadership
If institutions hope to influence enrollment, thereby shaping the academic culture
and population of their campuses they must have dynamic leaders who can successfully
implement change and coordinate the diverse functions that make up enrollment
management. Effective leaders are vitally important to higher education as they define an
institution and its practices (Fairholm, 1998). Good leaders must be enthusiastic about
their work and the potential of the institutions that employ them (Dessler, 1995).
Furthermore, good leaders are confident in their judgment, and they hold themselves and
their followers to high expectations (Hoover, 1991).
Early leadership studies focused on trait and behavior theories. This body of
literature suggests that great leaders possess a trait or characteristic that creates an innate
ability to lead (Chemers, 1997). However, Stogdill (1948) conducted a survey of the
literature that focused on identifying reliable differences in personal characteristics
between leaders and followers in a variety of organizational settings. While he found that
many personality traits are related to leadership, the link is not strong enough to provide
an explanation of leadership emergence. Stogdill’s evaluation of the literature and
subsequent conclusions encouraged researchers to pursue alternate explanations of
leadership. New models began to materialize as researchers sought to identify

8
characteristics of effective leaders. Two prominent theories were transactional and
transformational leadership.
Transactional leadership, which is based on exchange, uses reward or punishment
as incentives to manipulate followers into performing tasks (Avolio & Bass, 2002) and
served as the basis for the development of transformational leadership (Avolio, 1999;
Avolio, Waldman, &Yammarino, 1991). Transformational leadership has been ascribed
with effecting change by influencing values, attitudes, and behaviors of others (Avolio &
Bass, 2002). Furthermore, transformational leaders have been credited with converting
followers into leaders and are able to generate commitment, satisfaction, and excitement.
The rapidly changing environment of postsecondary education calls for leaders
who are more adaptive and flexible (Bass, Avolio, Jung, & Berson, 2003). Adaptive
leaders, also known as transformational leaders (Bass, 1985), work with followers to
enhance performance and generate creative solutions to complex problems (Bass, 1985;
Bass, et al., 2003; Burns, 1978; Dvir, Eden, Avolio, & Shamir, 2002). Transformational
leadership, although an extension of transactional leadership, provides an alternative to
contingent reward, and is credited with enhancing performance and exceeding
expectations (Bass, 1985; Burns, 1978; Day, Zaccaro, & Halpin, 2004; Dvir et al. 2002).
Transformational leadership theory was selected for evaluation in this study
because it reportedly produces exceptional performance from subordinates. Because
transformational leadership evolved from transactional leadership, evaluation of the two
methods provided pertinent information regarding appropriate leadership models for
enrollment managers. Burns (1978) conducted a comprehensive study of leadership and

9
categorized individuals as either transactional or transformation. This study, while not a
replication of Burns’ work, also evaluated participants and categorized their leadership
style as either transactional or transformational.
Statement of the Problem
Dwindling resources, declining enrollments, underprepared students, demands for
accountability, competition from other institutions and increased government regulation
are just a few of the issues facing enrollment managers (Anderson, 1997). Due to
numerous challenges and sometimes seemingly insurmountable obstacles, enrollment
managers must be effective leaders who are capable of creating environments that are
proactive and beneficial for students, faculty, staff, and the community. Dessler (1995)
maintains, “Good leadership is more important than it has ever been before, because it is
the leader who must initiate change, and provide a unifying vision” (p. 365).
While research on enrollment management is still emergent, leadership has been
the focus of extensive research in the private sector. More recently, in higher education,
leadership has come under scrutiny as well. However, a clear understanding about the
nature of educational leadership has not emerged (Cohen & Brawer, 1996; Roueche,
Baker, & Rose, 1989). Sergiovanni (1992) suggests that researchers have failed to
develop a comprehensive definition because leadership continues to be evaluated on
behavioral or trait theories and contingent reward styles.

10
Purpose of the Study
The purpose of this study was to examine the leadership styles of currently
employed enrollment management professionals within the Southern Association of
Collegiate Registrars and Admissions Officers (SACRAO) region, which is part of the
American Association of Collegiate Registrars and Admissions Officers (AACRAO).
The following states are included in SACRAO and are subject to inclusion of this study:
Alabama, Arkansas, Florida, Georgia, Kentucky, Louisiana, Mississippi, North Carolina,
Oklahoma, South Carolina, Tennessee, Texas and Virginia. Additionally, leadership
style was evaluated in conjunction with personal and employment characteristics (i.e.,
age, gender, level of education, type of institution).
The Multifactor Leadership Questionnaire (MLQ) by Avolio and Bass, which
categorizes leaders into either transformational or transactional leadership styles, was
used to determine leadership style of current enrollment managers.
Significance of the Study
“Declining enrollments are second only to declining appropriations as the reason
for colleges’ and universities’ financial problems” (Penn, 1999, p. 2). In 1994,
62 percent of college administrators responding to a survey conducted by the American
Council of Education cited sustaining a suitable enrollment as one of the most important
challenges facing their schools (Dennis, 1998). Private industry has long recognized the
importance of leadership, however, Bryman (1986) notes that only recently has higher
education begun to focus on leadership and its impact on an institution. In this effort,

11
existing leadership theory has been applied and adapted to higher education. Dean
(1986) reminds us that higher education administrators have altered leadership theories to
fit the characteristics of postsecondary institutions.
More recent research studies have been conducted regarding leadership within
higher education; however, most work has focused on university and college presidents
or vice presidents. There are comparatively few studies that have examined leadership
style of college personnel at the department chair or dean level. However, no studies
were located that focused on leadership styles of enrollment managers. Results of this
study led to a better understanding of leadership styles for enrollment management
professionals who are currently employed within higher education.
Research Questions
The premise of this study is to determine transactional or transformational
leadership styles of enrollment management professionals. The following questions will
be used to facilitate the study.
1. What are the leadership styles of enrollment managers?
2. Is there a relationship between leadership style and gender in enrollment
managers?
3. Is there a relationship between leadership style and two-year/four-year institution
status in enrollment managers?
4. Is there a relationship between leadership style and private/public institution
status in enrollment managers?

12
5. Is there a relationship between leadership style and leadership experience level in
enrollment managers?
6. Is there a difference in leadership style between enrollment managers with
differing years of leadership experience?
7. Is there a difference in the actual enrollment (student headcount) of the institution
and the institution’s enrollment management leadership style?
Research Hypothesis
H01: There is no statistically significant evidence to conclude that there are more
transactional leaders than transformation leaders acting as enrollment managers.
H02: There is no statistically significant dependence between leadership style of
male and female enrollment managers.
H03: There is no statistically significant dependence between leadership styles of
enrollment mangers at two- and four-year institutions.
H04: There is no statistically significant dependence between leadership style of
enrollment mangers at private and public institutions.
H05: There is no statistically significant dependence between leadership styles of
enrollment managers who have differing levels of education.
H06: There is no statistically significant dependence between leadership styles of
enrollment managers who have differing years of leadership experience.
H07: There is no mean difference in the actual enrollment of the institution and the
institution’s enrollment management leadership style.

13
Delimitations of the Study
Inherent to the study are certain delimitations that must be noted.
1. The study is limited to individuals who hold job titles that contain the word(s)
enrollment, enrollment management, or enrollment service and supervise the
undergraduate admission and financial aid offices.
2. The study is limited to enrollment management professionals in the SACRAO
region.
3. The study is limited to the evaluation of transformational and transactional
leadership styles.
4. The study is limited to self-reported data by participants.
Assumptions and Limitations of the Study
1. Participation in this study was voluntary and inference cannot be drawn to all
enrollment managers.
2. The Multifactor Leadership Questionnaire was a valid and reliable survey
instrument that correctly identifies transactional and transformational leadership
styles.
3. Enrollment management professionals honestly evaluated their leadership style.
4. Enrollment management professionals exhibit either transactional or
transformational leadership behavior.

14
Definition of Terms
This study used the following terms in the literature review, interpretation of the
data, and in concluding remarks. The terms were defined in relation to the nature of this
study.
Enrollment Management – “An organizational concept and a systematic set of
activities designed to enable educational institutions to exert more influence over their
student enrollments. Organized by strategic planning and supported by institutional
research, enrollment management activities concern student college choice, transition to
college, student attrition and retention, and student outcomes” (Hossler and Bean as cited
in Henderson, 2001, p. 15).
Enrollment Manager – An individual who effectively and efficiently integrates
often disparate functions in an effort to influence enrollment (Black, 2001; Dennis,
1998).
Leadership – “The process of influencing the activities of an organized group in
its efforts toward goal setting and goal achievement” (Stogdill, 1974, p. 57).
Multifactor Leadership Questionnaire (MLQ) – a survey instrument to measure
leadership style.
Transactional Leadership – Leadership that is based on exchange. Reward or
punishment is used as incentive to manipulate followers into performing (Avolio & Bass,
2002).
15
Transformational Leadership – “The ability to influence values, attitudes, beliefs,
and behaviors of others by working with and through them to accomplish the college’s
mission and purpose” (Roueche, Baker, & Rose, 1989, p. 11).
Conclusion
The underlying premise of this study involved the evaluation of leadership styles
of enrollment managers. This chapter provides an introduction to enrollment
management, explains its importance in maintaining an appropriate student enrollment,
and argues the necessity of employing enrollment managers who are also talented
leaders. The MLQ was used to survey participants regarding leadership style; subsequent
data analyses led to an improved understanding of leadership styles of enrollment
management professionals.
Organization of Remaining Chapters
Chapter II includes a literature review of enrollment management and leadership
theories and styles. Chapter III explains the research methodology used to conduct the
study, including an explanation of the survey instrument. Chapter IV includes survey
results and data analyses. Chapter V provides a summary of the study, conclusions, and
suggestions for further study.

16
CHAPTER II
REVIEW OF RELATED LITERATURE
Enrollment Management
During the last twenty-five years, reductions in the number of graduating high
school seniors and an erosion of trust in all types of public entities have posed challenges
for higher education (Penn, 1999). This decline in prospective students spurred
competition among institutions, while the call for greater accountability has increased the
burden of state and federal reporting.
“Declining enrollments are second only to declining appropriations as the reason
for colleges’ and universities’ financial problems” (Penn, 1999, p. 2). If administrators
are to manage enrollment and curtail attrition, they must understand the current student
population and use research to project future enrollments (Hossler & Hoezee, 2002). An
enrollment management plan that is creative, innovative, and concise can support
institutional efforts to manage student enrollment.
During the late 1970s, John Maguire and Frank Campanella of Boston College are
credited with coining the term enrollment management. In an effort to combat declining
enrollments and retention rates at Boston College, Campanella (as cited in Henderson,
2001) approached colleagues with the concept of enrollment management. Campanella
wrote, “I am convinced that enrollment management will shortly be the ‘name of the
game.’ I am equally convinced that it will require a coordinated and integrated effort of
the highest order” (Henderson, 2001, p. 6).

17
Crockett (2003) explains that enrollment management is more than granting
admission to students. Enrollment management has expanded from primarily facilitating
enrollment, to include marketing, recruitment, financial aid, advising, registration,
retention, and even instruction. Don Hossler as cited in Henderson (2001) believes that
enrollment management is “reaching its adolescence as an industry” (p. 3). According to
Owens (2001), the evolution of enrollment management has been one of the most
significant developments in the administration of higher education. Fewer students
graduating from secondary schools caused concern among private institutions, which
were the first to use enrollment management as a way to attract and retain new students
(Owens, 2001). Soon after, public universities, colleges, and community colleges
embraced the enrollment management concept as strategy of competing with other
institutions, and enrolling and retaining a desired student population. Enrollment
management is no longer just the responsibility of a few, but a campus-wide endeavor.
Institutions must develop an evolving, integrated plan to attract and retain students.
Enrollment Management Defined
Enrollment management has been a viable approach to managing enrollment for
about thirty years. Because educators were unsuccessful in reversing enrollment declines
of the 1970’s, they began to seriously consider enrollment management (Dixon, 1995).
“Enrollment management is a process that brings together often disparate functions
having to do with recruiting, funding, tracking, retaining, and replacing students as they
move toward, within, and away from the university” (Henderson, 2001, p. 7). Enrollment

18
management, as defined by Crockett (2003), is a systematic and integrated approach to
achieving enrollment goals by exerting control over factors that shape the size and
characteristics of the student body. Dennis (1998) defines enrollment management as
understanding why students enroll or withdraw, knowing how students finance
educational expenses, connecting enrollment management with retention, and strategic
planning to enable the institution to meet future enrollment and revenue requirements.
Enrollment management is most likely to succeed when the president supports the
endeavor and faculty are sympathetic and involved. Because an enrollment management
plan encompasses many functions of the college, it will have greater success if it receives
full administrative support (Dolence, 1993). The president of the campus must not only
endorse the enrollment management program verbally, but also allocate sufficient
funding (Penn, 1999). Successful implementation of the plan requires a concerted effort
that receives campus-wide support (Dolence, 1993). Bradica (2001) cautions enrollment
managers that interdependence may be necessary to attain goals. Because not all
personnel may cooperate in implementing the plan, it is necessary for the enrollment
manager to be able to influence others. Cross training and communication may aid this
process.
Responsibilities of Enrollment Management
An effective enrollment manager must have a global perspective of the institution.
Additionally, those who practice enrollment management must be well versed in state
and federal legislation, funding formulas and the general state of higher education.

19
Furthermore, these individuals must be able to gain support of administration and faculty
and secure necessary resources to fund the effort. Penn (1999) believes the success of a
plan may rest with the enrollment manager’s ability to communicate, persuade, and
collaborate with others. “Enrollment management changes the way colleges and
universities approach the business of higher education” (Penn, 1999, p. 3). With
appropriate strategic planning, assessment, fiscal and personnel resources, and trained
professionals, enrollment management helps postsecondary institutions meet challenges
of increased competition and reduced funding. Institutions with a viable enrollment
management program report greater success in meeting goals.
As competition for students becomes stronger, the role of the enrollment manager
will continue to increase in importance. Few colleges can afford to operate status quo,
but must aggressively recruit and retain students. An effective enrollment manager, by
anticipating change and planning appropriately, can help an institution achieve and
maintain enrollment goals. Although application of enrollment management plans varies,
the basic need to manage enrollment from initial contact through graduation has become
evident.
Dixon (1995) as cited in Penn (1999) posits that enrollment management has four
objectives: (a) to define the mission, characteristics, and promote the institution to
appropriate markets; (b) secure campus-wide participation and support of enrollment
management activities; (c) to strategically award financial aid to maximize enrollment;
and (d) to designate sufficient personnel, fiscal, and technical resources to the enrollment
management plan. An integrated enrollment management plan requires new levels of

20
trust and cooperation between participants. Its success rests on sound, ongoing planning
and evaluation based on criteria established in the development phase of the program
(Dolence, 1993).
Enrollment management must be holistic in nature (Dolence, 1993). Faculty play
an important role in enrollment management, and it is a mistake for enrollment
management to ignore this group. Hossler (1986) admits that it would be a grievous
error, and impossible on most campuses, to attempt to dictate policy to faculty. Yet the
faculty has a direct influence on student enrollments in a variety of ways. Student-faculty
interaction has a powerful impact on student persistence (Tinto, 1993). The enrollment
manager must successfully communicate to faculty how they can support the campus
enrollment effort. For example, Dixon (1995) suggests that faculty participate in
enrollment management activities such as phone banks, open house, panel discussions
and workshops, both on and off campus.
Effective enrollment management relies upon a steady flow of information
(Dolence, 1993). For example, developing an enrollment management plan that predicts
future enrollment will assist administration in planning construction, altering the
curriculum, or expanding services (Hossler & Hoezee, 2002). Research is such an
important component that a researcher should be assigned to the enrollment management
team (Dennis, 1998). Enrollment management uses data to support decisions and to
assist with the development of an appropriate plan. Long-range enrollment management
plans must be reconciled with the strategic goals and mission of the institution.

21
Enrollment management has been charged with analyzing, monitoring and
shaping the size and characteristics of the student body (Dennis, 1998). Enrollment
management seeks to improve the quality of services, programs, and student activities.
Students are coming to college campuses with high expectations of receiving a
comprehensive educational experience that is rich in academics and extracurricular
activities. Enrollment management must ensure students’ needs are met within the
context of the institutional culture and mission, otherwise the probability that a student
will depart prior to degree attainment is greatly increased (Crockett, 2003). Educational
institutions must do more than just teach, but also must help students achieve educational
and career goals. Enrollment management is an evolving process that seeks to enhance
not only recruitment, but also retention.
Because enrollment management is paramount to an effective recruitment and
retention initiative, leadership becomes an integral part of successful implementation.
Enrollment managers must be creative “super stars” who are futuristic in thinking and
planning, expect excellence, and utilize a humanistic approach when solving problems
(Dennis, 1998, p. 15). Given the importance of enrollment management to the
maintenance of an organization, the individual selected to lead the enrollment effort must
be energetic, calm during a crisis, a strategic thinker and planner, and able to garner
support and participation from the entire campus.
“Managing enrollments is a way of managing the business of higher education”
(Henderson, 2001, p. 6) and is utilized in many institutions. Enrollment managers know
that to have successful retention rates, the institution must provide superior service and

22
exceed expectations of students and their families. Student needs are more important
than personnel needs, desires, and agendas (Dennis, 1998). Henderson (2001) explains
that enrollment management is more than admitting students, but “encompasses a cradle-
to-endowment mentality that starts with recruitment before students even know they want
to come, flows into retention, and renews itself with satisfied alumni ready to contribute
to the institution” (p. 35).
Leadership
Dwindling resources, declining enrollments, underprepared students, demands for
accountability, competition from other institutions and increased government regulation
are just a few of the issues facing enrollment managers (Anderson, 1997). Leaders are
challenged to create an environment that is good for students, faculty, staff, and the
community. Being an effective leader is no easy task; good leaders must be enthusiastic
about their work and the potential of the institutions that employ them. Furthermore,
good leaders are confident in their judgment and hold themselves and followers to high
expectations (Hoover, 1991).
Early leadership studies focused on traits or personality characteristics as
determinants of effective leadership (Bhal & Ansari, 2000; Bryman, 1986). This research
suggested that leaders are born and not made (Bennis & Nanus, 1985). Frederick
Taylor’s rigid scientific management theory was utilized from about 1910 until 1935. It
focused on lowering cost of factory production, increasing efficiency, and was often
referred to at the classical era of organizational theory (Fairholm, 1998; Wallin & Ryan,
23
1994). Effective leadership was associated with effective management (Fairholm, 1998).
The mid 1930s through the 1950s saw human relations infiltrate the world of leadership.
Human and interpersonal factors were introduced into management theories as leaders
sought to boost employee satisfaction, dedication and performance (Wallin & Ryan,
1994).
Behavioral theories began to emerge during World War II as trait research failed
to explain leader effectiveness (Bass, 1990). These studies evaluated behavior rather than
traits of leaders; in other words, “leadership may be defined as the behavior of an
individual while he is involved in directing group activities” (Bass, 1990, p.14). The
1950s and 1960s recognized an effort to combine classical management and human
relations management. Classical management assumes that the average person dislikes
work and will avoid it whenever possible (Wallin & Ryan, 1994). During this era,
researchers also studied how followers perceived leaders. Leadership traits were
influenced by various situations and each called for different responses and actions
(Roueche, Baker & Rose, 1989). Situational theories, or contingency models, followed
trait and behavioral research. The focus of situational theory involved analyzing the
situation in which leadership behavior occurred (Daft, 1999). Transformational
leadership research pursued a new area of study by comparing relation al behavior of
leaders and followers.
Definitions of Leadership
Leadership has many definitions. The similar definitions make it difficult to
differentiate between leadership styles. Therefore, Bass (1990) suggests the meaning of

24
leadership may depend upon the type of institution in which it is found. Leadership is
more than measuring output or enforcing rules; it also involves the development of others
(Fairholm, 1998). “Leadership occurs when one person influences another to work
toward some predetermined objective” (Dessler, 1995, p. 364). Birnbaum (1992) posits
that leadership is more than a measurement of leadership activity, but also includes the
follower’s interpretation of a leader’s behaviors. Hollander (1978), as cited in Bryman
(1986), defined leadership as a process of influence between a leader and followers.
Stogdill (1974) described leadership as “the process of influencing the activities of an
organized group in its efforts toward goal setting and goal achievement” (p. 57).
Nahavandi (1997) offered the following definition of leadership, “a person who
influences individuals and groups within an organization, helps them in the establishment
of goals, and guides them toward achievement of those goals, thereby allowing them to
be effective” (p. 4).
Despite numerous definitions of leadership, a frequently cited component is the
concept of “influence”. Tannebaum and Massarik (1968) support the notion of influence
when defining leadership as “interpersonal influence exercised in a situation and directed,
through the communication process, toward the attainment of a specialized goal or goals”
(p. 34). Gulley (1960) provided a commonly held view of leadership in stating,
“Leadership… means influencing others within a particular situation and social context in
a way that induces them to follow, to be modified, to be directed” (p.74).

25
Trait Theory Early studies analyzed leadership based on hereditary attributes (Bass, 1990) and
compared traits of leaders with those of followers. Trait theory argued that psychological
or physiological characteristics determined leadership style and leaders shaped an
organization according to their ability (Lipham, 1973). By identifying specific traits or
characteristics of leaders, one could distinguish a leader from a follower (Bryman, 1986).
General Archibald Wavell (1941), as cited in Bryman (1986), summed up the foundation
of trait leadership with the following comment, “No amount of learning will make a man
a leader unless he has the natural qualities of one” (p. 18).
Research concerning trait theory concentrated on the following factors:
(a) physical factors such as age, height, weight, physique, health, and appearance;
(b) ability factors such as fluency of speech, tone of voice, academic performance,
intelligence, judgment and decision, insight, and initiative; and (c) personality features
such as integrity, emotional control, self confidence, and popularity (Bass, 1990; Bryman
1986). According to this theory, an individual must possess these traits or characteristics
in order to assume leadership.
Seeking to ascertain if trait theory accurately predicted leadership potential,
Stogdill (1948) reviewed 124 studies conducted between 1904 and 1947 and concluded
that specific traits and characteristics were not responsible for the emergence of
leadership. Stogdill’s (1948) summary of the review:
A person does not become a leader by virtue of the possession of some combination of traits, but the patterns of personal characteristics of the

26
leader must bear some relevant relationship to the characteristics, activities, and goals of the followers. (p. 64)
Mann (1959) also reviewed trait studies, and like Stogdill, reported that the foundation of
trait theory lacked validity. Traits reported as being crucial to effective leadership in one
study were not validated in others.
Stogdill (1974) completed a second review of trait leadership research that
included an additional 163 studies that were conducted from 1949 to 1970. This review
identified factors associated with energy, age, status, mobility, education and intelligence
as being able to separate effective leaders from ineffective leaders. According to Stogdill
(1974), improved measurement techniques and methodology lead to the identification of
these traits. However, Stogdill (1974) surmised that trait theory research produced
confusing results because a combination of traits proved effective in some groups of
leaders, while they were ineffective in others. Therefore, Stogdill concluded that
leadership requires more than just the study of people, but also the study of situations.
Behavioral Theory More than fifty years of study failed to produce a single personality trait or quality
that accurately predicted leadership (Jennings, 1961). Failure of the trait theory led to
further research that focused on behavioral styles of leadership.
Behavioral theories emerged during World War II because trait research had
failed to explain leader effectiveness (Bryman, 1986). Behavioral leadership proposed

27
that behavior of the leader impacted work and follower effectiveness. This era of
research focused on leadership behavior as a means of identifying the best way to lead.
Iowa State University Studies
Studies conducted during the 1930s at Iowa State University identified three
leadership styles: autocratic, democratic, and laissez-faire (Bryman, 1986). According to
Daft (1999) “an autocratic leader is one who tends to centralize authority and derive
power from position, control of rewards, and coercions. A democratic leader delegates
authority to others, encourages participation, relies on subordinates’ knowledge for
completion of tasks, and depends on subordinate respect for influence” (p. 69). Laissez-
faire is the absence or avoidance of leadership and has been labeled the most ineffective
style (Bass, 1990; Bryman, 1986).
Ohio State Leadership Studies
The Ohio State studies were viewed as influential because the research focused on
activities of leaders, instead of traits (Bryman, 1986). Through this research, the
Leadership Behavior Description Questionnaire was developed. The instrument
measured two basic dimensions of leader behavior, consideration and structure:
1. Consideration describes leadership behaviors such as friendship, trust, and mutual
respect (Bass, 1990). The leader is concerned for the welfare of followers and
maintains an approachable demeanor.

28
2. Initiating structure solidifies the roles of the leader and followers and relates to
patterns of organization, communication, and procedural methods. Rules are
established that govern follower performance (Bass, 1990).
The two dimensions of leadership were mutually inclusive and together created four
types of leadership. Table 2.1 identifies the four combinations of leadership behavior
describe in the Leadership Behavior Description Questionnaire.
Table 2.1: Ohio State Leadership Study Quadrants
Quadrant I High consideration (+)
High initiating structure (+)I = (+,+)
Quadrant II Low consideration (-)
High initiating structure (+) II= (-,+)
Quadrant III Low consideration (-)
Low initiating structure (-) III = (-,-)
Quadrant IV High consideration (+)
Low initiating structure (-) IV = (+,-)
Note. From “Leadership Behavior: Its Description and Measurement,” by R.M. Stogdill and A.E. Coons, 1957, (Eds.). Research Monograph 88. (Columbus: Bureau of Business Research, The Ohio State University, 1957).
Quadrant I became the focus of researchers as the combination of high
consideration and structural qualities was thought to be the most advantageous.
However, these pursuits soon proved disappointing as the contingency aspect of the
model cancels the success of the style and subsequent development of a universal
leadership style. Farris and Lim (1969) as cited in Bass (1974) conducted a correlation
study of leadership behavior and employee competency and concluded that the follower’s
level of competence was influential in the leader’s choice of quadrant. Leaders of more
competent employees more frequently utilized a style that emphasized consideration.

29
University of Michigan Studies
Leadership research during the 1940s conducted at the University of Michigan
compared the behavior of effective leaders with ineffective leaders (Leftwich, 2001).
These studies resulted in the development of two types of leadership behavior (Bryman,
1986). Employee-centered leaders focus on the individual needs of followers, while job-
centered leaders direct activities toward efficiency by focusing on reaching task goals and
facilitating the structure of tasks (Leftwich, 2001). Although the employee-centered and
job-centered styles of leadership correspond to the Ohio State studies concepts of
consideration and initiating structure, the Michigan studies concluded that leaders used
one type of leadership and did not change styles depending on employee competency.
Employee-centered and job-centered leadership styles are reportedly opposing concepts.
They also found that employee-centered leaders were more productive (Megginson, et al.,
1989).
The following Figure 2.1 denotes strong effects as indicated by the solid lines;
weaker effects are denoted with the use of the broken line. Evaluation of this figure
demonstrates that managerial leadership is affected by the climate of an organization,
which includes decision-making procedures, conflict resolution, communication, and
concern for employees (Bryman, 1986).

30
Managerial Leadership
Organizational Group Climate Process
Peer Leadership
Note. From “Relations among four social psychological aspects of organizations,” by J.L. Franklin, Administrative Science Quarterly, 20, September 1975.
Figure 2.1. Managerial Leadership
Managerial Grid The Managerial Grid, conceived by Blake & Mouton (1964) and reported in
Bryman (1986), is an approach to organizational development and is one of the best
known in the literature. The foundation of the theory is a contrast between two
approaches to the managerial role: (a) concern for production and (b) concern for people
(Bryman, 1986). Blake and Mouton believe that both concerns are essential ingredients
of effective management and each is conceptualized as a nine-point scale, thus producing
eighty-one possible combinations of managerial behavior.
The following scale Figure 2.2 (Bryman, 1986, p. 76), as derived from Blake and
Mouton (1964), plots the Managerial Grid on a scale from one to nine and divides them
into quadrants.

31
The Managerial Grid Concern 9 For People 5 1 1 5 9
Concern For Production
Note. From Leadership and Organizations (p. 73), by A. Bryman, 1986, London:
Routledge & Kegan Paul. Figure 2.2. Managerial Grid
The grid is composed of five categories that are based on concern for production
and concern for people (Bryman, 1986). The categories are:
1. Impoverished management is characterized by low scores on both dimensions, a
context in which conflict is likely. The leader maintains low involvement with
people and minimal communication.
2. Country club management has a high concern for people and a low concern for
production. Emphasis is on maintaining friendly relationships within a
1,9
9,9
1,1
9,1
5,5

32
harmonious work environment.
3. Task management is concerned with production and views employees as suppliers
of labor who must be controlled and directed.
4. Middle-of-the-road management is concerned with both people and production; it
is possible to balance work and morale.
5. Team management promotes a high degree of concern for both people and
production. Followers are involved in the planning and execution of work.
Contingency Theories
“Discouraged by the sparse yield of the trait and behavioral approaches, the field
of leadership was ready for a new paradigm” (Chemers, 1997, p. 28). Contingency
models of leadership effectiveness represented a new era of study in the field of
leadership research. Contingency theories try to predict which types of leadership style
will be most effective in different types of situations (Holda, 1995). Contingency
approaches hypothesize that there are no universally acceptable styles of leadership. A
particular leadership style may prove valid in one situation, yet ineffective in another.
Therefore, discrete factors in the situation influence leadership. “Leadership must change
with the situation – or the situation must change to accommodate the kind of leadership
exercised” (Fairholm, 1998, p. 53). Bryman (1986) expresses the basic structure of the
contingency approach Figure 2.3.

33
Note. From Leadership and Organizations (p. 126), by A. Bryman, 1986, London: Routledge & Kegan Paul.
Figure 2.3. Contingency Leadership Model
The models of contingency theory discussed include Fiedler’s Contingency
Model, House and Mitchell’s path-goal theory, Hersey and Blanchard’s Situational
Leadership theory, and Vroom and Yetton’s contingency model.
Fiedler’s Contingency Model
Fiedler developed the first contingency approach to study leadership. Fiedler
developed a personality measure, the least preferred co-worker (LPC) scale; to identify
leadership styles (Holda, 1995). The LPC instrument measured esteem for the leader’s
least preferred co-worker and the score was used to generalize leadership style. The LPC
Situational Factors
Leadership Style/Behavior
Outcomes (e.g. group performance, subordinates satisfaction)

34
score measures the degree of motivation exerted by a leader. Task oriented leaders
earned lower LPC scores while relationship oriented leaders earned high scores.
Fiedler (1967) stated that LPC leaders encourage superior performance from their
followers in some circumstances, but in other contexts, low LPC leaders will do better.
“In other words, Fiedler maintains that the type of leader required in order for group
performance to be enhanced is situationally contingent” (Bryman, 1986, p. 128).
Bass (1990) reports Fiedler developed three leadership factors, which indicated a
leader’s ability to influence followers. They are: (a) leader-member relations, which
refers to the quality of the relationship between the leader and followers; (b) task
structure refers to the clarity of followers’ tasks; and (c) position power corresponds with
the leader’s ability to issue rewards and/or punishments accordingly.
Results from Fiedler’s research indicated that task-oriented leaders are more
effective in high-control and low-control situations, and that relationship-oriented leaders
are more effective in moderate-control situations. Task-oriented leaders perform better in
favorable situations “because everyone gets along, the task is clear, and the leader has
power; all that is needed is for someone to take charge and provide direction” (Daft,
1999, p. 96). Conditions unfavorable to the task-oriented leader require high levels of
structure and task direction. The relationship-oriented leader performs better in favorable
situations because human relations skills are important in achieving high group
performance in these situations.
Fiedler (1967) discovered that various combinations of the three contingency
factors actually defined which leadership style was most effective in eight different

35
situations as identified in Table 2.2.
Table 2.2: Situational Leadership in Eight Octants
LEADER-MEMBER
RELATIONS
TASK STRUCTURE
POSITION POWER
FAVORABLE LEADERSHIP STYLE
Octant I Good Structured Strong Task Oriented Octant II Good Structured Weak Task Oriented Octant III Good Unstructured Strong Task Oriented Octant IV Good Unstructured Weak Relationship OrientedOctant V Poor Structured Strong Relationship OrientedOctant VI Poor Structured Weak Relationship OrientedOctant VII Poor Unstructured Strong Relationship OrientedOctant VIII Poor Unstructured Weak Task Oriented
Note. Fred E. Fiedler, A Theory of Leadership Effectiveness (New York: McGraw-Hill, 1967), p. 142. Chemers (1997) notes a weakness of Fiedler’s model is its failure to describe or
directly analyze the processes by which a leader’s motivational orientation affects group
processes and outcomes. While the model does predict leadership effectiveness, it does
not delineate the processes that produce effective leader performance.
House and Mitchell Path-Goal Theory
The path-goal theory developed by House in 1971 and refined in 1974 by House
and Mitchell, “argued that motivation to engage in a behavior was a function of the
product of the person’s perception of the probability that the behavior would lead to a
goal and the perceived importance of the goal” (Chemers, 1997, p. 44). The leader can
influence subordinates’ perceptions of work and the paths to attaining stated goals
(Holda, 1995). The path-goal theory identifies variables that define follower motivation.

36
Evans (1970), as cited in Chemers (1997), reasoned that leadership behaviors did not
always have the same effects on group outcomes such as productivity because they did
not always have the same effects on path-goal perceptions and that path-goal perceptions
were determinants of leader behaviors such as initiation of structure and consideration.
Chemers (1997) summarized the House & Mitchell leadership theories into four
categories: (a) Instrumental Leadership requires the leader to clarify what is expected of
subordinates, rules and procedures, and how to complete tasks; (b) Supportive Leadership
demonstrates a leader’s concern for welfare of subordinates; (c) Participative Leadership
involves collaborative decision making between the leader and subordinates; and
(d) Achievement-Oriented Leadership sets ambitious goals for subordinates and
communicates a high level of confidence in their ability to complete tasks. The effective
leader used a combination of the above styles to meet the needs of the followers, which in
turn increased productivity.
According to House (1971), effective leaders provided subordinates with the
guidance and rewards necessary for satisfaction and performance. A leader is responsible
for helping subordinates determine which path will lead to goal achievement and
subsequent attainment of rewards. Successful ventures increase the confidence level of
subordinates, pique their interest, and increase their efforts to achieve goals (Leftwich,
2001). An effective leader increased follower rewards for goal attainment and
communicated an avenue to achieve these rewards by clarifying or reducing obstacles
and increasing opportunities for personal satisfaction (Bass, 1990).

37
Hersey and Blanchard Situational Leadership Model
Hersey and Blanchard, as cited in Bass (1990), proposed a leadership model based
on their understanding of prior empirical research. The propositions were: (a) leadership
styles vary among individuals; (b) some leaders initiate structure to accomplish tasks,
others maintain personal relationships, while still others do nothing; (c) effective
leadership style depends on the situation; (d) the best attitudinal style is high-task and
high-relations oriented, (e) the tasks and maturity level of the follower will dictate the
most effective leadership style; and (f) maturity of the follower is a product of the
individual’s level of education, prior training, or age. This leadership theory attempts to
understand the relationships between effective leadership styles and follower maturity.
Effective leadership is demonstrated when the leader chooses a behavior that coincides
with the maturity level of followers (Bass, 1990).
Hersey and Blanchard (1977) attempted to match four leadership patterns (a) task
oriented, (b) dynamic, (c) relations oriented, and (d) delegating, with four levels of
maturity (a) low, (b) moderately low, (c) moderately high, and (d) high. Maturity was
identified as the most significant variable in determining leadership style. Follower
maturity is responsible for the relationship between leader behavior and leader
effectiveness. Chemers (1997) goes on to explain that the leader must decide the
maturity level of each follower before implementing a specific leadership style. Hersey
and Blanchard (1977) also posit that leadership styles may be negotiated between the
leader and follower; as follower maturity improves, leaders provide greater freedom. The

38
main contribution of the Situational Leadership Model approach is that it suggests leaders
should be flexible in their behavior (Chemers, 1997).
Vroom and Yetton
Vroom and Yetton (1973) focused their research on decision-making rather than
styles of leadership (Holda, 1995). This model seeks to enhance the decision-making
ability of the leader and the follower’s acceptance of those decisions. Situational factors
impose either an autocratic or participative leadership approach (Chemers, 1997). The
following levels of participation are proposed: (a) A = autocratic process, (b) C =
consultative process and (c) G = group decision-making. The approaches to leadership
are on a continuum, with AI and GII representing the extremes. The following table
categorizes the decision processes.
Table 2.3: Taxonomy of decision processes in the Vroom-Yetton model
AI Solve problems or make decisions based on available information.
AII Obtain information from subordinates, but the leader makes the decision without consulting followers.
CI Solicit ideas from subordinates individually and then the leader makes a decision.
Although the leader determines the solution, subordinates are influential in the process.
CII Solicit ideas from a group of subordinates and then the leader makes a decision.
Although the leader determines the solution, subordinates are influential in the process.
GII The leader shares the problem with the group of subordinates. Collaborative
decision-making process involves the leader and subordinates.
Note: Vroom & Jago, “On the validity of the Vroom-Yetton model”, Journal of Applied Psychology, 63, (p. 152).

39
Vroom and Jago (1974), as cited in Bass (1990), added another approach – “DI”,
referring to “delegation”. The leader delegates a problem to a follower, provides
pertinent information for decision-making and then supports the follower’s decision. AI
and AII are directive, CI and CII are consultative, GI and GII are participative, and DI
involves delegation (Bass, 1990). Chemers (1997) explains the leader must evaluate each
of these choices and select the appropriate approach for the current situation. Bass
(1990) suggests the following variables may influence the leader’s choice of leadership
style: (a) quality requirement of the solution, (b) sufficient information to allow the
leader to make an informed decision, (c) structure of the problem, (d) follower
acceptance important to implementation, (e) follower support of independent decision
making, (f) follower support of organizational goals, and (g) the probability of conflict
among followers.
Transactional Leadership
Burns (1978) as cited in Roueche, Baker, & Rose (1989) defines transactional
leadership as, “one person taking the initiative in making contact with another for the
purpose of an exchange of valued things, such as paying wages to employees for their
efforts and skills” (p.4). Transactional leadership is structured and concerned with
maintaining efficiency and supports the use of power to influence followers to complete
transactions. Avolio & Yammarino (2002) define transactional leadership as being
characterized by exchanges and self-interest and report leaders who do not use

40
transforming leadership must influence followers through rewards and sanctions.
Transactional leadership requires agreement between the leader and the follower
on the need to attain a specific goal. To facilitate goal achievement, objectives are
developed, and the follower understands what is necessary to reap the reward or
punishment (Roueche, Baker, & Rose, 1989). Thus, transactional leadership involves
either positive or negative exchanges, depending on the follower’s performance (Bass &
Avolio, 1994). Once the exchange is completed, there is no further need to interact
unless another process of contingent reward is introduced (Avolio & Yammarino, 2002;
Baker, 1992).
Avolio (1999) and Avolio & Bass (2002) identify three components of
transactional leadership. They are:
1. Contingent reward involves an exchange. The leader rewards followers upon
successful completion of tasks or assignments.
2. Management-by-Exception involves corrective action. While it may not be as
effective as other leadership styles, it is often necessary. When a leader monitors
performance and takes corrective action as needed, active management is being
utilized. However, if the leader waits until a mistake occurs and then corrects,
passive management is being utilized.
3. Laissez-Faire is the avoidance or absence of leadership. Not only is it deemed the
most inactive, but also the most ineffective.
Transactional leadership has also been referred to as scientific leadership, which
assumes the leader has control over available rewards. Followers, who are in pursuit of

41
the rewards, allow leaders to exert control and influence (Bottery, 2001). Burns (1978)
argues that this working relationship is not permanent, as the followers and leaders are
not jointly seeking a common goal. Although transactional leadership dominated
research in the 1960s, Sergiovanni (1992) suggests that it may no longer be viewed as the
preferred leadership style because it limits human potential.
Transformational Leadership
Leadership theories have evolved from trait theory, through behavioral and
situational studies, to transformational (Krill, Carter, Williams, 1997). Focus changed
from the leader’s attributes and actions to an assessment of the relationship between the
leader and follower.
Transformation leadership research emerged in the late 1970s when Burns (1978)
conducted a comprehensive study of leadership and categorized leaders as either
transactional or transformational (Avolio & Yammarino, 2002). Transformational
leadership, which is an expansion of transactional leadership, does not place major
emphasis on exchanges or rewards within the system. Instead, transformational
leadership challenges followers to disregard self-interests and encourages pursuit of
institutional goals, interests of the group, and moves followers gradually from concerns
for exchange to concerns for achievement and growth (Bass & Avolio, 1994).
Transformational leadership is “the development of a relationship of mutual
needs, aspirations, and values in which the leader looks for potential motives in

42
followers, seeks to satisfy higher needs and engages the full person of the follower”
(Burns, 1978, p. 4). Bottery (2001) deemed transformational leadership as having greater
value than its transactional counterpart. Bass (1985) later suggested that both
transactional and transformational leadership styles were needed for effective leadership.
Fairholm (1998) credits transformational leaders with transforming themselves,
followers, and the organization. Tichy and Devanna (1996) as cited in Krill, et al. (1997)
describe transforming leaders as change agents because of their ability to translate their
dream for the organization into a vision shared by followers. Transformational
leadership tries to build confidence in followers, thereby converting them into leaders.
Transformational leadership relies on the ability of the leader to inspire followers
through the creation and dissemination of a vision (Bottery, 2001). The leader must
communicate the vision to followers and engage them in pursuit of an objective. Gronn
(1997) explains transformational leaders create learning opportunities for followers and
empowers them to solve problems as a means of fostering leadership skills.
Avolio & Yammarino (2002) explain that transformation leaders focus on vision,
ideals, values, risk and change. “Transformational leadership goes beyond the attempts
of some leaders to satisfy the current needs of followers by focusing on transactions or
exchanges through contingent reward behavior” (Bass & Avolio, 1994, p. 27). By
recognizing needs in followers, transformational leaders seek to engage the full person by
encouraging the pursuit of higher-order needs (Roueche, Baker & Rose, 1989).
Followers and leaders unite to achieve a common goal, which places emphasis on
institutional goals and not personal agendas (Avolio & Yammarino, 2002).

43
Transforming leaders are known for their ability to motivate and energize
followers into a common vision that identifies lofty goals for the organization (Krill, et.
al., 1997). The relationship between a transformational leader and followers encourages
performance that exceeds expectations of all parties (Burns, 1978; Day, Zaccaro, &
Halpin, 2004). Transformational leaders are able to motivate followers to do more than
originally planned and often even more than they thought possible.
Burns (1978) as cited in Avolio and Yammarino (2002) describes
transformational leadership as a moral leadership theory. Transformational leaders care
about their followers and understand the impact of their actions on the group.
Transformational leaders seek the development of followers who are motivated by
intrinsic values and consequently more attached to the leader’s mission (Avolio &
Yammarino, 2002). “True transformation leadership occurs when followers adopt
institutional objectives as part of their own self-concept and pursue their own personal
fulfillment by achieving collective purposes” (Chemers, 1997, p. 158).
Full-Range Leadership Theory
The most recent model of transformational leadership is the full range theory.
This model has the potential to explain leadership and its multidimensional nature and to
empirically measure behaviors that can be used to predict leadership outcomes
(Antonakis & House, 2002). The full-range model has been deemed more successful in
determining effective leadership because it is an integrative theory that (a) has been
widely accepted in leadership literatures, (b) is supported by empirical research, and (c) is

44
integrative. Bass (1985) included transformational leadership in his Full-Range
leadership model. Expanding Burns’ leadership theory, Bass renewed focus on “high
impact leadership” (Avolio, 2004, p. 72). While Bass (1985) posits that transactional
leadership is important to effective leadership, leaders should utilize both
transformational and transactional behaviors (Dum Dum, Lowe, & Avolio, 2002). Bass
argues that transactional leadership is effective in the designation of objectives and
measurement of achievement; however, this style of leadership in itself is limiting.
Transformational leadership is necessary to provide a higher meaning and purpose
(Antonakis & House, 2002).
Birnbaum (1992) suggests that effective leaders are not purely transactional or
transformational, but blend both styles. Bass and Avolio (1994) developed the Front
Range Leadership Theory (FRLT), which evolved from Bass’
transactional/transformational theory (Antonakis & House, 2002). The FRLT consists of
nine factors that are categorized into three leadership styles: (a) transformation
(b) transactional, and (c) laissez-faire leadership.
Transformational leaders encourage superior results from followers by using a full
range of leadership, which is composed of one or more of the following components or
behaviors (Antonakis & House, 2002; Barnett & McCormick, 2004). Transformational
leadership includes the following five factors:
1. Idealized influence (attributed), also referred to as attributed charisma, describes
followers’ perception of the leader’s power, confidence, and inspirational ideals.

45
This emotional aspect of leadership is credited with shifting follower self-interest
to a global perspective that places the welfare of the organization first.
2. Idealized influence (behaviors), also referred to as behavioral charisma, includes
leader behaviors that reveal the leader’s values and beliefs, ethical and moral
values, and vision. This type of leader models appropriate behavior for followers.
Power is used only when necessary and never for personal gain.
3. Inspirational motivation encourages followers to excel. Followers are motivated
to achieve objectives that have previously been thought unattainable. The leader
raises expectations and communicates confidence in followers that encourages the
achievement of ambitious goals. Enthusiasm and optimism are results of this
leadership behavior.
4. Intellectual stimulation encourages followers to question assumptions, invites
creative solutions to problems, and challenges the status quo. Leaders encourage
creative and innovative thinking and reframe problems in order to gain new
perspectives. Furthermore, the leader does not publicly criticize followers’
mistakes. Followers are encouraged to try new approaches and have the right to
fail.
5. Individualized consideration refers to leaders who act as mentors and pay
attention to individual needs for growth and achievement. The leader encourages
followers to strive for higher levels of attainment by pursuing challenges. This
leader listens, delegates tasks as a means of developing followers, and offers
direction or support as needed.

46
Transactional leadership, the second category of the FRLT, includes the following
three factors:
1. Contingent reward is based on exchange. This method of leadership clarifies
roles of followers and the rewards that will be issued for desired outcomes. This
style is effective, but to a lesser degree than transformational leadership.
2. Management-by-exception (active) is a corrective or negative transaction and
occurs when the follower deviates from the norm. The leader actively monitors
follower performance and takes corrective action when a mistake occurs.
3. Management-by-exception (passive) is similar to management-by-exception
(active); however, passive leaders do not actively monitor performance, but
instead wait until deviations occur and then implement a corrective action.
Laissez-faire leadership, the third category in FRLT, describes the absence of
leadership. This type of leader avoids making decisions and is the most inactive form of
leadership (Antonakis & House, 2002), and has not been credited with encouraging any
type of transaction.
Leadership Models Sergiovanni (1992) discusses four leadership models. However, he notes it may
be difficult for leaders to choose one model and follow it as prescribed. Combining
aspects from the different models may create a more effective theory.
1. Psychological Theory uses motivation and human relations skills. Followers, in
an effort to collect rewards, behave appropriately. Followers respond as required

47
as long as rewards are available; however, performance ceases when rewards are
no longer forthcoming. This theory decreases follower involvement in daily
operation and narrows performance.
2. Technical-Rational Theory relies on logic and scientific research. This theory
does not place importance on values, preferences or beliefs. Empirical research
dictates the best leadership practice or method. Facts, objectives, and evidence
are used to make decisions.
3. Professional Theory is based on the leader’s knowledge and personal expertise.
Knowledge is used to inform, not prescribe practice, and is not considered
privileged. Leaders communicate expectations to followers and acceptable
methods of achieving goals. This theory encourages expanded follower
performance as they gain professional knowledge through experience.
4. Moral Theory expects followers to respond to shared commitments and promotes
interdependence. Shared ideas and values create obligations and duties in the
workplace. This theory allows the leader to rely on followers to complete
assignments and obligations and to conform to professional and community
values. Moral leadership promotes collective endeavors and enhances
performance.
Sergiovanni (1992) argues that professional and moral theories should form the
foundation for effective leadership, with psychological and technical-rational theories
offering support.

48
Conclusion
Despite the volume of literature on leadership theory, specific studies assessing
the leadership styles of enrollment managers were not identified. Fairholm (1998)
believes understanding leadership “is the single most important intellectual task of this
generation, and leading is the most needed skill” (p. xiii). Although enrollment
management is an established concept in most educational institutions and is responsible
for managing student enrollments, little is known about the individuals elected to lead
these efforts. This study will contribute to the body of literature and advance the
understanding of leadership styles of enrollment management professionals.

49
CHAPTER III
METHODOLOGY
The purpose of this study was to identify leadership styles of enrollment
managers. Furthermore, the leadership style of the enrollment manager was compared to
the type of employing institution and the participant’s gender, level of education, and
number of years of supervisory experience. This chapter identifies participants, survey
instrumentation, and procedures for data collection and analysis.
Participants
Participants were enrollment management professionals employed by
postsecondary institutions within the following states: Alabama, Arkansas, Florida,
Georgia, Kentucky, Louisiana, Mississippi, North Carolina, Oklahoma, South Carolina,
Tennessee, Texas and Virginia. Participants were selected based on their job title and
their job functions. Individuals who held titles that contained the word enrollment and
maintained responsibility for undergraduate admissions and financial aid were selected
for participation.
To ensure continuity between the job functions of participants, the study was
limited to enrollment managers who supervised both undergraduate admissions and
financial aid. Of 700 higher education institutions surveyed, approximately 94 percent of
enrollment management professionals supervised undergraduate admissions and
77 percent supervised financial aid (Bodfish, 2002; Huddleston & Rumbough, 1997).

50
Because these two areas were most frequently cited as functions of enrollment
management, they served as selection criterion that allowed for the evaluation of
leadership style of this study population. By limiting the study to enrollment managers
who met the selection criteria, individuals with comparable responsibilities were
evaluated and included in the study. Although this study identified subjects by these
selections criteria, it should be noted that most enrollment management models also
encompassed other functions, such as advising, recruiting, marketing and retention.
Instrumentation
The Multifactor Leadership Questionnaire (MLQ) Form 5X – Short (Revised),
developed by Bass and Avolio, is designed to measure transactional and transformational
leadership styles and was used to categorize participants. The MLQ 5X has been
investigated and shown to have excellent internal consistency, reliability, and construct
validity (Bass & Avolio, 1993). The MLQ 5X is a self-administered questionnaire that
consists of 45 items. The items are individually measured on 5-point, Likert-type, ordinal
scale (0 = not at all to 4 = frequently, if not always). The MLQ 5X items relate to nine
latent constructs of leadership: idealized influence (attributed), idealized influence
(behavior), inspirational motivation, intellectual stimulation, individual consideration,
contingent reward, management-by-exception (active), management-by-exception
(passive), and laissez-faire leadership. The nine factors are defined below.
1. Idealized Influence (Attributed) – Followers’ perception of the leader’s power,
confidence, and inspirational ideals. This emotional aspect of leadership is
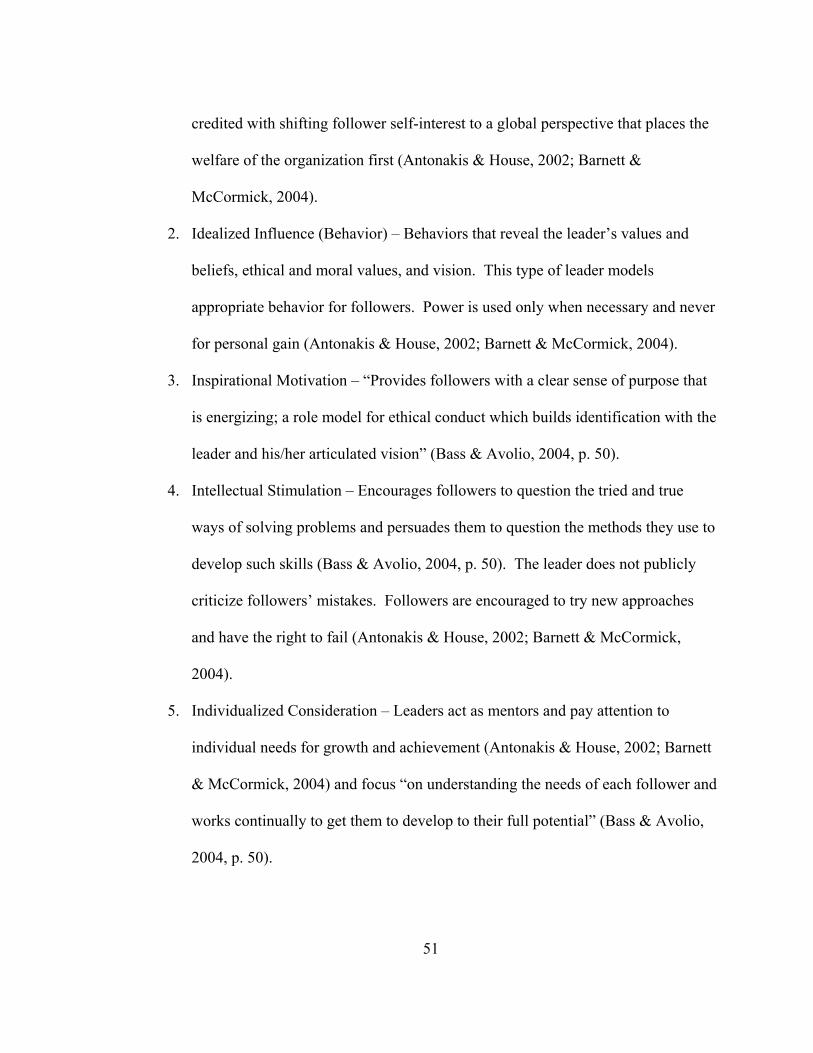
51
credited with shifting follower self-interest to a global perspective that places the
welfare of the organization first (Antonakis & House, 2002; Barnett &
McCormick, 2004).
2. Idealized Influence (Behavior) – Behaviors that reveal the leader’s values and
beliefs, ethical and moral values, and vision. This type of leader models
appropriate behavior for followers. Power is used only when necessary and never
for personal gain (Antonakis & House, 2002; Barnett & McCormick, 2004).
3. Inspirational Motivation – “Provides followers with a clear sense of purpose that
is energizing; a role model for ethical conduct which builds identification with the
leader and his/her articulated vision” (Bass & Avolio, 2004, p. 50).
4. Intellectual Stimulation – Encourages followers to question the tried and true
ways of solving problems and persuades them to question the methods they use to
develop such skills (Bass & Avolio, 2004, p. 50). The leader does not publicly
criticize followers’ mistakes. Followers are encouraged to try new approaches
and have the right to fail (Antonakis & House, 2002; Barnett & McCormick,
2004).
5. Individualized Consideration – Leaders act as mentors and pay attention to
individual needs for growth and achievement (Antonakis & House, 2002; Barnett
& McCormick, 2004) and focus “on understanding the needs of each follower and
works continually to get them to develop to their full potential” (Bass & Avolio,
2004, p. 50).

52
6. Contingent Reward – “Clarifies what is expected from followers and what they
will receive if they meet expected levels of performance” (Bass & Avolio, 2004,
p. 50).
7. Management-by-Exception (Active) – This corrective, or negative transaction
occurs when the follower deviates from the norm. The leader actively monitors
performance and takes corrective action when a follower makes a mistake
(Antonakis & House, 2002; Barnett & McCormick, 2004).
8. Management-by-Exception (Passive) – Inactive monitoring of performance. The
leader waits until deviations occur and then implements a corrective action
(Antonakis & House, 2002; Barnett & McCormick, 2004).
9. Passive Avoidant – Tends to react only after problems have become serious. This
type of leadership factor is associated with the avoidance of corrective action and
limited decision-making ability (Bass & Avolio, 2004).
The factors idealized influence (attributed and behavioral), inspirational,
intellectual stimulation and individualized consideration characterize transformational
leadership. Contingent reward, management-by-exception (active and passive), and
passive avoidant are associated with transactional leadership (Bass & Avolio, 2004).
The current version of the MLQ 5X has been translated into Spanish, Portuguese,
Italian, French German, Norwegian, Swedish, Hebrew, Turkish, Arabic, Chinese, Thai,
and Korean for use in various assessment and training research projects (Bass & Avolio,
2004).

53
Validity
The leadership constructs with respect to the relationship with performance have
been confirmed in meta-analyses conducted by several researchers (Bass & Avolio, 2000;
Catanyag, 1995; Geyer & Steyrer, 1998; Lowe, et al., 1996; Molero & Morales, 1994).
Transformational leadership is most highly correlated with effectiveness followed by
transactional and passive styles of leadership. The meta-analyses confirmed the
relationship between transformational leadership and objectively measured performance
was stronger and more positive than the transactional styles of leadership (Bass &
Avolio, 2004; Dum Dum, Lowe, & Avolio, 2002; Fuller, Patterson, Hester & Stringer,
1996; Gasper, 1992; Lowe, Kroeck & Sivasubramaniam, 1996). Additionally,
Antonakis, Avolio, and Sivasubramaniam (2003) examined the validity of the MLQ 5X
and found the instrument to be valid in measuring leadership styles of both male and
female leaders. The MLQ 5X uses factor analysis to define constructs of
transformational and transactional leadership and form a model for understanding the
effects of leadership (Barnett & McCormick, 2004).
The MLQ 5X has been researched, validated, and used in more than 300 research
programs, dissertations and theses (Bass & Avolio, 2004). Because the MLQ 5X has
been widely used and validated, it is not necessary to pilot-test the instrument. Lowe,
Kroeck, and Sivasubramaniam (1996) performed 33 independent empirical studies using
the MLQ 5X and concluded there was a positive correlation between all factors of
transformational leadership and objective and subjective measures of performance.

54
Reliability
Bass and Avolio (2004) report reliability for the total items and each leadership
factor scale ranges from .74 to .94. Reliability scores are high and exceed the published
standards for internal consistency. An alpha coefficient above .60 is generally considered
internally consistent (Mitchell & Jolley, 2000). The reliabilities within each data set
generally indicated that the MLQ 5X was reliable in measuring each of the leadership
factors across the initial nine latent constructs (Bass & Avolio, 2004). Furthermore, the
instrument produces similar results when administered to various individuals.
Research Hypotheses
H01: There is no statistically significant evidence to conclude that there are more
transactional leaders than transformation leaders acting as enrollment managers.
H02: There is no statistically significant dependence between leadership style of male
and female enrollment managers.
H03: There is no statistically significant dependence between leadership styles of
enrollment mangers at two-year and four-year institutions.
H04: There is no statistically significant dependence between leadership style of
enrollment mangers at private and public institutions.
H05: There is no statistically significant dependence between leadership styles of
enrollment managers who have differing levels of education.
H06: There is no statistically significant dependence between leadership styles of
enrollment managers who have differing years of leadership experience.

55
H07: There is no mean difference in the actual enrollment of the institution and the
institution’s enrollment management leadership style.
Procedures for Data Collection
Participants were employed by both two-year and four-year institutions, public
and private, and were members of the Southern Association of Collegiate Registrars and
Admissions Officers (SACRAO). The Membership Committee of SACRAO provided, at
no charge, a list of all members that included the employee’s name, physical address, and
e-mail address. Participants did not receive any type of remuneration.
Those members, who were charged with enrollment management activities, as
identified by job title and function, received a survey via e-mail. The survey,
accompanied by a cover letter that requested and explained the importance of their
participation, was e-mailed to the survey sample. The e-mail message also provided
instructions for completing the survey, including a URL to access the survey instrument.
Participants who did not complete the survey within two weeks received a follow up
message requesting their participation
Confidentiality
To protect the confidentiality of participants, no one other than the researcher had
access to completed surveys. Data from completed surveys was entered into SPSS,
however no identifying information was included. Because this research proposal
required participation of human subjects, permission from the Texas Tech University

56
Office of Research Services was obtained prior to implementing the study.
Data Analysis
To examine the leadership styles of enrollment managers, descriptive statistics
were calculated for all variables. For quantitative variables, the mean, median, and
minimum score, maximum score, and standard deviation were calculated and identified
for the entire sample. Graphical techniques, including histograms and box plots, also
aided in the interpretation of data. Qualitative variables were summarized via the use of
frequencies. Bar graphs graphically display any relevant characteristics of these
qualitative variables. All statistical procedures were performed at the 0.05 significance
level.
To assess H01, a test of proportion was used. Proportion, as defined by Hinkle,
Wiersma, and Jurs (2003) is “the fractional part of a group that possesses some specific
characteristic” (p.738). The character of interest for this hypothesis was the
transformational leadership style of enrollment managers. Assumptions of this test
included approximately normal distributions for the predicted proportions. This
assumption can be assumed true if the numbers who possess the characteristic are at least
five and those who do not possess the characteristic is also at least five. For H02 through
H06, χ2 tests of independence were used to measure relationships between the variables.
χ2 was designed to test hypotheses about categorical data (Kranzler & Moursund, 1999).
χ2 assumed all expected frequencies were equal to or greater than one and, at most, 20
percent of the expected frequencies were less than five. H07 made use of the t-Test for

57
independent samples. The primary purpose of the test “is to determine whether the
means of two groups of scores differ to a statistically significant degree” (Kranzler &
Moursund, 1999, p. 89). Basic assumptions of this statistical measure include:
(1) independent data, (2) equal standard deviations between groups, and (3) the mean of
the data follow a normal distribution. The Central Limit Theorem can also be utilized to
guarantee that the mean of the data is normal if the sample size is reasonably large. To
assess the assumption of equal standard deviations in institutional enrollment between the
two leadership style groups, Levene’s Test of Equal Standard Deviations was used. If
Levene’s test was significant (indicating the standard deviations differ), degrees of
freedom were adjusted.

58
CHAPTER IV
ANALYSIS OF THE DATA
Introduction
This chapter presents statistical analyses of the data collected to address research
questions. First, the research hypotheses are reviewed. A description of the population
and sample is provided, followed by an explanation regarding classification of the
participants. A presentation of summary statistics for all variables under consideration in
the study is also included. Finally, the findings from the statistical procedures that have
been applied to the data are presented.
Review of the Research Hypotheses
The research hypotheses for this study are as follows:
H01: There is no statistically significant evidence to conclude that there are more
transactional leaders than transformation al leaders acting as enrollment
managers.
H02: There is no statistically significant dependence between leadership style of male
and female enrollment managers.
H03: There is no statistically significant dependence between leadership styles of
enrollment managers at two-year and four-year institutions.
H04: There is no statistically significant dependence between leadership style of
enrollment managers at private and public institutions.

59
H05: There is no statistically significant dependence between leadership styles of
enrollment managers who have differing levels of education.
H06: There is no statistically significant dependence between leadership styles of
enrollment managers who have differing years of leadership experience.
Ho7: There is no mean difference in the actual enrollment of the institution and the
institution’s enrollment management leadership style.
Population and Sample
To make a judgment in regard to the research hypotheses, the Multifactor
Leadership Questionnaire (MLQ) Form 5X – Short (Revised) was e-mailed to 397
participants, which comprise the population under consideration in this study. In total,
203 surveys were returned which represents a 51% response rate. Of the 203 responses,
118 (58%) were enrollment managers who supervised undergraduate admissions and
financial aid. These 118 sample participants make up the sample that will be analyzed in
detail; all 118 participants in the sample provided usable data since incomplete surveys
were not accepted.
Classification of the Participants
The MLQ 5X does not rigidly classify the respondents as either transformational
or transactional leaders. It indicates which participants exhibit behaviors that are
consistent with transformational leadership or behaviors that are consistent with
transactional leadership. In order to answer the research questions specified in this study,

60
this rigid classification was necessary. The Multifactor Leadership Questionnaire (3rd
ed.) Manual and Sampler Set provides descriptive statistics, including the mean, standard
deviation, and range, for all leadership factors. The leadership factors of idealized
influence (attributed and behavioral), inspirational motivation, intellectual stimulation
and individualized consideration characterize transformational leadership. Contingent
reward, management-by-exception (active and passive), and laissez-faire are associated
with transactional leadership. To classify leadership style, a participant’s scores from
each individual factor (e.g. idealized influence or inspirational motivation) were totaled.
Next, the mean scores of all transformational factors and of all transactional factors were
calculated, thus enabling the researcher to classify a participant as either a
transformational or transactional in leadership style. Participants were classified as
having transformational leadership style if their overall transformational score was
greater than the sample mean transformational score. All other participants were
classified as having transactional leadership style.
Summary Statistics
The level of significance (alpha, α) for this study is .05. Behavioral science
researchers frequently use a higher level of significance, such as α = .05 or α = .10,
because it reduces the probability of making a Type II error (Hinkle, Wiersma, & Jurs,
2003). Thus, smaller significance levels, such as α = .01, reduce the probability of
making a Type I error (Hinkle, Wiersma, & Jurs, 2003; Weiss, 2002). Errors in
hypothesis testing, as defined by Hinkle, Wiersma, & Jurs (2003), are:

61
Type I error – “rejecting a null hypothesis when in fact it is true” (p. 740).
Type II error – “retaining a null hypothesis when in fact it is false” (p. 740).
The level of significance (α = .05) was selected after evaluating the consequences
of both Type I and Type II errors. Because this study seeks to identify the trend in
leadership style, it is important to reject a null hypothesis if is false (Hinkle, Wiersma, &
Jurs, 2003).
The following summary statistics describe the sample and lend insight to the
statistical findings that will be presented in the following section. The summary statistics
include frequencies and percentages for qualitative data. For quantitative data, the
summary statistics will include means, standard deviations, minimum and maximum
values, and medians.
Of the 118 sample participants, 66 (55.9%) were classified as having
transformational leadership style and 52 (44.1%) were classified as having transactional
leadership style. Because the research questions focus on the possible differences
between these two groups of leaders, the following summary statistics will be provided
based on the respective groups.
Gender
Table 4.1 provides the frequency distribution by gender for each of the leadership
styles. With respect to gender, 55.9% of the respondents were male and 44.1% of the
respondents were female. If each leadership style is considered individually, insight into
research hypothesis H02 can be gained. For the males included in the study, 51.5% were

62
transformational and 48.5% were transactional. For the females, 61.5% were classified
as having transformational leadership style and 38.5% were classified as having
transactional leadership style. Therefore, the sample considered here was roughly split
between the leadership styles for the men, and the women had a slight tendency to be
more transformational. The χ2-test in the following section will determine if this is a
significant tendency.
Table 4.1: Gender by Leadership Style
Leadership Style
Gender Transactional Transformational Total
Male 32 34 66
Female 20 32 52
Total 52 66 118
Two-Year/Four-Year Institutions
Information to address H03 was gained from the variable referring to the highest
academic credential offered by the employing institution. The responses for this variable
are shown in Table 4.2. For the one “other” response, more detail was given. This
institution offers medical, law and other doctorate degrees. Note that the hypothesis only
distinguishes between two-year and four-year institutions. Therefore, these data were
recoded as follows: (a) institutions whose highest credential offered was the associate
degree were grouped into the two-year institution category, and (b) institutions that

63
offered baccalaureate degrees and beyond were grouped into the four-year institution
category.
Table 4.2: Highest Academic Credential Offered
Highest Credential Frequency
Other 1
Associate 19
Baccalaureate 23
Master’s 37
Doctorate 31
Law 1
Medical 3
Professional 3
Results of the two-year or four-year classification by leadership style are
identified in Table 4.3. For the entire sample, 16.1% of the institutions represented in the
sample are two-year and 83.9% are four-year. Of the sample participants from two-year
institutions, 52.6% were categorized as having transactional leadership style and 47.4%
were categorized as having transformational leadership style. 42.4% of the sample
participants from four-year institutions were categorized as having transactional
leadership style and 57.6% were categorized as having transformational leadership style.

64
Table 4.3: Two-Year or Four-Year Institution by Leadership Style
Leadership Style
Two-Year or Four Year
Transactional Transformational Total
2-Year 10 9 19
4- Year 42 57 99
Total 52 66 118
Public Versus Private Institutions
Of the 118 participants, 66 (55.9%) were from public institutions and 52 (44.1%)
were from private institutions. Of the 52 private institutions, only one was for profit.
Table 4.4 displays the institution type by leadership style, according to the MLQ 5X, of
the enrollment manager. Of the sample participants from public institutions, 42.4% were
categorized as having transactional leadership style and 57.6% were categorized as
having transformational leadership style. Of the sample participants from private
institutions, 46.2% were categorized as having transactional leadership style and 53.8%
were categorized as having transformational leadership style.
Table 4.4: Public or Private Institution by Leadership Style
Leadership Style Institution Transactional Transformational Total
Public 28 38 66 Private 24 28 52
Total 52 66 118

65
Educational Level
The educational levels of the enrollment managers in the sample included
Baccalaureate (8), Master’s (61), Doctorate (46) and Professional (3) degrees. A purpose
of this study is to determine whether a relationship exists between an enrollment
manager’s level of education and their leadership style. The frequencies that address this
possible relationship are shown in Table 4.5. Breaking each educational level into the
leadership styles represented in the sample, the following information is found. Of the
sample participants who have earned a Baccalaureate degree, 37.5% were categorized as
having transactional leadership style and 62.5% were categorized as having
transformational leadership style, while those who have earned a Master’s degree, 45.9%
were categorized as having transactional leadership style and 54.1% were categorized as
having transformational leadership style. 41.3% of sample participants who have earned
a Doctorate were categorized as having transactional leadership style, while 58.7% were
categorized as having transformational leadership style. For sample participants who
have obtained a Professional degree, 66.7% were categorized as having transactional
leadership style and 33.3% were categorized as having transformational leadership style.

66
Table 4.5: Educational Level by Leadership Style
Leadership Style
Educational Level Transactional Transformational Total
Baccalaureate 3 5 8
Master’s 28 33 61
Doctorate 19 27 46
Professional 2 1 3
Total 52 66 118
Supervisory Experience
The participants were asked about their years of supervisory experience. Possible
responses were ordinal with the following choices: less than one year, more than one
year but less than four years, more than four years but less than eight years, more than
eight years but less than twelve years, more than twelve years but less than sixteen years,
more than sixteen years but less than twenty years, and more than twenty years. No
participants reported less than one year of supervisory experience; every other category
had at least one response. Table 4.6 displays the years of supervisory experience for the
enrollment managers by their leadership styles. The percentages of sample participants
who were categorized as either having transactional leadership style or transformational
leadership style by years of supervisory experience are: More than one year but less than
four years – 0% transactional, 100% transformational; (b) More than four years but less
than eight years – 33.3% transactional, 66.7% transformational; (c) More than eight years
but less than twelve years – 46.7% transactional, 53.3% transformational; (d) More than

67
twelve years but less than sixteen years – 71.4% transactional, 28.6% transformational;
(e) More than sixteen years but less than twenty years – 29.2% transactional and 70.8%
transformational; and (f) More than twenty years – 41.5% transactional and 58.5%
transformational.
Table 4.6: Years of Supervisory Experience by Leadership Style
Leadership Style
Years of Supervisory Experience
Transactional Transformational Total
More than 1 but less than 4 0 2 2
More than 4 but less than 8 1 2 3
More than 8 but less than 12 7 8 15
More than 12 but less than 16 15 6 21
More than 16 but less than 20 7 17 24
More than 20 22 31 53
Total 52 66 118
Institutional Enrollment
The only quantitative variable collected from the respondents was institutional
enrollment. Specifically, student headcount for the fall 2004 term of the respondent’s
institution was requested. Some data clean up was required for this variable as several
participants responded with total semester credit hours (SCH) instead of total student
headcount. For respondents who provided an e-mail address, the researcher verified

68
institutional enrollment via the institution’s web page. For those respondents who did not
provide an e-mail address, SCH responses were converted to student headcount. Table
4.7 displays the summary statistics of means, standard deviations, minimum and
maximum values, and medians for the entire sample as well as for the transactional
leaders and the transformational leaders. In observing the table, it appears that an outlier
exists in the student headcount where the response was entered as zero. Institutional
enrollment was a free response variable, thus participants could enter the number zero.
This particular participant did not include an e-mail address, therefore, the researcher
could not verify institutional enrollment.
Table 4.7: Summary Statistics of Institutional Enrollment for Fall 2004.
Headcount Statistics:
Mean Standard Deviation
Minimum Maximum Median
Overall Sample 8804.14 10216.38 0 55090 4276.00
Transactional 7779.02 8964.19 0 41248 4000.00
Transformational 9611.80 11105.03 215 55090 4586.50
Statistical Findings
Hypothesis 1
To test the first null hypothesis that there is no statistically significant evidence to
conclude that there are more transactional leaders than transformation leaders acting as
enrollment managers, as identified by the MLQ 5X, a test of proportions was used. From
the respondents, the sample proportion of participants classified as having transactional

69
leadership style was 0.441. (Recall that 52 participants were classified as having
transactional leadership style and 66 were classified as having transformational
leadership style.) Based on this sample proportion, there is not sufficient evidence to
reject the null hypothesis (z = 1.204, p = 0.8857). Thus, there is no statistical support to
claim that more participants displayed transactional leadership style than transformational
leadership style.
Hypothesis 2
A Chi-Square Test of Independence was the statistical procedure employed to test
the second null hypothesis of no statistically significant dependence between leadership
style of male and female enrollment managers. Figure 4.1 graphically represents the
percent of males and females who are classified as by leadership style. There are slight
differences in the heights of the bars in both the male category and the female category.

70
48.5
38.5
51.5
61.5
0
10
20
30
40
50
60
70
Male Female
Gender
Perc
ent Transactional
Transformational
Figure 4.1: Leadership Style by Gender
Table 4.8 shows the frequencies of the leadership styles by gender, including the
expected cell counts, which are pertinent to the Chi-Square test. Based on the sample
data, there is not sufficient evidence to reject the null hypothesis (χ2 = 1.186, df = 1,
p=0.276). Note that there are no expected cell counts that are less than 5. This ensures
that the Chi-Square test is valid. Based on findings of this study, there is no statistical
support of a dependent relationship between leadership style and male and female
enrollment managers.

71
Table 4.8: H02 Cell Counts (Expected Cell Counts)
Leadership Style
Gender Transactional Transformational Total
Male 32 (29.1) 34 (36.9) 66
Female 20 (22.9) 32 (29.1) 52
Total 52 66 118
Hypothesis 3
A Chi-Square Test of Independence was also applied to the data in order to test
the third hypothesis of no statistically significant dependence between leadership styles
of enrollment mangers at two-year institutions and four-year institutions. Details of the
groupings used to identify an institution as either two-year or four-year were provided in
the summary statistics section. Figure 4.2 graphically displays the percent of sample
participants’ leadership style dependent on whether they were employed by a two-year or
four-year institution. As evidenced by the graph, the bars within the two-year institutions
are similar in height and the bars within the four-year institutions are similar in height.

72
52.6
42.447.4
57.6
0
10
20
30
40
50
60
70
Two-Year Four-Year
Two-Year or Four-Year Institution
Perc
ent Transactional
Transformational
Figure 4.2: Leadership Style by Two or Four-Year Institution
Table 4.9 shows the respondents classified by both their leadership style and
whether their institution is either two-year or four-year along with the expected cell
counts. Based on results of this study, there is not sufficient evidence to reject this null
hypothesis (χ2=0.674, df=1, p=0.412). Since the minimum expected cell count is 8.4, no
expected cell counts are less than 5. Hence, there is no statistical support of a dependent
relationship between the enrollment manager’s leadership style and whether the
institution is two-year or four-year.

73
Table 4.9: H03 Cell Counts (Expected Cell Counts)
Leadership Style
Two-Year or Four Year
Transactional Transformational Total
2-Year 10 (8.4) 9 (10.6) 19
4- Year 42 (43.6) 57 (55.4) 99
Total 52 66 118
Hypothesis 4
To test the hypothesis of no statistically significant dependence between
leadership style of enrollment mangers at private and public institutions, a Chi-Square
Test of Independence was utilized. Figure 4.3 indicates that the percentages of the
sample population as categorized as having transactional leadership style or
transformational leadership style are equitable within the private institutions and within
the public institutions. Table 4.10 shows the respondents classified both by their MLQ
5X leadership style and whether their institution is either public or private; expected cell
counts are also included. Based on these results, there is not sufficient evidence to reject
this null hypothesis (χ2 = 0.164, df = 1, p = 0.685). No expected cell counts are less than
5. Hence, there is no statistical support of a dependent relationship between leadership
style of enrollment managers at private and public institutions.

74
46.242.4
53.857.6
0
10
20
30
40
50
60
70
Private Public
Private or Public Institution
Perc
ent
TransactionalTransformational
Figure 4.3: Leadership Style by Public or Private Institution
Table 4.10: H04 Cell Counts (Expected Cell Counts)
Leadership Style
Institution Transactional Transformational Total
Public 28 (29.1) 38 (36.9) 66
Private 24 (22.9) 28 (29.1) 52
Total 52 66 118
Hypothesis 5
Chi-Square Test of Independence was used to test the null hypothesis of no
statistically significant dependence between leadership styles of enrollment managers

75
who have differing levels of education. To obtain a valid p-value for this test, several χ2
values were computed. First, the entire set of 118 respondents was used. Figure 4.4
shows the percent of transformational and transactional leaders, as identified by the MLQ
5X, within each educational level. This figure indicates that leadership styles are equally
distributed across the educational levels. This test consisted of eight cells, as there were
four educational levels (baccalaureate, master’s, doctorate and professional) for each of
the two leadership styles. With this test, there were four expected cell counts that were
less than 5. In the sample, there were only three participants with professional degrees
and eight with baccalaureate degrees. Dividing these small sample sizes into the two
leadership styles caused several cells to have expected cell counts less than 5, thus
resulting in an invalid Chi-Square test. Several attempts were made to categorize in such
a way that the expected cell counts would all be at least 5. However, these attempts were
unsuccessful. (Although the Chi-Squares were not valid, all resulted in p-values greater
than 0.05.)
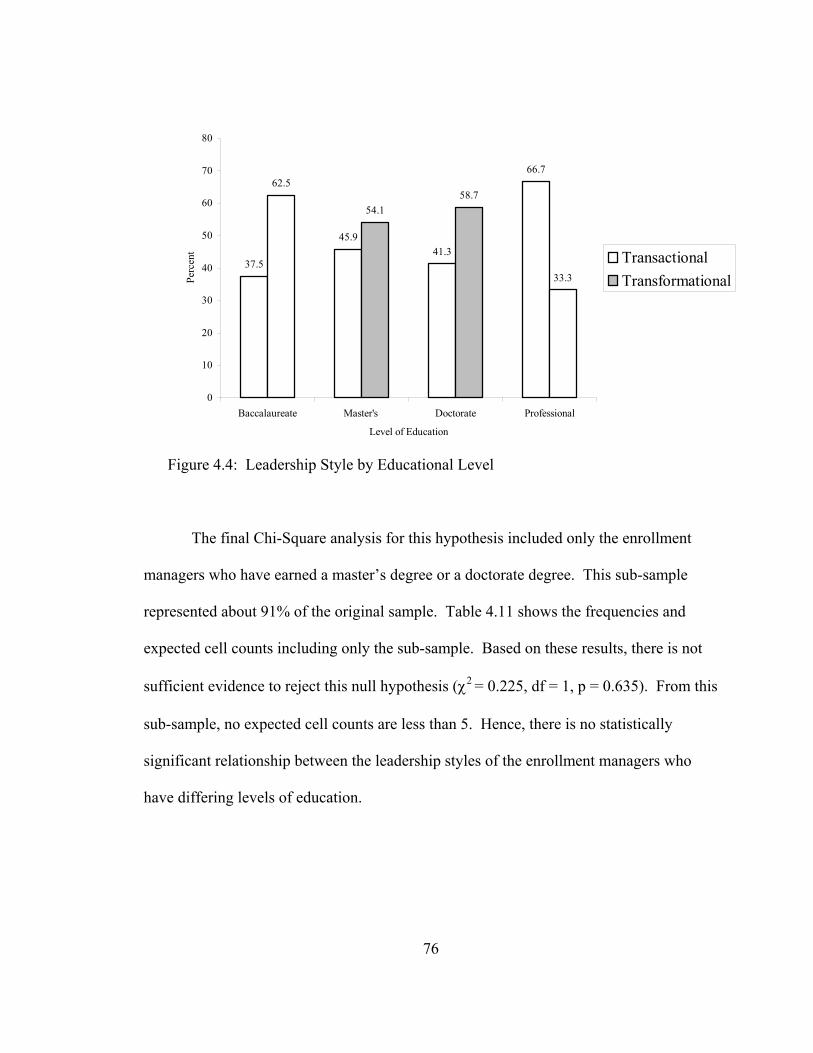
76
37.5
45.941.3
66.762.5
54.158.7
33.3
0
10
20
30
40
50
60
70
80
Baccalaureate Master's Doctorate Professional
Level of Education
Perc
ent Transactional
Transformational
Figure 4.4: Leadership Style by Educational Level
The final Chi-Square analysis for this hypothesis included only the enrollment
managers who have earned a master’s degree or a doctorate degree. This sub-sample
represented about 91% of the original sample. Table 4.11 shows the frequencies and
expected cell counts including only the sub-sample. Based on these results, there is not
sufficient evidence to reject this null hypothesis (χ2 = 0.225, df = 1, p = 0.635). From this
sub-sample, no expected cell counts are less than 5. Hence, there is no statistically
significant relationship between the leadership styles of the enrollment managers who
have differing levels of education.

77
Table 4.11: H05 Cell Counts (Expected Cell Counts)
Leadership Style
Institution Transactional Transformational Total
Master’s 28 (26.8) 33 (34.2) 61
Doctorate 19 (20.2) 27 (25.8) 46
Total 52 66 118
Hypothesis 6
The final Chi-Square Test of Independence included in this study addresses the
sixth null hypothesis of no statistically significant dependence between leadership styles
of enrollment managers who have differing years of leadership experience. Figure 4.5
shows the percentages of sample participants categorized as transformational leadership
style and transactional leadership style within each experience category.

78
0
33.3
46.7
71.4
29.2
41.5
100
66.7
53.3
28.6
70.8
58.5
0
20
40
60
80
100
120
>1<4 >4<8 >8<12 >12<16 >16<20 >20
Years of Supervisory Experience
Perc
ent
TransactionalTransformational
Figure 4.5: Leadership Style by Years of Experience
Similar to the hypothesis test concerning educational levels, this test of hypothesis
also encountered expected cell counts less than 5. This was due to the small sample sizes
in the lower years of experience. To alleviate this problem, several options were
attempted. First, the categories of more than one year but less than four years and more
than four years but less than eight years were combined. Again, there were expected cell
counts of less than 5. Next, all experience years less than 12 were combined. Table 4.12
shows the frequencies and expected cell counts for this hypothesis after the above-
mentioned categories were combined. Based on these results, there is sufficient evidence
to reject this null hypothesis (χ2 = 8.815, df = 3, p = 0.032). No expected cell counts are
less than 5. Hence, there is statistical support of a dependent relationship between

79
leadership styles of enrollment managers who have differing years of leadership
experience. In reviewing Table 4.12, it appears that enrollment managers are more likely
to be categorized as having transformational leadership style as their years of supervisory
experience increases.
Table 4.12: H06 Cell Counts (Expected Cell Counts) – Using a Combined Category of
More than 1 But Less than 12. Leadership Style
Years of Supervisory Experience Transactional Transformational Total More than 1 but less than 12 8 (8.8) 12 (11.2) 20 More than 12 but less than 16 15 (9.3) 6 (11.7) 21 More than 16 but less than 20 7 (10.6) 17 (13.4) 24 More than 20 22 (23.4) 31 (29.6) 53
Total 52 66 118
Another Chi-Square Test of Independence was performed for the years of
supervisory experience. In this test, the categories of “more than one but less than four”
and “more than 4 but less than eight” were omitted. Table 4.13 identifies these
frequencies and expected cell counts. Based on these results, there is sufficient evidence
to reject this null hypothesis (χ2 = 8.630, df = 3, p = 0.035). No expected cell counts are
less than 5. Again, there is statistical support of a dependent relationship between an
enrollment manager’s years of supervisory experience and their leadership style. As in
the previous analysis, it appears that participants in the sample population have a
tendency to be categorized by the MLQ 5X as having transformational leadership style as
their years of supervisory experience increases.

80
Table 4.13: H06 Cell Counts (Expected Cell Counts) – Omitting Years of Experience
Less than Eight.
Leadership Style Years of Supervisory Experience Transactional Transformational Total More than 1 but less than 12 7 (6.8) 8 (8.2) 20 More than 12 but less than 16 15 (9.5) 6 (11.5) 21 More than 16 but less than 20 7 (10.8) 17 (13.2) 24 More than 20 22 (23.9) 31 (29.1) 53
Total 52 66 118
Hypothesis 7
A two-sample independent t-test was used to test the final null hypothesis of no
mean difference in the actual enrollment of the institution and the institution’s enrollment
management leadership style. The respondent’s institutional student headcount for fall
2004 was used to estimate the institution’s enrollment. Figure 4.6 displays the error bar
plots for these data. Before conducting the t-test, Levene’s test for equality of variances
determined that it could be concluded that the standard deviations of enrollment for the
two different leadership styles are equal (F = 2.111, p = 0.149). Therefore, the t-test was
conducted assuming that the two groups have equal standard deviations in enrollment
numbers. The mean enrollment for participants classified as having transactional
leadership style was 7779.02 and the mean enrollment for participants classified as
having transformational leadership style was 9611.80. Based on the results of the
independent samples t-test, there is not sufficient evidence to conclude that the mean
enrollment of institutions with transactional leaders differs from that of institutions with
transformational leaders (t = 0.967, df = 116, p = 0.335).

81
6652N =
Leadership Style
TransformationalTransactional
Hea
dcou
nt
14000
12000
10000
8000
6000
4000
Figure 4.6: Headcount by Leadership Style
Conclusion
Chapter IV illustrated the statistical analyses of data collected from survey
participants. Selection criteria that required participants to supervise the undergraduate
admissions office and financial aid office reduced the number of completed surveys that
were used in the analysis of data. Results of 118 participants, from a total of 203
participants who completed surveys, were used to accept or reject the research
hypotheses of this study. Participants were classified as either having transactional
leadership style or transformational leadership style. The level of significance for this
study was α = .05. Descriptive statistics were calculated for all variables. For
quantitative variables, the mean, median, minimum score and maximum score, and

82
standard deviation were calculated and identified for the entire sample. Chi-square (χ2)
independence tests were used to measure relationships between qualitative variables and
a t-Test for independent samples was used to determine if the difference between the
means of two groups was statistically significant. Chapter V will include a summary of
the study, discussion of the findings, and recommendations for future research.

83
CHAPTER V
CONCLUSIONS AND RECOMMENDATIONS
The primary purpose of this study was to identify the leadership style of
enrollment management professionals at higher education institutions in the following
states: Alabama, Arkansas, Florida, Georgia, Kentucky, Louisiana, Mississippi, North
Carolina, Oklahoma, South Carolina, Tennessee, Texas and Virginia. Data from the
Multifactor Leadership Questionnaire, Form 5X (MLQ 5X) was used to categorize
participants as either transactional leaders or transformational leaders. This chapter
provides a summary of the study, discussion, recommendations for future research, and
conclusions.
Summary of the Study
The premise of this study was to determine transactional or transformational
leadership styles of enrollment management professionals. Transactional leadership is
based on exchange; reward or punishment is used as an incentive to manipulate followers
into performing (Avolio & Bass, 2002). Transformational leadership is defined as “the
ability to influence values, attitudes, beliefs, and behaviors of others by working with and
through them to accomplish the college’s mission and purpose” (Roueche, Baker, &
Rose, 1989, p. 11). Enrollment management, as defined by Dennis (1998), is
(a) recognizing why students enroll or withdraw, (b) knowing how students finance
educational expenses, (c) connecting enrollment management with retention, and

84
(d) utilizing strategic planning to enable the institution to meet future enrollment and
revenue requirements. Enrollment management has expanded from primarily facilitating
student enrollments, to include marketing, recruitment, financial aid, advising,
registration, retention, and even instruction. An enrollment manager must frequently
integrate numerous collegiate functions in an effort to influence enrollment (Black, 2001;
Dennis, 1998). Given the extensive responsibilities of the job, Bradica (2001) reminds
enrollment managers that an interdependent relationship with colleagues may be
necessary to achieve and sustain goals.
Because the concept of enrollment management is relatively new to higher
education, information about individuals who lead these efforts is virtually non-existent.
This study provides information that may be used to form a knowledge base regarding
this population. To assess leadership style, participants completed the MLQ 5X; results
were analyzed to form demographic and leadership profiles. The MLQ 5X identifies the
transactional and transformational leadership components of the Full Range Leadership
Theory (FRLT). Transactional leadership includes the following factors: contingent
reward, management-by-exception (active), management-by-exception (passive), and
laissez-faire leadership. Transformational leadership includes the following factors:
idealized influence (attributed), idealized influence (behavior), inspirational motivation,
intellectual stimulation, and individualized consideration. The survey instrument was
e-mailed to participants on two separate occasions. The sample size was 397, of which
203 (51%) responded by submitting a completed survey. Of the 203 responses, 118

85
participants (58%) met the selection criteria (supervised the undergraduate admission
office and the financial aid office) and comprised the sample population.
The following research questions were posed to facilitate the study:
1. What are the leadership styles of enrollment managers?
2. Is there a relationship between leadership style and gender in enrollment
managers?
3. Is there a relationship between leadership style and two-year/four-year institution
status in enrollment managers?
4. Is there a relationship between leadership style and private/public institution
status in enrollment managers?
5. Is there a relationship between leadership style and level of education in
enrollment managers?
6. Is there a relationship between leadership style and leadership experience level in
enrollment managers?
7. Is there a difference in the actual enrollment (student headcount) of the institution
and the institution’s enrollment management leadership style?
The survey instrument, MLQ 5X, has been used extensively in research.
Antonakis, Avolio, and Sivasubramaniam (2003) examined the validity of the MLQ 5X
and found the instrument to be valid in measuring leadership styles of both male and
female leaders. Additionally, the leadership constructs with respect to the relationship
with performance has been confirmed in meta-analyses conducted by several researchers
(Bass & Avolio, 2000; Catanyag, 1995; Geyer & Steyrer, 1998; Lowe, et al., 1996;

86
Molero & Morales, 1994). The meta-analyses confirmed the relationship between a
leader’s performance and transformational leadership style was stronger than the
relationship between a leader’s performance and transactional leadership style (Bass &
Avolio, 2004; Dum Dum, Lowe, & Avolio, 2002; Fuller, Patterson, Hester & Stringer,
1996; Gasper, 1992; Lowe, Kroeck & Sivasubramaniam, 1996).
Results gleaned from this study suggest there is not a statistically significant
association between leadership style and the participants’ gender (p = 0.276), their type
of institution (two-year or four-year, p = 0.412; public or private, p = 0.685), and their
levels of education (p = 0.635). Additionally, an independent samples t-test
demonstrated that leadership style and fall 2004 student headcount at the employing
institution were not related (p = 0.335). There was, however, statistical support of a
dependent relationship between leadership style, as categorized by the MLQ 5X, of
enrollment managers who have differing years of experience (p = 0.032).
Discussion
Statistical calculations, including Chi-Square Test of Independence, Levene’s test
for equality, and a two-sample independent t-test were used to evaluate the data and
answer the research questions.
Research Question 1
What are the leadership styles of enrollment managers?

87
This question was designed to determine the leadership style of enrollment
managers. The responses to the MLQ 5X identified the majority of participants were
classified as transformational leaders (55.9%). However, even though 66 participants
from the total sample of 118 were categorized as transformational, the result was not
statistically significant at the .05 level, hence; the null hypothesis was not rejected.
Unlike the findings in the study, research conducted by Padde, et al. (1995) and Stone
(1992) report statistically significant evidence that suggests leaders are more likely to
utilize transformational leadership styles. Temple (2001) also reports community college
technical deans perceive their leadership style as transformational.
As mentioned earlier, enrollment management is relatively new to higher
education. While there is literature discussing the concept of enrollment management,
there are virtually no studies examining individuals who lead enrollment efforts. Rosser
(2001) explains the majority of leadership studies have centered on senior administrators
such as presidents, provosts, and chief academic affairs officers. This study focused on
enrollment managers from the Southern United States. Based on findings of this study,
leadership theory and behavior norms from existing literature may not be generalized to
this population.
The narrow definition of enrollment management used in this study may have
influenced the response in relation to this research question. Participants in this study
were leaders who supervised the undergraduate admissions office and the financial aid
office, two highly bureaucratic functions within enrollment management.
For example, many of the procedures of an undergraduate admission office are

88
influenced by external agencies. Procedures for determining state residency are specified
by state agencies, and enrollment managers do not have the discretion to recommend
residency policy for students. It is important to assign accurate residency status as this
determines student tuition and fee charges; certain financial aid programs also hinge on
residency. Incorrect residency decisions create liabilities for both the student and the
institution.
Another bureaucratic function within the scope of enrollment management is the
student financial aid office. Personnel in this office must award student aid programs in
accordance with the guidelines that govern the administration of state and federal aid.
While college employees must ensure aid applicants meet eligibility criteria, they are not
given latitude in determining eligibility criteria of recipients; federal methodology, as
determined by the U.S. Department of Education is applied to all Title IV aid
applications. The resulting analysis of a student’s academic and financial status defines a
student’s aid eligibility or lack thereof. Furthermore, external agencies also prescribe
additional eligibility criteria in the form of enrollment requirements and satisfactory
academic progress standards that students must meet in order to receive funding. It is
imperative that the financial aid office correctly award aid programs as they are subject to
federal and state audits. Grants awarded outside the confines dictated by the Department
of Education may create financial liabilities for the student and the institution.
Because these two offices are governed by strict regulations, the directors who
supervise the offices on a daily basis gain expertise in their field, thus the enrollment
managers may interact with them less often. If the enrollment manager views the

89
directors as experts, capable of managing the offices, they may intervene only in the
event of a problem. Intervention when a deviation from the norm occurs is symbolic of
transactional leadership. Therefore, the researcher speculates that the bureaucratic nature
of these offices may encourage leaders to rely on leadership techniques of contingent
reward and management-by-exception.
Enrollment management is an emerging concept with several models in existence.
Henderson (2001) explains that models range from loosely coupled committees to entire
divisions dedicated to managing student enrollment. The committee model is noted for
convenience as it is comprised of representatives from relevant departments, and does not
require additional funding or the hiring of specialized personnel. While this model does
promote discussion, it usually does not have the authority to affect change. Enrollment
management divisions, on the other hand, require the allocation of fiscal and personnel
resources. The institution gains additional benefits from this model as participants share
and pursue common goals and objectives. This model is placed high on the organization
chart and the leader frequently reports directly to the president of the institution.
By examining the models mentioned above, one can surmise that very different
individuals may be selected to lead the enrollment management effort. One model
utilizes the services of existing personnel who must split their time between duties, while
the other designates personnel specifically for the task of enrollment management.
Because the committee model makes use of current personnel, an individual with
enrollment management experience may not be available. However, when an institution
establishes an enrollment management division, one might posit that they would also

90
seek to hire a highly trained and qualified individual to lead the effort. Based on the
information stated above, one might conclude that enrollment management leaders vary
in their skill set and commitment to the enrollment management process.
Adoption of a specific enrollment management model is not mandated by
accreditation agencies nor is there a universally accepted set of requisite skills for this
group of leaders. Numerous enrollment management models, coupled with nebulous
qualifications for enrollment management leaders, may account for a diverse group of
individuals who have less education and supervisory experience than other
administrators, and consequently are less likely to be classified as transformational
leaders.
Research Question 2
Is there a relationship between leadership style and gender in enrollment
managers?
Research question two sought to determine if gender influenced leadership style.
Results from this study show that female participants were more likely to be labeled
transformational leaders than were male participants. 61.5% of the female participants
were identified as having transformational leadership style, while only 51.5% of males
were identified as having transformational leadership style. Daughtry and Finch (1997)
and Davis (2002) did not find a relation between gender and leadership style, even
though female participants were more often identified as transformational leaders.
Gilligan (1982), who has extensively researched the moral development of

91
females, criticized prior research regarding moral development because (a) results were
based on white males, and (b) a male’s tendency to think in terms of rules and justice was
considered superior to a female’s tendency to think in terms of caring and relationships.
A single model of reasoning patterns and stages of moral development fails to capture the
different realities of each gender (Chliwniak, 1997). Gilligan’s (1982) moral
development pathway asserts that women and men have differing moral and
psychological inclinations. Race, ethnicity, socioeconomic status, and family all
contribute to the psychological development of girls. Gilligan (1982) concludes that girls
lose a firm sense of self and authentic voice as they move from childhood into
adolescence because they are silenced by the male culture. Women adopted male
standards of success to better fit into male-dominated hierarchical structures and systems
(Chliwniak, 1997). Gilligan agrees that women suppress their natural self in order to
meet standards determined by society.
Despite the increasing body of literature on female leaders, few studies have
empirically examined gender differences from a subordinate perspective (Rosser, 2001);
many studies report only self-perceived leadership style. Rosser (2001), in evaluating
leadership style of post-secondary deans, solicited self-reported evaluations of leadership
and also included subordinate, or follower, perceptions of the dean’s leadership style.
Results suggest that female leaders are perceived as more effective than male leaders. In
comparison to males, Bass et al. (1996) report female leaders are more frequently labeled
effective, transformational, and responsible for generating greater follower satisfaction;
this is based on both male and female follower perceptions of leaders. Cannon’s (2003)

92
research does not support the notion that female leaders are more effective, instead
proposes that existing research supports the conclusion that women possess different
leadership traits or characteristics.
Gilligan, Ward, Taylor (1988) report that female leaders tend to emphasize factors
associated with transformational leadership and male leaders tend to emphasize factors
associated with transactional leadership. Gillet-Karam (2001) reminds researchers that
leadership style may be assessed via multiple measures and “women arrive at their
responsibilities through care and concern while men focus on a path of justice” (p. 167).
Roueche et al. (1989) report that transformational leadership and “the concept of caring
and respect for others was significantly correlated with gender” (p. 250) with females
scoring higher transformational leadership scores. While Taylor (1994) acknowledges
that research supports differences in leadership style of men and women, any effect of
these differences on operations has not been identified.
Research Question 3
Is there a relationship between leadership style and two-year/four-year institution
status in enrollment managers?
Two-year institutions reported more enrollment managers as having transactional
leadership style (52.6%) than did four-year institutions (42.4%). Although the finding
was not significant (p = 0.412) and suggests that leaders at two-year institutions do not
differ from leaders at four-year institutions, future research may determine if institutions
that offer terminal degrees below the baccalaureate level tend to employ (a) individuals

93
who have not earned a doctorate and (b) do not have extensive supervisory experience
since level of education and supervisory experience have been linked to leadership style
(Birnbaum, 1992; Ireh & Bailey, 1999; Padde, et al., 1995).
Although two-year schools currently enroll more than 11 million students
(Community College Facts, n.d.), community colleges are often criticized as being
inferior educational institutions (Cohen & Brawer, 1996). Community colleges are
generally categorized as “open enrollment” institutions and may not actively seek to
influence the characteristics of a student population, but rather respond to enrollment
changes. Another possible explanation is that because community colleges may be
considered less prestigious than four-year schools, they may not attract individuals who
have advanced degrees and supervisory experience. This conjecture is supported by the
findings of this study as two-year institutions more frequently employed individuals who
were classified as having transactional leadership style.
Despite the absence of literature that specifically discusses leadership style of
enrollment managers at two-year/four-year institutions, insight to this hypothesis may be
gained by reviewing literature that evaluates perceived leadership styles of other
administrators within these institutions. Haire (1997), Leftwich (2001), and Temple
(2001) report that leaders within two-year institutions are more likely to be categorized as
having transformational leadership style. However, their findings, like those of this
study, did not show a statistically significant relationship.
Romero (2004) posits that leading a two-year school is complex and demands the
qualities of a transformational leader. The multiple purposes of most two-year

94
institutions require leaders who are able to form collaborative relationships in order to
accomplish diverse purposes. While Romero’s study does not specifically address
leadership style of enrollment managers, the focus of the report and its emphasis on
leadership within two-year institutions, allow the recommendations to be generalized to
the participants of this study. According to Romero (2004), two-year institutions should
seek to employ leaders who share power and are able to build relationships with faculty
and industry alike. Collaborative decision-making is associated with intellectual
stimulation, a factor of transformational leadership.
Deans within four-year institutions, as reported by Rosser, Johnsrud, & Heck
(2003), must satisfy dual populations including senior administration and faculty. This
ability to influence followers and senior administrators is also required of enrollment
management leaders. To facilitate this duality of influence, they suggest leadership
effectiveness may be enhanced through interpersonal transactions, which is related to the
transformational leadership factor, individualized consideration. Although Rosser et al.
do not discuss leadership styles of enrollment managers, the findings of their study focus
on a group of mid-level administrators that may be applicable to the participants of this
study.
Research Question 4
Is there a relationship between leadership and private/public institution status in
enrollment managers?
This study found that 57.5% of the participants who are employed by public

95
institutions were identified as having transformational leadership style, while 53.8% of
the participants who are employed by private institutions were identified as having
transformational leadership style. Again, no statistically significant relationship was
found between leadership style of enrollment mangers at private and public institutions (p
= 0.685). Results suggest that leaders at private institutions are virtually the same as
leaders at public institutions.
The researcher did not locate literature that compares leadership style of
enrollment managers at private institutions and public institutions. In this study, there
was almost equal representation of types of institutions (44.1% private, 55.9% public)
and types of leaders (44.3% transactional, 55.7% transformational) employed by the
institutions. Even though there is no literature upon which to compare results, the
findings from this study suggest institutional type does not influence leadership style of
the enrollment manager. To gain insight to this hypothesis, the researcher evaluated
literature that details preferred leadership traits of other types of leaders within
private/public institutions.
The main funding source of many private colleges is derived from students in the
form of tuition, fees, room, and board payments; fiscal health may depend on enrolling a
sufficient number of students each semester (Williams, 1989). Private institutions may
be more successful in meeting institutional goals if they employ leaders who are well
versed in fiscal management, marketing, and recruiting (Williams, 1989). This skill set is
expanded by Sattler (1999) who also suggests leaders of private institutions build
relationships with internal and external communities, empower coworkers, communicate

96
a vision, and encourage pursuit toward a common mission. These factors are associated
with transformational leadership style. Therefore, one may speculate that an enrollment
leader who uses a transformational leadership style will have greater success in leading a
private institution. Although public institutions receive funding from local, state, and
public entities, one can argue that leaders within public institutions would benefit from
the same leadership characteristics as mentioned above. Leaders of public institutions
monitor legislative proceedings and may seek to influence appropriations by lobbying,
testifying, and communicating institutional needs to elected officials. Additionally,
public institutions, like private, must engage personnel in the pursuit of stated goals.
Based on the existing body of literature in support of leadership, transformational
leadership style should promote these endeavors.
Research Question 5
Is there a relationship between leadership style and level of education in
enrollment managers?
The purpose of this research question was to determine if enrollment managers’
highest academic credentials (e.g. Associate, Baccalaureate, Master’s, Doctorate, or
Professional) influenced leadership style. Leadership style and level of education were
not associated (p = 0.635), thus the null hypothesis was not rejected. Davis (2002), who
reports no association between perceived leadership style and level of education, also
supports this finding. However, results from Padde, et al. (1995), who also used the
Multifactor Leadership Questionnaire to evaluate leadership style, reports that leaders
97
with higher educational credentials were more frequently identified as having
transformational leadership style. Birnbaum (1992) concurs, reporting that leaders with
higher educational qualifications score higher transformational leadership scores.
Most studies have focused on chief executive officers, who as a group are more
likely to have earned a doctorate (Rosser, 2001). Only 39% of the participants in this
study have earned doctorates, compared to 76.4% of college presidents (Corrigan, 2002).
Therefore, this study’s finding of no statistical significance between leadership style and
level of education may be because no models of leadership theory have been established
for enrollment managers or mid-level administrators, who as a group do not
predominately hold doctoral degrees.
Research Question 6
Is there a relationship between leadership style and leadership experience level in
enrollment managers?
Results from this study demonstrated an association between years of supervisory
experience and leadership style. As years of supervisory experience increases,
participants tend to become more transformational in leadership style. This finding was
statistically significant, thus the null hypothesis was rejected (χ2 = 8.815, df = 3, p =
0.032). Ireh & Bailey (1999), who report that leaders with more years of supervisory
experience are more likely to use transformational leadership style, also support this
finding.

98
Early research sought to explain leadership by identifying leadership traits or
characteristics of an individual. Birnbaum (1992) states, “the idea that leaders have
certain characteristics or traits that differentiate them from nonleaders is one of the oldest
and most thoroughly researched notions about leadership” (p. 62). Stogdill (1974) and
Mann (1959) conclude that trait theory research produced confusing results because a
combination of traits proved effective in some groups of leaders, while they were
ineffective in others. The failure of the trait theory to identify leaders led to new era of
leadership studies that eventually began to consider that leaders could be made and must
not be born with an innate ability to lead.
Transforming leaders are known for their ability to motivate and energize
followers into a common vision that identifies lofty goals for the organization (Krill, et
al., 1997). The relationship between a transformational leader and followers encourages
performance that exceeds expectations of all parties (Burns, 1978; Day, Zaccaro, &
Halpin, 2004). Transformational leadership has been shown to be positively related to
performance (Bass, 1985; Dvir, Eden, Avolio, & Shamir B., (2002).
Results from this study suggest that as leaders gain experience, they become more
transformational in leadership style. Therefore, one could posit that leadership is a
learned skill and the more experience one has the better equipped he or she is to serve as
a leader who is capable of using transformational leadership to inspire followers to
achieve superior performance.
Additional insight to understanding how leadership style and years of experience
are associated may be gained by reviewing classic stage theory within the context of

99
developmental psychology. Erikson (1959) wrote that with more experience, human
behavior is influenced by life stage and crisis resolution. Erikson proposed psychosocial
stages through which people move to resolve successive identity crises. Successful
resolution of the stage crises at any particular chronological age enables a person to move
forward to the next natural stage of human development. Erikson (1959) supports the
notion leadership can be enhanced depending on the developmental stage of a person. He
contends that people pass through stages where work becomes very important and the
desire to guide the next generation creates a need to nurture and care for others.
Erikson’s Stage Theory (1959) profiled eight stages through which people
normally move as they age across the life span. From birth to death, he described periods
of the human life that people move through, facing common crises of identity and
conflicts of development. Of particular interest for purposes of this research are the adult
stages of Intimacy vs. Isolation and Generativity vs. Stagnation. During Stage 6,
Intimacy vs. Isolation, adults form relationships with others, which in turn promote the
growth of identity and personality. Stage 7, Generativity vs. Stagnation, refers to concern
for the next generation. If adults do not successfully navigate this stage, they become
stagnate.
These psychosocial stages may influence leadership style development of leaders.
For example, the crisis of Intimacy vs. Isolation is whether a person is willing to be
involved with others on a deeper more relationship-driven level, as opposed to a person
who prefers a more isolated position. Isolation may restrict their ability to form close
relationships and subsequently may encourage a transactional leadership style.

100
Utilization of this style is acerbated by isolation associated with Stage 6 as the individual
interacts with followers as little as possible. Contrast this with a leader who is willing to
reveal himself/herself to followers, experiencing an enhanced connection with others, by
building deeper relationships that foster opportunities for the development of a
transformational relationship.
Generativity vs. Stagnation is the next stage in Erikson’s theory of development.
Thought by most social scientists to occur between the ages of 35 and 55, this crisis
resolution relies upon a person’s willingness to be intimate with others in a variety of
relationships; a person’s work is fundamental to this stage. Viewing the potential for
persons in leadership positions, it could be said that this crisis of development, if resolved
positively, results in a leader’s ability to be more caring and more nurturing to followers;
the concepts of caring and nurturing are associated with transformational leadership.
These leaders encourage followers to grow and develop leadership skills and are also
concerned with guiding and shaping the next generation of leaders. Generativity, or a
concern for future generations, represents successful resolution of this stage. However,
without resolution, stagnation will occur and an individual becomes self-absorbed and
disconnected from others.
“Erikson’s theory is a loose connection of observation, empirical generalizations,
and abstract theoretical claims. Consequently, it is difficult to state his claims in a way
that can be tested or relate his empirical findings to more abstract levels of the theory”
(Miller, 2002, p. 160). Because we cannot draw conclusions that Erikson’s Stage Theory
of development is responsible for the evolution of transformational behaviors, it leads

101
one to speculate if other factors foster development of additional or enhanced leadership
skills.
A review of the literature surrounding leadership development suggests that
specific events and relationships can improve leadership skills. Wonacott (2001)
reviewed 17 leadership development programs and reported that participants could
improve leadership skills and behaviors when they participated in structured development
programs and were actively engaged in the learning process. Furthermore, the level of
improvement was enhanced by team-building exercises, networking opportunities,
establishment of goals, and the participant’s commitment to increasing leadership ability.
The following experiences reportedly provide opportunities for individuals to develop or
hone leadership skills and behaviors: (a) the acquisition of new positions (jobs) with
additional responsibilities; (b) assuming responsibility for new projects; (c) negotiating
personnel problems, including conflict resolution and termination of employees;
(d) being actively mentored and counseled; and (e) consistently working, and engaging,
with a supervisor. These learning opportunities help leaders build self-confidence,
improve communication skills, develop sensitivity and respect for others, and encourage
the adoption of a global perspective of the institution (Wonacott, 2001). These leadership
behaviors are associated with transformational leadership, therefore, one could posit that
leadership must not be an innate ability, but can be taught and learned. Thus, as this
study suggests, leaders become more transformational as experience is gained.
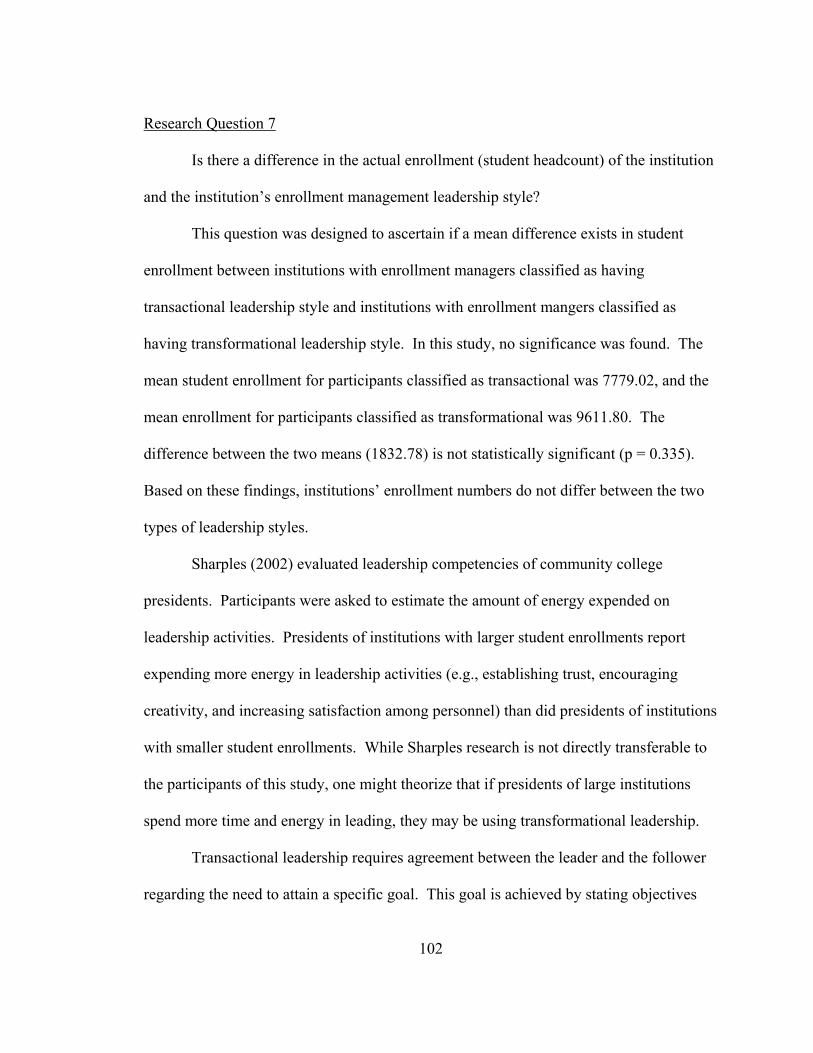
102
Research Question 7
Is there a difference in the actual enrollment (student headcount) of the institution
and the institution’s enrollment management leadership style?
This question was designed to ascertain if a mean difference exists in student
enrollment between institutions with enrollment managers classified as having
transactional leadership style and institutions with enrollment mangers classified as
having transformational leadership style. In this study, no significance was found. The
mean student enrollment for participants classified as transactional was 7779.02, and the
mean enrollment for participants classified as transformational was 9611.80. The
difference between the two means (1832.78) is not statistically significant (p = 0.335).
Based on these findings, institutions’ enrollment numbers do not differ between the two
types of leadership styles.
Sharples (2002) evaluated leadership competencies of community college
presidents. Participants were asked to estimate the amount of energy expended on
leadership activities. Presidents of institutions with larger student enrollments report
expending more energy in leadership activities (e.g., establishing trust, encouraging
creativity, and increasing satisfaction among personnel) than did presidents of institutions
with smaller student enrollments. While Sharples research is not directly transferable to
the participants of this study, one might theorize that if presidents of large institutions
spend more time and energy in leading, they may be using transformational leadership.
Transactional leadership requires agreement between the leader and the follower
regarding the need to attain a specific goal. This goal is achieved by stating objectives

103
that the follower must accomplish in order to reap a reward or punishment (Roueche,
Baker, & Rose, 1989). Once the exchange is completed, there is no further need to
interact unless another process of contingent reward is introduced (Avolio & Yammarino,
2002; Baker, 1992). Conversely, transformational leadership is a multifaceted approach
and requires the leader to maintain frequent contact with followers. Transformational
leaders (a) create learning opportunities for followers, (b) empower them to solve
problems as a means of fostering leadership skills, and (c) encourage efforts that exceed
expectations of all parties (Burns, 1978; Day, Zaccaro, & Halpin, 2004; Gronn, 1997).
Transformational leaders also strive to build confidence in followers, thereby converting
them into leaders (Tichy & Devanna, 1996). These activities require time and effort from
the leader.
Recommendations for Future Research
The following recommendations for future research are offered in an attempt to
explore further the leadership style of enrollment managers within higher education.
1. One weakness of this study is that only the self-perceived leadership style of the
leader was solicited. A study should be conducted to include participation of the
leaders’ followers. Previous research has shown that leaders tend to perceive
themselves as exhibiting transformational behaviors at a slightly higher level than
do their followers (Haire, 1997; Hardy, 1999; Leftwich, 2001; Roueche, Baker &
Rose, 1989). By soliciting the participation of the leader’s followers, the

104
researcher could compare the leader’s self-perceived leadership style to the
perception of the follower.
2. Several published studies indicate that female leaders are more likely to be
identified as transformational leaders than are their male counterparts (Avolio &
Bass, 2004; Bass et al., 1996; Eagly et al., 2003; Padde, et al., 1995; Roueche et
al., 1989). Given the geographic limitation of the southern United States, the
researcher recommends that a study be conducted nationwide in order to
determine if gender is related to leadership style.
3. Previous research reports that transformational leadership is positively correlated
with follower satisfaction with the leader, effectiveness of the leader, role clarity,
mission clarity, openness of communication, and superior outcomes for the
organization (Avolio & Yammarino, 2002; Burns, 1978; Day, Zaccaro, & Halpin,
2004; Padde et al, 1995). The study presented here should be expanded to include
evaluation of leadership style of enrollment managers in relation to satisfaction of
followers.
4. Wonacott (2001) and Watts & Hammons (2002) suggest that leadership
development can promote the development of transformational leadership
behaviors and characteristics in participants. The leadership style of enrollment
managers who have participated in leadership development programs should be
assessed to determine if they are more likely to use transformational behaviors.
5. Future research should evaluate the association of leadership style with age and
years of supervisory experience, of leadership style with gender and years of

105
supervisory experience, and of leadership style with ethnicity and years of
supervisory experience.
6. This study categorized participants as transactional leaders or as transformational
leaders. Future research should be conducted to determine if enrollment
managers use a combination of transactional and transformational leadership
styles. It has been suggested that effective leaders are not purely transactional or
transformational, but blend both styles (Antonakis & House, 2002; Barnett &
McCormick, 2004; Birnbaum, 1992; Dum Dum, Lowe, & Avolio, 2002).
7. This study should be conducted to include an expanded definition of enrollment
management. Leaders within enrollment management who supervise offices
other than undergraduate admissions and financial aid should be evaluated for
leadership style. The bureaucratic functions of undergraduate admissions and
financial aid may have influenced leadership style of the participants.
8. A career pathway to enrollment management leadership positions has not been
identified. To understand leadership styles of this population, it may behoove
educators to analyze the path by which one achieves an enrollment management
position. Studies to document the pathway to leadership positions with
enrollment management should be conducted.
9. A study should be conducted to assess current models of enrollment management
and its placement in the organizational chart. Additionally, leadership style of the
enrollment management leader should be assessed to determine if there is an

106
association between leadership style and the model of enrollment management at
the employing institution.
10. Although results of this study did not demonstrate an association between
leadership style and type of institution, two-year schools did report a higher
percent of transactional leaders. Future study should be conducted to determine if
there is a correlation between leadership style and the type of institution.
11. Future research should include a national study to determine if there is a
relationship between leadership style and geographic location. By conducting a
national study, the sample size would increase, thus creating more opportunity for
significant p-values.
Conclusions
A lack of documented research regarding profiles and leadership styles of
enrollment managers spurred this research project. Survey data, gathered via the
MLQ 5X, were used to gain insight to seven research questions.
There was statistical support of a dependent relationship between the leadership
style of participants and their years of supervisory experience, thus the null hypothesis
was rejected. The association between leadership style and years of supervisory
experience is important because it coincides with other research that concludes leaders
tend to become more transformational as they gain experience. Additionally, this finding
lends credence to the theory that leadership behaviors and characteristics can be learned
and change with time, training, and experience.

107
This finding is important for post-secondary administrators. It provides a basis
upon which administrators may justify the allocation of resources for leadership
development. Watts & Hammons (2002) alert higher education to an impending leader
shortage primarily due to planned retirements. In an effort to ensure adequate leadership
for the future, colleges and universities should support, develop, and incorporate
leadership development programs. Results from this study suggest that leadership style is
related to years of experience. One can surmise that a leader with more years of
experience has also had increased interaction with coworkers, more opportunity to solve
complex problems, more contact with individuals who have served both formally and
informally as mentors, and progressive experience with new responsibilities, thereby
facilitating the acquisition, or evolution, of a transformational leadership style.
Leadership development programs that include activities that emulate real-world
experiences may expedite the growth of transformational behaviors, hence allowing
leaders to develop more quickly. This is desirable as transformational leadership is
associated with improved personnel performance and satisfaction.
Non-statistical results from this study were also identified. Findings suggest there
was not a statistically significant association between leadership style and the
participant’s gender, the type of institution (either two-year or four-year; public or
private), or the level of education. The lack of correlation between leadership style and
the variables might have been influenced by characteristics in the survey population. The
researcher speculates results gleaned from this study deviated from the norm established
by previous leadership research for the following reasons.

108
As a whole, the sample had fewer earned doctorates than did most groups who
have historically been included in the study of leadership theory. The majority of
leadership studies have focused on presidents and other chief administrators who
are more likely to have earned a doctoral degree (Rosser, 2001). Leadership
studies have reported a correlation between leadership style and level of education
(Birnbaum, 1992; Padde, et al., 1995).
This sample was equitably comprised of men and women. Historically, women
have not been equally represented in most leadership studies; thus prior
conclusions of leadership behavior were based predominately on male
characteristics (Cannon, 2003). Results from this study may be attributable to the
inclusion of equitable proportions of men and women, or gender may not be
related to the leadership styles of enrollment managers. Chliwniak (1997)
reminds us that a single model of reasoning fails to capture the different realities
of each gender.
There is no universally adopted model of enrollment management. While
organizational structure may differ between institutions, most will have a
president and senior administrative body that assume responsibility for
administering key functions of the college. However, enrollment management
models are not firmly entrenched in organizational structure, thus they may vary
considerably. Models that require minimal institutional commitment include an
enrollment management committee. At the opposite end of the spectrum, models
that support the maintenance of an enrollment management division require

109
significant resources. Institutions that use loosely structured models, such as a
committee or coordinator, are less likely to place major emphasis on the
enrollment management concept, and therefore may be less likely to attract an
experienced leader with advanced academic credentials.
Results from this study contribute to the body of literature on the leadership styles
of individuals whose main responsibility lies within enrollment management. Prior to
hiring an individual to lead an enrollment management initiative, the researcher
recommends institutions evaluate and select an enrollment management model that is
reflective of the level of commitment to the process. The type of enrollment management
model adopted should guide the selection process in hiring an enrollment leader.
Because transformational leadership is credited with achieving superior performance
from employees, thereby creating greater opportunity for achievement of stated goals,
findings from this study provide a rationale for (a) hiring an individual with more
supervisory experience, and/or (b) the inclusion of leadership development programs to
promote the acquisition of transformational leadership skills within current personnel.

110
REFERENCES
Anderson, J.A. (1997). Leadership training initiatives for community college administrators: A focused synthesis of the literature. Community College Review, 24(4), 27-50.
Antonakis, J., Avolio, B.J., & Sivasubramaniam, N. (2003). Context and leadership: An examination of the nine-factor full-range leadership theory using the multifactor leadership questionnaire. The Leadership Quarterly, 14(3), 261-295.
Antonakis, J. & House, R.J. (2002). The full-range leadership theory: The way forward. In B.J. Avolio & F.J. Yammarino (Eds.), Transformational and charismatic leadership: The road ahead. (pp. 3-34). Kidlington, OX: Elsevier Science, Ltd.
Avolio, B.J. (1999). Full leadership development: Building the vital forces in organizations. Thousand Oaks, CA: Sage.
Avolio, B.J. (2004). Examining the full range model of leadership: Looking back to transform forward. In D.V. Day, S.J. Zaccaro, & S.M. Halpin (Eds.), Leader development for transforming organizations (pp. 71-98). Mahway, NJ: Lawrence Erlbaum Associates.
Avolio, B.J. & Bass, B.M. (1991). The full-range leadership development. Center for Leadership Studies, Binghamton, NY.
Avolio, B.J. & Bass, B.M. (2002). Developing Potential Across Full Range of Leadership. Mahwah, NJ: Lawrence Erlbaum Associates, Inc.
Avolio, B.J., Waldman, D.A., & Yammarino, F.J. (1991). Leading in the 1990s: The four I (prime)s of transformational leadership. Journal of European Industrial Training, 15(4), 11-19.
Avolio, B.J. & Yammarino, F.J. (Eds.). (2002). Transformational and charismatic leadership: The road ahead. Oxford, UK: Elsevier Science, Ltd.
Baker, G. A. (1992). Cultural Leadership. Washington, DC: Community College Press.
Barnett, K. & McCormick, J. (2004). Leadership and individual principal-teacher relationships in schools. Educational Administration Quarterly, 40(3), 406-434.
Barry, D. A. (2002). Job satisfaction and leadership style: A study of Michigan high school principals (Doctoral dissertation, Western Michigan University, 2002). Dissertation Abstracts International, 63, 3063.

111
Bass, B.M. (1974). The substance and the shadow. American Psychologist, 29, 870-886.
Bass, B. M. (1985). Leadership and performance beyond expectations. Cambridge, MA: Harvard University Press.
Bass, B. M. (1990). Bass & Stogdill’s handbook of leadership: Theory, research & managerial applications (3rd ed.). New York: The Free Press.
Bass, B.M. (1998). Transformational leadership: Industrial, military, and educational impact. Mahway, NJ: Lawrence Erlbaum Associates, Inc.
Bass, B.M. & Avolio, B.J. (1993). Transformational leadership: A response to critiques. In M.M. Chemers & R. Ayman (Eds.). Leadership theory and research. Perspectives and directions (pp. 49-80). New York: Academic Press.
Bass, B.M. & Avolio, B.J. (1994). Improving organizational effectiveness through transformational leadership. Thousand Oaks, CA: Sage Publications.
Bass, B.M. & Avolio, B.J. (2000). Effects on platoon readiness of transformational/transactional platoon leadership. Final Report. (Contract DASW01-96K-0008, U.S. Army Research Institute for the Behavioral and Social Sciences, March 2000.)
Bass, B.M. & Avolio, B.J. (2004). Multifactor leadership questionnaire: Manual and sampler set. Redwood City, CA: Mind Garden Publications
Bass, B.M. Avolio, B.J., & Atwater, L. (1996). The transformational and transactional leadership of men and women. Applied Psychology: An International Review, 45, 5-34.
Bass, B.M., Avolio, B.J., Jung, D.L., & Berson, Y. (2003). Predicting unit performance by assessing transformational and transactional leadership. Journal of Applied Psychology, 88(2), 207-218.
Bennis, W. & Nanus, B. (1985). Leaders: The strategies for taking charge. New York: Harper & Row.
Bhal, K.T., & Ansari, M.A. (2000). Managing dyadic interactions in organizational leadership. New Delhi: Sage Publications.
Birnbaum, R. (1992). How academic leadership works. San Francisco: Jossey-Bass.
Black, J. (Ed.). (2001). The strategic enrollment management revolution. Washington, DC: American Association of Collegiate Registrars and Admissions Officers.

112
Blake, R.R., & Mouton, J. S. (1964). The managerial grid. Houston: Gulf.
Bodfish, S.E, (2002). 2001-2002 National enrollment management survey. (Available from Noel-Levitz, 6300 South Syracuse Way, Suite 645, Centennial, CO 80111).
Bottery, M. (2001). Globalisation and the UK Competition state: No room for transformational leadership in education? School Leadership and Management, 21(2), 199-218.
Bradica, J.E. (2001). Enrollment management: An interdependence model. Retrieved September 1, 2004, from http://www.newfoundations.com/OrgTheory/Bradica721.html.
Bryman, A. (1986). Leadership and organizations. Boston, MA: Routledge & Kegan Paul.
Burns, J.M. (1978). Leadership. New York: Harper and Row.
Cannon, D. Glen (2003). Desired leadership attributes of Georgia technical college presidents (Doctoral dissertation, University of Georgia, 2003). Dissertation Abstracts International, 64 (02A), 346.
Catanyag, D.V. (1995). Effects of transformational leadership behaviors of public secondary principals in the national capital region on school effectiveness. Unpublished doctoral dissertation, University of the Philippines, Manila.
Chemers, M.M. (1997). An integrative theory of leadership. Mahwah, NJ: Lawrence Erlbaum Associates.
Chliwniak, Luba (1997). Higher education leadership: Analyzing the gender gap, ERIC Identifier: ED410846, Publication number: 1997-00-00.
Cohen, A.M. & Brawer, F.B. (1996). The American community college. San Francisco, CA: Jossey-Bass, Inc., Publishers.
Community College Facts. (n.d.). Retrieved from http://www.aacc.nche.edu/Content/NavigationMenu/AboutCommunityColleges/Fast_Facts1/Fast_Facts.htm
Corrigan, M.E. (2002). the American college president. Washington, DC: American Council on Education, Center for Policy Analysis.
Crockett, K. (2003, June). Essentials of enrollment management. Paper presented at the meeting of the Noel-Levitz North American Enrollment Management Institute, Vail, CO.

113
Croomes, M.D. (2000). The historical roots of enrollment management. New Directions for Student Services, 89, 5-18.
Daft, Richard L. (1999). Leadership: Theory and practice. Fort Worth, TX: Dryden Press.
Daughtry, L.H. & Finch, C.R., (1997). Effective leadership of vocational administrators as a function of gender and leadership style. Journal of Vocational Education Research, 22(3), 173-186.
Davis, D.J. (2002). An analysis of the perceived leadership styles and levels of satisfaction of selected junior college athletic directors and head coaches. The Sports Journal, 5(2), Summer 2002.
Day, D.V., Zaccaro, S.J., & Halpin, S.M. (Eds.). (2004). Leader development for transforming organizations: Growing leaders for tomorrow. Mahwah, NJ: Lawrence Erlbaum Associates.
Dean, P. (1986). A critical incident study investigating the perceived effective and ineffective behaviors of Iowa community college presidents. (Doctoral dissertation, The University of Iowa, 1896). Dissertation Abstracts International, 51, 2578.
Dennis, M. J. (1998). A practical guide to enrollment and retention management in higher education. Westport, CT: Bergin & Garvey.
Dessler, G. (1995). Managing organizations in an era of change. Fort Worth, TX: Dryden Press.
Dixon, R. R. (1995). What is enrollment management? New Directions for Student Services, 71, 5-10.
Dixon, R. R. (1995). Enrollment management in the future. New Directions for Student Services, 71, 89-98.
Dolence, M.G. (1993). Strategic enrollment management: cases from the field. Washington, DC: American Association of Collegiate Registrars and Admissions Officers.
Dum Dum, R., Lowe, K.B., & Avolio, B.J. (2002). A meta-analysis of transformational and transactional leadership correlates of effectiveness and satisfaction: An update and extension. In B.J. Avolio & F. J. Yammarino (Eds.), Transformational and charismatic leadership: The road ahead, 2, (pp. 35-66). Oxford, U.K: Elsevier Science.

114
Dvir, T., Eden, D. Avolio, B.J., & Shamir B. (2002). Impact of transformational leadership on follower development and performance: A field experiment. Academy of Management Journal, 45(4), 735-744.
Eagly, A.H., Johannesen-Schmidt, M.C., & Van Enger, M.L. (2003). Transformational, transactional, and laissez-faire leadership styles: A meta-analysis comparing men and women. Psychological Bulletin, 129, 569-591.
Erikson, E.H. (1959). Identify and the life cycle. Psychological issues (Monograph No. 1). New York: International University Press.
Eugene Emerson Jennings. (1961). The anatomy of leadership. Management of Personnel Quarterly Ann Arbor, 1(1), 2-8.
Evans-Johnson, E. (1970). Urban executive leadership development for black professionals (Doctoral dissertation, University of Southern California, 1970). Dissertation Abstracts International, 31, 3010.
Fairholm, G.W. (1998). Perspectives on leadership: From the science of management to its spiritual heart. Westport, CT: Quorum Books.
Farris, G.F. & Lim, F.G. (1969). Effects of performance on leadership, cohesiveness, influence, satisfaction, and subsequent performance. Journal of Applied Psychology, 53(6), 490-497.
Fiedler, F.E. (1967). A theory of leadership effectiveness. New York: McGraw-Hill.
Florio, D.H. (1976, August). Declining enrollment. Paper presented at the meeting of the National School Boards Association, Washington, DC.
Franklin, J.L. (1975). Relations among four social-psychological aspects of organizations. Administrative Science Quarterly, 20(3), 422-433.
Fuller, J.B., Patterson, C., Hester, K., & Stringer, D.Y. (1996). A quantitative review of research on charismatic leadership. Psychological Reports, 78, 271-287.
Gasper, S. (1992). Transformational leadership: An integrative review of the literature (Doctoral dissertation, Western Michigan University, 1992). Dissertation Abstracts International, 53 (08A), 2619.
Geyer, A.L., & Steyrer, J. (1998). Transformational leadership, classical leadership dimensions and performance indicators in savings banks. Leadership Quarterly, 47, 397-420.

115
Gillet-Karam, R. (2001). Community college leadership: Perspectives of women as presidents. Community College Journal of Research & Practice, 25(3), 167-171.
Gilligan, C. (1982). In a different voice: Psychological theory and women’s development. Cambridge, MA: Harvard University Press.
Gilligan, C., Ward, J.V., & Taylor, J.M. (Eds.) (1988). Mapping the moral domain: A contribution of women’s thinking to psychological theory and education. Cambridge, MA: Harvard University Press.
Gronn, P. (1997). Leading for learning: Organizational transformation and the formation of leaders. Journal of Management Development, 16(4), 274-283.
Gulley, H.E. (1960). Discussion, conference, and group process. New York: Holt, Rinehart and Winston, Inc.
Haire, C.M. (1997). Transformational leadership and continuous quality improvement in community colleges (Doctoral dissertation, North Carolina State University, 1997). Dissertation Abstracts International, 58 (03A), 0710.
Hardy, F. W. (1999). Presidential and follower assessment of leadership style and its relationship to organizational climate (Doctoral dissertation, North Carolina State University, 1999). Dissertation Abstracts International, 61, 2620.
Henderson, S.E. (2001). On the brink of a profession. In J. Black (Ed.), Strategic Enrollment Management Revolution (pp. 3-36). Washington, DC: American Association of Collegiate Registrars and Admissions Officers.
Hersey, P. & Blanchard, K.H. (1977). Management of organizational behavior: Utilizing human resources. Englewood Cliffs, JF: Prentice-Hall.
Hinkle, D.E., Wiersma, W., & Jurs, S.G. (2003). Applied statistics for the behavioral sciences (5th ed.). NY: Houghton Mifflin Company.
Holda, W.M. (1995). Leader-follower congruence: An analysis of community college presidential leadership (Doctoral dissertation, Texas A & M University at Commerce, 1995). Dissertation Abstracts International, 56, 3424.
Hoover, N.R. (1991, April). Transformational and transactional leadership: An empirical test of a theory. Paper presented at the annual meeting of the American educational research association in Chicago, IL.
Hossler, D. (1986). Creating effective enrollment management systems. New York: College Entrance Examination Board.

116
Hossler, D. & Hoezee, E. (Eds.). (2002). Enrollment management prediction model [Electronic version]. The Enrollment Management Review, 18(1).
House, R. J. (1971). A path-goal theory of leader effectiveness. Administrative Science Quarterly, 16, 321-326.
House, R.J. & Mitchell, T.R. (1974). Path-goal theory and leadership. Journal of Contemporary Business, 3, 81-97.
Hoy, W.K., & Miskel, C.G. (1991). Educational administration: Theory, research, and practice. New York: McGraw Hill.
Huddleston, T. (2001). Building the enrollment organizational model. In J. Black (Ed.), Strategic enrollment management revolution (pp. 3-36). Washington, DC: American Association of Collegiate Registrars and Admissions Officers.
Huddleston, T. & Rumbough, L. P. (1997). Evaluating the enrollment management organization. College and University, 72(4), 2-5.
Ireh, M., & Bailey, J. (1999). A study of superintendents’ change leadership styles using the situational leadership model. American Secondary Education, 27(4), 22-32.
Jennings, Eugene Emerson (1961). The anatomy of leadership. Management of Personnel Quarterly, 1(1), 2-10.
Jonas, Peter M. and Popovics, Alexander J. (2000). Beyond the enrollment management division: the enrollment management organization. College and University, 76 (2), 3-8.
Kranzler, G. & Moursund, J. (1999). Statistics for the terrified. Upper Saddle River, NJ: Prentice Hall.
Krill, T.L, Carter, R.I., & Williams, D.L. (1997). An exploration of the leadership practice enabling others to act: A case study. Journal of Agricultural Education, 38(4), 42-49.
Leftwich, Philip Robbins. (2001). Transformational leadership at the department chair level in North Carolina community colleges (Doctoral dissertation, North Carolina State University, 2001). Dissertation Abstracts International, 62, 534B.
Lewin, K.U., Lippitt, R., & White, R.K. (1939). Patterns of aggressive behavior in experimentally created social climates. Journal of Social Psychology, 10, 271-299.

117
Lipham, J.M. (1973) The relationship of organizational structure to organizational adaptiveness in elementary schools. Report from the Project on Organization for Instruction and Administrative Arrangements. Madison: University of Wisconsin, Wisconsin Research and Development Center for Cognitive Learning,
Lowe, K.B., Kroeck, G., & Sivasubramaniam, N. (1996). Effectiveness correlates of transformational and transactional leadership: A meta-analytic review. Leadership Quarterly, 1, 385-426.
Mabry, T.N. (1987). Enrollment management (Report No. 400-86-0051). Washington, DC: Office of Educational Research and Improvement. (ERIC Document Reproduction Service No. ED286558)
Maguire, J. (1976). To the organized go the students, Bridge Magazine, XXXIX (1). Boston: Boston College.
Mann, F.C. (1959). A review of the relationships between personality and performance in small groups. Psychological Bulletin, 56, 241-270.
Marks, H.M. & Printy, S.M. (2003). Principal leadership and school performance: An integration of transformational and instructional leadership. Educational Administration Quarterly, 39(3), 370-397.
Megginson, L.C, Mosley, D.C., & Pietri P.H. (1989). Management, concepts and applications. New York: Harper & Row.
Miller, P.H. (2002). Theories of developmental psychology (4th Ed.). New York: Worth Publishers.
Mitchell, M.L. & Jolley, J.M. (2000). Research design explained (4th Ed.). Belmont, CA: Wadsworth.
Molero, R. & Morales, J.F. (1994). A study on leadership in a healthcare organization using Bass’ Multifactor Leadership Questionnaire (MLQ). Paper presented at the meeting of the International Congress of Applied Psychology. Madrid, Spain.
Nahavandi, A. (1997). The art and science of leadership. Upper Saddle River, NJ: Prentice Hall.
Owens, R.R. (2001). SED as a driver for institutional change. In J. Black (Ed.), Strategic enrollment management revolution (pp. 111-128). Washington, DC: American Association of Collegiate Registrars and Admissions Officers.

118
Padde, P., Budke, W.E., & McCasslin N.L. (1995). An Evaluation of the Relationship Between Supervisory Techniques and Organizational Outcomes Among the Supervisors in the Agricultural Extension Service in the Eastern Region Districts of Uganda. Ohio State University, Columbus: Department of Agriculture Education. (ERIC Document Reproduction Service No. ED384732)
Penn, G. (1999). Enrollment management for the 21st century: Delivering institutional goals, accountability and fiscal responsibility (Report No. EDO-HE-1999-4). Washington, DC: Office of Educational Research and Improvement. (ERIC Document Reproduction Service No. ED432939)
Romero, M. (2004). Who will lead our community colleges? Change, 36(6), 30-34.
Rosser, V.J. (2001, April). Women and their effectiveness as leaders: What makes the difference among deans. Paper presented that the annual meeting of the American Education Research Association, Seattle, WA.
Roueche, J.E., Baker III, G.A. & Rose, R. R. (1989). Shared vision. Washington, DC: Community College Press.
Sattler, J.L. (1999, February). Surviving the deanship: It plays in peoria or perspectives of a private university dean. Paper presented at the meeting of the American Association of Colleges for Teacher Education Annual Conference, Washington, DC.
Sergiovanni, T.J. (1992). Moral leadership: Getting into the heart of school improvement. San Francisco, CA: Jossey-Bass.
Sharples, R.H. (2002). The importance of leadership competencies: Perceptions of North Carolina community college presidents (Doctoral dissertation, North Carolina State University, 2002). Dissertation Abstracts International, 63, 1238.
Stogdill, R.M. (1948). Personal factors associated with leadership. Columbus: The Ohio State University.
Stogdill, R.M. (1974). Handbook of leadership: A survey of theory and research. New York: Free Press.
Stogdill, R.M. & Coons, A.E. (1957). Leadership behavior: Its description and measurement [Monograph]. Columbus Bureau of Business Research, 88.
Stone, P. (1992). Transformational leadership in principals: An analysis of the multifactor leadership questionnaire results (Report No. 1992-07-00). MN:

119
Mankato State University, MN: Department of Educational Administration. (ERIC Document Reproduction Service No. ED355613)
Summerskill, J. (1962). Dropouts from college. In N. Sanford (Ed.), The American college (pp. 627-654). New York: John Wiley & Sons, Inc.
Tannebaum, R. & Massarik, R. (1968). Leadership: A frame of reference. In D.E. Porter & P.B. Applewhite (Eds.), Organizational behavior and management. Scranton, PA: International Textbook.
Taylor, P. (1994). Leadership in Education. Emergency Librarian, 21(3), 9-18.
Temple, J. (2001). Leadership style of technical deans in American community colleges: a predictive study (Doctoral dissertation, Texas Tech University, 2001). Dissertation Abstracts International, 62, 437.
Thorp, L., Cummins, R., & Hudson, M.B. (1998). Women’s self-perceived leadership skills in a collegiate agricultural education course. Journal of Agricultural Education, 39(1), 55-62.
Tichy, N. & Devanna, R. (1986). Transformational leadership. New York: Wiley.
Tinto, V. (1993). Leaving college: Rethinking the causes and cures of student attrition (2nd ed.). Chicago: University of Chicago Press.
U.S. Census Bureau, http://www.census.gov/population/www/pop-profile/profile.html
Vroom, V.H. & Jago, A.G. (1978). On the validity of the Vroom-Yetton model. Journal of Applied Psychology, 63, p. 152.
Vroom V.H., & Yetton, P.W. (1973). Leadership and decision-making. Pittsburgh: University of Pittsburgh Press.
Wallin, D.L., & Ryan, J.R. (1994). Order out of chaos: Leadership for the 21st century. Community College Journal of Research and Practice, 18(6), 527-538.
Walter, J.E., & Lipham, J.M. (1973). The relationship of organizational structure to organizational adaptiveness in elementary schools. Madison, Wisconsin: University of Wisconsin, Research and Development Center for Cognitive Learning.
Watts, G.E. & Hammons, J.O. (2002). Leadership development for the next generation. New Directions for Community Colleges, 120, 59-69.

120
Williams, D.N. (1989). The survival of private junior colleges (Report No. EDO-JC—89-07). Los Angeles, CA: Office of Educational Research and Improvement. (ERIC Document Reproduction Service No. ED327222)
Wonacott, Michael E. (2001) Leadership Development in Career and Technical Education (Report No. EDO-CE-010225). Washington, DC: Office of Educational Research and Improvement. (Document Reproduction Service No. ED452366)

121
APPENDIX A
PERMISSION TO COPY
THOMPSON PUBLISHING SERVICES
From: "Woods, Amy" <[email protected]> To: 'Tanya Hughes' <[email protected]> Subject: RE: Permission to copy Date: Thu, 2 Dec 2004 16:22:26 -0000 Dear Tanya Hughes Permission is granted for use of the requested material in your forthcoming dissertation, subject to the following conditions: 1. The material to be quoted/produced was published without credit to another source. If another source is acknowledged, please apply directly to that source for permission clearance. 2. Permission is for non-exclusive, English language rights, and covers use in your dissertation only. Any further use (including storage, transmission or reproduction by electronic means) shall be the subject of a separate application for permission. 3. Full acknowledgement must be given to the original source, with full details of figure/page numbers, title, author(s), publisher and year of publication. Yours sincerely Amy Woods Permissions Administrator Tel: +44 (0) 1264 342873 Fax: +44 (0) 1264 342792 -----Original Message----- From: Tanya Hughes [mailto:[email protected]] Sent: 24 November 2004 17:40 To: [email protected] Subject: Permission to copy

122
My name is Tanya Hughes and I am a doctoral student. I am requesting permission to use two charts from the following book: Leadership and Organizations by Bryman, A. (1986). ISBN 0-7102-0324-1. The following number is located under the ISBN 0-7102-0800-6(p). The first chart is entitled The Managerial Grid schema and is on page 76 of the book. The second chart demonstrates "the basic structure of contingency approaches of leadership" (p. 126). I would like to use these in my dissertation. If my dissertation committee approves my proposal and subsequent dissertation, the document would be published (5 copies) with one copy remaining in the institution's library. My e-mail address is [email protected] I await the favor of your reply and appreciate your assistance in this matter. Sincerely, Tanya Hughes

APPENDIX B
PERMISSION TO COPY
MIND GARDEN
123

APPENDIX C
SURVEY LETTER
124
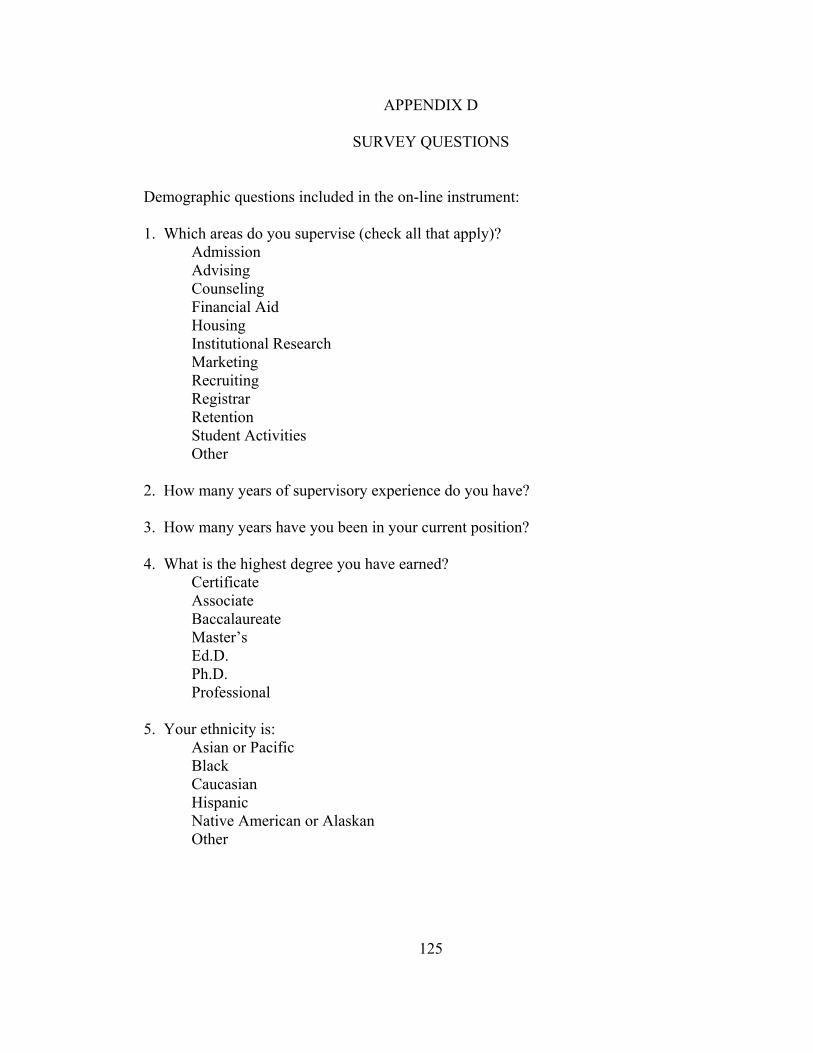
APPENDIX D
SURVEY QUESTIONS
125
Demographic questions included in the on-line instrument:
1. Which areas do you supervise (check all that apply)? Admission Advising Counseling Financial Aid Housing Institutional Research Marketing Recruiting Registrar Retention Student Activities Other
2. How many years of supervisory experience do you have? 3. How many years have you been in your current position? 4. What is the highest degree you have earned?
Certificate Associate Baccalaureate Master’s Ed.D. Ph.D. Professional
5. Your ethnicity is:
Asian or Pacific Black Caucasian Hispanic Native American or Alaskan Other

126
6. Your gender is: Female Male
7. What is your age? 8. What is the institutional head-count for fall 2004? 9. Type of institution:
Public Private 2 Year 4 Year 4 Year and above
10. Would you like a copy of the survey results?
If so, please include your e-mail address.

APPENDIX E
SURVEY FOLLOW-UP LETTER
127