Identification of Genes for Spontaneous Neuropathic Pain in ...
313
Identification of Genes for Spontaneous Neuropathic Pain in Mice: Whole Genome and Candidate Gene Approaches by Merav Yarkoni-Abitbul A thesis submitted in conformity with the requirements for the degree of Doctor of Philosophy Faculty of Dentistry University of Toronto © Copyright by Merav Yarkoni-Abitbul 2014
-
Upload
khangminh22 -
Category
Documents
-
view
0 -
download
0
Transcript of Identification of Genes for Spontaneous Neuropathic Pain in ...

Identification of Genes for Spontaneous Neuropathic Pain in Mice: Whole Genome and Candidate Gene Approaches
by
Merav Yarkoni-Abitbul
A thesis submitted in conformity with the requirements for the degree of Doctor of Philosophy
Faculty of Dentistry University of Toronto
© Copyright by Merav Yarkoni-Abitbul 2014

ii
Identification of Genes for Spontaneous Neuropathic Pain in Mice: Whole Genome and Candidate Gene Approaches
Merav Yarkoni-Abitbul
Doctor of Philosophy
Faculty of Dentistry
University of Toronto
2014
Abstract
Chronic neuropathic pain (NP) affects many people worldwide; causing suffering that is difficult
to treat, incurable and not preventable. There is growing hope that pain genetics may identify
novel treatment targets. In this dissertation we report on candidate NP genes using a mouse NP
model produced by hindpaw denervation. Previous research showed that inbred A/J (A-mice)
but not C57BL6/J (B-mice) express highly variable levels of self-mutilation of the denervated
hindpaw (‘autotomy’, a behaviour related to NP). This suggested that genetic and environmental
factors interact (GXE) in controlling this variance. Using this NP model in recombinant inbred
mice, a region on chromosome-15 (‘Pain1’) was identified as harbouring autotomy gene(s).
Here we report that Csf2rb1, a gene encoding the colony stimulating factor-2β1 common
receptor of GM-CSF (granulocyte-macrophage colony stimulating factor), and interleukins 3 and
5, is a candidate autotomy gene in Pain1. Up-regulation in Csf2rb1 expression levels in the
lumbar spinal cord correlated autotomy levels in denervated A and B mice vs. their naïve or
sham groups. Csf2rb1-expressing cells were labelled immunohistologically in several CNS
structures known to process pain inputs, including spinal dorsal horn, central canal, and select
spinal white matter regions, hippocampal dentate gyrus, ventricle linings and periventricular and
arcuate hypothalamus nuclei. CSF2RB1 protein levels were increased in spinal cord and brain of

iii
denervated A mice expressing autotomy vs. non-autotomizing A and B mice, and vs. their
control groups (naïve and sham A and B mice). Based on cyto-morphology and co-localization
with Vimentin, but not GFAP (astrocytes), OX42 (microglia), NeuN (neurons), MAP2 (neurons),
and NG2 (oligodendrocytes) markers, Csf2rb1-expressing cells were identified as ependymal
cells/radial glia/tanycytes. Previous studies showed that C3H/HeN mice express significantly
more pain behaviour than C3H/HeJ mice in several models. This contrast has been attributed to
a mutation in Tlr4 encoding Toll-like receptor-4 in C3H/HeJ mice. We show here that
denervated C3H/HeN mice express higher autotomy levels than C3H/HeJ mice. Spinal Csf2rb1
expression levels increased significantly post-denervation in C3H/HeN but not C3H/HeJ mice.
Thus, we propose that spontaneous NP behaviour in mice is associated with up-regulated
Csf2rb1 and CSF2RB1 levels in the CNS and associated with TLR4 signalling.

iv
Acknowledgments
I would like to thank first and foremost my supervisor Prof. Ze’ev Seltzer for his
excellent supervision, and for guiding me every step of the way throughout my PhD program.
His scientific expertise and superb research ideas are the great outcome of this research work. I
especially thank Prof. Seltzer for allowing me to discover the fascinating combination of genetics
and neuroscience and to become a true scientific investigator. Without him this PhD
achievement would not be possible.
I thank the members of my lab for their moral support, team-work, and for assisting me in
certain parts of my research: Drs. Elaheh Soleimannejad, Shihong Zhang, and Tina Elahipanah,
and David Tichauer, and Mariam Mashregi.
I thank the members of my committee, Prof Siew-Ging Gong, Prof. Michael Salter, and
Prof. Lei Sun for all their amazing support throughout my PhD program.
I am especially thankful for Dr. Simon Beggs and Prof. Michael Salter for allowing me to
carry out my immunohistochemical experiments in their laboratory at the Hospital for Sick
Children. I thank Dr. Beggs for assisting me in all the immunohistochemical experiments, for
his thorough supervision and technical support.
I am very grateful to Dr. Natalia Kraeva (Department of Anesthesiology, Toronto
General Hospital) for her wonderful technical support, guidance and supervision in my real time
PCR experiments that I carried out in her lab.
Special thanks to Dr. Ruslan Dorfman for his scientific expertise and for expertly and
kindly guiding me throughout my PhD program.
Thank you so much to my beautiful family, my husband Yaniv, and my sons Eli, Erez
and Yagel. I could not have done this without you. You have been so supportive and so patient
with me throughout the years and I owe you the world. I love you all and I thank you for
allowing me to achieve this goal in my life.
Thank you Mom, Yaniv and Alon. Thank you for your moral support and for believing
in me. Thank you for being there every moment of the day and throughout all the difficult
moments. You really helped me make this happen! This one is for Dad!!! I know he would have
been so proud.

v
Table of Contents
Abstract ii
Acknowledgments iv
Table of Contents v
List of Tables xi
List of Figures xii
List of schemes xiv
List of Appendices xv
List of abbreviations xvi
Chapter 1: Introduction and general aims 1
1.1 Chronic pain and its clinical manifestations 3
1.2 Pathophysiology of neuropathic pain 4
1.2.1 Spontaneous ectopic activity 4
1.2.2 Peripheral sensitization 6
1.2.3 Central sensitization 7
1.2.4 Sympathetically maintained pain 9
1.2.4.1 Direct coupling between the sympathetic neurons and
sensory neurons in the DRG 10
1.2.4.2 Chemically mediated coupling between the sympathetic
efferents and sensory neurons in skin 10
1.2.4.3 α -adrenoceptor-mediated super sensitivity of nociceptive
fibers 11
1.2.4.4 Nerve degeneration 11
1.3 The memory of pain and pre-emptive analgesia 12
1.4 Modeling chronic pain in animals 12
1.4.1 The Neuroma Model for spontaneous pain 14
1.4.2 Contrasting autotomy behaviour in mouse and rat strains 16
1.4.2.1 Additional mouse strains used to study autotomy behaviour 17
1.5 Mini-review of the genetics of neuropathic pain 18
1.5.1 Neuropathic pain genes in partial nerve injury models 20
1.6 Epigenetics and chronic pain 20

vi
1.7 Sex and gender differences in chronic pain 21
1.8 Rationale for comparing mouse to human genomes 21
1.9 Hypotheses and Aims 24
Chapter 2: Materials and methods 25
2.1 Induction and assessment of the pain phenotype (autotomy) 25
2.1.1 Mice 25
2.1.2 Surgical procedures 27
2.1.3 Phenotyping autotomy behaviour 28
2.2 Tissue acquisition 28
2.3 RNA extraction 29
2.4 Microarraying and data analysis 30
2.4.1 Study design 30
2.4.2 Agilent Two-Color Microarray Protocol 33
2.4.3 Expression array analyses 33
2.4.4 Gene interaction networks analysis 35
2.4.5 SNP variation in inbred mouse strains with known levels of
autotomy behaviour 36
2.4.6 Interrogating published Csf2rb1-immunohistochemically labelled
spinal cord and brain slices of naïve B mice 37
2.4.7 Methodological aspects of literature survey of the biological
relevance of candidate genes 37
2.5 Gene follow-up assays 37
2.5.1 Quantitative real-time PCR 37
2.5.2 Immunocytochemistry 38
2.5.3 Quantitation of CSF2RB1 labelled cells in the spinal cord and brain 40
2.5.4 Co-localization analyses 40
2.5.5 Counting pStat3 labelled cells in the spinal cord and brain 41
2.6 Statistical analysis 41
Chapter 3: Study I: Regulation of autotomy levels by gene expression changes:
Whole genome study of the DRGs and spinal cord 42
3.1 Introduction 42
3.2 Results 45

vii
3.2.1 Autotomy phenotypes in denervated A and B mice 45
3.2.2 Criteria for candidate gene selection 48
3.2.3 Group comparisons of genome-wide gene expression data 49
3.2.3.1 Constitutive gene expression levels of autotomy-related genes 50
3.2.3.2 Expression of DRG genes in denervated A and B mice 53
3.2.3.3 Spinal cord genes whose expression is associated with
autotomy levels 57
3.2.4 Network analysis 58
3.2.4.1 Network analysis for DRG genes in denervated A and B mice 58
3.2.4.2 Network analysis of genes expressed in the spinal cord of
denervated A and B mice 61
3.2.5 Pain1 DRG genes in denervated A and B mice 64
3.2.6 Pain1 genes associated with autotomy in spinal cord 68
3.2.7 In Situ hybridization (ISH) labelling of Csf2rb2 in the spinal cord
and brain of the mouse 70
3.2.8 Csf2rb1 gene network 76
3.2.9 SNP analysis in candidate autotomy genes – Pain1 genes in intact
A and B mice 78
3.2.10 Other candidate genes related to autotomy 82
3.2.11 Selecting the best candidate gene in Pain1 83
3.3 Discussion 85
3.3.1 Csf2rb1 as a candidate autotomy gene in Pain1 85
3.3.2 Cacng2 in Pain1 as a candidate autotomy gene 86
3.4 Conclusions 88
Chapter 4: Study II: Expression of CSF2RB1 by spinal central canal ependymal
cells/radial glia/tanycytes correlates with autotomy levels in
Mice 89
4.1 Introduction 89
4.2 Results 90
4.2.1 Autotomy behaviour in denervated A and B mice 90
4.2.2 Csf2rb1 pattern of expression correlates with autotomy behaviour
in denervated A mice 94
viii
4.2.3 Autotomy behaviour in denervated C3H/HeJ and AKR/J mice 97
4.2.4 Csf2rb1 expression levels in C3H/HeJ vs. AKR/J mice 101
4.2.5 CSF2RB1 protein is differentially expressed in spinal cords of A
and B mice 103
4.2.6 Evidence that CSF2RB1 is localized in ependymal cells/radial
glia/tanycytes of the central canal 110
4.2.7 CSF2RB1 in the brain is associated with high autotomy levels in
denervated A mice 112
4.2.8 CSF2RB1 in ependymal cells/radial glia/tanycytes in other brain
regions 117
4.3 Discussion 119
4.3.1 Csf2rb1 is correlated with pain levels in denervated A mice 119
4.3.2 CSF2RB1 is expressed in ependymal cells/radial glia/tanycytes
of the central canal 120
4.3.3 CSF2RB1 cells in the hippocampal dentate gyrus 123
4.3.4 CSF2RB1 cells in the hypothalamic peri-ventricular and arcuate
nuclei 124
4.3.5 Autotomy behaviour in denervated C3H/HeJ mice 125
4.4 Conclusions 125
Chapter 5: Study III: Tlr4 and pStat3 as candidate genes controlling autotomy
behaviour in mice 127
5.1 Introduction 127
5.1.1 Tlr4 127
5.1.2 Tlr4 up-regulation in pain behaviour 130
5.1.3 Tlr4 blockade reverses established neuropathic pain behaviour 133
5.1.4 C3H/HeJ vs. C3H/HeN mice 133
5.1.5 Tlr4 and Csf2rb1 in the inflammatory process 136
5.1.6 pStat3 136
5.1.7 C3H/HeJ and C3H/HeN mice in the Neuroma Model 138
5.2 Results 139
5.2.1 Autotomy behaviour in denervated C3H/HeN (Tlr4 wild-type) and
C3H/HeJ (Tlr4-deficient) mice 139
ix
5.2.2 Csf2rb1 expression patterns in C3H/HeN and C3H/HeJ mice 141
5.2.3 CSF2RB1+ cells in the central canal of C3H/HeN mice 144
5.2.4 Tlr4 gene regulation in A vs. B mice 144
5.2.5 Tlr4 gene polymorphisms in MHS vs. NLS mice 146
5.2.6 pStat3 in dorsal horn of A vs. B mice 147
5.2.7 pStat3 in the dentate gyrus of A vs. B mice 149
5.2.8 pStat3 in the peri-ventricular nucleus of A mice 149
5.3 Discussion 151
5.3.1 Tlr4 contributes to chronic neuropathic pain 151
5.3.2 Tlr4 gene is differentially expressed in A vs. B mice 152
5.3.3 Proposed mechanisms for Tlr4 in NP 154
5.3.4 Csf2rb1 gene expression levels in wild-type and TLR4-deficient
Mice 155
5.3.5 pStat3 expression in the spinal cord of A vs. B mice 156
5.3.6 Proposed mechanism for pStat3 and CSF2RB1 in the spinal cord 157
5.3.7 Hippocampal pStat3 expression is associated with autotomy 158
5.4 Conclusions 160
Chapter 6: General Discussion and Conclusions 161
6.1 Mechanisms involving the Colony-Stimulating Factor 2 Receptor Beta 1,
CSF2RB1 162
6.1.1 The GM-CSF cytokine and its receptors in the nervous system 162
6.2 CSF2RB1 is expressed in Ependymal cells/radial glia/tanycytes in
the CNS 167
6.2.1 CSF2RB1+ ependymal cells/radial glia/tanycytes surrounding the
spinal central canal and in spinal lamina X 168
6.2.2 Metabotropic glutamate receptor 1 alpha (mGluR1α) is expressed
in ependymal cells/tanycytes/radial glia of the spinal central canal 172
6.2.3 Endothelin B receptor is expressed in ependymal
cells/tanycytes/radial glia of the spinal central canal 172
6.3 Co-localization of CSF2RB1 and the neural stem cell marker Vimentin
in the spinal cord 173
6.4 The hippocampus in processing nociceptive input 175

x
6.4.1 Processing chronic pain inputs in the hippocampus 177
6.5 Which cell types express CSF2RB1 in the hippocampus? 178
6.6 The involvement of CSF2RB1 in neuroprotection 180
6.6.1 Cytoprotection involves CSF2RB1 operating in a complex with
the erythropoietin receptor (EpoR) 180
6.6.2 The neuroprotective cytokine erythropoietin is a ligand for
CSF2RB1 180
6.7 CSF2RB1 operating with Receptor d’origine nantais (RON) 182
6.8 pStat3 in the spinal cord 184
6.10 pStat3 in the peripheral nervous system (PNS) contributing to neuronal
hyperexcitablility may be associated with CSF2RB1 in A mice 186
6.11 The pain-related genes induced by pStat3 in the PNS and CNS 187
6.12 pStat3 is expressed in the subventricular zone of the brain but not
around the spinal central canal 187
6.13 Study design considerations in gene expression studies 189
6.13.1 Pooled vs. individualized arrays 189
6.13.2 The number of arrays per group 190
6.13.3 Type of group comparisons and choice of the reference (control)
group 191
6.13.4 Arrayed neural tissues 193
6.13.5 Statistical consideration 194
6.13.6 Group comparisons 194
6.14 Limitations of the studies 195
6.15 Future direction of research 197
6.16 Conclusions 199
References 201
Appendices 238
Copyright acknowledgements 294

xi
List of Tables
Table 1: Strains, group types and the number of animals per group 26
Table 2: Comaprison types and genes associated with each comparison type 34
Table 3: Probes and genes with contrasting expression levels between naïve A vs.
B mice are presented 51
Table 4: Pain1 genes in lumbar DRGs showing a significant contrast in the expression
level between intact A and B mice at P<0.05 and a fold change of more than 1.5 or less
than -1.5 (listed in alphabetical order) 52
Table 5: Pain1 genes in lumbar spinal cord showing a significant contrast in the
expression level between intact A and B mice at P<0.05 and a fold change of more than
1.5 or less than -1.5 (listed in alphabetical order) 53
Table 6: Probes and genes that are regulated with autotomy behaviour in A and B mice 55
Table 7: Candidate autotomy genes in the DRGs and biological processes in which they
operate 60
Table 8: Candidate autotomy genes in the spinal cord and biological processes in
which they operate 62-3
Table 9: Pain1 genes in naïve, sham-operated and denervated A and B mice that
reacted to the treatments by changed expression levels in the DRG 65-7
Table 10: Pain1 genes in the individual 3 group comparisons that yielded in the spinal
cord (ADH vs. AS; ADH vs. BD; ADH vs. ADL) 69
Table 11: SNPs in Pain1 candidate autotomy genes regulated constitutively between
A and B mice and between other MHS (A/HeJ, C3H/HeJ, BALBc/ByJ, BALB/cJ) vs.
NLS (AKR/J, C57BL/10J) strains 81
Table 12: Candidate autotomy genes in Pain1 and their known relevance to pain 83
Table 13: Documented phenotypic differences between Tlr4 wild-type and mutant mice 135
Table 14: Tlr4 SNPs that contrast between A and B mice and are located in coding
regions (synonymous and non-synonymous SNPs), intronic and un-translated regions 147

xii
List of Figures
Figure 1: Study design for microarray experiment 32
Figure 2: Course of autotomy behaviour in denervated A and B mice 47
Figure 3: Average autotomy onset day of denervated A and B mice 48
Figure 4: Numbers of DRG genes throughout the genome whose expression level is
regulated by the effects of: (1) denervation in A mice expressing high autotomy vs. sham
operated A mice, (2) denervation in different strains expressing contrasting autotomy
levels and (3) the effect of different environmental controls 57
Figure 5: Number of spinal cord genes throughout the genome whose expression level is
regulated by the effects of: (1) denervation in A mice expressing high autotomy vs. sham
operated A mice, (2) denervation in different strains expressing contrasting autotomy
levels and (3) the effect of different environmental controls 58
Figure 6: Physical genetic map of Csf2rb1 and Csf2rb2 70
Figure 7: Photomicrographs of Csf2rb2 ISH in select regions of mouse brain 72
Figure 8: Photomicrographs from the Allen Brain Atlas showing a strong labelling of in situ
hybridization of Csf2rb2 in the lumbar spinal cord of a 56 weeks old intact B male mouse 73
Figure 9: Photomicrographs from the Allen Brain Atlas showing a strong labelling of
in situ hybridized reaction product to Csf2rb2 in nuclei of certain cells clustering in
specific brain nuclei and regions of an intact 56 weeks male old B mouse 74-5
Figure 10: Gene networks of Csf2rb1 76-7
Figure 11: Postoperative course of average autotomy scores in denervated, sham and
naive A and B mice 92
Figure 12: Average autotomy onset day in denervated A and B mice 93
Figure 13: Autotomy scores at onset day in denervated A and B mice 93
Figure 14: Correlation of Csf2rb1 gene expression levels with autotomy behaviour on
PO day 14 in denervated A and B mice 96
Figure 15: Csf2rb1 gene expression levels correlation with onset day of autotomy and
autotomy onset scores in denervated A and B mice 97
Figure 16: Postoperative course of average autotomy scores in C3H/HeJ and AKR/J mice 99
Figure 17: Autotomy average onset day in C3H/HeJ and AKR/J mice 100
Figure 18: Score of autotomy at onset day of denervated C3H/HeJ and AKR/J mice 100

xiii
Figure 19: Csf2rb1 gene expression levels in the spinal cord of C3H/HeJ and AKR/J mice 102
Figure 20: Csf2rb1 gene expression levels in denervated CeH/HeJ and AKR/J mice
sub-grouped by autotomy onset day 102
Figure 21: Immunohistochemical analysis of CSF2RB1 expressing cells in the spinal
cord 106
Figure 22: CSF2RB1 expression levels in the spinal dorsal horn 107
Figure 23: The number of long CSF2RB1+ processes in the spinal cord of A and B mice 108
Figure 24: The number of long CSF2RB1+ processes extending laterally in A and B mice 109
Figure 25: Co-localization of CSF2RB1 and Vimentin in ependymal cells/tanycytes/
radial glia surrounding the central canal in control and denervated A and B mice 111
Figure 26: Photomicrographs of hippocampal dentate gyrus sections labelled immuno-
histologically for CSF2RB1, expressed in pyramidal and granule layers 114
Figure 27: Correlation of the number of CSF2RB1+ long processes per 200μm of the
dentate gyrus with autotomy behaviour 115
Figure 28: CSF2RB1 expression in the dentate gyrus 116
Figure 29: CSF2RB1 immunoreactive cells in select brain regions 117-8
Figure 30: Course of autotomy levels in denervated C3H/HeN mice carrying the
wild-type Tlr4 gene sequence and C3H/HeJ mice carrying the mutant gene 140
Figure 31: Average autotomy onset day in denervated C3H/HeN and C3H/HeJ mice 140
Figure 32: The average score of autotomy at its onset in denervated C3H/HeN and
C3H/HeJ mice 141
Figure 33: Csf2rb1 gene expression levels in denervated C3H/HeN and C3H/HeJ mice 142
Figure 34: Correlation of Csf2rb1 gene expression levels (in denervated C3H/HeN and
C3H/HeJ mice) with the onset day of autotomy and autotomy onset scores 143
Figure 35: CSF2RB1 immunostaining in the central canal of C3H/HeN mice 144
Figure 36: Tlr4 gene expression levels in DRG and spinal cord of A vs. B mice 146
Figure 37: Photomicrographs of the spinal cord of denervated and sham operated A
mice labelled immunohistologically for pStat3 148
Figure 38: Photomicrographs of the dentate gyrus of denervated and sham operated A
mice labelled immunohistologically for pStat3 150
Figure 39: Photomicrographs of the brain ventricles of denervated and sham operated A
mice labelled immunohistologically for pStat3 151

xiv
List of Schemes
Scheme 1: A model for TLRs in peripheral nerve injury and neuropathic pain
(reprinted with permission from RightsLink, License Number 3378941306268) 129
Scheme 2: TLR4 is a potential master switch in pain regulation after nerve injury
(reprinted with permission from RightsLink, License Number 3378941061859) 131-2
Scheme 3: Normal expression of GM-CSF/ IL-3/IL-5, CSF2RA and CSF2RB1
receptor complex in the intact peripheral nervous system and spinal dorsal horn 165
Scheme 4: Expression of CSF2RB1 and CSF2RA and their ligands following
peripheral nerve injury (PNI) in the Neuroma Model 166
Scheme 5: Ependymal and neuroglial cells surrounding the central canal of the spinal
cord (Gray, 1918) 169
Scheme 6: Adapted from (Qiagen): CSF2RB intracellular signalling through Jak/Stat3,
PI3K and Src 185-6

xv
List of Appendices
Appendix I: Genome-wide candidate genes associated with autotomy in the DRGs 238
Appendix II: Genome-wide candidate genes associated with autotomy in the spinal cord 246
Appendix III: SNP variations in A vs. B mice, and other high- (C3H/HeJ, BALBc/cByJ),
low- (C57BL/10J, AKR/J, C58/J) and intermediate-autotomy score strains (129S1/SvImJ,
129x1/SvJ, DBA/2J) 249
Appendix IV: mRNA levels of the reference gene Hprt across treatment groups and
strains following real-time PCR 291
Appendix V: Number of CSF2RB1+ cell extensions around the central canal in naïve and
sham-operated A and B mice, and in denervated A high autotomy and low autotomy mice 292
Appendix VI: Number of CSF2RB1+ cell processes crossing the dentate gyrus per 200 μm
unit length in naïve and sham-operated A and B mice 293
Appendix VII: Number of CSF2RB1+ cells in the polymorph dentate gyrus per ROI
of 2500 μm2 of naïve and sham-operated A and B mice 293
xvi
List of Abbreviations
A
A A/J
ABA Allen Brain Atlas
ADH Denervated A/J high-autotomy mouse
ADL Denervated A/J no/low-autotomy mouse
AFS Autotomy final score
AI Intact A/J mouse
AOS Autotomy onset score
AS Sham-operated A/J mouse
AMPA Alpha-amino-3-hydroxy-5-methyl-4-isoxazolepropionic acid
ANOVA Analysis of variance
ARH Hypothalamic arcuate nucleus
ATP Adenosine triphosphate
B
B C57BL6/J
BD Denervated C57BL6/J mouse
BI Intact C57BL6/J mouse
BS Sham-operated C57BL6/J mouse
BDNF Brain-derived neurotrophic factor
C
CaMKII Calmodulin-Dependent Protein Kinase II
CCI Chronic constriction injury
cDNA Complementary DNA
CGRP Calcitonin gene-related peptide
CNS Central nervous system
CREB cAMP response element-binding protein
cRNA Complementary RNA
CSF2RB1 Colony stimulating factor 2 receptor beta
CTP Cytidine 5'-triphosphate
D
DEPC Diethyl pyrocarbonate
DNA Deoxyribonucleic acid
DRG Dorsal root ganglia
E
ECM Extracellular matrix
EGF-BP Epidermal growth factor-binding protein

xvii
ENU N-ethyl-N-nitrosourea
ERK1 Extracellular signal-regulated kinase 1
ERK2 Extracellular signal-regulated kinase 2
F
FAS Final autotomy score
G
GDNF Glial cell-derived neurotrophic factor
GFAP Glial fibrillary acidic protein
GITC Guanidine isothiocyanate
GM-CSF Granulocyte-macrophage colony stimulating factor
GPCR G protein-coupled receptors
H
Hapmap Haplotype map
Hprt1 Hypoxanthine guanine phosphoribosyl transferase 1
5HT 5-hydroxytryptamine, also known as Serotonin
I
IASP International Association for the Study of Pain
IB4 Isolectin-B4
IL-1β Interleukin 1 beta
IL-3 Interleukin 3
IL-5 Interleukin 5
IL-6 Interleukin 6
IL-3Rβ Interleukin-3 receptor beta
INF-γ Interferon gamma
i.p. Intraperitoneal
ITGAM Integrin alpha M
J
Jak Janus kinase
JNK c-Jun N-terminal kinase
M
MAP-2 Microtubule-associated protein 2
MAPK Mitogen-activated protein kinase, also known as ERK
MCP-1 Monocyte chemoattractant protein 1
MGI Mouse Genome Informatics
mGluR Metabotropic glutamate receptor
MHS-A Moderate/High scores of autotomy in A mice

xviii
MHS- C3H/HeJ Moderate/High scores of autotomy in C3H/HeJ mice
MHS- C3H/HeN Moderate/High scores of autotomy in C3H/HeN mice
MMLV-RT Moloney murine leukemia virus reverse transcriptase
MMP9 Matrix metallopeptidase 9
mRNA Messenger RNA
MSP Macrophage Stimulating Protein
N
Nav 1.8 Sodium channel, voltage-gated, type X, alpha subunit
NFκB Nuclear factor kappa B
NeuN Neuronal nuclei
NGF Nerve growth factor
NIH National Institute of Health
NLS-A No/low scores of autotomy in A mice
NLS-AKR/J No/low scores of autotomy in AKR/J mice
NLS-B No/low scores of autotomy in B mice
NLS-C3H/HeJ No/low scores of autotomy in C3H/HeJ mice
NLS-C3H/HeN No/low scores of autotomy in C3H/HeN mice
NMDA N-methyl-D-aspartate
NO Nitric Oxide
O
OD Optical density
Oligo Oligonucleotide
OX42 Anti-Integrin αM [CD11b]
P
PAG Peri-aqueductal gray
PBS Phosphate buffered saline
PCR Polymerase chain reaction
PGE2 Prostaglandin E2
PI3K Phosphatidylinositol-3-kinase
PKA Protein kinase A
PKC Protein kinase C
PLC Phosphoinositide phospholipase C
PMPS Post-mastectomy pain syndrome
PNS Peripheral nervous system
PO Post-operative
PSL Partial sciatic nerve ligation
PVi Periventricular nucleus pars internal

xix
Q
qPCR Quantitative PCR
QTL Quantitative trait loci
R
RI Recombinant inbred lines
RNA Ribonucleic acid
ROI Region of Interest
RON Receptor d’origine nantais (macrophage stimulating 1 receptor)
ROS Reactive Oxygen Species
rRNA Ribosomal RNA
RT Reverse transcriptase
RT-PCR Real time PCR
S
siRNA Small interference RNA
SMP Sympathetically maintained pain
SNL Spinal nerve ligation
SNP Single nucleotide polymorphism
Stat Signal-transducer and activator of transcription protein
STK Stem-cell derived Tyrosine Kinase
T
TNFα Tumor necrosis factor α
TRAF6 TNF receptor-associated factor 6
TRPV1 Transient receptor potential cation channel, subfamily V, member 1
U
UTR Un-translated region
UV Ultraviolet
V
V3 Third ventricle
VMAB Ventromedial afferent bundle
VTA Ventral tegmental area

Chapter 1 Introduction and general aims
Chronic neuropathic pain is a complex disease that follows nerve damage and affects nearly 5%
of the human population with no effective cure, causing suffering and emotional, motor, mental,
sleep dysfunctions and social participation problems to the pain patients and their families. It
also involves major costs to the economy. Over the past two decades there has been a substantial
advancement in our understanding of neuropathic pain. For example, we now know that a
genetic pre-disposition to develop neuropathic pain exists in humans and animals alike, and that
certain individuals will suffer much more pain than others, following the same inciting injury,
due to a genetic pre-disposition interacting with environmental risk factors. In this respect,
phantom and spontaneous pains are felt in certain limb amputees and in some women following
breast mastectomies and in individuals who lose an organ such as an eye, tooth, uterus, etc.
Likewise, spontaneous pain in certain animal rodent models is an outcome of total and partial
nerve transections, and its extent depends on their genetic background, interacting with the
environment.
The purpose of this study was to identify genes that are responsible for initiating and/or
maintaining spontaneous neuropathic pain in an animal model, the Neuroma Model (Wall et al.,
1979) that mimics the pathophysiology of human leg amputees. In this model, total hind paw
denervation is performed in inbred mice of certain genetic backgrounds, and pain is assessed by
self-mutilation behaviour (‘autotomy’). The study used a whole genome approach to interrogate
differential gene expression levels following hind paw denervation that triggers autotomy
behaviour in a few neural structures known to be involved in pain processing, i.e., ipsilateral
lumbosacral dorsal root ganglia (DRGs) associated with the injured nerves and the lumbar spinal
cord where these nerves terminate and synapse with 2nd
-order neurons (Chapter 3). Both the
DRGs and the spinal cord are neuroplastic tissues in which changes in gene and protein
expression levels occur following peripheral nerve injury and both serve as candidate tissues for
investigators to study pain mechanisms. The study focused on mouse lines that are known from
previous experiments by us and others to genetically contrast in the levels of autotomy behaviour
following hind paw denervation (i.e., A vs. B) to seek candidate pain genes. The focus of our
search for such genes was on a previously identified quantitative trait locus (QTL) on
1

2
chromosome 15, named Pain1, that was linked with autotomy in A and B mice (Seltzer et al.,
2001).
The whole genome gene expression profiling study identified in the spinal cord a candidate gene
in Pain1, named Csf2rb1 that we associated with autotomy behaviour in this dissertation using
genetic and immunohistochemical techniques (Chapter 4). The Csf2rb1 gene and its expressed
CSF2RB1 protein were correlated with autotomy behaviour in the spinal cord and brain. Two
additional genes that were studied in the context of Csf2rb1 are Tlr4 and the phosphorylated
protein Stat3 product of Stat3 that correlated with autotomy behaviour (Chapter 5). In the final
chapter of this dissertation (Chapter 6) we discuss possible mechanisms that combine Csf2rb1,
Tlr4, and Stat3, together and as separate entities in the context of the mechanisms of chronic
neuropathic pain.
The following experimental procedures for this thesis were performed by the author (MYA):
RNA extractions, RNA quantifications, gel electrophoresis, cDNA syntheses, primer designs,
RT-PCRs, immunohistochemistry, fluorescence microscopy and imaging, cell counts, in-silico
studies, autotomy phenotyping, some animal surgeries, perfusions and tissue isolation, as well as
statistical analysis, graphs and tables. Surgery, perfusion and tissue extraction of animals for
gene expression profiling and immunohistochemistry were performed by Drs. Shihong Zhang,
Elaheh Solemannejad, and Simon Beggs. Gene expression profiling using microarrays was
performed by outsourcing at the Microarray Centre (ACTG, Toronto, ON). Statistical analysis
for the microarray gene expression data was performed by the author (MYA) and David
Tichauer.
The following sections of the Introduction provide an overview of chronic neuropathic pain, its
clinical manifestations and pathophysiology, including the changes that occur in the nervous
system following nerve damage, such as spontaneous ectopic activity, peripheral and central
sensitization, sympathetically-maintained pain, collateral sprouting, nerve degeneration and
regeneration, disinhibition, excitotoxic cell death, and role of glia cells. Next, follows an
introduction to modeling chronic pain in animals and the Neuroma Model that was used in this
study. The Introduction concludes with a mini-review of the genetics of neuropathic pain, and
hence the rationale of comparing mouse to human genomes in the present study.
3
1.1 Chronic pain and its clinical manifestations
Chronic pain is defined as pain experienced over a period of 3 (some propose 6) months or more
following nerve injury, certain diseases, consumption of drugs and exposure to certain
chemicals. In addition it may be produced by other causes such as inheriting specific
polymorphisms on certain sodium channel genes (reviewed by Suzuki and Dickenson, 2000).
Neuropathic pain is distinguished from other chronic pain syndromes in that it was originally
defined as ‘pain initiated or caused by a primary lesion or dysfunction in the nervous system’
(International Association for the Study of Pain (‘IASP’) terminology) (Merskey and Bogduk,
1994). A more precise definition was developed by Treede et al (2008) stating it as ‘pain arising
as a direct consequence of a lesion or disease affecting the somatosensory system’ (Treede et al.,
2008). It can be subdivided into peripheral and central neuropathy, depending on where the
primary lesion or dysfunction is situated. In the periphery, neuropathic pain can result from
diseases (e.g., diabetes mellitus, uremia, herpes zoster, HIV and cancer) or due to
complete/partial nerve injury following surgery/trauma (e.g., after limb amputation, total nerve
transection by a shrapnel/knife, and partial trauma to the nerves/other tissues), or nerve
compression by tumors, entrapment, and nerve crush, burn or freezing, etc. Central pain
syndromes, however, result from damage/diseases to various structures in the brain or the spinal
cord (e.g., stroke, multiple sclerosis, amyotropic lateral sclerosis, cancer, etc). Despite these
diverse causes, the symptoms of neuropathic pain are similar and often include spontaneous pain,
pain in response to non-noxious stimuli (known as tactile and thermal allodynia), increased
responsiveness to noxious stimuli (known as mechanical and thermal hyperalgesia), sensory
deficits (e.g., anesthesia, hypoesthesia, analgesia and hypoalgesia), and sensory abnormalities
(e.g., dysesthesia and paresthesia), sympathetic dependence, spread to body parts not innervated
by affected nerves or central nervous system (CNS) structures, and exacerbation by movements
(Merskey and Bogduk, 1994)(Woolf and Mannion, 1999). However, not everyone undergoing
such inciting events develops neuropathic pain. For instance, the incidence of phantom limb
pain in Danish limb amputees is about 80% (Jensen and Nikolajsen, 1999), and of post-
mastectomy pain syndrome (PMPS) in women with breast cancer is up to 65% (Livneh-Fuchs,
2005). Moreover, pain intensity, frequency and duration in these patients also varies widely
from individual to individual, even when the inciting injury was the same (Jensen and
Nikolajsen, 1999). This variability suggests that chronic pain is a complex trait, controlled by
4
variations in many genes. Moreover, this genetic control is further modified by non-genetic
situational, emotional, cultural, social and other environmental factors. While the identity of
most genes for neuropathic pain is still unknown, much is known about the pathophysiological
outcomes controlled by these genes. The next section describes the pathophysiology of
neuropathic pain.
1.2 Pathophysiology of neuropathic pain
Looking at neuropathic pain from the perspective of its natural history, the earliest signal of
occurred injury is ‘injury discharge’, an immediate discharge of a barrage of action potentials in
many injured sensory fibbers at the time of nerve injury (Cohn and Seltzer, 1991; Seltzer et al.,
1991a, 1991b; Wall et al., 1974). Injury discharge may induce changes in the peripheral nervous
system (PNS) and CNS, thought to be responsible for stimulus-evoked pain (i.e., allodynia and
hyperalgesia), and spontaneous pain (Devor and seltzer, 1999). Nerve injury is also associated
with an interruption of nerve conduction from the receptive field to the CNS, followed by
Wallerian degeneration of the axons distal to the lesion. After a few days new sprouts grow out
in an attempt to regenerate and reinnervate the original targets. Even under the best conditions,
when the targets are present and not amputated, this attempt will only be partially successful
(Devor et al., 1979). Apart from the local effects at the site of nerve injury, there are several
changes that manifest in sites far beyond the lesion. These include chromatolysis of the nucleus
and other changes in the cell body of the injured primary afferent neurons in dorsal root ganglia
including dramatic changes to its profile of gene expression levels (Costigan et al., 2002; Cragg,
1970; Kim et al., 2009b, 2012; Liu et al., 2012a; Méchaly et al., 2006; Persson et al., 2009a;
Rodriguez Parkitna et al., 2006; Stam et al., 2007; Valder et al., 2003; Vega-Avelaira et al.,
2009; Wang et al., 2002a; Xiao et al., 2002). Even though the injury occurred in the PNS, there
are numerous additional changes in the CNS that contribute to neuropathic pain states, including
the activation of glia cells, accentuation of excitatory transmission and reduced inhibitory
transmission (see below).
1.2.1 Spontaneous ectopic activity
Following nerve injury, a neuroma forms at the cut end, comprising blood vessels, fibrotic scar
tissue and sprouts of severed axons. Sprouts emitted from damaged primary afferents develop

5
hyperexcitability that is so pronounced that it manifests in ongoing, ectopic activity, which
contributes an afferent drive for spontaneous pain but also a background sensitizing input for
allodynia, hyperalgesia, and spread of pain, and pain exacerbated by movement and by
sympathetic activity. Nerves damaged partially also develop a neuroma, termed ‘in-continuity’
or ‘partial neuroma’. The ectopic spontaneous firing develops not only in the injured nerve end
where sprouts in nerve-end neuromas are located (Burchiel, 1984; Devor and Raber, 1990;
Govrin-Lippmann and Devor, 1978; Wall and Devor, 1983) but also in the DRGs where the
soma of injured afferents are located (Burchiel, 1984; Devor et al., 1994; Govrin-Lippmann and
Devor, 1978; Kajander and Bennett, 1992; Wall and Devor, 1983). These two ectopic input
sources result from changes in the expression of ion channels in the genome located at the
nucleus of cell bodies of the injured peripheral afferents in the DRGs (Devor et al., 1993). Under
normal conditions certain Na+, K
+, Ca
2+ and Cl
- channels are constantly synthesized in the soma
and conveyed by rapid axonal transport to be assembled in the axolemma along the proximal and
distal axon and its ends, where they play a role in impulse generation, conduction, and synaptic
transmission including self-modulation of excitability by autoreceptors (Cummins and Waxman,
1997). Following nerve injury there is a change in the expression levels of these ion channel
subunits, including down-regulation of some channels and up-regulation of others that are not
expressed under normal conditions (Costigan et al., 2002; Cragg, 1970; Kim et al., 2009b, 2012;
Liu et al., 2012a; Méchaly et al., 2006; Persson et al., 2009a; Rodriguez Parkitna et al., 2006;
Stam et al., 2007; Valder et al., 2003; Vega-Avelaira et al., 2009; Wang et al., 2002a; Xiao et al.,
2002). In addition, there is redistribution of Na+ channels and their clustering in pathological
membrane regions (Devor et al., 1993), such as the sprouts in the neuroma and the membrane of
the afferent’s soma in the DRG. As a result, there is local hyperexcitability manifesting in
spontaneous firing and evoked firing in the sprouts of the neuroma as well as in the somata (Wall
and Devor, 1983). Thus, changes in the expression and function of ion channels may contribute
to the development of certain chronic pain states (Suzuki and Dickenson, 2000). The increase in
production, transport, and membrane insertion of transducer channels and voltage-gated ion
channels in nociceptors is primarily due to the activation of intracellular signalling transduction
pathways activated by inflammatory mediators. This so-called sensitization of nociceptors is a
factor of peripheral sensitization (Suzuki and Dickenson, 2000).

6
1.2.2 Peripheral sensitization
Peripheral nerve injury, like any other significant tissue injury, produces inflammation, a process
clinically characterized by redness, warmth, swelling, and pain. Inflammation is a complex
interaction between damaged endothelial cells, sympathetic efferents, and primary sensory
afferent neurons, and inflammatory cells such as macrophages, neutrophils, lymphocytes and
mast cells (Scholz and Woolf, 2007). In response to tissue damage, all of these cellular players
release inflammatory mediators, such as H+ and K
+ ions, nitric oxide, norepinephrine, serotonin
(5-HT), bradykinin, endothelin, prostaglandins (i.e., PGE2), cytokines, platelet activating factor,
histamine, glutamate, nerve growth factor (NGF) (Julius and Basbaum, 2001). From
sympathetic efferent fibbers, there is a release of neuropeptides, and catecholamines (Raja,
1995). From peripheral terminals of nociceptive afferent fibbers, there is a release of substance
P, calcitonin gene-related peptide CGRP, neurokinin A (Hudspith et al., 2006). These peptides
modify the excitability of sensory and sympathetic nerve fibbers, induce vasodilation, and
promote the release of further chemical mediators by inflammatory cells. The resulting ‘soup’ of
inflammatory mediators sensitizes further the nociceptive neurons and produces the phenomenon
of peripheral sensitization (Hudspith et al., 2006). In the event of partial nerve injury, where the
original targets are still innervated, the effect of peripheral sensitization is such that non-noxious,
low-intensity mechanical and thermal stimuli that would not normally cause pain are now
perceived as painful (hence the concept of allodynia). There is also an increased responsiveness
to noxious thermal and mechanical stimuli at the site of innervation, known as hyperalgesia
(Hudspith et al., 2006).
Another signal triggering cascades that result in chronic pain is not electrical but a chemical
signal, manifests in neurotrophic factors (i.e., NGF, BDNF, NT3 and GDNF) that are released
under normal conditions from healthy tissues, permeating in between the cells of the tissues of
the body to eventually reach the axolemma of primary afferent terminals in those tissues and get
bound to neurotrophic factor receptors on those membranes (i.e., trkA-C and ret, respectively).
The complex of trophin-receptor then gets internalized into the protoplasm of primary afferents,
uploaded onto the axonal transportation machinery, and get transferred retrogradely to the cell
bodies in the DRGs, to inform the genome that the terminals in the periphery are connected to

7
healthy tissues. But when these afferents are injured, transport of those trophic signals is
arrested, triggering the cascade of changes that lead to chronicity of pain (Fitzgerald et al., 1985).
Other than changes occurring at the injured nerve, there are transneuronal neuroplastic changes
in the CNS, that manifest as abnormal processing of sensory inputs (Hama et al., 1996). These
changes appear as ‘central sensitization’, discussed in the next section.
1.2.3 Central sensitization
Neuroplasticity in the CNS involves many processes, including activation of glial cells
(microglia and astrocytes), disinhibition by excitotoxic destruction of dorsal horn inhibitory
interneurons, reorganization of neuronal circuits in the dorsal horn, and changes in descending
pain pathways (Suzuki and Dickenson, 2000; Woolf and Salter, 2000; Zimmermann, 2001).
Under normal conditions proinflammatory mediators, cytokines, neuropeptides and transmitters
excite or inhibit pre- and post-synaptic cells in the spinal cord and its corollary trigeminal
brainstem complex. Ca2+
, Na+, and Cl
- influxes into post-synaptic cells and K
+ outfluxes,
depolarize and hyperpolarize neurons in the dorsal horn as a summated result of synaptic
activities that integrate excitatory and inhibitory synapses (reviewed in Latremoliere and Woolf,
2009). An increase in intracellular Ca2+
in post-synaptic cells beyond a certain level appears to
be the key trigger for initiating activity-dependent ‘central sensitization’. There is Ca2+
induced
activation of intracellular kinases PKC, PKA, CaMKII on the post-synaptic neurons. These
kinases phosphorylate NMDA and AMPA receptors on their C-terminus and change their
activity and their trafficking to or from the membrane of post-synaptic cells, leading to ongoing
excitation and central sensitization (Latremoliere and Woolf, 2009). Activated PKC contributes
both to hyperexcitability by activating NMDA receptors and to disinhibition, by reducing
inhibitor transmission [apoptosis of inhibitory interneurons and inhibition of descending peri-
aqueductal grey (PAG)] (Latremoliere and Woolf, 2009). Other intracellular pathways that
sustain central sensitization include the phosphatidylinositol-3-kinase (PI3K) pathway and the
mitogen-activated protein kinase (MAPK) pathway that involves the extracellular signal-
regulated kinases ERK1 and ERK2 (reviewed in (Latremoliere and Woolf, 2009). Post synaptic
neurons in the dorsal horn also retain several metabotropic (G-protein coupled) glutamate
receptor subtypes (mGluR), which are either Ca2+
permeable (i.e., GluR1 and GluR3) or Ca2+
impermeable (i.e. mGluR2). The mGluR family is composed of 8 receptors that form 3 groups,

8
based on their sequence similarities and their coupling with specific Gα-proteins (reviewed in
(Latremoliere and Woolf, 2009).
Peripheral nerve injury initiates proliferation and activation of glial cells in the spinal cord as
well as infiltration of immune cells from the periphery, especially macrophages and T-cells (Cao
and DeLeo, 2008; Tanga et al., 2005; Watkins et al., 2007). Some immune cells may be related
to clearing debris of dying terminals of primary afferents and to apoptotically and excitotoxically
dying second order dorsal horn neurons. Microglia proliferate and become activated, whereby
they produce and release trophic factors, neurotransmitters, cytokines, and reactive oxygen
species into the dorsal horn (Romero-Sandoval et al., 2008; Watkins and Maier, 2002), and these
factors interact with neurons and trigger central sensitization and pain following nerve injury (Ji
and Suter, 2007; Latrémolière et al., 2008; Ledeboer et al., 2005; Meunier et al., 2007; Milligan
et al., 2004; Raghavendra et al., 2003a, 2003b; Verge et al., 2004). The signals that trigger
microglial activation and recruitment include ATP and NO (Davalos et al., 2005; Duan et al.,
2009; Nimmerjahn et al., 2005), cytokines, and chemokines, some of which are released by
injured sensory neurons and others by microglial cells themselves or by astorcytes and T-cells
(Abbadie et al., 2003, 2009; DeLeo and Yezierski, 2001; Dominguez et al., 2008; Milligan et al.,
2008; van Rossum and Hanisch, 2004; Watkins and Maier, 2002; Watkins et al., 2001). Release
of cytokines by microglia increases neuronal excitability through activation of ERK and CREB
(Ji et al., 2009; Kawasaki et al., 2008). Activated microglia also release BDNF and NO (Coull et
al., 2003; Horvath et al., 2008) promoting segmental disinhibition (Coull et al., 2005). Finally,
microglia can also provoke neuronal death by ROS, pro-apoptotic cytokines such as TNF (Huang
et al., 2005), and by a diminished glutamate uptake (Chéret et al., 2008; Tawfik et al., 2008;
Tilleux and Hermans, 2007). T-cells produce specific cytokines such as INF-γ, which reduce
GABAergic currents in the dorsal horn (Vikman et al., 2003) through activation of IFN- γ
receptors (Vikman et al., 1998) and also activate and recruit microglia. Astrocytes also become
activated after peripheral nerve injury (Garrison et al., 1994; Ji et al., 2009; Milligan and
Watkins, 2009) with a slower onset and more prolonged time course than microglia, and may
play more of a role in the maintenance of neuropathic pain hypersensitivity than microglia (Gao
et al., 2009; Zhang et al., 2006; Zhuang et al., 2005). Overall, these mechanisms that follow
peripheral nerve injury either increase excitability or reduce inhibition (Latremoliere and Woolf,
2009).

9
These changes may explain most sensory abnormalities manifesting as neuropathic pain,
including spontaneous pain, hypersensitivity to stimuli and the spread of pain to regions extra-
territorial to the field originally innervated by the injured nerve.
1.2.4 Sympathetically-maintained pain
In addition to neuroplasticity of the somatosensory nervous system there are plastic changes in
the autonomic nervous system that act on sensory nerves after nerve insult, contributing to
sympathetically-maintained pain (SMP). This manifests in the somatosensory and sympathetic
nervous systems interacting , manifesting in one of the symptoms of neuropathic pain
syndromes such as neuroma pain, which may be aggravated or maintained by activity of the
sympathetic nervous system (Chabal et al., 1992).
Normally, sympathetic-sensory direct coupling between sympathetic and nociceptive neurons
does not exist in peripheral nerves or DRGs. Such an abnormal coupling typically develops after
peripheral nerve injury or inflammation, manifesting in a chemical interaction between
sympathetic and nociceptive neuron terminals in skin (i.e., catecholamines and neuropeptides
released by sympathetic nerve endings), and via the development of α-adrenoceptor-mediated
supersensitivity in nociceptors in the skin in the presence of released inflammatory mediators.
Evidence from human studies have shown the direct association of noradrenaline in the
development of hyperalgesia in sensitized normal skin, either through direct binding or
sensitization of α-adrenoceptors (Drummond, 1998, 1999; Fuchs et al., 2001; Lipnicki and
Drummond, 2001). Similarly, in patients with SMP, exogenous noradrenaline evoked
spontaneous pain and hyperalgesia in affected skin, but not in unaffected contralateral skin in
these patients or in control subjects (Ali et al., 2000). Evidence suggests that the noradrenaline
role in nociception in SMP is mediated by α 1-adrenoreceptors,which are more abundant in these
patients (Davis et al., 1991; Drummond et al., 1996; Fuchs et al., 2001).
Evidence from animal models of neuropathic pain have pointed to an increased sensitivity of
sensory nerves to noradrenaline, mediated by α-adrenoceptor subtypes 1 or 2, depending on the
species, site of injury and coexisting inflammation (Ali et al., 1999; Baik et al., 2003; Hong and
Abbott, 1996; Lee et al., 1999a; Sato and Perl, 1991). The excitatory effects of noradrenaline, as
well as other α-adrenoceptor agonists and sympathetic chain stimulation have been observed in

10
various nerve injury models. Nociceptive nerve fibbers in the neuromas of complete sciatic
nerve transected rats can be activated both by stimulation of the sympathetic chain and by local
injection of α -adrenoceptor agonists (Chen et al., 1996). Similarly, nociceptive fibbers that
survive partial injury of a peripheral nerve can be stimulated by alpha-adrenoceptor agonists in
rabbits (Sato and Perl, 1991) and primates (Ali et al., 1999), and can increase hyperalgesia and
activation of nociceptive afferents (Sato and Perl, 1991).
1.2.4.1 Direct coupling between the sympathetic neurons and sensory
neurons in the DRG
In animal models, peripheral nerve insult has been shown to trigger sympathetic nerve sprouting
into the DRG. New post-ganglionic sympathetic fibbers normally associated with blood vessels
and involved in vasoconstrictor activity, sprout and form basket-like structures around primary
neuronal cell bodies that survive the nerve injury (McLachlan et al., 1993). Studies suggest that
very few α-adrenoceptors are present on the cell bodies of primary afferent neurons under
normal conditions but that these increase following nerve injury in parallel with an increase in
regional sympathetic nerve sprouting (Birder and Perl, 1999; Ongioco et al., 2000; Petersen et
al., 1996; Xie et al., 2001). In some models of chronic pain, a pre-emptive sympathectomy
prevented the expression of chronic pain (Coderre et al., 1986). However, pain behaviour has
not yet been shown to increase with increased sympathetic sprouting in the CNS (Kim et al.,
2001). Moreover, the time of appearance of those basket-like terminals of sympathetic efferents
around somata of primary afferents in the DRGs is many weeks after chronic pain behaviour has
started or even long gone, suggesting that they are an epiphenomenon unrelated to the
appearance of chronic pain.
1.2.4.2. Chemical coupling between sympathetic efferents and sensory
neurons in skin
Two groups have reported abnormal migration and sprouting of non-peri-vascular sympathetic
fibbers in rat skin of the hindpaw (Yen et al., 2006) and lower lip (Grelik et al., 2005a, 2005b)
into the upper dermis following partial nerve injury to the sciatic and trigeminal nerve,
respectively. In each study, an increase in sensory innervation to the upper dermis was also

11
observed. Newly sprouted abnormal sympathetic fibbers were found wrapped around sensory
fibbers, forming new associations that potentially provide a histological setting for chemically
mediated coupling between sympathetic nerve terminals and sensory receptors. Peak
sympathetic innervation overlapped with an increase in spontaneous grooming of the affected
area that was not observed in the sham animals, implying a relationship between the cutaneous
changes and pain (Grelik et al., 2005a). The exact mechanism of sympathetic-sensory coupling
in these rats is yet to be established, but may involve activation of α-adrenoceptors, which may
be expressed on nociceptive fibbers and directly activate firing or they may be expressed on cells
closely associated with nerve fibbers and trigger nociceptive fibbers indirectly.
1.2.4.3. α-adrenoceptor-mediated super sensitivity of nociceptive fibbers
It seems that adrenergic responsiveness is not due to exposure of α-adrenoceptors to increased
concentrations of ligand, but rather that decreased availability of the ligand results in increased
sensitivity and/or over-expression of genes encoding the adrenergic receptor (Drummond, 2004).
Receptor sensitization and changes in expression may be associated with tissue injury and
inflammation (Gibbs et al., 2008). Noradrenaline may contribute to pain and inflammation by
enhancing the turnover of inflammatory mediators and algogenic substances, such as nerve
growth factor and prostaglandins (Gonzales et al., 1991) as part of peripheral sensitization, or
may directly trigger antidromic firing of nociceptive neurons by activating α-adrenoreceptors on
nociceptive afferents (Lin et al., 2003).
1.2.5 Nerve degeneration
In addition to peripheral and central mechanisms that contribute to neuroplasticity that occur
following nerve injury, some injured primary afferents begin to degenerate. This manifests in
the ‘dying back’ phenomenon where the proximal segments of some of the axons in an injured
nerve undergo shrinkage on the axon diameter, slowing down of conduction velocity in the
shrunk segment. In addition, some primary afferents show transganglionic degeneration of the
injured nerve terminals in the spinal dorsal horn (in the case of a peripheral and spinal nerve
injury), and in the trigeminal brainstem nuclei (in case of a trigeminal nerve injury) (Arvidsson,
1979).

12
1.3 The memory of pain and preemptive analgesia
The memory of pain exists in humans and lower animals, and frequently dominates the primary
experience leaving an impact on pathophysiology and suffering. Memory and learning are
characteristics processed by the hippocampal region of the brain. Many animal studies have
demonstrated that an analgesic given prior to a noxious stimulus or injury is more effective at
preventing central sensitization than the same analgesic given after the stimulus. The key
concept behind pre-emptive analgesia is that painful stimuli establish the memory of pain. The
hypothesis of pre-emptive analgesia is that analgesia administered before the painful stimulus
will prevent or reduce subsequent pain analgesic requirements in comparison to the identical
analgesic administered after the painful stimulus, by preventing or reducing the memory of pain
in the nervous system. For example, Dickenson and Sullivan (Dickenson and Sullivan, 1987)
showed in rats that intrathecal opiods administered before intracutaneous formalin injection
inhibit central sensitization. Opiods given just after the formalin injection had much less effect.
In another electrophysiologic study, Woolf demonstrated that the systemic morphine dose
needed to prevent central hyperexcitability, given before brief noxious electrical stimulation of
the gastrocnemious-soleus nerve in rats, was one-tenth the dose required to abolish prolonged
activity after it had developed (Woolf, 1983). Other reports suggest that the severity of acute
pain, such as surgery, influences the development of chronic pain. Wilkins et al. compared
phantom sensation and phantom pain in 60 children and adolescents with congenital limb
deficiency or amputation after surgery or trauma (Wilkins et al., 1998). Phantom sensation was
present in 7.4% of the congenital group and 69.7% of the surgical group. Data from a large
series by Sherman likewise indicate that loss of an existing limb is associated with a nearly ten-
fold greater likelihood of phantom sensation than agenesis of a limb (Sherman, 1997). Arnstein
reported that if severe pain is allowed to persist for more than 24 hours, neuroplastic changes
associated with the development of intractable chronic pain syndromes are evident (Arnstein,
1997).
1.4 Modeling chronic pain in animals
Dissecting the complex experience of chronic pain in humans necessitated invasive research in
animal models dedicated to the study of painful neuropathies. The rationale for using such

13
models is based on the expectations that mechanisms underlying chronic pain-like behaviours in
animals contribute to the same behaviours in humans with chronic pain. The genes associated
with these mechanisms could become targets of potential analgesic treatments. This highlights
the need for animal models that mimic human pain, as described below.
Earlier models of injury-induced neuropathic pain involved total denervation of a paw or a tooth,
as well as deafferenting the CNS by a few or multiple dorsal rhizotomies (i.e., by transection of
dorsal roots that provide the CNS with afferent input from all the body), or total or partial nerve
section(s), or cut-and-resuture, or crush, or freezing, or burning, or pulpectomies or pulpotomies
of the teeth (Lombard et al., 1979; Seltzer et al., 1991a). More recent models concentrated on
partial denervations of the sciatic nerve and trigeminal tributaries. Unlike models of total
denervation, these models preserve some of the sensory information passing from the hindpaw or
face to the spinal cord or brainstem nuclei, respectively. The three mostly used models are the
chronic constriction injury (CCI) model of the sciatic nerve (Bennett and Xie, 1988), the partial
sciatic nerve ligation (PSL) model (Seltzer et al., 1990), and the L5 and L6 spinal nerve ligation
(SNL) model (Kim and Chung, 1992). Much of what modern pain research has taught us has
been gained from using these models. Several additional animal models for chronic pain,
primarily for inflammatory and neuropathic pain following nerve injury, have been developed in
recent years (reviewed in (Bennett et al., 2003; Zeltser and Seltzer, 1994).
In addition to the above animal models for chronic pain that are produced by peripheral nerve
injury, other models for chronic pain caused by spinal cord injuries (SCI) are also available. SCI
pain in humans is typically perceived in several body part including regions that are insensate to
external stimuli, and is usually bilateral. It is referred to as deafferentation pain, dysesthetic pain
or central dysesthesia syndrome (Davidoff et al., 1991; Nashold, 1991; Siddall et al., 2002;
Yezierski, 1996). “Below-level” pain is the most common. This type is perceived below the
level of the injury. Other types of SCI pain include “at-level” and “above-level” pain syndromes
(Hicken, 2002; Siddall et al., 2002). “At-level” pain is associated with damage at, or near the
site of injury, and is modeled by ischemic, excitotoxic, and contusion injury to the spinal cord
(Hulsebosch et al., 2000; Siddall et al., 1995; Wiesenfeld-Hallin et al., 1994; Yezierski et al.,
1998). Excitotoxic SCI models produce excessive grooming behaviour, and autotomy, and is
associated with neuronal loss that includes the neck of the dorsal horn with sparing of the
superficial laminae (Devroede et al., 1989; Krupina et al., 2010; Speiser et al., 1991; Yezierski,

14
2005; Yezierski et al., 1998). “Below-level” neuropathic pain is modeled by the contusion
model (Christensen and Hulsebosch, 1997; Hulsebosch, 2002; Vierck and Light, 2000) and is
dependent upon partial deafferentation of rostral targets of the spinothalamic and associated
pathways (Reviewed by Yezierski, 2005). Behavioral measures include licking, guarding,
orientation, vocalizations, (Yezierski, 2005).
The Neuroma Model of neuropathic pain was the first to be studied in detail and is still one of
the few available models for spontaneous human pain syndromes triggered by nerve injury
(Coderre et al., 1986; Wall et al., 1979; Zeltser and Seltzer, 1994). This model is described in
greater details below, for it was used in the present research study.
1.4.1 The Neuroma Model for spontaneous pain
This model is expressed by self-mutilation (‘autotomy’) of a denervated paw. Transection of the
sciatic and saphenous nerves leads within couple weeks (in rats) or a few days (in mice) to
abnormally excessive licking, scratching and biting of the denervated portions of the hindpaw
(Wall et al., 1979). This behaviour lasts up to 2 months (in rats) and about 1 month (in mice).
Wall et al. (1979) developed a scoring system for this behaviour that is still widely accepted (see
Methods). The accepted explanation offered as a rationale underlying the expression of self-
mutilation in this model is that the ectopic inputs from nerve-end neuromas and the DRGs
associated with the injured nerve, combined with abnormally sensitized processing of this input
in the CNS, leads to the perception of pain that is referred to the denervated limb. In an attempt
to rid itself of the pain, the animal licks, scratches and injures the painful paw, which is the
behavioural endpoint of this model. Onset, duration and final score on the last day of the
behavioural follow up period provide as quantifiable spatio-temporal parameters of this model,
serving as indicators of the onset, duration and intensity of the pain.
There have been controversies on whether autotomy behaviour is a sign of pain (see for example
Rodin and Kruger, 1984), since similar behaviours can be induced in animals by certain skin
irritations or diseases (assumed to induce itching) and injection of excitatory agents into the CNS
(Asada et al., 1996; Nojima et al., 2004). In addition, it has been argued that the absence of
sensory input from the denervated limb may in itself result in self-mutilation because the animal
may not recognize the anesthetic limb as part of the body and attempts to remove it as if a
15
foreign body. However, although such factors may contribute to the behaviour under specific
circumstances, it is widely accepted now that autotomy following nerve lesion reflects chronic
neuropathic pain (for reviews, see Coderre et al., 1986; Devor and seltzer, 1999; Kauppila,
1998).
Autotomy behaviour can be prevented or suppressed by drugs, surgical procedures that offer pain
relief in humans, such as anticonvulsants, tricyclic antidepressants, NMDA receptor antagonists,
dorsal column stimulation and dorsal root lesions. On the other hand, analgesic drugs such as
nonsteroidal anti-inflammatory drugs, which do not offer relief for neuropathic pain patients, do
not affect autotomy (Coderre et al., 1986; Gao et al., 1996; Kauppila, 1998; Levitt, 1985; Seltzer,
1995; Wiesenfeld-Hallin and Hallin, 1984; Zeltser et al., 2000). Social manipulations also affect
autotomy levels significantly (e.g., single vs. communal housing, housing with animals that
concurrently express vs. do not express chronic pain, or housing with the opposite vs. same sex)
(Devor et al., 2007; Nissenbaum et al., 2010).
Finding genes that control both autotomy in rodents and chronic pain in humans could provide
strong evidence for this behaviour being an expression of pain in rodents. This, in fact, has
happened in part by way of work presented in this thesis dissertation for Csf2rb1 (so far only in
mice), and previously for Cacng2, a report to which we contributed (Nissenbaum et al., 2010).
Although autotomy is not a normal response of humans to chronic pain, it occurs in many
species ranging from rodents to primates. Onset and course of autotomy are closely correlated
with the timing and amount of ectopic firing of neural impulses from sensory nerve fibbers at the
severed nerve end and from the DRGs (Devor and seltzer, 1999). Treatments that suppress
chronic pain in humans had the same effect on this behaviour in operated rodents, and vice versa,
drugs that were not effective in human neuropathic pain were ineffective in blunting autotomy in
denervated rodents. The Neuroma Model was chosen for this study because it mimics the clinical
condition of phantom limb pain, anesthesia dolorosa and post-plexus avulsion syndromes that
can develop in susceptible individuals after an amputation or denervation of a limb.
16
1.4.2 Contrasting autotomy behaviour in mouse and rat strains
Autotomy levels vary greatly among different inbred, outbred and selected lines of mice and rats
raised, operated and maintained under identical environmental conditions (Defrin et al., 1996;
Devor et al., 1982; Mogil et al., 1999a; Shir et al., 2001; Wall et al., 1979; Wiesenfeld and
Hallin, 1981), demonstrating that genetic factors play a major role in controlling the contrasting
levels of autotomy in these rodents. Lines of rats have been selected for high versus low
autotomy levels from a common outbred strain of Sabra rats (Devor and Raber, 1990; Devor et
al., 2005a), further confirming the genetic basis of this trait. Since this thesis focuses on the
genetics of autotomy as a model of spontaneous neuropathic pain, two strains of mice that
contrast on the autotomy phenotype, A/J (‘A’; a high-autotomy inbred strain) and C57BL6/J
(‘B’; a low-autotomy inbred strain) mice were chosen to compare their gene expression levels in
key neural tissues that control pain chronicity – the peripheral injured nerve and the spinal cord.
A few studies documented the contrast in autotomy levels between A and B mice, showing the
high susceptibility in A mice (Devor et al., 2007; Minert et al., 2007a; Mogil et al., 1999a;
Seltzer et al., 2001), and the resistance to autotomy behaviour in B mice, following a period of
35-36 days post-hindpaw denervation (Devor et al., 2007; Minert et al., 2007b; Seltzer et al.,
2001). In addition to studies on spontaneous pain, A and B mice were also shown to contrast in
stimulus-evoked pain behaviours following PNI and SNL (Mogil et al., 1999a; Persson et al.,
2009b).
The A inbred strain is widely used in cancer and immunology and has been developed by LC
Strong in 1921 from a cross between a Cold Spring Harbour albino and a Bagg albino
(http://jaxmice.jax.org/strain/000646.html). It is highly susceptible to cortisone-induced
congenital cleft palate. It has a high incidence of spontaneous lung adenomas, and lung tumors
readily develop in response to carcinogens. In addition to atherosclerosis resistance, A mice are
resistant to diabetes, obesity, insulin resistance and glucose intolerance. On either chow or high
fat diet, A mice maintain low glucose and insulin levels. A mice develop cigarette smoke-
induced emphysema in approximately half the time when compared with B mice. Structural lung
damage caused by induced asthma mimics the phenotype found in asthma patients more closely
than does the induced damage in BALB/cJ mice.

17
The B inbred strain is commonly used as a general purpose strain and background strain for the
generation of congenics carrying both spontaneous and induced mutations
(http://jaxmice.jax.org/strain/000664.html). B mice are used in a wide variety of research areas
including cardiovascular biology, developmental biology, diabetes and obesity, genetics,
immunology, neurobiology, and sensorineural research. B mice have a low susceptibility to
tumors and delayed senescence relative to BALB/cJ and DBA/2J. Other characteristics include
among others 1) a high susceptibility to diet-induced obesity, type 2 diabetes, and
atherosclerosis; 2) resistance to audiogenic seizures and 3) late-onset hearing loss.
1.4.2.1 Additional mouse strains used to study autotomy
behaviour
In addition to A and B mice, many other inbred mouse strains are used to study autotomy
behaviour, such as 129/J, AKR/J, BALB/cJ, C3H/HeJ, C3H/HeN, C58/J, CBA/J, RIII/J and
SM/J. These strains were previously phenotyped by us and others to determine their
susceptibility to develop autotomy following hind paw denervation (Blech-Hermoni, 2005;
Mogil et al., 1999a). Here we introduce and describe the additional strains that contrast in
autotomy behaviour which we used in our follow-up assays for seeking candidate pain genes.
The C3H mouse strain is susceptible for the development of autotomy behaviour
following hind paw denervation. It was developed in 1920 by LC Strong from a cross of
a Bagg albino female with a DBA male. A spontaneous mutation occurred in C3H/HeJ
strain sometime between 1960 and 1968 at the Tlr4 gene locus (Tlr4lps
). This is a
dominant-negative point mutation Pro→His at position 712 in the third exon of the gene
(Poltorak et al., 1998). These mice are therefore considered TLR4-deficient mice.
C3H/HeJ mice are non-responsive to lipopolysaccharide and thus endotoxin resistant
(Morrison and Ryan, 1979). They are highly susceptible to infection by Gram-negative
bacteria, and once infected with Salmonella exhibit a delayed chemokine production,
impaired nitric oxide generation, and attenuated cellular immune responses.
Macrophages from C3H/HeJ mice fail to induce inflammatory cytokines such as TNFα,
IL-1 and IL-6 (Morrison and Ryan, 1979). These mice have been maintained at the
Jackson laboratory and are distinct from the C3H/HeN mice, maintained by Harlan and

18
lack the mutation in the Tlr4 locus. C3H/HeN mice are the respective wild type controls.
This thesis contains studies using both C3H/HeJ and C3H/HeN mice (Chapters 4 & 5).
More description on these mice and their phenotypic variability is discussed in Chapter
5.1.
The AKR/J inbred mouse strain is resistant to autotomy behaviour following hind paw
denervation. AKR mice were originally inbred at the Rockefeller Institute, and are
widely used in cancer research for their high leukemia incidence (60-90%) and in
immunology as a source of the Thy1.1 (theta AKR) antigen. AKR/J mice are viremic
from birth, and express the ecotropic retrovirus AKV in all tissues. Other mutations that
characterise this strain include alteration in hair development, adrenocortical lipid
depletion, resistance to aortic lesion formation on a semi-synthetic high fat diet and hypo
responsiveness to diets containing high levels of fat and cholesterol.
1.5 Mini-review of the genetics of neuropathic pain
It is generally believed that behavioural traits related to chronic pain reflect altered gene
expression levels in the cell body of the injured primary afferent neurons in DRGs associated
with the injured nerve, in their intact neighbours, as well as in neurons and glia in the CNS
(Coyle, 2007; Griffin et al., 2007; Kim et al., 2009b; Ko et al., 2002; Liu et al., 2012a; Nesic et
al., 2005; Persson et al., 2009b; Rodriguez Parkitna et al., 2006; Sun et al., 2002; Valder et al.,
2003; Wang et al., 2002a). Both peripheral and central mechanisms contribute to neuroplasticity
that depends on the expression of specific genes in the PNS and CNS. There have been a few
genome-wide studies to identify genes regulated by nerve injury and correlated with chronic pain
levels in animal models (Coyle, 2007; Griffin et al., 2007; Kim et al., 2009b; Ko et al., 2002;
Lacroix-Fralish et al., 2006; Liu et al., 2012a; Nesic et al., 2005; Persson et al., 2009b; Rodriguez
Parkitna et al., 2006; Sun et al., 2002; Valder et al., 2003; Wang et al., 2002a). Most of the
studies on gene expression profiling after nerve injury have been modeled in rats, and fewer
studies were performed in mice. The present study used the Neuroma Model for spontaneous
neuropathic pain in mice, which mimics the pathophysiology of pain in human leg amputees, to
study novel genes and decipher new mechanisms within peripheral and central neural tissues.
We hypothesize that both mice and humans carry the same genes and have similar mechanisms
19
by which neuropathic pain is established and maintained. The rationale for comparing human to
mouse genomes is discussed in Section 1.6.
The following identified genes include members of several classes, which operate to produce
chronic pain in numerous mechanisms. These are G protein-coupled receptors (‘GPCR’), ligand-
and voltage-gated ion channels, receptor tyrosine kinases, growth factors and neurotrophic
factors, cytokines are inflammatory mediators, neuropeptides, cell cytoskeletal genes, cell
surface/extracellular matrix genes, and more. GPCRs are neurotransmitter receptors and they
produce chronic pain by increasing intracellular Ca2+
and by exciting or inhibiting neuronal
activity; Ligand- and voltage-gated ion channels include Na+, K
+ and Ca
2+ types and they
produce chronic pain by increasing or diminishing electrical excitability. Receptor tyrosine
kinases include PKA, PKC and ERK and they produce chronic pain by phosphorylating
membrane bound receptors and activating them. Several growth and neurotrophic factors
contribute to chronic pain, and these include NGF, EGF, GDNF and BDNF. They can change
the expression levels of some ion channels in the DRG when they are no longer transported to
the cell body, in occurrence with the disconnected nerve from the periphery. Other ways by
which neurotrophic factors can contribute to chronic pain is by axonal sprouting and by
decreasing inhibition (BDNF). Cytokines are inflammatory mediators that contribute to glial
activation and to neuronal hyperexcitability, provoke cell death and reduce GABAergic currents
in the dorsal horn thus producing chronic pain. Neuropeptides such as substance P and
neurokinin A function as neurotransmitters and contribute to the development of chronic pain by
modifying the excitability of sensory and sympathetic nerve fibbers, inducing vasodilation, and
promoting the release of further chemical mediators by inflammatory cells.
The proteins encoded by these genes have helped forming, in part, the current dogma that
neuropathic pain involves the cross talk of many cell types in the nervous system, namely
various types of neurons and glial cells. In this respect, neurons fire impulses but also respond to
activated glial cells (i.e., microglia and astrocytes) that release factors to which neurons respond
and change their excitability. In addition to the changes in the levels of specific gene expression,
changes in protein structure by way of post-translational protein modifications may also play a
role after nerve injury in DRGs, trigeminal ganglion, spinal cord, brainstem and brain
(Latremoliere and Woolf, 2009).
20
1.5.1 Neuropathic pain genes in partial nerve injury models
A few genes for neuropathic pain behaviour were previously identified by others, in
collaboration with our group. An example is the Cacng2 gene, a gene for spontaneous
neuropathic pain, which is discussed in greater detail in the Discussion of this dissertation. Other
genes of stimulus-evoked neuropathic pain that have been identified using partial nerve injury
models include Kcns1, Trpa1 and P2rx7. The potassium channel alpha subunit KCNS1,
involved in neuronal excitability, is constitutively expressed in sensory neurons and markedly
downregulated in rats following SNI, CCI and SNL relative to their naïve controls (Costigan et
al., 2010). The same study also identified a single SNP within the Kcns1 gene in humans that
correlated with neuropathic pain in five of six independent patient cohorts (total of 1359
subjects). These cohorts included patients with lumbar back pain with disc herniation and limb
amputation pain subjects. Another study by the same group indicated that TRPA1, a
nonselective cation channel expressed by nociceptors, contributes to cold hypersensitivity in rats
following SNI (del Camino et al., 2010). Finally, variation within the coding sequence of the
gene encoding the P2X7 receptor, a member of the family of ionotropic ATP-gated receptors,
affects chronic pain sensitivity in both mice and humans (Sorge et al., 2012).
1.6 Epigenetics and chronic pain
Epigenetics refers to genetic control by factors other than the DNA sequence that alters gene
expression levels. Among these are environmental factors that play a critical role in pain
phenomics and genetics. Gene regulation is modified in part by DNA methylation and
unmethylation processes. When DNA is unmethylated, it is exposed in a manner that allows
gene transcription machinery to bind to it and begin transcription. During gestation, different
tissues acquire specific patterns of DNA methylation. These patterns confer cell type identity by
regulating genome function (Razin and Szyf, 1984). DNA methylation is a reversible biological
signal (Ramchandani et al., 1999) that occurs in response to external signals. We now know that
DNA methylation is also involved in chronic pain (Doehring et al., 2013; Qi et al., 2013). This
is important because DNA methylation is not only a mechanism underlying inter-individual
differences in the susceptibility for developing chronic pain, but it is also potentially reversible
by pharmacological or therapeutic interventions (Stone and Szyf, 2013). Wang et al. recently
demonstrated a role for DNA methylation in the spinal cord following nerve injury in rats (Wang
21
et al., 2011) and Tajerian et al. reported that methylation of the SPARC promoter in
intervertebral discs is associated with chronic back pain in both pre-clinical models and in human
patients(Tajerian et al., 2011). Thus, studies exploring the relationship between epigenetics and
chronic pain will identify differentially regulated genes and pathways that can be more directly
targeted pharmacologically.
1.7 Sex and gender differences in chronic pain
Documented evidence indicates that the prevalence of many common chronic pain conditions is
higher in females compared to males (Fillingim et al., 2009). For example, females show higher
frequencies of many musculoskeletal pain conditions, migraines, and irritable bowel syndrome
(Fillingim et al., 2009). Neuropathic pain-like behaviours in rodents following partial nerve
injury or spinal cord injury also demonstrates strain-dependent sex differences (DeLeo and
Rutkowski, 2000; Gorman et al., 2001). In rodents, sex differences can also be influenced
significantly by genotype (Mogil et al., 2000), such that within the same strain males express
more pain than females, or vice versa. Examples include 129/J, A/J, BALB/cJ, CBA/J and CM/J
mouse strains. Differences also exist between the sexes in response to analgesics, especially
opiods. Male rodents show robustly more opioid antinociception compared to their female
counterparts (Craft, 2003); however, sex differences in opiod analgesia depend on the specific
opioid, the way a drug is administered, and the pain model used (Niesters et al., 2010). Some
documented a slightly more analgesic effect of morphine among women than men (Niesters et
al., 2010).
1.8 Rationale for comparing mouse to human genomes
The mouse model is a powerful tool to investigate the mechanisms underlying a complex trait
using invasive methodologies that are impossible in humans. Mouse genomes provide robust
bioinformatic tools to identify human genes by offering a first screen that identifies quantitative
trait loci (QTLs) for a trait under investigation, thereby directing attention to specific
chromosomal regions along the human genome where candidate pain genes may be sought. A
comprehensive understanding of gene regulation in animal models of ongoing pain is greatly
needed in order to better understand the molecular mechanisms of neuropathic pain and to
identify novel targets for the development of better pain treatments.

22
Identifying genetic variations in human subjects with/out chronic pain could highlight genes that
control pain via sequence variations in coding regions that could result in variable protein
expression and function operating in pain pathways. There are, however, other genetic
mechanisms that could affect the pain phenotype, such as gene expression levels that result in the
abundance of the gene products, thereby affecting neural functions associated with processing
pain inputs. Since the tissues associated with pain processing (i.e., brain, spinal cord and DRGs)
are not available for study in living human subjects, and suitable post-mortem material is not
available, we must rely on animal models for studying tissue-specific gene expression levels or
sequence variations. The close homology in genomes of human vs. other mammalian species,
and the similarity between humans and rodents in brain pathways and some pain phenotypes,
justify a comparative whole-genome approach (Vallender and Lahn, 2004). Mice are used for
genetics since the murine genome is the most studied and there are powerful assays available for
genetic manipulation. There are readily available inbred mice lines of different genetic
background. In fact, four of these lines (DBA/2J, 129/J, A and B) have already been fully-
sequenced by Celera:
(http://findarticles.com/p/articles/mi_m0EIN/is_2000_Oct_12/ai_66001567) and many others
genotyped in high density (Frazer et al. 2007). These lines contrast on several pain phenotypes,
one of which is autotomy (Mogil et al., 1999a). There are additional resources available for
mapping the murine genome for QTLs, including recombinant inbred lines (RIs) that are
descendants of parental lines that contrast on pain phenotypes, i.e., the 23 lines of the AXB-BXA
RI set that were derived as recombinant inbred daughter lines by crossing the A and B strains,
and that express highly contrasting line-specific autotomy levels following the same hindpaw
denervation (Seltzer et al., 2001). Furthermore, haplotype maps (‘Hapmaps’) of many inbred
mouse strains are now available from Perlegen (Frazer et al., 2007);
(http://www.ncbi.nlm.nih.gov/SNP/), Roche (Liao et al., 2004), and MIT
(http://www.broad.mit.edu/mouse/hapmap/). Consomic lines (Nadeau et al., 2000; Singer et al.,
2004); http://jaxmice.jax.org/type/consomic.html), advanced intercrossed lines (AILs) (Darvasi
and Soller, 1995) and congenic lines
(http://www.informatics.jax.org/morsebook/frames/frame11.shtml), are now available for in-
silico QTL mapping. Additionally, genetic manipulations such as knock-outs, knock-ins, small
interference RNA (siRNA), antisense treatments, and ENU-induced mutations, are all powerful

23
methodological approaches that enable investigators to study the genetics of pain in mice. These
make mice the best animal model to identify genetic determinants controlling chronic pain. No
less important is the fact that there are a number of mouse models for neuropathic pain, of which
the Neuroma Model (autotomy) was chosen for this study. Since work done by others and our
group have already identified the A and B mice as strains contrasting on this trait, part of the
present study was to compare gene expression levels in neural structures of these two lines.
Mouse strains expressing variable phenotypes under the same experimental conditions are often
used to positionally map genetic loci associated with that phenotype. These assays are also
known as QTL mapping assays. In a previous QTL mapping study that used 23 AXB and BXA
recombinant inbred (RI) lines, and their parental A and B inbred strains, from which the AXB
and BXA lines were derived by repeated crossings and inbreeding, our group identified Pain1, a
QTL on mouse chromosome 15 having a major effect on autotomy behaviour (Seltzer et al.,
2001). This study was based on the documented contrast in autotomy levels expressed by A and
B mice following the same hindpaw denervation procedure. The presence of a QTL in Pain1 has
been since confirmed by another study that used a different genetic assay and parental strains of
a different genetic background than those used by our group (Devor et al., 2005b). QTL
mapping is an unbiased approach to seek for the causative gene(s) in Pain1, which has already
come to completion. Another unbiased approach to seeking for Pain1 genes is a whole genome
expression profiling array which is used in this study (Veltman and de Vries, 2006). The
rationale for using a whole-genome array to seek for Pain1 genes in the DRGs and the spinal
cord is that both of these tissues are targets of neuroplasticity that may contribute to the contrast
in autotomy behaviour in A vs. B mice. We were interested to isolate the target tissue for Pain1.
We reasoned that if Pain1 controls autotomy in the PNS it would be regulated in the DRGs, and
if Pain1 plays role in the CNS it would be regulated in the spinal cord or the brain. We chose to
look for Pain1 in the spinal cord because of the numerous changes that occur both in neurons
and in glia cells following the nerve denervation which may be attributed by alterations in gene
expression levels.

24
1.9 Hypotheses and Aims
On the basis of this introduction, we posit that:
1. Contrasting spontaneous chronic neuropathic pain (CNP) behaviour following hindpaw
denervation in the mouse is associated with differential gene expression levels in DRGs
associated with the injured nerves, and in lumbar spinal cord segments that process
afferent inputs from these nerves.
2. The environment can influence the levels of spontaneous CNP behaviour of mice
following hindpaw denervation in the mouse by way of regulating the expression level of
some of the genes in the DRGs associated with injured nerves, and/or in the lumbar
spinal cord.
3. One or more genes in mouse Pain1 control the variability in autotomy levels across
strains of mice undergoing the same hindpaw denervation in the DRG, the spinal cord or
the brain.
To address these hypotheses, the aims of this dissertation are:
1. To use whole genome expression microarrays to identify CNP genes in lumbar DRGs
and spinal cords of inbred mice expressing contrasting autotomy levels following
hindpaw denervation by peripheral neurectomy.
2. To identify in these whole genome expression microarrays CNP genes in lumbar DRGs
and spinal cords that regulate their expression level by interaction with the environment,
thereby affecting the levels of autotomy following hindpaw denervation by peripheral
neurectomy.
3. To prioritize the best gene for autotomy in Pain1 using molecular and
immunohistochemical techniques.

25
Chapter 2 Materials and Methods
This project has been approved by the Ethics Committee of the University of Toronto (protocols
numbers: 20006329, 20007793, 20008876 and 20008322). This study also adhered to the
guidelines of the International Association for the Study of Pain and those of the National
Institutes of Health (NIH), which funded this project.
2.1. Induction and assessment of the pain phenotype (autotomy)
2.1.1 Mice
Mouse strains with contrasting autotomy behaviour were used herein to study gene and protein
expression levels that correlate with the phenotype. A total of 233 male mice (79 A/J; 60
C57BL6/J; 39 C3H/HeJ; 38 C3H/HeN; 17 AKR/J) ages 8-12 weeks were used in the studies
reported here (Table 1). For the purpose of gene expression, immunohistochemistry and
behavioural studies, these mice were denervated, sham-operated (see below Surgical Procedures)
or left intact. For the genome wide expression profiling study, spinal cords and DRGs from the
same mice were profiled on individual arrays except for one spinal cord and one DRG isolated
from 2 different mice.
Study I: Genome-wide expression profiling of A vs. B mice: This study was used as a non-
biased approach to seek for candidate genes, particularly in Pain1, associated with autotomy
behaviour. For this study we used 7 groups of mice (detailed below) to seek for contrasts in gene
expression levels within high autotomy mice and low autotomy mouse groups of the A and B
strains. A total of 89 male mice (45 A/J; 44 C57BL6/J) ages 8-9 weeks comprised this study,
including 8 intact mice per strain, 12 sham-operated mice per strain and 24 and 25 mice that
underwent the denervation procedure. For the purpose of gene expression profiling, 5 mice per
group were selected; the groups, naïve (AI, BI), sham (AS, BS), denervated low-autotomy
(ADL, BD) and denervated high-autotomy (ADH).
Study II: Follow-up assays for Csf2rb1 gene: This study was used in order to validate, in part,
the findings of Pain1 candidate gene, Csf2rb1, resulting from the gene expression profiling.
Mice were denervated, sham-operated or were left intact for further qPCR and

26
immunohistological experiments. Additional to the A and B strains, other mouse strains with
contrasting autotomy behaviour were used in this study to validate the up regulation in Csf2rb1
gene expression in high autotomy mice compared to low autotomy mouse groups. A total of 148
male mice (62 A/J; 30 C57BL6/J; 39 C3H/HeJ; and 17 AKR/J) ages 8-12 weeks were included
in this study.
Study III: Studying Csf2rb1-associated genes, Tlr4 and Stat3, with autotomy behaviour: This
study was used to correlate Tlr4 and Stat3 genes with autotomy behaviour and with Csf2rb1 in
mice. Autotomy behaviour and Csf2rb1 gene expression levels were compared between Tlr4
wild-type and mutant mice. pStat3 was compared immunohistologically in the spinal cord and
brain tissues of high autotomy A mice and low autotomy A and B mouse groups. A total of 88
male mice (8 A/J; 3 C57BL6/J; 39 C3H/HeJ; and 38 C3H/HeN) ages 8-12 weeks were used in
this study.
Table 1: Strains, group types and the number of animals per group
Intact = naïve mice, not operated; Sham = transection of the skin and muscles of hindpaw;
Denervated = transection of the sciatic nerve as well as skin and gluteal muscles, transection of
the saphenous nerves involved additional cut of overlaying skin; No/Low = autotomy scores of
0-1; Moderate = autotomy scores of 2-7; High = autotomy scores of 8-11.
Strains A B C3H/HeJ AKR C3H/HeN
Groups
Autotomy levels
No/Low High No/ Low No/Low High No/Low No/Low High
Intact 16 12 6 6 6
16
Sham 20 16 6 6 12
Denervated 18 25 32 17 10 5 4
SUBTOTAL 54 25 60 29 10 17 22 16
TOTAL=233 79 60 39 17 38

27
Autotomy levels by strain:
NLS-A No/low scores of autotomy in A mice
NLS-B No/low scores of autotomy in B mice
NLS-AKR/J No/low scores of autotomy in AKR/J mice
NLS-C3H/HeJ No/low scores of autotomy in C3H/HeJ mice
NLS-C3H/HeN No/low scores of autotomy in C3H/HeN mice
MHS-A Moderate/High scores of autotomy in A mice
MHS- C3H/HeJ Moderate/High scores of autotomy in C3H/HeJ mice
MHS- C3H/HeN Moderate/High scores of autotomy in C3H/HeN mice
2.1.2 Surgical procedures
Animals were deeply anesthetized by an induction dose of 4% halothane inhalation, switched
down to 2% for a maintenance dose. When the animal became irresponsive to noxious stimuli
(pinching the paw or tail), the fur on the left leg was clipped, and under sterile conditions the
sciatic nerve innervating the left hindpaw was exposed unilaterally by cutting the skin and the
overlaying gluteal muscles. The nerve was then tightly ligated with 2 5-0 silk sutures with the
proximal suture being first, and transected in between the ligatures. This order ensured that the
injury introduces only one injury discharge to the nervous system by way of the proximal suture.
The skin was closed with Michel metal clips (#9), which were removed on PO day 14. The
saphenous nerve was exposed on the same side through a skin incision on the medial thigh,
ligated (as above), and cut. The wounds were closed in layers using 4-0 vicryl sutures. For mice
undergoing sham operation, the skin and overlying muscles on the left hindpaw were cut and re-
sutured (as above), leaving the sciatic and saphenous nerves intact. After recovery from the
anesthesia in a holding cage (kept at 300C) the animals were returned to their original cage
groupings, 4 per cage. Mice of the same strain and treatment were caged together and kept in the
animal facility of the Faculty of Dentistry at the University of Toronto under normal husbandry
conditions [i.e., water and chow pellets (2018 Teklad global 18% protein rodent diet that is based
in part on soy protein [www.harlan.com/products])] were supplied ad libitum; a 12 hr light/dark
cycle, lights switched on at 07:00]. Mice were sacrificed on day 14 PO (A/J, C57BL6/J and
C3H/HeN mice), 21 PO (C3H/HeJ and AKR/J mice) or upon reaching the maximal ethically
permissible score of autotomy score of 11 (see 2.1.3, below).

28
2.1.3 Phenotyping autotomy behaviour
Autotomy was scored daily by a single trained observer (MYA) using the following acceptable
scale (Wall et al., 1979). Removal of one nail was not scored as part of the autotomy behaviour
because it could have been caused by a traumatic accident to an insensate nail. Removal of two
or more nails was considered an intentional act driven by the animal’s wish to rid itself of the
pain referred to the spontaneously painful paw. One point was assigned for two or more injured
nails, and for each injured half toe, up to a maximal ethically permitted score of 11 if all 5 toes
were self-injured. If an animal reached this score prior to the end of the study on days 14 or 21,
it was euthanized and its score was added in subsequent days as if it is still alive. These scores
were used in data analyses together with scores of other animals in its group. There is no way to
avoid bias of the experimenter to the strain under study because A mice are albino whereas B
mice are black. However, experimenters were partially blinded to the experimental group within
each strain because both sham operated and denervated mice had skin wounds and metal clips.
Nevertheless, it is impossible to avoid some biasing because denervated mice are paralyzed and
disclose their neurological status by dragging behind the paralyzed leg; whereas sham operated
mice are not. See Table 1 for a summary of strains, experimental groups, treatment types and
phenotypic levels.
2.2 Tissue acquisition
Mice were deeply anesthetised by an i.p. injection of a mixture of urethane (1.125 mg/kg) and
alpha chloralose (75 mg/kg) prior to trans-cardiac perfusion-fixation. The cardiac cavity was
exposed, a metal cannula connected to 2 20ml syringes was driven through the apex to the
ascending aorta and clamped in situ. The right atrium was cut and the circulatory system flushed
with diethyl pyrocarbonate (DEPC)-treated saline (to limit the entry of exogenous RNAases from
the perfusate). Then the body tissues were fixed by perfusion with RNAlater (Ambion,
Burlington, ON, Canada) following the protocol of LeDoux et al. (2006) to maintain RNA
integrity post-mortem. The lumbosacral spinal cord and the ipsilateral L3-L6 DRGs were
extracted under direct vision using a stereomicroscope (at X25), dripping RNAlater during the
entire procedure to maintain RNA integrity and prevent the tissues from drying. For
immunohistochemical staining, mice were flushed with 1% Phosphate Buffered Saline (PBS, 20

29
ml) followed by 4% paraformaldehyde (50 ml), spinal cord segments L3-L6 and whole brains
were carefully removed and stored at 30% sucrose until sectioning.
2.3 RNA extraction
DRG tissues were disrupted and lysed with GITC-containing buffer (buffer RLT; Qiagen,
Mississauga, ON, Canada) using the disposable polypropylene pellet pestle (Sigma, Oakville,
ON, Canada). Next, the samples were homogenized by passing them through a syringe fitted
with a 20-gauge needle. High-molecular weight DNA was sheared by passing the lysate though
the needle at least 20 times or until a homogeneous lysate was achieved. RNA extraction was
then followed using the RNeasy micro-kit (Qiagen, Mississauga, ON, Canada). Briefly, ethanol
was added to the samples to adjust binding conditions, and then applied to RNeasy MiniElute
Spin Columns for adsorption of RNA to membrane. Contaminants were removed with simple
wash steps, and RNA was eluted from the column with RNase-free water.
Spinal cord tissues were homogenized in QIAzol (Qiagen, Mississauga, ON, Canada) using a
tissue rupture (Qiagen, Mississauga, ON, Canada) with plastic disposable probes. RNA
extraction followed thereafter, using the lipid tissue mini-kit (Qiagen, Mississauga, ON, Canada).
Briefly, Chloroform was added to the samples to separate the phases of the lysate, and then
ethanol was added to the aqueous phase to adjust binding conditions. Samples were applied to
RNeasy Spin Columns for adsorption of RNA to membrane. Contaminants were removed with
simple wash spins of buffers RW1 and RPE, and RNA was eluted from the column with RNase-
free water.
RNA purity and concentration was confirmed from the OD readings at wavelengths of 260/280
nm using a dual beam UV spectrophotometer (Biochrom, Holliston, MA, USA) then by running
1.5% agarose gel. For microarray, RNA integrity was determined by capillary electrophoresis
using the RNA 6000 Nano LabChip and the Agilent Bioanalyzer 2100. RNA samples were
stored at -80°C until further analysis.

30
2.4 Microarraying and data analysis
2.4.1 Study design
In this study we arrayed DRG and spinal cord tissue specimen from individual mice, 5
mice per group, to seek for autotomy candidate genes. We discuss our rationale for
choosing this design over other previously published studies in the field in the following
section. In the majority of gene studies, pooled RNA, rather than individual samples
from spinal cord or DRGs, was used for array analyses. On the one hand, group
comparisons, based on whole genome gene expression data that use pooled samples, is
economical because it involves fewer expression arrays. On the other hand, however,
pooling carries an unavoidable disadvantage that one cannot exclude a-priori individual
outliers from the arrayed group, because their RNA is pre-mixed with that of non-
outliers. Having outliers in the group is bound to skew the group average and increase its
variance, as it is impossible to determine which animal sets off the mean of a group,
skewing the group average either to a falsely higher or lower value from the true average
value. Unlike arithmetic averaging that seeks the mean value of a group after a careful
examination of the values contributed by individuals in the group, allowing pre-averaging
exclusion of outliers, such studies produce inherently imprecise data, as opposed to the
use of individual animals. Thus, the pooled approach is bound to be less sensitive in
identifying true findings by increasing false positive and false negative candidate gene
identifications.
In neurobiology studies especially, particular genes that encode for stress-response
proteins and immunoglobulins, can be affected by many factors unrelated to the
experimental treatment. As a result, some individual samples could potentially have
levels 5-10 fold higher than levels typical of the group in some of these genes (Hardiman,
2009). For example, individual animals may be infected or some tissue samples may be
anoxic for relatively long periods before they are preserved, which allows cells to
respond to stress. It is easier to detect and compensate for such aberrations, if individual
samples are hybridized. A comparison of samples from pooled and non-pooled design
found that most identified genes that differentially regulated between the two groups in

31
the pooled study resulted as extreme outliers in only one individual in the non-pooled
study (Hardiman, 2009). Furthermore, examining individual samples separately allows
one to estimate variation between individuals which is sometimes important and often
interesting. Therefore, it is generally recommended against pooling from only a small
number of individuals (n<20) (Hardiman, 2009). For these reasons, this study focused on
individualized array analysis.
Previous gene expression studies on mice, mostly using the pooled approach, focused their
attention either on one tissue, such as DRG, spinal cord or brain, or on one gene, such as using
knockout mice, or on disease causing neuropathic pain. However, no report has appeared in
press on a study in mice after peripheral nerve injury, used the single animal arraying study
design to seek neuropathic pain-related genes in both the DRGs and spinal cord in the same
study. Thus, the significance of the present study is that it is the first to use single animal
arraying to detect altered gene expression levels both in the DRGs and spinal cord in an attempt
to find mechanisms involved in the contrasting neuropathic pain-related behaviour.
In this study, we arrayed RNA extracted from DRGs of individual mice, one mouse specimen
per array, in 7 groups, for a total of 35 arrays. In a different and parallel experiment, we arrayed
RNA extracted from spinal cords of the same individual mice, one mouse specimen per array, in
7 groups, for a total of 35 arrays. The total number of arrays used in our study was 70. Figure 1
shows the study design for this experiment.

32
Figure 1: Study design for microarray experiment. Showing in (A) the 35 arrays divided into 7
mouse groups and corresponding to DRG RNA extracted from 35 individual mice, and in (B) the
35 arrays divided into 7 mouse groups and corresponding to spinal cord RNA extracted from the
same 35 individual mice. Group comparisons are demonstrated by green (Naive A vs. Naïve B)
red (MHS-A vs. Sham A; MHS-A vs. NLS-A; MHS-A vs. NLS-B) and blue (NLS-B vs. Sham B)
arrows. The B sham group was excluded from the main data analysis, but served as an internal
control to isolate genes in the B strain that are involved with denervation, Wallerian
degeneration, nerve regeneration and apoptosis.
A A
1 2 3 4
5 6 7
Mouse 4
Mouse 1 Mouse 2
Mouse 5
Mouse 3
Mouse 9
Mouse 6 Mouse 7
Mouse 10
Mouse 8
Mouse 14
Mouse 11 Mouse 12
Mouse 15
Mouse 13
Mouse 19
Mouse 16 Mouse 17
Mouse 20
Mouse 18
Mouse 24
Mouse 21 Mouse 22
Mouse 25
Mouse 23
Mouse 29
Mouse 26 Mouse 27
Mouse 30
Mouse 28
Mouse 34
Mouse 31 Mouse 32
Mouse 35
Mouse 33
Naïve Sham A
NLSA
MHS
BNaive
BSham
BNLS
= Array; A = A mice; B = B mice; MHS = Moderate/High autotomy scores
NLS = No/Low autotomyscores
B. Spinal Cord
A A
1 2 3 4
5 6 7
Mouse 4
Mouse 1 Mouse 2
Mouse 5
Mouse 3
Mouse 9
Mouse 6 Mouse 7
Mouse 10
Mouse 8
Mouse 14
Mouse 11 Mouse 12
Mouse 15
Mouse 13
Mouse 19
Mouse 16 Mouse 17
Mouse 20
Mouse 18
Mouse 24
Mouse 21 Mouse 22
Mouse 25
Mouse 23
Mouse 29
Mouse 26 Mouse 27
Mouse 30
Mouse 28
Mouse 34
Mouse 31 Mouse 32
Mouse 35
Mouse 33
Naïve Sham A
NLSA
MHS
BNaive
BSham
BNLS
= Array; A = A mice; B = B mice; MHS = Moderate/High autotomy scores
NLS = No/Low autotomyscores
A. Dorsal Root Ganglia

33
2.4.2 Agilent Two-Color Microarray Protocol
Microarray-based gene expression analysis was performed using the Agilent 4x44K gene chip
Microarray Centre, UHN, Toronto, ON, Canada). Complementary RNA (cRNA) was amplified
for a two-color microarray gene expression analysis. Labelled cRNA was synthesized using
double-stranded cDNA (Quick Amp Labeling protocol, Agilent): first and second strand cDNA
was synthesized from 200 ng or more total RNA using an MMLV-RT Oligo dT promoter Primer
containing a T7 RNA polymerase promoter site (Agilent Quick Amp Kit, Two-Color,
Mississauga, ON, Canada); the cRNA was synthesized and labelled with Cy5-CTP or Cy3-CTP
NPTs by in vitro transcription using T7 promoter-coupled double stranded cDNA as template;
and the amplified cRNA product was purified using an RNeasy mini spin column (Qiagen,
Mississauga, ON, Canada) with buffer RPE. The yield of the in vitro transcription reaction was
determined by product absorbance at 260 nm measured using NanoDrop ND-1000 UV-VIS
Spectrophotometer (Agilent, version 3.2.1, Mississauga, ON, Canada). Following labelling,
samples were hybridized to the Agilent 4x44K gene chip, using the Agilent Gene Expression
Hybridization Kit (65ºC, 17 hrs, 10 rpm). Arrays were washed and scanned immediately to
minimize the impact of environmental oxidants on signal intensity (GenePix 4000B scanner,
Molecular Devices, Sunnyvale, CA, USA). The microarray scanned data was extracted to
images using Agilent Feature Extraction Software, producing output files of the ‘*.tiff’ format,
for determination of gene expression levels. To avoid bias, samples were blinded and treated on
the microarray in a randomized fashion.
2.4.3 Expression array analyses
Log ratio data from the Agilent 2-color microarray were imported into and analyzed with Partek
Genomic Suite software version 6.4. Two independent gene expression analyses were performed
for mRNA extracted from: (i) the DRGs, and (ii) spinal cords. For each microarray analysis,
gene expression levels were compared within- and between-strains of the intact/naive, sham-
operated and denervated A and B strains, for a total of 4 comparisons. Each group comprised
five animals that were selected for meeting the criteria of expression of certain levels of
autotomy (or the lack thereof) following hindpaw denervation, and satisfactory perfusion

34
fixation, judged the by hardness of the perfused material. Total RNA from each animal
represented one biological sample for arraying.
Prior to running the statistical tests, samples were controlled for the following factors in a four-
way ANOVA: (i) Batch Day, (ii) Strain (A vs. B), (iii) Operation Type (naïve vs. sham vs.
denervated), and (iv) Autotomy Phenotype (NLS vs. MHS of 2-11). The outcome for controlling
the samples yielded 2 outliers that were excluded from the statistical analysis (one denervated
NLS-A mouse was excluded from DRG data; one B sham mouse was excluded from spinal cord
data). For those 2 groups that had an outlier removed, the statistical tests were performed on 4
mice per that group, instead of 5 mice per group.
Following correction, each two selected comparison groups were analyzed by ANOVA, and
gene lists were then generated according to the following criteria: p-value<0.05 and -1.5<fold
change>1.5. An independent comparison between naïve/intact A vs. B mice (AI vs. BI) was
performed. Three additional independent comparisons between groups of denervated mice
expressing high-autotomy vs. low- autotomy scores were performed and were later used in a
VENN analysis. The three comparisons were: (i) between denervated MHS-A mice having
moderate-to-high autotomy scores (ADH) vs. sham-operated A mice who never expressed
autotomy (AS), (ii) ADH vs. denervated NLS-A mice expressing no or low autotomy scores
(ADL), and (iii) ADH vs. denervated NLS-B mice who typically express no or low autotomy
scores (BD). VENN analysis of all 3 comparisons yielded a shortlisted number of candidate
genes in the DRGs and spinal cords associated only with the expression of MHS in denervated A
mice, but not in sham operated A mice and not in B mice. This analysis excluded genes whose
expressions levels were regulated with the denervation. A final independent comparison within
the B strain (NLS-B vs. sham-operated B mice) was used as an internal control to seek genes in
B mice that associate with nerve degeneration, regeneration and apoptosis, and genes for
resistance to autotomy (See Table 2).
Contrast type Yield genes associated with:
AI vs. BI Injury discharge, genes differential between strains A and B ADH vs. ADL Autotomy behaviour (GXE) ADH vs. AS Nerve degeneration, regeneration, apoptosis in A mice ADH vs. BD Autotomy behaviour, genes differential between strains A and B BD vs. BS Nerve degeneration, regeneration, apoptosis and autotomy resistance in B mice
Table 2: Comaprison types and genes associated with each comparison type

35
2.4.4 Gene interaction network analysis
The products of candidate genes that were considered in this study are expected to operate each
in its tissue target. However, genes interact within genetic networks where their products affect
the expression of one or more genes thereby forming a biochemical pathway underlying
physiological processes. Moreover, sometime a gene is pleiotropic, where its product operates in
more than one such network or process. Identifying such networks and processes places a
candidate gene within a functional context that is of great interest to unravel. Functionally
related genes can be found using network analysis. For the purpose of our work we made use of
GeneMANIA, a website that searches publicly available biological datasets to find functionally
related genes (http://www.genemania.org/). These include protein-protein, protein-DNA and
genetic interactions, pathways, reactions, gene and protein expression data, protein domains and
phenotypic screening profiles. The names of candidate genes for autotomy in DRGs and spinal
cord (identified from the genome-wide gene expression results) were fed by us into
GeneMANIA to seek for gene interaction networks. The nodes connecting between every two
genes were denoted in a specific color/category, depending on the type of interaction between
the two genes.
For example, an interaction denoting co-expression means that two genes were linked if their
expression levels were similar across conditions and time series. Data used for such an analysis
originated in gene expression studies in previously published gene expression articles.
Similarly, an interaction denoting physical interaction means that two gene products were
linked over time in reported protein-protein interaction studies.
Genetic interaction means that two genes were functionally associated if the reported effects of
perturbing one gene were found to be modified by perturbations to a second gene over time.
Shared protein domains means that two gene products were linked if published reports
indicated that they have the same protein domain.
Co-localization means that two genes were linked if they were both expressed in the same tissue
or if their gene products were both reportedly identified in the same cellular location.

36
Pathway denotes instances where two gene products were reportedly linked in the same reaction
within the same pathway.
Predicted denotes any predicted functional relationships between reported gene products, often
protein-protein interactions. A major source of data for predicting a gene’s function originates
from comparative analysis of its functional relationships in other organisms via orthology. For
example, two proteins can be predicted to interact if their orthologs in another organism are
known to interact. In such cases, network names describe the original data source of
experimentally measured interactions and from which organism(s) the proposed interactions
derive.
Other denotes any networks that did not fit into any of the above categories. Examples include
phenotype correlations from Ensembl (www.ensembl.org) disease information from OMIM
(www.omim.org) and chemical genomics data (Bredel and Jacoby, 2004).
2.4.5 SNP variation in inbred mouse strains with known levels of
autotomy behaviour
The MGI SNP Variation Database
(http://www.informatics.jax.org/javawi2/servlet/WIFetch?page=snpQF) includes mapped data on
SNPs of tens of inbred mouse strains. We used it in this dissertation to search for SNPs in the
Pain1 region that differed across autotomy contrasting strains and could be implicated as
causative variants in candidate autotomy genes). To this end, SNPs were searched in the genes
shortlisted as candidate genes for autotomy in the Pain1 QTL. For each gene, SNPs were
screened in the following genetic regions: mRNA un-translated regions (UTRs), synonymous
coding regions, non-synonymous coding regions, and introns, using the following criteria. SNPs
were considered as candidate autotomy related SNPs if they differed between: (1) A and B mice
and (2) Strains known from previous studies to express MHS following hindpaw denervation
(i.e., C3H/HeJ, BALB/CByJ, or CBA/J) vs. strains known to express NLS following the same
denervation (i.e., AKR/J). SNP data was not available for C58/J mice.

37
2.4.6 Interrogating published Csf2rb1-immunohistochemically
labelled spinal cord and brain slices of naïve B mice
The Allen Brain Atlas (http://www.brain-map.org/) is an internet-based resource that published
histological photomicrographs of brain and spinal cord slices from a 56 days old naïve C57BL/6J
male mouse, using the in situ hybridization ISH method to label various murine genes with
radiocatively labelled riboprobes. Regrettably, this resource did not include micrographs of
Csf2rb1, but of Csf2rb2, and representative slides are included in this dissertation and their
relevance is discussed herein.
2.4.7 Mythological aspects of literature survey of the biological
relevance of candidate genes
A Pubmed search was performed for each of the candidate genes in Pain1 with the following
keywords: ‘brain’, ‘nerve’, ‘CNS’, ‘spinal cord’, ‘nerve injury’, ‘inflammation’ (‘inflamm*’),
’neurodegenerat*’, ‘analges*’, ‘pain’, ‘nocicept*’, ‘neuropath*’, ‘hyperalges*’, and ‘allodyn*’.
Any gene that was co-notated in 3 or more keywords was considered a candidate gene.
2.5 Gene follow-up assays
2.5.1 Quantitative real-time PCR
Since our results identified in the gene expression microarray study that up-regulation in spinal
cord, but not DRGs, levels of Csf2rb1 is the only candidate autotomy gene in Pain1, in the
follow up study we only validated the expression of this gene in the spinal cord. This was
carried out on A and B mice of the same 7 groups (at least 3 mice/group) but using a new batch
of mice that did not participate in the gene expression microarray study. cDNA was synthesized
from 1 μg total RNA (QuantiTect Reverse Transcription Kit, Qiagen) as follows. RNA
purification with gDNA wipe out buffer for 2 min at 42°C preceded the reverse transcription
reaction with Quantiscript Reverse transcriptase (1µl), Quantiscript RT Buffer x4 (4µl) and RT
Primer Mix (1µl) in a 20 µl reaction (Qiagen) for 15 min at 42°C. Reverse Transcriptase was

38
immediately inactivated by incubation for 3 min at 95°C. Gene-specific primers were designed
using the Integrated DNA Technologies website (www.idtdna.com). To reduce the contribution
of contaminating genomic DNA, primers were designed to span exon junctions. The primers: for
Csf2rb1 were mCSF2RB1_F TCGCTTTGGCTGTGTCTCTGTATACAG and mCSF2RB1_R
CATGCTGCCAGGAGGCCAG, and for Hprt mHPRT_F GTTGTTGGATATGCCCTTGA, and
mHPRT_R AGATTCAACTTGCGCTCATC.
Templates were amplified at the following PCR conditions: An initial incubation for 3 min at
95°C and 44 cycles of 15 sec at 95°C, 30 s at 66°C, and 10 sec at 95°C. The gene encoding for
the enzyme hypoxanthine guanine phosphoribosyl transferase 1 (Hprt) was chosen as the
reference gene for normalization because it is a constitutively and stably expressed in the
mammalian brain regardless of treatments [for example, in a murine model of epilepsy (Pernot et
al., 2010)], and therefore, it is frequently used as a reference gene (de Kok et al., 2005; Kõks et
al., 2008; Korostynski et al., 2007). Other reference genes that we checked in the spinal cord
(i.e., S18 rRNA and Gapdh) using temperature gradient RT-PCR, were not used in our following
experiments because they did not produce a stable PCR product (i.e. fragment was detected
following agarose gel electrophoresis). Reactions were performed in quadruplets on a
MiniOpticon (BioRad) cycler using SsoFast EvaGreen Supermix (10 μl, Biorad), cDNA
template (1 μg), and gene-specific primers (2.5 pmol) in a 20 µl reaction volume.
qPCR levels were compared in the new batch of A and B mice (i.e., mice that did not participate
in the gene expression microarray study) and mice of other strains with known contrasting
autotomy levels (i.e., C3H/HeJ and C3H/HeN), known from previous studies, including from our
lab, to express MHS following hindpaw denervation vs. AKR/J that are known to express NLS
following the same procedure. For the purpose of qPCR analysis, mice were denervated, sham-
operated, or left intact as described above. All denervated mice were followed up PO and scored
for autotomy prior to qPCR analysis as described above.
2.5.2 Immunohistochemistry
Using a cryotome, frozen tissues were sectioned into 50 μm sections. Floating sections were
washed with 1% PBS three times for 15 min at room temperature, and were then blocked with
10% donkey serum (in 3% triton) for 50 min at room temperature. The side of the spinal cord

39
ipsilateral to the surgical procedure was marked by a small indent in the ventral horn. The
sections were incubated for 48 hrs at 4°C with primary antibodies prepared in 1% PBS solution
containing 3% donkey serum and 3% triton, including the following antibodies:
1. Mouse NeuN (1:2,000, Chemicon, Temecula, CA, USA) was used as a neuronal marker.
2. Mouse OX-42 (1:2,000, Abcam, Toronto, ON, Canada) was used as a microglial marker.
3. Mouse GFAP (1:2,000, Sigma, Oakville, ON, Canada) was used as an astrocyte marker.
4. Mouse NG2 (1:1,000, Millipore, Burlington, MA, USA) was used as an oligodendrocyte
marker.
5. Mouse MAP2 (1:2,000, Chemicon, Temecula, CA, USA) was used as a neuronal marker.
6. Mouse anti-human Vimentin (1:200, Millipore, Burlington, MA, USA) was used as an
ependymal cells/ radial glia/tanycytes marker.
7. Rabbit IL3Rβ (1:500, Santa Cruz, Dallas, TX, USA) was used to label CSF2RB1.
8. Rabbit pStat3 (1:500, Cell Signalling Technology, Burlington, MA, USA) was used to label
phosphorylated STAT3 (on Tyr705).
Sections were washed with 1% PBS 3 times for 15 min at room temperature and were then
incubated for 3 hrs at room temperature with light-protected secondary antibodies prepared in
1% PBS solution containing 3% donkey serum and 3% triton (donkey anti-rabbit Cy3 1:1,000
Jackson ImmunoResearch Laboratories, INC., West Grove, PA, USA; donkey anti-mouse Cy5
1:1,000 Jackson ImmunoResearch Laboratories, INC., West Grove, PA, USA. Following
incubation, sections were washed again with PBS 3 times for 15 min at room temperature and
remained protected from light to prevent bleaching and fading of the fluorescence signal.
Sections were mounted on glass slides and then cover-slipped with a mounting medium (Sigma,
Oakville, ON, Canada). Labelled tissue slides were observed using a Zeiss epi-fluorescent
microscope. Select slides of representative tissues were used for Z-stack photographic
recordings.
Immunohistochemistry controls: Spleen tissue is known to express CSF2RB1
(http://www.biorbyt.com/csf2rb-antibody-5). Therefore, in a pilot experiment that was carried
out prior to using the IL3Rβ antibody against spinal cord CSF2RB1, we used murine spleen
tissue as a positive control to verify that the antibody is indeed specific. As a negative control, 2
spinal cord sections were labelled with only secondary antibodies, to determine antibody
40
specificity with the primary antibody sections. To prevent background staining, solutions of the
antibodies were diluted to the optimal concentration, as well, blocking, reaction times and
temperature of incubation, were optimized. To exclude other effects such as autofluorescence,
optimal tissue fixation processes were adopted.
2.5.3 Quantitation of CSF2RB1 labelled cells in the spinal cord
and brain
In spinal cord transverse sections, CSF2RB1-positive cells having a soma located around the
central canal and extending processes dorsally, ventrally or laterally were counted if their
processes extended for a distance from the soma that was at least 20 μm in length. CSF2RB1-
positive labelling was also found in coronal brain sections, mainly throughout the dentate gyrus
of the hippocampus and in the hypothalamus (mostly in the arcuate nucleus). Each cell extended
a thinner process than those of the spinal cord around the central canal. Labelled processes were
arranged in a parallel manner, traversing the dentate gyrus and the arcuate nucleus perpendicular
to their layers. This parallel arrangement and uniform labelling enabled us to count the number
of labelled processes in the dentate gyrus as follows. An arbitrary region of interest (ROI) was
selected and a 200 μm line was drawn on the photomicrograph, perpendicular to the processes.
The number of CSF2RB1-positively labelled processes that crossed the line was counted per a
standard unit length (200 μm). To avoid bias by the experimenter, images were coded to conceal
the identity of the mouse strain and treatment group. ROIs were selected in a sequential manner
for the randomized sections: upper right aspect of the dentate gyrus, lower right aspect, upper left
aspect and lower left aspect.
2.5.4 Co-localization analyses
All images showing co-localization of CSF2RB1 with Vimentin positive cells were first z-
stacked by the Volocity 3D Image Analysis Software (version 6.1.1, PerkinElmer, Woodbridge,
ON, Canada) using the DE convolution feature prior to co-localization analysis. A region of
interest around the central canal was chosen for setting the background fluorescence threshold,
and then the software assesses the level of co-localization of CSF2RB1 with Vimentin by
calculation of the Pearson Correlation Coefficient and p value that determined how many

41
profiles containing one label also contained the other label. To avoid bias, images were coded to
conceal the mouse strain and treatment.
2.5.5 Counting pStat3 labelled cells in the spinal cord and brain
In the spinal dorsal horn, pStat3+ cells appeared as small dots indicating labelling of the nuclei.
Such cells were present in laminae I and II of the dorsal horn as well as in the ventral horn, but
devoid of the central canal region. Here we only counted those located in lamina I and the inner
part of lamina II, since this region is associated with pain processing. The region of interest
where cells were counted was a square 0.01mm2 (100μm x 100μm). pStat3+ cells were counted
both in the ipsilateral and contralateral sides of the dorsal horn. In the polymorph layer of the
hippocampal dentate gyrus a region of interest measured 2500 μm2
was used for counting
labelled cells. pStat3+ cells were counted bilaterally. Avoiding bias was accomplished as
described above. ROIs in all slides were selected in the same region in the middle of spinal
dorsal horn, in laminae I and II.
2.5 Statistical analysis
Analysis of genome wide gene expression microarray data was carried out by the Partek
Genomic Suite (Version 6.4; Partek Inc.). All other data (behaviour, qPCR and
immunocytochemistry) were analyzed using SPSS (version 13.0). Normality tests determined
distribution type prior to data analysis. One-way or two-way ANOVA tests and an independent
2-tailed T-test were used, where appropriate, to determine the level of significance of the
difference in the means of tested groups. Groups included MHS, NLS, or the combination of the
two (Denervated), Sham-operated, Naïve, or the combination of the two (Control) in the
following strains: A, B, AKR, C3H/HeJ and C3H/HeN. Tukey or LSD post hoc tests were used
to identify which groups contrasted significantly in the ANOVA tests. Independent variables:
Group and Day PO. Dependent variables: Autotomy score, gene expression levels, number of
cells. P<0.05 was considered significant in all tests. When the same set of data was used in
more than one statistical comparison, inflation of the alpha level was adjusted with the
Bonferroni factor. FDR corrections were used for P<0.05, P<0.01 and P<0.001. All averages
appear ± SEM.

42
Chapter 3
Study I: Regulation of autotomy levels by gene expression
changes: Whole genome study of the DRGs and spinal cord
3.1 Introduction
The complexity of neuropathic pain remains a challenge for researchers trying to decipher the
genetic factors that contribute to understanding the mechanisms involved and identifying novel
targets for analgesics. Neuropathic pain is a complex trait resulting from various types of insults
to the nervous system. We modelled neuropathic pain in response to peripheral nerve injury, as
is seen following trauma and surgery (e.g., in leg amputees and women post-mastectomy). To
this end, we used the Neuroma Model (Wall et al., 1979) in the mouse to seek genes involved in
the development and maintenance of spontaneous neuropathic pain. We selected this rodent
model because it closely mimics spontaneous neuropathic pain following peripheral denervation
in humans, for which there is still a tremendous need for analgesics that confer an effective
alleviation of pain without adverse side effects. The Neuroma Model was developed by our
group in 1979, has since been published in hundreds of reports including many reports by our
group, and much is known about the pathophysiology involved.
While humans have a diverse genetic makeup, that of inbred mice is strain-specific, making the
latter a good animal model advantageous toward studying complex traits such as neuropathic
pain. Like individual humans, strains of inbred mice of different genetic backgrounds are
susceptible or resistant in various degrees to develop chronic pain in a model-specific manner
(Mogil et al., 1999a, 1999b), which marks an advantage starting point in associating genotype to
phenotype, as well as the impact of the environment given an identical genome (Seltzer and
Dorfman, 2004). For example, certain inbred mouse strains show high autotomy scores, while
others show moderate, low or very low scores, even though the inciting injury (i.e. denervation
of the hindpaw) was the same (Devor et al., 2007; Mogil et al., 1999a). Based on this phenotypic
variation we previously mapped a QTL on mouse chromosome 15 associated with autotomy,
which we named Pain1, using the contrasting autotomy strains A and B and their 23 recombinant
inbred strains (Seltzer et al., 2001). In the present study, we used the same contrasting strains in
43
a non-biased approach to carry out a genome-wide gene expression to seek for candidate genes
for autotomy in the DRGs associated with the injured nerves, and the spinal cord, where these
original nerves terminate and where pain processing is altered due to the injury.
It is noteworthy that sexual dimorphism exists in pain phenotypes, including autotomy, such that
the same mouse strain may be highly susceptible to autotomy in one sex and less susceptible to
autotomy in another sex (Devor et al., 2007; Mogil et al., 1999a). Therefore, this study focused
on male mice only. Autotomy expressing male mouse strains include the A/J, BALB/cJ,
C3H/HeJ and C3H/HeN, CBA/J and SM/J (‘autotomy susceptible’ strains), while the strains
C57BL6/J, C57BL10/J, C58/J and AKR/J express relatively low autotomy following the same
denervation procedure (‘autotomy resistant’ strains). The intermediate strains that develop
autotomy at medium scores include 129/J, RIIIS/J and DBA/2J. These levels depend on the lab
where the study was carried out and the environmental conditions at the time of the study
including diet, type of anesthetic agent used, and other intra-operative variables including the
way the nerves and tissues were handled by the experimenter, and housing conditions (e.g.,
social “cage effects”). This information is important because the availability of inbred strains of
mice and rats is informative not only in the context of genetic variability but also for unraveling
epigenetic factors; both aspects are analyzed in the present study. Since most mouse strains were
already densely mapped for SNP variations across the genome, based in part on the full sequence
map produced by Celera, knowing their autotomy levels (under specific environmental
conditions) is a powerful tool that enables investigators to identify candidate genes associated
with this trait, a feature that will be used in the present study to prioritize candidate genes based
on having highly polymorphic regions between autotomy A, B and other susceptible and
autotomy resistant strains.
Numerous studies already used genome-wide expression profiling as an initial method to seek
candidate genes and pathways contributing to neuropathic pain. Some used peripheral nerve
injury rodent models (Coyle, 2007; Griffin et al., 2007; Kim et al., 2009b; Ko et al., 2002; Kõks
et al., 2008; Lacroix-Fralish et al., 2006; Liu et al., 2012a; Nesic et al., 2005; Persson et al.,
2009b; Rodriguez Parkitna et al., 2006; Sun et al., 2002; Valder et al., 2003; Wang et al., 2002a),
while others focused on other types of insult, such as inflammation pain models (Géranton et al.,
2007) or disease-caused pain models (Takasaki et al., 2012). Other studies used mice with

44
specific knocked out genes to study the role of a specific gene in relation to pain behaviour
(Kõks et al. 2008; Wang et al. 2010). In one study the injury was to the CNS (Nesic et al.,
2005). Studies profiled genes from DRGs, spinal cord or brain tissues, mainly from the rat, and
very few studies were performed in mice models. Two studies on rats profiled genes in both
DRG and spinal cord associated with neuropathic and inflammatory pain (Rodriguez Parkitna et
al., 2006; Wang et al., 2002a). In the present dissertation study we profiled genes in key PNS
(i.e., DRGs) and CNS (i.e., spinal cord) tissues in the mouse that are known to process normal
daily pain, and change following injury to produce neuropathic pain. The rationale for studying
genes in both tissues in described in the next section.
Some triggers of the neural mechanisms that produce chronic pain are believed to operate very
early after injury. As described in the Introduction (Chapter 1) these signals originate in injured
tissues and nerves, informing the soma of injured primary afferents (and perhaps trans-
synaptically also the CNS) that an injury has just occurred. One of these signals is an electrical
neural message (‘injury discharge’, (Cohn and Seltzer, 1991; Devor and seltzer, 1999; Seltzer et
al., 1991b, 1991c; Vatine et al., 1998; Wall et al., 1974; Zeltser et al., 2000). Thus, genes
involved in determining the excitability of primary afferents to injury resulting in the emission of
an injury discharge at the time of nerve injury, as well as genes that operate in the CNS and deal
with the impact that injury discharge has on the CNS are important determinants of chronicity,
because difference in the type and abundance (i.e., constitutive expression levels) of genes
encoding these signals may explain the contrast in autotomy between the studied groups. These
autotomy genes may encode for a higher excitability level of primary afferent neurons when, for
instance, A mice are injured and a lower excitability in B mice when they are similarly injured.
We reason that higher excitability in A mice at the time of insult would manifest in more injured
afferents firing an injury discharge or firing at a higher frequency than B mice undergoing the
same injury. In addition, other genes may control the dynamic balance of the excitations and
inhibitions in the CNS that process the impact of injury discharge when it floods the spinal (or
trigeminal) dorsal horn with synaptic inputs. For example, the expectation is that B mice, having
genes encoding inhibitions expressed at considerably higher levels than A mice, are posed to
better cope with the injury discharge than A mice, by inhibiting the injury discharge before it
impacts the CNS pain pathways and triggering the cascades of chronic pain. To this end, we
sought genes in the DRGs and spinal cord having significantly different expression levels in

45
intact A (‘AI’) vs. intact B (‘BI’) mice (at a genome-wide significance level and at a 1.5<fold
change <-1.5) .
Another approach we used in the present study represents the traditional study design, seeking
autotomy genes by contrasting expression levels after the nerve injury has taken place in MHS
vs. NLS mouse groups, adjusted by the expression levels in groups of sham-operated mice to
exclude genes related to surgery and anesthesia. Specifically, we compared gene expression
levels in MHS mice to 3 independent groups of NLS, to produce a candidate gene list of
autotomy-causing and alternatively autotomy-protecting genes. Some of these genes are thought
to be regulated in the PNS and others in the CNS because both of these sites contribute to the
development of chronic neuropathic pain by mechanisms of peripheral and central sensitization.
To this end we sought autotomy candidate genes in the DRGs, where potential gene regulation of
the injured nerves occurs and in the spinal cord, where gene regulation of 2nd
order neurons,
interneurons and glial cells, all affecting neuropathic pain neurotransmission, proceeds. Our
main focus was to detect the Pain1 candidate gene that is regulated either in the DRGs or in the
spinal cord.
3.2 Results
3.2.1 Autotomy phenotypes in denervated A and B mice
Prior to the whole-genome microarray experiment that represents this study, we phenotyped our
mice and selected 5 mice per group for tissue extraction. Seven groups of mice comprised this
study: 4 groups of A mice and 3 groups of B mice. Two groups of naïve mice of the A (AI) and
B (BI) strains were not operated and as expected, none expressed autotomy behaviour. Two
groups of sham-operated A (AS) and B (BS) mice were subjected to general anesthesia and
tissue injury, but not nerve injury, and as expected, they also did not express autotomy. B mice
that underwent complete hindpaw denervation did not express autotomy or expressed very low
levels of this behaviour (i.e., final scores of 0-1; BD). This was also expected from the literature,
except for the report by Mogil et al. (Mogil et al., 1999a) who found that denervated B mice
expressed the highest levels of autotomy compared to 10 other inbred lines. However, following
our results (Seltzer et al., 2001) that reported that B mice expressed no- or very low autotomy

46
levels, in a follow up study Mogil et al. retracted from this oversight (Devor et al. 2005) . By the
end of the behavioural follow up on day 14 PO, the group of A mice that underwent the same
denervation procedure as B mice, expressed a wide range of autotomy scores varying from 1 to
11 (Figure 2b). The first day, in which any sign of autotomy was observed (Autotomy Onset
Day; ‘AOD’) in these mice, also varied widely from day 1-14. Five of the denervated A mice
that expressed the highest autotomy scores on PO day 14 (ADH) were selected for the gene
expression study along with 5 denervated A mice that expressed the lowest levels of autotomy on
the same PO day (ADL). Figures 2 and 3 indicate the average daily autotomy score and the
AOD of the groups included in the gene expression study (respectively). Figures 2 and 3 show
that differences between ADH vs. ADL and BD mice is highly significant.

47
Figure 2: Course of autotomy behaviour in denervated A and B mice. Following sciatic and
saphenous nerve section, A mice were followed up daily and their autotomy behaviour was
scored up to day 14. (A) Average autotomy scores (± SEM) are presented for A mice (N=25) vs.
B mice (N=24). ANOVA for repeated measurements with Tukey’s post hoc test were performed
for all 14 days; *p<0.05, **p<0.01, ***p<0.001, ****p<0.0001 (B) Final autotomy scores on
post-operative day 14 are shown for all 49 A and B mice. Based on these scores, mice of the A
strain were sub-divided into 3 groups, NLS-A group with final autotomy scores of 0 or 1, N=10),
a moderate autotomy group having on day 14 PO scores ranging from 2-7 (N=7), and a group of
high autotomy scores ranging from 8-11 (N=8). All 24 B mice showed NLS of 0-1.
0123456789
1011
0 5 10 15 20 25
Fin
al a
uto
tom
y sc
ore
Mouse number
Autotomy in A and B mice on day 14 PO
A high-autotomy
A moderate-autotomy
A low-autotomy
B low-autotomy
B
0
1
2
3
4
5
6
1 2 3 4 5 6 7 8 9 10 11 12 13 14
Au
toto
my
sco
re
Post operative day
Autotomy in A and B mice
A mice
B mice
A
*
***
**
****
****** ***
****
********
********

48
Figure 3: Average autotomy onset day of denervated A and B mice. Group averages of the first
day any score of autotomy was observed (Autotomy onset day) are presented for A mice with
high autotomy scores (N=15) and of the 2 groups that expressed NLS throughout the 14 days of
PO follow up period: A mice (N=10) and B mice (N=24). A one-way ANOVA with the
Tukey’s post hoc test revealed that denervated MHS-A mice started to express autotomy at a
significantly shorter delay than the 2 other NLS groups.
3.2.2 Criteria for candidate gene selection
In order to select for candidate genes in the DRG and the spinal cord, we followed a specific set
of criteria. First, we performed one-one group comparisons that yielded long lists of genes
responsible for inducing ‘injury discharge’ and ‘autotomy’ before or after denervation in MHS-A
mice. Next, we considered statistical corrections for multiple testing to reduce the number of
candidate genes. Using a VENN analysis strategy, we were able to look closer at shared
autotomy genes between different group comparisons and to exclude genes associated with the
nerve injury which were not relevant to autotomy. Using the GeneMANIA website that
integrates a given set of genes into gene network interactions, we distinguished candidate
autotomy genes further by acquiring the biological processes and cellular pathways in which
they are engaged. Since this analysis yielded a series of candidate genes, we chose to focus
particularly on the Pain1 region, for which we had previous knowledge for controlling autotomy
behaviour in A vs. B mice.
0
2
4
6
8
10
12
14A
uto
tom
y o
nse
t d
ay
Autotomy onset day in A and B mice
A high-autotomy
A low-autotomy
B low-autotomy
P<0.0001P<0.0001
49
It should be noted here that meanwhile we performed our individual group comparisons in a non-
biased approach of selecting candidate autotomy genes throughout the genome, we found the
Pain1 gene, Csf2rb1, as the second most significant (P<10-05
) genome-wide gene in the group
comparison ADH vs. ADL in spinal cord, as well as the 7th most significant genome-wide gene
in the group comparison ADH vs. AS (P<10-04
) within this tissue. This gene was also
significantly different in the genome-wide comparison ADH vs. BDL (P<10-05
) in the spinal
cord. We discuss its candidacy further in later sections and show why we selected it our primary
candidate gene for further study.
The following additional criteria were used to select for the best candidate gene in Pain1.
Candidate Pain1 genes that yielded from the VENN analysis following nerve injury were sought
out in the Allen brain atlas for their in situ expression in the murine spinal cord. Candidate
Pain1 genes that differentially regulated between autotomy susceptible A mice vs. autotomy
resistant B mice before the nerve injury were analyzed in the following manner. Polymorphisms
that may explain the differences between A and B autotomy levels were sought in these genes.
The pain relevance of candidate genes was determined using a Pubmed search for key pain
words. The next sections describe each criterion in full detail.
3.2.3 Group comparisons of genome-wide gene expression data
Our analysis for the genome-wide expression data consisted of several one-one group
comparisons using the 7 studied groups (Section 2.4.1 Study design, Figure 1). Separate
analyses were applied to the DRG microarray dataset and for the spinal cord dataset. For each
target tissue, four separate group comparisons were carried out. The first group comparison
detected mRNA differences in intact A (AI) vs. intact B (BI) mice. This comparison followed
the natural history of chronic pain chronologically, seeking potential differential mRNA levels
between these two strains at the time of nerve injury. Such variations may affect the injury
discharge and its impact on the CNS in A vs. B mice. The dataset resulting from comparing
spinal cord genes in AI vs. BI is expected to emerge constitutively expressed genes contributing
to alterations in apoptosis and excitotoxicity of pain inhibitory interneurons in spinal cords of A
vs. B mice. This potential difference may trigger central sensitization in A mice that could drive
the nervous system to produce more chronic pain in these mice compared to B mice, and may

50
explain, in part, why A mice express higher autotomy levels. The dataset resulting from
comparing DRG genomes of AI vs. BI is expected to yield genes associated with the immediate-
early response of primary afferents to injury and initiation of Wallerian degeneration and
regeneration.
The next three group comparisons provided autotomy associated genes. Our strategy for
selecting candidate genes for autotomy was to compare the ADH group (i.e., A mice expressing
MHS of 2-11) with other groups of mice that express NLS (i.e., A sham, NLS-B mice, and NLS-
A mice), and then use VENN analysis to select genes that were significantly regulated in all
three of these group comparisons (see Section 2.4.2 for detailed methods; see Figures 4 and 5 in
Results).
3.2.3.1 Constitutive gene expression levels of autotomy-related
genes
Genes showing a significant fold change in the constitutive expression levels in the DRGs and
spinal cords of intact A (‘AI’) vs. B mice (‘BI’), of more than 1.5, or less than -1.5 (at P<0.05)
were listed. A summary of their numbers in these tissues and strains is shown in Table 3
indicating that more than 5000 out of 44,000 probes on the array (corresponding to ~4500 genes
in either tissue) were differentially expressed throughout the genome in mice of the two strains at
P<0.05. However, many of these are false positive determinations that were included as an
artefact of the multiple comparisons (i.e., 44,000 probes). To compensate for the outcome of the
inflation of the alpha level, a False Discovery Rate (FDR) analysis (at various levels) was carried
out, and as expected, at a level of FDR<0.05 the number of probes differentially expressed in the
DRG and spinal cord of the 2 strains dropped to 1296 and 973 probes, respectively. Reducing
the significance level to FDR<0.01 caused an additional reduction in the number of probes to
760 and 594 probes, respectively, and at FDR<0.001 the numbers dropped further to 439 and
321 probes, respectively. Thus, the number of probes with contrasting constitutive expression
levels across the two strains remained high. It is conceivable that some of these genes may
confer a susceptibility or resistance to the development of autotomy post- hindpaw denervation.
However, in addition to these genes, many other genes are likely involved in other contrasting
phenotypes between intact A and B mice that are unrelated to the contrast in autotomy. One way

51
of coming closer to identifying candidate autotomy genes is to look only at genes harboured in
the Pain1 autotomy QTL and select those that contrast between the strains.
In Pain1 alone, there were 20 probes encoding 16 genes that differentially contrasted between A
and B intact mice in the DRGs (Table 4). In the spinal cord, a total of 25 probes encoding 22
genes were constitutively and significantly regulated between the two mouse strains (Table 5).
Each of these was a possible candidate gene responsible for the production and/or response to
injury discharge immediately after the nerve injury, and thereby possibly explaining the
contrasting auotomy behaviour in these strains. In section 3.2.9 we provide the SNP analysis for
candidate genes in Pain1 and discuss further the candidacy of potential genes that may be
associated with injury discharge.
Table 3: Probes and genes with contrasting expression levels between naïve A vs. B mice are
presented. Spinal cord (SC) and DRG probes throughout the genome show a significant contrast
in the expression levels in naïve/intact A and B mice. These probes include genes likely
associated with the production of, and/or the response to injury discharge, and are therefore
susceptibility genes to developing autotomy behaviour in A mice or its prevention in B mice.
P<0.05 FDR<0.05 FDR<0.01 FDR<0.001
5116 1296 760 439 Probes
4600 1160 680 395 Genes
5164 973 594 321 Probes
4650 880 535 290 Genes
DRG
SC
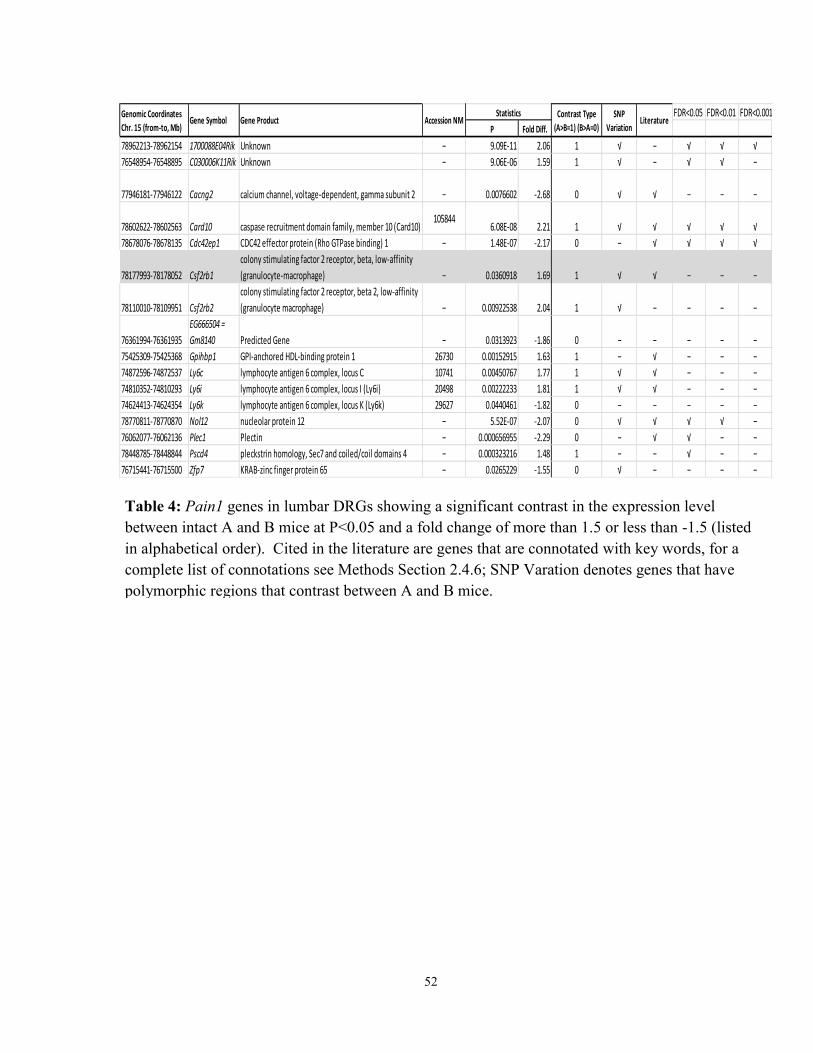
52
FDR<0.05 FDR<0.01 FDR<0.001
P Fold Diff.
78962213-78962154 1700088E04Rik Unknown − 9.09E-11 2.06 1 √ − √ √ √
76548954-76548895 C030006K11Rik Unknown − 9.06E-06 1.59 1 √ − √ √ −
77946181-77946122 Cacng2 calcium channel, voltage-dependent, gamma subunit 2 − 0.0076602 -2.68 0 √ √ − − −
78602622-78602563 Card10 caspase recruitment domain family, member 10 (Card10)105844
6.08E-08 2.21 1 √ √ √ √ √
78678076-78678135 Cdc42ep1 CDC42 effector protein (Rho GTPase binding) 1 − 1.48E-07 -2.17 0 − √ √ √ √
78177993-78178052 Csf2rb1
colony stimulating factor 2 receptor, beta, low-affinity
(granulocyte-macrophage) − 0.0360918 1.69 1 √ √ − − −
78110010-78109951 Csf2rb2
colony stimulating factor 2 receptor, beta 2, low-affinity
(granulocyte macrophage) − 0.00922538 2.04 1 √ − − − −
76361994-76361935
EG666504 =
Gm8140 Predicted Gene − 0.0313923 -1.86 0 − − − − −
75425309-75425368 Gpihbp1 GPI-anchored HDL-binding protein 1 26730 0.00152915 1.63 1 − √ − − −
74872596-74872537 Ly6c lymphocyte antigen 6 complex, locus C 10741 0.00450767 1.77 1 √ √ − − −
74810352-74810293 Ly6i lymphocyte antigen 6 complex, locus I (Ly6i) 20498 0.00222233 1.81 1 √ √ − − −
74624413-74624354 Ly6k lymphocyte antigen 6 complex, locus K (Ly6k) 29627 0.0440461 -1.82 0 − − − − −
78770811-78770870 Nol12 nucleolar protein 12 − 5.52E-07 -2.07 0 √ √ √ √ −
76062077-76062136 Plec1 Plectin − 0.000656955 -2.29 0 − √ √ − −
78448785-78448844 Pscd4 pleckstrin homology, Sec7 and coiled/coil domains 4 − 0.000323216 1.48 1 − − √ − −
76715441-76715500 Zfp7 KRAB-zinc finger protein 65 − 0.0265229 -1.55 0 √ − − − −
LiteratureGenomic Coordinates
Chr. 15 (from-to, Mb)Gene Symbol Gene Product
SNP
Variation
Statistics Contrast Type
(A>B=1) (B>A=0)Accession NM
Table 4: Pain1 genes in lumbar DRGs showing a significant contrast in the expression level
between intact A and B mice at P<0.05 and a fold change of more than 1.5 or less than -1.5 (listed
in alphabetical order). Cited in the literature are genes that are connotated with key words, for a
complete list of connotations see Methods Section 2.4.6; SNP Varation denotes genes that have
polymorphic regions that contrast between A and B mice.

53
3.2.3.2 Expression of DRG genes in denervated A and B mice
The following section introduces the genome-wide array analysis to seek for potential ‘autotomy
genes’ in A mice following hind paw denervation. Equivalent analyses were performed in
parallel for DRG and spinal cord tissues. To distinguish and select for the most optimal
candidate ‘autotomy genes’ in A mice, we compared the gene expression levels of A high
autotomy mice (MHS-A) with gene expression levels of low autotomy mouse groups in the
FDR<0.05 FDR<0.01 FDR<0.001
P Fold Diff.
74705824-74705765 2010109I03Rik Unknown 25929 0.05415 -1.60 0 √ − − − −
77411931-77411872
9130218O11Rik=
Apol10b apolipoprotein L 10B − 0.01565 -2.99 0 √ − − − −
75947885-75947826 BC024139 cDNA sequence BC024139 198172 0.02372 1.69 1 − − − − −
75049228-75049287 BC025446 cDNA sequence BC025446 146058 0.02124 -1.58 0 − − − − −
77822064-77822005 Cacng2
calcium channel, voltage-dependent, gamma
subunit 2 − 0.01056 -1.56 0 √ √ − − −
78602863-78602804 Card10 caspase recruitment domain family, member 10 130 0.00001 2.69 1 √ √ √ √ √
78678076-78678135 Cdc42ep1 CDC42 effector protein (Rho GTPase binding) 1 − 0.00000 -3.07 0 − √ √ √ √
73398751-73398810 Dennd3 DENN/MADD domain containing 3 − 0.02855 -1.63 0 √ − − − −
74752329-74752388 ENSMUST00000096398 Predicted Gene − 0.01923 -1.56 0 − − − − −
78498028-78497969 Lrrc62 = Elfn2
leucine rich repeat and fibronectin type III,
extracellular 2 − 0.01863 1.45 1 − − − − −
74589435-74589376 Ly6d lymphocyte antigen 6 complex, locus D ( 10742 0.04082 -2.01 0 √ − − − −
75392855-75392555 Ly6h lymphocyte antigen 6 complex, locus H 11837 0.02714 1.56 1 − √ − − −
75574346-75574287 Mafa
v-maf musculoaponeurotic fibrosarcoma oncogene
family, protein A (a − 0.04180 1.54 1 − √ − − −
78770811-78770870 Nol12 nucleolar protein 12 − 0.00068 -1.76 0 √ √ √ − −
79083778-79083837 Pick1 protein interacting with C kinase 1 − 0.00050 -2.43 0 √ √ √ − −
76016579-76016520 Plec1 plectin 1 , transcript variant 6 201389 0.01409 2.26 1 − √ − − −
78018531-78018472 Pvalb parvalbumin 13645 0.00843 2.24 1 √ √ − − −
76911278-76911219 Rbm9 = RBfox2 RNA binding protein, fox-1 homolog (C. elegans) 2 − 0.00185 3.13 1 √ √ − − −
76531533-76531294 Recql4 RecQ protein-like 4 58214 0.00823 -1.84 0 √ √ − − −
76345755-76345696 Scrt1 scratch homolog 1, zinc finger protein (Drosophila) − 0.02167 1.89 1 √ − − − −
73404944-73404885 Slc45a4 solute carrier family 45, member 4 − 0.04403 1.71 1 √ − − − −
74553969-74553910 Slurp1 Ly6/Plaur domain containing 1 − 0.00685 -2.19 0 √ √ − − −
SNP
VariationLiterature
Genomic Coordinates
Chr. 15 (from-to, Mb)Gene Symbol Gene Product
Statistics Contrast Type
(A>B=1) (B>A=0)Accession NM
Table 5: Pain1 genes in lumbar spinal cord showing a significant contrast in the expression level
between naïve/intact A and B mice at P<0.05 and a fold change of more than 1.5 or less than -1.5
(listed in alphabetical order). Cited in the literature are genes that are connotated with key words,
for a complete list of connotations see Methods Section 2.4.6; SNP Varation denotes genes that
have polymorphic regions that contrast between A and B mice.
54
following manner. MHS-A mice were compared to sham-operated A mice (Group comparison
1), MHS-A mice were compared to NLS-B mice (Group comparison 2), MHS-A mice were
compared to NLS-A mice (group comparison 3). Each of the 3 group comparisons from the
DRG dataset resulted in a list of thousands of genes throughout the genome that differed at a
significance level of P<0.05 and at a 1.5<fold difference<-1.5 (Figure 4). The 3 group
comparisons and their outcome are detailed below.
Comparison (1): Mice of the ADH group underwent a denervation procedure involving
anesthesia, wound formation, major nerves injured, followed by wound healing, degeneration of
the cut nerves, and expression of MHS of the toes. The AS mice had the same procedures but
they lacked the denervation procedure, no major nerves were injured and no degeneration of the
cut nerves was followed. Despite the identity in the genomes of the mice of these two groups,
the difference in procedures and behavioural outcomes manifested in gene expression level
differences in 2194 probes encoding 1964 genes throughout the genome. This large number of
genes correlates to genes associated directly with denervation + autotomy behaviour. Reducing
the significance level to an FDR<0.05 reduced the numbers to 335 probes encoding 300 genes; at
FDR<0.01 there was an additional reduction in the number of probes to 162 and 145 genes,
respectively, and at an FDR<0.001 the numbers dropped further to 58 and 50 genes, respectively
(see Table 6). One should keep in mind that shortlisting the gene lists by lowering FDR
thresholds concurrently increases the type 2 error, thereby eliminating genes, which may be
relevant to the pain outcome.
Comparison (2): ADH and BD mice had undergone exactly the same surgical procedures
involving anesthesia, wound formation, major nerves injured, followed by wound healing, and
degeneration of the cut nerves. The only two differences between these groups were the
differing expression levels of autotomy of the toes and strain-specific differences in DRG
neuronal, satellite cells and other cell types that are unrelated to the autotomy behaviour. The
genomes of DRG cells in these groups differed in 5034 probes that mark 4679 genes. These are
compared to 5116 probes (that mark 4600 genes) in intact A vs. B mice. Reducing the
significance level to an FDR<0.05 lowered the numbers to 977 probes encoding 880 genes; at
FDR<0.01 an additional reduction in the number of probes brought it to 584 and 525 genes,

55
respectively, and at an FDR<0.001 the numbers dropped further to 342 probes and 300 genes,
respectively (see Table 6).
Comparison (3): ADH and ADL mice have an identical genome and underwent exactly the same
surgical procedure, same nerves that degenerated post-axotomy and the same wound that healed
post-operatively, and only differed on the autotomy levels. This difference in autotomy levels
was associated with 3375 probes throughout the genome that mark 3037 DRG genes. Some
mice responded by autotomy and some did not. We do not know the reason why the latter did
not but this unknown environmental parameter drove these mice to lack the drive for autotomy
behaviour and they are listed in Table 6. These genes may be regarded as genes whose
expression level was differentially affected by the environment in a GXE manner. Setting the
significance level to FDR<0.05 reduced the numbers to 1336 probes encoding 1200 genes; at
FDR<0.01 the number of probes got down to 74 and 65 probes, respectively, and at FDR<0.001
the numbers dropped further to 7 probes and genes, respectively (see Table 6).
Table 6: Probes and genes that are regulated with autotomy behaviour in A and B mice. Spinal
cord (SC) and DRG probes throughout the genome showing significant gene expression levels in
MHS-A, NLS-A and B mice.
P<0.05 FDR<0.05 FDR<0.01 FDR<0.001
2194 335 162 58 Probes
1964 300 145 50 Genes
798 0 0 0 Probes
756 0 0 0 Genes
3375 1336 74 7 Probes
3037 1200 65 7 Genes
677 0 0 0 Probes
666 0 0 0 Genes
5037 977 584 342 Probes
4679 880 525 300 Genes
2465 783 465 261 Probes
2215 700 420 235 Genes
SC
DRG
SC
A h
igh
vs.
A
low
A h
igh
vs.
B
low
DRG
SC
A h
igh
vs.
A
sham
DRG

56
To shorten the above lists even further we used a Venn analysis in order to isolate autotomy-
specific genes. This analysis applies filters that screen the dataset according to a set of criteria,
leaving out genes that do not fit a specific profile, thereby isolating autotomy-associated genes.
The profile sought genes shared between all 3 group comparisons: ADH vs. AS, ADH vs. BD
and ADH vs. ADL. Also, these genes came up as significantly different at a P value<0.05 and a
1.5<fold change<-1.5 in each of the three group comparisons (Figure 4). When correcting for
multiple comparisons, we were unable to get differentially expressed genes in the spinal cord,
and only a few that regulated in the DRGs. Therefore, in order to use the Venn analysis strategy
for selecting candidate genes for autotomy, we gave each gene a fair chance, not to miss any
false negatives, and used a cut off of P value<0.05 and a 1.5<fold change<-1.5. The resulting list
included genes in lumbar DRGs of A mice whose regulation is not related to the response to
surgery per se (i.e., the anesthesia, wounds in skin, fascia and muscles), but related to the
response to nerve degeneration and regeneration that drive denervated A mice, but not B mice, to
express autotomy, and whose regulation is sensitive to environmental variables that cause some
A mice to express autotomy (ADH) while protecting other A mice (ADL) from neuroglial
mechanisms originating in the DRGs that drive for autotomy. The resulting Venn diagram in
Figure 4 shows a subset of 284 probes, encoding 226 unique genes throughout the DRG genome,
which fitted these filters. These genes are listed in Appendix I by name, protein product they
encode, genomic coordinates, fold difference, direction of effect, and P value. Some of these
genes showed the same direction, i.e. up-regulation or down-regulation in all 3 group
comparisons. Other genes showed a mixture of up-regulation in some comparisons and down-
regulation in others.
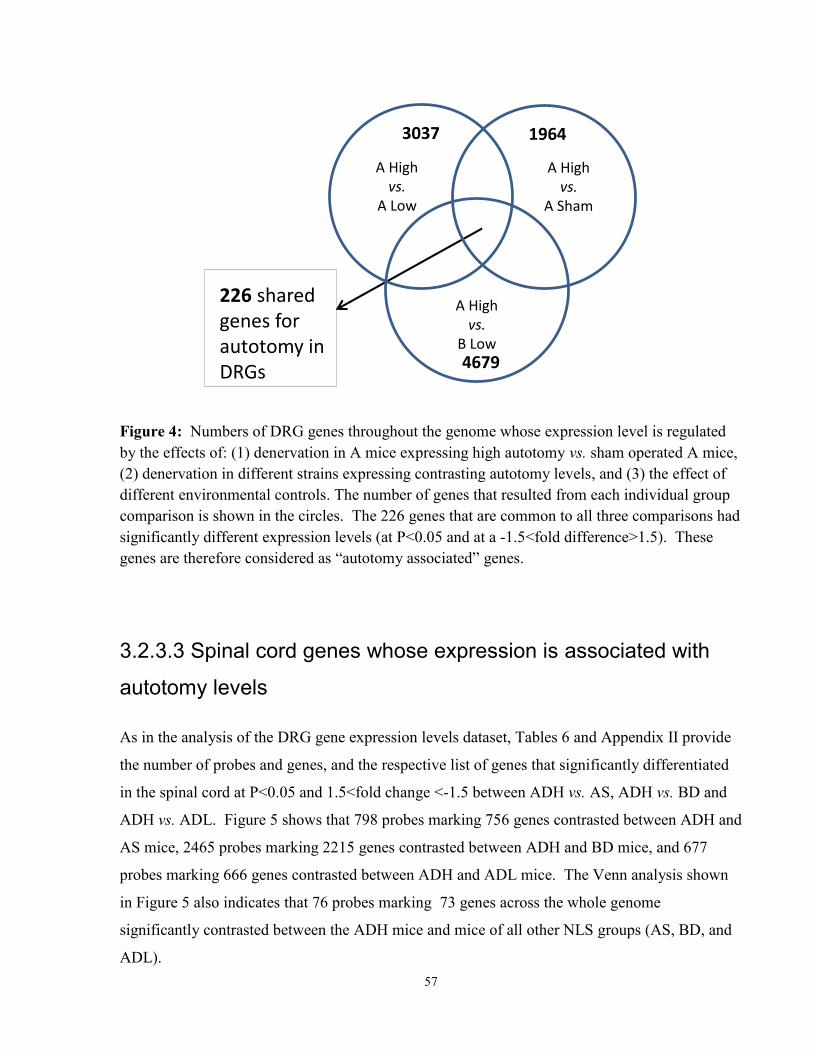
57
Figure 4: Numbers of DRG genes throughout the genome whose expression level is regulated
by the effects of: (1) denervation in A mice expressing high autotomy vs. sham operated A mice,
(2) denervation in different strains expressing contrasting autotomy levels, and (3) the effect of
different environmental controls. The number of genes that resulted from each individual group
comparison is shown in the circles. The 226 genes that are common to all three comparisons had
significantly different expression levels (at P<0.05 and at a -1.5<fold difference>1.5). These
genes are therefore considered as “autotomy associated” genes.
3.2.3.3 Spinal cord genes whose expression is associated with
autotomy levels
As in the analysis of the DRG gene expression levels dataset, Tables 6 and Appendix II provide
the number of probes and genes, and the respective list of genes that significantly differentiated
in the spinal cord at P<0.05 and 1.5<fold change <-1.5 between ADH vs. AS, ADH vs. BD and
ADH vs. ADL. Figure 5 shows that 798 probes marking 756 genes contrasted between ADH and
AS mice, 2465 probes marking 2215 genes contrasted between ADH and BD mice, and 677
probes marking 666 genes contrasted between ADH and ADL mice. The Venn analysis shown
in Figure 5 also indicates that 76 probes marking 73 genes across the whole genome
significantly contrasted between the ADH mice and mice of all other NLS groups (AS, BD, and
ADL).
226 shared genes for autotomy in DRGs
A Highvs.
A Low
A Highvs.
B Low
A Highvs.
A Sham
3037
4679
1964

58
Figure 5: Number of spinal cord genes throughout the genome whose expression level is
regulated by the effects of: (1) denervation in A mice expressing high autotomy vs. sham
operated A mice, (2) denervation in different strains expressing contrasting autotomy levels, and
(3) the effect of different environmental controls. The numbers of genes that resulted from each
individual group comparison are shown in the circles. The 73 genes that are common to all three
comparisons had significantly different expression levels (at P<0.05 and at a -1.5<fold
difference>1.5). These genes are therefore considered as “autotomy associated” genes.
3.2.4 Network analysis
3.2.4.1 Network analysis for DRG genes in D14PO denervated A
and B mice
In the next step to select for candidate ‘autotomy genes’, we looked at gene networks that
resulted from our gene lists, to isolate potential candidates that may be involved in pain
mechanisms. Using the GeneMANIA website, the 226 candidate genes in the DRG resulting
from the Venn analysis were further analyzed for network interactions, to determine with which
biological processes and cellular pathways they are engaged. Table 7 lists genes from the 226
genes’ list, and their proteins, which are known from the literature to functionally interact with
other proteins in biological processes. This mechanistic network analysis includes co-
73 shared genes for autotomy in spinal cord
A Highvs.
A Low
A Highvs.
B Low
A Highvs.
A Sham
666
2215
756

59
expression, co-localization, and physical interaction, whereby genes are co-expressed in the same
tissue, proteins are co-localized in the same cell organelle, or proteins are physically bound to
one another as a complex in a physical interaction, respectively. As shown in the Table 7, some
of the 226 genes interact with other candidate autotomy genes in this list (in bold), whereas many
other genes only interact with genes not on this list (non-bold). Out of these 226 DRG candidate
autotomy genes, some genes interacted within the following biological pathways: response to
metal ions and/or inorganic substance (Bcl2, Prnp, Gdi1, Ncam1, Cnga3, Homer1, Mef2c, Ect2,
Mapk8, Ccl19 and Ppargc1b), B cell proliferation (Ada, Bcl2, Il13ra1, Irs2, Mef2c), chemokine
receptor binding (Ccl17, Ccl19, Cxcl10, Stat1, Stat3), histone deacetylase binding (bx5, Mapk8,
Mef2c, Nr2c1, Nrip1), lymphocyte activation (Gata3, Cd47, Mef2c, Ada, Bcl2, Il4ra, Il13ra1,
Irs2), cellular component movement and/or cell migration (Bcl2, Ccl19, Cxcl10, Igf1r, Irs2,
Mapk8, Podxl, Fer, Gata3), and excitotoxicity, apoptosis, and neuroprotection (Bcl2).

60
Table 7: Candidate autotomy genes in the DRGs and biological processes in which they
operate. In bold are genes from the 226 autotomy candidate genes. In non-bold are other genes
that interacted in a network with other genes. In a Network genes that are either co-expressed,
co-localized or in physical interaction with another gene/s (i.e. 2 or more proteins that are found
bound to each other in a complex); individual= genes that were not interacting with other gene/s.
Underlined is Stat3 that was also studied by us in this project and reported herein (Chapter 5).
Homer1 Chr 13 94406010-94442522 homer homolog 1 (Drosophila) 26556
Mef2c Chr 13 84141092-84141151 myocyte enhancer factor 2C 25282
Bcl2 Chr 1 108538339-108538280 B-cell leukemia/lymphoma 2 9741
Cnga3 Chr 1 37206871-37206930 cyclic nucleotide gated channel alpha 3 9918
Ccl19 Chr 4 42776430-42776371 (C-C motif) ligand 19 11888
Gdi1 Chr X 74305012- 74311867 guanosine diphosphate (GDP) dissociation inhibitor 1 14567
Ncam1 Chr 9 49257408-49257349 neural cell adhesion molecule 1 17967
Prnp Chr 2 131909928- 131938431 prion protein 11170
Ect2 Chr 3 27321129-27318861 ect2 oncogene 7900
Mapk8 Chr 14 32207646-32207587 mitogen activated protein kinase 8 26419
Ppargc1b Chr 18 61421963-61421904peroxisome proliferative activated receptor, gamma,
coactivator 1 beta170826
Ada Chr 2 163726584- 163750177 adenosine deaminase 7398
Bcl2 Chr 1 108538339-108538280 B-cell leukemia/lymphoma 2 9741
Il13ra1 Chr X 32601604-32601663 interleukin 13 receptor, alpha 1 133990
Irs2 Chr 8 10986961- 11008430 insulin receptor substrate 2 1081212
Mef2c Chr 13 84141092-84141151 myocyte enhancer factor 2C 25282
Ccl17 Chr 8 97700999-97701058 chemokine (C-C motif) ligand 17 (Ccl17), mRNA 11332
Ccl19 Chr 4 42776430-42776371 (C-C motif) ligand 19 11888
Cxcl10 Chr 5 93422014-93421955 chemokine (C-X-C motif) ligand 10 21274
Stat1 Chr 1 52066524-52066583 signal transducer and activator of transcription 1 20846
Stat3 Chr 11 100886810-100939511 signal transducer and activator of transcription 3 20848
bx5 Chr 15 103191546..103239816 chromobox homolog 5 (Drosophila HP1a) _
Mapk8 Chr 14 32207646-32207587 mitogen activated protein kinase 8 26419
Mef2c Chr 13 84141092-84141151 myocyte enhancer factor 2C 17260
Nr2c1 Chr 10 93580081-93580140 nuclear receptor subfamily 2, group C, member 1 22025
Nrip1 Chr 16 76234512-76234453 nuclear receptor interacting protein 1 268903
Gata3 Chr 2 9857078- 9878600 GATA binding protein 3 14462
Cd47 Chr 16 49831819-49831878Mus musculus adult male hippocampus cDNA, RIKEN
full-length enriched library, cl16423
Gata3 Chr 2 9857078- 9878600 GATA binding protein 3 14462
Mef2c Chr 13 84141092-84141151 myocyte enhancer factor 2C 25282
Ada Chr 2 163726584- 163750177 adenosine deaminase 7398
Bcl2 Chr 1 108538339-108538280 B-cell leukemia/lymphoma 2 9741
Il4ra Chr 7 125552282- 125579474 interleukin 4 receptor, alpha 16190
Il13ra1 Chr X 32601604-32601663 interleukin 13 receptor, alpha 1 133990
Ind
ivi
du
al
Irs2 Chr 8 10986961- 11008430 insulin receptor substrate 2 1081212
Bcl2 Chr 1 108538339-108538280 B-cell leukemia/lymphoma 2 9741
Ccl19 Chr 4 42776430-42776371 (C-C motif) ligand 19 11888
Cxcl10 Chr 5 93422014-93421955 chemokine (C-X-C motif) ligand 10 21274
Igf1r Chr 7 68105625-68105684 insulin-like growth factor I receptor 10513
Irs2 Chr 8 10986961- 11008430 insulin receptor substrate 2 1081212
Mapk8 Chr 14 32207646-32207587 mitogen activated protein kinase 8 26419
Podxl Chr 6 31450627-31450568 Mus musculus podocalyxin-like 13723
Fer Chr 17 63896018- 64139496 er (fms/fps related) protein kinase 103921
Gata3 Chr 2 9857078- 9878600 GATA binding protein 3 14462
cell
ula
r co
mp
on
en
t
mo
vem
en
t an
d/o
r ce
ll
mig
rati
on
In a
Ne
two
rkIn
div
idu
al
che
mo
kin
e
rece
pto
r
bin
din
g
In a
Ne
two
rk
his
ton
e
de
ace
tyla
se
bin
din
g
In a
Ne
two
rk
lym
po
ho
cyte
act
ivat
ion
In a
Ne
two
rk
resp
on
se t
o in
org
anic
su
bst
ance
/ m
eta
l
ion
s In a
Ne
two
rkIn
div
idu
al
B c
ell
pro
life
rati
on
Ind
ivid
ual
DRG VENN genes Gene SymbolGenomic coordinates (Chr, from-
to Mb)Gene Product
Accession
NM

61
3.2.4.2 Network analysis of genes expressed in the spinal cord of
denervated A and B mice
An additional network analysis was performed, in a similar manner to the dataset of the DRG
autotomy genes, for the autotomy associated genes in the spinal cord. Table 8 lists genes in
biological processes found using a GeneMania analysis for some of the 73 candidate genes for
autotomy in the spinal cord, yielding the most significant contrasts in the three comparisons. Out
of these 73 spinal cord candidate autotomy genes, some genes interacted within the following
biological pathways: phagocytosis/endocytosis (Sirpb1a, Hck, Fcgr1 Slc11a1, Fcer1g, Vav1,
Coro1a), myeloid leukocyte/dendrite activation (Gimap5, Lilrb3, Pilrb1, Slc11a1, Fcer1g, Sfi1,
Tyrobp), adaptive immune response (Lilrb3, Fcgr1, Icam1, Slc11a1, Fcer1g, Samsn1, Gimap5),
homeostasis of number of cells (Lilrb3, Heph, Sox6, Fcer1g, Sfpi1, Coro1a, Gimap), external
side of plasma membrane (Vwf, Icam1, Fcgr1, Cd244, Emr1, Fcer1g, Ccr5), immunological
synapse (Cd53, Coro1a, Icam1), immunoglobulin binding (Fcgr1, Fcer1g, Vwf), myeloid cell
differentiation (Gimap5, Pilrb1, Lilrb3, Sox6, Cebpa, Heph, Sfpi1), antigen processing and
presentation (Fcgr1, Slc11a1, Fcer1g, Icam1), endocytosis and phagocytosis (Sirpb1a, Fcgr1,
Hck, Slc11a1, Fcer1g, Vav1, Coro1a), and inflammatory response (Fcgr1, Fcer1g, Ccr5, Kl).

62
Table 8: Candidate autotomy genes in the spinal cord and biological processes in which they
operate. In bold are genes from the 73 autotomy candidate genes. In non-bold are other genes
that interacted in a network with other genes. In a Network genes that are either co-expressed,
co-localized or in physical interaction with another gene/s (i.e. 2 or more proteins that are found
bound to each other in a complex); individual genes that were not interacting with other gene/s.
Sirpb1a Chr 3 015348529-015348470 signal-regulatory protein beta 1A 1002898
Hck Chr 2 152840517-152842444 hemopoietic cell kinase 10407
Fcgr1 Chr 3 096369943-096369880 Fc receptor, IgG, high affinity I 14129Slc11a1 Chr 1 74375203-74386051 solute carrier family 11 (proton-coupled
divalent metal ion transporters), member 1
13612
Fcer1g Chr 1 171229572-171234349 Fc receptor, IgE, high affinity I, gamma
polypeptide
10185
Vav1 Chr 17 57279100-57329236 vav 1 oncogene 22324Coro1a Chr 7 126699774-126704754 coronin, actin binding protein 1A 12721Gimap5 Chr 6 48676977-48677036 GTPase, IMAP family member 5 175035
Lilrb3 Chr 7 3315702-3315643 leukocyte immunoglobulin-like receptor,
subfamily B (with TM and ITIM domains),
member 3
18733
Pilrb1 Chr 5 138082142-138082083 paired immunoglobin-like type 2 receptor
beta 1 170741
Slc11a1 Chr 1 74375203-74386051 solute carrier family 11 (proton-coupled
divalent metal ion transporters), member 1
13612
Fcer1g Chr 1 171229572-171234349 Fc receptor, IgE, high affinity I, gamma
polypeptide
10185
Sfpi1 Chr 2 91096797-91115756 SFFV proviral integration 1 20734Tyrobp Chr 7 30413788-30417582 TYRO protein tyrosine kinase binding protein 11662
Lilrb3 Chr 7 3315702-3315643 leukocyte immunoglobulin-like receptor,
subfamily B (with TM and ITIM domains),
member 3
18733
Fcgr1 Chr 3 096369943-096369880 Fc receptor, IgG, high affinity I 14129Icam1 Chr 9 20779144-20779203 intercellular adhesion molecule 1 10493
Slc11a1 Chr 1 74375203-74386051 solute carrier family 11 (proton-coupled
divalent metal ion transporters), member 1
13612
Fcer1g Chr 1 171229572-171234349 Fc receptor, IgE, high affinity I, gamma
polypeptide
10185
samsn1 Chr 16 75858794- 75909266 SAM domain, SH3 domain and nuclear
localization signals, 167742
Ind
ivi
du
al Gimap5 Chr 6 48676977-48677036 GTPase, IMAP family member 5 175035
Lilrb3 Chr 7 3315702-3315643 leukocyte immunoglobulin-like receptor,
subfamily B (with TM and ITIM domains),
member 3
18733
Heph Chr X 92733954-92734013 hephaestin , transcript variant 2 181273
Sox6 Chr 7 115332904-115332845 SRY-box containing gene 6 , transcript
variant 120679
Fcer1g Chr 1 171229572-171234349 Fc receptor, IgE, high affinity I, gamma
polypeptide
10185
Sfpi1 Chr 2 91096797-91115756 SFFV proviral integration 1 20734Coro1a Chr 7 126699774-126704754 coronin, actin binding protein 1A 12721
Ind
iv
idu
al Gimap5 Chr 6 48676977-48677036 GTPase, IMAP family member 5 175035
ad
ap
tiv
e i
mm
un
e r
esp
on
seh
om
eo
sta
sis
of
nu
mb
er
of
cell
s
In a
Ne
two
rk
Genomic coordinates (Chr, from-to
Mb)Gene Product
Accession
NM
ph
ag
ocy
tosi
s /
en
do
cyto
sis
In a
Ne
two
rk
Gene SymbolSC VENN genes
In a
Ne
two
rk
my
elo
id l
eu
ko
cyte
/de
nd
rite
act
iva
tio
n
In a
Ne
two
rk

63
Table 8: Continued
Vwf Chr 6 125652152-125652211 Von Willebrand factor homolog 11708
Icam1 Chr 9 20779144-20779203 intercellular adhesion molecule 1 10493
Fcgr1 Chr 3 096369943-096369880 Fc receptor, IgG, high affinity I 14129Cd244 Chr 1 173419775-173419834 CD244 natural kil ler cell receptor 2B4 18729
Emr1 hr 17 57358686-57483529 EGF-like module containing, mucin-like,
hormone receptor-like sequence 1 13733
Fcer1g Chr 1 171229572-171234349 Fc receptor, IgE, high affinity I, gamma
polypeptide
10185
Ccr5 Chr 9 124121543-124127183 chemokine (C-C motif) receptor 5 12774Cd53 Chr 3 106758861-106790149 CD53 antigen 7651
Coro1a Chr 7 126699774-126704754 coronin, actin binding protein 1A 12721Icam1 Chr 9 20779144-20779203 intercellular adhesion molecule 1 10493
Fcgr1 Chr 3 096369943-096369880 Fc receptor, IgG, high affinity I 14129Fcer1g Chr 1 171229572-171234349 Fc receptor, IgE, high affinity I, gamma
polypeptide
10185
In di vi du al Vwf Chr 6 125652152-125652211 Von Willebrand factor homolog 11708
Gimap5 Chr 6 48676977-48677036 GTPase, IMAP family member 5 175035
Pilrb1 Chr 5 138082142-138082083 paired immunoglobin-like type 2 receptor
beta 1 170741
Lilrb3 Chr 7 3315702-3315643 leukocyte immunoglobulin-like receptor,
subfamily B (with TM and ITIM domains),
member 3
18733
Sox6 Chr 7 115332904-115332845 SRY-box containing gene 6 , transcript
variant 120679
Cebpa Chr 7 34829102-34829161 Mus musculus CCAAT/enhancer binding
protein , alpha
Heph Chr X 92733954-92734013 hephaestin , transcript variant 2 181273
Sfpi1 Chr 2 91096797-91115756 SFFV proviral integration 1 20734Fcgr1 Chr 3 096369943-096369880 Fc receptor, IgG, high affinity I 14129Slc11a1 Chr 1 74375203-74386051 solute carrier family 11 (proton-coupled
divalent metal ion transporters), member 1
13612
Fcer1g Chr 1 171229572-171234349 Fc receptor, IgE, high affinity I, gamma
polypeptide
10185
In di vi du al Icam1 Chr 9 20779144-20779203 intercellular adhesion molecule 1 10493
Sirpb1a Chr 3 015348529-015348470 signal-regulatory protein beta 1A 1002898
Fcgr1 Chr 3 096369943-096369880 Fc receptor, IgG, high affinity I 14129Hck Chr 2 152840517-152842444 hemopoietic cell kinase 10407
Slc11a1 Chr 1 74375203-74386051 solute carrier family 11 (proton-coupled
divalent metal ion transporters), member 1
13612
Fcer1g Chr 1 171229572-171234349 Fc receptor, IgE, high affinity I, gamma
polypeptide
10185
Vav1 Chr 17 57279100-57329236 vav 1 oncogene 22324Coro1a Chr 7 126699774-126704754 coronin, actin binding protein 1A 12721Fcgr1 Chr 3 096369943-096369880 Fc receptor, IgG, high affinity I 14129Fcer1g Chr 1 171229572-171234349 Fc receptor, IgE, high affinity I, gamma
polypeptide
10185
Ccr5 Chr 9 124121543-124127183 chemokine (C-C motif) receptor 5 12774
Kl Chr 5 151255290-151255349 secreted isoform of Klotho protein 16591
SC VENN genes Gene SymbolGenomic coordinates (Chr, from-to
Mb)Gene Product
Accession
NM
In a
Ne
two
rk
ext
ern
al s
ide
of
pla
sma
me
mb
ran
e
In a
Ne
two
rk
en
do
cyto
sis
and
ph
ago
cyto
sis
Infl
amm
ato
ry
resp
on
se
In a
Ne
two
rkIn
a N
etw
ork
imm
un
o-
glo
bu
lin
bin
din
g
In a
Ne
two
r
k
In a
Ne
two
rk
mye
loid
ce
ll d
iffe
ren
tiat
ion
In a
Ne
two
rk
imm
un
o
logi
cal
syn
apse
anti
gen
pro
cess
ing
and
pre
sen
tati
on

64
3.2.5 Pain1 DRG genes in denervated A and B mice
In the next step of the search for candidate ‘autotomy genes’ having a major effect on this pain
behaviour, we screened the list of candidate DRG autotomy genes to isolate those harboured
exclusively in Pain1. As shown in Table 8, seven genes were significantly regulated at P<0.05
in all 3 group comparisons (Csf2rb1, Cyhr1, Hemt1, Oplah, Ptk2, Rabl4, Rbm9). However, only
Hemt1 gene, encoding for hematopoietic cell transcript 1, fitted the criteria of the Venn analysis,
with fold differences ranging from -3.0 to +5.8. Hemt1 was up regulated in the ADH group 5.8
fold more compared to the AS group (P<0.00003), and 3.0 fold more compared to the ADL
group (NLS mice; P<0.01), but down-regulated by -2.0 fold compared to the BD group (P<0.03).
Hemt1 was not found to interact with other genes in the network analysis, nor was it found in
databases (http://www.ncbi.nlm.nih.gov/gene/?term=hemt1) of cellular pathways or biological
pathways. However, while Hemt1 is part of the genes mapped by the Allen Brain Atlas,
indicating that its cDNA probes did hybridize to brain sections of the B mouse used by this atlas,
there are no hybridization maps to spinal cord sections (http://mouse.brain-
map.org/gene/show/14978) and therefore, further indications about where in the spinal cord of
intact B mice it is expressed are not available from this resource.

65
Table 9: Pain1 genes in sham-operated and denervated A mice and denervated B mice that
reacted to the treatments by changed expression levels in the DRG. The 3 group comparisons
(ADH vs. AS; ADH vs. BD; and ADH vs. ADL) list candidate genes at P<0.05. In red are genes
that differed between each two compared groups at a significance level of P<0.05 in all 3
comparisons, regardless of the fold difference; in black are fold differences that did not reach the
cut off -1.5<fold difference>1.5. Those genes that were significant at P<0.05 in all 3 group
comparisons are Csf2rb1, Cyhr1, Hemt1, Oplah, Ptk2, Rabl4, Rbm9. Only Hemt1 gene made the
cut off of P<0.05 at a -1.5<fold difference>1.5 in all 3 group comparisons. Underlined is the
gene we report in this dissertation study.
P Fold Diff. P Fold Diff. P Fold Diff.
74433385-74433326 1700016M24Rik =
Mroh4
maestro heat-like repeat
family member 4
0.04103 -1.8
78962213-78962154 1700088E04Rik Unknown 138581 0.00673 -1.2 0.00000 1.7
0.05296 -1.5
75808056-75807997 2410075B13Rik =
Ccdc166
coiled-coil domain containing
166
75474451-75474510 2810039B14Rik Unknown 0.04725 -1.2
73054667-73054608 8030476L19Rik Unknown 0.03068 -1.2 0.04770 -1.2
75828441-75828382 AA409316 =
Fam83h
family with sequence
similarity 83, member H
134087 0.01302 -1.7
77659374-77659315 AK037579 Unknown 0.00980 1.3
78964090-78964149 AK147274 Unknown 0.01449 -2.5
78964090-78964149 AK147274 Unknown 0.00249 1.6 0.00463 1.6
76884283-76884342 Apol6 apolipoprotein L 6 0.04203 -2.1
74496481-74496422 Arc activity regulated cytoskeletal-
associated protein
0.01711 1.3 0.00515 -1.4
74416405-74416464 Bai1 brain-specific angiogenesis
inhibitor 1
174991 0.01264 -1.7
77234114-77234055 BC020489 = Apol9a apolipoprotein L 9a 0.00347 -2.5
76548954-76548895 C030006K11Rik Unknown 176828 0.00003 1.6
76549038-76548979 C030006K11Rik Unknown 176828 0.00047 1.5
77819931-77819872 Cacng2 calcium channel, voltage-
dependent, gamma subunit 2
0.04829 -1.6 0.01956 -1.8
78602622-78602563 Card10 caspase recruitment domain
family, member 10
130 0.00000 2.4
78602863-78602804 Card10 caspase recruitment domain
family, member 10
130 0.00000 2.3
78678076-78678135 Cdc42ep1 CDC42 effector protein (Rho
GTPase binding) 1
0.00000 -2.7
76728465-76728524 Commd5 COMM domain containing 5 25536 0.00667 -1.3 0.00130 -1.5
78175465-78175524 Csf2rb1 colony stimulating factor 2
receptor, beta 1, low-affinity
(granulocyte macrophage)
0.01223 2.0 0.01745 1.9 0.04768 1.3
78177993-78178052 Csf2rb1 colony stimulating factor 2
receptor, beta 1, low-affinity
(granulocyte macrophage)
0.04485 1.6
76172763-76172822 Cyc1 cytochrome c-1 25567 0.00193 -1.7
76473085-76473026 Cyhr1 cysteine and histidine rich 1 0.00002 -1.3 0.00992 -1.4 0.00037 -1.5
76485515-76485456 Cyhr1 cysteine and histidine rich 1 0.00048 -1.4 0.02838 -1.1 0.03946 -1.1
76471038-76470979 Cyhr1 cysteine and histidine rich 3 0.05218 -1.3 0.00981 -1.7
6255912-76256422 D330001F17Rik =
Mroh1 =
ENSMUST0000009
2595
maestro heat-like repeat
family member 1
0.03852 1.9
ADH-ADLAccession NM
Genomic Coordinates
Chr. 15 (from-to, Mb)Gene Symbol Gene Product
ADH-AS ADH-BD
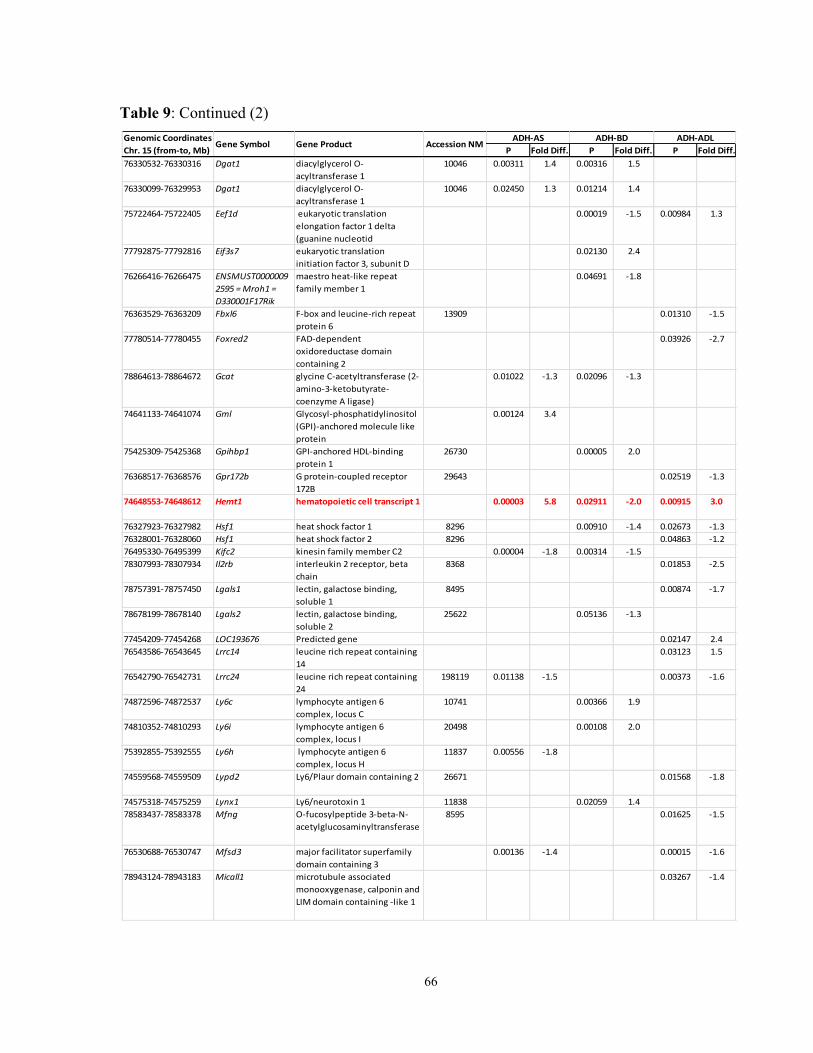
66
Table 9: Continued (2)
P Fold Diff. P Fold Diff. P Fold Diff.
76330532-76330316 Dgat1 diacylglycerol O-
acyltransferase 1
10046 0.00311 1.4 0.00316 1.5
76330099-76329953 Dgat1 diacylglycerol O-
acyltransferase 1
10046 0.02450 1.3 0.01214 1.4
75722464-75722405 Eef1d eukaryotic translation
elongation factor 1 delta
(guanine nucleotid
0.00019 -1.5 0.00984 1.3
77792875-77792816 Eif3s7 eukaryotic translation
initiation factor 3, subunit D
0.02130 2.4
76266416-76266475 ENSMUST0000009
2595 = Mroh1 =
D330001F17Rik
maestro heat-like repeat
family member 1
0.04691 -1.8
76363529-76363209 Fbxl6 F-box and leucine-rich repeat
protein 6
13909 0.01310 -1.5
77780514-77780455 Foxred2 FAD-dependent
oxidoreductase domain
containing 2
0.03926 -2.7
78864613-78864672 Gcat glycine C-acetyltransferase (2-
amino-3-ketobutyrate-
coenzyme A ligase)
0.01022 -1.3 0.02096 -1.3
74641133-74641074 Gml Glycosyl-phosphatidylinositol
(GPI)-anchored molecule like
protein
0.00124 3.4
75425309-75425368 Gpihbp1 GPI-anchored HDL-binding
protein 1
26730 0.00005 2.0
76368517-76368576 Gpr172b G protein-coupled receptor
172B
29643 0.02519 -1.3
74648553-74648612 Hemt1 hematopoietic cell transcript 1 0.00003 5.8 0.02911 -2.0 0.00915 3.0
76327923-76327982 Hsf1 heat shock factor 1 8296 0.00910 -1.4 0.02673 -1.3
76328001-76328060 Hsf1 heat shock factor 2 8296 0.04863 -1.2
76495330-76495399 Kifc2 kinesin family member C2 0.00004 -1.8 0.00314 -1.5
78307993-78307934 Il2rb interleukin 2 receptor, beta
chain
8368 0.01853 -2.5
78757391-78757450 Lgals1 lectin, galactose binding,
soluble 1
8495 0.00874 -1.7
78678199-78678140 Lgals2 lectin, galactose binding,
soluble 2
25622 0.05136 -1.3
77454209-77454268 LOC193676 Predicted gene 0.02147 2.4
76543586-76543645 Lrrc14 leucine rich repeat containing
14
0.03123 1.5
76542790-76542731 Lrrc24 leucine rich repeat containing
24
198119 0.01138 -1.5 0.00373 -1.6
74872596-74872537 Ly6c lymphocyte antigen 6
complex, locus C
10741 0.00366 1.9
74810352-74810293 Ly6i lymphocyte antigen 6
complex, locus I
20498 0.00108 2.0
75392855-75392555 Ly6h lymphocyte antigen 6
complex, locus H
11837 0.00556 -1.8
74559568-74559509 Lypd2 Ly6/Plaur domain containing 2 26671 0.01568 -1.8
74575318-74575259 Lynx1 Ly6/neurotoxin 1 11838 0.02059 1.4
78583437-78583378 Mfng O-fucosylpeptide 3-beta-N-
acetylglucosaminyltransferase
8595 0.01625 -1.5
76530688-76530747 Mfsd3 major facilitator superfamily
domain containing 3
0.00136 -1.4 0.00015 -1.6
78943124-78943183 Micall1 microtubule associated
monooxygenase, calponin and
LIM domain containing -like 1
0.03267 -1.4
ADH-BD ADH-ADLGenomic Coordinates
Chr. 15 (from-to, Mb)Gene Symbol Accession NMGene Product
ADH-AS
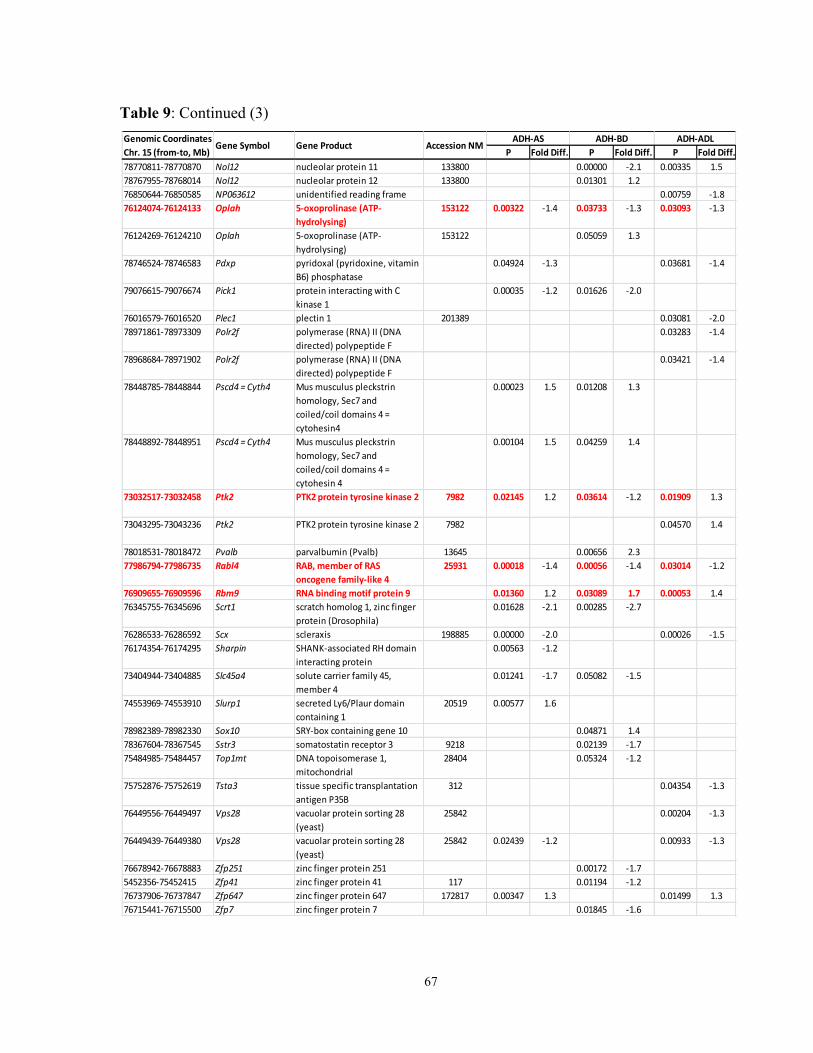
67
Table 9: Continued (3)
P Fold Diff. P Fold Diff. P Fold Diff.
78770811-78770870 Nol12 nucleolar protein 11 133800 0.00000 -2.1 0.00335 1.5
78767955-78768014 Nol12 nucleolar protein 12 133800 0.01301 1.2
76850644-76850585 NP063612 unidentified reading frame 0.00759 -1.8
76124074-76124133 Oplah 5-oxoprolinase (ATP-
hydrolysing)
153122 0.00322 -1.4 0.03733 -1.3 0.03093 -1.3
76124269-76124210 Oplah 5-oxoprolinase (ATP-
hydrolysing)
153122 0.05059 1.3
78746524-78746583 Pdxp pyridoxal (pyridoxine, vitamin
B6) phosphatase
0.04924 -1.3 0.03681 -1.4
79076615-79076674 Pick1 protein interacting with C
kinase 1
0.00035 -1.2 0.01626 -2.0
76016579-76016520 Plec1 plectin 1 201389 0.03081 -2.0
78971861-78973309 Polr2f polymerase (RNA) II (DNA
directed) polypeptide F
0.03283 -1.4
78968684-78971902 Polr2f polymerase (RNA) II (DNA
directed) polypeptide F
0.03421 -1.4
78448785-78448844 Pscd4 = Cyth4 Mus musculus pleckstrin
homology, Sec7 and
coiled/coil domains 4 =
cytohesin4
0.00023 1.5 0.01208 1.3
78448892-78448951 Pscd4 = Cyth4 Mus musculus pleckstrin
homology, Sec7 and
coiled/coil domains 4 =
cytohesin 4
0.00104 1.5 0.04259 1.4
73032517-73032458 Ptk2 PTK2 protein tyrosine kinase 2 7982 0.02145 1.2 0.03614 -1.2 0.01909 1.3
73043295-73043236 Ptk2 PTK2 protein tyrosine kinase 2 7982 0.04570 1.4
78018531-78018472 Pvalb parvalbumin (Pvalb) 13645 0.00656 2.3
77986794-77986735 Rabl4 RAB, member of RAS
oncogene family-like 4
25931 0.00018 -1.4 0.00056 -1.4 0.03014 -1.2
76909655-76909596 Rbm9 RNA binding motif protein 9 0.01360 1.2 0.03089 1.7 0.00053 1.4
76345755-76345696 Scrt1 scratch homolog 1, zinc finger
protein (Drosophila)
0.01628 -2.1 0.00285 -2.7
76286533-76286592 Scx scleraxis 198885 0.00000 -2.0 0.00026 -1.5
76174354-76174295 Sharpin SHANK-associated RH domain
interacting protein
0.00563 -1.2
73404944-73404885 Slc45a4 solute carrier family 45,
member 4
0.01241 -1.7 0.05082 -1.5
74553969-74553910 Slurp1 secreted Ly6/Plaur domain
containing 1
20519 0.00577 1.6
78982389-78982330 Sox10 SRY-box containing gene 10 0.04871 1.4
78367604-78367545 Sstr3 somatostatin receptor 3 9218 0.02139 -1.7
75484985-75484457 Top1mt DNA topoisomerase 1,
mitochondrial
28404 0.05324 -1.2
75752876-75752619 Tsta3 tissue specific transplantation
antigen P35B
312 0.04354 -1.3
76449556-76449497 Vps28 vacuolar protein sorting 28
(yeast)
25842 0.00204 -1.3
76449439-76449380 Vps28 vacuolar protein sorting 28
(yeast)
25842 0.02439 -1.2 0.00933 -1.3
76678942-76678883 Zfp251 zinc finger protein 251 0.00172 -1.7
5452356-75452415 Zfp41 zinc finger protein 41 117 0.01194 -1.2
76737906-76737847 Zfp647 zinc finger protein 647 172817 0.00347 1.3 0.01499 1.3
76715441-76715500 Zfp7 zinc finger protein 7 0.01845 -1.6
Genomic Coordinates
Chr. 15 (from-to, Mb)Gene Symbol Accession NMGene Product
ADH-AS ADH-BD ADH-ADL

68
3.2.6 Pain1 genes associated with autotomy in spinal cord
Table 10 shows that within Pain1, the only genes that came up as significantly contrasting
between ADH and all three other groups (Venn shared genes) were Csf2rb1 and Csf2rb2.
Csf2rb1 encodes the beta subunit 1 of the common receptor for the following three cytokines:
granulocyte-macrophage colony stimulating factor (GM-CSF), and the interleukin-3 (IL3) and -5
(IL5). Its other aliases are: Bc, Il3r, AIC2B, Il3rb, Il5rb, CDw131, Il3rb1, Csfgmrb, AI848964
and MGC130522. Csf2rb2, on the other hand, encodes the beta subunit 2 of the common
receptor for the following three cytokines: granulocyte-macrophage colony stimulating factor
(GM-CSF), and the interleukin-3 (IL3) and -5 (IL5), and is located juxtaposed and upstream of
Csf2rb1 on mouse chromosome 15 within Pain1. Its other aliases are AIC2A, BetaIl3, Bil3,
Csfgmrb, Il3r, Il3rb and Il3rb2. It is likely a gene duplicate of Csf2rb1. Csf2rb1 was up-
regulated in ADH mice expressing MHS, compared to A mice that had the sham operation and
did not express autotomy (1.8 fold; P<0.0001), and to denervated B mice (BD) who expressed
NLS (1.7 fold; P<0.00003), and also to the denervated NLS-A mice despite undergoing the same
denervation and carrying the same A genome (1.9 fold; P<0.00009).

69
Table 10: Pain1 genes in the individual 3 group comparisons that yielded in the spinal cord
(ADH vs. AS; ADH vs. BD; ADH vs. ADL), P<0.05. In red are genes that yielded P<0.05 and
made the the cut off -1.5<fold difference>1.5. Those were Csf2rb1 and Csf2rb2.
P Fold Diff. P Fold Diff. P Fold Diff.
76884283-76884342 Apol6 Apolipoprotein L 6 0.04768 1.5
74496481-74496422 Arc activity regulated cytoskeletal-associated 0.02168 -1.3 0.02209 -1.3
78678076-78678135 Cdc42ep1 CDC42 effector protein (Rho GTPase 0.00000 -2.8
76777840-76777899 1110038F14Rik Unknown 54099 0.02957 -1.2
78962213-78962154 1700088E04Rik Unknown 138581 0.00182 1.4
77352227-77352168 2210421G13Rik Unknown 175391 0.04079 7.5
77352479-77352420 2210421G13Rik Unknown 175391 0.04762 4.2
77317715-77317774 9030421J09Rik Unknown 177744 0.02945 1.7 0.03415 1.7
74496481-74496422 Arc activity regulated cytoskeletal-associated 0.00007 -1.6
78602863-78602804 Card10 caspase recruitment domain family, 130 0.00002 2.4
78602622-78602563 Card10 caspase recruitment domain family 130 0.00006 2.1
78677249-78677308 Cdc42ep1 CDC42 effector protein (Rho GTPase 0.02491 -1.5
76728465-76728524 Commd5 COMM domain containing 5 25536 0.03226 1.3
78177993-78178052 Csf2rb1
colony stimulating factor 2 receptor, beta
1, low-affinity (granulocyte macrophage) 0.00013 1.8 0.00005 1.8 0.00009 1.9
78110010-78109951 Csf2rb2
colony stimulating factor 2 receptor, beta
2, low-affinity (granulocyte macrophage) 0.03975 1.7 0.01284 1.9 0.04049 1.7
76157502-76157561 Exosc4 exosome component 4 175399 0.01966 -1.2
78721389-78721448 Gga1
golgi associated, gamma adaptin ear
containing, ARF binding protein 0.04180 1.3
76327923-76327982 Hsf1 heat shock factor 1 8296 0.03284 -1.4
78678199-78678140 Lgals2 lectin, galactose-binding, soluble 2 25622 0.01818 -1.4
77454209-77454268 LOC193676 Predicted gene 0.01654 2.5
74822437-74822378 Ly6a
Mus musculus lymphocyte antigen 6
complex, locus A 10738 0.00429 1.9
74935520-74935462 Ly6c mRNA for Ly-6C variant 0.00016 2.0
74872596-74872537 Ly6c lymphocyte antigen 6 complex, locus C 10741 0.00017 2.2
74810352-74810293 Ly6i lymphocyte antigen 6 complex, locus I 20498 0.00029 2.1
78089728-78089787 Ncf4 neutrophil cytosolic factor 4 8677 0.03332 1.8
76453642-76453583 Nfkbil2
nuclear factor of kappa light polypeptide
gene enhancer in B-cells 0.03995 1.3
78770811-78770870 Nol12 nucleolar protein 12 0.00189 -1.6
78767955-78768014 Nol12 nucleolar protein 12 133800 0.02868 1.2
79083778-79083837 Pick1 protein interacting with C kinase 1 0.03420 -1.6
78448785-78448844 Pscd4
pleckstrin homology, Sec7 and coiled/coil
domains 4 0.04177 1.3 0.04387 1.3
73032517-73032458 Ptk2 PTK2 protein tyrosine kinase 2 7982 0.02290 -1.3
76911278-76911219 Rbm9 RNA binding motif protein 9 0.00441 2.6
78739245-78739304 Sh3bp1 SH3-domain binding protein 1 9164 0.00784 1.7
73407821-73407762 Slc45a4 solute carrier family 45, member 4 0.00353 1.2
75484985-75484457 Top1mt DNA topoisomerase 1, mitochondrial 28404 0.04252 -1.2
75452356-75452415 Zfp41 zinc finger protein 41 0.05080 -1.2
Genomic
Coordinates Chr. 15
ADH-AS ADH-BD ADH-ADLAccession
NMGene ProductGene Symbol

70
3.2.7 In Situ Hybridization (ISH) labelling of Csf2rb2 in the spinal
cord and brain of the mouse
The resulted Pain1 ‘autotomy genes’ from our spinal cord data analysis, Csf2rb1 and Csf2rb2,
were further investigated by us using in silico methodology. The Allen Institute has produced
the Allen Brain Atlas (ABA; Allen Brain Atlas) by using in situ hybridization (ISH) methods to
map nuclei of many expressed genes throughout the brain and spinal cord of a naïve young adult
C57BL6/J male mouse. Using this resource, investigators can screen photomicrographs of
sagittal or coronal views of brain sections and transverse views of spinal cord sections labelled
with the gene under study. In addition, investigators can view matching Nissl stained sections
and anatomical reference views that schematically annotate the same sections as those under
investigation, pinpointing anatomical structures harbouring the gene under study. Amongst the
genes studied by the ABA is Csf2rb2, a gene that is also located in Pain1, which was also
detected by us using the whole genome gene expression analysis of the DRG and spinal cord, but
at a marginal significance compared to Csf2rb1. Csf2rb2 juxtaposes in Pain1 the gene Csf2rb1
(Figure 6), the gene we studied in this dissertation work. Csf2rb2 has a sequence and orientation
that suggest that it is a result of gene duplication.
Figure 6: Physical genetic map of Csf2rb1 and Csf2rb2. These two genes are located
juxtaposing each other in Pain1.
Csf2rb2 Csf2rb1 = Csf2rb

71
While the ABA did not map Csf2rb1, it is of value to analyze the cell types that express Csf2rb2
and their location in the brain and spinal cord vis-à-vis those of Csf2rb1. We carefully studied
these maps and provide a summary below. The following are photomicrographs of sections from
the ABA for Csf2rb2 showing intense labelling of somata of cells in the dentate gyrus
polymorph layer and a careful observation also shows many more smaller cells in the granule
layers (Figure 7A, C). Labelled cells were also found in the peri-aqueductal grey (PAG; cells of
which engage in endogenous modulation of pain (Ho et al., 2013), the hypothalamic
supramamillary and arcuate nuclei (data not shown), the midbrain ventral tegmental area (VTA)
and on the pial surface of the brain, and in the grey matter surrounding the 3rd
ventricle, seen as a
black thin rim in Figure 7C. The spinal cord is also labelled, mainly with neurons in the white
and grey matter, including in specific dorsal horn regions that take part in processing nociceptive
inputs (Layer I, substantia gelatinosa, deeper Layers, Layer X, central canal, but also the ventral
horn neurons; Figure 8). Since these labelled sections are from B mice, it is possible that A mice
constitutively express more of this gene in dorsal horn and central canal regions that process
nociceptive inputs. Moreover, in the brain of a 56 week old B mouse, the Atlas shows highly
specific and very intense labelling of Csf2rb2 expressing neuronal nuclei in select regions,
mainly the Polymorph Layer of the Hippocampal Formation Dentate Gyrus, the
Supramammilary Nucleus, Arcuate nucleus of the hypothalamus, Subthalamic nucleus, and

72
Periaqueductal Gray Matter (Figure 9).
A B
C

73
Figure 7: Photomicrographs of Csf2rb2 ISH in select regions of mouse brain
(http://mouse.brain-map.org/experiment/show/73992937). (A, C) Coronal sections from the
ABA for Csf2rb2 in the mouse brain showing strong and specific labelling of cells in the dentate
gyrus (red ovals), peri-aqueductal grey (PAG, blue oval), the midbrain ventral tegmental area
(VTA), the pial surface of the brain (green oval), and in the grey matter surrounding the 3rd
ventricle (blue oval).
Figure 8: Photomicrographs from the Allen Brain Atlas (http://mousespinal.brain-
map.org/imageseries/show.html?id=100038817) showing a strong labelling of in situ
hybridization of Csf2rb2 in the lumbar spinal cord of a 56 weeks old intact B male mouse.
Transverse sections of the spinal cord show widely distributed labelling of Csf2rb2 expression in
neurons throughout the gray matter, more in the upper dorsal horn (1). There is also labelling of
glia cells under the pial surface of the dorsal columns (2) and around the central canal (3).
1
2
3

74
1
1
2
1
1
A B
C D
1
2
2
2
4
2
2
4
2
1
2
SMN
5
3
3
3
2
E
B
A
F G
Figure 9: Photomicrographs from the Allen Brain Atlas (http://mouse.brain-
map.org/experiment/show/73992937) showing a strong labelling of in situ hybridized reaction product to
Csf2rb2 in nuclei of certain cells clustering in specific brain nuclei and regions of an intact 56 weeks
male old B mouse (A, C, D, E). Sagittal (A, C) and coronal (D) sections of the mouse brain showing
selective areas having Csf2rb2 expression: (1) dentate gyrus of the hippocampal formation; shown in
light green in the reference atlas (B). Cells marked by (2) are labelled in the Peri-aqueductal Gray (PAG),
an area that is involved in descending modulation of pain (E-I). Strong labelling was also noted in the
Supramamilary Nucleus (SMN), marked as (3) in panels E-G, and other hypothalamic nuclei, including
the Arcuate Nucleus (ARH) marked as (7) in panels (H-J). What appears as glia cells in linings of
ventricles and the pia mater is marked by (4) and (5) in panels E-G. (B, F, G, J) show reference maps.

75
6
J
H
B
A
I
B
A
7
7
7

76
3.2.8 Csf2rb2 gene networks
The ISH data from the Allen Atlas of Csf2rb2, together with the strong indications from our own
gene expression data, pointing at Csf2rb1 and Csf2rb2 as possible candidate genes for autotomy
behaviours has prompted us to have a closer look at network interactions specifically with these
genes. Figure 10 illustrates the gene networks in which Csf2rb1 is involved. As can be seen,
Csf2rb1 is co-expressed with Csf2rb2, Csf2ra and Jak2, among other genes. Jak2 is one of the
kinases that phosphorylates CSF2RB1 and is discussed in greater detail in Chapter 5 & 6 in
mechanisms of the Jak/Stat pathway. Csf2rb1 is co-localized with and is found in a physical
interaction with Csf2rb2, among other genes. Csf2rb1 shares similar protein domains found in
Csf2rb2 and Csf2ra, as shown in Figure 10.
Figure 10: Gene networks of Csf2rb1. Presented in grey circles are genes found by GeneMania
to correlate with Csf2rb1 in one or more networks. Every line presents the correlation between
two genes, and the color specifies the type of correlation: purple designates co-expressed genes,
genes that are expressed together in the same tissue or system; physical interactions is marked by
pink lines, gene products are found physically bound to one another in the same complex, thus
serve in the same cellular pathway; co-localization (in blue lines), gene products that are
localized together within the same tissue or in the same cellular location; and shared protein
domains (in green lines), gene products that have the same protein domains. The thickness of the
lines symbolizes the weight of the correlation, the thicker the line the more correlated are 2 gene
or gene products.

77
Co-expression Co-localization
Physical interactionsShared protein domains

78
3.2.9 SNP analysis in candidate autotomy genes – Pain1 genes in
intact A and B mice
In addition to different mRNA levels in candidate genes that may produce differential levels of
autotomy behaviour, other genetic mechanisms may produce the same effect on chronic pain
behaviour, conferred by differences in the genetic sequence that control the contrasting
phenotypes in two genetic backgrounds, such as A vs. B mouse strains. One type of such genetic
alteration is mismatching single nucleotides between the two strains. These alterations are called
single nucleotide polymorphisms (SNPs), which can be found in exons that relay the genetic
message, in intronic regions that are not translated, or in the untranslated regions normally found
upstream of the gene where transcription factors bind and begin gene transcription. SNPs can
affect mRNA stability, production of different splice variants, gene-gene interactions, and the
production of a dysfunctional/truncated protein. In the present study, we looked at SNPs in
candidate genes, preferentially in coding regions, that exist between autotomy prone mouse
strains and autotomy resistant strains, such as A vs. B. This analysis served as another criterion
for prioritizing a candidate autotomy gene for future study, because genes lacking SNPs that
differ between A and B mice can be excluded from the shortlisted candidates for being
considered autotomy genes.
Using the Jax Labs Mouse Genome Informatics (MGI) website
(http://www.informatics.jax.org/javawi2/servlet/WIFetch?page=snpQF) we compared the
sequence of a select number of mouse strains for which we had previous knowledge regarding
their typical level of autotomy post-hindpaw denervation, including some that are known to
express moderate-high levels of autotomy (such as A mice), some that express no or low
autotomy levels (including B mice) and some that express moderate autotomy levels. Table 11
and Appendix III list all candidate autotomy genes in Pain1, differentially expressed in the
DRGs, spinal cord, or both, and their SNPs according to following types.
(1) SNPs in coding regions: Several synonymous and non-synonymous SNPs were found in
these genes when comparing A to B mice, as well as comparing other high autotomy strains
(A/HeJ, BALB/cByJ, BALB/cJ), low autotomy strains (AKR/J, C57BL10/J), and moderate
autotomy strains (129X1/SvJ, 129S1/SvImJ, and DBA/2J).

79
(i) Non-synonymous SNPs, located in exons and thereby encode for a change in the amino acid
sequence of the gene product, were found in Csf2rb2 (2 such SNPs), and one SNP in each of the
genes Csf2rb1, Ly6i, Zfp7 Pick1 and Recql4. In Recql, the same SNP was also present in other
high (C3H/HeJ and BALB/cByJ) vs. low (AKR/J) and vs. moderate (DBA/2J, 129S1/SvImJ, and
129X1/SvJ) autotomy strains.
(ii) Four synonymous SNPs were found in exons. These are “silent” mutations, which do not
alter the amino acid sequence of the protein. Four such SNPs were noted in Csf2rb2 and 1 SNP
in each of the genes Csf2rb1, Ly6i, Zfp7, Pick1 and the currently not annotated gene
2010109I03Rik. In 2010109I03Rik the same SNP was also present in other high autotomy
strains (C3H/HeJ and BALB/cByJ) vs. low autotomy strains (AKR/J) and vs. moderate autotomy
strains (DBA/2J). As well, another SNP in this gene contrasted between the same strains;
however the allele in B mice is unknown.
(2) SNPs in untranslated regulatory regions (UTRs): UTRs also included many polymorphisms
in nucleotides mismatching between A and B mice. Seven genes contained SNPs within these
regions in Pain1: Nol12, differentially regulated in both DRGs and spinal cord of A vs. B mice,
had 2 SNPs; Csf2rb2, Csf2rb1, 1700088E04Rik, and Ly6i, differentially regulated in DRGs of A
vs. B mice, had 7, 4, 1, and 1 SNPs, respectively; 2010109I03Rik and Rbm9, that were
differentially regulated in the spinal cords of A vs. B mice, had 3 and 2 SNPs, respectively,
differing between A and B mice in the mRNA UTR. In 2010109I03Rik the same two SNPs were
also present in other high autotomy strains (C3H/HeJ and BALB/cByJ) vs. low autotomy strains
(AKR/J) and vs. moderate autotomy strains (DBA/2J, 129S1/SvImJ, and 129X1/SvJ).
(3) Intronic SNPs: Most genes had SNP variations in introns, and most variations in general were
intronic, as expected. Of the 34 candidate genes in Pain1, 20 genes had SNPs within introns.
Cacng2 (Nissenbaum et al., 2010) and Card 10, which were differentially regulated in both
DRGs and spinal cords of A vs. B mice, had 90 SNPs and one SNP within introns, respectively,
contrasting between the two strains, 9 SNPs contrasted between other high autotomy strains
(C3H/HeJ and BALB/cByJ) and low autotomy strain (AKR/J), and 6 SNPs contrasted between
high autotomy strains (C3H/HeJ and BALB/cByJ) and moderate autotomy strains (DBA/2J,
129S1/SvImJ, and 129X1/SvJ). In each of these SNPs, one allele was dedicated to all high
autotomy mouse strains and the other allele was present in low and/or the moderate autotomy

80
groups mentioned above. Rbm9, which was differentially regulated in the spinal cord of A vs. B
mice, had 94 SNPs within introns, which differed in these two strains, 23 SNPs differed between
other high autotomy strains (C3H/HeJ and BALB/cByJ) vs. low autotomy strain (AKR/J), and 10
SNPs contrasted between high autotomy strains (C3H/HeJ and BALB/cByJ) vs. moderate
autotomy strains (DBA/2J, 129S1/SvImJ, and 129X1/SvJ). Some of the other genes that
contained SNPs within introns that contrasted between A and B mice included: Csf2rb2,
Csf2rb1, Zfp7, 170008E04Rik, Ly6i, Ly6c and C030006K11Rik, which were differentially
expressed in the naïve DRGs, having 24, 13, 12, 7, 5, 2 and 1 SNPs, respectively; Pick1 Pvalb,
Apol10b, Recql4, and 2010109I03Rik that was differentially expressed in the naïve spinal cord,
had 23, 11, 5, 1, and 1 SNPs within introns, respectively.
The SNP analysis herein has advanced our knowledge on the genotypic contrast in several
candidate genes in Pain1 between A and B mice, and between other contrasting autotomy
strains. These differences in genotype within certain candidate genes may explain the
differential gene expression levels constitutively, as well as following hindpaw denervation, in
the contrasting autotomy strains. Indeed, we point out several candidates that were differentially
expressed in A vs. B mice before the denervation in intact mice, and following the denervation
with the appearance of autotomy. These 12 genes, Card10, Nol12, 1700088E04Rik,
CO30006K11Rik, Csf2rb1, Csf2rb2, Ly6c, Ly6i, Zfp7, Pick1, Pvalb, and Rbm9, were
differentially regulated with autotomy in at least one group comparison (ADH vs. AS, BD and
ADL; P<0.05;), and polymorphisms in coding, non-coding, and untranslated regulatory regions
were detected as discussed above. Of the four polymorphic type regions, the most significant
SNP type is in coding regions, whereby the mutation causes a change in the amino acid of the
protein and can potentially change its function. We thus prioritized genes with non-synonymous
SNPs at the highest level. SNPs in coding regions that were ‘silent’ and did not change the
amino acid were considered next, whereby the coding sequence in mRNA does not change the
protein function or its secondary structure. Third to be considered were genes whose SNPs were
located in UTRs, indicating whether mRNA levels may change for example, due to malfunctions
in the promoter binding site. Intronic SNPs were considered last because they were insignificant
unless they were found juxtaposing an exon-intron boundary, which might have affected the
splice site and could have created a splice variant. It is noteworthy that only three genes,
Csf2rb2, Csf2rb1, and Ly6i conveyed polymorphisms in all 4 regions discussed above, whereby

81
Csf2rb2 and Csf2rb1 were highly polymorphic within intronic and UTR regions in A vs. B mice,
some of which may explain the significant elevated mRNA levels in MHS- A mice compared to
NLS- B mice. Polymorphisms in Csf2rb2 and Csf2rb1 found in coding regions may or may not
support the notion that a truncated or non-functional protein receptor is produced in either the B
or the A strain, but not both. In conclusion to the SNP analysis Csf2rb2 and Csf2rb1 remain the
best candidate genes for autotomy in Pain1.
Table 11: SNPs in Pain1 candidate autotomy genes regulated constitutively between A and B
mice and between other MHS (A/HeJ, C3H/HeJ, BALB/cByJ, BALB/cJ) vs. NLS (AKR/J,
C57BL/10J) strains; MOD=Moderate autotomy strains: 129X1/SvJ, 129S1/SvI
Total SNPs A vs. B High vs. Low High vs. ModLow vs. ModTotal SNPs A vs. B High vs. Low High vs. ModLow vs. Mod Total SNPs A vs. B High vs. Low High vs. ModLow vs. ModTotal SNPs A vs. B High vs. Low High vs. ModLow vs. Mod
Card10 2 − − − − 0 − − − − 0 − − − − 1 1 − − −
Cdc42ep1 0 − − − − 0 − − − − 0 − − − − 0 − − − −
Cacng2 0 − − − − 0 − − − − 0 − − − − 109 90 9 6 0
Nol12 7 2 − − − 1 − − − − 1 − − − − 44 − − − 5
Plec1 0 − − − − 0 − − − − 0 − − − − 0 − − − −
1700088E04Rik 1 1 − − − 0 − − − − 0 − − − − 13 7 − − −
C030006K11Rik 1 − − − − 0 − − − − 0 − − − − 3 1 2 − −
Csf2rb1 6 4 − − − 1 1 − − − 5 1 − − − 47 13 − − −
Csf2rb2 15 7 − − − 9 4 − − − 11 2 − − − 126 24 − − 1
EG666504 = Gm8104 0 − − − − 0 − − − − 0 − − − − 0 − − − −
Gpihbp1 0 − − − − 0 − − − − 0 − − − − 0 − − − −
Ly6c 1 − − − − 0 − − − − 1 − − − − 28 2 4 − −
Ly6i 10 1 1 − − 1 1 − − − 2 1 − − − 37 5 5 − −
Ly6k 0 − − − − 0 − − − − 1 − − − − 2 − − − −
Pscd4 0 − − − − 0 − − − − 0 − − − − 0 − − − −
Zfp7 0 − − − − 1 1 − − − 1 1 − − − 18 12 4 1 −
2010109I03Rik 9 3 − 2 − 2 1 1 − − 0 − − − − 3 1 − − −
9130218O11Rik=
Apol10b 2 − − − − 3 − − − − 3 − − − − 47 5 3 1 1
BC024139 0 − − − − 0 − − − − 0 − − − − 0 − − − −
BC025446 0 − − − − 0 − − − − 0 − − − − 39 − − − −
Dennd3 7 − − − − 13 − − − − 7 − − − − 511 − − 9 −
ENSMUST00000096398 0 − − − − 0 − − − − 0 − − − − 0 − − − −
Lrrc62 = Elfn2 1 − − − − 0 − − − − 0 − − − − 8 − − − −
Ly6d 2 − − − − 0 − − − − 0 − − − − 9 − − 2 −
Ly6h 0 − − − − 0 − − − − 0 − − − − 0 − − − −
Mafa 0 − − − − 0 − − − − 0 − − − − 0 − − − −
Pick1 0 − − − − 1 1 − − − 2 1 − − − 83 23 − 5 −
Pvalb 0 − − − − 0 − − − − 0 − − − − 24 11 − − −
Rbm9 = RBfox2 2 2 − − − 0 − − − − 0 − − − − 145 94 23 10 −
Recql4 0 − − − − 0 − − − − 1 − 1 − − 3 1 1 − −
Scrt1 1 − − − 1 0 − − − − 0 − − − − 0 − − − −
Slc45a4 17 − − − − 9 − − − − 1 − − − − 207 − − 4 4
Slurp1 0 − − − − 0 − − − − 0 − − − − 3 − − 1 −
Coding Synonymous Coding Nonsynonymous IntronGene
mRNA UTR
DR
Gs &
Sp
ina
l
Co
rd
DR
Gs
Sp
ina
l co
rd

82
3.2.10 Other candidate genes related to autotomy
Another analytical algorithm for prioritizing the 34 Pain1 candidate genes for further in depth
work, resulting from the comparisons of the expression data in the DRGs and spinal cord of
intact and denervated A vs. B mice, was a literature search performed for each gene to examine
whether it has been studied within the context of pain or another related neural or neurological
function. A Pubmed search was performed for each of the candidate genes in Pain1 with the
following 14 searching terms: ‘brain’, ‘nerve’, ‘CNS’, ‘spinal cord’, ‘nerve injury’,
‘inflammation’ and ‘inflammatory response’,‘neurodegeneration’, ‘analgesia’, ‘pain’,
‘nociception’, ‘neuropathic’, ‘hyperalgesia’ and ‘allodynia’.
Table 12 lists genes reported in articles associated with one or more of these 14 searching terms,
including the product they encode, accession number, and chromosomal location (Mb). Genes
appearing in reports that included 1 of the 14 searching terms (‘brain’) were Ly6i, Ly6h and
Scrt1. Genes reported with 2 searching terms were Nol12, and Pvalb (‘brain’ and ‘nerve’) and
Gpihbp1 (‘brain’ and ‘analgesia’). Genes reported with 3 terms were Plec1 (‘brain’, ‘nerve’ and
‘inflammatory response’) and Recql4 (‘brain’, ‘CNS’ and ’neurodegeneration’). The gene Card
10 was reported with 4 terms (‘brain’, ‘nerve’, ‘inflammatory response’, and ‘analgesia’). Genes
reported with 5 terms were Ly6c and Rbm9 (‘brain’, ‘nerve’, ‘CNS’, ‘nerve injury’,
‘inflammation’and ‘inflammatory response’). The gene Mafa was reported with 6 terms (‘brain’,
‘nerve’, ‘spinal cord’, ‘nerve injury’, ‘inflammation’, ‘inflammatory response’ and ‘analgesia’).
The gene Csf2rb1 was reported with 7 terms (‘brain’, ‘nerve’, ‘CNS’, ‘spinal cord’, ‘nerve
injury’, ‘inflammatory response’ and ‘neurodegeneration’). The gene Cacng2 was reported with
8 terms (‘brain’, ‘nerve’, ‘CNS’, ‘spinal cord’, ‘nerve injury’, ‘inflammatory response’,
‘neurodegeneration’ and ‘pain’; some of these were actually contributed by our publication of it:
Nissenbaum et al., 2010). Finally, Pick1 was associated with 10 search terms (brain’, ‘nerve’,
‘CNS’, ‘spinal cord’, ‘nerve injury’, ‘inflammation’, ‘neurodegeneration’ ‘analgesia’,
‘nociception’, ‘neuropathic’ and ‘hyperalgesia’). Thus, based on this literature search, any one
of the above-listed genes could be a candidate gene for autotomy, moreover, it is important to
keep in mind that a new gene never implicated before with this trait could be missed with this
analysis.

83
Table 12: Candidate autotomy genes in Pain1 and their known relevance to pain. In red are
genes that are reported in articles associated with one or more of the following14 searching
terms: ‘brain’, ‘nerve’, ‘CNS’, ‘spinal cord’, ‘nerve injury’, ‘inflammation’ and ‘inflammatory
response’,‘neurodegeneration’, ‘analgesia’, ‘pain’, ‘nociception’, ‘neuropathic’, ‘hyperalgesia’
and ‘allodynia’.
3.2.11 Selecting the best candidate gene in Pain1
The gene expression profiling results from this study identified a number of candidate genes for
autotomy before and after the nerve injury. Autotomy genes were found throughout the genome
in both DRGs and spinal cords. In Pain1 there were a few candidates that differentially
regulated between A vs. B mice before the nerve injury, which could explain autotomy behaviour
Gene Brain Nerve CNSSpinal
cord
Nerve
injury
Inflammation,
Inflammatory
response
Neurodegeneration Analgesia
Pain,
Nociception,
Neuropathic
Hyperalgesia,
Allodynia
Cacng2 √ √ √ √ √ √ √ x √ x
Card10 √ √ x x x √ x √ x x
Plec1 √ √ x x x √ x x x x
Nol12 √ √ x x x x x x x x
Cdc42ep1 √ x x x x x x x x x
Csf2rb1 √ √ √ √ √ √ √ x x x
Ly6c √ √ √ x √ √ x x x x
Gpihbp1 √ x x x x x x √ x x
Ly6i √ x x x x x x x x x
Csf2rb2 x x x x x x x x x x
1700088E04Rik x x x x x x x x x x
C030006K11Rik x x x x x x x x x x
EG666504 = Gm8104 x x x x x x x x x x
Ly6k x x x x x x x x x x
Pscd4 x x x x x x x x x x
Zfp7 x x x x x x x x x x
Pick1 √ √ √ √ √ √ √ √ √ √
Mafa √ √ x √ √ √ x √ x x
Rbm9 = RBfox2 √ √ √ x √ √ x x x x
Slurp1 x √ √ √ √ x x x √ x
Recql4 √ x √ x x x √ x x x
Pvalb √ √ x x x x x x x x
Ly6h √ x x x x x x x x x
Scrt1 √ x x x x x x x x x
2010109I03Rik x x x x x x x x x x
9130218O11Rik=
Apol10b x x x x x x x x x x
BC024139 x x x x x x x x x x
BC025446 x x x x x x x x x x
Dennd3 x x x x x x x x x x
ENSMUST00000096398 x x x x x x x x x x
Lrrc62 = Elfn2 x x x x x x x x x x
Ly6d x x x x x x x x x x
Slc45a4 x x x x x x x x x x
DR
Gs
& S
pin
al
Co
rdD
RG
sS
pin
al
cord
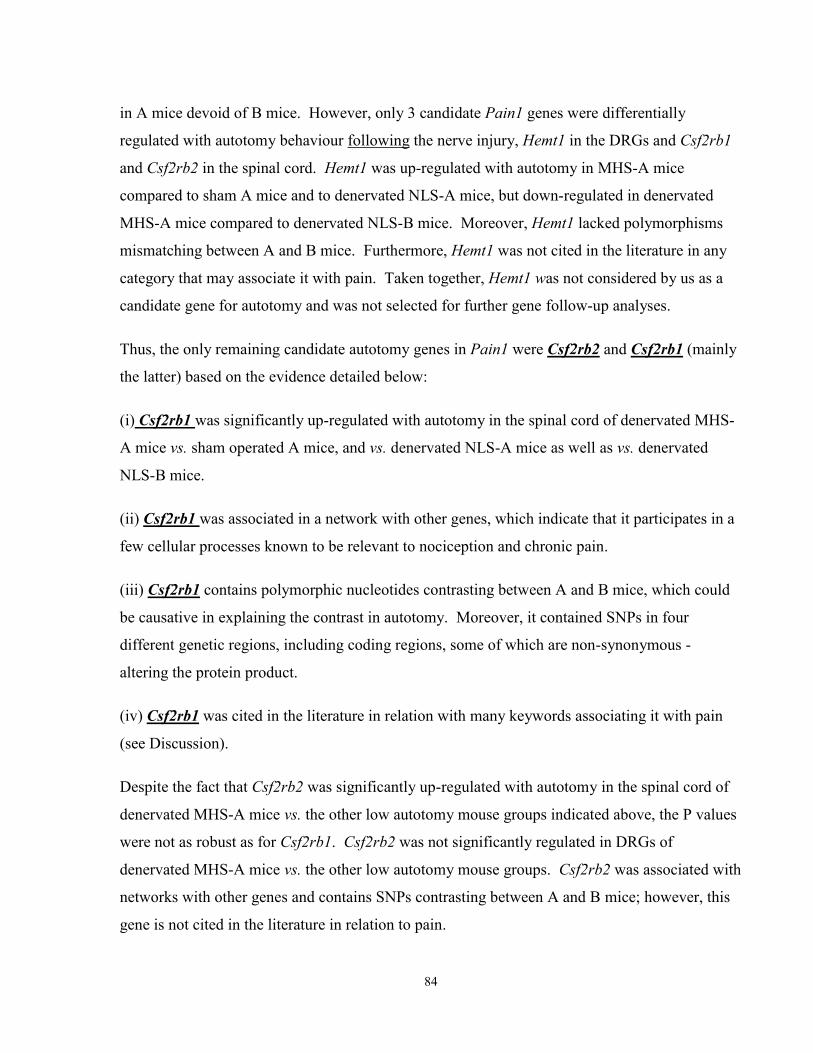
84
in A mice devoid of B mice. However, only 3 candidate Pain1 genes were differentially
regulated with autotomy behaviour following the nerve injury, Hemt1 in the DRGs and Csf2rb1
and Csf2rb2 in the spinal cord. Hemt1 was up-regulated with autotomy in MHS-A mice
compared to sham A mice and to denervated NLS-A mice, but down-regulated in denervated
MHS-A mice compared to denervated NLS-B mice. Moreover, Hemt1 lacked polymorphisms
mismatching between A and B mice. Furthermore, Hemt1 was not cited in the literature in any
category that may associate it with pain. Taken together, Hemt1 was not considered by us as a
candidate gene for autotomy and was not selected for further gene follow-up analyses.
Thus, the only remaining candidate autotomy genes in Pain1 were Csf2rb2 and Csf2rb1 (mainly
the latter) based on the evidence detailed below:
(i) Csf2rb1 was significantly up-regulated with autotomy in the spinal cord of denervated MHS-
A mice vs. sham operated A mice, and vs. denervated NLS-A mice as well as vs. denervated
NLS-B mice.
(ii) Csf2rb1 was associated in a network with other genes, which indicate that it participates in a
few cellular processes known to be relevant to nociception and chronic pain.
(iii) Csf2rb1 contains polymorphic nucleotides contrasting between A and B mice, which could
be causative in explaining the contrast in autotomy. Moreover, it contained SNPs in four
different genetic regions, including coding regions, some of which are non-synonymous -
altering the protein product.
(iv) Csf2rb1 was cited in the literature in relation with many keywords associating it with pain
(see Discussion).
Despite the fact that Csf2rb2 was significantly up-regulated with autotomy in the spinal cord of
denervated MHS-A mice vs. the other low autotomy mouse groups indicated above, the P values
were not as robust as for Csf2rb1. Csf2rb2 was not significantly regulated in DRGs of
denervated MHS-A mice vs. the other low autotomy mouse groups. Csf2rb2 was associated with
networks with other genes and contains SNPs contrasting between A and B mice; however, this
gene is not cited in the literature in relation to pain.

85
On this basis, Csf2rb1 was selected as the best candidate gene for autotomy, and the subject of
the gene follow-up assays described below in Chapter 4. While working on these experiments
on this gene, another gene in Pain1, Cacng2, has been studied as a candidate gene for autotomy
collaboratively by us and another research group at the Hebrew University in Jerusalem
(Nissenbaum et al., 2010). Some experimental work contributed by both groups resulted in a
publication to which we co-author, and this work is discussed in detail in the Discussion.
3.3 Discussion
3.3.1 Csf2rb1 as a candidate autotomy gene in Pain1
The present study used whole genome expression profiling to identify Csf2rb1 (a gene encoding
for the common receptor beta of GM-CSF, IL-3 and IL-5) as another candidate autotomy gene in
Pain1, in addition to Cacng2 (Nissenbaum et al., 2010). Chapter 4 describes additional
experiments we undertook to further support its candidacy. Csf2rb1 was expressed in
significantly higher levels in DRGs of naïve A mice compared to naïve B mice, and in the spinal
cord of denervated A mice expressing MHS of autotomy compared to denervated A mice with
NLS of autotomy . Csf2rb1 is part of a heterodimer receptor complex, the Colony Stimulator
Factor Receptor (CSFR) that is composed of 2 α and 2 β subunits. Csf2rb1 encodes the β
receptor subunit which is common for a number of cytokines, and is analogous to other cytokine
receptor complexes (such as the IL-6, IL-4, IL-13, and IL-2 receptors), each of which uses a
shared signalling subunit, suggesting an evolutionary conserved structural and functional
arrangement whereby a single polypeptide receptor chain can recognize more than one cytokine
to mediate multiple biological activities (Hercus et al., 2009). Indeed, Csf2rb1 encodes the beta
chain of a cytokine receptor which is shared among three ligands, GM-CSF, IL-3 and IL-5. It is
conserved in humans, chimpanzees, Rhesus monkeys, dogs, cows, rats, mice and chicken. Its
protein product is involved in multiple biological mechanisms, including cell survival,
proliferation, differentiation and apoptosis or its repression (Hercus et al., 2009; Kao et al., 2008;
Lee et al., 1999b; Lopez et al., 2010). Upon ligand binding, with any ligand of the three: GM-
CSF, IL-3, or IL-5, and receptor dimerization and activation via Janus kinase-2 (Jak-2) (Lopez et
al., 2010), intracellular signalling is followed, including the Jak/Signal transducer and activator

86
of transcription (Jak/Stat) pathway, Ras/Mitogen-activated protein kinase (Ras-MAPK) pathway,
and the phosphatidylinositol-3 (PI-3) kinase pathway (Hercus et al., 2009).
Many chronic inflammatory diseases are driven by deregulated GM-CSF, IL-3, or IL-5 cytokine
receptor signalling, highlighting their importance in disease (Lopez et al., 2010). Thus, Csf2rb1
holds several roles in important cellular mechanisms that have been conserved through
evolution, which may suggest that this gene product may play the same role in neuropathic pain
mechanisms in many other mammalian and avian species. If corroborated by additional
experiments, this conservation would attest to the importance this gene product plays in pain
mechanisms. While not much is known about the functions of Csf2rb1 in the nervous system,
more is known about one of its ligands, GM-CSF, in relation to neurological diseases, response
to nerve injury, and in peripheral pain mechanisms. In this dissertation we describe the possible
involvement of CSF2RB1 in the CNS, and propose its association with pain.
3.3.2 Cacng2 in Pain1 as a candidate autotomy gene
In a recent publication we proposed that Cacng2, a gene in Pain1, is also a candidate autotomy
controlling gene (Nissenbaum et al., 2010). To prioritize the genes in Pain1, Nissenbaum et al.
applied four criteria to the genes in this QTL: (1) segregation between known SNPs in genes in
the confidence length of the QTL with the autotomy phenotype, i.e., having one SNP in all MHS
autotomy strains following nerve injury while having the other SNP in NLS autotomy strains. (2)
reported functional relevance of the candidate gene to neuropathic pain, or other pain syndromes
or traits (e.g., acute and/or inflammatory pain) as found by browsing PubMed using a set of
relevant searching terms, (3) significant up- or down-regulation of the gene expression levels
following hindpaw denervation, in a direction compatible with the gene’s putative function, and
(4) differential expression in several MHS vs. NLS autotomy strains.
The mouse strains studied by Nissenbaum et al. were different from those we used in the present
study in the following ways. The only MHS strain used for gene expression by Nissenbaum et
al. was C3H/HeJ. The A mouse strain used in the present study was not included in the gene
analysis (Criterion-4), but was only used for the SNP variation analysis
(http://www.informatics.jax.org). That study did not identify SNPs that: (i) alter protein
sequence in Cacng2, and (ii) segregate between mouse strains with known NLS and MHS,
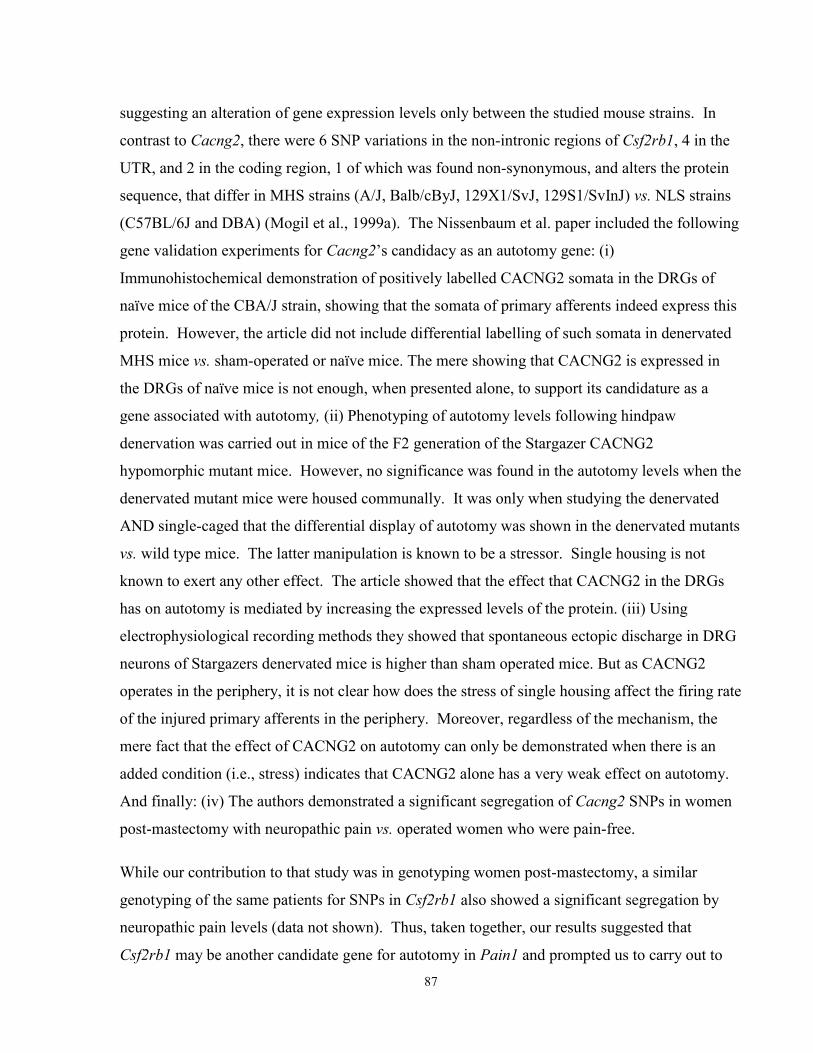
87
suggesting an alteration of gene expression levels only between the studied mouse strains. In
contrast to Cacng2, there were 6 SNP variations in the non-intronic regions of Csf2rb1, 4 in the
UTR, and 2 in the coding region, 1 of which was found non-synonymous, and alters the protein
sequence, that differ in MHS strains (A/J, Balb/cByJ, 129X1/SvJ, 129S1/SvInJ) vs. NLS strains
(C57BL/6J and DBA) (Mogil et al., 1999a). The Nissenbaum et al. paper included the following
gene validation experiments for Cacng2’s candidacy as an autotomy gene: (i)
Immunohistochemical demonstration of positively labelled CACNG2 somata in the DRGs of
naïve mice of the CBA/J strain, showing that the somata of primary afferents indeed express this
protein. However, the article did not include differential labelling of such somata in denervated
MHS mice vs. sham-operated or naïve mice. The mere showing that CACNG2 is expressed in
the DRGs of naïve mice is not enough, when presented alone, to support its candidature as a
gene associated with autotomy, (ii) Phenotyping of autotomy levels following hindpaw
denervation was carried out in mice of the F2 generation of the Stargazer CACNG2
hypomorphic mutant mice. However, no significance was found in the autotomy levels when the
denervated mutant mice were housed communally. It was only when studying the denervated
AND single-caged that the differential display of autotomy was shown in the denervated mutants
vs. wild type mice. The latter manipulation is known to be a stressor. Single housing is not
known to exert any other effect. The article showed that the effect that CACNG2 in the DRGs
has on autotomy is mediated by increasing the expressed levels of the protein. (iii) Using
electrophysiological recording methods they showed that spontaneous ectopic discharge in DRG
neurons of Stargazers denervated mice is higher than sham operated mice. But as CACNG2
operates in the periphery, it is not clear how does the stress of single housing affect the firing rate
of the injured primary afferents in the periphery. Moreover, regardless of the mechanism, the
mere fact that the effect of CACNG2 on autotomy can only be demonstrated when there is an
added condition (i.e., stress) indicates that CACNG2 alone has a very weak effect on autotomy.
And finally: (iv) The authors demonstrated a significant segregation of Cacng2 SNPs in women
post-mastectomy with neuropathic pain vs. operated women who were pain-free.
While our contribution to that study was in genotyping women post-mastectomy, a similar
genotyping of the same patients for SNPs in Csf2rb1 also showed a significant segregation by
neuropathic pain levels (data not shown). Thus, taken together, our results suggested that
Csf2rb1 may be another candidate gene for autotomy in Pain1 and prompted us to carry out to

88
undertake additional follow-up experiments including immunohistochemistry (see Chapter 4) to
further support its candidacy.
3.4 Conclusions
Experiments we carried out in the study reported in Chapter 3 identified Csf2rb1 as the gene in
Pain1 that significantly up-regulated in the spinal cord with pain behaviour induced by
denervation of the hindpaw in A mice compared to B mice and sham operated A mice. Its
mRNA levels were constitutively higher in the DRGs of naïve A vs. B mice and significantly
elevated in the ipsilateral spinal cord following hindpaw denervation in A mice vs. B mice.
Moreover, SNPs in several exons of Csf2rb1 were polymorphic between A and B mice.
Furthermore, Csf2rb1 has been documented to participate in some peripheral pain pathways,
such as Jak/Stat3, PI3K, MAPK and nuclear factor kappa B (NFκB) signalling. As these studies
did not test its role in the CNS, it is possible that should those articles tested it in the CNS its role
there could have been demonstrated as well. In addition, one of its ligands (i.e., GM-CSF) is a
crucial contributor to microglial activation in the CNS as well as contributes to membrane
excitability of peripheral sensory neurons (Duport and Garthwaite, 2005; Giulian and Ingeman,
1988; Hutter et al., 2010; Lin and Levison, 2009; Maresz et al., 2005; Mukaino et al., 2010;
Nakajima et al., 2006; Quan et al., 2009; Schweizerhof et al., 2009; Sheikh et al., 2009; Suzuki et
al., 2008; Volmar et al., 2008) - two important cellular mechanisms in pain. Results reported in
the next chapter additionally validate, in part, the candidacy of Csf2rb1 as an autotomy gene.

89
Chapter 4
Study II: Expression of CSF2RB1 by spinal central canal ependymal cells/radial glia/tanycytes correlates with autotomy levels in mice
4.1 Introduction
The Neuroma model (Wall et al., 1979) of spontaneous neuropathic pain mimics in rodents pain
experienced by humans following limb amputation, plexus avulsion, and major denervations.
The model manifests in progressive self-mutilation (‘autotomy’) of the denervated hindpaw, and
when studied under the same environmental conditions, the degree of autotomy is highly variable
across inbred rodent stains, indicating that this trait is controlled genetically (Devor et al., 2007;
Mogil et al., 1999a). Yet, mice of the same inbred strain, that are studied under fixed
experimental conditions, also show some variability in autotomy levels, indicating that some
environmental parameters have not been fully controlled and that they play some role via gene-
by-environment interactions.
The A and B strains are inbred (see Chapter 1 Section 1.4.2), and when tested under the same
environmental conditions they show contrasting levels of autotomy, where A express MHS and
B express NLS following the same hindpaw denervation procedure (Chapter 3). These strains,
together with the 23 recombinant inbred lines of the AXB-BXA set that were derived from
crossing mice of the A and B inbred strains, have been used by us previously to map a
quantitative trait locus (QTL) on mouse chromosome 15 that has a major effect on controlling
the variable levels of autotomy. We termed this QTL Pain1 (Seltzer et al., 2001). The presence
of this QTL was replicated in a study that used two strains that are also known to contrast on this
trait but are different strains from those used by Seltzer et al. 2001: C3H/HeJ and C58/J (Devor
et al., 2005b). This replication study indicated that Pain1 may contain autotomy genes in
additional contrasting strains, different from A versus B mice, that can be generalized to
operating in this function in mice in general. We reported that Cacng2, a gene harboured at the
Pain1 QTL, is a candidate gene for autotomy and neuropathic pain in women post-mastectomy.
This gene encodes the calcium channel subunit g2 (Nissenbaum et al., 2010).

90
In our preceding study, using whole genome expression analysis of DRGs and spinal cord in
naïve, sham-operated and denervated mice of the A and B strains, we identified another gene
located in Pain1 associated with autotomy behaviour. This gene, Csf2rb1, encodes the common
beta receptor of the cytokines GM-CSF, IL-3 and IL-5. In the present study, our aim was to
associate the candidacy of Csf2rb1 as another gene for autotomy in Pain1, and identify the type
of cells expressing it as ependymal cells/radial glia/tanycytes located in certain locations in the
spinal cord and brain.
4.2 Results
4.2.1 Autotomy behaviour in denervated A and B mice
To determine whether expressed levels of the Csf2rb1 gene correlate with the levels of pain
behaviour, autotomy was scored in denervated A and B mice following sciatic and saphenous
neurectomy, and these levels were compared with those of sham operated and naïve mice of the
same strains. Figure 11 displays the autotomy behaviour in these groups. As expected from
previous experiments by others and us, the figure shows that naïve and sham-operated A and B
mice remained free of autotomy throughout the 14 day behavioural follow-up, while denervated
A mice expressed considerably more autotomy behaviour compared to denervated B mice. Also
expected was the finding that denervated A mice expressed on day 14 PO final autotomy scores
that varied highly from animal to animal ranging from an AFS=0-11. As done in Chapter 3,
denervated A mice were divided into two subgroups, one comprising mice that expressed no/low
scores (NLS) on day 14 PO (i.e., having AFSs=0-1; ‘low-autotomy’), and the other subgroup of
mice who expressed moderate-high scores (MHS) on day 14 PO (i.e., had AFSs=2-11; ‘high
autotomy’). Figure 11b shows the average course of autotomy behaviour in these two subgroups
of denervated A mice. The final autotomy score on day14 PO significantly differed between
MHS and NLS phenotypes at P<0.0001 and was used as the final pain outcome measure for the
following correlative assessment of Csf2rb1 gene expression levels.
A second phenotype that contrasted between denervated A and B mice was the autotomy onset
day, i.e., the day in which mice began to self-mutilate and their autotomy score was ≥1. MHS-A

91
mice began to self-mutilate much earlier (day 4.84 PO ±0.77), compared with NLS- A mice (day
13.0 PO ±0.85, P<0.0001) or NLS-B mice (day 12.5 PO ±0.99, P<0.0001) (Figure 12b).
The third pain outcome of autotomy behaviour that was used to assess the expression level of
Csf2rb1 was the level of self-mutilation expressed by denervated mice on the onset day of
autotomy, a phenotype we named Autotomy Onset Score (‘AOS’). Figure 13a shows that the
average AOS in MHS- A mice was significantly higher (4.08±1.05) compared to the NLS-A
mice (0.14±0.14; P<0.0001) and NLS-B mice (0.41±0.09; P<0.0001), and this low score retained
low (scores of 0-1) throughout the experiment. MHS-A mice expressed a wider range of self-
mutilation scores on the day of onset. Therefore, it was important to determine whether Csf2rb1
gene expression levels also drove A mice to express a higher autotomy score at the behaviour’s
onset or only at the end of the behavioural follow up on day 14.

92
Figure 11: Post-operative course of average autotomy scores in denervated, sham and naïve A
and B mice. Following sciatic and saphenous neurectomy, mice were followed up daily and
their autotomy behaviour was scored up to day 14. (A) Average autotomy scores per day, of
denervated A mice (AFSs on day 14PO ranged from 0-11; N=42) vs. denervated B mice (AFSs
on day 14PO ranged from 0-1; N=32), A-sham (AFS on day 14PO was 0 for all mice; N=12), B-
sham (AFS on day 14PO was 0 for all mice; N=12), A-naïve (AFS on day 14PO was of 0 for all
mice; N=8;) and B-naïve mice (AFS on day 14PO was of 0 for all mice; N=8;) (B) Average
autotomy scores of MHS-A mice (AFSs on day 14PO were 2-11; N=25) vs. NLS-A subgroup
(AFSs on day 14 were 0-1; N=17), A-sham (AFS on day 14PO of all mice was 0; N=12), and A-
naïve mice (AFS of all mice on day 14PO was 0; N=8). For A and B, Two-way ANOVA for
0
1
2
3
4
5
6
1 2 3 4 5 6 7 8 9 10 11 12 13 14
Ave
rage
au
toto
my
sco
re
Post operative day
Autotomy in A and B mice
A-denervated
B-denervated
A-sham
B-sham
A-naive
B-naive
0
1
2
3
4
5
6
7
8
9
1 2 3 4 5 6 7 8 9 10 11 12 13 14
Ave
rage
au
toto
my
sco
re
Post operative day
Autotomy in A mice
A-high
A-low
A-sham
A-naive
B
A
*
****
*** **** ********
************
************
*
**
* ** *****
** ** ****************

93
repeated measures was performed followed by Tukey’s post hoc test; *P<0.05, **P<0.01,
***P<0.001, ****P<0.0001
Figure 12: Average autotomy onset day in denervated A and B mice. Following sciatic and
saphenous neurectomy, mice were followed up daily and their autotomy behaviour was scored
up to day 14. (A) Average autotomy onset day is presented for mice of the MHS-A subgroup
(N=25) vs. NLS-A mice (N=20) and NLS-B mice (N=32), sham-operated A and B mice (N=12
and N=12, respectively), and naïve A and B mice (N=8 and N=8, respectively). A one-way
ANOVA with Tukey’s post hoc showed that denervated MHS-A mice had a significantly shorter
autotomy onset day than all other NLS groups. (B) The number of mice which developed
autotomy on each day post-operation is represented in the columns. The frequency of autotomy
scores at onset day is shown for the MHS-A, NLS-A and NLS-B autotomy subgroups, as well as
for sham-operated and naïve A and B subgroups.
Figure 13: Autotomy scores at onset day in denervated A and B mice. Following sciatic and
saphenous neurectomy, mice were followed up daily and their autotomy behaviour was scored at
onset. (A) Average scores of autotomy at onset day in denervated A and B mice are presented
for MHS-A subgroup (N=25) vs. NLS-A (N=20) and NLS-B mice (0.28±0.08, N=32), sham
operated A and B mice (N=12 and N=12, respectively), and naïve A and B mice (N=8 and N=8,
respectively). A one-way ANOVA with Tukey’s post hoc showed that denervated A-high mice
had significantly higher autotomy onset scores than all other low autotomy groups. (B) The
0
2
4
6
8
10
12
14
16
A mice B mice
Au
toto
my
on
set
day
Autotomy onset day in A and B mice
denervated-high
denervated-low
sham
naive
0
5
10
15
20
25
30
35
40
45
50
1 2 4 5 6 7 8 9
10
11
12
13
A m
ice
14
B m
ice
14
Nu
mb
er
of
mic
e
Autotomy onset day
Number of mice per Autotomy Onset Day
denervated-high
denervated-low A
denervated-low B
sham
naive
p<0.0001
A B
0
0.5
1
1.5
2
2.5
3
3.5
4
A mice B mice
Au
toto
my
on
set
sco
re
Autotomy onset score in A and B mice
denervated-high
denervated-low
sham
naive
p<0.0001
0
5
10
15
20
25
30
35
40
45
50
A m
ice
0
B m
ice
0
A m
ice
1
B m
ice
1 2 3 4 5 7
11
Nu
mb
er
of
mic
e
Autotomy onset score
Number of mice per Autotomy Onset Score
denervated-high
denervated-low
sham
naive
BA

94
frequency of certain autotomy scores is shown in the denervated MHS-A, NLS-A and NLS-B
subgroups, as well as the sham-operated and naïve subgroups.
4.2.2 Csf2rb1 pattern of expression correlates with autotomy
behaviour in denervated A mice
Csf2rb1 gene expression levels contrasted in spinal cords of denervated MHS-A vs. NLS-A
mice, as expected from previous studies (Figure 14A). The significantly contrasting Csf2rb1
expression levels were noted between autotomizing and non-autotomizing mice, whether
denervated, sham operated or naïve. In denervated MHS-A mice, Csf2rb1 was expressed 2-fold
higher compared to the denervated NLS-A mice, and to sham-operated A mice (2.47±0.33 vs.
1.20±0.09; P<0.002, and 1.07±0.06; P<0.01, respectively). Moreover, Csf2rb1 was expressed 2-
fold higher in the MHS-A mice compared to the NLS-B mice (2.47±0.33 vs. 1.19±0.05;
P<0.004). No significant difference was observed between its expression levels in intact A and
B mice. Thus, constitutive gene expression levels of Csf2rb1 are comparable in the spinal cords
of these mice and therefore, the behavioural contrast post-denervation cannot be attributed to
differing constitutive levels of expression that would manifest at the time of nerve injury or a few
hours thereafter. Furthermore, no significant difference in gene expression levels was observed
between sham-operated A and B mice. Thus, the behavioural contrast post-denervation between
these strains cannot be attributed to differing levels of expression that are caused by anesthesia
and cutting skin and exposure of the nerves alone. Moreover, no significant difference was
observed in Csf2rb1 expression levels between the denervated NLS-A and NLS-B mice. This
result is compatible with the explanation that despite strain differences, same levels of Csf2rb1
gene expression are associated with the same autotomy levels. In fact, these expression levels
were generally comparable in all six groups that expressed NLS. Figure 14B shows the
correlation between Csf2rb1 gene expression and the autotomy levels in denervated A and B
mice on day 14 PO (R2 = 0.31; P<0.004).
Csf2rb1 gene expression levels were also correlated with the onset day of autotomy in A and B
mice (Figure 15A). MHS-A mice that had an early onset of autotomy that ranged from PO days
1-7 , had significantly higher Csf2rb1 mRNA levels in the ipsilateral spinal cord compared with
NLS-A and NLS-B mice that had a significantly later onset, ranging from PO days 8-14
(2.43±0.38 vs. 1.19±0.10; P<0.01 and 1.19±0.05; P<0.01, respectively). Within MHS-A mice,

95
no significant differences in Csf2rb1 spinal cord mRNA levels were observed between early vs.
late onset days of autotomy. This result suggests that expression levels of this gene are not
related to the onset of auotomy and its trigger but to the maintenance phase of chronic pain that
is at its peak at the time the animals were sacrificed, correlating significantly with the contrast at
the AFS levels rather than the onset days of the behaviour. Despite this conclusion, Csf2rb1
gene expression levels significantly correlated with the level of autotomy at its onset, both in A
and B mice (Figure 15B). Csf2rb1 mRNA levels of mice expressing at onset MHS (i.e., scores
≥2) did not significantly differ from those of mice expressing NLS at onset (i.e., autotomy onset
score of 1). However, high levels of autotomy at onset in MHS-A mice were correlated
significantly with higher Csf2rb1 mRNA levels on day 14 PO of A and B mice that did not
develop autotomy at all (2.32±0.51 vs. 1.27±0.07; P<0.05 and 1.19±0.05; P<0.05, respectively).
In conclusion Csf2rb1 was regulated significantly with autotomy behaviour, especially with the
autotomy final score on day 14PO in A and B mice.

96
Figure 14: Correlation of Csf2rb1 gene expression levels with autotomy behaviour on PO day
14 in denervated A and B mice. (A) Average Csf2rb1 mRNA levels (normalized relatively to
the expression levels of Hprt, the reference gene, see Appendix IV) of naïve (N=4, and N=4,
respectively), sham-operated (N=4 and N=4, respectively), denervated A and B mice with NLS
(N=8, and N=6, respectively), and denervated MHS-A mice (N=11). Csf2rb1 expression was 2-
fold higher in MHS-A mice compared to NLS mice (one-way ANOVA followed by Tukey’s
post hoc test). (B) Correlation analysis of Csf2rb1 mRNA levels (normalized by the levels of
Hprt) of individual denervated A and B mice and their autotomy levels on PO day 14.
0
0.5
1
1.5
2
2.5
3
A strain B strain
mR
NA
level of
Csf2
rb1
rela
tive t
o H
prt
Csf2rb1 gene expression in A and B mice
Naive
Sham
Low Autotomy
High Autotomy
P<0.01P<0.05 P<0.01P<0.01
A
B
R = 0.3137
0
0.5
1
1.5
2
2.5
3
3.5
4
4.5
0 2 4 6 8 10 12
mR
NA
leve
l of
Csf
2rb
1re
lati
ve t
o H
prt
Final autotomy score
Correlation of Csf2rb1 mRNA and autotomy levels in A and B mice
P = 0.003593

97
Figure 15: Csf2rb1 gene expression levels correlation with the onset day of autotomy and
autotomy onset scores in denervated A and B mice. (A) Average Csf2rb1 mRNA levels (relative
to Hprt) are represented for Low autotomy/Late onset B and A mice, which developed an
autotomy score of 1 on days 8-14 PO (N=6 and N=7), MHS-A/Late onset mice, which developed
autotomy scores of 2-11 on days 8-14 PO (N=5), and MHS-A/Early onset mice, which
developed autotomy scores of 2-11 on day 1-7 PO (N=8). Csf2rb1 expression was 2-fold higher
in MHS-A/Early onset mice, compared to Low autotomy/Late onset mice (one-way ANOVA
followed by LSD’s post hoc test). (B) Average Csf2rb1 mRNA levels (relative to Hprt) are
shown for denervated A and B mice, which did not develop autotomy and remained with an
autotomy score of 0 up to day 14 PO (N=6 and N=6), denervated A mice, which developed high
or low autotomy and their score at autotomy onset day was 1 (N=6), and A-MHS mice, which
developed high autotomy and their score at onset was ≥2 (N=8). Csf2rb1 expression was 2-fold
higher in denervated A mice that developed high autotomy scores of ≥2 at onset, compared to
denervated A and B mice with no autotomy until PO day 14, hence their score at onset day of 15
PO was 0 (one-way ANOVA followed by LSD’s post hoc test).
4.2.3 Autotomy behaviour in denervated C3H/HeJ and AKR/J
mice
If Csf2rb1 expression regulates the autotomy behaviour in mice in general and not just the
contrast between denervated A and B strains, then other autotomy contrasting strains should also
show the corresponding contrast in expression levels of this gene in the spinal cord. Therefore,
two additional strains that are known from previous work to contrast in autotomy behaviour
following hindpaw denervation were used next, to determine whether Csf2rb1 correlates with
autotomy in these strains as well: C3H/HeJ mice, which express MHS, and AKR/J, which
express NLS following the same sciatic and saphenous neurectomy. Table 11 (Chapter 3) shows
that these two strains carry many SNPs on candidate Pain1 autotomy genes we considered in the
previous Chapter. For this reason, we compared Csf2rb1 gene expression levels in these strains
0
0.5
1
1.5
2
2.5
3
Low autotomy/Lateonset
High autotomy/Lateonset
High autotomy/Earlyonset
mR
NA
leve
l of
Csf
2rb
1re
lati
ve t
o H
prt
Csf2rb1 gene expression is correlated with onset day of autotomy in A and B mice
B
A
0
0.5
1
1.5
2
2.5
3
Onset score 0 Onset score 1 Onset score >2mR
NA
leve
l of
Csf
2rb
1re
lati
ve t
o H
prt
Csf2rb1 gene expression is correlated with autotomyonset score in A and B mice
B
A
B
p<0.01
A
p<0.01p<0.05
p<0.05
_

98
correlating these levels with autotomy behaviour. Mice of the two strains were denervated, or
sham-operated, or left intact, and were followed up for autotomy behaviour. As most C3H/HeJ
mice that were denervated did not develop autotomy in the first 14 days post-operation, they
were followed up for 21 days PO. Upon reaching a final autotomy score of 11 or on post-
operative day 21 mice were perfused and their spinal cords removed for gene expression
analysis. As in A mice (on PO day 14), on day 21 autotomy scores of denervated C3H/HeJ mice
varied from 0-11, and like A mice they were divided into two separate subgroups: NLS (having
AFS=0-1) and MHS (having scores AFS=2-11) subgroups. Autotomy scores in denervated
AKR/J mice were as expected from the literature (AFS=0). Figure 16 shows the average
autotomy behaviour in the MHS-C3H/HeJ mice compared to NLS-AKR/J mice (16A), and NLS-
C3H/HeJ mice (16B).
Autotomy onset day of denervated C3H/HeJ and AKR/J mice is shown in Figure 17A. As
shown above for A and B mice, denervated MHS-C3H/HeJ mice had an earlier onset day
(8.3±1.26, ranging from 2-15) than NLS-C3H/HeJ mice (16.22±2.04, ranging from day 1-21;
P<0.01) and NLS -AKR mice (22.0±0.00; P<0.001) that did not express autotomy. The number
of mice that expressed autotomy on each day PO is shown in Figure 17B.
The score of autotomy at onset day also varied highly in C3H/HeJ and AKR/J mice (Figure
18A). This score was significantly higher in C3H/HeJ mice with high autotomy scores on PO
day 21 (2.9±0.66, ranging from 1-7) than C3H/HeJ and AKR/J mice with no or low levels of
autotomy on PO day 21 (0.29±0.13 P<0.0001, and 0±0; P<0.0001, respectively). The number of
mice that expressed autotomy with onset scores 0-7 is represented in the columns (Figure 18B).

99
Figure 16: Post-operative course of average autotomy scores in C3H/HeJ and AKR/J mice.
Following sciatic and saphenous neurectomy, mice were followed up daily and their autotomy
behaviour was scored up to day 21. (A) Average autotomy scores per day of denervated
C3H/HeJ mice (AFSs on PO day 21 ranged from 0-11; N=28) vs. denervated AKR/J mice (AFSs
0
0.5
1
1.5
2
2.5
3
3.5
4
1 2 3 4 5 6 7 8 9 10 11 12 13 14 15 16 17 18 19 20 21
Ave
rage
au
toto
my
sco
re
Post operative day
Autotomy in C3H/HeJ and AKR/J mice
C3H/HeJ denervated
AKR/J denervated
C3H/HeJ sham
AKR/J sham
C3H/HeJ naive
AKR/J naive
0
1
2
3
4
5
6
7
8
9
10
1 2 3 4 5 6 7 8 9 10 11 12 13 14 15 16 17 18 19 20 21
Ave
rage
au
toto
my
sco
re
Post operative day
Autotomy in C3H/HeJ mice
C3H/HeJ high
C3H/HeJ low
C3H/HeJ sham
C3H/HeJ naive
A
B
C
0
2
4
6
8
10
12
0 5 10 15 20
Fin
al a
uto
tom
y sc
ore
Mouse number
Autotomy in C3H and AKR mice on PO day 21
C3H/HeJ high
C3H/J moderate
C3H/HeJ low
AKR/J low
* *****
****
**
** ** **** ** ** ** ** ** **
********
**
**** **
** ** ** ** ** ** **

100
of all mice on PO day 21 were 0; N=5), sham-operated C3H/HeJ and AKR/J mice, and naïve
C3H/HeJ and AKR/J mice (AFSs were 0 for all sham-operated and naïve mice of both strains on
PO day 21; N=6 mice per group). (B) Average autotomy scores per day of MHS-C3H/HeJ mice
(AFSs on PO day 21 ranged from 2-11; N=10) vs. NLS-C3H/HeJ mice (AFSs ranged on PO day
21 from 0-1; N=18), C3H/HeJ sham (AFSs on day 21 PO were 0; N=6), and C3H/HeJ naïve
mice (AFSs of 0 on day 21 PO; N=6). Two-way ANOVA for repeated measures was performed
followed by Tukey’s post hoc test; *P<0.05, **P<0.01, ****P<0.0001 (C) Final autotomy scores
of individual mice on PO day 21.
Figure 17: Autotomy average onset day in C3H/HeJ and AKR/J mice was followed up daily to
PO day 21. (A) Average autotomy onset days of denervated MHS-C3H/HeJ, NLS-C3H/HeJ and
NLS-AKR/J mice, and sham operated and naïve mice of both strains. A one-way ANOVA
followed by Tukey’s post hoc test was performed. MHS-C3H/HeJ mice had a significantly
lower autotomy onset day than the denervated NLS-C3H/HeJ, the C3H/HeJ sham-operated and
naive groups and the denervated, sham and naïve AKR/J mice. (B) The number of mice of these
groups that expressed certain autotomy scores at autotomy onset day.
Figure 18: Score of autotomy at onset day of denervated C3H/HeJ and AKR/J mice. (A)
Average autotomy score at onset day of denervated MHS-C3H/HeJ mice, denervated NLS-
C3H/HeJ and NLS-AKR/J mice, sham-operated and naïve mice of both strains. A one-way
ANOVA followed by Tukey’s post hoc test was performed. MHS-C3H/HeJ mice had
significantly higher autotomy scores at onset than the denervated mice with NLS, sham-operated
0
5
10
15
20
25
C3H/HeJ AKR/J
Au
toto
my
on
set
day
Autotomy onset day in C3H/HeJ and AKR/J mice
denervated-high
denervated-low
sham
naive
A
0
5
10
15
20
25
Nu
mb
er
of
mic
e
Autotomy onset day
Number of mice per Autotomy Onset Day
denervated-high
denervated-low
sham
naive
BP<0.001
P<0.01
P<0.0001
0
0.5
1
1.5
2
2.5
3
3.5
4
C3H/HeJ AKR/J
Au
toto
my
on
set
sco
re
Autotomy onset score in C3H/HeJ and AKR/J mice
denervated-high
denervated-low
sham
naiveP<0.0001
0
5
10
15
20
25
Nu
mb
er
of
mic
e
Autotomy onset score
Number of mice per Autotomy Onset Score
denervated-high
denervated-low
sham
naive
A B

101
and naive groups (P<0.0001 in all 5 comparisons). (B) The number of mice that expressed
autotomy scores 0-7 at the onset day of autotomy.
4.2.4 Csf2rb1 expression levels in C3H/HeJ vs. AKR/J mice
Csf2rb1 expression levels in denervated NLS-C3H/HeJ mice was significantly higher than in
NLS-AKR/J mice (1.37±0.07 vs. 1.05±0.07; P<0.01) (Figure 19). These data indicate that in
these strains Csf2rb1 expression levels were not differentially regulated with high autotomy
behaviour. No significant differences in Csf2rb1 gene expression levels in the spinal cord were
found between intact C3H/HeJ and AKR/J mice. Thus, the constitutive gene expression levels of
Csf2rb1 are comparable in the spinal cords of these strains. This suggests that the CSF2RB1
protein levels present at the time of nerve injury are not relevant for the contrasting levels of
autotomy seen PO on day 21. Furthermore, no significant differences were observed between
the sham-operated mice of the two strains. Csf2rb1 expression levels did not contrast
significantly between MHS- C3H/HeJ mice, NLS-C3H/HeJ and NLS-AKR/J mice (Figure 19).
There was no significant correlation between the autotomy onset day and expression levels of
Csf2rb1 in denervated C3H/HeJ and AKR/J mice (Figure 20A). Only AKR/J mice, which were
all classified as late onset, as none of these mice expressed autotomy up to PO day 21, had a
significantly lower mRNA levels of Csf2rb1 (1.05±0.07) compared to the late-onset C3H/HeJ
mice (P<0.05), and to the early onset C3H/HeJ mice (P<0.02). These data indicate that the
differences in Csf2rb1 expression are unrelated to the levels of autotomy but to inherent strain
differences between C3H/HeJ and AKR/J mice.
Lastly, AKR/J mice that all had an onset score of 0 up to PO day 21 expressed a significantly
lower level of Csf2rb expression (1.05±0.07) compared to the two C3H/HeJ subgroups, (P<0.03
and P<0.04, for the onset score of 0, and onset score ≥1, respectively) (Figure 20B). Csf2rb1
gene expression levels, however, were not significantly different in the two subgroups of
denervated C3H/HeJ mice, regardless of the degree of self-mutilation at onset. This was the
third indication that autotomy variables in the C3H/HeJ and AKR/J strains are not regulated by
Csf2rb1 expression levels, although there are strain-related differences.

102
Figure 19: Csf2rb1 gene expression levels in the spinal cord of C3H/HeJ and AKR/J mice.
Average Csf2rb1 mRNA levels relative to Hprt reference gene (see Appendix IV) are shown for
naïve C3H/HeJ and AKR/J mice (N=6 and N=5, respectively), sham-operated mice of these
strains (N=6 and N=3, respectively), denervated mice that expressed NLS (N=5 and N=5,
respectively), and denervated mice of the C3H/HeJ strain expressing MHS (N=4). These values
indicate that Csf2rb1 expression levels did not correlate significantly with autotomy scores.
Expression of Csf2rb1 was significantly higher in NLS-C3H/HeJ mice compared to NLS-AKR/J
mice (One-way ANOVA followed by LSD post hoc test).
Figure 20: Csf2rb1 gene expression levels in denervated C3H/HeJ and AKR mice sub-grouped
by the autotomy onset day (early onset: 0-7 days PO and late onset: 8-21 days PO, and by its
score (score=0 and scores≥1). (A) Csf2rb1 mRNA levels of AKR/J and C3H/HeJ mice
(calculated relatively to those of Hprt, the reference gene), which expressed autotomy with a late
onset (N=7 and N=5) and C3H/HeJ mice with an early onset (N=6). Thus, Csf2rb1 expression
levels were significantly elevated in C3H/HeJ mice compared to AKR/J mice, regardless of their
onset day. (B) Csf2rb1 mRNA levels (relative to those of the Hprt reference gene) of denervated
0
0.2
0.4
0.6
0.8
1
1.2
1.4
1.6
C3H/HeJ AKR/J
mR
NA
leve
l of
Csf
2rb
rela
tive
to
Hp
rt
Csf2rb1 gene expression in C3H and AKR mice
Naive
Sham
Low Autotomy
High Autotomy
p<0.01
0
0.2
0.4
0.6
0.8
1
1.2
1.4
1.6
Late onset Early onset
mR
NA
leve
l of
Csf
2rb
re
lati
ve t
o H
prt
Csf2rb1 and Autotomy onset day
AKR/J
C3H/HeJ
BA
P<0.05P<0.05P<0.05
P<0.05
0
0.2
0.4
0.6
0.8
1
1.2
1.4
1.6
Onset score 0 Onset score =>1
mR
NA
leve
l of
Csf
2rb
rela
tive
to
Hp
rt
Csf2rb1 and Autotomy onset score
AKR/J
C3H/HeJ

103
AKR/J and C3H/HeJ mice, which did not express autotomy at all up to PO day 21 (N=5 and
N=5, respectively), and in denervated C3H/HeJ mice, which expressed at onset MHS (N=8).
Thus, Csf2rb1 expression levels were higher in denervated C3H/HeJ mice regardless of their
autotomy onset score. One-way ANOVA followed by LSD post hoc test was performed.
4.2.5 CSF2RB1 protein is differentially expressed in spinal cords
of A and B mice
The results we got in A, B, C3H/HeJ and AKR/J mice, denervated, sham-operated and naïve, are
compatible with the following two scenarios that affect our rationale for the following
experiments: (i) Csf2rb1 is a gene whose upregulated expression post-denervation is needed for
producing MHS of autotomy in the spinal cord of some denervated A mice, but not of
denervated C3H/HeJ mice. In her dissertation, Tina Elahipanah from our lab (Elahipanah, 2010)
showed that the drive for autotomy in MHS mice is controlled not only by a Pain1 gene(s) but
also by (an)other gene(s) on mouse chromosome 14 whose identity is unknown. This would
suggest that there are transcription factors that are upstream these genes and whose function is to
activate expression of Csf2rb1 in the spinal cord and/or those other genes, depending on the
environment and strain. (ii) Proactive, genetically controlled prevention of expression of Csf2rb1
in the spinal cord protects some denervated mice from developing pain and expressing autotomy.
The results we got so far indicate that there is a significant correlation between levels of
autotomy and differences in Csf2rb1 levels of expression in the DRGs of intact A vs. B mice,
and changes in the spinal cord post-denervation in some A but not B mice. But mRNA levels
are not final proof that this also manifest in the protein it encodes, one needs to show that it is
indeed differentially expressed in the spinal cord of denervated A and B mice. Moreover, it is
important to find out which cell types express this gene, and where in the spinal cord are they
located. To address these questions, immunohistochemical staining was carried out by way of
labelling CSF2RB1 with antibodies against the receptor. After preliminary experiments we were
successful with antibodies against CSF2RB1. The results of experiments that used this as a
marker are shown below. Transverse sections of perfusion fixed spinal cords of naïve, sham
operated, and denervated A and B mice were processed and compared.

104
As in the gene expression studies, based on their expressed levels of autotomy, denervated A
mice were subdivided into MHS and NLS subgroups (as done in previous chapters of this
dissertation), while denervated B mice were all expressors of NLS. Visibly detectable levels of
the reaction product were located in select parts of the spinal cord: (i) in small glia cells in the
white matter including the dorsal (mainly the medio-dorsal part) and ventral columns, and to a
lesser extent around the spinal cord under the pial surface, (ii) fine reaction product was found
throughout the grey matter, including around blood vessels, and (iii) mainly in cells around the
central canal. Of these locations, the most prominent difference between A and B mice was seen
in the CSF2RB1+ cells located around the central canal. These bipolar cells had a spindle-
shaped, very thin soma, extending a single long and thick process that was strongly labelled with
the reaction product, which could be easily followed for many hundreds of μm until terminating
dorsally in the dorsal septum, ventrally in the ventral septum, and laterally in lamina X of the
spinal cord (Figure 21A-I). To compare the number of such cells in mice of the various tested
groups, we counted the number of such processes extending longer than 20 μm from the outer
edge of the central canal into the dorsal, ventral and lateral directions, per section 50 μm thick
(Figure 23). No differences were found in the total number of processes between naïve A and
sham-operated A mice, and between naïve B and sham-operated B mice (Appendix V). As there
were no significant differences in any of these comparisons the numbers for naïve and sham
operated mice were combined into one control group for each strain. As well, no differences
were observed in the numbers of processes per section in denervated MHS- mice and NLS- A
mice (Appendix V). Therefore, the values for denervated animals were combined into one
denervated group per strain. The numbers of CSF2RB1+ processes extending to the dorsal and
ventral midsagittal septa were not significantly different. In non-denervated naïve and sham
operated animals there were significantly more processes per section extending dorsally and
ventrally in A mice than B mice (dorsally extending processes: 4.74±0.64 vs. 0.75±0.70
(P<0.0001); ventrally extending processes: 4.75±0.63 vs. 0.85±0.79 (P<0.0001); respectively).
The number of such processes increased significantly after denervation in A mice compared to
its control mice (dorsally extending processes: 6.47±0.19 vs. 4.74±0.64 (P<0.018); ventrally
extending processes: 7.12±0.42 vs. 4.75±0.63 (P<0.003). This increase was also observed after
denervation in B mice (dorsally extending processes: 6.33±0.63 vs. 0.75±0.70, P<0.0001;
ventrally extending processes: 6.33±0.38 vs. 0.85±0.79, P<0.0001; respectively). Comparable

105
number of cells extending dorsally and ventrally were observed in A and B mice after
denervation, as is seen in Figures 23A and 23B.
The average numbers of CSF2RB1+ processes per section that extended laterally were
significantly higher in A mice compared to B mice both in naïve, sham operated and after
denervation (control mice: 12.49±2.28 vs. 1.42±0.99 (P<0.0001); denervated mice: 18.89±1.14
vs.7.58±1.33 (P<0.002) respectively; Figure 23C). In both strains, denervated mice showed a
significant increase in the number of lateral extensions compared to their respective controls (A
mice: 18.89±1.14 vs. 12.49±2.28, P<0.008; B mice: 7.58±1.33 vs. 1.42±0.99, P<0.085,
respectively).
The overall number of processes per section extending dorsally, ventrally and laterally was
significantly higher in A mice compared to B mice, both prior to, and after denervation: control
mice: 20.27±3.09 vs. 2.71±2.13, respectively (P<0.0001); denervated mice: 30.33±1.31 vs.
18.13±1.43, respectively (P<0.0001), Figure 23D). In summary, CSF2RB1-labelled processes in
the spinal cord of control mice were significantly more abundant in A mice compared to B mice,
but increased in numbers after denervation.
Figure 24 shows the number per section of CSF2RB1-labelled, laterally extending processes of
individual control (naïve and sham) and denervated A and B mice. It can be seen that all B mice
and a small number of A mice had 10 lateral processes per section or fewer. Most A mice had
10 or more of these processes per section that extend laterally deeper into the grey matter of the
spinal cord.

106
Figure 21: Immunohistochemical analysis of CSF2RB1-expressing cell types in the spinal cord.
CSF2RB1 is present in white matter (green arrows, A), dorsal horn (white arrows, A, F, H) and
dorsal column (yellow arrows, A, F, G, H), around some blood vessels (red arrows, A, F), and
abundantly surrounding the central canal with strongly labelled ependymal cells/radial
glia/tanycyte cells (A-E) in MHS-A mice (A, B, D-H) and NLS-B mouse (C). Elongated bipolar
CSF2RB1+ cells ≥20 μm have their cell body lining the central canal extending a single process
in a centrifugal manner dorsally or ventrally into the dorsal and ventral midsagittal septa and
laterally into Lamina X (A). Considerably longer and thicker CSF2RB1+ processes are present
in A mice (B) compared to B mice (C). In these ependymal cells/radial glia/tanycytes CSF2RB1
did not co-localize with NeuN that labels neurons (B), GFAP that labels astrocytes (C, blue),
MAP-2 that also labels neurons (D), NG2 that labels oligodendrocyte precursor glia cells (E,
blue). In glia present in the dorsal column CSF2RB1 did not co-localize with NeuN (F, G, blue)
or GFAP (H). (I) Schematic diagram of spinal cord sectioning, showing the staining of the
central canal (CC) region and the cell extensions into dorsal and ventral columns; DH=Dorsal
horn; VH=Ventral Horn; scale bar - 160 µm (A-B), 39 µm (C-H); magnification - 5x (A), 20x
(B-H).
A
B
C F
G
HE
D
CSF2RB1NeuN
IB4
CSF2RB1NeuN
IB4
CSF2RB1GFAP
IB4
CSF2RB1MAP-2
IB4
CSF2RB1NG2
CSF2RB1NeuN
IB4
CSF2RB1NeuN
IB4
CSF2RB1GFAP
Greyma er
Whitema er
Whitema er
CentralcanalGreyma er
Soma
Process
Process
Rostral Caudal
A B
C
Dorsalcolumn
DH
L
CC
VH
I

107
Figure 22: CSF2RB1 expression levels in the spinal dorsal horn. (A) Cross section of a high-
autotomy A mouse expressing CSF2RB1 (red) in white and grey matter, and neuronal nuclei
(NeuN, green) in the white matter of the spinal cord. Magnification, 5x; scale bar, 310 μm. (B)
Higher magnification (20x) of the dorsal horn showing expression of CSF2RB1 in laminae I and
II, some of which co-localized with neuronal nuclei, marked by NeuN (C & F). (D) Spinal
dorsal horn labelling CSF2RB1 (red) and neuronal nuclei (blue) in a denervated B mouse
expressing low autotomy. Some of the CSF2RB1 profiles co-localized with neuronal nuclei
(purple). (F) A replication of the Figure in B, showing only CSF2RB1 expression in white, with
dense dots appearing in laminae I and II. Scale bar, 39 μm
A B C
D E F
CSF2RB1NeuN
CSF2RB1NeuNIB4
CSF2RB1
CSF2RB1NeuN
MERGECSF2RB1
NeuN
CSF2RB1NeuN
MERGE

108
Figure 23: The number of long CSF2RB1+ processes in the spinal cord of A and B mice. Cells
that extend labelled processes to a distance ≥20 μm from the outer edge of the central canal into
dorsal, ventral and lateral aspects of the spinal cord were counted in A and B mice, before and
after denervation. Average process numbers is presented separately for dorsal (A), ventral (B),
lateral (C), and the sum of all extensions (D; N≥4 mice per group, ≥6 sections per mouse).
Control designates pooled data of naïve and sham operated mice that were not found to be
significantly different from each other. Neurectomized= all denervated mice, MHS and NLS in
A strain, NLS in B strain. This data was pooled per strain regardless of the autotomy levels
expressed by these groups since the number of processes did not correlate autotomy levels. One-
way ANOVA was carried out followed by LSD post hoc test.
C
0
5
10
15
20
25
Control Neurectomized
Nu
mb
er
of
cells
≥2
0 μ
m
Lateral extentions
A mice
B mice
p<0.001p<0.01
p<0.01
0
1
2
3
4
5
6
7
8
Control Neurectomized
Nu
mb
er
of
cells
≥2
0 μ
m
Dorsal extensions
A mice
B mice
Ap<0.001 p<0.001
p<0.05
0
1
2
3
4
5
6
7
8
Control Neurectomized
Nu
mb
er
of
cells
≥2
0 μ
m
Ventral extensions
A mice
B mice
B
0
5
10
15
20
25
30
35
Control Neurectomized
Nu
mb
er
of
cells
≥2
0 μ
m
All extentions
A mice
B mice
Dp<0.05
p<0.001p<0.01
p<0.01
p<0.001 p<0.001p<0.05

109
Figure 24: The number of long CSF2RB1+ processes extending laterally in A and B mice. (A)
Average number of CSF2RB1+ processes extending ≥20 μm from the outer edge of the central
canal into dorsal, ventral and lateral aspects of the spinal cord, in naïve and sham-operated
(control) A and B mice. (B) Average number of CSF2RB1+ lateral processes in denervated A
and B mice. Average numbers are presented as lateral extensions (≥ 6 sections per mouse).
0
5
10
15
20
25
30
0 2 4 6 8 10
Nu
mb
er
of
late
ral e
xte
nti
on
s ≥2
0 μ
m
Mouse number
Denervated mice distribution
A-high
A-low
B-low
0
5
10
15
20
25
30
0 2 4 6 8 10 12 14
Nu
mb
er
of
late
ral e
xte
nsi
on
s ≥2
0 μ
m
Mouse number
Control mice distribution
A mice
B mice
A
B

110
4.2.6 Evidence that CSF2RB1 is localized in ependymal
cells/radial glia/tanycytes of the central canal
Mice were subjected to hindpaw denervation, sham operation or were left intact, and their
perfusion-fixed spinal cords were removed for immunohistological staining with CSF2RB1 and
various other antibodies that are differentially expressed in particular cell types within the spinal
cord. This was done to determine what type(s) of cells express CSF2RB1 in the spinal cord.
The results of these immunohistological experiments are shown in Figures 22A-G. They
indicate that CSF2RB1+ cells did not co-localize with OX-42 (not shown) and GFAP, markers
for microglia and astrocytes, respectively (Figure 21C, H). IL-3Rβ labelled in red co-localized
with NeuN in some of the neuronal nuclei that were labelled by green or blue fluorescence,
showing that green and red merged into yellow in the upper dorsal horn layers (Figure 22B-C, F)
and red and blue merged into purple (Figure 22D). However, this observation may be an artefact
due to the fact that a z-stack image that is shown in Figure 22F collectively gathers tens of
images, some of which include neuronal nuclei and others that do not. CSF2RB1 did not co-
express with dendrites and neurites of neurons that were labelled blue with the MAP-2 antibody
(Figure 21D). CSF2RB1 also did not co-express with NG2 that labels a precursor cell of
oligodendroglia (Figure 21E). However, CSF2RB1 co-localized with Vimentin, a marker of
ependymal cells/radial glia/tanycytes. Figure 25 shows that the same ependymal cells/radial
glia/tanycytes around the central canal in both A and B mice were labelled by CSF2RB1 and
Vimentin. CSF2RB1 co-localized with Vimentin significantly more in A mice in this region,
compared to B mice, as shown by the scatter plots in Figures 25D, H, and by measure of the
average Pearson’s Correlation Coefficients ±SEM (0.69±0.06 vs. 0.14±0.05, P<0.0002,
respectively; Figure 25I). In A and B mice, denervated, sham-operated and naïve mice all
showed co-localizations of CSF2RB1 with Vimentin. Figure 25J shows the average Pearson’s
Correlation Coefficients for the individual mice, demonstrating higher correlations in A mice
compared to B mice. These results indicate that A mice express significantly more CSF2RB1-
expressing ependymal cells/radial glia/tanycytes compared to B mice.
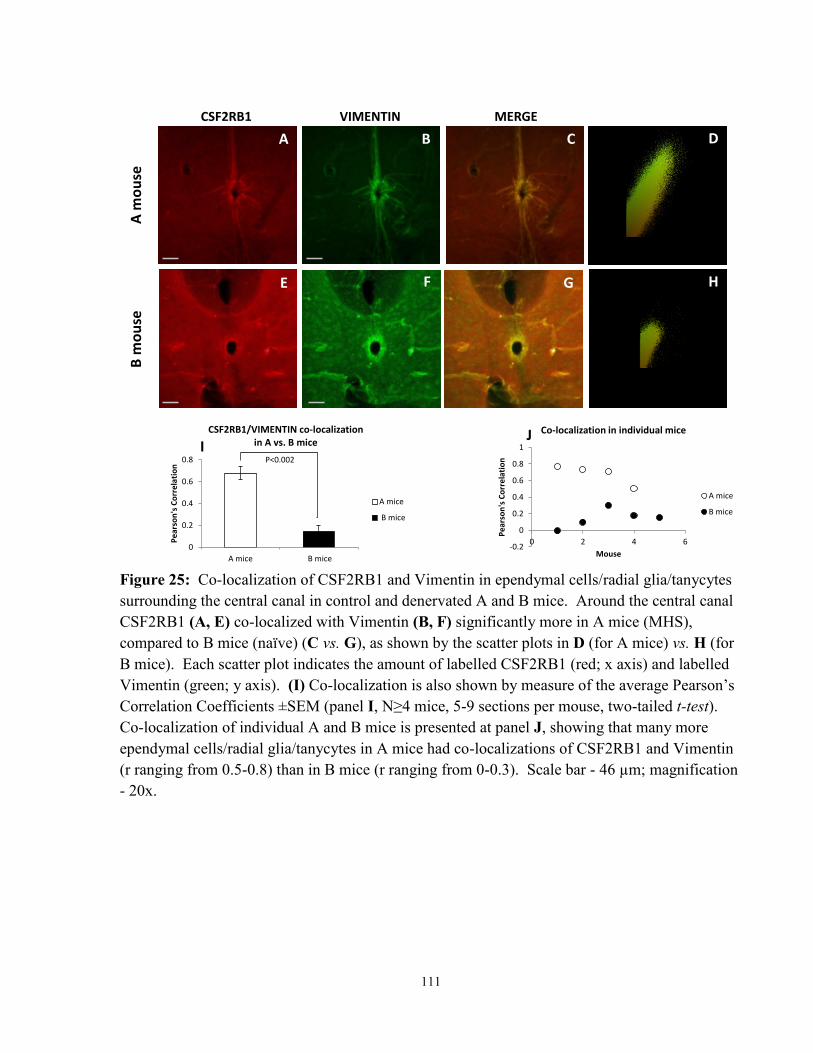
111
Figure 25: Co-localization of CSF2RB1 and Vimentin in ependymal cells/radial glia/tanycytes
surrounding the central canal in control and denervated A and B mice. Around the central canal
CSF2RB1 (A, E) co-localized with Vimentin (B, F) significantly more in A mice (MHS),
compared to B mice (naïve) (C vs. G), as shown by the scatter plots in D (for A mice) vs. H (for
B mice). Each scatter plot indicates the amount of labelled CSF2RB1 (red; x axis) and labelled
Vimentin (green; y axis). (I) Co-localization is also shown by measure of the average Pearson’s
Correlation Coefficients ±SEM (panel I, N≥4 mice, 5-9 sections per mouse, two-tailed t-test).
Co-localization of individual A and B mice is presented at panel J, showing that many more
ependymal cells/radial glia/tanycytes in A mice had co-localizations of CSF2RB1 and Vimentin
(r ranging from 0.5-0.8) than in B mice (r ranging from 0-0.3). Scale bar - 46 µm; magnification
- 20x.
-0.2
0
0.2
0.4
0.6
0.8
1
0 2 4 6
Pe
arso
n's
Co
rre
lati
on
Mouse
Co-localization in individual mice
A mice
B mice
CSF2RB1 VIMENTIN MERGE
A m
ou
seB
mo
use
0
0.2
0.4
0.6
0.8
A mice B mice
Pe
arso
n's
Co
rre
lati
on
CSF2RB1/VIMENTIN co-localization in A vs. B mice
A mice
B mice
P<0.002I
G
A
H
DCB
FE
J

112
4.2.7 CSF2RB1 in the brain is associated with high autotomy
levels in denervated A mice
In Chapter 3 (Section 3.2.7) of this thesis report we showed that Csf2rb2 is expressed in
numerous regions of the mouse spinal cord and brain, demonstrated by in situ hybridization in
the Allen Brain Atlas. This analysis suggested that Csf2rb1, the gene we studied in this
dissertation, might also be expressed in brain regions known to process pain input, and whether
its expression in those structures correlates with autotomy behaviour in denervated A and B
mice. To this end, brain sections (50μm thick) of perfusion-fixed naïve, sham and denervated
MHS-A and NLS-A mice, and naïve, sham and denervated NLS-B mice, were immunolabelled
with IL-3Rβ (i.e., CSF2RB1). As with the Csf2rb2 gene, CSF2RB1+ cells were abundantly seen
in a select number of regions in the brain, very similar to those harbouring the Csf2rb2 gene.
CSF2RB1 was located in small cells in the dentate gyrus granule layer and in the polymorph
layer (Figure 26A-F). Labelled cells were also found in the hypothalamic arcuate nuclei, lining
the 4th ventricle (Figure 28A-D), and the pial surface of the brain, areas exposed to cerebrospinal
fluid (Figure 28E). The most profound difference between A vs. B mice was present in the
dentate gyrus and the arcuate nucleus. In the granule layer, there were many more CSF2RB1+
cells with processes crossing in a perpendicular orientation through the layer in MHS-A mice,
compared to denervated NLS-A and sham operated A mice or naïve, sham and denervated NLS-
B mice (Figure 26).
Naïve and sham-operated mice did not differ significantly in the number of processes crossing
the dentate gyrus granule cell layer (Appendix VI). Therefore, data from naïve and sham-
operated mice were pooled separately for A and B strains into strain-specific control subgroups
as shown in the summarizing histograms in Figure 26E.
The histograms also show that MHS-A mice had 3-folds more CSF2RB1+ cells with processes
traversing the granule layer, per unit length of 200 μm, compared to denervated NLS-A, NLS-B,
and control A and B mice [MHS-A: 6.56±3.79 vs. NLS- A: 4.35±2.30 (P<0.03); NLS-B:
2.35±0.69 (P<0.008); control A: 5.10±2.71 (P<0.01); control B: 6.31±2.07 (P<0.03)]. A
positive correlation between CSF2RB1+ processes in the granule layer and autotomy behaviour
on day 14 PO of A and B mice is shown in Figure 27 (R=0.82, P<0.0003).

113
The polymorph layer of the dentate gyrus in denervated A mice contained significantly more
CSF2RB1+ somata than control A mice and the same was observed for B mice (Figure 26F).
But in denervated A mice there was no significant difference between MHS and NLS mice in the
number of CSF2RB1 labelled cells per ROI of 2500 μm2 for a 50 μm thick section, (13.82±2.21
vs. 13.93±0.43, respectively, P<0.96). Thus, these cells do not seem to a play a role in
correlating autotomy levels by gene-by-environment interactions that protects some denervated
A mice from expressing autotomy.
Control A and B mice comprised pooled data of CSF2RB1+ cells in the polymorph layer of
naïve and sham-operated animals, since no significant differences were observed between these
two groups in A or B mice (Appendix VII). No significant differences were found between the
number of such cells in control A and B mice. However, denervation caused a significant
increase in the number of CSF2RB1 expressing cells in the polymorph layer of the dentae gyrus
compared to control A and B mice: 13.88±1.01 and 5.89±1.86 cells per 2500 μm2 of a 50 μm
think section, respectively, (P<0.01), and 16.47±2.54 and 8.10±0.98 cells per 2500 μm2 of a 50
μm think section, respectively (P<0.01). But no difference was found between denervated A and
B mice. Thus, this finding is most likely associated with changes due to the denervation, rather
than changes of strain specificity between A and B mice.
Figure 28 shows the co-localization of very few CSF2RB1+ cells in the polymorph cell layer
with Vimentin, the same marker that labelled ependymal cells/radial glia/tanycytes in the central
canal. CSF2RB1 did not co-localize neurons, labelled by NeuN, or with GFAP or OX-42 that
label astroglia and microglia, respectively.

114
Figure 26: Photomicrographs of hippocampal dentate gyrus sections labelled
immunohistologically for CSF2RB1 (red), expressed in granule and polymorph layers. These
cells and processes were present in sham-operated A and B mice (A, C), but were significantly
increased in denervated mice of both strains (B, D). (E) The average number of processes
traversing through the granule layer per unit length of 200 μm was significantly higher in MHS-
A mice, (B), compared to control A mice, and denervated NLS- A mice (N≥3 mice per group, ≥
5 sections per mouse). (F) CSF2RB1+ cells in the polymorph layer of the dentate gyrus of A
and B mice. The average number of cells per region of interest of 2500 μm2 per section is shown
for control and denervated A and B mice (N≥3 mice per group, ≥ 5 sections per mouse). Control
(i.e., naïve and sham-operated mice); Denervated (data of MHS and NLS was combined for the
A strain, and of mice with NLS for the B strain. One-way ANOVA followed by the LSD post
hoc test was performed. Scale bar- 46 µm, magnification - 20x.
A mouse B mouse E
0
5
10
15
20
25
Control Low Autotomy High Autotomy
Nu
mb
er o
f p
roce
ss c
ross
ing
/ 2
00
μm
CSF2RB1+ processes in dentate gyrus
A mice
B mice
P<0.01
P<0.01
P<0.05
F
0
2
4
6
8
10
12
14
16
18
20
Control AxotomizedN
um
ber
of
CSF
2R
B+
spo
ts /
50
μm
²
CSF2RB1+ spots in dentate gyrus
A mice
B mice
P<0.01
P<0.01
Denervated

115
Figure 27: Correlation of the number of CSF2RB1+ long processes per 200 μm of the dentate
gyrus with autotomy behaviour. The number of CSF2RB1+ processes traversing the granule
layer of the dentate gyrus per 200 μm/section is shown as a function of the Final Autotomy
Scores (FASs) on PO day 14 of denervated A and B mice. The number of processes ranged from
4-10 per 200 μm/50 μm thick section per mouse, red circles designate mice expressing MHS in
A mice; blue circles denote A-NLS mice and black diamonds mark B-NLS mice.
0
5
10
15
20
25
30
0 2 4 6 8 10 12Nu
mb
er
of
pro
cess
es
cro
ssin
g /
20
0 μ
m
Final autotomy score
CSF2RB1+ processes in dentate gyrus are correlated with high autotomy
R = 0.82P = 0.0003

116
Figure 28: CSF2RB1 expression in the dentate gyrus. CSF2RB1 (red) is expressed in pyramidal
and granule layers of the dentate gyrus. It did not co-localize with (A) NeuN (neurons; green),
(B) OX42 (microglia; green), or (C) GFAP (astrocytes; green) expressed in the same areas of A
and B mice. CSF2RB1 co-localized with very few Vimentin+ cells (indicated by white arrows).
(D) Vimentin (shown in green) labels ependymal cells/radial glia/tanycytes but not astroglia or
microglia. Notable CSF2RB1 somata are observed in both A denervated mice with autotomy
(A-B), and B denervated mice with no autotomy (C-D). Magnification - 20x; scale bar - 46 μm.
CSF2RB1NeuN
A B C
D
CSF2RB1Ox42
CSF2RB1GFAP
CSF2RB1Vimentin

117
4.2.8 CSF2RB1 in ependymal cells/ radial glia/tanycytes in other
brain regions
CSF2RB1 was present in additional regions in the brain, specifically around the 3rd ventricle
(V3 in Figure 29), in the peri-ventricular hypothalamic nucleus (PVI in Figure 29), in the
hypothalamic arcuate nucleus (ARH in Figure 29), in the pial surface of the brain in some
regions (e.g., Figure 29H1-3). Figure 29 shows considerable differences in CSF2RB1-
expressing cells in the hypothalamic PVI nucleus of A mice compared to B mice. These cells
have a soma located near the ventricle, sending a short process to the lining of the ventricle and a
very long process extending perpendicularly to the surface of the ventricle, deep into the peri-
ventricular hypothalamic zone. These processes are robustly visible in the A mouse, but are
almost devoid in the B mouse (Figure 29C, D). CSF2RB1 was not expressed by neurons, as
shown by the green NeuN fluorescence in Figure 29A, B, which did not co-localize with the red
fluorescence of the CSF2RB1+ cells. CSF2RB1+ cells also did not co-localize with GFAP or
OX-42 that label astroglia and microglia, respectively (data not shown). However, CSF2RB1+
cells co-localized with Vimentin, as shown in Figure 29H at the pial surface in the ventral aspect
of the brain, and in cells lining the ventricles (Figure 29E1-3).
Figure 29: CSF2RB1 immunoreactive cells in select brain regions. CSF2RB1+ cells were
present in the peri-ventricular hypothalamic nucleus surrounding the 3rd ventricle of sham A
mice, extending very long processes into the hypothalamus (A-C), whereas in sham B mice (D-
E) these CSF2RB1+ cells did not extend such processes into the hypothalamus. Figures A-C
show that CSF2RB1+ cells (red fluorescence) did not co-localize with NeuN (green
fluorescence) in the PVi (B), but did co-localize with Vimentin (E1-3). (F) Nissl stained brain
section of an intact B mouse taken from the Allen Brain Atlas (http://www.brain-map.org)
showing neuronal clusters in the same rostrocaudal location of the sections shown in (A-D). (G)
An anatomical reference brain atlas annotating the brain nuclei located in the same sections as in
A-F. (H1-3) Co-localization of CSF2RB1 with Vimentin is shown at the pial surface in the
ventral aspect of the brain in a B sham mouse. PVi = peri-ventricular nucleus pars internal; V3 =
third ventricle; ARH = arcuate nucleus of the hypothalamus. Scale bar - 160 μm (A), 46 μm (B-
D), 39 μm (E1-E3, H1-H3); Magnification - 5x (A), 20x, (B-H).
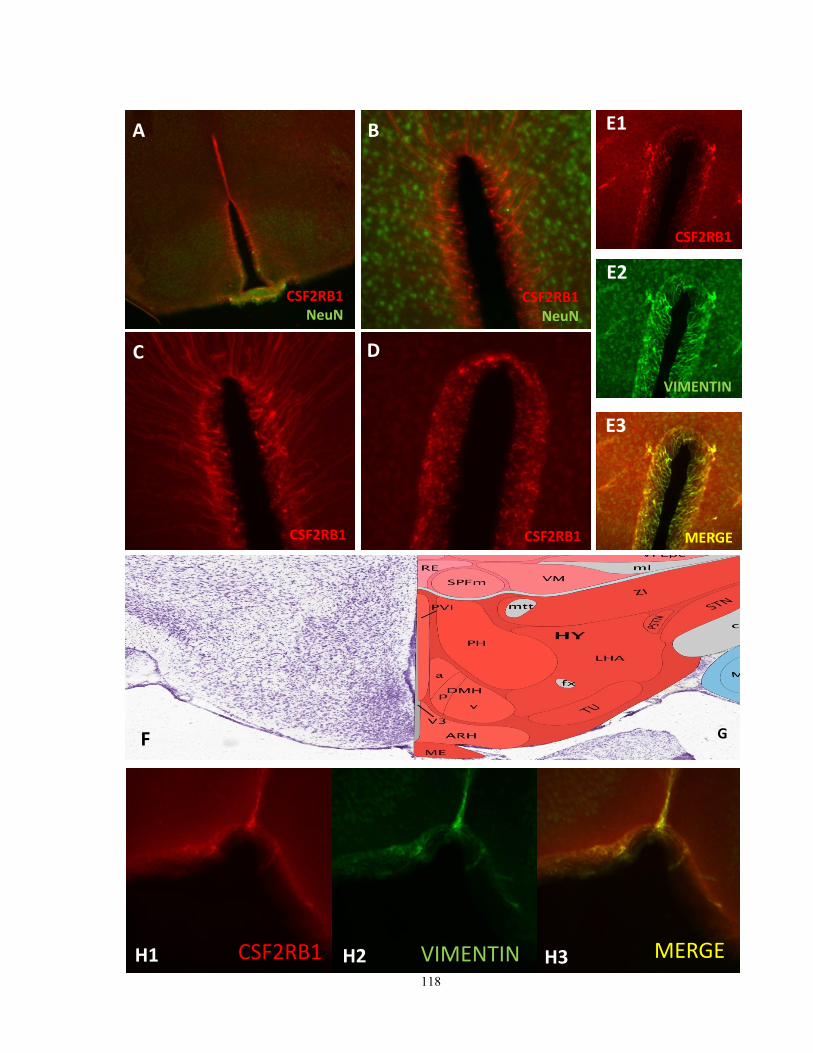
118
B
C D
A
CSF2RB1
VIMENTIN
MERGE
E1
E3
E2
F G
CSF2RB1NeuN
CSF2RB1NeuN
CSF2RB1CSF2RB1
CSF2RB1 VIMENTIN MERGEH1 H3 H2

119
4.3 Discussion
The present study validated the results of the expression profiling data we presented in Chapter
3, where spinal cord expression levels of Csf2rb1, a gene located in Pain1, was shown to be
significantly associated with autotomy behaviour following peripheral nerve injury. Here, using
RT-PCR and immunohistochemical analyses, we validated, in part, these findings by showing
that the post-operative changes in mRNA levels indeed translate into changes in expressed
protein product of Csf2rb1 in the spinal cord and brain of nerve injured mice, and that these
expressed levels correspond to the autotomy behaviour. Thus, the major findings of the present
results garnered in Chapter 4 can be summarized as follows: (i) Csf2rb1mRNA expression levels
were up-regulated in MHS-A mice, but not in NLS-A or NLS-B mice, and this up-regulation
significantly correlated the autotomy scores, (ii) In MHS-C3H/HeJ mice vs. NLS-C3H/He/J and
NLS-AKR/J mice, we were unable to find differences in the expressed levels of Csf2rb1 mRNA
levels, (iii) CSF2RB1 was demonstrated in ependymal cells/radial glia/tanycytes of lamina X of
the spinal central canal, and (iv) CSF2RB1 was also expressed in select regions of the brain,
including the hypothalamus, hippocampus, peri-ventricular nuclei and pia, correlating
significantly the autotomy behaviour with ependymal cells/radial glia/tanycytes cell processes in
the dentate gyrus. The following sections discuss these results in detail.
4.3.1 Csf2rb1 is correlated with pain levels in denervated A mice
Gene expression assays for Csf2rb1 in A vs. B mice validated the findings in Chapter 3 on the
expression profiling study, whereby Csf2rb1 was up-regulated in the ipsilateral spinal cord of
denervated MHS-A mice. Data we describe here indicate that Csf2rb1 mRNA levels
significantly correlated with the autotomy scores in A mice. As well, denervated A mice that
scored autotomy levels of 2 or higher at onset had significantly higher number of Csf2rb1
transcripts compared to denervated A mice that did not express autotomy at all. However, within
the MHS-A mice, no significant difference in Csf2rb1 mRNA levels was observed in mice that
developed autotomy early (on day 1-7 PO) vs. mice that developed autotomy later (on day 8-14
PO), indicating that Csf2rb1 is associated with pain maintenance in these animals, represented by
their final scores on day 14 PO rather than with pain initiation, represented by their autotomy
scores at onset of the behaviour.

120
In addition to the contrast in Csf2rb1 gene expression levels in A vs. B mice, mRNA levels of
this gene also contrasted within the A strain between MHS and NLS mice, indicating that
regulation of this gene is also affected by the environment in a GXE interaction. However, this
could not be demonstrated for denervated C3H/HeJ vs. AKR/J mice, that while contrasted in
their autotomy behaviour, ipsilateral spinal cord Csf2rb1 gene expression levels did not differ
significantly, indicating that Csf2rb1 does not play the same role in autotomy between these two
strains as it does in A and B mice. It may be that in these strains Csf2rb2, rather than Csf2rb1,
differentially regulates autotomy behaviour. More research is needed to answer this question. In
conclusion to the above results, it seems that Csf2rb1 up-regulation is mechanistically involved
in producing the drive for autotomy in some denervated A mice. Alternatively, it is possible that
the genome interacts with the environment to protect some denervated A mice, and all
denervated B mice from autotomy by preventing up-regulation of Csf2rb1 in the spinal cord.
4.3.2 CSF2RB1 is expressed in ependymal cells/radial
glia/tanycytes of the spinal central canal
We have localized CSF2RB1 to ependymal cells/radial glia/tanycytes of the spinal central canal,
since it was co-expressed with Vimentin, but not with neuronal or other glial markers.
Moreover, we showed that the CSF2RB1 positive cells are characterized by a very typical
morphology of ependymal cells/radial glia/tanycytes of the spinal cord, as they extend long
processes deep into the spinal cord grey matter and to the midsagittal septa of the white matter
dorsally and ventrally. Since we showed that there was a significantly higher number of such
processes in naïve A mice compared to naïve B mice, could suggest that CSF2RB1+ ependymal
cells/radial glia/tanycytes of the spinal cord participate in the spinal response to injury discharge
at the time of nerve injury. As reviewed in Chapter 1, injury discharge is one of the main
triggers that initiate the development of neuropathic pain after nerve injury. However, Csf2rb1
gene expression data contradict its possible role in initiating neuropathic pain, as discussed above
(Section 4.3.1), since no differences in Csf2rb1 mRNA levels were detected between naïve A vs.
B mice. We propose that the morphology of these CSF2RB1+ ependymal cells/radial
glia/tanycytes in the central canal region may be important in mechanisms of initiating pain at
the time of nerve injury, and that the number of CSF2RB1 receptors that these cells express may
be important in pain maintenance mechanisms. The morphology of these cells characterized by

121
long processes that are expressed in A mice and are absent in B mice may be important perhaps
for interaction with other cell types, such as neurons or glia. In a similar way that glial cells
cross talk with neurons in the dorsal horn and activate them to induce hyperexcitablity,
CSF2RB1+ ependymal cells/radial glia/tanycytes may cross talk with other cell types and
contribute to the central sensitization in the spinal cord. One way could be by releasing
inflammatory mediators that can respond to neurons thereby exciting them. Another way is by
having the same inflammatory mediators activate microglia and astrocytes. We also suggest that
in addition to the potential impact of physical appearance of CSF2RB1+ ependymal cells/radial
glia/tanycytes may have on pain mechanisms, the number of transcripts that encode the CSF2
receptors on these cells may be significant in pain maintenance, since Csf2rb1 mRNA levels
were associated with autotomy behaviour in A mice.
A significant increase of CSF2RB1+ ependymal cells/radial glia/tanycytes of the spinal central
canal was also observed after the denervation in B mice. The increase in the number of
CSF2RB1+ processes both in A and B strains may suggest that these cells proliferate in response
to nerve injury and not necessarily related to pain per se. Indeed, studies indicate that ependymal
cell proliferation increases dramatically following spinal cord injury, and is necessary for the
production of neurons, oligodendrocytes, and more abundantly astorcytes that migrate to the site
of injury where they serve critical role in glial scar formation (Meletis et al., 2008). But to the
best of our knowledge we are the first to show that these cells respond to peripheral nerve injury.
In this respect, ependymal cells/radial glia/tanycytes in the central canal are known to serve as
neural stem cells, and are very important following nerve injury (Guo et al., 2011; Mothe and
Tator, 2005). This phenomenon is well known in spinal cord and trigeminal microglia and
astrocytes, which change their appearance from the normal state, proliferate and become
‘activated’ in response to nerve injury, particularly within areas of pain perception, such as the
spinal and trigeminal dorsal horn. These microglia and astrocytes communicate with nociceptive
neurons through inflammatory agents and cytokines released by inflammatory cells, which
promote neuronal excitation and disinhibition processes associated with chronic pain (Jo et al.,
2009; Kim et al., 2009a; Liu et al., 2012b; Matsui et al., 2010; Wen et al., 2011). Likewise, it
may be that ependymal cells/radial glia/tanycytes of the spinal central canal act in a similar way
to astrocytes and microglia following nerve injury, in that they may release inflammatory
mediators (either GM-CSF, IL-3, IL-5, or others, which may promote the release of the former

122
agents from other cell types) to act on their receptor, CSF2RB1. It is important to note that
because CSF2RB1+ cells did not co-localize with microglia and astrocytes or with neurons in the
central canal region, they may be a new type of cell responding to nerve injury in a function that
is currently unknown. Given that we detected CSF2RB1+ ependymal cells/radial glia/tanycyte
increase after denervation in both A and B mice, we propose that the number of CSF2RB1+
processes and the extent in which they invade deep into the spinal cord significantly more in A
than B mice, could be major determinants that affect autotomy behaviour.
Future research is needed to test whether differences exist in the number of lateral processes
between the ipsi- and the contra-lateral sides of the spinal cord following unilateral nerve injury,
especially in denervated A mice. Such a difference was not obvious to the eye of the investigator
just by observing the two sides of the dorsal horn, as is robustly ipsilateral for other glial cells
such as microglia and astrocytes. We already know that with the proliferation and activation of
microglia and astrocytes following nerve injury, the increase in the number of these cells at the
side of the injury are associated with pain mechanisms (Calvo and Bennett, 2012; Tsuda et al.,
2013). Emirandetti et al. have shown that A mice produce robustly more astrocytes compared to
B mice one week following sciatic nerve transection, especially around axotomized motoneurons
(Emirandetti et al., 2006). The study also showed that significant differences existed between
ipsi- and contra-lateral sides within the same animal. Although motoneurons are located in the
ventral horn where pain inputs are not processed, the increased production of astrocytes in the
ipsilateral spinal cord may contribute to overall changes in the dorsal horn associated with pain
perception. Similarly, the present study showed an increase in the number of ependymal
cells/radial glia/tanycytes in spinal cord of A mice, which may also drive them to pain
mechanisms involving these cells. The significant fold change in CSF2RB1+ ependymal
cells/radial glia/tanycytes number that we detected around the central canal in B mice after
denervation may not be sufficient for activating pain mechanisms involving these cells, since
these mice do not develop autotomy. Further studies are needed to confer this possibility.
It is noteworthy that we also located CSF2RB1+ cells in the dorsal columns, mostly near the
midline and a few in white matter surrounding the grey matter of the spinal cord. These cells did
not react with Vimentin, suggesting that they may be another subtype of cell, other than
ependymal cells/radial glia/tanycytes. These non-Vimentin, CSF2RB1+ cells, in white matter

123
also did not co-localize with NeuN, OX-42, and GFAP, suggesting that they are not neurons (not
expected in white matter), microglia, or astrocytes. It may be that these cells are another type of
specialized glia that is reactive with Nestin, that like Vimentin is a marker for neural stem cells
(Busch et al., 2010; Mothe and Tator, 2005; White et al., 2010).
4.3.3 CSF2RB1 cells in the hippocampal dentate gyrus
Csf2rb2 expression, documented by the ABA for naïve B mice, was found in the hippocampus
and other brain structures that process pain inputs. This has led us to look closer at CSF2RB1
protein expression in these regions, especially in the hippocampus. Indeed, we found CSF2RB1
expression in almost identical areas of the brain, including the peri-ventricular region of the
hypothalamus, the pial surface, and the hippocampal dentate gyrus, where Csf2rb2 expression
was found. But while the cells expressing the latter protein were neurons, the vast majority of
the expression of CSF2RB1 in the brain was not in neurons, and also not in microglia or
astroglia. It is interesting that these two genes, juxtaposing on Pain1, comprising what may very
likely be the result of gene duplication, are present in the same structures in the central nervous
system, but on different cell types: neurons (expressing CSF2RB2 and known to respond to
peripheral nerve injury and be a major part of the chronic pain pathway) and ependymal
cells/radial glia/tanycytes (expressing CSF2RB1, shown in this dissertation to take part in
chronic pain pathways), suggesting the possibility that as they both respond to the same 3 ligands
(GM-CSF, IL-3 and IL-5), they may be part of the same mechanism. It is possible that they are
recruited to produce chronic pain at two different time periods: neurons may respond earlier, at
the triggering phase of pain chronicity, while ependymal cells/radial glia/tanycytes may respond
later, taking a role during the chronic pain maintenance phase. Like the cells expressing
CSF2RB1 in the spinal cord, those in the brain were characterized by a bipolar thin soma
extending a single long process perpendicularly through the granule layer of the dentate gyrus.
The number of such cellular processes crossing through that layer correlated with high autotomy
scores, and appeared in much greater numbers in these animals compared to control and
denervated A and B mice that did not express autotomy. The polymorph and granule cell layers
in control A and B mice were dotted with many CSF2RB1+ somata, proliferating in numbers
both in A and B mice post-injury, regardless of autotomy. The mere fact that a peripheral nerve
injury can trigger proliferation of certain glia cells in the brain (i.e., the hippocampus) is

124
fascinating. More research is needed to unravel the importance of this mechanism, the signals
triggering it, and the relevance to pain.
Evidence for pain processing in the hippocampus is discussed in detail in Chapter 6.
4.3.4 CSF2RB1 cells in the hypothalamic peri-ventricular and
arcuate nuclei
In the grey matter near the 3rd ventricle of the brain we saw some remarkable differences in the
morphology of CSF2RB1 labelled cells between sham operated mice of different strains.
CSF2RB1+ cells in A mice were characterized by long processes extending perpendicularly to
the granule layer, traversing throughout that layer, whereas the cells in B mice lacked those
processes and the reaction product was limited to the soma of cells expressing it. As in the
central canal of the spinal cord, these hypothalamic CSF2RB1+ cells co-reacted with Vimentin.
Like the dentate gyrus, the peri-ventricular zone harbours many neural stem cells that respond to
brain injury by neoneurogenesis, including ependymal cells. Ependymal cells/radial
glia/tanycytes typically form a single layer of ciliated neuroepithelial cells that line the lumen of
the ventricles, aqueducts and spinal central canal. Our results show clearly that, as in the spinal
central canal, the hypothalamic nuclei expressing CSF2RB1+ cells comprise a much thicker
layer in both A and B mice, with contrasting morphologies between the strains. In response to
nerve injury these cells proliferate, increasing in numbers 2.5 times. This fits the process that
characterizes astroglia and microglia after peripheral nerve injury (Beggs and Salter, 2007;
Echeverry et al., 2008). Whether these morphological differences between A and B mice have a
functional role associated with their autotomy levels, is not known as of yet. It has been shown
that ependymal cells/radial glia/tanycytes lining the lateral ventricles are quiescent under normal
conditions and serve as a reservoir that is recruited by injury (Carlén et al., 2009). Following
stroke, these cells are activated to produce neuroblasts and glial cells (Carlén et al., 2009). We
propose that these cells may have a similar role following peripheral nerve injury in the
autotomy model, but we have no evidence to support this hypothesis. It is also not clear, why
neoneurogenesis and proliferation of glia cells should be instrumental in producing chronic pain.
We could not co-localize CSF2RB1 positive cells in this region with GFAP expressing

125
astrocytes nor to OX-42 expressing microglia, yet other types of glial cells may emerge from
ependymal lineage in this region.
4.3.5 Autotomy behaviour in denervated C3H/HeJ mice
We aimed to extend our findings of Csf2rb1 gene expression levels correlating with MHS in A
mice to another autotomy susceptible strain, C3H/HeJ mice, which generate MHS following the
same hindpaw denervation. The expression of Csf2rb1 in denervated vs. sham-operated and
naïve C3H/HeJ mice did not correlate with autotomy behaviour. Mice of this strain often
showed variable levels of autotomy behaviour following hindpaw denervation like A mice. As
noted, autotomy behaviour was followed in C3H/HeJ mice for up to day 21 PO (unlike A mice
which were followed up to day 14 PO) to ensure that at least 50% of the denervated mice
developed autotomy. However, by day 14 PO, for an unknown reason most C3H/HeJ mice
failed to develop autotomy and in fact this outcome was the case even when the follow up period
was extended to day 21 PO. In contrast, in denervated A mice up to 50% developed autotomy by
day 14 PO or earlier. This phenotypic difference in autotomy behaviour between these strains
may be explained by differences in their genetic background and/or differences that may develop
as their genes interact with environmental factors in a ‘GXE interactions’ fashion.
4.4 Conclusions
The present study validated, in part, the candidacy of Csf2rb1 as a gene in Pain1 whose
expression levels are linearly and significantly correlated with scores of autotomy behaviour in
some denervated A mice. Expression profiling results for Csf2rb1 in the spinal cord ipsilateral to
the injury (shown in Chapter 3) were replicated here using quantitative PCR methodology. We
also identified that CSF2RB1 is expressed in ependymal cells/radial glia/tanycytes in the spinal
cord central canal. This identification is based on the co-localization of CSF2RB1 with the
neural stem cell marker Vimentin. In addition, we identified ependymal cells/radial
glia/tanycytes expressing CSF2RB1 in various brain regions including the dentate gyrus, peri-
ventricular and arcuate nuclei of the hypothalamus, and in the pial surface of the brain. We also
found that the number CSF2RB1-expressing cells in the dentate gyrus extend processes through
the granule cell layer in MHS-A mice , but significantly less abundant or even completely absent

126
in denervated NLS-A and B mice and in sham mice of these strains. Although CSF2RB1 co-
localized with Vimentin in the pial surface of the brain we could not locate Vimentin in the
CSF2RB1+ cells of the dentate gyrus. It is possible that in the dentate gyrus these cells co-
localize with another neural stem cell marker named Nestin (Busch et al., 2010; Kirsch et al.,
2008; Mothe and Tator, 2005; White et al., 2010). Future studies are needed to test whether
Nestin co-localizes with CSF2RB1 or not. As well, functional studies are needed to identify the
mechanism by which Csf2rb1 gene product may control the development and/or maintenance of
neuropathic pain in these brain areas and/or the spinal cord areas mentioned in this report.

127
Chapter 5
Study III: Tlr4 and pStat3 as candidate genes controlling
autotomy behaviour in mice
5.1 Introduction
In the last set of experiments of this thesis we studied 2 additional candidate genes for autotomy
(Tlr4 and Stat3), which relate to the work on Csf2rb1 (see Chapters 3-4) and further seek to
explain the role of Csf2rb1 in neuropathic pain. The following paragraphs introduce the current
knowledge reported on those 2 additional genes as well as elaborate on the rationale for inclusion
of the following experiments in this dissertation.
5.1.1 Tlr4
Toll-like receptors (TLRs) comprise a family of proteins that are assembled in the outer cell
membrane of neurons, glia, macrophages, Schwann cells and pericytes in the nervous system,
and following peripheral nerve injury they serve as activators of Schwann cells in the PNS and
glia in the spinal cord (Hutchinson et al., 2008; Kim et al., 2009a; Piccinini and Midwood, 2010;
Tanga et al., 2005). TLR4 is one of 13 identified mammalian TLRs (Bowie and O’Neill, 2000),
a recognition receptor that responds to diverse invading pathogens and/or endogenous ligands.
Upon ligand binding TLRs undergo dimerization, activating intracellular signalling cascades that
regulate gene transcription via transcription factors, such as NFκB and AP-1, thereby generating
numerous proinflammatory cytokines, including IL-1β, IL-6 and TNFα (Kaisho and Akira, 2006;
Kawai and Akira, 2007; Okun et al., 2011). Endogenous signals are considered the source of
TLR activation in neuropathic pain conditions (Hutchinson et al., 2008; Kim et al., 2009a; Tanga
et al., 2005), particularly by activating glial cells in the spinal cord (Piccinini and Midwood,
2010; Scholz and Woolf, 2007). Those signals are referred to as damage- (or the risk of damage,
i.e., danger-) associated molecular patterns (DAMPs), and examples include fibronectin, β-
defensins, high mobility group box-1 (HMGB1), and heat shock proteins (Asea et al., 2002;
Costigan et al., 1998; Ohashi et al., 2000; Piccinini and Midwood, 2010; Vabulas et al., 2002).
DAMPs are believed to originate from long-term Wallerian degeneration of nociceptive fibres

128
that can last for years after the original trigger (Kim et al., 2009a; Vargas and Barres, 2007).
When bound to TLRs, DAMPs also regulate degeneration of the distal axonal segments that got
disconnected from the parent axon and the soma, a process that according to some investigators
initiates neuropathic pain via additional peripheral and central mechanisms (Kim et al., 2009a;
Piccinini and Midwood, 2010).
Scheme 1 (reprinted with permission from Kim et al., 2009a) illustrates a model of TLRs
involved in nerve injury and neuropathic pain. Following nerve injury, TLRs on peripheral
Schwann cells respond to DAMPs and regulate Wallerian degeneration and nerve regeneration.
Subsequently, DAMPs in the spinal dorsal horn activate microglial TLRs thereby releasing
inflammatory mediators and other factors on site, such as IL-1β, IL-6, TNFα, PGE2, NO and
BDNF (Jo et al., 2009; Kim et al., 2009a; Liu et al., 2012b). Some of these factors sensitize
neurons and others activate pain pathways indirectly, resulting in pain hypersensitivity (Matsui et
al., 2010; Wen et al., 2011). Specifically, these microglial mediators strongly regulate synaptic
transmission by enhancing excitatory and suppressing inhibitory synaptic transmission in spinal
cord neurons (Coull et al., 2005; Kawasaki et al., 2008). TLR4 microglial activation increases
p38 MAPK signalling in the spinal cord after SNL injury, which enhances release of TNFα, IL-
1β, and BDNF (Liu et al., 2012b). Astrocytes in the spinal cord and brain also express TLR4 on
the cell membrane (not shown in Scheme 1) and also contribute to the maintenance of
neuropathic pain conditions (Gao et al., 2009; Gao and Ji, 2010; Tsuda et al., 2011; Wei et al.,
2008). Gilmore and Skinner (1979) were the first to report that peripheral nerve injury (PNI)
induces astrocyte activation (Gilmore and Skinner, 1979), which is involved in the maintenance
of pain hypersensitivity (Raghavendra et al., 2003a). As well, TLR4 expression can be induced
in astrocytes in response to inflammation (Takeda and Akira, 2004). Among the many mediators
released from activated astrocytes to promote pain following PNI are ATP, NO, IL-6, PGE2, IL-
1β, CCL2 (MCP-1), CXCL-1 and CXCL-10 (reviewed in Liu et al., 2012b; McMahon et al.,
2005), many of which are induced by TLR4. Nerve injury and inflammation activate NFκB and
MAPK-mediated signalling pathways ERK and JNK in spinal astrocytes via TLR4, leading to
the synthesis and release of inflammatory mediators (Liu et al., 2012b). In the PNS, TLR4 is
expressed in TRPV1-expressing trigeminal neurons (Wadachi and Hargreaves, 2006), and
increases TRPV1 activity by LPS-induced intracellular Ca2+
release and inward currents in these
cells (Diogenes et al., 2011). In addition, TLR4 co-localizes with CGRP in primary sensory

129
neurons, and LPS enhances the TRPV-1 dependent release of CGRP (Ferraz et al., 2011), which
modifies the excitability of sensory neurons. Since LPS is a ligand for TLR4, these studies
indicate that TLR4 is involved in neuronal excitability also in the PNS.
Scheme 1: A model for TLRs in peripheral nerve injury and neuropathic pain (Kim et al.,
2009a).
Immediately following nerve injury, inflammatory and immune cells are recruited to the
nerve injury site including blood-derived immune cells, nerve-resident macrophages, and
Schwann cells, and these become activated upon binding endogenous TLR agonists
including cell membrane components, plasma proteins, heat shock proteins, IL-1β, and
TNFα (Hameed et al., 2010), to release cytokines, chemokines and neurotrophic factors
that facilitate nerve degeneration and regeneration processes (as shown in the bottom
inset of Scheme 1). These growth factors, as well as other inflammatory mediators, may

130
directly sensitize neurons and contribute to the development of neuropathic pain (Coull et
al., 2005; Kawasaki et al., 2008). Additionally, binding of endogenous agonists of TLRs
on resting microglia in the spinal dorsal horn activate these cells and release
inflammatory mediators that promote neuropathic pain (top rectangle). These agonists,
including IL-1β and TNFα, possibly originate from necrotic cells in the spinal cord after
spinal injury or by release from the microglia themselves. Proinflammatory cytokine
production results from the NFκB/MAPK pathways initiated by TLR4 (Jo et al., 2009).
TLRs are expressed in the PNS in Schwann cells (Tang et al., 2007) and in trigeminal
sensory neurons (Wadachi and Hargreaves, 2006).
5.1.2 Tlr4 up-regulation in pain behaviour
The following numerous reports have indicated an association between up-regulation of
Tlr4 and pain behaviour. In the intraplantar Complete Freund’s Adjuvant (CFA)-induced
peripheral inflammation model, Tlr4 was up-regulated within 4 h in various CNS regions
including the lumbar spinal cord, brain stem and forebrain, and remained elevated for
more than 14 days (Raghavendra et al., 2004), in parallel with dissipation of the allodynia
Tlr4 expression was similarly up-regulated after L5 nerve transection in the lumbar spinal
cord within 4 h, and continued to increase until day 14 post-injury, also correlating with
the time course of allodynia (DeLeo et al., 2004; Tanga et al., 2004). Furthermore, TLR4
contributed to neuropathic pain behaviour in the SNL L5 spinal nerve ligation and CCI
models and to long established neuropathic pain (2-4 months), not just to pain that
follows shortly after nerve damage (up to 14 days) (Lewis et al., 2012). Both Tlr4 gene
and its protein expression levels were significantly elevated on days 3 and 7 post-CCI in
rats compared to their sham controls, as were IL-1β and TNFα (proinflammatory
cytokines contributing to neuropathic pain states) (Kuang et al., 2012). Following a CCI
injury in rats, both Tlr4 gene expression levels and proinflammatory cytokines IL-1 and
TNFα were elevated significantly on days 1, 3, 7, 10 and 14 PO (Wu et al., 2010). In the
SNL model in B mice, Tlr4 mRNA levels were elevated significantly 14 days post-spinal
nerve injury on the ipsilateral dorsal horn, compared with the contralateral dorsal horn
(Kuboyama et al., 2011). Finally, in a rat model of bone cancer pain, both Tlr4 gene and
protein expression levels were significantly increased on days 6, 12 and 18 post-induction

131
of the pain model, compared to sham and intact rats (Lan et al., 2010). These studies,
while demonstrating increased Tlr4 gene and protein expression levels in parallel with
increase in evoked pain sensitivity in several models, raise the possibility that was not
tested before, that overexpression of Tlr4 may also correlate with spontaneous
neuropathic pain levels in the Neuroma model. Mechanisms involving Tlr4 are shown in
the following schematic diagram (Scheme 2).
Scheme 2: TLR4 is a potential master switch in pain regulation after nerve injury (Bottom
rectangles are adapted from (Liu et al., 2012b) with permission # 3378941061859). TLR4 is
expressed in neuronal and non-neuronal cells, on primary afferents, macrophages and Schwann
cells in the periphery and post-synaptically on 2nd
-order neurons, excitatory and inhibitory
interneurons, pericytes (Peri), microglia and astrocytes in the spinal and trigeminal dorsal horns
(Liu et al., 2012b). As products of nerve injury, necrotic cells release HSP60, and extracellular
matrix component, fibronectin, which are the ligands of TLR4 receptors (‘DAMPs’) released
after tissue/nerve injury and stress. Neuronal TLR4 increases the excitability of nociceptors by
increasing TRPV1 activity and TRPV-1 dependent release of CGRP. TLR4 on macrophages in
the PNS and microglia in the spinal cord, clear up the myelin debris of necrotic primary afferents
and interneurons and promote nerve regeneration in the periphery. In the spinal cord, TLR4
induces the activation of microglia and astrocytes and the production of proinflammatory
cytokines (INFLAM), leading to the development and maintenance of neuropathic pain. TLR4
signals through the adaptor protein, myeloid differentiation primary response protein 88
(MyD88), which leads to the translocation of NFκB to the nucleus, its binding to the DNA,
ending in subsequent gene expression levels. Simultaneously, MAPK signalling pathways are
activated, such as ERK, p38, and c-Jun N-terminal kinase (JNK), leading to the phosphorylation
and activation of transcription factors (not shown) to bind DNA and initiate gene transcription
followed by protein synthesis of numerous genes. Activation of TLR signalling cascades
produces a wide array of inflammatory mediators, including cytokines and chemokines, such as
TNFα, IL-1β, IL-6, BDNF, PGE2, CCL2 (MCP-1), CXC-chemokine ligand 1 (CXCL-1) and
CXCL-10, as well as reactive oxygen/nitrogen intermediates such as NO. Microglial activation
via TLR4 signalling is dependent upon GM-CSF released from astrocytes, ex vivo. GM-CSF,
IL-1β and IL-6, released from endothelial cells induce neuronal excitability. TLR4 signalling in
neurons, macrophages, and glia leads to increase in excitatory (INFLAM) and decrease in
inhibitory (BDNF) synaptic transmission in PNS and spinal cord neurons, which ultimately lead
to central sensitization and ongoing pain. Endo = Endothelial cells

132
macrophage
TLR4
Nerve injury
Debris clearance
Necrotizing afferentsNecrotizing interneurons
TLR4 ligands (Fibronectin; HSP-60)
Periphery Spinal dorsal horn
Autotomy PainInhibitory interneuron
Microglia
TLR4
TLR4
INFLAM
Astrocyte
Asc
end
ing
pai
n
pat
hw
ays
Neuronal hyperexcitability
INFLAM
GM-CSF
Microglia Astrocyte

133
5.1.3 Tlr4 blockade reverses established neuropathic pain
behaviour
Studies on Tlr4 knockout and mutant mice, and other studies using Tlr4 blocking agents show
that absence, blocking or elimination of Tlr4 expression reverses established neuropathic pain
states (Hutchinson et al. 2008; Kuang et al. 2012; Lan et al. 2010; Lewis et al. 2012; Liu et al.
201; Wu et al. 2010). For example, following a CCI nerve injury in the rat, an established
neuropathic pain behaviour was reversed by intrathecal TLR4 receptor antagonists (Hutchinson
et al., 2008) and intrathecal Tlr4 small interfering RNA injection (siRNA) (Kuang et al., 2012;
Wu et al., 2010). Intrathecal Tlr4 injection of siRNA in the rat also prevented the initial
development of bone cancer pain on day 4 post-induction of the model, and when administered
on post-inoculation day 9 it attenuated (but not completely blocked) the well-established bone
cancer pain behaviour (Lan et al., 2010; Liu et al., 2010).
To summarize, TLR4 and its associated signalling components contribute to pain
hypersensitivity. Blocking TLR4 signalling pathway prevents the initial development of
neuropathic stimulus-induced pain such as allodynia and hyperalgesia in mice and rats, and
reverses these abnormal sensory hypersensitivities in these models (Bettoni et al., 2008; Cao et
al., 2009; Hutchinson et al., 2008; Lan et al., 2010; Liu et al., 2010; Saito et al., 2010; Tanga et
al., 2005; Wu et al., 2010). Tlr4, the gene encoding TLR4, and its expressed protein, have never
been associated with spontaneous neuropathic pain behaviour (autotomy) in rodent models of
neuropathy. Therefore, it was of interest for us to show whether this gene plays role in autotomy
behaviour in mice of certain genetic backgrounds. The following section introduces the C3H
mouse strain, which is widely used to study Tlr4 function in various phenotypes, including
neuropathic pain.
5.1.4 C3H/HeJ vs. C3H/HeN mice
Several inbred C3H mouse strains are commercially available, including C3H/HeJ and
C3H/HeN, which have been studied previously by others for autotomy behaviour. C3H/HeJ
mice carry a genetic mutation in a non-synonymous SNP located in the Trl4 gene that is absent
from C3H/HeN mice. It is possible that this mutation alters the way in which denervated mice of

134
the two strains respond to neuropathic pain, displayed by differences in their autotomy levels.
Autotomy behaviour in these strains was not compared as of yet in the same lab at the same
time, although other mouse models for pain behaviour, i.e. L5 spinal nerve transection in the
SNL (‘Chung’) model, have shown that C3H/HeJ mutant mice have reduced pain sensitivity
levels compared to the wild-type C3H/HeN following nerve injury (Cao et al., 2009; Tanga et
al., 2005). In another model that induces allodynia via intrathecal LPS induction, investigators
showed that TLR4 dependence of allodynia exists in C3H/HeN-induced mice but is lacking in
C3H/HeJ-induced mice (Sorge et al., 2011). This difference in pain behaviour was strain
specific, as it related only to male mice and was absent in female C3H/HeN-induced and
C3H/HeJ-induced mice (Sorge et al., 2011). Table 13 lists the phenotypic differences between
C3H/HeJ (TLR4-deficient) and C3H/HeN (TLR4 wild-type) mice.

135
Phenotypes References
TLR4-deficient TLR4 wild-type
AFS Median = 1, AUC Median = 24.5 (Blech-Hermoni, 2005)
Average AFS = 10,
90% of mice
autotomized
(Minert et al., 2007a;
Rubinstein et al., 2003)
Average AFS = 7.5 (Persson et al., 2009a)
Folloing total denervation: average AFS = 9,
Following partial nerve ligation
(SNL): 30-35% of B/C3H/HeJ mice developed
thermal and mechanical hypersensitivity
compared to A/J mice.
(Mogil et al., 1999a)
Attenuated hypersensitivity to mechanical allodynia
and thermal hyperalgesia, compared to wild-type,
after CCI or spinal nerve L5 transection (SNL)
(Bettoni et al., 2008;
Cao et al., 2009; Tanga
et al., 2005)
Decreased expression of spinal microglial
markers and proinflammatory cytokines,
compared to wild-type, following CCI or
spinal nerve L5 transection (SNL)
(Bettoni et al., 2008;
Cao et al., 2009; Tanga
et al., 2005)
Reversal of mechanical hypersensitivity and
diminished glial activation markers after
resolution of peripheral inflammation
(Christianson et al.,
2011)
Decreased allodynia induced by intrathecal
LPS in male C3H/HeJ vs. C3H/HeN mice
(Sorge et al., 2011)
Resistance to atherosclerosis (Wang et al., 2007)
Lower levels of pro-inflammatory cytokines
TNFα and IL-6 in lung tissue in vivo after
bacterial infection
(Hassan et al., 2012)
Increased risk of intestinal damage and
microbial infection during acute graft-versus-
host-disease (GVHD)
(Imado et al., 2010)
Weigh less, but
consume more food,
leaner body mass
and fat mass; more
severe cancer
cachexia, but
smaller tumors;
IL1β is elevated in
serum of tumor-
bearing mice
(Cannon et al., 2007)
Endotoxin hyporesponsive (tolerant) (Baker et al., 1991;
Berenson et al., 2001;
Chung et al., 1998)
Table 13: Documented phenotypic differences between TLR4-deficient and TLR4 wild-type mice
(http://jaxmice.jax.org/strain/000659.html).

136
5.1.5 Tlr4 and Csf2rb1 in the inflammatory process
It has been shown that GM-CSF, one of CSF2RB1’s ligands, is responsible for microglial
activation (Duport and Garthwaite, 2005; Giulian and Ingeman, 1988; Hutter et al., 2010; Lin
and Levison, 2009; Maresz et al., 2005; Mukaino et al., 2010; Nakajima et al., 2006; Parajuli et
al., 2012; Quan et al., 2009; Sheikh et al., 2009; Suzuki et al., 2008; Volmar et al., 2008). More
recently, GM-CSF-induced microglial activation was shown to be dependent on TLR4 signalling
(Parajuli et al., 2012). GM-CSF enhances both mRNA and surface expression of TLR4 in brain-
derived isolated microglia, peaking at 48 hours after stimulation and remaining stable for 72 hrs.
GM-CSF-induced expression of TLR4 increases the production of LPS-mediated IL-1β, IL-6,
TNFα, and NO, via NFκB (Parajuli et al., 2012), associated neuropathic pain (Kuang et al., 2012;
McMahon et al., 2005; Milligan and Watkins, 2009). We showed that the receptor for GM-CSF,
CSF2RB1, is also associated with neuropathic pain. Csf2rb1 mRNA levels were up regulated in
the spinal cord following hind paw denervation and correlated with autotomy behaviour
(Chapters 3 & 4). Therefore it is suggested that co-expression of Tlr4 and Csf2rb1 may be
necessary to promote signalling events that are mediated by NFκB, such as the production of
inflammatory mediators associated with neuropathic pain. We hypothesize that the up-regulation
of Csf2rb1 in the spinal cord, which is associated with autotomy following denervation, may be
correlated with Tlr4 expression in mice. To test this hypothesis we compared the gene
expression levels of Csf2rb1 in the spinal cord before and following hind paw denervation, in
TLR4 wild-type vs. TLR4-deficient mice.
5.1.6 pStat3
Stat3 is a signal transducer activated upon phosphorylation by receptor-associated kinases in
response to cytokines and growth factors (Yuan et al., 2004). Stat3 is a transcription factor in the
Jak/Stat3 intracellular signalling pathway that once activated by IL-6, gp130 and Jak2 it initiates
in various cell types, including cells in the peripheral nervous system such as DRG satellite cells,
and the CNS, such as microglia and astrocytes, the transcription of cytokines and inflammatory
mediators Il-6, Mmp9, Ccl2, Il-1β, Tnfα, and p38 (Yu et al., 2009). When this happens following
peripheral nerve injuries, the release of these mediators in the spinal and trigeminal dorsal horns
has been shown to lead to allodynia and hyperalgesia (Dominguez et al., 2008, 2010; Dubový et

137
al., 2010; Kohli et al., 2010; Maeda et al., 2009; Tang et al., 2012). The active, phosphorylated
form of Stat3 (i.e., pStat3) is present in microglia and astrocytes of the spinal cord after SNL
injury (Dominguez et al., 2008; Tang et al., 2012), and in microglia (Dominguez et al., 2010) and
satellite cells of the DRG (Dubový et al., 2010) after CCI injury. The Jak-Stat3 pathway also
initiates nerve injury-induced astrocyte proliferation in the dorsal horn after SNI injury (Tsuda et
al., 2011). Blocking signal transmission in the Jak-Stat3 pathway, with leptin suppressors or
with the suppressor of cytokine signalling 3 (SOCS3), can reverse mechanical allodynia and
thermal hyperalgesia following PNS and CNS damage (Dominguez et al., 2008, 2010; Lim et al.,
2009; Maeda et al., 2009; Tang et al., 2012; Tian et al., 2011; Tsuda et al., 2011). Transgenic
mice that express the gene for human sickle hemoglobin (HbS; a protein that causes in humans a
syndrome of painful sickle cell anemia) show musculoskeletal and cutaneous mechanical and
heat allodynia (Kohli et al., 2010). These behavioural abnormalities were associated with
increased spinal pStat3 (activated Stat3) signalling, and an accompanying increase in IL-6, TLR4
levels (Kohli et al., 2010).
Stat3 also plays a role in bone cancer pain rodent models. This effect is mediated by the release
of G-CSF or GM-CSF from tumor-affected tissues. Binding of G-CSF or GM-CSF each to its
own receptor on sensory nerve fibres and cell bodies in the PNS was associated with sensory
hypersensitivity manifesting in mechanical allodynia and thermal hyperalgesia (Schweizerhof et
al., 2009). In cultured sensory DRGs, activation of the Jak/Stat pathway by G-CSF or GM-CSF
lead to phosphorylation of Stat3 and its translocation to the cell nucleus, where it initiates the
transcription of nociceptive transducers such as Trpv1, Nav1.8 and potassium channels involved
in regulating excitability of sensory nerves, such as Kcnd2 (Kv4.2) (Schweizerhof et al., 2009).
Exposure to G-CSF or GM-CSF sensitizes sensory nerve fibres to nociceptive stimuli, which can
be observed by electrophysiological recordings from single afferents ex vivo as well as by
behavioural responses to noxious stimuli in vivo (Stösser et al., 2011). Blocking G-CSF or GM-
CSF signalling by receptor neutralizing antibodies or by signalling inhibitors leads to a relief in
bone cancer pain in rodent models (Stösser et al., 2011). It has also been shown that Stat3 (not
directly through G-CSF or GM-CSF, but through Jak2 and/or NFκB, which signal downstream
of CSF2RB1) induces in cancer cells the transcription of inflammatory mediators such as Mmp9,
Il-6 Il-1β and Ccl2 (Yu et al., 2009), known to play a role in pathological pain (Qian et al., 2011;
Soria-Castro et al., 2010). These evidence link indirectly the GM-CSF receptor beta

138
(CSF2RB1), the gene product focused in this dissertation, to Stat3 signalling. While this
evidence relate to the role of Stat3 signalling following its activation by ligands of CSF2RB1 in
peripheral nociceptors, there is no report documenting the role of Stat3 signalling in CNS
spontaneous neuropathic pain following peripheral nerve injury. On this basis, we raised the
hypothesis that GM-CSF released from the terminals of injured nerves in the CNS, astrocytes,
blood cells (to name a few; see Scheme 4, Chapter 6) into the spinal cord following hindpaw
denervation, binds to its common receptor recognition subunit alpha (CSF2RA), on the surface
of expressing cells and ’ignite’ an intracellular signalling mechanism via the active subunit of the
common receptor beta (CSF2RB1), and Stat3 within the same cells. The transcription and
release of inflammatory mediators from these cells into the extracellular space may interact with
more of the same cells in a positive feedback loop (Ogura et al., 2008), or may excite second
order neurons, and promote autotomy (Scheme 4, Chapter 6). We further hypothesize a similar
pathway occurring in the hippocampal dentate gyrus, since we detected CSF2RB1+ cells in that
region and associated it with high autotomy. These hypotheses were tested here in the following
sets of experiments. First, we induced autotomy and sham operations in A and B mice and
excised their lumbar spinal cords and brains for histology after perfusion fixation of the CNS.
Next, we immunolabelled the sections with pStat3 antibodies (selective for activated Stat3) and
with various markers of neurons and glial cells. Finally, we analyzed the pStat3 labelled sections
in the spinal cord and brains, and associated them statistically with CSF2RB1 data.
5.1.7 C3H/HeJ and C3H/HeN mice in the Neuroma model
C3H/HeJ and C3H/HeN mice have been used by other investigators interchangeably to study
autotomy behaviour following peripheral neurectomy, not noticing the genetic difference
between the strains and unaware of the Tlr4 mutation and its reported impact on stimulus-
induced neuropathic pain, including us (Blech-Hermoni, 2005; Minert et al., 2007a; Mogil et al.,
1999a; Persson et al., 2009a; Rubinstein et al., 2003). Thus, on this background it was of interest
to test whether this single point mutation in the Tlr4 gene causes mice to develop a different
course of autotomy than other known “high” autotomy wild-type mouse strains including
C3H/HeN. To test the hypothesis that absence of TLR4 modifies autotomy behaviour in mice,
we monitored and compared this behaviour in mutated C3H/HeJ mice vs. wild-type C3H/HeN
mice.

139
5.2 Results
5.2.1 Autotomy behaviour in denervated C3H/HeN (Tlr4 wild-type)
and C3H/HeJ (Tlr4-deficient) mice
C3H/HeN and C3H/HeJ mice were denervated, sham-operated or left intact, and were followed
up for autotomy behaviour up to day 14 and 21 PO, respectively. As expected, none of the
sham-operated or intact mice expressed autotomy. As well, most wild-type mice (C3H/HeN)
have already expressed high autotomy before day 14, and had to be euthanized and perfused on
or before that day and their spinal cords were removed for gene expression analysis. Because
most denervated C3H/HeJ mice did not develop autotomy in the first 14 days PO, the follow up
was continued until day 21 PO, to test whether autotomy will develop albeit a delay. However,
mice perfused prior to day 21 PO retained their individual autotomy scores as part of their groups
scores until the end of the autotomy follow up period (i.e., PO day 21). Thus, on day 21 PO
autotomy scores in denervated mice of both strains varied from 0-11. Figure 30 shows the PO
course of autotomy behaviour in denervated wild-type mice compared to TLR4-deficient mice.
Average autotomy scores of the two strains diverged soon after the denervation procedure.
TLR4 wild-type mice showed a significant increase from day 4-14 PO (Figure 30A). Fifty
percent of wild-type mice (10 out of 20) expressed autotomy by day 14, their last observation
day, compared to 21% of TLR4-deficient mice (6 out of 28) at a significance level of P<0.003
(Figure 30B).
The average autotomy onset day for denervated wild-type and TLR4-deficient mice is shown in
Figure 31. The average onset day differed significantly in the C3H/HeN compared to that of
C3H/HeJ mice (7.1±1.3 vs. 9.8±0.91, P<0.05). The severity of autotomy at onset day,
characterized by the average score of autotomy at its onset, also differed significantly (Figure
32). Thus, mice carrying the Tlr4 mutation expressed a reduced average score at onset compared
to the wild type mice (1.3±0.35 vs. 12.6±0.72; P<0.04).

140
Figure 30: Course of autotomy levels in C3H/HeN mice carrying the wild-type Tlr4 gene
sequence and C3H/HeJ mice carrying the mutant gene followed up daily up to day 14. (A) Daily
average autotomy scores of C3H/HeJ mice (N=28) were significantly lower than those of
C3H/HeN (N=20). ANOVA for repeated measurements with Tukey’s post hoc test were
performed for all 14 days, yielding a value of P<0.005 for comparisons carried out for PO days
4, 12-14, and a value of P<0.0001 for PO days 5-11, (B) Percent mice with an autotomy score
above 6 on day 14 PO is shown for wild-type and TLR4-deficient mice. This difference was
significant at P<0.003.
Figure 31: Average autotomy onset day in denervated C3H/HeN and C3H/HeJ mice, shown in
grey and red, respectively as noted for TLR4 wild-type and TLR4-deficient mice. Average
autotomy onset day of the two strains differed significantly (2-tailed independent T-test, P<0.05).
-1
0
1
2
3
4
5
6
7
8
1 2 3 4 5 6 7 8 9 10 11 12 13 14
Av
era
ge
au
toto
my
sco
re
Post operative day
Autotomy in C3H/HeN and C3H/HeJ mice
TLR4 wild-type
TLR4-deficient
A
50%
21%
0%
10%
20%
30%
40%
50%
60%
TLR4 wild-type TLR4-deficient% M
ice
wit
h f
ina
l a
uto
tom
y s
co
re >
6
Percent mice with high autotomy scoresB
P<0.05
0
2
4
6
8
10
12
TLR4 wild-type TLR4-deficient
Au
toto
my
on
set
day
Autotomy onset day in C3H/HeN and C3H/HeJ mice

141
Figure 32: The average score of autotomy at its onset in denervated C3H/HeN and C3H/HeJ
mice (N=20 and 28) following sciatic and saphenous neurectomy was significantly lower for
mice of the C3H/HeJ strain , and ranged from 1-7, compared to the score in C3H/HeN mice
which ranged from 1-8 (2-tailed independent T-test; P<0.003).
5.2.2 Csf2rb1 expression patterns in C3H/HeN and C3H/HeJ
mice
As shown in Figure 33, levels of Csf2rb1 expressed in the spinal cord of nerve injured mice of
the C3H/HeN (carriers of the Tlr4 wild-type sequence of the gene) were significantly higher than
those of naïve and sham controls of this strain (1.36±0.08 vs. 0.96±0.13, P<0.001; vs. 1.05±0.06,
P<0.002, respectively), and was even significantly elevated in mice expressing NLS compared to
naïve and sham controls (1.35±0.05 vs. 0.96±0.13, P<0.009; vs. 1.05±0.06, P<0.02). There was
no significant difference in Csf2rb1 mRNA levels in the spinal cord between denervated mice of
this strain that expressed NLS and those that expressed MHS. The expression of Csf2rb1 in the
two strains was not significantly different when comparing the two naïve groups, the two sham
groups, the two low-autotomy groups, or the two high autotomy groups of the two strains.
Within the C3H/HeJ strain (mice carrying the Tlr4 mutation) Csf2rb1 gene expression levels also
did not change significantly following denervation. The same outcome was evident when
P<0.003
0
0.5
1
1.5
2
2.5
3
3.5
TLR4 wild-type TLR4-deficient
Au
toto
my
on
set
sco
re
Autotomy onset score in C3H/HeN and C3H/HeJ mice

142
comparing MHS-C3H/HeJ, mice that developed high autotomy scores, and NLS-C3H/HeJ
groups with naïve and sham-operated mice of this strain.
Autotomy onset day and score at onset were not significantly correlated with gene expression
levels of Csf2rb1 in the two strains (Figure 34). Csf2rb1 gene expression levels were
comparable regardless of the time mice began to develop autotomy. Similarly, Csf2rb1 gene
expression levels were similar regardless of the degree of self-mutilation mice had at onset and
up to day 14 and 21 PO in C3H/HeN and C3H/HeJ mice, respectively.
Figure 33: Csf2rb1 gene expression levels in denervated C3H/HeN and C3H/HeJ mice.
Average Csf2rb1 mRNA levels relative to Hprt reference gene (see Appendix IV) of naïve (N=4
and N=6), sham-operated (N=8 and N=6), denervated with NLS (N=4 and N=5) and denervated
with MHS (N=12 and N=4) TLR4 wild-type and TLR4-deficient mice, respectively. Csf2rb1
expression did not change significantly among the TLR4-deficient mice by sham operation or
denervation, whether resulting in NLS or MHS. In the TLR4 wild-type mice, however, Csf2rb1
levels were significantly elevated after nerve injury (but not after sham operation) in mice that
expressed NLS as well as in those with MHS. Significantly elevated spinal levels of Csf2rb1
were also noted when comparing the two denervated groups against the sham operated group
(One-way ANOVA with post hoc LSD test).
P<0.01P<0.001
P<0.05
P<0.005
0
0.2
0.4
0.6
0.8
1
1.2
1.4
1.6
Naïve Sham Low Autotomy High Autotomy
mR
NA
leve
l of
Csf
2rb
re
lati
ve t
o H
prt
Csf2rb1 expression levels in wild-type vs. deficient Tlr4 mice
TLR4 wild-type
TLR4-deficient
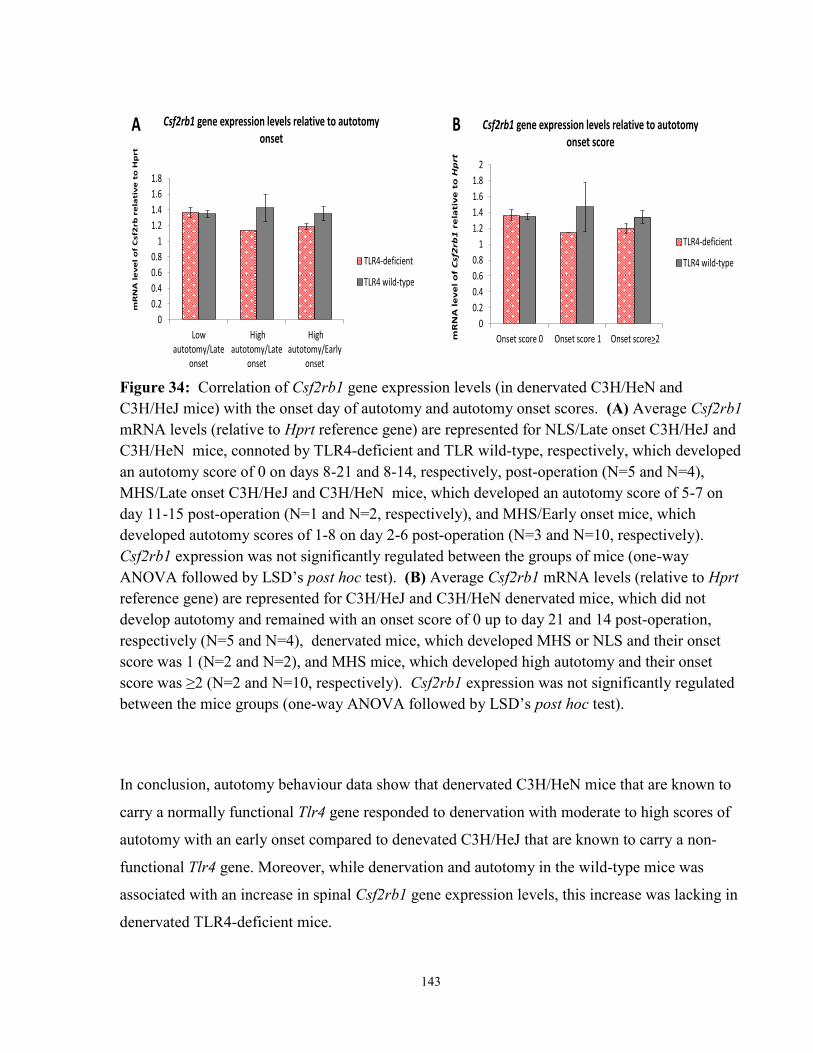
143
Figure 34: Correlation of Csf2rb1 gene expression levels (in denervated C3H/HeN and
C3H/HeJ mice) with the onset day of autotomy and autotomy onset scores. (A) Average Csf2rb1
mRNA levels (relative to Hprt reference gene) are represented for NLS/Late onset C3H/HeJ and
C3H/HeN mice, connoted by TLR4-deficient and TLR wild-type, respectively, which developed
an autotomy score of 0 on days 8-21 and 8-14, respectively, post-operation (N=5 and N=4),
MHS/Late onset C3H/HeJ and C3H/HeN mice, which developed an autotomy score of 5-7 on
day 11-15 post-operation (N=1 and N=2, respectively), and MHS/Early onset mice, which
developed autotomy scores of 1-8 on day 2-6 post-operation (N=3 and N=10, respectively).
Csf2rb1 expression was not significantly regulated between the groups of mice (one-way
ANOVA followed by LSD’s post hoc test). (B) Average Csf2rb1 mRNA levels (relative to Hprt
reference gene) are represented for C3H/HeJ and C3H/HeN denervated mice, which did not
develop autotomy and remained with an onset score of 0 up to day 21 and 14 post-operation,
respectively (N=5 and N=4), denervated mice, which developed MHS or NLS and their onset
score was 1 (N=2 and N=2), and MHS mice, which developed high autotomy and their onset
score was ≥2 (N=2 and N=10, respectively). Csf2rb1 expression was not significantly regulated
between the mice groups (one-way ANOVA followed by LSD’s post hoc test).
In conclusion, autotomy behaviour data show that denervated C3H/HeN mice that are known to
carry a normally functional Tlr4 gene responded to denervation with moderate to high scores of
autotomy with an early onset compared to denevated C3H/HeJ that are known to carry a non-
functional Tlr4 gene. Moreover, while denervation and autotomy in the wild-type mice was
associated with an increase in spinal Csf2rb1 gene expression levels, this increase was lacking in
denervated TLR4-deficient mice.
B
0
0.2
0.4
0.6
0.8
1
1.2
1.4
1.6
1.8
Lowautotomy/Late
onset
Highautotomy/Late
onset
Highautotomy/Early
onset
mR
NA
le
ve
l o
f C
sf2
rb r
ela
tiv
e t
o H
prt
Csf2rb1 gene expression levels relative to autotomy onset
TLR4-deficient
TLR4 wild-type
A
0
0.2
0.4
0.6
0.8
1
1.2
1.4
1.6
1.8
2
Onset score 0 Onset score 1 Onset score>2mR
NA
le
ve
l o
f C
sf2
rb1
re
lati
ve
to
Hp
rt
Csf2rb1 gene expression levels relative to autotomy onset score
TLR4-deficient
TLR4 wild-type

144
5.2.3 CSF2RB1+ cells in the central canal of C3H/HeN mice
Next, we were interested to see whether or not CSF2RB1 protein is expressed in the spinal cords
of wild-type and mutant C3H mice, and to determine whether these cells change in number and
morphology following nerve injury in these mice. As in the A and B mice, CSF2RB1+ cells of
C3H/HeN and C3H/HeJ mice were located around the central canal. However, no significant
differences in the number of these cells in MHS- and sham-operated C3H/HeN mice were
detected, as shown in Figure 35.
Figure 35: CSF2RB1 immunostaining in the central canal of C3H/HeN mice. Average number
of cells per 50μm thick transverse slice having processes that extend laterally from the cell body
at the central canal for ≥20 μm into lamina X of the spinal cord are presented for sham-operated
and denervated MHS mice; ≥6 sections per mouse. Each column represents data for 1 mouse, 2
mice per treatment.
5.2.4 Tlr4 gene regulation in A vs. B mice
The results we got for the two C3H strains prompted us to ask whether Tlr4 also regulates
differentially the expression of Csf2rb1 in A and B mice following denervation. Tlr4 gene
expression levels were determined in the lumbar DRGs associated with the injured sciatic and
saphenous nerves, as well as in the spinal cords of these mice, and were compared to naïve and
0
5
10
15
20
25
30
Sham 1 Sham 2 High Aut 1 High Aut 2
Nu
mb
er
of
cells
≥2
0 μ
m
CSF2RB1+ cells in C3H/ HeN mice

145
sham operated mice. The expectation was that mRNA levels of Tlr4 will be higher in A mice
compared to B mice, before and/or after peripheral nerve injury, and that this over expression
will lead to more receptor abundance and function, driving pain mechanisms in A but not B
mice. In the case of TLR4-mutant mice, mRNA levels of Tlr4 gene and its protein product are
diminished both in PNS and CNS tissue. However, in A and B mice we could not predict
whether the functional difference would occur in the periphery (DRG) or in the CNS (spinal
cord), or both, and due to the fact that we had previous data on the transcript abundance in both
tissues from our expression profiling arrays (Chapter 3), we analyzed these data from both DRGs
and spinal cords of A and B naïve, sham-operated and NLS and MHS mice.
In support of the hypothesis, we found that Tlr4 mRNA levels in the DRGs and spinal cords of A
mice were elevated 2-fold compared to the levels of B mice for the same groups (naïve, sham-
operated, and denervated whether with or without MHS) (Figure 36). Tlr4 mRNA levels in the
ipsilateral DRGs of naïve A and B mice were 0.53±0.60 and 0.28±0.02, respectively (P<0.001,
one-way ANOVA with LSD post hoc test). In sham-operated A and B mice these levels were
also significantly different 0.59±0.06 and 0.31±0.05, respectively (P<0.0001, one-way ANOVA
with LSD post hoc test). Tlr4 mRNA in denervated NLS-A mice was 0.62±0.05 compared to
0.28±0.04 in NLS-B mice (P<0.0001, one-way ANOVA with LSD post hoc test). Finally,
denervated MHS-A mice had 0.54±0.01 compared to denervated NLS-B mice (P<0.001, one-
way ANOVA with LSD post hoc test). In the DRG of A and B mice, denervation that led to
NLS or MHS was not associated with a change in mRNA levels of Tlr4 compared to sham-
operated same-strain groups or the same-strain naïve groups (Figure 36A).
Similar 2-fold differences in Tlr4 gene expression levels were observed in ipsilateral spinal cords
of A vs. B mice (Figure 36B). Sham-operated and denervated NLS-A mice had >2-fold
difference in Tlr4 expression levels compared to the B mice with the same phenotypes (sham
0.20±0.03 and 0.08±0.05, P<0.03; denervated NLS 0.21±0.045 and 0.09±0.04, P<0.03,
respectively). As well, Tlr4 gene expression levels were >2-fold in the denervated MHS- A mice
compared to the denervated NLS- B mice (0.23±0.04 vs. 0.09±0.04, P<0.01, respectively). Tlr4
mRNA levels were not significantly higher in naïve A vs. B mice. As in the DRG, ipsilateral
spinal Tlr4 expression levels did not correlate the type of treatment mice received, since
expression levels in sham-operated mice, and nerve injured mice with NLS or with MHS, did not

146
differ from those of the naive group. Likewise, spinal Tlr4 expression levels of nerve-injured
mice with NLS or with MHS did not differ from those of the sham operated mice. The same lack
of change was seen in B mice groups. The only differences were across the strains.
Figure 36: Tlr4 gene expression levels in DRG and spinal cord of A vs. B mice. Average Tlr4
mRNA levels (relative to those of a mouse reference gene pool) are shown in (A) for DRGs of
the naïve (N=5 and N=5), sham-operated (N=5 and N=5), denervated with NLS (N=3 and N=5)
A and B mice, respectively, and denervated A mice with MHS (N=5), and in (B) for the
ipsilateral spinal cord of naïve (N=5 and N=5), sham-operated (N=5 and N=5), denervated with
NLS (N=5 and N=5) A and B mice, respectively, and denervated MHS-A mice (N=5). One-way
ANOVA with LSD post hoc test was performed.
5.2.5 Tlr4 gene polymorphisms in MHS vs. NLS mice
Next, we were interested to determine whether differences in pain behaviour between autotomy
susceptible and autotomy resistant strains may be explained by polymorphic contrasts within the
Tlr4 locus. Using the MGI website
(http://www.informatics.jax.org/javawi2/servlet/WIFetch?page=snpQF) we found, 35 SNPs in
Tlr4 (29% out of all 122 reported SNPS within Tlr4 from the MGI website) between A and B
mice that contrast in autotomy levels, located in coding, untranslated (UTR) and intronic regions
of the gene (Table 14), including 2 non-synonymous, 2 synonymous, 3 UTR and 28 intronic
mutations. When using the same SNP browser to compare SNPs in other strains having known
levels of autotomy (Blech-Hermoni, 2005; Devor et al., 2007; Mogil et al., 1999a), contrasting
those that typically express MHS with those expressing NLS autotomy scores, such as BALB/cJ
0
0.1
0.2
0.3
0.4
0.5
0.6
0.7
0.8
Naïve Sham LowAutotomy
HighAutotomy
Rela
tiv
e m
RN
A e
xp
ressio
n
Tlr4 in DRG of A vs. B mice
A
B
A
0
0.05
0.1
0.15
0.2
0.25
0.3
Naïve Sham LowAutotomy
HighAutotomy
Rela
tiv
e m
RN
A e
xp
ressio
n
Tlr4 in spinal cord of A vs. B mice
A
B
BP<0.05 P<0.05P<0.001
P<0.0001 P<0.0001 P<0.001P<0.01

147
(MHS) vs. AKR/J and DBA/2J (NLS), we found 20 SNPs out of all 122 reported SNPs within
Tlr4 (16%). These were located in exons (i.e., 4 non-synonymous and 2 synonymous), in UTR
(n=3) and in intronic regions of the gene (n=11 SNPs). Twenty-one SNPs were identified
between high (BALB/cJ) and moderate autotomy strains (129S1/SvImJ and 129X1/SvJ; 17%).
These were 5 non-synonymous SNPs, 2 synonymous SNPs, 3 UTR SNPs and 11 SNPs in
intronic regions of the gene. Thus, there are a large number of SNP variations in the sequence
code of Tlr4 that might correlate the contrast in autotomy behaviour between A and B mice, and
possibly between other MHS vs. MLS strains. These polymorphic regions may alter Tlr4 mRNA
stability or TLR4 protein structure that would have functional relevance for autotomy behaviour
in the A strain compared to the B strain (as reported above the Tlr4 gene expression levels
difference across the two strains). Some of these SNPs may adversely affect the function of the
TLR4 receptor making the gene in C3H/HeJ mice dysfunctional.
Table 14: Tlr4 SNPs that contrast between A and B mice and are located in coding regions
(synonymous and non-synonymous SNPs), intronic and un-translated regions. Some of these are
also polymorphic between other strains known to express NLS vs. MHS of autotomy, such as
BALB/cJ, AKR/J and DBA/2J vs. 129X1/SvJ and/or 129S1/SvImJ, respectively. Some SNPs
regulated between all of the above MHS vs. NLS strains. Other SNPs regulated only between
some of the above strains.
5.2.6 pStat3 in dorsal horn of A vs. B mice
Unlike CSF2RB1 expressed in the central canal of the spinal cord, pStat3 was not expressed
there, only to a minimal extent. pStat3 was expressed in unidentified cells within the whole
spinal cord, including the dorsal horn. As can be seen in Figure 37, GFAP labelling did not
coincide with pStat3, therefore all we can state at this time is that pStat3 is not expressed in
astrocytes. The expression levels of pStat3 in the ipsi- and contralateral dorsal horns of
denervated mice were not significantly different (Student’s t-test). However, significant
Gene
mRNA UTR Coding Synonymous Coding Nonsynonymous Intronic
Total SNPs
A vs. BHigh vs.
LowHigh vs.
IntTotal SNPs
A vs. BHigh vs.
LowHigh vs.
IntTotal SNPs
A vs. BHigh vs.
LowHigh vs.
IntTotal SNPs
A vs. BHigh vs.
LowHigh vs.
Int
Tlr4 12 3 3 3 13 2 2 2 11 2 4 5 86 28 11 11

148
differences were observed between sham operated and denervated mice of the same strain (AS
8.3±1.8 vs. NLS-A 22.2±3.8, P<0.001; AS 8.3±1.8 vs. MHS-A 19.1±3.1, P<0.004, respectively),
and between A and B denervated mice (NLS-B 11.3±1.3 vs. NLS-A 22.2±3.8, P<0.007; NLS-B
11.3±1.3 vs. MHS-A 19.1±3.1, P<0.03, respectively). Figure 37 shows photomicrographs of
transverse sections of the L4-5 segments of the spinal cord with a focus on the dorsal horn
region, immunolabelled with pStat3 and GFAP antibodies. The Figure clearly shows an elevated
expression in pStat3 in the dorsal horn of denervated A mice, significantly more so than the
sham-operated A mice, and the denervated B mice. There was no significant difference in pStat3
expression between denervated A mice with (MHS) and without (NLS) autotomy.
Figure 37: Photomicrographs of the spinal cord of denervated and sham operated A mice
labelled immunohistologically for pStat3. pStat3 (red) was highly expressed in the L4-5 spinal
dorsal horn of MHS-A mice (A), compared to sham-operated A mice (B-C). pStat3 is evident
throughout the grey matter, but note that it was absent around the central canal (arrow) in A
sham mouse (D). pStat3 did no co-localize with astrocytes (GFAP; green) and also not with
most neuronal nuclei (NeuN; green), but only co-localized with a small subpopulation of neurons
(B & E). (F) Cell nuclei in the spinal dorsal horn, immunolabelled with pStat3 were counted in
an area of 100μm x 100μm (0.01mm2) on gray scale images to accentuate pStat3 labelled in
white over a dark gray/black background, as shown in (B). Data is shown for 6-8 sections, 1
A
FED
CB
0
5
10
15
20
25
30
pST
AT3
+ ce
lls /
10
mm
²
pSTAT3+ cells in ipsilateral dorsal horn
P<0.001
P<0.004
P<0.007
P<0.03
A
pSTAT3GFAP
ED
CB
pSTAT3NeuN
pSTAT3NeuN
pSTAT3NeuN
pSTAT3
149
mouse per group; One-way ANOVA with LSD post hoc test; Magnification, 20X; Scale bar 80
μm.
5.2.7 pStat3 in the dentate gyrus of A vs. B mice
In order to detect whether the Stat3 pathway in the dentate gyrus plays role in autotomy
behaviour, as we found for CSF2RB1, we looked at its active form, pStat3, using
immunostaining analysis. Strikingly, there was a significant difference in the expression of
pStat3 between the right and left dentate gyrus of denervated A mice expressing high autotomy
scores compared to denervated low autotomy B mice. There was a 2-fold difference in pStat3
expression levels in these MHS-A mice between the left and right sides, which was not seen in
any studied low autotomy groups, in which the fold change remained around 1 between the
dentate gyri on the two sides (Figure 38). pStat3 did not co-localize with the astroglial marker
GFAP (Figure 38B-C). We could not perform a double labelling of pStat3 with CSF2RB1, since
the two antibodies came from the same species. But labelled cells in the dentate gyrus
polymorph layer with either pStat3 or CSF2RB1 looked identical in morphology.
5.2.8 pStat3 in the peri-ventricular nucleus of A mice
A significant labelling of pStat3 was also observed around the brain ventricles of denervated and
sham operated A mice, a region that comes in contact with cerebrospinal fluid (Figure 39). A
small population of these cells also reacted with GFAP, indicating that some astrocytes in the
peri-ventricular region express pStat3. pStat3 did not co-localize with neuronal nuclei (as
marked by NeuN; Figure 39B). Immunoreactivity with CSF2RB1 was also seen in this region in
both A and B mice (Chapter 4), suggesting that the two proteins may be co-expressed withtin the
same cells.

150
Figure 38: Photomicrographs of the dentate gyrus of denervated and sham operated A mice
labelled immunohistologically for pStat3. pStat3 (red) is expressed by cells in polymorph and
granule layers of the dentate gyrus. It did not co-localize with GFAP (astrocytes, green; A & B),
or with NeuN (neuronal nuclei, green; D). pStat3 expression in the left hemisphere of A high-
autotomy mouse is shown in (A) compared to the right hemisphere of the same mouse where
lower pStat3 expression was detected (B) and compared to a hemisphere of an A sham mouse
where lower pStat3 expression was also valid (D). (C) Fold change data is shown for 1-2 mice
per treatment type. Number of cells in both hemispheres, per section, was counted in an area of
50μm x 50μm (2,500μm2), 4-6 sections per mouse. Ratios between right and left hemispheres
are presented as a fold change. One-way ANOVA with Tukey’s post hoc test. Magnification -
20X; Scale bar - 80 μm.
C
BA
pSTAT3GFAP
pSTAT3GFAP
D
pSTAT3NeuN
0
0.5
1
1.5
2
2.5
3
A sham A low-autotomy
A high-autotomy
B low-autotomy
Fold
ch
ange
of
pST
AT3
+ ce
lls in
left
/rig
ht
he
mis
ph
ere
s
Increase in dentate gyrus pSTAT3+ cells correlates with autotomy
P<0.0001P<0.0001 P<0.0001

151
Figure 39: Photomicrographs of the brain ventricles of denervated and sham operated A mice
labelled immunohistologically for pStat3. pStat3 immunopositive cells are seen around the brain
ventricles and throughout the peri-ventricular region. pStat3 co-localized with a small
population of astrocytes in a MHS-A mouse (Shown in yellow; arrows in A, C) but not with
neurons shown for an A sham mouse in (B). Magnification – 20X; Scale bar – 80 μm.
5.3 Discussion
5.3.1 Tlr4 contributes to chronic neuropathic pain
In the present study we showed for the first time that Tlr4 is a gene whose product contributes to
the maintenance of spontaneous chronic neuropathic pain in the Neuroma model of autotomy.
This is based on the observations that C3H/HeJ (TLR4-mutant) mice were less susceptible to
develop autotomy compared to C3H/HeN (wild-type) animals, manifested by the lower number
of mice that autotomized on day 21 post-denervation, longer onset times and lower autotomy
scores at onset compared to wild-type mice. These results suggest that Tlr4 is a gene that
correlates with the maintenance of spontaneous neuropathic pain in the mouse. In addition to
Tlr4 it is possible that there might be other genes having SNP variations between C3H/HeJ and
C3H/HeN, and these genetic differences may play a role in spontaneous neuropathic pain. More
research is needed to answer this question.
These results are compatible with previous studies that compared Tlr4 mutant and wild-type
mice in models of stimulus-evoked chronic neuropathic pain. Tanga et al. (2005) compared Tlr4
knockout and point-mutant mice that underwent a L5 nerve transection in the SNL model and
A B
pSTAT3NeuN
pSTAT3GFAP
C
pSTAT3GFAP

152
reported observing a significantly attenuated behavioural hypersensitivity and a decreased
expression of spinal microglial markers, reduced glial activation and reduced expression of pain-
related cytokines. In another study using the CCI model, the authors have shown reduced
thermal hyperalgesia and mechanical allodynia on days 4 and 8 post-injury in Tlr4 knockout
compared to wild type mice (Bettoni et al., 2008). Thus, we can conclude that Tlr4 gene may be
important in maintaining both stimulus-evoked and spontaneous pain-related behaviours.
5.3.2 Tlr4 gene is differentially expressed in A vs. B mice
The autotomy-contrasting mouse strains A and B, which we used in studies 1 and 2 of this thesis
to seek candidate genes for autotomy and study the role of CSF2RB1, showed a significant
contrast in Tlr4 gene expression levels, as follows. Denervated B mice, which did not develop
autotomy after total hindpaw denervation, had significantly lower Tlr4 mRNA levels in DRG
neurons and in the lumbar spinal cord, as compared with denervated A mice, which expressed
moderate-high autotomy scores following the same denervation procedure. This contrast in Tlr4
gene expression levels between A and B strains was also demonstrated when comparing their
two sham operated groups (i.e., AS vs. BS) as well as the denervated groups of these strains
(MHS-A and NLS-A vs. NLS-B mice). These results suggest that levels of expressed Tlr4 may
be important in regulating pain after tissue and nerve injury in A mice, and not in B mice,
peripherally (in DRG neurons) and centrally (in the spinal cord), or that lower Tlr4 gene
expressed in B mice relative to A mice in these tissues may have protected them from autotomy
behaviour.
The current results also demonstrate that constitutive Tlr4 mRNA levels in the spinal cord of
intact A and B mice are not significantly different; suggesting that in these mice Tlr4 in the
spinal cord is not involved in the triggering mechanisms of chronicity at the time of nerve injury,
when the animal is intact. This conclusion is supported by findings of other groups that showed
that loss of Tlr4 gene did not change acute pain behaviour, and did not alter acute pain behaviour
of the intact contralateral paw, after an ipsilateral nerve injury (Bettoni et al., 2008; Cao et al.,
2009). However, our results also showed that Tlr4 expression levels of intact A and B mice in
the DRG is significantly different, and this may propose a peripheral mechanism involving Tlr4
at the time of nerve injury. Further studies are needed to assess in which cell types within the
153
DRG Tlr4 gene is expressed, to better understand whether or not an ‘injury discharge’
mechanism is involved. Within DRG tissue are DRG neurons, satellite cells, and also
macrophages (Hu and McLachlan, 2003), which are the potential cells to express Tlr4. Since
TLR4 is expressed on macrophages and is also found on the cell membrane of trigeminal
nociceptive neurons (Wadachi and Hargreaves, 2006), the gene may be transcribed within the
DRGs, and then transported to the cell membrane, or it may be transcribed in the macrophages or
both. Thus both or one of these cell types may be potential targets for producing and relaying
‘injury discharge’ to the CNS, associated with TLR4. Additional studies are needed to answer
these questions.
Experiments carried out in silico, confirmed that the Tlr4 gene is polymorphic in contrasting
autotomy strains, including in A and B mice. Therefore, the alterations in Tlr4 gene expression
levels between A and B mice (or between other autotomy contrasting strains) can be explained,
in part, by differences in DNA sequence between MHS and NLS strains. Currently, there is no
functional information available for these SNPs specifically, but other SNPs in Tlr4 have been
associated with disease. A study by Yamakawa et al.(2013) shows that a human polymorphism
in the Tlr4 gene causes LPS hyporesponsiveness, and is associated with a variety of infectious
and non-infectious diseases (Yamakawa et al., 2013). Numerous studies in humans and fewer
studies in mice demonstrated that polymorphisms in the Tlr4 locus between individuals and
strains, respectively, exist, and these modify the responses to inflammatory (Liu et al., 2011),
autoimmune (Leichtle et al., 2011; Sivula et al., 2012) and neurodegenerative disease (Yu et al.,
2012).
The data presented here suggest a correlation between Tlr4 expression and autotomy behaviour
in wild-type vs. TLR4-mutant mice, as well as in A vs. B mice, demonstrated by the differences
in autotomy levels, day of onset and onset scores following hind paw denervation, and by
differences in Tlr4 mRNA levels in autotomizing A vs. non-autotomizing B mice. Further
studies are needed to show whether blocking the Tlr4 gene expression or the function of the
TLR4 protein in A mice could potentially reduce autotomy following hindpaw denervation in the
Neuroma Model.
154
5.3.3 Proposed mechanisms for Tlr4 in neuropathic pain
In the present study we showed that Tlr4 gene expression levels in the spinal cord and DRGs
correlate with autotomy behaviour in denervated A mice and with the absence of this behaviour
in denervated B mice. We also showed that the presence of functional TLR4 receptors correlates
with autotomy in Tlr4 wild-type mice and that absence of TLR4 modulates autotomy behaviour
in Tlr4 mutant mice. We suggest that in the PNS and spinal cord of A and C3H/HeN mice,
TLR4 mediates macrophage/glial activation, which is significantly higher in these mice
compared with B and C3H/HeJ mice. The proposed enhanced macrophage/glial activation in the
PNS and spinal cords of A and C3H/HeN mice may initiate the transcription and production of
cytokines and inflammatory mediators and other factors which sensitize pain pathways. These
substances may facilitate excitation of nociceptors in the PNS and second order neurons in the
spinal dorsal horn, thereby contributing to peripheral and central sensitizations. In addition,
some anti-inflammatory mediators and neurotrophins (such as BDNF) may facilitate blocking of
inhibitory interneurons in the spinal dorsal horn, a mechanism which is also known to contribute
to central sensitization.
There is a large body of evidence linking microglial activation to TLR4 activation, and vice
versa (reviewed in (Guo and Schluesener, 2007; Nicotra et al., 2012). In essence, Tlr4 is a
documented key regulator for initiating and/or maintaining pain, by enhancing the production of
inflammatory mediators and factors that promote pain. Simultaneously, TLR4 may be involved
in other mechanisms including phagocytosis in debris clearance of necrotic cells in the periphery
and spinal cord, which are remnants of dying nociceptors, by-products of the denervation and
second order spinal neurons. Although not shown before, such dying neurons may occur higher
up supraspinally along pain pathways, stirring up the phagocytic action of glia and inflammatory
cells, which we saw in those supraspinal structures as manifested in CSF2RB1 expressing cells.
This mechanism may, in addition to producing sensitization of pain pathways directly, also
enhance processes of regeneration and axonal sprouting in the neuroma and from collaterals of
intact afferents in the periphery as well as within the spinal cord, including collateral sprouting of
central terminals of intact neighbouring cells into spinal termination sites that do not normally
process these inputs. In the periphery, axonal sprouting within the neuroma and assembly of
sodium channels in the sprouts’ membranes leads to ectopic activity of action potentials that

155
relay nociceptive messages through the spinal cord and to the brain. In the spinal cord, axonal
sprouting of nociceptors into laminae that do not normally process pain inputs, send nociceptive
messages to the brain.
Following nerve injury TLR4 signalling can be activated by various ligands (i.e., necrotic cells,
HSP60, fibronectin) in numerous cell types in peripheral and central nervous systems (Schwann
cells, macrophages, neurons, pericytes and glia) to produce and maintain pain (See section 5.1.1
Tlr4). Therefore, mice that lack the functional receptor (i.e., C3H/HeJ, the Tlr4 mutant mice), or
have fewer copies of the receptor (e.g., B mice) compared with mice having the functional
receptor (i.e., C3H/HeN; Tlr4 wild type) and in greater numbers (i.e., A mice) are more
susceptible to autotomy behaviour.
5.3.4 Csf2rb1 gene expression levels in wild-type and TLR4-
deficient mice
The Csf2rb1 gene expression data in denervated C3H/HeN and C3H/HeJ mice shows that this
gene is up regulated after denervation in the wild-type mice, but not in TLR4-mutant mice,
suggesting that a functional Tlr4 is necessary for the induction of Csf2rb1 expression levels
following denervation, and that the two genes may be involved in the same pathway.
In Chapter 4 the data showed that the cytokine receptor CSF2RB1, encoded by its gene on
Pain1, correlates with MHS of autotomy in denervated A mice, and that its protein co-localizes
in specialized ependymal cells/radial glia/tanycytes around the central canal of the spinal cord
and in the brain in the dentate gyrus and peri-ventricular and arcuate nuclei of the hypothalamus.
We also showed that compared to denervated mice of the B strain, the number of such
specialized cells around the spinal central canal of autotomizing A mice increases, and their
morphology changes by hypertrophy that manifests in elongation of their processes.
Additionally we showed that following denervation in mice of the A and B strains, the number of
CSF2RB1+ ependymal cells/radial glia/tanycytes in the central canal region is significantly
increased compared to sham-operated and naïve mice of both strains. The present study
demonstrated co-localization of CSF2RB1 in ependymal cells/radial glia/tanycytes in wild-type
mice of the C3H/HeN strain, which extended into the grey matter of the spinal cord and reached

156
the pial surface. However, our data failed to show an increase in the number of these cells
(immunolabelled with CSF2RB1) in denervated MHS mice compared to sham-operated wild-
type mice. These data suggest that, compared to autotomy-resistant B mice, both A and
C3H/HeN autotomy-susceptible strains have longer processes of CSF2RB1-expressing
ependymal cells/radial glia/tanycytes which may play role in the modulation of pain in these
strains.
5.3.5 pStat3 expression in the spinal cord of A vs. B mice
In the present study we determined the expression of phosphorylated Stat3 (pStat3) in the spinal
dorsal horn by immunohistochemical analysis and correlated it with the levels of neuropathic
pain behaviour. The activated form of the protein, pStat3, was expressed in the spinal dorsal
horn following hindpaw denervation demonstrated by a higher number of labelled cells in
denervated A mice, which are genetically susceptible to express autotomy, compared to B mice
that are genetically resistant to express this behaviour following the same denervation procedure.
Similar low numbers of pStat3-labelled cells were evident after sham-operation in the A strain.
These results suggest that Stat3 signalling in the spinal cord is correlated with autotomy
behaviour.
To understand better which cell types are responsible for the change in expression of pStat3 in
the spinal dorsal horn after denervation and during autotomy we labelled the cells with the
astrocyte marker GFAP or with a neuronal nucleus marker NeuN, testing whether they co-
localize with pStat3 in the same cells, based on previous knowledge that astrocytes and neurons
originally differentiated from ependymal cells/radial glia/tanycytes (Barnabé-Heider et al.,
2010). Our hypothesis was that CSF2RB1+ spinal central canal ependymal cells/radial
glia/tanycytes that have a long process into the spinal dorsal horn, become activated after
peripheral injury by a signal that is still unknown. When activated they sensitize pain pathways
in the dorsal horn that in turn, produce a spontaneous nociceptive message to the brain where
spontaneous pain is perceived, motivating the animal to express autotomy in A and C3H/HeN
mice. Also possible is that ependymal cells/radial glia/tanycytes in their known capacity as stem
cells would multiple and differentiate into astrocytes and/or neurons, which would in an
unknown way contribute to pain behaviour. Either way, be it via neoneurogenesis and/or
neoastrogliogenesis, or hypertrophy of processes in existing ependymal cells/radial

157
glia/tanycytes, our data are compatible with CSF2RB1 in these cells as a necessary component
that activates in these cells perhaps via Jak/Stat3 the signalling that triggers transcription of pain
genes to maintain the state of chronic pain. However, in contrast to the ‘stem cell hypothesis’,
pStat3 did not co-localize with astrocytes, and only co-expressed in a few neurons. It is possible
that these signalling events may occur in microglia, which expresses pStat3 in mice strains
studied in our experiments. These events may be mediated by increased CSF2RB1 levels in
these glia activating Jak and triggering transcription and synthesis of inflammatory mediators of
pain maintenance. However, we did not co-localize CSF2RB1 with the microglial marker OX-
42 in the spinal cord. Interestingly, other investigators were able to show co-localization of the 2
proteins in cell cultures and in brain tissue (Parajuli et al., 2012).
Further experiments are needed to validate and extend our findings in the spinal dorsal horn with
additional markers for microglia, such as Iba-1, Integrin alpha M (ITGAM), and F4/80, which
are used interchangeably in similar studies. These antibodies may or may not show different
results in co-expression with pStat3 presented here.
5.3.6 Proposed mechanism for pStat3 and CSF2RB1 in the spinal
cord
Jak/Stat3 signalling may be triggered through binding of any of the 3 ligands (IL-3, IL-5 and
GM-CSF) of CSF2RB1 in the spinal dorsal horn. In addition to the Jak/Stat3 pathway that is
likely initiated by CSF2RB1 in DRG neurons (as introduced above in Section 5.1.7 ‘pStat3’),
other Stat pathways are known to be initiated by CSF2RB1, including Stat1, Stat3, Stat5 and
Stat6, which depend on Jaks or Src kinases and the cell type in which signalling is initiated
(Reddy et al., 2000). Both Jak and Src kinase have a role in phosphorylating, and thereby,
activating Stats as well as other proteins intracellulary, such as the intracellular domain of
CSF2RB1, which is phosphorylated by Jak2. Once activated, pStats enter the nucleus and
initiate transcription of several genes. In BaF3 cells, CSF2RB1 activates the transcription of c-
Fos, c-Jun and c-Myc (Itoh et al., 1996; Watanabe et al., 1995) (Scheme 6), which are
immediate-early genes that have a known role in initiating pain mechanisms (Munglani and
Hunt, 1995). Other genes include Trpv1, Scn10a, Kcnd2 and Kcnk2, which are transcribed via
CSF2RB1/Jak/Stat3 signalling in nociceptive DRG neurons associated with bone cancer pain
158
and most likely in other chronic pain syndromes as well (Stösser et al., 2011). We can speculate
from these previous reports that CSF2RB1/Jak/Stat3 in the dorsal horn may be activated in (i)
post-synaptic cells that express c-Fos and c-Jun 14 days after SNL (Munglani and Hunt, 1995),
similar to our Neuroma model, in which mice were evaluated for protein expression on day 14
post- hindpaw denervation, or (ii) microglia which express pStat3 correlated with neuropathic
pain following peripheral nerve insults. These 2 scenarios are discussed in greater detail in
Chapter 6.
5.3.7 Hippocampal pStat3 expression is associated with autotomy
In Chapter 4 of this thesis report, we showed that the expression of CSF2RB1 in the
hippocampal dentate gyrus is associated with autotomy behaviour. The pStat3 labelled round
cells did not react with NeuN (a label of neurons) nor with astroglial marker GFAP. Additional
experiments are needed to confirm if pStat3+ cells are microglial or ependymal. Here we show
that pStat3+ cells, which numbers correlate autotomy behaviour, appear in similar morphologies
and localization in the dentate gyrus as are the CSF2RB1+ cells in that region. It is possible that
the same cells are labelled for both CSF2RB1 and pStat3 in the hippocampal dentate gyrus, and
that these two molecules operate in the same cellular pathway, but we did not carry out this
experiment as of yet.
In contrast to the findings with CSF2RB1, where we showed a bilateral equal increased
expression in the dentate gyrus, hypothalamic peri-ventricular and arcuate nuclei of MHS mice,
pStat3 expression was more dominant in one hemisphere compared to the other and correlated
with autotomy. This side difference did not correlate with sham- or hind paw denervation
operation. Whether this unilateral increased signal of pStat3 in the dentate gyri is correlated with
chronic neuropathic pain needs more research. There are many connections between the 2 brain
hemispheres by way of the corpus callosum, commissures, and decussations at every level below
the brain down to the spinal cord or brainstem nuclei, which makes isolation between the 2 sides
of the CNS almost impossible. Therefore, pain pathways may be interconnected between the
two sides of the CNS and expression levels of pain genes and proteins should be analyzed
carefully.

159
Studies have shown a hemispheric dominance in levels of gene and protein expression after
ipsilateral injuries to the nerve or CNS that are compatible with known anatomical decussations.
For example, when compared to sham-operated animals, the CCI or SNI nerve injuries in the rat
were accompanied by an over-expression of cytokines that have a role in pain behaviour, such as
IL-1β and IL-6, in the dentate gyri bilaterally, more prominently on the contralateral side (del
Rey et al., 2011). Another group of investigators showed in the rat that transient forebrain
ischemia (which sometimes leads to brain injury) caused an increased expression of Stat3 and
pStat3 in nuclei of the dentate hilar region starting from day 1 to day 14 post-treatment (Choi et
al., 2003). Shortly after hypoxic/ischemic brain injuries (24–48 h), pStat3 is only observed in the
ipsilateral side (mainly in the hippocampal fissure and corpus callosum) of mice, while
inflammatory mediators such as IL-6, IL-1β and TNFα were highly expressed in the ipsilateral
hemisphere up to 7 days post-injury (Shrivastava et al., 2013). No expression in these cytokines
was detected at 14 days post-injury in these mice. Shrivastava et al. (2013) co-localized pStat3+
nuclei in a small subpopulation of reactive astrocytes and microglia in the ipsilateral hemisphere
up to 7 days post-injury, specifically in the Cornu Ammonis 1 (CA1) and hippocampal fissure
regions. This study suggests that pStat3 may be an important facilitator of pro-inflammatory
production soon after injury and may mediate the proliferation and activation of glial cells in the
hippocampus. Once glial cells are activated, they may carry on different cellular signalling
events independent of pStat3. However, since we detected our pStat3 in cells 14 days post-
injury, we suggest that pStat3 in the hippocampus has a significant role in maintaining pain at 14
days following hindpaw denervation.
pStat3 in the above studies was localized in astrocytes (Choi et al., 2003; Shrivastava et al.,
2013), unlike our results, which did not co-localize pStat3 with GFAP (a marker of astrocytes).
The discrepancy may be due to the different type of nerve injury or strain of mice. Because we
did not carry out co-localization experiments of pStat3 with OX-42 or Vimentin, which label
microglia or ependymal cells, respectively, we suggest that pStat3 molecule could be localized to
one of these cell types within the dentate gyrus in mice of the Neuroma model.
160
5.4 Conclusions
In the present study we showed that the gene Tlr4 and the transcription factor, pStat3, are
associated with spontaneous neuropathic pain in the Neuroma mouse Model. Autotomy
behaviour was more profound in the TLR4 wild-type mice, showing increased levels of spinal
Csf2rb1 mRNA following hindpaw denervation, compared to the TLR4-mutant mice which had
delayed autotomy and an unchanged spinal Csf2rb1 gene expression level following the same
denervation. pStat3 immunoreactivity was detected in the spinal dorsal horn of mice and
correlated with autotomy behaviour in the ipsilateral side, and in the hippocampal dentate gyrus,
correlating with autotomy. pStat3 was also evident in the brain ventricles, but was lacking
around the spinal central canal. More studies are needed to determine the exact mechanisms of
TLR4 and pStat3 in the spinal cord and brain to bring about spontaneous neuropathic pain.

161
Chapter 6
General Discussion and Conclusions
The main results presented in this dissertation identified candidate genes for spontaneous
neuropathic pain in the mouse following peripheral nerve injury using expression profiling of the
whole genome as well as in the region of Pain1, a quantitative trait locus on mouse chromosome
15 known to harbour such gene(s). We used genome-wide expression arrays to identify genes in
DRGs and spinal cord, the expression of which is changed by hindpaw denervation and the new
levels of the protein regulate autotomy behaviour. Whole genome expression studies have been
used extensively in many rodent models of neuropathic pain, in order to identify such genes and
the molecular and physio-pathological mechanisms that they encode, which drive the animal to
express genetically associated neuropathic pain levels.
Most of these rodent models used stimulus-evoked pain behaviour, testing the partially
denervated limbs mainly for allodynia and hyperalgesia in the still partially innervated receptive
fields of the injured nerves, but none has done it as of yet for spontaneous neuropathic pain
behaviour which is the symptom most bothering pain patients and for which identified genes
would be treatment targets (Coyle, 2007; Kim et al., 2009b; Ko et al., 2002; Kõks et al., 2008;
Lacroix-Fralish et al., 2006; Nesic et al., 2005; Rodriguez Parkitna et al., 2006; Sun et al., 2002;
Valder et al., 2003; Wang et al., 2002a). This dissertation reports on experiments that have used
the Neuroma model in the mouse to focus on the identification of candidate genes controlling
spontaneous pain levels, because this model mimics well the genetic and neuropathological
events that are believed to occur in humans who suffered limb amputation and develop
spontaneous post-amputation chronic pain, or in patients who had post-surgical pain (anesthesia
dolorosa).
6.1 Mechanisms involving the Colony-Stimulating Factor 2
Receptor Beta 1, CSF2RB1
Using the non-biased approach of whole-genome expression profiling in inbred lines of
mice with known contrasting spontaneous neuropathic pain behaviour following an
identical nerve injury, we identified in the mouse spinal cord Csf2rb1 as a candidate gene
162
associated with this behaviour and having a major correlation with this trait’s variance.
In the following sections we discuss the literature about Csf2rb1 and its ligands in the
intact nervous system and in response to neural insults, as well as the mechanisms
involved.
6.1.1 The GM-CSF cytokine and its receptors in the nervous
system
GM-CSF has been linked in the literature to many pain mechanisms following nerve injury, by
way of their effect as glial activators (Duport and Garthwaite, 2005; Giulian and Ingeman, 1988;
Hutter et al., 2010; Lin and Levison, 2009; Maresz et al., 2005; Mukaino et al., 2010; Nakajima
et al., 2006; Quan et al., 2009; Sheikh et al., 2009; Suzuki et al., 2008; Volmar et al., 2008) and
causing neuronal excitation (Schweizerhof et al., 2009). GM-CSF has also been implicated in
several human neurological disorders and animal models of disease, such as Alzheimer disease
(Danielyan et al., 2010; Tarkowski et al., 2001; Volmar et al., 2008), bone cancer pain
(Schweizerhof et al., 2009), in the EAE model (an inflammatory demyelinating disease similar to
multiple sclerosis) (Kroenke et al., 2010), Hypoxia-ischemia (Clarkson et al. 2007), malignant
gliomas (Rafat et al., 2010), and x-adreno-leuko-dystrophy, a neurodegenerative disease (Ferrer
et al., 2010). Receptors for GM-CSF (i.e., Csf2ra and Csf2rb1, and -2, where -1 is also known as
Il3rβ and Il5rβ) have also been implicated in many neurological and pain syndromes, such as
bone cancer pain (Csf2ra; Schweizerhof et al. 2009), bipolar disorder (Csf2rb1; Moskvina et al.
2009), depression (Csf2rb1; Chen et al. 2011), diabetes mellitus (Il3rβ; Loesch et al. 2010),
malaria (Csf2rb1; Medana et al. 2009), and Schizophrenia (Csf2rb1; Carter 2009; Moskvina et
al. 2009; Chen et al. 2011). Thus, not surprisingly, GM-CSF and its receptors may be involved
in cellular mechanisms in the nervous system related to impaired cell production, activation,
function and eventually apoptosis and cell death.
Under normal conditions, GM-CSF is expressed in numerous cell types, including monocytes,
macrophages, fibroblasts and endothelial cells, in addition to T-cells (Fleetwood et al., 2005;
Franzen et al., 2004; Hamilton, 2002, 2008; Whetton and Dexter, 1989). In the nervous system,
GM-CSF is mostly produced and released from astrocytes, in addition to other cells, namely
endothelial cells (reviewed by Franzen et al. 2004), and pericytes (co-localized with IL-1β and

163
IL-6; Fabry et al. 1993), whereby it crosses the blood-brain barrier as well as the blood-spinal
cord barrier (McLay et al., 1997). Scheme 3 illustrates a model of the cell types in body tissues
in the periphery expressing GM-CSF and its receptors in the intact peripheral and central nervous
system. CSF2RB1 is involved in peripheral mechanisms of pain (Schweizerhof et al., 2009;
Stösser et al., 2011). However, the focus of this dissertation is on CSF2RB1 in the CNS,
correlating with our findings that CSF2RB1 in the spinal cord and brain are associated with
autotomy behaviour. Therefore, detail is given foremost to mechanisms in the spinal cord.
Scheme 4 summarizes major events that occur following peripheral nerve injury, which involve
GM-CSF and CSF2RB1. Following peripheral nerve injury (PNI in the Scheme), GM-CSF is
secreted from injured nerves (Mirski et al., 2003), terminating in the spinal or trigeminal dorsal
horn, and is responsible for the excessive multiplication, hypertrophy and activation of microglia
and astroglia in the CNS (Fleetwood et al., 2005; Franzen et al., 2004; Mirski et al., 2003). GM-
CSF, IL-3 and IL-5 get secreted from hematopoietic cells that pass through the blood-brain
barrier (Schäbitz et al., 2008), and these participate in activating CSF2RB1-expressing cells in
the spinal cord, microglia, astrocytes, nociceptive terminals at their central synapses and second
and third order neurons in the dorsal horn, as well as on inhibitory interneurons. Multiple
intracellular signalling pathways in these cell types are triggered upon CSF2RB1 ligand binding.
These include: (i) the Jak/Stat pathway, (ii) the MAP kinase pathway, and (iii) the PI3 kinase
pathway (Hamilton, 2008; Kaushansky, 2006). These pathways lead to the transcription of
messengers of certain genes and protein synthesis including mediators of inflammation,
neurotrophins, ion channels, etc. In glia, these pathways release cytokines and chemokines that
contribute to membrane excitability of neurons nearby. GM-CSF is considered a critical
mediator in the development of chronic inflammation (Reddy et al., 2009), and also regulates the
composition of the glial scar after injury to the CNS (Reddy et al., 2009). Up until here we
mentioned mainly GM-CSF as the ligand of CSF2RB1, however, as mentioned above, IL-3 and -
5 also utilize this receptor. This raises the question which cell type expresses these interleukins
and under which conditions are they released. To date, neither IL-3 nor IL-5 cytokines were
shown to be released by damaged nerve cells, but they do get released from immune cells in
response to infection or injury. IL-3 stimulates the production and activation of mast cells and
basophils, which are important cell regulators of the TH2 inflammatory responses (Galli et al.,
2005). The Th2-type cytokines include interleukins 4, 5, 10 and 13 (Berger, 2000). IL-5 is

164
mainly eosinophil-specific (Lopez et al., 1988) and thus linked to diseases where eosinophils are
the main cells elevated participating in pathological processes, such as some forms of asthma
(Humbert et al., 1997).
A study on cultured mouse embryonic cells and fibroblasts identified a novel TNF receptor-
associated factor 6 (TRAF6) binding domain in mediating NFκB signalling through GM-CSF
receptor (Meads et al., 2010). NFκB is activated in the mouse spinal cord following sciatic nerve
transection and is expressed in neurons on the ipsilateral side of the spinal cord 3-5 days post-
injury (Pollock et al., 2005), and in microglia and astrocytes following PNI. NFκB triggers gene
expression, including of the inflammatory mediators Il-1, Il-6, Tnfα, and monocyte chemo-
attractant protein-1 (Mcp-1), which are all implicated in pain (Qian et al., 2011; Soria-Castro et
al., 2010).

165
Scheme 3: Normal expression of GM-CSF/ IL-3/IL-5 (Rohde et al., 1994), CSF2RA and
CSF2RB1 receptor complex in the intact peripheral nervous system and spinal dorsal horn. GM-
CSF and IL-3 are normally produced by T-cells, monocytes, endothelial cells, pericytes and
mostly by astrocytes in the intact CNS (Fabry et al., 1993). IL-5 is produced by eosinophils.
Under normal conditions, when the tissues are healthy, there are only very low plasma
concentrations of GM-CSF, IL-3 and IL-5. These cytokines can cross the BSCB (Schäbitz et al.,
2008) and contribute to the activation of CSF2RB1-expressing cells in the spinal cord. Main
mechanisms initiated by the receptor complex are hematopoietic cell survival (via IP-3 kinase
activation) and apoptosis suppression (Williams et al., 1990). Increased cytokine concentrations,
such as during an inflammatory response, promote both cell survival and proliferation
(Guthridge et al., 2006).
Periphery Spinal dorsal horn
GM-CSF
R
Inhibitory interneuron
R
R
T
T
T
GM-CSFATPGlut
Microglia
RT
T
T
R
Pre-synaptic nociceptive neuron
Post-synaptic cell
Schwann cell
GM-CSF/IL-3/IL-5 receptor
Receptor ligands (GM-CSF, IL-3, IL-5)
T-cell
Monocyte
R
T
IL-3IL-5
IL-3IL-5

166
Scheme 4: A suggested model for CSF2RB1, CSF2RA and their ligands following peripheral
nerve injury (PNI) in the Neuroma Model. PNI (shown in red) induces production and release of
GM-CSF from injured sciatic nerve (necrotizing afferents) (Mirski et al., 2003) and fibroblasts in
the periphery (Be’eri et al. 1998; Ebadi et al. 1997; Franzen et al. 2004; Saadea et al. 1996), and
from astrocytes and endothelial cells (Endo) in the spinal dorsal horn (Franzen et al., 2004), to
promote a local inflammatory response. GM-CSF promotes myelin, axonal and neuronal debris
clearance by macrophages in the periphery and microglia in the spinal cord. GM-CSF in the
spinal cord increases microglial activation, thereby releasing neuroinflammatory mediators that
increase and membrane excitability of primary afferent terminals, projected post-synaptic
neurons in the spinal dorsal horn and local interneurons. IL-1β released from microglia/pericytes
and IL-6 released from pericytes contributes to neuronal hyperexcitablity of post-synaptic cells.
Upon the binding of GM-CSF to its receptor on nociceptive afferents, the Jak/Stat pathway is
activated and gene expression of ion channels, such as Trpv1, Scn10a, Kcnd2 and Kcnk2 (not
shown) (Stösser et al., 2011) is promoted which facilitates excitability of the post-synaptic cell.
The increase in neuronal hyperexcitability facilitates by ascending pain pathways to the
perception of pain (autotomy) in the brain. Invading monocytes (Inv Mono) also respond to
GM-CSF by binding to its receptor, which leads to autoimmune inflammation.
macrophage
Nerve injury
Debris clearance
Periphery Spinal dorsal horn
Autotomy PainInhibitory interneuron
IL-1β
GM-CSFAstrocyte
Asc
en
din
g p
ain
p
ath
way
s
Neuronal hyperexcitability
GM-CSF/IL-3/IL-5 receptor Receptor ligands (GM-CSF, IL-3, IL-5)T-cellMonocyte
R
T
GM-CSF
R
T
T
T
R
Microglia
R
R
Microglia
R
GM-CSF
Jak-Stat3
Microglial activation
Nectotizing afferentsNecrotizing interneuronsFibroblasts
T
T
T
InvMono
R
Autotimmuneinflammation

167
6.2 CSF2RB1 is expressed in Ependymal cells/radial
glia/tanycytes in the CNS
The results of experiments carried out in Chapter 4 have identified the cells expressing
CSF2RB1 in the spinal cord central canal region as a type of glia cell known as ependymal cells,
or radial glia (Doetsch, 2003; Jacquet et al., 2009; Kirsch et al., 2008; Knabe et al., 2005). On
this basis, we propose that these cells are one of the cellular players in CNS pain mechanisms
that correlate spontaneous pain manifested by autotomy behaviour in some denervated A strain
mice. Our results also showed that glia cells in select brain regions, including the hippocampal
dentate gyrus, the peri-ventricular nucleus and arcuate nucleus of the hypothalamus, and some
glia cells located in the pial surface of the spinal cord and brain, and dorsal columns, also express
CSF2RB1. Many of the latter cells share the same cellular morphological appearance as those of
the spinal central canal radial glia cells, i.e., having a bipolar thin spindle shaped elongated soma,
with one short process extending to spaces containing cerebro-spinal fluid (CSF) and another
very elongated process extending to the opposite direction, ranging over long distances into grey
matter nearby in regions known to process pain input such as the spinal dorsal horn,
hippocampus and hypothalamus.
Tanycytes are characterized by the presence of elongated processes that extend deeply into the
subjacent neuropil. These processes might entrap a capillary or terminate on a neuron or an
astrocyte (Tang and Sim, 1997). Both tanycytes and ependymal cells were found to have typical
physiological characteristics of glial cells: high resting membrane potential, responsiveness to
extracellular K+, and extensive dye coupling indicative of a cellular network and gap junctions.
Tanycytes and ependymal cells function as mechanical and chemical barriers in the CNS, and
protect it from potentially hazardous materials that might be in the CSF. Ependymal cells also
contain special enzymes, one of which is monoamine oxidase, which inactivates biogenic amines
including serotonin, epinephrine, norepinephrine, and dopamine. This may be important in the
context of pain mechanisms, since these amines normally function in the CNS via inhibitory and
facilitatory descending pain pathways. Thus, an increased population of ependymal cells in the
CNS, as we detected in our A mice positive for CSF2RB1, may encourage biogenic amine
inactivation, and diminish inhibitory descending action, leading to disinhibition and more pain,
and an increased drive for autotomy. This hypothesis may apply to ependymal cells located in

168
both the spinal cord and brain regions engaged in descending pain modulation, such as PAG
nucleus. Due to the morphological characteristics found in our CSF2RB1+ cells around the
central canal, we propose that these cells are ependymal cells/radial glia/tanycytes. Some
investigators suggest that these types should be universally named ependymal cells (Meletis et
al., 2008).
Results of the present study show that, while the short process of the ependymal cells line is in
the central canal lining, their very elongated process projects dorsally, or ventrally, or laterally.
The latter terminates in the neuropil around the central canal or extends into the dorsal and
ventral horns. Some of these processes make end feet on capillaries in the neuropil. Electron
microscopic analysis of the ultra-structure of the dorsal horn labelled with antibodies against
CSF2RB1 could elaborate more on the targets of these processes, because at the fluorescent light
microscopic level that we used for the present study it was impossible to follow these fine
processes further to their termination sites. Nevertheless, fine reaction product was seen
throughout the neuropil attesting to the abundance of the termination sites, literally, throughout
the grey matter, and indirectly pointing at the importance of their possible function(s) in health
and post-injury, and diseases. Although speculative, their position with “one foot in the cerebro-
spinal fluid” and one in the neuropil suggests that their function is related to passing CSF to glia
and/or neurons.
6.2.1 CSF2RB1+ ependymal cells/radial glia/tanycytes
surrounding the spinal central canal and in spinal lamina X
Previous authors have already classified the cell types located around the central canal of the
spinal cord. The technique used by investigators to catalogue types of cells in the nervous
system includes silver impregnation methods such as the Golgi stain that selectively labels only
some of the cells in neural tissues under study (but those that it does stain get labelled in their
entirety). One type of cell around the central canal, the ependymal cell, looks identical to those
we labelled in this study as CSF2RB1+ central canal cells (Scheme 5, taken from Gray 1918).
The original description associated with this cell type describes the central canal region as: “It is
filled with cerebrospinal fluid, and lined by ciliated, columnar epithelium, outside of which is an
encircling band of gelatinous substance, the substantia genlatinosa centralis. This gelatinous

169
substance consists mainly of neuroglia, but contains a few nerve cells and fibres; it is traversed
by processes from the deep ends of the columnar ciliated ependymal cells which line the central
canal (Fig. 667)” (Gray, 1918).
Scheme 5: Ependymal and neuroglial cells surrounding the central canal of the spinal cord
(Gray, 1918)
The gene expression validation experiments of Csf2rb1, described in Chapter 4, further
associated this gene with autotomy levels in some denervated A mice. Spinal cord Csf2rb1
mRNA levels linearly correlated with high autotomy scores, and follow up CSF2RB1
immunolabelling experiments that we performed, further suggested that Csf2rb1 is indeed
expressed in ependymal cells of the central canal. The central canal region of the spinal cord is
localized within lamina X, a region that used to be named substantia genlatinosa centralis,
where glia and neurons are located.
Primary afferents terminating in lamina X originate from numerous peripheral sources including
among others, unmyelinated axons of the sciatic nerve (Wang et al., 1994a). Interestingly,
within lamina X there is a bundle of primary afferent axons running rostrocaudally ventral to the
central canal, known as the ventromedial afferent bundle (VMAB) (Nadelhaft and Booth, 1984).
This is a unique bundle of afferents that express neurochemicals such as substance P and CGRP,
the nerve growth factor receptors p75 and trkA, the vanilloid receptor VR1, and the GM1
ganglioside, and binding the plant lectin IB4 (Gibson et al., 1981; Michael et al., 1997; Ramer et
al., 2001; Wang et al., 1994a). The expression of these molecules within the DRG is frequently
used to divide sensory neurons into subpopulations that minimally overlap (Snider and

170
McMahon, 1998). For example, in rodents small and thinly myelinated or unmyelinated lumbar
DRG neurons are subdivided into 40% expressing substance P and CGRP, and 30% expressing
IB4. The remaining 30% of DRG neurons are large myelinated axons, and can be labelled with
the B fragment of cholera toxin (CTB), which binds to the GM1 ganglioside. Thus the VMAB
contains all primary sensory afferent subtypes. Wall et al. identified a dense bundle of CGRP and
IB4 positive cells in VMAB at all spinal segments, but this bundle was the largest at L3-L5
(Wall et al., 2002), indicating that these cells may be primary afferents of the sciatic nerve. The
fact that some of these afferents express IB4 and others express CGRP characterizes them as the
two subpopulations of nociceptive neuron (Nagy and Hunt, 1982; Silverman and Kruger, 1990),
and their termination in the VMAB proposed this area as another area in the spinal cord that
receives and processes pain information from the peripheral target, such as the hindpaw. This is
important because the ependymal cells that we found to associate with autotomy in this region
may crosstalk with these nociceptors as glia do in the dorsal horn, thereby provoking the
ascending neurons in this region to transmit pain information into the brain.
Although traditionally lamina X has not been defined as a primary pain input processing area
per se, numerous reports have suggested that second and third order lamina X neurons may be
engaged in processing nociceptive inputs, harbouring molecules, including peptides such as
substance P, cholecystokinin, metenkephalin, neurophysin, oxytocin, adrenocorticotrophic
hormone, thyroid-releasing hormone, and vasoactive intestinal peptide, which were also found in
lamina X with similar concentrations to those found in laminae I and II (Honda and Lee, 1985;
Matsushita, 1998; Nicholas et al., 1999; Phelan and Newton, 2000), receptors such as for NK1,
NK2, opioids, substance P, and galanin and neurotransmitters including GABA and glycine
(Matsushita, 1998), glutamate (Phelan and Newton, 2000), acetyl choline (Phelan and Newton,
2000), and 5HT (Honda and Lee, 1985) all known to be related directly or indirectly with pain.
Axons originating in lamina X neurons ascend to higher brain centres that process pain-related
inputs (Menétrey et al., 1982; Nahin et al., 1983; Wall et al., 2002). Some neurons in this region
have a small receptive field whereas that of others is very large encompassing a whole
dermatome and a few having an even much larger field, suggesting that neurons in Rexed’s
Lamina X may have a generalized integrative function, which is still poorly understood (Honda
and Lee, 1985; Honda and Perl, 1985; Nahin et al., 1983; Ness and Gebhart, 1987; Wall et al.,

171
2002). Since many of the afferents terminating in this region harbour properties that are
compatible with them being nociceptive afferents, and axons originating from this area ascend to
higher pain-related brain centres, it is possible that pre- and post-synaptic cells in lamina X are
critical for pain perception. CSF2RB1+ ependymal cells/radial glia/tanycytes may associate with
the excitability of second order neurons in Lamina X. Since ependymal cells/radial
glia/tanycytes are known to be in contact with the CSF in the central canal (LaMotte, 1987), we
speculate that their possible role in the autotomy contrast between some denervated A and all
denervated B mice may be related to this as of yet unknown function. More work is needed to
elucidate this hypothesis.
Evidence for GM-CSF and IL-3 originating from fibroblasts, endothelial cells, T-cells,
pericytes, microglia and astrocytes following peripheral nerve injury have been discussed above
in section 6.1.1. It may be that some or all of these cells release inflammatory cytokines
responsible to activate CSF2RB1 in ependymal cells/radial glia/tanycytes. Regardless of their
source, however, since our findings indicate that denervated A mice have significantly more
ependymal cells/radial glia/tanycytes extending laterally into the grey matter than denervated B
mice, but not more cells that extend dorsally or ventrally into the white matter, they may carry
different functions depending on the direction to which they extend. Several studies have
described intense proliferation of ependymal precursors during embryonic development or
induced by an external stimulus, such as spinal cord compression or physical activity (Cizkova et
al., 2009; Sevc et al., 2009, 2011), which occurs not in the dorso-ventral poles but rather in the
dorso-lateral walls (Sevc et al., 2009). This may be important in that the processes that extend
dorso-laterally, toward laminae I and II of the spinal cord may serve as ‘ladders’ for CSF2RB1+
ependymal cells/radial glia/tanycytes that differentiate following hind paw denervation into
astrocytes, neurons and oligodendrocytes, where they can contribute in the mechanisms of pain.
This model suggests the same role that radial glia have in the developing brain and spinal cord,
where they serve as “ladders” to enable other primordial cells to crawl on them on their way to
their targets in the cortex.
It is possible that during the post-operative period, binding of GM-CSF, IL-3 and IL-5 to
CSF2RB1 receptors on ependymal cells/radial glia/tanycytes that extend laterally in A mice is
part of a mechanism associated with maintaining the hypersensitive state of CNS pain pathways,

172
resulting in some denervated A mice expressing considerably more neuropathic pain-like
behaviour than denervated B mice. It is suggested that mediators released from the injured
nerve, which terminates in the spinal cord, would activate more cells in the ipsi-lateral side,
compared to the contra-lateral side. We did not see a visible difference in the number of these
cells that extend laterally between the ipsi- and contralateral spinal cord. Further analyses are
needed to determine whether or not a significant difference is detected between the two sides,
which may assist in explaining the mechanism of these cells in pain processing.
6.2.2 Metabotropic glutamate receptor 1 alpha (mGluR1α) is
expressed in ependymal cells/radial glia/tanycytes of the spinal
central canal
Ependymal cells/radial glia/tanycytes of the central canal express metabotropic glutamate
receptor 1 alpha (mGluR1α), one of the 8 metabotropic glutamate receptors that play a role in
excitatory neurotransmission, neuronal plasticity and neurotoxicity in the CNS (Nakanishi et al.,
1994). If these cells were only playing a role in production and transport of CSF to and from the
central canal, why should they also express these receptors, unless they also play a role in
excitatory neurotransmission, and/or neuronal plasticity, and/or neurotoxicity? Thus, mGlur1α
may contribute to the excitatory responses evoked by stimulation of synaptic afferent inputs,
leading to long-term increases in synaptic efficacy (Baude et al., 1993). This may be relevant to
injury discharge which comprises a high frequency input (Cohn and Seltzer, 1991; Seltzer et al.,
1991b, 1991c). mGluR1α immunoreactivity was found in ependymal cells/radial glia/tanycytes
of the medulla oblongata and the spinal cord (Tang and Sim, 1997).
6.2.3 Endothelin B receptor is expressed in ependymal cells/radial
glia/tanycytes of the spinal central canal
The Endothelin B receptor (ETBR) immunostaining in the rat is very similar to the CSF2RB1
labelling that we observed throughout the spinal cord of mice, especially those in the central
canal region and in the white matter (Peters et al., 2003). This receptor, which localized in
ependymal cells of naïve rats (Peters et al., 2003), is involved in mediating reactive gliosis of

173
ependymal cells 1-2 weeks after brain injury in the rat (Koyama et al., 1999). This study
suggests that CSF2RB1 in this region of the spinal cord may be involved in the activation of
ependymal cells/radial glia/tanycytes after peripheral nerve injury. More importantly, ETBR has
been implicated in neuropathic pain models. ETBR is elevated in rat spinal nerves and
contributes to cold allodynia after SNL (Werner et al., 2010). Additionally, ETBRs contribute to
orofacial mechanical allodynia induced by unilateral constriction of the infraorbital nerve in rats
(Chichorro et al., 2006). Although ETBRs are thought to play a role in elevating pain levels by
operating on spinal neurons, as suggested from the above studies, it may also have a role in
increasing neuropathic pain indirectly via increased expression in central canal ependymal
cells/radial glia/tanycytes that also express CSF2RB1.
6.3 Co-localization of CSF2RB1 and the neural stem cell marker
Vimentin in the spinal cord
We proposed that CSF2RB1 is expressed by ependymal cells/radial glia/tanycytes in the
central canal region of the spinal cord based on their unique morphology as well as co-
localization of the protein marker Vimentin, which is known to be expressed by these
cells (Bodega et al., 1994; Prieto et al., 2000). However, Vimentin is also expressed by
immature astrocytes and invading fibroblastoid cells, a component of the developing scar
tissue (Conrad et al., 2005; Schwab et al., 2005), macrophages (Kim et al., 2003; Shin et
al., 2003), invading meningeal cells (Wang et al., 1997) and cells surrounding blood
vessels (Farooque et al., 1995). Indeed we co-localized CSF2RB1 and Vimentin in cells
lining blood vessel walls in the spinal cord. But the only cell type in the central canal
that looks like those expressing CSF2RB1 are ependymal cells/radial glia/tanycytes.
These cells were present in intact mice, hence they cannot be considered
“reactive/responsive” or “invading” at the constitutive stage. Thus, CSF2RB1 expressing
cells are stem cells reservoir of the spinal cord, aside from astrocytes and
oligodendrocytes (Barnabé-Heider et al., 2010). In response to spinal cord injury,
ependymal cells are known to proliferate dramatically, producing oligodendrocytes, and
more abundantly astrocytes, that migrate to the site of injury and make a substantial part
of the glial scar (Barnabé-Heider et al., 2010; Meletis et al., 2008). It has been
documented long ago and is now well established that peripheral nerve injury causes

174
degeneration of central terminals of primary afferents in the dorsal horn of the spinal cord
(Arvidsson et al., 1986). This debris may release chemicals that trigger ependymal cells
to multiply and become astrocytes. Two weeks after spinal cord injury astrocytes
constitute most of the newly formed cells followed by ependymal cells and
oligodendrocyte progenitors (Barnabé-Heider et al., 2010). By 4 months after the injury,
there is a reduction in the number of progeny of all three cell types, and at this stage the
largest number of new glial cells derived from ependymal cells followed by astrocytes
and oligodendrocytes (Barnabé-Heider et al., 2010). Of special note, ependymal cells
may also differentiate into neurons. In the EAE model of multiple sclerosis, ependymal
cells of the spinal cord seem to be restricted to their own lineages and do not proliferate
into reactive astrocytes that express GFAP (Guo et al., 2011). So it seems that the signal
for proliferation of these progenitor ependymal cells depends on the type of pathology.
We are the first to suggest the hypothesis that peripheral nerve injury is yet another such
signal that triggers the proliferation of these cells. If established by future experiments,
ependymal cells may be seen as having a role of providing the spinal cord with glia cells,
that in addition to clearing up the debris of degenerating afferents and second order
neurons in the spinal cord following peripheral nerve injury, may be associated with
sensitization of ascending pain pathways, thereby facilitating the process of development
of neuropathic pain. Additionally, by way of neo-neurogenesis, ependymal cells may
replenish the dorsal horn with the partially depleted pain suppressing interneurons that
die out by excitotoxicity and apoptosis in response to the nerve injury (see Introduction in
Chapter 1) (Dubner and Ruda, 1992; Suzuki and Dickenson, 2000; Woolf and Salter,
2000; Zimmermann, 2001).
Interestingly, Vimentin induces microglial activation in murine primary cultures and
enhances the expression of LPS-induced inflammatory genes such as Tnfα and iNos in
these cells (Jiang et al., 2012). These studies suggest that our Vimentin+/CSF2RB1+
cells in the central canal region may be associated with microglial activation and
subsequent TLR4 signalling, particularly following hind paw denervation. We showed
that these ependymal cells/radial glia/tanycytes multiplied significantly following the
denervation in both A and B mice. Indeed, CSF2RB1 (via GM-CSF) has been shown to
increase TLR4 and microglial activation ex vivo (Parajuli et al., 2012). Additionally, the

175
impairment of microglial activation in Vim-/-
mice was associated with reduced neuronal
toxicity in ischemic brains (Jiang et al., 2012). These data may suggest that our
Vimentin+/CSF2RB1+ cells detected in the central canal may also be involved with
neuronal excitotoxicity, a trigger for central sensitization and maintained pain. As there
are no indications from the literature that ependymal cells/radial glia/tanycytes play a
direct role in neuroplasticity, another interesting finding is that TLRs 2 and 7, rather than
TLR4, were found to be over expressed in ependymal cells of murine cerebellar white
matter after parasite infection (Mishra et al., 2006). This indicates a possible role of
ependymal cells/radial glia/tanycytes in inflammatory processes mediated by TLR
signalling.
6.4 The hippocampus in processing nociceptive input
A substantial body of evidence indicates that (i) the hippocampus processes pain-related inputs,
(ii) some hippocampal neurons respond exclusively to noxious stimuli, and (iii) long-term
anatomical changes occur in neurons of the hippocampal dentate gyrus following noxious
stimulation (reviewed in Liu & Chen 2009). NMDA receptor antagonist drugs administered to
the hippocampus interfered with long-term potentiation, learning, and memory in hippocampus
neurons. When applied to the spinal cord these drugs prevented similar long-term
neurophysiological changes elicited by noxious stimulation. McKenna and Melzack showed that
blocking NMDA receptors in the dentate gyrus reduced nociceptive behaviour in an animal
model of sub acute inflammatory pain, the Formalin Pain Model (McKenna and Melzack, 2001).
The experience of pain is currently perceived as the result of complex processing of nociceptive
inputs by the nervous system using three complementary approaches, including sensory-
discriminative, affective-motivational and cognitive-evaluative aspects (Melzack and Casey,
1968; Price, 1999). Thus, the experience of pain results from processing inputs in a neuro-matrix
of widely distributed and hierarchically interconnected neural networks in the brain of which the
hippocampus plays an important role (Bushnell, 2006; Melzack, 2005, 2008). The hippocampus
has been traditionally known for its role in learning and memory, affect and motivation. Thus,
involvement of the hippocampal formation in pain is connected to aspects of learning avoidance
behaviour, anchoring past painful experiences in memory, and labelling a painful event as having

176
a negative valence. Like in other senses, the experience of pain is compared against stored past
pain experiences in an attempt to seek the most adaptive response and the best behavioural
approach to cope with the stimulus. But in recent years cumulative efforts from many
laboratories have allowed a clearer dissection of the roles of the hippocampal formation in pain
processing, integrating behavioural, electrophysiological, molecular/biochemical, structural and
functional brain imaging evidence to support the role played by the hippocampal formation in the
affective/motivational aspects of pain perception (Al Amin et al., 2004; Echeverry et al., 2004;
Favaroni Mendes and Menescal-de-Oliveira, 2008; Khanna et al., 2004; Lathe, 2001; McKenna
and Melzack, 1992, 2001; Soleimannejad et al., 2006, 2007; Yamamotová et al., 2007; Zhao et
al., 2009). Melzack and Casey proposed that the limbic forebrain structures, including the
hippocampal formation, play important roles in the ‘aversive drive and affect that comprise the
motivational dimension of pain’ (Melzack and Casey, 1968). Based on our findings, we
speculate that compared to denervated mice that do not express autotomy, the increased
expression of CSF2RB1+ in the dentate gyrus of denervated A mice that express high-autotomy
suggests that these mice may experience an increased negative valence to the nociceptive inputs
arriving to the brain from neuromas, DRGs and sensitized pain pathways in the CNS, which
increases their pain experience possibly by also increasing the fear of pain that is produced by
their inability to stop and/or avoid the pain. Compared to NLS mice, the enhanced pain
experience in denervated MHS-A mice may additionally be associated with a higher volume and
frequency of ectopic activity in injured primary afferents from neuromas, DRGs and due to
increased input volume arriving to the brain via sensitized pain pathways in the CNS.
In addition, it has been shown previously in intact mice that decreased levels of hippocampal
CSF2RA and GM-CSF is associated with a reduce capacity for memory formation (Krieger et
al., 2012). Thus, high autotomy in some denervated A mice may be related to their enhanced
capacity to memorize the negative valence associated with the pain input. It has also been shown
that the number of GM-CSF immunoreactive neurons expressed in the dentate gyrus are reduced
in patients with Alzheimer’s disease who suffer from increasing memory deficits (Ridwan et al.,
2012), suggesting a role of GM-CSF signalling in memory. Thus, it may also be that those A
mice who prior to the injury had more CSF2RB1+ cells compared to other A mice, lead them to
develop a stronger impact of the pain enormity in their memory and that this is part of the
emotive drive that causes them to label the pain as more hurtful. Further research is needed to

177
explain the differences in A mice that express autotomy vs. A mice that do not express autotomy
following hindpaw denervation, trying to tag them ahead of the denervation in some way that
would predict who is at risk for expressing high levels of autotomy after nerve injury. For
example, testing levels of pain avoidance in these mice when they are still intact, before their
denervation, may indicate whether some of these mice have a negative valence to the pain
experience. Such studies could then be followed by trials of pre-emptive analgesic approaches in
mice found at high risk, also in an attempt to suppress the negative valence in these mice,
followed by hindpaw denervation.
6.4.1 Processing chronic pain inputs in the hippocampus
We have shown that CSF2RB1+ cells in the granule layer of the hippocampal dentate gyrus are
correlated with levels of autotomy behaviour in some denervated A mice. Previous studies also
suggested that the hippocampus is associated with neuropathic pain and that abnormal
hippocampal function may contribute to the sensation of chronic pain or even be causative in
producing such a sensation (for a review see Liu & Chen, 2009). Rats that had a nerve injury
and expressed neuropathic pain-like behaviour showed a bilateral hippocampal increase in the
transcription factor NFκB and this effect was mediated by activation of NMDA receptors (Chou
et al., 2011). NFκB normally facilitates the transcription of numerous inflammatory cytokines
that play a role in neuropathic pain, including Il-1β, Il-6, Tnfα and Mcp-1 (Qian et al., 2011;
Soria-Castro et al., 2010). Rats that prolonged nerve injury in the CCI and SNI neuropathic pain
models had increased levels of hippocampal cytokines and neurotrophic factors such as IL-1β,
IL-6, NGF and GDNF (Al-Amin et al., 2011), enhanced regulation of hippocampal gene
expression of cytokines and the neurotrophin Bdnf (Duric and McCarson, 2005; Hu et al., 2010;
Uçeyler et al., 2008), and impaired neoneurogenesis in the hippocampus (Duric and McCarson,
2006; Terada et al., 2008). Del Rey et al. showed that sustaining a nerve injury in the SNI and
CCI models caused an up-regulation of hippocampal IL-1β, which was closely correlated with
the level of mechanical allodynia in both Sprague Dawley and Wistar Kyoto rat strains (del Rey
et al., 2011). In vivo and in vitro LTP induction in the hippocampus resulted in a long lasting
increase of IL-1β and IL-6 expression (Balschun et al., 2004; Schneider et al., 1998).
Furthermore, blockage of IL-1 signalling impaired the maintenance of LTP (Schneider et al.,
1998), while blockage of endogenous IL-6 prolonged it (Balschun et al., 2004). It is noteworthy

178
that decreased levels of hippocampal GM-CSF did not alter stimulus-evoked pain behaviour in
control mice, as observed by paw withdrawal latencies in the Hargreaves test (Krieger et al.,
2012), indicating that signalling via GM-CSF and its receptors may be modified following nerve
injury, thereby taking part in neuropathic pain behaviour. Since CSF2RB1 promotes NFκB
activation (Meads et al., 2010), we propose the hypothesis that neuropathic pain as induced in the
Neuroma Model may be related to the activation of the CSF2RB1/NFκB signalling pathway in
the hippocampal dentate gyrus. NFκB activation in CSF2RB1+ dentate cells may lead to the
transcription and release of inflammatory mediators, such as Il-1β, and Tnfα, associated with
pain in the dentate gyrus of A mice. Future functional experiments with CSF2RB1are needed to
attest these hypotheses.
6.5 Which cell types express CSF2RB1 in the hippocampus?
Unlike the spinal cord, where CSF2RB1 was co-expressed with Vimentin in cells of the central
canal, we were unable to co-localize this receptor with Vimentin+ glia cells in the dentate gyrus,
nor with neurons or other glia. Only a few Vimentin+ cells at the boundaries of polymorph and
granule dentate layers were co-localized with CSF2RB1. Since the hippocampus is one of the
brain sites for neoneurogenesis, yet as Vimentin did not labels most of the CSF2RB1 cells, it is
possible that in the hippocampus CSF2RB1 cells express Nestin, another neural stem/progenitor-
associated marker, rather than Vimentin (Busch et al., 2010; Mothe and Tator, 2005; White et al.,
2010) (see below). As we reported in Chapter 4, CSF2RB1 cells in denervated MHS-A mice
multiplied in numbers, attesting to their capacity for glioneogenesis. While not studied in detail,
we did not detect a strong increase in the numbers of NeuN, GFAP and OX42 labelled cells, this
may point at the fact that the increase in CSF2RB1 cells was not accompanied by a similar
increase in the number of neurons, astrocytes or microglia in the dentate gyrus. Maybe lacking
Vimentin signifies that their capacity to multiply is only limited to becoming their kind (i.e.,
CSF2RB1 cells). Thus, maybe brain CSF2RB1 cells do not function as a reservoir for the de
novo production of neurons and other types of glia but only have a selective glioneogenetic
capacity to multiply specifically CSF2RB1 cells. This should be tested in future research.
In vivo intra-peritoneal administration of 200 ng GM-CSF to BALB/c, C57BL, and C3H/HeJ
promotes increased production of granulocytes and macrophages (Metcalf et al., 1987), and

179
CSF2RB1 is involved in proliferation and differentiation of granulocyte-macrophage progenitors
(Brown et al., 2012). Similar mechanisms may be involved in the CNS with the function of
CSF2RB1 in differentiation of neural stem cells into other cell types. In embryonic and adult
brain, radial glial and some astroglia are neural stem cell-like and generate neurons and glial
cells (Doetsch, 2003). Once they differentiate into a new cell type, such as astrocytes, CSF2RB1
expression may activate the new cells and initiate the process of inflammation. We suggest that
neurons, astrocytes and ependymal cells in the dentate gyrus of autotomizing A mice may
differentiate from CSF2RB1+ neural stem cells, and once differentiated may contribute to the
role of pain in these mice.
CSF2RB1 operates in tandem with another subunit of the ‘common receptor’ – CSF2RA.
Indeed, other investigators showed that CSF2RA1 is expressed in the sub granular zone of the
dentate gyrus and in cells, which send elongated processes into the granular cell layer that
resemble migrating neural stem cells (Krüger et al., 2007). Moreover, hippocampal adult neural
stem cells in culture that are CSF2RA+ co-localized with Nestin; the Csf2ra gene was expressed
in neural stem cells from the hippocampus and the sub ventricular zone (Krüger et al., 2007). In
another study, the dendritic layer in the hippocampus showed weak to moderate CSF2RA
staining in neurons (Ridwan et al., 2012). Unlike healthy humans, Alzheimer patients’ granule
cells of the dentate gyrus were only slightly labelled with CSF2RA and GM-CSF (Ridwan et al.,
2012). In the mouse, in situ hybridization to Csf2rb2 showed a robust labelling in many neurons
in the granule layer. We did not localize CSF2RB1 in neurons, since none of the neurons
labelled by NeuN showed co-localization of CSF2RB1 (Dahlberg et al., 2003). This would
suggest that the GM-CSF receptors do not co-localize to the same cells, each relaying a specific
effect to its own cell type, glial (in the case of CSF2RB1) and neuronal (in the case of CSF2RA).
Interestingly GM-CSF and CSF2RA were also very faintly detectable in astrocytes, ependymal
cells and cells of the choroid plexus of all brain regions of Alzheimer patients (Ridwan et al.,
2012).
Although we have not localized CSF2RB1 to microglia in areas of the CNS, namely spinal cord
and brain, previous reports have demonstrated the expression of CSF2RA in brain-derived
microglia (Parajuli et al., 2012). According to Parajuli et al. (2012), both Csf2ra and Csf2rb1
gene transcripts are strongly expressed in brain-derived microglia, however their expression is

180
much weaker in astrocytes and neurons isolated from brain. Parajuli et al. located CSF2RA, but
not CSF2RB1, to microglia by immunohistochemical staining, but not to isolated astrocytes or
cortical neurons. The fact that Parajuli et al. could label CSF2RA in microglia, but neither they
nor we could label CSF2RB1 in these cells, may suggest that the receptor complex CSF2RA/B1
is expressed on microglia, but suggests that the binding properties of immunolabelled antibodies
to the receptor β subunit may be disrupted when it is bound to the cell surface in microglia.
The granulocyte colony-stimulating factor (G-CSF), another hematopoietic growth factor with a
high analogy to GM-CSF, promotes the differentiation of neural precursors in adult brain and is
a part of the regeneration of the brain after insults (Kirsch et al., 2008). In adult Wistar rats, the
receptor for G-CSF is expressed in many brain areas, as well as in the walls of blood vessels,
muscles and their respective precursors, and neurons (Kirsch et al., 2008). The expression of the
G-CSF receptor in the developing CNS was most prominent in ependymal cells/radial
glia/tanycytes, co-expressed with the stem cell marker Nestin (Kirsch et al., 2008). The results
of Kirsh et al. may be relevant to us if CSF2RB1+ cells in the brain (that failed to co-localize
with Vimentin) would in fact be found to co-localize with Nestin.
Taken together, these results show that CSF2RB1 is present in the dentate gyrus, and is
correlated with denervation, as seen in the increased number of cells in the polymorph layer, and
with autotomy behaviour, as seen in the increased number of processes in the granule layer.
6.6 The involvement of CSF2RB1 in neuroprotection
6.6.1 Cytoprotection involves CSF2RB1 operating in a complex
with the erythropoietin receptor (EpoR)
While our findings associate autotomy levels with Csf2rb1 gene expression levels in the spinal
cord and the presence of CSF2RB1 protein in ependymal cells/radial glia/tanycytes of the central
canal, other glia in the dorsal columns and white matter of the spinal cord, glia in the
hippocampal dentate gyrus and hypothalamic peri-ventricular and arcuate nuclei, the mechanism
by which these cells produce neuropathic pain remains unknown.

181
It is possible that CSF2RB1 may have pleiotropic effects in various parts of the nervous system,
not all of which have a role in chronic pain or if having roles in chronic pain – not necessarily
having the same role or even the same direction. It is not impossible to have a gene product
playing an antinociceptive role in one location of the pain pathway and the opposite direction in
another location. For example, it has been reported that CSF2RB1 is involved in a cytoprotective
mechanism by interacting with erythropoietin (Epo). Epo binds to a heterodimeric receptor
consisting of the Epo receptor (EpoR) and CSF2RB1 (i.e., IL-3Rβ) (Blake et al., 2002; Jubinsky
et al., 1997; Leist et al., 2004).
EpoR and IL-3Rβ also co-localize in neurons of the spinal cord where they play a
neuroprotective role in the mouse (Brines et al., 2004). Numerous other studies have shown the
localization of EpoR (i.e., without IL-3Rβ) in spinal cord neurons (Yoo et al., 2009), in
specifically GABAergic neurons (Won et al., 2007), and in neural progenitor cells ( Wang et al.
2010), as well as oligodendrocyte progenitor cells (Cho et al., 2012), and radial glia cells that
transform into astrocytes (Knabe et al., 2005). In these studies EpoR has an activating effect on
cell differentiation and growth both in neonates and in adults recovering from nerve injury. In a
rat model of spinal cord injury IL-3Rβ expression (regardless of the presence of EpoR) is
increased in neurons near the injury site compared with uninjured animals (King et al., 2007).
While an injured spinal cord is not like a spinal cord responding to peripheral nerve injury, there
are some similarities, because after peripheral nerve injury primary afferents and second order
neurons degenerate in the spinal cord, which triggers gliosis to clear the debris. While in our
experiments CSF2RB1 was not expressed in neurons, it is possible that ependymal glia and the
other glia that expressed CSF2RB1 also expressed EpoR. In this case, such glia could function
in cytoprotection. However, having more CSF2RB1 was associated in out experiments with
increased autotomy, a behaviour unrelated to cytoprotection but to the opposite effect - of
excitotoxicity and apoptosis in the spinal cord after nerve injury that results in disinhibition of
pain pathways. Thus, we do not believe that cytoprotection is a mechanism related to the effect
of CSF2RB1 in our phenotype. The spinal cord central canal CSF2RB1+ ependymal cells we
co-labelled with Vimentin increased in number after the nerve injury. They may also express
EpoR, and these two receptors may act in these cells together to promote cell proliferation and
differentiation.

182
6.6.2 The neuroprotective cytokine erythropoietin is a ligand for
CSF2RB1
The cytokine Epo exerts generalized protective and trophic properties that have been
demonstrated in various tissues, including neural tissue (Bernaudin et al., 1999; Brines et al.,
2000; Grasso et al., 2009; King et al., 2007; Liao et al., 2008). When peripherally administered,
Epo can cross the blood-brain barrier, and stimulates neoneurogenesis, neuronal differentiation,
and activates brain neurotrophic, anti-apoptotic, anti-oxidant and anti-inflammatory signalling.
These mechanisms trigger tissue protective effects in disorders of the nervous system. Epo is
neuroprotective in several disorders, including stroke (for review see Hasselblatt et al. 2006),
peripheral nerve injury (for review see Höke & Keswani 2005), contusion or compression of the
spinal cord (Cetin et al., 2006; Gorio et al., 2002; Grasso et al., 2006; Leist et al., 2004). In some
occasions, Epo binds to the EpoR- CSF2RB1 receptor complex (EpoR- CSF2RB1) and activates
it. This complex receptor is up-regulated after tissue injury (Brines and Cerami, 2008; Brines et
al., 2004). Swartjes et al. showed that an Epo catabolite produces long-term relief of allodynia in
rats and mice following a SNI injury by activation of CSF2RB1 (Swartjes et al., 2011).
Knockout mice that lacked a functional CSF2RB1 did not recover from allodynia (Swartjes et
al., 2011). These results are not compatible with our findings in that CSF2RB1 plays in these
cited papers a protective role against neuropathic pain. We demonstrated that expression levels
of the Csf2rb1 gene and its expressed protein are correlated positively with neuropathic pain
levels, since high autotomy mice showed over expression of this gene compared to groups of
mice that did not express the behaviour. As argued in section 6.6.1, CSF2RB1 expression may
be tissue- and cell-specific, and depending on its site of expression it may undertake different
signalling pathways, leading to different cellular functions, such as neuroprotection or
neurodegeneration and pain.
6.7 CSF2RB1 operating with Receptor d’origine nantais (RON)
CSF2RB1 in the CNS can sometimes signal via the receptor d’origine nantais (RON) and its
signalling components including its ligand macrophage stimulating protein 1 (MSP). The
MSP/RON pathway is involved in several important biological processes, including
macrophage/microglial activity and morphological changes, neurite extension, cellular migration

183
and wound healing (Funakoshi and Nakamura, 2001; Suzuki et al., 2008; Tsutsui et al., 2005;
Wang et al., 1996, 2002b). RON (in human) and its murine homologue Stem-cell derived
Tyrosine Kinase (STK) is a receptor with an extracellular α-chain, that binds MSP, and a
transmembrane β-chain with intrinsic tyrosine kinase activity (Wang et al., 1994b, 1995) that
initiates intracellular signalling via other proteins and receptors, such as CSF2RB1. When RON
signals via CSF2RB1, it promotes cellular ‘morphological changes’ (Mera et al., 1999). When
CSF2RB1 signals independently (through its own ligands), it promotes pathways of
’morphological changes’ and ‘cellular growth’(Mera et al., 1999). Since CSF2RB1 is involved
in numerous biological processes, such as autoimmunity and, inflammation normal and
malignant hematopoiesis, and autoimmunity (reviewed by Hercus et al. 2013), it is possible that
some of the pathways that lead to these processes depend on RON. RON, like CSF2RB1, is
expressed in various tissue and cell types, including peripheral macrophages, DRG neurons and
glial cells (Suzuki et al., 2008). There is currently no information about whether RON is
expressed on ependymal cells. It is possible that cross-talk between RON and CSF2RB1
mediates processes of inflammation in these cells, which could ultimately lead to pain.
A few studies dedicated to MSP and RON in the CNS are available, and demonstrate the
significance of their signalling in tissues such as the spinal cord and brain. Studies showed that
both in the presence and in the absence of RON, microglial activation is enhanced, suggesting
that CSF2RB1 may be involved via cross talk with RON and independent of RON in promoting
microglial activation . In the presence of RON, microglial activation and migration are enhanced
(Suzuki et al., 2008). MSP acting on brained-derived murine microglia, induces inflammatory
cytokine production of IL-6, GM-CSF, iNOS, and to a much lesser extent IL-1β and TNFα
(Suzuki et al., 2008). In the absence of RON, microglial activation in the spinal cord is
enhanced, and the pro-inflammatory cytokines IL-1β and TNFα are up-regulated (Tsutsui et al.,
2005). Since CSF2RB1 (via GM-CSF) increases TLR4 and microglial activation ex vivo
(Parajuli et al., 2012), these studies suggest that microglial activation may be mediated by
CSF2RB1 in the spinal cord in the Neuroma model used in the present study.
In addition to the mechanisms described above which involve CSF2RB1 and TLR4 microglial
activation is that of proliferation induced by GM-CSF in microglia (Suzumura et al., 1996) . In
RON deficient KO mice, after EAE induction, there is deterioration in demyelination, axonal

184
injury and neuroinflammation, suggesting that RON signalling via CSF2RB1 is important in
these processes.
6.8 pStat3 in the spinal cord
PStat3 has been correlated with neuropathic pain, demonstrated by its expression in spinal cord
glia and certain cell types in the PNS of neuropathic pain animal models (Dominguez et al.,
2008, 2010; Dubový et al., 2010; Kohli et al., 2010; Maeda et al., 2009; Stösser et al., 2011;
Tang et al., 2012). PStat3 in astrocytes and/or microglia in the spinal dorsal horn of rodents in
neuropathic pain models enhanced the expression of Il-6, Il-1β, Tnfα, Nmdar, Ccl2 and Atf3.
Our results show that pStat3 did not co-localize with GFAP, the marker of astrocytes, even
though previous studies have shown that SNL and SNI in rats, and SCI in mice induces pStat3 in
astrocytes of the spinal cord (Herrmann et al., 2008; Tang et al., 2012; Tsuda et al., 2011). This
discrepancy with our results could be with the nature of the species and mouse model used.
Whereas SNL in the rat induces pStat3 in astrocytes and microglia (Dominguez et al., 2008;
Tang et al., 2012), the study by Dominguez et al. (2008) failed to show the expression of pStat3
in astrocytes, indicating discrepancies within the same species and model exist. In another study
by Dominguez et al. (2010), CCI in the rat induced pStat3 in microglia, but once again, failed to
show the expression of this molecule in astrocytes.
It is noteworthy that intrathecal LPS produces mechanical allodynia in the rat by activating Stat3
in spinal astrocytes, and blockade of spinal pStat3 can attenuate mechanical allodynia,
correlating with decreased astrocyte activation in the dorsal horn (Liu et al., 2013). LPS elevated
the chemokines Cxcl3cl1, Cxcl10, Cxcl5 and Ccl20 in the spinal dorsal horn, and pStat3
inhibited the levels of these chemokines, with decreased pain behaviour (Liu et al., 2013). Since
LPS is induced by TLR4, we propose that this mechanism is regulated also via TLR4,
presumable in astrocytes.
Based on previous reports we illustrate a model of CSF2RB1/pStat3 signalling in cells in the
PNS and CNS, where these proteins play role in neuropathic pain states (Scheme 6). PNI
induces the production and binding of cytokines to CSF2RB1 and initiate intracellular signalling
via Jak2, Src and PI3K, the kinases that phosphorylate and activate CSF2RB1. Jak2
phosphorylates Stat3 and pStat3 is translocated to the nucleus and initiates gene transcription. At
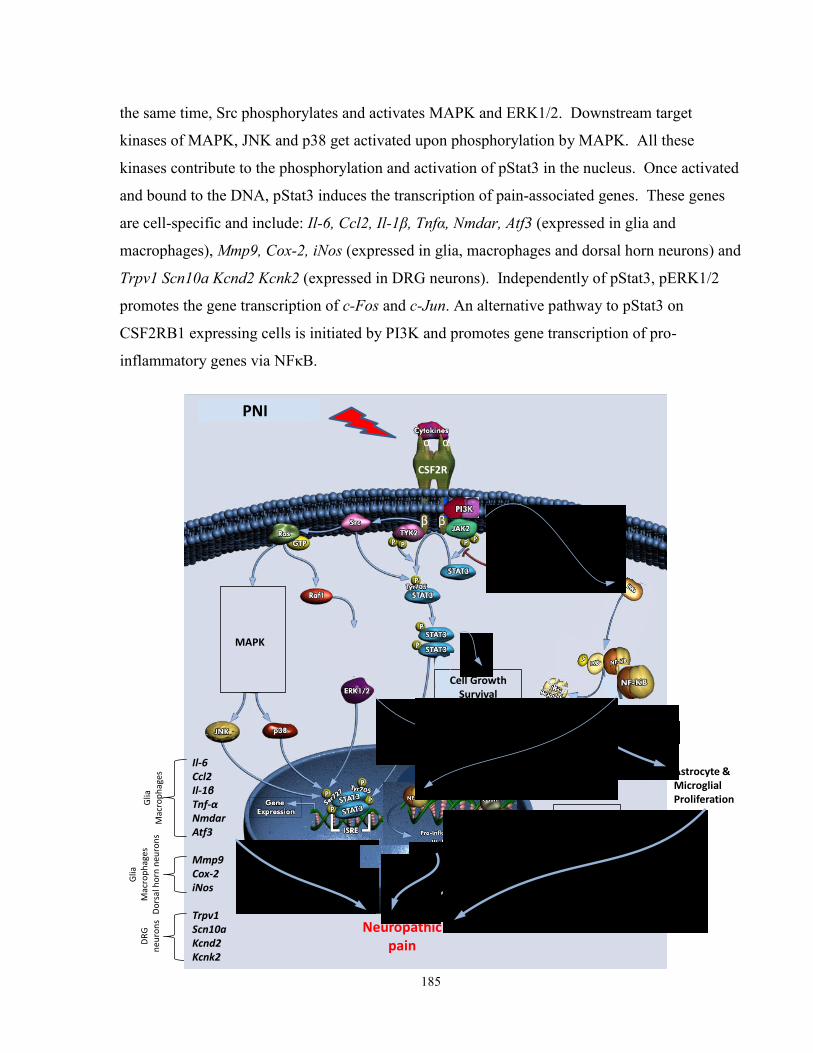
185
the same time, Src phosphorylates and activates MAPK and ERK1/2. Downstream target
kinases of MAPK, JNK and p38 get activated upon phosphorylation by MAPK. All these
kinases contribute to the phosphorylation and activation of pStat3 in the nucleus. Once activated
and bound to the DNA, pStat3 induces the transcription of pain-associated genes. These genes
are cell-specific and include: Il-6, Ccl2, Il-1β, Tnfα, Nmdar, Atf3 (expressed in glia and
macrophages), Mmp9, Cox-2, iNos (expressed in glia, macrophages and dorsal horn neurons) and
Trpv1 Scn10a Kcnd2 Kcnk2 (expressed in DRG neurons). Independently of pStat3, pERK1/2
promotes the gene transcription of c-Fos and c-Jun. An alternative pathway to pStat3 on
CSF2RB1 expressing cells is initiated by PI3K and promotes gene transcription of pro-
inflammatory genes via NFκB.
PNI
CSF2R
Astrocyte & Microglial ProliferationG
liaM
acro
ph
ages
Glia
Mac
rop
hag
esD
ors
al h
orn
neu
ron
sD
RG
neu
ron
s
Cell GrowthSurvival
Differentiation
MAPK
Il-6Ccl2Il-1βTnf-αNmdarAtf3
Mmp9Cox-2iNos
Trpv1 Scn10a Kcnd2 Kcnk2
Neuropathic pain
Gene Expression
α α
ββ

186
Scheme 6: Adapted from (Qiagen): CSF2RB1 intracellular signalling through Jak/Stat3, PI3K
and Src. As shown, upon binding of cytokines (GM-CSF, IL-3 or IL-5) to the 2α receptor
subunits on the extracellular cell surface, there are multiple pathways that lead from the cell
membrane to the nucleus via the activation of the receptor β1 subunit by Jak2, PI3K, or Src/Ras,
that continue through the protoplasm to affect cell survival (and astro- microglial proliferation)
by pStat3, or continue to the nucleus where transcription factors such as Stat3, ERK1/2 and
NFκB activate changes in gene expression. Pain-associated genes include pro-inflammatory
mediators, receptors and transcription factors (expressed in glia, macrophages and dorsal horn
neurons) and ion channels (expressed in DRG neurons), and bring about neuropathic pain by
increasing the membrane hyper excitability of neurons in the PNS and spinal cord.
6.10 pStat3 in the peripheral nervous system (PNS) contributing
to neuronal hyperexcitablility may be associated with CSF2RB1 in
A mice
Previous studies have shown the involvement of Stat3 signalling with or without CSF2RB1
activation in the PNS, and associated it with chronic neuropathic pain. Stat3 is over-expressed in
ganglionic satellite glial cells in the rat following sciatic CCI injury, and is activated by IL-6
(over-expressed in both L4-5 DRGs and satellite glial cells) binding to its receptor in these cells.
pStat activation in satellite glial cells was accompanying the ensuing allodynia and hyperalgesia
(Dubový et al., 2010). In another model, the partial sciatic nerve ligation (PSL), pStat3 is
maximally expressed in macrophages of the injured nerve at 3 hours PO, and continues to be
expressed in these cells up to day 7 PO, but is absent in sham-operated mice (Maeda et al.,
2009). Since injury in the PSL model produces neuropathic pain for 7 weeks or longer (Seltzer
et al., 1990), it is suggestive that pStat3 in the PNS is involved in the initiation of pain, rather
than its maintenance. pStat3 activity in peripheral macrophages releases inflammatory mediators
(Maeda et al., 2009) that contribute to membrane hyper-excitability of nociceptive neurons.
Additionally, pStat3 activity in nociceptive DRG neurons, mediated by CSF2RB1, promotes
membrane hyperexcitability by initiating gene transcription of ion channels and trans locating
them to the cell membrane (Stösser et al., 2011). These reports hint at the possibility of
CSF2RB1/pStat3 playing roles in initiating autotomy in A mice, and not in B mice. This is
consistent with our findings in DRG neurons where we showed a difference in constitutive levels

187
of Csf2rb1 gene in intact A mice vs. B mice, and proposed then that these transcript differences
at the time of nerve injury may be associated with injury discharge propagation into the spinal
dorsal horn in the first 24 hours or so after the denervation. Thus, depending on the cell type and
the location in the nervous system (i.e., in the periphery or the spinal cord), mechanism involving
pStat3 may carry different roles initiating or maintaining chronic neuropathic pain.
6.11 The pain-associated genes induced by pStat3 in the PNS
and CNS
In some cases, the same pain genes elicited by Jak/Stat3 following PNI, are expressed in both
peripheral and central cell types. For instance, PSL injury induces the expression of genes
promoting pain such as Mmp-9, Cox-2 and iNos, via pStat3 in macrophages of the injured sciatic
nerve (Maeda et al., 2009). However, these genes are also regulated in the spinal cord after
peripheral nerve insults. MMP-9 is constitutively expressed in spinal neurons and microglial
cells, and is immediately up-regulated after PSL injury, returning to baseline levels at day 3
(Liou et al., 2013). COX-2, while not present in dorsal root ganglion cells, exists in spinal cord
neurons, including those in the superficial dorsal horn (Willingale et al., 1997).
Immunoreactivity and mRNA levels of iNOS in dorsal horn neurons of the spinal segments L4–
L5 were up regulated in CCI animals 14 days after the surgery (Martucci et al., 2008). The
above indications from the literature suggest that pStat3 in our MHS-A mice may induce the
expression of Mmp-9, Cox-2 and iNos genes in spinal post-synaptic neurons through the
activation of immediate early genes c-Fos and c-Jun. Alternatively, pStat3 in autotomizing mice
may activate the transcription of Mmp-9, Cox-2 and iNos genes in microglial cells, already
discussed above.
6.12 pStat3 is expressed in the sub ventricular zone of the brain
but not around the spinal central canal
It is noteworthy that CSF2RB1+ radial glia surrounding the central canal did not express pStat3
constitutively and did not start expressing this protein post-operatively in denervated mice,
indicating that these cells carry mechanisms independent of Jak/Stat3. It is more likely that in
these radial glia cells, CSF2RB1 activates the Jak/Stat5 pathway initiating cell proliferation.

188
Studies on hematopoietic cells show that a mechanism involving IL3 and its receptor, IL3R (also
known as CSF2RB1) initiates proliferation and promotes cell survival through the Jak/Stat5
pathways (reviewed in Reddy et al. 2000). Alternatively, it may also be that CSF2RB1 in these
glia initiate another pathway, such as PI3K/NFκB or the Ras/Raf ERK pathway (Hamilton, 2008;
Kaushansky, 2006; Schweizerhof et al., 2009; Zhuang et al., 2005), which result in activation of
transcription factor(s) that increase gene expression of multiple pain genes, like Il-1β, Il-6 and
Tnfα (via the former pathway), or c-Fos and c-Jun (in the latter pathway), to name a few
(Scheme 6). C-Fos expression is increased 4-fold in the central canal of mice in response to
formalin-induced acute pain (Palkovits et al., 2007). This finding supports the idea that post-
synaptic cells in lamina X have similar characteristics as the post-synaptic cells in the dorsal
horn. Further studies necessitate determining whether c-Fos and c-Jun play role in neuropathic
pain conditions after peripheral nerve injury in lamina X neurons, and whether CSF2RB1 plays
role in this mechanism.
pStat3 and CSF2RB1 both showed intense immunolabelling in the arcuate nucleus of the
hypothalamus, the peri-ventricular nucleus and the third ventricle. The areas of the ventricles
also include the choroid plexus which is made up of ependymal and epithelial cells and functions
as a blood-cerebrospinal fluid barrier. If pStat3 in also expressed in ependymal cells, then
CSF2RB1 may function with this transcription factor in ependymal cells surrounding the
ventricles. We have not yet carried out experiments of co-localization with pStat and Vimentin.
As in the central canal region, c-Fos is up regulated in murine brain ventricles in a model of
acute pain. A single formalin injection into the hind paw elicits strong c-Fos mRNA and Fos
protein expression in pain-related brain areas, in the circumventricular organs, in the choroid
plexus and in tanycytes and ependymal cells of the third ventricle (Palkovits et al., 2007). C-Fos
mRNA was also seen throughout the damaged neocortex in neurons and in non-neural brain cells
(e.g., glia, pia, ependymal) within a short time after induction of brain ischemia or trauma in the
human, rat and mouse (Wessel et al., 1991; Dragunow et al., 1990). The over expression of c-
Fos was also observed in the hippocampal dentate gyrus granule layer and thalamic nuclei after
brain injury in mice (Wessel et al., 1991; Dragunow et al., 1990). The induction of c-Fos in
these cells may be related to their proliferation or to growth factors production as previously
suggested (Dragunow and Robertson, 1988; Mocchetti et al., 1989), and may be mediated in part

189
by pStat3 and CSF2RB1 signalling. NMDA-receptor-mediated events lead to c-Fos induction in
neocortical neurons after injury (Dragunow et al., 1990). Thus, c-Fos has significant roles in the
spinal cord and brain, especially in areas where we detected CSF2RB1 and pStat3 expression. It
is possible that CSF2RB1- and pStat3-expressing cells in these areas have a role in pain
modulation, which may involve the activation of c-Fos. Interestingly, c-Fos and c-Jun genes are
activated by CSF2RB1 in hematopoietic BaF3 cells, and induce their proliferation (Watanabe et
al., 1993). It is likely that CSF2RB1 ependymal cells in the brain areas detected has roles in
proliferation, particularly through c-Fos activation.
As in the central canal region, where CSF2RB1+ ependymal cells extended processes deep into
the grey matter of the spinal cord, CSF2RB1+ ependymal cells send long processes deep into
brain regions of the hypothalamus and the PAG, 2 brain areas that processes pain information by
ascending and descending modulation. In these regions we propose that CSF2RB1 activates
ependymal cells and initiates intracellular signalling events that lead to the release of cytokines,
chemokines and other pain related molecules. These factors in the extracellular space can
sensitize neighbouring neurons of the ascending modulation in the hypothalamus and the
descending inhibitory modulation in the PAG. Whether excitatory transmission or inhibitory
modulation is associated with CSF2RB1 in these areas is a new area of research to be explored.
6.13 Study design considerations in gene expression studies
In a non-biased approach that used whole genome expression profiling, we shortlisted candidate
genes for autotomy behaviour in the mouse using a unique study design that included a few
criteria discussed below.
6.13.1 Pooled vs. individualized arrays
Murine studies mostly focused on pooled brain tissue after nerve injury (Kõks et al., 2008), drug
treatments (Chetcuti et al., 2008; Korostynski et al., 2007), or on naïve animals (not associated
with nerve injury) (Ghate et al., 2007). One example of a non-pooling study sought oxidative
stress genes in the hippocampus and cortex following traumatic brain injury in Apolipoprotein E
(APOE) transgenic mice (Ferguson et al., 2010). In this particular study, non-pooling was
crucial because stress-associated genes were primarily considered. As we reasoned previously in

190
the Methods Section 2.4.1, genes encoding stress proteins can change their expression levels not
only due to a particular treatment used but can also be affected by environmental factors that are
not associated with the treatment. Similarly, when seeking for pain genes in the Neuroma
Model, stress-related genes associated with the nerve injury that may be important in pain
mechanisms, should be distinguished from those that alter expression levels during tissue
harvesting. These genes can only be detected as outliers of a group using the non-pooling
approach.
Other studies that used the pooled approach and may therefore misinterpret their results in
certain genes are listed. In one study on glutamate transgenic mice vs. wild-type mice, three
mice per group were used to assess hippocampal gene expression levels (Wang et al., 2010a).
Other murine studies were performed on DRGs after nerve injury (Méchaly et al., 2006), or on
DRGs isolated from naïve animals (not associated with nerve injury) (LeDoux et al., 2006). A
more recent study compared the gene expression levels of DRGs via an unknown approach,
pooling/non-pooling, following axotomy (Persson et al., 2009b). Another study on Mmp9
knockout vs. wild-type mice did not indicate whether they used pooling or not for their genome
wide expression profiling in normal vs. sciatic nerve and DRG (Kim et al., 2012). Murine
studies in spinal cord were performed in herpes zoster-associated neuropathic pain (Takasaki et
al., 2012). Up to date, no comparative gene expression studies were carried out on spinal cord
tissue in mice following peripheral nerve injury.
6.13.2 The number of arrays per group
The higher the number of arrayed individuals the greater the statistical power there is to
find genes that significantly change their expression levels after nerve injury at a
−1.5≥fold change ≥1.5 and at a significance level of p<0.05, after correction of the p
values by FDR set at ≤0.05. However, the higher the number of arrays used in a study,
the costlier the project. The convention for neural tissue is 3 arrays per group (Géranton
et al., 2007; Di Giovanni et al., 2005; Griffin et al., 2007; Kim et al., 2009b; Korostynski
et al., 2007; LeDoux et al., 2006; Nesic et al., 2005; Sun et al., 2002; Valder et al., 2003;
Vega-Avelaira et al., 2009; Wang et al., 2010a; Zhang et al., 2004), however, other
studies used fewer arrays per group (Costigan et al., 2002; Coyle, 2007; Ghate et al.,

191
2007; Lacroix-Fralish et al., 2006; Rodriguez Parkitna et al., 2006; Takasaki et al., 2012)
and even fewer studies used more than 3 arrays per group (Chetcuti et al., 2008; Di
Giovanni et al., 2003; Kõks et al., 2008). To improve the chances of finding genes that
are significantly regulated by the studied trait we studied 5 animals per group.
6.13.3 Type of group comparisons and choice of the
reference (control) group
Several studies compared nerve-injured animals to naïve animals (Costigan et al., 2002;
Griffin et al., 2007; Rodriguez Parkitna et al., 2006). In this inferior type of comparison,
it is impossible to separate gene expression levels related to injury response and the
recovery thereafter (i.e., production of injury discharge and/or the impact that this
message of occurred injury has on its targets, degeneration of nerve fibres and removal of
debris, inflammation at the cut end of the nerves, regeneration and sprout formation, and
tissue healing) from genes directly associated with neuropathic pain behaviour, having
had a nerve injury. It is, therefore, undesirable to compare naïve vs. nerve-injured groups
when studying neuropathic pain-associated genes. Rather, to identify genes whose
products drive animals to expressing high levels of neuropathic pain-related behaviour -
expression levels of DRGs (Persson et al., 2009b; Valder et al., 2003; Vega-Avelaira et
al., 2009; Wang et al., 2002a), spinal cords (Di Giovanni et al., 2003; Lacroix-Fralish et
al., 2006; Liu et al., 2012a; Wang et al., 2002a; Zhang et al., 2004), and brain tissue
(Kõks et al., 2008), the correct comparisons should be between nerve-injured animals
who express high levels of the pain behaviour and: (i) sham-operated animals of the same
genetic background, (ii) nerve-injured animals of the same genetic background who
express low/no levels of the pain behaviour, (iii) nerve-injured animals from another
genetic background who are known to express no/low levels of the pain behaviour, (iv)
sham-operated animals of that second strain, and (v) naive animals of both strains.
The study of Kim et al. (2009b) compared gene expression levels in the DRGs on the
injured ipsilateral side with the DRGs on the uninjured contralateral side of the same
animal, based on previous findings indicating that gene expression profiles were similar
between tissues contralateral to nerve ligation and those from sham animals of the same
192
genetic background (Wang et al., 2002a). There are no known direct interactions between
injured peripheral neurons on the affected side and those contralaterally in the same
spinal segments or the trigeminal brainstem nuclei through their central terminals.
However, indirect bilateral interactions may be possible via CNS interneurons that cross
contra laterally or systemically through the circulation. Indeed, chronic pain may
manifest not only ipsilaterally, referred to the side of nerve injury, but also
contralaterally, expressed as ‘mirror-image’ pain. It is likely that such pain results from
genes abnormally regulated in the DRGs on the uninjured side. However, it is not correct
to regard the contralateral side as a control even if the animal does not show behavioural
changes contralaterally, because genes contralaterally may be abnormally regulated even
if this does not manifest in neuropathic sensory abnormalities.
Likewise, it is not optimal to compare gene expression levels in the two sides of the
spinal cord or trigeminal brain stem nuclei in the same animal, in light of the known side-
to-side neural connections that exist between neurons of the same segments. To detect
genes whose expression is associated with processing sensory inputs, including
nociceptive domains, Sun et al. (2002) compared gene expression levels in the dorsal
horn with that of the ventral horn, which is associated with integrating sensory inputs and
motor outputs. The results of such a comparison are even more puzzling.
These discrepancies in some of the published reports that studied the regulation of gene
expression levels in DRGs and the spinal cord point out the need for an optimal study
design and the significance of selecting the correct groups to be compared in such a
study. In our study we compared the ipsilateral DRGs and spinal cord segments to those
of the sham-operated mice of the same genetic background.
Two studies done in rats following spinal cord injury and partial hindpaw denervation in
the SNL model, respectively (Coyle, 2007; Nesic et al., 2005), compared spinal cord gene
expression levels between nerve-injured animals expressing neuropathic pain versus
nerve-injured animals that did not express the pain phenotype. The pain phenotype in
both studies was mechanical allodynia. This group comparison most closely resembled
our study design in that it compared animals within the same genetic background and
eliminated the influence of most non-genetic environmental factors by comparing

193
animals having the same inciting event. In our experiment, gene expression levels in A
mice that expressed high autotomy levels, were compared to those of mice of the same A
strain who did not express autotomy or expressed very low autotomy levels following the
same nerve injury, and to sham-operated A mice. Moreover, Nesic et al. (2005) were one
of the few who grouped animals according to their pain levels, retaining the levels of
individual animals, as was done in the present study rather than pooling their mRNA as
was done in most other studies.
6.13.4 Arrayed neural tissues
Our study carried out expression profiling analyses on two types of neural tissues (i.e.,
DRGs and spinal cords) from the same animals. To date, previous reports that studied
more than neural tissue type (LeDoux et al., 2006; Rodriguez Parkitna et al., 2006; Wang
et al., 2002a) have used the pooled approach. In one proteomic profiling study that
compared both sciatic nerve and dorsal horn tissues, the authors neglected to mention
whether pooling or individual arraying was used in their expression profiles (Liu et al.,
2012a). Another research group performed DRG (Xiao et al., 2002) and spinal cord
expression profiling (Zhang et al., 2004) in two separate studies, also by pooling the
samples. Studies using individual tissue arrays of only 3 animals per group were carried
out on mouse brain (Kõks et al., 2008), rat spinal cord (Nesic et al., 2005), and rat DRG
(Valder et al., 2003) tissues.
To summarize, we believe that our study improved on study design over most published
previous studies, in: (i) using individual specimens to compare gene expression levels in
individuals rather than pooling the mRNA, (ii) comparing two neural tissues of the same
animals, enabling correlation of the expression across animals of the same groups and
across groups, (iii) selecting better specific group comparisons that included naive, sham-
operated and hindpaw-denervated animals in the two strains of contrasting pain
behaviours, and (iv) comparing mice of the same genetic background having had the
same nerve injury bur responding with contrasting pain behaviour. In this design within-
strain comparisons enabled us to identify genes that interact with the environment (gene-
by-environment interactions, ‘GXE’) associated with the studied pain phenotype,

194
whereas across-strain comparisons permitted the findings of genetic factors related to
chronic pain behaviour.
6.13.5 Statistical considerations
We conducted a number of statistical analyses of gene expression profiles, looking for
genes across the whole genome that correlate the contrast in pain behaviour, with a
special focus on genes in the Pain1 region. The more comparisons we made, the higher
the likelihood that some of the genes identified as significantly regulated by pain were
false positive identifications (‘type 1 error’), and that those identified as not significant –
might have been wrongly labelled as such and were actually false negative identifications
(‘type 2 error’). In an attempt to limit this likelihood one needs to correct for inflation of
the alpha level due to multiple comparisons by using the Bonferroni adjustment factor, or
other, less conservative methods, such as the False Discovery Rate (Benjamini and
Hochberg, 1995). The considerably more conservative of the two approaches was the
Bonferroni method because when dividing the level of 0.05 by the number of probes in
the array we used in our study (N=44,000), the outcome yields an α=E-06 as the minimal
p value needed to reject the null hypothesis that the expression of a gene under study was
invariable across the compared groups. Any p value above this threshold would have
been considered insignificant in a genome-wide analysis. However, as our hypothesis
was that the gene under study should be located within Pain1, dividing 0.05 by the
number of probes in Pain1 genes (N=238) should have yielded p≤0.0002 as the criterion
of significance. This p-value was used as the criterion of significance to seek candidate
pain genes in Pain1. We were unable, using a cut off of FDR<0.05 to locate any gene in
the spinal cord that is significantly associated with the trait, nevertheless, decided to
proceed with further analyses without considering the FDR correction of the alpha level.
6.13.6 Group comparisons
Another factor of importance when seeking candidate genes using a whole genome
expression array was to decide on the cut-off level of fold changes considered
meaningful. Although a p<0.05 alone would result in many false-positives, the
combination of fold-change and p-value thresholds could eliminate most false positives

195
that are obtained only with p<0.05 (Di Giovanni et al., 2005). Since we analyzed our
data in 3 group comparisons, all genes found to be significant at p<0.05 and −1.5≥fold
change were considered candidate genes. This set of criteria has also been used in other
studies (Costigan et al., 2002; Coyle, 2007; Di Giovanni et al., 2005; Szpara et al., 2007).
In one of these studies (Szpara et al., 2007) an FDR test was run as well, but results of the
FDR were not used in filtering data for clustering or further analysis, as was done in the
present study.
6.14 Limitations of the studies
In this study we used 2 strains that are susceptible to develop autotomy (A and C3H) and 2
strains that are resistant to this behaviour (B and AKR), and looked at the Csf2rb gene
expression levels in these strains. Tlr4 gene was compared in the two C3H strains, C3H/HeN
and C3H/HeJ. PStat3 was studied in the A vs. B strains. In order to get a more general
perspective of these genes on autotomy behaviour, this necessitates using more contrasting
strains to study the following genes, especially in immunohistochemical techniques in which
mostly A and B mice were used.
For immunohistochemical labelling of pStat3, there is a need for a greater N to signify the
findings in the spinal dorsal horn and brain regions, to be able to assess if and what is the
difference between high autotomy and low autotomy mouse groups. Another limitation in the
immunohistochemical studies was the inability to co-label pStat3 cells in the spinal dorsal horn
and in the brain areas, as well as to co-label CSF2RB1 in the dentate gyrus, and to assess in
which cell types these gene products are located in these areas. More antibodies other than the
ones used in the present study to label microglia (i.e., Iba-1, Itgam) and neural stem cells such as
Nestin are needed to complete the study. The fact that we could not co-localize CSF2RB1 in
some of the dentate gyrus cells, via GFAP and Vimentin markers, could be due to very intensely
labelled CSF2RB1 masking a weaker label of the other markers. It is also possible that neural
stem cells positive for CSF2RB1 were beginning to differentiate into astrocytes, ependymal cells
and neurons at the time the animals were perfused for the study, which is why we could not
detect the receptor in these latter cells.

196
One of the future avenues of research could be focusing on regions we found harbouring cells
expressing CS2RB1 and using double or triple labelling to map the same tissue sections for GM-
CSF, IL-3, IL-5, and their receptors (CSF2RB1, CSF2RB2 and CSF2RA). We did not co-
localize CSF2RB1 to neuronal nuclei, marked by NeuN only to a very small number of neurons
(which may be an artefact due to z-stack imaging), and it is possible that membrane-bound, as
opposed to nuclear CSF2RB1 is found on neurons of our mice. Another possibility is to label the
CSF2RB1 cells found in white matter of the dorsal horn with a double label for axons, to exclude
the possibility that they localize in neurons. These glial cells did not co-localize with Vimentin,
indicating that they are not the same ependymal cells/tanycytes/radial glia found in the central
canal.
Imaging of the fluorescence was observed using a conventional epifluorescence microscope.
However, the use of confocal microscopy could have accentuated the origins and end points of
CSF2RB1-labelled processes, especially in the spinal central canal region, dorsal horn, and
dorsal columns as well as in the brain.
Immunolabelling of TLR4 is necessary in A vs. B mice, to detect where this receptor is
expressed in the spinal cord and brain, and to assess whether or not differences exist between the
strains/autotomy levels. Using a better gear (fluorescent microscope with laser light) could have
helped detect where the CSF2RB1+ processes around the central canal terminate, whether in the
neuropil or elsewhere.
As mentioned in the Methods, the experimenter was blinded while autotomy phenotyping to the
identity of the group under observation, i.e., not knowing if the operated animal was denervated
or sham-operated. However, differences do exist between the two operations, in that the
denervated paw is also paralyzed, hence dragged by the animal. This can easily be observed by
the experimenter, thereby readily distinguishing between a sham and a denervated mouse.
However, autotomy behaviour is very clear when seen in an animal, and its presence or absence
is easy to quantify. Nevertheless, on some rare occasions it may be difficult to decide whether
an injury is caused by an intended self-mutilation or is the result of mechanical wounding due to
dragging of the paw on the floor. In summary, scoring of autotomy was performed using an
acceptable method that when using blinding techniques can minimize rater bias.

197
6.15 Future direction of research
This dissertation reports on 3 main genes that correlated spontaneous pain behaviour in the
mouse, Csf2rb2, Tlr4 and Stat3. The main focus was in the Pain1 gene Csf2rb1 which we
correlated with autotomy in both the spinal cord and brain. It is not yet known in which
mechanism Csf2rb1 is involved and where is it primarily affecting the pain phenotype in the
mouse. Is Csf2rb1’s function dominating in the spinal cord or in the brain to maintain pain
behaviour? More experiments are needed to attest these possibilities.
The present study concentrated mostly on gene expression and immunohistochemical techniques
to seek for correlations between a gene of interest and autotomy behaviour. Note however, that
all of the observations reported herein, were of correlations and not mechanistic. Additional
functional studies are needed to assess whether the studied genes contribute to the development
and/or maintenance of chronic neuropathic pain. As such, there is a need to block a gene of
interest (i.e., Csf2rb1, Tlr4, Stat3) in specific areas such as the spinal cord, hippocampus, brain
ventricles, by way of injecting siRNAs, specific antibodies, or peptides that block the function of
the protein, and after complete hind paw denervation detect the differences in autotomy
behaviour between animals that received the block and those that did not. These studies should
be performed in strains that are susceptible to develop autotomy in a penetrance of 50% or more,
such as the A or C3H/HeN strain.
In situ blockade assays for Csf2rb1 are more preferable than using an available Csf2rb1
knockout mouse to study autotomy behaviour for several reasons. First, the commercially
available Cre-Lox conditional knockout mice from the Jackson Laboratories were produced in
C57BL6/J mice, which are known to be resistant to autotomy behaviour following hindpaw
denervation (Devor 2005). Knocking out this gene is expected to make these animals resistant
to autotomy following hindpaw denervation. Therefore, a conditional knocked out Csf2rb1 gene
in the C57BL6/J background would not be informative because these mice would not autotomize
regardless of the mutation (given their strain resistance to autotomy behaviour). To be
informative after hindpaw denervation, this knockout should have been introduced to A/J mice,
so that a wild-type mouse that usually autotomizes following hindpaw denervation would
expresses no autotomy, or lower autotomy levels, when this gene is knocked out. Finally,

198
developmental knockouts (i.e., mice whose gene is already knocked out at an embryonic stage)
are problematic because the animal may develop compensatory mechanisms, which would
enable it to function normally despite lacking functional copies of that gene, and therefore, an
adult knocked out mouse might not show the desired phenotype.
Alternative complementary studies of inducing receptor activity in autotomy resistant strains,
such as B and AKR, are beneficial. The ligand for CSF2RB1, GM-CSF can be injected into
these mice before and following hind paw denervation to assess whether or not autotomy
behaviour is induced in these strains, by activating the receptor. Alternatively, LPS can be
injected in these mice to assess whether TLR activation produces autotomy.
Results of CSF2RB1 in the dentate gyrus showing increased expression with autotomy behaviour
in A mice suggested a negative valence in these mice. We hypothesized that A mice probably
cannot avoid their pain in the way that B mice can. Therefore, in order to test this hypothesis, A
and B mice can be placed in chambers for pain avoidance testing to see whether there is a
difference in their avoidance behaviour. These tests can be performed after CSF2RB1 block in
A mice, for instance, or alternatively after GM-CSF induction in B mice, to see whether Csf2rb1
plays role in the avoidance.
Another step to determine whether Csf2rb1 is indeed an important neuropathic pain gene is to
study its sequence in human neuropathic pain patients vs. that of patients who suffered the same
injury yet did not develop neuropathic pain. Indeed, preliminary genotyping of a few Csf2rb1
SNPs in humans, have been carried out in our lab and I took part in this study. The pilot results
identified a candidate haplotype in 350 women with post-mastectomy neuropathic pain
syndrome that was different from the haplotype of pain-free women following the same
operation. However, we were unable to replicate the same haplotype in a smaller cohort of leg
amputees with and without phantom limb pain. These preliminary studies were lacking because
we genotyped only a few SNPs along the gene to adequately map it for polymorphisms.

199
6.16 Conclusions
The present study aimed to identify novel genes associated with chronic neuropathic pain and the
mechanisms they encode in a mouse model of spontaneous pain, imitating phantom limb pain in
human amputees, and patients who sustained a complete cut nerve but the limb itself remained
part of the body (‘anesthesia dolorosa’). Using a non-biased approach, we identified a novel
gene named Csf2rb1 in a region on chromosome 15 of the mouse that was mapped in previous
studies Pain1. This gene encodes a cytokine receptor of 3 ligands IL-3, IL-5 and GM-CSF. We
identified two additional genes, named Tlr4 and Stat3, encoding the Toll-like receptor 4, and the
Signal transducer and activator of transcription 3, respectively. These genes propose new pain
mechanisms in the CNS, involving specialized glial cells in the spinal cord and brain that were
never implicated in neuropathic pain before. Our major findings regarding these 3 genes are
listed below.
1. We were able to substantiate in part the candidacy of Csf2rb1 as a gene for autotomy in
Pain1 and identified cells that express it in the spinal cord as ependymal cells/radial
glia/tanycytes. We propose that these cells in the central canal region may contribute to
the hyperexcitability of ascending nociceptive neurons (including those originating in
Layer X - the VMAB), thereby delivering pain inputs to higher brain centres.
2. We found that these cells proliferate post-injury and propose (although without
supporting evidence as of yet) that they may function as a reservoir of spinal stem cells
that respond to injury in the production of neurons and/or glia cells in the spinal cord and
white matter, in the form of ependymal cells/radial glia/tancyte gliosis. Such a
proliferation and differentiation in the dorsal horn may contribute to the maintenance of
neuropathic pain.
3. We were able to show a marked immunolabelling of both CSF2RB1 and pStat3 in the
peri-ventricular zone, the arcuate nucleus and the hippocampal dentate gyrus, where
expression of both proteins correlated with autotomy behaviour in some denervated A
mice. We suggest that these areas, shown previously to be significant in neuropathic pain
behaviour, may be important in maintaining spontaneous neuropathic pain. Additionally

200
we showed a moderate expression of CSF2RB1 in the dorsal horn, and of pStat3 that
increased in mice with high-autotomy levels. Whether the main mechanism for Csf2rb1
is spinal or at higher brain centres, such as the hippocampus and hypothalamus, is yet to
be discovered. However, our findings show that over-expression of Csf2rb1 and/or its
product is correlated with high autotomy levels in the spinal cord, and brain of some
denervated A mice, not in B mice.
4. We show for the first time that TLR4 regulation is associated with spontaneous
neuropathic pain. TLR4-deficient mice, carrying a dysfunctional TLR4 receptor, had a
delayed autotomy behaviour compared to wild type mice having the normal receptor.
Consistent with this finding, Tl4 gene expression levels were differentially regulated in
DRGs and spinal cords of autotomy susceptible A vs. autotomy resistant B mice. Spinal
Csf2rb1 gene in TLR4-deficient mice failed to up-regulate following hindpaw
denervation, whereas in TLR4 wild-type mice Csf2rb1 mRNA levels up-regulated after
the same denervation procedure.
5. We propose cellular mechanisms in pain pathways, which involve Csf2rb1, Tlr4, and
pStat3 that ultimately lead to the sensitization of neurons in the spinal cord and brain via
cytokines, chemokines, and other pain-related molecules.

201
References
Abbadie, C., Lindia, J.A., Cumiskey, A.M., Peterson, L.B., Mudgett, J.S., Bayne, E.K.,
DeMartino, J.A., MacIntyre, D.E., and Forrest, M.J. (2003). Impaired neuropathic pain responses
in mice lacking the chemokine receptor CCR2. Proc. Natl. Acad. Sci. U. S. A. 100, 7947–7952.
Abbadie, C., Bhangoo, S., De Koninck, Y., Malcangio, M., Melik-Parsadaniantz, S., and White,
F.A. (2009). Chemokines and pain mechanisms. Brain Res. Rev. 60, 125–134.
Ali, Z., Ringkamp, M., Hartke, T.V., Chien, H.F., Flavahan, N.A., Campbell, J.N., and Meyer,
R.A. (1999). Uninjured C-fiber nociceptors develop spontaneous activity and alpha-adrenergic
sensitivity following L6 spinal nerve ligation in monkey. J. Neurophysiol. 81, 455–466.
Ali, Z., Raja, S.N., Wesselmann, U., Fuchs, P.N., Meyer, R.A., and Campbell, J.N. (2000).
Intradermal injection of norepinephrine evokes pain in patients with sympathetically maintained
pain. Pain 88, 161–168.
Allen Brain Atlas Allen Brain Atlas.
Al Amin, H.A., Atweh, S.F., Jabbur, S.J., and Saadé, N.E. (2004). Effects of ventral
hippocampal lesion on thermal and mechanical nociception in neonates and adult rats. Eur. J.
Neurosci. 20, 3027–3034.
Al-Amin, H., Sarkis, R., Atweh, S., Jabbur, S., and Saadé, N. (2011). Chronic dizocilpine or
apomorphine and development of neuropathy in two animal models II: effects on brain cytokines
and neurotrophins. Exp. Neurol. 228, 30–40.
Arnstein, P.M. (1997). The neuroplastic phenomenon: a physiologic link between chronic pain
and learning. J. Neurosci. Nurs. J. Am. Assoc. Neurosci. Nurses 29, 179–186.
Arvidsson, J. (1979). An ultrastructural study of transganglionic degeneration in the main
sensory trigeminal nucleus of the rat. J. Neurocytol. 8, 31–45.
Arvidsson, J., Ygge, J., and Grant, G. (1986). Cell loss in lumbar dorsal root ganglia and
transganglionic degeneration after sciatic nerve resection in the rat. Brain Res. 373, 15–21.
Asada, H., Yamaguchi, Y., Tsunoda, S., and Fukuda, Y. (1996). The role of spinal cord
activation before neurectomy in the development of autotomy. Pain 64, 161–167.
Asea, A., Rehli, M., Kabingu, E., Boch, J.A., Bare, O., Auron, P.E., Stevenson, M.A., and
Calderwood, S.K. (2002). Novel signal transduction pathway utilized by extracellular HSP70:
role of toll-like receptor (TLR) 2 and TLR4. J. Biol. Chem. 277, 15028–15034.
Baik, E., Chung, J.M., and Chung, K. (2003). Peripheral norepinephrine exacerbates neuritis-
induced hyperalgesia. J. Pain Off. J. Am. Pain Soc. 4, 212–221.
202
Baker, C.C., Niven-Fairchild, A.T., Yamada, A., Caragnano, C.L., and Kupper, T.S. (1991).
Macrophage antigen presentation and interleukin 1 production after cecal ligation and puncture
in C3H/HeN and C3H/HeJ mice. Arch. Surg. Chic. Ill 1960 126, 253–257; discussion 257–258.
Balschun, D., Wetzel, W., Del Rey, A., Pitossi, F., Schneider, H., Zuschratter, W., and
Besedovsky, H.O. (2004). Interleukin-6: a cytokine to forget. Faseb J. Off. Publ. Fed. Am. Soc.
Exp. Biol. 18, 1788–1790.
Barnabé-Heider, F., Göritz, C., Sabelström, H., Takebayashi, H., Pfrieger, F.W., Meletis, K., and
Frisén, J. (2010). Origin of new glial cells in intact and injured adult spinal cord. Cell Stem Cell
7, 470–482.
Baude, A., Nusser, Z., Roberts, J.D., Mulvihill, E., McIlhinney, R.A., and Somogyi, P. (1993).
The metabotropic glutamate receptor (mGluR1 alpha) is concentrated at perisynaptic membrane
of neuronal subpopulations as detected by immunogold reaction. Neuron 11, 771–787.
Be’eri, H., Reichert, F., Saada, A., and Rotshenker, S. (1998). The cytokine network of wallerian
degeneration: IL-10 and GM-CSF. Eur. J. Neurosci. 10, 2707–2713.
Beggs, S., and Salter, M.W. (2007). Stereological and somatotopic analysis of the spinal
microglial response to peripheral nerve injury. Brain. Behav. Immun. 21, 624–633.
Benjamini, Y., and Hochberg, Y. (1995). Controlling the false discovery rate: a practical and
powerful approach to multiple testing. J. R. Stat. Soc. Ser. B Methodol. 57, 289–300.
Bennett, G.J., and Xie, Y.K. (1988). A peripheral mononeuropathy in rat that produces disorders
of pain sensation like those seen in man. Pain 33, 87–107.
Bennett, G.J., Chung, J.M., Honore, M., and Seltzer, Z. (2003). Models of neuropathic pain in
the rat. Curr. Protoc. Neurosci. Editor. Board Jacqueline N Crawley Al Chapter 9, Unit 9.14.
Berenson, C.S., Rasp, R.H., Gau, J.T., Ryan, J.L., and Yohe, H.C. (2001). Differences in splenic
B-lymphocyte ganglioside expression and accessibility in normal and endotoxin-hyporesponsive
mice. J. Leukoc. Biol. 69, 969–976.
Berger, A. (2000). Th1 and Th2 responses: what are they? BMJ 321, 424.
Bernaudin, M., Marti, H.H., Roussel, S., Divoux, D., Nouvelot, A., MacKenzie, E.T., and Petit,
E. (1999). A potential role for erythropoietin in focal permanent cerebral ischemia in mice. J.
Cereb. Blood Flow Metab. Off. J. Int. Soc. Cereb. Blood Flow Metab. 19, 643–651.
Bettoni, I., Comelli, F., Rossini, C., Granucci, F., Giagnoni, G., Peri, F., and Costa, B. (2008).
Glial TLR4 receptor as new target to treat neuropathic pain: efficacy of a new receptor
antagonist in a model of peripheral nerve injury in mice. Glia 56, 1312–1319.
Birder, L.A., and Perl, E.R. (1999). Expression of alpha2-adrenergic receptors in rat primary
afferent neurones after peripheral nerve injury or inflammation. J. Physiol. 515 ( Pt 2), 533–542.

203
Blake, T.J., Jenkins, B.J., D’Andrea, R.J., and Gonda, T.J. (2002). Functional cross-talk between
cytokine receptors revealed by activating mutations in the extracellular domain of the beta-
subunit of the GM-CSF receptor. J. Leukoc. Biol. 72, 1246–1255.
Blech-Hermoni, Y. (2005). Investigation of the transmission of autotomy in high-expressing and
low-expressing mouse strains and a genetic comparison of PAIN1, a mouse putative QTL ofr
autotomy, in rat lines. University of Toronto.
Bodega, G., Suárez, I., Rubio, M., and Fernández, B. (1994). Ependyma: phylogenetic evolution
of glial fibrillary acidic protein (GFAP) and vimentin expression in vertebrate spinal cord.
Histochemistry 102, 113–122.
Bowie, A., and O’Neill, L.A. (2000). The interleukin-1 receptor/Toll-like receptor superfamily:
signal generators for pro-inflammatory interleukins and microbial products. J. Leukoc. Biol. 67,
508–514.
Bredel, M., and Jacoby, E. (2004). Chemogenomics: an emerging strategy for rapid target and
drug discovery. Nat. Rev. Genet. 5, 262–275.
Brines, M., and Cerami, A. (2008). Erythropoietin-mediated tissue protection: reducing collateral
damage from the primary injury response. J. Intern. Med. 264, 405–432.
Brines, M., Grasso, G., Fiordaliso, F., Sfacteria, A., Ghezzi, P., Fratelli, M., Latini, R., Xie, Q.-
W., Smart, J., Su-Rick, C.-J., et al. (2004). Erythropoietin mediates tissue protection through an
erythropoietin and common beta-subunit heteroreceptor. Proc. Natl. Acad. Sci. U. S. A. 101,
14907–14912.
Brines, M.L., Ghezzi, P., Keenan, S., Agnello, D., de Lanerolle, N.C., Cerami, C., Itri, L.M., and
Cerami, A. (2000). Erythropoietin crosses the blood-brain barrier to protect against experimental
brain injury. Proc. Natl. Acad. Sci. U. S. A. 97, 10526–10531.
Brown, A.L., Salerno, D.G., Sadras, T., Engler, G.A., Kok, C.H., Wilkinson, C.R., Samaraweera,
S.E., Sadlon, T.J., Perugini, M., Lewis, I.D., et al. (2012). The GM-CSF receptor utilizes β-
catenin and Tcf4 to specify macrophage lineage differentiation. Differ. Res. Biol. Divers. 83, 47–
59.
Burchiel, K.J. (1984). Effects of electrical and mechanical stimulation on two foci of
spontaneous activity which develop in primary afferent neurons after peripheral axotomy. Pain
18, 249–265.
Busch, S.A., Horn, K.P., Cuascut, F.X., Hawthorne, A.L., Bai, L., Miller, R.H., and Silver, J.
(2010). Adult NG2+ cells are permissive to neurite outgrowth and stabilize sensory axons during
macrophage-induced axonal dieback after spinal cord injury. J. Neurosci. Off. J. Soc. Neurosci.
30, 255–265.
Bushnell, M. (2006). Representation of pain in the brain. In Textbook of Pain, (China: Elsevier
Ltd.), pp. 107–124.

204
Calvo, M., and Bennett, D.L.H. (2012). The mechanisms of microgliosis and pain following
peripheral nerve injury. Exp. Neurol. 234, 271–282.
Del Camino, D., Murphy, S., Heiry, M., Barrett, L.B., Earley, T.J., Cook, C.A., Petrus, M.J.,
Zhao, M., D’Amours, M., Deering, N., et al. (2010). TRPA1 contributes to cold hypersensitivity.
J. Neurosci. Off. J. Soc. Neurosci. 30, 15165–15174.
Cannon, T.Y., Guttridge, D., Dahlman, J., George, J.R., Lai, V., Shores, C., Buzková, P., and
Couch, M.E. (2007). The effect of altered Toll-like receptor 4 signaling on cancer cachexia.
Arch. Otolaryngol. Head Neck Surg. 133, 1263–1269.
Cao, L., and DeLeo, J.A. (2008). CNS-infiltrating CD4+ T lymphocytes contribute to murine
spinal nerve transection-induced neuropathic pain. Eur. J. Immunol. 38, 448–458.
Cao, L., Tanga, F.Y., and Deleo, J.A. (2009). The contributing role of CD14 in toll-like receptor
4 dependent neuropathic pain. Neuroscience 158, 896–903.
Carlén, M., Meletis, K., Göritz, C., Darsalia, V., Evergren, E., Tanigaki, K., Amendola, M.,
Barnabé-Heider, F., Yeung, M.S.Y., Naldini, L., et al. (2009). Forebrain ependymal cells are
Notch-dependent and generate neuroblasts and astrocytes after stroke. Nat. Neurosci. 12, 259–
267.
Carter, C.J. (2009). Schizophrenia susceptibility genes directly implicated in the life cycles of
pathogens: cytomegalovirus, influenza, herpes simplex, rubella, and Toxoplasma gondii.
Schizophr. Bull. 35, 1163–1182.
Cetin, A., Nas, K., Büyükbayram, H., Ceviz, A., and Olmez, G. (2006). The effects of
systemically administered methylprednisolone and recombinant human erythropoietin after acute
spinal cord compressive injury in rats. Eur. Spine J. Off. Publ. Eur. Spine Soc. Eur. Spinal
Deform. Soc. Eur. Sect. Cerv. Spine Res. Soc. 15, 1539–1544.
Chabal, C., Jacobson, L., Russell, L.C., and Burchiel, K.J. (1992). Pain response to perineuromal
injection of normal saline, epinephrine, and lidocaine in humans. Pain 49, 9–12.
Chen, P., Huang, K., Zhou, G., Zeng, Z., Wang, T., Li, B., Wang, Y., He, L., Feng, G., and Shi,
Y. (2011). Common SNPs in CSF2RB are associated with major depression and schizophrenia in
the Chinese Han population. World J. Biol. Psychiatry Off. J. World Fed. Soc. Biol. Psychiatry
12, 233–238.
Chen, Y., Michaelis, M., Janig, W., and Devor, M. (1996). Adrenoreceptor subtype mediating
sympathetic-sensory coupling in injured sensory neurons. J. Neurophysiol. 76, 3721–3730.
Chéret, C., Gervais, A., Lelli, A., Colin, C., Amar, L., Ravassard, P., Mallet, J., Cumano, A.,
Krause, K.-H., and Mallat, M. (2008). Neurotoxic activation of microglia is promoted by a nox1-
dependent NADPH oxidase. J. Neurosci. Off. J. Soc. Neurosci. 28, 12039–12051.

205
Chetcuti, A., Adams, L.J., Mitchell, P.B., and Schofield, P.R. (2008). Microarray gene
expression profiling of mouse brain mRNA in a model of lithium treatment. Psychiatr. Genet. 18,
64–72.
Chichorro, J.G., Zampronio, A.R., and Rae, G.A. (2006). Endothelin ET(B) receptor antagonist
reduces mechanical allodynia in rats with trigeminal neuropathic pain. Exp. Biol. Med.
Maywood Nj 231, 1136–1140.
Cho, Y.K., Kim, G., Park, S., Sim, J.H., Won, Y.J., Hwang, C.H., Yoo, J.Y., and Hong, H.N.
(2012). Erythropoietin promotes oligodendrogenesis and myelin repair following lysolecithin-
induced injury in spinal cord slice culture. Biochem. Biophys. Res. Commun. 417, 753–759.
Choi, J.-S., Kim, S.Y., Cha, J.-H., Choi, Y.-S., Sung, K.-W., Oh, S.T., Kim, O.N., Chung, J.-W.,
Chun, M.-H., Lee, S.B., et al. (2003). Upregulation of gp130 and STAT3 activation in the rat
hippocampus following transient forebrain ischemia. Glia 41, 237–246.
Chou, C.-W., Wong, G.T.C., Lim, G., McCabe, M.F., Wang, S., Irwin, M.G., and Mao, J.
(2011). Peripheral nerve injury alters the expression of NF-κB in the rat’s hippocampus. Brain
Res. 1378, 66–71.
Christensen, M., and Hulsebosch, C.E. (1997). Chronic central pain after spinal cord injury. J
neurotrauma 14, 517–537.
Christianson, C.A., Dumlao, D.S., Stokes, J.A., Dennis, E.A., Svensson, C.I., Corr, M., and
Yaksh, T.L. (2011). Spinal TLR4 mediates the transition to a persistent mechanical
hypersensitivity after the resolution of inflammation in serum-transferred arthritis. Pain 152,
2881–2891.
Chung, C.S., Xu, Y.X., Wang, W., Chaudry, I.H., and Ayala, A. (1998). Is Fas ligand or
endotoxin responsible for mucosal lymphocyte apoptosis in sepsis? Arch. Surg. Chic. Ill 1960
133, 1213–1220.
Cizkova, D., Nagyova, M., Slovinska, L., Novotna, I., Radonak, J., Cizek, M., Mechirova, E.,
Tomori, Z., Hlucilova, J., Motlik, J., et al. (2009). Response of ependymal progenitors to spinal
cord injury or enhanced physical activity in adult rat. Cell. Mol. Neurobiol. 29, 999–1013.
Clarkson, A.N., Liu, H., Schiborra, F., Shaw, O., Sammut, I.A., Jackson, D.M., and Appleton, I.
(2007a). Angiogenesis as a predictive marker of neurological outcome following hypoxia-
ischemia. Brain Res. 1171, 111–121.
Clarkson, A.N., Clarkson, J., Jackson, D.M., and Sammut, I.A. (2007b). Mitochondrial
involvement in transhemispheric diaschisis following hypoxia-ischemia: Clomethiazole-
mediated amelioration. Neuroscience 144, 547–561.
Coderre, T.J., Grimes, R.W., and Melzack, R. (1986). Deafferentation and chronic pain in
animals: an evaluation of evidence suggesting autotomy is related to pain. Pain 26, 61–84.

206
Cohn, S., and Seltzer, Z. (1991). Inherited propensity for neuropathic pain is mediated by
sensitivity to injury discharge. Neuroreport 2, 647–650.
Conrad, S., Schluesener, H.J., Adibzahdeh, M., and Schwab, J.M. (2005). Spinal cord injury
induction of lesional expression of profibrotic and angiogenic connective tissue growth factor
confined to reactive astrocytes, invading fibroblasts and endothelial cells. J. Neurosurg. Spine 2,
319–326.
Costigan, M., Mannion, R.J., Kendall, G., Lewis, S.E., Campagna, J.A., Coggeshall, R.E.,
Meridith-Middleton, J., Tate, S., and Woolf, C.J. (1998). Heat shock protein 27: developmental
regulation and expression after peripheral nerve injury. J. Neurosci. Off. J. Soc. Neurosci. 18,
5891–5900.
Costigan, M., Befort, K., Karchewski, L., Griffin, R.S., D’Urso, D., Allchorne, A., Sitarski, J.,
Mannion, J.W., Pratt, R.E., and Woolf, C.J. (2002). Replicate high-density rat genome
oligonucleotide microarrays reveal hundreds of regulated genes in the dorsal root ganglion after
peripheral nerve injury. Bmc Neurosci. 3, 16.
Costigan, M., Belfer, I., Griffin, R.S., Dai, F., Barrett, L.B., Coppola, G., Wu, T., Kiselycznyk,
C., Poddar, M., Lu, Y., et al. (2010). Multiple chronic pain states are associated with a common
amino acid-changing allele in KCNS1. Brain J. Neurol. 133, 2519–2527.
Coull, J.A.M., Boudreau, D., Bachand, K., Prescott, S.A., Nault, F., Sík, A., De Koninck, P., and
De Koninck, Y. (2003). Trans-synaptic shift in anion gradient in spinal lamina I neurons as a
mechanism of neuropathic pain. Nature 424, 938–942.
Coull, J.A.M., Beggs, S., Boudreau, D., Boivin, D., Tsuda, M., Inoue, K., Gravel, C., Salter,
M.W., and De Koninck, Y. (2005). BDNF from microglia causes the shift in neuronal anion
gradient underlying neuropathic pain. Nature 438, 1017–1021.
Coyle, D.E. (2007). Spinal cord transcriptional profile analysis reveals protein trafficking and
RNA processing as prominent processes regulated by tactile allodynia. Neuroscience 144, 144–
156.
Craft, R.M. (2003). Sex differences in opioid analgesia: “from mouse to man.”Clin. J. Pain 19,
175–186.
Cragg, B.G. (1970). What is the signal for chromatolysis? Brain Res. 23, 1–21.
Cummins, T.R., and Waxman, S.G. (1997). Downregulation of tetrodotoxin-resistant sodium
currents and upregulation of a rapidly repriming tetrodotoxin-sensitive sodium current in small
spinal sensory neurons after nerve injury. J. Neurosci. Off. J. Soc. Neurosci. 17, 3503–3514.
Dahlberg, J.E., Lund, E., and Goodwin, E.B. (2003). Nuclear translation: What is the evidence?
RNA 9, 1–8.
207
Danielyan, L., Klein, R., Hanson, L.R., Buadze, M., Schwab, M., Gleiter, C.H., and Frey, W.H.
(2010). Protective effects of intranasal losartan in the APP/PS1 transgenic mouse model of
Alzheimer disease. Rejuvenation Res. 13, 195–201.
Darvasi, A., and Soller, M. (1995). Advanced intercross lines, an experimental population for
fine genetic mapping. Genetics 141, 1199–1207.
Davalos, D., Grutzendler, J., Yang, G., Kim, J.V., Zuo, Y., Jung, S., Littman, D.R., Dustin, M.L.,
and Gan, W.-B. (2005). ATP mediates rapid microglial response to local brain injury in vivo.
Nat. Neurosci. 8, 752–758.
Davidoff, G., Werner, R., and Waring, W. (1991). Compressive mononeuropathies of the upper
extremity in chronic paraplegia. Paraplegia 29, 17–24.
Davis, K.D., Treede, R.D., Raja, S.N., Meyer, R.A., and Campbell, J.N. (1991). Topical
application of clonidine relieves hyperalgesia in patients with sympathetically maintained pain.
Pain 47, 309–317.
Defrin, R., Zeitoun, I., and Urca, G. (1996). Strain differences in autotomy levels in mice:
relation to spinal excitability. Brain Res. 711, 241–244.
DeLeo, J.A., and Rutkowski, M.D. (2000). Gender differences in rat neuropathic pain sensitivity
is dependent on strain. Neurosci. Lett. 282, 197–199.
DeLeo, J.A., and Yezierski, R.P. (2001). The role of neuroinflammation and neuroimmune
activation in persistent pain. Pain 90, 1–6.
DeLeo, J.A., Tanga, F.Y., and Tawfik, V.L. (2004). Neuroimmune activation and
neuroinflammation in chronic pain and opioid tolerance/hyperalgesia. Neurosci. Rev. J. Bringing
Neurobiol. Neurol. Psychiatry 10, 40–52.
Devor, M., and Raber, P. (1990). Heritability of symptoms in an experimental model of
neuropathic pain. Pain 42, 51–67.
Devor, M., and seltzer, Z. (1999). Pathophysiology of damaged nerves in relation to chronic
pain. In Textbook of Pain, (New York: Churchill Livingstone), pp. 129–161.
Devor, M., Schonfeld, D., Seltzer, Z., and Wall, P.D. (1979). Two modes of cutaneous
reinnervation following peripheral nerve injury. J. Comp. Neurol. 185, 211–220.
Devor, M., Imbal, R., and Govrin-Lippman, R. (1982). Genetics of the brain (Amsterdam:
Elsevier Biomedical Press).
Devor, M., Govrin-Lippmann, R., and Angelides, K. (1993). Na+ channel immunolocalization in
peripheral mammalian axons and changes following nerve injury and neuroma formation. J.
Neurosci. Off. J. Soc. Neurosci. 13, 1976–1992.
Devor, M., Jänig, W., and Michaelis, M. (1994). Modulation of activity in dorsal root ganglion
neurons by sympathetic activation in nerve-injured rats. J. Neurophysiol. 71, 38–47.

208
Devor, M., del Canho, S., and Raber, P. (2005a). Heritability of symptoms in the neuroma model
of neuropathic pain: replication and complementation analysis. Pain 116, 294–301.
Devor, M., Gilad, A., Arbilly, M., Yakir, B., Raber, P., Pisanté, A., and Darvasi, A. (2005b).
pain1: a neuropathic pain QTL on mouse chromosome 15 in a C3HxC58 backcross. Pain 116,
289–293.
Devor, M., Gilad, A., Arbilly, M., Nissenbaum, J., Yakir, B., Raber, P., Minert, A., Pisanté, A.,
and Darvasi, A. (2007). Sex-specific variability and a “cage effect” independently mask a
neuropathic pain quantitative trait locus detected in a whole genome scan. Eur. J. Neurosci. 26,
681–688.
Devroede, G., Girard, G., Bouchoucha, M., Roy, T., Black, R., Camerlain, M., Pinard, G.,
Schang, J., and Arhan, P. (1989). Idiopathic constipation by colonic dysfunction. Relationship
with personality and anxiety. Dig Dis Sci. 34, 1428–1433.
Dickenson, A.H., and Sullivan, A.F. (1987). Subcutaneous formalin-induced activity of dorsal
horn neurones in the rat: differential response to an intrathecal opiate administered pre or post
formalin. Pain 30, 349–360.
Diogenes, A., Ferraz, C.C.R., Akopian, A.N., Henry, M.A., and Hargreaves, K.M. (2011). LPS
sensitizes TRPV1 via activation of TLR4 in trigeminal sensory neurons. J. Dent. Res. 90, 759–
764.
Doehring, A., Oertel, B.G., Sittl, R., and Lötsch, J. (2013). Chronic opioid use is associated with
increased DNA methylation correlating with increased clinical pain. Pain 154, 15–23.
Doetsch, F. (2003). The glial identity of neural stem cells. Nat. Neurosci. 6, 1127–1134.
Dominguez, E., Rivat, C., Pommier, B., Mauborgne, A., and Pohl, M. (2008). JAK/STAT3
pathway is activated in spinal cord microglia after peripheral nerve injury and contributes to
neuropathic pain development in rat. J. Neurochem. 107, 50–60.
Dominguez, E., Mauborgne, A., Mallet, J., Desclaux, M., and Pohl, M. (2010). SOCS3-mediated
blockade of JAK/STAT3 signaling pathway reveals its major contribution to spinal cord
neuroinflammation and mechanical allodynia after peripheral nerve injury. J. Neurosci. Off. J.
Soc. Neurosci. 30, 5754–5766.
Dragunow, M., and Robertson, H.A. (1988). Brain injury induces c-fos protein(s) in nerve and
glial-like cells in adult mammalian brain. Brain Res. 455, 295–299.
Dragunow, M., Goulding, M., Faull, R.L., Ralph, R., Mee, E., and Frith, R. (1990). Induction of
c-fos mRNA and protein in neurons and glia after traumatic brain injury: pharmacological
characterization. Exp. Neurol. 107, 236–248.
Drummond, P.D. (1998). Enhancement of thermal hyperalgesia by alpha-adrenoceptors in
capsaicin-treated skin. J. Auton. Nerv. Syst. 69, 96–102.
209
Drummond, P.D. (1999). Nitroprusside inhibits thermal hyperalgesia induced by noradrenaline
in capsaicin-treated skin. Pain 80, 405–412.
Drummond, P.D. (2004). Involvement of the sympathetic nervous system in complex regional
pain syndrome. Int. J. Low. Extrem. Wounds 3, 35–42.
Drummond, P.D., Skipworth, S., and Finch, P.M. (1996). alpha 1-adrenoceptors in normal and
hyperalgesic human skin. Clin. Sci. Lond. Engl. 1979 91, 73–77.
Duan, Y., Sahley, C.L., and Muller, K.J. (2009). ATP and NO dually control migration of
microglia to nerve lesions. Dev. Neurobiol. 69, 60–72.
Dubner, R., and Ruda, M.A. (1992). Activity-dependent neuronal plasticity following tissue
injury and inflammation. Trends Neurosci. 15, 96–103.
Dubový, P., Klusáková, I., Svízenská, I., and Brázda, V. (2010). Satellite glial cells express IL-6
and corresponding signal-transducing receptors in the dorsal root ganglia of rat neuropathic pain
model. Neuron Glia Biol. 6, 73–83.
Duport, S., and Garthwaite, J. (2005). Pathological consequences of inducible nitric oxide
synthase expression in hippocampal slice cultures. Neuroscience 135, 1155–1166.
Duric, V., and McCarson, K.E. (2005). Hippocampal neurokinin-1 receptor and brain-derived
neurotrophic factor gene expression is decreased in rat models of pain and stress. Neuroscience
133, 999–1006.
Duric, V., and McCarson, K.E. (2006). Persistent pain produces stress-like alterations in
hippocampal neurogenesis and gene expression. J. Pain Off. J. Am. Pain Soc. 7, 544–555.
Ebadi, M., Bashir, R.M., Heidrick, M.L., Hamada, F.M., Refaey, H.E., Hamed, A., Helal, G.,
Baxi, M.D., Cerutis, D.R., and Lassi, N.K. (1997). Neurotrophins and their receptors in nerve
injury and repair. Neurochem. Int. 30, 347–374.
Echeverry, M.B., Guimarães, F.S., and Del Bel, E.A. (2004). Acute and delayed restraint stress-
induced changes in nitric oxide producing neurons in limbic regions. Neuroscience 125, 981–
993.
Echeverry, S., Shi, X.Q., and Zhang, J. (2008). Characterization of cell proliferation in rat spinal
cord following peripheral nerve injury and the relationship with neuropathic pain. PAIN 135,
37–47.
Elahipanah, T. (2010). Identification of Candidate Genes for Neuropathic Pain at the Pain1
Locus on Mouse Chromosome 15. University of Toronto.
Emirandetti, A., Graciele Zanon, R., Sabha, M., Jr, and de Oliveira, A.L.R. (2006). Astrocyte
reactivity influences the number of presynaptic terminals apposed to spinal motoneurons after
axotomy. Brain Res. 1095, 35–42.

210
Fabry, Z., Fitzsimmons, K.M., Herlein, J.A., Moninger, T.O., Dobbs, M.B., and Hart, M.N.
(1993). Production of the cytokines interleukin 1 and 6 by murine brain microvessel endothelium
and smooth muscle pericytes. J. Neuroimmunol. 47, 23–34.
Farooque, M., Badonic, T., Olsson, Y., and Holtz, A. (1995). Astrocytic reaction after graded
spinal cord compression in rats: immunohistochemical studies on glial fibrillary acidic protein
and vimentin. J. Neurotrauma 12, 41–52.
Favaroni Mendes, L.A., and Menescal-de-Oliveira, L. (2008). Role of cholinergic, opioidergic
and GABAergic neurotransmission of the dorsal hippocampus in the modulation of nociception
in guinea pigs. Life Sci. 83, 644–650.
Ferguson, S., Mouzon, B., Kayihan, G., Wood, M., Poon, F., Doore, S., Mathura, V., Humphrey,
J., O’Steen, B., Hayes, R., et al. (2010). Apolipoprotein E genotype and oxidative stress response
to traumatic brain injury. Neuroscience 168, 811–819.
Ferraz, C.C.R., Henry, M.A., Hargreaves, K.M., and Diogenes, A. (2011). Lipopolysaccharide
from Porphyromonas gingivalis sensitizes capsaicin-sensitive nociceptors. J. Endod. 37, 45–48.
Ferrer, I., Aubourg, P., and Pujol, A. (2010). General aspects and neuropathology of X-linked
adrenoleukodystrophy. Brain Pathol. Zurich Switz. 20, 817–830.
Fillingim, R.B., King, C.D., Ribeiro-Dasilva, M.C., Rahim-Williams, B., and Riley, J.L. (2009).
Sex, gender, and pain: a review of recent clinical and experimental findings. J. Pain Off. J. Am.
Pain Soc. 10, 447–485.
Fitzgerald, M., Wall, P.D., Goedert, M., and Emson, P.C. (1985). Nerve growth factor
counteracts the neurophysiological and neurochemical effects of chronic sciatic nerve section.
Brain Res. 332, 131–141.
Fleetwood, A.J., Cook, A.D., and Hamilton, J.A. (2005). Functions of granulocyte-macrophage
colony-stimulating factor. Crit. Rev. Immunol. 25, 405–428.
Franzen, R., Bouhy, D., and Schoenen, J. (2004). Nervous system injury: focus on the
inflammatory cytokine “granulocyte-macrophage colony stimulating factor.”Neurosci. Lett. 361,
76–78.
Frazer, K.A., Eskin, E., Kang, H.M., Bogue, M.A., Hinds, D.A., Beilharz, E.J., Gupta, R.V.,
Montgomery, J., Morenzoni, M.M., Nilsen, G.B., et al. (2007). A sequence-based variation map
of 8.27 million SNPs in inbred mouse strains. Nature 448, 1050–1053.
Fuchs, P.N., Meyer, R.A., and Raja, S.N. (2001). Heat, but not mechanical hyperalgesia,
following adrenergic injections in normal human skin. Pain 90, 15–23.
Funakoshi, H., and Nakamura, T. (2001). Identification of HGF-like protein as a novel
neurotrophic factor for avian dorsal root ganglion sensory neurons. Biochem. Biophys. Res.
Commun. 283, 606–612.

211
Galli, S.J., Kalesnikoff, J., Grimbaldeston, M.A., Piliponsky, A.M., Williams, C.M.M., and Tsai,
M. (2005). MAST CELLS AS “TUNABLE” EFFECTOR AND IMMUNOREGULATORY
CELLS: Recent Advances. Annu. Rev. Immunol. 23, 749–786.
Gao, Y.-J., and Ji, R.-R. (2010). Targeting astrocyte signaling for chronic pain. Neurother. J.
Am. Soc. Exp. Neurother. 7, 482–493.
Gao, X., Ren, B., Linderoth, B., and Meyerson, B. (1996). Daily spinal cord stimulation
suppresses autotomy behavior in rats following peripheral deafferentation. Neuroscience 75,
463–470.
Gao, Y.-J., Zhang, L., Samad, O.A., Suter, M.R., Yasuhiko, K., Xu, Z.-Z., Park, J.-Y., Lind, A.-
L., Ma, Q., and Ji, R.-R. (2009). JNK-induced MCP-1 production in spinal cord astrocytes
contributes to central sensitization and neuropathic pain. J. Neurosci. Off. J. Soc. Neurosci. 29,
4096–4108.
Garrison, C.J., Dougherty, P.M., and Carlton, S.M. (1994). GFAP expression in lumbar spinal
cord of naive and neuropathic rats treated with MK-801. Exp. Neurol. 129, 237–243.
Géranton, S.M., Morenilla-Palao, C., and Hunt, S.P. (2007). A role for transcriptional repressor
methyl-CpG-binding protein 2 and plasticity-related gene serum- and glucocorticoid-inducible
kinase 1 in the induction of inflammatory pain states. J. Neurosci. Off. J. Soc. Neurosci. 27,
6163–6173.
Ghate, A., Befort, K., Becker, J.A.J., Filliol, D., Bole-Feysot, C., Demebele, D., Jost, B., Koch,
M., and Kieffer, B.L. (2007). Identification of novel striatal genes by expression profiling in
adult mouse brain. Neuroscience 146, 1182–1192.
Gibbs, G.F., Drummond, P.D., Finch, P.M., and Phillips, J.K. (2008). Unravelling the
pathophysiology of complex regional pain syndrome: focus on sympathetically maintained pain.
Clin. Exp. Pharmacol. Physiol. 35, 717–724.
Gibson, S.J., Polak, J.M., Bloom, S.R., and Wall, P.D. (1981). The distribution of nine peptides
in rat spinal cord with special emphasis on the substantia gelatinosa and on the area around the
central canal (lamina X). J. Comp. Neurol. 201, 65–79.
Gilmore, S.A., and Skinner, R.D. (1979). Intraspinal non-neuronal cellular responses to
peripheral nerve injury. Anat. Rec. 194, 369–387.
Di Giovanni, S., Knoblach, S.M., Brandoli, C., Aden, S.A., Hoffman, E.P., and Faden, A.I.
(2003). Gene profiling in spinal cord injury shows role of cell cycle in neuronal death. Ann.
Neurol. 53, 454–468.
Di Giovanni, S., Faden, A.I., Yakovlev, A., Duke-Cohan, J.S., Finn, T., Thouin, M., Knoblach,
S., De Biase, A., Bregman, B.S., and Hoffman, E.P. (2005). Neuronal plasticity after spinal cord
injury: identification of a gene cluster driving neurite outgrowth. Faseb J. Off. Publ. Fed. Am.
Soc. Exp. Biol. 19, 153–154.

212
Giulian, D., and Ingeman, J.E. (1988). Colony-stimulating factors as promoters of ameboid
microglia. J. Neurosci. Off. J. Soc. Neurosci. 8, 4707–4717.
Gonzales, R., Sherbourne, C.D., Goldyne, M.E., and Levine, J.D. (1991). Noradrenaline-induced
prostaglandin production by sympathetic postganglionic neurons is mediated by alpha 2-
adrenergic receptors. J. Neurochem. 57, 1145–1150.
Gorio, A., Gokmen, N., Erbayraktar, S., Yilmaz, O., Madaschi, L., Cichetti, C., Di Giulio, A.M.,
Vardar, E., Cerami, A., and Brines, M. (2002). Recombinant human erythropoietin counteracts
secondary injury and markedly enhances neurological recovery from experimental spinal cord
trauma. Proc. Natl. Acad. Sci. U. S. A. 99, 9450–9455.
Gorman, A.L., Yu, C.G., Ruenes, G.R., Daniels, L., and Yezierski, R.P. (2001). Conditions
affecting the onset, severity, and progression of a spontaneous pain-like behavior after
excitotoxic spinal cord injury. J. Pain Off. J. Am. Pain Soc. 2, 229–240.
Govrin-Lippmann, R., and Devor, M. (1978). Ongoing activity in severed nerves: source and
variation with time. Brain Res. 159, 406–410.
Grasso, G., Sfacteria, A., Erbayraktar, S., Passalacqua, M., Meli, F., Gokmen, N., Yilmaz, O., La
Torre, D., Buemi, M., Iacopino, D.G., et al. (2006). Amelioration of spinal cord compressive
injury by pharmacological preconditioning with erythropoietin and a nonerythropoietic
erythropoietin derivative. J. Neurosurg. Spine 4, 310–318.
Grasso, G., Graziano, F., Sfacteria, A., Carletti, F., Meli, F., Maugeri, R., Passalacqua, M., Certo,
F., Fazio, M., Buemi, M., et al. (2009). Neuroprotective effect of erythropoietin and darbepoetin
alfa after experimental intracerebral hemorrhage. Neurosurgery 65, 763–769; discussion 769–
770.
Gray, H. (1918). Anatomy of the human body (Philadelphia: Lea & Febiger).
Grelik, C., Bennett, G.J., and Ribeiro-da-Silva, A. (2005a). Autonomic fibre sprouting and
changes in nociceptive sensory innervation in the rat lower lip skin following chronic
constriction injury. Eur. J. Neurosci. 21, 2475–2487.
Grelik, C., Allard, S., and Ribeiro-da-Silva, A. (2005b). Changes in nociceptive sensory
innervation in the epidermis of the rat lower lip skin in a model of neuropathic pain. Neurosci.
Lett. 389, 140–145.
Griffin, R.S., Costigan, M., Brenner, G.J., Ma, C.H.E., Scholz, J., Moss, A., Allchorne, A.J.,
Stahl, G.L., and Woolf, C.J. (2007). Complement induction in spinal cord microglia results in
anaphylatoxin C5a-mediated pain hypersensitivity. J. Neurosci. Off. J. Soc. Neurosci. 27, 8699–
8708.
Guo, L.-H., and Schluesener, H.J. (2007). The innate immunity of the central nervous system in
chronic pain: the role of Toll-like receptors. Cell. Mol. Life Sci. Cmls 64, 1128–1136.
213
Guo, F., Maeda, Y., Ma, J., Delgado, M., Sohn, J., Miers, L., Ko, E.M., Bannerman, P., Xu, J.,
Wang, Y., et al. (2011). Macroglial plasticity and the origins of reactive astroglia in experimental
autoimmune encephalomyelitis. J. Neurosci. Off. J. Soc. Neurosci. 31, 11914–11928.
Guthridge, M.A., Powell, J.A., Barry, E.F., Stomski, F.C., McClure, B.J., Ramshaw, H., Felquer,
F.A., Dottore, M., Thomas, D.T., To, B., et al. (2006). Growth factor pleiotropy is controlled by
a receptor Tyr/Ser motif that acts as a binary switch. Embo J. 25, 479–489.
Hama, A.T., Pappas, G.D., and Sagen, J. (1996). Adrenal medullary implants reduce
transsynaptic degeneration in the spinal cord of rats following chronic constriction nerve injury.
Exp. Neurol. 137, 81–93.
Hameed, H., Hameed, M., and Christo, P.J. (2010). The effect of morphine on glial cells as a
potential therapeutic target for pharmacological development of analgesic drugs. Curr. Pain
Headache Rep. 14, 96–104.
Hamilton, J.A. (2002). GM-CSF in inflammation and autoimmunity. Trends Immunol. 23, 403–
408.
Hamilton, J.A. (2008). Colony-stimulating factors in inflammation and autoimmunity. Nat. Rev.
Immunol. 8, 533–544.
Hardiman, G. (2009). Microarray Innovations: Technology and Experimentation (CRC Press).
Hassan, F., Ren, D., Zhang, W., Merkel, T.J., and Gu, X.-X. (2012). Moraxella catarrhalis
Activates Murine Macrophages through Multiple Toll Like Receptors and Has Reduced
Clearance in Lungs from TLR4 Mutant Mice. Plos One 7, e37610.
Hasselblatt, M., Ehrenreich, H., and Sirén, A.-L. (2006). The brain erythropoietin system and its
potential for therapeutic exploitation in brain disease. J. Neurosurg. Anesthesiol. 18, 132–138.
Hercus, T.R., Thomas, D., Guthridge, M.A., Ekert, P.G., King-Scott, J., Parker, M.W., and
Lopez, A.F. (2009). The granulocyte-macrophage colony-stimulating factor receptor: linking its
structure to cell signaling and its role in disease. Blood 114, 1289–1298.
Hercus, T.R., Dhagat, U., Kan, W.L.T., Broughton, S.E., Nero, T.L., Perugini, M., Sandow, J.J.,
D’Andrea, R.J., Ekert, P.G., Hughes, T., et al. (2013). Signalling by the βc family of cytokines.
Cytokine Growth Factor Rev. 24, 189–201.
Herrmann, J.E., Imura, T., Song, B., Qi, J., Ao, Y., Nguyen, T.K., Korsak, R.A., Takeda, K.,
Akira, S., and Sofroniew, M.V. (2008). STAT3 is a critical regulator of astrogliosis and scar
formation after spinal cord injury. J. Neurosci. Off. J. Soc. Neurosci. 28, 7231–7243.
Hicken, B. (2002). Classifiction of spinal cord injury pain: literature review and future
directions. In Spinal Cord Injury Pain: Assessment, Mechanisms, Management, (Seattle: IASP
Press), pp. 25–38.

214
Ho, Y.-C., Cheng, J.-K., and Chiou, L.-C. (2013). Hypofunction of glutamatergic
neurotransmission in the periaqueductal gray contributes to nerve-injury-induced neuropathic
pain. J. Neurosci. Off. J. Soc. Neurosci. 33, 7825–7836.
Höke, A., and Keswani, S.C. (2005). Neuroprotection in the PNS: erythropoietin and
immunophilin ligands. Ann. N. Y. Acad. Sci. 1053, 491–501.
Honda, C.N., and Lee, C.L. (1985). Immunohistochemistry of synaptic input and functional
characterizations of neurons near the spinal central canal. Brain Res. 343, 120–128.
Honda, C.N., and Perl, E.R. (1985). Functional and morphological features of neurons in the
midline region of the caudal spinal cord of the cat. Brain Res. 340, 285–295.
Hong, Y., and Abbott, F.V. (1996). Contribution of peripheral alpha 1A-adrenoceptors to pain
induced by formalin or by alpha-methyl-5-hydroxytryptamine plus noradrenaline. Eur. J.
Pharmacol. 301, 41–48.
Horvath, R.J., Nutile-McMenemy, N., Alkaitis, M.S., and Deleo, J.A. (2008). Differential
migration, LPS-induced cytokine, chemokine, and NO expression in immortalized BV-2 and
HAPI cell lines and primary microglial cultures. J. Neurochem. 107, 557–569.
Hu, P., and McLachlan, E.M. (2003). Distinct functional types of macrophage in dorsal root
ganglia and spinal nerves proximal to sciatic and spinal nerve transections in the rat. Exp.
Neurol. 184, 590–605.
Hu, Y., Yang, J., Hu, Y., Wang, Y., and Li, W. (2010). Amitriptyline rather than lornoxicam
ameliorates neuropathic pain-induced deficits in abilities of spatial learning and memory. Eur. J.
Anaesthesiol. 27, 162–168.
Huang, Y., Erdmann, N., Peng, H., Zhao, Y., and Zheng, J. (2005). The role of TNF related
apoptosis-inducing ligand in neurodegenerative diseases. Cell. Mol. Immunol. 2, 113–122.
Hudspith, M., Siddall, Phillip, and Munglani, Rajesh (2006). Physiology of Pain. In Foundations
of Anesthesia, (Elsevier Mosby),.
Hulsebosch, C.E. (2002). Pharmacology of chronic pain after spinal cord injury: novel acute and
chronic intervention strategies. In Spinal Injury Pain: Assessment, Mechanism, Management,
Progess in Pain Research and Management, (Seattle: IASP Press), pp. 189–204.
Hulsebosch, C.E., Xu, G.-Y., Perez, P.J., Westlund, K.N., Taylor, C., and McAdoo, D.J. (2000).
Rodent model of chronic central pain after spinal cord contusion injury and effects of
gabapentin. J neurotrauma 17, 1205–1217.
Humbert, M., Corrigan, C.J., Kimmitt, P., Till, S.J., Kay, A.B., and Durham, S.R. (1997).
Relationship between IL-4 and IL-5 mRNA expression and disease severity in atopic asthma.
Am. J. Respir. Crit. Care Med. 156, 704–708.
Hutchinson, M.R., Zhang, Y., Brown, K., Coats, B.D., Shridhar, M., Sholar, P.W., Patel, S.J.,
Crysdale, N.Y., Harrison, J.A., Maier, S.F., et al. (2008). Non-stereoselective reversal of

215
neuropathic pain by naloxone and naltrexone: involvement of toll-like receptor 4 (TLR4). Eur. J.
Neurosci. 28, 20–29.
Hutter, E., Boridy, S., Labrecque, S., Lalancette-Hébert, M., Kriz, J., Winnik, F.M., and
Maysinger, D. (2010). Microglial response to gold nanoparticles. Acs Nano 4, 2595–2606.
Imado, T., Iwasaki, T., Kitano, S., Satake, A., Kuroiwa, T., Tsunemi, S., and Sano, H. (2010).
The protective role of host Toll-like receptor-4 in acute graft-versus-host disease.
Transplantation 90, 1063–1070.
Itoh, T., Muto, A., Watanabe, S., Miyajima, A., Yokota, T., and Arai, K. (1996). Granulocyte-
macrophage colony-stimulating factor provokes RAS activation and transcription of c-fos
through different modes of signaling. J. Biol. Chem. 271, 7587–7592.
Jacquet, B.V., Salinas-Mondragon, R., Liang, H., Therit, B., Buie, J.D., Dykstra, M., Campbell,
K., Ostrowski, L.E., Brody, S.L., and Ghashghaei, H.T. (2009). FoxJ1-dependent gene
expression is required for differentiation of radial glia into ependymal cells and a subset of
astrocytes in the postnatal brain. Dev. Camb. Engl. 136, 4021–4031.
Jensen, T., and Nikolajsen, L. (1999). Phantom pain and other phenomena after amputation. In
Textbook of Pain, (New York: Churchill Livingstone), pp. 799–814.
Ji, R.-R., and Suter, M.R. (2007). p38 MAPK, microglial signaling, and neuropathic pain. Mol.
Pain 3, 33.
Ji, R.-R., Gereau, R.W., 4th, Malcangio, M., and Strichartz, G.R. (2009). MAP kinase and pain.
Brain Res. Rev. 60, 135–148.
Jiang, S.X., Slinn, J., Aylsworth, A., and Hou, S.T. (2012). Vimentin participates in microglia
activation and neurotoxicity in cerebral ischemia. J. Neurochem. 122, 764–774.
Jo, D., Chapman, C.R., and Light, A.R. (2009). Glial Mechanisms of Neuropathic Pain and
Emerging Interventions. Korean J. Pain 22, 1.
Jubinsky, P.T., Krijanovski, O.I., Nathan, D.G., Tavernier, J., and Sieff, C.A. (1997). The beta
chain of the interleukin-3 receptor functionally associates with the erythropoietin receptor. Blood
90, 1867–1873.
Julius, D., and Basbaum, A.I. (2001). Molecular mechanisms of nociception. Nature 413, 203–
210.
Kaisho, T., and Akira, S. (2006). Toll-like receptor function and signaling. J. Allergy Clin.
Immunol. 117, 979–987; quiz 988.
Kajander, K.C., and Bennett, G.J. (1992). Onset of a painful peripheral neuropathy in rat: a
partial and differential deafferentation and spontaneous discharge in A beta and A delta primary
afferent neurons. J. Neurophysiol. 68, 734–744.

216
Kao, C.-J., Chiang, Y.-J., Chen, P.-H., Lin, K.-R., Hwang, P.-I., Yang-Yen, H.-F., and Yen, J.J.-
Y. (2008). CBAP interacts with the un-liganded common beta-subunit of the GM-CSF/IL-3/IL-5
receptor and induces apoptosis via mitochondrial dysfunction. Oncogene 27, 1397–1403.
Kauppila, T. (1998). Correlation between autotomy-behavior and current theories of neuropathic
pain. Neurosci. Biobehav. Rev. 23, 111–129.
Kaushansky, K. (2006). Lineage-specific hematopoietic growth factors. N. Engl. J. Med. 354,
2034–2045.
Kawai, T., and Akira, S. (2007). TLR signaling. Semin. Immunol. 19, 24–32.
Kawasaki, Y., Zhang, L., Cheng, J.-K., and Ji, R.-R. (2008). Cytokine mechanisms of central
sensitization: distinct and overlapping role of interleukin-1beta, interleukin-6, and tumor necrosis
factor-alpha in regulating synaptic and neuronal activity in the superficial spinal cord. J.
Neurosci. Off. J. Soc. Neurosci. 28, 5189–5194.
Khanna, S., Chang, L.S., Jiang, F., and Koh, H.C. (2004). Nociception-driven decreased
induction of Fos protein in ventral hippocampus field CA1 of the rat. Brain Res. 1004, 167–176.
Kim, S.H., and Chung, J.M. (1992). An experimental model for peripheral neuropathy produced
by segmental spinal nerve ligation in the rat. Pain 50, 355–363.
Kim, D., Heo, S., Ahn, M., Sim, K., and Shin, T. (2003). Activation of embryonic intermediate
filaments contributes to glial scar formation after spinal cord injury in rats. J. Vet. Sci. 4, 109–
112.
Kim, D., Lee, S., and Lee, S.J. (2009a). Toll-like receptors in peripheral nerve injury and
neuropathic pain. Curr. Top. Microbiol. Immunol. 336, 169–186.
Kim, D.-S., Figueroa, K.W., Li, K.-W., Boroujerdi, A., Yolo, T., and Luo, Z.D. (2009b).
Profiling of dynamically changed gene expression in dorsal root ganglia post peripheral nerve
injury and a critical role of injury-induced glial fibrillary acidic protein in maintenance of pain
behaviors [corrected]. Pain 143, 114–122.
Kim, H.J., Na, H.S., Back, S.K., and Hong, S.K. (2001). Sympathetic sprouting in sensory
ganglia depends on the number of injured neurons. Neuroreport 12, 3529–3532.
Kim, Y., Remacle, A.G., Chernov, A.V., Liu, H., Shubayev, I., Lai, C., Dolkas, J., Shiryaev,
S.A., Golubkov, V.S., Mizisin, A.P., et al. (2012). The MMP-9/TIMP-1 axis controls the status
of differentiation and function of myelin-forming Schwann cells in nerve regeneration. Plos One
7, e33664.
King, V.R., Averill, S.A., Hewazy, D., Priestley, J.V., Torup, L., and Michael-Titus, A.T.
(2007). Erythropoietin and carbamylated erythropoietin are neuroprotective following spinal
cord hemisection in the rat. Eur. J. Neurosci. 26, 90–100.

217
Kirsch, F., Krüger, C., and Schneider, A. (2008). The receptor for granulocyte-colony
stimulating factor (G-CSF) is expressed in radial glia during development of the nervous system.
Bmc Dev. Biol. 8, 32.
Knabe, W., Sirén, A.-L., Ehrenreich, H., and Kuhn, H.-J. (2005). Expression patterns of
erythropoietin and its receptor in the developing spinal cord and dorsal root ganglia. Anat.
Embryol. (Berl.) 210, 209–219.
Ko, J., Na, D.S., Lee, Y.H., Shin, S.Y., Kim, J.H., Hwang, B.G., Min, B.-I., and Park, D.S.
(2002). cDNA microarray analysis of the differential gene expression in the neuropathic pain and
electroacupuncture treatment models. J. Biochem. Mol. Biol. 35, 420–427.
Kohli, D.R., Li, Y., Khasabov, S.G., Gupta, P., Kehl, L.J., Ericson, M.E., Nguyen, J., Gupta, V.,
Hebbel, R.P., Simone, D.A., et al. (2010). Pain-related behaviors and neurochemical alterations
in mice expressing sickle hemoglobin: modulation by cannabinoids. Blood 116, 456–465.
De Kok, J.B., Roelofs, R.W., Giesendorf, B.A., Pennings, J.L., Waas, E.T., Feuth, T., Swinkels,
D.W., and Span, P.N. (2005). Normalization of gene expression measurements in tumor tissues:
comparison of 13 endogenous control genes. Lab. Investig. J. Tech. Methods Pathol. 85, 154–
159.
Kõks, S., Fernandes, C., Kurrikoff, K., Vasar, E., and Schalkwyk, L.C. (2008). Gene expression
profiling reveals upregulation of Tlr4 receptors in Cckb receptor deficient mice. Behav. Brain
Res. 188, 62–70.
Korostynski, M., Piechota, M., Kaminska, D., Solecki, W., and Przewlocki, R. (2007). Morphine
effects on striatal transcriptome in mice. Genome Biol. 8, R128.
Koyama, Y., Takemura, M., Fujiki, K., Ishikawa, N., Shigenaga, Y., and Baba, A. (1999).
BQ788, an endothelin ET(B) receptor antagonist, attenuates stab wound injury-induced reactive
astrocytes in rat brain. Glia 26, 268–271.
Krieger, M., Both, M., Kranig, S.A., Pitzer, C., Klugmann, M., Vogt, G., Draguhn, A., and
Schneider, A. (2012). The hematopoietic cytokine granulocyte-macrophage colony stimulating
factor is important for cognitive functions. Sci. Reports 2, 697.
Kroenke, M.A., Chensue, S.W., and Segal, B.M. (2010). EAE mediated by a non-IFN-γ/non-IL-
17 pathway. Eur. J. Immunol. 40, 2340–2348.
Krüger, C., Laage, R., Pitzer, C., Schäbitz, W.-R., and Schneider, A. (2007). The hematopoietic
factor GM-CSF (granulocyte-macrophage colony-stimulating factor) promotes neuronal
differentiation of adult neural stem cells in vitro. Bmc Neurosci. 8, 88.
Krupina, N., Khlebnikova, N., Orlova, I., Grafova, V., Smirnova, V., Rodina, V., Kukushkin, M.,
and Kryzhanovsky, G. (2010). Experimental model of combined pain and depression status in
rats. Bull Exp Biol Med. 149, 479–484.

218
Kuang, X., Huang, Y., Gu, H.-F., Zu, X.-Y., Zou, W.-Y., Song, Z.-B., and Guo, Q.-L. (2012).
Effects of intrathecal epigallocatechin gallate, an inhibitor of Toll-like receptor 4, on chronic
neuropathic pain in rats. Eur. J. Pharmacol. 676, 51–56.
Kuboyama, K., Tsuda, M., Tsutsui, M., Toyohara, Y., Tozaki-Saitoh, H., Shimokawa, H.,
Yanagihara, N., and Inoue, K. (2011). Reduced spinal microglial activation and neuropathic pain
after nerve injury in mice lacking all three nitric oxide synthases. Mol. Pain 7, 50.
Lacroix-Fralish, M.L., Tawfik, V.L., Tanga, F.Y., Spratt, K.F., and DeLeo, J.A. (2006).
Differential spinal cord gene expression in rodent models of radicular and neuropathic pain.
Anesthesiology 104, 1283–1292.
LaMotte, C.C. (1987). Vasoactive intestinal polypeptide cerebrospinal fluid-contacting neurons
of the monkey and cat spinal central canal. J. Comp. Neurol. 258, 527–541.
Lan, L.S., Ping, Y.J., Na, W.L., Miao, J., Cheng, Q.Q., Ni, M.Z., Lei, L., Fang, L.C., Guang,
R.C., Jin, Z., et al. (2010). Down-regulation of Toll-like receptor 4 gene expression by short
interfering RNA attenuates bone cancer pain in a rat model. Mol. Pain 6, 2.
Lathe, R. (2001). Hormones and the hippocampus. J. Endocrinol. 169, 205–231.
Latremoliere, A., and Woolf, C.J. (2009). Central sensitization: a generator of pain
hypersensitivity by central neural plasticity. J. Pain Off. J. Am. Pain Soc. 10, 895–926.
Latrémolière, A., Mauborgne, A., Masson, J., Bourgoin, S., Kayser, V., Hamon, M., and Pohl,
M. (2008). Differential implication of proinflammatory cytokine interleukin-6 in the
development of cephalic versus extracephalic neuropathic pain in rats. J. Neurosci. Off. J. Soc.
Neurosci. 28, 8489–8501.
Ledeboer, A., Sloane, E.M., Milligan, E.D., Frank, M.G., Mahony, J.H., Maier, S.F., and
Watkins, L.R. (2005). Minocycline attenuates mechanical allodynia and proinflammatory
cytokine expression in rat models of pain facilitation. Pain 115, 71–83.
LeDoux, M.S., Xu, L., Xiao, J., Ferrell, B., Menkes, D.L., and Homayouni, R. (2006). Murine
central and peripheral nervous system transcriptomes: comparative gene expression. Brain Res.
1107, 24–41.
Lee, D.H., Liu, X., Kim, H.T., Chung, K., and Chung, J.M. (1999a). Receptor subtype mediating
the adrenergic sensitivity of pain behavior and ectopic discharges in neuropathic Lewis rats. J.
Neurophysiol. 81, 2226–2233.
Lee, S.F., Huang, H.M., Chao, J.R., Lin, S., Yang-Yen, H.F., and Yen, J.J. (1999b). Cytokine
receptor common beta chain as a potential activator of cytokine withdrawal-induced apoptosis.
Mol. Cell. Biol. 19, 7399–7409.
Leichtle, A., Lai, Y., Wollenberg, B., Wasserman, S.I., and Ryan, A.F. (2011). Innate signaling
in otitis media: pathogenesis and recovery. Curr. Allergy Asthma Rep. 11, 78–84.

219
Leist, M., Ghezzi, P., Grasso, G., Bianchi, R., Villa, P., Fratelli, M., Savino, C., Bianchi, M.,
Nielsen, J., Gerwien, J., et al. (2004). Derivatives of erythropoietin that are tissue protective but
not erythropoietic. Science 305, 239–242.
Levitt, M. (1985). Dysesthesias and self-mutilation in humans and subhumans: a review of
clinical and experimental studies. Brain Res. 357, 247–290.
Lewis, S.S., Loram, L.C., Hutchinson, M.R., Li, C.-M., Zhang, Y., Maier, S.F., Huang, Y., Rice,
K.C., and Watkins, L.R. (2012). (+)-naloxone, an opioid-inactive toll-like receptor 4 signaling
inhibitor, reverses multiple models of chronic neuropathic pain in rats. J. Pain Off. J. Am. Pain
Soc. 13, 498–506.
Liao, G., Wang, J., Guo, J., Allard, J., Cheng, J., Ng, A., Shafer, S., Puech, A., McPherson, J.D.,
Foernzler, D., et al. (2004). In silico genetics: identification of a functional element regulating
H2-Ealpha gene expression. Science 306, 690–695.
Liao, Z.B., Zhi, X.G., Shi, Q.H., and He, Z.H. (2008). Recombinant human erythropoietin
administration protects cortical neurons from traumatic brain injury in rats. Eur. J. Neurol. Off. J.
Eur. Fed. Neurol. Soc. 15, 140–149.
Lim, G., Wang, S., Zhang, Y., Tian, Y., and Mao, J. (2009). Spinal leptin contributes to the
pathogenesis of neuropathic pain in rodents. J. Clin. Invest. 119, 295–304.
Lin, H.-W., and Levison, S.W. (2009). Context-dependent IL-6 potentiation of interferon-
gamma-induced IL-12 secretion and CD40 expression in murine microglia. J. Neurochem. 111,
808–818.
Lin, Q., Zou, X., Fang, L., and Willis, W.D. (2003). Sympathetic modulation of acute cutaneous
flare induced by intradermal injection of capsaicin in anesthetized rats. J. Neurophysiol. 89, 853–
861.
Liou, J.-T., Sum, D.C.-W., Liu, F.-C., Mao, C.-C., Lai, Y.-S., and Day, Y.-J. (2013). Spatial and
temporal analysis of nociception-related spinal cord matrix metalloproteinase expression in a
murine neuropathic pain model. J. Chin. Med. Assoc. Jcma 76, 201–210.
Lipnicki, D.M., and Drummond, P.D. (2001). Vascular and nociceptive effects of localized
prolonged sympathetic blockade in human skin. Auton. Neurosci. Basic Clin. 88, 86–93.
Liu, M.-G., and Chen, J. (2009). Roles of the hippocampal formation in pain information
processing. Neurosci. Bull. 25, 237–266.
Liu, H., Shiryaev, S.A., Chernov, A.V., Kim, Y., Shubayev, I., Remacle, A.G., Baranovskaya,
S., Golubkov, V.S., Strongin, A.Y., and Shubayev, V.I. (2012a). Immunodominant fragments of
myelin basic protein initiate T cell-dependent pain. J. Neuroinflammation 9, 119.
Liu, L., Coller, J.K., Watkins, L.R., Somogyi, A.A., and Hutchinson, M.R. (2011). Naloxone-
precipitated morphine withdrawal behavior and brain IL-1β expression: comparison of different
mouse strains. Brain. Behav. Immun. 25, 1223–1232.

220
Liu, S., Yang, J., Wang, L., Jiang, M., Qiu, Q., Ma, Z., Liu, L., Li, C., Ren, C., Zhou, J., et al.
(2010). Tibia tumor-induced cancer pain involves spinal p38 mitogen-activated protein kinase
activation via TLR4-dependent mechanisms. Brain Res. 1346, 213–223.
Liu, T., Gao, Y.-J., and Ji, R.-R. (2012b). Emerging role of Toll-like receptors in the control of
pain and itch. Neurosci. Bull. 28, 131–144.
Liu, X., Tian, Y., Lu, N., Gin, T., Cheng, C.H.K., and Chan, M.T.V. (2013). Stat3 Inhibition
Attenuates Mechanical Allodynia through Transcriptional Regulation of Chemokine Expression
in Spinal Astrocytes. Plos One 8.
Livneh-Fuchs, J. (2005). Risk factors for chronic pain in women following breast surgery due to
cancer, in neurobioloby/cancer research. Hebrew University.
Loesch, A., Tang, H., Cotter, M.A., and Cameron, N.E. (2010). Sciatic nerve of diabetic rat
treated with epoetin delta: effects on C-fibers and blood vessels including pericytes. Angiology
61, 651–668.
Lombard, M.C., Nashold, B.S., Jr, Albe-Fessard, D., Salman, N., and Sakr, C. (1979).
Deafferentation hypersensitivity in the rat after dorsal rhizotomy: a possible animal model of
chronic pain. Pain 6, 163–174.
Lopez, A.F., Sanderson, C.J., Gamble, J.R., Campbell, H.D., Young, I.G., and Vadas, M.A.
(1988). Recombinant human interleukin 5 is a selective activator of human eosinophil function.
J. Exp. Med. 167, 219–224.
Lopez, A.F., Hercus, T.R., Ekert, P., Littler, D.R., Guthridge, M., Thomas, D., Ramshaw, H.S.,
Stomski, F., Perugini, M., D’Andrea, R., et al. (2010). Molecular basis of cytokine receptor
activation. Iubmb Life 62, 509–518.
Maeda, T., Kiguchi, N., Kobayashi, Y., Ikuta, T., Ozaki, M., and Kishioka, S. (2009). Leptin
derived from adipocytes in injured peripheral nerves facilitates development of neuropathic pain
via macrophage stimulation. Proc. Natl. Acad. Sci. U. S. A. 106, 13076–13081.
Maresz, K., Carrier, E.J., Ponomarev, E.D., Hillard, C.J., and Dittel, B.N. (2005). Modulation of
the cannabinoid CB2 receptor in microglial cells in response to inflammatory stimuli. J.
Neurochem. 95, 437–445.
Martucci, C., Trovato, A.E., Costa, B., Borsani, E., Franchi, S., Magnaghi, V., Panerai, A.E.,
Rodella, L.F., Valsecchi, A.E., Sacerdote, P., et al. (2008). The purinergic antagonist PPADS
reduces pain related behaviours and interleukin-1 beta, interleukin-6, iNOS and nNOS
overproduction in central and peripheral nervous system after peripheral neuropathy in mice.
Pain 137, 81–95.
Matsui, T., Svensson, C.I., Hirata, Y., Mizobata, K., Hua, X.-Y., and Yaksh, T.L. (2010).
Release of prostaglandin E(2) and nitric oxide from spinal microglia is dependent on activation
of p38 mitogen-activated protein kinase. Anesth. Analg. 111, 554–560.

221
Matsushita, M. (1998). Ascending propriospinal afferents to area X (substantia grisea centralis)
of the spinal cord in the rat. Exp. Brain Res. Exp. Hirnforsch. Expérimentation Cérébrale 119,
356–366.
McKenna, J.E., and Melzack, R. (1992). Analgesia produced by lidocaine microinjection into the
dentate gyrus. Pain 49, 105–112.
McKenna, J.E., and Melzack, R. (2001). Blocking NMDA receptors in the hippocampal dentate
gyrus with AP5 produces analgesia in the formalin pain test. Exp. Neurol. 172, 92–99.
McLachlan, E.M., Jänig, W., Devor, M., and Michaelis, M. (1993). Peripheral nerve injury
triggers noradrenergic sprouting within dorsal root ganglia. Nature 363, 543–546.
McLay, R.N., Kimura, M., Banks, W.A., and Kastin, A.J. (1997). Granulocyte-macrophage
colony-stimulating factor crosses the blood--brain and blood--spinal cord barriers. Brain J.
Neurol. 120 ( Pt 11), 2083–2091.
McMahon, S.B., Cafferty, W.B.J., and Marchand, F. (2005). Immune and glial cell factors as
pain mediators and modulators. Exp. Neurol. 192, 444–462.
Meads, M.B., Li, Z.-W., and Dalton, W.S. (2010). A novel TNF receptor-associated factor 6
binding domain mediates NF-kappa B signaling by the common cytokine receptor beta subunit.
J. Immunol. Baltim. Md 1950 185, 1606–1615.
Méchaly, I., Bourane, S., Piquemal, D., Al-Jumaily, M., Ventéo, S., Puech, S., Scamps, F.,
Valmier, J., and Carroll, P. (2006). Gene profiling during development and after a peripheral
nerve traumatism reveals genes specifically induced by injury in dorsal root ganglia. Mol. Cell.
Neurosci. 32, 217–229.
Medana, I.M., Day, N.P.J., Hien, T.T., White, N.J., and Turner, G.D.H. (2009). Erythropoietin
and its receptors in the brainstem of adults with fatal falciparum malaria. Malar. J. 8, 261.
Meletis, K., Barnabé-Heider, F., Carlén, M., Evergren, E., Tomilin, N., Shupliakov, O., and
Frisén, J. (2008). Spinal cord injury reveals multilineage differentiation of ependymal cells. Plos
Biol. 6, e182.
Melzack, R. (2005). Evolution of the neuromatrix theory of pain. The Prithvi Raj Lecture:
presented at the third World Congress of World Institute of Pain, Barcelona 2004. Pain Pr. Off. J.
World Inst. Pain 5, 85–94.
Melzack, R. (2008). The future of pain. Nat. Rev. Drug Discov. 7, 629.
Melzack, R., and Casey, K. (1968). Sensory, motivational, and central control determinants of
pain. In The Skin Senses, (Springfield, IL: Charles C. Thomas), pp. 423–439.
Menétrey, D., Chaouch, A., Binder, D., and Besson, J.M. (1982). The origin of the
spinomesencephalic tract in the rat: an anatomical study using the retrograde transport of
horseradish peroxidase. J. Comp. Neurol. 206, 193–207.

222
Mera, A., Suga, M., Ando, M., Suda, T., and Yamaguchi, N. (1999). Induction of cell shape
changes through activation of the interleukin-3 common beta chain receptor by the RON
receptor-type tyrosine kinase. J. Biol. Chem. 274, 15766–15774.
Merskey, H., and Bogduk, N. (1994). Classification of Chronic Pain Descriptions of Chronic
Pain Syndromes and Definitions of Pain Terms Second Edition.
Metcalf, D., Begley, C.G., Williamson, D.J., Nice, E.C., De Lamarter, J., Mermod, J.J., Thatcher,
D., and Schmidt, A. (1987). Hemopoietic responses in mice injected with purified recombinant
murine GM-CSF. Exp. Hematol. 15, 1–9.
Meunier, A., Latrémolière, A., Dominguez, E., Mauborgne, A., Philippe, S., Hamon, M., Mallet,
J., Benoliel, J.-J., and Pohl, M. (2007). Lentiviral-mediated targeted NF-kappaB blockade in
dorsal spinal cord glia attenuates sciatic nerve injury-induced neuropathic pain in the rat. Mol.
Ther. J. Am. Soc. Gene Ther. 15, 687–697.
Michael, G.J., Kaya, E., Averill, S., Rattray, M., Clary, D.O., and Priestley, J.V. (1997). TrkA
immunoreactive neurones in the rat spinal cord. J. Comp. Neurol. 385, 441–455.
Milligan, E.D., and Watkins, L.R. (2009). Pathological and protective roles of glia in chronic
pain. Nat. Rev. Neurosci. 10, 23–36.
Milligan, E.D., Zapata, V., Chacur, M., Schoeniger, D., Biedenkapp, J., O’Connor, K.A., Verge,
G.M., Chapman, G., Green, P., Foster, A.C., et al. (2004). Evidence that exogenous and
endogenous fractalkine can induce spinal nociceptive facilitation in rats. Eur. J. Neurosci. 20,
2294–2302.
Milligan, E.D., Sloane, E.M., and Watkins, L.R. (2008). Glia in pathological pain: a role for
fractalkine. J. Neuroimmunol. 198, 113–120.
Minert, A., Gabay, E., Dominguez, C., Wiesenfeld-Hallin, Z., and Devor, M. (2007a).
Spontaneous pain following spinal nerve injury in mice. Exp. Neurol. 206, 220–230.
Minert, A., Gabay, E., Dominguez, C., Wiesenfeld-Hallin, Z., and Devor, M. (2007b).
Spontaneous pain following spinal nerve injury in mice. Exp. Neurol. 206, 220–230.
Mirski, R., Reichert, F., Klar, A., and Rotshenker, S. (2003). Granulocyte macrophage colony
stimulating factor (GM-CSF) activity is regulated by a GM-CSF binding molecule in Wallerian
degeneration following injury to peripheral nerve axons. J. Neuroimmunol. 140, 88–96.
Mishra, B.B., Mishra, P.K., and Teale, J.M. (2006). Expression and distribution of Toll like
receptors in the brain during murine neurocysticercosis. J. Neuroimmunol. 181, 46–56.
Mocchetti, I., De Bernardi, M.A., Szekely, A.M., Alho, H., Brooker, G., and Costa, E. (1989).
Regulation of nerve growth factor biosynthesis by beta-adrenergic receptor activation in
astrocytoma cells: a potential role of c-Fos protein. Proc. Natl. Acad. Sci. U. S. A. 86, 3891–
3895.

223
Mogil, J.S., Wilson, S.G., Bon, K., Lee, S.E., Chung, K., Raber, P., Pieper, J.O., Hain, H.S.,
Belknap, J.K., Hubert, L., et al. (1999a). Heritability of nociception I: responses of 11 inbred
mouse strains on 12 measures of nociception. Pain 80, 67–82.
Mogil, J.S., Wilson, S.G., Bon, K., Lee, S.E., Chung, K., Raber, P., Pieper, J.O., Hain, H.S.,
Belknap, J.K., Hubert, L., et al. (1999b). Heritability of nociception II. “Types” of nociception
revealed by genetic correlation analysis. Pain 80, 83–93.
Mogil, J.S., Chesler, E.J., Wilson, S.G., Juraska, J.M., and Sternberg, W.F. (2000). Sex
differences in thermal nociception and morphine antinociception in rodents depend on genotype.
Neurosci. Biobehav. Rev. 24, 375–389.
Morrison, D.C., and Ryan, J.L. (1979). Bacterial endotoxins and host immune responses. Adv.
Immunol. 28, 293–450.
Moskvina, V., Craddock, N., Holmans, P., Nikolov, I., Pahwa, J.S., Green, E., Owen, M.J., and
O’Donovan, M.C. (2009). Gene-wide analyses of genome-wide association data sets: evidence
for multiple common risk alleles for schizophrenia and bipolar disorder and for overlap in
genetic risk. Mol. Psychiatry 14, 252–260.
Mothe, A.J., and Tator, C.H. (2005). Proliferation, migration, and differentiation of endogenous
ependymal region stem/progenitor cells following minimal spinal cord injury in the adult rat.
Neuroscience 131, 177–187.
Mukaino, M., Nakamura, M., Yamada, O., Okada, S., Morikawa, S., Renault-Mihara, F.,
Iwanami, A., Ikegami, T., Ohsugi, Y., Tsuji, O., et al. (2010). Anti-IL-6-receptor antibody
promotes repair of spinal cord injury by inducing microglia-dominant inflammation. Exp.
Neurol. 224, 403–414.
Munglani, R., and Hunt, S.P. (1995). Molecular biology of pain. Br. J. Anaesth. 75, 186–192.
Nadeau, J.H., Singer, J.B., Matin, A., and Lander, E.S. (2000). Analysing complex genetic traits
with chromosome substitution strains. Nat. Genet. 24, 221–225.
Nadelhaft, I., and Booth, A.M. (1984). The location and morphology of preganglionic neurons
and the distribution of visceral afferents from the rat pelvic nerve: a horseradish peroxidase
study. J. Comp. Neurol. 226, 238–245.
Nagy, J.I., and Hunt, S.P. (1982). Fluoride-resistant acid phosphatase-containing neurones in
dorsal root ganglia are separate from those containing substance P or somatostatin. Neuroscience
7, 89–97.
Nahin, R.L., Madsen, A.M., and Giesler, G.J., Jr (1983). Anatomical and physiological studies of
the gray matter surrounding the spinal cord central canal. J. Comp. Neurol. 220, 321–335.
Nakajima, K., Graeber, M.B., Sonoda, M., Tohyama, Y., Kohsaka, S., and Kurihara, T. (2006).
In vitro proliferation of axotomized rat facial nucleus-derived activated microglia in an autocrine
fashion. J. Neurosci. Res. 84, 348–359.

224
Nakanishi, S., Masu, M., Bessho, Y., Nakajima, Y., Hayashi, Y., and Shigemoto, R. (1994).
Molecular diversity of glutamate receptors and their physiological functions. EXS 71, 71–80.
Nashold, B.S., Jr (1991). Deafferentation Pain Syndromes: Pathophysiology and treatment. In
Advances Is Pain Research and Therapy, (New York: Raven Press), pp. 301–319.
Nesic, O., Lee, J., Johnson, K.M., Ye, Z., Xu, G.-Y., Unabia, G.C., Wood, T.G., McAdoo, D.J.,
Westlund, K.N., Hulsebosch, C.E., et al. (2005). Transcriptional profiling of spinal cord injury-
induced central neuropathic pain. J. Neurochem. 95, 998–1014.
Ness, T.J., and Gebhart, G.F. (1987). Characterization of neuronal responses to noxious visceral
and somatic stimuli in the medial lumbosacral spinal cord of the rat. J. Neurophysiol. 57, 1867–
1892.
Nicholas, A.P., Zhang, X., and Hökfelt, T. (1999). An immunohistochemical investigation of the
opioid cell column in lamina X of the male rat lumbosacral spinal cord. Neurosci. Lett. 270, 9–
12.
Nicotra, L., Loram, L.C., Watkins, L.R., and Hutchinson, M.R. (2012). Toll-like receptors in
chronic pain. Exp. Neurol. 234, 316–329.
Niesters, M., Dahan, A., Kest, B., Zacny, J., Stijnen, T., Aarts, L., and Sarton, E. (2010). Do sex
differences exist in opioid analgesia? A systematic review and meta-analysis of human
experimental and clinical studies. Pain 151, 61–68.
Nimmerjahn, A., Kirchhoff, F., and Helmchen, F. (2005). Resting microglial cells are highly
dynamic surveillants of brain parenchyma in vivo. Science 308, 1314–1318.
Nissenbaum, J., Devor, M., Seltzer, Z., Gebauer, M., Michaelis, M., Tal, M., Dorfman, R.,
Abitbul-Yarkoni, M., Lu, Y., Elahipanah, T., et al. (2010). Susceptibility to chronic pain
following nerve injury is genetically affected by CACNG2. Genome Res. 20, 1180–1190.
Nojima, H., Cuellar, J.M., Simons, C.T., Carstens, M.I., and Carstens, E. (2004). Spinal c-fos
expression associated with spontaneous biting in a mouse model of dry skin pruritus. Neurosci.
Lett. 361, 79–82.
Ogura, H., Murakami, M., Okuyama, Y., Tsuruoka, M., Kitabayashi, C., Kanamoto, M.,
Nishihara, M., Iwakura, Y., and Hirano, T. (2008). Interleukin-17 promotes autoimmunity by
triggering a positive-feedback loop via interleukin-6 induction. Immunity 29, 628–636.
Ohashi, K., Burkart, V., Flohé, S., and Kolb, H. (2000). Cutting edge: heat shock protein 60 is a
putative endogenous ligand of the toll-like receptor-4 complex. J. Immunol. Baltim. Md 1950
164, 558–561.
Okun, E., Griffioen, K.J., and Mattson, M.P. (2011). Toll-like receptor signaling in neural
plasticity and disease. Trends Neurosci. 34, 269–281.

225
Ongioco, R.R., Richardson, C.D., Rudner, X.L., Stafford-Smith, M., and Schwinn, D.A. (2000).
Alpha2-adrenergic receptors in human dorsal root ganglia: predominance of alpha2b and alpha2c
subtype mRNAs. Anesthesiology 92, 968–976.
Palkovits, M., Deli, M.A., Gallatz, K., Tóth, Z.E., Buzás, E., and Falus, A. (2007). Highly
activated c-fos expression in specific brain regions (ependyma, circumventricular organs,
choroid plexus) of histidine decarboxylase deficient mice in response to formalin-induced acute
pain. Neuropharmacology 53, 101–112.
Parajuli, B., Sonobe, Y., Kawanokuchi, J., Doi, Y., Noda, M., Takeuchi, H., Mizuno, T., and
Suzumura, A. (2012). GM-CSF increases LPS-induced production of proinflammatory mediators
via upregulation of TLR4 and CD14 in murine microglia. J. Neuroinflammation 9, 268.
Pernot, F., Dorandeu, F., Beaup, C., and Peinnequin, A. (2010). Selection of reference genes for
real-time quantitative reverse transcription-polymerase chain reaction in hippocampal structure
in a murine model of temporal lobe epilepsy with focal seizures. J. Neurosci. Res. 88, 1000–
1008.
Persson, A.-K., Thun, J., Xu, X.-J., Wiesenfeld-Hallin, Z., Ström, M., Devor, M., Lidman, O.,
and Fried, K. (2009a). Autotomy behavior correlates with the DRG and spinal expression of
sodium channels in inbred mouse strains. Brain Res. 1285, 1–13.
Persson, A.-K., Gebauer, M., Jordan, S., Metz-Weidmann, C., Schulte, A.M., Schneider, H.-C.,
Ding-Pfennigdorff, D., Thun, J., Xu, X.-J., Wiesenfeld-Hallin, Z., et al. (2009b). Correlational
analysis for identifying genes whose regulation contributes to chronic neuropathic pain. Mol.
Pain 5, 7.
Peters, C.M., Rogers, S.D., Pomonis, J.D., Egnazyck, G.F., Keyser, C.P., Schmidt, J.A.,
Ghilardi, J.R., Maggio, J.E., and Mantyh, P.W. (2003). Endothelin receptor expression in the
normal and injured spinal cord: potential involvement in injury-induced ischemia and gliosis.
Exp. Neurol. 180, 1–13.
Petersen, M., Zhang, J., Zhang, J.M., and LaMotte, R.H. (1996). Abnormal spontaneous activity
and responses to norepinephrine in dissociated dorsal root ganglion cells after chronic nerve
constriction. Pain 67, 391–397.
Phelan, K.D., and Newton, B.W. (2000). Sex differences in the response of postnatal rat lumbar
lamina X neurons to exogenously applied galanin recorded in vitro. Brain Res. Dev. Brain Res.
122, 157–163.
Piccinini, A.M., and Midwood, K.S. (2010). DAMPening inflammation by modulating TLR
signalling. Mediators Inflamm. 2010.
Pollock, G., Pennypacker, K.R., Mémet, S., Israël, A., and Saporta, S. (2005). Activation of NF-
kappaB in the mouse spinal cord following sciatic nerve transection. Exp. Brain Res. Exp.
Hirnforsch. Expérimentation Cérébrale 165, 470–477.

226
Poltorak, A., He, X., Smirnova, I., Liu, M.Y., Van Huffel, C., Du, X., Birdwell, D., Alejos, E.,
Silva, M., Galanos, C., et al. (1998). Defective LPS signaling in C3H/HeJ and C57BL/10ScCr
mice: mutations in Tlr4 gene. Science 282, 2085–2088.
Price, D. (1999). Psychological mechanisms of pain and analgesia (Seattle: IASP Press).
Prieto, M., Chauvet, N., and Alonso, G. (2000). Tanycytes transplanted into the adult rat spinal
cord support the regeneration of lesioned axons. Exp. Neurol. 161, 27–37.
Qi, F., Zhou, Y., Xiao, Y., Tao, J., Gu, J., Jiang, X., and Xu, G.-Y. (2013). Promoter
demethylation of cystathionine-β-synthetase gene contributes to inflammatory pain in rats. Pain
154, 34–45.
Qiagen QIAGEN - GeneGlobe Pathways - STAT3 Pathway.
Qian, N.-S., Liao, Y.-H., Feng, Q.-X., Tang, Y., Dou, K.-F., and Tao, K.-S. (2011). Spinal toll
like receptor 3 is involved in chronic pancreatitis-induced mechanical allodynia of rat. Mol. Pain
7, 15.
Quan, Y., Möller, T., and Weinstein, J.R. (2009). Regulation of Fcgamma receptors and
immunoglobulin G-mediated phagocytosis in mouse microglia. Neurosci. Lett. 464, 29–33.
Rafat, N., Beck, G.C., Schulte, J., Tuettenberg, J., and Vajkoczy, P. (2010). Circulating
endothelial progenitor cells in malignant gliomas. J. Neurosurg. 112, 43–49.
Raghavendra, V., Tanga, F., and DeLeo, J.A. (2003a). Inhibition of microglial activation
attenuates the development but not existing hypersensitivity in a rat model of neuropathy. J.
Pharmacol. Exp. Ther. 306, 624–630.
Raghavendra, V., Tanga, F., Rutkowski, M.D., and DeLeo, J.A. (2003b). Anti-hyperalgesic and
morphine-sparing actions of propentofylline following peripheral nerve injury in rats:
mechanistic implications of spinal glia and proinflammatory cytokines. Pain 104, 655–664.
Raghavendra, V., Tanga, F.Y., and DeLeo, J.A. (2004). Complete Freunds adjuvant-induced
peripheral inflammation evokes glial activation and proinflammatory cytokine expression in the
CNS. Eur. J. Neurosci. 20, 467–473.
Raja, S.N. (1995). Role of the sympathetic nervous system in acute pain and inflammation. Ann.
Med. 27, 241–246.
Ramchandani, S., Bhattacharya, S.K., Cervoni, N., and Szyf, M. (1999). DNA methylation is a
reversible biological signal. Proc. Natl. Acad. Sci. U. S. A. 96, 6107–6112.
Ramer, M.S., Bradbury, E.J., and McMahon, S.B. (2001). Nerve growth factor induces P2X(3)
expression in sensory neurons. J. Neurochem. 77, 864–875.
Razin, A., and Szyf, M. (1984). DNA methylation patterns. Formation and function. Biochim.
Biophys. Acta 782, 331–342.

227
Reddy, E.P., Korapati, A., Chaturvedi, P., and Rane, S. (2000). IL-3 signaling and the role of Src
kinases, JAKs and STATs: a covert liaison unveiled. Oncogene 19, 2532–2547.
Reddy, P.H., Manczak, M., Zhao, W., Nakamura, K., Bebbington, C., Yarranton, G., and Mao,
P. (2009). Granulocyte-macrophage colony-stimulating factor antibody suppresses microglial
activity: implications for anti-inflammatory effects in Alzheimer’s disease and multiple sclerosis.
J. Neurochem. 111, 1514–1528.
Del Rey, A., Yau, H.-J., Randolf, A., Centeno, M.V., Wildmann, J., Martina, M., Besedovsky,
H.O., and Apkarian, A.V. (2011). Chronic neuropathic pain-like behavior correlates with IL-1β
expression and disrupts cytokine interactions in the hippocampus. Pain 152, 2827–2835.
Ridwan, S., Bauer, H., Frauenknecht, K., von Pein, H., and Sommer, C.J. (2012). Distribution of
granulocyte-monocyte colony-stimulating factor and its receptor α-subunit in the adult human
brain with specific reference to Alzheimer’s disease. J. Neural Transm. Vienna Austria 1996
119, 1389–1406.
Rodin, B.E., and Kruger, L. (1984). Deafferentation in animals as a model for the study of pain:
an alternative hypothesis. Brain Res. 319, 213–228.
Rodriguez Parkitna, J., Korostynski, M., Kaminska-Chowaniec, D., Obara, I., Mika, J.,
Przewlocka, B., and Przewlocki, R. (2006). Comparison of gene expression profiles in
neuropathic and inflammatory pain. J. Physiol. Pharmacol. Off. J. Pol. Physiol. Soc. 57, 401–
414.
Rohde, D., Wickenhauser, C., Denecke, S., Stach, A., Lorenzen, J., Hansmann, M.L., Thiele, J.,
and Fischer, R. (1994). Cytokine release by human bone marrow cells: analysis at the single cell
level. Virchows Arch. Int. J. Pathol. 424, 389–395.
Romero-Sandoval, E.A., Horvath, R.J., and DeLeo, J.A. (2008). Neuroimmune interactions and
pain: focus on glial-modulating targets. Curr. Opin. Investig. Drugs Lond. Engl. 2000 9, 726–
734.
Van Rossum, D., and Hanisch, U.-K. (2004). Microglia. Metab. Brain Dis. 19, 393–411.
Rubinstein, R.E., Deem, K.C., Jensen, J., MacKinnon, S.E., and Tung, T.H. (2003). Strain
differences in autotomy in mice after peripheral nerve transection or repair. Microsurgery 23,
363–368.
Saada, A., Reichert, F., and Rotshenker, S. (1996). Granulocyte macrophage colony stimulating
factor produced in lesioned peripheral nerves induces the up-regulation of cell surface expression
of MAC-2 by macrophages and Schwann cells. J. Cell Biol. 133, 159–167.
Saito, O., Svensson, C.I., Buczynski, M.W., Wegner, K., Hua, X.-Y., Codeluppi, S., Schaloske,
R.H., Deems, R.A., Dennis, E.A., and Yaksh, T.L. (2010). Spinal glial TLR4-mediated
nociception and production of prostaglandin E(2) and TNF. Br. J. Pharmacol. 160, 1754–1764.

228
Sato, J., and Perl, E.R. (1991). Adrenergic excitation of cutaneous pain receptors induced by
peripheral nerve injury. Science 251, 1608–1610.
Schäbitz, W.-R., Krüger, C., Pitzer, C., Weber, D., Laage, R., Gassler, N., Aronowski, J., Mier,
W., Kirsch, F., Dittgen, T., et al. (2008). A neuroprotective function for the hematopoietic
protein granulocyte-macrophage colony stimulating factor (GM-CSF). J. Cereb. Blood Flow
Metab. Off. J. Int. Soc. Cereb. Blood Flow Metab. 28, 29–43.
Schneider, H., Pitossi, F., Balschun, D., Wagner, A., del Rey, A., and Besedovsky, H.O. (1998).
A neuromodulatory role of interleukin-1beta in the hippocampus. Proc. Natl. Acad. Sci. U. S. A.
95, 7778–7783.
Scholz, J., and Woolf, C.J. (2007). The neuropathic pain triad: neurons, immune cells and glia.
Nat. Neurosci. 10, 1361–1368.
Schwab, J.M., Conrad, S., Monnier, P.P., Julien, S., Mueller, B.K., and Schluesener, H.J. (2005).
Spinal cord injury-induced lesional expression of the repulsive guidance molecule (RGM). Eur.
J. Neurosci. 21, 1569–1576.
Schweizerhof, M., Stösser, S., Kurejova, M., Njoo, C., Gangadharan, V., Agarwal, N., Schmelz,
M., Bali, K.K., Michalski, C.W., Brugger, S., et al. (2009). Hematopoietic colony-stimulating
factors mediate tumor-nerve interactions and bone cancer pain. Nat. Med. 15, 802–807.
Seltzer, Z. (1995). The relevance of animal neuropathy models for chronic pain in humans.
Seminars in Neuroscience 7, 211–219.
Seltzer, Z., and Dorfman, R. (2004). Identifying genetic and environmental risk factors for
chronic orofacial pain syndromes: human models. J. Orofac. Pain 18, 311–317.
Seltzer, Z., Dubner, R., and Shir, Y. (1990). A novel behavioral model of neuropathic pain
disorders produced in rats by partial sciatic nerve injury. Pain 43, 205–218.
Seltzer, Z., Beilin, B.Z., Ginzburg, R., Paran, Y., and Shimko, T. (1991a). The role of injury
discharge in the induction of neuropathic pain behavior in rats. Pain 46, 327–336.
Seltzer, Z., Cohn, S., Ginzburg, R., and Beilin, B. (1991b). Modulation of neuropathic pain
behavior in rats by spinal disinhibition and NMDA receptor blockade of injury discharge. Pain
45, 69–75.
Seltzer, Z., Beilin, B.Z., Ginzburg, R., Paran, Y., and Shimko, T. (1991c). The role of injury
discharge in the induction of neuropathic pain behavior in rats. Pain 46, 327–336.
Seltzer, Z., Wu, T., Max, M.B., and Diehl, S.R. (2001). Mapping a gene for neuropathic pain-
related behavior following peripheral neurectomy in the mouse. Pain 93, 101–106.
Sevc, J., Daxnerová, Z., and Miklosová, M. (2009). Role of radial glia in transformation of the
primitive lumen to the central canal in the developing rat spinal cord. Cell. Mol. Neurobiol. 29,
927–936.

229
Sevc, J., Daxnerová, Z., Haňová, V., and Koval’, J. (2011). Novel observations on the origin of
ependymal cells in the ventricular zone of the rat spinal cord. Acta Histochem. 113, 156–162.
Sheikh, A.M., Nagai, A., Ryu, J.K., McLarnon, J.G., Kim, S.U., and Masuda, J. (2009).
Lysophosphatidylcholine induces glial cell activation: role of rho kinase. Glia 57, 898–907.
Sherman, R. (1997). Phantom pain (New York: Plenum Press).
Shin, T., Lee, Y., and Sim, K. (2003). Embryonic intermediate filaments, nestin and vimentin,
expression in the spinal cords of rats with experimental autoimmune encephalomyelitis. J. Vet.
Sci. 4, 9–13.
Shir, Y., Zeltser, R., Vatine, J.J., Carmi, G., Belfer, I., Zangen, A., Overstreet, D., Raber, P., and
Seltzer, Z. (2001). Correlation of intact sensibility and neuropathic pain-related behaviors in
eight inbred and outbred rat strains and selection lines. Pain 90, 75–82.
Shrivastava, K., Llovera, G., Recasens, M., Chertoff, M., Giménez-Llort, L., Gonzalez, B., and
Acarin, L. (2013). Temporal expression of cytokines and signal transducer and activator of
transcription factor 3 activation after neonatal hypoxia/ischemia in mice. Dev. Neurosci. 35,
212–225.
Siddall, P., Xu, C., and Cousins, M. (1995). Allodynia following traumatic spinal cord injury in
the rat. Neuroreport 6, 1241–1244.
Siddall, P., Yezierski, R.P., and Loeser, J. (2002). Taxonomy and epidemiology of spinal cord
injury pain. In Spinal Injury Pain: Assessment, Mechanism, Management, Progess in Pain
Research and Management, (Seattle: IASP Press), pp. 9–23.
Silverman, J.D., and Kruger, L. (1990). Selective neuronal glycoconjugate expression in sensory
and autonomic ganglia: relation of lectin reactivity to peptide and enzyme markers. J.
Neurocytol. 19, 789–801.
Singer, J.B., Hill, A.E., Burrage, L.C., Olszens, K.R., Song, J., Justice, M., O’Brien, W.E., Conti,
D.V., Witte, J.S., Lander, E.S., et al. (2004). Genetic dissection of complex traits with
chromosome substitution strains of mice. Science 304, 445–448.
Sivula, J., Cordova, Z.M., Tuimala, J., Jaatinen, T., Partanen, J., Volin, L., and Turpeinen, H.
(2012). Toll-like receptor gene polymorphisms confer susceptibility to graft-versus-host disease
in allogenic hematopoietic stem cell transplantation. Scand. J. Immunol. 76, 336–341.
Snider, W.D., and McMahon, S.B. (1998). Tackling pain at the source: new ideas about
nociceptors. Neuron 20, 629–632.
Soleimannejad, E., Semnanian, S., Fathollahi, Y., and Naghdi, N. (2006). Microinjection of
ritanserin into the dorsal hippocampal CA1 and dentate gyrus decrease nociceptive behavior in
adult male rat. Behav. Brain Res. 168, 221–225.

230
Soleimannejad, E., Naghdi, N., Semnanian, S., Fathollahi, Y., and Kazemnejad, A. (2007).
Antinociceptive effect of intra-hippocampal CA1 and dentate gyrus injection of MK801 and AP5
in the formalin test in adult male rats. Eur. J. Pharmacol. 562, 39–46.
Sorge, R.E., LaCroix-Fralish, M.L., Tuttle, A.H., Sotocinal, S.G., Austin, J.-S., Ritchie, J.,
Chanda, M.L., Graham, A.C., Topham, L., Beggs, S., et al. (2011). Spinal cord Toll-like receptor
4 mediates inflammatory and neuropathic hypersensitivity in male but not female mice. J.
Neurosci. Off. J. Soc. Neurosci. 31, 15450–15454.
Sorge, R.E., Trang, T., Dorfman, R., Smith, S.B., Beggs, S., Ritchie, J., Austin, J.-S., Zaykin,
D.V., Vander Meulen, H., Costigan, M., et al. (2012). Genetically determined P2X7 receptor
pore formation regulates variability in chronic pain sensitivity. Nat. Med. 18, 595–599.
Soria-Castro, I., Krzyzanowska, A., Pelaéz, M.L., Regadera, J., Ferrer, G., Montoliu, L.,
Rodríguez-Ramos, R., Fernández, M., and Alemany, S. (2010). Cot/tpl2 (MAP3K8) mediates
myeloperoxidase activity and hypernociception following peripheral inflammation. J. Biol.
Chem. 285, 33805–33815.
Speiser, Z., Uziel, J., Defrin-Assa, R., Gitter, S., and Urca, G. (1991). Different behavioral
deficits are induced by anoxia/hypoxia in neonatal and senescent rats: blockade by MK-801.
Behav. Brain Res. 42, 181–186.
Stam, F.J., MacGillavry, H.D., Armstrong, N.J., de Gunst, M.C.M., Zhang, Y., van Kesteren,
R.E., Smit, A.B., and Verhaagen, J. (2007). Identification of candidate transcriptional modulators
involved in successful regeneration after nerve injury. Eur. J. Neurosci. 25, 3629–3637.
Stone, L.S., and Szyf, M. (2013). The emerging field of pain epigenetics. Pain 154, 1–2.
Stösser, S., Schweizerhof, M., and Kuner, R. (2011). Hematopoietic colony-stimulating factors:
new players in tumor-nerve interactions. J. Mol. Med. Berl. Ger. 89, 321–329.
Sun, H., Xu, J., Della Penna, K.B., Benz, R.J., Kinose, F., Holder, D.J., Koblan, K.S., Gerhold,
D.L., and Wang, H. (2002). Dorsal horn-enriched genes identified by DNA microarray, in situ
hybridization and immunohistochemistry. Bmc Neurosci. 3, 11.
Suzuki, R., and Dickenson, A.H. (2000). Neuropathic pain: nerves bursting with excitement ..
Neuroreport 11, R17–21.
Suzuki, Y., Funakoshi, H., Machide, M., Matsumoto, K., and Nakamura, T. (2008). Regulation
of cell migration and cytokine production by HGF-like protein (HLP) / macrophage stimulating
protein (MSP) in primary microglia. Biomed. Res. Tokyo Jpn. 29, 77–84.
Suzumura, A., Sawada, M., and Marunouchi, T. (1996). Selective induction of interleukin-6 in
mouse microglia by granulocyte-macrophage colony-stimulating factor. Brain Res. 713, 192–
198.
Swartjes, M., Morariu, A., Niesters, M., Brines, M., Cerami, A., Aarts, L., and Dahan, A. (2011).
ARA290, a peptide derived from the tertiary structure of erythropoietin, produces long-term

231
relief of neuropathic pain: an experimental study in rats and β-common receptor knockout mice.
Anesthesiology 115, 1084–1092.
Szpara, M.L., Vranizan, K., Tai, Y.C., Goodman, C.S., Speed, T.P., and Ngai, J. (2007).
Analysis of gene expression during neurite outgrowth and regeneration. Bmc Neurosci. 8, 100.
Tajerian, M., Alvarado, S., Millecamps, M., Dashwood, T., Anderson, K.M., Haglund, L.,
Ouellet, J., Szyf, M., and Stone, L.S. (2011). DNA methylation of SPARC and chronic low back
pain. Mol. Pain 7, 65.
Takasaki, I., Taniguchi, K., Komatsu, F., Sasaki, A., Andoh, T., Nojima, H., Shiraki, K., Hsu,
D.K., Liu, F.-T., Kato, I., et al. (2012). Contribution of spinal galectin-3 to acute herpetic
allodynia in mice. Pain 153, 585–592.
Takeda, K., and Akira, S. (2004). TLR signaling pathways. Semin. Immunol. 16, 3–9.
Tang, F.R., and Sim, M.K. (1997). Metabotropic glutamate receptor subtype-1 alpha (mGluR1
alpha) immunoreactivity in ependymal cells of the rat caudal medulla oblongata and spinal cord.
Neurosci. Lett. 225, 177–180.
Tang, J., Li, Z.-H., Ge, S.-N., Wang, W., Mei, X.-P., Wang, W., Zhang, T., Xu, L.-X., and Li, J.-
L. (2012). The Inhibition of Spinal Astrocytic JAK2-STAT3 Pathway Activation Correlates with
the Analgesic Effects of Triptolide in the Rat Neuropathic Pain Model. Evid.-Based
Complement. Altern. Med. Ecam 2012, 185167.
Tang, S.-C., Arumugam, T.V., Xu, X., Cheng, A., Mughal, M.R., Jo, D.G., Lathia, J.D., Siler,
D.A., Chigurupati, S., Ouyang, X., et al. (2007). Pivotal role for neuronal Toll-like receptors in
ischemic brain injury and functional deficits. Proc. Natl. Acad. Sci. U. S. A. 104, 13798–13803.
Tanga, F.Y., Raghavendra, V., and DeLeo, J.A. (2004). Quantitative real-time RT-PCR
assessment of spinal microglial and astrocytic activation markers in a rat model of neuropathic
pain. Neurochem. Int. 45, 397–407.
Tanga, F.Y., Nutile-McMenemy, N., and DeLeo, J.A. (2005). The CNS role of Toll-like receptor
4 in innate neuroimmunity and painful neuropathy. Proc. Natl. Acad. Sci. U. S. A. 102, 5856–
5861.
Tarkowski, E., Wallin, A., Regland, B., Blennow, K., and Tarkowski, A. (2001). Local and
systemic GM-CSF increase in Alzheimer’s disease and vascular dementia. Acta Neurol. Scand.
103, 166–174.
Tawfik, V.L., Regan, M.R., Haenggeli, C., Lacroix-Fralish, M.L., Nutile-McMenemy, N., Perez,
N., Rothstein, J.D., and DeLeo, J.A. (2008). Propentofylline-induced astrocyte modulation leads
to alterations in glial glutamate promoter activation following spinal nerve transection.
Neuroscience 152, 1086–1092.

232
Terada, M., Kuzumaki, N., Hareyama, N., Imai, S., Niikura, K., Narita, M., Yamazaki, M.,
Suzuki, T., and Narita, M. (2008). Suppression of enriched environment-induced neurogenesis in
a rodent model of neuropathic pain. Neurosci. Lett. 440, 314–318.
Tian, Y., Wang, S., Ma, Y., Lim, G., Kim, H., and Mao, J. (2011). Leptin enhances NMDA-
induced spinal excitation in rats: A functional link between adipocytokine and neuropathic pain.
Pain 152, 1263–1271.
Tilleux, S., and Hermans, E. (2007). Neuroinflammation and regulation of glial glutamate uptake
in neurological disorders. J. Neurosci. Res. 85, 2059–2070.
Treede, R.-D., Jensen, T.S., Campbell, J.N., Cruccu, G., Dostrovsky, J.O., Griffin, J.W.,
Hansson, P., Hughes, R., Nurmikko, T., and Serra, J. (2008). Neuropathic pain: redefinition and
a grading system for clinical and research purposes. Neurology 70, 1630–1635.
Tsuda, M., Kohro, Y., Yano, T., Tsujikawa, T., Kitano, J., Tozaki-Saitoh, H., Koyanagi, S.,
Ohdo, S., Ji, R.-R., Salter, M.W., et al. (2011). JAK-STAT3 pathway regulates spinal astrocyte
proliferation and neuropathic pain maintenance in rats. Brain J. Neurol. 134, 1127–1139.
Tsuda, M., Masuda, T., Tozaki-Saitoh, H., and Inoue, K. (2013). Microglial regulation of
neuropathic pain. J. Pharmacol. Sci. 121, 89–94.
Tsutsui, S., Noorbakhsh, F., Sullivan, A., Henderson, A.J., Warren, K., Toney-Earley, K., Waltz,
S.E., and Power, C. (2005). RON-regulated innate immunity is protective in an animal model of
multiple sclerosis. Ann. Neurol. 57, 883–895.
Uçeyler, N., Tscharke, A., and Sommer, C. (2008). Early cytokine gene expression in mouse
CNS after peripheral nerve lesion. Neurosci. Lett. 436, 259–264.
Vabulas, R.M., Ahmad-Nejad, P., Ghose, S., Kirschning, C.J., Issels, R.D., and Wagner, H.
(2002). HSP70 as endogenous stimulus of the Toll/interleukin-1 receptor signal pathway. J. Biol.
Chem. 277, 15107–15112.
Valder, C.R., Liu, J.-J., Song, Y.-H., and Luo, Z.D. (2003). Coupling gene chip analyses and rat
genetic variances in identifying potential target genes that may contribute to neuropathic
allodynia development. J. Neurochem. 87, 560–573.
Vallender, E.J., and Lahn, B.T. (2004). Positive selection on the human genome. Hum. Mol.
Genet. 13, R245–R254.
Vargas, M.E., and Barres, B.A. (2007). Why is Wallerian degeneration in the CNS so slow?
Annu. Rev. Neurosci. 30, 153–179.
Vatine, J.J., Argov, R., and Seltzer, Z. (1998). Brief electrical stimulation of c-fibers in rats
produces thermal hyperalgesia lasting weeks. Neurosci. Lett. 246, 125–128.
Vega-Avelaira, D., Géranton, S.M., and Fitzgerald, M. (2009). Differential regulation of immune
responses and macrophage/neuron interactions in the dorsal root ganglion in young and adult rats
following nerve injury. Mol. Pain 5, 70.

233
Veltman, J.A., and de Vries, B.B.A. (2006). Diagnostic genome profiling: unbiased whole
genome or targeted analysis? J. Mol. Diagn. Jmd 8, 534–537; discussion 537–539.
Verge, G.M., Milligan, E.D., Maier, S.F., Watkins, L.R., Naeve, G.S., and Foster, A.C. (2004).
Fractalkine (CX3CL1) and fractalkine receptor (CX3CR1) distribution in spinal cord and dorsal
root ganglia under basal and neuropathic pain conditions. Eur. J. Neurosci. 20, 1150–1160.
Vierck, C., and Light, A.R. (2000). Allodynia and hyperalgesia within dermatomes caudal to a
spinal cord injury in primates and rodents. Prog Brain Res. 129, 411–428.
Vikman, K., Robertson, B., Grant, G., Liljeborg, A., and Kristensson, K. (1998). Interferon-
gamma receptors are expressed at synapses in the rat superficial dorsal horn and lateral spinal
nucleus. J. Neurocytol. 27, 749–759.
Vikman, K.S., Hill, R.H., Backström, E., Robertson, B., and Kristensson, K. (2003). Interferon-
gamma induces characteristics of central sensitization in spinal dorsal horn neurons in vitro. Pain
106, 241–251.
Volmar, C.-H., Ait-Ghezala, G., Frieling, J., Paris, D., and Mullan, M.J. (2008). The granulocyte
macrophage colony stimulating factor (GM-CSF) regulates amyloid beta (Abeta) production.
Cytokine 42, 336–344.
Wadachi, R., and Hargreaves, K.M. (2006). Trigeminal nociceptors express TLR-4 and CD14: a
mechanism for pain due to infection. J. Dent. Res. 85, 49–53.
Wall, P.D., and Devor, M. (1983). Sensory afferent impulses originate from dorsal root ganglia
as well as from the periphery in normal and nerve injured rats. Pain 17, 321–339.
Wall, P.D., Waxman, S., and Basbaum, A.I. (1974). Ongoing activity in peripheral nerve: injury
discharge. Exp. Neurol. 45, 576–589.
Wall, P.D., Devor, M., Inbal, R., Scadding, J.W., Schonfeld, D., Seltzer, Z., and Tomkiewicz,
M.M. (1979). Autotomy following peripheral nerve lesions: experimental anaesthesia dolorosa.
Pain 7, 103–111.
Wall, P.D., Kerr, B.J., and Ramer, M.S. (2002). Primary afferent input to and receptive field
properties of cells in rat lumbar area X. J. Comp. Neurol. 449, 298–306.
Wang, H., Rivero-Melián, C., Robertson, B., and Grant, G. (1994a). Transganglionic transport
and binding of the isolectin B4 from Griffonia simplicifolia I in rat primary sensory neurons.
Neuroscience 62, 539–551.
Wang, H., Sun, H., Della Penna, K., Benz, R.J., Xu, J., Gerhold, D.L., Holder, D.J., and Koblan,
K.S. (2002a). Chronic neuropathic pain is accompanied by global changes in gene expression
and shares pathobiology with neurodegenerative diseases. Neuroscience 114, 529–546.
Wang, M.H., Cox, G.W., Yoshimura, T., Sheffler, L.A., Skeel, A., and Leonard, E.J. (1994b).
Macrophage-stimulating protein inhibits induction of nitric oxide production by endotoxin- or
cytokine-stimulated mouse macrophages. J. Biol. Chem. 269, 14027–14031.

234
Wang, M.H., Iwama, A., Skeel, A., Suda, T., and Leonard, E.J. (1995). The murine stk gene
product, a transmembrane protein tyrosine kinase, is a receptor for macrophage-stimulating
protein. Proc. Natl. Acad. Sci. U. S. A. 92, 3933–3937.
Wang, M.H., Skeel, A., and Leonard, E.J. (1996). Proteolytic cleavage and activation of pro-
macrophage-stimulating protein by resident peritoneal macrophage membrane proteases. J. Clin.
Invest. 97, 720–727.
Wang, M.-H., Zhou, Y.-Q., and Chen, Y.-Q. (2002b). Macrophage-stimulating protein and RON
receptor tyrosine kinase: potential regulators of macrophage inflammatory activities. Scand. J.
Immunol. 56, 545–553.
Wang, S.S., Shi, W., Wang, X., Velky, L., Greenlee, S., Wang, M.T., Drake, T.A., and Lusis,
A.J. (2007). Mapping, genetic isolation, and characterization of genetic loci that determine
resistance to atherosclerosis in C3H mice. Arterioscler. Thromb. Vasc. Biol. 27, 2671–2676.
Wang, X., Messing, A., and David, S. (1997). Axonal and nonneuronal cell responses to spinal
cord injury in mice lacking glial fibrillary acidic protein. Exp. Neurol. 148, 568–576.
Wang, X., Bao, X., Pal, R., Agbas, A., and Michaelis, E.K. (2010a). Transcriptomic responses in
mouse brain exposed to chronic excess of the neurotransmitter glutamate. Bmc Genomics 11,
360.
Wang, Y., Yao, M., Zhou, C., Dong, D., Jiang, Y., Wei, G., and Cui, X. (2010b). Erythropoietin
promotes spinal cord-derived neural progenitor cell proliferation by regulating cell cycle.
Neuroscience 167, 750–757.
Wang, Y., Liu, C., Guo, Q.-L., Yan, J.-Q., Zhu, X.-Y., Huang, C.-S., and Zou, W.-Y. (2011).
Intrathecal 5-azacytidine inhibits global DNA methylation and methyl- CpG-binding protein 2
expression and alleviates neuropathic pain in rats following chronic constriction injury. Brain
Res. 1418, 64–69.
Watanabe, S., Muto, A., Yokota, T., Miyajima, A., and Arai, K. (1993). Differential regulation
of early response genes and cell proliferation through the human granulocyte macrophage
colony-stimulating factor receptor: selective activation of the c-fos promoter by genistein. Mol.
Biol. Cell 4, 983–992.
Watanabe, S., Ishida, S., Koike, K., and Arai, K. (1995). Characterization of cis-regulatory
elements of the c-myc promoter responding to human GM-CSF or mouse interleukin 3 in mouse
proB cell line BA/F3 cells expressing the human GM-CSF receptor. Mol. Biol. Cell 6, 627–636.
Watkins, L.R., and Maier, S.F. (2002). Beyond neurons: evidence that immune and glial cells
contribute to pathological pain states. Physiol. Rev. 82, 981–1011.
Watkins, L.R., Milligan, E.D., and Maier, S.F. (2001). Glial activation: a driving force for
pathological pain. Trends Neurosci. 24, 450–455.

235
Watkins, L.R., Hutchinson, M.R., Milligan, E.D., and Maier, S.F. (2007). “Listening” and
“talking” to neurons: implications of immune activation for pain control and increasing the
efficacy of opioids. Brain Res. Rev. 56, 148–169.
Wei, F., Guo, W., Zou, S., Ren, K., and Dubner, R. (2008). Supraspinal glial-neuronal
interactions contribute to descending pain facilitation. J. Neurosci. Off. J. Soc. Neurosci. 28,
10482–10495.
Wen, Y.-R., Tan, P.-H., Cheng, J.-K., Liu, Y.-C., and Ji, R.-R. (2011). Microglia: a promising
target for treating neuropathic and postoperative pain, and morphine tolerance. J. Formos. Med.
Assoc. Taiwan Yi Zhi 110, 487–494.
Werner, M.F.P., Trevisani, M., Campi, B., André, E., Geppetti, P., and Rae, G.A. (2010).
Contribution of peripheral endothelin ETA and ETB receptors in neuropathic pain induced by
spinal nerve ligation in rats. Eur. J. Pain Lond. Engl. 14, 911–917.
Wessel, T.C., Joh, T.H., and Volpe, B.T. (1991). In situ hybridization analysis of c-fos and c-jun
expression in the rat brain following transient forebrain ischemia. Brain Res. 567, 231–240.
Whetton, A.D., and Dexter, T.M. (1989). Myeloid haemopoietic growth factors. Biochim.
Biophys. Acta 989, 111–132.
White, R.E., McTigue, D.M., and Jakeman, L.B. (2010). Regional heterogeneity in astrocyte
responses following contusive spinal cord injury in mice. J. Comp. Neurol. 518, 1370–1390.
Wiesenfeld, Z., and Hallin, R.G. (1981). Influence of nerve lesions, strain differences and
continuous cold stress on chronic pain behavior in rats. Physiol. Behav. 27, 735–740.
Wiesenfeld-Hallin, Z., and Hallin, R.G. (1984). The influence of the sympathetic system on
mechanoreception and nociception. Hum Neurobiol. 3, 41–46.
Wiesenfeld-Hallin, Z., Hao, J.-X., Aldskogius, H., Seiger, A., and Xu X-J (1994). Allodynia-like
symptoms in rats after spinal cord ischemia: An animal model of central pain. In Touch,
Temperature and Pain in Health and Disease: Mechanisms and Assessments, (Seattle: IASP
Press), pp. 355–372.
Wilkins, K.L., McGrath, P.J., Finley, G.A., and Katz, J. (1998). Phantom limb sensations and
phantom limb pain in child and adolescent amputees. Pain 78, 7–12.
Williams, G.T., Smith, C.A., Spooncer, E., Dexter, T.M., and Taylor, D.R. (1990). Haemopoietic
colony stimulating factors promote cell survival by suppressing apoptosis. Nature 343, 76–79.
Willingale, H.L., Gardiner, N.J., McLymont, N., Giblett, S., and Grubb, B.D. (1997). Prostanoids
synthesized by cyclo-oxygenase isoforms in rat spinal cord and their contribution to the
development of neuronal hyperexcitability. Br. J. Pharmacol. 122, 1593–1604.
Won, Y.J., Yoo, J.Y., Lee, J.H., Hwang, S.J., Kim, D., and Hong, H.N. (2007). Erythropoietin is
neuroprotective on GABAergic neurons against kainic acid-excitotoxicity in the rat spinal cell
cultures. Brain Res. 1154, 31–39.

236
Woolf, C.J. (1983). Evidence for a central component of post-injury pain hypersensitivity.
Nature 306, 686–688.
Woolf, C.J., and Mannion, R.J. (1999). Neuropathic pain: aetiology, symptoms, mechanisms,
and management. Lancet 353, 1959–1964.
Woolf, C.J., and Salter, M.W. (2000). Neuronal plasticity: increasing the gain in pain. Science
288, 1765–1769.
Wu, F., Bian, J., Miao, X., Huang, S., Xu, X., Gong, D., Sun, Y., Lu, Z., and Yu, W. (2010).
Intrathecal siRNA against Toll-like receptor 4 reduces nociception in a rat model of neuropathic
pain. Int. J. Med. Sci. 7, 251–259.
Xiao, H.-S., Huang, Q.-H., Zhang, F.-X., Bao, L., Lu, Y.-J., Guo, C., Yang, L., Huang, W.-J., Fu,
G., Xu, S.-H., et al. (2002). Identification of gene expression profile of dorsal root ganglion in
the rat peripheral axotomy model of neuropathic pain. Proc. Natl. Acad. Sci. U. S. A. 99, 8360–
8365.
Xie, J., Ho Lee, Y., Wang, C., Mo Chung, J., and Chung, K. (2001). Differential expression of
alpha1-adrenoceptor subtype mRNAs in the dorsal root ganglion after spinal nerve ligation.
Brain Res. Mol. Brain Res. 93, 164–172.
Yamakawa, N., Ohto, U., Akashi-Takamura, S., Takahashi, K., Saitoh, S.-I., Tanimura, N.,
Suganami, T., Ogawa, Y., Shibata, T., Shimizu, T., et al. (2013). Human TLR4 polymorphism
D299G/T399I alters TLR4/MD-2 conformation and response to a weak ligand monophosphoryl
lipid A. Int. Immunol. 25, 45–52.
Yamamotová, A., Franek, M., Vaculín, S., St’astný, F., Bubeníková-Valesová, V., and Rokyta,
R. (2007). Different transfer of nociceptive sensitivity from rats with postnatal hippocampal
lesions to control rats. Eur. J. Neurosci. 26, 446–450.
Yen, L.D., Bennett, G.J., and Ribeiro-da-Silva, A. (2006). Sympathetic sprouting and changes in
nociceptive sensory innervation in the glabrous skin of the rat hind paw following partial
peripheral nerve injury. J. Comp. Neurol. 495, 679–690.
Yezierski, R.P. (1996). Pain following spinal cord injury: the clinical problem and experimental
studies. Pain 68, 185–194.
Yezierski, R.P. (2005). Spinal cord injury pain: general mechanisms. In Handbook of Clinical
Neurology, (Amsterdam: Elsevier),.
Yezierski, R.P., Liu, S., Ruenes, G., Kajander, K., and Brewer, K. (1998). Excitotoxic spinal
cord injury: behavioral and morphological characteristics of a central pain model. Pain 75, 141–
155.
Yoo, J.Y., Won, Y.J., Lee, J.H., Kim, J.U., Sung, I.Y., Hwang, S.J., Kim, M.J., and Hong, H.N.
(2009). Neuroprotective effects of erythropoietin posttreatment against kainate-induced
excitotoxicity in mixed spinal cultures. J. Neurosci. Res. 87, 150–163.

237
Yu, H., Pardoll, D., and Jove, R. (2009). STATs in cancer inflammation and immunity: a leading
role for STAT3. Nat. Rev. Cancer 9, 798–809.
Yu, J.-T., Miao, D., Cui, W.-Z., Ou, J.-R., Tian, Y., Wu, Z.-C., Zhang, W., and Tan, L. (2012).
Common variants in toll-like receptor 4 confer susceptibility to Alzheimer’s disease in a Han
Chinese population. Curr. Alzheimer Res. 9, 458–466.
Yuan, Z.-L., Guan, Y.-J., Wang, L., Wei, W., Kane, A.B., and Chin, Y.E. (2004). Central role of
the threonine residue within the p+1 loop of receptor tyrosine kinase in STAT3 constitutive
phosphorylation in metastatic cancer cells. Mol. Cell. Biol. 24, 9390–9400.
Zeltser, R., and Seltzer, Z. (1994). Touch, Temperature, and Pain in Health and Disease:
Mechanisms and Assessments (Seattle).
Zeltser, R., Beilin, B., Zaslansky, R., and Seltzer, Z. (2000). Comparison of autotomy behavior
induced in rats by various clinically-used neurectomy methods. Pain 89, 19–24.
Zhang, K.-H., Xiao, H.-S., Lu, P.-H., Shi, J., Li, G.-D., Wang, Y.-T., Han, S., Zhang, F.-X., Lu,
Y.-J., Zhang, X., et al. (2004). Differential gene expression after complete spinal cord transection
in adult rats: an analysis focused on a subchronic post-injury stage. Neuroscience 128, 375–388.
Zhang, X.-C., Zhang, Y.-Q., and Zhao, Z.-Q. (2006). Different roles of two nitric oxide activated
pathways in spinal long-term potentiation of C-fiber-evoked field potentials.
Neuropharmacology 50, 748–754.
Zhao, X.-Y., Liu, M.-G., Yuan, D.-L., Wang, Y., He, Y., Wang, D.-D., Chen, X.-F., Zhang, F.-
K., Li, H., He, X.-S., et al. (2009). Nociception-induced spatial and temporal plasticity of
synaptic connection and function in the hippocampal formation of rats: a multi-electrode array
recording. Mol. Pain 5, 55.
Zhuang, Z.-Y., Gerner, P., Woolf, C.J., and Ji, R.-R. (2005). ERK is sequentially activated in
neurons, microglia, and astrocytes by spinal nerve ligation and contributes to mechanical
allodynia in this neuropathic pain model. Pain 114, 149–159.
Zimmermann, M. (2001). Pathobiology of neuropathic pain. Eur. J. Pharmacol. 429, 23–37.

238
Appendix I
Genome wide candidate genes associated with autotomy in the DRGs. The expression of these
genes differentially contrasted between A high vs. A sham, A low, and B low autotomy mice at a
p-value<0.05 and a -1.5>fold change>1.5

239
p-value FC p-value FC p-value FC
--- 2610200G18RikMus musculus adult male tongue cDNA, RIKEN full-length
enriched library, clone:22.00E-07 2.1 0.00074 1.6 0.00884 -1.8 ↕
Chr 1chr1:108538339-
108538280Bcl2
Mus musculus 13 days embryo male testis cDNA, RIKEN
full-length enriched library0.01048 -1.5 0.00938 -2.6 0.03584 -1.9 ↓
Chr 1chr1:109352466-
109352525Serpinb2
Mus musculus serine (or cysteine) peptidase inhibitor,
clade B, member 2 (Serpin9.67E-05 3.3 0.00606 2.4 0.00418 2.9 ↑
Chr 1chr1:121245445-
121245386Inhbb Mus musculus inhibin beta-B (Inhbb), mRNA [NM_008381] 7.35E-08 2.8 2.86E-06 2.5 0.02656 1.5 ↑
Chr 1chr1:123265403-
123269353Ccdc93
Mus musculus coiled-coil domain containing 93 (Ccdc93),
transcript variant 3, mR0.01137 1.6 0.02907 1.6 0.01186 1.7 ↑
Chr 1chr1:133837210-
133837269Elk4
Mus musculus 16 days neonate thymus cDNA, RIKEN full-
length enriched library, cl0.03116 2.1 0.05113 -2.4 0.02691 2.4 ↕
Chr 1chr1:161916409-
1619164684930523C07Rik
Mus musculus 2 days pregnant adult female oviduct cDNA,
RIKEN full-length enrich0.01527 -1.9 0.01775 -2.0 0.01512 -1.8 ↓
Chr 1chr1:165138892-
165138833AK081699
Mus musculus 16 days embryo head cDNA, RIKEN full-
length enriched library, clone0.03718 -1.6 0.00241 -2.2 0.00325 -2.7 ↓
Chr 1chr1:168151835-
168151776D1Ertd471e
Mus musculus DNA segment, Chr 1, ERATO Doi 471,
expressed, mRNA (cDNA clone IMAG0.01154 -2.5 0.00531 1.6 0.00022 -4.0 ↕
Chr 1chr1:169684432-
169684491Lmx1a
Mus musculus LIM homeobox transcription factor 1 alpha
(Lmx1a), mRNA [NM_033652]0.00306 2.2 0.00645 2.2 0.00095 2.0 ↑
Chr 1chr1:172963507-
1729635661700009P17Rik
Mus musculus RIKEN cDNA 1700009P17 gene, mRNA (cDNA
clone MGC:74123 IMAGE:6774920.00205 -1.7 0.0029 -1.8 0.03063 -1.6 ↓
Chr 1chr1:173837985-
173837926Vangl2
Mus musculus loop tail associated protein, mRNA (cDNA
clone IMAGE:30545600), par0.006 -1.7 0.00463 -2.1 0.00095 -1.8 ↓
Chr 1chr1:177520104-
177520045Chml
Mus musculus 9 days embryo whole body cDNA, RIKEN full-
length enriched library, 0.04746 1.8 0.02216 1.5 0.00189 1.6 ↑
Chr 1chr1:183013430-
183013371Wdr26
PREDICTED: Mus musculus WD repeat domain 26,
transcript variant 1 (Wdr26), mRNA 0.00012 1.7 0.00023 1.7 0.00033 1.6 ↑
Chr 1chr1:183652496-
183652437Lbr Mus musculus lamin B receptor (Lbr), mRNA [NM_133815] 0.04287 1.5 0.03616 1.7 0.03223 1.6 ↑
Chr 1chr1:196514819-
196514878Plxna2 Mus musculus plexin A2 (Plxna2), mRNA [NM_008882] 0.00355 -1.9 0.00109 -2.2 0.03009 -1.5 ↓
Chr 1chr1:37206871-
37206930Cnga3
Mus musculus cyclic nucleotide gated channel alpha 3
(Cnga3), mRNA [NM_009918]0.03656 -1.8 0.00735 -2.3 0.03595 -1.7 ↓
Chr 1chr1:44064804-
44070854Bivm
Mus musculus basic, immunoglobulin-like variable motif
containing (Bivm), mRNA [0.03583 2.1 0.04015 2.3 0.00078 3.2 ↑
Chr 1chr1:46690040-
46690099BG082943
H3082F09-5 NIA Mouse 15K cDNA Clone Set Mus musculus
cDNA clone H3082F09 5', mRN0.00301 -2.2 0.04592 -1.8 0.00398 -2.4 ↓
Chr 1chr1:52066524-
52066583Stat1
Mus musculus 3 days neonate thymus cDNA, RIKEN full-
length enriched library, clo0.04731 -2.1 0.05204 -2.2 0.03696 -2.1 ↓
Chr 1chr1:93204297-
93204356BC056923
Mus musculus cDNA sequence BC056923 (BC056923),
mRNA [NM_173395]0.00019 3.5 0.01629 2.3 0.03172 1.8 ↑
Chr 2chr2:113808012-
113806082Aqr Mus musculus aquarius (Aqr), mRNA [NM_009702] 0.02304 1.7 0.02912 1.8 0.01246 1.8 ↑
Chr 2chr2:119045695-
119045754Chac1
Mus musculus ChaC, cation transport regulator-like 1 (E.
coli) (Chac1), mRNA [NM6.52E-05 1.9 0.01673 1.5 0.02038 -1.5 ↕
Chr 2chr2:121995549-
121995490Duoxa1
Mus musculus dual oxidase maturation factor 1 (Duoxa1),
mRNA [NM_145395]0.02468 -1.5 8.88E-13 -11.7 0.00091 -1.8 ↓
Chr 2chr2:12290412-
122903532310047O13Rik
Mus musculus 12 days embryo spinal cord cDNA, RIKEN
full-length enriched library0.00932 -1.6 0.04184 -2.7 1.85E-05 -2.7 ↓
Chr 2chr2:12930017-
12930076C1ql3
Mus musculus 0 day neonate eyeball cDNA, RIKEN full-
length enriched library, clo0.04169 1.8 0.04456 1.9 0.00687 2.0 ↑
Chr 2chr2:135760884-
1357609436330527O06Rik
Mus musculus RIKEN cDNA 6330527O06 gene
(6330527O06Rik), mRNA [NM_029530]0.01027 4.0 0.02848 3.7 0.01589 3.0 ↑
Chr 2chr2:143518220-
143518161Bfsp1
Mus musculus beaded fi lament structural protein in lens-
CP94 (Bfsp1), mRNA [NM_00.01048 -2.1 0.05226 -1.8 0.02418 -1.7 ↓
Chr 2chr2:146769105-
146769164Xrn2
Mus musculus 5'-3' exoribonuclease 2 (Xrn2), mRNA
[NM_011917]3.92E-05 1.5 0.01294 1.7 1.82E-05 1.5 ↑
Chr 2chr2:151800890-
151800949Srxn1
Mus musculus sulfiredoxin 1 homolog (S. cerevisiae)
(Srxn1), mRNA [NM_029688]7.06E-08 2.4 0.00012 1.8 7.02E-05 1.8 ↑
Chr 2chr2:165842112-
165842053AK038166
Mus musculus 16 days neonate thymus cDNA, RIKEN full-
length enriched library, cl0.02272 -2.3 0.00502 -3.2 0.007 -2.5 ↓
Chr 2chr2:172046374-
1720464332010011I20Rik
Mus musculus RIKEN cDNA 2010011I20 gene
(2010011I20Rik), mRNA [NM_025912]1.64E-09 2.3 0.00023 1.5 0.00031 1.9 ↑
Chr 2chr2:172165210-
1721652691700029J11Rik
Mus musculus adult male testis cDNA, RIKEN full-length
enriched library, clone:10.00885 1.5 0.00081 1.9 0.01194 1.5 ↑
Chr 2chr2:181318940-
181318881Btbd4
Mus musculus 0 day neonate kidney cDNA, RIKEN full-
length enriched library, clon0.02321 2.2 0.00935 2.8 0.01989 2.0 ↑
Chr 2chr2:33387100-
33386753Lmx1b
Mus musculus LIM homeobox transcription factor 1 beta
(Lmx1b), mRNA [NM_010725]0.01168 -1.5 0.01051 -1.6 6.94E-05 -2.1 ↓
Chr 2chr2:34765430-
34765371Traf1
Mus musculus Tnf receptor-associated factor 1 (Traf1),
mRNA [NM_009421]0.01873 -1.8 0.04355 -1.6 0.00618 -1.7 ↓
Chr 2chr2:3695767-
36958263110001A13Rik
Mus musculus RIKEN cDNA 3110001A13 gene
(3110001A13Rik), mRNA [NM_025626]2.77E-05 1.5 9.78E-05 2.0 0.00156 1.6 ↑
Chr 2chr2:63869523-
63869464AK035003
Mus musculus 12 days embryo embryonic body between
diaphragm region and neck cDN0.005 -3.1 0.04297 -2.4 0.00091 -4.6 ↓
Gene RegulationA high vs. A lowA high vs. A sham A high vs. B low
ChromGenomic
CoordinatesGene Name Description

240
Chr 2chr2:68911727-
68911786Lass6
Mus musculus longevity assurance homolog 6 (S.
cerevisiae) (Lass6), mRNA [NM_1722.52E-05 2.1 0.00121 1.8 2.63E-06 -2.7 ↕
Chr 2chr2:76855437-
768505602610301F02Rik
Mus musculus 0 day neonate lung cDNA, RIKEN full-length
enriched library, clone:0.03079 -1.9 0.01947 -2.1 0.05115 -1.7 ↓
Chr 3chr3:101589718-
101589777Igsf3
Mus musculus immunoglobulin superfamily, member 3
(Igsf3), mRNA [NM_207205]0.02011 -1.6 0.03171 -1.6 0.01351 -1.6 ↓
Chr 3chr3:101942973-
101942914BC037703
Mus musculus cDNA sequence BC037703 (BC037703),
mRNA [NM_172295]0.00332 -1.7 0.02241 -1.6 0.0226 -1.5 ↓
Chr 3chr3:104782221-
104782280Slc16a1
Mus musculus solute carrier family 16 (monocarboxylic
acid transporters), member0.00565 2.0 0.04573 1.7 3.61E-05 2.7 ↑
Chr 3chr3:137563799-
137563858Ddit4l
Mus musculus DNA-damage-inducible transcript 4-like
(Ddit4l), mRNA [NM_030143]0.04862 -1.8 0.00884 -1.6 0.00084 -2.9 ↓
Chr 3chr3:146078707-
146078766Mcoln3
Mus musculus 12 days embryo male wolffian duct
includes surrounding region cDNA,0.00019 4.8 0.01824 2.8 0.00018 4.5 ↑
Chr 3chr3:27321129-
27318861Ect2 Mus musculus ect2 oncogene (Ect2), mRNA [NM_007900] 0.04356 1.5 0.01931 1.7 0.03212 -2.0 ↕
Chr 3chr3:51492886-
51492827Ndufc1
Mus musculus NADH dehydrogenase (ubiquinone) 1,
subcomplex unknown, 1 (Ndufc1), 0.04556 -1.7 0.00764 -2.8 0.00869 -1.9 ↓
Chr 3chr3:88722014-
88724240Arhgef2
Mus musculus rho/rac guanine nucleotide exchange
factor (GEF) 2 (Arhgef2), mRNA 0.03031 1.8 0.0148 2.1 0.0154 1.8 ↑
Chr 3chr3:88797018-
887970772810403A07Rik
Mus musculus 12 days embryo spinal ganglion cDNA,
RIKEN full-length enriched lib0.04796 1.5 0.01641 -2.2 0.02114 2.3 ↕
Chr 3chr3:90129695-
90129636Ubap2l
Mus musculus ubiquitin associated protein 2-like
(Ubap2l), transcript variant 2,0.01495 1.5 0.01892 -4.2 0.03315 -3.1 ↕
Chr 4chr4:116473895-
116477403Zswim5
Mus musculus zinc finger, SWIM domain containing 5
(Zswim5), mRNA [NM_001029912]0.00108 -2.4 0.0223 -1.9 0.00126 2.5 ↕
Chr 4chr4:122794043-
122794102Pabpc4
Mus musculus poly A binding protein, cytoplasmic 4
(Pabpc4), transcript variant 0.0199 1.7 0.00303 2.0 0.01381 1.7 ↑
Chr 4chr4:126018254-
126018195Eif2c4
Mus musculus eukaryotic translation initiation factor 2C,
4 (Eif2c4), mRNA [NM_10.04612 -1.5 0.00799 -2.1 7.92E-05 -2.0 ↓
Chr 4chr4:131196947-
131196883Epb4.1
Mus musculus 10 days neonate cerebellum cDNA, RIKEN
full-length enriched library0.01879 2.3 0.02854 2.3 0.00164 2.8 ↑
Chr 4chr4:131572636-
1315725779530096D07Rik
RIKEN cDNA 9530096D07 gene
[Source:MarkerSymbol;Acc:MGI:2441753]
[ENSMUST0000004
0.00472 -1.4 0.0015 -1.8 0.00084 -1.5 ↓
Chr 4chr4:150960446-
150960505Tnfrsf25
Mus musculus tumor necrosis factor receptor
superfamily, member 25 (Tnfrsf25), m0.00215 -1.5 0.00024 -1.7 2.94E-05 -1.8 ↓
Chr 4chr4:154627261-
154627202A230069A22Rik
Mus musculus RIKEN cDNA A230069A22 gene
(A230069A22Rik), mRNA [NM_001033394]0.00325 2.6 0.04483 2.0 0.02445 2.3 ↑
Chr 4chr4:40459443-
404595022010003O02Rik
Mus musculus adult male small intestine cDNA, RIKEN full-
length enriched library0.01743 -1.5 0.00413 -2.9 0.00012 -2.3 ↓
Chr 4chr4:42776430-
42776371Ccl19
Mus musculus chemokine (C-C motif) l igand 19 (Ccl19),
mRNA [NM_011888]0.01625 -2.3 0.05161 -2.1 0.00704 -2.5 ↓
Chr 4chr4:43055216-
43055060B230312A22Rik
Mus musculus RIKEN cDNA B230312A22 gene
(B230312A22Rik), mRNA [NM_172691]0.00833 2.1 0.03375 1.9 0.04377 1.7 ↑
Chr 4chr4:49671132-
49671191Rnf20
Mus musculus ring finger protein 20 (Rnf20), mRNA
[NM_182999]0.02757 -1.5 0.02746 -1.5 0.00582 -1.7 ↓
Chr 4chr4:52499529-
52499588Smc2
Mus musculus structural maintenance of chromosomes 2
(Smc2), mRNA [NM_008017]0.00818 1.7 0.00403 1.9 0.00453 2.8 ↑
Chr 4chr4:64842834-
64842893Pappa
Mus musculus pregnancy-associated plasma protein A
(Pappa), mRNA [NM_021362]0.02753 1.8 0.01502 2.1 0.04897 1.7 ↑
Chr 4chr4:88338603-
883385444930553M12Rik
Mus musculus adult male testis cDNA, RIKEN full-length
enriched library, clone:40.00198 1.9 0.00021 2.5 0.00018 2.5 ↑
Chr 5chr5:116738100-
1167362301500001A10Rik Mus musculus mRNA for mKIAA1853 protein [AK129457] 0.02568 2.1 8.51E-05 1.9 0.00868 -2.2 ↕
Chr 5chr5:15037678-
15037619Speer4c
PREDICTED: Mus musculus spermatogenesis associated
glutamate (E)-rich protein 4c0.00084 2.9 0.03809 2.0 0.00194 -2.9 ↕
Chr 5chr5:26594067-
26594126LOC664837
PREDICTED: Mus musculus similar to RIKEN cDNA
5031410I06, transcript variant 2 (1.77E-08 3.8 0.00712 1.7 0.0473 -1.5 ↕
Chr 5chr5:27827153-
27827094Speer4b
Mus musculus spermatogenesis associated glutamate (E)-
rich protein 4b (Speer4b),0.00596 3.2 0.02735 2.8 0.04506 -2.3 ↕
Chr 5chr5:4250526-
4250585NAP067089-1 Unknown 0.04893 -1.7 0.01351 -2.1 0.05219 -1.6 ↓
Chr 5chr5:65910887-
659091719030416H16Rik
Mus musculus RIKEN cDNA 9030416H16 gene, mRNA
(cDNA clone MGC:29439 IMAGE:3964500.04501 1.6 0.05013 1.7 0.04813 1.5 ↑
Chr 5chr5:74909055-
74905333Lnx1
Mus musculus l igand of numb-protein X 1 (Lnx1), mRNA
[NM_010727]0.00529 -1.5 0.00312 -1.6 0.00132 3.7 ↕
Chr 5chr5:87638404-
87638345Tmprss11f
Mus musculus transmembrane protease, serine 11f
(Tmprss11f), mRNA [NM_178730]3.38E-05 2.7 1.17E-05 3.4 0.00039 -2.6 ↕
Chr 5chr5:92433181-
92433122Btc
Mus musculus betacellulin, epidermal growth factor
family member (Btc), mRNA [NM0.0301 -1.8 7.93E-11 -18.9 0.00331 -2.7 ↓
Chr 5chr5:93422014-
93421955Cxcl10
Mus musculus chemokine (C-X-C motif) l igand 10 (Cxcl10),
mRNA [NM_021274]0.05301 -2.4 0.00492 -4.5 0.00739 -3.3 ↓
Chr 6chr6:108516481-
108516540Itpr1
Mus musculus inositol 1,4,5-triphosphate receptor 1
(Itpr1), mRNA [NM_010585]5.80E-07 2.7 0.00112 1.5 0.00163 1.5 ↑
Chr 6chr6:117889534-
117889593Hnrpf
Mus musculus heterogeneous nuclear ribonucleoprotein F
(Hnrpf), mRNA [NM_133834]0.04362 1.6 0.01804 1.9 0.02914 1.6 ↑
Chr 6chr6:120759377-
120759436Slc25a18
PREDICTED: Mus musculus solute carrier family 25
(mitochondrial carrier), member0.02916 -1.9 0.03866 -1.9 0.01632 -1.9 ↓
Chr 6chr6:121854555-
121854614Mug1
Mus musculus murinoglobulin 1 (Mug1), mRNA
[NM_008645]0.0003 2.7 0.00227 2.5 0.00075 -2.3 ↕
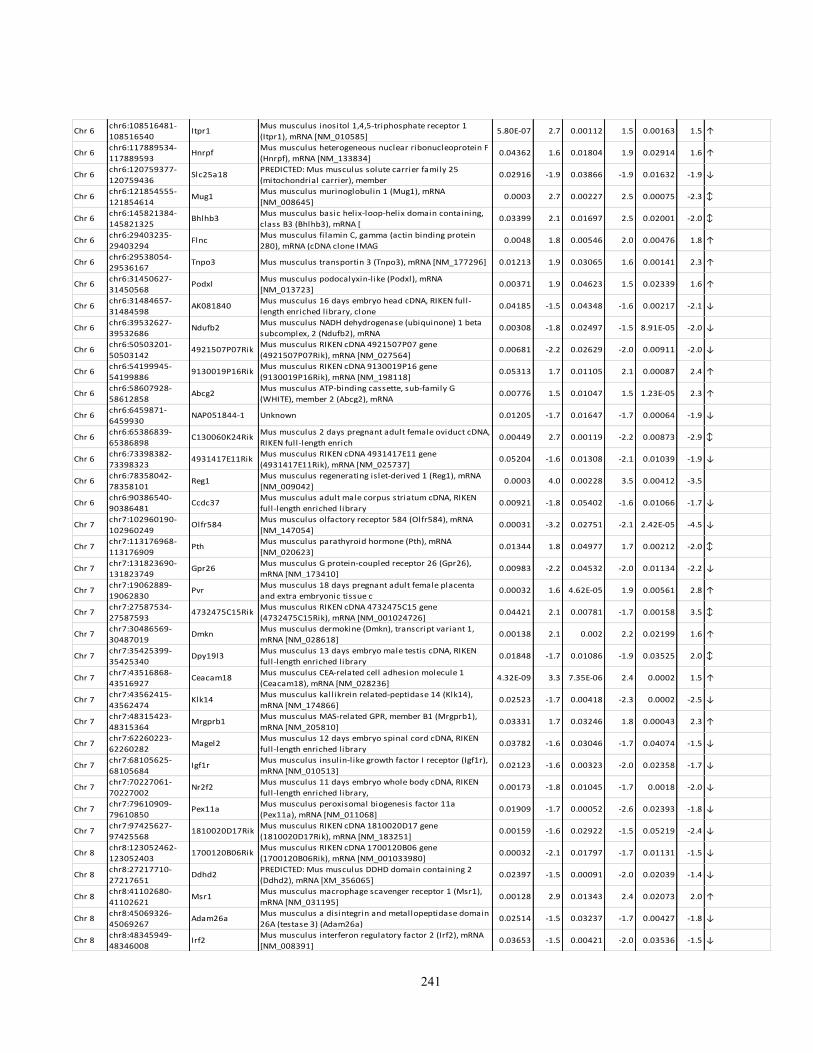
241
Chr 6chr6:108516481-
108516540Itpr1
Mus musculus inositol 1,4,5-triphosphate receptor 1
(Itpr1), mRNA [NM_010585]5.80E-07 2.7 0.00112 1.5 0.00163 1.5 ↑
Chr 6chr6:117889534-
117889593Hnrpf
Mus musculus heterogeneous nuclear ribonucleoprotein F
(Hnrpf), mRNA [NM_133834]0.04362 1.6 0.01804 1.9 0.02914 1.6 ↑
Chr 6chr6:120759377-
120759436Slc25a18
PREDICTED: Mus musculus solute carrier family 25
(mitochondrial carrier), member0.02916 -1.9 0.03866 -1.9 0.01632 -1.9 ↓
Chr 6chr6:121854555-
121854614Mug1
Mus musculus murinoglobulin 1 (Mug1), mRNA
[NM_008645]0.0003 2.7 0.00227 2.5 0.00075 -2.3 ↕
Chr 6chr6:145821384-
145821325Bhlhb3
Mus musculus basic helix-loop-helix domain containing,
class B3 (Bhlhb3), mRNA [0.03399 2.1 0.01697 2.5 0.02001 -2.0 ↕
Chr 6chr6:29403235-
29403294Flnc
Mus musculus fi lamin C, gamma (actin binding protein
280), mRNA (cDNA clone IMAG0.0048 1.8 0.00546 2.0 0.00476 1.8 ↑
Chr 6chr6:29538054-
29536167Tnpo3 Mus musculus transportin 3 (Tnpo3), mRNA [NM_177296] 0.01213 1.9 0.03065 1.6 0.00141 2.3 ↑
Chr 6chr6:31450627-
31450568Podxl
Mus musculus podocalyxin-like (Podxl), mRNA
[NM_013723]0.00371 1.9 0.04623 1.5 0.02339 1.6 ↑
Chr 6chr6:31484657-
31484598AK081840
Mus musculus 16 days embryo head cDNA, RIKEN full-
length enriched library, clone0.04185 -1.5 0.04348 -1.6 0.00217 -2.1 ↓
Chr 6chr6:39532627-
39532686Ndufb2
Mus musculus NADH dehydrogenase (ubiquinone) 1 beta
subcomplex, 2 (Ndufb2), mRNA0.00308 -1.8 0.02497 -1.5 8.91E-05 -2.0 ↓
Chr 6chr6:50503201-
505031424921507P07Rik
Mus musculus RIKEN cDNA 4921507P07 gene
(4921507P07Rik), mRNA [NM_027564]0.00681 -2.2 0.02629 -2.0 0.00911 -2.0 ↓
Chr 6chr6:54199945-
541998869130019P16Rik
Mus musculus RIKEN cDNA 9130019P16 gene
(9130019P16Rik), mRNA [NM_198118]0.05313 1.7 0.01105 2.1 0.00087 2.4 ↑
Chr 6chr6:58607928-
58612858Abcg2
Mus musculus ATP-binding cassette, sub-family G
(WHITE), member 2 (Abcg2), mRNA 0.00776 1.5 0.01047 1.5 1.23E-05 2.3 ↑
Chr 6chr6:6459871-
6459930NAP051844-1 Unknown 0.01205 -1.7 0.01647 -1.7 0.00064 -1.9 ↓
Chr 6chr6:65386839-
65386898C130060K24Rik
Mus musculus 2 days pregnant adult female oviduct cDNA,
RIKEN full-length enrich0.00449 2.7 0.00119 -2.2 0.00873 -2.9 ↕
Chr 6chr6:73398382-
733983234931417E11Rik
Mus musculus RIKEN cDNA 4931417E11 gene
(4931417E11Rik), mRNA [NM_025737]0.05204 -1.6 0.01308 -2.1 0.01039 -1.9 ↓
Chr 6chr6:78358042-
78358101Reg1
Mus musculus regenerating islet-derived 1 (Reg1), mRNA
[NM_009042]0.0003 4.0 0.00228 3.5 0.00412 -3.5
Chr 6chr6:90386540-
90386481Ccdc37
Mus musculus adult male corpus striatum cDNA, RIKEN
full-length enriched library0.00921 -1.8 0.05402 -1.6 0.01066 -1.7 ↓
Chr 7chr7:102960190-
102960249Olfr584
Mus musculus olfactory receptor 584 (Olfr584), mRNA
[NM_147054]0.00031 -3.2 0.02751 -2.1 2.42E-05 -4.5 ↓
Chr 7chr7:113176968-
113176909Pth
Mus musculus parathyroid hormone (Pth), mRNA
[NM_020623]0.01344 1.8 0.04977 1.7 0.00212 -2.0 ↕
Chr 7chr7:131823690-
131823749Gpr26
Mus musculus G protein-coupled receptor 26 (Gpr26),
mRNA [NM_173410]0.00983 -2.2 0.04532 -2.0 0.01134 -2.2 ↓
Chr 7chr7:19062889-
19062830Pvr
Mus musculus 18 days pregnant adult female placenta
and extra embryonic tissue c0.00032 1.6 4.62E-05 1.9 0.00561 2.8 ↑
Chr 7chr7:27587534-
275875934732475C15Rik
Mus musculus RIKEN cDNA 4732475C15 gene
(4732475C15Rik), mRNA [NM_001024726]0.04421 2.1 0.00781 -1.7 0.00158 3.5 ↕
Chr 7chr7:30486569-
30487019Dmkn
Mus musculus dermokine (Dmkn), transcript variant 1,
mRNA [NM_028618]0.00138 2.1 0.002 2.2 0.02199 1.6 ↑
Chr 7chr7:35425399-
35425340Dpy19l3
Mus musculus 13 days embryo male testis cDNA, RIKEN
full-length enriched library0.01848 -1.7 0.01086 -1.9 0.03525 2.0 ↕
Chr 7chr7:43516868-
43516927Ceacam18
Mus musculus CEA-related cell adhesion molecule 1
(Ceacam18), mRNA [NM_028236]4.32E-09 3.3 7.35E-06 2.4 0.0002 1.5 ↑
Chr 7chr7:43562415-
43562474Klk14
Mus musculus kall ikrein related-peptidase 14 (Klk14),
mRNA [NM_174866]0.02523 -1.7 0.00418 -2.3 0.0002 -2.5 ↓
Chr 7chr7:48315423-
48315364Mrgprb1
Mus musculus MAS-related GPR, member B1 (Mrgprb1),
mRNA [NM_205810]0.03331 1.7 0.03246 1.8 0.00043 2.3 ↑
Chr 7chr7:62260223-
62260282Magel2
Mus musculus 12 days embryo spinal cord cDNA, RIKEN
full-length enriched library0.03782 -1.6 0.03046 -1.7 0.04074 -1.5 ↓
Chr 7chr7:68105625-
68105684Igf1r
Mus musculus insulin-like growth factor I receptor (Igf1r),
mRNA [NM_010513]0.02123 -1.6 0.00323 -2.0 0.02358 -1.7 ↓
Chr 7chr7:70227061-
70227002Nr2f2
Mus musculus 11 days embryo whole body cDNA, RIKEN
full-length enriched library,0.00173 -1.8 0.01045 -1.7 0.0018 -2.0 ↓
Chr 7chr7:79610909-
79610850Pex11a
Mus musculus peroxisomal biogenesis factor 11a
(Pex11a), mRNA [NM_011068]0.01909 -1.7 0.00052 -2.6 0.02393 -1.8 ↓
Chr 7chr7:97425627-
974255681810020D17Rik
Mus musculus RIKEN cDNA 1810020D17 gene
(1810020D17Rik), mRNA [NM_183251]0.00159 -1.6 0.02922 -1.5 0.05219 -2.4 ↓
Chr 8chr8:123052462-
1230524031700120B06Rik
Mus musculus RIKEN cDNA 1700120B06 gene
(1700120B06Rik), mRNA [NM_001033980]0.00032 -2.1 0.01797 -1.7 0.01131 -1.5 ↓
Chr 8chr8:27217710-
27217651Ddhd2
PREDICTED: Mus musculus DDHD domain containing 2
(Ddhd2), mRNA [XM_356065]0.02397 -1.5 0.00091 -2.0 0.02039 -1.4 ↓
Chr 8chr8:41102680-
41102621Msr1
Mus musculus macrophage scavenger receptor 1 (Msr1),
mRNA [NM_031195]0.00128 2.9 0.01343 2.4 0.02073 2.0 ↑
Chr 8chr8:45069326-
45069267Adam26a
Mus musculus a disintegrin and metallopeptidase domain
26A (testase 3) (Adam26a)0.02514 -1.5 0.03237 -1.7 0.00427 -1.8 ↓
Chr 8chr8:48345949-
48346008Irf2
Mus musculus interferon regulatory factor 2 (Irf2), mRNA
[NM_008391]0.03653 -1.5 0.00421 -2.0 0.03536 -1.5 ↓
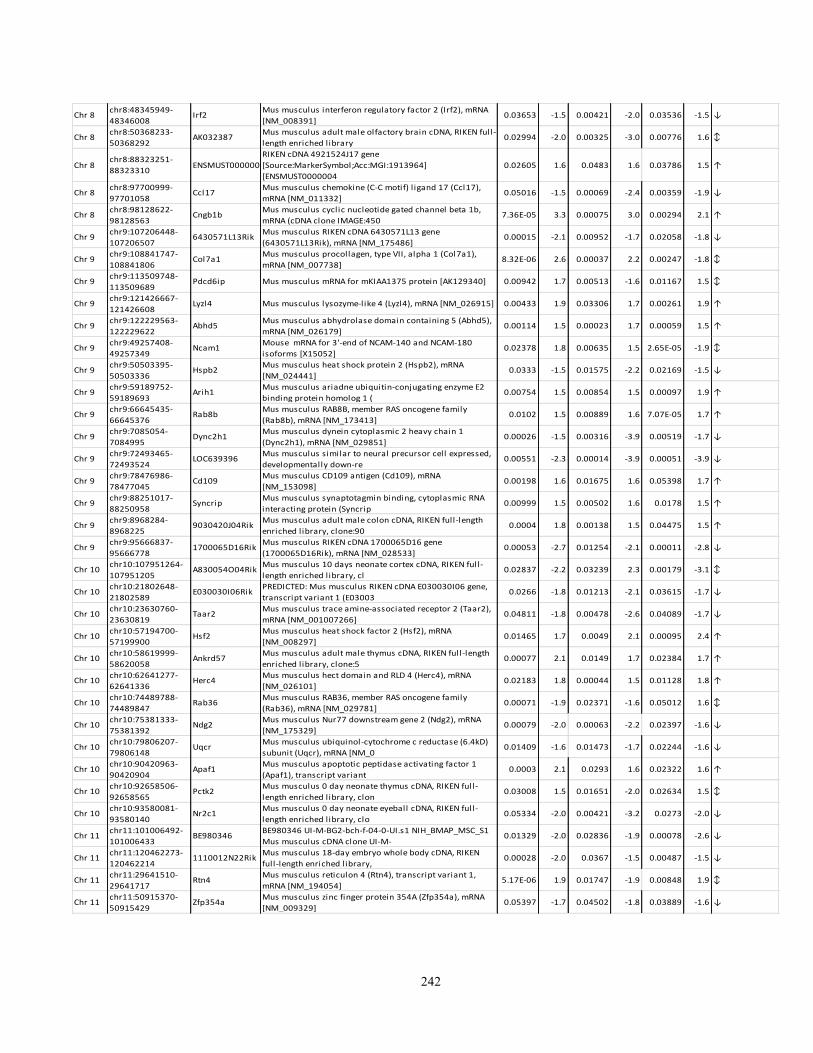
242
Chr 8chr8:48345949-
48346008Irf2
Mus musculus interferon regulatory factor 2 (Irf2), mRNA
[NM_008391]0.03653 -1.5 0.00421 -2.0 0.03536 -1.5 ↓
Chr 8chr8:50368233-
50368292AK032387
Mus musculus adult male olfactory brain cDNA, RIKEN full-
length enriched library0.02994 -2.0 0.00325 -3.0 0.00776 1.6 ↕
Chr 8chr8:88323251-
88323310ENSMUST00000047705
RIKEN cDNA 4921524J17 gene
[Source:MarkerSymbol;Acc:MGI:1913964]
[ENSMUST0000004
0.02605 1.6 0.0483 1.6 0.03786 1.5 ↑
Chr 8chr8:97700999-
97701058Ccl17
Mus musculus chemokine (C-C motif) l igand 17 (Ccl17),
mRNA [NM_011332]0.05016 -1.5 0.00069 -2.4 0.00359 -1.9 ↓
Chr 8chr8:98128622-
98128563Cngb1b
Mus musculus cyclic nucleotide gated channel beta 1b,
mRNA (cDNA clone IMAGE:4507.36E-05 3.3 0.00075 3.0 0.00294 2.1 ↑
Chr 9chr9:107206448-
1072065076430571L13Rik
Mus musculus RIKEN cDNA 6430571L13 gene
(6430571L13Rik), mRNA [NM_175486]0.00015 -2.1 0.00952 -1.7 0.02058 -1.8 ↓
Chr 9chr9:108841747-
108841806Col7a1
Mus musculus procollagen, type VII, alpha 1 (Col7a1),
mRNA [NM_007738]8.32E-06 2.6 0.00037 2.2 0.00247 -1.8 ↕
Chr 9chr9:113509748-
113509689Pdcd6ip Mus musculus mRNA for mKIAA1375 protein [AK129340] 0.00942 1.7 0.00513 -1.6 0.01167 1.5 ↕
Chr 9chr9:121426667-
121426608Lyzl4 Mus musculus lysozyme-like 4 (Lyzl4), mRNA [NM_026915] 0.00433 1.9 0.03306 1.7 0.00261 1.9 ↑
Chr 9chr9:122229563-
122229622Abhd5
Mus musculus abhydrolase domain containing 5 (Abhd5),
mRNA [NM_026179]0.00114 1.5 0.00023 1.7 0.00059 1.5 ↑
Chr 9chr9:49257408-
49257349Ncam1
Mouse mRNA for 3'-end of NCAM-140 and NCAM-180
isoforms [X15052]0.02378 1.8 0.00635 1.5 2.65E-05 -1.9 ↕
Chr 9chr9:50503395-
50503336Hspb2
Mus musculus heat shock protein 2 (Hspb2), mRNA
[NM_024441]0.0333 -1.5 0.01575 -2.2 0.02169 -1.5 ↓
Chr 9chr9:59189752-
59189693Arih1
Mus musculus ariadne ubiquitin-conjugating enzyme E2
binding protein homolog 1 (0.00754 1.5 0.00854 1.5 0.00097 1.9 ↑
Chr 9chr9:66645435-
66645376Rab8b
Mus musculus RAB8B, member RAS oncogene family
(Rab8b), mRNA [NM_173413]0.0102 1.5 0.00889 1.6 7.07E-05 1.7 ↑
Chr 9chr9:7085054-
7084995Dync2h1
Mus musculus dynein cytoplasmic 2 heavy chain 1
(Dync2h1), mRNA [NM_029851]0.00026 -1.5 0.00316 -3.9 0.00519 -1.7 ↓
Chr 9chr9:72493465-
72493524LOC639396
Mus musculus similar to neural precursor cell expressed,
developmentally down-re0.00551 -2.3 0.00014 -3.9 0.00051 -3.9 ↓
Chr 9chr9:78476986-
78477045Cd109
Mus musculus CD109 antigen (Cd109), mRNA
[NM_153098]0.00198 1.6 0.01675 1.6 0.05398 1.7 ↑
Chr 9chr9:88251017-
88250958Syncrip
Mus musculus synaptotagmin binding, cytoplasmic RNA
interacting protein (Syncrip0.00999 1.5 0.00502 1.6 0.0178 1.5 ↑
Chr 9chr9:8968284-
89682259030420J04Rik
Mus musculus adult male colon cDNA, RIKEN full-length
enriched library, clone:900.0004 1.8 0.00138 1.5 0.04475 1.5 ↑
Chr 9chr9:95666837-
956667781700065D16Rik
Mus musculus RIKEN cDNA 1700065D16 gene
(1700065D16Rik), mRNA [NM_028533]0.00053 -2.7 0.01254 -2.1 0.00011 -2.8 ↓
Chr 10chr10:107951264-
107951205A830054O04Rik
Mus musculus 10 days neonate cortex cDNA, RIKEN full-
length enriched library, cl0.02837 -2.2 0.03239 2.3 0.00179 -3.1 ↕
Chr 10chr10:21802648-
21802589E030030I06Rik
PREDICTED: Mus musculus RIKEN cDNA E030030I06 gene,
transcript variant 1 (E030030.0266 -1.8 0.01213 -2.1 0.03615 -1.7 ↓
Chr 10chr10:23630760-
23630819Taar2
Mus musculus trace amine-associated receptor 2 (Taar2),
mRNA [NM_001007266]0.04811 -1.8 0.00478 -2.6 0.04089 -1.7 ↓
Chr 10chr10:57194700-
57199900Hsf2
Mus musculus heat shock factor 2 (Hsf2), mRNA
[NM_008297]0.01465 1.7 0.0049 2.1 0.00095 2.4 ↑
Chr 10chr10:58619999-
58620058Ankrd57
Mus musculus adult male thymus cDNA, RIKEN full-length
enriched library, clone:50.00077 2.1 0.0149 1.7 0.02384 1.7 ↑
Chr 10chr10:62641277-
62641336Herc4
Mus musculus hect domain and RLD 4 (Herc4), mRNA
[NM_026101]0.02183 1.8 0.00044 1.5 0.01128 1.8 ↑
Chr 10chr10:74489788-
74489847Rab36
Mus musculus RAB36, member RAS oncogene family
(Rab36), mRNA [NM_029781]0.00071 -1.9 0.02371 -1.6 0.05012 1.6 ↕
Chr 10chr10:75381333-
75381392Ndg2
Mus musculus Nur77 downstream gene 2 (Ndg2), mRNA
[NM_175329]0.00079 -2.0 0.00063 -2.2 0.02397 -1.6 ↓
Chr 10chr10:79806207-
79806148Uqcr
Mus musculus ubiquinol-cytochrome c reductase (6.4kD)
subunit (Uqcr), mRNA [NM_00.01409 -1.6 0.01473 -1.7 0.02244 -1.6 ↓
Chr 10chr10:90420963-
90420904Apaf1
Mus musculus apoptotic peptidase activating factor 1
(Apaf1), transcript variant0.0003 2.1 0.0293 1.6 0.02322 1.6 ↑
Chr 10chr10:92658506-
92658565Pctk2
Mus musculus 0 day neonate thymus cDNA, RIKEN full-
length enriched library, clon0.03008 1.5 0.01651 -2.0 0.02634 1.5 ↕
Chr 10chr10:93580081-
93580140Nr2c1
Mus musculus 0 day neonate eyeball cDNA, RIKEN full-
length enriched library, clo0.05334 -2.0 0.00421 -3.2 0.0273 -2.0 ↓
Chr 11chr11:101006492-
101006433BE980346
BE980346 UI-M-BG2-bch-f-04-0-UI.s1 NIH_BMAP_MSC_S1
Mus musculus cDNA clone UI-M-0.01329 -2.0 0.02836 -1.9 0.00078 -2.6 ↓
Chr 11chr11:120462273-
1204622141110012N22Rik
Mus musculus 18-day embryo whole body cDNA, RIKEN
full-length enriched library, 0.00028 -2.0 0.0367 -1.5 0.00487 -1.5 ↓
Chr 11chr11:29641510-
29641717Rtn4
Mus musculus reticulon 4 (Rtn4), transcript variant 1,
mRNA [NM_194054]5.17E-06 1.9 0.01747 -1.9 0.00848 1.9 ↕
Chr 11chr11:50915370-
50915429Zfp354a
Mus musculus zinc finger protein 354A (Zfp354a), mRNA
[NM_009329]0.05397 -1.7 0.04502 -1.8 0.03889 -1.6 ↓

243
Chr 11chr11:5160083-
5160024Kremen1
Mus musculus 16 days embryo head cDNA, RIKEN full-
length enriched library, clone0.03086 -1.5 0.03863 -1.6 0.00013 -2.5 ↓
Chr 11chr11:61955256-
61955315TC1644694
Q5DTQ5_MOUSE (Q5DTQ5) MKIAA4061 protein
(Fragment), partial (20%) [TC1644694]0.02513 1.7 0.04407 1.7 0.00142 2.0 ↑
Chr 11chr11:66917550-
66917609Myh3
PREDICTED: Mus musculus myosin, heavy polypeptide 3,
skeletal muscle, embryonic 0.01264 -1.6 0.03535 -1.5 0.01021 -1.6 ↓
Chr 11chr11:68790423-
68790482Slc25a35
Mus musculus solute carrier family 25, member 35
(Slc25a35), mRNA [NM_028048]0.02179 -1.6 0.00729 -1.7 0.03635 -1.6 ↓
Chr 11chr11:80680725-
80680784Spaca3
Mus musculus sperm acrosome associated 3 (Spaca3),
mRNA [NM_029367]0.0028 -2.0 0.02331 -1.8 0.00019 -2.2 ↓
Chr 12chr11:94295255-
94295196Spata20
Mus musculus spermatogenesis associated 20 (Spata20),
mRNA [NM_144827]0.0017 -1.5 0.00058 -1.6 0.04658 -1.5 ↓
Chr 12chr12:101445617-
101445558Smek1
Mus musculus SMEK homolog 1, suppressor of mek1
(Dictyostelium) (Smek1), mRNA [N0.00828 1.7 0.02801 1.6 0.00649 1.7 ↑
Chr 12chr12:108776768-
1087768271600002O04Rik
PREDICTED: Mus musculus RIKEN cDNA 1600002O04 gene
(1600002O04Rik), mRNA [XM_1474.06E-05 2.3 0.00346 1.9 0.04326 -1.8 ↕
Chr 12chr12:113637224-
113637283Tmem121
Mus musculus transmembrane protein 121 (Tmem121),
mRNA [NM_153776]0.00026 -1.6 0.00028 -1.7 0.00101 -1.5 ↓
Chr 12chr12:119632407-
119632348Itgb8
PREDICTED: Mus musculus integrin beta 8, transcript
variant 1 (Itgb8), mRNA [XM_0.01292 -1.6 0.00827 -1.7 0.02509 -2.2 ↓
Chr 12chr12:32105719-
32105660Slc26a4
Mus musculus solute carrier family 26, member 4
(Slc26a4), mRNA [NM_011867]3.98E-08 10.9 2.06E-07 11.3 9.57E-05 5.2 ↑
Chr 12chr12:53886191-
53886250AK048748
Mus musculus 0 day neonate cerebellum cDNA, RIKEN full-
length enriched library, 0.00185 2.1 0.00072 2.5 0.01676 1.8 ↑
Chr 12chr12:55812459-
55812400Baz1a
PREDICTED: Mus musculus bromodomain adjacent to zinc
finger domain 1A (Baz1a), m0.00056 1.9 0.0186 -1.8 0.01755 1.5 ↕
Chr 12chr12:71377444-
71377503Txndc1
Mus musculus thioredoxin domain containing 1 (Txndc1),
mRNA [NM_028339]0.017 1.6 0.01316 1.8 0.00082 2.0 ↑
Chr 12chr12:88338961-
883390201810035L17Rik
Mus musculus partial mRNA for hypothetical protein,
clone Telethon(Italy_B41)_St0.05006 -1.5 0.01728 -1.7 0.05196 -1.6 ↓
Chr 12chr12:90476912-
90476971AK081115
Mus musculus 10 days neonate cerebellum cDNA, RIKEN
full-length enriched library0.00263 -1.7 0.00622 -1.7 5.61E-05 -2.1 ↓
Chr 12chr12:99183734-
99183793NAP046120-1 Unknown 0.02329 -1.5 0.01087 -1.6 0.00124 -1.8 ↓
Chr 13chr13:102837027-
102836968AK085102
Mus musculus 13 days embryo lung cDNA, RIKEN full-
length enriched library, clone0.03004 1.5 0.04945 1.5 0.02859 -2.3 ↓
Chr 13chr13:32850377-
32850318Serpinb1a
Mus musculus serine (or cysteine) peptidase inhibitor,
clade B, member 1a (Serpi2.99E-08 2.6 0.00106 1.6 8.18E-07 2.0 ↑
Chr 13chr13:61205022-
61204963Cts6 Mus musculus cathepsin 6 (Cts6), mRNA [NM_021445] 0.04363 -1.7 0.01404 -2.1 0.01565 -2.0 ↓
Chr 13chr13:64149966-
64149907Zfp367
Mus musculus zinc finger protein 367 (Zfp367), mRNA
[NM_175494]0.00028 1.8 0.00023 2.0 0.04006 1.9 ↑
Chr 13chr13:74132349-
74131679Slc6a18
Mus musculus solute carrier family 6 (neurotransmitter
transporter), member 18 (0.00587 -1.5 0.00317 -1.6 0.04035 1.6 ↕
Chr 13chr13:74815274-
748152161500032O14Rik
Mus musculus adult male cerebellum cDNA, RIKEN full-
length enriched library, clo0.015 -1.8 4.34E-05 -3.5 0.01143 -1.8 ↓
Chr 13chr13:84141092-
84141151Mef2c
Mus musculus myocyte enhancer factor 2C (Mef2c), mRNA
[NM_025282]0.00767 -2.0 0.01344 -2.0 0.00122 -2.2 ↓
Chr 13chr13:94406010-
94442522Homer1
homer homolog 1 (Drosophila)
[Source:MarkerSymbol;Acc:MGI:1347345] [ENSMUST000000.00759 1.5 0.00131 1.7 0.01926 1.5 ↑
Chr 14chr14:100335001-
100334942Tbc1d4
Mus musculus activated spleen cDNA, RIKEN full-length
enriched library, clone:F80.02166 1.9 0.0214 1.5 0.00183 -2.1 ↕
Chr 14chr14:100814710-
100814769Lmo7
CG02_13_B03.x1 FH CG02 Mus musculus cDNA clone
CG02_13_B03 similar to LIM domain8.03E-10 3.4 4.55E-05 2.0 0.04728 1.5 ↑
Chr 14chr14:118120528-
118120469Ugcgl2
PREDICTED: Mus musculus UDP-glucose ceramide
glucosyltransferase-like 2, transcr0.0062 1.7 0.00674 -2.2 0.01131 1.7 ↕
Chr 14chr14:31838178-
31838237Lrrc18
Mus musculus leucine rich repeat containing 18 (Lrrc18),
mRNA [NM_026253]0.03136 -1.5 0.00137 -2.0 0.0069 -2.3 ↓
Chr 14chr14:32207646-
32207587Mapk8
Mus musculus mitogen activated protein kinase 8, mRNA
(cDNA clone MGC:62245 IMAG0.03124 1.7 0.001 2.5 0.02655 1.6 ↑
Chr 14chr14:33358618-
33358559Ldb3
Mus musculus LIM domain binding 3 (Ldb3), transcript
variant 1, mRNA [NM_011918]0.00194 -1.9 0.01198 -1.7 0.00362 -1.7 ↓
Chr 14chr14:54836480-
54836421Cbln3
Mus musculus cerebellin 3 precursor protein (Cbln3),
mRNA [NM_019820]0.04601 1.6 0.00809 2.1 0.00091 3.4 ↑
Chr 14chr14:66295961-
662960209430085L16Rik
Mus musculus 12 days embryo embryonic body between
diaphragm region and neck cDN0.00151 -3.4 0.02438 -2.5 0.00037 -4.2 ↓
Chr 14chr14:68198527-
68198468Slc25a37
Mus musculus 12 days embryo embryonic body between
diaphragm region and neck cDN0.01073 2.1 0.02783 2.0 0.00601 1.8 ↑
Chr 14chr14:87313420-
87313361Pcdh20
Mus musculus protocadherin 20 (Pcdh20), mRNA
[NM_178685]5.08E-05 -3.0 4.20E-05 -3.5 0.00153 -3.1 ↓
Chr 14chr14:8988272-
8962068NAP064811-1 Unknown 0.00626 -2.2 0.05147 -1.8 0.00292 -2.4 ↓
Chr 15chr15:10634379-
10634320Rai14
Mus musculus adult male corpora quadrigemina cDNA,
RIKEN full-length enriched li0.01661 -1.7 0.03005 -1.7 0.00745 -2.0 ↓
Chr 15chr15:26733928-
26733869Fbxl7
Mus musculus 12 days embryo eyeball cDNA, RIKEN full-
length enriched library, cl0.00091 -2.4 0.00299 -2.4 0.00048 -3.2 ↓
Chr 15chr15:44502535-
445024765730410E15Rik
Mus musculus adult male hippocampus cDNA, RIKEN full-
length enriched library, cl0.04512 -1.7 0.00304 2.9 0.00549 1.8 ↕
Chr 15chr15:54864258-
54861192Taf2
PREDICTED: Mus musculus TAF2 RNA polymerase II, TATA
box binding protein (TBP)-a0.03539 1.5 0.01457 1.8 0.00921 1.8 ↑
Chr 15chr15:6371412-
6371855Dab2
Mus musculus disabled homolog 2 (Drosophila) (Dab2),
transcript variant 3, mRNA 0.00126 1.7 0.0057 1.9 0.00365 1.8 ↑

244
Chr 15chr15:26733928-
26733869Fbxl7
Mus musculus 12 days embryo eyeball cDNA, RIKEN full-
length enriched library, cl0.00091 -2.4 0.00299 -2.4 0.00048 -3.2 ↓
Chr 15chr15:44502535-
445024765730410E15Rik
Mus musculus adult male hippocampus cDNA, RIKEN full-
length enriched library, cl0.04512 -1.7 0.00304 2.9 0.00549 1.8 ↕
Chr 15chr15:54864258-
54861192Taf2
PREDICTED: Mus musculus TAF2 RNA polymerase II, TATA
box binding protein (TBP)-a0.03539 1.5 0.01457 1.8 0.00921 1.8 ↑
Chr 15chr15:6371412-
6371855Dab2
Mus musculus disabled homolog 2 (Drosophila) (Dab2),
transcript variant 3, mRNA 0.00126 1.7 0.0057 1.9 0.00365 1.8 ↑
Chr 15chr15:6706780-
67068394921505C17Rik
Mus musculus RIKEN cDNA 4921505C17 gene
(4921505C17Rik), mRNA [NM_030168]0.02965 2.0 0.02166 1.7 0.00587 2.4 ↑
Chr 15chr15:74651369-
74651428Hemt1 Mus musculus mRNA for HemT-3 protein [AJ242831] 2.91E-05 5.8 0.00915 3.0 0.0291 -2.0 ↕
Chr 15chr15:82203312-
82203253Cyp2d22
Mus musculus 15 days embryo head cDNA, RIKEN full-
length enriched library, clone0.02451 -2.1 0.02195 -2.3 0.00561 -2.7 ↓
Chr 15chr15:9012640-
90180671110020G09Rik
Mus musculus 4 days neonate male adipose cDNA, RIKEN
full-length enriched librar0.01933 1.5 0.00181 1.7 0.01149 1.4 ↑
Chr 15chr15:90847007-
90846948AK078857
Mus musculus adult male colon cDNA, RIKEN full-length
enriched library, clone:900.02065 -2.9 0.05386 -2.6 0.00052 -4.7 ↓
Chr 15chr15:98497981-
98497922Rnd1
Mus musculus Rho family GTPase 1 (Rnd1), mRNA
[NM_172612]0.00047 1.8 0.02526 1.5 0.03859 -1.5 ↕
Chr 15chr15:98862343-
98862534Tuba6
Mus musculus tubulin, alpha 6 (Tuba6), mRNA
[NM_009448]0.00117 2.1 0.01048 1.9 0.01968 1.8 ↑
Chr 16chr16:032698506-
032698565Muc4 Mus musculus mucin 4 (Muc4), mRNA [NM_080457] 0.02166 -1.6 0.04541 -1.8 8.66E-05 -2.5 ↓
Chr 16chr16:20573640-
20573939Psmd2
Mus musculus proteasome (prosome, macropain) 26S
subunit, non-ATPase, 2 (Psmd2),0.01744 1.5 0.02008 1.6 0.00983 1.5 ↑
Chr 16chr16:49831819-
49831878Cd47
Mus musculus adult male hippocampus cDNA, RIKEN full-
length enriched library, cl0.02871 -1.7 0.02111 -1.9 0.03457 -1.7 ↓
Chr 16chr16:76234512-
76234453Nrip1
Mus musculus 16 days embryo lung cDNA, RIKEN full-
length enriched library, clone1.05E-06 1.7 1.05E-05 1.8 0.00012 -2.3 ↕
Chr 16chr16:77384095-
773841532810055G20Rik
Mus musculus 15 days embryo male testis cDNA, RIKEN
full-length enriched library0.03231 -1.8 0.03414 -2.1 0.03653 -1.8 ↓
Chr 16chr16:8561558-
8564000Pmm2
Mus musculus phosphomannomutase 2 (Pmm2), mRNA
[NM_016881]4.45E-05 1.8 0.01082 1.5 1.04E-05 1.7 ↑
Chr 17chr17:13627718-
13627777Mllt4 PREDICTED: Mus musculus myeloid [XM_890447] 0.05372 -1.6 0.00445 -2.9 0.00404 -2.2 ↓
Chr 17chr17:15104504-
15104563AK044799
Mus musculus 9.5 days embryo parthenogenote cDNA,
RIKEN full-length enriched lib0.04372 -1.6 0.01864 -1.9 0.00722 -2.0 ↓
Chr 17chr17:21356011-
213560703110052M02Rik
Mus musculus 12 days embryo eyeball cDNA, RIKEN full-
length enriched library, cl0.01608 -1.6 0.00017 -2.4 0.01389 -1.9 ↓
Chr 17chr17:21524657-
21524598MGC29393
Mus musculus hypothetical gene MGC29393 (MGC29393),
mRNA [NM_029281]0.00407 -1.9 0.00036 -2.5 0.0152 -1.6 ↓
Chr 17chr17:28565376-
28565435Brpf3
Mus musculus cDNA, RIKEN full-length enriched library,
clone:M5C1075N18 product:0.01111 1.9 0.03633 1.8 0.04881 1.6 ↑
Chr 17chr17:32280266-
32280325Cyp4f16
Mus musculus cytochrome P450, family 4, subfamily f,
polypeptide 16 (Cyp4f16), m0.00112 1.8 0.04189 1.5 0.00248 1.6 ↑
Chr 17chr17:63608687-
63609305Fert2
Mus musculus fer (fms/fps related) protein kinase, testis
specific 2 (Fert2), tr0.04928 1.5 0.00581 1.9 0.02297 1.5 ↑
Chr 17chr17:74130419-
741220320610016J10Rik
Mus musculus 15 days embryo head cDNA, RIKEN full-
length enriched library, clone0.00281 1.5 0.03551 -1.5 0.00533 1.6 ↕
Chr 17chr17:84607731-
84607790Abcg8
Mus musculus ATP-binding cassette, sub-family G
(WHITE), member 8 (Abcg8), mRNA 0.00173 -2.1 0.00011 -2.9 1.89E-08 -3.5 ↓
Chr 18chr18:12286520-
12286579Riok3
Mus musculus RIO kinase 3 (yeast) (Riok3), mRNA
[NM_024182]9.21E-09 1.9 1.24E-05 1.6 0.00016 1.6 ↑
Chr 18chr18:34761926-
34761867Cdc23
Mus musculus CDC23 (cell division cycle 23, yeast,
homolog) (Cdc23), mRNA [NM_177.70E-07 1.5 0.03039 1.6 0.00056 1.9 ↑
Chr 18chr18:61421963-
61421904Ppargc1b
Mus musculus 3 days neonate thymus cDNA, RIKEN full-
length enriched library, clo0.00185 -1.7 0.00013 -2.2 0.00353 -1.6 ↓
Chr 18chr18:66984818-
66984759Mc4r
Mus musculus melanocortin 4 receptor (Mc4r), mRNA
[NM_016977]0.00035 2.2 0.02516 1.7 0.00568 1.7 ↑
Chr 18chr18:78263922-
78263863Slc14a1
Mus musculus solute carrier family 14 (urea transporter),
member 1 (Slc14a1), mR0.00086 2.2 0.01359 1.7 0.00112 2.0 ↑
Chr 19chr19:17740656-
17740597Pcsk5
PREDICTED: Mus musculus proprotein convertase
subtil isin [XM_129214]0.02247 -1.9 0.00442 -1.9 0.0288 -2.0 ↓
Chr 19chr19:3407031-
3407090Mtl5
Mus musculus metallothionein-like 5, testis-specific
(tesmin) (Mtl5), transcript0.00028 2.0 0.02309 1.5 0.00124 1.7 ↑
Chr 19chr19:42653405-
42653346Loxl4
Mus musculus lysyl oxidase-like 4 (Loxl4), mRNA
[NM_053083]0.03309 1.5 0.05063 1.5 0.00041 1.9 ↑
Chr 19chr19:47673498-
47673557Slk
Mus musculus STE20-like kinase (yeast) (Slk), mRNA
[NM_009289]0.00201 1.6 0.00066 1.8 0.00563 1.5 ↑
Chr XchrX:102487244-
102487185EG436227
PREDICTED: Mus musculus similar to RAN binding protein
5 (LOC436227), mRNA [XM_60.00547 2.5 0.01508 2.4 0.00166 2.8 ↑
Chr XchrX:118513543-
118513484Nap1l3
Mus musculus nucleosome assembly protein 1-like 3
(Nap1l3), mRNA [NM_138742]0.0169 -1.5 0.0493 -1.5 0.0275 -2.7 ↓
Chr XchrX:12718478-
12716303Cask
Mus musculus calcium/calmodulin-dependent serine
protein kinase (MAGUK family) (0.02564 1.7 0.05268 1.7 0.03362 1.6 ↑
Chr XchrX:131066050-
1310650791700129I15Rik
Mus musculus RIKEN cDNA 1700129I15 gene
(1700129I15Rik), mRNA [NM_030106]0.04256 -1.8 0.01327 -2.2 0.02143 -1.8 ↓
Chr XchrX:147262104-
147263076Huwe1
Mus musculus HECT, UBA and WWE domain containing 1
(Huwe1), mRNA [NM_021523]0.05109 1.9 0.01007 2.7 0.03339 2.0 ↑
Chr XchrX:155969795-
155968708Ppef1
PREDICTED: Mus musculus protein phosphatase with EF
hand calcium-binding domain 0.01617 1.8 0.02792 1.8 0.00166 2.2 ↑
Chr XchrX:32601604-
32601663Il13ra1
Mus musculus interleukin 13 receptor, alpha 1 (Il13ra1),
mRNA [NM_133990]5.03E-08 2.6 0.00076 1.7 0.00363 1.7 ↑
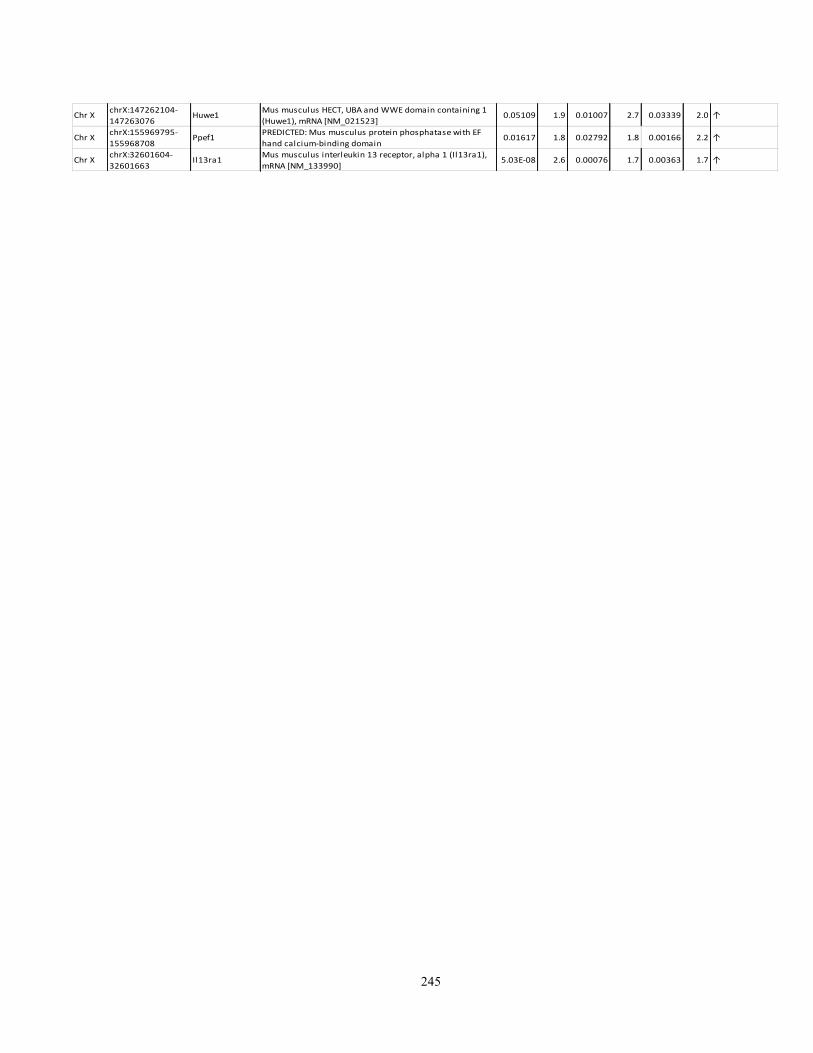
245
Chr XchrX:147262104-
147263076Huwe1
Mus musculus HECT, UBA and WWE domain containing 1
(Huwe1), mRNA [NM_021523]0.05109 1.9 0.01007 2.7 0.03339 2.0 ↑
Chr XchrX:155969795-
155968708Ppef1
PREDICTED: Mus musculus protein phosphatase with EF
hand calcium-binding domain 0.01617 1.8 0.02792 1.8 0.00166 2.2 ↑
Chr XchrX:32601604-
32601663Il13ra1
Mus musculus interleukin 13 receptor, alpha 1 (Il13ra1),
mRNA [NM_133990]5.03E-08 2.6 0.00076 1.7 0.00363 1.7 ↑

246
Appendix II
Genome wide candidate genes associated with autotomy in the spinal cord. The expression of
these genes differentially contrasted between A high vs. A sham, A low, and B low autotomy
mice at a p-value<0.05 and a -1.5>fold change>1.5

247
p-value FC p-value FC p-value FC
A_51_P144143 Unknown 0.00311 2.2 0.02768 1.8 0.004705 2.0 ↑
A_52_P756294 Unknown 0.028155 -1.8 0.006459 -2.2 0.002368 -2.5 ↓
1
chr1:173419775-
173419834 Cd244
Mus musculus CD244 natural kil ler cell
receptor 2B4 (Cd244), mRNA [NM_018729] 0.000589 4.7 0.004608 3.5 0.001678 4.5 ↑
1 chr1:93204297-93204356 BC056923
Mus musculus cDNA sequence BC056923
(BC056923), mRNA [NM_173395] 0.000575 -2.3 0.052241 -1.6 0.000315 4.9 ↕
2
chr2:152840517-
152842444 Hck
Mus musculus hemopoietic cell kinase (Hck),
mRNA [NM_010407] 0.000439 1.8 0.01733 1.5 0.002317 1.5 ↑
2
chr2:158194053-
158194111 BC054059
Mus musculus cDNA sequence BC054059
(BC054059), mRNA [NM_145635] 0.010497 1.5 0.010769 1.5 0.000432 -2.6 ↕
2 chr2:85380612-85380671 Olfr996
Mus musculus olfactory receptor 996
(Olfr996), mRNA [NM_146437] 0.05319 1.5 0.038565 1.6 0.020682 1.7 ↑
3
chr3:015348529-
015348470 Sirpb1
Mus musculus 2 days pregnant adult female
ovary cDNA, RIKEN full-length enriched 0.008169 2.7 0.027844 2.3 0.000311 3.4 ↑
3
chr3:096369943-
096369880 Fcgr1
Mus musculus strain AB/H (Biozzi) high
affinity immunoglobulin gamma Fc receptor 0.006367 2.1 0.035451 1.6 0.030384 1.7 ↑
4
chr4:133365725-
133365666 Cd52
Mus musculus CD52 antigen (Cd52), mRNA
[NM_013706] 0.012086 1.9 0.033703 1.7 0.027094 1.6 ↑
4 chr4:44546223-44546164 Pax5
Mus musculus adult male aorta and vein
cDNA, RIKEN full-length enriched library, 0.031117 -1.5 0.004985 -1.7 0.00291 -1.9 ↓
4 chr4:57804030-57804089 Palm2
Mus musculus paralemmin 2 (Palm2), mRNA
[NM_172868] 0.006506 1.5 0.012424 1.8 0.008827 1.5 ↑
5
chr5:115709119-
115709178 Msi1
Mus musculus 12 days embryo spinal
ganglion cDNA, RIKEN full-length enriched lib 0.039337 -2.1 0.049721 -2.1 0.017942 -2.2 ↓
5
chr5:137960881-
137960822 6430598A04Rik
Mus musculus RIKEN cDNA 6430598A04 gene
(6430598A04Rik), mRNA [NM_175521] 0.013192 -1.6 0.040411 -1.5 0.002022 -1.6 ↓
5
chr5:138082142-
138082083 Pilrb1
Mus musculus paired immunoglobin-like type
2 receptor beta 1 (Pilrb1), mRNA [NM_ 0.031787 2.0 0.021466 2.2 0.000677 2.7 ↑
5
chr5:151255290-
151255349 Kl
Mus musculus mRNA for secreted isoform of
Klotho protein, complete cds [AB010088 0.043075 -1.5 0.019356 -1.6 0.042877 -1.5 ↓
5 chr5:26334255-26332802 NAP030421-1 Unknown 0.000382 2.9 0.045309 1.8 0.000272 2.4 ↑
6
chr6:119738783-
119738724 Erc1
Mus musculus ELKS/RAB6-interacting/CAST
family member 1 (Erc1), transcript varia 0.042747 1.7 0.007141 1.8 0.008765 1.6 ↑
6
chr6:125652152-
125652211 Vwf
Mus musculus Von Willebrand factor
homolog (Vwf), mRNA [NM_011708] 0.000629 2.1 0.007385 1.8 0.011167 1.7 ↑
6
chr6:128336896-
128336955 TC1608296
U74612 forkhead box M1A (Homo sapiens)
(exp=-1; wgp=0; cg=0), partial (7%) [TC16 0.001126 -2.1 0.030692 -1.6 0.000403 -2.2 ↓
6 chr6:48676977-48677036 Gimap5
Mus musculus 0 day neonate lung cDNA,
RIKEN full-length enriched library, clone: 0.041022 1.7 0.052663 1.7 0.000418 2.2 ↑
6 chr6:70633716-70652162 L18942
Mus musculus immunoglobulin l ight chain
AbH130 VJ region mRNA, partial cds. [L18 0.006933 -1.8 0.016065 -1.7 0.002701 -2.3 ↓
7
chr7:100058635-
100058694 Kcne3
Mus musculus potassium voltage-gated
channel, Isk-related subfamily, gene 3 (Kcn 0.000857 4.7 0.024391 2.7 0.00055 4.2 ↑
7
chr7:100811781-
100811722 P2ry6
Mus musculus pyrimidinergic receptor P2Y, G-
protein coupled, 6 (P2ry6), mRNA [NM 0.000279 2.0 0.014567 1.6 0.011099 1.5 ↑
7
chr7:102452451-
102452510 Olfr550
Mus musculus olfactory receptor 550
(Olfr550), mRNA [NM_147104] 0.018138 -1.6 0.001984 -2.0 0.007857 -1.8 ↓
7
chr7:115332904-
115332845 Sox6
Mus musculus SRY-box containing gene 6
(Sox6), transcript variant 1, mRNA [NM_01 0.046212 -1.9 0.016585 2.3 0.006843 -2.5 ↕
7 chr7:29288473-29288532 6330444E15Rik
Mus musculus RIKEN cDNA 6330444E15 gene
(6330444E15Rik), mRNA [NM_001002767] 0.017829 -3.1 0.023119 -3.1 0.004761 -3.4 ↓
7 chr7:3315702-3315643 Lilrb3
Mus musculus leukocyte immunoglobulin-like
receptor, subfamily B (with TM and IT 0.020983 2.2 0.021992 2.1 0.053998 1.7 ↑
7 chr7:34829102-34829161 Cebpa
Mus musculus CCAAT/enhancer binding
protein (C/EBP), alpha (Cebpa), mRNA
[NM_007 0.023195 1.5 0.027609 1.5 0.027393 1.5 ↑
8 chr8:19023541-19023482 Defb38
Mus musculus defensin beta 38 (Defb38),
mRNA [NM_183036] 0.039239 -1.8 0.049692 -1.8 0.000759 -3.2 ↓
8 chr8:69447128-69447187 Tktl2
Mus musculus adult male testis cDNA, RIKEN
full-length enriched library, clone:4 0.022256 -1.7 0.035506 1.5 0.000427 1.8 ↕
8 chr8:87987554-87987613 Man2b1
Mus musculus mannosidase 2, alpha B1
(Man2b1), mRNA [NM_010764] 0.000316 1.5 0.001743 1.5 6.23E-05 1.5 ↑
9 chr9:20779144-20779203 Icam1
Mus musculus intercellular adhesion
molecule, mRNA (cDNA clone MGC:6195
IMAGE:35 0.003055 2.0 0.041917 1.6 0.002198 1.9 ↑
9 chr9:51676988-51677047 4933407I05Rik
Mus musculus adult male testis cDNA, RIKEN
full-length enriched library, clone:4 0.02292 1.6 0.029478 1.6 0.004362 1.6 ↑
9 chr9:88997625-89005486 Bcl2a1b
Mus musculus B-cell leukemia/lymphoma 2
related protein A1b (Bcl2a1b), mRNA [NM_ 0.000314 2.7 0.015572 1.9 0.012493 2.4 ↑
10
chr10:74401286-
74401227 Rtdr1
Mus musculus adult male testis cDNA, RIKEN
full-length enriched library, clone:4 0.016465 -1.8 0.041637 -1.7 0.000609 -2.2 ↓
10
chr10:78696506-
78696565 AJ543404
Mus musculus cDNA sequence AJ543404
(AJ543404), mRNA [NM_175936] 0.00223 -2.0 0.022038 -1.7 0.004851 -2.6 ↓
10
chr10:78988523-
78987832 Theg
Mus musculus testicular haploid expressed
gene (Theg), transcript variant 1, mRN 0.042957 -1.5 0.003788 -1.9 8.84E-05 -2.2 ↓
10
chr10:79295284-
79295509 NAP025923-1 Unknown 0.020349 -2.3 0.047093 -2.1 0.000255 -3.9 ↓
10
chr10:97043284-
97043343 Kera
Mus musculus keratocan (Kera), mRNA
[NM_008438] 0.014682 2.9 0.048062 2.4 0.000293 3.9 ↑
A high vs. B lowGene RegulationChrom Genomic Coordinates Gene Name Description
A high vs. A sham A high vs. A low
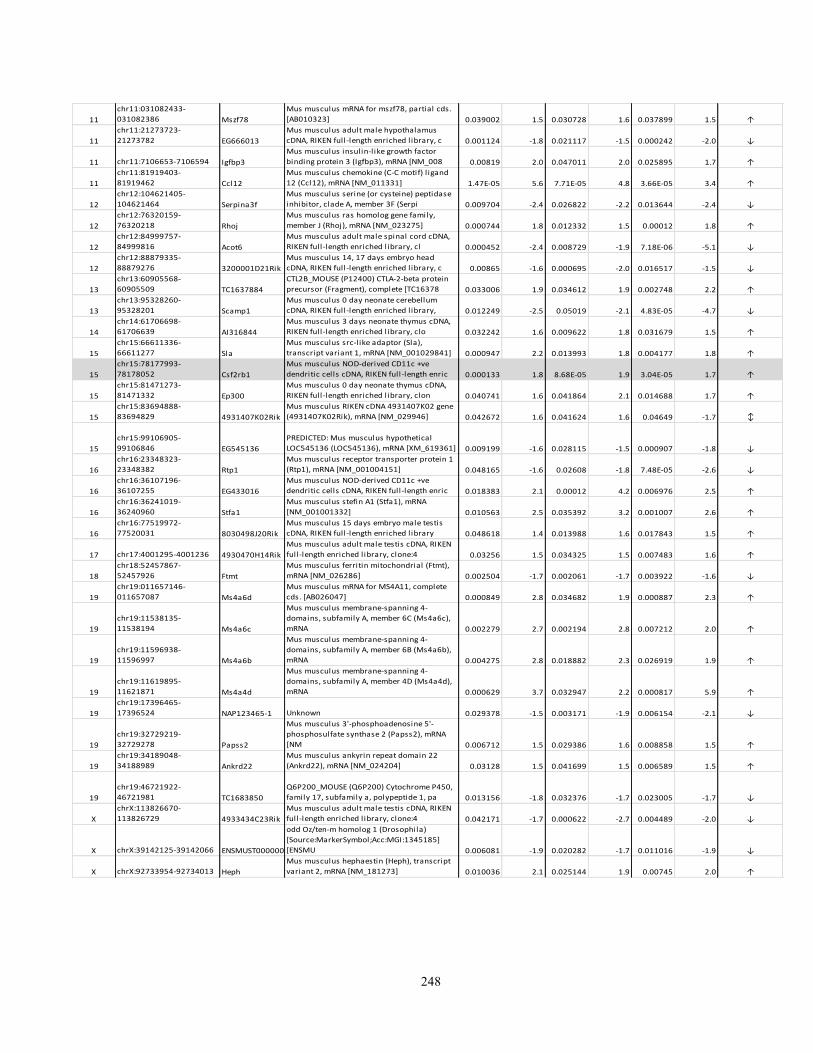
248
11
chr11:031082433-
031082386 Mszf78
Mus musculus mRNA for mszf78, partial cds.
[AB010323] 0.039002 1.5 0.030728 1.6 0.037899 1.5 ↑
11
chr11:21273723-
21273782 EG666013
Mus musculus adult male hypothalamus
cDNA, RIKEN full-length enriched library, c 0.001124 -1.8 0.021117 -1.5 0.000242 -2.0 ↓
11 chr11:7106653-7106594 Igfbp3
Mus musculus insulin-like growth factor
binding protein 3 (Igfbp3), mRNA [NM_008 0.00819 2.0 0.047011 2.0 0.025895 1.7 ↑
11
chr11:81919403-
81919462 Ccl12
Mus musculus chemokine (C-C motif) l igand
12 (Ccl12), mRNA [NM_011331] 1.47E-05 5.6 7.71E-05 4.8 3.66E-05 3.4 ↑
12
chr12:104621405-
104621464 Serpina3f
Mus musculus serine (or cysteine) peptidase
inhibitor, clade A, member 3F (Serpi 0.009704 -2.4 0.026822 -2.2 0.013644 -2.4 ↓
12
chr12:76320159-
76320218 Rhoj
Mus musculus ras homolog gene family,
member J (Rhoj), mRNA [NM_023275] 0.000744 1.8 0.012332 1.5 0.00012 1.8 ↑
12
chr12:84999757-
84999816 Acot6
Mus musculus adult male spinal cord cDNA,
RIKEN full-length enriched library, cl 0.000452 -2.4 0.008729 -1.9 7.18E-06 -5.1 ↓
12
chr12:88879335-
88879276 3200001D21Rik
Mus musculus 14, 17 days embryo head
cDNA, RIKEN full-length enriched library, c 0.00865 -1.6 0.000695 -2.0 0.016517 -1.5 ↓
13
chr13:60905568-
60905509 TC1637884
CTL2B_MOUSE (P12400) CTLA-2-beta protein
precursor (Fragment), complete [TC16378 0.033006 1.9 0.034612 1.9 0.002748 2.2 ↑
13
chr13:95328260-
95328201 Scamp1
Mus musculus 0 day neonate cerebellum
cDNA, RIKEN full-length enriched library, 0.012249 -2.5 0.05019 -2.1 4.83E-05 -4.7 ↓
14
chr14:61706698-
61706639 AI316844
Mus musculus 3 days neonate thymus cDNA,
RIKEN full-length enriched library, clo 0.032242 1.6 0.009622 1.8 0.031679 1.5 ↑
15
chr15:66611336-
66611277 Sla
Mus musculus src-l ike adaptor (Sla),
transcript variant 1, mRNA [NM_001029841] 0.000947 2.2 0.013993 1.8 0.004177 1.8 ↑
15
chr15:78177993-
78178052 Csf2rb1
Mus musculus NOD-derived CD11c +ve
dendritic cells cDNA, RIKEN full-length enric 0.000133 1.8 8.68E-05 1.9 3.04E-05 1.7 ↑
15
chr15:81471273-
81471332 Ep300
Mus musculus 0 day neonate thymus cDNA,
RIKEN full-length enriched library, clon 0.040741 1.6 0.041864 2.1 0.014688 1.7 ↑
15
chr15:83694888-
83694829 4931407K02Rik
Mus musculus RIKEN cDNA 4931407K02 gene
(4931407K02Rik), mRNA [NM_029946] 0.042672 1.6 0.041624 1.6 0.04649 -1.7 ↕
15
chr15:99106905-
99106846 EG545136
PREDICTED: Mus musculus hypothetical
LOC545136 (LOC545136), mRNA [XM_619361] 0.009199 -1.6 0.028115 -1.5 0.000907 -1.8 ↓
16
chr16:23348323-
23348382 Rtp1
Mus musculus receptor transporter protein 1
(Rtp1), mRNA [NM_001004151] 0.048165 -1.6 0.02608 -1.8 7.48E-05 -2.6 ↓
16
chr16:36107196-
36107255 EG433016
Mus musculus NOD-derived CD11c +ve
dendritic cells cDNA, RIKEN full-length enric 0.018383 2.1 0.00012 4.2 0.006976 2.5 ↑
16
chr16:36241019-
36240960 Stfa1
Mus musculus stefin A1 (Stfa1), mRNA
[NM_001001332] 0.010563 2.5 0.035392 3.2 0.001007 2.6 ↑
16
chr16:77519972-
77520031 8030498J20Rik
Mus musculus 15 days embryo male testis
cDNA, RIKEN full-length enriched library 0.048618 1.4 0.013988 1.6 0.017843 1.5 ↑
17 chr17:4001295-4001236 4930470H14Rik
Mus musculus adult male testis cDNA, RIKEN
full-length enriched library, clone:4 0.03256 1.5 0.034325 1.5 0.007483 1.6 ↑
18
chr18:52457867-
52457926 Ftmt
Mus musculus ferritin mitochondrial (Ftmt),
mRNA [NM_026286] 0.002504 -1.7 0.002061 -1.7 0.003922 -1.6 ↓
19
chr19:011657146-
011657087 Ms4a6d
Mus musculus mRNA for MS4A11, complete
cds. [AB026047] 0.000849 2.8 0.034682 1.9 0.000887 2.3 ↑
19
chr19:11538135-
11538194 Ms4a6c
Mus musculus membrane-spanning 4-
domains, subfamily A, member 6C (Ms4a6c),
mRNA 0.002279 2.7 0.002194 2.8 0.007212 2.0 ↑
19
chr19:11596938-
11596997 Ms4a6b
Mus musculus membrane-spanning 4-
domains, subfamily A, member 6B (Ms4a6b),
mRNA 0.004275 2.8 0.018882 2.3 0.026919 1.9 ↑
19
chr19:11619895-
11621871 Ms4a4d
Mus musculus membrane-spanning 4-
domains, subfamily A, member 4D (Ms4a4d),
mRNA 0.000629 3.7 0.032947 2.2 0.000817 5.9 ↑
19
chr19:17396465-
17396524 NAP123465-1 Unknown 0.029378 -1.5 0.003171 -1.9 0.006154 -2.1 ↓
19
chr19:32729219-
32729278 Papss2
Mus musculus 3'-phosphoadenosine 5'-
phosphosulfate synthase 2 (Papss2), mRNA
[NM 0.006712 1.5 0.029386 1.6 0.008858 1.5 ↑
19
chr19:34189048-
34188989 Ankrd22
Mus musculus ankyrin repeat domain 22
(Ankrd22), mRNA [NM_024204] 0.03128 1.5 0.041699 1.5 0.006589 1.5 ↑
19
chr19:46721922-
46721981 TC1683850
Q6P200_MOUSE (Q6P200) Cytochrome P450,
family 17, subfamily a, polypeptide 1, pa 0.013156 -1.8 0.032376 -1.7 0.023005 -1.7 ↓
X
chrX:113826670-
113826729 4933434C23Rik
Mus musculus adult male testis cDNA, RIKEN
full-length enriched library, clone:4 0.042171 -1.7 0.000622 -2.7 0.004489 -2.0 ↓
X chrX:39142125-39142066 ENSMUST00000084357
odd Oz/ten-m homolog 1 (Drosophila)
[Source:MarkerSymbol;Acc:MGI:1345185]
[ENSMU 0.006081 -1.9 0.020282 -1.7 0.011016 -1.9 ↓
X chrX:92733954-92734013 Heph
Mus musculus hephaestin (Heph), transcript
variant 2, mRNA [NM_181273] 0.010036 2.1 0.025144 1.9 0.00745 2.0 ↑

249
Appendix III
SNP variations in A vs. B mice, and other high- (C3H/HeJ, BALBc/cByJ), low- (C57BL/10J, AKR/J,
C58/J) and intermediate-autotomy strains (129S1/SvImJ, 129x1/SvJ, DBA/2J)
Gene : dbSNP Function Class
Assays
SNP A/J C3H/HeJ BALB/cByJ 129S1/SvImJ 129X1/SvJ DBA/2J C57BL/6J C57BL/10J AKR/J C58/J
Allele
(ss) Summary
Dennd3 : Intron 2 1 C C C G G C C/G
Dennd3 : Intron 2 2 C
T C C
C/T
Dennd3 : Intron 1 3 C
T C
C/T
Dennd3 : Intron 1 4 C
T C
C/T
Dennd3 : Intron 1 5 T
C T
C/T
Dennd3 : Intron 1 6 G
A
A/G
Dennd3 : Intron 1 7 T
A
A/T
Dennd3 : Intron 1 8 C
T
C/T
Dennd3 : Intron 1 9 C
A
A/C
Dennd3 : Intron 2 10 A
G A
A/G
Dennd3 : Intron 2 11 A
C A
A/C
Dennd3 : Intron 2 12 C
T C
C/T
Dennd3 : Intron 2 13 A
G A
A/G
Dennd3 : Intron 2 14 C
T
C/T
Dennd3 : Intron 2 15 T
C T T
C/T
Dennd3 : Intron 2 16 A
T A A
A/T
Dennd3 : Intron 1 17 T
C T
C/T
Dennd3 : Intron 1 18 T
G T
G/T
Dennd3 : Intron 2 19 G
G A G
A/G
Dennd3 : Intron 1 20 T
G T
G/T
Dennd3 : Intron 2 21 T
G G
G/T
Dennd3 : Intron 2 22 T
A A
A/T
Dennd3 : Intron 3 23 C C C G G C C
C
C/G
Dennd3 : Intron 3 24 A A A G G A A
A
A/G
Dennd3 : Intron 3 25 C C C T T C C
C
C/T
Dennd3 : Intron 2 26 C C C T T C
C
C/T
Dennd3 : Intron 2 27 G G G T
T G
G
G/T
Dennd3 : Intron 2 28 A A A G G A
A
A/G
Dennd3 : Intron 2 29 A A A G
G
A
A/G
Dennd3 : Intron 1 30 T T T A
T
T
A/T
Dennd3 : Intron 3 31 T T T
C C
T
C/T
Dennd3 : Intron 1 32
A G
A/G
Dennd3 : Intron 2 33 A
T A
A/T
Dennd3 : Intron 2 34 C C C T T C
C
C/T

250
Dennd3 : Intron 2 35 G
A G G
A/G
Dennd3 : Intron 1 36 G
A G
A/G
Dennd3 : Intron 3 37 C C C T T C C
C
C/T
Dennd3 : Intron 2 38 G
T G G
G/T
Dennd3 : Intron 1 39 A
T A
A/T
Dennd3 : Intron 1 40 G
A G
A/G
Dennd3 : Intron 1 41 T
C T
C/T
Dennd3 : Intron 1 42 T
C T
C/T
Dennd3 : Intron 1 43 G
A G
A/G
Dennd3 : Intron 1 44 T
G T
G/T
Dennd3 : Intron 1 45 T
C T
C/T
Dennd3 : Intron 1 46 T
C T
C/T
Dennd3 : Intron 2 47 A
G G
A/G
Dennd3 : Intron 1 48 C C C T
C
C
C/T
Dennd3 : Intron 3 49 A A A G
G
A
A/G
Dennd3 : Intron 3 50 C C C C
T C
C
C/T
Dennd3 : Intron 3 51 C C C T
C C
C
C/T
Dennd3 : Intron 3 52 C C C T
T C
C
C/T
Dennd3 : Intron 3 53 C C C T
C C
C
C/T
Dennd3 : Intron 1 54 T T T T
T
T
C/T
Dennd3 : Intron 3 55 C C C T
C C
C
C/T
Dennd3 : Intron 1 56 C
T
C C
C/T
Dennd3 : Intron 1 57 C
T
C C
C/T
Dennd3 : Intron 1 58 G G G G
G
G
A/G
Dennd3 : Intron 2 59 G G G T
G G
G
G/T
Dennd3 : Intron 3 60 T T T G
G T
T
G/T
Dennd3 : Intron 2 61 C
C G C
C/G
Dennd3 : Intron 1 62 A
G A
A/G
Dennd3 : Intron 1 63 G
A G
A/G
Dennd3 : Intron 2 64 T T T C C T
T
C/T
Dennd3 : Coding-Synonymous
2 65 C C C C C G
C
C/G
Dennd3 : Coding-Synonymous
3 66 T T T C C T T
T
C/T
Dennd3 : Intron 2 67 G G G C C G
G
C/G
Dennd3 : Intron 1 68 T
G T
G/T
Dennd3 : Intron 1 69 A
G
A/G
Dennd3 : Intron 1 70 A
G
A/G
Dennd3 : Intron 1 71
A G
A/G
Dennd3 : Intron 1 72
G A
A/G
Dennd3 : Intron 1 73 C
C T
C/T
Dennd3 : Intron 2 74 A A A T T T
A
A/T
Dennd3 : Intron 1 75 G
A A
A/G

251
Dennd3 : Intron 1 76 T
C C
C/T
Dennd3 : Intron 2 77 C C C T T T
C
C/T
Dennd3 : Intron 1 78 G
C G
C/G
Dennd3 : Intron 2 79 A A A G G G
A
A/G
Dennd3 : Intron 2 80 A A A G G G
A
A/G
Dennd3 : Intron 1 81 T
C T
C/T
Dennd3 : Intron 2 82 C C C T T T
C
C/T
Dennd3 : Intron 1 83 T
T C
C/T
Dennd3 : Intron 1 84 G G G G
G
G
A/G
Dennd3 : Intron 2 85 T T T C C C
T
C/T
Dennd3 : Intron 1 86 T T T C
C
T
C/T
Dennd3 : Intron 3 87 G G G A A G
G
A/G
Dennd3 : Intron 3 88 A A A G G G
A
A/G
Dennd3 : Coding-Synonymous
1 89 C C C C
C
C/G
Dennd3 : Intron 3 90 A A A G G G A
A
A/G
Dennd3 : Intron 1 91 G G G G
G
G
A/G
Dennd3 : Intron 2 92 G
A A G
A/G
Dennd3 : Intron 2 93 A
A G A
A/G
Dennd3 : Intron 2 94 G
T T G G
G/T
Dennd3 : Intron 2 95 T T T C C C
T
C/T
Dennd3 : Intron 1 96 A
G G
A/G
Dennd3 : Intron 1 97 G G G C
G
G
C/G
Dennd3 : Intron 1 98 T
G G
G/T
Dennd3 : Intron 1 99 G
G A
A/G
Dennd3 : Intron 1 100 C
T T
C/T
Dennd3 : Intron 1 101 A
G G
A/G
Dennd3 : Intron 2 102 A A A
G G
A
A/G
Dennd3 : Intron 1 103 T
C C
C/T
Dennd3 : Intron 2 104 A A A G G G
A
A/G
Dennd3 : Intron 2 105 G G G A A A
G
A/G
Dennd3 : Intron 1 106 A A A
A
A
A/G
Dennd3 : Intron 2 107 G G G
C
G
C/G
Dennd3 : Intron 1 108 A
T
A/T
Dennd3 : Intron 1 109 G
A
A/G
Dennd3 : Intron 1 110 T
C
C/T
Dennd3 : Intron 1 111 G
A
A/G
Dennd3 : Intron 1 112 G
A
A/G
Dennd3 : Intron 1 113 T
C
C/T
Dennd3 : Intron 1 114 T
C
C/T
Dennd3 : Intron 1 115 C
T
C/T
Dennd3 : Intron 1 116 T T T C
T
T
C/T
Dennd3 : Intron 1 117 T T T C
T
T
C/T

252
Dennd3 : Intron 1 118 C C C T
C
C
C/T
Dennd3 : Intron 2 119 C C C T
C
C
C/T
Dennd3 : Intron 2 120 C C C T T C
C
C/T
Dennd3 : Intron 1 121 G
A G
A/G
Dennd3 : Intron 1 122 C
T C
C/T
Dennd3 : Intron 1 123 T
C T
C/T
Dennd3 : Intron 2 124 G G G A A G
G
A/G
Dennd3 : Intron 2 125 T T T C C C
T
C/T
Dennd3 : Intron 2 126 A A A G G A
A
A/G
Dennd3 : Intron 2 127 C C C A A C
C
A/C
Dennd3 : Intron 2 128 G G G C C C
G
C/G
Dennd3 : Intron 2 129 T T T C
C
T
C/T
Dennd3 : Intron 1 130 A
C
A/C
Dennd3 : Intron 1 131 A
C
A/C
Dennd3 : Intron 1 132 G
A
A/G
Dennd3 : Intron 1 133 A
G
A/G
Dennd3 : Intron 1 134 G
T
G/T
Dennd3 : Intron 1 135
T T
T
Dennd3 : Intron 1 136 C C C T
T
C
C/T
Dennd3 : Intron 2 137 G G G G G A
G
A/G
Dennd3 : Intron 1 138 T
T C
C/T
Dennd3 : Intron 1 139 G
G A
A/G
Dennd3 : Intron 1 140 A
A T
A/T
Dennd3 : Intron 2 141 A A A
G G
A
A/G
Dennd3 : Intron 2 142 A A A G G G
A
A/G
Dennd3 : Intron 2 143 C C C T T C
C
C/T
Dennd3 : Intron 2 144 A A A G G G
A
A/G
Dennd3 : Intron 1 145 C
C T
C/T
Dennd3 : Intron 1 146 A A A A
T
A
A/T
Dennd3 : Intron 2 147 T T T C C C
T
C/T
Dennd3 : Intron 1 148 A
T
A/T
Dennd3 : Intron 1 149 T
A
A/T
Dennd3 : Intron 1 150 G
C
C/G
Dennd3 : Intron 1 151 G
T
G/T
Dennd3 : Intron 1 152 T
C
C/T
Dennd3 : Intron 2 153 T T T
C C
T
C/T
Dennd3 : Intron 2 154 G G G C C
G
C/G
Dennd3 : Intron 1 155 C
T
C/T
Dennd3 : Intron 1 156 C
A
A/C
Dennd3 : Intron 1 157 T
C
C/T
Dennd3 : Intron 2 158 A A A
G
A
A/G
Dennd3 : Intron 2 159 G G G
A
G
A/G
Dennd3 : Intron 1 160 A A A G
G
A
A/G

253
Dennd3 : Intron 1 161 G
A
A/G
Dennd3 : Intron 1 162 C
T
C/T
Dennd3 : Intron 1 163 T
G
G/T
Dennd3 : Intron 2 164 C
A C
A/C
Dennd3 : Intron 2 165 G
A G
A/G
Dennd3 : Intron 3 166 T T T C
C T
T
C/T
Dennd3 : Intron 1 167 C C C
C
C
A/C
Dennd3 : Intron 1 168 T T T C
T
T
C/T
Dennd3 : Intron 1 169 T T T C
T
T
C/T
Dennd3 : Intron 1 170 C C C T
C
C
C/T
Dennd3 : Intron 1 171 T T T C
T
T
C/T
Dennd3 : Intron 1 172 C C C A
C
C
A/C
Dennd3 : Intron 1 173 C C C T
C
C
C/T
Dennd3 : Intron 1 174 G
A G
A/G
Dennd3 : Intron 2 175 T
C C T
C/T
Dennd3 : Intron 1 176 G
G T
G/T
Dennd3 : Intron 1 177 C
G C
C/G
Dennd3 : Intron 2 178 C C C T T C
C
C/T
Dennd3 : Intron 1 179 G G G C
G
G
C/G
Dennd3 : Intron 2 180 G
T G
G/T
Dennd3 : Intron 1 181 G G G A
G
G
A/G
Dennd3 : Intron 3 182 G G G A
A G
G
A/G
Dennd3 : Intron 3 183 G G G T
T G
G
G/T
Dennd3 : Intron 2 184 A A A G G A
A
A/G
Dennd3 : Intron 1 185 C
T
C/T
Dennd3 : Intron 2 186 T T T G G G
T
G/T
Dennd3 : Intron 1 187 C C C T
C
C
C/T
Dennd3 : Intron 1 188 C
G
C/G
Dennd3 : Intron 1 189 C
T
C/T
Dennd3 : Intron 2 190 G G G A A G
G
A/G
Dennd3 : Intron 1 191 C
A
A/C
Dennd3 : Intron 2 192 T T T C C T
T
C/T
Dennd3 : Intron 1 193 T
A
A/T
Dennd3 : Intron 2 194 C
T C C
C/T
Dennd3 : Intron 3 195 C C C
T C C
C
C/T
Dennd3 : Intron 3 196 G G G C C G G
G
C/G
Dennd3 : Intron 2 197 A A A A A G
A
A/G
Dennd3 : Intron 3 198 T T T C C C
T
C/T
Dennd3 : Intron 1 199 G G G A
G
G
A/G
Dennd3 : Intron 1 200 A A A C
A
A
A/C
Dennd3 : Intron 1 201 G
A G
A/G
Dennd3 : Intron 1 202 G
A G
A/G
Dennd3 : Intron 1 203 G
A G
A/G

254
Dennd3 : Intron 1 204 T
C C
C/T
Dennd3 : Intron 1 205 T
C T
C/T
Dennd3 : Intron 1 206 C
T
C/T
Dennd3 : Intron 1 207
G A
A/G
Dennd3 : Intron 1 208
C T
C/T
Dennd3 : Intron 1 209
T C
C/T
Dennd3 : Intron 1 210 T T T C
T
T
C/T
Dennd3 : Intron 1 211 G
T
G
G/T
Dennd3 : Intron 3 212 ? C C C C T C
C
C/T
Dennd3 : Intron 1 213 A
G
A/G
Dennd3 : Intron 1 214 C
T C
C/T
Dennd3 : Intron 2 215 T
C T C
C/T
Dennd3 : Intron 2 216 C C C A A C
C
A/C
Dennd3 : Intron 3 217 A A A G G A A
A
A/G
Dennd3 : Intron 3 218 A A A
G A A
A
A/G
Dennd3 : Intron 2 219 G
A G G
A/G
Dennd3 : Intron 2 220 G
A G G
A/G
Dennd3 : Intron 3 221 C C C T T C C
C
C/T
Dennd3 : Intron 2 222 C C C T T C
C
C/T
Dennd3 : Intron 1 223 G
G A
A/G
Dennd3 : Intron 1 224 C
C T
C/T
Dennd3 : Intron 1 225 G
G A
A/G
Dennd3 : Intron 2 226 T T T
C C
T
C/T
Dennd3 : Intron 2 227 A A A T T A
A
A/T
Dennd3 : Intron 1 228 G G G
G
A/G
Dennd3 : Intron 2 229 C C C T T C
C
C/T
Dennd3 : Intron 1 230 C
A C
A/C
Dennd3 : Intron 2 231 G G G A A G
G
A/G
Dennd3 : Intron 2 232 C C C A A C
C
A/C
Dennd3 : Intron 2 233 T T T C C
T
C/T
Dennd3 : Intron 2 234 G G G A A
G
A/G
Dennd3 : Intron 1 235 A
G
A/G
Dennd3 : Intron 1 236 G
A
A/G
Dennd3 : Intron 1 237 G
T
G/T
Dennd3 : Intron 1 238 T
C T
C/T
Dennd3 : Intron 1 239 A
C A
A/C
Dennd3 : Intron 2 240 C C C T T C
C
C/T
Dennd3 : Intron 1 241 G
T G
G/T
Dennd3 : Intron 1 242 C
T C
C/T
Dennd3 : Intron 2 243 A
G G
A/G
Dennd3 : Intron 2 244 G G G A A G
G
A/G
Dennd3 : Intron 1 245 G
G A
A/G
Dennd3 : Intron 1 246 G
A A
A/G

255
Dennd3 : Intron 1 247 C
T C
C/T
Dennd3 : Intron 2 248 A A A G G G
A
A/G
Dennd3 : Intron 2 249 C C C T T T
C
C/T
Dennd3 : Intron 1 250 G
G A
A/G
Dennd3 : Intron 2 251 A A A G G
A
A/G
Dennd3 : Intron 2 252 T
C
T
C/T
Dennd3 : Intron 2 253 G
A
G
A/G
Dennd3 : Intron 3 254 G G
T
G
G
G/T
Dennd3 : Intron 2 255 C
G
C C
C/G
Dennd3 : Intron 2 256 A
G
A A
A/G
Dennd3 : Intron 2 257
A
G G
A/G
Dennd3 : Intron 2 258 C
C C T C
C/T
Dennd3 : Intron 3 259 C C C C C T C
C
C/T
Dennd3 : Intron 2 260 T T T
C
T
C/T
Dennd3 : Intron 3 261 G G G A A A G
G
A/G
Dennd3 : Intron 3 262 T T T
C T T
T
C/T
Dennd3 : Intron 3 263 T T T
C C T
T
C/T
Dennd3 : Intron 1 264 T T T C
T
C/T
Dennd3 : Intron 1 265 G G G A
G
A/G
Dennd3 : Intron 2 266 A A A T
A
A
A/T
Dennd3 : Intron 1 267 A A A A
A
A/G
Dennd3 : Intron 2 268 T
G
T T
G/T
Dennd3 : Intron 1 269 G G G G
G
A/G
Dennd3 : Intron 3 270 A A A G
A A
A
A/G
Dennd3 : Intron 1 271 T
T T G T
G/T
Dennd3 : Intron 2 272 T
G G T T
G/T
Dennd3 : Intron 2 273 C
G G
C
C/G
Dennd3 : Intron 1 274 G
A G G
A/G
Dennd3 : Intron 2 275 T T T C C C T
T
C/T
Dennd3 : Intron 1 276 G G G A
G
A/G
Dennd3 : Intron 1 277 A A A C
A
A/C
Dennd3 : Coding-Synonymous
2 278 C
T C
C/T
Dennd3 : Intron 2 279 G G G A A A
G
A/G
Dennd3 : Intron 1 280 A
T
A/T
Dennd3 : Intron 1 281 G
A G
A/G
Dennd3 : Intron 1 282 T
T
T
Dennd3 : Intron 1 283 C
G G
C/G
Dennd3 : Intron 1 284 G
A G
A/G
Dennd3 : Intron 1 285 T
C T
C/T
Dennd3 : Intron 2 286 T T T G
T
T
G/T
Dennd3 : Intron 1 287 C
C
C
Dennd3 : Intron 1 288 C
C
C

256
Dennd3 : Intron 2 289 T T T
A
T
A/T
Dennd3 : Intron 2 290 G G G T
G
G
G/T
Dennd3 : Intron 2 291 A A A G
G
A
A/G
Dennd3 : Intron 1 292 T
T C
C/T
Dennd3 : Intron 1 293 A
G A
A/G
Dennd3 : Intron 2 294 T T T C C C
T
C/T
Dennd3 : Intron 1 295 T
T C
C/T
Dennd3 : Intron 2 296 A A A G G A
A
A/G
Dennd3 : Intron 2 297 A A A C C A
A
A/C
Dennd3 : Intron 1 298 A
G A
A/G
Dennd3 : Intron 2 299 G G G A A G
G
A/G
Dennd3 : Intron 2 300 A
G A A
A/G
Dennd3 : Intron 2 301 C
T C C
C/T
Dennd3 : Intron 1 302 T
A T T
A/T
Dennd3 : Intron 2 303 T
C T T
C/T
Dennd3 : Intron 2 304 G
A G G
A/G
Dennd3 : Intron 2 305 C
T C C
C/T
Dennd3 : Intron 3 306 A A A G G G A
A
A/G
Dennd3 : Coding-Synonymous
1 307 A A A A
G
A
A/G
Dennd3 : Coding-Synonymous
1 308 G G G A
G
G
A/G
Dennd3 : Coding-NonSynonymous
1 309 G G G G
G
G
A/G
Dennd3 : Intron 2 310 A
G A A
A/G
Dennd3 : Intron 1 311 C
T
C/T
Dennd3 : Intron 1 312 A
T
A/T
Dennd3 : Intron 1 313 G
A
A/G
Dennd3 : Intron 1 314 A
G
A/G
Dennd3 : Intron 1 315 T
C
C/T
Dennd3 : Intron 1 316 T
C
C/T
Dennd3 : Intron 2 317 T
C
T
C/T
Dennd3 : Intron 1 318 A
G
A/G
Dennd3 : Intron 1 319 C
T
C/T
Dennd3 : Intron 1 320 T
A
A/T
Dennd3 : Intron 1 321 G
G A
A/G
Dennd3 : Intron 1 322 T
C T
C/T
Dennd3 : Intron 2 323 C
T C C
C/T
Dennd3 : Intron 1 324 A
G G
A/G
Dennd3 : Intron 1 325
A T
A/T
Dennd3 : Intron 1 326
G G
G
Dennd3 : Intron 2 327 A A A A A G
A
A/G
Dennd3 : Intron 2 328 G G G A A G
G
A/G

257
Dennd3 : Intron 2 329 C C C C C T
C
C/T
Dennd3 : Intron 1 330
A G
A/G
Dennd3 : Intron 1 331
G A
A/G
Dennd3 : Intron 1 332
T C
C/T
Dennd3 : Intron 2 333 G G G
G T
G
G/T
Dennd3 : Intron 1 334
G A
A/G
Dennd3 : Intron 2 335 T T T
C T
T
C/T
Dennd3 : Intron 2 336 G G G A A G
G
A/G
Dennd3 : Intron 1 337 C
G G
C/G
Dennd3 : Intron 3 338 A A A G G A A
A
A/G
Dennd3 : Intron 3 339 A A A G G A A
A
A/G
Dennd3 : Intron 2 340 C C C T T C
C
C/T
Dennd3 : Intron 1 341 T
C T
C/T
Dennd3 : Intron 3 342 T T T C C C T
T
C/T
Dennd3 : Intron 3 343 C C C G
G C
C
C/G
Dennd3 : Intron 2 344 A
G A
A/G
Dennd3 : Intron 2 345 T
G T
G/T
Dennd3 : Intron 1 346 A
A
A
Dennd3 : Intron 1 347 G
G
G
Dennd3 : Intron 2 348 C
A A A C
A/C
Dennd3 : Intron 2 349 T
C C T T
C/T
Dennd3 : Intron 2 350 A
G G G A
A/G
Dennd3 : Intron 2 351 G G G A A G
G
A/G
Dennd3 : Intron 1 352 A
G A
A/G
Dennd3 : Intron 1 353 T
C T
C/T
Dennd3 : Intron 1 354 G
A G
A/G
Dennd3 : Intron 1 355 G G G G
A
G
A/G
Dennd3 : Intron 2 356 A A A G
A
A
A/G
Dennd3 : Intron 2 357 T T T C
C
T
C/T
Dennd3 : Intron 1 358 A A A C
A
A
A/C
Dennd3 : Intron 1 359 T T T C
T
T
C/T
Dennd3 : Intron 2 360 T T T C
T T
T
C/T
Dennd3 : Intron 2 361 T T T C
T T
T
C/T
Dennd3 : Intron 2 362 C
T
C
C/T
Dennd3 : Intron 2 363 T
C
T
C/T
Dennd3 : Intron 2 364 C
T C C
C/T
Dennd3 : Intron 2 365 A A A T T A
A
A/T
Dennd3 : Intron 2 366 A A A G G A
A
A/G
Dennd3 : Intron 1 367 A
T A
A/T
Dennd3 : Intron 1 368 T
C T
C/T
Dennd3 : Intron 1 369 T
T C
C/T
Dennd3 : Intron 1 370 G G G C
G
G
C/G
Dennd3 : Intron 2 371 T T T C C T
T
C/T

258
Dennd3 : Intron 2 372 T T T C C T
T
C/T
Dennd3 : Intron 2 373 G G G G G A
G
A/G
Dennd3 : Intron 1 374 G G G A
G
G
A/G
Dennd3 : Intron 1 375 G G G A
G
G
A/G
Dennd3 : Intron 1 376 A A A C
A
A
A/C
Dennd3 : Intron 2 377 G G G A A G
G
A/G
Dennd3 : Intron 1 378 C
G
C/G
Dennd3 : Intron 2 379 A A A G G A
A
A/G
Dennd3 : Intron 2 380 A A A
G A
A
A/G
Dennd3 : Intron 1 381
G T
G/T
Dennd3 : Intron 1 382 T
C T
C/T
Dennd3 : Intron 1 383 G
A G
A/G
Dennd3 : Intron 2 384 T T T C C C
T
C/T
Dennd3 : Intron 2 385 C C C T T C
C
C/T
Dennd3 : Intron 2 386 C C C T T C
C
C/T
Dennd3 : Coding-Synonymous
2 387 G G G C C G
G
C/G
Dennd3 : Coding-Synonymous
2 388 C C C T T C
C
C/T
Dennd3 : Coding-Synonymous
2 389 C C C T T C
C
C/T
Dennd3 : Coding-Synonymous
2 390 C C C T T C
C
C/T
Dennd3 : Intron 1 391 C C C T
C
C
C/T
Dennd3 : Intron 1 392 A A A G
A
A
A/G
Dennd3 : Intron 1 393 C
T C
C/T
Dennd3 : Intron 1 394 T
A
A/T
Dennd3 : Intron 1 395 T
A
A/T
Dennd3 : Intron 1 396 C
T
C/T
Dennd3 : Intron 1 397 C
A
A/C
Dennd3 : Intron 1 398 C
A
A/C
Dennd3 : Intron 1 399 A
G
A/G
Dennd3 : Intron 1 400 C
T
C/T
Dennd3 : Intron 1 401 A
G
A/G
Dennd3 : Intron 1 402 T
G
G/T
Dennd3 : Intron 1 403 T
C C
C/T
Dennd3 : Intron 1 404 A A A C
A
A
A/C
Dennd3 : Intron 1 405 C C C G
C
C
C/G
Dennd3 : Intron 1 406 T T T C
T
T
C/T
Dennd3 : Coding-Synonymous
2 407 T T T C C C
T
C/T
Dennd3 : Coding-Synonymous
1 408 A A A G
A
A
A/G

259
Dennd3 : Intron 1 409 A A A
G
A
A/G
Dennd3 : Intron 1 410 T T T C
T
T
C/T
Dennd3 : Intron 2 411 C C C T T C
C
C/T
Dennd3 : Intron 2 412 G G G A A A
G
A/G
Dennd3 : Intron 2 413 G G G A A A
G
A/G
Dennd3 : Intron 2 414 G G G A A G
G
A/G
Dennd3 : Intron 1 415 A
G A
A/G
Dennd3 : Intron 1 416 G G G A
G
G
A/G
Dennd3 : Intron 1 417 A
G A
A/G
Dennd3 : Intron 1 418 T
C C
C/T
Dennd3 : Intron 1 419 A
C C
A/C
Dennd3 : Intron 1 420 G G G C
C
G
C/G
Dennd3 : Intron 1 421 A A A G
A
A
A/G
Dennd3 : Intron 1 422 T
C
C/T
Dennd3 : Intron 1 423 C
C T
C/T
Dennd3 : Intron 1 424
A A
A
Dennd3 : Intron 1 425 C
G C
C/G
Dennd3 : Intron 1 426
G G
G
Dennd3 : Intron 1 427
G G
G
Dennd3 : Intron 1 428 C
T C
C/T
Dennd3 : Intron 1 429 C
T C
C/T
Dennd3 : Intron 1 430
G A
A/G
Dennd3 : Intron 1 431 T
C
C/T
Dennd3 : Intron 2 432 C
T C
C/T
Dennd3 : Intron 1 433 G
G A
A/G
Dennd3 : Intron 2 434 A
G G
A/G
Dennd3 : Intron 1 435 A
G A
A/G
Dennd3 : Intron 2 436 T
C C C T
C/T
Dennd3 : Intron 2 437 T
G G T T
G/T
Dennd3 : Intron 1 438 G
A A
A/G
Dennd3 : Intron 2 439 C
T T C C
C/T
Dennd3 : Intron 2 440 T
G T T
G/T
Dennd3 : Intron 1 441 T
G G
G/T
Dennd3 : Intron 1 442
G
G
A/G
Dennd3 : Intron 2 443 T
G
G/T
Dennd3 : Intron 2 444 C
C
T
C/T
Dennd3 : Intron 1 445 T
C T
C/T
Dennd3 : Intron 1 446 G
A G
A/G
Dennd3 : Intron 1 447 T
C T
C/T
Dennd3 : Intron 1 448 C
T C
C/T
Dennd3 : Intron 1 449 A
T A
A/T
Dennd3 : Intron 1 450 T
C T
C/T
Dennd3 : Intron 1 451 A
G G
A/G

260
Dennd3 : Intron 1 452 C
T C
C/T
Dennd3 : Intron 1 453 C
T C
C/T
Dennd3 : Intron 1 454
A G
A/G
Dennd3 : Intron 1 455 G
A G
A/G
Dennd3 : Intron 2 456 A
C A
A/C
Dennd3 : Intron 1 457
C C
C
C/T
Dennd3 : Intron 1 458 G
C
C/G
Dennd3 : Intron 1 459 A
T
A/T
Dennd3 : Intron 1 460 A
G
A/G
Dennd3 : Intron 1 461 T
A T
A/T
Dennd3 : Intron 1 462 A
G
A/G
Dennd3 : Intron 2 463 C
C C G
C/G
Dennd3 : Intron 1 464 T
C T
C/T
Dennd3 : Intron 1 465 A
G A
A/G
Dennd3 : Intron 1 466 A
G
A/G
Dennd3 : Intron 1 467 T
C T
C/T
Dennd3 : Intron 1 468 C
T C
C/T
Dennd3 : Intron 1 469 T
G T
G/T
Dennd3 : Intron 2 470 T
C T
C/T
Dennd3 : Intron 1 471 G
C G
C/G
Dennd3 : Intron 1 472 C
T C
C/T
Dennd3 : Intron 1 473 C
A C
A/C
Dennd3 : Intron 1 474 G
T G
G/T
Dennd3 : Intron 1 475 C
T C
C/T
Dennd3 : Intron 2 476 ?
C C T
C/T
Dennd3 : Coding-Synonymous
3 477 A
G
A A
A/G
Dennd3 : Intron 3 478 C
C
T C
C/T
Dennd3 : Intron 2 479 T
C
T T
C/T
Dennd3 : Intron 1 480 A
G A
A/G
Dennd3 : Intron 1 481 A
A
A
Dennd3 : Intron 1 482 A
G
A/G
Dennd3 : Intron 2 483 C
G G
C/G
Dennd3 : Intron 2 484 C
C A
A/C
Dennd3 : Intron 1 485 G
T
G/T
Dennd3 : Intron 1 486 C
T
C/T
Dennd3 : Intron 1 487 G
A
A/G
Dennd3 : Intron 1 488 C
T
C/T
Dennd3 : Intron 1 489 T T T C
T
T
C/T
Dennd3 : Intron 1 490
T
A
A/T
Dennd3 : Intron 2 491 G
A G G
A/G
Dennd3 : Intron 3 492 T T T
C T T
T
C/T

261
Dennd3 : Coding-Synonymous
3 493 G G G A A G G
G
A/G
Dennd3 : Coding-NonSynonymous
2 494 A
G G
A
A/G
Dennd3 : Intron 2 495 T
C C
T
C/T
Dennd3 : Intron 2 496 A A A G G A
A
A/G
Dennd3 : Intron 2 497 A A A G
G
A
A/G
Dennd3 : Intron 1 498 C C C A
C
C
A/C
Dennd3 : Intron 1 499 C C C T
C
C
C/T
Dennd3 : Intron 1 500 C C C T
C
C
C/T
Dennd3 : Intron 1 501 T T T C
T
T
C/T
Dennd3 : Intron 1 502 A A A
T
A
A/T
Dennd3 : Intron 1 503 G G G A
G
G
A/G
Dennd3 : Intron 1 504 G G G A
G
G
A/G
Dennd3 : Intron 2 505 G
A G G
A/G
Dennd3 : Intron 3 506 G G G A A G G
G
A/G
Dennd3 : Intron 2 507 A
G G A A
A/G
Dennd3 : Intron 2 508 T
C C T T
C/T
Dennd3 : Intron 3 509 C C C T T C C
C
C/T
Dennd3 : Intron 3 510 T T T C
T T
T
C/T
Dennd3 : Intron 3 511 C C C T T C C
C
C/T
Dennd3 : Intron 3 512 G G G A A
G
G
A/G
Dennd3 : Intron 1 513 G G G G
T
G
G/T
Dennd3 : Intron 2 514 A
G G
A
A/G
Dennd3 : Intron 2 515 C
T T
C
C/T
Dennd3 : Intron 2 516 T
C C
T
C/T
Dennd3 : Intron 2 517 T
C C
T
C/T
Dennd3 : Intron 2 518 A
G G
A
A/G
Dennd3 : Intron 2 519 C
G C
C/G
Dennd3 : Intron 2 520 C
T C C
C/T
Dennd3 : Intron 2 521 A
G A A
A/G
Dennd3 : Intron 1 522 A
G A
A/G
Dennd3 : Intron 3 523 A A A G G A A
A
A/G
Dennd3 : Intron 3 524 G G G C C G
G
C/G
Dennd3 : Intron 2 525 C
T T C C
C/T
Dennd3 : Intron 3 526 G G G A A G G
G
A/G
Dennd3 : Coding-NonSynonymous
3 527 G G G A A G
G
A/G
Dennd3 : mRNA-UTR 3 528 G G G T T G G
G
G/T
Dennd3 : mRNA-UTR 1 529 A A A A
A
A
A/G
Dennd3 : mRNA-UTR 1 530 G G G A
G
G
A/G
Dennd3 : mRNA-UTR 1 531 G G G A
G
G
A/G
Dennd3 : mRNA-UTR 3 532 C C C T T C C
C
C/T

262
Dennd3 : mRNA-UTR 1 533 G G G G
G
G
A/G
Dennd3 : mRNA-UTR 3 534 C C C T T C C
C
C/T
Slc45a4 : Intron 1 1 A A A A G A A/G
Slc45a4 : mRNA-UTR 2 2 C
T T C C
C/T
Slc45a4 : mRNA-UTR 2 3 G G G A A G G
G
A/G
Slc45a4 : mRNA-UTR 2 4 C
A A C C
A/C
Slc45a4 : mRNA-UTR 3 5 A A A T T A A
A
A/T
Slc45a4 : mRNA-UTR 3 6 A A A G G A A
A
A/G
Slc45a4 : mRNA-UTR 1 7 T T T C
T
T
C/T
Slc45a4 : Coding-NonSynonymous
2 8 T
A
T
A/T
Slc45a4 : Coding-Synonymous
1 9 G G G G
A
G
A/G
Slc45a4 : Coding-Synonymous
3 10 G G G A A A G
G
A/G
Slc45a4 : Intron 3 11 G G G A A G G
G
A/G
Slc45a4 : Intron 3 12 T T T C C C T
T
C/T
Slc45a4 : Intron 1 13 A
G G
A/G
Slc45a4 : Intron 2 14 T
G G T T
G/T
Slc45a4 : Intron 1 15 T
A A A T
A/T
Slc45a4 : Intron 2 16
A A C C
A/C
Slc45a4 : Intron 3 17 A A A G G G A
A
A/G
Slc45a4 : Intron 3 18 A A A G
G A
A
A/G
Slc45a4 : Intron 3 19 G G G A
A G
G
A/G
Slc45a4 : Intron 2 20 A
G
G A
A/G
Slc45a4 : Intron 3 21 A A A G G A A
A
A/G
Slc45a4 : Intron 1 22 G
G G A G
A/G
Slc45a4 : Intron 3 23 G
C C C G
C/G
Slc45a4 : Intron 4 24 A A A G G A A
A
A/G
Slc45a4 : Intron 4 25 A A A G G A A
A
A/G
Slc45a4 : Coding-Synonymous
3 26 A A A G G A
A
A/G
Slc45a4 : Intron 2 27 C
T T
C
C/T
Slc45a4 : Intron 1 28 T T T C
C
T
C/T
Slc45a4 : Intron 1 29 C C C T
C
C
C/T
Slc45a4 : Intron 1 30 C C C T
C
C
C/T
Slc45a4 : Intron 2 31 C
A C
A/C
Slc45a4 : Intron 3 32 A A A G
G A
A
A/G
Slc45a4 : Intron 2 33 C
T T C
C/T
Slc45a4 : Intron 3 34 T T T G G T
T
G/T
Slc45a4 : Intron 3 35 C C C T T C C
C
C/T
Slc45a4 : Intron 3 36 G G G A A G G
G
A/G

263
Slc45a4 : Intron 3 37 A A A C C A A
A
A/C
Slc45a4 : Intron 3 38 G G G C C G G
G
C/G
Slc45a4 : Coding-Synonymous
3 39 G G G A A G
G
A/G
Slc45a4 : Coding-Synonymous
3 40 C C C T T C
C
C/T
Slc45a4 : Coding-Synonymous
3 41 T T T G G T
T
G/T
Slc45a4 : Coding-Synonymous
1 42 A
G A
A/G
Slc45a4 : Intron 3 43 C C C T T C C C C C C/T
Slc45a4 : Intron 4 44 G G G A A G G
G
A/G
Slc45a4 : Intron 2 45 G
C G G
C/G
Slc45a4 : Intron 2 46 G
G A G
A/G
Slc45a4 : Intron 3 47 C C C T T C C
C
C/T
Slc45a4 : Intron 2 48 T
C C T T
C/T
Slc45a4 : Intron 2 49 C
T T C C
C/T
Slc45a4 : Intron 3 50 T T T C C T T
T
C/T
Slc45a4 : Intron 2 51 G G G A A G
G
A/G
Slc45a4 : Intron 3 52 A
G G G A
A/G
Slc45a4 : Intron 3 53 A
C C A A
A/C
Slc45a4 : Intron 3 54 T T T C C T T
T
C/T
Slc45a4 : Intron 3 55 A A A G G A A
A
A/G
Slc45a4 : Intron 3 56 C C C T T C C
C
C/T
Slc45a4 : Intron 2 57 C
T C C
C/T
Slc45a4 : mRNA-UTR 3 58 G G G A A G G
G
A/G
Slc45a4 : Intron 2 59 C
T T C C
C/T
Slc45a4 : Intron 2 60 C
G G C C
C/G
Slc45a4 : Intron 1 61 A
G A
A/G
Slc45a4 : Intron 3 62 T T T C C T T
T
C/T
Slc45a4 : Intron 2 63 G G G A A G
G
A/G
Slc45a4 : Intron 2 64 T T T C C C
T
C/T
Slc45a4 : Intron 1 65 G
A G
A/G
Slc45a4 : Intron 2 66 A A A C C A
A
A/C
Slc45a4 : Intron 1 67
T G
G/T
Slc45a4 : Intron 1 68
T C
C/T
Slc45a4 : Intron 1 69 A
G A
A/G
Slc45a4 : Intron 1 70 C
T C
C/T
Slc45a4 : Intron 1 71 C
T C
C/T
Slc45a4 : Intron 1 72 T
G T
G/T
Slc45a4 : Intron 1 73 C
T C
C/T
Slc45a4 : Intron 1 74 T T T C
T
T
C/T
Slc45a4 : Intron 1 75 A
C
A/C

264
Slc45a4 : Intron 1 76 C
T C
C/T
Slc45a4 : Intron 2 77 T T T C C C
T
C/T
Slc45a4 : Intron 1 78 A A A C
A
A
A/C
Slc45a4 : Intron 2 79 G G G A A G
G
A/G
Slc45a4 : Intron 2 80 A A A G G A
A
A/G
Slc45a4 : Intron 1 81
T A
A/T
Slc45a4 : Intron 2 82 G G G
C G
G
C/G
Slc45a4 : Intron 2 83 A A A A A G
A
A/G
Slc45a4 : Intron 2 84 A A A C C A
A
A/C
Slc45a4 : Intron 1 85 T
T G
G/T
Slc45a4 : Intron 1 86 A
G
A/G
Slc45a4 : Intron 1 87 A
C A
A/C
Slc45a4 : Intron 3 88 C C C T T C C
C
C/T
Slc45a4 : Intron 2 89 C C C G G C
C
C/G
Slc45a4 : Intron 3 90 T T T G
T T
T
G/T
Slc45a4 : Intron 3 91 G G G A A G G
G
A/G
Slc45a4 : Intron 3 92 C C C T T C C
C
C/T
Slc45a4 : Intron 3 93 T T T C C T T
T
C/T
Slc45a4 : Intron 3 94 C C C T T C C
C
C/T
Slc45a4 : Intron 1 95 G
A G
A/G
Slc45a4 : Intron 2 96 A A A G G A
A
A/G
Slc45a4 : Intron 1 97 T
A T
A/T
Slc45a4 : Intron 3 98 C C C
G G C
C
C/G
Slc45a4 : Intron 1 99 T
C T T
C/T
Slc45a4 : Intron 2 100 G
A G G
A/G
Slc45a4 : Intron 2 101 T T T G G T
T
G/T
Slc45a4 : Intron 3 102
T
C
C/T
Slc45a4 : Intron 4 103 A A A
C A A
A
A/C
Slc45a4 : Intron 1 104 A A A A
G
A
A/G
Slc45a4 : Intron 4 105 C C C A A C C
C
A/C
Slc45a4 : Intron 3 106 C C C T T C C
C
C/T
Slc45a4 : Intron 3 107 C C C T T T C
C
C/T
Slc45a4 : Intron 2 108 A A A A A G G
A
A/G
Slc45a4 : Intron 1 109 T T T G
T
T
G/T
Slc45a4 : Intron 2 110 G
C G
C/G
Slc45a4 : Intron 3 111 A A A G
G A
A
A/G
Slc45a4 : Intron 3 112 G G G G
A G
G
A/G
Slc45a4 : Intron 3 113 A A A G
G A
A
A/G
Slc45a4 : Intron 4 114 T T T C
T T
T
C/T
Slc45a4 : Intron 4 115 T T T C
T T
T
C/T
Slc45a4 : Intron 2 116
A
G G
A/G
Slc45a4 : Intron 4 117 C C C T
C C
C
C/T
Slc45a4 : Intron 1 118 C C C C
C
C
C/T

265
Slc45a4 : Intron 3 119 C C C T T C C
C
C/T
Slc45a4 : Intron 3 120 G G G A A G G
G
A/G
Slc45a4 : Intron 3 121 T
G G T T
G/T
Slc45a4 : Intron 2 122 T T T T T G
T
G/T
Slc45a4 : Intron 3 123 A
G G G A
A/G
Slc45a4 : Intron 3 124 C C C C C T C
C
C/T
Slc45a4 : Intron 2 125 G G G G G A
G
A/G
Slc45a4 : Intron 2 126 G G G A A G
G
A/G
Slc45a4 : Intron 2 127 C C C T T T
C
C/T
Slc45a4 : Intron 2 128 G
A
G G
A/G
Slc45a4 : Intron 3 129 T T T C C T T
T
C/T
Slc45a4 : Intron 4 130 G G G A A G G
G
A/G
Slc45a4 : Intron 2 131 T
C T T
C/T
Slc45a4 : Intron 1 132 C C C A
C
C
A/C
Slc45a4 : Intron 3 133 T T T C
C
T
C/T
Slc45a4 : Intron 1 134 A A A G
A
A/G
Slc45a4 : Intron 3 135 T T T C
C
T
C/T
Slc45a4 : Intron 1 136 A A A T
A
A
A/T
Slc45a4 : Intron 2 137 T
C T T
C/T
Slc45a4 : Intron 2 138 C
G C C
C/G
Slc45a4 : Intron 1 139 T T T C
T
T
C/T
Slc45a4 : Intron 1 140 C
T C
C/T
Slc45a4 : Intron 1 141 C
A C
A/C
Slc45a4 : Intron 3 142 A A A T T A A
A
A/T
Slc45a4 : Intron 2 143 C C C T T C
C
C/T
Slc45a4 : Intron 2 144 A A A
G A
A
A/G
Slc45a4 : Intron 2 145 G
A G G
A/G
Slc45a4 : Intron 3 146 T T T G G G T
T
G/T
Slc45a4 : Intron 1 147 C
C T
C/T
Slc45a4 : Intron 3 148 C C C A A C C
C
A/C
Slc45a4 : Intron 3 149 G G G A A G G
G
A/G
Slc45a4 : Coding-Synonymous
3 150 T T T G G T T
T
G/T
Slc45a4 : Coding-Synonymous
1 151 G G G G
G
G
A/G
Slc45a4 : mRNA-UTR 3 152 C C C T T C
C
C/T
Slc45a4 : mRNA-UTR 3 153 G G G A A G G
G
A/G
Slc45a4 : Intron 2 154 T T T G G T T
T
G/T
Slc45a4 : Intron 2 155 C C C T T C C
C
C/T
Slc45a4 : Intron 1 156 T T T
T
G/T
Slc45a4 : Intron 1 157 A A A
A
A/C
Slc45a4 : Intron 2 158 G G G A A G G
G
A/G
Slc45a4 : Intron 3 159 G G G A A A G
G
A/G

266
Slc45a4 : Intron 2 160 G
C G
C/G
Slc45a4 : Intron 2 161 G
C G
C/G
Slc45a4 : Intron 3 162 G G G A A G G
G
A/G
Slc45a4 : Intron 3 163 C C C T T C C
C
C/T
Slc45a4 : Intron 3 164 C C C T T C C
C
C/T
Slc45a4 : Intron 2 165 T
A A T T
A/T
Slc45a4 : Intron 2 166 G
G C G
C/G
Slc45a4 : Intron 1 167 A A A G
A
A
A/G
Slc45a4 : Intron 2 168 C
T C
C/T
Slc45a4 : Intron 3 169 C C C G G C
C
C/G
Slc45a4 : Intron 1 170 C C C C
C
C
C/T
Slc45a4 : Intron 2 171 G G G A A G G
G
A/G
Slc45a4 : Intron 1 172 A A A G
A
A
A/G
Slc45a4 : Intron 3 173 T T T C C C T
T
C/T
Slc45a4 : Intron 3 174 C C C C C T C
C
C/T
Slc45a4 : Intron 1 175 C C C C
C
C/T
Slc45a4 : Intron 2 176 A A A T T A A
A
A/T
Slc45a4 : Intron 1 177 G G G G
T
G
G/T
Slc45a4 : Intron 1 178 C C C C
T
C
C/T
Slc45a4 : Intron 2 179 A
G G A
A/G
Slc45a4 : Intron 3 180 A A A G G A A
A
A/G
Slc45a4 : Intron 3 181 T T T G G T T
T
G/T
Slc45a4 : Intron 2 182 A
G G A
A/G
Slc45a4 : Intron 1 183 T T T G
T
T
G/T
Slc45a4 : Intron 2 184 C
T C C
C/T
Slc45a4 : Intron 3 185 T T T C C T T
T
C/T
Slc45a4 : Intron 3 186 G G G A A G G
G
A/G
Slc45a4 : Intron 3 187 T T T C C C T
T
C/T
Slc45a4 : Intron 3 188 G G G G G A G
G
A/G
Slc45a4 : Intron 3 189 A A A G G A A
A
A/G
Slc45a4 : Intron 2 190 T
C T
C/T
Slc45a4 : Intron 2 191 A
G A A
A/G
Slc45a4 : Intron 2 192 A
G A A
A/G
Slc45a4 : Intron 2 193 C
A C C
A/C
Slc45a4 : Intron 2 194 C
G C C
C/G
Slc45a4 : Intron 2 195 T T T C C T T
T
C/T
Slc45a4 : Intron 1 196 C C C T
C
C
C/T
Slc45a4 : Intron 1 197 G G G C
G
G
C/G
Slc45a4 : Intron 1 198 G
A G
A/G
Slc45a4 : Intron 2 199 A A A
G A A
A
A/G
Slc45a4 : Intron 2 200 T
C C T
C/T
Slc45a4 : Intron 2 201 G
G T G
G/T
Slc45a4 : Intron 2 202 C C C C
T C
C
C/T

267
Slc45a4 : Intron 1 203 A
G A A
A/G
Slc45a4 : Intron 1 204 T T T A
T
T
A/T
Slc45a4 : Intron 3 205 C C C T T C C
C
C/T
Slc45a4 : Intron 3 206 T T T C C T T
T
C/T
Slc45a4 : Intron 3 207 A A A G G A A
A
A/G
Slc45a4 : Intron 3 208 T T T C C T T
T
C/T
Slc45a4 : Intron 2 209 T T T T T C
T
C/T
Slc45a4 : Intron 2 210 T
A T
A/T
Slc45a4 : Intron 1 211 C C C A
C
C
A/C
Slc45a4 : Intron 1 212 A A A A
G
A
A/G
Slc45a4 : Intron 2 213 G
A
G
A/G
Slc45a4 : Intron 2 214 T
G
T
G/T
Slc45a4 : Intron 3 215 A A A G G A A
A
A/G
Slc45a4 : Intron 1 216 A
G
A/G
Slc45a4 : Intron 2 217 A
G
A
A/G
Slc45a4 : Intron 2 218 T
A T T
A/T
Slc45a4 : Intron 2 219 T T T C
T
T
C/T
Slc45a4 : Intron 2 220 T T T G G T
T
G/T
Slc45a4 : Intron 1 221 T T T C
T
T
C/T
Slc45a4 : Intron 2 222 G G G T T G
G
G/T
Slc45a4 : Intron 1 223 C
T
C/T
Slc45a4 : Intron 2 224 T T T C C C
T
C/T
Slc45a4 : Intron 2 225 G G G A A G
G
A/G
Slc45a4 : Intron 2 226 G G G A A G
G
A/G
Slc45a4 : mRNA-UTR 2 227 A A A G G A
A
A/G
Slc45a4 : mRNA-UTR 2 228 G G G A A G
G
A/G
Slc45a4 : mRNA-UTR 2 229 A A A
C A
A
A/C
Slc45a4 : mRNA-UTR 2 230 A A A
C A
A
A/C
Slc45a4 : mRNA-UTR 1 231 T
G T
G/T
Slc45a4 : mRNA-UTR 2 232 T T T C C T
T
C/T
Slc45a4 : mRNA-UTR 2 233 T T T A A T
T
A/T
Slc45a4 : mRNA-UTR 1 234 A
G
A/G
Slurp1 : Intron 1 1
G
A
A/G
Slurp1 : Intron 2 2 G
A
G
A/G
Slurp1 : Intron 2 3 T
C
T
C/T
Ly6d : Intron 3 1 G G G A A G G
G
A/G
Ly6d : Intron 2 2
T T G G
G/T
Ly6d : mRNA-UTR 3 3 A A A G G A A
A
A/G
Ly6d : mRNA-UTR 2 4 A
G G A A
A/G
Ly6d : Intron 2 5 A
T T A
A/T
Ly6d : Intron 2 6 G
A A G
A/G
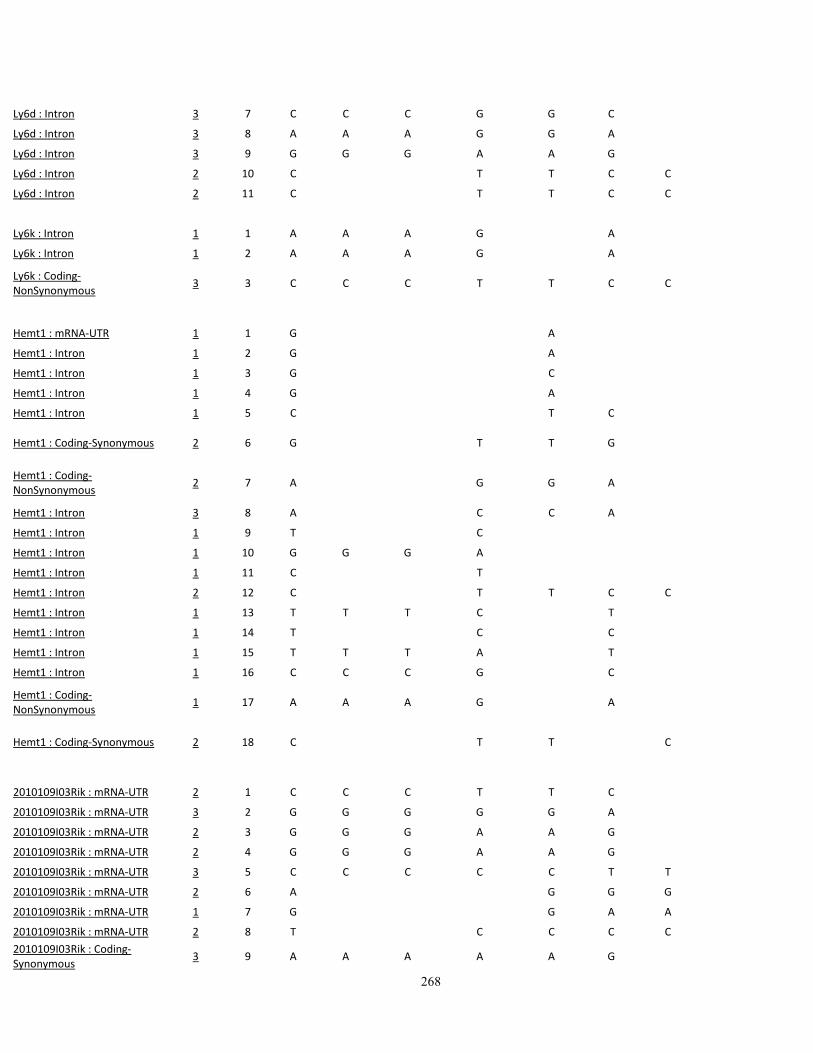
268
Ly6d : Intron 3 7 C C C G G C
C
C/G
Ly6d : Intron 3 8 A A A G G A
A
A/G
Ly6d : Intron 3 9 G G G A A G
G
A/G
Ly6d : Intron 2 10 C
T T C C
C/T
Ly6d : Intron 2 11 C
T T C C
C/T
Ly6k : Intron 1 1 A A A G
A
A
A/G
Ly6k : Intron 1 2 A A A G
A
A
A/G
Ly6k : Coding-NonSynonymous
3 3 C C C T T C C
C
C/T
Hemt1 : mRNA-UTR 1 1 G
A
A/G
Hemt1 : Intron 1 2 G
A
A/G
Hemt1 : Intron 1 3 G
C
C/G
Hemt1 : Intron 1 4 G
A
A/G
Hemt1 : Intron 1 5 C
T C
C/T
Hemt1 : Coding-Synonymous 2 6 G
T T G
G/T
Hemt1 : Coding-NonSynonymous
2 7 A
G G A
A/G
Hemt1 : Intron 3 8 A
C C A
A/C
Hemt1 : Intron 1 9 T
C
C/T
Hemt1 : Intron 1 10 G G G A
G
A/G
Hemt1 : Intron 1 11 C
T
C/T
Hemt1 : Intron 2 12 C
T T C C
C/T
Hemt1 : Intron 1 13 T T T C
T
T
C/T
Hemt1 : Intron 1 14 T
C
C
C/T
Hemt1 : Intron 1 15 T T T A
T
T
A/T
Hemt1 : Intron 1 16 C C C G
C
C
C/G
Hemt1 : Coding-NonSynonymous
1 17 A A A G
A
A
A/G
Hemt1 : Coding-Synonymous 2 18 C
T T
C
C/T
2010109I03Rik : mRNA-UTR 2 1 C C C T T C
C
C/T
2010109I03Rik : mRNA-UTR 3 2 G G G G G A
A
A/G
2010109I03Rik : mRNA-UTR 2 3 G G G A A G
G
A/G
2010109I03Rik : mRNA-UTR 2 4 G G G A A G
G
A/G
2010109I03Rik : mRNA-UTR 3 5 C C C C C T T
T
C/T
2010109I03Rik : mRNA-UTR 2 6 A
G G G
A/G
2010109I03Rik : mRNA-UTR 1 7 G
G A A
A/G
2010109I03Rik : mRNA-UTR 2 8 T
C C C C
C/T
2010109I03Rik : Coding-Synonymous
3 9 A A A A A G
G
A/G

269
2010109I03Rik : Coding-Synonymous
3 10 T T T C C C C
C
C/T
2010109I03Rik : Intron 2 11 G
G A A
A/G
2010109I03Rik : Intron 1 12 C C C T
C
C
C/T
2010109I03Rik : Intron 1 13 T T T C
T
T
C/T
2010109I03Rik : mRNA-UTR 2 14 A A A G G G
G
A/G
Ly6i : mRNA-UTR 2 1 T T T C
C
C
C/T
Ly6i : mRNA-UTR 1 2 G
A
A/G
Ly6i : mRNA-UTR 1 3 T
C
C/T
Ly6i : mRNA-UTR 1 4 G
T T
G/T
Ly6i : mRNA-UTR 1 5 A
G
A/G
Ly6i : mRNA-UTR 1 6 A
C
A/C
Ly6i : mRNA-UTR 1 7 T
G
G/T
Ly6i : mRNA-UTR 1 8 A
G
A/G
Ly6i : Coding-NonSynonymous
1 9 C
T T
C/T
Ly6i : Intron 2 10 C C C G G G
G
C/G
Ly6i : Intron 1 11 C
A A
A/C
Ly6i : Intron 1 12 C
A A
A/C
Ly6i : Intron 1 13 T
C C
C/T
Ly6i : Intron 1 14 G
A A
A/G
Ly6i : Intron 1 15 A
C C
A/C
Ly6i : Intron 1 16 T
C C
C/T
Ly6i : Intron 1 17 T
G G
G/T
Ly6i : Intron 1 18 T
C C
C/T
Ly6i : Intron 1 19 G
A A
A/G
Ly6i : Intron 1 20 A
G G
A/G
Ly6i : Intron 1 21 G
T T
G/T
Ly6i : Intron 1 22 G
A A
A/G
Ly6i : Intron 1 23 A
C C
A/C
Ly6i : Intron 1 24 T
C C
C/T
Ly6i : Intron 1 25 A
G G
A/G
Ly6i : Intron 1 26 A A A T
T
T
A/T
Ly6i : Intron 1 27 G
T T
G/T
Ly6i : Intron 1 28 A A A G
G
G
A/G
Ly6i : Intron 1 29 G
A
A/G
Ly6i : Intron 1 30 T
C C
C/T
Ly6i : Intron 1 31 G
A
A/G
Ly6i : Intron 1 32 T
G
G/T
Ly6i : Intron 1 33 C
T T
C/T
Ly6i : Intron 1 34 G
A A
A/G
Ly6i : Intron 1 35 C
G G
C/G
Ly6i : Intron 1 36 T
A A
A/T

270
Ly6i : Intron 1 37 T T T C
C
C
C/T
Ly6i : Intron 1 38 C
A A
A/C
Ly6i : Intron 1 39 T
C C
C/T
Ly6i : Intron 1 40 G
C C
C/G
Ly6i : Intron 2 41 C C C T T T
T
C/T
Ly6i : Intron 3 42 T T T G G G G
G
G/T
Ly6i : Intron 1 43 G
C C
C/G
Ly6i : Intron 2 44 T
G
G G
G/T
Ly6i : Intron 3 45 C C C G
G G
G
C/G
Ly6i : Intron 3 46 G G G T T T T
T
G/T
Ly6i : Coding-Synonymous 2 47 G
C C C C
C/G
Ly6i : Coding-NonSynonymous
3 48 T T T G G G G
G
G/T
Ly6i : mRNA-UTR 3 49 T
C C C C C C C C/T
Ly6i : mRNA-UTR 1 50 G G G
C
C/G
Ly6c1 : Intron 2 1 G G G A A A
A
A/G
Ly6c1 : Intron 2 2 C C C T T T
T
C/T
Ly6c1 : Intron 2 3 A A A G G G
G
A/G
Ly6c1 : Intron 2 4 A A A G G G
G
A/G
Ly6c1 : Intron 1 5 T
A A
A/T
Ly6c1 : Intron 1 6 G
C C
C/G
Ly6c1 : Intron 1 7
C
A
A
A
A/C
Ly6c1 : Intron 2 8 G
G C C C
C
C/G
Ly6c1 : Intron 2 9 C
C T T T
T
C/T
Ly6c1 : Intron 1 10 G
T T
G/T
Ly6c1 : mRNA-UTR 1 11
C C
C
Ly6c1 : Coding-NonSynonymous
1 12 A
G G
A/G
Ly6c1 : Intron 2 13 G
G T G
G/T
Ly6c1 : Intron 2 14 G
C C
C/G
Ly6c1 : Intron 1 15 G
C C
C/G
Ly6c1 : Intron 1 16 G G G
A
A
A/G
Ly6c1 : Intron 2 17 C C C T
T
T
C/T
Ly6c1 : Intron 1 18
C C T
T
T
C/T
Ly6c1 : Intron 1 19 G
C C
C/G
Ly6c1 : Intron 1 20 G
T T
G/T
Ly6c1 : Intron 1 21 G
C
C/G
Ly6c1 : Intron 1 22 T
C
C/T
Ly6c1 : Intron 1 23 T
C
C/T
Ly6c1 : Intron 1 24 C
T
C/T
Ly6c1 : Intron 1 25 A
T T
A/T

271
Ly6c1 : Intron 1 26 T
C C
C/T
Ly6c1 : Intron 2 27 T T T C
C
C
C/T
Ly6c1 : Intron 2 28 A A A G G G
G
A/G
Ly6c1 : Intron 1 29 T
A A
A/T
Ly6c1 : Intron 1 30 T
C
C/T
BC025446 : Intron 2 1 G
A
A
A/G
BC025446 : Intron 1 2 G G G A
A
A/G
BC025446 : Intron 3 3 T T T C C C C
C
C/T
BC025446 : Intron 1 4 T T T C
C
C
C/T
BC025446 : Intron 2 5 G
A A A
A/G
BC025446 : Intron 3 6 C C C T T T T
T
C/T
BC025446 : Intron 2 7 C
T T T
C/T
BC025446 : Intron 1 8 T
T
C
C
C/T
BC025446 : Intron 2 9 T
C C C
C/T
BC025446 : Intron 2 10 T
C C C
C/T
BC025446 : Intron 3 11 G G G C C C C
C
C/G
BC025446 : Intron 2 12 A A A G G G
G
A/G
BC025446 : Intron 2 13 A A A C C C
C
A/C
BC025446 : Intron 1 14 G G G G
G
G
A/G
BC025446 : Intron 1 15 A A A G
G
G
A/G
BC025446 : Intron 1 16 T T T C
T
C/T
BC025446 : Intron 1 17
A T
T
A/T
BC025446 : Intron 2 18 A A A T T T
T
A/T
BC025446 : Intron 2 19 T T T G G G
G
G/T
BC025446 : Intron 1 20 C
T T
C/T
BC025446 : Intron 1 21 C
T T
C/T
BC025446 : Intron 1 22 C
A
A/C
BC025446 : Intron 1 23 C
T T
C/T
BC025446 : Intron 1 24 C
T T
C/T
BC025446 : Intron 1 25 C
T T
C/T
BC025446 : Intron 2 26 T T T C C C
C
C/T
BC025446 : Intron 1 27 C
T T
C/T
BC025446 : Intron 1 28 A
G
A/G
BC025446 : Intron 1 29 T
C C
C/T
BC025446 : Intron 1 30 G
A A
A/G
BC025446 : Intron 1 31 T
A A
A/T
BC025446 : Intron 1 32 G
A A
A/G
BC025446 : Intron 1 33 T
G G
G/T
BC025446 : Intron 1 34 C
A A
A/C
BC025446 : Intron 1 35 A
G G
A/G
BC025446 : Intron 1 36 A
G G
A/G
BC025446 : Intron 1 37 G
A A
A/G

272
BC025446 : Intron 1 38 T
A A
A/T
BC025446 : Intron 1 39 C
T
C/T
Scrt1 : mRNA-UTR 2 1 G
A
A/G
C030006K11Rik : Intron 2 15 A A
C
C
C
A/C
C030006K11Rik : Intron 3 16 A A A C C C
C
A/C
C030006K11Rik : Intron 3 17 A A A G G G
G
A/G
C030006K11Rik : mRNA UTR 4 18 C C C T T T T
T
C/T
Recql4 : Coding-NonSynonymous
3 1 T T T G G G G
G
G/T
Recql4 : Intron 2 2 A A A G
G
G
A/G
Recql4 : Intron 3 3 T
C C C
C/T
Recql4 : Intron 4 4 G G G A A A A
A
A/G
Zfp7 : Intron 1 1 A A A
G
A/G
Zfp7 : Intron 2 2 T
C C
C/T
Zfp7 : Intron 1 3 C
T T
C/T
Zfp7 : Intron 3 4 A
C C C
A/C
Zfp7 : Intron 3 5 C
T T T
C/T
Zfp7 : Intron 3 6 T
C C
C/T
Zfp7 : Coding-Synonymous 3 7 T
C
C/T
Zfp7 : Intron 1 8 C
A
A/C
Zfp7 : Intron 1 9 C
T T
C/T
Zfp7 : Intron 3 10 T
C C C
C/T
Zfp7 : Intron 4 11 C
T T
T
C/T
Zfp7 : Intron 1 12 A A A T
A
A
A/T
Zfp7 : Intron 3 13 C
T T T
C/T
Zfp7 : Intron 3 14 G G G T
T T
T
G/T
Zfp7 : Intron 4 15 G G G T
T T
T
G/T
Zfp7 : Coding-NonSynonymous
3 16 T
G G
G/T
Zfp7 : Intron 4 17 A A A G
G G
G
A/G
Zfp7 : Intron 3 18 C
T T T
C/T
Zfp7 : Intron 4 19 A A A G G G G
G
A/G
Zfp7 : Intron 4 20 C C C G G G G
G
C/G
Rbfox2 : mRNA-UTR 3 1 A G G A/G
Rbfox2 : mRNA-UTR 3 2 A
G G
A/G
Rbfox2 : Intron 4 3 A
A G G G G
G
A/G

273
Rbfox2 : Intron 2 4 C
T T
C/T
Rbfox2 : Intron 2 5 T T T C
C
C
C/T
Rbfox2 : Intron 3 6 C
T T T
C/T
Rbfox2 : Intron 3 7 A A A C
C
C
A/C
Rbfox2 : Intron 3 8 G G G T
T T
G/T
Rbfox2 : Intron 3 9 A A A G G G
G
A/G
Rbfox2 : Intron 3 10 A
G G G
A/G
Rbfox2 : Intron 1 11 T
A A
A/T
Rbfox2 : Intron 3 12 C
A A
A/C
Rbfox2 : Intron 4 13 T T T C
C C
C
C/T
Rbfox2 : Intron 4 14 A A A G
G G
G
A/G
Rbfox2 : Intron 4 15 T
T G
G
G
G/T
Rbfox2 : Intron 3 16 T
C C
C/T
Rbfox2 : Intron 3 17 T
C C
C/T
Rbfox2 : Intron 3 18 T
C C C
C/T
Rbfox2 : Intron 3 19 T
G
G
G/T
Rbfox2 : Intron 4 20 C C C A A A A
A
A/C
Rbfox2 : Intron 3 21 C
T T T
C/T
Rbfox2 : Intron 1 22 C C C C
C
C
C/T
Rbfox2 : Intron 4 23 A A A T
T
T
A/T
Rbfox2 : Intron 3 24 A
G G G
A/G
Rbfox2 : Intron 4 25 C C C G G G G
G
C/G
Rbfox2 : Intron 4 26 T T T C
C C
C
C/T
Rbfox2 : Intron 4 27 C C C T
T T
T
C/T
Rbfox2 : Intron 1 28 C C C C
C
C
C/T
Rbfox2 : Intron 3 29 G
A A
A
A/G
Rbfox2 : Intron 2 30 T
C C C C
C/T
Rbfox2 : Intron 2 31 A A A G
G
G
A/G
Rbfox2 : Intron 4 32 T T T C C C C
C
C/T
Rbfox2 : Intron 3 33 A
G G G
A/G
Rbfox2 : Intron 1 34 G G G G
G
G
A/G
Rbfox2 : Intron 2 35 A
G G G
A/G
Rbfox2 : Intron 4 36 C C C T T T T
T
C/T
Rbfox2 : Intron 1 37 G G G G
G
G
C/G
Rbfox2 : Intron 3 38 C C C A A A
A
A/C
Rbfox2 : Intron 3 39 T T T C C C
C
C/T
Rbfox2 : Intron 2 40 C C C T
T
T
C/T
Rbfox2 : Intron 3 41 T T T A A A
A
A/T
Rbfox2 : Intron 4 42 T T T A A A A
A
A/T
Rbfox2 : Intron 4 43 C C C T T T T
T
C/T
Rbfox2 : Intron 3 44 G G G T T T T
T
G/T
Rbfox2 : Intron 4 45 G G G A A A A
A
A/G
Rbfox2 : Intron 4 46 T
T A A A A
A
A/T

274
Rbfox2 : Intron 1 47 G G G G
G
G
A/G
Rbfox2 : Intron 4 48 C C C T T T T
T
C/T
Rbfox2 : Intron 3 49 A
G
G
A/G
Rbfox2 : Intron 4 50 G G G T
T T
T
G/T
Rbfox2 : Intron 3 51 T
C
C
C/T
Rbfox2 : Intron 3 52 G
A
A
A/G
Rbfox2 : Intron 3 53 A A A G
G
G
A/G
Rbfox2 : Intron 3 54 A
C C C
A/C
Rbfox2 : Intron 3 55 T T T C
C C
C
C/T
Rbfox2 : Intron 3 56 T
A A A
A/T
Rbfox2 : Intron 3 57 G
A
A
A/G
Rbfox2 : Intron 1 58 T
A A
A/T
Rbfox2 : Intron 4 59 G G G A A A A
A
A/G
Rbfox2 : Intron 3 60 G
T T T
G/T
Rbfox2 : Intron 4 61 T
T C C C C
C
C/T
Rbfox2 : Intron 4 62 C C C T
T T
T
C/T
Rbfox2 : Intron 3 63 T
C
C
C/T
Rbfox2 : Intron 4 64 A A A C C C C
C
A/C
Rbfox2 : Intron 1 65 A
A A
A
Rbfox2 : Intron 1 66 C C C C
C
C
C/T
Rbfox2 : Intron 1 67 A A A A
A
A
A/G
Rbfox2 : Intron 2 68 A
C C
A/C
Rbfox2 : Intron 4 69 A A A G G G G
G
A/G
Rbfox2 : Intron 3 70 G G G C
C
C
C/G
Rbfox2 : Intron 1 71
G
T
T
T
G/T
Rbfox2 : Intron 2 72 C C C T
T
T
C/T
Rbfox2 : Intron 1 73 T
A
A
A/T
Rbfox2 : Intron 3 74 G
A A A
A/G
Rbfox2 : Intron 3 75 C
G G G
C/G
Rbfox2 : Intron 3 76 C
T T T
C/T
Rbfox2 : Intron 3 77 C
C G
G G
G
C/G
Rbfox2 : Intron 3 78 A
G G
A/G
Rbfox2 : Intron 2 79 T
T G T T
G/T
Rbfox2 : Intron 2 80 A
A C A
A/C
Rbfox2 : Intron 2 81 G
A
A
A/G
Rbfox2 : Intron 3 82 T
C C C
C/T
Rbfox2 : Intron 3 83 A
C C C
A/C
Rbfox2 : Intron 4 84 G G G A A A A
A
A/G
Rbfox2 : Intron 3 85 A
G G
A/G
Rbfox2 : Intron 4 86 T
C C C C
C/T
Rbfox2 : Intron 4 87 T
T C C C C
C
C/T
Rbfox2 : Intron 4 88 C C C T T T T T T T C/T
Rbfox2 : Intron 1 89 C C C C
C
C
C/T

275
Rbfox2 : Intron 1 90 G G G G
G
G
A/G
Rbfox2 : Intron 1 91 A A A A
A
A
A/C
Rbfox2 : Intron 4 92 G
G A A A A
A
A/G
Rbfox2 : Intron 4 93 G
G A A A
A
A/G
Rbfox2 : Intron 4 94 G
G A A A A
A
A/G
Rbfox2 : Intron 3 95 T T T G G G G
G
G/T
Rbfox2 : Intron 1 96 A
G G G
A/G
Rbfox2 : Intron 2 97 A
T
A/T
Rbfox2 : Intron 2 98 A
G G
A/G
Rbfox2 : Intron 4 99 A A A C C C C
C
A/C
Rbfox2 : Intron 3 100 A
G
G
A/G
Rbfox2 : Intron 1 101 C
G
C/G
Rbfox2 : Intron 2 102 G
A
A/G
Rbfox2 : Intron 3 103 A
G G G
A/G
Rbfox2 : Intron 4 104 C C C T T T T
T
C/T
Rbfox2 : Intron 3 105 C
A A A
A/C
Rbfox2 : Intron 3 106 G
A A A
A/G
Rbfox2 : Intron 3 107 C
A A
A/C
Rbfox2 : Intron 4 108 A A A G G G
G
A/G
Rbfox2 : Intron 2 109 A
T T
A/T
Rbfox2 : Intron 3 110 G
A A A
A/G
Rbfox2 : Intron 3 111 T T T C
C
C
C/T
Rbfox2 : Intron 4 112 T T T C
C
C
C/T
Rbfox2 : Intron 2 113 T
C C
C/T
Rbfox2 : Intron 4 114 C C C T
T T
T
C/T
Rbfox2 : Intron 2 115 T T T A
A
A
A/T
Rbfox2 : Intron 4 116 G G G A
A A
A
A/G
Rbfox2 : Intron 4 117 A A A G
G G
G
A/G
Rbfox2 : Intron 3 118 C
T
T
C/T
Rbfox2 : Intron 3 119 T
C C C C
C/T
Rbfox2 : Intron 3 120 C
T T T
C/T
Rbfox2 : Intron 4 121 C
T T T T
C/T
Rbfox2 : Intron 2 122 A
G G G
A/G
Rbfox2 : Intron 3 123 G G G A A A
A
A/G
Rbfox2 : Intron 2 124 G
A A A
A/G
Rbfox2 : Intron 1 125 G
G A
A/G
Rbfox2 : Intron 1 126 A
G
G
A/G
Rbfox2 : Intron 1 127 A
G
G
A/G
Rbfox2 : Intron 3 128 A
A
C
A/C
Rbfox2 : Intron 2 129 G
A A A
A/G
Rbfox2 : Intron 2 130 G
T T T
G/T
Rbfox2 : Intron 3 131 G
A A
A/G
Rbfox2 : Intron 1 132 G
A
A/G
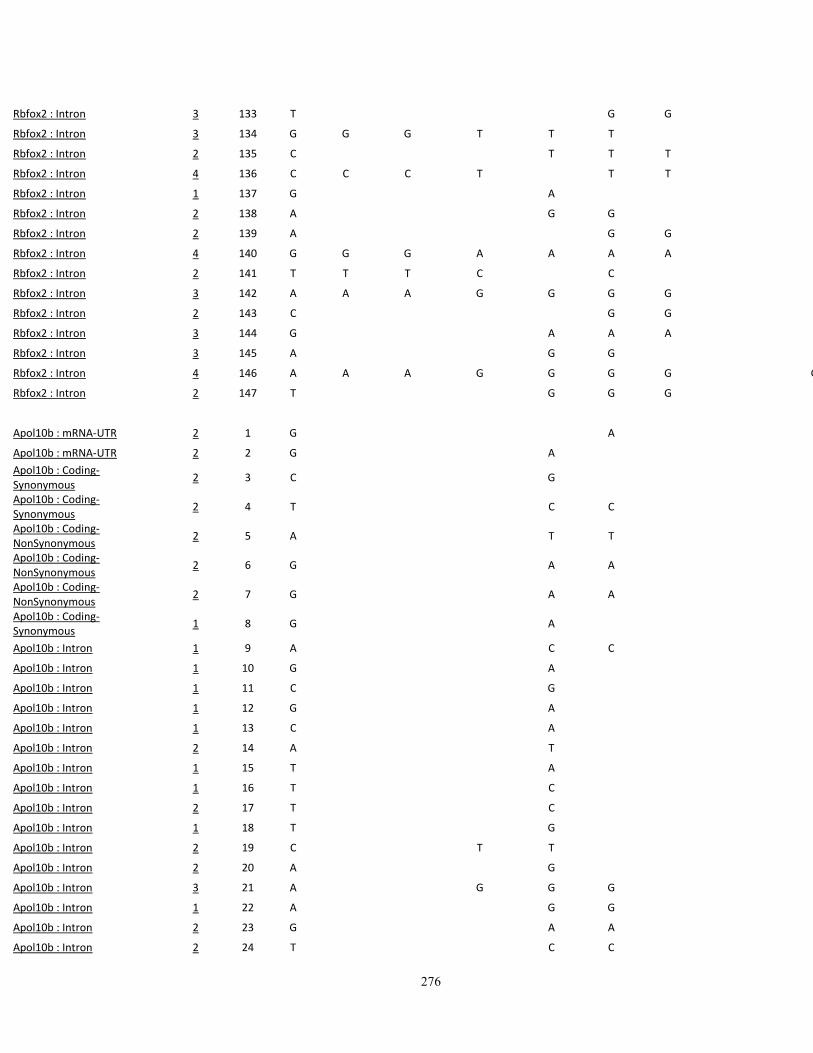
276
Rbfox2 : Intron 3 133 T
G G
G/T
Rbfox2 : Intron 3 134 G G G T T T
T
G/T
Rbfox2 : Intron 2 135 C
T T T
C/T
Rbfox2 : Intron 4 136 C C C T
T T
T
C/T
Rbfox2 : Intron 1 137 G
A
A/G
Rbfox2 : Intron 2 138 A
G G
A/G
Rbfox2 : Intron 2 139 A
G G
A/G
Rbfox2 : Intron 4 140 G G G A A A A
A
A/G
Rbfox2 : Intron 2 141 T T T C
C
C
C/T
Rbfox2 : Intron 3 142 A A A G G G G
A
A/G
Rbfox2 : Intron 2 143 C
G G
C/G
Rbfox2 : Intron 3 144 G
A A A
A/G
Rbfox2 : Intron 3 145 A
G G
A/G
Rbfox2 : Intron 4 146 A A A G G G G G G G A/G
Rbfox2 : Intron 2 147 T
G G G
G/T
Apol10b : mRNA-UTR 2 1 G
A
A/G
Apol10b : mRNA-UTR 2 2 G
A
A/G
Apol10b : Coding-Synonymous
2 3 C
G
C/G
Apol10b : Coding-Synonymous
2 4 T
C C
C/T
Apol10b : Coding-NonSynonymous
2 5 A
T T
A/T
Apol10b : Coding-NonSynonymous
2 6 G
A A
A/G
Apol10b : Coding-NonSynonymous
2 7 G
A A
A/G
Apol10b : Coding-Synonymous
1 8 G
A
A/G
Apol10b : Intron 1 9 A
C C
A/C
Apol10b : Intron 1 10 G
A
A/G
Apol10b : Intron 1 11 C
G
C/G
Apol10b : Intron 1 12 G
A
A/G
Apol10b : Intron 1 13 C
A
A/C
Apol10b : Intron 2 14 A
T
A/T
Apol10b : Intron 1 15 T
A
A/T
Apol10b : Intron 1 16 T
C
C/T
Apol10b : Intron 2 17 T
C
C/T
Apol10b : Intron 1 18 T
G
G/T
Apol10b : Intron 2 19 C
T T
C/T
Apol10b : Intron 2 20 A
G
A/G
Apol10b : Intron 3 21 A
G G G
A/G
Apol10b : Intron 1 22 A
G G
A/G
Apol10b : Intron 2 23 G
A A
A/G
Apol10b : Intron 2 24 T
C C
C/T

277
Apol10b : Intron 2 25 A
G G
A/G
Apol10b : Intron 2 26 T
C C
C/T
Apol10b : Intron 2 27 A
G G
A/G
Apol10b : Intron 2 28 G
A
A/G
Apol10b : Intron 2 29 G
T
G/T
Apol10b : Intron 2 30 C
T
C/T
Apol10b : Intron 2 31 A
G
A/G
Apol10b : Intron 1 32 T
A
A/T
Apol10b : Intron 1 33 A
G G
A/G
Apol10b : Intron 1 34 G
A A
A/G
Apol10b : Intron 2 35 A
T
A/T
Apol10b : Intron 3 36 C T
T T T
T
C/T
Apol10b : Intron 2 37 G
A A
A/G
Apol10b : Intron 2 38 A
C C
A/C
Apol10b : Intron 2 39 A
T T
A/T
Apol10b : Intron 1 40 C
T
T
C/T
Apol10b : Intron 3 41 T
C C
C/T
Apol10b : Intron 3 42 C
T T
C/T
Apol10b : Intron 3 43 T
C C C C
C/T
Apol10b : Intron 1 44
A
T
A/T
Apol10b : Intron 4 45 T
C
C C
C
C/T
Apol10b : Intron 2 46 T T T C
C
C
C/T
Apol10b : Intron 4 47 T T T C
C
C
C/T
Apol10b : Intron 3 48 G
A A A A
A/G
Apol10b : Intron 1 49 T T T T
T
T
C/T
Apol10b : Intron 1 50 A
G G
A/G
Apol10b : Intron 1 51 C
T T
C/T
Apol10b : Intron 1 52 T
G
G/T
Apol10b : Intron 1 53 T
C
C/T
Apol10b : Intron 1 54 A
G
A/G
Apol10b : Intron 1 55
C C
T
C/T
Cacng2 : Intron 3 1 T A A A/T
Cacng2 : Intron 3 2 C
A A
A/C
Cacng2 : Intron 4 3 G G
A A A A
A
A/G
Cacng2 : Intron 3 4 T
C
C
C
C/T
Cacng2 : Intron 3 5 G G
A
A
A
A/G
Cacng2 : Intron 3 6 C
T
C/T
Cacng2 : Intron 4 7 C C
T
T
C/T
Cacng2 : Intron 4 8 C C
T
T
T
C/T
Cacng2 : Intron 4 9 C C
T T
T
C/T
Cacng2 : Intron 2 10 G
A
A/G
Cacng2 : Intron 4 11 C C
T
T T
T
C/T
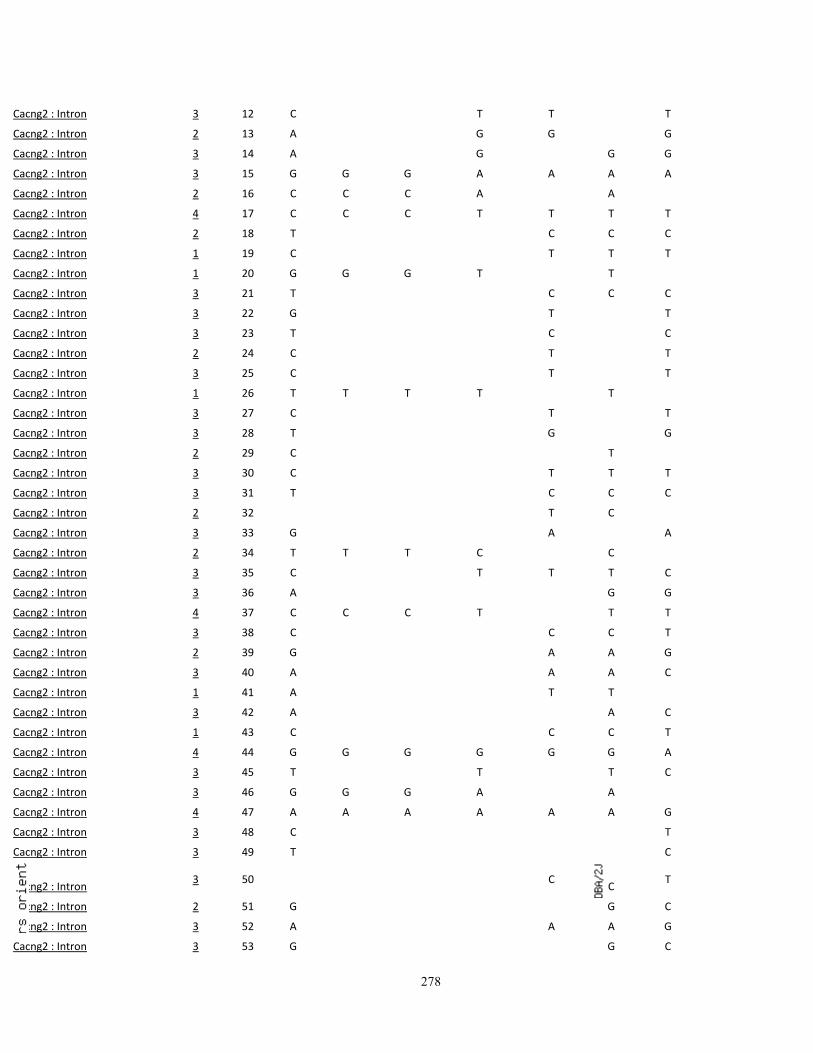
278
Cacng2 : Intron 3 12 C
T T
T
C/T
Cacng2 : Intron 2 13 A
G G
G
A/G
Cacng2 : Intron 3 14 A
G
G G
A/G
Cacng2 : Intron 3 15 G G G A A A A
A/G
Cacng2 : Intron 2 16 C C C A
A
A
A/C
Cacng2 : Intron 4 17 C C C T T T T
T
C/T
Cacng2 : Intron 2 18 T
C C C
C/T
Cacng2 : Intron 1 19 C
T T T
C/T
Cacng2 : Intron 1 20 G G G T
T
T
G/T
Cacng2 : Intron 3 21 T
C C C
C/T
Cacng2 : Intron 3 22 G
T
T
G/T
Cacng2 : Intron 3 23 T
C
C
C/T
Cacng2 : Intron 2 24 C
T
T
C/T
Cacng2 : Intron 3 25 C
T
T
C/T
Cacng2 : Intron 1 26 T T T T
T
T
G/T
Cacng2 : Intron 3 27 C
T
T
C/T
Cacng2 : Intron 3 28 T
G
G
G/T
Cacng2 : Intron 2 29 C
T
C/T
Cacng2 : Intron 3 30 C
T T T
C/T
Cacng2 : Intron 3 31 T
C C C
C/T
Cacng2 : Intron 2 32
T C
C/T
Cacng2 : Intron 3 33 G
A
A
A/G
Cacng2 : Intron 2 34 T T T C
C
C
C/T
Cacng2 : Intron 3 35 C
T T T C
C/T
Cacng2 : Intron 3 36 A
G G
A/G
Cacng2 : Intron 4 37 C C C T
T T
T
C/T
Cacng2 : Intron 3 38 C
C C T
C/T
Cacng2 : Intron 2 39 G
A A G
A/G
Cacng2 : Intron 3 40 A
A A C
A/C
Cacng2 : Intron 1 41 A
T T
A/T
Cacng2 : Intron 3 42 A
A C
A/C
Cacng2 : Intron 1 43 C
C C T
C/T
Cacng2 : Intron 4 44 G G G G G G A
G
A/G
Cacng2 : Intron 3 45 T
T
T C
C/T
Cacng2 : Intron 3 46 G G G A
A
A
A/G
Cacng2 : Intron 4 47 A A A A A A G
A
A/G
Cacng2 : Intron 3 48 C
T
C/T
Cacng2 : Intron 3 49 T
C
C/T
Cacng2 : Intron
3 50
C
C
T
C/T
Cacng2 : Intron 2 51 G
G C
C/G
Cacng2 : Intron 3 52 A
A A G
A/G
Cacng2 : Intron 3 53 G
G C
C/G

279
Cacng2 : Intron 3 54 T
T T A
A/T
Cacng2 : Intron 5 55 A
A A A A G
A/G
Cacng2 : Intron 4 56 A
A A A G
A/G
Cacng2 : Intron 4 57 T
T G
G/T
Cacng2 : Intron 3 58 C
C T
C/T
Cacng2 : Intron 4 59 G G G G G G C
G
C/G
Cacng2 : Intron 4 60 A A A A A A C
A
A/C
Cacng2 : Intron 3 61 C
C C C T
C/T
Cacng2 : Intron 2 62 T
T
C
C/T
Cacng2 : Intron 3 63 C
C C C T
C/T
Cacng2 : Intron 3 64 A
A A A G
A/G
Cacng2 : Intron 3 65 A
A A A G
A/G
Cacng2 : Intron 3 66 G
G G G A
A/G
Cacng2 : Intron 4 67 G G G G G G A
G
A/G
Cacng2 : Intron 3 68 A
A G
A/G
Cacng2 : Intron 3 69 T
T G
G/T
Cacng2 : Intron 4 70 G G G G G G C
G
C/G
Cacng2 : Intron 1 71 G
C
C/G
Cacng2 : Intron 3 72 G
G G G A
A/G
Cacng2 : Intron 3 73 C
C C C T
C/T
Cacng2 : Intron 3 74 G
G G G C
C/G
Cacng2 : Intron 3 75 T
C C C T
C/T
Cacng2 : Intron 4 76 A A A A A A G
A
A/G
Cacng2 : Intron 3 77 G
G
A
A/G
Cacng2 : Intron 3 78 C
C C T
C/T
Cacng2 : Intron 3 79 C C C A
A
A
A/C
Cacng2 : Intron 3 80 T
T T C
C/T
Cacng2 : Intron 3 81 C
C C T
C/T
Cacng2 : Intron 4 82 T T T T
T C
T
C/T
Cacng2 : Intron 3 83 C
C C T
C/T
Cacng2 : Intron 3 84 T
T T C
C/T
Cacng2 : Intron 3 85 C
C C T
C/T
Cacng2 : Intron 3 86 T
T T C
C/T
Cacng2 : Intron 3 87 G
G G A
A/G
Cacng2 : Intron 3 88 A
A A C
A/C
Cacng2 : Intron 2 89 G
G G A
A/G
Cacng2 : Intron 2 90 C
C C T
C/T
Cacng2 : Intron 3 91 G
G G C
C/G
Cacng2 : Intron 3 92 A
A A G
A/G
Cacng2 : Intron 3 93 C
C C T
C/T
Cacng2 : Intron 4 94 T T T T T T A
T
A/T
Cacng2 : Intron 3 95 C
C
T
C/T
Cacng2 : Intron 4 96 A A A A A A G
A
A/G

280
Cacng2 : Intron 3 97 G
G G A
A/G
Cacng2 : Intron 3 98 G
G G A
A/G
Cacng2 : Intron 3 99 G
G G G A
A/G
Cacng2 : Intron 3 100 C
C C C T
C/T
Cacng2 : Intron 3 101 C
C C C T
C/T
Cacng2 : Intron 3 102 G
G G G A
A/G
Cacng2 : Intron 4 103 C C C C C C G
C
C/G
Cacng2 : Intron 4 104 T T T T T T C
T
C/T
Cacng2 : Intron 4 105 A A A G G G
G
A/G
Cacng2 : Intron 3 106 G
G
G A
A/G
Cacng2 : Intron 3 107 C
C T
C/T
Cacng2 : Intron 3 108 A
A
A G
A/G
Cacng2 : Intron 3 109 G
G
G A
A/G
Pvalb : Intron 2 1 T
T C
C/T
Pvalb : Intron 3 2 T T T T T C
C/T
Pvalb : Intron 3 3 G G G G G A
A/G
Pvalb : Intron 2 4 G
G A
A/G
Pvalb : Intron 2 5 C
C T
C/T
Pvalb : Intron 4 6 T T T T T C C
C/T
Pvalb : Intron 4 7 A A A A A G G
A
A/G
Pvalb : Intron 3 8 A
A G G
A/G
Pvalb : Intron 3 9 T
T A A
A/T
Pvalb : Intron 3 10 G
G T T
G/T
Pvalb : Intron 3 11 C
C T T
C/T
Pvalb : Intron 1 12 G
G G
T
G/T
Pvalb : Intron 3 13 C
C T
C/T
Pvalb : Intron 2 14 C C C C
T
C/T
Pvalb : Intron 2 15 C C C C
T
C/T
Pvalb : Intron 4 16 G G G
A A
G
A/G
Pvalb : Intron 2 17 G
A A
A/G
Pvalb : Intron 4 18 A A A A A G G
A
A/G
Pvalb : Intron 2 19 C C C C C T C
C
C/T
Pvalb : Intron 3 20 T
T T C C
C/T
Pvalb : Intron 4 21 T T
T
C
T
C/T
Pvalb : Intron 2 22 G
G A G
A/G
Pvalb : Intron 4 23 T T T T
C C
T
C/T
Pvalb : Intron 2 24 G
G A G
A/G
Csf2rb2 : mRNA-UTR 3 1 C
C T T
C/T
Csf2rb2 : mRNA-UTR 4 2 A A A A A T T
A
A/T
Csf2rb2 : mRNA-UTR 4 3 T T T T T G G
T
G/T
Csf2rb2 : mRNA-UTR 4 4 C C C C C T T
C
C/T

281
Csf2rb2 : mRNA-UTR 4 5 T T T T T C C
T
C/T
Csf2rb2 : mRNA-UTR 4 6 C C C C C G G
C
C/G
Csf2rb2 : mRNA-UTR 3 7 T
T T C
C/T
Csf2rb2 : mRNA-UTR 3 8 G
G G A
A/G
Csf2rb2 : mRNA-UTR 3 9 G
G G A
A/G
Csf2rb2 : mRNA-UTR 2 10 T
T
T
Csf2rb2 : mRNA-UTR 3 11 C C C C C T
C
C/T
Csf2rb2 : mRNA-UTR 3 12 G G G G
T
G
G/T
Csf2rb2 : mRNA-UTR 2 13 A
G
A/G
Csf2rb2 : mRNA-UTR 3 14 A
G G
A/G
Csf2rb2 : mRNA-UTR 2 15 A
G
A/G
Csf2rb2 : Coding-Synonymous
3 16 C
G G
C/G
Csf2rb2 : Coding-Synonymous
4 17 T
T
C C
C/T
Csf2rb2 : Coding-Synonymous
1 18 C
A A
A/C
Csf2rb2 : Coding-NonSynonymous
2 19 T
C C
C/T
Csf2rb2 : Coding-Synonymous
4 20 C
C
A A
A/C
Csf2rb2 : Coding-NonSynonymous
3 21 C
C C
T
C/T
Csf2rb2 : Coding-Synonymous
2 22 C
C T
C/T
Csf2rb2 : Coding-NonSynonymous
2 23 T
T
C/T
Csf2rb2 : Coding-Synonymous
2 24 G
G A
A/G
Csf2rb2 : Coding-NonSynonymous
3 25 G G G G G A
G
A/G
Csf2rb2 : Coding-NonSynonymous
2 26 C C C C C T
C
C/T
Csf2rb2 : Intron 3 27 C C C C C T
C
C/T
Csf2rb2 : Intron 3 28 G G G G G C
G
C/G
Csf2rb2 : Intron 2 29 T T T T T C
T
C/T
Csf2rb2 : Intron 3 30 A A A A A G
A
A/G
Csf2rb2 : Intron 3 31 A A A A A G
A
A/G
Csf2rb2 : Intron 3 32
C T
T
C/T
Csf2rb2 : Intron 2 33 A
A A A T
A/T
Csf2rb2 : Intron 2 34 T T
T T C
T
C/T
Csf2rb2 : Intron 1 35 C
C
C
Csf2rb2 : Intron 1 36 G
G
G

282
Csf2rb2 : Intron 3 37 C C
C C A
A/C
Csf2rb2 : Intron 1 38
G
G
G
A/G
Csf2rb2 : Intron 3 39 T T T T T C
T
C/T
Csf2rb2 : Intron 3 40 A A A A
G
A
A/G
Csf2rb2 : Intron 2 41 T
C
C/T
Csf2rb2 : Intron 1 42 G
A
A/G
Csf2rb2 : Intron 1 43 G
A
A/G
Csf2rb2 : Intron 1 44 A
C
A/C
Csf2rb2 : Intron 1 45 G
A
A/G
Csf2rb2 : Intron 2 46 C C C C
T
C
C/T
Csf2rb2 : Intron 1 47 A
G
A/G
Csf2rb2 : Intron 1 48 G
T
G/T
Csf2rb2 : Intron 1 49 G
A
A/G
Csf2rb2 : Intron 1 50 C
T
C/T
Csf2rb2 : Intron 1 51 G
A
A/G
Csf2rb2 : Coding-NonSynonymous
2 52 G
A
A/G
Csf2rb2 : Intron 1 53 C
G
C/G
Csf2rb2 : Intron 1 54 T
C
C/T
Csf2rb2 : Intron 1 55 A
A G
A/G
Csf2rb2 : Intron 1 56 C
C T
C/T
Csf2rb2 : Intron 1 57 A
A T
A/T
Csf2rb2 : Intron 1 58 T
T C
C/T
Csf2rb2 : Intron 1 59 C
C T
C/T
Csf2rb2 : Intron 1 60 T
T A
A/T
Csf2rb2 : Intron 1 61 C
C T
C/T
Csf2rb2 : Intron 1 62 A
A G
A/G
Csf2rb2 : Intron 1 63 A
A G
A/G
Csf2rb2 : Intron 1 64 A
A T
A/T
Csf2rb2 : Intron 1 65 G
G C
C/G
Csf2rb2 : Intron 1 66 C
C T
C/T
Csf2rb2 : Intron 1 67 T
T G
G/T
Csf2rb2 : Intron 1 68 G
G C
C/G
Csf2rb2 : Intron 2 69 A
A A G G
A/G
Csf2rb2 : Intron 3 70 A
A A G G
A/G
Csf2rb2 : Intron 3 71 C
C
T T
C/T
Csf2rb2 : Intron 3 72 C
C
T T
C/T
Csf2rb2 : Intron 3 73 A
A
G G
A/G
Csf2rb2 : Intron 3 74 T T T T
A
A/T
Csf2rb2 : Intron 3 75 A
A A
G
A/G
Csf2rb2 : Intron 1 76 T T T T
T
T
G/T
Csf2rb2 : Intron 3 77 C C C C
A
C
A/C

283
Csf2rb2 : Coding-NonSynonymous
4 78 A A A A
T T
A/T
Csf2rb2 : Intron 3 79 T
G G
G/T
Csf2rb2 : Intron 3 80 C
T T
C/T
Csf2rb2 : Intron 3 81 T
C C
C/T
Csf2rb2 : Intron 4 82 T T T T
C C
T
C/T
Csf2rb2 : Intron 4 83 G G G G
A A
G
A/G
Csf2rb2 : Intron 5 84 C C C C C G G
C
C/G
Csf2rb2 : Intron 1 85
C C
C
C/T
Csf2rb2 : Intron 3 86 C
C C T T
C/T
Csf2rb2 : Intron 3 87 T
T T C C
C/T
Csf2rb2 : Intron 1 88
A G
A/G
Csf2rb2 : Intron 2 89 T T T T T C
T
C/T
Csf2rb2 : Intron 1 90 C C C C
T
C
C/T
Csf2rb2 : Intron 2 91 T T T T T C
T
C/T
Csf2rb2 : Intron 1 92 A
A
A
Csf2rb2 : Intron 1 93 T
G
G/T
Csf2rb2 : Intron 1 94 T
G
G/T
Csf2rb2 : Coding-Synonymous
2 95 T
T A
A/T
Csf2rb2 : Coding-NonSynonymous
3 96 A A A A A G
A
A/G
Csf2rb2 : Coding-NonSynonymous
2 97 G G G G G T
G
G/T
Csf2rb2 : Intron 3 98 G G G G G A
G
A/G
Csf2rb2 : Coding-Synonymous
2 99 A
A G
A/G
Csf2rb2 : Coding-NonSynonymous
2 100 A
A G
A/G
Csf2rb2 : Coding-Synonymous
2 101 T
T G
G/T
Csf2rb2 : Intron 3 102 G
G G G A
G
A/G
Csf2rb2 : Intron 1 103 A
A C
A/C
Csf2rb2 : Intron 1 104
C
C
C
C/G
Csf2rb2 : Intron 2 105 T T T T T C
T
C/T
Csf2rb2 : Intron 2 106 C
A
A/C
Csf2rb2 : Intron 2 107 T
T A
A/T
Csf2rb2 : Intron 2 108 T
C C
C/T
Csf2rb2 : Intron 2 109 C C C C C T
C
C/T
Csf2rb2 : Intron 2 110 A
A A G G
A/G
Csf2rb2 : Intron 3 111 C C C C C A
C
A/C
Csf2rb2 : Intron 3 112 C C C C C A
C
A/C
Csf2rb2 : Intron 2 113 C C C C
C
C
C/T

284
Csf2rb2 : Intron 2 114 C
C A
A/C
Csf2rb2 : Intron 3 115 A A A A A G
A
A/G
Csf2rb2 : Intron 4 116 G G G G G A
G
A/G
Csf2rb2 : Intron 4 117 T T T T
A A
T
A/T
Csf2rb2 : Intron 3 118 T T T T T G
T
G/T
Csf2rb2 : Intron 2 119 A A A A A G
A
A/G
Csf2rb2 : Intron 1 120 G G G G
A
G
A/G
Csf2rb2 : Intron 2 121 G
G A
A/G
Csf2rb2 : Intron 1 122 C
T
C/T
Csf2rb2 : Intron 4 123 T T T T T C C
T
C/T
Csf2rb2 : Coding-Synonymous
3 124 A A A A
G G
A
A/G
Csf2rb2 : Coding-NonSynonymous
2 125 G G G G
C
G
C/G
Csf2rb2 : Intron 4 126 T T T T
G G
G/T
Csf2rb2 : Intron 3 127 G G G G
A A
G
A/G
Csf2rb2 : Intron 3 128 G G G G
A
G
A/G
Csf2rb2 : Intron 2 129 G
A
A/G
Csf2rb2 : Intron 1 130 C
C G
C/G
Csf2rb2 : Intron 3 131 C
C C C A
C
A/C
Csf2rb2 : Intron 4 132 A A A A
C
A
A/C
Csf2rb2 : Intron 2 133 G
G
T
G/T
Csf2rb2 : Intron 2 134 A
A A T
A/T
Csf2rb2 : Intron 2 135 T
T A
A/T
Csf2rb2 : Intron 2 136
A C
A/C
Csf2rb2 : Intron 2 137 A
A C
A/C
Csf2rb2 : Intron 2 138 C
C G
C/G
Csf2rb2 : Intron 2 139 G
G T
G/T
Csf2rb2 : Intron 1 140 C
T
C/T
Csf2rb2 : Intron 2 141 G
G
A/G
Csf2rb2 : Intron 2 142 A
A T
A/T
Csf2rb2 : Intron 2 143 G
G A
A/G
Csf2rb2 : Intron 2 144 T
T
G G
G/T
Csf2rb2 : Intron 2 145 A
A
C C
A/C
Csf2rb2 : Intron 3 146 A
A
G G
A/G
Csf2rb2 : Intron 2 147 A
A
C C
A/C
Csf2rb2 : Intron 4 148 G C
? G C C
C
C/G
Csf2rb2 : Intron 3 149 A
A A C C
A/C
Csf2rb2 : Intron 2 150 T
T T G G
G/T
Csf2rb2 : Intron 3 151 C
C C C A A
C
A/C
Csf2rb2 : Intron 1 152 T
T C
C/T
Csf2rb2 : Intron 3 153 C
C T T
C/T
Csf2rb2 : Intron 3 154 T
T T C C
C/T

285
Csf2rb2 : Intron 3 155 A
A A G G
A/G
Csf2rb2 : Intron 3 156 A
A A G
A/G
Csf2rb2 : Intron 3 157 T
T A
A/T
Csf2rb2 : Intron 4 158 G G G G G A A
G
A/G
Csf2rb2 : Intron 4 159 T T T T T G G
T
G/T
Csf2rb2 : Intron 3 160
G A A
A/G
Csf2rb2 : Intron 3 161 G
G A A
A/G
Csf2rb : Intron 2 1 A A C A/C
Csf2rb : Intron 2 2 G
G A
A/G
Csf2rb : Intron 4 3 G G G G G A A
G
A/G
Csf2rb : Intron 1 4 A
A T
A/T
Csf2rb : Intron 1 5 T
T G
G/T
Csf2rb : Intron 4 6 A A A A A G
A
A/G
Csf2rb : Intron 4 7 T T T T T A A
T
A/T
Csf2rb : Intron 3 8 A
A G
A/G
Csf2rb : Intron 3 9 T
T C C
C/T
Csf2rb : Intron 2 10 G
G
T
G/T
Csf2rb : Intron 3 11 C
C
T T
C/T
Csf2rb : Coding-NonSynonymous
1 12 C C C C
G
C
C/G
Csf2rb : Intron 3 13 A
A A C C
A/C
Csf2rb : Intron 1 14 A A A A
G
A
A/G
Csf2rb : Intron 4 15 G
G G G A A
A/G
Csf2rb : Intron 3 16 C
C T
C/T
Csf2rb : Intron 1 17 T T T T
C
T
C/T
Csf2rb : Intron 1 18 A A A A
C
A
A/C
Csf2rb : Intron 1 19 G G G G
G
G
G/T
Csf2rb : Intron 1 20 A A A A
T
A
A/T
Csf2rb : Intron 1 21 C C C C
T
C
C/T
Csf2rb : Intron 1 22 T T T T
C
T
C/T
Csf2rb : Intron 1 23 G G G G
T
G
G/T
Csf2rb : Coding-NonSynonymous
1 24 C C C C
A
C
A/C
Csf2rb : Coding-NonSynonymous
1 25
T T T
C
T
C/T
Csf2rb : Intron 2 26
T T T
G
G/T
Csf2rb : Intron 2 27 T T T T T ?
T
C/T
Csf2rb : Intron 2 28 G G G G G A
G
A/G
Csf2rb : Intron 1 29 C
C T
C/T
Csf2rb : Intron 1 30
T
T
C/T
Csf2rb : Intron 3 31 A
A G G
A/G
Csf2rb : Intron 1 32 G
G
A/G

286
Csf2rb : Intron 4 33 C C C C C G G
C
C/G
Csf2rb : Intron 1 34 T
C
C/T
Csf2rb : Intron 1 35 G
A
A/G
Csf2rb : Intron 1 36 A
G
A/G
Csf2rb : Intron 1 37 C
T
C/T
Csf2rb : Intron 1 38 T
A T
A/T
Csf2rb : Intron 1 39 G
A G
A/G
Csf2rb : Intron 1 40 C
A C
A/C
Csf2rb : Intron 2 41 A
? G G
A/G
Csf2rb : Intron 1 42 T
A T
A/T
Csf2rb : Intron 1 43 C
C
C
Csf2rb : Intron 3 44 C
C G
C/G
Csf2rb : Intron 1 45 G G G G
G
G
G/T
Csf2rb : Intron 4 46 A
A
G G
A/G
Csf2rb : Intron 3 47 T
T
A
A/T
Csf2rb : Intron 2 48 G G G G
C
G
C/G
Csf2rb : Intron 3 49 G G G G G A A
G
A/G
Csf2rb : Intron 2 50 A
A A G G
A/G
Csf2rb : Coding-Synonymous 4 51 C
C
C T T
C/T
Csf2rb : Coding-NonSynonymous
1 52 A
A
G G
A/G
Csf2rb : Coding-NonSynonymous
2 53 ? A
C C A A
A/C
Csf2rb : mRNA-UTR 2 54 C
C G G
C/G
Csf2rb : mRNA-UTR 1 55 T
G T
G/T
Csf2rb : mRNA-UTR 3 56 T
T T G G
G/T
Csf2rb : mRNA-UTR 2 57 A
A A G G
A/G
Csf2rb : mRNA-UTR 1 58 G
G G C C
C/G
Csf2rb : mRNA-UTR 2 59 A
A G
A/G
Elfn2 : mRNA-UTR 3 1 T
T C
C/T
Elfn2 : Intron 3 2 G
G A
A/G
Elfn2 : Intron 3 3 T
T T T C
C/T
Elfn2 : Intron 4 4 T T T T
T C
T
C/T
Elfn2 : Intron 3 5 G
G G T
G/T
Elfn2 : Intron 3 6 G
G A
A/G
Elfn2 : Intron 4 7 G
G G
G A
G
A/G
Elfn2 : Intron 3 8 G
G C
C/G
Elfn2 : Intron 1 9
T G
G/T
Card10 : Intron 3 1 C C C T C/T
Card10 : mRNA-UTR 2 2 C
? T
C/T

287
Card10 : mRNA-UTR 1 3 G
A A
A/G
Nol12 : mRNA-UTR 3 1 C C C T T C
C
C/T
Nol12 : Intron 3 2 T
T G G T
T
G/T
Nol12 : Intron 3 3 T T T C
T
T
C/T
Nol12 : Intron 3 4 A A A C
A
A
A/C
Nol12 : Coding-Synonymous 3 5 A A A G
A
A
A/G
Nol12 : Intron 3 6 G G G A A G
G
A/G
Nol12 : Intron 3 7 T T
C C T
C/T
Nol12 : Intron 3 8 A A
G G A
A/G
Nol12 : Intron 3 9 T T
C C T
C/T
Nol12 : Intron 3 10 G G G C C G
G
C/G
Nol12 : Intron 3 11 A A A G G A
A
A/G
Nol12 : Intron 2 12 A
G A
A/G
Nol12 : Intron 2 13 G
A G
A/G
Nol12 : Intron 3 14 C
C T T C
C/T
Nol12 : Intron 2 15 T
C T
C/T
Nol12 : Intron 2 16 C
C
C
Nol12 : Intron 3 17 A A A G
A
A
A/G
Nol12 : Intron 2 18 C
A C
A/C
Nol12 : Intron 2 19 A
G A
A/G
Nol12 : Intron 3 20 A A A C C A
A
A/C
Nol12 : Intron 2 21
C T
C/T
Nol12 : Intron 2 22
C T
C/T
Nol12 : Intron 2 23
A C
A/C
Nol12 : Coding-NonSynonymous
3 24 T T T C C T
T
C/T
Nol12 : Intron 2 25 A
G A
A/G
Nol12 : Intron 2 26 A
G A
A/G
Nol12 : Intron 2 27 T
C T
C/T
Nol12 : Intron 2 28 C
T C
C/T
Nol12 : Intron 2 29 A
C A
A/C
Nol12 : Intron 3 30 G
G C C G
G
C/G
Nol12 : Intron 3 31 A
A G G A
A
A/G
Nol12 : Intron 2 32 T
G T
G/T
Nol12 : Intron 3 33 G
T
G
G/T
Nol12 : Intron 2 34 A
A
A
Nol12 : Intron 2 35 T
T
T
Nol12 : Intron 3 36 A A A G
A
A
A/G
Nol12 : Intron 2 37 T
T
T
Nol12 : Intron 3 38 G G G A A G
G
A/G
Nol12 : Intron 3 39 C
C T T C
C
C/T

288
Nol12 : Intron 2 40 G
T G
G/T
Nol12 : Intron 2 41 A
G A
A/G
Nol12 : Intron 2 42 T
C T
C/T
Nol12 : Intron 2 43 G
C G
C/G
Nol12 : Intron 2 44 G
A G
A/G
Nol12 : Intron 2 45 A
T A
A/T
Nol12 : Intron 2 46 C
T C
C/T
Nol12 : Intron 2 47 A
G A
A/G
Nol12 : mRNA-UTR 3 48 G G G T T G
G
G/T
Nol12 : mRNA-UTR 3 49 G G G A A G
G
A/G
Nol12 : mRNA-UTR 3 50 C
C G G C
C
C/G
Nol12 : mRNA-UTR 3 51 G G G A
G
G
A/G
Nol12 : mRNA-UTR 3 52 A A A G G A
A
A/G
Nol12 : mRNA-UTR 3 53 A A A G G A
A
A/G
1700088E04Rik : Intron 2 1 G
T G G
G/T
1700088E04Rik : Intron 3 2 G
A A G A
A/G
1700088E04Rik : Intron 3 3 A
G G A G
A/G
1700088E04Rik : Intron 3 4 G
C G C
C/G
1700088E04Rik : Intron 3 5 T
G T G
G/T
1700088E04Rik : Intron 4 6 T T T C C T C
T
C/T
1700088E04Rik : Intron 4 7 A A A G G A G
A
A/G
1700088E04Rik : Intron 2 8
G T T
G/T
1700088E04Rik : Intron 3 9
T C
C/T
1700088E04Rik : Intron 2 10
A G
A/G
1700088E04Rik : Intron 2 11 G
A G
A/G
1700088E04Rik : Intron 2 12 A
T A
A/T
1700088E04Rik : Intron 4 13 G G G A A G A
G
A/G
1700088E04Rik : mRNA-UTR 4 14 G G G A A G A
G
A/G
Pick1 : Intron 4 1 A A A
G A
A
A/G
Pick1 : Coding-Synonymous 4 2 G G G A A G A
G
A/G
Pick1 : Intron 3 3
G A G
A/G
Pick1 : Intron 1 4 G G G C
G
G
C/G
Pick1 : Intron 3 5 T
T C
T C
T
C/T
Pick1 : Intron 4 6 A A A A
A T
A
A/T
Pick1 : Intron 3 7 T T T C
T
T
C/T
Pick1 : Intron 2 8 T T T C C T
T
C/T
Pick1 : Intron 2 9 T
C T
C/T
Pick1 : Intron 3 10
C C A
C
C
A/C
Pick1 : Intron 3 11 T
T C
T
T
C/T

289
Pick1 : Intron 3 12 A A A G
A
A
A/G
Pick1 : Intron 3 13 G
G T
G
G
G/T
Pick1 : Intron 3 14 G G G C
G
G
C/G
Pick1 : Intron 3 15 T T T C
T
T
C/T
Pick1 : Intron 3 16 C C C A
C
C
A/C
Pick1 : Intron 3 17 A A A C
A
A
A/C
Pick1 : Intron 2 18 G
G
G
Pick1 : Intron 3 19 T
A T A
A/T
Pick1 : Intron 4 20 T T T C C T C
T
C/T
Pick1 : Intron 3 21 A
C A C
A/C
Pick1 : Intron 4 22 C
C G G C G
C
C/G
Pick1 : Intron 1 23 C
C
C
Pick1 : Intron 4 24 T T T C C T C
T
C/T
Pick1 : Intron 3 25 G
C G C
C/G
Pick1 : Intron 3 26 T
G T G
G/T
Pick1 : Intron 3 27 G
G G A
A/G
Pick1 : Intron 4 28 G G G G G G A
G
A/G
Pick1 : Intron 3 29 G G G A A G
G
A/G
Pick1 : Intron 2 30 C C C T T C
C
C/T
Pick1 : Intron 3 31 T
T C
T
C/T
Pick1 : Intron 1 32 G
A
A
A/G
Pick1 : Intron 2 33 A A A G
A
A
A/G
Pick1 : Intron 2 34 T
T
T
Pick1 : Intron 2 35 T
C
C/T
Pick1 : Intron 2 36 G G G T T G
G
G/T
Pick1 : Intron 2 37 C
T
C/T
Pick1 : Intron 3 38 A A A G G A
A
A/G
Pick1 : Intron 2 39 C
A C
A/C
Pick1 : Intron 1 40 G
A G
A/G
Pick1 : Intron 2 41 G
A G
A/G
Pick1 : Intron 2 42
C T
C/T
Pick1 : Intron 2 43 G G G A A G
G
A/G
Pick1 : Intron 2 44 G G G A
G
G
A/G
Pick1 : Intron 2 45 T
C T
C/T
Pick1 : Intron 2 46 A
T A
A/T
Pick1 : Intron 2 47 G
A G
A/G
Pick1 : Intron 3 48 T
T C
C/T
Pick1 : Intron 4 49 A A A G G A G
A
A/G
Pick1 : Intron 4 50 T T T C C T C
T
C/T
Pick1 : Intron 3 51 C
A C A
A/C
Pick1 : Intron 3 52 C
T T C T
C/T
Pick1 : Intron 3 53 C
T T C T
C/T
Pick1 : Intron 3 54 T
C
T C
C/T
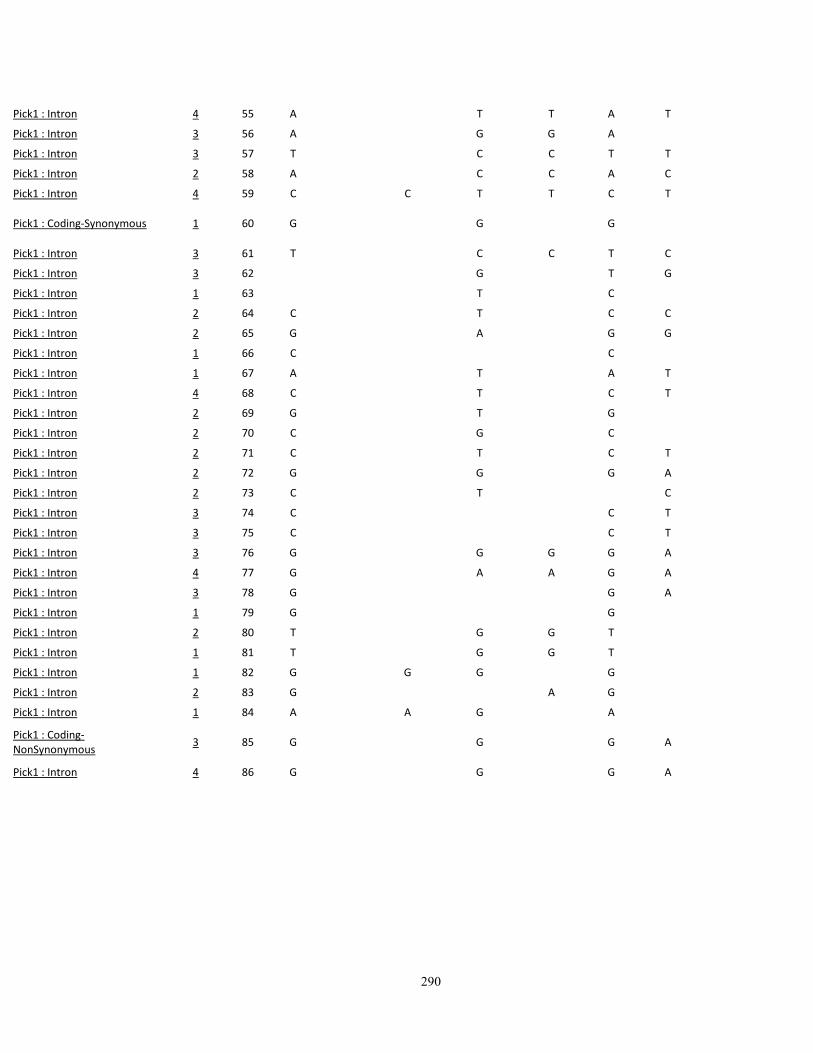
290
Pick1 : Intron 4 55 A
T T A T
A/T
Pick1 : Intron 3 56 A
G G A
A
A/G
Pick1 : Intron 3 57 T
C C T T
T
C/T
Pick1 : Intron 2 58 A
C C A C
A/C
Pick1 : Intron 4 59 C
C T T C T
C
C/T
Pick1 : Coding-Synonymous 1 60 G
G
G
G
A/G
Pick1 : Intron 3 61 T
C C T C
C/T
Pick1 : Intron 3 62
G
T G
G/T
Pick1 : Intron 1 63
T
C
C/T
Pick1 : Intron 2 64 C
T
C C
C/T
Pick1 : Intron 2 65 G
A
G G
A/G
Pick1 : Intron 1 66 C
C
C
Pick1 : Intron 1 67 A
T
A T
A/T
Pick1 : Intron 4 68 C
T
C T
C
C/T
Pick1 : Intron 2 69 G
T
G
G/T
Pick1 : Intron 2 70 C
G
C
C/G
Pick1 : Intron 2 71 C
T
C T
C/T
Pick1 : Intron 2 72 G
G
G A
A/G
Pick1 : Intron 2 73 C
T
C
C/T
Pick1 : Intron 3 74 C
C T
C/T
Pick1 : Intron 3 75 C
C T
C/T
Pick1 : Intron 3 76 G
G G G A
A/G
Pick1 : Intron 4 77 G
A A G A
A/G
Pick1 : Intron 3 78 G
G A
A/G
Pick1 : Intron 1 79 G
G
G
Pick1 : Intron 2 80 T
G G T
G/T
Pick1 : Intron 1 81 T
G G T
G/T
Pick1 : Intron 1 82 G
G G
G
G
A/G
Pick1 : Intron 2 83 G
A G
A/G
Pick1 : Intron 1 84 A
A G
A
A
A/G
Pick1 : Coding-NonSynonymous
3 85 G
G
G A
A/G
Pick1 : Intron 4 86 G
G
G A
A/G

291
Appendix IV
mRNA levels of the reference gene Hprt across treatment groups and strains following real-time
PCR. (A) Hprt remained insignificantly different in the naïve, sham, and denervated low groups
of A and B mice, and in denervated high autotomy A mice (P>0.05). (B) Hprt remained
insignificantly different in the naïve, sham, and denervated low groups of C3H/HeJ and AKR/J
mice, and in denervated high autotomy C3H/HeJ mice (P>0.05). (C) Hprt remained
insignificantly different in the naïve, sham, and denervated low- and high-autotomy groups of
C3H/HeN (Tlr4 +/+
) and C3H/HeJ (Tlr4 -/-
) mice (P>0.05). One-way ANOVA with post hoc
Tukey’s test
0
0.1
0.2
0.3
0.4
0.5
0.6
0.7
C3H/HeJ AKR/J
mRN
A le
vel o
f Hpr
t
Hprt gene expression in C3H and AKR mice
Naive
Sham
Low Autotomy
High Autotomy
0
0.1
0.2
0.3
0.4
0.5
0.6
0.7
A mice B mice
mR
NA
leve
l of H
prt
Hprt gene expression in A and B mice
Naive
Sham
0
0.1
0.2
0.3
0.4
0.5
0.6
0.7
Naïve Sham LowAutotomy
HighAutotomy
mRN
A le
vel o
f Hpr
t
Hprt expression in wild-type vs. mutant Tlr4 mice
Tlr4 +/+
Tlr4 -/-
A
B
C

292
Appendix V
Number of CSF2RB1+ cell extensions around the central canal in naïve and sham-operated A
and B mice, and in denervated A high autotomy and low autotomy mice. P-values show
insignificant differences in the number of extensions between naïve and sham-operated A mice,
and between naïve and sham-operated B mice (paired T-test). Data for these 2 groups of mice,
per strain, were pooled together for further analysis. As well, p-values show insignificant
differences in the number of extensions between MHS-A and NLS-A mice (paired T-test). Data
for these 2 groups of mice were pooled together for further analysis.
Mice Number of CSF2RB1+ extensions in CC
Dorsal Ventral Lateral Total
Naïve A 4.11±1.45 4.43±1.26 13.20±4.76 20.58±6.54
Sham A 5.28±0.68 5.01±0.56 11.88±1.74 20.01±2.21
P-value 0.38 0.66 0.79 0.93
Naïve B 1.46±1.40 1.58±1.58 1.88±1.88 4.33±4.28
Sham B 0.04±0.04 0.13±0.13 0.96±0.96 1.08±1.08
P-value 0.35 0.39 0.68 0.49
MHS-A 6.60±0.26 7.58±0.55 18.19±1.02 30.23±1.51
NLS-A 6.21±0.17 6.33±0.35 20.29±2.90 30.54±2.87
P-value 0.34 0.16 0.41 0.19

293
Appendix VI
Number of CSF2RB1+ cell processes crossing the dentate gyrus per 200 μm unit length in naïve
and sham-operated A and B mice. P-values show insignificant differences in the number of
processes between naïve and sham-operated A mice, and between naïve and sham-operated B
mice (paired T-test). Data for these 2 groups of mice, per strain, were pooled together for further
analysis.
Mice Number of CSF2RB1+ processes crossing the DG per 200 μm
Naïve A 6.83±6.86
Sham A 6.50±4.04
P-value 0.68
Naïve B 5.11±2.73
Sham B 7.51±3.41
P-value 0.6
Appendix VII
Number of CSF2RB1+ cells in the polymorph dentate gyrus per ROI of 2500 μm2 of naïve and
sham-operated A and B mice. P-values show insignificant differences in the number of cells
between naïve and sham-operated A mice, and between naïve and sham-operated B mice (paired
T-test). Data for these 2 groups of mice, per strain, were pooled together for further analysis.
Mice Number of CSF2RB1+ cells in polymorph DG
Naïve A 3.37±0.45
Sham A 7.15±2.70
P-value 0.37
Naïve B 7.96±1.58
Sham B 8.24±1.39
P-value 0.9

294
Copyright Acknowledgements
RightsLink, permission to reproduce Scheme 1, License Number 3378941306268
RightsLink, permission to reproduce Scheme 2, License Number 3378941061859