Identification of current ecosystem functional types in the Iberian Peninsula
13
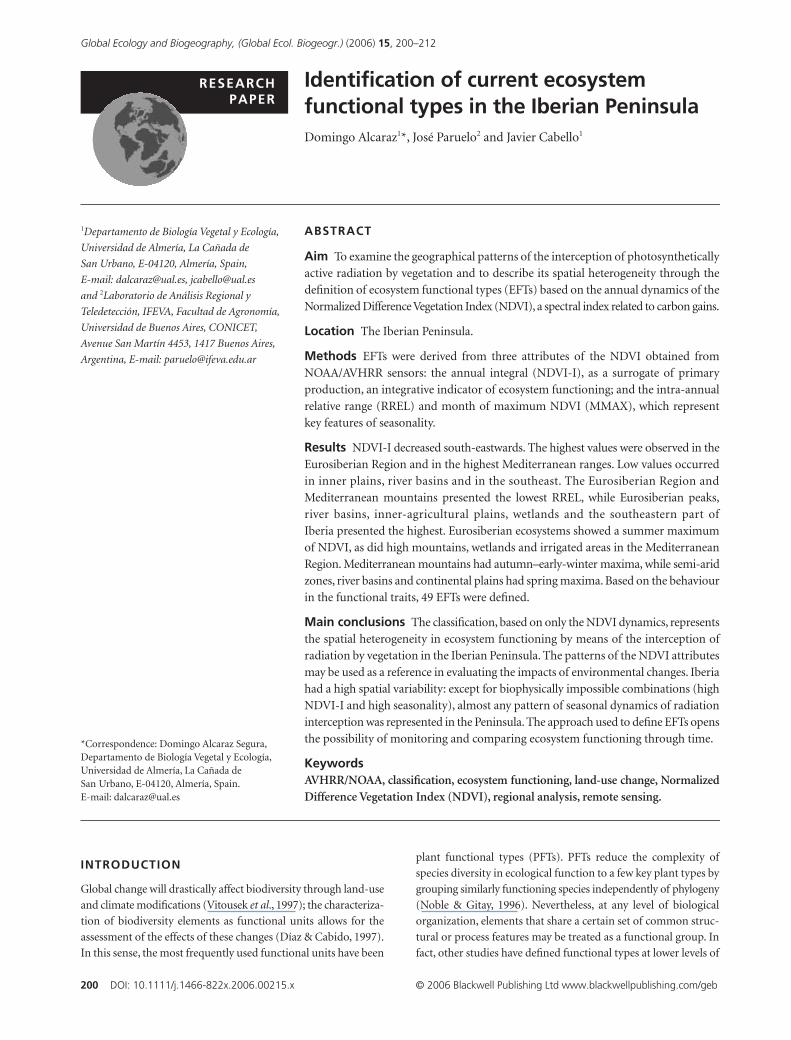
Global Ecology and Biogeography, (Global Ecol. Biogeogr.) (2006) 15, 200–212 RESEARCH PAPER 200 DOI: 10.1111/j.1466-822x.2006.00215.x © 2006 Blackwell Publishing Ltd www.blackwellpublishing.com/geb Blackwell Publishing Ltd Identification of current ecosystem functional types in the Iberian Peninsula Domingo Alcaraz 1 *, José Paruelo 2 and Javier Cabello 1 ABSTRACT Aim To examine the geographical patterns of the interception of photosynthetically active radiation by vegetation and to describe its spatial heterogeneity through the definition of ecosystem functional types (EFTs) based on the annual dynamics of the Normalized Difference Vegetation Index (NDVI), a spectral index related to carbon gains. Location The Iberian Peninsula. Methods EFTs were derived from three attributes of the NDVI obtained from NOAA/AVHRR sensors: the annual integral (NDVI-I), as a surrogate of primary production, an integrative indicator of ecosystem functioning; and the intra-annual relative range (RREL) and month of maximum NDVI (MMAX), which represent key features of seasonality. Results NDVI-I decreased south-eastwards. The highest values were observed in the Eurosiberian Region and in the highest Mediterranean ranges. Low values occurred in inner plains, river basins and in the southeast. The Eurosiberian Region and Mediterranean mountains presented the lowest RREL, while Eurosiberian peaks, river basins, inner-agricultural plains, wetlands and the southeastern part of Iberia presented the highest. Eurosiberian ecosystems showed a summer maximum of NDVI, as did high mountains, wetlands and irrigated areas in the Mediterranean Region. Mediterranean mountains had autumn–early-winter maxima, while semi-arid zones, river basins and continental plains had spring maxima. Based on the behaviour in the functional traits, 49 EFTs were defined. Main conclusions The classification, based on only the NDVI dynamics, represents the spatial heterogeneity in ecosystem functioning by means of the interception of radiation by vegetation in the Iberian Peninsula. The patterns of the NDVI attributes may be used as a reference in evaluating the impacts of environmental changes. Iberia had a high spatial variability: except for biophysically impossible combinations (high NDVI-I and high seasonality), almost any pattern of seasonal dynamics of radiation interception was represented in the Peninsula. The approach used to define EFTs opens the possibility of monitoring and comparing ecosystem functioning through time. Keywords AVHRR/NOAA, classification, ecosystem functioning, land-use change, Normalized Difference Vegetation Index (NDVI), regional analysis, remote sensing. *Correspondence: Domingo Alcaraz Segura, Departamento de Biología Vegetal y Ecología, Universidad de Almería, La Cañada de San Urbano, E-04120, Almería, Spain. E-mail: [email protected] 1 Departamento de Biología Vegetal y Ecología, Universidad de Almería, La Cañada de San Urbano, E-04120, Almería, Spain, E-mail: [email protected], [email protected] and 2 Laboratorio de Análisis Regional y Teledetección, IFEVA, Facultad de Agronomía, Universidad de Buenos Aires, CONICET, Avenue San Martín 4453, 1417 Buenos Aires, Argentina, E-mail: [email protected] INTRODUCTION Global change will drastically affect biodiversity through land-use and climate modifications (Vitousek et al., 1997); the characteriza- tion of biodiversity elements as functional units allows for the assessment of the effects of these changes (Díaz & Cabido, 1997). In this sense, the most frequently used functional units have been plant functional types (PFTs). PFTs reduce the complexity of species diversity in ecological function to a few key plant types by grouping similarly functioning species independently of phylogeny (Noble & Gitay, 1996). Nevertheless, at any level of biological organization, elements that share a certain set of common struc- tural or process features may be treated as a functional group. In fact, other studies have defined functional types at lower levels of
-
Upload
independent -
Category
Documents
-
view
1 -
download
0
Transcript of Identification of current ecosystem functional types in the Iberian Peninsula
Global Ecology and Biogeography, (Global Ecol. Biogeogr.)
(2006)
15
, 200–212
RESEARCHPAPER
200
DOI: 10.1111/j.1466-822x.2006.00215.x © 2006 Blackwell Publishing Ltd www.blackwellpublishing.com/geb
Blackwell Publishing Ltd
Identification of current ecosystem functional types in the Iberian Peninsula
Domingo Alcaraz
1
*, José Paruelo
2
and Javier Cabello
1
ABSTRACT
Aim
To examine the geographical patterns of the interception of photosyntheticallyactive radiation by vegetation and to describe its spatial heterogeneity through thedefinition of ecosystem functional types (EFTs) based on the annual dynamics of theNormalized Difference Vegetation Index (NDVI), a spectral index related to carbon gains.
Location
The Iberian Peninsula.
Methods
EFTs were derived from three attributes of the NDVI obtained fromNOAA/AVHRR sensors: the annual integral (NDVI-I), as a surrogate of primaryproduction, an integrative indicator of ecosystem functioning; and the intra-annualrelative range (RREL) and month of maximum NDVI (MMAX), which representkey features of seasonality.
Results
NDVI-I decreased south-eastwards. The highest values were observed in theEurosiberian Region and in the highest Mediterranean ranges. Low values occurredin inner plains, river basins and in the southeast. The Eurosiberian Region andMediterranean mountains presented the lowest RREL, while Eurosiberian peaks,river basins, inner-agricultural plains, wetlands and the southeastern part ofIberia presented the highest. Eurosiberian ecosystems showed a summer maximumof NDVI, as did high mountains, wetlands and irrigated areas in the MediterraneanRegion. Mediterranean mountains had autumn–early-winter maxima, while semi-aridzones, river basins and continental plains had spring maxima. Based on the behaviourin the functional traits, 49 EFTs were defined.
Main conclusions
The classification, based on only the NDVI dynamics, representsthe spatial heterogeneity in ecosystem functioning by means of the interception ofradiation by vegetation in the Iberian Peninsula. The patterns of the NDVI attributesmay be used as a reference in evaluating the impacts of environmental changes. Iberiahad a high spatial variability: except for biophysically impossible combinations (highNDVI-I and high seasonality), almost any pattern of seasonal dynamics of radiationinterception was represented in the Peninsula. The approach used to define EFTs opensthe possibility of monitoring and comparing ecosystem functioning through time.
Keywords
AVHRR/NOAA, classification, ecosystem functioning, land-use change, Normalized
Difference Vegetation Index (NDVI), regional analysis, remote sensing.
*Correspondence: Domingo Alcaraz Segura, Departamento de Biología Vegetal y Ecología, Universidad de Almería, La Cañada de San Urbano, E-04120, Almería, Spain. E-mail: [email protected]
1
Departamento de Biología Vegetal y Ecología,
Universidad de Almería, La Cañada de
San Urbano, E-04120, Almería, Spain,
E-mail: [email protected], [email protected]
and
2
Laboratorio de Análisis Regional y
Teledetección, IFEVA, Facultad de Agronomía,
Universidad de Buenos Aires, CONICET,
Avenue San Martín 4453, 1417 Buenos Aires,
Argentina, E-mail: [email protected]
INTRODUCTION
Global change will drastically affect biodiversity through land-use
and climate modifications (Vitousek
et al
., 1997); the characteriza-
tion of biodiversity elements as functional units allows for the
assessment of the effects of these changes (Díaz & Cabido, 1997).
In this sense, the most frequently used functional units have been
plant functional types (PFTs). PFTs reduce the complexity of
species diversity in ecological function to a few key plant types by
grouping similarly functioning species independently of phylogeny
(Noble & Gitay, 1996). Nevertheless, at any level of biological
organization, elements that share a certain set of common struc-
tural or process features may be treated as a functional group. In
fact, other studies have defined functional types at lower levels of
Iberian ecosystem functional types
Global Ecology and Biogeography
,
15
, 200–212 © 2006 Blackwell Publishing Ltd
201
the biodiversity hierarchy (genes, molecules, etc.) and with other
organism groups (Steneck, 2001). Several authors have pointed
out the necessity of a functional classification of ecosystems
(Körner, 1994; Valentini
et al
., 1999; Paruelo
et al
., 2001a). In this
sense, as plant species can be grouped based on functional
features (i.e. relative growth rates, nitrogen fixation) into PFTs,
ecosystems can be grouped based on their functional behaviour
into ecosystem functional types (hereafter EFTs). Also, as
environmental transformations are particularly noticeable at the
ecosystem level (Vitousek
et al
., 1997), knowledge of the temporal
and spatial patterns of ecosystem functioning at the regional scale
provides a proper background to assess the effects of environ-
mental changes (Gitay & Noble, 1997).
Mueller-Dombois and Ellenberg (1974) pointed out that vegeta-
tion classification could be based on interdependencies in
the functional sense between vegetation and the environment,
emphasizing in this way functional similarities between different
ecosystems. Considering functional variables in the definition of
ecosystems clearly complements and improves the descriptions
based on only structural features (Valentini
et al
., 1999) and shows
some advantages: (1) functional classifications provide a useful
framework to understand large-scale ecological changes in
relation to ecosystem function and processes; (2) the inertia of
structural attributes may delay the perception of ecosystem
responses to environmental changes, while the exchange of energy
and matter of an ecosystem has a shorter response (Milchunas
& Lauenroth, 1995); (3) monitoring of functional attributes with
satellite imagery is easier than for structural ones (Paruelo
et al
.,
2001a); and (4) functional attributes allow the qualitative and
quantitative assessment of ecosystem services (Costanza
et al
.,
1997).
Different approaches have been proposed for the definition of
functional units at the ecosystem level, using both top-down and
bottom-up strategies. Shugart (1997) was one of the first to use
the term EFT as ‘aggregated components of ecosystems whose
interactions with one another and with the environment produce
differences in patterns of ecosystem structure and dynamics’ (i.e.
the way in which plants modify ecosystem dynamics in the sense
of functional effect types of Díaz & Cabido, 2001). Walker (1997)
proposed the use of a similar term, vegetation functional types,
for groups of PFTs in sets that constitute the different states
of vegetation succession in non-equilibrium ecosystems. The
same term was applied by Scholes
et al
. (1997) in a wider sense
for those areas having similar ecological attributes, such as PFTs
composition, structure, phenology, biomass or productivity.
Several studies have applied hierarchy and patch dynamic
theories (Aber
et al
., 1999; Reynolds & Wu, 1999; Wu
et al
., 2003)
for the definition of ecosystem and landscape functional types
at different spatial scales, by scaling-up emergent structural and
functional properties from patches to region. Valentini
et al
.
(1999) defined functional units by focusing on patches of the
land surface that are able to exchange mass and energy with the
atmosphere and show a coordinated and specific response to
environmental factors. They also made an attempt to aggregate
functional properties in order to achieve a functional classifica-
tion of ecosystems, with a specific focus on processes involved in
biosphere–atmosphere exchanges. These ideas have been developed
in several works (e.g. Falge
et al
., 2002) that assessed the applica-
bility of FLUXNET data to evaluate EFTs in terms of their differ-
ences in net ecosystem CO
2
exchange, which is crucial for
scaling-up flux estimates on eddy-covariance towers to landscape
and global scales.
Remote sensing techniques provide valuable tools to classify
ecosystems at the regional scale (e.g. Lloyd, 1990; Nemani &
Running, 1997). Mueller-Dombois and Ellenberg (1974) suggested
the use of solar energy by green plants as a parameter worthy for
a functional quantitative characterization of ecosystems. Hence,
functional traits derived from satellite data and related to carbon
and water cycles are suitable variables to define EFTs. This is the
case of the approach by Paruelo
et al
. (2001a) for temperate
South America. EFTs were defined separately from vegetation
structure as a group of ecosystems sharing functional character-
istics that included the amount and timing of matter and energy
exchanged between the biotic community and the environment
(in the same sense as Valentini
et al
., 1999). The functional variables
they used in their classification focused on the dynamics of
primary production, one of the essential and most integrative
indicators of ecosystem functioning (McNaughton
et al
., 1989;
Virginia & Wall, 2001). For this purpose, they used three
attributes of the seasonal dynamics of the Normalized Difference
Vegetation Index (NDVI). This is an spectral index closely
related to above-ground net primary productivity (ANPP)
(Tucker & Sellers, 1986; Sellers
et al
., 1992) and a linear estimator
of the fraction of absorbed photosynthetically active radiation
(fAPAR) by vegetation (Sellers
et al
., 1996; Fensholt
et al
., 2004;
Wang
et al
., 2004).
Here, we used the Iberian Peninsula (Fig. 1) as a suitable
region to test and implement a classification based on functional
attributes of ecosystems. As previous studies have remarked
(Lloyd, 1989; Lobo
et al
., 1997), Iberia has many desirable pro-
perties for remote sensing studies. Despite its size (581,000 km
2
),
it has remarkable landscape diversity as a consequence of its
relief, climate, geological features and biogeographical location
(transition between the Eurosiberian and Mediterranean
Regions according to Rivas-Martínez, 1987). Nowadays, a large
part of Iberia has a relatively low human population and crop-
lands have decreased considerably in the last few decades. There
is a wide knowledge of the Iberian ecosystems in terms of its veg-
etation structure and floristic composition (e.g. Rivas-Martínez,
1987; Costa
et al
., 1998), and important structural (Peñuelas &
Boada, 2003) and functional (Vicente-Serrano & Heredia-
Laclaustra, 2004) changes have been documented due to climate
modifications. Remote sensing studies based on NDVI have been
used largely under a wide range of environmental conditions in
Iberia to estimate biomass, leaf area index, vegetation stress,
fAPAR and productivity (e.g. Calvao & Palmeirim, 2004; Filella
et al
., 2004).
Currently, the Iberian Peninsula is proving to be a lively
research area in relation to global change and ecosystem
functioning (e.g. Shoshany, 2000; Arribas
et al
., 2003; González-
Alonso
et al
., 2004; Peñuelas
et al
., 2004). Some of these works
were based on NOAA/AVHRR NDVI temporal series. Lloyd
D. Alcaraz
et al.
202
Global Ecology and Biogeography
,
15
, 200–212 © 2006 Blackwell Publishing Ltd
(1989) carried out a multitemporal characterization of different
Iberian vegetation structures with 2 years (1985–86) of images
from April to October. Lobo
et al
. (1997) explored the power of
NDVI temporal series (1984–88) to resolve vegetation types using
hierarchical classification methods. Azzali and Menenti (1999)
constructed maps of vegetation units characterized by homo-
geneous foliar phenology (isogrowth zones) by using Fourier
analysis with 10-day composites of maximum NDVI for 1995.
Following the rationale of Paruelo
et al
. (2001a), in this article
we describe the functional diversity of the Iberian Peninsula at
the regional scale by defining EFTs from the dynamics of carbon
gains using traits derived from the seasonal dynamics of the
NDVI for the period 1982–99. Our specific objectives were:
1
to describe the main patterns of the interception of radiation
by vegetation from three attributes of the NDVI annual curve
(the annual integral, the interseasonal variability and the date of
maximum NDVI);
2
to define, based on such traits, EFTs for the Iberian Peninsula;
and
3
to analyse the correspondence between the functional units
defined and potential vegetation and land-use types, and to get
the main controls of the spatial distribution of EFTs in the
Iberian Peninsula.
METHODS
We based our analysis on mean monthly NDVI values for the
period 1982–99. The NDVI is a spectral index calculated from
the reflectance in the red (channel 1, 580–680 nm) and near
infrared (channel 2, 725–1100 nm) bands as follows (Tucker &
Sellers, 1986): NDVI = (NIR
−
R)/(NIR + R). Our data set con-
sisted of 10-day NDVI composites provided by the Global Land
Cover 8 km AVHRR Project (Pathfinder AVHRR Land–PAL data
set). This data base comes from NOAA-7, -9 and -11 satellite
imageries and was radiometrically and spatially corrected (for
details see James & Kalluri, 1994). The scenes have an approximate
spatial resolution of 8
×
8 km and cover the whole globe. We
used the portion of the images located between 35
°
N and 45
°
N
latitude and 3.5
°
E and 10.2
°
W longitude in correspondence
with the Iberian Peninsula. The period considered (1982–99)
includes both extremely dry and wet periods for the Peninsula
(Arribas
et al
., 2003; Sumner
et al
., 2003).
Once the composites were imported to
Imagine 8.4,
they were layer-stacked to create a 36-band image for each year.
To minimize noise and spurious values not removed by the
original processing of the PAL data base, negative and extreme
values were eliminated. Those problems associated with cloud
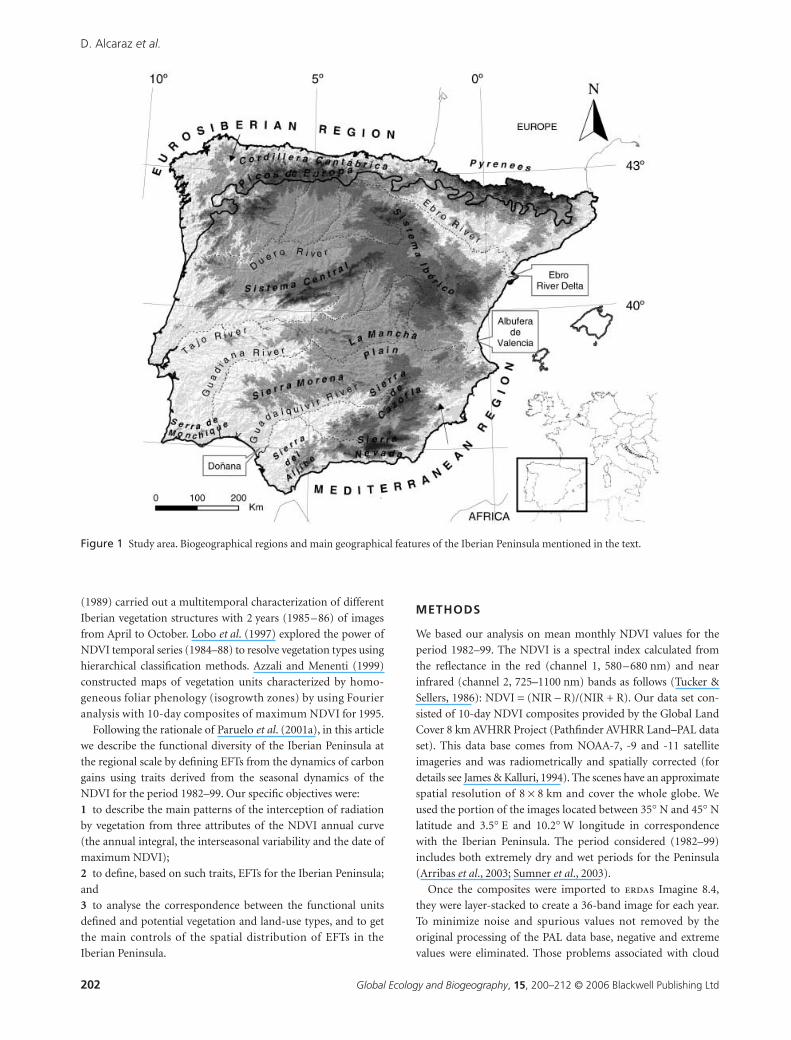
Figure 1 Study area. Biogeographical regions and main geographical features of the Iberian Peninsula mentioned in the text.
Iberian ecosystem functional types
Global Ecology and Biogeography
,
15
, 200–212 © 2006 Blackwell Publishing Ltd
203
contamination, off-nadir views and sensor degradation were also
minimized by selecting the maximum NDVI value for each pixel
from the three 10-day composites of each month. The monthly
NDVI images were examined visually to check for further pos-
sible erroneous pixels to be removed manually. The final range of
NDVI values varied between 0 and 0.8.
To describe the patterns of the interception of radiation by
vegetation, the following variables were derived from the sea-
sonal NDVI curve of the averaged year (Appendix S1 in Supple-
mentary Material): annual integral (NDVI-I); annual relative
range (RREL) (difference between maximum and minimum
NDVI divided by annual integral); and month of the absolute
maximum of NDVI (MMAX). These three variables describe in
a conceivable way the height and shape of the annual NDVI
curve and have biological significance (Pettorelli
et al
., 2005).
They have been reported to capture important features of
ecosystem functioning for temperate ecosystems (Lloyd, 1990;
Paruelo & Lauenroth, 1995; Nemani & Running, 1997; Paruelo
et al
., 2001b). NDVI-I has been used as an integrative indicator
of ecosystem functioning as it is a linear estimator of fAPAR
(Sellers
et al
., 1996) and thus of ANPP (Tucker & Sellers, 1986;
Sellers
et al
., 1992; Paruelo
et al
., 1997). It has been employed
from cool, moist temperate rain forests to Mediterranean
forests and shrublands and even in hot deserts (e.g. Lloyd, 1990;
Ricotta
et al
., 1999; Stoms & Hargrove, 2000; Hoare & Frost,
2004). RREL provides a description of the intra-annual variation
of photosynthetic activity, which has been used as an indicator of
the seasonality of carbon fluxes (Oesterheld
et al
., 1998; Potter &
Brooks, 1998; Guerschman
et al
., 2003). MMAX is a good
descriptor of vegetation phenology, indicating the intra-annual
distribution of the period with maximum photosynthetic
activity (Lloyd, 1990; Hoare & Frost, 2004).
We examined the meaningfulness of these three attributes for
describing the NDVI annual curve in the Iberian Peninsula. A prin-
cipal component analysis (PCA) was carried out using the 12 NDVI
values of the annual curve for the whole Peninsula and for the Euro-
siberian and Mediterranean Regions separately. We then analysed
the correlation between the functional attributes (NDVI-I, RREL
and MMAX) and the first two principal axes of each PCA
separately. We also tested correlation among the three variables.
The functional classification was carried out by identifying
subsets of the three-dimensional space defined by the functional
variables NDVI-I, RREL and MMAX. For this, we avoided classi-
fications based on automatic clustering algorithms because they
are data-dependent and did not keep the spatial patterns that
could be recognized in the RGB false-colour image of the three
traits that were clearly related to geographical and bioclimatic
features. Instead we used a ‘fixed’ classification method to maxi-
mize the biological meaning and interpretability of the classes.
Also, such an approach will allow the use of the same classifica-
tion rules in further analysis on an annual basis, and provides a
way to achieve a simple functional classification that produces
ecologically interpretable outputs. Following the logic of Noble
and Gitay (1996) in developing functional classifications we
decided to start from the most simple, as long as outputs were
ecologically interpretable. Four intervals of each attribute
(Table 1) produced a relatively low number of potential classes
(4
×
4
×
4 = 64) and allowed for the maintenance in the final
classification of the patterns observed for the variables in the
RGB image. We looked for the three highest spatial discontinui-
ties in the NDVI-I and RREL maps. In order to obtain four inter-
vals, the way we proceeded was based on selecting those three
values where a relatively abrupt fall or increase in the spatial pro-
file of the variable occurred. For MMAX, we also grouped the
12-month image into only four classes, which were in close cor-
respondence with the four seasons that occur in temperate eco-
systems. In this case, to keep the continuous nature of the annual
period and the relative distance between months (i.e. December
is as close to January as July is to June), we transformed months
into polar coordinates. The entire circumference of a year was
divided into 12 portions and each month was equated to an angle
(30
°
for January and 360
°
for December). Months were therefore
characterized by its sine and cosine values. All pixels of this two-
band image were classified into four clusters using the
method (Iterative Self Organizing Data Analysis) that corre-
sponded to the four seasons of the year in temperate ecosystems.
The use of this synthetic variable increased the spatial continuity
of the functional classification and made the interpretation of the
phenological spatial patterns easier.
Each class was named as an EFT following the terminology
suggested by Paruelo
et al
. (2001a). We assigned codes to each
EFT based on two letters and a number (three characters) related
to the interval value of each trait used in the definition of the
classes (NDVI-I, RREL and MMAX). The first letter of the code
(capital) corresponded to the NDVI-I level, ranging from
A
to
D
for low to high NDVI-I. The second letter (small) showed the rel-
ative range, ranging similarly from
a
to
d
for low to high RREL.
The numbers indicated the season of maximum NDVI (see
Table 1). The definition and coding of EFTs were based only on
Table 1 Range of the functional traits used in the definition of ecosystem functional types (EFTs) of the Iberian Peninsula: NDVI integral (NDVI-I), relative range of NDVI (RREL) and month of the maximum NDVI (MMAX). Capital letters correspond to the NDVI-I level, ranging from A to D for low to high NDVI-I. Small letters show the relative range, ranging similarly from a to d for low to high RREL. The numbers indicate the season of maximum NDVI
Functional code Lower limit Upper limit
NDVI-I A 0.099 0.250
B 0.250 0.400
C 0.400 0.550
D 0.550 0.680
RREL a 0.070 0.290
b 0.290 0.515
c 0.515 0.920
d 0.920 2.254
MMAX 1 Summer
2 Autumn and early winter
3 Late winter and early spring
4 Late spring
D. Alcaraz
et al.
204
Global Ecology and Biogeography
,
15
, 200–212 © 2006 Blackwell Publishing Ltd
functional attributes and allow for an ecological interpretation of
the legend.
According to the correspondence among EFTs, potential vege-
tation and land-cover units, we identified the main controls of
the spatial patterns of the EFTs. We evaluated the correspondence
between the current functional units and potential vegetation
through a correspondence analysis (CA) of the contingency
matrix resulting from cross-tabulating the EFTs with a digital
map compiled from vegetation series maps (Rivas-Martínez,
1987; Rivas-Martínez
et al
., 1990; Costa
et al
., 1998; Valle
et al
.,
2003). We grouped original vegetation series into 11 main poten-
tial vegetation types: Mediterranean evergreen oak forests; semi-
deciduous forests; broad-leaved deciduous and mixed forests;
birch forests; Eurosiberian coniferous forests; beech forests;
Juni-
perus thurifera
L. arborescent matorral; Mediterranean maquis;
Iberian–African arborescent scrub and arid garrigues; oro-
Mediterranean grasslands and scrubs; and wetlands and hydro-
phytic vegetation (see Appendix S2 in Supplementary Material).
We also carried out a CA between EFTs and current land-cover
types based on PELCOM (Pan-European Land Cover Monitoring
Project: http://cgi.girs.wageningen-ur.nl/cgi/projects/eu/
pelcom/) with 1
×
1 km of spatial resolution. To make a more
comprehensive ordination analysis, both CAs were performed
including EFTs that covered up to 90% of the Iberian surface.
The assessment of the correspondence between our classes and
the potential vegetation and land-cover maps were not intended
to be an evaluation of our approach but an objective assessment
of the agreement between structural and functional descriptions
of current ecosystems at the regional level in a very human mod-
ified area such as the Iberian Peninsula.
RESULTS
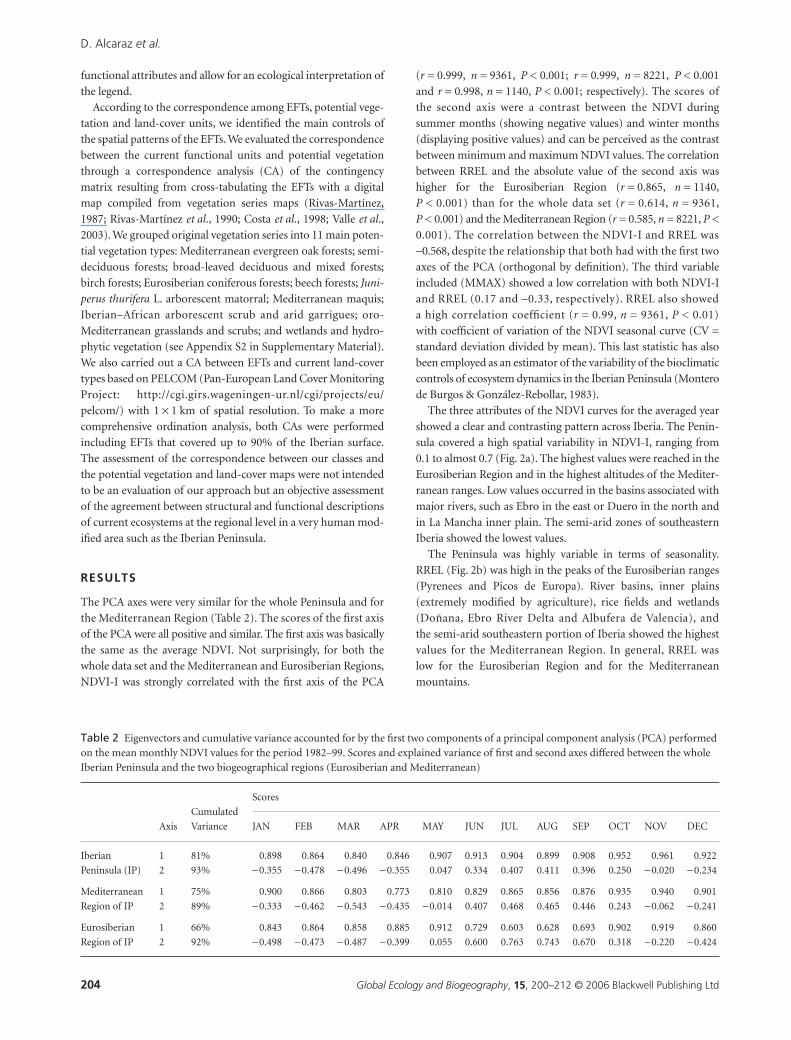
The PCA axes were very similar for the whole Peninsula and for
the Mediterranean Region (Table 2). The scores of the first axis
of the PCA were all positive and similar. The first axis was basically
the same as the average NDVI. Not surprisingly, for both the
whole data set and the Mediterranean and Eurosiberian Regions,
NDVI-I was strongly correlated with the first axis of the PCA
(
r =
0.999,
n
= 9361,
P
< 0.001;
r
= 0.999,
n
= 8221,
P
< 0.001
and
r
= 0.998,
n
= 1140,
P
< 0.001; respectively). The scores of
the second axis were a contrast between the NDVI during
summer months (showing negative values) and winter months
(displaying positive values) and can be perceived as the contrast
between minimum and maximum NDVI values. The correlation
between RREL and the absolute value of the second axis was
higher for the Eurosiberian Region (
r =
0.865,
n
= 1140,
P
< 0.001) than for the whole data set (
r =
0.614,
n
= 9361,
P
< 0.001) and the Mediterranean Region (
r =
0.585,
n
= 8221,
P
<
0.001). The correlation between the NDVI-I and RREL was
−
0.568, despite the relationship that both had with the first two
axes of the PCA (orthogonal by definition). The third variable
included (MMAX) showed a low correlation with both NDVI-I
and RREL (0.17 and
−
0.33, respectively). RREL also showed
a high correlation coefficient (
r =
0.99,
n
= 9361,
P
< 0.01)
with coefficient of variation of the NDVI seasonal curve (CV =
standard deviation divided by mean). This last statistic has also
been employed as an estimator of the variability of the bioclimatic
controls of ecosystem dynamics in the Iberian Peninsula (Montero
de Burgos & González-Rebollar, 1983).
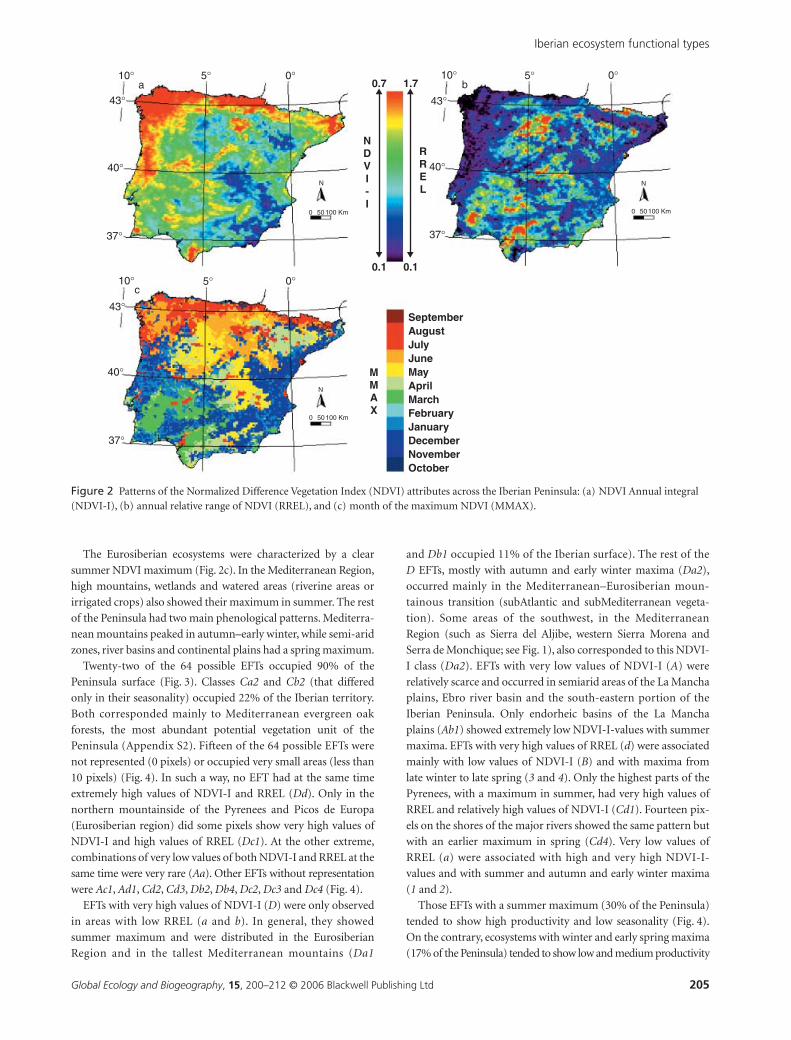
The three attributes of the NDVI curves for the averaged year
showed a clear and contrasting pattern across Iberia. The Penin-
sula covered a high spatial variability in NDVI-I, ranging from
0.1 to almost 0.7 (Fig. 2a). The highest values were reached in the
Eurosiberian Region and in the highest altitudes of the Mediter-
ranean ranges. Low values occurred in the basins associated with
major rivers, such as Ebro in the east or Duero in the north and
in La Mancha inner plain. The semi-arid zones of southeastern
Iberia showed the lowest values.
The Peninsula was highly variable in terms of seasonality.
RREL (Fig. 2b) was high in the peaks of the Eurosiberian ranges
(Pyrenees and Picos de Europa). River basins, inner plains
(extremely modified by agriculture), rice fields and wetlands
(Doñana, Ebro River Delta and Albufera de Valencia), and
the semi-arid southeastern portion of Iberia showed the highest
values for the Mediterranean Region. In general, RREL was
low for the Eurosiberian Region and for the Mediterranean
mountains.
Table 2 Eigenvectors and cumulative variance accounted for by the first two components of a principal component analysis (PCA) performed on the mean monthly NDVI values for the period 1982–99. Scores and explained variance of first and second axes differed between the whole Iberian Peninsula and the two biogeographical regions (Eurosiberian and Mediterranean)
Axis
Cumulated
Variance
Scores
JAN FEB MAR APR MAY JUN JUL AUG SEP OCT NOV DEC
Iberian 1 81% 0.898 0.864 0.840 0.846 0.907 0.913 0.904 0.899 0.908 0.952 0.961 0.922
Peninsula (IP) 2 93% −0.355 −0.478 −0.496 −0.355 0.047 0.334 0.407 0.411 0.396 0.250 −0.020 −0.234
Mediterranean 1 75% 0.900 0.866 0.803 0.773 0.810 0.829 0.865 0.856 0.876 0.935 0.940 0.901
Region of IP 2 89% −0.333 −0.462 −0.543 −0.435 −0.014 0.407 0.468 0.465 0.446 0.243 −0.062 −0.241
Eurosiberian 1 66% 0.843 0.864 0.858 0.885 0.912 0.729 0.603 0.628 0.693 0.902 0.919 0.860
Region of IP 2 92% −0.498 −0.473 −0.487 −0.399 0.055 0.600 0.763 0.743 0.670 0.318 −0.220 −0.424
Iberian ecosystem functional types
Global Ecology and Biogeography, 15, 200–212 © 2006 Blackwell Publishing Ltd 205
The Eurosiberian ecosystems were characterized by a clear
summer NDVI maximum (Fig. 2c). In the Mediterranean Region,
high mountains, wetlands and watered areas (riverine areas or
irrigated crops) also showed their maximum in summer. The rest
of the Peninsula had two main phenological patterns. Mediterra-
nean mountains peaked in autumn–early winter, while semi-arid
zones, river basins and continental plains had a spring maximum.
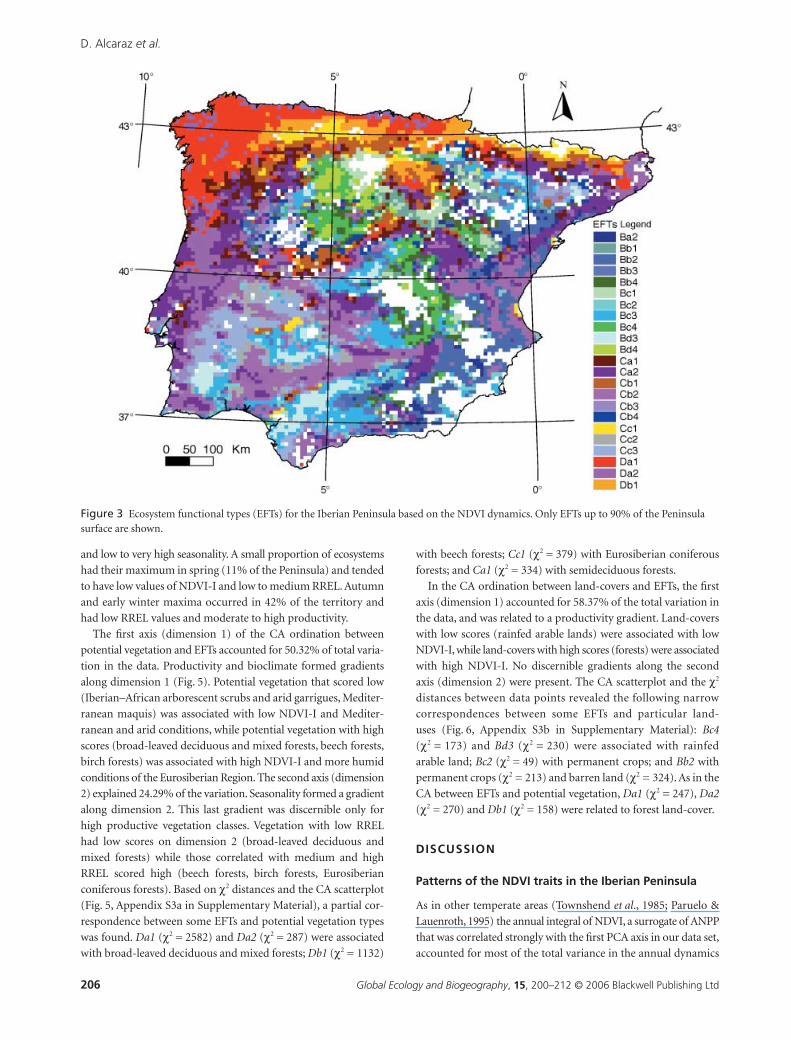
Twenty-two of the 64 possible EFTs occupied 90% of the
Peninsula surface (Fig. 3). Classes Ca2 and Cb2 (that differed
only in their seasonality) occupied 22% of the Iberian territory.
Both corresponded mainly to Mediterranean evergreen oak
forests, the most abundant potential vegetation unit of the
Peninsula (Appendix S2). Fifteen of the 64 possible EFTs were
not represented (0 pixels) or occupied very small areas (less than
10 pixels) (Fig. 4). In such a way, no EFT had at the same time
extremely high values of NDVI-I and RREL (Dd). Only in the
northern mountainside of the Pyrenees and Picos de Europa
(Eurosiberian region) did some pixels show very high values of
NDVI-I and high values of RREL (Dc1). At the other extreme,
combinations of very low values of both NDVI-I and RREL at the
same time were very rare (Aa). Other EFTs without representation
were Ac1, Ad1, Cd2, Cd3, Db2, Db4, Dc2, Dc3 and Dc4 (Fig. 4).
EFTs with very high values of NDVI-I (D) were only observed
in areas with low RREL (a and b). In general, they showed
summer maximum and were distributed in the Eurosiberian
Region and in the tallest Mediterranean mountains (Da1
and Db1 occupied 11% of the Iberian surface). The rest of the
D EFTs, mostly with autumn and early winter maxima (Da2),
occurred mainly in the Mediterranean–Eurosiberian moun-
tainous transition (subAtlantic and subMediterranean vegeta-
tion). Some areas of the southwest, in the Mediterranean
Region (such as Sierra del Aljibe, western Sierra Morena and
Serra de Monchique; see Fig. 1), also corresponded to this NDVI-
I class (Da2). EFTs with very low values of NDVI-I (A) were
relatively scarce and occurred in semiarid areas of the La Mancha
plains, Ebro river basin and the south-eastern portion of the
Iberian Peninsula. Only endorheic basins of the La Mancha
plains (Ab1) showed extremely low NDVI-I-values with summer
maxima. EFTs with very high values of RREL (d) were associated
mainly with low values of NDVI-I (B) and with maxima from
late winter to late spring (3 and 4). Only the highest parts of the
Pyrenees, with a maximum in summer, had very high values of
RREL and relatively high values of NDVI-I (Cd1). Fourteen pix-
els on the shores of the major rivers showed the same pattern but
with an earlier maximum in spring (Cd4). Very low values of
RREL (a) were associated with high and very high NDVI-I-
values and with summer and autumn and early winter maxima
(1 and 2).
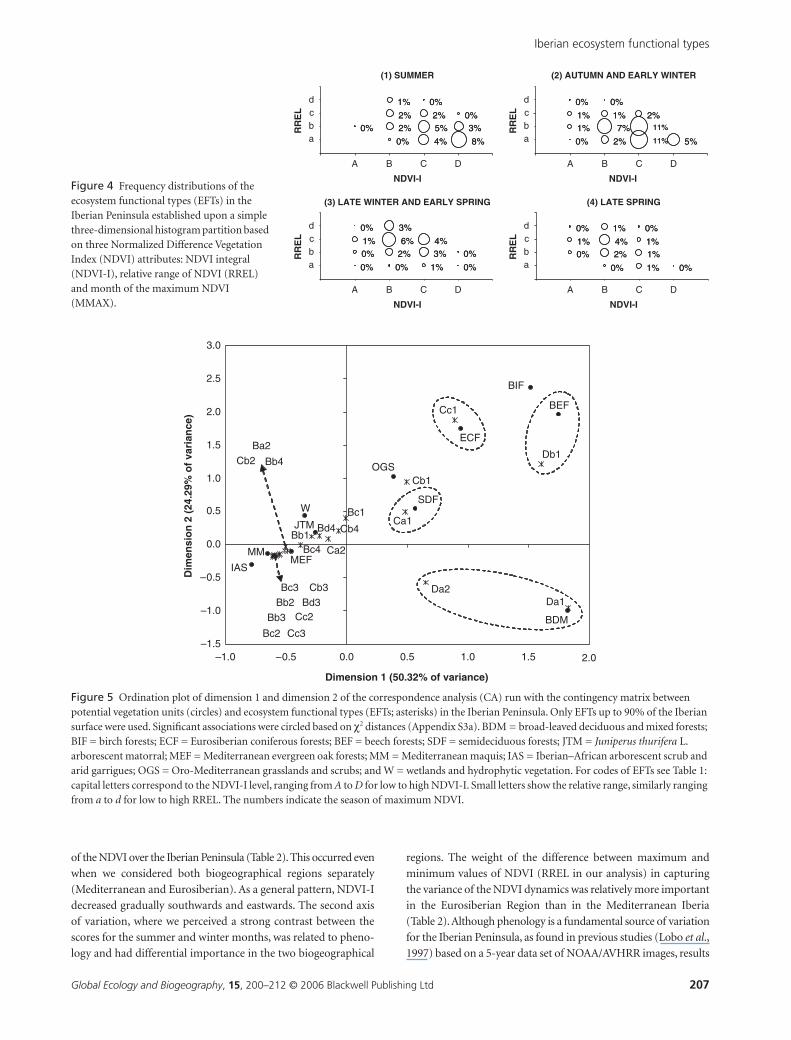
Those EFTs with a summer maximum (30% of the Peninsula)
tended to show high productivity and low seasonality (Fig. 4).
On the contrary, ecosystems with winter and early spring maxima
(17% of the Peninsula) tended to show low and medium productivity
Figure 2 Patterns of the Normalized Difference Vegetation Index (NDVI) attributes across the Iberian Peninsula: (a) NDVI Annual integral (NDVI-I), (b) annual relative range of NDVI (RREL), and (c) month of the maximum NDVI (MMAX).
D. Alcaraz et al.
206 Global Ecology and Biogeography, 15, 200–212 © 2006 Blackwell Publishing Ltd
and low to very high seasonality. A small proportion of ecosystems
had their maximum in spring (11% of the Peninsula) and tended
to have low values of NDVI-I and low to medium RREL. Autumn
and early winter maxima occurred in 42% of the territory and
had low RREL values and moderate to high productivity.
The first axis (dimension 1) of the CA ordination between
potential vegetation and EFTs accounted for 50.32% of total varia-
tion in the data. Productivity and bioclimate formed gradients
along dimension 1 (Fig. 5). Potential vegetation that scored low
(Iberian–African arborescent scrubs and arid garrigues, Mediter-
ranean maquis) was associated with low NDVI-I and Mediter-
ranean and arid conditions, while potential vegetation with high
scores (broad-leaved deciduous and mixed forests, beech forests,
birch forests) was associated with high NDVI-I and more humid
conditions of the Eurosiberian Region. The second axis (dimension
2) explained 24.29% of the variation. Seasonality formed a gradient
along dimension 2. This last gradient was discernible only for
high productive vegetation classes. Vegetation with low RREL
had low scores on dimension 2 (broad-leaved deciduous and
mixed forests) while those correlated with medium and high
RREL scored high (beech forests, birch forests, Eurosiberian
coniferous forests). Based on χ2 distances and the CA scatterplot
(Fig. 5, Appendix S3a in Supplementary Material), a partial cor-
respondence between some EFTs and potential vegetation types
was found. Da1 (χ2 = 2582) and Da2 (χ2 = 287) were associated
with broad-leaved deciduous and mixed forests; Db1 (χ2 = 1132)
with beech forests; Cc1 (χ2 = 379) with Eurosiberian coniferous
forests; and Ca1 (χ2 = 334) with semideciduous forests.
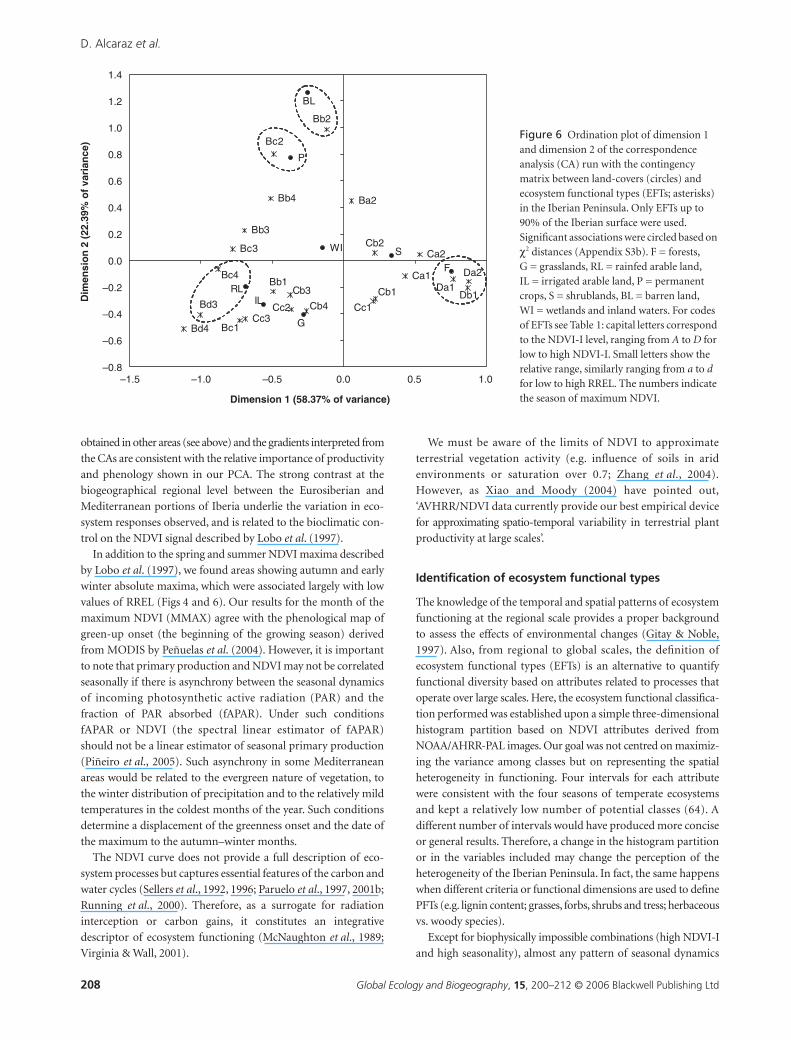
In the CA ordination between land-covers and EFTs, the first
axis (dimension 1) accounted for 58.37% of the total variation in
the data, and was related to a productivity gradient. Land-covers
with low scores (rainfed arable lands) were associated with low
NDVI-I, while land-covers with high scores (forests) were associated
with high NDVI-I. No discernible gradients along the second
axis (dimension 2) were present. The CA scatterplot and the χ2
distances between data points revealed the following narrow
correspondences between some EFTs and particular land-
uses (Fig. 6, Appendix S3b in Supplementary Material): Bc4
(χ2 = 173) and Bd3 (χ2 = 230) were associated with rainfed
arable land; Bc2 (χ2 = 49) with permanent crops; and Bb2 with
permanent crops (χ2 = 213) and barren land (χ2 = 324). As in the
CA between EFTs and potential vegetation, Da1 (χ2 = 247), Da2
(χ2 = 270) and Db1 (χ2 = 158) were related to forest land-cover.
DISCUSSION
Patterns of the NDVI traits in the Iberian Peninsula
As in other temperate areas (Townshend et al., 1985; Paruelo &
Lauenroth, 1995) the annual integral of NDVI, a surrogate of ANPP
that was correlated strongly with the first PCA axis in our data set,
accounted for most of the total variance in the annual dynamics
Figure 3 Ecosystem functional types (EFTs) for the Iberian Peninsula based on the NDVI dynamics. Only EFTs up to 90% of the Peninsula surface are shown.
Iberian ecosystem functional types
Global Ecology and Biogeography, 15, 200–212 © 2006 Blackwell Publishing Ltd 207
of the NDVI over the Iberian Peninsula (Table 2). This occurred even
when we considered both biogeographical regions separately
(Mediterranean and Eurosiberian). As a general pattern, NDVI-I
decreased gradually southwards and eastwards. The second axis
of variation, where we perceived a strong contrast between the
scores for the summer and winter months, was related to pheno-
logy and had differential importance in the two biogeographical
regions. The weight of the difference between maximum and
minimum values of NDVI (RREL in our analysis) in capturing
the variance of the NDVI dynamics was relatively more important
in the Eurosiberian Region than in the Mediterranean Iberia
(Table 2). Although phenology is a fundamental source of variation
for the Iberian Peninsula, as found in previous studies (Lobo et al.,
1997) based on a 5-year data set of NOAA/AVHRR images, results
Figure 4 Frequency distributions of the ecosystem functional types (EFTs) in the Iberian Peninsula established upon a simple three-dimensional histogram partition based on three Normalized Difference Vegetation Index (NDVI) attributes: NDVI integral (NDVI-I), relative range of NDVI (RREL) and month of the maximum NDVI (MMAX).
Figure 5 Ordination plot of dimension 1 and dimension 2 of the correspondence analysis (CA) run with the contingency matrix between potential vegetation units (circles) and ecosystem functional types (EFTs; asterisks) in the Iberian Peninsula. Only EFTs up to 90% of the Iberian surface were used. Significant associations were circled based on χ2 distances (Appendix S3a). BDM = broad-leaved deciduous and mixed forests; BIF = birch forests; ECF = Eurosiberian coniferous forests; BEF = beech forests; SDF = semideciduous forests; JTM = Juniperus thurifera L. arborescent matorral; MEF = Mediterranean evergreen oak forests; MM = Mediterranean maquis; IAS = Iberian–African arborescent scrub and arid garrigues; OGS = Oro-Mediterranean grasslands and scrubs; and W = wetlands and hydrophytic vegetation. For codes of EFTs see Table 1: capital letters correspond to the NDVI-I level, ranging from A to D for low to high NDVI-I. Small letters show the relative range, similarly ranging from a to d for low to high RREL. The numbers indicate the season of maximum NDVI.
D. Alcaraz et al.
208 Global Ecology and Biogeography, 15, 200–212 © 2006 Blackwell Publishing Ltd
obtained in other areas (see above) and the gradients interpreted from
the CAs are consistent with the relative importance of productivity
and phenology shown in our PCA. The strong contrast at the
biogeographical regional level between the Eurosiberian and
Mediterranean portions of Iberia underlie the variation in eco-
system responses observed, and is related to the bioclimatic con-
trol on the NDVI signal described by Lobo et al. (1997).
In addition to the spring and summer NDVI maxima described
by Lobo et al. (1997), we found areas showing autumn and early
winter absolute maxima, which were associated largely with low
values of RREL (Figs 4 and 6). Our results for the month of the
maximum NDVI (MMAX) agree with the phenological map of
green-up onset (the beginning of the growing season) derived
from MODIS by Peñuelas et al. (2004). However, it is important
to note that primary production and NDVI may not be correlated
seasonally if there is asynchrony between the seasonal dynamics
of incoming photosynthetic active radiation (PAR) and the
fraction of PAR absorbed (fAPAR). Under such conditions
fAPAR or NDVI (the spectral linear estimator of fAPAR)
should not be a linear estimator of seasonal primary production
(Piñeiro et al., 2005). Such asynchrony in some Mediterranean
areas would be related to the evergreen nature of vegetation, to
the winter distribution of precipitation and to the relatively mild
temperatures in the coldest months of the year. Such conditions
determine a displacement of the greenness onset and the date of
the maximum to the autumn–winter months.
The NDVI curve does not provide a full description of eco-
system processes but captures essential features of the carbon and
water cycles (Sellers et al., 1992, 1996; Paruelo et al., 1997, 2001b;
Running et al., 2000). Therefore, as a surrogate for radiation
interception or carbon gains, it constitutes an integrative
descriptor of ecosystem functioning (McNaughton et al., 1989;
Virginia & Wall, 2001).
We must be aware of the limits of NDVI to approximate
terrestrial vegetation activity (e.g. influence of soils in arid
environments or saturation over 0.7; Zhang et al., 2004).
However, as Xiao and Moody (2004) have pointed out,
‘AVHRR/NDVI data currently provide our best empirical device
for approximating spatio-temporal variability in terrestrial plant
productivity at large scales’.
Identification of ecosystem functional types
The knowledge of the temporal and spatial patterns of ecosystem
functioning at the regional scale provides a proper background
to assess the effects of environmental changes (Gitay & Noble,
1997). Also, from regional to global scales, the definition of
ecosystem functional types (EFTs) is an alternative to quantify
functional diversity based on attributes related to processes that
operate over large scales. Here, the ecosystem functional classifica-
tion performed was established upon a simple three-dimensional
histogram partition based on NDVI attributes derived from
NOAA/AHRR-PAL images. Our goal was not centred on maximiz-
ing the variance among classes but on representing the spatial
heterogeneity in functioning. Four intervals for each attribute
were consistent with the four seasons of temperate ecosystems
and kept a relatively low number of potential classes (64). A
different number of intervals would have produced more concise
or general results. Therefore, a change in the histogram partition
or in the variables included may change the perception of the
heterogeneity of the Iberian Peninsula. In fact, the same happens
when different criteria or functional dimensions are used to define
PFTs (e.g. lignin content; grasses, forbs, shrubs and tress; herbaceous
vs. woody species).
Except for biophysically impossible combinations (high NDVI-I
and high seasonality), almost any pattern of seasonal dynamics
Figure 6 Ordination plot of dimension 1 and dimension 2 of the correspondence analysis (CA) run with the contingency matrix between land-covers (circles) and ecosystem functional types (EFTs; asterisks) in the Iberian Peninsula. Only EFTs up to 90% of the Iberian surface were used. Significant associations were circled based on χ2 distances (Appendix S3b). F = forests, G = grasslands, RL = rainfed arable land, IL = irrigated arable land, P = permanent crops, S = shrublands, BL = barren land, WI = wetlands and inland waters. For codes of EFTs see Table 1: capital letters correspond to the NDVI-I level, ranging from A to D for low to high NDVI-I. Small letters show the relative range, similarly ranging from a to d for low to high RREL. The numbers indicate the season of maximum NDVI.
Iberian ecosystem functional types
Global Ecology and Biogeography, 15, 200–212 © 2006 Blackwell Publishing Ltd 209
of radiation interception is represented in the Iberian Peninsula.
The lack of an EFT with high productivity and seasonality (Dd)
reflects a physical constraint: if RREL is high, the ecosystem
must have a low NDVI during part of the year, which in turn
will reduce NDVI-I. On the other hand, an EFT with high pro-
ductivity and low seasonality (Da) requires a high and stable
NDVI throughout the year. For this reason, ANPP was the high-
est under low seasonality circumstances. This pattern occurred
under summer NDVI maxima in the lowest parts of the
Eurosiberian Region and in high Mediterranean mountains. It was
also observed in some parts of the Eurosiberian–Mediterranean
transition, the eastern Pyrenees and the western front of
the Peninsula between the Tajo and Duero rivers, but in this
case with autumn and early winter maxima. In addition, few
Mediterranean areas in the southwestern part of the Peninsula
were highly productive and barely seasonal. Mediterranean
evergreen oak forests of southwestern Iberian Peninsula (Sierra
del Aljibe), with relatively mild temperatures and under one
of the highest precipitation regimes of Iberia, showed similar
dynamics to subtropical ecosystems (Iguazú subtropical
forest: 26° S, 54° W) (Paruelo et al., 2001a; Garbulsky & Paruelo,
2004), not constrained by either low temperature or water
availability.
EFTs with low productivity always had moderate to high
seasonality, as in watered ecosystems or in the major river basins
and semiarid areas of southeastern Iberia. In these cases,
maximum values of NDVI were reached in summer and spring,
respectively. The remaining part of the Mediterranean Region
showed moderate productivity and seasonality and had maxima
mainly in the autumn and early winter months. This was very
common in the Mediterranean mountains.
Functional vs. structural ecosystem classifications
We did not attempt to assimilate the functional classes to the
structural ones. Different potential vegetation and land-cover
types had the same NDVI dynamics and, conversely, there were
different functional dynamics within the same potential vegeta-
tion or land-cover unit. Most of the Iberian vegetation has
been profoundly modified, so the lack of a total correspondence
between functional and potential vegetation categories may
simply reflect the difference between potential and current vege-
tation. It is also possible that some EFTs represent transitions
between, rather than typical examples of, different vegetation
units, or that several of the functional types defined here were
part of a larger or smaller potential vegetation unit at a different
aggregation level. Functional and structural classification schemes
differed in the criteria used to define the level of aggregation of
the units and to set boundaries between them. In this sense,
the definition of boundaries between classes, either structural or
functional, may change because of the observation protocol,
i.e. seasonal dynamics of NDVI vs. vegetation physiognomy or
land-cover (Allen & Hoekstra, 1992), setting a limit to the total
correspondence between both descriptions. On the other hand,
while we used the same aggregation criteria in classifying every
pixel, the aggregation level varies among potential vegetation
types. Also, remote sensing-based EFTs avoided scaling-up
local observations to the region (Paruelo et al., 2001a) and did
not rely on models of the relationship between structural
attributes and environmental features (bioclimate, soils etc.),
scarcely tested at regional scale (e.g. Nielson et al., 1992; but see
Stephenson, 1990).
Nevertheless, results from the CAs discriminated the import-
ance of both potential vegetation and land-use in explaining the
functioning of particular ecosystems and some narrow corre-
spondences were found. EFTs Da1, Db1, Da2, Ca1 and Cc1, 22%
of the Iberian Peninsula surface, were associated with potential
vegetation, which indicates a higher bioclimatic control over the
functioning of these areas. Conversely, human land-uses were
more important in explaining the functioning of EFTs Bb2, Bc2, Bc4
and Bd3, 15% of the Iberian surface. Modification of ecosystem
functioning is a well-described consequence of human land
use in many areas of the world (e.g. Paruelo et al., 2001; Williams
et al., 2004), and has been associated frequently with an increase
in seasonality (Paruelo et al., 2001b; Guerschman et al., 2003). In
fact, agricultural land-uses of Iberia were related to EFTs with
intermediate NDVI-I and high RREL.
As stated above, the definition of EFTs is dependent on the
variables included. Remote sensing may provide additional func-
tional variables to improve ecosystem descriptions (Nemani &
Running, 1997). Shortwave albedo and surface temperature, two
variables linked closely to the exchange of energy of the ecosystem,
may provide a complementary description to the one presented here,
based on the seasonal dynamics of carbon gains (e.g. Piñeiro
et al., 2002; Garbulsky & Paruelo, 2004). Besides, the integration
of dissimilar phenological cycles from different PFTs or vegeta-
tion components occurring in an AVHRR-PAL pixel may be
responsible for the observed NDVI dynamics (Schmidt &
Karnieli, 2000). In spite of the spatial heterogeneity of Iberia, the
NOAA/AVHRR-PAL data set provided a functional classification
that retained ecological meaning. However, a more detailed study
based on AVHRR-LAC or MODIS imagery will provided a more
in-depth characterization of ecosystem functioning and its rela-
tionship with dominant PFTs, potential vegetation, bioclimate
and land-use.
ACKNOWLEDGEMENTS
The authors are grateful to Dr Pablo Marquet and two anonymous
reviewers for their useful comments that improved this paper
significantly. We thank Gervasio Piñeiro, Martín Garbulsky, Juan
Pablo Guerschman, Esteban Jobbagy and Cecilio Oyonarte for
useful discussions and comments. Junta de Andalucía (FPDI
2000, BOJA 140/2000), University of Almería, Proyecto Estratégico
of the University of Buenos Aires, CONICET and FONCYT
provided financial support. Satellite data were provided by
the Earth Observing System Data and Information System,
Distributed Active Archive Center at Goddard Space Flight
Center (NASA’s Mission to Planet Earth in cooperation with
NOAA). The PELCOM land-cover database was provided by the
European Environmental Agency. We acknowledge Ian Tasker
for the English revision.
D. Alcaraz et al.
210 Global Ecology and Biogeography, 15, 200–212 © 2006 Blackwell Publishing Ltd
REFERENCES
Aber, J.D., Burke, I.C., Acock, B., Bugmann, H.K.M., Kabat, P.,
Menaut, J.C., Noble, I.R., Reynolds, J.F., Steffen, W.L. & Wu, J.
(1999) Group report: hydrological and biogeochemical processes
in complex landscapes — what is the role of temporal and
spatial ecosystem dynamics? Integrating hydrology, ecosystem
dynamics and biogeochemistry in complex landscapes (ed. by J.D.
Tenhunen and P. Kabat), pp. 335–356. John Wiley & Sons, Berlin.
Allen, T.F.H. & Hoekstra, T.W. (1992) Toward a unified ecology.
Columbia University Press, New York.
Arribas, A., Gallardo, C., Gaertner, M.A. & Castro, M. (2003)
Sensitivity of the Iberian Peninsula climate to a land degrada-
tion. Climate Dynamics, 20, 477–489.
Azzali, S. & Menenti, M. (1999) Mapping isogrowth zones on
continental scale using temporal Fourier analysis of AVHRR-
NDVI data. International Journal of Applied Earth Observation
and Geoinformation, 1, 9–20.
Calvao, T. & Palmeirim, J.M. (2004) Mapping Mediterranean
scrub with satellite imagery: biomass estimation and spectral
behaviour. International Journal of Remote Sensing, 25, 3113–
3126.
Costa, J.C., Aguiar, C., Capelo, J.H., Lousa, M. & Neto, C. (1998)
Biogeografia de Portugal continental. Quercetea, 1, 5–56.
Costanza, R., d’Arge, R., de Groot, R., Farber, S., Grasso, M.,
Hannon, B., Limburg, K., Naeem, S., O’Neill, R.V. & Paruelo, J.
(1997) The value of the world’s ecosystem services and natural
capital. Nature, 387, 253–260.
Díaz, S. & Cabido, M. (1997) Plant functional types and ecosystem
function in relation to global change. Journal of Vegetation
Science, 8, 463–474.
Díaz, S. & Cabido, M. (2001) Vive la différence: plant functional
diversity matters to ecosystem processes. Trends in Ecology &
Evolution, 16, 646–655.
Falge, E., Baldocchi, D., Tenhunen, J., Aubinet, M., Bakwin, P.,
Berbigier, P., Bernhofer, C., Burba, G., Clement, R., Davis, K.J.,
Elbers, J.A., Goldstein, A.H., Grelle, A., Granier, A.,
Guomundsson, J., Hollinger, D., Kowalski, A.S., Katul, G.,
Law, B.E., Malhi, Y., Meyers, T., Monson, R.K., Munger, J.W.,
Oechel, W., Paw, K.T., Pilegaard, K., Rannik, U., Rebmann, C.,
Suyker, A., Valentini, R., Wilson, K. & Wofsy, S. (2002) Season-
ality of ecosystem respiration and gross primary production
as derived from FLUXNET measurements. Agricultural and
Forest Meteorology, 113, 53–74.
Fensholt, R., Sandholt, I. & Rasmussen, M.S. (2004) Evaluation
of MODIS LAI, fAPAR and the relation between fAPAR and
NDVI in a semi-arid environment using in situ measurements.
Remote Sensing of Environment, 91, 490–507.
Filella, I., Peñuelas, J., Llorens, L. & Estiarte, M. (2004) Reflect-
ance assessment of seasonal and annual changes in biomass
and CO2 uptake of a Mediterranean shrubland submitted to
experimental warming and drought. Remote Sensing of Environ-
ment, 90, 308–318.
Garbulsky, M.F. & Paruelo, J.M. (2004) Remote sensing of
protected areas to derive baseline vegetation functioning char-
acteristics. Journal of Vegetation Science, 15, 711–720.
Gitay, H. & Noble, I.R. (1997) What are functional types and how
should we seek them? Plant functional types. Their relevance
to ecosystem properties and global change (ed. by T.M. Smith,
H.H. Shugart and F. I. Woodward), pp. 3–19. Cambridge Univer-
sity Press, Cambridge.
González-Alonso, F., Cuevas, J.M., Calle, A., Casanova, J.L. &
Romo, A. (2004) Spanish vegetation monitoring during the
period 1987–2001 using NOAA-AVHRR images. International
Journal of Remote Sensing, 25, 3–6.
Guerschman, J.P., Paruelo, J.M. & Burke, I.C. (2003) Land use
impacts on the Normalized Difference Vegetation Index in
temperate Argentina. Ecological Applications, 13, 616–628.
Hoare, D. & Frost, P. (2004) Phenological description of natural
vegetation in southern Africa using remotely-sensed vegeta-
tion data. Applied Vegetation Science, 7, 19–28.
James, M.E. & Kalluri, S.N.V. (1994) The Pathfinder AVHRR
Land Data Set — an improved coarse resolution data set for
terrestrial monitoring. International Journal of Remote Sensing,
15, 3347–3363.
Körner, C. (1994) Scaling from species to vegetation: the useful-
ness of functional groups. Biodiversity and ecosystem function
(ed. by E.D. Schulze and H.A. Mooney), pp. 117–139.
Springer-Verlag, Berlin.
Lloyd, D. (1989) A phenological description of Iberian vegeta-
tion using short wave vegetation index imagery. International
Journal of Remote Sensing, 10, 827–833.
Lloyd, D. (1990) A phenological classification of terrestrial vege-
tation cover using shortwave vegetation index imagery. Inter-
national Journal of Remote Sensing, 11, 2269–2279.
Lobo, A., Ibáñez, J.J. & Carrera, C. (1997) Regional scale
hierarchical classification of temporal series of AVHRR
vegetation index. International Journal of Remote Sensing, 18,
3167–3193.
McNaughton, S.J., Oesterheld, M., Frank, D.A. & Williams, K.J.
(1989) Ecosystem-level patterns of primary productivity and
herbivory in terrestrial habitats. Nature, 341, 142–144.
Milchunas, D.G. & Lauenroth, W.K. (1995) Inertia in plant
community structure: State changes after cessation of
nutrient enrichment stress. Ecological Applications, 5,
1195–2005.
Montero de Burgos, J.L. & González-Rebollar, J.L. (1983) Dia-
gramas bioclimáticos. Instituto para la Conservación de la Nat-
uraleza, Madrid.
Mueller-Dombois, D. & Ellenberg, H. (1974) Aims and methods
of vegetation ecology. John Wiley & Sons, New York.
Nemani, R.R. & Running, S.W. (1997) Land cover characteriza-
tion using multitemporal red, near-IR, and thermal-IR data
from NOAA/AVHRR. Ecological Applications, 7, 79–90.
Nielson, R.P., King, G.A. & Koerper, G. (1992) Toward a rule-
based biome model. Landscape Ecology, 7, 27–43.
Noble, I.R. & Gitay, H. (1996) A functional classification for
predicting the dynamics of landscapes. Journal of Vegetation
Science, 7, 329–336.
Oesterheld, M., DiBella, C.M. & Kerdiles, H. (1998) Relation
between NOAA-AVHRR satellite data and stocking rate of
rangelands. Ecological Applications, 8, 207–212.
Iberian ecosystem functional types
Global Ecology and Biogeography, 15, 200–212 © 2006 Blackwell Publishing Ltd 211
Paruelo, J.M., Burke, I.C. & Lauenroth, W.K. (2001b) Land-use
impact on ecosystem functioning in eastern Colorado, USA.
Global Change Biology, 7, 631–639.
Paruelo, J.M., Epstein, H.E., Lauenroth, W.K. & Burke, I.C.
(1997) ANPP estimates from NDVI for the Central Grassland
Region of the United States. Ecology, 78, 953–958.
Paruelo, J.M., Jobbágy, E.G. & Sala, O.E. (2001a) Current distri-
bution of ecosystem functional types in temperate South
America. Ecosystems, 4, 683–698.
Paruelo, J.M. & Lauenroth, W.K. (1995) Regional patterns of
Normalized Difference Vegetation Index in North American
shrublands and grasslands. Ecology, 76, 1888–1898.
Peñuelas, J. & Boada, M. (2003) A global change-induced biome
shift in the Montseny mountains (NE Spain). Global Change
Biology, 9, 131–140.
Peñuelas, J., Filella, I., Zhang, X.Y., Llorens, L., Ogaya, R., Lloret,
F., Comas, P., Estiarte, M. & Terradas, J. (2004) Complex spati-
otemporal phenological shifts as a response to rainfall changes.
New Phytologist, 161, 837–846.
Pettorelli, N., Vik, J.O., Mysterud, A., Gaillard, J.M., Tucker, C.J.
& Stenseth, N.C. (2005) Using the satellite-derived NDVI to
assess ecological responses to environmental change. Trends in
Ecology & Evolution, 20, 503–510.
Piñeiro, G., Alcaraz, D., Paruelo, J.M., Oyonarte, C., Guer-
schman, J.P., Escribano, P. & Cabello, J. (2002) A functional
classification of natural and human-modified areas of ‘Cabo de
Gata’, Spain, based on Landsat TM data. 29th International
Symposium of Remote Sensing of Environment, 8–12 April.
Buenos Aires, Argentina.
Piñeiro, G., Oesterheld, M. & Paruelo, J.M. (2005) Seasonal
variation of aboveground production and radiation use
efficiency of temperate rangelands estimated through remote
sensing. Ecosystems, in press.
Potter, C.S. & Brooks, V. (1998) Global analysis of empirical rela-
tions between annual climate and seasonality of NDVI. Inter-
national Journal of Remote Sensing, 19, 2921–2948.
Reynolds, J.F. & Wu, J. (1999) Do landscape structural and
functional units exist? Integrating hydrology, ecosystem
dynamics and biogeochemistry in complex landscapes (ed. by
J.D. Tenhunen and P. Kabat), pp. 273–296. John Wiley &
Sons, Berlin.
Ricotta, C., Avena, G. & De Palma, A. (1999) Mapping and mon-
itoring net primary productivity with AVHRR NDVI time-
series: statistical equivalence of cumulative vegetation indices.
ISPRS Journal of Photogrammetry and Remote Sensing, 54,
325–331.
Rivas-Martínez, S. (1987) Mapa de series de vegetación de España
1: 400,000 y Memoria. ICONA, Madrid.
Rivas-Martínez, S., Lousa, M., Díaz, T.E., Fernández-González, F.
& Costa, M. (1990) La vegetación del sur de Portugal (Sado,
Alentejo y Algarve). Itinera Geobotanica, 3, 5–126.
Running, S.W., Thornton, P.E., Nemani, R.R. & Glassy, J.M.
(2000) Global terrestrial gross and net primary productivity
from the earth observing system. Methods in ecosystem science
(ed. by O.E. Sala, R.B. Jackson, H.A. Mooney and R.W.
Howarth), pp. 44–57. Springer-Verlag, New York.
Schmidt, H. & Karnieli, A. (2000) Remote sensing of the seasonal
variability of vegetation in a semi-arid environment. Journal of
Arid Environments, 45, 43–59.
Scholes, R.J., Pickett, G., Ellery, W.N. & Blackmore, A.C. (1997)
Plant functional types in African savannas and grasslands.
Plant functional types: their relevance to ecosystem properties and
global change (ed. by T.M. Smith, H.H. Shugart and F.I. Wood-
ward), pp. 255–268. Cambridge University Press, Cambridge.
Sellers, P.J., Berry, J.A., Collatz, G.J., Field, C.B. & Hall, F.G.
(1992) Canopy reflectance, photosynthesis, and transpiration.
III. A reanalysis using improved leaf models and a new canopy
integration scheme. Remote Sensing of Environment, 42, 187–
216.
Sellers, P.J., Randall, D.A., Collatz, G.J., Berry, J.A., Field, C.B.,
Dazlich, D.A., Zhang, C., Collelo, G.D. & Bounoua, L. (1996)
A revised land surface parameterization (SiB2) for atmos-
pheric GCMs. Part I: Model formulation. Journal of Climate, 9,
676–705.
Shoshany, M. (2000) Satellite remote sensing of natural Mediter-
ranean vegetation: a review within an ecological context.
Progress in Physical Geography, 24, 153–178.
Shugart, H.H. (1997) Plant and ecosystem functional types.
Plant functional types: their relevance to ecosystem properties
and global change (ed. by T.M. Smith, H.H. Shugart and
F.I. Woodward), pp. 20–45. Cambridge University Press,
Cambridge.
Steneck, R.S. (2001) Functional groups. Encyclopedia of biodiver-
sity (ed. by S.A. Levin), pp. 121–139. Academic Press, San
Diego.
Stephenson, N.L. (1990) Climatic control of vegetation distribu-
tion: the role of the water balance. American Naturalist, 135,
649–670.
Stoms, D.M. & Hargrove, W.W. (2000) Potential NDVI as a base-
line for monitoring ecosystem functioning. International Jour-
nal of Remote Sensing, 21, 401–407.
Sumner, G.N., Romero, R., Homar, V., Ramis, C., Alonso, S. &
Zorita, E. (2003) An estimate of the effects of climate change
on the rainfall of Mediterranean Spain by the late twenty-first
century. Climate Dynamics, 20, 789–805.
Townshend, J.R.G., Goff, T.E. & Tucker, C.J. (1985) Multitemporal
dimensionality of images of normalized difference vegetation
index at continental scales. IEEE Transactions on Geoscience
and Remote Sensing, 23, 888–895.
Tucker, C.J. & Sellers, P.J. (1986) Satellite remote-sensing of pri-
mary production. International Journal of Remote Sensing, 7,
1395–1416.
Valentini, R., Baldocchi, D.D. & Tenhunen, J.D. (1999) Ecological
controls on land–surface atmospheric interactions. Integrating
hydrology, ecosystem dynamics and biogeochemistry in complex
landscapes (ed. by J.D. Tenhunen and P. Kabat), pp. 105–116.
John Wiley & Sons, Berlin.
Valle, F., Algarra, J.A., Arrojo, E., Asensi, A., Cabello, J., Cano, E.,
Cañadas, E.M., Cueto, M., Dana, E., De Simón Navarrete, E.,
Díez-Garretas, B., García-Fuentes, A., Giménez, E., Gómez-
Mercado, F., Jiménez Morales, M.N., Linares, J.E., Lorite, J.,
Melendo, M., Montoya, M.C., Mota, J., Navarro, F.B., Peñas, J.,
D. Alcaraz et al.
212 Global Ecology and Biogeography, 15, 200–212 © 2006 Blackwell Publishing Ltd
Salazar, C. & Torres, J.A. (2003) Mapa de Series de Vegetación
de Andalucía. Editorial Rueda, Madrid.
Vicente-Serrano, S.M. & Heredia-Laclaustra, A. (2004) NAO
influence on NDVI trends in the Iberian Peninsula (1982–
2000). International Journal of Remote Sensing, 25, 2871–
2879.
Virginia, R.A. & Wall, D.H. (2001) Principles of ecosystem
function. Encyclopedia of biodiversity (ed. by S.A. Levin),
pp. 345–352. Academic Press, San Diego.
Vitousek, P.M., Mooney, H.A., Lubchenco, J. & Melillo, J.M.
(1997) Human domination of Earth’s ecosystems. Science, 277,
494–499.
Walker, B.H. (1997) Functional types in non-equilibrium eco-
systems. Plant functional types: their relevance to ecosystem
properties and global change (ed. by T.M. Smith, H.H. Shugart
and F.I. Woodward), pp. 91–103. Cambridge University Press,
Cambridge.
Wang, Q., Tenhunen, J., Dinh, N.Q., Reichstein, M., Vesala, T. &
Keronen, P. (2004) Similarities in ground- and satellite-based
NDVI time series and their relationship to physiological activ-
ity of a Scots pine forest in Finland. Remote Sensing of Environ-
ment, 93, 225–237.
Williams, J.W., Seabloom, E.W., Slayback, D.A., Stoms, D.M. &
Viers, J.H. (2005) Anthropogenic impacts upon plant species
richness and net primary productivity in California. Ecology
Letters, 8, 127–137.
Wu, J., Jenerette, G.D. & David, J.L. (2003) Linking land-use
change with ecosystem processes: a hierarchical patch dynamic
model. Integrated land use and environmental models (ed. by
S. Guhathakurta), pp. 99–119. Springer, Berlin.
Xiao, J. & Moody, A. (2004) Photosynthetic activity of US
biomes: responses to the spatial variability and seasonality of
precipitation and temperature. Global Change Biology, 10,
437–451.
Zhang, X., Friedl, M.A., Schaaf, C.B. & Strahler, A.H. (2004) Cli-
mate controls on vegetation phenological patterns in northern
mid- and high latitudes inferred from MODIS data. Global
Change Biology, 10, 1133–1145.
Editor: Pablo Marquet
SUPPLEMENTARY MATERIAL
The following material is available online at www.blackwell-
synergy.com/loi/geb
Appendix S1 The three Normalized Difference Vegetation Index
(NDVI) attributes employed in the functional characterization of
the Iberian Peninsula ecosystems (NDVI-I, RREL and MMAX).
Appendix S2 Main potential vegetation types of the Iberian
Peninsula.
Appendix S3 Results of the correspondence analyses (CA)
carried out between ecosystem functional types (EFTs) and
(a) potential vegetation and (b) land covers.
BIOSKETCHES
Domingo Alcaraz Segura is a PhD candidate interested
in the study of the functioning of ecosystems and the
impacts of human activities upon them using remote
sensing and GIS. At present he receives a grant from the
Andalusian Government at the University of Almería.
Dr José M. Paruelo is the head of the Regional Analysis
and Remote Sensing Laboratory of the College of
Agronomy, professor in ecology at UBA and staff scientist
of the National Research Council of Argentina
(CONICET). His research interests focus on regional
ecological analysis, land use impacts on ecosystem
functioning and water dynamics in arid ecosystems.
Dr Javier Cabello is a lecturer in conservation biology at
the University of Almería and member of the research
group Ecología de Zonas Áridas. He is interested in
assessing the impacts of human activities on biodiversity
and in the design and monitoring of protected areas.