The Globalization of Knowledge in the Iberian Colonial World
Upload
independentCategory
view
0download
0
E L S E V I E R Palaeogeography, Palaeoclimatology, Palaeoecology 112 (1994) 297-322
PglAE0-
Biostratigraphy and palaeobiogeography of East Africa and the Iberian peninsula.
Martin Pickford a, Jorge Morales b
" Geological Survey ofNamibia, P.O. Box 2168, Windhoek 9000, Namibia b Departamento de Paleobiologia, Museo Nacional de Ciencias Naturales, Josk Gutidrrez Abascal, 2, 28006 Madrid, Spain
Received 26 July 1993; revised and accepted 20 April 1994
Abstract
The aim of this paper is to examine the mammalian faunas of the Neogene of Spain and of East Africa with a view to understanding the relationships between the Neogene faunas of the two regions. The available data indicates that during the Neogene, faunal similarities between Iberia and East Africa varied greatly, at times the resemblances being relatively great (high number of genera in common), at others the similarities being weak (low number of genera in common). Changes in faunal similarity appear to be related to latitudinal fluctuations in the position of the boundaries of the Proto-Ethiopian and Proto-Palaearctic zoogeographic realms. Periods of greater faunal similarity coincide with a northerly position of the boundary zone, while periods of greater faunal dissimilarity occur when the boundary zone is located in a southerly position, as it is today. We related these changes in the position of the boundary zone between zoogeographic realms to geotectonic, climatic and astronomic changes which affected the globe.
1. Introduction
Biostratigraphy and palaeobiogeography use the same data base: fossils. The former discipline accents the time dimension whereas the latter concentrates on the space dimension, but both are interdependent to a great degree, since each depends upon comparisons of palaeobiological data sets from two or more areas and time periods. One often sees in the literature discussions on biostratigraphic correlations within an area, a lim- ited time period or a single mammal group (see Azzaroli et al., 1988 and Thomas, 1984 as exam- pie), but seldom does one see a close comparison of the palaeobiologic histories of two or more regions that lie within different biogeographic realms. This is understandable when one considers that in general, the faunal similarities between different biogeographic realms tend to be weakly
0031-0182/94/$7.00 © 1994 Elsevier Science B.V. All rights reserved SSDI 0031-0182 (94) 00042-7
expressed, making faunal comparisons lean or difficult. However, some groups of large mammals, such as carnivores, tend to be cosmopolitan and therefore occur in several biogeographic realms, providing possibilities for faunal correlation. But of more interest is the observation that biogeo- graphic realms are dynamic entities. Their bound- aries are not geographically fixed and neither are their faunal contents rigidly confined within them.
2. Biogeographic background
Boundary zones between biogeographic realms are precisely that: zones. They are l eaky- -an imals and plants can and do cross from realm to realm, especially over geological time spans - -a l though the bulk of taxa within any particular realm appears to remain faithful to that realm. Over geological time spans, boundary zones between biogeographic realms shift about on the surface of

298 M. Pickford, J. Morales/Palaeogeography, Palaeoclirnatology, Palaeoecology 112 (1994) 297-322
the globe, the principal displacement vector being latitudinal. This is because the primary signal in biogeographic realms is itself latitudinal in origin, the realms being biological expressions of two factors, both of which are due to Earth/Sun rela- tionships. Firstly, because the Earth is a rotating sphere that orbits round an energy source--the Sun--there is differential receipt of solar energy at the earth's surface, maximum quantities being absorbed by each square meter at the equator and minimum quantities at the poles of rotation. Secondly, because the axis of rotation of the Earth is inclined at a steep angle to its orbital plane, the zone of maximal receipt of solar energy shifts latitudinally on the surface of the globe. As the spinning Earth orbits round the Sun, alternatively its north pole or its south pole are leaning towards the Sun. Maximal receipt of solar energy in the northern hemisphere occurs when the north pole of rotation is facing towards the Sun, whereas maximal receipt of energy in the southern hemi- sphere occurs when the south pole of rotation faces towards the Sun. These annual latitudinal shifts in the position of maximal energy receipt at the Earth's surface are responsible for the phenom- enon of seasonality.
In high latitudes, temperature and day length fluctuations are the strongest signals to emerge from the myriad of seasonality signatures that exist. Humidity fluctuations occur but are generally less marked. Thus seasonality in high latitudes is overwhelmed by day length and temperature changes, the seasons alternating predominantly between cold (winter) and hot (summer) (Fig. 1). Many plants and animals show primary adapta- tions to cope with such fluctuations. Highly mobile species such as birds and bats have evolved migra- tory behaviour, the migrations being triggered by changes in day length. Less mobile species such as polar bears and arctic hares have evolved hiberna- tion behaviours, which are also triggered by day length changes. In general, in the high latitudes,re- production is timed to coincide with the warmer-- summer and autumn--periods.
In low latitudes in contrast, day length and annual temperature fluctuations are minor, but humidity fluctuations are usually important, with the result that seasonality in the tropics tends to be dominated by wet/dry alternations (Fig. 1). Many animals living
in the tropics have evolved strategies to cope with such wet/dry seasonality. Some species aestivate and many of them time their reproduction to coincide with the onset of wet seasons.
Animal species attempting to cross from a tropi- cal to a boreal zone or viceversa may physically be able to do so, but they seldom survive there unless they can change their reproductive strategies to coincide with the type of seasonality which characterises the regions which they are colonising. As individuals, zoo animals, for example, appear to do quite well if properly looked after, despite the very different seasonality that can occur in their foreign homes. What they are unable to do unless special care is taken on the part of the zoo keepers, is to maintain their numbers by reproduc- ing. It is a difficult matter for a specie to change its reproductive cycle to coincide with a cold/warm cycle if its primary adaptation was to a wet/dry cycle. This is because timing of reproduction in boreal species is often triggered by day length changes which are read by the pineal gland which in turn triggers hormonal controls within the body. Reproduction in wet/dry seasonality regions are triggered by humidity levels, food abundance and food type among others. Species that occur in several zoogeographic realms--pandemic to cos- mopolitan taxa--such as many kinds of carni- vores, tend to be reproductively flexible and their food sources are much the same in the different realms. Species which are confined to single zoo- geographic realms--endemic taxa--are often her- bivores with reproductive cycles closely tied in to wet/dry or cold/warm seasonality, as the case may be. Furthermore, because of the major differences between tropical and boreal plant communities and biomass productivity through the year, herbi- vore communities often show a marked latitudi- nally controlled distribution pattern. The most obvious example of this phenomenon is the bound- ary zone between the Oriental and Palaearctic realms in South East Asia. Here there are no physical geographic barriers to keep the Palaearctic and Oriental species apart. Instead, it is the major difference in kind of seasonality that does so hot/cold to the north of the boundary zone, wet/dry to the south of it.
For these and other reasons, species tend to remain within their biogeographic realms, some of

M. Pickford, J. Morales/Palaeogeography, Palaeoclimatology, Palaeoecology 112 (1994) 297-322
.............. "." "9"':::::::="'~"" ........... 30 ° E . . . . , . . .
e - ~ o*c °*~1 I L a t i t u d e , ,
3 0 ° S 0 ° :30 ° N 6 0 ° N
299
wet/dry seasonality ~ /
~reeze
L a t i t u d e I i
30 ° S 0 °
w i n t e r / s u m m e r s e a s o n s
i i
3 0 * N 6 0 0 N
300C
OoC
23 °
30" E I
~ l souhtherly oosition I
Fig. 1. Main distinguishing features of the Palaearctic and Ethiopian Biogeographic Realms and the boundary zone between them.
them even over geological time periods. But because the boundary zones can and do move and because not all lineages are strictly confined to their realm, specific areas of the globe can experi- ence faunal changes which implicate species from neighbouring biogeographic realms. Occasionally in the geological column, one may note a period during which there was a relatively large number of new lineages colonising a region from an adja-
cent realm, at other times fewer. For example, if the Ethiopian genus Hippopotamus occurs in a deposit in Europe, it is often found alongside other Ethiopian taxa such as hyaenas and lions. Such colonisations of regions which are normally Palaearctic by essentially tropical species are usu- ally of short duration, with the tropical species soon going extinct in their high latitude home. However, some lineages do manage to adapt to

300 M. Pickford, J. Morales/Palaeogeography, Palaeoclirnatology, Palaeoecology 112 (1994) 297-322
conditions in their new regions so well that they become intimate elements of their new realm. The woolly mammoths and rhinos of the Pleistocene of Eurasia represent such lineages, but even these species did not last at high latitudes for extended periods of geological time. Understanding the dynamics of such invasions and extinctions is greatly enhanced if the fossil records of neighbour- ing zoogeographic regions are well documented. Comparisons between the faunal histories of the two such regions can yield substantially more evidence of the details of the processes and timing of faunal interchanges than can parochial examina- tions of faunal history carried out in each area in isolation from the other.
The reliablity and viability of long distance biostratigraphic correlations greatly depends upon the completeness of the faunal successions being compared. While a few "key" taxa, such as the equids Anchitherium, Hipparion and Equus have traditionally been considered to define useful biostratigraphic datum events in the Old World, it is generally accepted that entire faunas provide a more acceptable sense of correlation, because the spread of individual taxa across vast geographic distances containing varied biotopes, can be mark- edly diachronic. In this study we compare late Neogene faunas from two relatively compact parts of the Old World, Spain (___ 40°N latitude) and East Africa (+ Equatorial), which have been well studied and which have yielded comparatively complete successions of mammalian faunas. Microfaunal remains have proved to be inadequate for the purposes of correlating between East Africa and Spain, on account of their rarity in most of the East African fossil collections. Furthermore, the few East African sites rich in micromammals contain taxa which have not been recorded from Spain, indicating that the zoogeographic ranges of micromammals tended to be more restricted than were those of large mammals, many of which occur in both study regions.
3. Data base The data upon which this study is based consists
of the large mammal fossils recovered from numer- ous localities in East Africa and Spain spanning the time period 22.5 Ma to the Holocene. A deep personal knowledge of the East African (MP) and
Spanish (JM) Neogene faunas, together with a good knowledge of the faunas of other regions of the Old World and the sites from which they came means that the authors are pooling extensive geolo- gical and palaeontological personal observations made over the past two decades. Most of the fossil taxa mentioned here have been examined by the authors in the belief that this is the only really solid foundation upon which to base biostrati- graphic correlations. Uncritical garnering of species and generic names from published sources is fraught with problems and quickly renders syn- thetic works based solely or predominantly on the literature, doubtful to worthless.
In East Africa, MP has examined over 500 fossil localities which have yielded in excess of 100,000 fossils spanning the late Neogene and Quaternary periods, belonging to more than 215 genera. In Spain, JM has worked at more than 200 fossil sites and has examined approximately 60,000 fos- sils belonging to more than 185 genera. In total, some 365 genera are included in this study (Table 1). In East Africa and Spain there are about 73 and 21 extant large mammal genera respectively (numbers vary from author to author). The figures for fossil genera look reasonably com- plete by comparison, although there is little doubt that new discoveries will be made in both regions. In addition, both authors have visited numerous museums in Europe, North America, the Indian Subcontinent and Africa for the purposes of making comparative studies of fossils. A further point which we consider to be important in biostra- tigraphy, is that both authors have studied several different groups of mammals in depth and thus have a first hand knowledge of several of the biostratigraphically important groups and a good working knowledge of the overall faunas for the time periods and regions being studied.
Table 2a-g are lists of taxa examined together with their known distribution in time within Spain and East Africa. While it is evident that there are some gaps in our knowledge, it is clear that the data base is sufficiently comprehensive for the purposes of this review. Figs. 2 and 3 provide the chronological positions of the main localities which have yielded fossils in East Africa and Spain. The East African sites are in many cases positioned on the basis of radio-isotopic dating, stratigraphy

M. Pickford, J. Morales/Palaeogeography, Palaeoclimatology, Palaeoecology 112 (1994) 297-322 301
Table 1 Generic diversity and main zoogeographic atfmities of the Neogene large mammal families from East Africa and Spain
Family Spain Both E Africa Main zoogeographic affinities of family
Arctocyonidae 0 0 1 Not clear Teratodontidae 0 0 1 Ethiopian Hyaenodontidae 1 1 7 Tropical Amphicyonidae 8 2 2 Palaearctic Canidae 4 2 8 Cosmopolitan Ursidae 8 2 2 Palaearctic Mustelidae 22 4 15 Palaearctic (cosmopolitan) Nimravidae 2 0 0 Palaearctic Viverridae 5 3 21 Tropical Hyaenidae 11 3 6 Tropical (cosmopolitan) Cryptoproctidae 1 1 3 Not clear Felidae 15 5 7 Cosmopolitan Hominoidea 4 1 15 Ethiopian Cercopithecidae 4 1 13 Ethiopian Lorisidae 0 0 4 Ethiopian Proboscidea 7 5 14 Tropical (cosmopolitan) Deinotheru'dae 2 2 2 Tropical Hyracoidea 1 0 8 Ethiopian Orycteropodidae 0 0 3 Ethiopian Manidae 1 1 1 Tropical Chalicotheriidae 4 2 3 Cosmopolitan Rhinocerotidae 10 3 8 Cosmopolitan Equidae 3 2 2 Cosmopolitan Tapiridae 2 0 0 Tropical Cainotheriidae 1 0 0 Palaearctic Anthracotheriidae 1 1 4 Tropical Tayassuidae 5 2 2 Palaearctic Hippopotamidae 2 2 2 Ethiopian Suidae 9 3 15 Cosmopolitan Sanitheriidae 0 0 2 Tropical Camelidae 1 0 I Cosmopolitan Tragulidae 1 1 2 Tropical Moschidae 6 1 1 Palaearctic Palaeomerycidae 4 1 1 Palaearctic Cervidae 20 0 0 Palaearctic Climacoceratidae 0 0 2 Ethiopian Giraffoidea 4 1 7 Tropical (Ethiopian) Bovidae 24 2 44 Cosmopolitan Eotragini 1 0 0 Not clear Boselaphini 5 0 4 Tropical Bovini 4 0 5 Cosmopolitan Hippotragini 2 1 5 Ethiopian Hypsodontini 0 0 I Palaearctic Neotragini 0 0 7 Ethiopian Antilopini 4 1 5 Tropical Tragelaphini 0 0 2 Ethiopian Ovibovini 4 0 1 Palaearctic Caprini 4 0 0 Palaearctic Cephalophini 0 0 3 Ethiopian Reduncini 0 0 4 Ethiopian Alcelaphini 0 0 7 Ethiopian

302 M. Pickford, J. Morales/Palaeogeography, Palaeoclimatology, Palaeoecology 112 (1994)297-322
91
- o ==
o ~ ~ ~ ~ ,
l&l ¢ , 0 0 = = = =
- ; =° '=° i ~ o ~ ~ z I
c0 I < ~ ~ I
N =~ =~ I ~ Z I=E= :
)- ~. ~ ~ i z ~ z ~ ~,= ~ i=~o
=== =~ -
aol-- ~ ~ t o
-
- - b j -~
(D
0
0
z ~
~1-< Z
v
3 I -
o o ~ o o ~ o : o o o o o o o o m
@
_ o _ o= , , = = ~ = _ . . i
o ~c-o O . j ~ u
. . . . q ~
I l
~oI i --e:
,=o==. ~. .J
. J ~
o & o=
- - w x
> D
o
.5 0 I-. W < .J
o O =S
o
z "J - J o o o ~= ~, ,.=, ,=.,~
o ~ ~ o ~
l I I I I
I 3= ~ o o
~ o o 0 ~ ( . 9 D Z Z ~ z z n = = ~z~==o>_
o ~ ~ . z = I-.- -J z z z D j
1 = t~ O z ~ c
0 0 ~ a: ,..~ O. O J ' ~ 2E b.I Z
I
I
i ¢3
I I I I
~ 04 04
;.=
o=
0
0
"E0
0 C
,...,

M. Pickford, J. Morales/Palaeogeography, Palaeoclimatology, Palaeoecology 112 (1994) 297-322 303
~ o ~ o ~
' " 8 < = °=
>~ ~ ~ §~-~ -~ ,z ~J
I I
uO~ 0~ mm
Z . - l ie .-I ,~ ~
,~ <=,,~_,.. = , .<- o _ " ,,,>" .~=~
O J J 3 3 ~ do.,~<= o o < ,o = = == ~=;~ o o o _ ~
- - 0
,= '~ 8 "=' = <,~.~ " ' = ' - = ~.
,,, ~ ==< .=o~J,,, = N =
<= ~ < o . . , o= , . , = = < = o ~ = ~ = o ,=., ,.=, ; ~ ~ ° ~ '~,,,'=< ,,, z, , , ,= ~ ~, <> - , , , - , , ,~-~ ~ z.~ °, "<==*-~ ~ .~
<t == -' < =<<_, - - ~.~ ~Oo "-' a o=o ~ ~,~ >~<===<= , , ~ ==< o 0. ~ _ ~ o . _ , . ~ = , = 9 8 S ~ ,, .-, 8 = , , z - ,,, <,
.O = o>
5 o ~ o 0
~.3tJ
--IO~b.I _J 'O ~J:
~ = ~ ~ @ o
~ . ~ ~.~ < ,-.= o
..=.
| ,=,~
z ~
| i !
o
o o ~ o ~, t Y ~ :
.=0dd FI 0 1 P P ! I N J0~"~ NVI~IE N V I $
-IN V.rr~ - 3" I - IVA N~ ' I ' - IO~ N I N V I N O g V ~ V NVI-181NV~
NVlRO -NV~I.=I NVlN NVI-IO)-IFII N~IS3-1"IV/~ NVIOV~ N V I N 'q 3 -I ~0 NVIN30V -V7717 - I o s n a - v l s v
0
NVlN
!i[°t -] ! " i li!' • ~ 3N330I-ld ~ 3N300IW ~13ddn ~ 3N300IW 3-N3GIW~ 3N300IM ~13h43"I 9J
0 ~ 0
, I , l , l , l , ~ , t , t , I , I , T , I , I , I , I , T , I~ l , i , l , ~ , l , i , I , i , , 1 , i
rj~
..=
2 :..T,
O
O
O
2 ,.C
8 O ~D

304 M. Pickford, J. Morales/Palaeogeography, Palaeoclimatology, Palaeoecology 112 (1994) 297-322
Table 2 Generic list of large mammals from East Africa and Spain (empty bar=records in Spain; striped bar=records in East Africa; black bar=overlapping records in Spain and East Africa). (a) Arctocyonidae, Teratodontidae, Hyaenodontidae, Amphicyonidae, Canidae, Ursidae, Mustelidae
( 8 ) 2 5 2 4 2 3 2 2 2 1 2 0 1 9 1 8 1 7 1 e 1 5 1 4 1 3 1 2 1 1 1 0 S 8 '7 6 4 3 2 1
MaCTOCYOe411~E
rERATODONTIONE TgrModon
!HYIM~X~ONTII~E Hy~nm#ounJm ~ t o ~ w t u m ) M ~ IlPohyaw)oak)n MAWnopa
L~dmytlwtum
v ~
xor~-~f~ c ~
~ u m
WAlfftlt.I)l~ LUO~ EonmWvora MeEvora K~lur ra SNaonyx Toro~tra Er.~r~don
Lutra Paraonyx Aonyx Pa~oomem P r o m ~
P ~ ~ 4 ~
Mum~ k:~x~yx
Mk~k~ P r o p u ~ Toxodon
Ck'cammm~ MaraCa Troahar~m #Jer~k Isahyr~#s
S#nocyon Prapo~Vo~
l l
~ E
=
=
m
m
R
mm~

M. Pickford, J. Morales/Palaeogeography, Palaeoclimatology, Palaeoecology 112 (1994) 297-322 3 0 5
Table 2 (continued) (b) Nimravidae, Viverridae +Herpestidae, Cryptoproctidae, Hyaenidae, Felidae
lot 2 5 2 4 2 3 2 2 2 1 2 0 1 9 1 8 1 ? 1 6 1 5 1 4 1 3 1 2 1 1 1 0 9 8 7 6 5 4 3 2 1
Ne4RAW)AE Pmunmmo~r~us
VNERRIDAE Lel~te~a Kk~ch/* Leptopt~ct~
Herp~des Kanultes Herpmt~ Vlverrm Clvettlctls Atl~x
Croe~vchul Ook>~m
Genetta Nm~Vn~
Pseudocivetta S e m l ~ K ~ Siva~ua Mungo¢
CRYPTOPROCI1D~
P ~ , ~ u t a HYAEae~E
Pflovlvelrops Proflctltherlum Ictttllertum
TtWauCt~ Lycyaena Uym~c~ btyperhyaena Adcrocuta H),Nna Grocuta Pachycrocuta Ctw~m~pormetN ProW~e
FBJDAE Afrosmtlua
Stena#urus Panthera Homotherlum Megmntereo¢l Dhlofe~ Felm VlretWlurus ~ n a Lynx Pseuaaelurus
Panun#cha/mdus Ma~Wrod~
0i
=:::=
-i
i m m
ta~zl
imm
c~m
and biostratigraphy. Many of the Spanish localities have been positioned with reference to the European Land Mammal Zonation (MN Zonation) which is essentially based on biostrati- graphic arguments, but which is Spain is often founded on knowledge of stratigraphic position
and superpositional order within measured sequences of strata.
4. Terminology
There are various "key" words which commonly crop up in biostratigraphic studies, but which are

306 M. Pickford, J. Morales/Palaeogeography, Palaeoclimatology, Palaeoecology 112 (1994) 297-322
Table 2 (continued) (c) Hominoidea, Cercopithecidae, Lorisidae, Proboscidea, D e i n o t h e r i i d a e
Icl ~ i A m
Cmuzelli PIIopithecus Mlcroplth~us Limno~us Kalepithecus Turkanaplthecus Xenoptrhecu8 DenoYoplrhecus Procor~ul Rangwaplthecus Kenyapithecus Atropltt~us Oryqe~t~cus Otavlplri~cus Nyanz~o~us Aus~,alopithecus Paranthrop~ Homo
Prohylobatw Vlctorlaplthecus
Mlcrocolotxm Paracolobus Dolicho~thecus RNnocolot~s Colobu¢ C~,coplthecoides Macaca Patapapto Cecoce~ Dlno~thecus Papio Parado#chol~thecus ~ u s
LORBDI~
Mloeuotlcus Komba
PRC~C~DEA MI~TODONT~DI~
Gomphotherlum P ~ Archaeobelodon Z~oSop~odon E ~ n Prolanancus Choer~opl~don Tetralophodon Anancus S ~ ~e'.~.;.~:.~,
B.EFHNCnDAE Stegotetrabel~lcn
P~m~ep~ Mammuthus B~oh~
Prodelnothe#um C.,;, ,.~; ~,,~um
2 5 2 4 2 3 2 2 2 1 2 0 1 9 1 8 1 7 1 8 1 5 1 4 1 3 1 2 1 1 1 0 9 8 7 6 5 4 3 2 1 0
m
m
c ~
~ c n
ID
a c ~
c ~
i
imprecise or which convey precision which is unwar- ranted by the data. In continental settings, the word "datum"-- as for example used when describing the earliest known record of Proboscidea or of Hipparion in Eurasia as the "Proboscidean datum" and the "Hipparion datum"--has misled more than
it has helped biostratigraphers. Seldom does the earliest known record coincide with the arrival time of a taxon in a region: it is almost always later than it. Thus "datum" implies a precision that is effec- tively seldom attainable. The words "appearance" and "disappearance" likewise imply a precision

M. Pickford, J. Morales/Palaeogeography, Palaeoclimatology, Palaeoecology 112 (1994)297-322 307
Table 2 (continued) (d) Hyracoidea, Tubulidentata, Pholidota, Chalicotheriidae, Tapiridae, Rhinocerotidae, Equidae
~O~ 2 5 2 4 2 3 2 2 2 1 2 0 1 9 1 8 1 7 1 6 1 5 1 4 1 3 1 2 1 1 1 0 9 8 7 6 5 4 3 2 1 0
Megalohyrax Bunohyr~x
P~apllohyrar PIIohyrax Heterohyrax Glgantohyrax Procavla o~o~yrax
~ A T A Myoqcteropus
Leptoq~pus PHOLIOOTA Man~ (~J
MInBIOO/ClrYI.A ~ I D A E
PhylloP,#on Moropus Chalicotl',etium Chemosit~
T.aPIP~DAE Prc~Aolrus T~olrus
~ O A E Protaceratherium Brachypott~rlum Ple#lacerathertum I-~ro~nto:hinus Htspanotherlum Kenyatherlum Aceratherium Lartetotherlum
GB~ldatherium Dicemn~nus Chilothettdlum P aradlceros Coelodonta Ceratotherium
• D;cw-~
Anchltherlum H~opar~n ( s O
q
which can seldom be confirmed, but which are often proven inaccurate. Combinations of these words such as FAD (First Appearance Datum) and LAD (Last Appearance Datum) are to be avoided in our opinion. The widespread acceptance of the concept of the "Hipparion datum" at 12.5 Ma (Berggren and Van Couvering, 1974) and the "Proboscidean datum" (Madden and Van Couvering, 1976) delayed real advances in Old World large mammal biostratigraphy for more than a decade.
We prefer to use the phrases "Earliest Known Record" and "Latest Known Record", since these terms recognise the fact that increase in knowledge of the fossil record generally leads to changes in its understanding and interpretation. Furthermore,
EKRs and LKRs apply only to the specific areas under study, since the concept accounts for the fact that the biogeographic spread of taxa can be diachronic. Thus the EKR of Hipparion in Spain may be synchronous with its EKRs in East Africa and in Pakistan, or it may not be. The question can only be resolved by additional evidence which avoids the trap of circular reasoning.
We have worked at the generic level where possible, since there is greater confidence in identi- fying taxa to this level than there is in trying to work at the specific level. What we lose by exclud- ing the species rank, we feel that we recuperate by working with greater confidence at the generic rank. Furthermore, the number of species shared by Spain and East Africa is limited, whereas the
308 M. Pickford, J. Morales/Palaeogeography, Palaeoclimatology, Palaeoecology 112 (1994) 297-322
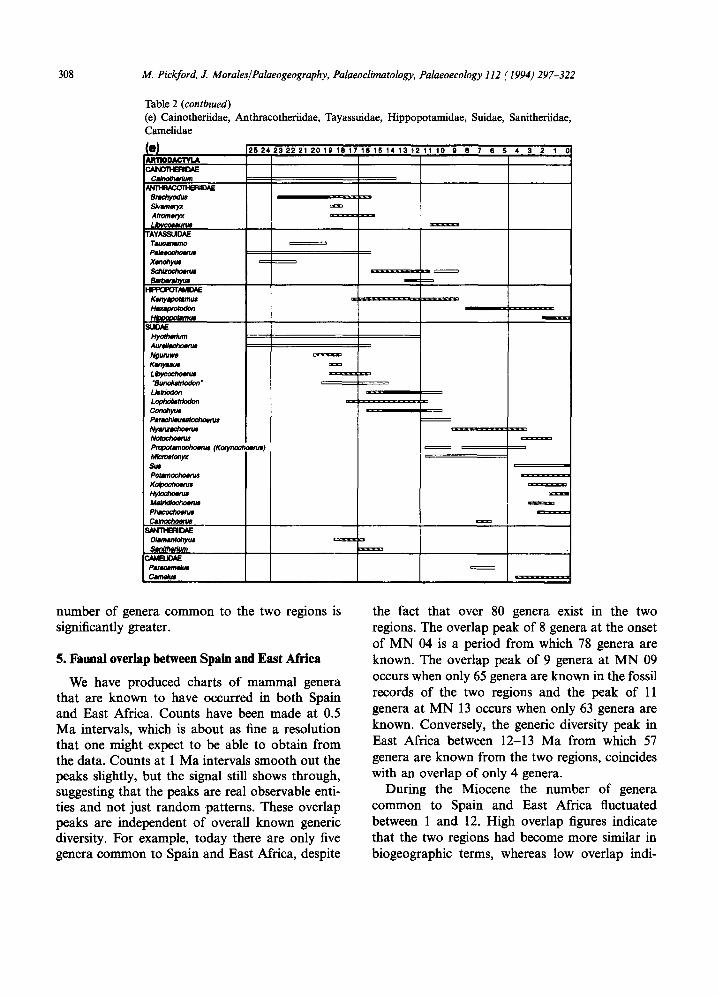
Table 2 (continued) (e) Cainotheriidae, Anthracotheriidae, Tayassuidae, Hippopotamidae, Suidae, Sanitlaeriidae, Camelidae
N m r l o ~
Cm~,;;m;,im
2 5 2 4 2 3 2 2 2 1 2 0 1 9 1 8 1 7 1 e 1 5 1 4 1 3 1 2 1 1 1 0 9 8 7 6 5 4 3 2 1 0
Bra~yodus S~ameq~x Atromeryx Lmpx~munm
TAYASSUIDAE T m o Palaeochoerus Xenohyus Scldzod/menm
PIPPOPOTI~VIDAE Kenyapommus Hex, pro~don H~po~mus
SUDAE Hyotherium Aurellachoen~ NgURIWO Kenyasu# t ~ "Bunol~odon" L~triodon L ~ Conohyus Parachleuastoct)oerus Nyanz~/~eruJ Nomctmenx Propotamochoer~ (Korynochoerus) Mlcrootonyx
Potsnocho~'zm Kmpochowus
MirkzYoct',oems Pl~coct~mw
C~¢IELIO~E Paracam~us Came/us
~ II::m,
mm~alaml~! T m ~
number of genera common to the two regions is significantly greater.
5. Faunal overlap between Spain and East Africa
We have produced charts of mammal genera that are known to have occurred in both Spain and East Africa. Counts have been made at 0.5 Ma intervals, which is about as fine a resolution that one might expect to be able to obtain from the data. Counts at 1 Ma intervals smooth out the peaks slightly, but the signal still shows through, suggesting that the peaks are real observable enti- ties and not just random patterns. These overlap peaks are independent of overall known generic diversity. For example, today there are only five genera common to Spain and East Africa, despite
the fact that over 80 genera exist in the two regions. The overlap peak of 8 genera at the onset of MN 04 is a period from which 78 genera are known. The overlap peak of 9 genera at MN 09 occurs when only 65 genera are known in the fossil records of the two regions and the peak of 11 genera at MN 13 occurs when only 63 genera are known. Conversely, the generic diversity peak in East Africa between 12-13 Ma from which 57 genera are known from the two regions, coincides with an overlap of only 4 genera.
During the Miocene the number of genera common to Spain and East Africa fluctuated between 1 and 12. High overlap figures indicate that the two regions had become more similar in biogeographic terms, whereas low overlap indi-

M. Pickford. J. Morales/Palaeogeography. Palaeoclimatology. Palaeoecology 112 (1994.) 297-322 3 0 9
Table 2 (continued) (f) Tragulidae, Moschidae, Palaeomerycidae, Cervoidea, Climacoceratidae, Giraffoidea
Dorcalmm~Jm
h Y a m ~ h ~ MOSCI'IDAE
Amphro -~u /us , , =
DrmoUw~um (WsW~m~)
~rorne~/x =
Oriomeryx
TY.a;.-~.7~. ix
LJooml,yx P ~
PA~opan)~4m~ Aclooawnaa SDh#noawlm Euprox AnWUmox L ~ T ~
C ~ Co-vt~ OotkCaoaoacmw R ~ Dama Atvlmloaer~ Eu~docer~
Cllnmaoauaw ;¢mua,,~4yX
Lorancamwyx = ~ m e r y x
Pam~traQw
De~nna~w~rn
Sk~a~nerium Glraffa
2 5 2 4 2 3 2 2 2 1 2 0 1 9 1 8 1 7 1 6 1 5 1 4 1 3 1 2 1 1 1 0 1 9 8 7 6 S 4 3 2 1 0~
[ z 3
i t x ~ z m . =
cates that they had become more dissimilar. From the lower Miocene until the present there were four main peaks of high overlap, separated from each other by troughs of low overlap (Fig. 4). High overlap peaks occur in the lower Miocene (MN 04), the late middle Miocene (MN 7/8), the latest Miocene (MN 13) and the late Pliocene (MN 17). Overlap troughs occur prior to MN 04 (which may be due to the poor nature of the fossil record in Spain), in the middle Miocene (MN 05), the late Miocene (MN 10), the Pliocene (MN 15) and there is a drop in overlap figures during the late Pleistocene to Holocene.
A count of cervid diversity in Spain (Fig. 4)
even though the diversity is always rather low, reveals a trend which is generally out of phase with the overlap chart. For example, when the overlap peak at MN 04 occurs, the diversity of cervids drops from 2 to 1. As the overlap figures for the upper Miocene and early Pleistocene drop, the diversity of cervid taxa increases from 1 to 3 and from 1 to 5 taxa, respectively. We interpret this to mean that the Palaearctic influence in Spain, as measured by cervid diversity, was fluctuating and furthermore, that the Palaearctic influence generally decreased when the Ethiopian influence increased and vice versa.
The presence of crocodiles in Spain has also

3 1 0 M. Pickford, J. Morales/Palaeogeography, Palaeoclimatology, Palaeoecology 112 (1994) 297-322
T a b l e 2 (continued) ( g ) B o v i d a e
BOVIDAE Eotragu~ M i o ~ m s Protragocetu~ AuMropc~tax Tragoportax Siv~ea8 Kipslgicerus Tragore,u Palaeor~s MNembri:,~ax P ~
Ugandax Slmatherium 8rabovus Synceru$ Pelorovi$ Bos/Bison S~lrgel~a Tethyfragus G~mt~agus Protoryx/Pachytragus
Praedamalls H~opotragus Oryx Hypsodontidae Gazella Oioceros H o m o l o ~ H~oanodo¢~ Gazelloeplra Antidorcu AnU~pe L#ocr~#us Trm~l~ol~us F~urotragus Samom~ H e s p e r i ~ P m e o ~ P ~
PR~amptoceros Bupi~pra Caprm Cephaloph~s Philantomba Syivk~pra Madoqua Rnynchotragus Or3otrag,;~ Neotragus Pelea Domatragus Raphtcw o* Ko~us Menellkla ThaWoce~ Redunca Alcelaphus Megalotragus Beatragus Pannularius Pamstigorgon Connochaetes Dil lah~m
2 5 2 4 2 3 2 2 2 1 2 0 1 9 1 8 1 7 1 6 1 5 1 4 1 3 1 2 1 1 1 0 9 8 7 6 5 4 3 2 1 0
mE~
gnta
r
~ Y g
ID
E m
a =
been plotted in Fig. 4 and these periods coincide closely with the mammal overlap peaks, providing further evidence of the existence of periods during which conditions in Spain were more tropical than they are today.
The combination of data suggests that the boundary zone between the Palaearctic and Ethiopian biogeographic regions was shifting lati- tudinally during the Neogene (Fig. 5). At the onset of MN 04 this boundary is thought to have shifted

M. Pickford, J. Morales/Palaeogeography, Palaeoclimatology, Palaeoecology 112 (1994)297-322 311
0
1
2
3
4
5
6
7
8
9
tC
11
12
t3
t4
15
tE
17
t8
t9
2(
2t
2;
2~
2~
2~
M o
Q5 • Q4
MN 1 16
15
MN t,
MN 13
12
ti
MN 10
9
MN 6
5
MN 4
MN 3
2 b
2a
MN I
S PAl N
6
5
? 4 ,5
5
2 2
7
W
LARGE MAMMALS OCCURRING IN BOTH SPAIN 8= E. AFRICA DISTRIBUTION (N ° of Genero} OF
CROCODILES IN SPAIN
9 ?
CERVID DIVERSITY IN SPAIN
(N ° of Genera)
CI 0
C2 I
c3 2
C4 3
c5 4 c6
C7 5
PVII 6
C8
7 PVI]
8
9 PV[
t0
t l
PV 12
13
PI~ t4
15 p'rtr
16
P ] ~ t7
p1T 18
19 P1
ZC
2t PO
Z2
Z3
24
2~
E. AFRICA M o
Fig. 4. Large mammal taxa occurring simulaneously in Spain and East Africa, the occurrence of crocodiles in Spain, and changes in diversity of Cervidae during the Neogene of Spain.
northwards. It then shifted southwards during M N 05, northwards again at M N 7/8, southwards at M N 10, northwards at M N 13, southwards at M N 15, northwards at M N 17 and southwards again
during the late Pleistocene. As a result the biogeo- graphic affinities of Spain fluctuated between purely Palaearctic (as it is today) and partly Ethiopian (as it was during M N 04 for example).

312 M. Pickford, J. Morales/Palaeogeography, Palaeoclimatology, Palaeoecology 112 (1994) 297-322
22 21 20 49 18 17 16
=|
15 t4 t3 12 I1 10 9 8 7 6 5 4 3 2 ~ 0 Mo
~ Boundory zone in northerly /-/~a~- position -/.~-'R. ~ .~.~..~*~v,&
Boundory zonel 7P/~' , '~_~;; ,X'~ in southerly l / / ~ 2 1 ~ ~
90 ° 90ON
80" ~'" ' ~ 80* 60 ° PALAEARTIC BIOGEOGRAPHIC REALM 60 °
50" 50 °
, o . , o .
,o. - v - - ,oo 200 20 •
ETHIOPIAN BIOGEOGRAPHIC REALM
m
llll I I " lll H M
22 21 20 t9 t8 17 t6 15 14 t3 12 1t 10 9 8 7 6 5 4 3 2 1 0 Mo
Fig. 5. Latitudinal fluctuations of the boundary zone between tropical and boreal biogeographic realms during the Neogene.
At present the boundary zone between the Palaearctic and Ethiopian zoogeographic realms lies at a latitude of about 30°N. It crosses Africa in an east-west sense some distance south of the Maghreb and the North African littoral zone, both of which are in the Palaearctic Realm (Geraads, 1982). Northwards shifts appear to have been rather sharply expressed, while the subsequent southwards shifts seem to have been gradual.
During periods of high generic overlap between East African and Spanish faunas, we postulate that Spain lay within the northern parts of the Ethiopian Zoogeographic realm (Fig. 5) or at least within the boundary zone, which is about 10 ° of latitude wide (Fig. I), the Palaearctic Realm lying some distance north of Spain. During the generic overlap troughs, Spain is considered to have lain within the Palaearctic Zoogeographic Realm, the boundary zone lying somewhere in northern
Africa. By this means the Iberian Peninsula experi- enced greater or lesser affinities with the Palaearctic or the Ethiopian Realms, with the consequence that its zoogeographic faunal content fluctuated, sometimes having greater Palaearctic representa- tion and lesser Ethiopian influence, at other times having the contrary. Geraads (1982) described much the same fluctuations in the Miocene to Recent faunas of the Maghreb. Van der Meulen and Daams (1992) reported that there was a major change in Iberian rodent faunas at the onset of MN 04, which accords with the large mammal changes.
6. Generic diversity and earliest known records
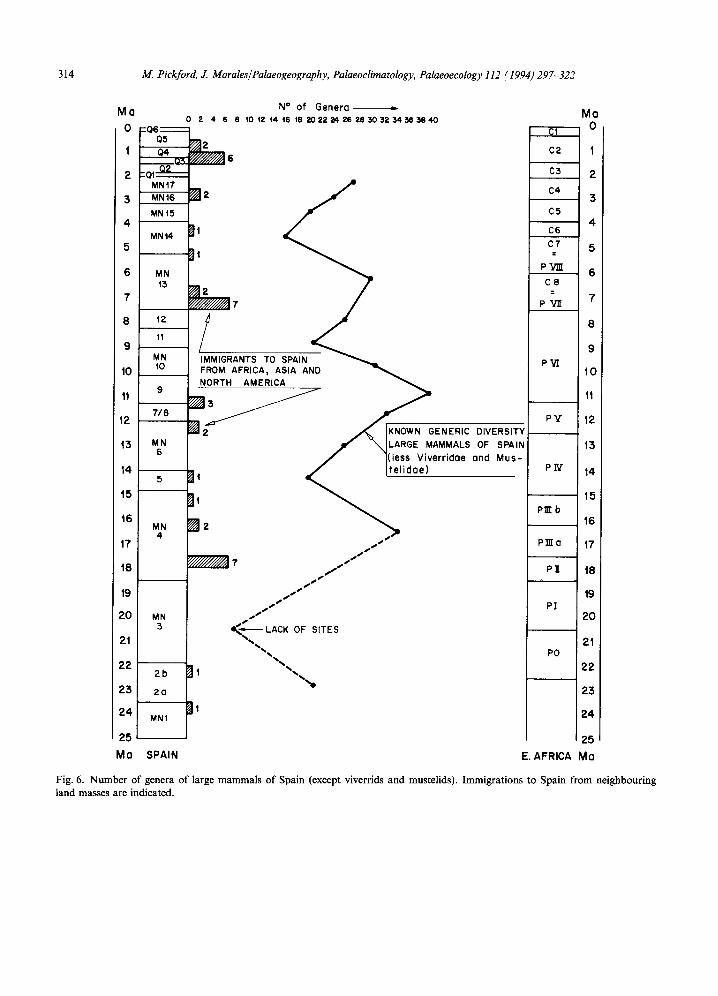
Fig. 6 provides a count of the diversity of large mammal genera recorded in Spain since the lower

M. Pickford, J. Morales/Palaeogeography, Palaeoclimatology, Palaeoecology 112 (1994)297-322 313
Miocene. The vivenfds and mustelids have been omitted on account of their very variable fossil representation. Diversity has fluctuated between 16 and 40 genera, diversity peaks occurring at MN 04, MN 09, MN 13 and MN 17. Diversity troughs occur at MN 05, MN 11 and MN 14. Some of the variation is undoubtedly due to vagaries of the fossil record, but a consideration of Wallace's Rule (Pickford, 1990) suggests that diversity peaks coin- cide with increased tropicality, while troughs coin- cide with increases boreality. This appears to be the case in the sense that the diversity increases in Spain occurred during periods when Iberia seems to have lain within or close to the Ethiopian Realm, whereas the troughs occur in the record when Iberia was part of the Palaearctic Realm.
In many instances it is clear that mammalian lineages were entering Spain from neighbouring regions, since there are no likely ancestors for such lineages in the prior Spanish fossil record. Dryopithecus, Pliohyrax and Hexaprotodon rep- resent such immigrants from Africa, while Anchitherium, Hipparion, Equus and Paracamelus represent immigrants from North America.
Fig. 7 reports the known generic diversity changes in East Africa during the Neogene and Quaternary. There is a general trend of decrease in generic diversity during the Miocene, with important increases during the Pliocene and Pleistocene. These figures are undoubtedly biassed by the spotty nature of the fossil record in East Africa (Fig. 1 ) for much of the Miocene. However, well sampled groups, such as the herbivores and primates, show similar trends (Pickford, 1991), suggesting that the form of the curve is informa- tive, even if the precise figures are perhaps less so.
7. Discussion
Patterns which emerge from the data indicate that during the past 22.5 Ma there were at least four major periods of marked faunal change in both Spain and in East Africa. These involved so many genera that the phrase "faunal turnover pulse" springs to mind. While there is some margin for error and the resolution is not very great in the dating techniques (-t-0.5 Ma), it appears to us
that the pulses were virtually contemporaneous in the two regions. They occurred at about 18+0.5 Ma, 11.5+0.5 Ma, 7.0+0.5 Ma and 2.5+0.5 Ma ago. A smaller peak of faunal change occurred at about 8.5 Ma. In Europe the major pulses corre- spond to faunal zones MN 04, MN 7/8 and 9,MN 13 and MN 17, while the minor one corresponds to Zone MN 11.
Comparison of these results with studies of faunal change elsewhere in the planet, reveal some interesting correspondences. For example, in a study of the fossil genera of the Great Plains of North America, Alroy (1992) reported major diversity drops at 17.4 Ma, 11.6 Ma, 8.7 Ma and 6.5 Ma in faunal successions dated mainly by radio-isotopic techniques. His analysis did not include late Pliocene and Pleistocene faunas. The number and timing of these faunal changes in North America are surprisingly close in number and timing to those of Iberia and East Africa, suggesting that they may well be related to responses to some global scale changes of some sort.
Barry et al. (1985) and Barry et al. (1991) studied faunal turnovers in the Siwaliks successions of Pakistan and have reported that significant faunal changes occurred at 16-20 Ma, 9.5 Ma and 7.4 Ma and minor changes at 13.2 Ma and 12.0 Ma, based on fossils collected from sedimentary sequences correlated to the Geomagnetic Reversal Time Scale. Considering the differences in dating techniques and the geographic positioning of the regions studied, we find that the correspondences are remarkably close, both in number and in timing, with one exception (Fig. 8). The appa- rently large offset between the 11.5 Ma event in Iberia/East Africa and the 9.5 Ma event in Pakistan may well be an artefact of the dating methods employed rather than a real chronological offset. Both of them include the earliest records of the equid Hipparion in their respective areas and in other respects these two faunal turnovers resem- ble each other. Whether it is the Pakistan dating which requires amendment, or that of the rest of the world, or both, remains to be resolved. In the Iberian and East African fossil sequences, we do not observe the minor events at 13.2 Ma and 12.0 Ma that Barry et al. (1985) reported from the
314 M. Pickford, J. Morales/Palaeogeography, Palaeoclimatology, Palaeoecology 112 (1994)297-322
Ma
!5
Ma
1
2
4N17 I 3 ~N 16 2
IN 15 4
IN 14 5
6 MN 13
7
8
9
10
11
2
13
14
15
16
17
18
19
;o ~N
P.2 2b
~.3 2a
!4 MN1
N ° of Genera ,.- 0 2 4 6 8 t0 t2 t4 t6 18 20 22 24 26 28 30 32 34 36 38 40
~N I(
12•7 / IMMIGRANTS TO SPAIN FROM AFRICA~ ASIA AND NORTH AMERICA
KNOWN GENERIC DIVERSITY LARGE MAMMALS OF SPAIN (less Viverridoe and Mus- te l idoe)
N2
~ r
s j , s j '
s ~ S J
e ~ LACK OF SITES
%%%%~
J~
SPAIN
C1
C2
C3
C4
C5
c6 C7 =
p "y]]]
C8 = P'VI
P ~
PY
PN
p l r b
P ~ o
P I
PI
PO
,3
4
5
E. AFRICA Mo
i o 0
1
2
3
4
5
6
7
8
9
0
I1
2
3
:4
5
6
7
18
19
:0
2
Fig. 6. Number of genera of large mammals of Spain (except viverrids and mustelids). Immigrations to Spain from neighbouring land masses are indicated.

M. Pickford, J. Morales/Palaeogeography, Palaeoclimatology, Palaeoecology 112 (1994) 297-322 315
MQ 0 'L 2
3
4
5
6
7
8
9
I0
It
t2
14 MN 5
r5
16
17
18
12 14 16 18 2 0 2 2 2 4 2 6 2 8 5 0 3 2 3 4 3 8 3 8 4 0 4 2 4 4 4 6 4 8 5 0 5 2 5 4 5 6 5 8 6 0 6 2 6 4 6 6 6 8
6: ~ C ~ - - _ ~ . _ - - - . . - . ~ -"-
2 2 2 Ct
C5
~ 7 ~NoWN GENERIC DIVERSITY CE OF LARGE MAMMALS OF C7 EAST AFRICA =
p'y~
C8
t2
MN lO
7/8
AN~
2 b
20
MNt
M a SPAIN
IMMIGRANTS TO EAST AFRICA FROM EURASIA AND N. AfdE
~///////////////~ t o
" / / / / / / /~/ / / / / / / / / /~ t l
FEW SITES
P',~K
PV
MQ 0
t
2
3
4
5
6
7
8
9
0
3
Pt~ 4
5 P in t
6 PTffa 7
PIT 8
PT 0
t PO
2
3
E. AFRICA M o
Fig. 7. Diversity of large mammal genera in the Neogene and Quaternary of East Africa with counts of taxa immigrant from neighbouring and distant continents.
Siwaliks, but this could be due to the restricted number of fossil sites spanning this period in East Africa. Neither is there a clearcut correspondence
for these events in the Great Plains succession of faunas, which are better known. They possibly represent faunal changes of localised significance

316 M. Pickford, J. Morales/Palaeogeography, Palaeoclimatology, Palaeoecology 112 (1994) 297-322
M Q 0
10
~5
~ y ~ t T. 4 g~
20
• - - t 2 . 0 - - -
- - t 3 ,2 - - -
- - - 8 . 5 - - .
VALACHIAN
RHODANIAN
ATTIC
STYRIAN
GREAT PLAINS SIWALiKS SPAIN AND TECTOGENIC N. AMERICA P A K I S T A N EAST AFRICA P H A S E S
Fig. 8. Comparison of major global scale Neogene faunal events reported from North America, Pakistan, Spain and East Africa (Double ended arrows correlate the events). The only major chronological offset is between the Hipparion event of Pakistan and the same event in the rest of the world. This offset is probably an artefact of the dating methods employed, but it is not known whether it is the Pakistan date which requires amendment, or whether it is those from the rest of the world, or both. (Minor events of local or regional significance are dotted).
rather than global scale events which have thus far escaped detection elsewhere.
A synthesis of the data from East Africa, Iberia, Pakistan and the Great Plains of North America, reveals that there were several major faunal turn- over pulses during the Neogene. Many of the genera involved in these pulses were colonising regions from neighbouring or even from distant zoogeographic realms, suggesting that they were periods of major adjustments to zoogeographic boundary zones. In the case of Iberia and East Africa, the boundary zone between the Palaearctic and Ethiopian realms appears to have been fluctu- ating latitudinally. Pickford (1986, 1990) has already pointed out that this boundary zone has moved northwards and southwards during the Neogene and that while it is in a northern position, the Ethiopian and Oriental zoogeographic realms fuse into a single entity stretching from Iberia in
the west to China in the east (Fig. 5). While the zoogeographic boundary is in a southern position, as it is today, the Oriental and Ethiopian zoogeo- graphic realms are separated from each other by a wide swath of the Palaearctic Realm in the vicinity of the Middle East and Afghanistan.
A further point of interest is that the major periods of faunal turnover in North America, Spain and East Africa (Tables 3-5) coincide closely with peaks of intercontinental interchange of large mammals (Fig. 9). For example, the onset of the Hemingfordian land mammal age in North America was accompanied by an "invasion" of 6 or 7 mammalian lineages from the Old World (Woodburne, 1987). This period correlates closely in time with the onset of MN 04 in Spain, which saw the arrival of 7 lineages from North America and Africa. In East Africa, this period coincides with faunal sets PII and PIII, during which 21 large mammal lineages entered Africa from Eurasia and America. This period coincides closely in time with the Styrian tectogenic phase.
There followed several million years with little evidence of intercontinental interchange of large mammals, until towards the end of the middle Miocene when there was another wave of intercon- tinental transfers, but this time more dispersed through time and involving fewer lineages. These interchanges occurred mainly between about 13 Ma and 10 Ma, which correlates closely in time with the Attic tectogenic phase.
After a further period of reduced interchange, there was an abrupt and marked increase at the end of the Miocene. 11 lineages entered North America from the Old World, 9 entered Spain from Africa, Eurasia and North America and 9 entered East Africa from Eurasia and North America. The timing of this episode correlates well with the Rhodanian tectogenic phase. In the Mediterranean area this period of interchanged could have been partially contemporaneous with the Messinian dessication crisis, that can favour the exchanges between Spain and the adjacent areas (Azzaroli, 1990; Azzaroli and Guazzone, 1979). After yet another period during which there was little or no intercontinental faunal interchange, renewed activity started during the Pliocene. 5 lineages entered America from the Old World, 2

M. Pickford, J. Morales/Palaeogeography, Palaeoclimatology, Palaeoecology 112 (1994) 297-322 317
Table 3 Earliest records of mammalian genera in North America immigrant from the Old World (according to Woodburne, 1987; dating from Alroy, 1992)
"o Bison, Oreamnos, Ovis, Ovlbos, Aloes, Homo,
Lutra, Lepus, Marnmuthus, Mustete, Panthers, Soergella, Rangifer, Cervus
Ursus, Parailurus, Chumaporthetes, Lynx
Ochotona, Pleslogulo, Eomelllvora, Slmocyon, Vulpes Indarctos, Agrlotherlum, Falls, Megantereon, Machslrodus, Tap/ms
10
11
12 Ischyrictis, Arnebelodon, Platybelodon
13
14 Gornphotherium
15 Plithocyon
16
17 Mionictls, Pseudaelurus
18
19
20
21
22
Potarnotherium, Arnphicyon, Phoberocyon, Hemicyon, Ursavus, Protaplrus, Brechypotherium
Cephalogale, Cynelos, Ysengrinia
23
24 IVtoropus
25
lineages entered Spain from the New World and from Africa,while 5 lineages entered Africa from Eurasia and America. This and subsequent activity during the late Pliocene and Pleistocene coincides in time with the Valachian tectogenic phase.
Pickford (1990, 1991) has suggested that there are two sorts of explanation for latitudinal fluctu-
ations in the boundary zones between biogeo- graphic realms. The most commonly cited explanation found in the literature is that the tropical zone widened and narrowed over time, but that its centreline remained fixed at the present fay equator. This has been called the accordion hypothesis of ecoclimatic belts (Pickford, 1992).
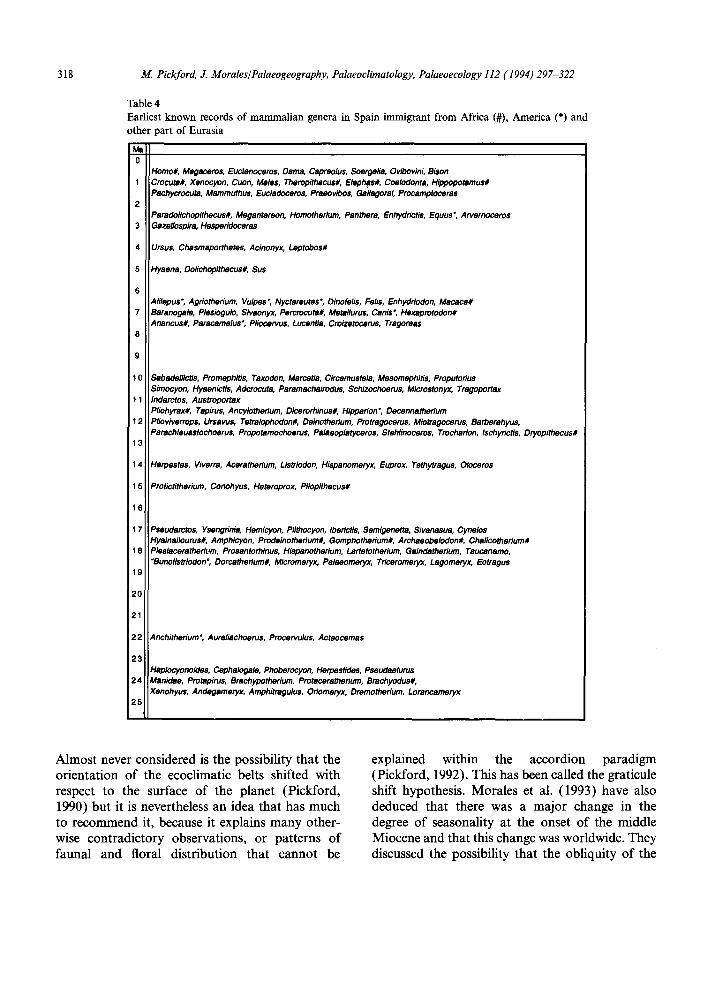
318 M. Pickford, J. Morales/Palaeogeography, Palaeoclimatology, Palaeoecology 112 (1994) 297-322
Table 4 Earliest known records of mammalian genera in Spain immigrant from Africa (#), America (*) and other part of Eurasia
Homo#, Megeceros, Euctenoceros, Dame, Capreolus, Soergelia, Ovibovtni, Bison Crocuta#, Xenocyon, Cuon, Males, Theropithecu$#, Elephas#, Coelodont$, Hippopotamus# Peehycrocuta, Mammuthus, Eucladocero$, Praeovibos, Gallagoral, Procamptoceras
Paradolichopithecu$#, Megantereon, Homotherium, Penthera, Enhydricti$, Equus*, Arvernoceros Gazellospira. Hesperidocera$
Ursus. Chasmaporthetes, Acinonyx, Leptobos#
Hyaena, Dolichoplthecu$#, Sus
Alilepus; Agriotherium, Vulpes*, Nyctereutes; Dinofelis, Fells, Enhydriodon, Macaca# Baranogale, Plesiogulo, Siveonyx, Percrocut$#, Meteiluru$, Canis*, Hexeprotodon# Anancus#, Paracamelus*, Pliocervu$, Lucentia, Croizetocerus, Tregoreas
10 Sabadellictis, Promephitis, Taxodon, Marcetia, Circamustela, Mesomephitis, Proputorius Simocyon, Hyaenicti$, Adcrocuta, Peramachairodus, Schizochoeru$, Microstonyx, Tragoportax
11 Inderctos, Austroportax Pliohyrax#, Tapiru$, Ancylotherium, Dicerorhinu$#, Hipparlon*, Decennatheriurn
12 Plioviverrops, Ursavus, Tetralophodon#, Delnotherium, Protragocerus, Miotragocerus, Barberehyus, Perachleuastochoeru$, Propotamochoeru$, Palaeoplatyceros, Stehlinoceros, Trocharion, Ischyricti$, Dryopithecus#
13
14
15
16
Herpestes, Vtverra, Aceratherium, Listriodon, Hispanomeryx, Euprox, Tethytragus, Oioceros
Protictitherium. Conohyus, Heteroprox, PIIopithecu$#
17 Pseuderctos, Ysengrinie, Hemicyon, Plithocyon, Ibericti$, Semigenett$, Sivanesu$, Cynelos Hyainailourus#, Amphicyon, Prodeinotherlum#, Gomphotherium#, Archaeobelodon#, Chalicotherium#
18 Plesiaceratherium, Prosantorhinus, Hispanotherturn, Lartetotherium, Galndetherium, Teucanamo, "Bunolistriodon', Oorcatherlum#, Micromeryx, Paleeomeryx, Trlceromeryx, Lagomeryx, Eotregus
19
20
21
22
23
24
25
Anchitherium'. Aureliechoeru$. Procervulu$, Acfeocernas
Haplocyonoide$, Cephelogale, Phoberocyon, Herpestides, Pseudaelurus Menidae. Protapirus, Brachypotherium. Proteceretherium, Brachyodus#, Xenohyu$, Andegameryx, Amphitragulus, Oriomeryx, Dreraotherium, Lorancerneryx
Almost never considered is the possibility that the orientation of the ecoclimatic belts shifted with respect to the surface of the planet (Pickford, 1990) but it is nevertheless an idea that has much to recommend it, because it explains many other- wise contradictory observations, or patterns of faunal and floral distribution that cannot be
explained within the accordion paradigm (Pickford, 1992). This has been called the graticule shift hypothesis. Morales et al. (1993) have also deduced that there was a major change in the degree of seasonality at the onset of the middle Miocene and that this change was worldwide. They discussed the possibility that the obliquity of the

M. Pickford, J. Morales/Palaeogeography, Palaeoclimatology, Palaeoecology 112 (1994)297-322 319
Table 5 Earliest known records of mammal genera in East Africa immigrant from Eurasia (#), America (*) and others parts of Africa
Ms 0
1
2
3
4
5
6
7
8
9
10
11
12
13
14
15
16
17
18
19
20
21
22
23
24
25
Aclnonyx#, Cercocebu$, Beetragus, Phacochoeru$
Lyceon, Hyaena, Crocuta, Megentereon#, Homotherlum#, Penthera#. Dinofeli$#, Cheemaporthetee#. Homo Gigentohyrax, Equus', Men.idiochoeru$, Antllope, Menellkie, Pelorovi$. Antldorca$, Synceru$, Megalotragu$ Lutra, Thempithecus, Cercopithecu$, Elephas, Loxodonta, Potamochoerue#, Notochoerue, Cemelue °
Hystricidee#. AIIlepus; Ceni$', Vulpes; Viverra#. Enhydriodon#, Ple$iogulo#, Agriotherium#, Hominidee, Perapapio Mammuthus, Stegotetrabelodon, Primelephes, Stegodon, Ceratotheriurn, Diceros, Hexaprotodon, Ceinochoeru$, Sivatherium, Giraffe, Hippotregini, Miotragoceru$#, Bovini, Medoqua, Aepycero$, Tragelaphu$, Alcelephini
Elasmotheriini#, Microcolobu$, Anencus, Ancylotherium#, Peleeoraas
Ictitherium#, Nyanzechoerus
Hipparion; Libycoseurus. Slvoraas, Eomelllvora Dendromuridae#, Lutrinae#, Tetrelophodon, Pachytragu$#, Protoryx
Percrocuta#, Agnotherium#, Hyp$odontldee#, Kip$igiceru$, Gentrytragus, Birgerbohlinia
Victoriapithecus. Pmhylobates, Doliochoerini. SchizochoerinL Kenyapotamidae#, Listriodon#, Conohyus#, Lophollstriodon#, Climacocera$, Nyanzemeryx, Bovidee (2)#
Kenyalagomys#, Felidae#, Amphicyonidae#, Hemicyon#, Ischyrictis#, Eomellivora#, Dicerorhinu$#. Chllotheridium#. Brachypotherlum#, Sivemeryx#, Afromeryx#. Sanltheriidae#, Canthumeryx, Giraffoidea, Propaleeoryx
Fissipeda#, Chalicotherildae#, Rhlnocerotidae#. Suidae#, Tragulidae#. Pecore#
Earth increased at this time, causing a worldwide change in the degree of seasonality which had tremendous repercussions upon global climates, vegetation belts and zoogeographic realms.
Climatic changes have often been invoked to explain faunal turnover pulses (Vrba, 1985; Alroy, 1992). However, what causes the climate to change
in the first place has seldom been evinced. In searching the literature for ideas concerning global change we have come across data which throws much light on the possible causes of both climatic change and faunal turnover pulses. Comparison of the tectogenetic history of the Alpine fold belt (Scherba, 1987) and our faunal data reveals a

320 M. Pickford, J. Morales/Palaeogeography, Palaeoclimatology, Palaeoecology 112 (1994) 297-322
i ( ]
0
t
2
3
4
5
6
7
8
9
10
It
t2
t3
14
15
46
17
t8
t9
20
2t
22
25
24
25
M a
N ° of Genera =-- 0 1 2 3 4 5 6 7 8 9 1 0 1 1 0 ! 2 3 4 5 6 7 0 I 2 3 4 5 6 7 8 9 1 0 1 1
z////////////////////A
~//////////////////////////A
~//////////'////A
"/////////////////////~ "/////////~'//~//~/////////.////./~.
"//////A "//////#,
~//////////~,
~ / / / / / / / f / / / / / / / / / / /~ , r/J///////////~/A
W~/////////////////////J
~ / / / / / / / / / / / / / / / / / / / # ,
r¢~//////////./~.
~//////////////A
LARGE MAMMAL GENERA IMMIGRANT TO AMERICA FROM OLD WORLD
LARGE MAMMAL GENERA IMMIGRANT TO SPAIN FROM NEW WORLD, ASIA AND AFRICA
LARGE MAMMAL GENERA IMMIGRANT TO E. AFRICA FROM EURASIA AND NEW WORLD
<I
TECTOGENIC PHASES
Fig. 9. Correlation of intercontinental large mammal interchanges during the Neogene of North America, Spain and East Africa, and of tectogenic history of the Alpine Fold Belt.

M. Pickford, J. Morales/Palaeogeography, Palaeoclimatology, Palaeoecology 112 (1994) 297-322 321
remarkably close chronological correspondence between them (Fig. 9). Scherba's synthesis built on the work of Stille (1924) and others who recognised that tectogenesis occurred in pulses or "phases" rather than continuously. During the Tertiary and Quaternary there have been at least 9 tectogenic phases (Laramide I, Laramide II, Illyrian, Pyrenean, Savic, Styrian, Attic, Rhodanian and Valachian). The Laramide I tecto- genic phase correlates in time with the K/T bound- ary, which was a period of major faunal change. The Pyrenean tectogenic phase correlates with the "grande coupure" of Europe and North America, which was also a period of profound faunal changes. The four faunal turnover pulses of the Neogene of Spain and East A~rica reported here correlate from oldest to youngest with the Styrian, Attic, Rhodanian and Valachian tectogenic phases. Considering the different histories of studies and the various dating methods employed, we consider that the chronology and the number of concor- dances between tectogenesis and faunal changes are remarkable. So remarkable in fact, that we consider that they each represent appropriate responses (one in the lithosphere, the other in the biosphere) to the same overall prime mover. Pickford (in prep.) examines the question further, but suffice to say at this stage that we see a close correspondence between the evolution of the bio- sphere and its substrate the lithosphere.
Acknowledgements
We are anxious to thank the Direcci6n General de Investigaci6n Cientifica y T6cnica for extending to MP funds for a sabbatical visit to the Museo Nacional de Ciencias Naturales, Madrid. This study is part of the research project PB 92-0066 DGICYT "Historia evolutiva de los ruminantes del Mioceno inferior y medio de Espafia".
References
Alcal~, L. and Montoya, P., 1989-1990. Las faunas de macromamiferos del Turoliense inferior espafiol. Paleontol. Evol., 23: 111-119.
Alcal~, L., Morales, J. and Sofia, D., 1989-1990. El registro f6sil ne6geno de los carnivoros (Creodonta y Carnivora, Mammalia) de Espafia. Paleontol. Evol., 23: 55-66.
Alcal~i, L., Morales, J. and Moya Sold, S., 1989-1990. El registro f6sil ne6geno de los b6vidos (Artiodactyla, Mammalia) de Espafia. Paleontol. Evol., 23: 67-73.
Alroy, J., 1992. Conjunction among taxonomic distributions and the Miocene mammalian biochronology of the Great Plains. Paleobiology, 18: 326-343.
Azanza, B. and Menendez, E., 1989-90. Los ciervos f6siles del ne6geno espafiol. Paleontol. Evol., 23: 75-82.
Azzaroli, A., 1990. Palaeogeography of terrestrial vertebrates in the perityrrhenian area. Palaeogeogr., Palaeoclimatol., Palaeoecol., 77: 83-90.
Azzaroli, A., De Giuli, C., Ficcarelli, G. and Torre, D., 1988. Late Pliocene to early mid-Pleistocene mammals in Eurasia: faunal succession and dispersal events. Palaeogeogr., Palaeoclimatol., Palaeoecol., 66: 77-100.
Azzaroli, A. and Guazzone, G., 1979. Terrestrial mammals and land connections in the Mediterranean before and during the Messinian. Palaeogeogr., Palaeoclimatol., Palaeoecol., 29: 155-167.
Barry, J., Johnson, N., Raza, S. and Jacobs, L., 1985. Neogene mammalian faunal change in southern Asia. Correlations with climate, tectonic and eustatic events. Geology, 13: 637-640.
Barry, J., Morgan, M., Winkler, A., Flynn, L., Lindsay, E., Jacobs, L. and Pilbeam, D., 1991. Faunal interchange and Miocene terrestrial vertebrates of southern Asia. Paleobiology, 17(3): 231-245.
Berggren, W.A. and Van Couvering, J., 1974. The late Neogene: Biostratigraphy, geochronology and palaeoclimatology of the last 15 million years in marine and continental sequences. Palaeogeogr., Palaeoclimatol., Palaeoecol., 16: 1-216.
Cerdefio, E., 1989-1990. Los rinocerotidos del Mioceno superior de Espafia. Paleontol. Evol., 23: 47-53.
Coppens, Y. and Howell, F.C., 1976. Mammalian faunas of the Omo Group: Distributional and biostratigraphical aspects. In: Y. Coppens, F. Howell, G. Isaac and R. Leakey (Editors), Earliest Man and Environments in the Lake Rudolf Basin. Chicago Univ. Press, pp. 177-192.
Feibel, C.S., Harris, J.M. and Brown, F.H., 1991. Palaeoenvironmental context for the late Neogene of the Turkana Basin. In: J.M. Harris (Editor), Koobi Fora Research Project 3. Clarendon Press, Oxford, pp. 321-361.
Geraads, D., 1982. Pal6obiog6ographie de l'Afrique du Nord depuis le Miocene Terminal, d'apr~s les grands mammif~res. G6obios M6m. Sp6c., 6: 473-481.
Howell, F.C. and Coppens, Y., 1974. Les faunes de mammif~res fossiles des formations plio-pl6istocbnes de l'Omo en Ethiopie. C.R. Acad. Sci. Paris, 278: 2421-2424.
Madden, C. and Van Couvering, J., 1976. The proboscidean datum event: early Miocene migration from Africa. Geol. Soc. Am. Abstr. Progr., 8(6): 992-993.
Morales, J., Pickford, M. and Sofia, D., 1993. Pachyostosis in a lower Miocene giraffoid from Spain, Lorancameryx pachyostoticus nov. gen. nov. sp. and its bearing on the

322 M. Pickford, ,1". Morales/Palaeogeography, Palaeoclimatology, Palaeoecology 112 (1994) 297-322
evolution of bony appendages in artiodactyls. G6obios, 26: 207-230.
Moy~ Sohi, S., Pons Moy~l, J. and K6hler, M., 1989-1990. Primates catarrinos (Mammalia) del Ne6geno de la peninsula Ib6rica. Paleontol. Evol., 23: 4145.
Pickford, M., 1986. The geochronology of the Hominoidea: a summary. In: J. Else and P. Lee (Editors), Primate Evolution. Cambridge Univ. Press, pp. 123-128.
Pickford, M., 1987. The diversity, zoogeography and geochro- nology of monkeys. Human Evol., 2: 71-89.
Pickford, M., 1986. Cainozoic palaeontological sites of Western Kenya. MOnch. Geowiss. Abh., 8: 1-151.
Pickford, M., 1990. Dynamics of Old World biogeographic realms during the Neogene: implications for biostratigraphy. In: European Neogene Mammal Chronology (Nato ASI Ser., 180). Plenum Press, New York, pp. 413-442.
Pickford, M., 1991. What caused the first steps towards the evolution of Walkie-Talkie Primates? Cah. Pal6oanthropol. : 275-293.
Scherba, I.G., 1987. Stages and phases of formation of
Cenozoic olistostromes in the Alpine Fold belt. In: Global Correlation of Tectonic Movements. Wiley, Chichester, pp. 49-82.
Stille, H., 1924. Grundfragen der vergleichenden Tektonik. Berlin, pp. 1-443.
Thomas, H., 1984. Les Bovidae (Artiodactyla: Mammalia) du Miocene du sous-continent Indlen, de la p6ninsule Arabique et de l'Afrique: biostratigraphie, biogeographie et ecologie. Palaeogeogr., Palaeoclimatol., Palaeoecol., 45: 251-299.
Van der Made, J., 1989-1990. Iberian Suoidea. Paleontol. Evol., 23: 83-97.
Van der Meulen, A. and Daams, R., 1992. Evolution of Early- Middle Miocene rodent faunas in relation to long term palaeoenvironmental changes. Palaeogeogr., Palaeoclimatol., Palaeoecol., 93: 227-253.
Vrba, E.S., 1985. Environment and evolution: alternative causes of the temporal distribution of evolutionary events. S. Aft. J, Sci., 81: 229-236.
Woodburne, M., 1987. Cenozoic mammals of North America: Geochronology and Biostratigrapby. Univ. California Press, Berkeley.
Copyright © 2022 FDOKUMEN