Identification of copper-responsive genes in an early life stage of the fathead minnow Pimephales...
12
Identification of copper-responsive genes in an early life stage of the fathead minnow Pimephales promelas Solange S. Lewis Stephen J. Keller Accepted: 28 October 2008 / Published online: 20 November 2008 Ó Springer Science+Business Media, LLC 2008 Abstract While physiological changes associated with copper toxicity have been studied in adult fathead minnow, Pimephales promelas, little is known about the effect of copper on newly hatched larvae. As a result we initiated an investigation on the mechanism of copper toxicity in 24 h post-hatch larvae using gene expression changes to identify responsive genes. Fish were exposed to copper concentra- tions of 0, 50, 125 and 200 lg/L in a 48 h toxicity test. Total RNA from survivors was used in a differential dis- play assay to screen for differentially expressed gene products. Altogether, 654 copper-responsive differentially expressed bands were collected. Database searches found homology for 261 sequences. One hundred and sixty-one bands were homologous to NCBI genes of known function, of which 69 were individual genes. The most abundant categories of functional genes responding to copper were involved in protein synthesis/translational machinery and contractile proteins. Twenty-one dose-responsive genes were measured for expression changes using real-time quantitative PCR. Differential gene expression was vali- dated for 11 of 13 genes, when a 1.2 times qPCR difference between the copper and control samples was observed. Transcripts identified as titin, cytochrome b, fast muscle specific heavy myosin chain 4, fast muscle troponin I, proteasome 26S subunit and troponin T3a were induced over twofold. Differential display bands identified as 60S ribosomal proteins L27 and L12 were repressed approxi- mately threefold. We conclude that copper exposure affects several cellular pathways in larval fathead minnows with protein synthesis, ribosome structure, and muscle contrac- tile proteins being the most sensitive to this stress. Keywords Fathead minnow Differential display Gene expression qPCR Copper Stress Introduction Among metals, copper is the second most toxic metal to fish after mercury. Even though copper is an essential cofactor of the biological molecules hemocyanin, cyto- chrome oxidase, tyrosinase, laccase and ceruloplasmin, in excess it becomes toxic to living organisms (Moore and Ramamoorthy 1984). Like many other metals, copper produces cellular oxidative stress due to the production of reactive oxygen species, ROS (Valko et al. 2005). Copper salts are frequently used as aquatic herbicides, algicides, fungicides and bactericides (Mount 1968; Newman and Unger 2003). Mining activity for this valuable metal increased in the latter half of the twentieth century with 307 million metric tons being produced after 1980, thus increasing copper pollution worldwide. Water pollution by copper is chiefly associated with mining activities, fertil- izer production, municipal and industrial sewage, materials released from brake pads in road runoff and its use as a biocide in antifouling paints. In water, copper is easily bound to particulate and organic matter, but a small pro- portion remains in soluble form and this is especially toxic to fish. Soluble copper concentrations range from 0.5 to 2.0 lg/L in uncontaminated freshwater and can reach 2,000 lg/L in contaminated waters close to the mines (David 2003; Moore and Ramamoorthy 1984; Newman and Unger 2003). S. S. Lewis S. J. Keller (&) Department of Biological Sciences, University of Cincinnati, Cincinnati, OH 45221, USA e-mail: [email protected] 123 Ecotoxicology (2009) 18:281–292 DOI 10.1007/s10646-008-0280-3
-
Upload
independent -
Category
Documents
-
view
1 -
download
0
Transcript of Identification of copper-responsive genes in an early life stage of the fathead minnow Pimephales...

Identification of copper-responsive genes in an early life stageof the fathead minnow Pimephales promelas
Solange S. Lewis Æ Stephen J. Keller
Accepted: 28 October 2008 / Published online: 20 November 2008
� Springer Science+Business Media, LLC 2008
Abstract While physiological changes associated with
copper toxicity have been studied in adult fathead minnow,
Pimephales promelas, little is known about the effect of
copper on newly hatched larvae. As a result we initiated an
investigation on the mechanism of copper toxicity in 24 h
post-hatch larvae using gene expression changes to identify
responsive genes. Fish were exposed to copper concentra-
tions of 0, 50, 125 and 200 lg/L in a 48 h toxicity test.
Total RNA from survivors was used in a differential dis-
play assay to screen for differentially expressed gene
products. Altogether, 654 copper-responsive differentially
expressed bands were collected. Database searches found
homology for 261 sequences. One hundred and sixty-one
bands were homologous to NCBI genes of known function,
of which 69 were individual genes. The most abundant
categories of functional genes responding to copper were
involved in protein synthesis/translational machinery and
contractile proteins. Twenty-one dose-responsive genes
were measured for expression changes using real-time
quantitative PCR. Differential gene expression was vali-
dated for 11 of 13 genes, when a 1.2 times qPCR difference
between the copper and control samples was observed.
Transcripts identified as titin, cytochrome b, fast muscle
specific heavy myosin chain 4, fast muscle troponin I,
proteasome 26S subunit and troponin T3a were induced
over twofold. Differential display bands identified as 60S
ribosomal proteins L27 and L12 were repressed approxi-
mately threefold. We conclude that copper exposure affects
several cellular pathways in larval fathead minnows with
protein synthesis, ribosome structure, and muscle contrac-
tile proteins being the most sensitive to this stress.
Keywords Fathead minnow � Differential display �Gene expression � qPCR � Copper � Stress
Introduction
Among metals, copper is the second most toxic metal to
fish after mercury. Even though copper is an essential
cofactor of the biological molecules hemocyanin, cyto-
chrome oxidase, tyrosinase, laccase and ceruloplasmin, in
excess it becomes toxic to living organisms (Moore and
Ramamoorthy 1984). Like many other metals, copper
produces cellular oxidative stress due to the production of
reactive oxygen species, ROS (Valko et al. 2005). Copper
salts are frequently used as aquatic herbicides, algicides,
fungicides and bactericides (Mount 1968; Newman and
Unger 2003). Mining activity for this valuable metal
increased in the latter half of the twentieth century with
307 million metric tons being produced after 1980, thus
increasing copper pollution worldwide. Water pollution by
copper is chiefly associated with mining activities, fertil-
izer production, municipal and industrial sewage, materials
released from brake pads in road runoff and its use as a
biocide in antifouling paints. In water, copper is easily
bound to particulate and organic matter, but a small pro-
portion remains in soluble form and this is especially toxic
to fish. Soluble copper concentrations range from 0.5 to
2.0 lg/L in uncontaminated freshwater and can reach
2,000 lg/L in contaminated waters close to the mines
(David 2003; Moore and Ramamoorthy 1984; Newman
and Unger 2003).
S. S. Lewis � S. J. Keller (&)
Department of Biological Sciences, University of Cincinnati,
Cincinnati, OH 45221, USA
e-mail: [email protected]
123
Ecotoxicology (2009) 18:281–292
DOI 10.1007/s10646-008-0280-3

Copper is very toxic to fish with a typical 96 h LC50
value ranging from 0.017 to 1.0 mg/L for most freshwater
fish species (Moore and Ramamoorthy 1984). In copper
toxicity tests, the 96 h median tolerance limit (TLm) for
adult fathead minnows was found to be between 430 and
470 lg/L, while concentrations as low as 11–33 lg/L
affected reproduction, growth and spawning (Mount 1968).
To some extent, the physiological effects of copper toxicity
have been characterized in adult fish. Copper precipitates
mucus secretions from the gills ultimately resulting in
asphyxiation (Carpenter 1927; Karan et al. 1998; Stokes
1979). When copper exposures are acute, gills tend to be
the site of copper accumulation as well as the primary
target organ for toxicity. Due to gill tissue damage, there is
a negative effect on respiratory gas exchange (Baker 1969;
Taylor et al. 1996). A reduced oxygen supply in the fish
leads to acidosis, a switch to anaerobic metabolism and the
accumulation of lactic acid. Gill damage also causes a toxic
buildup of ammonia due to a decrease in diffusion. Other
organs including the liver, kidneys and sensory organs are
damaged by copper exposure (Baker 1969; Gardner and
LaRoche 1973). Over long periods of copper exposure, the
liver and kidneys accumulate this metal whereas the mus-
cles contain relatively low levels (Stokes 1979).
While the mechanism of copper toxicity in adult fish has
been studied at the tissue level, the physiological effects of
copper in fish larvae are not known, except for the devel-
opmental abnormalities associated with long-term exposure.
Chronic exposure of the eggs and larvae to copper concen-
trations greater than 338 lg/L resulted in a decreased
growth rate and a high incidence of developmental abnor-
malities such as failure of eyes to emerge from enclosed
tissue, deformed maxillary bones and mandibles, malformed
lower jaws, misshapen fins reduced in size, kyphosis, lor-
dosis, scoliosis, eye defects in orientation, defective lenses
and microphthalmia (Scudder et al. 1988). More recently,
Brooks et al. (2006) have shown that adults and larvae bind
copper differently suggesting that there are probably dif-
ferent biochemical targets. Many of the adult organs are not
yet formed, so that this might explain the differences
between the larvae and adult. For example, the epithelial
layer of the skin is the site for respiratory gas exchange in
larval fish because the gills are not fully formed at the newly
hatched developmental stage (Blaxter 1988; Devlin et al.
1996). Larval fish have a liver, but the kidneys are not
developed. While ammonia toxicity is induced by copper
exposure in adult fish, teleosts are able to convert ammonia
to urea during early developmental stages and so may be
able to cope with increased plasma ammonia concentrations
(Wright et al. 1995). Because of the lack of complete
development of some larval stage organs and because of
different physiology, we expect a different response of lar-
vae to any stressor when compared with adult fish.
Different life stages of the fathead minnow, Pimephales
promelas, are routinely used to evaluate the potential
hazard posed by environmental pollutants to freshwater fish
in North America (Weber 1993). The early post-hatch stage
is considered one of the most sensitive to environmental
stress due to the loss of the protective chorionic layer of the
egg and its developmental immaturity (Kyle 1926; McKim
1977; McKim et al. 1978). Many studies have successfully
utilized transcriptional profiles to identify specific bio-
marker genes that respond to toxicants in a variety of
organisms (Bartosiewicz et al. 2001; Denslow et al. 2001).
In our study, differential display (Liang and Pardee 1992)
was used to identify candidate genes that showed a
response to copper. Differential display is a technique that
can be used without prior knowledge of an organism’s
genome and hence was ideal for working with the partially
characterized genome of the fathead minnow (Wintz et al.
2006; Larkin et al. 2007). The purpose of this study was to
characterize copper-induced transcriptional changes in fish
larvae and to compare this expression profile to other stress
studies in fish. To gain an insight into the various physio-
logical responses to stress, fathead minnow larvae aged
\24 h post-hatch were exposed to copper for 48 h and
analyzed to identify differentially expressed transcripts.
Materials and methods
Exposure to copper
The fathead minnows used in this experiment were from
the Newtown-USEPA stock population and the copper
exposures were carried out in the Andrew W. Breidenbach
Environmental Research Center in Cincinnati, OH, USA.
Between 100 and 250 fathead minnow larvae \24 h post-
hatch were exposed to copper concentrations of 0, 50, 125
and 200 lg/L in moderately hard reconstituted water in a
48 h static renewal test. The water was changed after 24 h
using criteria described by Weber (1993). The stock solu-
tion of 1 mg copper sulfate per mL was used to prepare
each test solution. Each treatment group was split into
several replicates to maintain a fish density of 25 individ-
uals per container that held 300 mL of test solution. The
copperless control used four containers, 50 lg/L copper
used five containers, 125 lg/L copper used six containers
and 200 lg/L copper used ten containers. Dead larvae were
removed from the test chambers during the water changes
and at the conclusion of the test. Larvae were not fed either
before or during the copper exposure because nutrition was
still available from their yolk sacs. Water chemistry at the
start and conclusion of the experiment was measured in
terms of pH, dissolved oxygen, conductivity and temper-
ature. The copper concentrations and fish density for each
282 S. S. Lewis, S. J. Keller
123

treatment were expected to provide *100 surviving larvae
from each treatment group, with the aim of pooling
*50 fish for two biological replicates within each treat-
ment group. To this end, there were 100 total survivors
from the control group, 110 total survivors from the
50 lg/L copper treatment, 110 total survivors from the
125 lg/L copper treatment, and 140 total survivors from
the 200 lg/L copper treatment. The survivors from each
treatment were divided into two biological replicates by
combining fish from half of the containers to make one of
the replicates. RNA was isolated from each biological
replicate within an hour of its collection.
RNA isolation
Each biological replicate was collected in a single tube and
the larvae were homogenized in Tri-Reagent LS (MRC
Inc., Cincinnati, OH, USA) following the manufacturer’s
protocol with an additional ethanol precipitation step.
Isolated RNA was treated with DNase I (Ambion, Austin,
TX, USA). RNA concentration and purity were measured
using a spectrophotometer to ensure that the 260/280 nm
ratios were above 1.8. All the RNA samples were also
analyzed for integrity on a 1.5% formaldehyde–agarose gel
as assessed by the intensities of the 28S and 18S ribosomal
RNA (rRNA) bands. The RNA was distributed into ali-
quots and stored at -80�C until used for differential
display or real-time quantitative PCR.
Differential display
Differential display on each of the two biological replicates
from each treatment group was performed using the flu-
oroDD HIEROGLYPH mRNA Profile Kit System for
Differential Display (Beckman Coulter Inc., Fullerton, CA,
USA) following the manufacturer’s protocols. Total RNA
(0.1 lg/lL) from each replicate was converted to cDNA
using T7-tagged anchored oligo-dT primers 1–6 (10 lM),
SuperScript II reverse transcriptase (200 units/lL) and
1 mM dinucleotide triphosphates (dNTPs) from the kit.
Polymerase chain reactions (PCRs) were performed with
the same anchored oligo-dT primers (10 lM) labeled with
a fluorescent dye, an M13-tagged 50 random primer (2 lM)
and 1 mM dNTPs. Reactions were heated at 95�C for
2 min, followed by 4 cycles of 92�C for 15 s, 50�C for 30 s
and 72�C for 2 min. This was followed by 30 cycles of
92�C for 15 s, 60�C for 30 s and 72�C for 2 min. There
was a further extension step at 72�C for 7 min. The cDNA
products were resolved on 5.6% denaturing urea poly-
acrylamide gels. Gels were scanned on a GenomyxLT
Fluorescent Imaging Scanner. The candidate bands were
excised from urea-free dried gels, dissolved in 50 lL TLE
buffer (10 mM Tris, 0.1 mM EDTA) and reamplified by
PCR using T7 and M13 primers (2 lM each). The ream-
plified products were run on a 1.5% agarose gel, excised,
purified using the MinElute kit (Qiagen Inc., Valencia, CA,
USA), and sequenced using the BigDye kit (Applied Bio-
systems, Foster City, CA, USA) and 2 lM of M13 primer.
The sequenced products were purified using Performa DTR
gel filtration cartridges (Edge BioSystems, Gaithersburg,
MD, USA) and read on an ABI 3100 Automated Capillary
DNA Sequencer (Applied Biosystems, Foster City, CA,
USA). Database searches were performed to determine the
identity of sequences using the BLASTN tool (Altschul
et al. 1997). Sequence quality was considered high if the
nucleotide reads were over 200 bp long and were evidently
the result of a single reamplified product. BLAST matches
of query sequences were considered significant if the cor-
responding E-value was \10-4.
Validation of differentially expressed cDNA fragments
using real-time qPCR
Real-time qPCR (Opticon 2, MJ Research/Bio-Rad Labo-
ratories, Waltham, MA, USA) was used to validate the
differential expression of 21 candidate genes in 200 lg/L
copper-treated replicates compared to those in the control
replicates of 0 lg/L copper. These candidates were selected
because they appeared to have a dose-response associated
with copper as assessed by differential display, and were
also identified by the same technique in response to zinc
and/or thermal stress (Lewis 2005). The primers for the 21
selected cDNAs were designed using the Primer Express
v2.0 software (Applied Biosystems, Foster City, CA, USA).
The sequences are summarized in Table 1.
The endogenous standard used to normalize gene
expression data was 18S rRNA. The universal primers and
competimer for 18S rRNA were obtained from the
QuantumRNA 18S Internal Standards Kit (Ambion Inc.,
Austin, TX, USA). Total RNA (1–2 lg) from each repli-
cate of pooled fish larvae was reverse transcribed with
MMLV-RT, 10 mM dNTPs and 30 lM random nonamers
from the ProtoScript First Strand cDNA Synthesis Kit
(New England BioLabs, Beverly, MA, USA). A diluted 1:5
solution of the cDNA was used to perform real-time qPCR
using the Platinum SYBR Green qPCR SuperMix-UDG kit
(Invitrogen, Carlsbad, CA, USA) according to the manu-
facturer’s instructions, modified to include 0.01% Tween
20, 0.025% DMSO and 0.1% glycerol. The concentration
of each primer was 4 lM. For reactions with 18S rRNA,
4 lL of 3:7 primer:competimer mixture were used in each
25 lL reaction. The PCR reaction had two initial steps of
50�C for 2 min and 95�C for 10 min, followed by 45 cycles
of 95�C for 30 s, 57�C for 60 s and 72�C for 30 s. The 45
cycles were followed by a melting curve analysis from 65
to 92�C to ensure that a single product was formed in the
Identification of copper-responsive genes in Pimephales promelas 283
123
reaction and that the melting temperature of the amplicon
corresponded to its expected G/C content. The relative
quantification method (2-DDCT) was used to calculate fold-
changes in gene expression using the actual reaction effi-
ciency values for each primer pair (estimated from
preliminary experiments) instead of assuming 100%
amplification efficiency. Each of the biological replicates
(n = 2) was assayed in triplicate and a mean Ct and the
standard error of the mean were calculated. A fold change
of 1.0 represents no change between copper treatment and
the controls (Livak and Schmittgen 2001). Note the fold
change of down-regulated messages has been calculated as
the reciprocal of the expression level relative to the control
level. The fold change for up-regulated messages is equal
to the expression level relative to the control level.
Results
Survival of fish exposed to copper
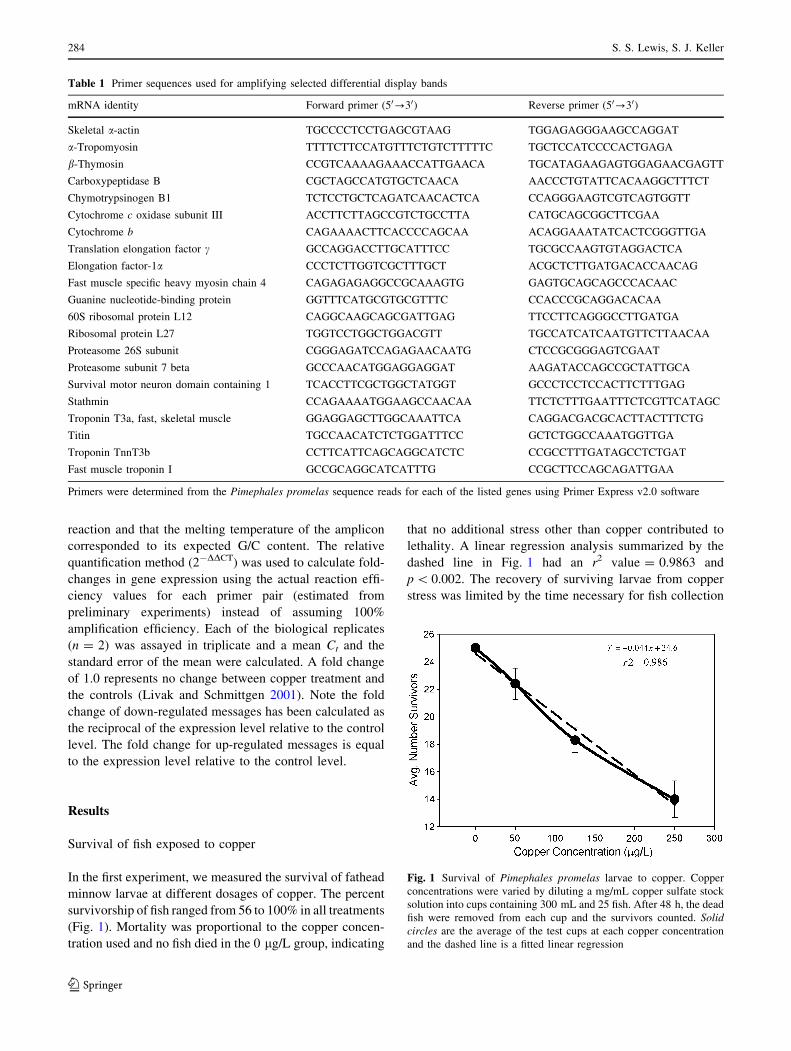
In the first experiment, we measured the survival of fathead
minnow larvae at different dosages of copper. The percent
survivorship of fish ranged from 56 to 100% in all treatments
(Fig. 1). Mortality was proportional to the copper concen-
tration used and no fish died in the 0 lg/L group, indicating
that no additional stress other than copper contributed to
lethality. A linear regression analysis summarized by the
dashed line in Fig. 1 had an r2 value = 0.9863 and
p \ 0.002. The recovery of surviving larvae from copper
stress was limited by the time necessary for fish collection
Table 1 Primer sequences used for amplifying selected differential display bands
mRNA identity Forward primer (50?30) Reverse primer (50?30)
Skeletal a-actin TGCCCCTCCTGAGCGTAAG TGGAGAGGGAAGCCAGGAT
a-Tropomyosin TTTTCTTCCATGTTTCTGTCTTTTTC TGCTCCATCCCCACTGAGA
b-Thymosin CCGTCAAAAGAAACCATTGAACA TGCATAGAAGAGTGGAGAACGAGTT
Carboxypeptidase B CGCTAGCCATGTGCTCAACA AACCCTGTATTCACAAGGCTTTCT
Chymotrypsinogen B1 TCTCCTGCTCAGATCAACACTCA CCAGGGAAGTCGTCAGTGGTT
Cytochrome c oxidase subunit III ACCTTCTTAGCCGTCTGCCTTA CATGCAGCGGCTTCGAA
Cytochrome b CAGAAAACTTCACCCCAGCAA ACAGGAAATATCACTCGGGTTGA
Translation elongation factor c GCCAGGACCTTGCATTTCC TGCGCCAAGTGTAGGACTCA
Elongation factor-1a CCCTCTTGGTCGCTTTGCT ACGCTCTTGATGACACCAACAG
Fast muscle specific heavy myosin chain 4 CAGAGAGAGGCCGCAAAGTG GAGTGCAGCAGCCCACAAC
Guanine nucleotide-binding protein GGTTTCATGCGTGCGTTTC CCACCCGCAGGACACAA
60S ribosomal protein L12 CAGGCAAGCAGCGATTGAG TTCCTTCAGGGCCTTGATGA
Ribosomal protein L27 TGGTCCTGGCTGGACGTT TGCCATCATCAATGTTCTTAACAA
Proteasome 26S subunit CGGGAGATCCAGAGAACAATG CTCCGCGGGAGTCGAAT
Proteasome subunit 7 beta GCCCAACATGGAGGAGGAT AAGATACCAGCCGCTATTGCA
Survival motor neuron domain containing 1 TCACCTTCGCTGGCTATGGT GCCCTCCTCCACTTCTTTGAG
Stathmin CCAGAAAATGGAAGCCAACAA TTCTCTTTGAATTTCTCGTTCATAGC
Troponin T3a, fast, skeletal muscle GGAGGAGCTTGGCAAATTCA CAGGACGACGCACTTACTTTCTG
Titin TGCCAACATCTCTGGATTTCC GCTCTGGCCAAATGGTTGA
Troponin TnnT3b CCTTCATTCAGCAGGCATCTC CCGCCTTTGATAGCCTCTGAT
Fast muscle troponin I GCCGCAGGCATCATTTG CCGCTTCCAGCAGATTGAA
Primers were determined from the Pimephales promelas sequence reads for each of the listed genes using Primer Express v2.0 software
Fig. 1 Survival of Pimephales promelas larvae to copper. Copper
concentrations were varied by diluting a mg/mL copper sulfate stock
solution into cups containing 300 mL and 25 fish. After 48 h, the dead
fish were removed from each cup and the survivors counted. Solidcircles are the average of the test cups at each copper concentration
and the dashed line is a fitted linear regression
284 S. S. Lewis, S. J. Keller
123

(*1 h). Other than copper concentration, there were no
major differences in water chemistry between different
treatment groups. In all experimental containers, the pH of
the water was 8.02–8.23, dissolved oxygen had a range of
7.6–8.3 mg/L, conductivity was 298–320 lS/cm and tem-
perature was maintained between 24 and 25�C throughout
the 48 h experiment. Extrapolation of the linear regression
in Fig. 1 yielded an estimated copper LD50 = 280 lg/L
for the 96 h larvae. This is consistent with Scudder et al.
(1988), who shows that the 96 h LC50 value for copper was
250 lg/L in larval fathead minnows.
Identification of copper-responsive genes
by differential display
Gene expression between control fish and copper-exposed
fish for three doses was compared by differential display
using two biological replicates within each treatment. It is
usually recommended that two independent samples from
the same treatment group be run in a differential display
gel to minimize the collection of false positives (Liang and
Pardee 1992; Sompayrac et al. 1995). When both replicate
samples from a single treatment group visually showed
similar intensity changes compared to other treatments,
they were selected for further analysis. A portion of a
representative gel (Fig. 2) shows similar bands in lanes
loaded with cDNA recovered from the 200 lg/L copper
treatment. By visual observation, both the 200 lg/L sample
cDNA bands are darker in intensity compared to other
bands isolated from lower copper exposures in the same
row. Therefore, these bands were denoted as up-regulated
by the 200 lg/L copper treatment of the larvae. In the row
below, cDNA band intensity is lighter in samples from the
higher copper-treated larvae and hence the band recovered
from this row would have been denoted as a down-regu-
lated candidate. There was little variation in the band
intensity across the two biological replicates in all of the
2,197 rows of bands resolved by differential display using
40 different random primer combinations. Figure 3
summarizes the selection of differentially expressed bands
through the complete analysis. A comparison of the bio-
logical replicates indicated that fewer than 1% of the 2,197
cDNA bands showed intensity variations. Six hundred and
fifty-four cDNAs of the 2,197 bands were differentially
expressed in copper treated samples and were isolated for
DNA sequencing. The copper-responsive bands were
selected for further analysis only if there was an identical
change in band intensity in both biological replicates
within a treatment group. Some bands showed visually
observable intensity changes in all copper-treated groups
relative to controls, while others showed band intensity
changes only in fish exposed to higher doses of copper
(Fig. 2). If the bands showed intensity changes in replicates
at the highest dosage (bands were either lighter or darker
relative to controls), they were designated as ‘‘dose-
responsive’’.
Of the 654 copper-responsive bands that we collected,
261 cDNA fragments yielded clear sequence data with
accurate reads over 200 bp. One hundred and sixty-one of
the differentially expressed bands had an E-value \ 0.0001
to genes deposited at the NCBI Genbank database.
Inspection of 161 cDNAs indicated that they could be
organized into 69 annotated genes. Of the 261 copper
induced cDNA differential display bands, 155 of these
bands matched with significant homology to 38 of the 69
annotated genes in Genbank. One message is known to
give rise to more than one cDNA and is a common problem
in differential display (Linskens et al. 1995). A flow dia-
gram summarizing the selection of bands for analysis is
presented in Fig. 3. In addition to the genes that had
E-values \0.0001 to annotated genes, we found 67
un-annotated sequences and 8 cDNAs with no homologies
at all. The 69 annotated differential display-derived bands
that responded to copper had high quality sequence reads.
The annotated genes and their induction or repression by
copper are listed in Table 2. Note that the directional
change in gene expression for an identified band was not
always consistent when a gene was identified multiple
Fig. 2 Portion of a representative differential display gel. Differential
display was performed using the cDNA samples prepared from *50
fish larvae from each exposure group. The arrows denote up regulated
or down regulated bands at different copper concentrations compared
to controls
Fig. 3 Analysis of differentially displayed bands in response to
copper. Summary of the differentially displayed bands from their
initial selection on the display gels to the validation by qPCR
Identification of copper-responsive genes in Pimephales promelas 285
123
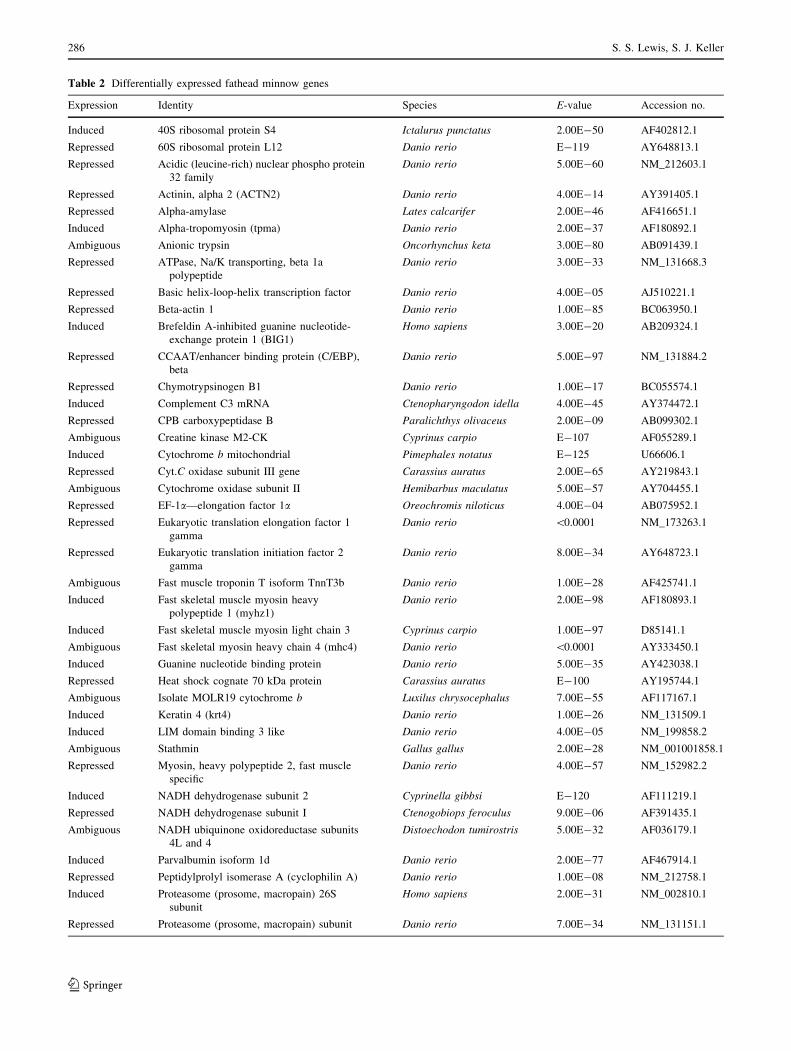
Table 2 Differentially expressed fathead minnow genes
Expression Identity Species E-value Accession no.
Induced 40S ribosomal protein S4 Ictalurus punctatus 2.00E-50 AF402812.1
Repressed 60S ribosomal protein L12 Danio rerio E-119 AY648813.1
Repressed Acidic (leucine-rich) nuclear phospho protein
32 family
Danio rerio 5.00E-60 NM_212603.1
Repressed Actinin, alpha 2 (ACTN2) Danio rerio 4.00E-14 AY391405.1
Repressed Alpha-amylase Lates calcarifer 2.00E-46 AF416651.1
Induced Alpha-tropomyosin (tpma) Danio rerio 2.00E-37 AF180892.1
Ambiguous Anionic trypsin Oncorhynchus keta 3.00E-80 AB091439.1
Repressed ATPase, Na/K transporting, beta 1a
polypeptide
Danio rerio 3.00E-33 NM_131668.3
Repressed Basic helix-loop-helix transcription factor Danio rerio 4.00E-05 AJ510221.1
Repressed Beta-actin 1 Danio rerio 1.00E-85 BC063950.1
Induced Brefeldin A-inhibited guanine nucleotide-
exchange protein 1 (BIG1)
Homo sapiens 3.00E-20 AB209324.1
Repressed CCAAT/enhancer binding protein (C/EBP),
beta
Danio rerio 5.00E-97 NM_131884.2
Repressed Chymotrypsinogen B1 Danio rerio 1.00E-17 BC055574.1
Induced Complement C3 mRNA Ctenopharyngodon idella 4.00E-45 AY374472.1
Repressed CPB carboxypeptidase B Paralichthys olivaceus 2.00E-09 AB099302.1
Ambiguous Creatine kinase M2-CK Cyprinus carpio E-107 AF055289.1
Induced Cytochrome b mitochondrial Pimephales notatus E-125 U66606.1
Repressed Cyt.C oxidase subunit III gene Carassius auratus 2.00E-65 AY219843.1
Ambiguous Cytochrome oxidase subunit II Hemibarbus maculatus 5.00E-57 AY704455.1
Repressed EF-1a—elongation factor 1a Oreochromis niloticus 4.00E-04 AB075952.1
Repressed Eukaryotic translation elongation factor 1
gamma
Danio rerio \0.0001 NM_173263.1
Repressed Eukaryotic translation initiation factor 2
gamma
Danio rerio 8.00E-34 AY648723.1
Ambiguous Fast muscle troponin T isoform TnnT3b Danio rerio 1.00E-28 AF425741.1
Induced Fast skeletal muscle myosin heavy
polypeptide 1 (myhz1)
Danio rerio 2.00E-98 AF180893.1
Induced Fast skeletal muscle myosin light chain 3 Cyprinus carpio 1.00E-97 D85141.1
Ambiguous Fast skeletal myosin heavy chain 4 (mhc4) Danio rerio \0.0001 AY333450.1
Induced Guanine nucleotide binding protein Danio rerio 5.00E-35 AY423038.1
Repressed Heat shock cognate 70 kDa protein Carassius auratus E-100 AY195744.1
Ambiguous Isolate MOLR19 cytochrome b Luxilus chrysocephalus 7.00E-55 AF117167.1
Induced Keratin 4 (krt4) Danio rerio 1.00E-26 NM_131509.1
Induced LIM domain binding 3 like Danio rerio 4.00E-05 NM_199858.2
Ambiguous Stathmin Gallus gallus 2.00E-28 NM_001001858.1
Repressed Myosin, heavy polypeptide 2, fast muscle
specific
Danio rerio 4.00E-57 NM_152982.2
Induced NADH dehydrogenase subunit 2 Cyprinella gibbsi E-120 AF111219.1
Repressed NADH dehydrogenase subunit I Ctenogobiops feroculus 9.00E-06 AF391435.1
Ambiguous NADH ubiquinone oxidoreductase subunits
4L and 4
Distoechodon tumirostris 5.00E-32 AF036179.1
Induced Parvalbumin isoform 1d Danio rerio 2.00E-77 AF467914.1
Repressed Peptidylprolyl isomerase A (cyclophilin A) Danio rerio 1.00E-08 NM_212758.1
Induced Proteasome (prosome, macropain) 26S
subunit
Homo sapiens 2.00E-31 NM_002810.1
Repressed Proteasome (prosome, macropain) subunit Danio rerio 7.00E-34 NM_131151.1
286 S. S. Lewis, S. J. Keller
123

times by different primers on different gels. In Tables 2
and 3, these bands are listed as ‘‘ambiguous’’ in their
expression response to copper. Of the 38 genes that con-
tributed to redundant bands, 19 had consistent expression
changes and 19 were ambiguous in expression.
Ontology of the copper sensitive genes
The 69 copper sensitive annotated gene sequences from the
P. promelas larvae were analyzed by submitting the gene
list to Gene Ontology Tree Machine (GOTM). GOTM is a
web-based platform for interpreting gene sets using Gene
Ontology (GO) hierarchies. The P. promelas gene list
consisted of 31 repressed genes, 23 induced genes and 15
genes that were ambiguous in their response to copper
(Table 2). These genes were compared to the genome of
Danio rerio using GOTM’s hypergeometric test. The
resulting default analysis at level 4 is summarized in the bar
chart of Fig. 4. Altogether 33 GO classes were found to be
significant at p \ 0.01. Two copper targets were identified
at a level 6 analysis, each having p \ 0.0002: (1) the
ribosome/protein synthesis genes, and (2) the cytoskeleton/
contractile fiber genes. These two targets accounted for
50% of all the copper sensitive sequences. The ribosome/
Table 2 continued
Expression Identity Species E-value Accession no.
Ambiguous Proteasome subunit beta 7 Danio rerio 1.00E-62 AF155581.1
Repressed Protocadherin-9 (PCDH9) Homo sapiens 2.00E-07 NM_020403.3
Repressed Ribosomal protein L18 Ictalurus punctatus 4.00E-33 AF401572.1
Repressed Ribosomal protein L21 Ictalurus punctatus 2.00E-64 AF401575
Induced Ribosomal protein L26 Ictalurus punctatus E-164 AF401580.1
Repressed Ribosomal protein L27 Ictalurus punctatus E-122 AF401581.1
Ambiguous Ribosomal protein L37a Ictalurus punctatus 3.00E-70 AF401594.1
Repressed Ribosomal protein L4 Danio rerio E-178 BC049520.1
Repressed Ribosomal protein L5b Ictalurus punctatus 1.00E-16 AF401557
Ambiguous Ribosomal protein L7 Danio rerio \0.0001 NM_213644.1
Induced Ribosomal protein L7a Ictalurus punctatus 5.00E-35 AF401560.1
Repressed Ribosomal protein S15 Danio rerio 1.00E-04 NM_001001819.1
Ambiguous Ribosomal protein S25 Danio rerio 4.00E-08 NM_200815.1
Ambiguous Ribosomal protein S3A Danio rerio 2.00E-53 NM_200059.1
Induced Ribosomal protein S5 (rps5) Danio rerio 1.00E-17 NM_173232.1
Repressed Similar to ATP synthase H? transporting
mitochondrial FO complex subunit b,
isoform 1
Xenopus laevis 2.00E-06 BC048772.1
Repressed Similar to neuronal transmembrane protein
Slitrk4
Gallus gallus 3.00E-05 XM_420266.1
Repressed Skeletal muscle alpha-actin Cyprinus carpio 7.00E-53 D50028.1
Ambiguous Survival motor neuron domain containing 1
(smndc1),
Danio rerio 2.00E-52 NM_212601.1
Induced Synaptotagmin 1 Rattus rattus 1.00E-69 AJ617615.1
Repressed Thymosin, beta 4, X chromosome Mus musculus 8.00E-09 NM_021278.1
Induced Titin Danio rerio 3.00E-17 AY081167.1
Induced Transforming acidic coiled-containing
protein 2 (TACC2)
Rattus norvegicus 3.00E-21 NM_001004415.1
Ambiguous Translation elongation factor 2 Danio rerio 4.00E-45 AY391422.1
Induced Translation initiation factor 2 Danio rerio 7.00E-19 AY648723.1
Induced Troponin T3a, skeletal fast Danio rerio 3.00E-51 BC053304.1
Induced Type I keratin Danio rerio 5.00E-35 AF174137.1
Repressed Type II cytokeratin (ckii) mRNA Danio rerio 1.00E-07 NM_131156.1
Induced Ubiquinol–cytochrome c reductase core I
protein
Oncorhynchus mykiss 2.00E-37 AF465782.1
cDNA bands which appeared to be induced or repressed by exposure to copper were sequenced and homologies were found in the NCBI
Genbank database having an E-value \ 0.001. Several cDNAs showed both an induction and repression and are designated as ambiguous
Identification of copper-responsive genes in Pimephales promelas 287
123

protein synthesis target was made up of 20 genes, of which
5 were induced, 10 repressed and 5 ambiguous. The cyto-
skeleton/contractile fiber target was made up of 15 genes, of
which 8 were induced, 5 repressed and 2 ambiguous.
Validation of copper altered gene expression
using real-time qPCR
It is necessary to validate observed gene expression chan-
ges in differential display using an alternative more
sensitive technique because a portion of the genes identi-
fied by this method are expected to be false positives
(Linskens et al. 1995). One such alternative technique is
real-time quantitative PCR (qPCR) using gene-specific
primers. Twenty-one of the 200 lg/L dose-responsive
copper genes were arbitrarily selected from the 69 anno-
tated cDNAs for validation. Six of the 21 genes were
induced by copper, 9 genes were repressed and 6 genes
were ambiguous in their gene expression. Untreated copper
control samples were taken as well. The total RNA isolated
from treated and control larvae was reverse transcribed
with random nonamers and used for both differential dis-
play and the qPCR experiments. An internal 18S rRNA
was used to normalize qPCR expression levels. The 18S
rRNA standard was averaged over all the non-treated
controls and the copper treated experimental samples. No
significant difference was noted between the control and
experimental 18S rRNA samples. An identical result was
obtained by measuring the 18S rRNA in different samples
with a RNA 6000 Agilent Nano Labchip (data not shown).
Thus a comparison of the gene levels in the experimental
versus the untreated controls was a consequence of the
change in the level of the gene mRNA. The calculated fold-
change differences for all 21 genes tested are summarized
in Table 3.
Out of the 15 genes whose expression was clearly
induced or repressed in differential display, 11 were vali-
dated by qPCR for the correct directional change in
expression. Two genes, eukaryotic translation elongation
factor gamma and chymotrypsinogen B1, did not have a
greater than a 1.1-fold change difference in qPCR in order
Table 3 Gene expression levels measured by real-time qPCR
mRNA identity Differential display
gel response
Real-time PCR
response
Expression relative
to control (±SE)
Fold-change
Aldolase B Ambiguous Downregulated 0.561 (±0.0318) 1.781
Skeletal a-actin Downregulated Upregulated 1.638 (±0.0063) 1.638
a-Tropomyosin Upregulated Upregulated 1.214 (±0.0198) 1.214
b-Thymosin Downregulated Upregulated 1.482 (±0.0858) 1.482
Carboxypeptidase B Downregulated Downregulated 0.397 (±0.1454) 2.515
Chymotrypsinogen B1 Downregulated Upregulated 1.099 (±0.0060) 1.099
Cytochrome c oxidase subunit III Downregulated Downregulated 0.421 (±0.0801) 2.373
Cytochrome b Upregulated Upregulated 3.685 (±0.0126) 3.685
Elongation factor-1a Downregulated Downregulated 0.539 (±0.0522) 1.853
Eukaryotic translation elongation factor c Downregulated Upregulated 1.035 (±0.0038) 1.035
Guanine nucleotide-binding protein Upregulated Upregulated 1.155 (±0.0039) 1.155
Fast muscle specific heavy myosin chain 4 Ambiguous Upregulated 3.119 (±0.1254) 3.119
60S ribosomal protein L12 Downregulated Downregulated 0.341 (±0.0040) 2.932
Ribosomal protein L27 Downregulated Downregulated 0.195 (±0.0202) 5.128
Proteasome 26S subunit Upregulated Upregulated 2.448 (±0.0175) 2.448
Proteasome subunit 7 beta Ambiguous Upregulated 1.407 (±0.0086) 1.407
Survival motor neuron domain containing 1 Ambiguous Upregulated 1.965 (±0.0122) 1.965
Stathmin Ambiguous Upregulated 1.718 (±0.0172) 1.718
Troponin T3a, fast, skeletal muscle Upregulated Upregulated 2.161 (±0.0135) 2.161
Titin Upregulated Upregulated 11.595 (±0.1768) 11.595
Troponin TnnT3b Ambiguous Downregulated 0.883 (±0.0059) 1.132
Fast muscle troponin I Ambiguous Upregulated 2.898 (±0.0241) 2.898
Twenty-one of the fathead minnow DNA sequences that were found to have homology in the NCBI Genbank were arbitrarily selected for qPCR
analyses. Each gene was assayed 3 times in each of the two biological duplicates using the 200 lg/lL RNA samples. The results are reported
relative to untreated controls using 2-DDCT to calculate the expression levels. Fold changes are reported as positive for both increased and
decreased RNAs relative to the control
288 S. S. Lewis, S. J. Keller
123

to be considered informative (Livak and Schmittgen 2001).
Two genes were clearly in conflict between differential
display and qPCR; skeletal a-actin and b-thymosin. Thus
when there was a clear unambiguous induction or repres-
sion in differential display, it was validated in 11 samples,
unresolved in 2 samples, and contradicted in 2 samples.
When the fold-change criterion in qPCR was raised to 1.7,
a value commonly used in microarray data, all the genes
had the same directional change in expression in both
qPCR and differential display (Tan et al. 2002; Ton et al.
2002). Real time qPCR indicates that genes encoding
contractile proteins such as fast muscle specific myosin
heavy chain 4, troponin T3a, fast muscle troponin I and
titin were all induced by copper exposure. Among mito-
chondrial genes, cytochrome c oxidase subunit III was
repressed while cytochrome b was induced. The genes
encoding translational machinery/protein expression pro-
teins were down-regulated by copper and included
elongation factor-1a, 60S ribosomal protein L12 and
ribosomal protein L27. Proteasome 26S was induced 2.45-
fold, carboxypeptidase B was repressed 2.52-fold, survival
motor neuron domain containing 1 was induced 1.96-fold
and stathmin induced 1.72-fold in response to copper
exposure.
Discussion
In this study, we investigated differential gene expression
in the fathead minnow larvae to ascertain the physiological
effects of copper toxicity in an early life stage. Inspection
of many differential display gels which used 40 different
random primer combinations indicated that copper affected
30% of the observable bands and there was very little band
variation between the experimental duplicates (Figs. 2, 3).
Almost 60% of the collected bands did not produce read-
able DNA sequences because more than one cDNA was
collected at a single band location. Moreover, of the 261
cDNAs that had clear sequences, we only could identify 69
unique annotated genes using the NCBI BLAST algorithm.
Failure to identify all the readable sequences occurred for
two reasons. First the same gene was detected by different
primer combinations. For example, 38 annotated genes in
the NCBI Genbank accounted for 155 of the 261 clear
DNA sequence reads. Secondly, there is no complete
searchable fathead minnow genome in the literature, so that
75 sequences which responded to copper could not be
associated with any annotations in the Genbank. None-
theless, we were able to examine 21 genes and confirm that
whenever differential display predicted induction or
Fig. 4 Ontology of copper-
responsive genes. The 69 genes
that were identified by
homology at NCBI were
submitted to the Gene Ontology
Tree Machine (GOTM) at
Vanderbilt University at their
web site: http://bioinfo.
vanderbilt.edu/gotm. The level
4 analysis is based on the fre-
quency of gene expression in
the Pimephales promelas versus
the complete zebrafish genome
Identification of copper-responsive genes in Pimephales promelas 289
123
repression, qPCR analysis confirmed the direction in 85%
of the sample cDNAs. When all of the annotated genes that
respond to copper are grouped by biological processes, two
larval metabolic pathways are identified by the GOTM
analysis: protein synthesis and muscle contractile fibers.
Four protein synthesis proteins showed induction by
copper exposure: ribosomal proteins S4, S5, L7a and L26.
Ribosomal protein S5 has been implicated as essential for
the accuracy of translation and ribosomal protein L26
appears to be involved in the pathway to terminate the cell
cycle and induce apoptosis. (Galkin et al. 2007; Takagi
et al. 2005). In contrast, many of the down-regulated genes
appear to be associated with the regulation of growth and
longevity (Zhang et al. 2006). These include the 40S
ribosomal protein S15, the 60S ribosomal proteins L4, L5b,
L12, L18, L21, L27, basic helix-loop-helix transcription
factor, CCAAT/enhancer binding protein, translation
elongation factors 1a and 1c, and translation initiation
factor 2c. Five different elongation factors have been
described in the metamorphoses of the Senegalese sole,
suggesting that the larval stage may require tissue specific
translation mechanisms (Infante et al. 2008). Ribosome
biogenesis in mice is known to be regulated by the mTOR
pathway (Hannan et al. 2003). The down-regulation of
several ribosomal proteins probably implies that the TOR
pathway was affected in copper-exposed fish. TOR sig-
naling has been shown to play a role in the oxidative stress
response as increased signaling increases sensitivity to the
stress (Patel and Tamanoi 2006). Therefore, the response of
protein synthesis to copper seems to be a protective
response of the organism to the damaging effects of excess
copper and is analogous to oxidative stress (Ton et al.
2003).
Genes identified in the NCBI Genbank as contractile
proteins were also affected by copper exposure. Overall
there appears to a very significant expression of contractile
protein messages in the presence of copper as compared to
the controls. For example, titin was induced over 11-fold
(Table 3). The genes encoding alpha-tropomyosin, fast
skeletal muscle myosin heavy polypeptide 1, fast skeletal
muscle myosin light chain 3, parvalbumin isoform 1d, and
troponin T3a were all induced in differential display gels.
Real-time qPCR confirmed an up-regulation of fast muscle
specific heavy myosin chain 4, troponin T3a, titin and
troponin I. The up-regulation of muscle genes is in contrast
to the down-regulation of most ribosomal protein genes.
However, titin contains a kinase domain that takes part in a
stress-response signaling pathway and also regulates the
expression of other muscle genes (Lange et al. 2005). An
important implication of copper-induced differential gene
expression for muscle protein genes is that a putative
increase or decrease in the synthesis of proteins could
disturb the myogenesis program. As a result, muscular and
cytoskeletal abnormalities are frequently observed in
young fish stressed by pollutants (Cheung et al. 2004;
Donaldson and Dye 1975; Sanders et al. 1995).
Two hour doses of non-lethal concentrations of copper
(1–50 lM CuSO4) administered to 48–96 h D. rerio larvae
induce cellular damage which is localized to neuromasts
causing apoptosis, and loss of hair cell markers (Hernandez
et al. 2006). This effect is specific to copper, as other
metals did not show these effects. Our results suggest that
copper alters the expression of several neurologically
important genes in the fathead minnow. For example, the
survival motor neuron domain containing 1 gene is induced
by exposure to copper. Survival motor neuron protein is
known to participate in stress granule formation within
cells in combination with several other proteins including
ribosomal proteins S3 and S19 (Hua and Zhou 2004).
Ribosomal protein S3A was also identified as being dif-
ferentially expressed in this study, although the expression
pattern was not consistent. A second neuronal gene induced
by copper exposure was synaptotagmin I. This protein is
associated with synaptic vesicles which play a role in
neurotransmitter release and may function as a Ca2? sensor
(Hilfiker et al. 1999). Synaptotagmin induction is associ-
ated with a variety of stresses and is inversely related to
Hsp70 expression (Fei et al. 2007; Thome et al. 2001). This
trend for decreased Hsp70 gene transcripts was also
observed in our study. Furthermore, synaptotagmin is
known to be a protein that binds copper intracellularly and
responds to stress along with fibroblast growth factor 1
(Landriscina et al. 2001). A third gene that plays a major
role in the nervous system is stathmin, which was induced
by copper in this study. Stathmin is a cytosolic phospho-
protein that regulates cell cycle progression through
microtubule depolymerization. The cell cycle is arrested if
stathmin expression becomes unbalanced by either induc-
tion or repression (Rubin and Atweh 2004). In relation to
stress, stathmin is phosphorylated possibly by mitogen-
activated protein kinases (Beretta et al. 1995). Stathmin
expression within the brain has a huge influence on
behaviors such as fear and anxiety. For example, stathmin
knockout mice show both an acquired and innate decrease
in fear reactions (Shumyatsky et al. 2005). A fourth gene,
similar to neuronal transmembrane protein Slitrk4, was
repressed in copper-exposed fish. The Slitrk genes are
thought to regulate neurite outgrowth (Aruga et al. 2003).
Therefore, exposures to 200 lg/mL copper affect the ner-
vous system potentially changing behavioral responses.
The protein chaperones Hsp70 and peptidylprolyl
isomerase A, were also down-regulated in copper-exposed
fish. However, the typical biomarker gene of metal expo-
sure, metallothionein was not affected by excessive copper.
Metallothionein normally sequesters excess metals and
plays a protective role against their toxicity in living
290 S. S. Lewis, S. J. Keller
123

organisms (Chen et al. 2004; Newman and Unger 2003).
This protein was not identified in our differential display
study, either because it was already present in large
amounts or was not altered in its expression by copper.
Another marker gene of oxidative stress, glutathione S
transferase, also was not identified in this study. The
absence of these two genes in the differential display test
may reflect that the defense mechanisms against metal
toxicity have already been set in place in the early life stage
of the fish. In zebrafish embryos metallothionein transcripts
are abundant and thought to be maternally contributed
because they play a very important role in development
(Chen et al. 2004). However, Chan et al. (2006) report a
1.5- to 3-fold induction of the metallothionein gene in 8 h
post fertilization D. rerio embryos exposed to 4 lM copper
for 24 h.
In summary, the expression of many genes was altered
by copper stress in fathead minnow larvae. The majority of
genes identified in this study encoded the structure of the
ribosome and contractile proteins. Other pathways impli-
cated in the response to copper toxicity include neuron
development, the oxidative stress response pathway, pro-
tein folding, proteolysis, PI3K pathway, MAP-kinase
pathway, and growth. Structural abnormalities are observed
in adult fish when the larvae are chronically exposed to
copper (Scudder et al. 1988). This observation may be
attributed to the perturbations in protein synthesis and the
expression of muscle contractile proteins. In addition, the
sluggish behavior and lack or responsiveness in copper
stressed fish can be attributed to the neuronal genes being
affected as well as a decrease in energy production. A
complete picture of the stress response of larval fish will
require a better definition of the P. promelas genome, a
more sensitive and accurate transcriptional assay, and an
examination of more stressors.
Acknowledgments We acknowledge the contributions of J.
Lazorchak, M. Smith, D. Lattier, M. Bagley, C. Tomlinson, R. Flick,
D. Gordon, S. Jackson, M. Brown-Augustine, R. Haugland, J. Ded-
dens, S. Keely and J. Stringer to this project. Funds for this project
have been provided by the University of Cincinnati Research Foun-
dation through the generosity of the Schlemm Family.
References
Altschul SF, Madden TL, Schaffer AA et al (1997) Gapped BLAST
and PSI-BLAST: a new generation of protein database search
programs. Nucleic Acids Res 25:3389–3402. doi:10.1093/nar/25.
17.3389
Aruga J, Yokota N, Mikoshiba K (2003) Human SLITRK family
genes: genomic organization and expression profiling in normal
brain and brain tumor tissue. Gene 315:87–94. doi:10.1016/
S0378-1119(03)00715-7
Baker JTP (1969) Histological and microscopical observations on
copper poisoning in the winter flounder (Pseudopleuronectesamericanus). J Fish Res Board Can 26:2785–2793
Bartosiewicz M, Penn S, Buckpitt A (2001) Applications of gene
arrays in environmental toxicology: fingerprints of gene regula-
tion associated with cadmium chloride, benzo (a) pyrene, and
trichloroethylene. Environ Health Perspect 109:71–74. doi:
10.2307/3434924
Beretta L, Dubois MF, Sobel A et al (1995) Stathmin is a major
substrate for mitogen-activated protein kinase during heat shock
and chemical stress in HeLa cells. Eur J Biochem 227:388–395.
doi:10.1111/j.1432-1033.1995.tb20401.x
Blaxter JHS (1988) Pattern and variety in development. In: Hoar WS,
Randall DJ (eds) Fish physiology, vol XI, Part A. Academic
Press, San Diego
Brooks ML, Boese CJ, Meyer JS (2006) Complexation and time-
dependent accumulation of copper by larval fathead minnows
(Pimephales promelas): implications for modeling toxicity.
Aquat Toxicol 78:42–49. doi:10.1016/j.aquatox.2006.02.002
Carpenter KE (1927) The lethal action of soluble metallic salts on
fishes. J Exp Biol 4:378–390
Chan KM, Ku LL, Chan C-Y et al (2006) Metallothionein gene
expression in zebrafish embryo-larvae and ZFL cell-line exposed
to heavy metal ions. Mar Environ Res 62:S83–S87. doi:10.1016/
j.marenvres.2006.04.012
Chen WY, John JA, Lin CH et al (2004) Expression of metallothi-
onein gene during embryonic and early larval development in
zebrafish. Aquat Toxicol 69:215–227. doi:10.1016/j.aquatox.
2004.05.004
Cheung AP, Lam TH, Chan KM (2004) Regulation of Tilapia
metallothionein gene expression by heavy metal ions. Mar
Environ Res 58:389–394. doi:10.1016/j.marenvres.2004.03.084
David CPC (2003) Establishing the impact of acid mine drainage
through metal bioaccumulation and taxa richness of benthic
insects in a tropical Asian stream (The Philippines). Environ
Toxicol Chem 22:2952–2959. doi:10.1897/02-529
Denslow ND, Bowman CJ, Ferguson RJ et al (2001) Induction of gene
expression in sheepshead minnows (Cyprinodon variegatus)
treated with 17b-estradiol, diethylstilbestrol, or ethinylestradiol:
the use of mRNA fingerprints as an indicator of gene regulation.
Gen Comp Endocrinol 121:250–260. doi:10.1006/gcen.2001.
7605
Devlin EW, Brammer JD, Puyear RL et al (1996) Prehatching
development of the fathead minnow Pimephales promelasRafinesque. USEPA publication EPA/600/R-96/079, Cincinnati
Donaldson EM, Dye HM (1975) Corticosteroid concentrations in
sockeye salmon (Oncorhynchus nerka) exposed to low concen-
trations of copper. J Fish Res Board Can 32:533–539
Fei G, Guo C, Sun HS et al (2007) Chronic hypoxia stress-induced
differential modulation of heat-shock protein 70 and presynaptic
proteins. J Neurochem 100:50–61. doi:10.1111/j.1471-4159.
2006.04194.x
Galkin O, Bentley AA, Gupta S et al (2007) Roles of the negatively
charged N-terminal extension of Saccharomyces cerevisiaeribosomal protein S5 revealed by characterization of a yeast
strain containing human ribosomal protein S5. RNA 13:2116–
2128. doi:10.1261/rna.688207
Gardner GR, LaRoche G (1973) Copper induced lesions in estuarine
teleosts. J Fish Res Board Can 30:363–368
Hannan KM, Brandenburger Y, Jenkins A et al (2003) mTOR-
dependent regulation of ribosomal gene transcription requires
S6K1 and is mediated by phosphorylation of the carboxy-
terminal activation domain of the nucleolar transcription factor
UBF. Mol Cell Biol 23:8862–8877. doi:10.1128/MCB.23.23.
8862-8877.2003
Hernandez PP, Moreno V, Olivari FA et al (2006) Sub-lethal
concentrations of waterborne copper are toxic to lateral line
neuromasts in zebrafish (Danio rerio). Hear Res 213:1–10. doi:
10.1016/j.heares.2005.10.015
Identification of copper-responsive genes in Pimephales promelas 291
123

Hilfiker S, Pieribone VA, Nordstedt C et al (1999) Regulation of
synaptotagmin I phosphorylation by multiple protein kinases.
J Neurochem 73:921–932. doi:10.1046/j.1471-4159.1999.0730
921.x
Hua Y, Zhou J (2004) Survival motor neuron protein facilitates
assembly of stress granules. FEBS Lett 572:69–74. doi:10.1016/
j.febslet.2004.07.010
Infante C, Asensio E, Canavate JP et al (2008) Molecular character-
ization and expression analysis of five different elongation factor
1 alpha genes in the flatfish Senegalese sole (Solea senegalensisKaup): differential gene expression and thyroid hormones
dependence during metamorphosis. BMC Mol Biol 9:19–36. doi:
10.1186/1471-2199-9-19
Karan V, Vitorovic S, Tutundzic V et al (1998) Functional enzymes
activity and gill histology of carp after copper sulfate exposure
and recovery. Ecotoxicol Environ Saf 40:49–55. doi:10.1006/
eesa.1998.1641
Kyle HM (1926) The biology of fishes. The Macmillan Company,
New York
Landriscina M, Bagala C, Mandinova A et al (2001) Copper induces
the assembly of a multiprotein aggregate implicated in the
release of fibroblast growth factor 1 in response to stress. J Biol
Chem 276:25549–25557. doi:10.1074/jbc.M102925200
Lange S, Xiang F, Yakovenko A et al (2005) The kinase domain of
titin controls muscle gene expression and protein turnover.
Science 308:1599–1603. doi:10.1126/science.1110463
Larkin P, Villeneuve DL, Knoebl I et al (2007) Development and
validation of a 2,000-gene microarray for the fathead minnow
(Pimephales promelas). Environ Toxicol Chem 26:1497–1506.
doi:10.1897/06-501R.1
Lewis SS (2005) Identification of stress-responsive genes in the early
larval stage of the fathead minnow Pimephales promelas. Ph.D.
dissertation. University of Cincinnati, Cincinnati
Liang P, Pardee AB (1992) Differential display of eukaryotic
messenger RNA by means of the polymerase chain reaction.
Science 257:967–971. doi:10.1126/science.1354393
Linskens MH, Feng J, Andrews WH et al (1995) Cataloging altered
gene expression in young and senescent cells using enhanced
differential display. Nucleic Acids Res 23:3244–3251. doi:
10.1093/nar/23.16.3244
Livak KJ, Schmittgen TD (2001) Analysis of relative gene expression
data using real-time quantitative PCR and the 2-DDCT method.
Methods 25:402–408. doi:10.1006/meth.2001.1262
McKim JM (1977) Evaluation of tests with early life stages of fish for
predicting long-term toxicity. J Fish Res Board Can 34:1148–
1154
McKim JM, Eaton JG, Holcombe GW (1978) Metal toxicity to
embryos and larvae of eight species of freshwater fish-II: copper.
Bull Environ Contam Toxicol 19:608–616. doi:10.1007/BF016
85847
Moore JW, Ramamoorthy S (1984) Heavy metals in natural waters,
applied monitoring and impact assessment. Springer, New York
Mount DI (1968) Chronic toxicity of copper to fathead minnows
(Pimephales promelas, Rafinesque). Water Res 2:215–223. doi:
10.1016/0043-1354(68)90027-4
Newman MC, Unger MA (2003) Fundamentals of ecotoxicology, 2nd
edn. Lewis, Boca Raton
Patel PH, Tamanoi F (2006) Increased Rheb-TOR signaling enhances
sensitivity of the whole organism to oxidative stress. J Cell Sci
119:4285–4292. doi:10.1242/jcs.03199
Rubin CI, Atweh GF (2004) The role of stathmin in the regulation of
the cell cycle. J Cell Biochem 93:242–250. doi:10.1002/jcb.
20187
Sanders BM, Nguyen J, Martin LS et al (1995) Induction and
subcellular localization of two major stress proteins in response
to copper in the fathead minnow Pimephales promelas. Comp
Biochem Physiol C Pharmacol Toxicol Endocrinol 112:335–343
Scudder BC, Carter JL, Leland HV (1988) Effects of copper on
development of the fathead minnow, Pimephales promelasRafinesque. Aquat Toxicol 12:107–124. doi:10.1016/0166-445X
(88)90029-X
Shumyatsky GP, Malleret G, Shin RM et al (2005) Stathmin, a gene
enriched in the amygdala, controls both learned and innate fear.
Cell 123:697–709. doi:10.1016/j.cell.2005.08.038
Sompayrac L, Jane S, Burn TC et al (1995) Overcoming limitations of
the mRNA differential display technique. Nucleic Acids Res
23:4738–4739. doi:10.1093/nar/23.22.4738
Stokes PM (1979) Copper accumulations in freshwater biota. In:
Nriagu JO (ed) Copper in the environment. Part I. Ecological
cycling. Wiley, New York, pp 358–381
Takagi M, Absalon MJ, McLure KG et al (2005) Regulation of p53
translation and induction after DNA damage by ribosomal
protein L26 and nucleolin. Cell 123:49–63. doi:10.1016/j.cell.
2005.07.034
Tan FL, Moravec CS, Li J et al (2002) The gene expression
fingerprint of human heart failure. Proc Natl Acad Sci USA
99:11387–11392. doi:10.1073/pnas.162370099
Taylor EW, Beaumont MW, Butler PJ (1996) Lethal and sub-lethal
effects of copper upon fish: a role for ammonia toxicity? In:
Taylor EW et al (eds) Toxicology of aquatic pollution:
physiological, cellular and molecular approaches. Cambridge
University Press, New York, pp 85–114
Thome J, Pesold B, Baader M et al (2001) Stress differentially
regulated synaptophysin and synaptotagmin expression in hip-
pocampus. Biol Psychiatry 50:809–812. doi:10.1016/S0006-
3223(01)01229-X
Ton C, Stamatiou D, Dzau VJ et al (2002) Construction of a zebrafish
cDNA microarray: gene expression profiling of the zebrafish
during development. Biochem Biophys Res Commun 296:1134–
1142. doi:10.1016/S0006-291X(02)02010-7
Ton C, Stamatiou D, Liew CC (2003) Gene expression profile of
zebrafish exposed to hypoxia during development. Physiol
Genomics 13:97–106
Valko M, Morris H, Cronin MTD (2005) Metals, toxicity and
oxidative stress. Curr Med Chem 12:1161–1208. doi:10.2174/
0929867053764635
Weber CI (1993) Methods for measuring the acute toxicity of
effluents and receiving waters to freshwater and marine organ-
isms, 4th edn. EPA/600/4–90/027F, Cincinnati
Wintz H, Yoo LJ, Loguinov A et al (2006) Gene expression profiles in
fathead minnow exposed to 2,4-DNT: correlation with toxicity in
mammals. Toxicol Sci 94:71–82. doi:10.1093/toxsci/kfl080
Wright P, Felskie A, Anderson P (1995) Induction of ornithine-urea
cycle enzymes and nitrogen metabolism and excretion in
rainbow trout (Oncorhynchus mykiss) during early life stages.
J Exp Biol 198:127–135
Zhang F, Hamanaka RB, Bobrovnikova-Marjon E et al (2006)
Ribosomal stress couples the unfolded protein response to p53-
dependent cell cycle arrest. J Biol Chem 281:30036–30045. doi:
10.1074/jbc.M604674200
292 S. S. Lewis, S. J. Keller
123