Artificial wavelet neuro-fuzzy model based on parallel wavelet network and neural network
Upload
independentCategory
view
1download
0
This article was originally published in a journal published byElsevier, and the attached copy is provided by Elsevier for the
author’s benefit and for the benefit of the author’s institution, fornon-commercial research and educational use including without
limitation use in instruction at your institution, sending it to specificcolleagues that you know, and providing a copy to your institution’s
administrator.
All other uses, reproduction and distribution, including withoutlimitation commercial reprints, selling or licensing copies or access,
or posting on open internet sites, your personal or institution’swebsite or repository, are prohibited. For exceptions, permission
may be sought for such use through Elsevier’s permissions site at:
http://www.elsevier.com/locate/permissionusematerial
Autho
r's
pers
onal
co
py
Identification of coating damage processes in corroded galvanizedsteel by acoustic emission wavelet analysis
Antolino Gallego a,⁎, José F. Gil b, Enrique Castro c, Rosa Piotrkowski a,d
a Departamento de Física Aplicada, Universidad de Granada, 18071 Granada, Spainb E.U. Arquitectura Técnica, Universidad de Granada, 18071 Granada, Spain
c Departamento de Física, Universidad de Jaén, 23071 Jaén, Spaind ECyT, Universidad Nacional de General San Martín, 1650 Pcia. Buenos Aires, Argentina
Received 25 May 2006; accepted in revised form 9 October 2006Available online 20 November 2006
Abstract
Scratch tests using Acoustic Emission (AE) were performed on corroded hot dip galvanized samples. Coatings and scratches were studied byscanning electron microscopy and electron dispersive X-ray spectrometry, and the coatings additionally by X-ray diffraction. Damage mechanismscould be identified applyingWavelet Transform analysis to AE signals. The evolution of specific AE wavelet parameters like the wavelet power wassuited to identify damage mechanisms. In general, the AE power was distributed in certain scale (frequency) bands in the time-scale plane, anddifferent coating damage mechanisms could be assigned to different bands. In particular, signals due to corrosion and non-corrosion mechanismscould be neatly separated.© 2006 Elsevier B.V. All rights reserved.
PACS: 43.40.Le; 43.60.Hj; 62.20.MkKeywords: Acoustic emission; Wavelet analysis; Coating adherence; Galvanized steel
1. Introduction
Zinc coatings on steel are widely used because of their pro-perties of adherence and protection against corrosion. In parti-cular, hot dip galvanizing is one of the most widely appliedmethods for solving the problem of corrosion in reinforced con-crete structures [1]. The high performance of these coatings is dueto the Zn–Fe phases that arise in the hot dipping process [2].
Galvanizing is still an active research field, with differentfronts, such as: changes in microstructure and properties throughthe addition of alloying elements or different pretreatments; cor-rosion behavior and mechanisms in different aggressive mediaand environments; bond strength in concrete structures underdifferent load conditions; and the development of improved al-though more costly coating techniques [3–12].
Acoustic Emission (AE) [13], which refers both to the processand the technique, is constituted by elastic waves generated by thesudden redistribution of the internal stress field in materials. Thewhole process involves elastic wave generation, propagation anddetection. Thus, AE is essentially a stochastic non-stationary (NS)process.
Wavelet Transform (WT) [14] is well-suited to NS processeswhere short and long-time phenomena coexist. In previouspapers WTwas applied to AE signals coming from scratch tests(STs) [15,16]. WTwas found to reveal the evolution of specificparameters that concisely characterize different coating failuremechanisms. In Ref. [16] we found that for certain coatings, thefrequency at which the AE wavelet power reached themaximum proved to be a useful parameter for identifyingdamage mechanisms. We expected that the application ofsimilar WT and AE techniques would throw some light ondamage mechanisms involved in corroded galvanized coatings.
The present paper is part of a program destined to evaluate theadherence of commercial galvanized coatings obtained under
Surface & Coatings Technology 201 (2007) 4743–4756www.elsevier.com/locate/surfcoat
⁎ Corresponding author. Tel.: +34 958 249 508; fax: +34 958 243 104.E-mail address: [email protected] (A. Gallego).
0257-8972/$ - see front matter © 2006 Elsevier B.V. All rights reserved.doi:10.1016/j.surfcoat.2006.10.018
Autho
r's
pers
onal
co
py
different conditions and then submitted to various corrosionprocesses, in order to understand coating features related toadherence and to establish criteria for improving the manufac-turing process. The identification of damage processes by AEthrough signal processing could then be applied on line onremote or inaccessible parts of a structure. This approach isrooted in the wide field of pattern recognition and damagedetection in materials and structures. The early detection ofcorrosion in galvanized steel is particularly crucial in the healthmonitoring of concrete structures in different environments andunder different load conditions.
2. Procedure
2.1. Experimental
Preparation of hot-dip galvanized samples (50 mm×20mm×4 mm plates) involved the same procedure described in Ref.[15], except that in this case it was finished with a centrifugalstage. A lot of 20 samples was prepared, with different coatingthicknesses and different corrosion levels; yet for the sake ofbrevity, and taking into account that the general results agree, inthis paper we compare results from just three samples, S1, S2and S3, all hot-dip galvanized at 450 °C for 3 min. The meancoating thicknesses were 152, 158 and 152 μm, respectively. S2and S3 were corroded for about 900 h in a salt mist chamber tosimulate a marine environment. Afterwards, corroded samplesS2 and S3 were cleaned up with an ammonia hydroxide watersolution (150/850 cm3). In order to remove part of thecorrosion products, sample S3 was then immersed for 20 s ina boiling bath of silver nitrate and chromic oxide, the mass lossbeing 1.6%. Sample S1 was left as cast and was taken as areference.
Coatings were examined by optical microscopy and scan-ning electron microscopy (SEM), and the chemical and crystal-lographic composition was analyzed by energy dispersive X-rayspectrometry (EDX) and X-ray diffraction (XRD).
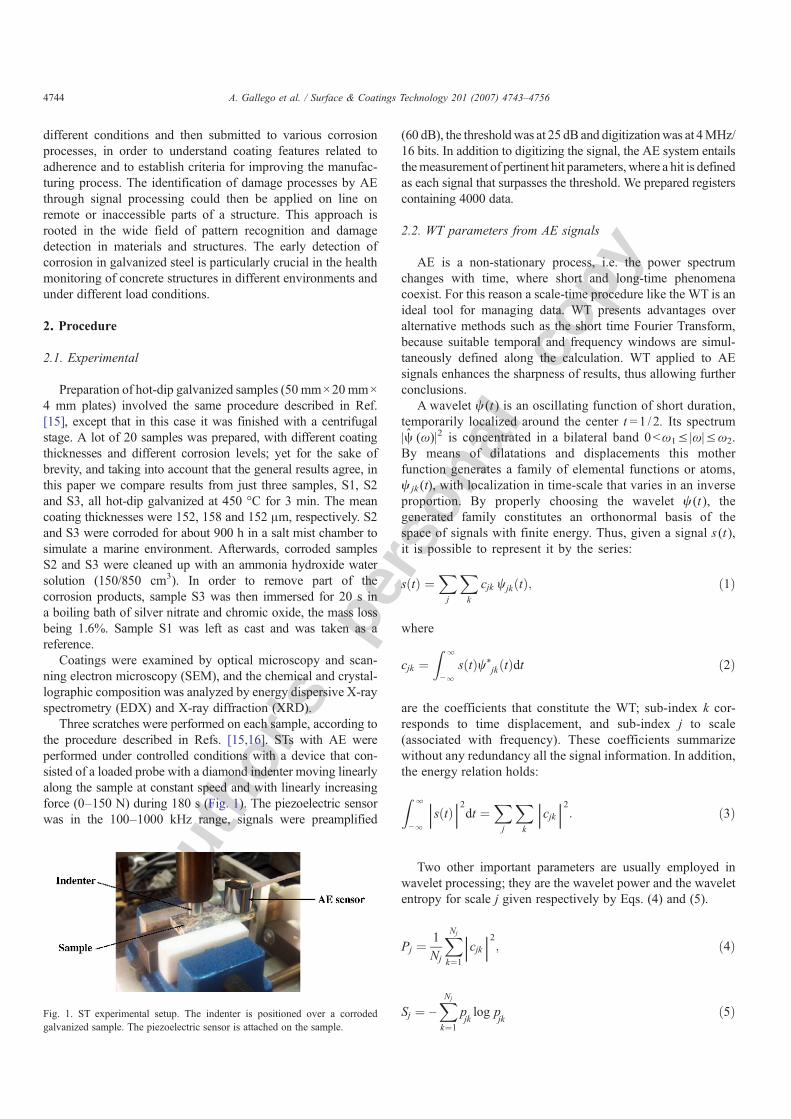
Three scratches were performed on each sample, according tothe procedure described in Refs. [15,16]. STs with AE wereperformed under controlled conditions with a device that con-sisted of a loaded probe with a diamond indenter moving linearlyalong the sample at constant speed and with linearly increasingforce (0–150 N) during 180 s (Fig. 1). The piezoelectric sensorwas in the 100–1000 kHz range, signals were preamplified
(60 dB), the thresholdwas at 25 dB and digitizationwas at 4MHz/16 bits. In addition to digitizing the signal, the AE system entailsthemeasurement of pertinent hit parameters, where a hit is definedas each signal that surpasses the threshold. We prepared registerscontaining 4000 data.
2.2. WT parameters from AE signals
AE is a non-stationary process, i.e. the power spectrumchanges with time, where short and long-time phenomenacoexist. For this reason a scale-time procedure like the WT is anideal tool for managing data. WT presents advantages overalternative methods such as the short time Fourier Transform,because suitable temporal and frequency windows are simul-taneously defined along the calculation. WT applied to AEsignals enhances the sharpness of results, thus allowing furtherconclusions.
A wavelet ψ (t ) is an oscillating function of short duration,temporarily localized around the center t=1 / 2. Its spectrum|ψ̂ (ω)|2 is concentrated in a bilateral band 0bω1≤ |ω|≤ω2.By means of dilatations and displacements this motherfunction generates a family of elemental functions or atoms,ψ jk (t), with localization in time-scale that varies in an inverseproportion. By properly choosing the wavelet ψ (t ), thegenerated family constitutes an orthonormal basis of thespace of signals with finite energy. Thus, given a signal s (t ),it is possible to represent it by the series:
sðtÞ ¼Xj
Xk
cjk wjkðtÞ; ð1Þ
where
cjk ¼Z l
−lsðtÞw⁎
jkðtÞdt ð2Þ
are the coefficients that constitute the WT; sub-index k cor-responds to time displacement, and sub-index j to scale(associated with frequency). These coefficients summarizewithout any redundancy all the signal information. In addition,the energy relation holds:
Z l
−ljsðtÞj2dt ¼ X
j
Xkjcjkj2: ð3Þ
Two other important parameters are usually employed inwavelet processing; they are the wavelet power and the waveletentropy for scale j given respectively by Eqs. (4) and (5).
Pj ¼ 1Nj
XNj
k¼1jcjkj2; ð4Þ
Sj ¼ −XNj
k¼1
pjklog p
jkð5ÞFig. 1. ST experimental setup. The indenter is positioned over a corroded
galvanized sample. The piezoelectric sensor is attached on the sample.
4744 A. Gallego et al. / Surface & Coatings Technology 201 (2007) 4743–4756

Autho
r's
pers
onal
co
py
where Nj is the number of coefficients involved at level j and pjkis given by:
pjk¼ jcjk j2=PjNj: ð6Þ
Power is related with the distribution of information inthe signal among different scales. For entropy, we used theShannon–Weaver definition [17]; Eq. (5) is the versionadapted for wavelets. The information provided by the WTcoefficients depends on the selection criterion adopted forthe basis. In particular, if we use theminimum entropy criterion,we are selecting the basis thatminimizes the number of significantcoefficients in the signal representation. The minimum entropy isa parameter that represents the degree of intrinsic order or degreeof organization of the signal: a relatively low entropy valueindicates the existence of a structure recognizable in the elementarypatterns. Contrarily, a high entropy value indicates the lack of asimple and identifiable structure. Once the basis is selected,entropy is related with the optimum number of decompositionlevels: only levels with relatively low entropy values need beconsidered.
Continuous wavelet analysis does not directly provide thetime-frequency analysis of the signal; it considers dilation andtranslation factors for continuous time and time-scale para-meters, where scale can be corresponded with frequency (thecorrespondence depends on the wavelet employed). At the sametime, the best wavelet basis depends strongly on the physicalprocess involved. For this reason, we used the AGU-VallenWavelet software [18] designed for AE signals and based onSuzuki's work [19], where the mother function is a Gabor(Gaussian) wavelet. The Gabor wavelet choice was made fordifferent reasons: it is suited for the AE phenomena and thescale-frequency correspondence is provided, as is clearlyexplained in Ref. [19]. Furthermore, when in previous work[15] WT with different bases (Haar, Gaussian, symmlet,Daubechies) was applied to signals, we found that the scaleswhere information was pertinent were essentially the same.
Our results after applying the software [18] were obtainedas time-frequency patterns where different colors wereassigned to different power intensities. Numerically a matrixof squared absolute values of WT coefficients was assigned toeach signal register; the number of rows and columns wasdetermined by the register duration and the samplingfrequency. The algorithm accounts well for the frequenciesinvolved, since the AE phenomena are between 100 and800 kHz. Moreover, we optimized the method by applying theentropy criterion empirically, i.e. only considering thefrequency range for which a structured wavelet pattern wasobtained [50–600] kHz. This is later shown in the Resultssection.
One of the parameters that resulted successful in identifyingthe damage was related with the wavelet power for frequencyinterval j defined by:
WPj ¼Xkjcjkj2; ð7Þ
where the sum is performed over the number of time intervalsconstituting the register duration. This was because the initialresults obtained suggested that the wavelet power was dis-tributed in the time-frequency plane according to certain fre-quency bands. Thus, according to observations, the entirefrequency range [50–600] kHz, was divided into threefrequency bands. They were respectively [50–200], [200–350] and [350–600] kHz; the values of the band limits wereoptimized using a recursive procedure and by observing all thewavelet spectrograms. The peak amplitudes of signals were, inall cases, between 2 and 5 times higher than electronic noise.We thus defined the parameter WPb by summing up WPj
Fig. 2. Diffraction patterns obtained from the top of samples S1 (upper), S2(centre) and S3 (lower). Si peaks are taken as a standard.
4745A. Gallego et al. / Surface & Coatings Technology 201 (2007) 4743–4756
Autho
r's
pers
onal
co
py
over all frequencies of the band b and dividing this result by thetotal WP and by the width of the band, Δb, i.e.:
WPb ¼ 1Db
Xj∊Db
WPjPj∊½50�600�
WPj: ð8Þ
Accordingly, we defined for the three considered bands theexpressions given by Eq. (9).
WP½50−200� ¼ 1150
Pj∊½50�200�
WPjPj∊½50�600�
WPj;
WP½200�350� ¼ 1150
Pj∊½200�350�
WPjPj∊½50�600�
WPj;
WP½350�600� ¼ 1250
Pj∊½350�600�
WPjPj∊½50�600�
WPj
ð9Þ
Results were improved defining another parameter: thefrequency location of the wavelet-power maximum in eachband. The procedure was based on our previous work; we foundin Ref. [16], dealing with nitride coating on steel, that differentcoating failure mechanisms could be associated with certainspecific frequency values whereWPj reached its maximum. As inthe present case different mechanisms coexisted, we studied theevolution of primary, secondary and tertiary maxima occurring inthe three frequency bands previously defined. We followed aspecial modus operandi: if the first maximumcorresponded to oneof the bands, the second was the one that fell in one of the othertwo bands; so that for the third maximum only one band remainedas a possibility. Second and third maxima were only considered iftheir amplitude was higher than 80% of the amplitude of the firstmaximum. The different maxima were distributed in narrowerfrequency bands that we named sub-bands.
Results were compared with SEM and EDX observations sothat the correlation between parameters obtained after applying theWT to AE signals and failure mechanisms could be established.
3. Results and discussion
3.1. XRD from the top of coatings
Fig. 2 shows XRD results obtained from the top of samplesS1–S3. The upper diagram (S1) exhibits the typical Zn–Fephases. The middle diagram (S2) shows peaks correspondingmainly to a Zn hydrated chloride phase and (to a lesser extent) toa Zn oxide phase, which seem to be the main constituents of thecorrosion products, although some amorphous phases couldalso be present. The lower diagram (S3) reveals as the mostintense peaks those corresponding to the oxide; less intensepeaks corresponding to the chloride and to Zn–Fe alloys arealso present. These results are coherent with the penetration ofthe X-rays and the depth of coatings.
3.2. SEM and EDX determinations in transversal cuts
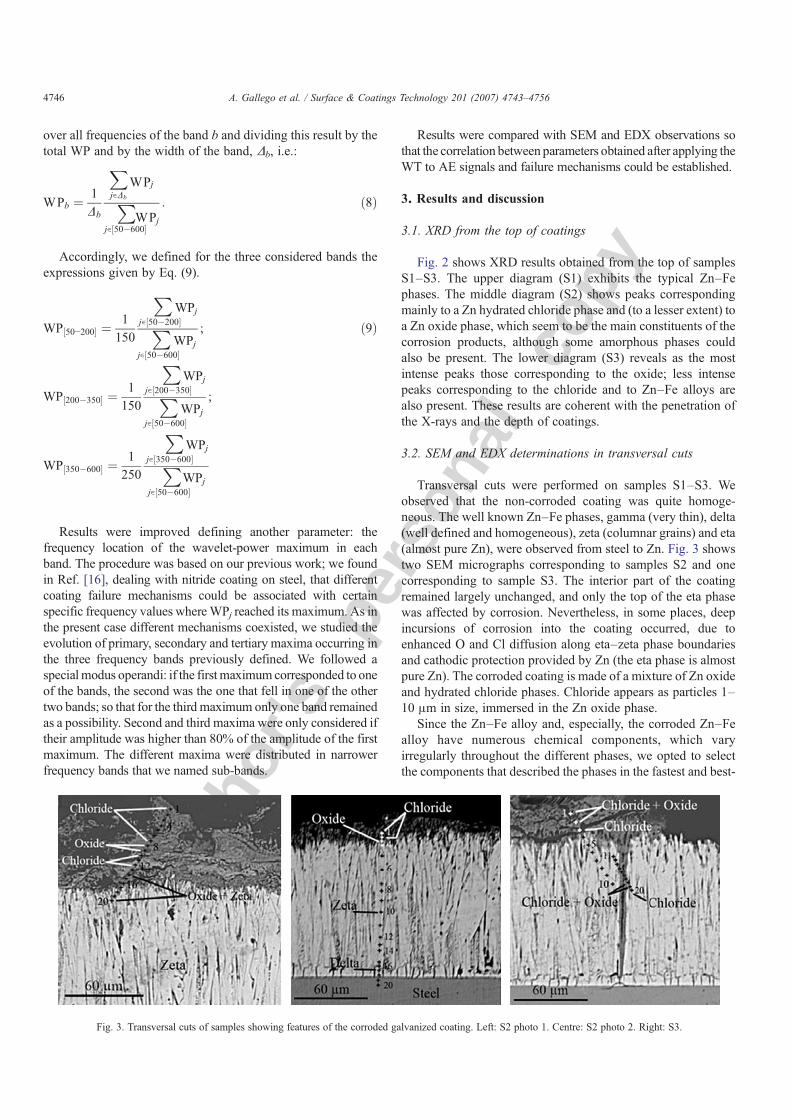
Transversal cuts were performed on samples S1–S3. Weobserved that the non-corroded coating was quite homoge-neous. The well known Zn–Fe phases, gamma (very thin), delta(well defined and homogeneous), zeta (columnar grains) and eta(almost pure Zn), were observed from steel to Zn. Fig. 3 showstwo SEM micrographs corresponding to samples S2 and onecorresponding to sample S3. The interior part of the coatingremained largely unchanged, and only the top of the eta phasewas affected by corrosion. Nevertheless, in some places, deepincursions of corrosion into the coating occurred, due toenhanced O and Cl diffusion along eta–zeta phase boundariesand cathodic protection provided by Zn (the eta phase is almostpure Zn). The corroded coating is made of a mixture of Zn oxideand hydrated chloride phases. Chloride appears as particles 1–10 μm in size, immersed in the Zn oxide phase.
Since the Zn–Fe alloy and, especially, the corroded Zn–Fealloy have numerous chemical components, which varyirregularly throughout the different phases, we opted to selectthe components that described the phases in the fastest and best-
Fig. 3. Transversal cuts of samples showing features of the corroded galvanized coating. Left: S2 photo 1. Centre: S2 photo 2. Right: S3.
4746 A. Gallego et al. / Surface & Coatings Technology 201 (2007) 4743–4756
Autho
r's
pers
onal
co
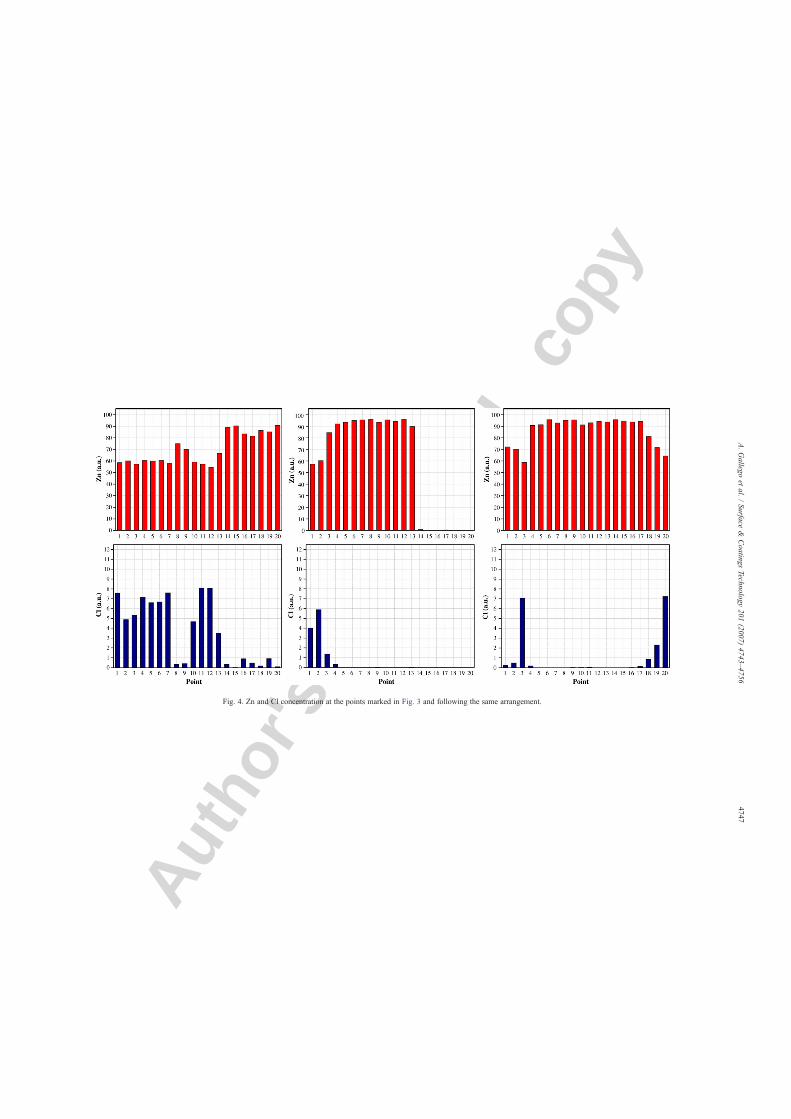
pyFig. 4. Zn and Cl concentration at the points marked in Fig. 3 and following the same arrangement.
4747A.Gallego
etal.
/Surface
&Coatings
Technology201
(2007)4743–4756
Autho
r's
pers
onal
co
py
suited terms: Zn and Cl. The apparent concentration wasconsidered, noted in Fig. 4 as concentration in “arbitrary units”.Zn values near 60, 80, 90 and 100 corresponded respectively tothe chloride, oxide, zeta and eta phases. Intermediate valuescorresponded to the presence of more than one phase at themeasurement point. Fig. 4 shows the profiles just describedacross corroded regions. It can be observed that although thechloride phase had been removed from the top of sample S3 to agreat extent, it was still present in the interior of the coating.
3.3. SEM and EDX along scratches
Three scratches of approximately 11 mm were performed oneach sample. As already found in Ref. [15], the depth of thescratch at its end reached only the eta–zeta two phase region. Asthe speed of ST was constant, the position on the scratch wasproportional to the corresponding instant in the test. For thisreason position on scratch and instant on test were both specifiedas position %, and each hit arrival time was expressed in these
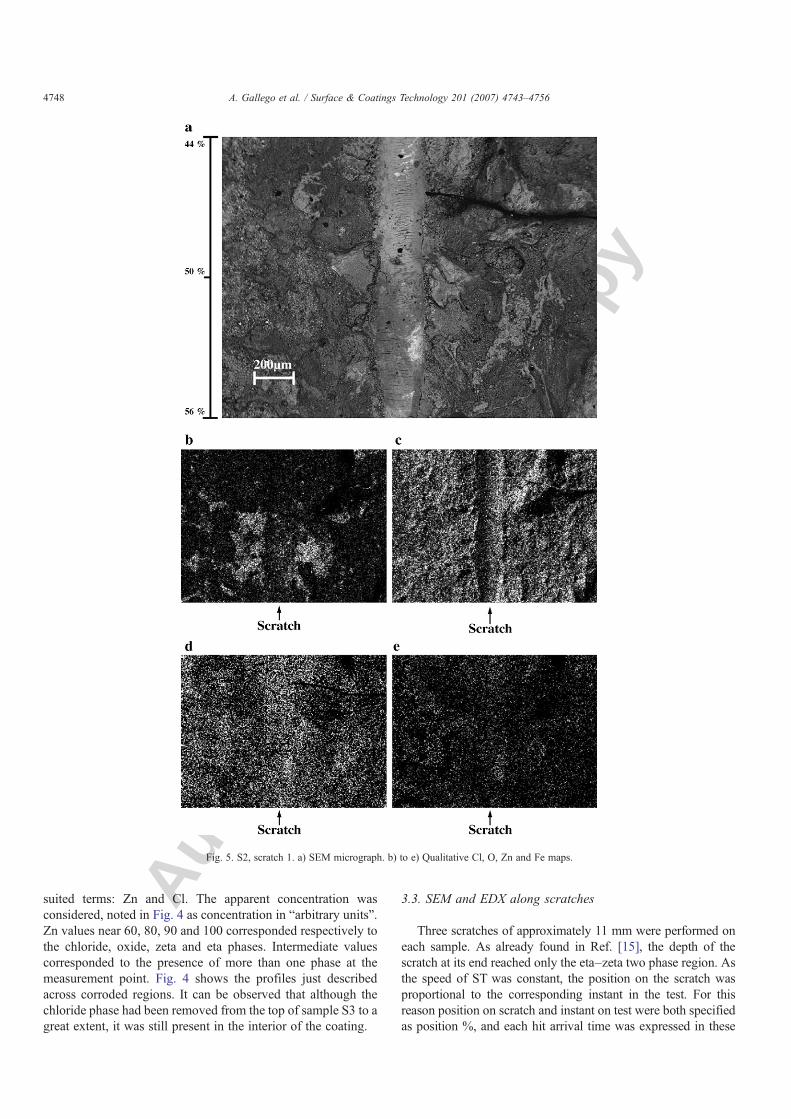
Fig. 5. S2, scratch 1. a) SEM micrograph. b) to e) Qualitative Cl, O, Zn and Fe maps.
4748 A. Gallego et al. / Surface & Coatings Technology 201 (2007) 4743–4756
Autho
r's
pers
onal
co
py
units. SEM and EDX determinations were performed alongscratches in order to determine damage mechanisms. The phaseassignment was performed by comparison with the resultsdescribed in Section 3.2.
The steadily increasing contact load causes compressive loadunder the indenter, tensile stress behind the indenter tip (trailingedge) and compressive stress ahead of the cutting tip (leadingedge). The vertical component of the force affects on one hand thesofter eta phase, and the related damage consists in deformation ofthis phase. Meanwhile, the vertical force also causes transversalcracking of fragile covering phases, like the oxide phase. Thehorizontal forces cause the cracking of the columnar zeta phaseand the interfacial cracking and extraction of the chloride
particles, together with other cracked material. These assertionsare justified in the paragraphs below.
According to SEM and EDX observations, the failuremechanisms in the non-corroded samples (as sample S1) werethe slipping of the eta phase and the breakage of zeta phasecolumns with ulterior extraction of the cracked particles. The firstmechanism led to the presence of noticeable transversal folds onthe scratches and heaps at their borders [15]. The secondmechanism led to a number of zeta particles accumulated at thescratch borders although not all the cracked zeta columns led toextracted particles.
In corroded samples (as S2 and S3) these mechanisms werealso present, but new ones arose. Themost visible failuremarks in
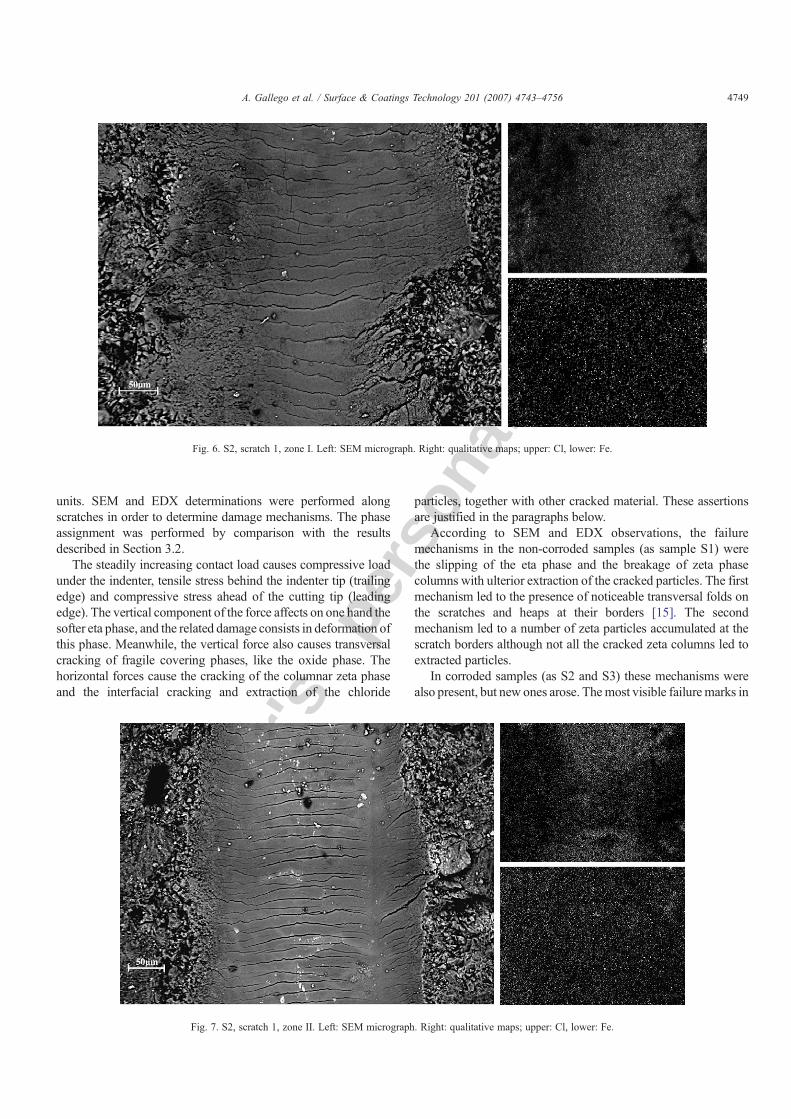
Fig. 6. S2, scratch 1, zone I. Left: SEM micrograph. Right: qualitative maps; upper: Cl, lower: Fe.
Fig. 7. S2, scratch 1, zone II. Left: SEM micrograph. Right: qualitative maps; upper: Cl, lower: Fe.
4749A. Gallego et al. / Surface & Coatings Technology 201 (2007) 4743–4756
Autho
r's
pers
onal
co
py
corroded samples were deep transversal cracks in the middle ofscratches and the presence of particles at the border of scratches.The transversal cracks appeared bothwhen the chloride phasewaspresent and when it was not. For this reason, and after carefulobservation, theywere attributed to the oxide phase.Yet, when thecorroded layer had not been partially removed (sample S2) a lot ofthe particles at the borders were rich in Cl. Therefore, the othercandidate mechanism for corroded samples was the interfacialcracking and extraction of chloride particles.
A detailed study of scratch 1 of sample 2 follows to exemplifywhat we did with each scratch of the three samples in order toexplain our AE results, shown in sub-section 3.4. Fig. 5 shows aSEMmicrograph and qualitative Cl, O, Zn and Fe maps obtained
from the central part of the scratch. Transversal oxide cracks areclearly observed in the SEM image of the scratch. According tothe O map, the oxide phase is present along all the scratch.Considering other maps, Cl and Fe content enhancement at thescratch borders indicate, respectively, the presence of extractedchloride and zeta phase particles (richer in Fe), which hadpreviously suffered cracking. The extraction of chloride particlesis more important from the position of 50% and onward; theextraction of zeta particles occurs in all of this zone. As Zn and Owere almost uniformly distributed, in Figs. 6–9 we only show Cland Fe maps, together with SEM micrographs with highermagnification. We divided the scratch into four zones, I to IV,according to position %: 0–25; 25–50; 50–75 and 75–100.
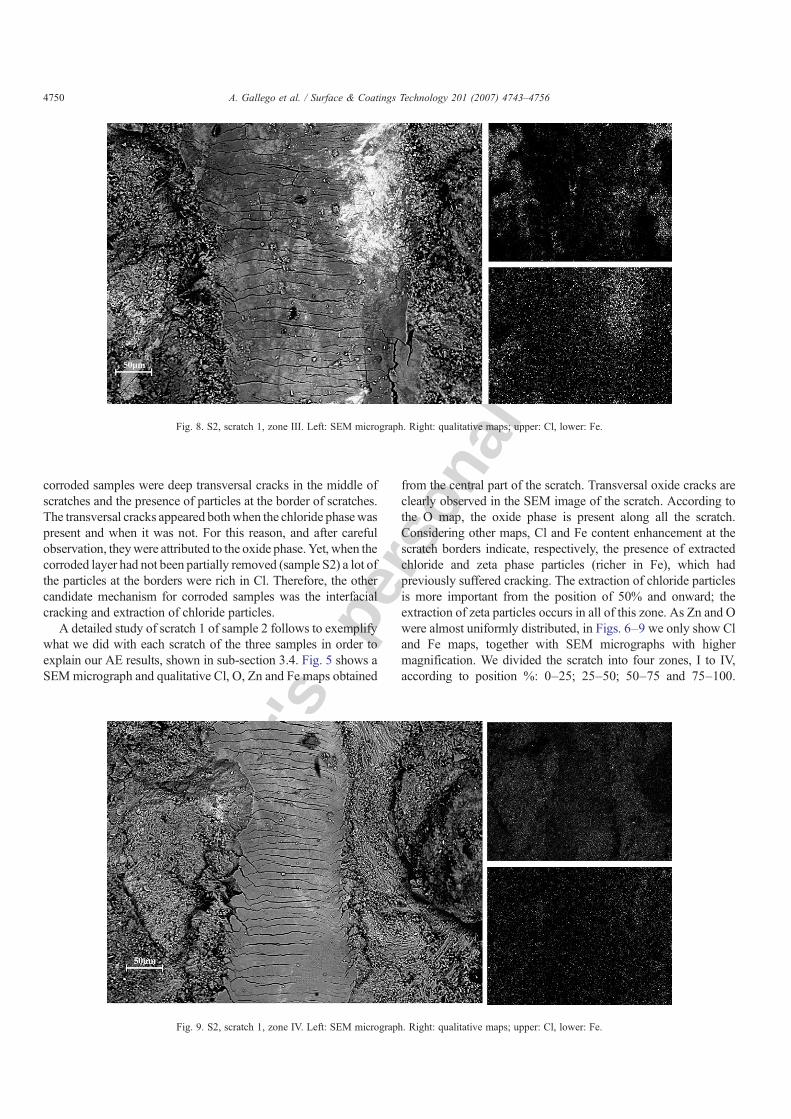
Fig. 8. S2, scratch 1, zone III. Left: SEM micrograph. Right: qualitative maps; upper: Cl, lower: Fe.
Fig. 9. S2, scratch 1, zone IV. Left: SEM micrograph. Right: qualitative maps; upper: Cl, lower: Fe.
4750 A. Gallego et al. / Surface & Coatings Technology 201 (2007) 4743–4756

Autho
r's
pers
onal
co
py
Micrographs and maps are from the central part of these zones.Observations can be gathered as follows:
In zone I (Fig. 6), oxide transversal cracking is the mostimportant mechanism, since neither Cl nor Fe content ishigher at the border of the scratch.In zone II (Fig. 7) the oxide fractures are less important thanin zone I. A high concentration of Cl can be observed on thescratch. This means that the indenter has reached a zone richin chlorides but few of them were yet extracted. Some Feenrichment can be detected at the borders, indicating thepartial extraction of zeta phase cracked particles.In zone III (Fig. 8), the oxide cracks are again important. Feand Cl concentrations are higher at the scratch borders,which means that chlorides and zeta cracked phase particleshave been extracted.In zone IV (Fig. 9), we observe profound oxide cracks, andFe and Cl enhanced content at the scratch borders.
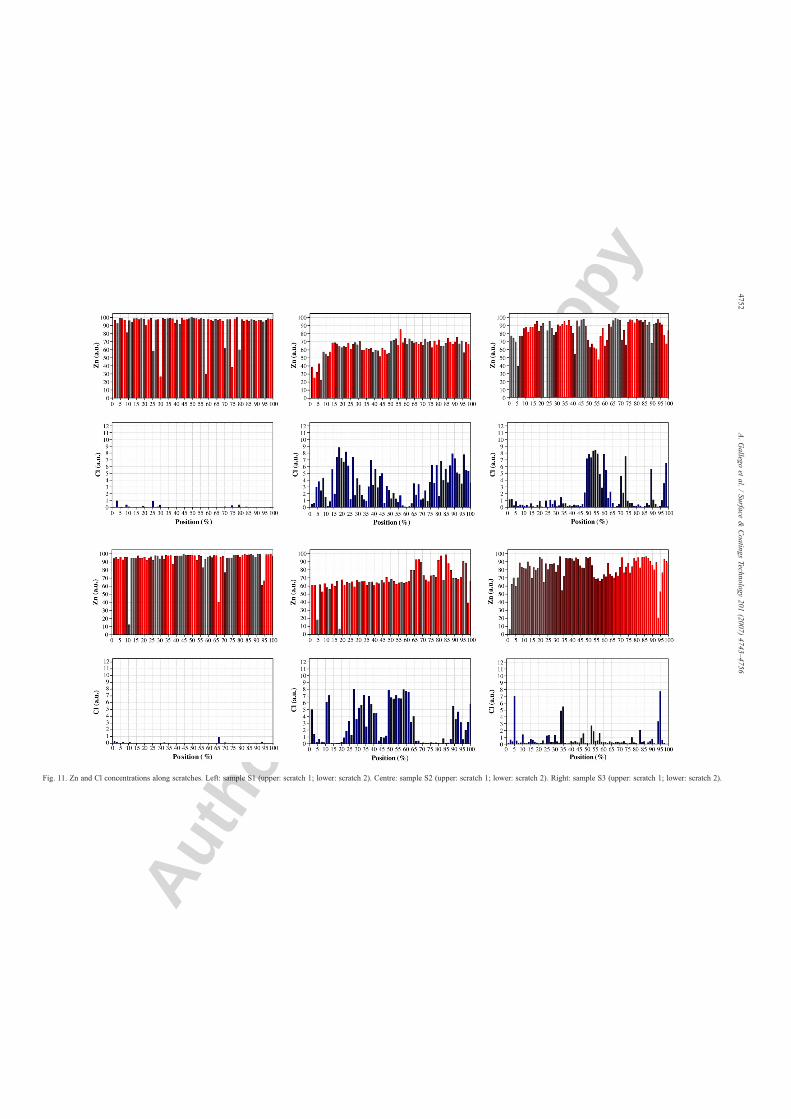
Fig. 10 shows an oxide crack emerging from a chloride/oxideinterphase boundary. The ulterior extraction of this particle isprobably facilitated. Fig. 11 shows Zn and Cl concentration atequidistant points along two scratches of each sample, which,according to what was stated in Section 3.2, provideinformation about the presence of the different phases alongscratches.
Summarizing, some damage mechanisms could be recog-nized: the transversal cracking of the oxide phase, the ex-traction of chloride particles, after interfacial separation fromthe oxide, and the extraction of a number of zeta particlesafter transversal cracking of the zeta columns. As the Feenrichment at the scratch borders is in general light, it can beguessed that only a fraction of the cracked zeta phase col-umns was extracted. We can see in Fig. 11 that along scratch1 of sample S2 the indenter tip had only reached the oxide
and chloride phases, at least in the measurement points,while in scratch 2 the zeta phase was also reached from themiddle of the scratch. Despite the fact that the indenter hadhardly reached the zeta phase columns, the stress field pro-duced by increasing the contact force could have been suf-ficient to induce their cracking; only a portion of the crackedparticles could then been extracted. The ductile deformationof the eta phase, not observed in the figures, is necessarilypresent and accompanies the other mechanisms. These mech-anisms are listed below for ulterior comparison with AEresults:
i) Deformation of the eta zone.ii) Transversal cracking of the zeta phase columns with
partial ulterior extraction of the cracked particles.iii) Transversal cracking of the oxide phase.iv) Interfacial chloride-oxide cracking, with ulterior extrac-
tion of the chloride particles.
Mechanisms are correlated, as seen for example in Fig. 10.Results from Figs. 5–11 described in this subsection werecompared in detail with AE results.
3.4. WT of AE signals
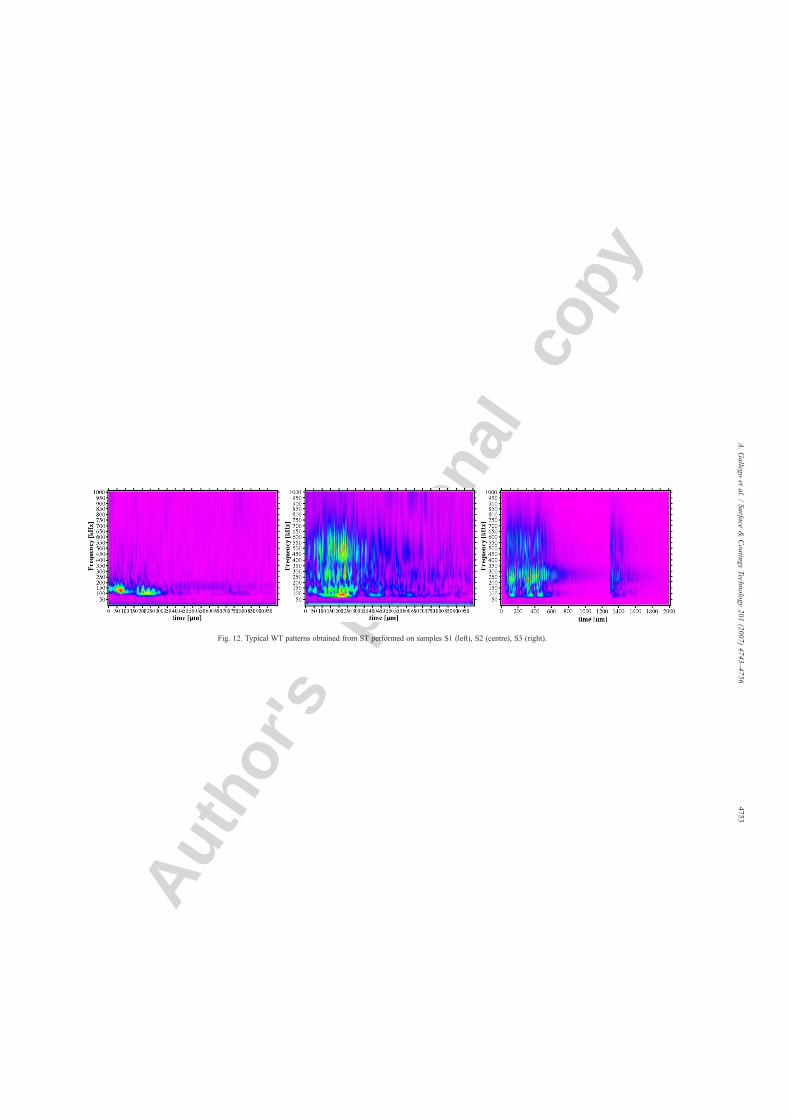
When WT was applied to AE signals, the time-frequencypatterns showed features that allowed their classification indifferent groups; Fig. 12 shows typical WT spots in the timefrequency plane. Each AE hit was in principle related to threefrequency bands, those mentioned in Section 2.2: [50–200],[200–350] and [350–600] kHz. This was done after a detailedand complete observation of all the WT spots.
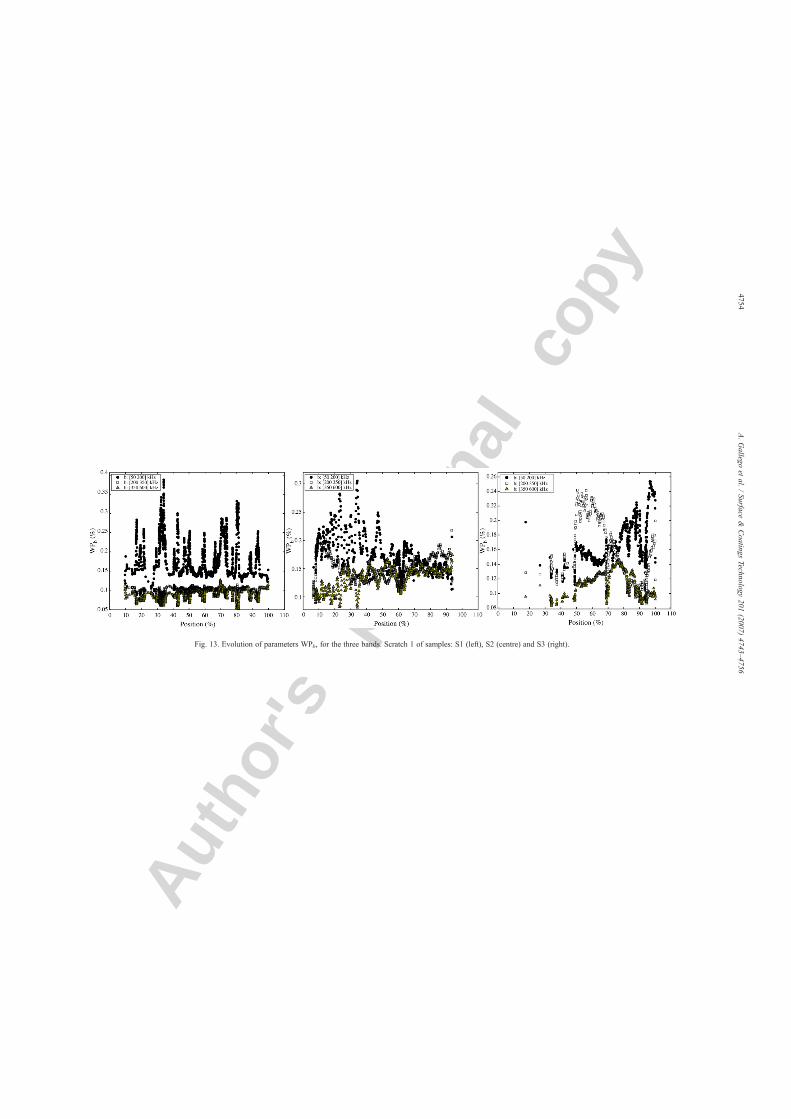
Fig. 13 shows the evolution of the parameters defined byEq. (9) for each band and along scratch 1 of each sample. It canbe observed that for sample S1, AE is mainly in the [50–200]kHz band. When corrosion exists, as in samples S2 and S3, theAE in the other two bands is also important. AE in the [350–600] kHz band is higher for sample S2 than for sample S3. Forsample S3, in the 49–65% position interval, AE is mainly inthe second band, [200–350] kHz, and it is weak in the thirdone, [350–600] kHz. In the same position interval there isevidence that corrosion products remained. A high Cl content isobserved on the scratch in Fig. 11; moreover SEM and EDXobservations showed a number of transversal cracks and veryfew extracted chloride particles.
Taking into account all of the stated considerations, non-corrosion mechanisms were assigned to the [50–200] kHz band.As for the corrosion mechanisms, oxide cracking and chlorideparticle extraction were assigned respectively to the [200–350]kHz and [350–600] kHz bands.
In order to improve the classification, we applied the pro-cedure described at the end of Section 2.2, determining thefrequency in each band at which the first maximum (andsometimes the second and third maxima) appeared for eachregister. The results on two scratches of each sample are pre-sented in Fig. 14. When these pictures were carefully examined,a set narrower bands \ named hereafter sub-bands \ could
Fig. 10. Details of S2, scratch 1. Extracted (white) chloride particles immersed inoxide phase (gray) at 63 position %. Oxide cracks initiate at a noticeable chlorideparticle near the center of the picture.
4751A. Gallego et al. / Surface & Coatings Technology 201 (2007) 4743–4756
Autho
r's
pers
onal
co
py
Fig. 11. Zn and Cl concentrations along scratches. Left: sample S1 (upper: scratch 1; lower: scratch 2). Centre: sample S2 (upper: scratch 1; lower: scratch 2). Right: sample S3 (upper: scratch 1; lower: scratch 2).
4752A.Gallego
etal.
/Surface
&Coatings
Technology201
(2007)4743–4756
Autho
r's
pers
onal
co
pyFig. 12. Typical WT patterns obtained from ST performed on samples S1 (left), S2 (centre), S3 (right).
4753A.Gallego
etal.
/Surface
&Coatings
Technology201
(2007)4743–4756
Autho
r's
pers
onal
co
pyFig. 13. Evolution of parameters WPb, for the three bands. Scratch 1 of samples: S1 (left), S2 (centre) and S3 (right).
4754A.Gallego
etal.
/Surface
&Coatings
Technology201
(2007)4743–4756
Autho
r's
pers
onal
co
py
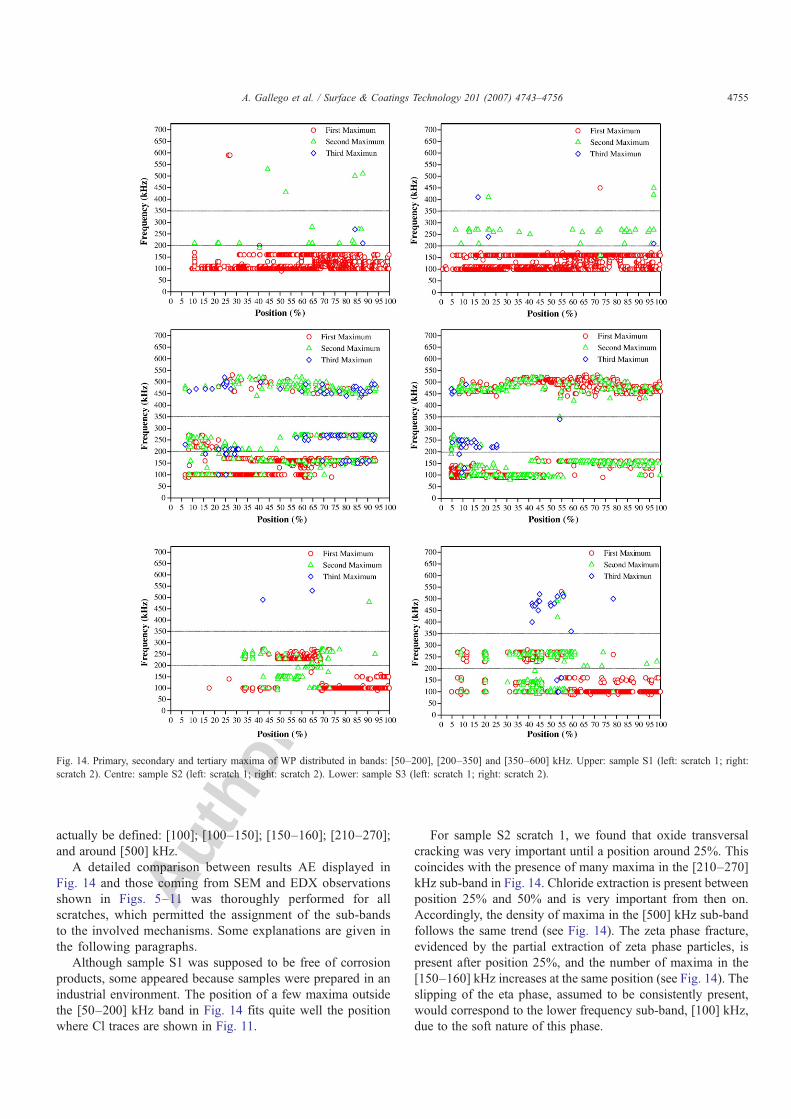
actually be defined: [100]; [100–150]; [150–160]; [210–270];and around [500] kHz.
A detailed comparison between results AE displayed inFig. 14 and those coming from SEM and EDX observationsshown in Figs. 5–11 was thoroughly performed for allscratches, which permitted the assignment of the sub-bandsto the involved mechanisms. Some explanations are given inthe following paragraphs.
Although sample S1 was supposed to be free of corrosionproducts, some appeared because samples were prepared in anindustrial environment. The position of a few maxima outsidethe [50–200] kHz band in Fig. 14 fits quite well the positionwhere Cl traces are shown in Fig. 11.
For sample S2 scratch 1, we found that oxide transversalcracking was very important until a position around 25%. Thiscoincides with the presence of many maxima in the [210–270]kHz sub-band in Fig. 14. Chloride extraction is present betweenposition 25% and 50% and is very important from then on.Accordingly, the density of maxima in the [500] kHz sub-bandfollows the same trend (see Fig. 14). The zeta phase fracture,evidenced by the partial extraction of zeta phase particles, ispresent after position 25%, and the number of maxima in the[150–160] kHz increases at the same position (see Fig. 14). Theslipping of the eta phase, assumed to be consistently present,would correspond to the lower frequency sub-band, [100] kHz,due to the soft nature of this phase.
Fig. 14. Primary, secondary and tertiary maxima of WP distributed in bands: [50–200], [200–350] and [350–600] kHz. Upper: sample S1 (left: scratch 1; right:scratch 2). Centre: sample S2 (left: scratch 1; right: scratch 2). Lower: sample S3 (left: scratch 1; right: scratch 2).
4755A. Gallego et al. / Surface & Coatings Technology 201 (2007) 4743–4756
Autho
r's
pers
onal
co
py
Such correlations performed on all scratches led to theclassification of sub-bands:
a) [100] kHz: Deformation by slipping of the eta phase.b) [150–160] kHz: Cracking of the columnar zeta phase.c) [100–150] kHz: Extraction of the cracked zeta particles by
zeta–eta interfacial sliding.d) [210–270] kHz: Transversal cracking of the oxide phase.e) [500] kHz: Extraction of chloride particles by oxide–
chloride interfacial cracking.
According to this classification, for sample S1, the extractionof cracked zeta particles was important after position 60%for scratch 1 and after position 52% for scratch 2. For scratch2 of sample S2, chloride and zeta phase extraction was im-portant in the 55–100% position interval (see Fig. 14). Cldepletion in that zone of the scratch begins a little later,together with evidence of the alternation of the oxide and zetaphases (see Fig. 11). For sample S3, a noticeable differencearose between the two scratches. Scratch 1 traversed a chlo-ride rich corrosion blob that had not been extracted (this fitsthe high Cl content in the 47–64% position interval).Accordingly, no maxima corresponding to mechanism e), andmany maxima corresponding to mechanism d), are detectedin the same interval in Fig. 14. Conversely, scratch 2 traverseda corroded region poor in Cl between positions 40 and 57%,and third maxima corresponding to mechanism e) are observedin that zone.
Fig. 14 shows that the different failure mechanisms coexistedthroughout the test, although the prevalence of each of themvaried, as can be seen following the sequence of primarymaxima. The position of the frequency sub-bands identify themechanisms, whereas the density of points are more relatedwith the number of broken atomic links. The width of the sub-bands has to do with the rheological status of the coatings, i.e.the level of internal stresses. In Ref. [9] Reumont et al. haveclearly shown that internal cracks form during galvanizationfollowing internal stresses, due to the different properties ofphases. The same could happen with the corroded coatings, andthe specific value of the characteristic frequency could thus varya little over samples, and even in different zones of the samesample.
4. Conclusions
WTwas applied to AE signals coming from ST on corrodedgalvanized steel, in order to seek a few concise and preciseparameters that could be assigned to different coating damagemechanisms.
Hot dip galvanized samples were corroded in a salt chamberand then submitted to ST. Damage mechanisms involveddeformation, fracture and/or extraction of the different phasesthat conformed the corroded coating, briefly named in our paperas oxide, chloride, eta phase and zeta phase.
WT results were adequately obtained as time frequency AEpatterns, which revealed that AE power was distributed in threefrequency bands. Consequently, the evolution of AE wavelet
power in different frequency bands was carefully comparedwith SEM and EDX observations along scratches, whichpermitted the assignment of different mechanisms to certainfrequency bands. In particular, signals due to corrosion and non-corrosion mechanisms could be easily separated. The classifi-cation was then refined, determining the frequency band inwhich the AE wavelet power reached maximum values. Theproposed classification is:
[100] kHz: Deformation by slipping of the eta phase.[100–150] kHz: Extraction of the cracked zeta particles byzeta–eta interfacial sliding.[150–160] kHz: Cracking of the columnar zeta phase.[210–270] kHz: Transversal cracking of the oxide phase.[500] kHz: Extraction of chloride particles by oxide–chloride interfacial cracking.
These mechanisms coexisted along the ST.
Acknowledgments
This work was partially supported by the MEC (Spain),through the financial help for the sabbatical year 2006 of R.Piotrkowski, spent at the University of Granada (SAB 2004-0081); by the Spanish I+D National Plan Projects DPI2002-04472-C02-02 and DPI2006-02970. Hot-dip galvanization wasperformed at Galvanizados, S.A., Madrid. Scratch tests wereperformed at the Elastic Waves Laboratory, ENDE, CNEA,Argentina.
References
[1] K.W.J. Treadway, B.L. Brown, R.N. Cox, Corrosion of reinforcing steel inconcrete, Am. Soc. Test. Mater., ASTM STP 713 (1980) 102.
[2] V. Raghavan, J. Phase Equilib. 24 (6) (2003) 544.[3] N. Pistofidis, G. Vourlias, S. Konidaris, E. Pavlidou, A. Stergiou, G.
Stergioudis, Mater. Lett. 60 (2006) 786.[4] M.F. Montemor, A.M. Cabral, M.L. Zhekudkevich, M.G.S. Ferreira, Surf.
Coat. Technol. 200 (2006) 2875.[5] Z. Tang, S. Hong, W. Xiao, J. Taylor, Corros. Sci. 48 (2006) 322.[6] J.M. Lee, Electrochim. Acta 51 (16) (2006) 3256.[7] H. Dafydd, D.A. Worsley, H.N. McMurray, Corros. Sci. 47 (2005) 3006.[8] A.P. Yadav, A. Nishikata, T. Tsuru, Corros. Sci. 46 (2004) 361.[9] G. Reumont, J.B. Vogt, A. Iost, J. Foct, Surf. Coat. Technol. 139 (2001)
265.[10] B.S. Hamad, J.A. Mike, Constr. Build. Mater. 19 (2005) 275.[11] C. Scott, C. Olier, A. Lamandé, P. Choquet, D. Chaleix, Thin Solid Films
436 (2003) 232.[12] G. Vourlias, N. Pistofidis, D. Chaliampalias, P. Patsalas, G. Stergioudis, D.
Tsipas, E.K. Polychroniadis, Surf. Coat. Technol. 200 (2006) 6594.[13] C.B Scruby, J. Phys., E J. Sci. Instrum. 20 (8) (1987) 946.[14] Y. Meyer, Wavelets: Algorithms and Applications, SIAM, Philadelphia,
1992.[15] A. Gallego, J.F. Gil, J.M. Vico, J.E. Ruzzante, R. Piotrkowski, Scr. Mater.
52 (2005) 1069.[16] R. Piotrkowski, A. Gallego, E. Castro, M.T. Garcia Hernandez, J.E.
Ruzzante, NDT&E Int. 38 (2005) 260.[17] C.E. Shannon, W. Weaver, The Mathematical Theory of Communication,
Univ. of Illinois, Urbana, 1964.[18] AGU-Vallen Wavelet, http://www.vallen.de/wavelet/index.html, 2002.[19] H. Suzuki, T. Kinjo, Y. Hayashi, M. Takemoto, K. Ono, J. Acoust. Emiss.
14 (2) (1996) 69.
4756 A. Gallego et al. / Surface & Coatings Technology 201 (2007) 4743–4756
Copyright © 2022 FDOKUMEN