Identification of a new outflow channel on Mars in Syrtis Major Planum using HRSC/MEx data
9
Planetary and Space Science 56 (2008) 1030–1042 www.elsevier.com/locate/pss Identification of a new outflow channel on Mars in Syrtis Major Planum using HRSC/MEx data N. Mangold a, , V. Ansan a , D. Baratoux b , F. Costard a , L. Dupeyrat a , H. Hiesinger c , Ph. Masson a , G. Neukum d , P. Pinet b a IDES, UMR8148, CNRS, and Universite´ Paris-Sud, Batiment 509, 91405 Orsay, France b DTP-OMP, UMR5562, CNRS, Toulouse, France c Institut fu¨r Planetologie, 48149 Mu¨nster, Germany d Freie Universita¨t, Berlin, Germany Received 20 August 2007; received in revised form 24 January 2008; accepted 28 January 2008 Available online 16 February 2008 Abstract Syrtis Major Planum is a volcanic plain dominated by lava flows. High resolution stereo camera (HRSC) images of the northern Syrtis Major region display erosional features such as grooves, teardrop-shaped islands and valleys. These landforms are characteristics of outflow channels seen on Mars, therefore implying that a flood event took place in this region. The flow of 100 km long and a few kilometer wide followed the local slopes in most locations. Maximum flood discharges estimated from images and topography vary from about 0.3 10 6 to 8 10 6 m 3 /s, and therefore are in the range of terrestrial mega-floods in the Scablands or Lake Bonneville. In North Syrtis Major, the relationships with surrounding lava flows and the timing of the flood coeval to Syrtis Major volcanic activity suggest that it could be related to the subsurface water discharge mobilized by the volcanic activity. The proximity of Noachian age basement rocks 20 km away from the flood and below lava flows might have played a role in its formation and water presence. r 2008 Elsevier Ltd. All rights reserved. Keywords: Mars; Outflow; Water; Volcanism 1. Introduction Mangala Valles (Southwest of the Tharsis region) or Athabasca Valles (southeast of Elysium region) have channel characteristics similar to those of Xanthe Terra but their source areas consist of a single fracture, probably related to volcano-tectonic activity (Burr et al., 2002; Head et al., 2003) or tectonic processes (Hanna and Phillips, 2006). The identification of new areas of similar floods is important to complete the classification and geographic distribution of Martian outflows and to understand their relationships with magmatic activity, groundwater distribution and climatic events. The high resolution and spatial coverage of the high resolution stereo camera (HRSC) allows us to study outflow channels in more detail or discover new locations of similar flood activity. The studied region is located at the transition from Syrtis Major Planum and the Nili Fossae regions (161N, 75–761E), in the eastern hemisphere, west of the Isidis plain (Fig. 1). No landform indicative of volcanoice interactions (pseudocraters, table mountains, etc.) or Very energetic floods suggesting catastrophic episodes of concentrated water flows formed outflow channels on Mars in a similar way as the release of water by glacial surges on Earth. However, the exact origin and conditions under which the outflow channels formed on Mars are still controversial (e.g., Carr, 2006). Outflow channels of the Xanthe– Margaritifer region, east of Valles Marineris, date back to the Hesperian period (43 Gy ago) and chaotic terrains of unknown origin characterize their source regions. Most models suggest a formation related to groundwater release either from aquifers, or permafrost melting resulting from increased geothermal flux, or magmatic activity (Carr, 1979; Baker et al., 1992; Rodriguez et al., 2005; Coleman, 2005). Outflows such as Corresponding author. E-mail address: [email protected] psud.fr (N. Mangold). 0032-0633/$ -see front matter r 2008 Elsevier Ltd. All rights reserved. doi:10.1016/j.pss.2008.01.011
-
Upload
univ-toulouse -
Category
Documents
-
view
1 -
download
0
Transcript of Identification of a new outflow channel on Mars in Syrtis Major Planum using HRSC/MEx data

Planetary and Space Science 56 (2008) 1030–1042
www.elsevier.com/locate/pss
Identification of a new outflow channel on Mars in Syrtis Major Planum using HRSC/MEx data
N. Mangolda,�
, V. Ansana
, D. Baratouxb
, F. Costarda
, L. Dupeyrata
, H. Hiesingerc
, Ph. Masson
a
, G. Neukumd
, P. Pinetb
a
IDES, UMR8148, CNRS, and Universite´ Paris-Sud, Batiment 509, 91405 Orsay, France b
DTP-OMP, UMR5562, CNRS, Toulouse, France c
Institut fu¨r Planetologie, 48149 Mu¨nster, Germany
d
Freie Universita¨t, Berlin, Germany
Received 20 August 2007; received in revised form 24 January 2008; accepted 28 January 2008 Available online 16 February 2008
Abstract
Syrtis Major Planum is a volcanic plain dominated by lava flows. High resolution stereo camera (HRSC) images of the northern Syrtis Major region display erosional features such as grooves, teardrop-shaped islands and valleys. These landforms are characteristics of outflow channels seen on Mars, therefore implying that a flood event took place in this region. The flow of 100 km long and a few kilometer wide followed the local slopes in most locations. Maximum flood discharges estimated from images and topography vary from about 0.3 �10
6 to 8 �10
6 m
3/s, and
therefore are in the range of terrestrial mega-floods in the Scablands or Lake Bonneville. In North Syrtis Major, the relationships with surrounding lava flows and the timing of the flood coeval to Syrtis Major volcanic activity suggest that it could be related to the subsurface water discharge mobilized by the volcanic activity. The proximity of Noachian age basement rocks 20 km away from the flood and below lava flows might have played a role in its formation and water presence. r 2008 Elsevier Ltd. All rights reserved.
Keywords: Mars; Outflow; Water; Volcanism
1. Introduction Mangala Valles (Southwest of the Tharsis region) or Athabasca Valles (southeast of Elysium region) have channel characteristics similar to those of Xanthe Terra but their source areas consist of a single fracture, probably related to volcano-tectonic activity (Burr et al., 2002; Head et al., 2003) or tectonic processes (Hanna and Phillips, 2006). The identification of new areas of similar floods is important to complete the classification and geographic distribution of Martian outflows and to understand their relationships with magmatic activity, groundwater distribution and climatic events. The high resolution and spatial coverage of the high resolution stereo camera (HRSC) allows us to study outflow channels in more detail or discover new locations of similar flood activity. The studied region is located at the transition from Syrtis Major Planum and the Nili Fossae regions (161N, 75–761E), in the eastern hemisphere, west of the Isidis plain (Fig. 1). No landform indicative of volcanoice interactions (pseudocraters, table mountains, etc.) or
Very energetic floods suggesting catastrophic episodes ofconcentrated water flows formed outflow channels on Mars ina similar way as the release of water by glacial surges onEarth. However, the exact origin and conditions under whichthe outflow channels formed on Mars are still controversial(e.g., Carr, 2006). Outflow channels of the Xanthe–Margaritifer region, east of Valles Marineris, date back to theHesperian period (43 Gy ago) and chaotic terrains of unknownorigin characterize their source regions. Most models suggesta formation related to groundwater release either fromaquifers, or permafrost melting resulting from increasedgeothermal flux, or magmatic activity (Carr, 1979; Baker etal., 1992; Rodriguez et al., 2005; Coleman, 2005). Outflows such as
Corresponding author. E-mail address: [email protected] (N. Mangold).
0032-0633/$ -see front matter r 2008 Elsevier Ltd. All rights reserved. doi:10.1016/j.pss.2008.01.011
N. Mangold et al. / Planetary and Space Science 56 (2008) 1030–1042
Fig.2.(a)Overallimageofthestudiedarea(HRSCmosaic1347-988).Atthislowresolutionthedeepvalley(DV)inthebottomcenteroftheimageistheonlylandformvisiblesuggestingalavatubeassociatedtothelavaflows.DetailsshowninFigs.3–5showothererosionalfeaturesnotconsistentwithvolcanicprocesses.
of interest. The Digital Elevation Model (DEM) of each orbit has been computed using tools developed for the HRSC instrument (Gwinner et al., 2005). Nevertheless, the accuracy is very low over smooth plains which lack roughness, limiting the number of correlation points (e.g. Ansan et al., 2008). We therefore use MOLA data for topographic measurements rather than HRSC DEMs on these smooth plains.
The Nili Fossae region belongs to Noachian highlands thatcan be easily identified by their rough and hilly landscape in contrast to the dark smooth lava plains of Syrtis Major (Fig.2). A north–south lineation, visible in the top center of Fig. 2, is a fracture parallel to the main Nili Fossae system. This fracture is probably due to the same tectonic stress as NiliFossae and it is buried by lava flows to the south, showing that it pre-existed lavas. The highlands locally display valleys with alluvial fans and possible associated lakes (Fassett and Head,2005; Mangold et al., 2006, 2007). OMEGA/MEx spectral data show that the highlands outcrops contain hydrated mine-rals such as clays, suggesting an alteration of the ancient crustby liquid water (Poulet et al., 2005). In contrast, Hesperian aged lava flows of Syrtis Major do not show any sign of hydrous minerals. This implies a history devoid of long-termliquid water activity. The presence of minerals such as pyroxenes and olivine confirm the volcanic origin of thematerial (Bandfield, 2002; Mustard et al., 2005; Poulet et al., 2007; Baratoux et al., 2007; Pinet et al., 2007).
Fig.1.(a)MOCwide-anglemosaicoftheSyrtisMajorregion.(b)Close-upoverthestudiedregion(centered171N,761E).
fluvial/glacial erosion (channels, valleys) has been previously observed on these Syrtis Major volcanic plains. Only a few studies suggest a possible interaction of volcanism with volatile-rich sediments in the Isidis–Syrtis area (Ivanov and Head, 2003), as well as possible subsurface water storage hypothesized by the presence of lobate ejecta craters (e.g. Baratoux et al., 2005). In our study, we focus on erosional features such as grooves, teardropshaped islands, and a deep valley located close to the boundary between the Syrtis Major smooth plains and the northern Noachian highland. On the basis of our investigations, we interpret these features as being the result of an aqueous flood event because these landforms are typical of energetic outflows. We estimate discharge rates and discuss the age and origin of these landforms.
2. Data and geologic context 3. Observation of erosional landforms on volcanic plains
The studied HRSC images are orbits 988, 1347 and 1593 with nadir resolution from 15 to 25 m. A mosaic of the three images has been completed at 25 m/pixel in the region
At regional scale (Fig. 2), the most interesting erosionallandform is a valley that crosses the northern part of the
N. Mangold et al. / Planetary and Space Science 56 (2008) 1030–1042
landforms are typical of erosion into a resistant bedrock. Grooves and valley might have been generated by the same process, as they show same directions.
lava plain close to the contact with the Noachian highlands.This narrow and deep valley is 60 km long with an EWorientation; we will refer to it as deep valley (DV). The DV, as observed on wide-angle images (Fig. 2), could beinterpreted as a volcanic feature such as a large collapsed lavatube. However, in the following section, we will presentobservational facts that render a volcanic interpretation lesslikely (Figs. 3–8).
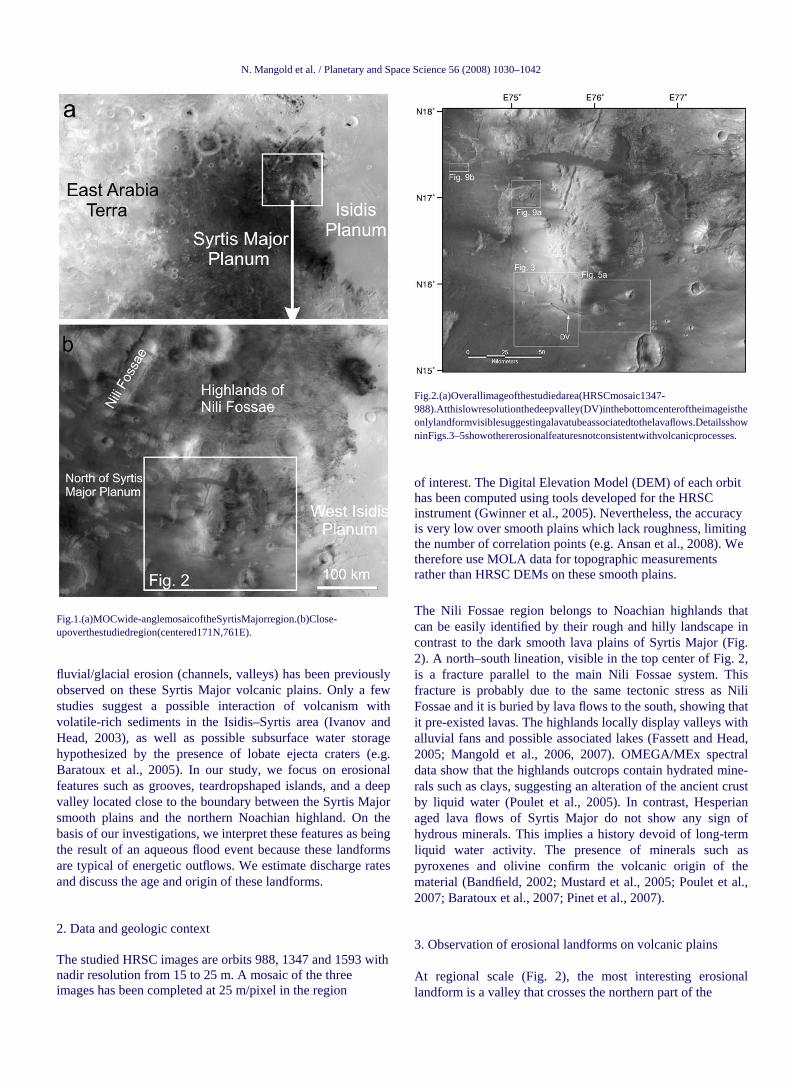
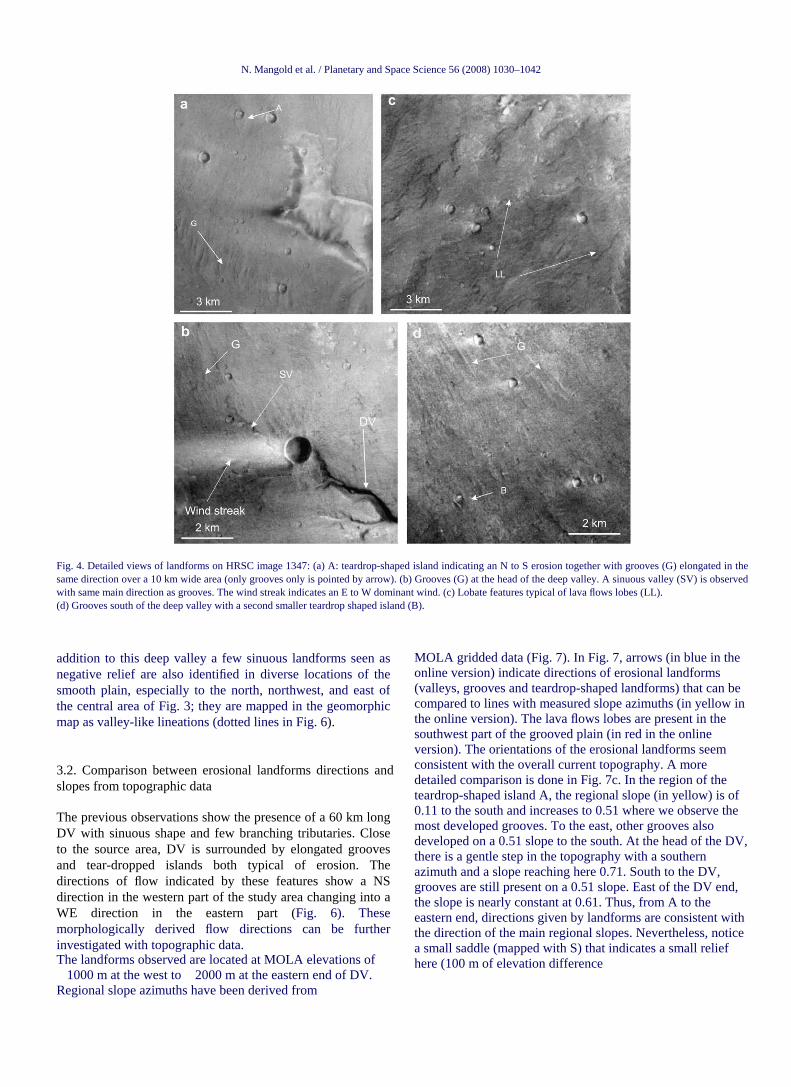
Another type of erosional landform is the teardropshaped islands A and B (Fig. 4). The most obvious example (A in Fig. 4a) is a small topographic feature with a teardrop shape that asymmetrically extends away from a 600 m diameter impact crater. The second small island (B in Fig. 4d) is less developed and is observed to the south, in a region where grooves are also less dense. Typical lava flow features include lobes, dikes, and rilles. Flow lobes of Syrtis Major lavas are identified by typical lobate shape in the southwest corner of the image only (Figs. 3, 4c). In contrast, no lobate shapes are observed in association with the DV, the grooves or the teardropshaped islands. Wind streaks are the only clear eolian landforms visible (Fig. 4a). They form by differential dust deposition and erosion behind the relief created by impact craters.
3.1. Erosional landforms on HRSC images
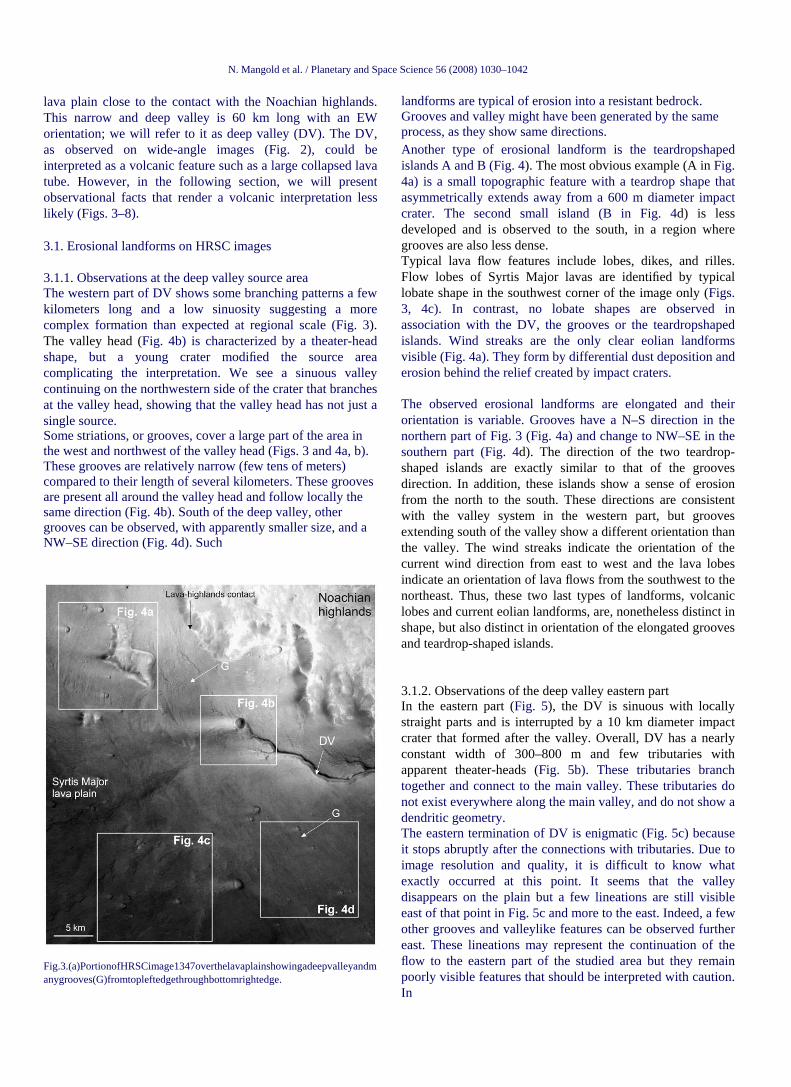
3.1.1. Observations at the deep valley source area The western part of DV shows some branching patterns a fewkilometers long and a low sinuosity suggesting a morecomplex formation than expected at regional scale (Fig. 3). The valley head (Fig. 4b) is characterized by a theater-head shape, but a young crater modified the source areacomplicating the interpretation. We see a sinuous valleycontinuing on the northwestern side of the crater that branchesat the valley head, showing that the valley head has not just asingle source. Some striations, or grooves, cover a large part of the area in the west and northwest of the valley head (Figs. 3 and 4a, b). These grooves are relatively narrow (few tens of meters) compared to their length of several kilometers. These grooves are present all around the valley head and follow locally the same direction (Fig. 4b). South of the deep valley, other grooves can be observed, with apparently smaller size, and a NW–SE direction (Fig. 4d). Such
The observed erosional landforms are elongated and their orientation is variable. Grooves have a N–S direction in the northern part of Fig. 3 (Fig. 4a) and change to NW–SE in the southern part (Fig. 4d). The direction of the two teardrop-shaped islands are exactly similar to that of the grooves direction. In addition, these islands show a sense of erosion from the north to the south. These directions are consistent with the valley system in the western part, but grooves extending south of the valley show a different orientation than the valley. The wind streaks indicate the orientation of the current wind direction from east to west and the lava lobes indicate an orientation of lava flows from the southwest to the northeast. Thus, these two last types of landforms, volcanic lobes and current eolian landforms, are, nonetheless distinct in shape, but also distinct in orientation of the elongated grooves and teardrop-shaped islands.
3.1.2. Observations of the deep valley eastern part In the eastern part (Fig. 5), the DV is sinuous with locally straight parts and is interrupted by a 10 km diameter impact crater that formed after the valley. Overall, DV has a nearly constant width of 300–800 m and few tributaries with apparent theater-heads (Fig. 5b). These tributaries branch together and connect to the main valley. These tributaries do not exist everywhere along the main valley, and do not show a dendritic geometry. The eastern termination of DV is enigmatic (Fig. 5c) because it stops abruptly after the connections with tributaries. Due to image resolution and quality, it is difficult to know what exactly occurred at this point. It seems that the valley disappears on the plain but a few lineations are still visible east of that point in Fig. 5c and more to the east. Indeed, a few other grooves and valleylike features can be observed further east. These lineations may represent the continuation of the flow to the eastern part of the studied area but they remain poorly visible features that should be interpreted with caution. In
Fig.3.(a)PortionofHRSCimage1347overthelavaplainshowingadeepvalleyandmanygrooves(G)fromtopleftedgethroughbottomrightedge.
N. Mangold et al. / Planetary and Space Science 56 (2008) 1030–1042
Fig. 4. Detailed views of landforms on HRSC image 1347: (a) A: teardrop-shaped island indicating an N to S erosion together with grooves (G) elongated in thesame direction over a 10 km wide area (only grooves only is pointed by arrow). (b) Grooves (G) at the head of the deep valley. A sinuous valley (SV) is observed with same main direction as grooves. The wind streak indicates an E to W dominant wind. (c) Lobate features typical of lava flows lobes (LL). (d) Grooves south of the deep valley with a second smaller teardrop shaped island (B).
MOLA gridded data (Fig. 7). In Fig. 7, arrows (in blue in the online version) indicate directions of erosional landforms (valleys, grooves and teardrop-shaped landforms) that can be compared to lines with measured slope azimuths (in yellow in the online version). The lava flows lobes are present in the southwest part of the grooved plain (in red in the online version). The orientations of the erosional landforms seem consistent with the overall current topography. A more detailed comparison is done in Fig. 7c. In the region of the teardrop-shaped island A, the regional slope (in yellow) is of 0.11 to the south and increases to 0.51 where we observe the most developed grooves. To the east, other grooves also developed on a 0.51 slope to the south. At the head of the DV, there is a gentle step in the topography with a southern azimuth and a slope reaching here 0.71. South to the DV, grooves are still present on a 0.51 slope. East of the DV end, the slope is nearly constant at 0.61. Thus, from A to the eastern end, directions given by landforms are consistent with the direction of the main regional slopes. Nevertheless, notice a small saddle (mapped with S) that indicates a small relief here (100 m of elevation difference
addition to this deep valley a few sinuous landforms seen as negative relief are also identified in diverse locations of the smooth plain, especially to the north, northwest, and east of the central area of Fig. 3; they are mapped in the geomorphic map as valley-like lineations (dotted lines in Fig. 6).
3.2. Comparison between erosional landforms directions andslopes from topographic data
The previous observations show the presence of a 60 km long DV with sinuous shape and few branching tributaries. Close to the source area, DV is surrounded by elongated grooves and tear-dropped islands both typical of erosion. The directions of flow indicated by these features show a NS direction in the western part of the study area changing into a WE direction in the eastern part (Fig. 6). These morphologically derived flow directions can be further investigated with topographic data. The landforms observed are located at MOLA elevations of �1000 m at the west to �2000 m at the eastern end of DV. Regional slope azimuths have been derived from

N. Mangold et al. / Planetary and Space Science 56 (2008) 1030–1042
Fig. 5. (a) Eastern part of the deep valley (DV). (b) Streams connecting (CS) to the deep valley with small theater-shaped head. (c) The deep valley ends suddenly with poorly visible lineations to the right of the image.
Fig. 6. Interpretative geomorphic map of the studied area. Grooves (gray lines) and valleys (black) indicate a NS direction at left changing to a WE direction atthe bottom central part of the image. Putative erosional landforms (dotted lines) indicate a continuation of the flow to the east and possible indication for the flow source area in the northwest.

N. Mangold et al. / Planetary and Space Science 56 (2008) 1030–1042
Fig. 7. (a) MOLA color map of the area with elevation contours every 200 m. (b) Regional slopes azimuths (yellow arrows), lava flows direction (red arrows) and fluvial landforms direction (blue arrows). Main slopes are consistent with directions observed for aqueous landforms all over the area. S is the saddle north of the dense grooves of Fig. 4a. The lava front (in red) is determined from the difference in shape of the lava plain (rougher inside red lines). (c) Close-up of MOLA topography contours and HRSC image on the location of Fig. 3.
scales depending on the intensity of the flood, thus suggesting a smaller flood at Syrtis Major than in Ares Vallis. By comparison, the teardrop-shaped island observed on Fig. 8d in Athabasca Valles, a more limited but recent flood (Burr et al., 2002), is 1 km wide, only two times larger than the similar landforms of the Syrtis Major region.
at maximum). North of A, the plain is very flat with the slope lower than 0.11; this area is devoid of any obvious erosional landform.
4. Interpretation of erosional landforms
4.1. Teardrop-shaped islands origin The length/width ratio (L/W) has been widely used tocompare these landforms to other processes (e.g. Baker andKochel, 1979). Values of L/W ratio are known to be of 3.15 for Scablands (Washington State) and 3.25 for the Martianislands in average (Baker and Kochel, 1979; Komar, 1984). They are generally slightly lower than fluvial islands in classical river streams with 4.3 (Komar, 1984). The L/W ratio of the first one (Fig. 8a) is approximately 3.0 fitting to the range of L/W ratio on earth and for the Martian
The two teardrop-shaped landforms A and B are similar in shape to the teardrop-shaped islands observed in classical outflow channels (e.g. Baker et al., 1992). The crater creates a zone of non-erosion, or at least of limited erosion, in the ‘‘shadow’’ behind the crater (Fig. 8a, b). Compared to Ares Vallis, a major flood event, the observed teardrop-shaped landforms are more than ten times smaller (Fig. 8c). The same shadow effect can occur at different

N. Mangold et al. / Planetary and Space Science 56 (2008) 1030–1042
Fig. 8. Comparison of landforms on Syrtis Major lava plain and other ouflow channels on Mars. (a,b): Close-ups of the two teardrop-shaped islands of North Syrtis area (see Fig. 4 for localization). (c,d): Teardrop-shaped islands in Ares Vallis floor (HRSC 1607) and Athabasca Vallis (HRSC 2121). (e) Close-up on grooved area in Syrtis area. (f) Grooves in Ares Valles (HRSC 1000).
plains might explain difference of erosion but this should indicate a contrary trend, because highlands are likely more erodable than lava flows. From the difference of scale and shape, it is therefore unlikely that wind erosion can explain the observed teardrop-shaped landforms in Fig. 4.
channels. The second one (Fig. 8b) has slightly lower ratio,with 1.9, and is less similar as noticed in the description. Could other processes explain these landforms? The plainsmaterial is of volcanic origin and volcanic landforms canlocally be erosional. However, the presence of streamlinedislands is not possible from lava flows themselves. These twocraters obviously formed after the plains formed, or theywould not have shown erosional patterns associated. Thus, teardrop-shaped landforms are not volcanic in origin.
4.2. Grooves origin
Some eroding forces such as wind, glacier abrasion or any aqueous flows often form grooves. Energetic aqueous floods can create grooves, similar to those frequently observed in other outflow channels (Fig. 8e, f). Here, the example of Ares Vallis is not larger than the grooves of Syrtis, in contrast to the teardrop-shaped islands. These grooves are located on the external edge of the valley, at a location where the flood was probably not as much developed as in the main course channel, therefore suggesting a discharge rate of loweramplitude than the Ares Vallis main channel system. Grooves follow the topographic slope as would aqueous flows too.
Current eolian activity follows E–W direction different from the grooves and islands, but a past eolian erosion might have followed other pathways. Teardrop-shaped islands and wind streaks are both due to the ‘‘shadow’’ created by the crater topography but they do not show similar morphologies, suggesting the teardrop-shaped islands are not wind related features. Small tear-dropped shapes behind craters can locally be due to eolian processes in dusty regions (see for example MOC E01-01738). However, these landforms are very small compared to the observed case, as they affect craters of typically 50 m wide or less. In addition, the outcrops of Noachian highlands do not show any sign of any NS direction of erosion, suggesting the observed erosion was limited to the plains material. This characteristic is more difficult to explain if this was created by wind. Eventually, a difference due to thedifference in material property between highlands and
Wind action forms erosional features such as yardangs, i.e. elongated hills formed in weak material parallel to the wind direction. However, wind streaks indicate E–W prevailing winds, which are not consistent with the N–S orientation of the grooves. One can argue that ancient wind directions could have been different, but yardangs are typically formed by erosion into weak material and are

N. Mangold et al. / Planetary and Space Science 56 (2008) 1030–1042
subsurface sapping. Fig. 4b indicates that grooves and DV have approximately same directions at the valley head. In order to reconcile these apparently contradictingobservations, an interpretation is proposed: DV might be alocal incision of a catastrophic flood that predominantly created grooves. Comparison can be made with the Holocene sub-glacial volcanic flood of the Jo¨ kulsa a Fjo¨ llum in Iceland (Waitt, 2002a, b). Therefore, the surface erosion wasfollowed by the incision of a nearly 1 km large and 100 m deep canyon about 100 km away from the flood source region. Such change of flow mode might occur, for example, when the bedrock strength or the slope changes, or when apreexisting landform such as a lava tube exist and is enlargedand re-incised. The increase of regional slopes to 0.71 at the valley head is consistent with a flow mode change (Fig. 7). These interpretations might also explain the directiondifference between DV and grooves south of the valley (Fig.4d). The flood was not fully sequestered in the valley but part of the flood continued as a sheet flow south to the DV.
much more difficult to create on a lava plain. As explained for tear-dropped islands, no wind erosion of a past N–S direction is seen in the relics if highlands visible inside the plain, an argument not favorable to explain grooves by this process too. The grooves follow the main slopes and change of direction sharply with it, despite the slope is very low, a characteristic also difficult to explain with a wind erosion origin.
Volcanic grooving is not common, but might occur when lavas are sequestered along a given topography, leading to more erosion than deposition. In Fig. 4c, in the southwestern part of the studied area, lava flows are clearly visible with a lobate shape and individual flows can be followed. However, where plains are grooved and cut by valleys, no lobes are visible, and no individual flows can be followed. Moreover, the presence of streamlined islands associated to the grooves, showing the same direction, does not favor a volcanic origin due to the gap of time necessary to form these two craters after the plains. Thus, the overall lack of any volcanic features due to the lava flows visible at the surface, and associated to the erosional landforms supports the idea that the grooves are not volcanic in origin, and formed after the emplacement of the lava bedrock.
In summary, the presence of widespread grooves andassociated tear-dropped islands that are consistent with the regional slopes is evidence for a high-energy aqueous flow having carved these landforms. We interpret the deep valley as formed by progressive surface erosion, and/or infiltration of volatiles inside the subsurface and backward sapping. In this interpretation, (1) aqueous flows formed first as a sheet flow forming grooves, and tear-dropped islands, over the smoothplains, and (2) aqueous flows carved the DV and its tributaries in specific location controlled by slope or local geology. This interpretation might also explain the abrupt end of the DV.Indeed, catastrophic floods often disappear progressively because the flow discharge decreases progressively in intensity from the source area and fluids infiltrate in the ground or evaporate (e.g. Baker et al., 1992).
Glacial abrasion forms grooves at different scales with associated features such as drumlins and moraines (e.g. Allen, 1997). This hypothesis is possible from the geometry of grooves, but no residual moraines are observed in this region whereas moraines should be present when ice sublimates or melts. Given the slope of o0.51, any glacier would be very thick: Given the basal strength of glacier of 50 kPa, such a slope would invoke a 1.6 km thick glacier which should have left other landforms such as moraines. Despite glacial grooves should not be fully excluded, erosional grooves from an aqueous erosion is easier to explain these landforms.
5. Putative source areas 4.3. Geometry of the valley system
The teardrop-shaped island A and erosional grooves indicate that the flood originated north of them. Following the erosional features to the north, we observe a gentletopographic saddle less of 80 m high over 20 km (S in Fig. 7).Strong floods might climb low slopes (here only 0.1–0.21 over 20 km) when over pressurized at the source area. An alternative, and probably more realistic explanation, is thatthis topographic saddle formed after the flood, thus explaining the apparent local discrepancy between the flow directions and the slopes. In fact, the saddle is located at backward slope of a wrinkle ridge (compressive structure) (Fig. 3). Wrinkle ridges have typically elevation differences on the order ofseveral hundred meters that could explain the existence of thisrelief (e.g. Watters, 1993; Mangold et al., 1998). They have also longer wavelength relief such as broad arches that createsmall bulge inside volcanic plains. Moreover, these lava plains are formed by lava flows that follows main slopes. As there is no apparent vent or dikes
The valley by itself resembles lava tubes at low resolution. However, the presence of a few branching tributaries indicates a geometry different from usual lava tubes, generally isolated and not connected. DV has a geometry and a width similar from beginning to end, with only a few tributaries, indicating an origin different from usual overland flows which are generally characterized by an increasing width and more dendritic patterns. The apparent theater-heads of several tributaries and the nearly constant width could suggest a formation by subsurface sapping, i.e. the seepage of water and regressive erosion forming large and poorly hierarchized valleys (Laity and Malin, 1985). A similar landform is visible in the Kasei Valles outflow channels and is interpreted mainly as a late episode of subsurface sapping (Williams et al., 2000). However, the observed grooves point towards an erosion by surface flows, hence a mechanism different from

N. Mangold et al. / Planetary and Space Science 56 (2008) 1030–1042
that this terrain might be a possible source area. Nevertheless, we do not observe any flow features right at the opening of this chaotic region.
feeding lavas at the saddle top, there is no reason that thelavas would have shown this topography during theirformation. Wrinkle ridges in Syrtis Major Planum might haveformed at the Late Hesperian epoch (Mangold et al., 2000), soafter the lava flows, and perhaps after the erosional landformsformed.
Several outflows such as Mangala or Athabasca Valles are born on large fractures; i.e. Cerberus Fossae in the case of Athabasca Valles. Similar fractures cross the highlands (Fig. 2). However, none is seen crossing the lava plains that could be a potential source area. Northwest of A, there are only few signs of lineations possibly corresponding to fluvial flows in three areas, especially close to the contact with Noachian highlands. Here, the grooves indicate a flow, perhaps coming from beneath the lava layers (Fig. 9b), thus suggesting the presence of aquifers beneath the uppermost lava layers, but this interpretation remains speculative because of the limitation in the image resolution. In summary, the source region of the aqueous flow is very difficult to identify. Signs of flows exist, but they are not continuous to the region of abundant grooves.
In addition, the plains north of A are very flat (typically 0.11) while we observe grooves occurring on slopes of 0.51. It is possible that the very flat relief could have impeded theformation of erosional landforms because of the relative lowerdischarge involved by this flat topography, therefore renderingdifficult the identification of the flow origin. An interesting landform is the chaotic terrain (Fig. 9a) observed 50 km north of A. Here, the smooth plains are no more flat and continuous, but are broken in many pieces that appear to be uplifted from a previously flat surface. A 100 m deep depression formed in these lava blocks. Chaotic terrains are found in many source areas of other outflow channel on Mars. Chaotic terrains at the source of outflows in Xanthe Terra are much larger and deeper than the one of Fig. 9b, with usually more than 2 km in depth and more than 50 km in width, but the resulting outflow channels are much wider too. By analogy with Xanthe Terra, we suggest
6. Estimation of discharge rates
Discharge rates are important for our understanding of the magnitude of outflow events. A main question for this calculation is: do we observe the effect of several episodes of flows or just a single one? DV might have formed as a second stage in the evolution of the outflow, but this stage can be part of the same episode of flow. Grooves visible at the scale of HRSC images required an energetic flow, but a suite of medium-size floods is not excluded. We estimate discharge rates as produced by a single episode of flow, but do not exclude the possibility of multiple episodes. As for other Martian outflow channels, we assume aqueous flows to be liquid water mixed with rocks, but this does not exclude other more exotic volatiles (e.g. Baker et al., 1992; Coleman, 2005).
6.1. Maximum discharge rate in the deep valley
We can calculate the maximum channel discharge with the well-known Manning equation assuming a bankfull discharge in the channel. This must be taken as a rough maximum that might overestimate the true discharge rate. We use the equation modified for Mars by Komar (1979) which corrects for Martian gravity:
Q ¼ Aðg4=3
=gn 2Þ
1=sRme 2 where A is the flow cross-sectional area, gm and ge are gravity
on Mars and Earth, respectively, s is the local slope, n is the Manning roughness coefficient and R is the hydraulic radius, defined as the ratio of flow cross-sectional area to wetted perimeter. Use of this equation to determine flow discharges has been used extensively for Martian outflow channels (e.g. Carr, 1996). A and R are calculated assuming a rectangular shape of the valley, using the depth of 50 m measured with MOLA data, and an average width of 500 m. At this location, the slope s is of 0.71. The main approximation in this calculation is the coefficient n.
Fr
ig.9.Close-uponpossibleflow-elatedfeaturesnorthofthemainlandforms.(a)Chaoticzonesasapossibleoriginfort
heflow.(b)Flowlineationsatthehighlands–lavasboundary.