ICMBSEA-JUNE-2021.pdf - INTERNATIONAL JOURNAL FOR ...
179
INTERNATIONAL JOURNAL FOR INNOVATIVE RESEARCH IN MULTIDISCIPLINARY FIELD (ISSN: 2455-0620) (Scientific Journal Impact Factor: 6.719) Monthly Peer-Reviewed, Refereed, Indexed Research Journal Index Copernicus International - IC Value: 86.87 (26 & 27 June, 2021) Jointly organized by: Management Institute, Warsaw University of Life Science - SGGW, Warszawa, Poland ‘Research Culture Society’ and ‘Scientific Research Association’ RESEARCH CULTURE SOCIETY & PUBLICATION Email: [email protected] Web Email: [email protected] WWW.IJIRMF.COM Conference Special Issue - 26 June - 2021
-
Upload
khangminh22 -
Category
Documents
-
view
7 -
download
0
Transcript of ICMBSEA-JUNE-2021.pdf - INTERNATIONAL JOURNAL FOR ...

INTERNATIONAL JOURNAL FOR INNOVATIVE RESEARCH IN
MULTIDISCIPLINARY FIELD
(ISSN: 2455-0620) (Scientific Journal Impact Factor: 6.719)
Monthly Peer-Reviewed, Refereed, Indexed Research Journal
Index Copernicus International - IC Value: 86.87
(26 & 27 June, 2021)
Jointly organized by:
Management Institute, Warsaw University of Life Science - SGGW, Warszawa, Poland
‘Research Culture Society’ and
‘Scientific Research Association’
RESEARCH CULTURE SOCIETY & PUBLICATION
Email: [email protected]
Web Email: [email protected]
WWW.IJIRMF.COM
Conference Special Issue - 26 June - 2021

ICBMSEA - 2021 Page 1
International
Conference on
‘Business, Management,
Social and Economical
Advancements’ (ICBMSEA – 2021)
26 & 27 June, 2021
Bangkok, Thailand.
Conference Special Issue - 26
The Managing Editor:
Dr. Chirag M. Patel
( Research Culture Society & Publication)
Jointly Organized By :
Management Institute, Warsaw University of Life Science -
SGGW, Warszawa, Poland,
‘Research Culture Society’
and
‘Scientific Research Organization’.

ICBMSEA - 2021 Page 2
International Conference
on
Business, Management, Social and
Economical Advancements
26 & 27 June, 2021
( Conference Proceedings – Special Issue )
Copyright: © The research work as a theory with other contents, images, tables, charts in full
papers are subject to copyright taken by Management Institute, Warsaw University of Life
Science - SGGW, Warszawa, Poland, ‘Research Culture Society’ and ‘Scientific Research
Association’, The Managing Editor, Co-editors and Authors of this Conference special issue.
Disclaimer: The author/authors/contributors are solely responsible for the content, images,
theory, datasets of the papers compiled in this conference special issue. The opinions expressed
in our published works are those of the author(s)/contributors and does not reflect of our
publication house, publishers and editors, the publisher do not take responsibility for any
copyright claim and/or damage of property and/or any third parties claim in any matter. The
publication house and/or publisher is not responsible for any kind of typo-error, errors,
omissions, or claims for damages, including exemplary damages, arising out of use, inability to
use, or with regard to the accuracy or sufficiency of the information in the published work. The
publisher or editor does not take any responsibility for the same in any manner. No part of this
publication may be reproduced or transmitted in any form by any means, electronic or
mechanical, including photocopy, recording, or any information storage and retrieval system,
without permission in writing from the copyright owner.
Online / Imprint: Any product name, brand name or other such mark name in this book are
subjected to trademark or brand, or patent protection or registered trademark of their respective
holder. The use of product name, brand name, trademark name, common name and product
details and distractions etc., even without a particular marking in this work is no way to be
constructed to mean that such names may be regarded as unrestricted in respect of trademark
and brand protection legislation and could thus be used by anyone.
Published By:
INTERNATIONAL JOURNAL FOR INNOVATIVE RESEARCH IN MULTIDISCIPLINARY
FIELD (E-ISSN: 2455:0620)
Research Culture Society and Publication.
(Reg. International ISBN Books and ISSN Journals Publisher)
Email: [email protected] / [email protected]
WWW.IJIRMF.COM

ICBMSEA - 2021 Page 3
About the organizing Institutions:
The Warsaw University of Life Sciences (Management Institute) Poland, is
one of the largest and the most prestigious universities in Poland. It educates nearly
18,000 students in 38 study programs (including 8 taught in English) - from
veterinary medicine and landscape architecture, through economics and computer
science, to tourism and dietetics. It employs 1,200 academic teachers and offers a
modern campus and excellent learning conditions. The campus is located in the
southernmost district of Warsaw, Ursynów. The campus has a historical part, with
an 18th-century palace and a new part where most of the faculty buildings and
dormitories are situated. The Management Institute was established in 2019. The
research developed in this Institute is related to management, trust, knowledge
management and information technology.
‘Research Culture Society’ is a Government Registered Scientific Research
organization. Society is working for research community at National and
International level to impart quality and non-profitable services. Society has
successfully organized 100+ conferences, seminars, symposiums and other
educational programmes at national and international level in association with
different educational institutions.
Objectives of the International Conference :
Our main objective is to observe the current scenario towards the advancement of
common citizen’s life by improving the theory and practice of various disciplines
of Business, Management and Economy.
The aim of the conference is to provide an interaction stage for researchers,
practitioners from academia and industries to deal with state-of-the-art
advancement in their respective fields.
ICBMSEA - 2021 Page 4
WARSAW UNIVERSITY OF LIFE SCIENCES, POLAND
MANAGEMENT INSTITUTE
MESSAGE
Dear Ladies and Gentlemen,
Thank you for your attendance at International Conference on Business,
Management, Social and Economical Advancements.
This year the Conference is organized by the Research Culture Society and
the Management Institute from Warsaw University of Life Sciences in Poland.
The theme of the conference is very actual and worth discussing. It has a
broad scope and great relevance in the context of the current scenario of the
situation in the world during the COVID 19 pandemic. The Conference will shed
light on the consequences of the Coronavirus and will point out the new challenges
in the business environment.
I would like to take the opportunity to thank you all for contributing to this
Conference.
I look forward to meaningful presentations, discussions, and collegial
networking.
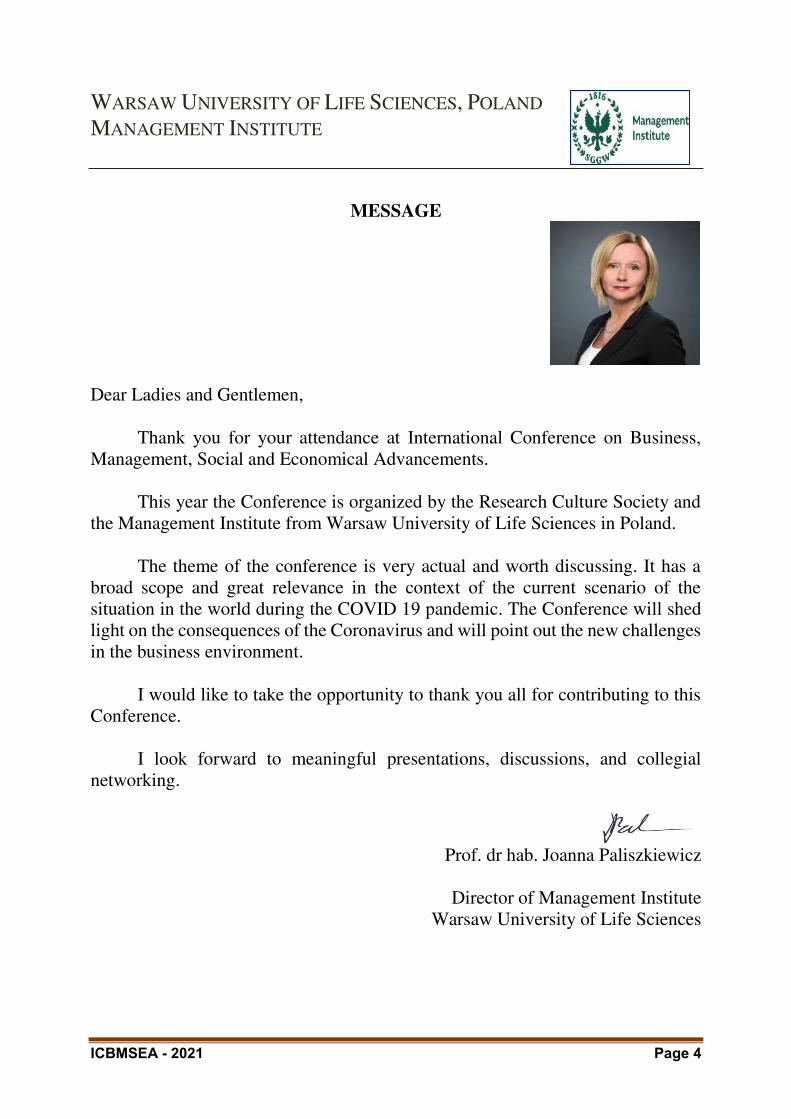
Prof. dr hab. Joanna Paliszkiewicz
Director of Management Institute
Warsaw University of Life Sciences

ICBMSEA - 2021 Page 5
Dr.C. M. Patel
Director, Research Culture Society.
Message
Dear Professional Colleagues.
I am happy that Management Institute, Warsaw University of Life Sciences,
Poland in collaboration with ‘Research Culture Society’ (Government Registered
Scientific Research organization, India) are organizing ‘International Conference
on Business, Management, Social and Economical Advancements’ during 26 & 27
June, 2021.
The aim of the conference is to provide an interaction stage for researchers,
practitioners from academia and industries to deal with state-of-the-art
advancement in their respective fields. The main objective is to observe the current
scenario towards the advancement of common citizen’s life by improving the theory and practice of various disciplines of Business, Management and Economy.
I believe, this International Conference will help in redefining the strong
connect between commerce, management and economics education and the
holistic development of students in the academic institutions. An additional goal
of this international conference is to combine interests and scientific research
related to business-economics to interact with members within and outside their
own disciplines and to bring people closer for the benefit of the scientific
community worldwide.
My best wishes to the committee members, speakers and Participants of this
scientific conference.
Dr.C. M. Patel
Director, Research Culture Society.

ICBMSEA - 2021 Page 6
Conference Committee
Organizers – Conference Chair Members :
Prof. Dr hab. Joanna Paliszkiewicz, Director of Management Institute, Warsaw University of Life
Science - SGGW, Warszawa, Poland.
Dr.C. M. Patel, Director, Research Culture Society.
Advisory Members :
Dr. Paresh Shah, Professor, Rai University. Alumnus of Indian Institute of Management (IIM)
Ahmedabad, India. International Awardee, Author of Oxford University Press.
Dr. R. Sivarethinamohan, Associate Professor at Department of Professional Studies, Christ (Deemed
to be) University, Bangalore, India.
Dr. Ahmad Rasmi Albattat, Assistant Professor, Post Graduate Centre, Management and Science
University, Shah Alam, Malaysia..
Session Chair / Reviewer Committee:
Dr. hab. Marcin Ratajczak, Dean of Faculty of Economics, Management Institute at Warsaw University
of Life Sciences (SGGW), Warszawa, Poland.
Dr. Anna Jasiulewicz, Assistant Professor, Management Institute at Warsaw University of Life Sciences
(SGGW), Warszawa, Poland.
Dr. Konrad Michalski, Adjunct Professor, Management Institute at Warsaw University of Life Sciences
(SGGW) Warszawa, Poland.
Dr.Piotr Pietrzak, Adjunct Professor, Management Institute at Warsaw University of Life Sciences
(SGGW), Warszawa, Poland.
Dr. Shaikh Aftab Anwar, Principal & Director, Poona College of Arts, Science and Commerce, Pune
and Poona Institute of Management Science and Entrepreneurship. Maharashtra, India
Dr. B Suresh Lal, Professor, Department of Economics, Kakatiya University, Warangal, India
Dr. Arti Gaur, Assistant Professor, Department of Business Administration, CDLU, India
Dr. Shovona Choudhury, Asst. Professor, Department of Commerce & Finance, Amity University,
Ranchi, India.
Dr. Gajendra Naidu, Professor, Faculty of Finance, Botho University: Gaborone Campus: Botswana,
Africa.
Dr. Purvi Derashri, Professor, Faculty of Commerce, Parul Institute of Commerce, Parul University,
Waghodia, Vadodara, India.
Dr. Kiran Sood, Associate Professor, Chitkara University, Faculty of Commerce, Punjab, India.
Dr. Obianuju, Emmanuela Agbasi, Lecturer, Nnamdi Azikiwe University, Awka, Nigeria
Dr. Harmeet Kaur, Assistant Professor, Amity Business School, Amity University Jharkhand, India
Dr. Alpesh Gajera, Assistant Professor, Faculty of Management, Marwadi University, Rajkot, Gujarat,
India

ICBMSEA - 2021 Page 7
Dr. Snehalkumar H. Mistry, Principal, Vidyabharati Trust College of BBA and BCA, Umrakh, Surat,
Gujarat, India
Dr. Sagar Manjare, Principal, Siddhant College of Management Studies, S.P. Pune University, Pune,
India
Dr.Umar Lawal Aliyu, Lecturer, LIGS University Honolulu, Hawaii, United States.
Keynote Speakers:
Prof. Dr hab. Joanna Paliszkiewicz, Director of Management Institute, Warsaw University of Life
Science - SGGW, Warszawa, Poland.
Dr. Markus Launer, Professor, Business Administration and Service Management, Ostfalia University
Campus, Suderburg, Germany.
Prof. Francesca Di Virgilio, Associate Professor, Department of Economics, University of Molise,
Campobasso , Italy.
Dr. hab. Marcin Ratajczak, Dean of Faculty of Economics, Management Institute at Warsaw University
of Life Sciences (SGGW), Warszawa, Poland.
Dr. Anna Jasiulewicz, Assistant Professor, Management Institute at Warsaw University of Life Sciences
(SGGW), Warszawa, Poland.
Dr. Konrad Michalski, Adjunct Professor, Management Institute at Warsaw University of Life Sciences
(SGGW) Warszawa, Poland.
Dr. Piotr Pietrzak, Adjunct Professor, Management Institute at Warsaw University of Life Sciences
(SGGW), Warszawa, Poland.
Dr.C. M. Patel, Director, Research Culture Society.
Rania Lampou, STEM instructor and an ICT teacher trainer, at the Greek Ministry of Education - the
Directorate of Educational Technology and Innovation, Greece.
Dr. T. K. Chatterjee, Associate Professor - Marketing, IMT Nagpur, India
Prof (Dr.) Raj Kumar Singh, Dean (R&D) & HOD (Department of Commerce), Chairperson, Centre
For Entrepreneurship, Innovation & Skill Development, School of Management Sciences, Varanasi, India
Dr. Ahmad Rasmi Albattat, Assistant Professor, Post Graduate Centre, Management and Science
University, Shah Alam, Malaysia..
Dr. Paresh Shah, Professor, Rai University. Alumnus of Indian Institute of Management (IIM)
Ahmedabad, India. International Awardee, Author of Oxford University Press.
Dr. Alona Revko, Professor, Chernihiv Polytechnic National University, Chernihiv, Ukraine
Dr. Mrs. Harvinder Soni, Professor , Taxila Business School, Jaipur, India
Dr. Rashmi Gujrati, Professor & Dean Tecnia Institutes of Advanced Studies, New Delhi, India
*****

ICBMSEA - 2021 Page 8
INDEX
PAPER ID Table of Contents Page
No.
a) About the organizing Institutions:
Objectives of the International Conference : 3
b) Message of Director, Management Institute, WULS, Poland 4
c) Message of Director, Research Culture Society. 5
d) Conference Committee 6
e) Keynote Speakers 7
f) Table of Contents 8 - 9
Paper Title & Author(s) Name
ICBMSEA001
Comparison of Financial performance between Islamic Banks and
Conventional Banks in North Sumatra --
Saleh Sitompul
10-15
ICBMSEA002
A Study on Green Marketing: The Competitive Advantage of
Sustainability --
Dr. Pralhad P. Rathod, and B. Sudheer Kumar
16-22
ICBMSEA003
Applying the concept of Tzu Chi Foundation management to Non-
profit organization management in Thailand --
Polwasit Lhakard
23-32
ICBMSEA004 Green supply chain management in India --
Dr. Bhawana Rewadikar 33-39
ICBMSEA005
A study on economic challenges faced by housewives in this
pandemic --
Mrs.Helen Sha Diana and Ms.Janani
40-45
ICBMSEA006
Socio-economic Impacts of COVID-19: Facilitating Developing
Countries Towards a ‘New Normal’ World --
Dr. Parin Somani
46-53
ICBMSEA007
Life insurance services: policy holder’s satisfaction with regard to services rendered by LIC agents --
Dr. Durga Prasad Vali
54-61
ICBMSEA008
Examining the impact of institutional support on the
entrepreneurial intentions of Indian engineering graduates-The
extended planned behavior approach --
Dr Satyalakshmi Kompella
62-71
ICBMSEA009
Correlation study on institutional information and functioning
about Quality Management of Colleges of Education in Karnataka
-- Dr.DIVAKARA NAIK K S
72-76
ICBMSEA010
Socio economic impact of covid-19 on the performing artists in
Kerala --
Dr.Radhika P. C., and Dr. Bhagyalakshmi P. C.
77-83
ICBMSEA011 College Autonomy in Indian Higher Education System --
Shisira Bania 84-91
ICBMSEA012
Customers’ Satisfaction towards E-Banking Services in the
Digital Era – A study of Selected Public Sector Banks of South
Gujarat Region. --
Stuti S. Desai and Dr. Chinmayee J. Bhatt
92-98
ICBMSEA - 2021 Page 9
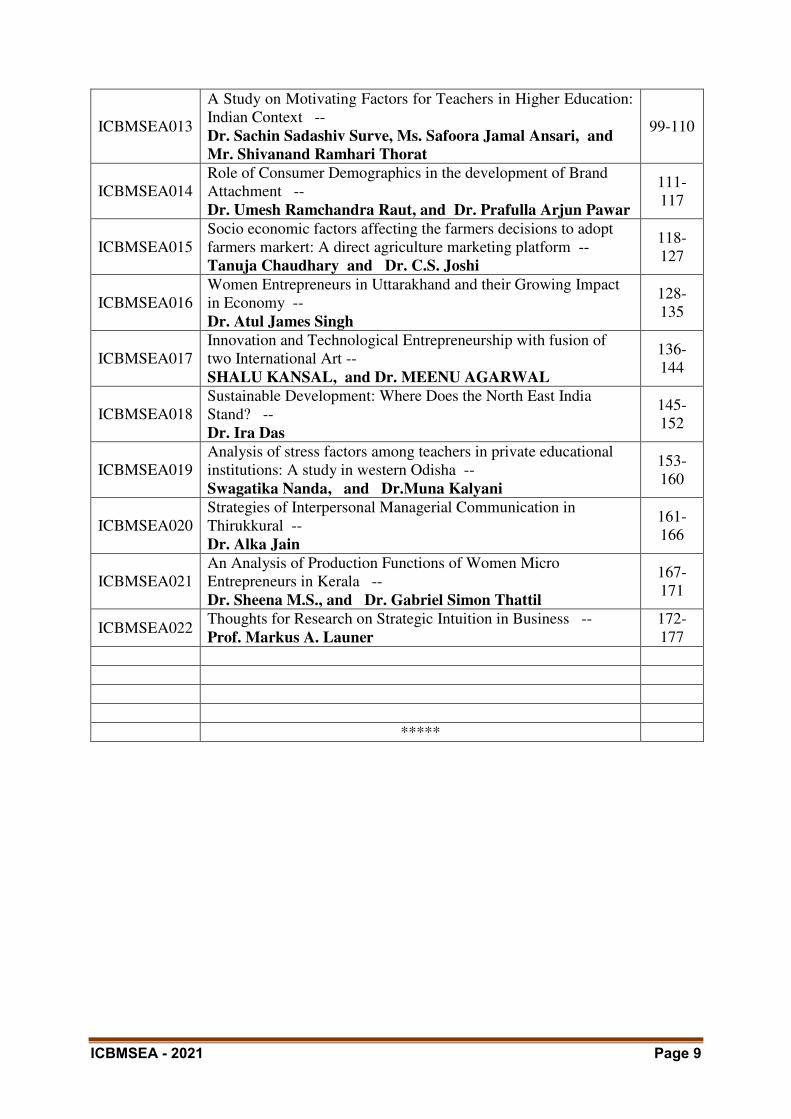
ICBMSEA013
A Study on Motivating Factors for Teachers in Higher Education:
Indian Context --
Dr. Sachin Sadashiv Surve, Ms. Safoora Jamal Ansari, and
Mr. Shivanand Ramhari Thorat
99-110
ICBMSEA014
Role of Consumer Demographics in the development of Brand
Attachment --
Dr. Umesh Ramchandra Raut, and Dr. Prafulla Arjun Pawar
111-
117
ICBMSEA015
Socio economic factors affecting the farmers decisions to adopt
farmers markert: A direct agriculture marketing platform --
Tanuja Chaudhary and Dr. C.S. Joshi
118-
127
ICBMSEA016
Women Entrepreneurs in Uttarakhand and their Growing Impact
in Economy --
Dr. Atul James Singh
128-
135
ICBMSEA017
Innovation and Technological Entrepreneurship with fusion of
two International Art --
SHALU KANSAL, and Dr. MEENU AGARWAL
136-
144
ICBMSEA018
Sustainable Development: Where Does the North East India
Stand? --
Dr. Ira Das
145-
152
ICBMSEA019
Analysis of stress factors among teachers in private educational
institutions: A study in western Odisha --
Swagatika Nanda, and Dr.Muna Kalyani
153-
160
ICBMSEA020
Strategies of Interpersonal Managerial Communication in
Thirukkural --
Dr. Alka Jain
161-
166
ICBMSEA021
An Analysis of Production Functions of Women Micro
Entrepreneurs in Kerala --
Dr. Sheena M.S., and Dr. Gabriel Simon Thattil
167-
171
ICBMSEA022 Thoughts for Research on Strategic Intuition in Business --
Prof. Markus A. Launer
172-
177
*****

INTERNATIONAL JOURNAL FOR INNOVATIVE RESEARCH IN MULTIDISCIPLINARY FIELD, ISSN: 2455-0620, Special Issue : 26, June-2021
Monthly, Peer-Reviewed, Refereed, Indexed Journal with IC Value: 86.87 Impact Factor: 6.719 Publication Date: 30/06/2021
Available online on - www.ijirmf.com Page 10
International Conference on
Business, Management, Social and Economical Advancements 26 & 27 June, 2021 Bangkok, Thailand
Jointly organized by: Management Institute, Warsaw University of Life Science - SGGW, Warszawa, Poland,
‘Research Culture Society’ and ‘Scientific Research Association’.
COMPARISON OF FINANCIAL PERFORMANCE BETWEEN
ISLAMIC BANKS AND CONVENTIONAL BANKS IN NORTH
SUMATRA
Saleh Sitompul
Postgraduate Doctoral Program Students Sharia Economics, Universitas Islam Negeri Sumatera Utara, Indonesian
Email - [email protected] Abstract: This study aims to determine the Comparison of Financial Performance Between
Islamic banks and Conventional Banks In North Sumatra. Methods of research using the method
of kuatitatif where with metodetime series for 6 years of secondary Data in penetilian this is a data
company financial statements of Islamic Banks and Conventional banks that have already been
published. The population in this study is the financial statements of islamic Banks and
Conventional banks from the year 2015-2020 sampling Technique used is metodetime series for 6
years. The type and Source of Data used in this research is secondary Data in the form of
financial statements of Islamic banks and Conventional Banks already published Data Collection
Methods used are: the comparative data is data the financial statements of each company is the
Source of the Research Data the Source of data used in the form of primary and secondary data
sources. The source of primary data obtained from the results of observation and interviews with
informants, while the source of the secondary data obtained from literature sources taken from
scientific journals, or books-the parent book that are relevant to the study of research, the archive
of the village, as well as documentation. Data collection techniques in this study with purposive
sampling method. Where data collection through observation, interviews, and documentation. The
results showed that the ratio of Capital Adequacy Ratio of a Conventional Bank is still above
criteria good condition stipulated by Bank Indonesia, namely exceed 8%. The ratio of Loan to
Deposit Ratio of Islamic Banks and Conventional Banks are under criteria a good condition set by
Bank Indonesia, namely between 85-110%. The ratio of Non-Performing Loans of commercial
Banks Conventi lmasih are on criteria good condition stipulated by Bank Indonesia which is below
5%. The ratio of Operating Costs / Operating Income of a Conventional Bank are not on the
criteria of good condition stipulated by Bank Indonesia, which is below 92% and the ratio of
Return On Assets of Conventional commercial Banks still are not on the criteria of good condition
stipulated by Bank Indonesia is above 1.5 percent.
Keywords: Financial Performance, Conventional Banks and Islamic Banks.
INTRODUCTION :
Financial Services institutions, namely the one of which the Bank has a strategic role in the economy of a country. As an intermediary institution, the bank's role in mobilizing public funds used to finance investment activities and provide services in payment traffic. In addition to running both the planning, the bank also serves as a medium in transmitting the monetary policy conducted by central banks.

INTERNATIONAL JOURNAL FOR INNOVATIVE RESEARCH IN MULTIDISCIPLINARY FIELD, ISSN: 2455-0620, Special Issue : 26, June-2021
Monthly, Peer-Reviewed, Refereed, Indexed Journal with IC Value: 86.87 Impact Factor: 6.719 Publication Date: 30/06/2021
Available online on - www.ijirmf.com Page 11
The Bank is known as a financial institution whose main activity is to receive deposits, savings and time deposits. Then the bank also known as a place to borrow money or credit for the people who need it. In addition, the bank also known as a place to exchange money, or accept all kinds of payment and deposit (Cashmere, 2009).
Based on the function of the bank, the nature of the bank's business with different manufacturing companies and other service companies. Most of the bank's assets are liquid assets and the level of asset turnover and pasivanya very high. The banking business is a business that relies heavily on trust, that the trust of the community as a user of banking services. Bit of course there are issues related to condition of the banks that are not healthy, then people will be flocking to withdraw their funds from the bank, so it will be more worsen the condition of the bank.
The Islamic financial system in Indonesia has expanded to the capital market, insurance, mortgages, savings and loan institutions, banks. It is to enrich the Islamic system over the conventional system which is used to compare the performance and future prospects in particular. The government made a strategic step the development of Islamic banking that gives permission to the bank-the bank for a conventional commercial to open a branch of Sharia Business Units, namely the conversion of conventional banks into Islamic banks (Antonio, 2001). However, during the period 1992-1998 there is only one Islamic Bank as the perpetrator of the Islamic banking industry, namely Bank Muamalat Indonesia, It is caused during the six years of operation is practically no other regulators that support the Islamic Banking system. This strategy also is a response and initiatives of change in the Banking Law No.10/1998 as a substitute for the LAW No.7/1992 firmly.
The Islamic Banking system is positioned as part of the national banking system. In 2008 the Government issued Law No.21/2008 Islamic Banking, which is expected to provide a legal basis that is more robust and greater opportunities in the development of Islamic Banking in Indonesia so similar and parallel to the conventional banks. Currently, the presence of Islamic banks in Indonesia has been regulated in the Legislation, namely Law No. 10, 1998 on the amendment of Act No. 7 of 1992 concerning Banking as well as more specific on Government Regulation No. 72 of 1992 on the Bank Based on the principles for the Results.
Since that time, the then-known two of the banking system in Indonesia (Dual Banking System) that are differentiated based on interest payment or results of operations namely: Banks that do business in conventional and Banks that do business in sharia.
Conventional banks and Islamic banks in a few things have similarities, especially in the technical side of the receipt of money, the transfer mechanism, computer technology used, the general terms of obtaining financing such as KTP, NPWP, proposals, financial reports, and so on. The fundamental difference between the two that are related to the legal aspects, organizational structure, the business is financed, and the working environment.
The needs of the community have been missed with the realization of the banking system that are shariah compliant. The activities of the operations of Islamic Banks using the principles for the results. Islamic banks do not use the flowers as a tool to benefit or charge interest on the loan because the interest is riba is forbidden. The pattern for this result allows the customer to monitor directly the performance of Islamic banks by monitoring the number for the results obtained. If the amount of the bank's profit the greater the greater for the results that are received by the customer and vice versa.
The number for the result of a small or smaller in a long time become the benchmark that the management of the bank slumped. The state of it is an early warning that is transparent and easy for the customer. Different from conventional banking, the customer is not able to assess the performance only based on the interest earned.
Islamic banks as an alternative to banking services has become a phenomenon in the Indonesian economy. Its existence has given a new breath to the world of business in this country, especially the banking world. Although still relatively new in the world of banking, however, Islamic Banks are able to progress and develop in the competition which is weird. This

INTERNATIONAL JOURNAL FOR INNOVATIVE RESEARCH IN MULTIDISCIPLINARY FIELD, ISSN: 2455-0620, Special Issue : 26, June-2021
Monthly, Peer-Reviewed, Refereed, Indexed Journal with IC Value: 86.87 Impact Factor: 6.719 Publication Date: 30/06/2021
Available online on - www.ijirmf.com Page 12
competition will be tighter between conventional banks and Islamic banks. Based on the statistics of Bank Indonesia to August 2011, the number of Islamic Banks today has reached 11 units. Sharia Business Unit, as many as 23. In addition, the number of Islamic Rural Banks has reached 154 units and the total amount of office of the sharia as much as 1,877 units. Raising funds from the community or so-called funds from third parties experienced growth every year. The rate of Deposit growth was recorded average 39,16% per year, so did the financing provided grow 34,85%per year. The growth of the Islamic banking industry in 2019, which reached 3.4 % with an average of 45% per year.
As one of the financial institutions, the bank needs to keep its performance so that it can operate optimally. Moreover, Islamic banks have to compete with conventional banks are dominant and has been growing rapidly in Indonesia. The increasingly sharp competition, this should be coupled with good management to be able to survive in the banking industry. One of the factors that must be considered by the bank to be able to continue bartahan life is the bank's financial performance.
One of the main sources of indicators that dijadiakan the basis of valuation is the financial statements of the bank concerned. Based on the financial statements of banking can be calculated a number of financial ratios that can be used to predict the level of profits, predict the future, and to anticipate future conditions. LITERATURE REVIEW: Conventional Banks
Conventional banks are Banks that run their business activities conventionally and by type consists of a Conventional Bank and the Bank Financing People Shariah (Booklet, Bangking Indonesia, 2011).
Islamic Banks
Islamic Bank is a Bank conducting its business activities based on Sharia Principles and according to its kind consists of Islamic Banks and Bank Financing People Shariah. Sharia principles is the principle of Islamic law in the activities of banking based on a fatwa issued by the institution that has the authority in the determination of the fatwa in the field of sharia (Booklet Bangking Indonesia, 2011). Financial Performance
The performance of banking is a picture of the achievements of the bank in the financial aspects, marketing, collection and disbursement of funds in a period. The Bank as a company is obliged to maintain public confidence in the performance of the bank concerned, it is therefore necessary transparency or disclosure of information on the financial statements of the bank that aims to provide information concerning the financial position, performance and changes in financial position, as well as a basis of decision-making. RESEARCH METHODS:
This research is included quantitative research because the data used in the form of numbers. The Data used in this research is secondary. Secondary Data in penetilian this is a data company financial statements of Islamic Banks and Conventional banks that have already been published.
The population in this study is the financial statements of Islamic Banks and Conventional banks from the year 2015-2020 sampling Technique used is metodetime series for 6 years. The type and Source of Data used in this research is secondary Data in the form of financial statements of Islamic banks and Conventional Banks that have already been published
Data Collection methods used are: the comparative data is data the financial statements of each company is the Source of the Research Data the Source of data used in the form of primary

INTERNATIONAL JOURNAL FOR INNOVATIVE RESEARCH IN MULTIDISCIPLINARY FIELD, ISSN: 2455-0620, Special Issue : 26, June-2021
Monthly, Peer-Reviewed, Refereed, Indexed Journal with IC Value: 86.87 Impact Factor: 6.719 Publication Date: 30/06/2021
Available online on - www.ijirmf.com Page 13
and secondary data sources. The source of primary data obtained from the results of observation and interviews with informants, while the source of the secondary data obtained from literature sources taken from scientific journals, or books-the parent book that are relevant to the study of research, the archive of the village, as well as documentation. Data collection techniques in this study with purposive sampling method. Where data collection through observation, interviews, and documentation. RESULTS AND DISCUSSION:
Financial Performance Of Islamic Banks With Conventional Commercial Banks In Terms
Of Capital Adequacy Ratio
From the results of the analysis obtained that the calculated F for the Capital Adequacy Ratio with equal variance assumed (we assume both the variance of the same) is 23,070 with a probability of 0.000. Therefore, the probability of the data above is smaller than 0.05, it can be said that there are differences in the variance in the data comparison of financial performance of Islamic Banks with Conventional Bank to the west of the Capital Adequacy Ratio. When both the variance of the same, then use the Equal Variances Assumed. t count for the Capital Adequacy Ratio by using the Equal Variances Assumed is 5,646 with significant of 0.000. Because the value of sig. tcount < ttable (0,000< 0,005), it can be said that if viewed from the south-west of the Capital Adequacy Ratio of the financial performance of Islamic Banks with Conventional Bank there is a significant difference. Financial Performance Of Islamic Banks With Conventional Bank In Terms Of Loan-To-
Deposit Ratio
From the results of the analysis conducted that the F count for Of Loan-To-Deposit Ratio with equal variance assumed (we assume both the variance of the same) is 4,010 with probability 0,057. Therefore, the probability of the data above is greater than 0.05, it can be said that there is no difference in the variance in the data comparison of financial performance of Islamic Banks with Conventional Bank to the ratio of Loan To Deposit Ratio. When both the variance of the same, then use the Equal Variances Assumed. t count for the Loan To Deposit Ratio by using the Equal Variances Assumed is 22,440 with significant of 0.000. Because the value of sig. tcount < ttable (0,000 < 0,005), it can be said that if seen from the ratio of Loan to Deposit Ratio, the financial performance of Islamic Banks with Conventional Bank there is a significant difference. Financial Performance Of Islamic Banks With Conventional Bank Viewed From The Side
Of The Non-Performing Loan
From the results of the analysis conducted that the F count for Non-Performing Loan with equal variance assumed (we assume both the variance of the same) is 82,643 with a probability of 0.000. Therefore the probability of the data above is smaller than 0.05, it can be said that there are differences in the variance in the data comparison of financial performance of Islamic Banks with Conventional Bank to the ratio of Non-Performing Loans. When both the variance of the same, then use the Equal Variances Assumed. t for Non-Performing Loan by using the Equal Variances Assumed is based on 3,974 real with significant of 0.001. Because the value of sig. tcount < ttable (0,001< 0,005), it can be said that if seen from the ratio of Non-Performing Loans, the financial performance of Islamic Banks with Conventional Bank there is a significant difference. Financial Performance Of Islamic Banks With Conventional Bank In Terms Of Operating
Costs / Operating Income
From the results of the analysis conducted that the F count for Operating Costs / Operating Income with equal variance assumed (we assume both the variance of the same) is 18,060 with a probability of 0.000. Therefore, the probability of the data above is smaller than 0.05, it can be said that there are differences in the variance in the data perbandingankinerja of finance of Islamic

INTERNATIONAL JOURNAL FOR INNOVATIVE RESEARCH IN MULTIDISCIPLINARY FIELD, ISSN: 2455-0620, Special Issue : 26, June-2021
Monthly, Peer-Reviewed, Refereed, Indexed Journal with IC Value: 86.87 Impact Factor: 6.719 Publication Date: 30/06/2021
Available online on - www.ijirmf.com Page 14
Banks with Conventional Bank to the ratio of Operating Costs / Operating Income. When both the variance of the same, then use the Equal Variances Assumed. t count for Operating Costs / Operating Income using the Equal Variances Assumed is -22,945 with significant of 0.001. Because the value of sig. tcount < ttable (0,001< 0,05), it can be said that if seen from the ratio of Operating Costs / Operating Income, the financial performance of Islamic Banks with Conventional Bank there is a significant difference.
Financial Performance Of Islamic Banks With Conventional Bank In Terms Of Return On
Assets
From the results of the analysis conducted that the F count to Return On Assets with equal variance assumed (we assume both the variance of the same) is 47,678 with a probability of 0.000. Therefore the probability of the data above is smaller than 0.05, it can be said that there are differences in the variance in the data comparison of financial performance of Islamic Banks with Conventional Bank to the ratio of Return On Assets. When both the variance of the same, then use the Equal Variances Assumed. t to Return On Assets by using the Equal Variances Assumed is 47,678 with significant of 0.000. Because the value of sig. t count > t table (0,000< 0,05), it can be said that if seen from the ratio of Return On Assets, the financial performance of Islamic Banks with Conventional Bank there is a significant difference.
CONCLUSION:
Based on the results of data analysis refers to the problem then it can be drawn conclusion as follows : The value of the Capital Adequacy Ratio of a Conventional Bank is under Sharia Banks, but
the ratio of Capital Adequacy Ratio of a Conventional Bank is still above criteria good condition stipulated by Bank Indonesia, namely exceed 8%.
The mean Loan-To-Deposit Ratio between Islamic Banks with Conventional Bank shows that the value of the Loan to Deposit Ratio Bank umum Syariah is located on top of a Conventional Bank. But the Ratio of Loan To Deposit Ratio of Islamic Banks and Conventional Banks are under criteria a good condition set by Bank Indonesia, namely between 85-110%.
The mean value of Non-Performing Loans between Islamic Banks with Conventional Bank shows that the value of the Non-Performing Loan Public Bank Syariah is located on top of a Conventional Bank, but the ratio of Non-Performing Loans of commercial Banks Conventi lmasih are on criteria good condition stipulated by Bank Indonesia which is below 5%.
The mean Operating Costs / Operating Income between Islamic Banks with Conventional Bank shows that the value of Operating Costs / Operating Income of Islamic Banks are on top of a Conventional Bank, the ratio of Operating Costs / Operating Income of a Conventional Bank are not on the criteria of good condition stipulated by Bank Indonesia, which is below 92%.
Mean value of Return On Assets between Islamic Banks with Conventional Bank shows that the value of Return On Assets of Islamic Banks are on top of a Conventional Bank, the ratio of Return On Assets of Conventional commercial Banks still are not on the criteria of good condition stipulated by Bank Indonesia is above 1.5 percent.
REFERENCES:
1. Abustan, 2019.Analisis Perbandingan Kinerja Keuangan Perbankan Syariah Dengan Perbankan Konvensional, Fakultas Ekonomi, Universitas. Gunadarma.
2. Boklet Perbankan Indonesia. 2014. Jakarta: Bank Indonesia. http://www.ojk.go.id diakses pada 01 Januari 2021.
INTERNATIONAL JOURNAL FOR INNOVATIVE RESEARCH IN MULTIDISCIPLINARY FIELD, ISSN: 2455-0620, Special Issue : 26, June-2021
Monthly, Peer-Reviewed, Refereed, Indexed Journal with IC Value: 86.87 Impact Factor: 6.719 Publication Date: 30/06/2021
Available online on - www.ijirmf.com Page 15
3. H.A.R. Tilaar. 2007. Mengindonesia Etnisitas dan Identitas Bangsa Indonesia Tinjauan dari Perspektif Ilmu Pendidikan. Jakarta: PT Rineka Cipta.
4. H. B. Sutopo. 2006. Metodologi Penelitian Kualitatif. Surakarta: Universitas Sebelas Maret. Hanif Nurcholis. Pertumbuhan dan Penyelenggaraan Pemerintahan Desa. Jakarta: Penerbit Erlangga.
5. http://www.bi.go.id diakses pada 05 Januari 2021. 6. Ningsih, 2016. Analisis Perbandingan Kinerja Keuangan Bank Umum Syariah dan Bank
Umum Konvensional di Indonesia, Fakultas Ekonomi dan Bisnis, Universitas Hasanuddin. 7. Peraturan bank Indonesia No. 11/3/PBI/2009 tentang Bank Umum Syariah. Jakarta : Bank
Indonesia.

INTERNATIONAL JOURNAL FOR INNOVATIVE RESEARCH IN MULTIDISCIPLINARY FIELD, ISSN: 2455-0620, Special Issue : 26, June-2021
Monthly, Peer-Reviewed, Refereed, Indexed Journal with IC Value: 86.87 Impact Factor: 6.719 Publication Date: 30/06/2021
Available online on - www.ijirmf.com Page 16
International Conference on
Business, Management, Social and Economical Advancements 26 & 27 June, 2021 Bangkok, Thailand
Jointly organized by: Management Institute, Warsaw University of Life Science - SGGW, Warszawa, Poland,
‘Research Culture Society’ and ‘Scientific Research Association’.
A Study on Green Marketing: The Competitive Advantage of
Sustainability
1Dr. Pralhad P Rathod
Associate Professor, Dept of Management Studies, Visvesvaraya Technological University (VTU), Belagavi.
Email : - [email protected],
2 B. Sudheer Kumar
Research Scholar, Dept of Management Studies, Visvesvaraya Technological University (VTU), Belagavi.
Email : - [email protected],
Abstract: Today, it seems that every company has a “green” story. And no wonder. Not only does the development and offering of “green” products and services positively impact consumer and investor perceptions of a company, it can also improve the bottom line.
So, it’s only natural that businesses in almost every industry are touting the “green” aspects of their products and services every chance they get. But embarking on an uninformed and
poorly prepared “green” advertising initiative can severely backfire, exposing a company to
investigations and penalties by federal and state agencies, false advertising lawsuits by
competitors, and perhaps worst of all, charges of “green washing” from the media and the blogosphere. Any one of these consequences can harm corporate identity and brand value,
effectively eliminating any benefits that a green marketing campaign may have conveyed.
Our attorneys are knowledgeable in the laws and regulations guiding green marketing and
have experience advising clients on issues relating to all kinds of advertising and promotions,
including green advertising. This paper is designed to provide some general guidance on
developing your company’s green advertising. Green advertising, like all other forms of advertising, should be truthful and not deceptive
or misleading to reasonable consumers. While a determination of whether a promotion or
advertising claim is “misleading” to a reasonable consumer is more art than science, the following guidelines can help you minimize the legal and public relations risks associated with a
green marketing campaign.
Keywords: Green marketing, Ecological, Green Products.
INTRODUCTION:
We are recognized leaders in marketing analysis, planning, and implementation for organizations in all stages of growth. Whether you are involved with a natural, organic, or some other "green" product, or you simply require professional marketing expertise for your good or service, we can help you set and achieve your objectives. Green marketing refers to the process of selling products and/or services based on their environmental benefits. Such a product or service may be environmentally friendly in itself or produced and/or packaged in an environmentally friendly way.

INTERNATIONAL JOURNAL FOR INNOVATIVE RESEARCH IN MULTIDISCIPLINARY FIELD, ISSN: 2455-0620, Special Issue : 26, June-2021
Monthly, Peer-Reviewed, Refereed, Indexed Journal with IC Value: 86.87 Impact Factor: 6.719 Publication Date: 30/06/2021
Available online on - www.ijirmf.com Page 17
Environmental sustainability is not simply a matter of compliance or risk management. Business is increasingly recognizing the many competitive advantages and business opportunities to be gained from eco-sustainability and green marketing. World-wide evidence indicates people are concerned about the environment and are changing their behavior accordingly. As a result, there is a growing market for sustainable and socially responsible products and services. The types of businesses that exist, the products they produce and their approaches to marketing are changing. People generally want to do the right thing, so the challenge and opportunity for the green marketer is to make it easy for people to do so. When all else is equal – quality, price, performance and availability – environmental benefit will most likely tip the balance in favor of a product. The marketing industry can ‘walk the talk’ and become the new corporate champions of the environment. Successful green marketers will reap the rewards of healthy profits and improved shareholder value, as well as help make the world a better place in the future.
Consumer awareness of environmental issues has grown considerably in the past few years and presents a good opportunity for companies to differentiate themselves through green marketing. However, it also presents risks if handled incorrectly. Instead of building brand loyalty, spurious green claims can alienate the very market you are trying to appeal to. The bottom line is; don’t just say green – be green. At this junction, the present paper is attempt to go through the history and framework of green marketing, importance of green marketing mix and how green marketing is competitive advantage of sustainability
What is Green Marketing?
Many terms describe this relationship: environmental marketing (Coddington, 1993), ecological marketing (Fisk, 1974; Henion and Kinnear, 1976), green marketing (Peattie, 1995; Ottman, 1992), sustainable marketing (Fuller, 1999) and greener marketing (Charter and Polonsky, 1999). Although the notion of marketing is more expansive, this paper employs the term green marketing to refer to the strategies to promote products by employing environmental claims either about their attributes or about the systems, policies and processes of the firms that manufacture or sell them1. Clearly, green marketing is part and parcel of the overall corporate strategy (Menon and Menon, 1997). Along with manipulating the traditional marketing mix (product, price, place and promotion), it requires an understanding of public policy processes. Green marketing also ties closely with issues of industrial ecology and environmental sustainability such as extended producers’ liability, life-cycle analysis, material use and resource flows, and eco-efficiency. Thus, the subject of green marketing is vast, having important implications for business strategy and public policy.
According to the American Marketing Association, green marketing is the marketing of products that are presumed to be environmentally safe. Thus, green marketing incorporates a broad range of activities, including product modification, changes to the production process, packaging changes, as well as modifying advertising. Yet defining green marketing is not a simple task where several meanings intersect and contradict each other; an example of this will be the existence of varying social, environmental and retail definitions attached to this term Other similar terms used are Environmental Marketing and Ecological Marketing.
Green, environmental and eco-marketing are part of the new marketing approaches which do not just refocus, adjust or enhance existing marketing thinking and practice, but seek to challenge those approaches and provide a substantially different perspective. In more detail green, environmental and eco-marketing belong to the group of approaches which seek to address the lack of fit between marketing as it is currently practiced and the ecological and social realities of the wider marketing environment.
History of Green Marketing:
The term Green Marketing came into prominence in the late 1980s and early 1990s. The American Marketing Association (AMA) held the first workshop on "Ecological Marketing" in

INTERNATIONAL JOURNAL FOR INNOVATIVE RESEARCH IN MULTIDISCIPLINARY FIELD, ISSN: 2455-0620, Special Issue : 26, June-2021
Monthly, Peer-Reviewed, Refereed, Indexed Journal with IC Value: 86.87 Impact Factor: 6.719 Publication Date: 30/06/2021
Available online on - www.ijirmf.com Page 18
1975. The proceedings of this workshop resulted in one of the first books on green marketing entitled "Ecological Marketing".
The Corporate Social Responsibility (CSR) Reports started with the ice cream seller Ben & Jerry's where the financial report was supplemented by a greater view on the company's environmental impact. In 1987 a document prepared by the World Commission on Environment and Development defined sustainable development as meeting “the needs of the present without compromising the ability of future generations to meet their own need”, this became known as the Brundtl and Report and was another step towards widespread thinking on sustainability in everyday activity. Two tangible milestones for wave 1 of green marketing came in the form of published books, both of which were called Green Marketing. They were by Ken Peattie (1992) in the United Kingdom and by Jacquelyn Ottman (1993) in the United States of America. According to Jacquelyn Ottman, (author of "The New Rules of Green Marketing: Strategies, Tools, and Inspiration for Sustainable Branding" (Greenleaf Publishing and Berrett-Koehler Publishers, February 2011)) from an organizational standpoint, environmental considerations should be integrated into all aspects of marketing — new product development and communications and all points in between. The holistic nature of green also suggests that besides suppliers and retailers new stakeholders be enlisted, including educators, members of the community, regulators, and NGOs. Environmental issues should be balanced with primary customer needs
The past decade has shown that harnessing consumer power to effect positive environmental change is far easier said than done. The so-called "green consumer" movements in the U.S. and other countries have struggled to reach critical mass and to remain in the forefront of shoppers' minds. While public opinion polls taken since the late 1980s have shown consistently that a significant percentage of consumers in the U.S. and elsewhere profess a strong willingness to favor environmentally conscious products and companies, consumers' efforts to do so in real life have remained sketchy at best. One of green marketing's challenges is the lack of standards or public consensus about what constitutes "green," according to Joel Makower, a writer on green marketing.] In essence, there is no definition of "how good is good enough" when it comes to a product or company making green marketing claims. This lack of consensus—by consumers, marketers, activists, regulators, and influential people—has slowed the growth of green products, says Makower, because companies are often reluctant to promote their green attributes, and consumers are often skeptical about claims.
Despite these challenges, green marketing has continued to gain adherents, particularly in light of growing global concern about climate change. This concern has led more companies to advertise their commitment to reduce their climate impacts, and the effect this is having on their products and services.
Features of Green Products:
Degradable A product or package advertised as degradable or biodegradable must completely break down and return to nature in a reasonably short period of time after customary disposal. For example, a trash bag marketed as “degradable” should completely break down in a landfill where trash bags normally end up after consumer use. It is not sufficient that the bag breaks down when buried in soil.
Compostable Product or packaging advertised as compostable must break down into usable compost in a safe and timely manner in a composting facility or in a home compost pile or device. If the material will not break down through typical home composting, the advertiser must qualify the claim to state this fact.

INTERNATIONAL JOURNAL FOR INNOVATIVE RESEARCH IN MULTIDISCIPLINARY FIELD, ISSN: 2455-0620, Special Issue : 26, June-2021
Monthly, Peer-Reviewed, Refereed, Indexed Journal with IC Value: 86.87 Impact Factor: 6.719 Publication Date: 30/06/2021
Available online on - www.ijirmf.com Page 19
Recyclable A product or package can be marketed as recyclable only if it can be collected, separated, or otherwise recovered from the solid waste stream through an established recycling program. If
the product is comprised of both recyclable and non‐recyclable components, the advertising claim should make this clear. And you should make clear whether the claim refers to the product, the package, or both. Recyclable claims are only appropriate when the product or packaging is made from materials that are accepted by recycling programs in a substantial majority of communities.
Recycled A claim that a product is produced from recycled content is appropriate only where materials have been recovered or otherwise diverted from the solid waste stream, either during the
manufacturing process (pre‐consumer) or after consumer use (post‐consumer). If the product or packaging is only partially constructed from recycled material, this must be clear. Where a product’s content consists of used, reconditioned, or remanufactured components, the “recycled” claim should be qualified.
Refillable A “refillable” claim is appropriate only where a system is provided for the collection and return of the packaging for refill by consumers. It should not make “refillable” claims where it is up to the consumer to find new ways to refill the package.
Ozone Safe/Friendly It is appropriate to check where the product contains chemicals that contribute to ozone formation at lower levels (smog) even where the product does not harm the upper ozone layer
The Four Ps of Green Marketing : Like conventional marketers, green marketers must address the ‘four Ps’ in innovative ways.
Product Entrepreneurs wanting to exploit emerging green markets will either: identify customers’ environmental needs and develop products to address these needs; or Develop environmentally responsible products to have less impact than competitors. The increasingly wide varieties of products on the market that support sustainable development and are good for the triple bottom line include: Products made from recycled goods, such as Quik’N Tuff housing materials made from
recycled broccoli boxes. Products that can be recycled or reused. Efficient products, which save water, energy or gasoline, save money and reduce
environmental impact. Queensland’s only waterless printer, Print point, reduces operating costs by using less water than conventional printers and is able to pass the savings on to customers.
Products with environmentally responsible packaging. McDonalds, for example, changed their packaging from polystyrene clamshells to paper.
Products with green labels, as long as they offer substantiation. Organic products — many consumers are prepared to pay a premium for organic products,
which offer promise of quality. Organic butchers, for example, promote the added qualities such as taste and tenderness.
A service that rents or loans products – such as toy libraries. Certified products, which meet or exceed environmentally responsible criteria.

INTERNATIONAL JOURNAL FOR INNOVATIVE RESEARCH IN MULTIDISCIPLINARY FIELD, ISSN: 2455-0620, Special Issue : 26, June-2021
Monthly, Peer-Reviewed, Refereed, Indexed Journal with IC Value: 86.87 Impact Factor: 6.719 Publication Date: 30/06/2021
Available online on - www.ijirmf.com Page 20
Whatever the product or service, it is vital to ensure that products meet or exceed the quality expectations of customers and is thoroughly tested.
Price Pricing is a critical element of the marketing mix. Most customers will only be prepared to pay a premium if there is a perception of additional product value.
This value may be improved performance, function, design, visual appeal or taste. Environmental benefits are usually an added bonus but will often be the deciding factor between products of equal value and quality.
Environmentally responsible products, however, are often less expensive when product life cycle costs are taken into consideration. For example, fuel-efficient vehicles, water-efficient printing and non-hazardous products.
Place The choice of where and when to make a product available will have significant impact on the customers you attract.
Very few customers will go out of their way to buy green products merely for the sake of it. Marketers looking to successfully introduce new green products should, in most cases, position them broadly in the market place so they are not just appealing to a small green niche market.
The location must also be consistent with the image you want to project and allow you to project your own image rather than being dominated or compromised by the image of the venue.
The location must differentiate you from your competitors. This can be achieved by in-store promotions and visually appealing displays or using recycled materials to emphasize the environmental and other benefits.
Promotion
Promoting products and services to target markets includes paid advertising, public relations, sales promotions, direct marketing and on-site promotions.
Smart green marketers will be able to reinforce environmental credibility by using sustainable marketing and communications tools and practices. For example, many companies in the financial industry are providing electronic statements by email, e-marketing is rapidly replacing more traditional marketing methods, and printed materials can be produced using recycled materials and efficient processes, such as waterless printing.
Retailers, for example, are recognizing the value of alliances with other companies, environmental groups and research organizations when promoting their environmental commitment. To reduce the use of plastic bags and promote their green commitment, some retailers sell shopping bags, for example those produced by Landcare Australia, Clean Up Australia and Planet Ark, under the banner of the Go Green Environment Fund.
The key to successful green marketing is credibility. Never overstate environmental claims or establish unrealistic expectations, and communicate simply and through sources that people trust.
Promote your green credentials and achievements Publicize stories of the company’s and employees’ green initiatives. Enter environmental awards programs to profile environmental credentials to customers and stakeholders.
Benefits of Green Marketing: Green marketing offers business bottom line incentives and top line growth possibilities.
While modification of business or production processes may involve start-up costs, it will save money in the long term. For example, the cost of installing solar energy is an investment in future energy cost savings.

INTERNATIONAL JOURNAL FOR INNOVATIVE RESEARCH IN MULTIDISCIPLINARY FIELD, ISSN: 2455-0620, Special Issue : 26, June-2021
Monthly, Peer-Reviewed, Refereed, Indexed Journal with IC Value: 86.87 Impact Factor: 6.719 Publication Date: 30/06/2021
Available online on - www.ijirmf.com Page 21
Companies that develop new and improved products and services with environmental impacts in mind give themselves access to new markets, substantially increase profits and enjoy competitive advantages over those marketing non-environmentally responsible alternatives. Socially Responsible Investment (SRI) in Australia is no longer a niche investment. Potential investors increasingly look to companies to demonstrate their social and environmental responsibility as well as traditional financial objectives and outcomes. Competitive businesses with an eye to emerging market forces address their triple bottom line performance. For example, to support its aim of being a sustainable business, The Body Shop produces a social and environmental performance report, ‘The New Bottom Line’, every two years.
CONCLUSION:
Our understanding of green marketing is still in its infancy, perhaps due to the multidisciplinary nature of the enterprise. Marketing scholars focus on a host of business strategy and public policy issues, including eco-labels and market segmentation, and the role of structural factors and economic incentives in influencing consumer behavior. For environmental economists, green marketing signifies a broader trend in the evolution of environmental policies that focus on information disclosure. Institutional theory, stakeholder theory and the corporate social performance perspective view green marketing as a subset of corporate policies designed to gain external legitimacy. These have developed in response to the expectations of a broad spectrum of stakeholders, both internal and external. Political economists focus on collective action dilemmas inherent in green marketing at the consumer and producer levels. This paper has identified key ideas in relation to promoting green products that may be most relevant to both scholars and practitioners of green marketing.
REFERENCES:
1. www.ftc.gov/bcp/conline/pubs/buspubs/greenguides.pdf). 2. www.epa.qld.gov.au/sustainable_industries 3. www.interscience.wiley.com 4. "Green Trade & Development" (.html). Green Markets International, Inc. Retrieved
January 2008. 5. Karl E., Henion; Thomas C. Kinnear (January 1976). "Ecological Marketing". Ecological
Marketing. American Marketing Association. pp. 168. ISBN 0-87757-076-0, ISBN 978-0-87757-076-9
6. Coddington W.(1993). Environmental Marketing: Positive Strategies for Reaching the
Green Consumer. McGraw- Hill: New York. 7. Fisk G. (1974). Marketing and the Ecological Crisis. Harper and Row: London. 8. Ottman J. 1996. Green consumers not consumed by ecoanxiety. Marketing News 30: 13. 9. Henion KE, Kinnear TC (eds). 1976. Ecological Marketing. American Marketing
Association: Chicago, IL. 10. Peattie K. (1995). Environmental Marketing Management. Pitman: London. 11. Ottman J.(1992). Greener Marketing. NTC: Lincolnwood, IL. 12. Fuller D. (1999). Sustainable Marketing: Managerial– Ecological Issues. Sage: Thousand
Oaks, CA. 13. Charter M, Polonsky MJ (eds). (1999). Greener Marketing: a Global Perspective on
Greening Marketing Practice, 2nd edn. Greenleaf: Sheffield. 14. Menon A, Menon A.(1997). Enviropreneurial marketing strategy: the emergence of
corporate environmentalism as market strategy. Journal of Marketing 61: 51–67. 15. "Green Trade & Development" (.html). Green Markets International, Inc.
http://www.green-markets.org/context.htm. Retrieved January 2008. 16. Belz F., Peattie K.(2009): Sustainability Marketing: A Global Perspective. John Wiley &
Sons

INTERNATIONAL JOURNAL FOR INNOVATIVE RESEARCH IN MULTIDISCIPLINARY FIELD, ISSN: 2455-0620, Special Issue : 26, June-2021
Monthly, Peer-Reviewed, Refereed, Indexed Journal with IC Value: 86.87 Impact Factor: 6.719 Publication Date: 30/06/2021
Available online on - www.ijirmf.com Page 22
17. Dodds, John (May 21, 2007). "Green Marketing 101" 18. Curtin, Emily (2006-09-14). "Lower East Side Green Market".
http://www.flickr.com/photos/nannyinnewyork/. Retrieved January 2008. 19. Karl E., Henion; Thomas C. Kinnear (January 1976). "Ecological Marketing". Ecological
Marketing. American Marketing Association. pp. 168. 20. "Green Marketing: Challenges & Opportunities for the New Marketing Age".
http://www.amazon.com/Green-Marketing-Challenges-Opportunities-1-4. Retrieved 12-06-2010.
21. "Greenleaf publishing bookshop". http://www.greenleaf-publishing.com/ Retrieved November 2010.
22. "Green Marketing". http://www.oppapers.com/essays/Greeen-Marketing/136465 Retrieved 2010-06-2010.
23. Dodds, John (August 11, 2006). "Geek Marketing 101". http://makemarketinghistory.blogspot.com/2006/08/geek-marketing-. Retrieved January 2008.
24. Mendleson, Nicola; Michael Jay Polonsky (1995). "Using strategic alliances to develop credible green marketing". Journal of Consumer Marketing (MCB UP Ltd) 12 (2): 4–18.
25. McDaniel, Stephen W.; David H. Rylander (1993). "Strategic green marketing". Journal of
Consumer Marketing (MCB UP Ltd) 10 (3): 4–10. 26. http://en.wikipedia.org/wiki/Green_marketing

INTERNATIONAL JOURNAL FOR INNOVATIVE RESEARCH IN MULTIDISCIPLINARY FIELD, ISSN: 2455-0620, Special Issue : 26, June-2021
Monthly, Peer-Reviewed, Refereed, Indexed Journal with IC Value: 86.87 Impact Factor: 6.719 Publication Date: 30/06/2021
Available online on - www.ijirmf.com Page 23
International Conference on
Business, Management, Social and Economical Advancements 26 & 27 June, 2021 Bangkok, Thailand
Jointly organized by: Management Institute, Warsaw University of Life Science - SGGW, Warszawa, Poland,
‘Research Culture Society’ and ‘Scientific Research Association’.
Applying the concept of Tzu Chi Foundation management to Non-
profit organization management in Thailand
Polwasit Lhakard
International Doctoral Program in Asia-Pacific Studies (IDAS), College of Social Science, National Chengchi University, Taipei, Taiwan
E-mail: [email protected]
Abstract: To driving assistance and social development, the most important was supporting by the
volunteer to do mission. The volunteer was essential to support main mission in the organization
and society in many country, which move forward continuously. Besides the society gain benefit
for the volunteer, also the volunteer can develop themselves. The power of volunteers is most
crucial to social development. However, to make sure many applications supporting
organizations, it may not guarantee the success of an organization. If there were inefficient in
organization management, so it is essential to create proper volunteer management. The Tzu Chi
Foundation is one of the best organization management that attractive and impressive to support
many volunteers. The Tzu Chi foundation provides systematization effectiveness. Yet it found that
Thailand has not many Non-profit organizations, which have much mission and knowledge about
volunteer management, similar to The Tzu Chi foundation. Also, the biggest obstacle to developing
a volunteer foundation in Thailand was a lack of knowledge and organization management skills,
result in application ineffective. This article focuses on the Tzu Chi Foundation in the volunteer
management system to compare and develop. Thailand and Taiwan are similar to Buddhist
people, which bring about useful education and adapt to Thai society.
Keyword: The Tzu Chi Foundation, Non profit management, Non profit organization, Thailand.
BACKGROUND:
The Tzu Chi foundation establish by Dharma Master Cheng Yen on 1966 in Hualien, Taiwan. The origin story was the Master Cheng Yen found many paupers with no medical expenses until their death. Later this incident spark 3 Catholic nuns ask about no supporting society and humanity from Buddhists formally. The Dharma Master Cheng Yen decide to establish The Buddhism Tzu Chi foundation as unofficial during 1966. There were 30 housewives’ members, so Dharma Master Cheng Yen invited homemakers to save 50 cents per day to support the pauper. From the small mission, it will make people faith in Dharma Master and The Buddhism Tzu Chi foundation extend to an academic group, middle and elite class in Taiwan and worldwide. In 1980, The Buddhism Tzu Chi foundation did officially register as a Charity organization in Taiwan, and in 1986, The Tzu Chi foundation builds the first hospital. This large and international standard hospital used a budget of 800 million Taiwan. Operated under the love and kind ideal, which is an advantage of the Buddhism Tzu Chi foundation hospital that different to other hospitals (Tzu Chi foundation Thailand,2006)
The Tzu Chi foundation grows up worldwide with two primary strategies are: When Taiwanese, who faith in The Tzu Chi Foundation, have an opportunity to work in foreign, they bring The Tzu Chi foundation philosophy marketing to countries and the universal supportive mission by The Tzu Chi foundation such as support the victim in other countries unconditional.
INTERNATIONAL JOURNAL FOR INNOVATIVE RESEARCH IN MULTIDISCIPLINARY FIELD, ISSN: 2455-0620, Special Issue : 26, June-2021
Monthly, Peer-Reviewed, Refereed, Indexed Journal with IC Value: 86.87 Impact Factor: 6.719 Publication Date: 30/06/2021
Available online on - www.ijirmf.com Page 24
From the above concept, it shows the role of the foundation in human development both physically and mentally. Which has the roles according to the following levels
The role of Tzu Chi Foundation in worldwide
The influence of the Tzu Chi Foundation with support mission in other countries and humanity kind ideal of Tzu Chi Foundation, effect to extend the foundation to 47 countries around the world. It leads to confirmation Taiwanese Buddhists in China after not confirmation a long time ago that caused by political conflict 1998. After that United State of America admired when saw operated supportive humanity by Tzu Chi foundation and decided to support Taiwan to become a WHO member (Douglas Shaw, 2004: 37)
The role of the Tzu Chi Foundation in Taiwan
Priest in the Foundation show their standpoint to unused donation money; many people had faith in the Tzu Chi foundation and decided to become a Tzu Chi foundation member. The perspective of the Tzu Chi foundation is not interrupting the political but very influential in politics. For example, in 1990, the vital role of the Taiwan government that effect to draw National health project policy. The Tzu Chi foundation not against capitalism but using love, kind each other, supports the victim, educates sympathizing, and creates an all-around conceptual framework. The Tzu Chi foundation, therefore, still exists and grows up among capitalism. (Phra Phaisan Wisalo, 2007: 62)
The role of the Tzu Chi Foundation in Thailand
The Tzu Chi foundation Thailand does not grow up enough, as can be seen as supporting by Taiwanese donation. It is different from other relief projects in another country, which receive a donation by people in their countries. The leading cause why Tzu Chi foundation Thailand does not grow up enough is 1) The most Buddhist organization in Thailand is weakness, not arrange mission that encourage Buddhist to support Buddhism. 2) The central Buddhism in Thailand focuses on make merit in the temple than society 3) Although Thailand's economy is growing up, the income distribution does not reach the people enough. Most people think they cannot afford donation or devote support each other enough. 4) Thai society still respects Theravada Buddhism and unfamiliar with Mahayana Buddhism and The relationship between The Tzu Chi foundation Taiwan to Thai society.
Volunteer Management and marketing
From the above concept, it can be seen that Tzu chi foundation can also help to fill many gaps in Thai society through the role model of management for non-profit organizations in Thailand. Through the concept of volunteer management by creating good image in Thailand as follows
Creating an image through volunteer organizational structure
The Tzu Chi Foundation is systematic operations, network pattern organization, divide department. The departments do their responsibilities. According to Dharma Master Cheng Yen, who will make equity to everyone, eliminate position and status inequity, they need to work with other departments. The Buddhism Tzu Chi foundation is divide into 2 part of the organization: First is Jing Si abode and second is The Buddhism Tzu Chi foundation, the abode place by Dharma Master Cheng Yen and Nun groups. The nun group has worked together to earn money to expense themselves, not involve with a donation of the Tzu Chi foundation. Dharma Master has the purpose of donating for the victim. The Buddhism Tzu Chi foundation operated by secular and divide the department. Each department responsible operated under advice and followed the Dharma Master Cheng Yen. There is systematic volunteer management from selection, training,

INTERNATIONAL JOURNAL FOR INNOVATIVE RESEARCH IN MULTIDISCIPLINARY FIELD, ISSN: 2455-0620, Special Issue : 26, June-2021
Monthly, Peer-Reviewed, Refereed, Indexed Journal with IC Value: 86.87 Impact Factor: 6.719 Publication Date: 30/06/2021
Available online on - www.ijirmf.com Page 25
and develop volunteer groups. The groups divide into supporting groups, beginners, director (Permanent member) and priest group. (Dharma Master Chen Yen,2004)
With the vision of Dharma Master Cheng Yen, after finished build the first hospital, she thinks that The Tzu Chi foundation should create the medical staff ready to work, expert, academic, and spiritual. Therefore, The Tzu Chi foundation extends education to create a medical team with love, ethical spiritual. Later the education mission extends from kindergarten to university and other courses besides medical courses. It is seen that since established The Tzu Chi Foundation for 40 years, The Tzu Chi foundation extends to covering all aspects. There are four primary aspirations and eight subdivides, according to the slogan "One step bring to eight footprints". The main four mission is "medical mission," which includes treatment and bone marrow donation. "Social work mission" includes charity and universal relief. "Education mission" includes educational and environmental protection. "Culture-humanity mission" provides humanity and the volunteer community. (Phra Phaisan Wisalo, 2007: 62)
The successful of ideal marketing by The Tzu Chi foundation
Individual marketing
The primary proliferation and personal development for The Tzu Chi Foundation are using kind and love ideal. To find a new member, The Tzu Chi foundation does socialize. The new member will be training to raise individual consciousness and do charity mission by The Tzu Chi Foundation, which is similar to MLM business strategy. But the difference is the Tzu Chi member system created to support humankind without self-interest. The Tzu Chi foundation worldwide can listen to Dharma by Dharma Master Cheng Yen in every morning on Ta Ai broadcast station.
Community marketing
The Tzu Chi foundation member will spend time together to carry the mission. When mission completed, everyone separated to live themselves, negligent relationship, and equity. Each The Tzu Chi foundation community had self-management and send the representative to meeting in headquarter. The meeting will encourage every volunteer rush to relief operated, and the meeting help to strengthen the relationships of the volunteer group. The factors that make Tzu Chi foundation member grown-up is good leadership as Dharma Master Cheng Yen and quality of life in Taiwanese society that cause mind stable.
To creating of interaction, marketing reduces the human distance in modern society with "love and give" such as in The Buddhist Tzu Chi hospital has Tzu chi volunteer member work with doctor and nurse for mediate between patient and doctor, treat the patient mind. Seed love creation in society is love incubation to another one, and that one will bring love to their family and extend to the workplace and community (Suparat Rattanamuk, 2007: 140)
METHODOLOGY :
In this article, the method of collecting secondary data and analyze data through online books and websites according to the following Content scope
The study specifies the scope of the conceptual content regarding volunteer activities in the Tzu Chi Foundation's by studying the cycle of volunteer management from planning ,selection, orientation and training, and evaluation and praise.
Data scope
Document data include research results , relevant documents regarding management , History and activities of the foundation.
Data analysis
In this study, the researcher used the content analysis method.

INTERNATIONAL JOURNAL FOR INNOVATIVE RESEARCH IN MULTIDISCIPLINARY FIELD, ISSN: 2455-0620, Special Issue : 26, June-2021
Monthly, Peer-Reviewed, Refereed, Indexed Journal with IC Value: 86.87 Impact Factor: 6.719 Publication Date: 30/06/2021
Available online on - www.ijirmf.com Page 26
Research Framework
Research finding
From the concepts of volunteer management and marketing of the foundation can be adapted as a guideline framework for non-profit organizations in Thailand as follows
The volunteer management concept to adapt and apply to a Non-profit organization in
Thailand
Thailand can bring the knowledge to adapt to the conceptual framework to volunteer management. The Tzu Chi Foundation is an organization with operated, marketing, organization, and volunteer management effectively. Thus, to develop a volunteer organization in Thailand, the author takes lessons from Tzu Chi Taiwan volunteer foundation management to suggest and conceptual framework with establishing Tzu Chi in Thailand as follow: Conceptual frameworks such as build trust and faith dimensions, searching volunteer dimensions, retention volunteer dimensions , support by the government dimensions . The author will mention below as follow :
Building trust and faith dimension
The Non-profit organization needs to build trust and faith to the public about their purpose involve with religion, raise organization ideology to people understand without suspicious, and explain about an organization.
Creating knowledge about trust and faith in organizational thinking, which makes people admire, need to mention the benefit of joining as a volunteer and do the right thing to society. For example, in the case of the Tzu Chi Foundation, participants will conduct pure meditation to reduce the ego and make merit to help people for happy living.The communication will make people trust and faith more than the individual. The volunteer organization's mission needs to show how to benefit social and individual receive. Furthermore, ideological trust links with institutions such as In Thai society Thai people will accept religious institutions for creating more public acceptance.
Volunteer searching dimensions
To searching volunteer to join with organization, it should consider various ways as follow : 1.Mission and Mission planning: This is the beginning of volunteer management. The
mission planning is reflected in organization achievement; that is, the volunteer has not the purpose of earning money but another purpose, such as devote to help an organization. If an organization does not assign mission what they do, it effects to reduce member due to they don’t know about responsible. In case there are no assign mission clearly in Thailand, it is an obstacle to
Volunteer Marketing
The concept of applying principles of Tzu Chi
volunteer management to Non-profit organizations
in Thailand
Suggestions for Tzu Chi Foundation to Non-profit organizations in Thailand
Mission

INTERNATIONAL JOURNAL FOR INNOVATIVE RESEARCH IN MULTIDISCIPLINARY FIELD, ISSN: 2455-0620, Special Issue : 26, June-2021
Monthly, Peer-Reviewed, Refereed, Indexed Journal with IC Value: 86.87 Impact Factor: 6.719 Publication Date: 30/06/2021
Available online on - www.ijirmf.com Page 27
hinder everyone who intends to work, such as volunteer student in the organization. These people cannot do mission as they require or mission, as discussed above.
In the Tzu Chi Foundation, assign the mission to make sure everyone wishes to do mission as they require from the organization. The Tzu Chi foundation divides eight missions, which everyone can select to do and decide to help as they need. Therefore, to make sure proper volunteer management, the question is what organization mission is and what quality people to join in the organization.
2. To access the information and news of an organization efficiently and quickly: When someone interested to join an organization as a volunteer, the most important is they need to know about organization information and clearly. Although today there are many medias such as social media, websites, it may lack knowledge. The best way is to ask by face to face or 2 way communication such as contacting by calling and asking about experience of volunteers to decide to join. For example, an invited system in Tzu Chi foundation in case of interested volunteer leave the phone number, it is necessary to contact immediately as soon as possible. This method is effective due to it bring exchanging experience between experienced volunteers and interested person.
3. Persuasion by staff and volunteers with leadership : An important factor in becoming a volunteer is asking factor. Therefore, if an organization wishes to have a large number of volunteers . There should be a team or individual who is an officer or volunteer with leadership. Because they are a true performer ,which will be able to provide practical information and volunteer missions . This system is designed by the Tzu chi foundation to provide financial and volunteer support. However, the organization should have a plan regarding the need of manpower for volunteers first. For a balance between work and people because once the volunteers have been working the organization should have enough workload to enable them to have the opportunity to participate in the activity so that the volunteers feel valuable to the mission and the organization that operates.
4. Selection of volunteers at various levels : Even if it allows volunteers to assess information for evaluating themselves to some positions, but does not mean that the volunteers are qualified for the job. The volunteer selection system has to be developed at various stages, both at the beginning of admission ,Training and passing on to volunteer experts are divided into as follow :
4.1 Types of volunteer selection 4.1.1 Preliminary selection : The interview system seems to be more appropriate
than the written system because the interviewer and the interviewee will interact rather than test the written system, which is one-way communication and complicating , In addition, the interview also gives an opportunity to ask questions in each department's needs.
4.1.2 Selection from internships : Providing opportunities for volunteers to work in
activities that are assigned to the organization for a period of time would allow volunteers to be able to assess themselves , whether they are suitable for volunteering in the work of that organization . At the same time, the organization will be able to assess both the work ability and the mental state of that volunteer. However, organizations must have a fair assessment system for volunteers. By always being aware that volunteers are basically sacrifices . In addition, the assessors must be those who have previously worked with volunteers.
4.1.3 Selection of expert volunteers : Passing as an expert volunteers must be more
accountable in terms of advising others and participating in corporate management decisions. Consideration of leadership and mindlessness

INTERNATIONAL JOURNAL FOR INNOVATIVE RESEARCH IN MULTIDISCIPLINARY FIELD, ISSN: 2455-0620, Special Issue : 26, June-2021
Monthly, Peer-Reviewed, Refereed, Indexed Journal with IC Value: 86.87 Impact Factor: 6.719 Publication Date: 30/06/2021
Available online on - www.ijirmf.com Page 28
From that concept selection of volunteers at various levels of the Tzu chi foundation It takes 2 years to consider and select to become a volunteer at various levels. With details as follows (Suparat Rattanamuk, 2007: 107)
4.2 Type of volunteer
4.2.1 Basic volunteer: Provide orientation, readiness condition, both moral and knowledge. Participants become a member with receive magazine every month. Later, member promotes to community volunteers, have a uniform, and join mission. The one director volunteer will take care of 20-40 community volunteers.
4.2.2 Internship Volunteer: it is instructive about Dharma Master Cheng Yen’s
ideal, such as principle and Tzu chi lifestyle. It provides train the volunteer within one year and training eight times per day per month, focusing on learning by assisting in the various missions of the foundation. Training female volunteers to donate money to the foundation. At least 25 people trained to be humble to visit the donors
4.2.3 Training Volunteer: Practice at least one year, have training schedule yearly,
evaluate both themselves and director volunteers.
4.2.4 Director Volunteer: Must attend a conference of vow and ready to be a volunteer at the committee level. There is 1 annual training for 3 days, which is a review of the principles, teachings, the do's and don'ts, and exchange of experiences.
Volunteer retention dimensions
The pursuit and selection of volunteers is the starting point for driving volunteer work. But once the volunteers join the organization, the thing that the organization should consider is how the organization will do so that the volunteers can work with the organization efficiently and effectively with the organization happily. And create a feeling that they and organization have achieved these goals together . That is an important role of the organization in managing volunteer work
1. The orientation and training: It divides into 2 section
1.1 Orientation is an initial step when a volunteer enters the organization with the objective of being aware of the history of the organization, work structure, various missions and various prohibitions . Moreover, volunteers have the opportunity to become familiar with each other . In general, the organization will provide orientation for volunteers in groups or generations with a large number of people. At orientation, may invite volunteers to the seniors come to exchange experiences in both positive and negative experiences . However, in the Tzu chi foundation does not speak too negatively to the point that new volunteers feel scared of volunteering. (Prawet Wasi, 2007 : 89)
1.2 Training is the next step after orientation to support the duty of volunteers. That is to say that it is about knowledge and understanding of specific subjects. Training of work skills, such as Volunteering in organization ,Team work, volunteer development with this training in 2 forms is classroom training and real-practice workshops with mentors or trainers. The Tzu chi foundation gives special importance to it because it creates a close relationship within the team. However, the learning of volunteers is not only a one-way training. Learning from the external environment also helps to create an atmosphere of mind, volunteering. Providing such learning conditions can take many forms, such as providing volunteers to practice Dharma , Moral Television Learning (Ta Ai Station of the Tzu chi Foundation) , Organizes a forum to exchange experiences of volunteers , Reading various related books . Which is an important part of volunteer work in every mission and every organization (Ampol Chindawattana, 2006: 72)

INTERNATIONAL JOURNAL FOR INNOVATIVE RESEARCH IN MULTIDISCIPLINARY FIELD, ISSN: 2455-0620, Special Issue : 26, June-2021
Monthly, Peer-Reviewed, Refereed, Indexed Journal with IC Value: 86.87 Impact Factor: 6.719 Publication Date: 30/06/2021
Available online on - www.ijirmf.com Page 29
2. Monitoring and support work of volunteers is a system that supports learning and working efficiently. It is learning from generation to generation or it is a job coaching guide from experienced staff and techniques in monitoring to follow this work, there are principles that must be adhered to is the work tracking is aimed at promoting learning, helping with problems and encouraging volunteers. It is not a crime of volunteering . In this principle, the organization has to be constantly reviewed. In which the Tzu chi foundation aside from having follow-up to teach, recommend and encourage . They also going out to survey the needs of the volunteers to find out what is missing and helping to find for supporting their members. This method is to help strengthen the morale of the volunteers by arranging stuffs such as body protection equipment while working for safety , Providing a place for volunteers to have a working room etc. (Prawet Wasi, 2007)
3. Recognition and honor : It shows acceptance and importance to volunteers. In order to create incentives for volunteers to live happily with the organization . In general, the Tzu chi foundation is honored in two ways: award and acknowledgment .
3.1 Giving awards to volunteers indicates acceptance of a job or behavior for a specified period of time, which may be given individually or in groups. Awards may be tangible items such as certificates, pins, photographs, uniforms.
3.2 Acknowledgment is not a thing but an expression of admiration and encouragement for good volunteering, such as gratitude such as the Kwan-en (thank-you) in the volunteer culture of the Tzu chi Foundation. Respect for the status of volunteers inviting volunteers to participate in organization staff meetings , Showing attention to job recommendations , Assignment of increased volunteer responsibilities and participation in administration as a committee (Douglas Shaw, 2004: pp. 44)
Government supporting dimension
The government sector should support the voluntary organization's operations as the government has years of experience in the field of voluntary work in the country. Thai government has established a voluntary development policy in 2001 and there is a national agenda on regarding giving and volunteering for society to lead the establishment of a center for giving and volunteering for society to promote the volunteer work of the country (Supparant Rattanamuk, 2007: pp.24-25) as well as the Tzu chi foundation, which is one of the driving forces Non-profit organization in Taiwanese society between Non-profit organization sectors that works with government sectors in the development of various areas of society, especially in medicine and education in Taiwan, the Tzu chi foundation plays a large role in the development of Taiwanese society as a whole and is a coordinator that helps volunteer work in Taiwan to be strong.
In this article, the author has created a conceptual framework. That can promote work which consists of Building trust and faith dimension, Volunteer searching dimensions, Volunteer retention dimensions and the Government supporting dimension as a framework for collaboration in Thailand. Non-profit organizations need to work together with the government. In various tasks, such as providing education and training regarding volunteer management , Establishing various types of training courses for volunteers so that volunteers are knowledgeable and more standard of operation , Promoting a volunteer management association in which volunteer organizations become members and use it to enhance the organization's potential. Which these knowledge the Tzu chi foundation can be a model for volunteer work between government and non-profit organizations in Thailand.
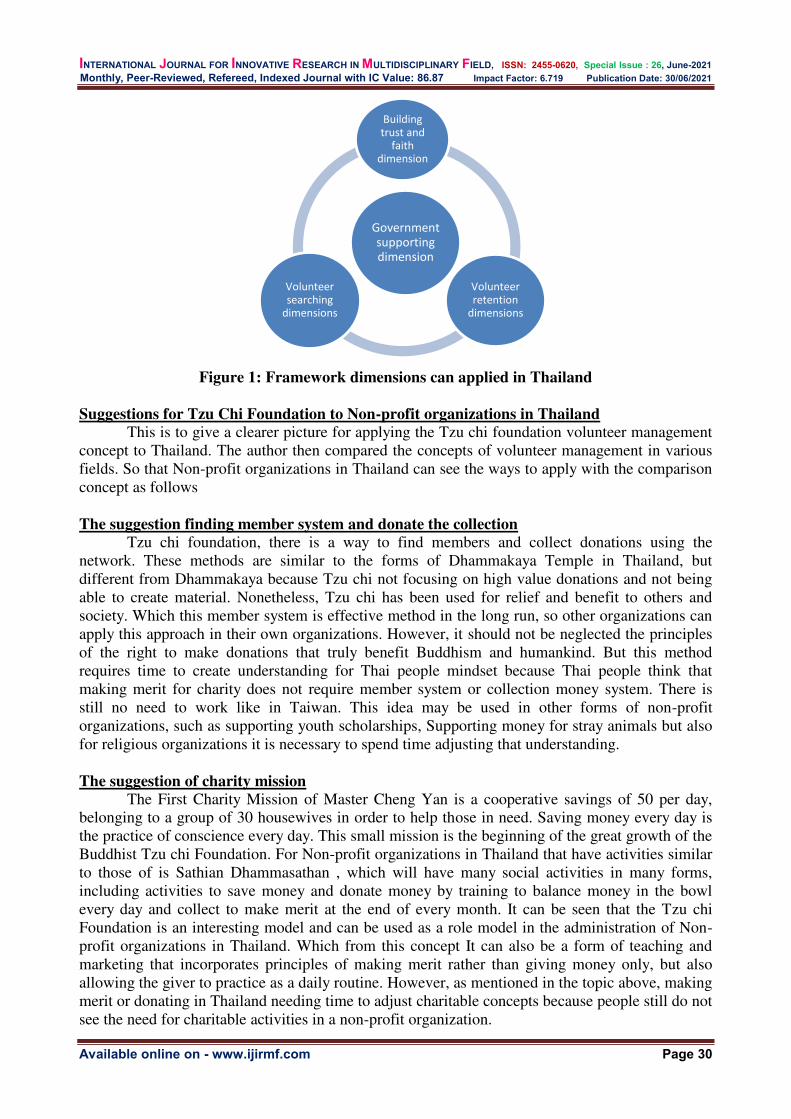
INTERNATIONAL JOURNAL FOR INNOVATIVE RESEARCH IN MULTIDISCIPLINARY FIELD, ISSN: 2455-0620, Special Issue : 26, June-2021
Monthly, Peer-Reviewed, Refereed, Indexed Journal with IC Value: 86.87 Impact Factor: 6.719 Publication Date: 30/06/2021
Available online on - www.ijirmf.com Page 30
Figure 1: Framework dimensions can applied in Thailand
Suggestions for Tzu Chi Foundation to Non-profit organizations in Thailand
This is to give a clearer picture for applying the Tzu chi foundation volunteer management concept to Thailand. The author then compared the concepts of volunteer management in various fields. So that Non-profit organizations in Thailand can see the ways to apply with the comparison concept as follows
The suggestion finding member system and donate the collection
Tzu chi foundation, there is a way to find members and collect donations using the network. These methods are similar to the forms of Dhammakaya Temple in Thailand, but different from Dhammakaya because Tzu chi not focusing on high value donations and not being able to create material. Nonetheless, Tzu chi has been used for relief and benefit to others and society. Which this member system is effective method in the long run, so other organizations can apply this approach in their own organizations. However, it should not be neglected the principles of the right to make donations that truly benefit Buddhism and humankind. But this method requires time to create understanding for Thai people mindset because Thai people think that making merit for charity does not require member system or collection money system. There is still no need to work like in Taiwan. This idea may be used in other forms of non-profit organizations, such as supporting youth scholarships, Supporting money for stray animals but also for religious organizations it is necessary to spend time adjusting that understanding.
The suggestion of charity mission
The First Charity Mission of Master Cheng Yan is a cooperative savings of 50 per day, belonging to a group of 30 housewives in order to help those in need. Saving money every day is the practice of conscience every day. This small mission is the beginning of the great growth of the Buddhist Tzu chi Foundation. For Non-profit organizations in Thailand that have activities similar to those of is Sathian Dhammasathan , which will have many social activities in many forms, including activities to save money and donate money by training to balance money in the bowl every day and collect to make merit at the end of every month. It can be seen that the Tzu chi Foundation is an interesting model and can be used as a role model in the administration of Non-profit organizations in Thailand. Which from this concept It can also be a form of teaching and marketing that incorporates principles of making merit rather than giving money only, but also allowing the giver to practice as a daily routine. However, as mentioned in the topic above, making merit or donating in Thailand needing time to adjust charitable concepts because people still do not see the need for charitable activities in a non-profit organization.
Government supporting dimension
Building trust and
faith dimension
Volunteer retention
dimensions
Volunteer searching
dimensions

INTERNATIONAL JOURNAL FOR INNOVATIVE RESEARCH IN MULTIDISCIPLINARY FIELD, ISSN: 2455-0620, Special Issue : 26, June-2021
Monthly, Peer-Reviewed, Refereed, Indexed Journal with IC Value: 86.87 Impact Factor: 6.719 Publication Date: 30/06/2021
Available online on - www.ijirmf.com Page 31
The suggestion of education mission
The Tzu chi foundation gives importance to education. By believing that every student is the seed of Buddha's education, the Tzu chi foundation in every level has the same format as train children to be virtuous, apply knowledge with the Principle 4 principles by Tzu chi foundation. By using the education curriculum of the Ministry of Education but adding ethics teaching Dharma and various activities that promote mental development (Punsima Pittayarangsarit, 2009) in Thailand also became interested in the Buddhist school with schools that clearly teach the Buddhist way of life, namely Satya Sai School operate with principles of love and compassion, focusing on the cultivation of morals and ethics along with academic is similar to the Tzu chi foundation Buddhist School. Many things are operating with principles of love and compassion focus on creating ethics for students. The relationships within the school are like a large family and food in the school is vegetarian. Which the education concept that is based on this moral is becoming more popular and is a trend of education for many institutions in Thailand, which currently focuses on academic teaching and learning too. Until causing the young generation to neglect virtue and generosity to others. So, if applied to this concept more widely, will be able to help the education system in Thailand has more quality.
The suggesting of environmental protection mission
Tzu chi foundation's environmental conservation mission It is similar to the work of many foundations in Thailand that focus on separating recyclable materials, bringing used items to repair and sell, but the difference is that the foundation in Thailand employs the poor labor in nearby communities to work to increase the income. For the Tzu chi Foundation, it comes from high-income people and those who have free time to raise funds to support the foundation's funds for the benefit of others, while also focusing on providing knowledge, cultivating the environment. In addition, if the foundation in Thailand has studied the business system for environmental preservation and adapted it into the foundation in Thailand, it can expand the environmental help for the poor to have more income (Warakorn Samkoset, 2550). Which from this concept Non-profit organizations in Thailand can apply the concepts of the Tzu chi foundation to raise funds. Which may be used by management and marketing methods from the first suggestion regarding finding a member system to receive donations and the second suggestion is to have marketing techniques for ways to raise money. As well as in-depth business studies on the environment in order to make full potential of waste, such as The use of biofuel energy from waste, Design of waste products , Product Value Added ,which the Tzu chi foundation uses this method as another way to create revenue for the organization.
The suggestion of culture mission
Da Ai Television of the Tzu chi foundation, It is the main crucial role that causes the Tzu chi foundation to expand far and wide and maintain the community integrity. In Thailand Buddhist organizations also has its own satellite television channel, such as the DMC TV or SBTTV of the Voice of Dharma Foundation for the People. But the objectives marketing is only to the groups that install the specific satellite of the organization. Therefore, causing the marketing to not be as thorough as it should be. If various Non-profit or Buddhist organizations able to coordinate with the government to provide support to the establishment of a television station which is a dedicated program and can offer programs 24 hours a day will increase the strength of Non-profit organization in Thailand. However, the use of television stations as a means of expanding cultural missions now is quite out of dated. It is found that the behavior of people has changed a lot. People are starting to watch less TV but are turning their attention to online media via mobile phones. So, non-profit organizations need to be more attractive in content for modern targets, especially the youth, who are one of the main goals of getting into a non-profit organization. Therefore, the communication channels and the details of the presentation must be adjusted to be interesting and able to reach new target members.
INTERNATIONAL JOURNAL FOR INNOVATIVE RESEARCH IN MULTIDISCIPLINARY FIELD, ISSN: 2455-0620, Special Issue : 26, June-2021
Monthly, Peer-Reviewed, Refereed, Indexed Journal with IC Value: 86.87 Impact Factor: 6.719 Publication Date: 30/06/2021
Available online on - www.ijirmf.com Page 32
CONCLUSION:
Based on the knowledge of Non-profit organization management of the Tzu chi foundation and its application for Non-profit organization in Thailand. The author suggests that the Tzu chi foundation, there is a factor, in terms of 1. The comprehensive mission to help fellow humans 2. Volunteer management has a clear system and structure for producing quality volunteers 3. Marketing with techniques, guidelines for earning income for the organization and including other factors such as tremendous faith in the teachings of master Cheng Yen, the concept of Buddhism, the quality of members. Which makes the volunteer management system successful in working and is an outstanding example of volunteer management. However, each volunteer organization may have different characteristics such as size, mission, type of organization (government, private or civil society), organizational culture. Therefore, implementing the concept of volunteer management of the Tzu chi foundation should also consider the organization's factors. Although, the case of the Tzu chi foundation is one of the best practice for a non-profit organization for studies. However, Non-profit organizations in Thailand must consider various factors and the context of the environment by choosing the strengths and can be adapted to the highest potential for managing Non-profit organizations. Therefore, the application of such Non-profit management concepts must be thoroughly considered in order to be most effective.
REFERENCES:
1. Ampol Chindawattana. (2006(. Volunteering Spirit to Build the World. Bangkok: Sang Media Company Limited.
2. Dharma Master Cheng Yen.(2004). Jing Si Aphorisms. Taiwan: Tzu Chi Cultural Publishing Co., 3. Douglas Shaw. (2004).Ten Thousand Lotus Blossoms of the Heart: Dharma Master Cheng Yen and
the Tzu Chi World. Taiwan: Tzu Chi Buddhist Cultural Center Publishing Co. 4. Phra Phaisan Wisalo.( 2007) . Science and Art of Goodness Management: A Case Study of Buddha
Tzu Chi Foundation. Bangkok: The Moral Center. 5. Prawet Wasi. (2007(. Buddha Tzu Chi - Taiwan Foundation. www.oknation. net / blog /
pring.php? id = 115700. Retrieved on 8 May 2020. 6. Punsima Pittayarangsarit .(2009).Study the methods of Buddhism propagation of the Tzu Chi
Buddhist organizations in Taiwan. Master of Buddhist Thesis. Graduate School: Mahachulalongkorn University.
7. Rattanachot. (2014(. The Buddha Tzu Chi Taiwan Foundation in Thailand.
www.jobbkk.com/en/job/jobs_ Njc2NTMx_ Internships. html. Retrieved on 16 May 2020. 8. Special Report.(2006). Medicine with Humanity, Tzu Chi Medical Journal, Vol. 4 May 2006:46.
https://www.tzuchithailand.org/th/index.php/tzuchi-content/tzuchi-publication/tzu-chi-journals-online/special-journal.Retrieved on 16 May 2020.
9. Suparat Rattanamun.(2007).Associate Professor. Volunteer Management System: A Case Study of Buddha Tzu Chi Foundation, Taiwan. Bangkok: Moral Center.
10. Rasami Kritsamit. (2007). Assistant Professor and Faculty. A study of guidelines for cultivating moral consciousness through the education system: a case study of the Tzu Chi Foundation of Taiwan. Bangkok: The Moral Center.
11. Supparant Rattanamuk.(2007). Situation of Volunteering in Thailand and Recommendations on Volunteer Infrastructure in Thailand, Background Paper Submitted to UNDP / UNV.
12. Tzu Chi Thailand Foundation. (2006) .History and management concepts. Bangkok: Tzu Chi Thailand Foundation.https://www.tzuchithailand.org/th/index.php/our-project.Retrieved on 16 May 2020.
13. Warakorn Samkose.)2007(. Buddha Tzu Chi -Taiwan Foundation.www.tzuchithailand.org/th/index.php/about-us/tzu-chi-foundation/global-tzu-chi-history.Retrieved on 16 May 2020.

INTERNATIONAL JOURNAL FOR INNOVATIVE RESEARCH IN MULTIDISCIPLINARY FIELD, ISSN: 2455-0620, Special Issue : 26, June-2021
Monthly, Peer-Reviewed, Refereed, Indexed Journal with IC Value: 86.87 Impact Factor: 6.719 Publication Date: 30/06/2021
Available online on - www.ijirmf.com Page 33
International Conference on
Business, Management, Social and Economical Advancements 26 & 27 June, 2021 Bangkok, Thailand
Jointly organized by: Management Institute, Warsaw University of Life Science - SGGW, Warszawa, Poland,
‘Research Culture Society’ and ‘Scientific Research Association’.
GREEN SUPPLY CHAIN MANAGEMENT IN INDIA
Dr. Bhawana Rewadikar
Assistant Professor, Department of Commerce Dr. Hari Singh Gour Vishwavidyalaya Sagar, M.P (INDIA)
Email - [email protected], Abstract: Green Supply Chain Management is the adoption of processes that are sustainable and
effective in minimizing the ecological impact. It refers to the recent innovations in supply chain
management making this processes green, such as green purchasing, green production, green
material management, green distribution and reverse logistics. India like many other countries, is
working towards achieving sustainable development goals and is moving towards a green supply
chain management.
In the wake of the Corona virus lockdown, India’s supply chain, like those all over the world, has been severely afflicted. With nations in lockdown, Business have taken a hit, and
economic growth has been deeply affected. As the outbreak the way people and businesses
operate, the need to become more conscious environmentally and prefer green alternatives
wherever possible becomes very important.
The Union Budget of India 2021-22 presents a structured approach to put our country on
the path of green recovery post the covid-19 pandemic. The Budget has a long-term vision for this
decade on environmental sustainability. India aspires to be self -reliant and Global manufacturing
champion and to meet this objective, substantial investment is required with respect to technology
research. Moving in this direction, an investment of Rs 1.97 lakh crore, over five years starting FY
2021-22 has been prioritized in 13 sectors. The focus is on enabling the harnessing of science,
technology and innovation more effectively.
This paper is an effort to give an insight on Green Supply Chain Management, its need and
importance, the opportunities and challenges involved and the Initiatives taken by Indian
companies to adopt Green Supply Chain Management.
Key Words: - Green Supply Chain Management concept, opportunities, challenges, initiatives
taken by Indian companies.
INTRODUCTION:
An organization’s Holistic growth is affirmed with its supply chains green performance, such as Green supply chain strategies, Green procurement, Green manufacturing/material management, Green packaging, Green logistics and reverse logistics.
Green supply chain management is now an integral part of any business. India which has steadily adopted smart technologically empowered operations has seen a major transformation in Green supply chain management, which reflects a growing concern for environmentally responsible economic activities.
Today’s leading companies, large and small, are looking for ways to go green. They understand if we want our planet remain habitable for generations to come, we must work together now to identify and reduce emissions, make our businesses more sustainable and ultimately move towards a circular economy.

INTERNATIONAL JOURNAL FOR INNOVATIVE RESEARCH IN MULTIDISCIPLINARY FIELD, ISSN: 2455-0620, Special Issue : 26, June-2021
Monthly, Peer-Reviewed, Refereed, Indexed Journal with IC Value: 86.87 Impact Factor: 6.719 Publication Date: 30/06/2021
Available online on - www.ijirmf.com Page 34
Green Supply Chain Management is also known as Environmental Supply Chain Management or Sustainable Supply Chain Management.
The Union Budget of India 2021-2022 presents a structured approach to put our country on the path of green recovery post the covid 19 pandemic. The Budget has a long-term vision for this decade on environmental sustainability. Is marked by wisely planned investments in the control of air pollution, potable water, deep sea biodiversity conservation and promoting renewable energy.
Green Supply Chain Management are integrating ecofriendly concept into supply chain management to improve environmental sustainability with different Green practices including Green procurement, Green distribution and warehousing, Green transportation with usage of biofuels, Green manufacturing processes and the products end of life management.
According to Patrick Penfield: “Green Supply Chain Management is the process of using Environmentally friendly inputs and transforming these inputs into outputs that can be reclaimed and reused at the end of their life cycle, thus creating a sustainable supply chain”.
GSCM = Green procurement + Green manufacturing/ material management + Green
marketing + Green distribution + Reverse logistics + Recycling
1. Green Procurement: - Green procurement is a concept of acquiring a selection of products and services that minimize environmental impact. It is the purchase of goods and services that are produced with fever resources, do not use or release toxic substances, are energy efficient or are easily disassembled for reuse and recycling and less harmful to the environment and to human health.
2. Green Manufacturing/ Material Management: -Green Manufacturing is defined as production processes which use inputs with relatively low environmental impacts are highly efficient, and generate little or no waste or pollution. It can lead to lower raw material costs, production efficiency gains, reduced environmental and occupational safety expenses and improved corporate image.
3. Green Marketing: -Green Marketing is defined as developing and selling environmentally friendly goods or services. It incorporated a broad range of activities, including product modification, changes to the production process, sustainable packaging as well as modifying advertisement.
4. Green Distribution: -Green distribution consists of Green transportation, Green ware housing, waste management, Green packaging. Green transportation replaces fossil fuel with bio fuel or other environment friendly technologies and fuel like CNG, hybrid, battery operated vehicles and equipment’s. Green warehousing is about adopting technology empowered management system to optimize operation and reduce waste. Waste generated by companies is further treated and used as input material in other operations. Bio-degradable material used for packaging, can reduce the harmful impact on the environment. Recycled packaging material, paper instead of plastic are now increasingly being used.
5. Reverse Logistics: -It is also a Green concept that has taken significant shape in industry. It refers to a set of activities conducted after the sale of product, involving the return of the product to the manufacturer for service or recycling.
Green Supply Chain Management has come into existence as one of the recent innovations to preserve the environment. It not only helps in improving the efficiency of the organization but profitability as well. Therefore, there exists a vast scope in developing countries such as India to adopt Green Supply Chain Management practices and achieve organizational excellence.

INTERNATIONAL JOURNAL FOR INNOVATIVE RESEARCH IN MULTIDISCIPLINARY FIELD, ISSN: 2455-0620, Special Issue : 26, June-2021
Monthly, Peer-Reviewed, Refereed, Indexed Journal with IC Value: 86.87 Impact Factor: 6.719 Publication Date: 30/06/2021
Available online on - www.ijirmf.com Page 35
In India as the environmental awareness is increasing, Firms are facing heavy pressure from different stakeholders including Government and customers to mitigate their harmful effect on the environment. Thus, it’s a strong need for Industries to apply Green Supply Chain Management because of increasing environmental constraints due to Global Warming, Corporate social responsibility, Increasing environment awareness in stakeholders, Evolving consumer and client demand, Eco friendly, Government regulations and curbs. Greening the industries, gains its importance in all sectors.
Green Supply Chain Management benefits the organization in terms of cost reduction, integrating suppliers in a participative decision-making process, that encourages environmental innovations. Main Benefits are as follows: -
1. Green design results in financial gain 2. Reducing operational cost 3. Building brand reputation 4. Gaining competitive advantages 5. Reduction of waste 6. Increasing Firms profitability 7. Digital transformation helps in reducing risk 8. Positive public relations 9. Sustainability of resources 10. Low environment risk and fines from regulatory (NEMA) National Environment
Management Authority.
OBJECTIVES:
Green Supply Chain Management practices have emerged as a systematic approach in India to balance the economic and environmental sustainability of Firms. Main objectives are as follows: -
1. To study the benefits of implementing the concept of Green Supply Chain Management. 2. To recognize the need for implementation of Green Supply Chain Management in Indian
industries for Global competitiveness. 3. To understand the recent trends, opportunities and challenges associated with Green Supply
Chain Management. 4. To study the initiatives taken by Indian companies to adopt Green Supply Chain
Management.
LITERATURE REVIEW:
Green Supply Chain Management is also known as Environmental Supply Chain Management or Sustainable Supply Chain Management (Chein and Shih 2007, Lintonklaseen and Jayaramn 2007), Green Supply Chain Management combines, Green procurement, Green manufacturing/material management, Green packaging, Green logistics and reverse logistics.(Sarkis2005) ,In Globalized economy rapid development in industries causes negative impact on the environment due to high resource consumption,, environmental pollution and waste generation(Wong, Lai, Lun and Cheng2015),Green Supply Chain Management is one of the best strategies to overcome these challenges as it improves the environmental performance of organization (Balasubramanion 2012).
RESEARCH METHODOLOGIES:
This study is based on the information collected from literature review of various Books, Journals, Articles, Research papers, Magazines, Government proceedings and Notices etc. A wide range of sustainable initiatives occur, Industries are considered and types of benefits generated are looked out. A thorough research on various companies’ initiatives, taken for the adoption of Green Supply Chain Management has been done.

INTERNATIONAL JOURNAL FOR INNOVATIVE RESEARCH IN MULTIDISCIPLINARY FIELD, ISSN: 2455-0620, Special Issue : 26, June-2021
Monthly, Peer-Reviewed, Refereed, Indexed Journal with IC Value: 86.87 Impact Factor: 6.719 Publication Date: 30/06/2021
Available online on - www.ijirmf.com Page 36
OPPORTUNITIES: -
In India as the environmental awareness is increasing, Firms are facing heavy pressure from different stakeholders, including Government and customers to mitigate the harmful effect on environment. Main opportunities are as follows: -
1. Develop total Eco system in Industries. 2. Adoption of Ecological Design of product. 3. New Innovative Eco-friendly strategies and technologies, to protect environmental
sustainability. 4. Sourcing Green materials and chemicals. 5. Sustainable environmental processes. 6. Green Automation, Mechanism and Packaging. 7. Green training to employees. 8. Green operation enhances Firms performance in terms of low waste manufacturing, reuse
and recycling of products. 9. Create competitive advantages in terms of greater customer satisfaction. 10. Positive image and reputation provide better opportunities to capture new markets and
Export their products in pro environmental countries. (UK, USA, Germany and Poland)
CHALLENGES: -
The major challenges of this decade are Covid 19 pandemic, climate change, air pollution, biodiversity, loss and availability of fresh water and fresh air for the health and wellness of humankind. Rebuilding the ecological infrastructure is critical. The Firms are facing many problems while finding the way for Green Initiatives. Successful implementation of Green Supply Chain Management is not a easy task. Main challenges are as follows: -
1. Integration of Green Supply Chain Management into traditional Supply Chain Management demands careful analysis and systematic change in existing system.
2. Lack of managing environmental standards and control policies within organization. 3. Rigid practices of suppliers. 4. Lack of resources, technical expertise, knowledge, training and experience. 5. Greening the whole Supply Chain Management need a lot of money to be spent on
Research and Development. 6. Financial constraints and low profitability. 7. Lack of support from top management. 8. lack of organization vision and mission towards sustainable practices. 9. Lack of customer awareness towards Green products. 10. Lack of Government support to adopt environmentally friendly policies and new
technology.
INIATIAVITIES TAKEN BY INDIAN COMPANIES: -
Disasters like Covid 19 pandemic can wreak havoc on even the biggest of companies’ business. Green Supply Chain Management has never been as important or as difficult as it is in the 2020s. Greening the industry gains its importance in all sectors like Information technologies, Pharmaceutical company, Engineering Oil and gas company, Manufacturing, Construction company, Digital streaming, E-Commerce, Cloud computing companies etc. Some company’s examples are as follows: -
S.NO NAME OF
COMPANY
GREEN INITIATIVES UNDERTAKEN
01
ONGC
Oil and Natural Gas Corporation ltd is the largest crude oil and natural gas company in India. Its initiatives are Green Public Procurement, Greening the vendor chain, Toxic use reduction, energy efficient green crematorium minimizes the air and water

INTERNATIONAL JOURNAL FOR INNOVATIVE RESEARCH IN MULTIDISCIPLINARY FIELD, ISSN: 2455-0620, Special Issue : 26, June-2021
Monthly, Peer-Reviewed, Refereed, Indexed Journal with IC Value: 86.87 Impact Factor: 6.719 Publication Date: 30/06/2021
Available online on - www.ijirmf.com Page 37
pollution, Efficient use of natural resources-fossil fuels, water, enhanced use of renewable energy, Reduce, Reuse, Recycle, Replenish raw materials.
02
DHL EXPRESS
INDIA PVT LTD.
DHL Express India Pvt. ltd is a pioneer of Green logistics. Its initiatives are Carbon dash board, Green optimization warehousing, water recycling, Transport, Packaging, Sustainable source material, Energy efficient lighting, Composting program, Reduce greenhouse gas emissions.
03
Dr. Reddy’s
LABORATORIES
Dr. Reddy’s Laboratories is an Indian multinational pharmaceutical company. Its initiatives are sustainable sourcing, sustainable goods, minimization of carbon footprint, effective and cost-efficient processes, replenish to consumption, towards a paperless organization.
04
LARSEN
TOUBRO
(L&T)
Larsen &Toubro is a technology, engineering, construction and manufacturing company in India. Its initiatives are Reduce, Recycle and Reuse (3 R principle), Rain water harvesting, zero waste water discharge energy efficient offices, use of wind and solar power energies, minimizing the use of automobiles.
05
ITC
ITC is one of India’s foremost private sector company. It has a diversified presence in FMCG, hotels, packaging, paperboards, information technology and Agri-business. Its initiatives are energy and waste management techniques, e-chou pals, committed to reduce carbon foot prints, sustainable procurement process, elemental chlorine free technology, ozone bleaching, and green boiler mechanism.
RESULT: -
Adoption of Green Supply Chain Management results in win- win situation for multiple partners whether there are environmental and economic tradeoffs for the supply partners. Covid-19 be the black swan event that finally forces many companies and entire industries to rethink and transform traditional Supply Chain Management to Green Supply Chain Management. India like many other countries is working towards achieving sustainable development goals and is moving towards a Green Supply Chain Management. Companies following the Green Supply Chain Management are now switching to environmentally safe components and finished goods. Recycled packaging material, paper instead of plastic are now increasingly being used for packaging. India is also investing in LED lighting, solar power automobiles and smart grid technology. Adoption of Green transportation replaces fossil fuel with bio-fuel or other environmental -friendly technologies and fuel like CNG, hybrid battery operated vehicle and equipment etc. Green warehousing is about adopting technology empowered management system (WMS) to optimize operations and reduce waste. Additionally, alternative energy sources like solar panels, recycling water and energy efficient lighting sources help supply chain providers to go Green. Consumers now showing clear preference for environmentally -friendly products, several organizations see great merit and profit in going green. Waste generated by companies is further treated and used as input material in other operations. Reverse logistics is also a Green concept that has taken significant shape in the Indian industry. The Union Budget of India 2021-22 presents a structured approach to put our country on the path of green recovery post the covid-19 pandemic. The Budget has a long-term vision for this decade on environmental sustainability. India aspires to be self -reliant and Global manufacturing

INTERNATIONAL JOURNAL FOR INNOVATIVE RESEARCH IN MULTIDISCIPLINARY FIELD, ISSN: 2455-0620, Special Issue : 26, June-2021
Monthly, Peer-Reviewed, Refereed, Indexed Journal with IC Value: 86.87 Impact Factor: 6.719 Publication Date: 30/06/2021
Available online on - www.ijirmf.com Page 38
champion and to meet this objective, substantial investment is required with respect to technology research. Moving in this direction, an investment of Rs 1.97 lakh crore, over five years starting FY 2021-22 has been prioritized in 13 sectors. The focus is on enabling the harnessing of science, technology and innovation more effectively. For Air pollution management42 urban centers are prioritizing with a million plus population for acting on air pollution control with a budget of Rs 2217 crores. To mitigate the impacts of urbanization for Urban Swachh Bharat Mission 2in five years with a sustainable allocation of Rs 1,41,678 crores. For use of renewable energy to meet India’s energy requirements is one of the priorities of this budget, it has planned an investment of Rs. 2500 crore in solar and renewable energy sources. India can take become pioneer in Green power sources with its continued investments in non-fossil-based fuels. The Budget in science and technology areas to encourage research on health and technology innovation, the proposed fund of Rs. 50,000 crores over five years will ensure that the overall research ecosystem of the country is strengthened.
CONCLUSION AND SUGGESTIONS: -
Positive efforts of Green Supply Chain Management might be even more relevant in the post covid -19 world because of the even more central role of sustainability. Green Supply Chain Initiatives help Firms to improve their environmental performance such as reduction in carbon emissions, elimination of waste from end -to -end supply chain, effective and strong collaborations with suppliers would decrease their communication cost and easily promote reuse, recycling and remanufacturing. By adopting Green Supply Chain Management practices. Firms may also enhance their operational performance through improving products quality and improving delivery services. Main suggestions are: - 1. Green Supply Chain Management will protect companies against the negative effects of
covid-19, as an effective drug protects from disease. 2. Green Supply Chain Management is an essential component of sustainability and it may
signal investors the ability to create value in long run. 3. Green Supply Chain Management can help firms to penetrate new market segments, which
enhancing their reputation and attracting top talent. 4. Green Supply Chain Management helps to make organization more attentive in determining
and responding to environmental demands of consumer and other stakeholders. 5. Greening the different phases of the supply chain leads to an integrated Green Supply Chain
which ultimately leads to competitiveness and economic performance. 6. Use of internationally recognized standards such as ISO 14001, one of the most widely
utilized Environmental Management System (EMS) standard. Its help organizations to improve their environmental performance through more efficient use of resources and reduction of waste, gaining a competitive advantage and the trust of stakeholders.
In the wake of the Corona virus lockdown, India’s supply chain, like those all over the world, has been severely afflicted. With nations in lockdown, Business has taken a hit, and economic growth has been deeply affected. As the outbreak the way people and businesses operate the need to become more conscious environmentally and prefer green alternatives wherever possible becomes very important. The future for Green Supply Chain Management looks promising. Now Green Supply Chain Management used in Banks and proposal for Green and sustainable campuses in Indian Higher Education institutes are as follows: - 1. STATE BANK OF INDIA (SBI): - SBI first initiative is Green Channel Counter. A mere swipe of card can transfer fund, withdraw money and even deposit money to another account without filling any physical forms. SBI also initiate Solar Powered ATMs in remote areas. 2. GREEN AND SUSTAINABLE CAMPUSES: -As the Mahatma Gandhi said “Be the change you wish to see in the world.” Green campuses are the need of hour as we face growing climate and environmental challenges. University Grants Commission (UGC), in the year 2020

INTERNATIONAL JOURNAL FOR INNOVATIVE RESEARCH IN MULTIDISCIPLINARY FIELD, ISSN: 2455-0620, Special Issue : 26, June-2021
Monthly, Peer-Reviewed, Refereed, Indexed Journal with IC Value: 86.87 Impact Factor: 6.719 Publication Date: 30/06/2021
Available online on - www.ijirmf.com Page 39
proposed a sustainable campus framework to set out the principles for achieving a green and sustainable campus environment for Higher Education Institutes (HEIs). This framework known as SATAT it includes Generic guidelines to make campus activities sustainable as far as possible and includes discussion and guidance on sector such as campus planning, designing and development ,resource optimization, landscapes and biodiversity, campus building design, energy and water management, transportation, procurement, waste management, green catering and event organization. According to National Education Policy (NEP-2020) environmental awareness including resource and water conservation, management of biological diversity, pollution and sustainable development would be an integral part of curricula in coming years. Students will be taught about making ethical decisions related to environmental consciousness and doing right in favor of global wellbeing. With this initiative it is expected that an ever -increasing number of HEIs will become eco-friendly and bring a paradigm shift in societal attitudes towards the environment.
REFERENCES:
1. Balasubramanian. S (2012) A hierarchical framework barriers to Green Supply Chain Management, Journal if Sustainable Development.
2. Dashore, K & Sahani N (2013) Green Supply Chain Management -Barriers &drivers: a review, International journal of Engineering, Research & Technology.
3. Jaggernath, R & Khan. Z (2015) Green Supply Chain Management, World Journal of Entrepreneurship, Management and Sustainable Development.
4. Mohanty. R. P. & Prakash. A (2013) Green Supply Chain Management practices in India: A empirical study, Production, Planning &Control: The Management of operations.
5. Reddy R&S (2001) Supply chains to virtual Integration, Tata McGraw Hill. 6. Sarkis (2005) Performance measurement of Green Supply Chain Management,
Benchmarking An International journal12 7. Shrivastava S, K, (2007) Green Supply Chain Management, a state of art literature review,
International journal of Management review volume 9. 8. Sudha, R (2012) Green Marketing in India, Namex International journal of Management
research. 9. Vachon, S (2007) Green Supply Chain Management Practices and the selection of
environmental technologies, International journal of Production Research 45; 10. Wong. C. W. Lai, K. H. Lun, Y. H. & Gheng T.E. (2015) Environmental management the
supply chain perspective, Springer. 11. An article on Sustainability Green Supply Chain Management by CII (Confederation of
Indian Industry) on 25th June 2020. 12. An article on Budget 2021 puts green recovery at the Centre for policy framework by CII
(Confederation of Indian Industry) first opportunity in the Asian age on 18 Feb 2021. 13. An article on Green and Sustainable campuses by Prof. D.P. Singh chairman University
Grant Commission (UGC) in Times of India dated 4 June 2021. 14. Environmental Sustainability Index (ESI) for Indian states summary report 2009.
Websites: -
http://en.wikipedia.org http://globalscgroup.com http://dx.dai.org https://timesof india.com www.indianmba.com www.mbaskood.com www.ciiblog,in www.dhl.com
INTERNATIONAL JOURNAL FOR INNOVATIVE RESEARCH IN MULTIDISCIPLINARY FIELD, ISSN: 2455-0620, Special Issue : 26, June-2021
Monthly, Peer-Reviewed, Refereed, Indexed Journal with IC Value: 86.87 Impact Factor: 6.719 Publication Date: 30/06/2021
Available online on - www.ijirmf.com Page 40
International Conference on
Business, Management, Social and Economical Advancements 26 & 27 June, 2021 Bangkok, Thailand
Jointly organized by: Management Institute, Warsaw University of Life Science - SGGW, Warszawa, Poland,
‘Research Culture Society’ and ‘Scientific Research Association’.
A STUDY ON ECONOMIC CHALLENGES FACED BY
HOUSEWIVES IN THIS PANDEMIC
Mrs.Helen Sha Diana1 and Ms.Janani2
1 Assistant Professor, PG Department of Social Work, Shrimathi Devkunvar Nanalal Bhatt Vaishnav College for Women, Chromepet, Chennai, TamilNadu, India
2 MSW Student, PG Department of Social Work, Shrimathi Devkunvar Nanalal Bhatt Vaishnav College for Women, Chromepet, Chennai, TamilNadu, India Corresponding Author’s Email: [email protected]
Abstract : Firstly, COVID-19 is a pandemic that has affected the economy directly and caused
serious implications all over the globe and brought the world to a standstill with unprecedented
changes in our society and economy. As has been the case, the novel coronavirus spread with such
speed and intensity across the world due to the interconnectedness of the globalized world that
most countries imposed. With the closure of educational institutions and the simultaneously
emerging norm of work from home, During the lockdown, we realized that women were much
more vulnerable. sThe first was through fiscal and monetary measures, but the second was
through income support programs to the most vulnerable and small businesses. The latter,
according to economists and policy experts, is the key to bridging the gap between a devastating
economic downturn and hopeful eventual recovery. The study focuses on difficulties faced by the
housewives and also to analyze the mindset of the housewives on various problems faced by them
economically. The present study is conducted in the Chennai district and a sample of 25
housewives and descriptive in nature. The researcher has used the convenience sampling method
to study the economic challenges faced by housewives. The primary data was used to collect data
from the respondents and also secondary data has been collected from various research papers,
magazines, journals and reports. The researcher has used percentage analysis to analysis the
data. The findings of the study have highlighted that 92% of the respondent’s family affected economically due to covid and also has heavy household work in this pandemic.
Key Words: Economic, Challenges, Housewives, Pandemic.
INTRODUCTION: The term unpaid work, as given by the International Labour Organization, is the ‘non-
remunerated work carried out to sustain the well-being and maintenance of other individuals in a household. As originally given by Becker, the unitary model assumes the household as the basic unit of analysis with common preferences and common utility curves of all members. the consequent inequalities in resource distribution but also justifies them in “favour of economic rationality” thereby seeing intrahousehold power dynamics and inequalities across genders as excusable and even preferable. Accordingly, the approach emphasizes reinforcing masculine and feminine behaviours through unpaid labour and therefore, to neutralize this deviance women take more responsibility for the unpaid household chores, thereby reinforcing the gender norms.

INTERNATIONAL JOURNAL FOR INNOVATIVE RESEARCH IN MULTIDISCIPLINARY FIELD, ISSN: 2455-0620, Special Issue : 26, June-2021
Monthly, Peer-Reviewed, Refereed, Indexed Journal with IC Value: 86.87 Impact Factor: 6.719 Publication Date: 30/06/2021
Available online on - www.ijirmf.com Page 41
IMPLICATIONS OF BURDEN OF UNPAID WORK ON WOMEN:
Since the burden of unpaid work is relatively greater on women as compared to men, it raises various concerns for them. The chores that fall into the category of unpaid labor are physically exerting and time consuming. As such, the unpaid work of women takes away most of their time and subjects’ women to time poverty, leaving little or no time for them to engage in productive activities like education and paid employment. In India, women’s labor force participation is dismal and has been showing a declining trend for more than a decade.
Furthermore, women’s lower labor force participation also disincentivizes investment in education and skill development of girls and young women, and they further get pushed into undertaking unpaid labor. Thus, disproportionate burden of unpaid work pushes women out of the labor force which not only affects their financial status but also makes education and skill upgradation less attractive which reduces their opportunities of participating in formal economy, therefore raising equity concerns for women’s participation in the process of development. Simultaneously, the designation of household chores as ‘women’s work’ does not include the element of choice and is instead governed by the norms of gender division of labor and norms, and feeds into the existing power relation across genders.
For women in paid employment, the drudgery of unpaid work is so high that they work longer than men owing to the triple burdens of unpaid work, reproductive work and paid employment. Consequently, there are only limited opportunities for social and political participation, which has significant bearing for their empowerment, and for leisure which affects their overall well-being [10]. This also affects their opportunities for career advancement, as women’s participation in paid work reduces the time spent on unpaid work but less than proportionally as compared to the increase in time in paid work, thereby effectively increasing the number of hours women spend working which is often compensated from the time spent for leisure, sleep, or personal care activities. Finally, the unpaid labor performed by women in not accounted for in the national accounting systems, and are therefore excluded from the realm of policy making.
Efforts to integrate women in the development process to make it inclusive have not considered the drudgery of unpaid work on women. For instance, the much recognized ‘efficiency approach’ that calls for integration and increased participation of women in the development process on grounds of costs of excluding women from the formal economy and the resulting inefficiencies in the markets, seeks to bring women into the ambit of development without considering the impact on their overall well-being. The literature highlights that such development, though inclusive, is bound to put stress on women, increase their drudgery and affect their overall well-being
REVIW OF LITERATURE:
Gendering COVID-19: Impact of The Pandemic on Women’s Burden of Unpaid Work in India. Priyanshi Chauhan Published: 24 October 2020
This paper highlights the impact of COVID-19 on gender equality, specifically on the burden of unpaid work for women. The paper shows that women were already sharing a higher burden of unpaid work, and COVID-19 and the consequent lockdown has worked to exacerbate the existing gender inequalities and increased their burden of unpaid work even more. Among women, marital status and employment status are the key determinants of women’s burden of unpaid work where time spent on unpaid work has increased the highest for married women and unemployed women, who were already spending the highest time on such work even before the lockdown. Specifically, during the lockdown, approximately 22.5% of married women, as compared to zero men and unmarried women, worked for more than 70 h/week. Similarly, unemployed women witness the highest increase of 30.5 percentage points for those who spent more than 70 h/week on unpaid work as compared to employed women who show the highest increase of 14.7 percentage points for those spending 22–28 h/week and 29–49 h/week each. The
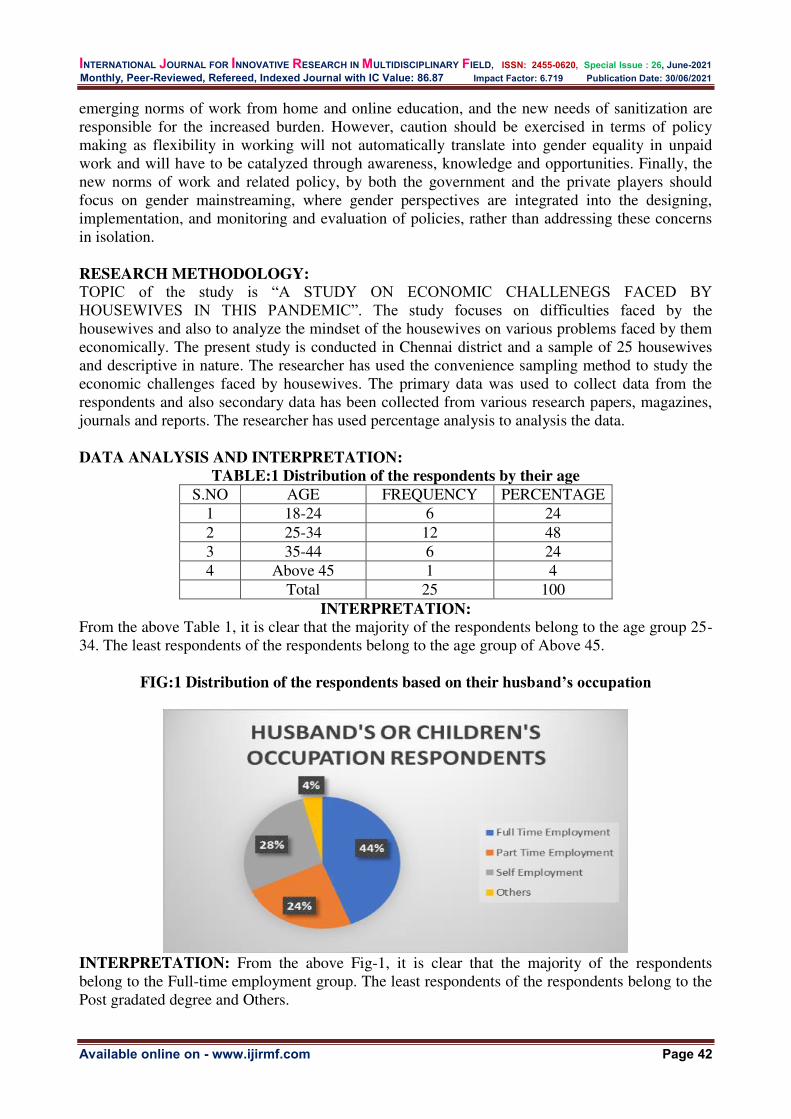
INTERNATIONAL JOURNAL FOR INNOVATIVE RESEARCH IN MULTIDISCIPLINARY FIELD, ISSN: 2455-0620, Special Issue : 26, June-2021
Monthly, Peer-Reviewed, Refereed, Indexed Journal with IC Value: 86.87 Impact Factor: 6.719 Publication Date: 30/06/2021
Available online on - www.ijirmf.com Page 42
emerging norms of work from home and online education, and the new needs of sanitization are responsible for the increased burden. However, caution should be exercised in terms of policy making as flexibility in working will not automatically translate into gender equality in unpaid work and will have to be catalyzed through awareness, knowledge and opportunities. Finally, the new norms of work and related policy, by both the government and the private players should focus on gender mainstreaming, where gender perspectives are integrated into the designing, implementation, and monitoring and evaluation of policies, rather than addressing these concerns in isolation.
RESEARCH METHODOLOGY:
TOPIC of the study is “A STUDY ON ECONOMIC CHALLENEGS FACED BY HOUSEWIVES IN THIS PANDEMIC”. The study focuses on difficulties faced by the housewives and also to analyze the mindset of the housewives on various problems faced by them economically. The present study is conducted in Chennai district and a sample of 25 housewives and descriptive in nature. The researcher has used the convenience sampling method to study the economic challenges faced by housewives. The primary data was used to collect data from the respondents and also secondary data has been collected from various research papers, magazines, journals and reports. The researcher has used percentage analysis to analysis the data.
DATA ANALYSIS AND INTERPRETATION:
TABLE:1 Distribution of the respondents by their age
S.NO AGE FREQUENCY PERCENTAGE 1 18-24 6 24 2 25-34 12 48 3 35-44 6 24 4 Above 45 1 4 Total 25 100
INTERPRETATION:
From the above Table 1, it is clear that the majority of the respondents belong to the age group 25-34. The least respondents of the respondents belong to the age group of Above 45.
FIG:1 Distribution of the respondents based on their husband’s occupation
INTERPRETATION: From the above Fig-1, it is clear that the majority of the respondents belong to the Full-time employment group. The least respondents of the respondents belong to the Post gradated degree and Others.
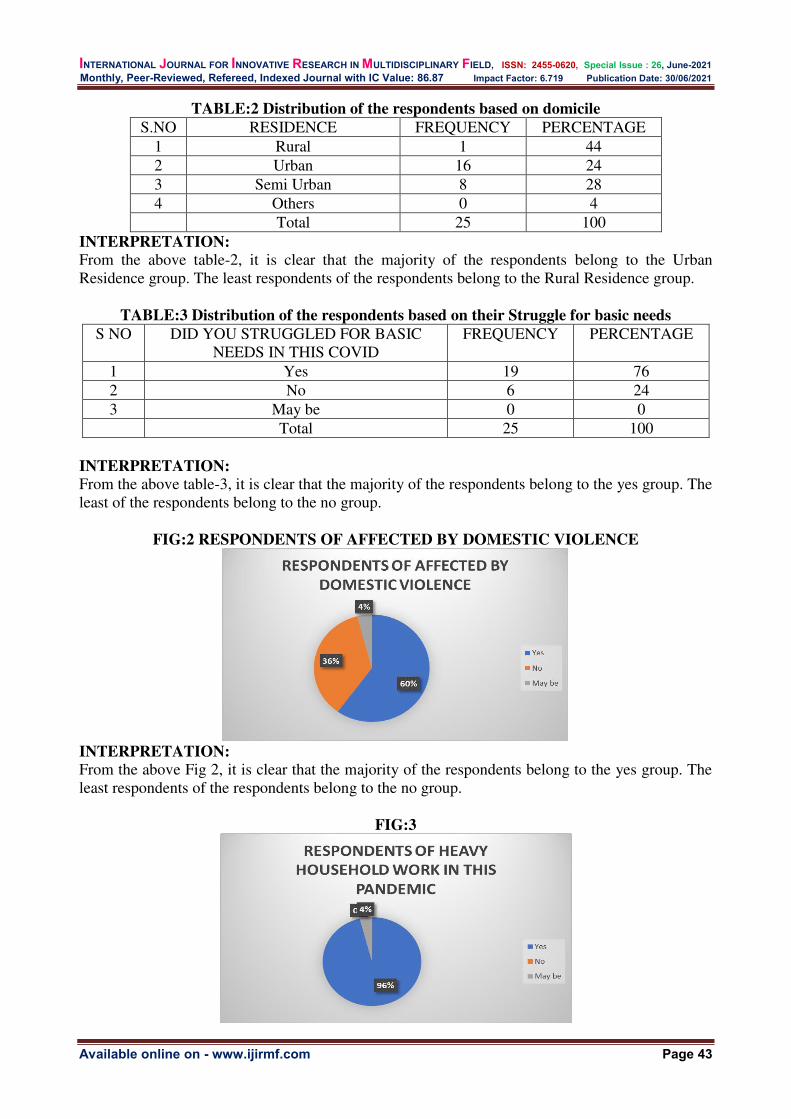
INTERNATIONAL JOURNAL FOR INNOVATIVE RESEARCH IN MULTIDISCIPLINARY FIELD, ISSN: 2455-0620, Special Issue : 26, June-2021
Monthly, Peer-Reviewed, Refereed, Indexed Journal with IC Value: 86.87 Impact Factor: 6.719 Publication Date: 30/06/2021
Available online on - www.ijirmf.com Page 43
TABLE:2 Distribution of the respondents based on domicile
S.NO RESIDENCE FREQUENCY PERCENTAGE 1 Rural 1 44 2 Urban 16 24 3 Semi Urban 8 28 4 Others 0 4 Total 25 100
INTERPRETATION:
From the above table-2, it is clear that the majority of the respondents belong to the Urban Residence group. The least respondents of the respondents belong to the Rural Residence group.
TABLE:3 Distribution of the respondents based on their Struggle for basic needs
S NO DID YOU STRUGGLED FOR BASIC NEEDS IN THIS COVID
FREQUENCY PERCENTAGE
1 Yes 19 76 2 No 6 24 3 May be 0 0 Total 25 100
INTERPRETATION:
From the above table-3, it is clear that the majority of the respondents belong to the yes group. The least of the respondents belong to the no group.
FIG:2 RESPONDENTS OF AFFECTED BY DOMESTIC VIOLENCE
INTERPRETATION:
From the above Fig 2, it is clear that the majority of the respondents belong to the yes group. The least respondents of the respondents belong to the no group.
FIG:3
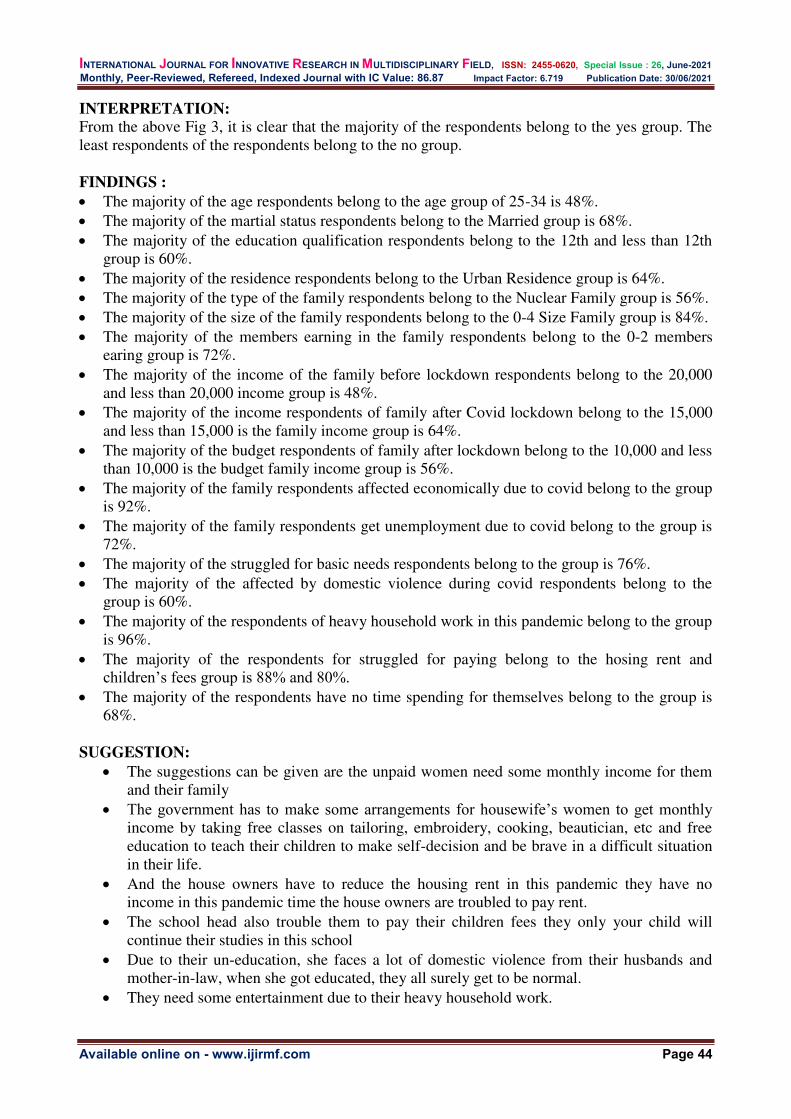
INTERNATIONAL JOURNAL FOR INNOVATIVE RESEARCH IN MULTIDISCIPLINARY FIELD, ISSN: 2455-0620, Special Issue : 26, June-2021
Monthly, Peer-Reviewed, Refereed, Indexed Journal with IC Value: 86.87 Impact Factor: 6.719 Publication Date: 30/06/2021
Available online on - www.ijirmf.com Page 44
INTERPRETATION:
From the above Fig 3, it is clear that the majority of the respondents belong to the yes group. The least respondents of the respondents belong to the no group.
FINDINGS :
The majority of the age respondents belong to the age group of 25-34 is 48%. The majority of the martial status respondents belong to the Married group is 68%. The majority of the education qualification respondents belong to the 12th and less than 12th
group is 60%. The majority of the residence respondents belong to the Urban Residence group is 64%. The majority of the type of the family respondents belong to the Nuclear Family group is 56%. The majority of the size of the family respondents belong to the 0-4 Size Family group is 84%. The majority of the members earning in the family respondents belong to the 0-2 members
earing group is 72%. The majority of the income of the family before lockdown respondents belong to the 20,000
and less than 20,000 income group is 48%. The majority of the income respondents of family after Covid lockdown belong to the 15,000
and less than 15,000 is the family income group is 64%. The majority of the budget respondents of family after lockdown belong to the 10,000 and less
than 10,000 is the budget family income group is 56%. The majority of the family respondents affected economically due to covid belong to the group
is 92%. The majority of the family respondents get unemployment due to covid belong to the group is
72%. The majority of the struggled for basic needs respondents belong to the group is 76%. The majority of the affected by domestic violence during covid respondents belong to the
group is 60%. The majority of the respondents of heavy household work in this pandemic belong to the group
is 96%. The majority of the respondents for struggled for paying belong to the hosing rent and
children’s fees group is 88% and 80%. The majority of the respondents have no time spending for themselves belong to the group is
68%.
SUGGESTION:
The suggestions can be given are the unpaid women need some monthly income for them and their family
The government has to make some arrangements for housewife’s women to get monthly income by taking free classes on tailoring, embroidery, cooking, beautician, etc and free education to teach their children to make self-decision and be brave in a difficult situation in their life.
And the house owners have to reduce the housing rent in this pandemic they have no income in this pandemic time the house owners are troubled to pay rent.
The school head also trouble them to pay their children fees they only your child will continue their studies in this school
Due to their un-education, she faces a lot of domestic violence from their husbands and mother-in-law, when she got educated, they all surely get to be normal.
They need some entertainment due to their heavy household work.

INTERNATIONAL JOURNAL FOR INNOVATIVE RESEARCH IN MULTIDISCIPLINARY FIELD, ISSN: 2455-0620, Special Issue : 26, June-2021
Monthly, Peer-Reviewed, Refereed, Indexed Journal with IC Value: 86.87 Impact Factor: 6.719 Publication Date: 30/06/2021
Available online on - www.ijirmf.com Page 45
CONCLUSION:
According to the World Bank data, female labour force participation footnote-3 has decreased from 32% in 2005 to 21% in 2019. Simultaneously, women’s time poverty has increased manifold, despite the drop in their labour force participation, clearly suggesting that women experience extreme time poverty due to their responsibilities of unpaid labour. Consequently, financial independence, bargaining power, lack of personal income affects their economic status, and decision-making within the household, thereby affecting the intra-household distribution of resources in favour of men as guided by the power dynamics of gender relations. Among women, marital status and employment status are the key determinants of women’s burden of unpaid work where time spent on unpaid work has increased the highest for married women and unemployed women, who were already spending the highest time on such work even before the lockdown.
REFERENCES:
1. Action Aid. (2019). Invisible work invisible workers: The sub-economies of unpaid work and paid work action research on women’s unpaid labor. Johannesburg: Action Aid.
2. Brines, J. (1994). Economic dependency, gender, and the division of labor at home. American Journal of Sociology.
3. Coffey, C., Revollo, P. E., Harvey, R., Lawson, M., Butt, A. P., Piaget, K., et al. (2020). Time to care: Unpaid and underpaid care work and the global inequality crisis. Nairobi: Oxfam International.
4. Dutta, D. (2019). No work is easy! Notes from the field on unpaid care work for women. In O. India (Ed.), Mind the gap: The state of employment in India.
5. Frankiewicz, B. (2020). 5 ways we lack gender balance in the workplace. World Economic Forum. https://www.weforum.org/agenda/2020/01/5-ways-companies-can-progress-more-women-into-leadership-roles/. Retrieved July 15, 2020.
6. World Bank. (2020). Gender dimensions of the COVID-19 pandemic. Washington: World Bank.
7. OECD. (n.d.). OECD. Stat. Employment: Time spent in paid and unpaid work, by sex. Retrieved July 3, 2020.
8. International Labor Organization (ILO). (n.d.). Gender equality tool. ILO. https://www.ilo.org/public/english/bureau/gender/newsite2002/about/defin.htm. Retrieved September 21, 2020.
Web References:
http://timesofindia.indiatimes.com www.economictimes.com https://www.ilo.org/public/english/bureau/gender/newsite2002/about/defin.htm.

INTERNATIONAL JOURNAL FOR INNOVATIVE RESEARCH IN MULTIDISCIPLINARY FIELD, ISSN: 2455-0620, Special Issue : 26, June-2021
Monthly, Peer-Reviewed, Refereed, Indexed Journal with IC Value: 86.87 Impact Factor: 6.719 Publication Date: 30/06/2021
Available online on - www.ijirmf.com Page 46
International Conference on
Business, Management, Social and Economical Advancements 26 & 27 June, 2021 Bangkok, Thailand
Jointly organized by: Management Institute, Warsaw University of Life Science - SGGW, Warszawa, Poland,
‘Research Culture Society’ and ‘Scientific Research Association’.
Socio-economic Impacts of COVID-19: Facilitating
Developing Countries Towards a ‘New Normal’ World
Dr. Parin Somani
Independent Academic Scholar, India Corresponding author: [email protected]
Abstract : This study aims to understand the socio-economic impact of the coronavirus pandemic,
with the endeavour to provide recommendations to facilitate developing countries within the ‘new normal’ world. There is a focus on the Indian economy. This study is completed by means of a
systematic literature review through a through literature search of published and grey literature.
Results have identified that COVID-19 has impacted the Indian economy substantially. Education
systems, agriculture industries, trading and healthcare systems have been identified. The gap
between higher and lower socio-economic statuses have exacerbated and many disparities
identified. This study recommends international collaboration, support from national governing
bodies and improved healthcare and educational systems. This can be achieved through
individuals working together within developing and developed countries to progress into the new
normal world in unison.
Keywords: COVID-19, Socio-economic, Developing countries, India, New normal.
INTRODUCTION :
The coronavirus (COVID-19) pandemic has affected global societies impinging upon social, economic, and political standings. The highly contagious virus with increasing transmission rates of infections and death, triggered governing bodies to apply regulations with the aim of protecting humanity. The virus transmits from one person to another through a cough or sneeze, dispersing saliva droplets which are penetrated through a non-infected person’s eyes nose or mouth via inhaling, or exposure through direct contact (WHO, 2020). The only way to contain the virus from progressively infecting societies, was a process used within historical pandemics like the 1918 flu pandemic involving the implementation of societal ‘lockdown’, self-isolation, and social distancing. This method has successfully contained the virus reducing transmission rates since the World Health Organization declared a global health emergency on 30th January 2020 (WHO, A Joint Statement on Tourism and COVID-19 - UNWTO and WHO Call for Responsibility and Coordination, 2020). It was on 25th March 2020, that the Indian Government declared a National Lockdown. During this period people were restricted to their homes except for those in need of medical assistance, those that required essential items pertaining to sustenance like food, also individuals unable to work from home were exempt (Somani, 2020). Since the easing of restrictions, there have been two waves of the virus, as a surge of infection rates and death rapidly increase and most recently the outbreak of the ‘Indian variant’ which put India at the epicentre of the COVID-19 pandemic. After China, India is the second most populous country in the world and a developing country, thus encountering many challenges. Within every nation a vital component of societal progression involves economic growth through which there is a rise in national income, output, and expenditure. It links to increased incomes which are greater than average, a reduction

INTERNATIONAL JOURNAL FOR INNOVATIVE RESEARCH IN MULTIDISCIPLINARY FIELD, ISSN: 2455-0620, Special Issue : 26, June-2021
Monthly, Peer-Reviewed, Refereed, Indexed Journal with IC Value: 86.87 Impact Factor: 6.719 Publication Date: 30/06/2021
Available online on - www.ijirmf.com Page 47
in poverty as individuals hold employment positions, there are less governmental loans imparted, improved education systems and life longevity (Pettinger, 2019). However, the lockdown restrictions put a stop to individuals enjoying their daily lives including attending their places of employment where physical contact was necessary. This has had grave impacts on the socio-economic situation within global societies, affecting developing countries and individuals of a lower-socio economic status that were unable to fend for themselves. India is a developing country that has been complying with a mixed socio-economic model, comprising of various theories and principles that have highlighted many disparities and an unstable market growth prior to the COVID-19 pandemic (Kapoor, 2020). The improvement in quality of life is linked to economic development and referred to as a critical driving force and creates highly paid occupations. Economic development also allows for a diverse economy resulting in the reduction of the reliability on an individual industry within a single region. Thus, local businesses have an opportunity to increase their revenue through business retention and expansion, leading to improved infrastructure within a region and a rise in employment opportunities, consequently resulting in an improved quality of life (Roche, 2018). Lockdown restrictions due to the COVID-19 pandemic have impinged upon traditional ways of enhancing the economy, affecting economic productivity as face-to-face interactions had stopped and non-essential shops were closed. Although restrictions are currently being lifted as we enter a ‘new normal’ world, socio-economic factors have already been affected. Approximately 90% of people working within industries, worked from home (Bela & Wilkinson, 2020), which affected employer strategies of operation. There was a swift transition for many, as the cultures changed from office-based employment or physical interaction within employment, to remote methods using technology to facilitate communication between and within organisations and their consumers, to ensure sustainability. The pandemic has resulted in many individuals unemployed and made redundant with countries recording a record high of employment rates (Kretchmer, 2020). As society enters a ‘new normal’ it is creating change in preconceived conditions or behaviours that societies have been set prior to the pandemic. They are what society deemed as expected, usual or typical (Thompson, 2018). Thus, the emergence of COVID-19 was abnormal, resulting in socio-economic implications within society.
OBJECTIVES:
This study aims to understand the socio-economic impact of COVID-19, with the endeavour to provide recommendations to facilitate developing countries within the ‘new normal’ world. There is a focus on the Indian economy.
METHODOLOGY:
This study is completed by means of a systematic literature review through a through literature search of published and grey literature. The following electronic databases are searched: Google Scholar, Gateway, Lexis Nexis, Blackwell Synergy and PubMed. The literary sources are identified, extracted from, analysed, evaluated, and interpreted through a well-planned process. A preliminary search has been conducted via the following key words: ‘COVID-19’, ‘Business’, ‘Economy, ‘Social’, ‘Socio-economic’, ‘India’, ‘Industry’, ‘Developing countries’. This search has resulted in numerous literatures sources. The following exclusion criteria is devised:
o Literature irrelevant to the economy not associated to COVID-19 are not used o Literature with a focus on developed countries are overlooked. o Literature pertaining to developing countries other than India are not favoured. o Literature in languages other than English are excluded. o Older literature with information replicating newer studies is not used. o Literature with insufficient technical information to their approach are not included.

INTERNATIONAL JOURNAL FOR INNOVATIVE RESEARCH IN MULTIDISCIPLINARY FIELD, ISSN: 2455-0620, Special Issue : 26, June-2021
Monthly, Peer-Reviewed, Refereed, Indexed Journal with IC Value: 86.87 Impact Factor: 6.719 Publication Date: 30/06/2021
Available online on - www.ijirmf.com Page 48
In total, forty-two literary sources are shortlisted to provide a focus on the study. Through close examination two sources are duplicated hence discarded. The abstracts and introductions of literature are examined after which a decision was made to eliminate three literature sources, leading to a closer examination of the literature. Post-examination another literature source is discarded resulting in a total of thirty-six primary literature sources to be used in this study.
RESULTS AND DISCUSSION :
Results have identified that COVID-19 has impacted the Indian economy substantially. Education systems, agriculture industries, trading and healthcare systems have been identified within this study.
The economy
COVID-19 effects on the global economy have been immense, as a multitude of businesses transitioned to online platforms to continue operation. Within India, prior to the COVID-19 pandemic there was the initiation of neo middle class urban employment within the Indian economy (Jagannathan, 2020). There were threats of larger organizations taking over independent local businesses constituting towards the formation of a micro-macro dynamic contributing to increased competition and a decrease in cyclical business practices. Globalisation has contributed to the enhancement of many economic functions which required a uniformed effort from organisations globally (Nathan, 2018). Connectivity made possible via the internet has created possibilities of vast global connectedness, where economic activities can give rise to innovations and important information that can be ‘shared’ globally in seconds. This requires technical skills which involves employers to ensure all employees are re-skilled and up skilled if necessary. The onus is also placed upon individuals who have been made redundant due to the economic climate caused by the pandemic, which forced business to cease operation. Numerous individuals have experienced job loss, including learned youths. Decreased funding has led to populations being deprived of sustenance including food and clean water for drinking and sanitisation purposes. Social distancing has also become a problem in developing countries as several individuals may reside in one residential area making the implementation of government guidelines like self-isolation and social distancing very difficult. Negative growth rates in GDP have been identified within the financial market, where external trade was limited, political systems faced scrutiny. The Cooperation companies and the agricultural sector within India have been affected. Simultaneously, migrant workers were challenged with hardship as public transport was ceased due to government applied lockdown regulations. Having been turned away from their employment due to restrictions, migrant workers embarked upon their journey to their villages within rural areas from their cities of work in urban regions. They carried out the ‘black march’ where they walked from Southern parts of India to Northern India. Many industries have been distressed questioning their sustainability during the COVID-19 pandemic and beyond, due to the decreased demand and disruption in the national consumer patterns. As individuals have largely been staying ‘safe’ at home until the recent ease of lockdown restrictions, tourism and hospitality have suffered and printing industries have lost many opportunities. Nevertheless, a peak in economy has emerged through rising technological opportunities utilising the internet and digital online platforms. Examples of these innovations are ‘Zoom’ ‘Google Meet’ ‘Skype’ ‘Microsoft Teams’ amongst others (Ashford, 2020). Social media has been utilised widely within developed and developing countries as populations take to the platform to stay connected, share ideas, information and misinformation. This new culture during the pandemic has given rise to several social media influencers and stars that have emerged through the pandemic. Technological advancements have successfully created opportunities for economic functionality progressing societies towards the ‘new normal’ world. Therefore, many businesses at micro-level that have not progressed and embraced new methodologies of

INTERNATIONAL JOURNAL FOR INNOVATIVE RESEARCH IN MULTIDISCIPLINARY FIELD, ISSN: 2455-0620, Special Issue : 26, June-2021
Monthly, Peer-Reviewed, Refereed, Indexed Journal with IC Value: 86.87 Impact Factor: 6.719 Publication Date: 30/06/2021
Available online on - www.ijirmf.com Page 49
progressing their business, thus facing challenges in sustainability. Many rural areas had a lack of digital infrastructure prior to the pandemic as internet connectivity was poor or non-existent. Therefore, the Indian government established internet connectivity within villages in India aiding individuals to stay connected and continue with their occupations remotely. Education
The COVID-19 pandemic has impinged upon student learning and teaching methodologies. Traditional methods of physical face-to-face education was replaced with remote methods, forcing a rapid transition (Somani, The Role of Education During and After COVID-19, 2021). The process of education is vital to the future of economic development as it is a process that can transform human beings to wholesome noble souls, who can be an asset to global societies. It is a process that should be made available to every individual despite their socio-economic background, status, or caste. The education system within India comprises of governmental and independent self-financed institutions. There was an attempt facilitate growth of the education system from urban to rural areas prior to the COVID-19 pandemic. This will contribute to the increased literacy rate of learned individuals within developing countries and contribute towards future economic prosperity. Due to the financial implication of acquiring education, many families of students belonging to lower socio-economic statuses were unable to send their children to school or continue their further education. Governmental educational institutions have access to grants that can aid development to help students, however it is necessary for acceptable standards to be achieved for imparting education. Private academic institutions in comparison, are constantly striving to survive and ensuring a balance between educated employable individuals and occupational requirements. Thus, COVID-19 pandemic resulted in upheaval within educational systems globally. Historically traditional educational had taken approximately a century to progress and identify methods that have been implemented through the world. Developing countries have categorised students through their age and learning abilities as educators taught the same material to every individual who were expected to memorise their work. Various teaching methods are utilised within classes and it was not until the nineteenth century under the vocational education act in 1963 that technology was adopted within educational institutions (Somani, TECHNOLOGY EDUCATION VS TRADITIONAL EDUCATION: A TRANSITION IN THE 21ST CENTURY – A SYSTEMATIC REVIEW, 2020) . This has continued to evolve to contemporary life, where during the pandemic remote learning has become the normal method knowledge acquisition. This has changed the dynamics of educational institutions and altered infrastructures where globalization has enabled partnerships to form and institutional collaboration towards economising resources. Together academic institutions can help students overcome socio-economic challenges like access to hardware, software, internet accessibility and numerous courses. There is a possibility that a combination of face-to-face teaching and learning and virtual interaction also known as the blended learning approach will continue into the new normal. Agriculture
Within the Indian economy agriculture can be perceived as the backbone, particularly as it is the dominant occupation of the Indian population (Wagh & Dongre, 2016). The COVID-19 pandemic has impinged upon agricultural productivity and implications on the rising prices of agricultural produce. There are heightened concerns relating to labours, irrigation, and reliance on natural conditions to yield good produce. However, with good produce comes a higher price which gives rise to competition usually resulting in lower prices winning. Thus, numerous landowners within India face economic crisis as the GDP is reduced in comparison to other occupations. The highest GDP of 16.5% in India is initiated by the food and agriculture sector and contributes 43% to the

INTERNATIONAL JOURNAL FOR INNOVATIVE RESEARCH IN MULTIDISCIPLINARY FIELD, ISSN: 2455-0620, Special Issue : 26, June-2021
Monthly, Peer-Reviewed, Refereed, Indexed Journal with IC Value: 86.87 Impact Factor: 6.719 Publication Date: 30/06/2021
Available online on - www.ijirmf.com Page 50
employment sector. This can be categorized onto dairy (29%), edible oil (32%), and cereals (10%). India also stands number one in dairy and spices products at a global scenario (export) (Mukherjee, Ray, & Bag, 2020). As the agricultural industry continued during the COVID-19 pandemic, many unemployed individuals decided to work within this industry so that they could generate income. This was a positive element for landowners, as they were able to continue contributing towards economic growth, provide sustenance for individuals locally and a growing demand for food. The demand for organic vegetables and chemical free products has increased and the rising panic contributing to the pandemic resulted in numerous individuals overstocking on food like lentils, rice and flour. This act created a rise in sales of the FMCG fast-moving consumer goods companies. There was a decrease in stock in trade and a chain supply that became distorted. There was an increase in deliveries that required innovative distributions channels ensuring they were aware of various routes to reach consumers, particularly as lockdown regulations were in place stopping vehicles reaching destinations (Mukherjee, Ray, & Bag, 2020). As a result of numerous discrepancies experiences by farmers, protests broke out to re-appeal against the three farm acts referred to as the Farm Bills that have been formed in September 2020 by the Indian Government (PTI, 2021).
Trade
Research has revealed that approximately forty million people have lost their jobs, dominantly within unorganised sectors (UN, 2020). India has maintained a strong partnership with china, US, UAE, and Saudi Arabia, therefore lockdown restrictions resulted in major industries being impacted including chemicals, textiles, and apparel, automotive, and metals and metal products. India’s third largest export destination is China comprising of 5.3% of Indian exports, and 52% Chinese imports comprising of capital goods, 52%, Intermediate Goods 32%, Consumer goods 14%, and raw materials just over 1%. In the short-term this disruption in the supply chain may affect the manufacturing of intermediate goods, however the productivity will be affected in the future as technologies and machinery will require replacing (UNCTAD, 2020). Fuels, chemicals, and stone and glass, contribute to over 40% of India’s exports, while textiles, clothing and transportation sectors contribute to approximately 18%. Vegetables, plastic and rubber, animals, food products, etc. have had reduced exposure as they are being made at local and national levels. The workload has increased for women within societies as majority of the unpaid work is carried out by females as they are expected to balance domestic duties and care work (Chauhan, 2020). India being at the epicenter of the COVID-19 pandemic with the emergence of the ‘India variant’ has resulted in many women spending increased time in their homes. There have been reports of increased domestic violence cases and potential long-term fatalities (Singh, 2020).
Health System
During the COVID-19 pandemic in developing countries like India, there have been an increased burden on healthcare systems. Many hospitals are governmental, charitable, or privately organisations within which individuals seek medical attention. The pandemic resulted in an overwhelming demand for hospital beds and oxygen cylinders regardless of socio-economic background. Individuals that used private hospitals prior to the pandemic were happy to be been in governmental facilities to save their lives. This has shifted the focus onto an importance of governmental and charitable hospitals within the contemporary world, and numerous medical partitioners aiding patients to good health. The need for funding has become highlighted within health systems, although it was a dominant factor prior to the pandemic. The pandemic has highlighted a need for strengthened medical systems with accessibility for all individuals including individuals within rural areas who have had to travel for long periods to find hospital facilities.
INTERNATIONAL JOURNAL FOR INNOVATIVE RESEARCH IN MULTIDISCIPLINARY FIELD, ISSN: 2455-0620, Special Issue : 26, June-2021
Monthly, Peer-Reviewed, Refereed, Indexed Journal with IC Value: 86.87 Impact Factor: 6.719 Publication Date: 30/06/2021
Available online on - www.ijirmf.com Page 51
CONCLUSION:
The COVID-19 pandemic has had adverse impacts upon societies within developing countries. It has affected societies socially and economically, creating a larger gap between individuals belonging to lower socio-economic background and higher socio-economic backgrounds. The COVID-19 pandemic will be marked in history, and the pathway to a new normal world will undergo scrutiny in the future. However, economic developments, human direction and civilisation have all been affected. This study has identified economic implications, education, agriculture, trade, and health systems as some of the areas that have been affected in developing countries. However, residing within the pandemic currently insufficient information is available to provide the complete effects on the socio-economic implications resulting from COVID-19. New advancements are continually being discovered particularly as the digital economy increases, and although technological advancements have supported economic progression during the pandemic, societies have been disrupted. There has been economic loss and people have lost their lives and endured suffering in many ways. We must learn from past events and progress towards a sustainable future. There has been a change in human behaviours within society as humans are being conditioned to maintain social distancing and wear personal protective equipment, while working remotely has become a societal norm. RECOMMENDATIONS:
The COVID-19 pandemic has highlighted many disparities within developing countries in particular India. Individuals belonging to lower socio-economic backgrounds have been most affected, although every individual within society has been affected by the pandemic to some degree socially and economically. This study has highlighted that pre-existing economic inequalities have been exacerbated during the pandemic. There is a need for rectification of these disparities for future sustainability of every developing country globally and particularly in India. Many injustices have been highlighted amongst individuals particularly individuals from lower socio-economic backgrounds and key workers as their hard work with very low wages and social value was undermined. They contribute immensely to the economic growth of developing countries and must be valued. The current decisions made through the pandemic will reflect on future economic prosperity, therefore this study recommends that a focus must be placed on educating societies within developing countries, as the youth are future leaders who will contribute to economic sustainability and a resilient nation. To aid growth within India, national and international collaboration with educational institutions, industrial sectors and health organisations will facilitate economic progression. Financial aid is required in many sectors and governing bodies can implement strategies to help, through which the economy can flourish. It is only by working together that we can achieve positive change through which developing countries can prosper.
REFERENCES:
1. Ashford, J. (2020, 05 01). Coronavirus: the businesses flourishing in the pandemic. (The Week) Retrieved 01 15, 2021, from https://www.theweek.co.uk/106894/coronavirus-the-businesses-flourishing-in-the-pandemic
2. Bela, A. F., & Wilkinson, D. (2020, 05 01). Technology intensity and homeworking in the
UK . (ons.gov) Retrieved 01 30, 2021, from https://www.ons.gov.uk/employmentandlabourmarket/peopleinwork/employmentandemployeetypes/articles/technologyintensityandhomeworkingintheuk/2020-05-01
3. Chauhan, P. (2020). Gendering COVID-19: Impact of the Pandemic on Women’s Burden of Unpaid Work in India. Springer.

INTERNATIONAL JOURNAL FOR INNOVATIVE RESEARCH IN MULTIDISCIPLINARY FIELD, ISSN: 2455-0620, Special Issue : 26, June-2021
Monthly, Peer-Reviewed, Refereed, Indexed Journal with IC Value: 86.87 Impact Factor: 6.719 Publication Date: 30/06/2021
Available online on - www.ijirmf.com Page 52
4. Jagannathan, R. (2020, 11 30). The Future Of Work: The Middle Class May Shrink And
The Neo Middle Will Rise. (Swarajya) Retrieved 01 16, 2021, from https://swarajyamag.com/ideas/the-future-of-work-the-middle-class-may-shrink-and-the-neo-middle-will-rise
5. Kapoor, A. (2020, 05 21). View: Rejuvenating India’s growth paradigm. (The Economic Times) Retrieved 01 15, 2021, from https://economictimes.indiatimes.com/news/economy/policy/view-rejuvenating-indias-growth-paradigm/articleshow/75862877.cms
6. Kretchmer, H. (2020, 05 13). How coronavirus has hit employment in G7 economies. (World Economic Forum) Retrieved 01 30, 2021, from https://www.weforum.org/agenda/2020/05/coronavirus-unemployment-jobs-work-impact-g7-pandemic/
7. Liu, W., Yue, X. G., & Tchounwou, P. B. (2020). Response to the COVID-19 Epidemic: The Chinese Experience and Implications for Other Countries. International journal of
environmental research and public health, 17(7), 2304. 8. Mukherjee, T., Ray, N., & Bag, S. (2020, 10 20). Opinion: Impact of covid-19 on the
Indian Economy. (Government Economic Times) Retrieved 01 15, 2021, from ET Government. com: https://government.economictimes.indiatimes.com/news/economy/opinion-impact-of-covid-19-on-the-indian-economy/75021731
9. Nathan, D. (2018). Globalization and Labour in Developing Countries: India. Journal of
Political Economy, 7(1), 105-121. 10. Pettinger, T. (2019, 12 14). Benefits of Economic Growth. (Economics help) Retrieved 02
30, 2021, from https://www.economicshelp.org/macroeconomics/economic-growth/benefits-growth/
11. PTI. (2021, 01 15). Farm Bills have potential to represent significant step forward for
agriculture reforms in India: IMF. (The Hindu) Retrieved 01 30, 2021, from https://www.thehindu.com/business/Economy/farm-bills-have-potential-to-represent-significant-step-forward-for-agriculture-reforms-in-india-imf/article33577480.ece
12. Roche, A. (2018, 05 07). Top 6 Reasons that Economic Development is Important to a
Region’s Economy. (Orlando Economic Partnership) Retrieved 01 30, 2021, from https://news.orlando.org/blog/top-6-reasons-that-economic-development-is-important-to-a-regions-economy-infographic/
13. Singh, S. (2020, 11 28). The impact of COVID-19 on women’s reproductive health in India: Safeguarding women’s rights. Retrieved from Population matters: https://populationmatters.org/news/2020/09/21/impact-covid-19-women-s-reproductive-health-india-safeguarding-women-s-rights
14. Snowdon, F. M. (2019). Epidemics and society: From the black death to the present. New Haven and London: Yale University Press.
15. Somani, P. (2020, 05 03). Corona Virus Pandemic: Comment by Parin Somani. (Asian Lite International) Retrieved 01 30, 2021, from https://asianlite.com/news/uk-news/corona-virus-pandemic-comment-by-parin-somani/
16. Somani, P. (2020). TECHNOLOGY EDUCATION VS TRADITIONAL EDUCATION: A TRANSITION IN THE 21ST CENTURY – A SYSTEMATIC REVIEW. International
Conference of Education, Research and Innovation. Seville . 17. Somani, P. (2021). The Role of Education During and After COVID-19. The Journal of
Social Sciences Studies and Research, 1(1), 34-40. 18. Thompson, K. (2018, 09 03). What is Normal? (Revise Sociology) Retrieved 01 20, 2021,
from https://revisesociology.com/2018/09/03/what-is-normal/ 19. UN. (2020). Hard times forecast for global job recovery in 2020, warns UN labour agency
chief. Geneva: United Nations.

INTERNATIONAL JOURNAL FOR INNOVATIVE RESEARCH IN MULTIDISCIPLINARY FIELD, ISSN: 2455-0620, Special Issue : 26, June-2021
Monthly, Peer-Reviewed, Refereed, Indexed Journal with IC Value: 86.87 Impact Factor: 6.719 Publication Date: 30/06/2021
Available online on - www.ijirmf.com Page 53
20. UNCTAD. ( 2020). Global trade impact of the Coronavirus (COVID-19) epidemic, Trade
and development report impact, . Geneva: United Nations. 21. Wagh, R., & Dongre, A. (2016). Agricultural Sector: Status, Challenges and it's Role in
Indian Economy. . Journal of Commerce and Management Thought, 7(1), 109. 22. WHO. (2020, 02 27). A Joint Statement on Tourism and COVID-19 - UNWTO and WHO
Call for Responsibility and Coordination. (World Health Organization) Retrieved 01 30, 2021, from https://www.who.int/news/item/27-02-2020-a-joint-statement-on-tourism-and-covid-19---unwto-and-who-call-for-responsibility-and-coordination
23. WHO. (2020, June 22). Health topics. Retrieved from World Health Organization : https://www.who.int/health-topics/coronavirus#tab=tab_1

INTERNATIONAL JOURNAL FOR INNOVATIVE RESEARCH IN MULTIDISCIPLINARY FIELD, ISSN: 2455-0620, Special Issue : 26, June-2021
Monthly, Peer-Reviewed, Refereed, Indexed Journal with IC Value: 86.87 Impact Factor: 6.719 Publication Date: 30/06/2021
Available online on - www.ijirmf.com Page 54
International Conference on
Business, Management, Social and Economical Advancements 26 & 27 June, 2021 Bangkok, Thailand
Jointly organized by: Management Institute, Warsaw University of Life Science - SGGW, Warszawa, Poland,
‘Research Culture Society’ and ‘Scientific Research Association’.
LIFE INSURANCE SERVICES: POLICY HOLDER’S SATISFACTION WITH REGARD TO SERVICES RENDERED BY
LIC AGENTS
Dr. Durga Prasad Vali
Assistant Professor, Department of Commerce University PG College Secunderabad, OU.
Email - [email protected]
Abstract: This article explains Risk transfer mechanism that ensures full or partial financial
compensation for the loss or damage caused by event(s) beyond the control of the insured party.
Under an insurance contract, a party (the insurer) indemnifies the other party (the insured)
against a specified amount of loss, occurring from specified eventualities within a specified
period, provided a fee called premium is paid. It is a promise of compensation for specific
potential future losses in exchange for a periodic payment. Insurance is designed to protect the
financial well-being of an individual, company or other entity in the case of unexpected loss. Some
forms of insurance are required by law, while others are optional.
Keywords: LIC, Insurer, IRDA, Life insurance, Health insurance, Risk.
INTRODUCTION:
Insurance is a basic form of risk management which provides protection against possible loss to life or physical assets. All assets have some economic value attached to them. There is also a possibility that these assets may get damaged / destroyed or become non-operational due to risks like breakdowns, fire, floods, earthquake etc. Different assets are exposed to different types of risks like a car has a risk of theft or meeting an accident, a house is exposed to risk of catching fire, a human is exposed to risk of death/accident. The purpose of insurance as a method of transferring risk is to provide economic protection against the losses that may be incurred due to uncertain predicaments caused by disability, death of an earning family member or economic losses. The events that cause losses may or may not occur during the operative time of the contract of insurance. People, therefore, opt for life insurance purely for the reason of uncertainties in life. Life Insurance gives the insured a kind of peace of mind as he is assured of making up the loss in the event of such uncertainties in life.
REVIEW OF LITERATURE:
C. Sunitha (2004) – In her ph.D. thesis on “Customer satisfaction in Life Insurance with special reference to women policy holders in Thanjavur District” examined the preferences and factors considered by women policy holders while taking policy, the criteria followed by women policy holders while selecting an Insurance agent and the satisfaction about the performance of agents and their level of satisfaction towards the services provided by LIC of India. Uma et al. (2015) – Uma in their article titled “A survey of Life insurance Awareness, Perception and Preferences”, observes that majority of customers are satisfied with the policy features

INTERNATIONAL JOURNAL FOR INNOVATIVE RESEARCH IN MULTIDISCIPLINARY FIELD, ISSN: 2455-0620, Special Issue : 26, June-2021
Monthly, Peer-Reviewed, Refereed, Indexed Journal with IC Value: 86.87 Impact Factor: 6.719 Publication Date: 30/06/2021
Available online on - www.ijirmf.com Page 55
whereas few customers are dissatisfied with the incomplete information provided to them and suppression of information about policy terms and conditions. Thakkar (2016) – “A study on Consumer Behaviour Towards Life Insurance Industry”, found that to know the investment behaviour of individuals with related to life insurance and also to know the problems faced by them. The study was conducted amongst the investors (policy holders) of Kolhapur city. His study revealed that Insurance advisor is the main influencer in buying decision of life insurance consumers. They depend largely on the insurance advisor. Rao (2017) – Rao in his article “Policy holder’s perceptions on LIC Policies and Services with reference to Srikakulam District in Andhra Pradesh”, has observed that insurance occupies an important position in the financial sector of the economy. The Life Insurance Corporation of India has devised several policies to satisfy the diversified needs of the customers. The main objective of this research is to study the policy holder’s perceptions on LIC policies and services with reference to Srikakulam district in Andhra Pradesh. Vijay Kumar (2018) – Vijay Kumar in his ph.D. thesis, “A Contemporary Study of factors influencing Urban and Rural consumers for buying different Life Insurance policies in Haryana” makes an in-depth study of factors influencing buyer behaviour for buying life insurance policies in Haryana. The study outlines that the insurance agent was the most influential factor for selecting the life insurance policy among rural and urban policy holders. Sharma (2019) – Sharma conducted a study on “Service Quality and Customer Satisfaction of Insurance” with 300 samples. The study exposed that service quality has a positive impact on customer satisfaction. Prajapati and Barad (2020) – “To study the Investor’s Behaviour towards Life Insurance Products”, explained that the life insurance basically is a tool against protection of life or against any unforeseen event or death of individuals. It provides financial protection against such risks. The study revealed that Insurance Advisor is the main influencer in investment decision of life insurance investors and they depend largely on the insurance advisor.
NEED FOR THE STUDY: The review of literature revealed that most of the research works on life insurance business in India have concentrated on buyer and seller perceptions on life insurance products, service quality, customer satisfaction in life insurance industry, and distribution channels of life insurance sector. There are very few studies which have concentrated on services rendered by LIC of India and its Agents. The study includes surveys and fact finding studies of various kinds. The major purpose of this research is descriptive study on policy holder’s perception and level of satisfaction on service quality of LIC agents. It also states the affairs or problems as they exist and are faced at present by the respondents.
IMPORTANCE OF THE STUDY: The study analyses the perceptions of customers considering various parameters like services offered by LIC agents, availability of services, accessibility, behaviour towards customers, etc. which would help the company to know where they need to improve and they also would come to know the expectations of customers from them.
SCOPE OF THE STUDY:
The study would examine the customer perceptions towards services rendered by LIC of India with its agents. The results of this research would help the company to have a better understanding about the consumer’s perception towards life insurance products offered by LIC of India. It takes into consideration various parameters like total premium, accessibility, number of policies, number of branches, security and so on. Since it is a sample study, it takes into consideration only the public sector insurance company i.e. LIC of India and the customer survey is also based on the sample customers drawn from the city of Hyderabad. The study excludes from its purview the

INTERNATIONAL JOURNAL FOR INNOVATIVE RESEARCH IN MULTIDISCIPLINARY FIELD, ISSN: 2455-0620, Special Issue : 26, June-2021
Monthly, Peer-Reviewed, Refereed, Indexed Journal with IC Value: 86.87 Impact Factor: 6.719 Publication Date: 30/06/2021
Available online on - www.ijirmf.com Page 56
analysis of the financial performance of the companies in terms of profits, dividends, financial ratios, assets, etc.
OBJECTIVES OF THE STUDY:
The study is taken up with the following objectives in view: 1. To study the policyholder’s perception towards services rendered by LIC of India through
its agents. 2. To study the factors influencing consumers in selecting a policy from LIC of India. 3. To study the policyholder’s satisfaction towards Life Insurance Corporation of India.
RESEARCH METHODOLOGY:
The data for the study is collected from primary as well as secondary sources.
Primary sources:
A survey method is adopted to collect primary data. A structured questionnaire is constructed to collect the data from policyholders. The questionnaire consists of 20 questions which are to be answered by the respondents. Secondary sources: Secondary data is collected from reports of IRDAI, IRDAI handbook on Indian Insurance Statistics, internet, books on related issues, company sources and research reports of various researchers in relevance to the study.
Sample size:
The sample size for primary data collection is 100 life insurance policyholders of Life Insurance Corporation of India.
Sampling method:
Convenience sampling method is adopted for selecting policyholders to collect the primary data.
Tools and Techniques for the analysis of the data:
One way ANOVA, Percentage method, graphs and charts are applied to analyse the primary data. All the data is analysed using MS-Word, MS-Excel and SPSS.
DATA ANALYSIS:
This study covers the demographic profile of the policy holders, reasons for selecting the life insurance policy. It also presents the policy holder’s opinion and satisfaction levels with regard to
the policy opted, premium and distribution channels (agents).
Table 1: Age group of Respondents
Interpretation:
As may be observed from the table, 33% of the respondents are in the middle age group (25 years to 35 years). Those in the young age group (Up to 25 years) account for about 26% of the sample, 23% of the respondents are in the age group of (35 years to 45 years) and the remaining 18% of respondents are in the old age group (Above 45 years).
Options Number of respondents Percentage (%)
Up to 25 years 26 26% 25 years - 35 years 33 33% 35 years - 45 years 23 23%
Above 45 years 18 18% Total 100 100%

INTERNATIONAL JOURNAL FOR INNOVATIVE RESEARCH IN MULTIDISCIPLINARY FIELD, ISSN: 2455-0620, Special Issue : 26, June-2021
Monthly, Peer-Reviewed, Refereed, Indexed Journal with IC Value: 86.87 Impact Factor: 6.719 Publication Date: 30/06/2021
Available online on - www.ijirmf.com Page 57
Table 2: Gender Classification Interpretation:
It is clear from the above table that 57% of the respondents are male and remaining 43% of respondents are female.
Table 3 – Educational Qualifications
Interpretation:
Majority of the respondents i.e., 32% of the respondents are having Post graduation or higher education, 26% of respondents are having graduation, 21% of respondents are having SSC qualification, 12% of respondents are illiterate and 9% of respondents are having intermediate.
Table 4: Reasons for investing in Life Insurance Policy
Reason Number of responses Percentage (%)
Safety of Investment 51 30.5% Tax Benefits 22 13.2% High Returns 4 2.4%
Savings 57 34.1% Life coverage 32 19.2%
Others 1 0.6% Total 167 100.0%
Interpretation:
It is observed from the above table that 34.1% of respondents mentioned Savings as the main reason for investing in a Life insurance policy. This is followed by those who invested for safety of investment (30.5%), life coverage (19.2%) and Tax benefits (13.2%). Returns did not figure significantly as the reason for investing in a life insurance policy (only 2.4%).
Table 5: Source of motivation to take a Life Insurance Policy Source of Motivation Number of responses Percentage (%)
Friend 19 17.6% Family member 44 40.7%
Colleague 5 4.6% Media 2 1.9%
Insurance Agent 37 34.3% Others 1 0.9% Total 108 100.0%
variable Options Number of respondents Percentage (%)
Gender
Male 57 57% Female 43 43% Total 100 100%
Variable Options Number of
respondents
Percentage
(%)
Educational
Qualifications
Illiterate 12 12.0% Up to SSC 21 21.0%
Intermediate 9 9.0% Graduation 26 26.0%
Post graduate 32 32.0% Total 100 100.0%
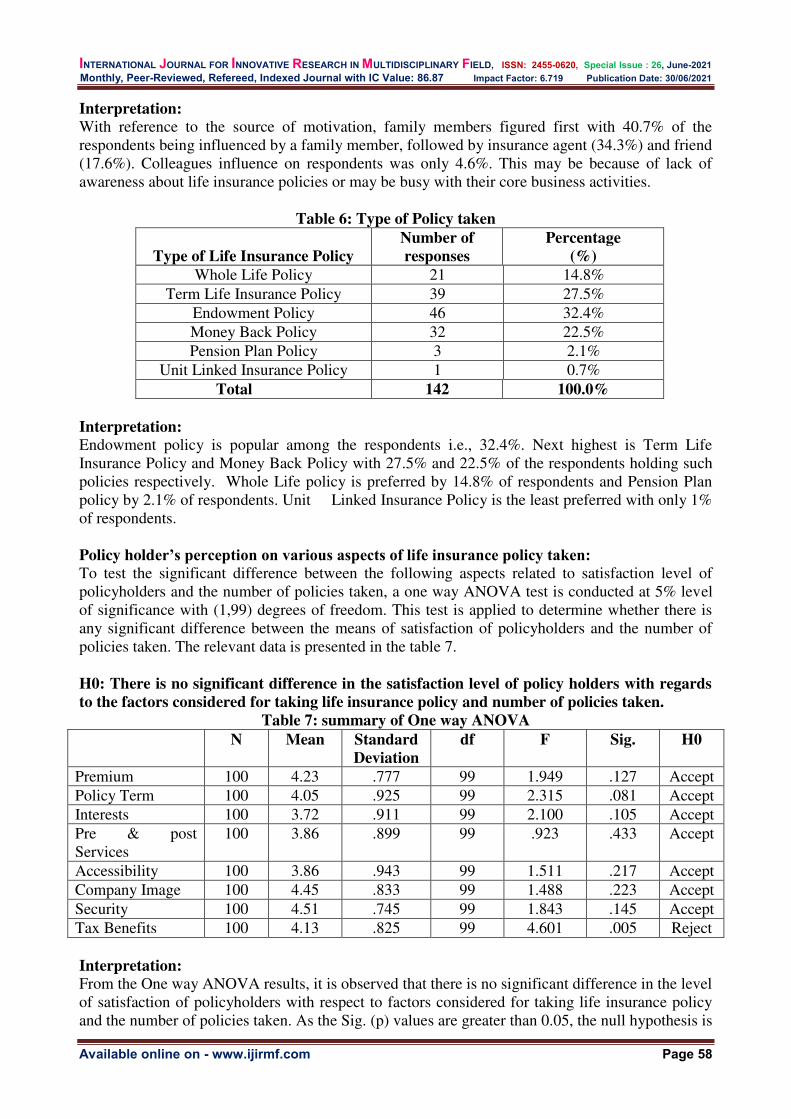
INTERNATIONAL JOURNAL FOR INNOVATIVE RESEARCH IN MULTIDISCIPLINARY FIELD, ISSN: 2455-0620, Special Issue : 26, June-2021
Monthly, Peer-Reviewed, Refereed, Indexed Journal with IC Value: 86.87 Impact Factor: 6.719 Publication Date: 30/06/2021
Available online on - www.ijirmf.com Page 58
Interpretation:
With reference to the source of motivation, family members figured first with 40.7% of the respondents being influenced by a family member, followed by insurance agent (34.3%) and friend (17.6%). Colleagues influence on respondents was only 4.6%. This may be because of lack of awareness about life insurance policies or may be busy with their core business activities.
Table 6: Type of Policy taken
Type of Life Insurance Policy
Number of
responses
Percentage
(%)
Whole Life Policy 21 14.8% Term Life Insurance Policy 39 27.5%
Endowment Policy 46 32.4% Money Back Policy 32 22.5% Pension Plan Policy 3 2.1%
Unit Linked Insurance Policy 1 0.7% Total 142 100.0%
Interpretation:
Endowment policy is popular among the respondents i.e., 32.4%. Next highest is Term Life Insurance Policy and Money Back Policy with 27.5% and 22.5% of the respondents holding such policies respectively. Whole Life policy is preferred by 14.8% of respondents and Pension Plan policy by 2.1% of respondents. Unit Linked Insurance Policy is the least preferred with only 1% of respondents.
Policy holder’s perception on various aspects of life insurance policy taken: To test the significant difference between the following aspects related to satisfaction level of policyholders and the number of policies taken, a one way ANOVA test is conducted at 5% level of significance with (1,99) degrees of freedom. This test is applied to determine whether there is any significant difference between the means of satisfaction of policyholders and the number of policies taken. The relevant data is presented in the table 7.
H0: There is no significant difference in the satisfaction level of policy holders with regards
to the factors considered for taking life insurance policy and number of policies taken.
Table 7: summary of One way ANOVA
N Mean Standard
Deviation
df F Sig. H0
Premium 100 4.23 .777 99 1.949 .127 Accept Policy Term 100 4.05 .925 99 2.315 .081 Accept Interests 100 3.72 .911 99 2.100 .105 Accept Pre & post Services
100 3.86 .899 99 .923 .433 Accept
Accessibility 100 3.86 .943 99 1.511 .217 Accept Company Image 100 4.45 .833 99 1.488 .223 Accept Security 100 4.51 .745 99 1.843 .145 Accept Tax Benefits 100 4.13 .825 99 4.601 .005 Reject
Interpretation:
From the One way ANOVA results, it is observed that there is no significant difference in the level of satisfaction of policyholders with respect to factors considered for taking life insurance policy and the number of policies taken. As the Sig. (p) values are greater than 0.05, the null hypothesis is

INTERNATIONAL JOURNAL FOR INNOVATIVE RESEARCH IN MULTIDISCIPLINARY FIELD, ISSN: 2455-0620, Special Issue : 26, June-2021
Monthly, Peer-Reviewed, Refereed, Indexed Journal with IC Value: 86.87 Impact Factor: 6.719 Publication Date: 30/06/2021
Available online on - www.ijirmf.com Page 59
accepted. But with respect to tax benefits, it is observed that there is a significant difference in the level of satisfaction of policyholders with respect to factors considered for taking life insurance policy and the number of policies taken, where the Sig. (p) value is less than 0.05. Therefore null hypothesis is rejected.
Satisfaction with services rendered by the LIC Agent:
The following table 9 presents the data related to the overall satisfaction on the services rendered by LIC Agent.
Table 9: Satisfaction with services rendered by LIC agent
Response
Gender
Male Percentage Female Percentage
No 7 12% 7 16% Yes 50 88% 36 84%
Total 57 100% 43 100%
Interpretation:
Out of 100 respondents who took policy from agent, majority are male respondents and 88% of the male respondents mentioned that they are satisfied with the services rendered by LIC agent. 84% of the female respondents mentioned that they are satisfied with the services rendered by LIC agent. 12% of the male respondents and 16% of female respondents mentioned that they are not satisfied with the services rendered by LIC agent. Reasons for dissatisfaction about the services of LIC agent:
There are 14% of the respondents i.e. 14 members out of 100 respondents who took policy from agent, have mentioned that they are not satisfied with the services rendered by the agents. The following table 10 indicates the reasons for dissatisfaction of policy holders.
Table 10: Reasons for dissatisfaction about the services of LIC Agent
Reason
Responses
Number of
respondents
Percentage
(%)
Does not explain terms and conditions 9 29.0% Does not explain why company's policy is better than others
3 9.7%
Does not advice wisely 7 22.6% Does not inform about renewal date 5 16.1% Does not deliver the receipts in time 7 22.6% Total 31 100.0%
Interpretation:
Majority of policy holders of LIC expressed that their agent does not explain terms and conditions, does not advice wisely and does not deliver receipts in time as the main reasons for their dissatisfaction about agent’s services. This may be because once the policy has been sold the agent gets the commission on the policy as long as the premium is paid by the policy holders.
Overall satisfaction with Insurance policies of LIC of India:
The following table-11 presents the data related to the overall satisfaction on insurance policies of LIC of India.

INTERNATIONAL JOURNAL FOR INNOVATIVE RESEARCH IN MULTIDISCIPLINARY FIELD, ISSN: 2455-0620, Special Issue : 26, June-2021
Monthly, Peer-Reviewed, Refereed, Indexed Journal with IC Value: 86.87 Impact Factor: 6.719 Publication Date: 30/06/2021
Available online on - www.ijirmf.com Page 60
Table 11 : Employment * Satisfaction with Insurance policies of LIC of India
Employment
Satisfaction with Insurance policies of LIC of India Total
Highly
Satisfactory
Satisfactory Neutral Dissatisfactory
Govt. employee 2 3 0 0 5 Private Employee 8 37 3 1 49 Self Employed 9 10 3 0 22 Retired 0 1 1 0 2 Student 1 6 5 0 12 Others 1 9 0 0 10
Total 21 66 12 1 100
Interpretation:
From the above table it is clearly observed that majority i.e. 66% of respondents are satisfied with the insurance policies of LIC of India. Out of satisfied respondents 37 respondents are private employees only. 21% of the respondents are highly satisfied and 12% of the respondents are neutrally satisfied. Only 1% of the respondents (private employee) are dissatisfied with the insurance policies of LIC of India.
Table 12: Policy holder’s opinion to suggest others to take the policy from LIC of India Options Frequency Percentage (%)
Yes 88 88% No 12 12%
Total 100 100.0 Interpretation:
Out of 100 respondents 88% of the respondents opinion is to suggest others to take a policy from LIC of India as they are happy with the services provided by LIC of India.
Table 13: Reasons for not suggesting others to take policy from LIC
Reasons
Responses
Number Percentage (%)
Delay in claim settlement 1 7.1% Complex formalities 1 7.1% High commission 2 14.3% Lack of Trust 3 21.4% Low guaranteed return 6 42.9% Can't increase or decrease premium 1 7.1% Total 14 100.0%
Interpretation:
Majority of the policy holders of LIC of India expressed that, low guaranteed return and lack of trust are the main reasons for not suggesting others to take a policy from LIC of India. Others opinion is that high commission delay in claim settlement, complex formalities and fixed premium are the reasons for not suggesting others to take policy from LIC of India.
CONCLUSION:
It is concluded that companies need to develop the products keeping in view the requirement of prospective life insurance policy holders. They have to treat provision insurance as a service by assuring a financial security to the life of an individual rather than a profit making business. By

INTERNATIONAL JOURNAL FOR INNOVATIVE RESEARCH IN MULTIDISCIPLINARY FIELD, ISSN: 2455-0620, Special Issue : 26, June-2021
Monthly, Peer-Reviewed, Refereed, Indexed Journal with IC Value: 86.87 Impact Factor: 6.719 Publication Date: 30/06/2021
Available online on - www.ijirmf.com Page 61
charging affordable premium, maintaining transparency in policy related matters while offering it and efficient services after the sale of the policy with prompt actions on the quarries and complaints raised by policy holders will help any life insurance company to sustain and grow in the highly competitive environment.
REFERENCES:
1. Uma et al. “A survey of Life Insurance Awareness, Perception and Preferences” 2011. 2. V. Satya Kumar, “Life Insurance Corporation of India – strategies for Expanding Role
in the Liberalised sector”, horizon in the Indian Insurance Industry, FAPCCI, April 2002, pg. 32.
3. Athma, P. and Kumar, R. (2007) “an explorative study of life insurance purchase decision making: influence of product and non-product factors”, infai journal risk & insurance, vol. Iv, October 2007, pg. No 19-21.
4. Khan M.K.., “Prospects of a career in Life Insurance Business in India – An Analysis, Indian Journal of Marketing, Volume 7, No. 6., Feb 1978, P.23-31.
5. Rao, B.S.R. and Appa Rao Machiraju, “Life Insurance and Emerging Trends in Financial Services Market”, Yogakshema, 1988, P.25.
6. Narasima Murthy, G., “Customer Services in Life Insurance Company – A Case Study”, Indian Journal of Marketing, Vol. 25, No. 23, Feb-Mar 1996, P.18-22.
7. Malliga, R., “Marketing of LIC Policies - A Study on Agents of Tirunelveli Division”, Indian Journal of Marketing, Vol. XXX, No. 8-10, August- October 2000, P. 6-9.
8. Mittal, R.K., “Privatisation of Life Insurance Sector in India – Impact and Perspective”, Indian Journal of Marketing, Vol. XXXII, November 2002, P.5.
9. PatilKallinath, S., “Life Insurance Corporation of India, Its Products and their Performance Evaluation”, A Special Reference to Gulbarga District, Finance India, Vol. 17, 2003, P. 1037-1040.
10. Kumar Jagendra, “Innovative Environment in Renovated Insurance Industry, the Insurance Times, 2005, Vol. 25, P.4.

INTERNATIONAL JOURNAL FOR INNOVATIVE RESEARCH IN MULTIDISCIPLINARY FIELD, ISSN: 2455-0620, Special Issue : 26, June-2021
Monthly, Peer-Reviewed, Refereed, Indexed Journal with IC Value: 86.87 Impact Factor: 6.719 Publication Date: 30/06/2021
Available online on - www.ijirmf.com Page 62
International Conference on
Business, Management, Social and Economical Advancements 26 & 27 June, 2021 Bangkok, Thailand
Jointly organized by: Management Institute, Warsaw University of Life Science - SGGW, Warszawa, Poland,
‘Research Culture Society’ and ‘Scientific Research Association’.
Examining the impact of institutional support on the
entrepreneurial intentions of Indian engineering graduates-
The extended planned behavior approach
Dr Satyalakshmi Kompella
Faculty Member, ICFAI Federation for Higher Education (IFHE), Hyderabad, India Email - [email protected]
Abstract : The Higher Education Institutions (HEIs) in India are entrusted with the important role
of transforming Indian youth into “job creators not job hunters”. Many studies have highlighted
the role of HEIs in preparing the students for entrepreneurship. Inculcation of entrepreneurship
education into the course curriculum, providing mentorship, inspiration and support through
initiatives like Entrepreneurship Development Cells (EDCs) have been suggested as effective
initiatives for creating young entrepreneurs. However, only a very small percentage of students
graduating from HEIs start own businesses after graduation, while many seek jobs through on-
campus or off-campus placements. Data from 378 final year engineering students from various
colleges in Hyderabad, Telangana, India, is used to study the direct and indirect relationships
between the entrepreneurial intentions of the students and the factors influencing the
intentions. TPB elements like entrepreneurial attitude, subjective norms, and perceived behavior
control were considered as the ‘cognitive’ elements and the entrepreneurial atmosphere and culture provided by HEIs is considered as the external environment factor. Contrary
to expectations, the impact of external environment does not play a significant role in shaping the
entrepreneurial intentions of the students. Attitude towards entrepreneurship and perceived
behavior control are found to be strong predictors of entrepreneurial intentions in
students. Finally, recommendations are offered which could help the HEIs take steps for
furthering transformation of students into entrepreneurs. The study has significant implications
for heads of HEIs, regulatory bodies, in-charges of EDCs, incubation cell in-charges and
investors.
Key words: Institutional support, HEIs, Theory of planned behaviour, graduating students,
entrepreneurial intentions.
INTRODUCTION :
An entrepreneur is ‘a person who undertakes a wealth-creating and value-adding process, through incubating ideas, assembling resources and making things happen’ (Kao, 1993). While ‘making things happen’ entrepreneurs act as “engines of economic growth” and aid in stimulating the country’s economy and contribute significantly to the development of the country. Hence, entrepreneurship has recently caught the attention of policy makers and scholars with special emphasis on youth entrepreneurship. In a view to bring more students into entrepreneurship, higher education institutes (HEIs) in India have been encouraged to develop a mechanism of entrepreneurial culture in their campuses, thus encouraging and supporting students to start their own businesses. While most HEIs have these mechanisms in place, the effectiveness of these initiatives is not clear. The present study attempts to study the impact of institutional support on

INTERNATIONAL JOURNAL FOR INNOVATIVE RESEARCH IN MULTIDISCIPLINARY FIELD, ISSN: 2455-0620, Special Issue : 26, June-2021
Monthly, Peer-Reviewed, Refereed, Indexed Journal with IC Value: 86.87 Impact Factor: 6.719 Publication Date: 30/06/2021
Available online on - www.ijirmf.com Page 63
the entrepreneurial intentions of graduating students. To promote entrepreneurship at colleges and university level, it is necessary to understand the factors influencing the entrepreneurial intentions of students and the role played by HEIs in shaping these intentions.
Many research papers on entrepreneurial intentions have focused on entrepreneurial intentions of students pursuing professional courses (Tkachev & Kolvereid, 1999; Pruett, Shinnar, Toney, Llopis & Fox, 2009; Sesen, 2013; Liñán, Urbano & Guerrero, 2011; Van Gelderen, Brand, Van Praag, Bodewes, Poutsma & Van Gils, 2008). The focus on this demographic is justified because young and educated individuals are highly preferred candidates for nascent entrepreneurship (Staniewski & Szopiński, 2013). Previous studies reveal that most of the university students consider it desirable to create a new firm (Guerrero, Rialp & Urbano, 2008). Several models have been utilized to explain entrepreneurial intentions. Of these, Ajzen’s Theory of Planned Behaviour (TPB) has been used to predict and understand intentions (Ajzen, 1991). TPB has been widely used in different contexts and on varied populations, including India with consistent and accountable results. This study uses TPB as the basis for examining the intentions of the target population. As far as the entrepreneurial intentions of Indian students are concerned, previous studies have shown that Indian students have a strong urge to start their own business but are hesitant to do so due to a variety of reasons (GEM, 2020). These reasons are found to be attitudinal, social (Srivastava & Misra, 2017) and contextual (Sahoo & Panda, 2019). The number of students taking up entrepreneurship after or during graduation is exceedingly small and most of the students are reluctant to start own businesses and prefer to look for employment in multi-national firms (MNC). Parental pressure plays a significant role in career choice of students in Indian culture (Ray et al, 2020). In this context, the role of HEIs as major influencing factor on the entrepreneurial intentions would help in overcoming societal, parental pressures and risk aversion attitudes and help students make the knowledgeable and conscious choice towards entrepreneurship. TPB has been used in previous studies to understand the entrepreneurial intentions of many kinds of populations including the university/college students. A scrutiny of recent studies based on the entrepreneurial intentions of Indian students reveals some lacunae. Previous studies have been confined to study of the entrepreneurial intentions from the individual point of view. The environmental factors need to be taken into consideration along with individual factors. The effect of contextual elements on the entrepreneurial intentions requires a comprehensive and systematic analysis which is missing in previous studies or covered partially. For the students pursuing engineering courses, HEI is their microenvironment. Regarding the contextual elements, the students pursuing courses at the HEIs would benefit greatly if they are exposed to the innovative culture of the institution. The students receive structured coaching on entrepreneurship in the form of electives or as additional courses or as specialization. It is mandatory for all engineering colleges in Telangana to have a fully functioning Entrepreneurship Development Cell (EDC) as per university guidelines. This allows students’ exposure to several activities like seminars, workshops, internships, competitions, symposia that throw light on various aspects of entrepreneurship. EDCs also contribute to the entrepreneurship-nurturing environment provided by the HEI (Tripathi, 2021). The role played by EDCs in shaping the entrepreneurial intentions of the students and whether they are successful in developing the entrepreneurial spirit in the students or not is not well documented in recent studies. The second lacuna is the limiting the analysis to the study of linear relationships between the dependent and independent variables and ignoring the indirect relationships between the entrepreneurial intentions and their factors. To overcome these limitations of the recent studies, this paper uses a sample survey conducted on 378 final year students from seven engineering colleges located in Hyderabad, Telangana. The paper provides a systematic and comprehensive discussion on the attitudinal, societal and control factors impacting the entrepreneurial intentions of the students. The paper also provides insights on the impact of institutional support on the intentions of the students. Structural

INTERNATIONAL JOURNAL FOR INNOVATIVE RESEARCH IN MULTIDISCIPLINARY FIELD, ISSN: 2455-0620, Special Issue : 26, June-2021
Monthly, Peer-Reviewed, Refereed, Indexed Journal with IC Value: 86.87 Impact Factor: 6.719 Publication Date: 30/06/2021
Available online on - www.ijirmf.com Page 64
equation modelling and mediation is applied to study the inter-relationships between the entrepreneurial intentions and their influencing factors. The paper is divided into five parts; introduction is followed by literature review. Research design is described in the next part followed by analysis of data. Results are discussed along with conclusions and recommendations.
LITERATURE REVIEW :
What are entrepreneurial intentions and how are they measured? Entrepreneurial intentions of any individual refer to his/her personal orientations that may
lead to setting up own ventures. There is no standard definition of the entrepreneurial intentions with various researchers adopting different definitions. Various terms have been used to refer to the intention towards venture creation like Entrepreneurship attitude orientation (EAO) by Tan et al (1996), career orientation (Kroon & Meyer, 2001), entrepreneurial personality (Korunka et al, 2012), etc. This paper has focused on final year students who have not engaged in any entrepreneurial activity so far. Hence, the term ‘entrepreneurial intentions’ in this paper will refer to the desire, wish and confidence that the student exhibits towards the process of venture creation. So far, all the research on the entrepreneurial intentions of Indian students has been confined to measurement of linear relationships between the dependent and the independent variables. Impact of mediating variables has not been tested so far. Also, recent models have been limited to the impact of personal abilities and attitudes on the entrepreneurial intentions of students. The impact of institutional support on the entrepreneurial intentions has not been studied so far. This paper aims to study the impact of institutional support on the entrepreneurial intentions of graduating engineers.
The factors affecting the entrepreneurial intentions of students Studying entrepreneurial intentions is a complex process. By considering entrepreneurship
as a planned behaviour and not as an impulsive decision, TPB allows us to examine the way an individual’s behavioural, normative and control beliefs shape the intentions towards entrepreneurship.
Previous studies show significant support for TPB as a model for predicting entrepreneurial intent (explaining over 27% of the variance in entrepreneurial intent). Recent literature like the study conducted by Vamvaka et al (2020) on Greek tertiary students has reiterated the findings that individual's entrepreneurial attitude and perceived behaviour control are strong predictors of his/her entrepreneurial intentions. Earlier studies have indicated that subjective norm is not a significant predictor of the entrepreneurial intentions (Linan, 2008), but recent studies have reported significant impact of subjective norms on the entrepreneurial intentions of respondents (Al-Shammari & Waleed,2018). Munir et al (2019) demonstrated that TPB model can used successfully to differentiate between the intentions of an emerging economy and a developing country. Valencia-Arias & Restrepo, (2020) reported that behaviour control is the most significant predictor of the entrepreneurial intentions. Purusottama, (2019) demonstrated that attitude and behaviour control are strong influencers on the entrepreneurial intentions while subjective norms are not significant predictors. Hence, this study posits that H1: Entrepreneurial attitude positively impacts the entrepreneurial intentions of Indian
engineering students
H2: Subjective norms positively impacts the entrepreneurial intentions of Indian engineering
students
H3: Perceived behaviour control positively impacts the entrepreneurial intentions of Indian
engineering students TPB model mainly focuses on the intrinsic factors affecting the propensity of any
individual towards entrepreneurship and it is a ‘cognitive’ approach (Khalid, 2018). Another approach to entrepreneurship is the ‘discovery’ approach where it is argued that the environment

INTERNATIONAL JOURNAL FOR INNOVATIVE RESEARCH IN MULTIDISCIPLINARY FIELD, ISSN: 2455-0620, Special Issue : 26, June-2021
Monthly, Peer-Reviewed, Refereed, Indexed Journal with IC Value: 86.87 Impact Factor: 6.719 Publication Date: 30/06/2021
Available online on - www.ijirmf.com Page 65
surrounding the individual influences his/her entrepreneurial actions and subsequent outcomes, showing that environmental change can give rise to increased entrepreneurial activity (Develi et al, 2011; Edelman & Yli–Renko, 2010). Environmental conditions can strengthen or weaken a person’s entrepreneurial intentions (Ibrahim & Mas’ud, 2016). A broad framework has been used in this study to assess the antecedents of entrepreneurial intentions which is a combination of both cognitive and discovery approaches (Kristiansen and Indarti, 2004; Schwarz et al, 2009; Sesen, 2013; Gieure et al, 2019). This study utilizes the TPB to study the cognitive processes of the target sample and the environment aspects refer to the perceptions of the students towards the institutional support offered by HEIs towards entrepreneurship. As the participants in the study are students, the external environment here refers to the institutional support provided by the HEIs. Previous studies have shown that the institutional support has no significant role on the entrepreneurial intentions (Sesen, 2013) but Kristiansen & Indarti (2004) have reported a significant impact on the intentions. Students who perceive positive entrepreneurship-related support from the institution are more likely to have stronger entrepreneurial intentions (Schwarz et al, 2009). Hence, this study posits that H4: Institutional support impacts the entrepreneurial intentions of Indian engineering students Recent studies on university students have reported that institutional support factors have an indirect role on the entrepreneurial intentions though mediation of the relationship between the entrepreneurial intentions and its factors (Qazi et al, 2020). Hence this paper posits that H5: Institutional support moderates the relationship between entrepreneurial intentions and the
three TPB elements –entrepreneurial attitude, subjective norms and perceived behaviour control A positive change in the strength of the entrepreneurial intentions can occur if there is a change in attitude towards entrepreneurship. If the individual views setting up own business favourably, he/she can display strong entrepreneurial intentions which can subsequently increase the chances of embarking on venture creation (Ajzen, 1991). It is advantageous for HEIs to adopt such strategies that can change the attitudes of students favourably towards entrepreneurship. But it is not easy to change attitudes, especially when they are firmly entrenched (Krosnick & Petty, 1995). Instead, strategies that target the perceived behaviour control of students towards entrepreneurship can be adopted to yield better and visible results. When HEIs provide an atmosphere that helps develop confidence in own abilities and skills to set up and execute projects, the students’ self-evaluation of their competencies can become more positive (Segal et al, 2005). Hence, this paper posits that H6: Perceived behaviour control mediates the relationship between entrepreneurial intentions
and Institutional support
METHODOLOGY:
Research sample Study was conducted on final year engineering college students belonging to seven different science and technology institutes in and around Hyderabad, Telangana. All these institutes were affiliated to Jawaharlal Nehru Technological University Hyderabad (JNTUH). Students pursuing bachelor course in engineering with specializations like computer science, electrical engineering and electronics, mechanical and information technology were the participants. A total of 900 questionnaires were administered to the students after obtaining the consent of the individual and the concerned institutional head. 390 questionnaires were collected from the students (recovery rate of 43.3%). After coding and filling the gaps by average method, 12 questionnaires were rejected, and 378 questionnaires (240 male and 138 female) were taken up for analysis. Research Instrument The questionnaire administered to the student elicited details like age, gender, and the course currently being pursued. The variables to be included in the questionnaire as per the objectives of the study were tested using a 4-point Likert scale, ranging from “strongly disagree” to “strongly agree”.
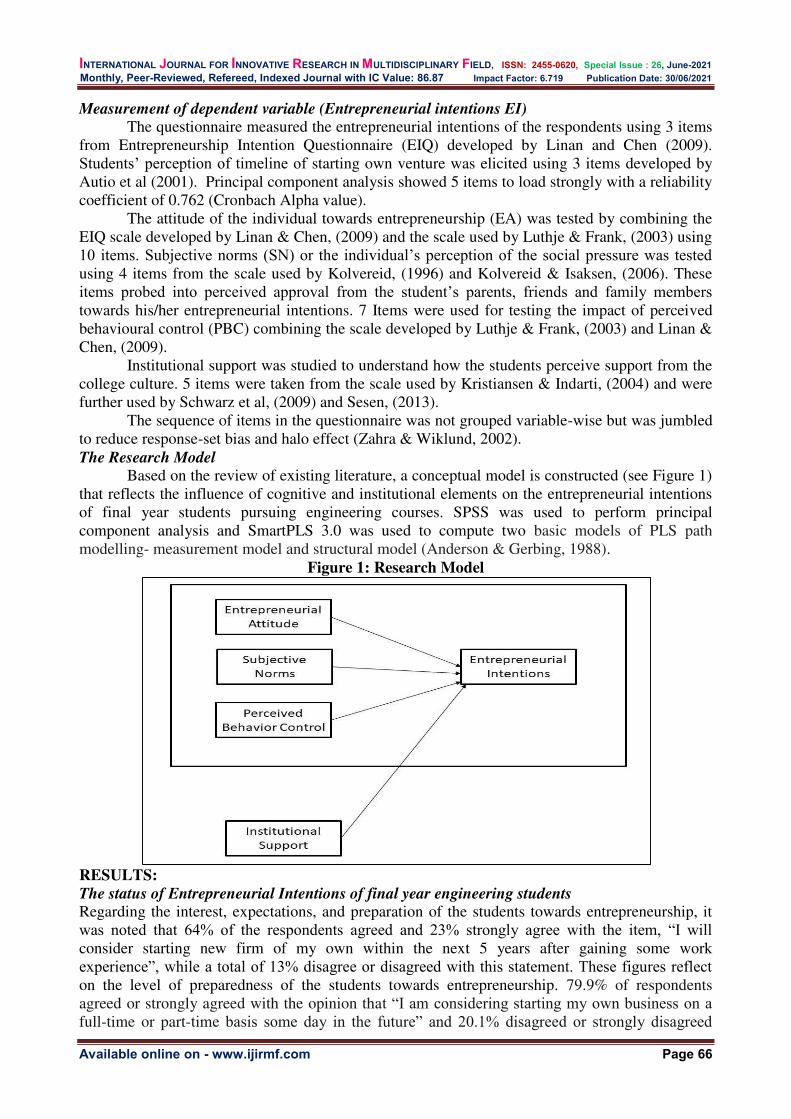
INTERNATIONAL JOURNAL FOR INNOVATIVE RESEARCH IN MULTIDISCIPLINARY FIELD, ISSN: 2455-0620, Special Issue : 26, June-2021
Monthly, Peer-Reviewed, Refereed, Indexed Journal with IC Value: 86.87 Impact Factor: 6.719 Publication Date: 30/06/2021
Available online on - www.ijirmf.com Page 66
Measurement of dependent variable (Entrepreneurial intentions EI) The questionnaire measured the entrepreneurial intentions of the respondents using 3 items
from Entrepreneurship Intention Questionnaire (EIQ) developed by Linan and Chen (2009). Students’ perception of timeline of starting own venture was elicited using 3 items developed by Autio et al (2001). Principal component analysis showed 5 items to load strongly with a reliability coefficient of 0.762 (Cronbach Alpha value).
The attitude of the individual towards entrepreneurship (EA) was tested by combining the EIQ scale developed by Linan & Chen, (2009) and the scale used by Luthje & Frank, (2003) using 10 items. Subjective norms (SN) or the individual’s perception of the social pressure was tested using 4 items from the scale used by Kolvereid, (1996) and Kolvereid & Isaksen, (2006). These items probed into perceived approval from the student’s parents, friends and family members towards his/her entrepreneurial intentions. 7 Items were used for testing the impact of perceived behavioural control (PBC) combining the scale developed by Luthje & Frank, (2003) and Linan & Chen, (2009).
Institutional support was studied to understand how the students perceive support from the college culture. 5 items were taken from the scale used by Kristiansen & Indarti, (2004) and were further used by Schwarz et al, (2009) and Sesen, (2013).
The sequence of items in the questionnaire was not grouped variable-wise but was jumbled to reduce response-set bias and halo effect (Zahra & Wiklund, 2002). The Research Model
Based on the review of existing literature, a conceptual model is constructed (see Figure 1) that reflects the influence of cognitive and institutional elements on the entrepreneurial intentions of final year students pursuing engineering courses. SPSS was used to perform principal component analysis and SmartPLS 3.0 was used to compute two basic models of PLS path modelling- measurement model and structural model (Anderson & Gerbing, 1988).
Figure 1: Research Model
RESULTS:
The status of Entrepreneurial Intentions of final year engineering students Regarding the interest, expectations, and preparation of the students towards entrepreneurship, it was noted that 64% of the respondents agreed and 23% strongly agree with the item, “I will consider starting new firm of my own within the next 5 years after gaining some work experience”, while a total of 13% disagree or disagreed with this statement. These figures reflect on the level of preparedness of the students towards entrepreneurship. 79.9% of respondents agreed or strongly agreed with the opinion that “I am considering starting my own business on a full-time or part-time basis some day in the future” and 20.1% disagreed or strongly disagreed

INTERNATIONAL JOURNAL FOR INNOVATIVE RESEARCH IN MULTIDISCIPLINARY FIELD, ISSN: 2455-0620, Special Issue : 26, June-2021
Monthly, Peer-Reviewed, Refereed, Indexed Journal with IC Value: 86.87 Impact Factor: 6.719 Publication Date: 30/06/2021
Available online on - www.ijirmf.com Page 67
with this statement. This shows that the intention to start own business involves both long-term and short-term planning and there is a strong inclination to plan for future engagements while still studying (Autio et al, 2001). While 45.5% showed some disagreement for “I'm ready to do anything to be an entrepreneur”, 54.5% showed agreement. This indicates that the students have strong expectations for entrepreneurship.
It was observed that 64.8% of the respondents agree or strongly agree and 35.2% disagree or strongly disagree with the statement “I have seriously thought about starting a firm”. While 78.8% feel that “I have the firm intention to start a firm someday”, only 21.2% have disagreed with this statement. These two results indicate strong entrepreneurial intentions of students. Overall, the results indicate that the final year students pursuing engineering courses in Hyderabad, Telangana, have strong entrepreneurial intentions.
Measurement model results
The relationship between the entrepreneurial intentions (EI) and the entrepreneurial attitude (EA), subjective norms (SN), perceived behaviour control (PBC) and Institutional Support (IS) was studied using structural equation modelling and the conceptual model was also tested using the same. A confirmatory factor analysis (CFA) was carried out to confirm the reliability of the items, convergent and discriminant validity. Table 1a shows the items loadings are above the critical threshold of ≥.50 as suggested by (Bagozzi, Yi, & Phillips, 1991; Gefen & Straub, 2000). The internal consistency reliability was also achieved as the composite reliability values were more than the required cut-off value of ≥ .70 (Bagozzi et al., 1991; Chin, 1998; Hair et al., 2006). Additionally, the convergent validity was also achieved as average variance extracted (AVE) met the minimum criteria of ≥ .5, (its values range between 0.563 to 0.653 (Fornell & Larcker, 1981; Henseler et al., 2009).
Table 1a: Item loadings, internal consistency, and Average Variance Extracted Constructs Indicators Loadings CR AVE
Entrepreneurial
intentions (EI)
I have seriously thought about starting a firm
.889 0.845 0.525
I have the firm intention to start a firm some day
.879
I am considering starting my own business on a full-time or part-time basis some day in the future
.854
I will consider starting new firm of my own within the next 5 years after gaining some work experience
.756
I'm ready to do anything to be an entrepreneur
.702
Entrepreneurial
Attitude (EA)
To me, being an entrepreneur means more advantages than disadvantages
.806 0.843 0.542
I’d rather found a new company than be the manager of an existing one
.772
You can only make big money if you are self-employed
.744
To me, being an entrepreneur means more advantages than disadvantages
.742
I relish the challenge of creating a new business
.685
A career as an entrepreneur is very attractive to me
.655
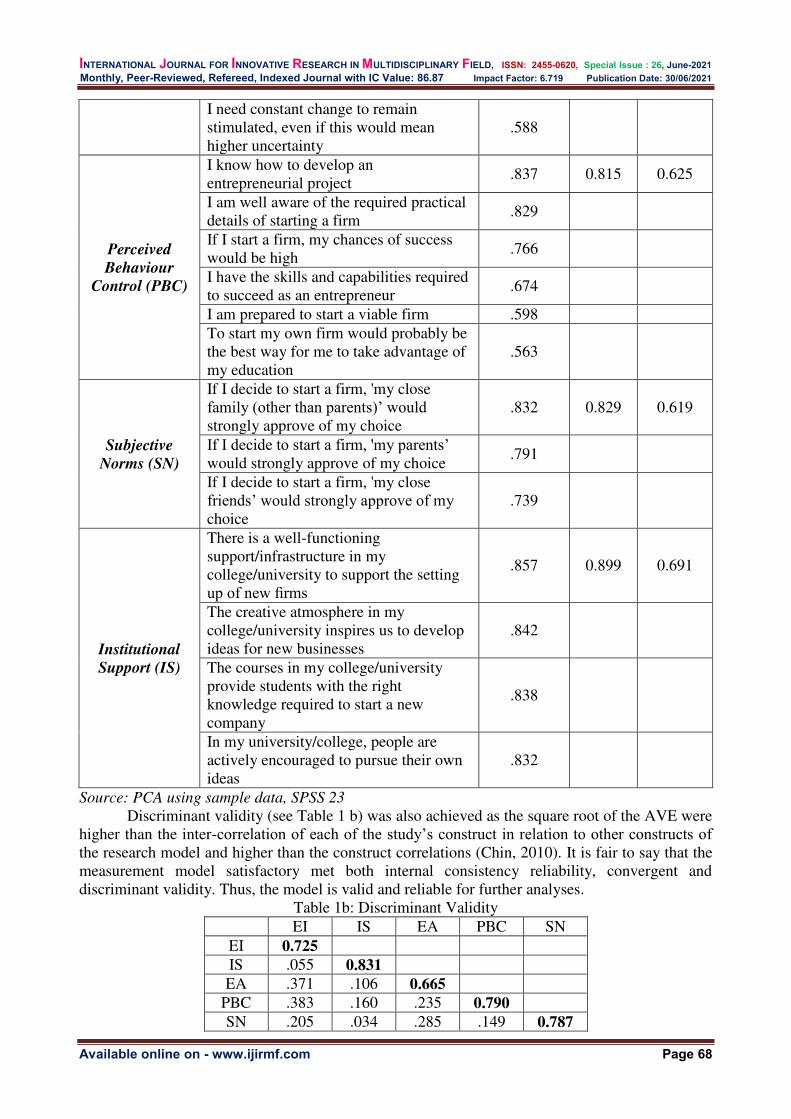
INTERNATIONAL JOURNAL FOR INNOVATIVE RESEARCH IN MULTIDISCIPLINARY FIELD, ISSN: 2455-0620, Special Issue : 26, June-2021
Monthly, Peer-Reviewed, Refereed, Indexed Journal with IC Value: 86.87 Impact Factor: 6.719 Publication Date: 30/06/2021
Available online on - www.ijirmf.com Page 68
I need constant change to remain stimulated, even if this would mean higher uncertainty
.588
Perceived
Behaviour
Control (PBC)
I know how to develop an entrepreneurial project
.837 0.815 0.625
I am well aware of the required practical details of starting a firm
.829
If I start a firm, my chances of success would be high
.766
I have the skills and capabilities required to succeed as an entrepreneur
.674
I am prepared to start a viable firm .598 To start my own firm would probably be the best way for me to take advantage of my education
.563
Subjective
Norms (SN)
If I decide to start a firm, 'my close family (other than parents)’ would strongly approve of my choice
.832 0.829 0.619
If I decide to start a firm, 'my parents’ would strongly approve of my choice
.791
If I decide to start a firm, 'my close friends’ would strongly approve of my choice
.739
Institutional
Support (IS)
There is a well-functioning support/infrastructure in my college/university to support the setting up of new firms
.857 0.899 0.691
The creative atmosphere in my college/university inspires us to develop ideas for new businesses
.842
The courses in my college/university provide students with the right knowledge required to start a new company
.838
In my university/college, people are actively encouraged to pursue their own ideas
.832
Source: PCA using sample data, SPSS 23
Discriminant validity (see Table 1 b) was also achieved as the square root of the AVE were higher than the inter-correlation of each of the study’s construct in relation to other constructs of the research model and higher than the construct correlations (Chin, 2010). It is fair to say that the measurement model satisfactory met both internal consistency reliability, convergent and discriminant validity. Thus, the model is valid and reliable for further analyses.
Table 1b: Discriminant Validity EI IS EA PBC SN
EI 0.725 IS .055 0.831 EA .371 .106 0.665
PBC .383 .160 .235 0.790 SN .205 .034 .285 .149 0.787

INTERNATIONAL JOURNAL FOR INNOVATIVE RESEARCH IN MULTIDISCIPLINARY FIELD, ISSN: 2455-0620, Special Issue : 26, June-2021
Monthly, Peer-Reviewed, Refereed, Indexed Journal with IC Value: 86.87 Impact Factor: 6.719 Publication Date: 30/06/2021
Available online on - www.ijirmf.com Page 69
Further, mediation and bootstrapping were undertaken to reveal the direct and indirect effects of the model. Bootstrapping using 2000-stong subsample was performed to study 4 direct effects (EA->EI, SN->EI, PBC->EI and IS->EI). Mediation was performed to study the effect of external environment in mediating the relationships between the dependent variable and the other independent variables. Mediation also helps to reveal if the relationship between IS and EI was impacted by mediation of other variables. Hence 4 indirect effects (IS*EA->EI, IS*SN->, IS*PBC->EI and PBC*IS->EI) were studied using mediation. Evaluation of the structural model revealed the following results:
Table 2: Path coefficients for Hypothesis Testing
Hypothesis Beta Standard error T-stat p-value Result
H1 EA->EI 0.4243 0.0912 4.6522 <0.0001*** Accepted
H2 SN->EI 0.0084 0.1064 0.4472 0.3273 Rejected
H3 PBC->EI 0.3027 0.097 3.1194 0.0009*** Accepted
H4 IS->EI 0.0476 0.1064 0.0869 0.4653 Rejected
H5 IS*EA->EI 0.0922 0.4024 0.2292 0.409 Rejected
IS*SN->EI 0.3541 0.3849 0.92 0.1787 Rejected
IS*PBC->EI
0.4383 0.5266 0.8322 0.202 Rejected
H6 PBC*IS->EI
0.0509 0.0885 2.7 0.0034 Accepted
***p<0.01 CONCLUSIONS AND DISCUSSION:
The study examines the relationship between the entrepreneurial intentions, attitude towards entrepreneurship, subjective norms, perceived behaviour control and institutional support. The study plays special focus on the role played by institutional support as the academic environment is the most important external environment for the students.
The results indicate that the budding engineers of Hyderabad, Telangana display a strong intention for entrepreneurship. The findings also revealed that entrepreneurial attitude and perceived behaviour control are positively related to the entrepreneurial intentions. However, the mediating effect of institutional support on the relationship between the entrepreneurial intentions and the three TPB elements has not been established in the study. Thus, the study recommends the exploration of the impact of the institutional support on the elements making up the entrepreneurial intentions. It is evident from the study that attitude and perceived control are key to impacting the entrepreneurial intentions and the institutional support aspect can impact the intentions by indirectly influencing attitude and control elements of intentions. The study thus has significant implications for the HEIs regarding planning and implementation of entrepreneurship development activities for the students. The study shows that institutional support nurtures the entrepreneurial intentions through the attitude formation and perception of control in the students. The linkages between institutional support and the elements of intention must be taken into consideration by the HEIs for nurturing and creating future entrepreneurs. The entrepreneurship development programs undertaken by HEIs must target building of attitude towards entrepreneurship in the students. Skill building programs can help in heightening the sense of control in the students thus eventually leading to strong entrepreneurial intentions.
Acknowledgements
The author acknowledges the cooperation extended by the heads of all science and technology institutes who permitted the study to be conducted on the students.

INTERNATIONAL JOURNAL FOR INNOVATIVE RESEARCH IN MULTIDISCIPLINARY FIELD, ISSN: 2455-0620, Special Issue : 26, June-2021
Monthly, Peer-Reviewed, Refereed, Indexed Journal with IC Value: 86.87 Impact Factor: 6.719 Publication Date: 30/06/2021
Available online on - www.ijirmf.com Page 70
REFERENCES: 1. Ajzen, I. (1991). The Theory of Planned Behavior. Organizational Behavior and Human
Decision Processes 50, (1991), 179-211. 2. Al-Shammari, M. and Waleed, R. (2018), "Entrepreneurial intentions of private university
students in the kingdom of Bahrain", International Journal of Innovation Science, Vol. 10 No. 1, pp. 43-57
3. Autio, E., H. Keeley, R., Klofsten, M., GC Parker, G., & Hay, M. (2001). Entrepreneurial intent among students in Scandinavia and in the USA. Enterprise and Innovation Management
Studies, 2(2), 145-160. 4. Develi, E. I., Sahin, B. E., & Sevimli, Y. (2011). Entrepreneurship and importance of personality
on entrepreneurship: a research on trainees of entrepreneurship education program. International
Journal of Business and Management Studies, 3(1), 115-124. 5. Edelman, L., & Yli–Renko, H. (2010). The impact of environment and entrepreneurial
perceptions on venture-creation efforts: Bridging the discovery and creation views of entrepreneurship. Entrepreneurship Theory and Practice, Volume: 34 issue: 5, page(s): 833-856
6. Gieure, C., del Mar Benavides-Espinosa, M., & Roig-Dobón, S. (2019). Entrepreneurial intentions in an international university environment. International journal of Entrepreneurial
Behavior & research, Vol. 25 No. 8, pp. 1605-1620. 7. Guerrero, M., Rialp, J., & Urbano, D. (2008). The impact of desirability and feasibility on
entrepreneurial intentions: A structural equation model. International Entrepreneurship and
Management Journal, 4(1), 35-50. 8. Hair, J. F., Ringle, C. M., & Sarstedt, M. (2011). PLS-SEM: Indeed a silver bullet. Journal of
Marketing theory and Practice, 19(2), 139-152. 9. Hair, J. F., Ringle, C. M., & Sarstedt, M. (2013). Partial least squares structural equation
modeling: Rigorous applications, better results and higher acceptance. Long range
planning, 46(1-2), 1-12. 10. Ibrahim, N., & Mas’ud, A. (2016). Moderating role of entrepreneurial orientation on the
relationship between entrepreneurial skills, environmental factors and entrepreneurial intention: A PLS approach. Management Science Letters, 6(3), 225-236.
11. Kao, R. W. (1993). Defining entrepreneurship: past, present and?. Creativity and innovation
management, 2(1), 69-70. 12. Kessler, A., Korunka, C., Frank, H., & Lueger, M. (2012). Predicting founding success and new
venture survival: A longitudinal nascent entrepreneurship approach. Journal of Enterprising
Culture, 20(01), 25-55. 13. Khalid, S. (2018). Assessing the relevance of culture in TPB entrepreneurial intention model: A
comparative study in Japan and Pakistan. Journal of Asia Entrepreneurship and
Sustainability, 14(1), 140-172. 14. Kolvereid, L., & Isaksen, E. (2006). New business start-up and subsequent entry into self-
employment. Journal of Business Venturing, 21(6), 866-885 15. Kolvereid, Lars, (1996), Organizational employment versus self-employment: reasons for career
choice intentions. Entrepreneurship: Theory and Practice, Spring 1996, p. 23+. Academic
OneFile, Accessed 21 Feb. 2017. 16. Kristiansen, S., & Indarti, N. (2004). Entrepreneurial intention among Indonesian and
Norwegian students. Journal of Enterprising Culture, 12(01), 55-78. 17. Kroon, J., & Meyer, S. (2001). The role of entrepreneurship education in career expectations of
students. South African Journal of Higher Education, 15(1), 47-53. 18. Krosnick, J. A., & Petty, R. E. (1995). Attitude strength: An overview. Attitude strength:
Antecedents and consequences, 1, 1-24. 19. Linan, F. (2008). Skill and value perceptions: how do they affect
entrepreneurial intentions?. International Entrepreneurship and Management Journal, 4(3), 257-272.

INTERNATIONAL JOURNAL FOR INNOVATIVE RESEARCH IN MULTIDISCIPLINARY FIELD, ISSN: 2455-0620, Special Issue : 26, June-2021
Monthly, Peer-Reviewed, Refereed, Indexed Journal with IC Value: 86.87 Impact Factor: 6.719 Publication Date: 30/06/2021
Available online on - www.ijirmf.com Page 71
20. Liñán, F., & Chen, Y. W. (2009). Development and cross–cultural application of a specific instrument to measure entrepreneurial intentions. Entrepreneurship theory and practice, 33(3), 593-617
21. Liñán, F., Urbano, D., Guerrero, M. (2011). Regional variations in entrepreneurial cognitions: Start-up inten-tions of university students in Spain. Entrepreneurship and Regional Development, 23(3–4), 187–215.
22. Lüthje, C., & Franke, N. (2003). The ‘making’of an entrepreneur: testing a model of entrepreneurial intent among engineering students at MIT. R&d Management, 33(2), 135-147.
23. Montaño, D. E., & Kasprzyk, D. (2015). Theory of reasoned action, theory of planned behavior, and the integrated behavioral model. Health behavior: Theory, research and practice, 70(4), 231.
24. Munir, H., Jianfeng, C. and Ramzan, S. (2019), "Personality traits and theory of planned behavior comparison of entrepreneurial intentions between an emerging economy and a developing country", International Journal of Entrepreneurial Behavior & Research, Vol. 25 No. 3, pp. 554-580.
25. Pruett, M., Shinnar, R., Toney, B., Llopis, F., & Fox, J. (2009). Explaining entrepreneurial intentions of university students: a cross-cultural study. International Journal of Entrepreneurial Behavior & Research, 15, 571-594
26. Purusottama, A. (2019). Revisiting students’entrepreneurial intention in indonesia: a theory of planned behavior approach. Jurnal Manajemen dan Kewirausahaan (Journal of Management
and Entrepreneurship), 21(1), 64-73. 27. Sahoo, S. and Panda, R.K. (2019), "Exploring entrepreneurial orientation and intentions among
technical university students: Role of contextual antecedents", Education + Training, Vol. 61 No. 6, pp. 718-736.
28. Schwarz, E. J., Wdowiak, M. A., Almer-Jarz, D. A., & Breitenecker, R. J. (2009). The effects of attitudes and perceived environment conditions on students' entrepreneurial intent: An Austrian perspective. Education+ Training, 51(4), 272-291.
29. Sesen, H. (2013). Personality or environment? A comprehensive study on the entrepreneurial intentions of university students. Education+ Training, 55(7), 624-640
30. Sesen, H. (2013). Personality or environment? A comprehensive study on the entrepreneurial intentions of university students. Education+ Training, 55(7), 624-640
31. Srivastava, S. and Misra, R. (2017), "Exploring antecedents of entrepreneurial intentions of young women in India: A multi-method analysis", Journal of Entrepreneurship in Emerging
Economies, Vol. 9 No. 2, pp. 181-206. 32. Staniewski, M. W., & Szopinski, T. (2013). Influence of socioeconomic factors on the
entrepreneurship of Polish students. Transformations in Business and Economics, 12(3), 30. 33. Tan, W. L., Long, W. A., & Robinson, P. (1996). Entrepreneurship attitude orientation and the
intention to start a business. Journal of Small Business & Entrepreneurship, 13(4), 50-61. 34. Tkachev, A., & Kolvereid, L. (1999). Self-employment intentions among Russian
students. Entrepreneurship & Regional Development, 11(3), 269-280. 35. Valencia-Arias, A., & Restrepo, L. A. M. (2020). Entrepreneurial Intentions among Engineering
Students: Applying a Theory of Planned Behavior Perspective. Periodica Polytechnica Social
and Management Sciences, 28(1), 59-69. 36. Vamvaka, V., Stoforos, C., Palaskas, T., & Botsaris, C. (2020). Attitude toward
entrepreneurship, perceived behavioral control, and entrepreneurial intention: dimensionality, structural relationships, and gender differences. Journal of Innovation and
Entrepreneurship, 9(1), 5. 37. Van Gelderen, M., Brand, M., Van Praag, M., Bodewes, W., Poutsma, E., & Van Gils, A.
(2008). Explaining entrepreneurial intentions by means of the theory of planned behaviour. Career development international, Vol. 13 No. 6, pp. 538-559.

INTERNATIONAL JOURNAL FOR INNOVATIVE RESEARCH IN MULTIDISCIPLINARY FIELD, ISSN: 2455-0620, Special Issue : 26, June-2021
Monthly, Peer-Reviewed, Refereed, Indexed Journal with IC Value: 86.87 Impact Factor: 6.719 Publication Date: 30/06/2021
Available online on - www.ijirmf.com Page 72
International Conference on
Business, Management, Social and Economical Advancements 26 & 27 June, 2021 Bangkok, Thailand
Jointly organized by: Management Institute, Warsaw University of Life Science - SGGW, Warszawa, Poland,
‘Research Culture Society’ and ‘Scientific Research Association’.
Correlation study on institutional information and functioning about
Quality Management of Colleges of Education in Karnataka
Dr.DIVAKARA NAIK K. S.
Principal, Nutana College of Education. Email - [email protected]
Abstract: Education of teachers not only to make easier becoming better of school education by
deserving, to set a part for a holy purpose & impartial teachers who can also fill up the gap
between schooling and higher education. The ideal image or role of teacher education as a process
of nation building is universally to know truth. Teacher serve education is an effective instrument of
man making. Enlightened and empowered teachers lead Indian societies and nations in their march
towards better and higher quality of life. Therefore, preparation of competent and dedicated
teachers on whom the entire edifice of education is constructed, is an extremely important task for
nation building. Teacher education occupies a central position in the whole educational system. In
recent year with the rapid expansion of teacher education institutions the quality of teacher
education has been challenged. For the solution of this challenge total quality management has
been needed. The motif force underlying the philosophy of total quality management is to lay stress
in twin principles ‘continuous improvement’ and ‘involvement’ of all member in the management of an institution. It implies a marked shift in emphasis in quality management from ‘product’ to ‘people’ and from ‘quantitative’ to ‘qualitative’ terms of reference. The present research falls
under the purview of quantitative research and hence quantitative methods, such as data collection,
analysis, comparison, tabulation and illustration, are used. Among 48 randomly selected colleges
of education, I received replies from 19 colleges of education only, and the same data are taken for
granted for analysis.
Key Words: Quality management, Teacher education institutions.
INTERDUCTION:
Teacher education is a global profession that needs to be understood properly. It is essential to grasp a global perspective of the profession as it is today, to make assumptions about it in the near future and to utilize the best thinking and instructional models available in the present times. Professionally powerful teaching is very important and increasing in our contemporary society as a result of the steam of dynamic initiatives of human development and evolution. Due to these developments and evolution, standards of learning would be higher in the 21st century than it has been in the 20th century. As a result, teachers would need to acquire additional knowledge and skills, both general and specific, to be able to survive and be successful in the 21st century school environment. Now a days the field of education is not only limited with books but has broadened in various new horizons. Development and changes in education have affected teacher education necessitating review and reforms. Teacher education is a program related with teacher proficiency and competence that would make them competent enough to face new challenges in the education. It is a deliberate enterprise aiming to provide good quality service to its customers in order to enable them to contribute significantly for development of the nation. This quality service is essential in the modern context of globalization. Applied to the field of Teacher Education, quality

INTERNATIONAL JOURNAL FOR INNOVATIVE RESEARCH IN MULTIDISCIPLINARY FIELD, ISSN: 2455-0620, Special Issue : 26, June-2021
Monthly, Peer-Reviewed, Refereed, Indexed Journal with IC Value: 86.87 Impact Factor: 6.719 Publication Date: 30/06/2021
Available online on - www.ijirmf.com Page 73
refers to the totality of features and characteristics of the student teacher acquired as a result of the teacher education programme. If the expectations of the schools, students, parents and the society are met, this indicates that the right type of teachers have been prepared by the teacher education institutions. And if the teachers continue to improve themselves, then there is value addition in education. Such teachers will continue to meet the needs of the society. For quality assurance of teacher education institutions, the NAAC and the NCTE have entered into a memorandum of understanding (MOU) for executing the process of assessment and accreditations of all teacher education institutions coming under the provision of the NCTE. Instead we should consider those indicators, which are applicable to a variety of situations sensitive to the specific needs and functions of teacher education. Hence, there should be flexibility in approaches and methodology for assessment of teacher education institutions.
CONCEPT OF QUALITY:
The dictionary meaning of quality is- “the degree of excellence”. According to Bennis (1993)-“Quality often is not measured at all, but is appreciated intuitively. One‘s response to quality is a feeling, a perception that is connected intimately with our experience of meaning, beauty and values in our lives.” According to Jan D. Timmer - “quality is a state of mind…the relentless pursuit of excellence, of never being satisfied with what you do, how you do it and how quickly you do it. There is always room for improvement. Everything can always be done better. Quality should be a part of our soul”. Quality is contextual. It is very difficult to give a comprehensive definition of quality. It is the totality of features and characteristics of the product, process or service that bear on its ability to satisfy stated or implied needs. In the educational context, quality is seen as a complex issue as education is concerned with human being. When we describe human being as a product, the description cannot encapsulate all the characteristics of teachers or learners in the same way, as one would describe the quality of commodities. Hence, the definition of quality varies depending upon the individual, institution and educational situation, social and national context.
QUALITY CONTROL INDICATORS IN TEACHER EDUCATION:
In the field of teacher education, the major quality indicators namely- curriculum design; curriculum transaction; evaluation system; research and development; infrastructure and learning resources; student support and progression; organization and management etc. have been identified by researchers. Special emphasis is also given on internship program, though it is considered under the broad category of curriculum. Few among these indicators are explained in details in the following sections. Curriculum Design: Curriculum in teacher education consists of two major components –
theory and the practicum. Though teacher education is mostly a skill based program but conceptual understanding of those skill oriented activities might be a major concern of a teacher ( teacher trainee). Therefore theory and practicum should have a justified proportion in the curriculum historical, Philosophical, Psychological, and Sociological aspects of education are four essential theoretical components. In addition, various contemporary issues and challenges emerging in the field of modern education should also be included there (Carr and Kemmis, 1986).
Curriculum Transaction: Not only curricular development, major emphasis should also be given on effective transaction of curriculum in teacher education program. Presently, responsibility of the curriculum transaction is laid on the teacher educators who by and large use lecture method for this purpose.
Evaluation: Evaluation of student teachers at this stage need to be comprehensive and continuous (Ahmand, 2008). Due importance should be given to the opinions of supervisors and school teachers who will maintain the record of the progress of student teachers. The capacity to organize thoughts and express them coherently, taking notes from
INTERNATIONAL JOURNAL FOR INNOVATIVE RESEARCH IN MULTIDISCIPLINARY FIELD, ISSN: 2455-0620, Special Issue : 26, June-2021
Monthly, Peer-Reviewed, Refereed, Indexed Journal with IC Value: 86.87 Impact Factor: 6.719 Publication Date: 30/06/2021
Available online on - www.ijirmf.com Page 74
reading materials and using teaching aids and ICT carefully at the appropriate moment need to be the major concerns of evaluation.
Research in teacher education: During the last five decades a large number of researches, surveys, etc. have been conducted in teacher education. Characteristics of effective teaching, curriculum evaluation, organizational climate and its impact on teachers’ performance, the criterion for admission of prospective teachers and administration of education/teacher education have found to catch the attention of researchers. But planned and purposive approach has been found to be neglected. In a few universities only, teacher educators conducting/ supervising researchers in various areas of education/teacher education are found.
Internship: Internship program is the core component of teacher education. There are wide variations in this program from institutions to institution. Not only that, there is a common practice to consider this program in the form of mere teaching practical by delivering lectures only on the method subjects. Exhaustive rating of practice teaching lessons (involving the essential skills) should be encouraged employing standardized tools and techniques.
OBJECTIVES OF STUDY:
To assess the differences between four divisions (Bangalore, Belagavi, Gulbarga and Mysuru) with respect to institutional information about total quality management and functioning about quality management scores of colleges of education in Karnataka
HYPOTHESIS OF THE STUDY:
Null Hypothesis: There is no correlation between institutional information and functioning scores about quality management of colleges of education in Karnataka
METHODOLOGY OF THE STUDY:
For the present study, survey and correlation method was used as research method for collecting information. SAMPLE: In the present study, the sample was selected from all the 49 assessed and
accredited colleges of teacher education in Karnataka state. For this purpose the 19 colleges of education were selected randomly from four divisions of Karnataka. All the selected colleges were recognized by NAAC and NCTE.
TOOLS USED TO COLLECT DATA: total quality management scale was developed by the investigator on various dimensions of quality education of colleges of education. Validity and reliability were established for the scale. The Rating scale was developed to measure the quality management in colleges of education. The Rating scale was framed on the basis of objectives of the study.
STATISTICAL TECHNIQUES USED: The appropriate statistical tools have been used such as simple mean, standard deviation, median, Inter quartile range (IQR), Non-parametric Kruskal Wallis analysis of variance and the Karl Pearson’s correlation coefficient and other relevant statistical tests.
ANALYSIS AND INTERPRETATION:
Null Hypothesis: There is no correlation between institutional information and
functioning scores about total quality management of colleges of education in
Karnataka
To test the above null hypothesis, the Karl Pearson’s product movement correlation coefficient technique has been performed and the results are presented in the table given below.

INTERNATIONAL JOURNAL FOR INNOVATIVE RESEARCH IN MULTIDISCIPLINARY FIELD, ISSN: 2455-0620, Special Issue : 26, June-2021
Monthly, Peer-Reviewed, Refereed, Indexed Journal with IC Value: 86.87 Impact Factor: 6.719 Publication Date: 30/06/2021
Available online on - www.ijirmf.com Page 75
Table 01: Correlation between total institutional information and total functioning scores
about total quality management of colleges of education in Karnataka
Variables Correlation between institutional information and functioning
scores of colleges of education in Karnataka
r-value r²-value t-value p-value
About total quality
management
0.9161 0.8392 9.4204 0.0001*
*p<0.05
From the results of the above table, it can be seen that, a significant and positive relationship was observed between total institutional information and total functioning scores about total quality management of colleges of education in Karnataka (r=0.9161, p<0.05) at 5% level of significance. Therefore, the null hypothesis is rejected and alternative hypothesis is accepted. It means that, there is an increase or decrease in total institutional information scores with increase or decrease in total functioning about total quality management of colleges of education in Karnataka. The relationship between total institutional information and total functioning scores about total quality management of colleges of education in Karnataka is also presented in the following scatter diagram.
Diagram01: Scatter diagram of correlation between total institutional information and total functioning scores about total quality management of colleges of education in Karnataka
FINDINGS AND CONCLUSIONS OF THE STUDY:
A significant and positive relationship was observed between institutional information and functioning scores about total quality management of colleges of education in Karnataka
CONCLUSIONS:
There is an increase or decrease in total institutional information scores with increase or decrease in total functioning about total quality management of colleges of education in Karnataka
REFERENCES:
1. Aggarwal, J. C. (2002). Educational Research an Introduction, 5th Ed., New Delhi, Avichal Publishing Company p.no. 79-91.
2. Mukhopadhyay, K. (2002). Total Quality Management in Education, NIEPA Publication 3. NAAC (2005), Guidelines for Creating of the Internal Quality Assurance Cell (IQAC) in
Accredited Institutions.

INTERNATIONAL JOURNAL FOR INNOVATIVE RESEARCH IN MULTIDISCIPLINARY FIELD, ISSN: 2455-0620, Special Issue : 26, June-2021
Monthly, Peer-Reviewed, Refereed, Indexed Journal with IC Value: 86.87 Impact Factor: 6.719 Publication Date: 30/06/2021
Available online on - www.ijirmf.com Page 76
4. Ahmand, S. (2008). UGC-NET: A Measure to Maintain Quality in Teaching and Research. University News, 46(21), May 19-25
5. Best J. W. & Kahn, J. V.(2003) Research in educational, 9th ed., New Delhi, prentice hall of India Pvt. Ltd p.no.1-23.
6. Kothari C.R. (2012).Research Methodology an Techniques,2nded., Delhi. New Age International Publication. Page no. 179.
7. Laksmi Latha P.(2012)Quality in Higher Education at Par with International
Standards.March50(13),p.16-20.
WEBLIOGRAPHY:
www.naac.gov.in. ncte.gov.in www.nbaind.org https://www.ugc.ac.in/ www.ncate.org www.academia.edu
-----

INTERNATIONAL JOURNAL FOR INNOVATIVE RESEARCH IN MULTIDISCIPLINARY FIELD, ISSN: 2455-0620, Special Issue : 26, June-2021
Monthly, Peer-Reviewed, Refereed, Indexed Journal with IC Value: 86.87 Impact Factor: 6.719 Publication Date: 30/06/2021
Available online on - www.ijirmf.com Page 77
International Conference on
Business, Management, Social and Economical Advancements 26 & 27 June, 2021 Bangkok, Thailand
Jointly organized by: Management Institute, Warsaw University of Life Science - SGGW, Warszawa, Poland,
‘Research Culture Society’ and ‘Scientific Research Association’.
SOCIO ECONOMIC IMPACT OF COVID-19 ON THE
PERFORMING ARTISTS IN KERALA
Dr.Radhika P. C.
Assistant Professor, Department of Commerce Sacred Heart College, Thevara, Kochi-682013
Email: [email protected] / [email protected]
Dr. Bhagyalakshmi P. C.
Associate Professor Department of Management Studies
SNGCE, Kolenchery, Ernakulam-682311 Email: [email protected]
Abstract: The world has been experiencing the COVID-19 pandemic since December 2019 and by
following COVID protocols, social distancing measures, lockdown, vaccination drive etc., the
governments all around the world are trying to control the same. But the first and second wave of
the pandemic hit the nation(India) severely and has had a drastic effect on all the economic
activities of the country. Kerala is a land with a great tradition of performing art forms and these
performing artists are mainly depending on the live performances conducted during festivals
(temple, church etc.), stage shows both national and international, shows conducted in connection
with tourism festivals, shows at tourism centers etc., for their day to day survival. The spread of
pandemic seized all these options and has made it an inactive situation for the last one and half
years and thus it is relevant to understand the socio economic impact of COVID 19 on the
performing artists in Kerala. Among the different performing art forms, Kathakali is considered as
the epitome of all the art forms and “Kathakali is a three-hundred-year-old dance form that
combines major aspects of opera, ballet, masque, and pantomime art forms”(The economic planning report 2020). The present study focuses on the Kathakali artists and has conducted an in
depth telephonic interview with selected Kathakali artists in Kerala. The sample frame consists of
all Kathakali artists under the Kalamandalam, ( a centre for promoting the traditional art forms of
Kerala and also Deemed University). Snowball sampling technique was used to collect data from
25 performing artists. The study result shows that the outbreak of the pandemic had a drastic effect
on the Kathakali performing artists and also explains the socio economic impacts of the same.
Keywords: Kathakali, Performic art forms, socio-economic impacts, COVID 19 pandemic.
INTRODUCTION: The spread of COVID 19 has had a devastating effect on the world economy. This is clear
from the statement issued by “FAO, ILO, IFAD and WHO- The COVID-19 pandemic has led to a
dramatic loss of human life worldwide and presents an unprecedented challenge to public health,
food systems and the world of work. The economic and social disruption caused by the pandemic
is devastating: tens of millions of people are at risk of falling into extreme poverty, while the
INTERNATIONAL JOURNAL FOR INNOVATIVE RESEARCH IN MULTIDISCIPLINARY FIELD, ISSN: 2455-0620, Special Issue : 26, June-2021
Monthly, Peer-Reviewed, Refereed, Indexed Journal with IC Value: 86.87 Impact Factor: 6.719 Publication Date: 30/06/2021
Available online on - www.ijirmf.com Page 78
number of undernourished people, currently estimated at nearly 690 million, could increase by up
to 132 million by the end of the year.”(WHO, Oct 20, 2020). The first wave itself affected the world severely and the people were struggling to come back to normal, but then the world was hit by the second wave. The second wave was more severe than the first in India and it is clear from the words of prime minister of India, Shri.Narendra Modi that “The pandemic has impacted every nation. The economic impact is huge, as well,”. (The newspaper article, Business Standard, May 27, 2021). Due to lockdown and restrictions, many people lost their jobs and this resulted in decrease in income, thus it is bound to have adverse effects on the economy. The different sectors in the economy are badly affected by the spread of disease. Among the different sectors, the present study focuses on the performing artists, especially Kathakali artists in Kerala. Kerala is a land with a great tradition of performing art forms and these performing artists are mainly depending on the live performances conducted during festivals(temple, church etc), stage shows both national and international, shows conducted in connection with tourism festivals, shows at tourism centers etc, for their day to day survival. The spread of pandemic seized all these options and has made it an inactive situation for the last one and half years and thus it is relevant to understand the socio economic impact of COVID 19 on the performing artists in Kerala. Among the different performing art forms, Kathakali is considered as the epitome of all the art forms and “Kathakali is a three-hundred-year-old dance form that combines major aspects of opera, ballet, masque, and pantomime art forms”(The economic planning report 2020). The present study focuses on the Kathakali artists and has conducted an in depth telephonic interview with selected Kathakali artists in Kerala.
OBJECTIVES OF THE STUDY:
To understand the economic impacts of COVID-19 on the Kathakali performing artists in Kerala.
To understand the social impacts of COVID-19 on the Kathakali performing artists in Kerala.
REVIEW OF LITERATURE:
There were a number of studies carried out on the importance of performing art forms, especially their role in tourism development. But only few studies are conducted to analyse the impacts of COVID19. The study of Avantika Matele and Arun Gopalakrishnan(2021) in their study try to understand the working of cultural and art organisations during COVID 19. The study also analysed the effectiveness of measures taken by these organisations in their consumer’s view point. The study explains that even though the organizations are conducting shows at discount rates, lack of proper communication to customers is the major problem. The study suggests that the organisations have to use social media for marketing the shows in order to ensure attendance and to get donations.
G. Nhamo et al.(2020) in their study analysed the impact of COVID-19 on the entertainment sector based on an intensive search on the internet by reviewing websites, blogs, social media updates etc. The study result shows that the entertainment sector has been badly affected by pandemics and resulted in cancellation of stage shows, film festivals, music and dance festivals etc, decrease of share value of entertainment companies, income loss for performing artists etc. The study found that “about 36 major international festivals had been postponed due to
the pandemic and about 24 international festivals had been cancelled altogether.” The study clearly explains the loss occurred in the entertainment sector due to COVID 19 and recommends that there is urgent need for support to take measures to protect artists and employees working in this sector who are affected by the pandemic. The study also recommends that there is a need to institute policies and insurance against loss of revenue. The study also highlights the importance of conducting case studies in each division of the entertainment sector to support better.

INTERNATIONAL JOURNAL FOR INNOVATIVE RESEARCH IN MULTIDISCIPLINARY FIELD, ISSN: 2455-0620, Special Issue : 26, June-2021
Monthly, Peer-Reviewed, Refereed, Indexed Journal with IC Value: 86.87 Impact Factor: 6.719 Publication Date: 30/06/2021
Available online on - www.ijirmf.com Page 79
The characteristics of performing artists and the effect of lockdown 1.0 was examined in the study conducted by Spiro N et.al,(2021) . The study found that performing artists have to go through very difficult situations of “closed venues, canceled work, and the restrictions of social distancing”. Due to the lack of financial support, some of the artists were forced to take other jobs, some relied on online mode. The study collected data from 385 performing artists in the United Kingdom. “The study identified five overarching themes characterizing the effects of Lockdown 1.0: lost or uncertain work and income, including canceled work, financial concerns, and
uncertainties for the future; constraints of lockdown working, including challenges of working at
home, struggles with online work and skill maintenance, and caring responsibilities; loss and
vulnerability, including reduced social connections, lack of support, vulnerability, feelings of loss
and grief, and concern for others; detrimental effects on health and wellbeing, including anxiety,
low or unstable mood, poorer physical health, and lack of motivation; and professional and
personal opportunities, including coping well or living more healthily, more time and less
pressure, new possibilities and activities, enhanced social connections, and new skills”. The study of Aubertin P and Kriellaars D (2021) evaluated the effects of holistic
interventional programs through physical literacy on the wellbeing of circus students. The study used a comparative method where the comparison was made between COVID 19 affected academic year and typical school year. The intervention programs were planned using online platforms by conducting webinars, Zoom meetings etc. The study found that these interventions were useful as it provided “psychological, physical, social, technical, artistic, and creative support”.
The review conducted in the area shows that the pandemic situation severely affected the performing artists and resulted in the cancellation of programmes. The artists were going through very difficult financial situations and some of them were forced to move to other sectors for their livelihood.
METHODOLOGY OF THE STUDY: Among the various art forms of Kerala, the study makes an attempt to explore how the
artists performing Kathakali, which is considered to be the epitome of performing arts, were affected socially and economically due to the Covid-19 pandemic. Kathakali performance is a combination of dance, music, devotion, drama, costumes and make-up, thus it makes it very difficult to organise an online show when compared with other performing art forms. The study was based on the data collected from Kathakali artists who were trained from Kerala Kalamandalam, which is considered to be the premiere public institution in India preserving the artistic heritage of Kerala through rigorous training and performance. After the lockdown 1.0 all the artists were hoping that soon normal situations would come and they would get the opportunity to perform in temple festivals, tourist stage shows etc. But the second wave and subsequent lockdown 2.0 again posed challenges and at this junction the study is relevant. As the state was going through uncertain situations, lockdown and restrictions, it was difficult to move around for data collection. Thus it was decided to conduct an interview through telephone and a sample of 25 Kathakali artists was chosen for the study using snowball sampling. The data collection was done during 1st June to 10th June 2021 during the lockdown2.0. Content analysis was used to generate data and Microsoft Excel Toolpak was used to analyse the data.
Kathakali
The performing arts of Kerala have kept the rich cultural heritage of the state alive. The various art forms occupy a distinct place in its heritage with its visual effects and mind-blowing music. These art forms and the stunning performances by the artists are a treat to the eye, both for the natives as well as for the tourists. There are nearly fifty dance forms performed in Kerala. The popular ones are Kathakali, Mohiniyattam, Theyyam, Koodiyattam, Chakyar Koothu, Ottamthullal & Thiruvathiarakali.

INTERNATIONAL JOURNAL FOR INNOVATIVE RESEARCH IN MULTIDISCIPLINARY FIELD, ISSN: 2455-0620, Special Issue : 26, June-2021
Monthly, Peer-Reviewed, Refereed, Indexed Journal with IC Value: 86.87 Impact Factor: 6.719 Publication Date: 30/06/2021
Available online on - www.ijirmf.com Page 80
Kathakali is the most popular classical dance drama of Kerala which originated over 300 years ago. The name Kathakalī is derived from Katha meaning "story or a conversation, or a traditional tale", and Kalī meaning "performance" or "play". The themes of Kathakalī are based on Natyashastra which is a compendium of dramatic arts. The audience gets to experience something divine with the combination of dance, music, devotion, drama, costumes and make-up. Kathakali performances are based on Indian epics and leave one enthralled at the various intricacies involved in the performance. The Kathakali attire is heavy and colourful with kireetam (headdress), kanchukam (jacket), and a long skirt padded with cushions which is distinctive of this art form. The make-up is of five types – Kathi, Thadi, Pacha, Kari and Munikku. When artists perform on stage, their ‘abhinaya’ or expression along with the ‘nritya’ or dance and ‘geetham’ or song immerse the audience into the story they are enacting.
Kerala Kalamandalam is one of the renowned institutions run by the Government of India, imparting training in various art forms such as Mohaniyattam, Kathakali (two classical dance forms), Panchavadyam, Mridangam, Thullal, Bharathanatyam, Nangyarkoothu , music (vocal and instrumental ), Carnatic music. Kalamandalam follows the ‘Gurukula Sampradaya’ where students stay and learn with their teachers. This classical art form in the genre of a story play is popular in India and abroad. These performing artforms serve as one of the major attractions for tourists. Art and cultural heritage, diverse natural attractions have helped tourism to flourish in Kerala. Kerala’s performing arts plays an important role in attracting tourists to the state. As per the report of Kerala statistics (2019), “Kerala is a leader in India when it comes to the destination
management, tourism promotion as well as tourist arrivals”. International tourists coming to Kerala has been increasing over the recent years and a number of Kathakali performances are arranged for foreign tourists. With the growing popularity of Kathakali, the classical dance drama made its movement from temple to stage. In olden days, Kathakali used to be performed in temple grounds or in open theatres called ‘Kuttampalam’ which was built inside the temple premises. The artists perform in front of ‘Kalivilaku’(huge dance lamp) which lights up the area. The performances happen during the night, which would continue till dawn with breaks in between for the performers and the audience. Nowadays the performances have shortened to two to three hours to suit the requirements of the audience. This art form over the years has impressed the audience with its music, songs and story narration. Kathakali rose to an internationally acclaimed art form and the artists got opportunities to travel to different parts of the world to showcase their talents.
The Covid -19 pandemic has had a significant impact on the performing arts. The cancellation of stage shows, festivals, closure of theatres worldwide and most of the events getting postponed , the entertainment industry especially the performing arts received a hard blow. The physical distancing requirements and closure of the physical venues curtailed not only public performances but also practices and rehearsals. Life during the lockdown wasn’t easy for many Kathakali artistes. Except for a few online performances conducted by a handful of prominent artists, others have no shows and zero interaction with the audience. Live stage performances are an integral part of Kathakali performance. The online performances have its limitations as it restricts the interaction between the audience and artistes. It limits the experiential joy of watching the artists perform with elaborate headdresses, vivid make-up, soulful expressions, mesmerising body movements, portraying the characters of Hindu mythology and Puranas, all toned to the rhythm of classical music. Many performing arts institutions attempted to adapt by offering through digital media but was found to be ineffective. The artists used to have daily performances for domestic and foreign audiences, but Covid-19 has hit the normalcy of life and they have been forced to take up other jobs for their survival. Several Kathakali artistes have been struggling to make their ends meet. The pandemic has adversely affected the dance and drama schools. Not only trainers but the students also find it hard to attend the online classes due to the connectivity issues as most of the students are from rural areas. Hence both the students and trainers are deprived of the mutual benefits of teaching and learning during the Covid days. Conducting online

INTERNATIONAL JOURNAL FOR INNOVATIVE RESEARCH IN MULTIDISCIPLINARY FIELD, ISSN: 2455-0620, Special Issue : 26, June-2021
Monthly, Peer-Reviewed, Refereed, Indexed Journal with IC Value: 86.87 Impact Factor: 6.719 Publication Date: 30/06/2021
Available online on - www.ijirmf.com Page 81
performance is not at all effective in the case of a Kathakali performance, because it needs a combination of magnificent costume & make-up, Kathakali music and drama, which is very difficult to organise in an online platform especially during the lockdown period. So when compared to the other art forms like classical dance , music etc, this sector is badly affected by COVID 19. Thus it is relevant to conduct a study to understand the socio economic impact of COVID 19 on the performing artists.
DISCUSSION OF THE RESULTS : This exploratory study was based on the in depth interview conducted with the 25
Kathakali artists using snowball sampling. The telephonic interviews conducted helped to understand the socio economic impacts of COVID 19 on the life of Kathakali performing artists. Out of the 25 artists, 4 artists were female and 21 were male. The majority of the artists belonged to the age group of 41-50 (10 artists) followed by ‘5 artists’ in 51-60, ‘6 artists’ in 31-40 and ‘4 artists’ above 60. Majority of the respondents (9 artists) have ‘5-10 years’ spent in this art form followed by 8 artists have spent ‘10-15 years’, 5 artists have spent ‘15-20 years’ and 3 artists have more than 20 years experience in this field.
The economic impacts were assessed using 8 questions. The result shows that 25 artists answered ‘yes’ to the question that “The art performance serves as the main source of my income?”. For the question “Have you been doing other jobs along with the art performances?” 20 artists answered ‘no’ and 5 artists answered that they are doing part time jobs along with their Kathakali performances, but their main source of income comes from Kathakali performances. For the question “ Is COVID-19 compelled you to take another job to earn my livelihood?” 22 artists answered ‘yes’ and they said that the spread of COVID 19 affected them very badly and to earn livelihood they joined other jobs like salesperson in supermarkets, taking online classes, part time private jobs etc. Only 3 people said that they are still hoping that the situation will be back to normal and simultaneously they have started to take online classes. For the question “ Whether they are planning to continue other jobs along with art performance because of the fear of uncertain situations that may happen in future (like COVID 19 )”, 20 artists answered ‘yes’. 18 artists said that during the past one half years since March 2020, they have done some (2 to maximum 5) online performances through their Google meet, Facebook, Zoom platform, youtube channel etc and few offline performances. But the income earned is very low. For the question “Do you think taking classes online are effective?”,15 artists said ‘not effective’, and they explained that as Kathakali classes need proper one to one guidance, taking online classes are not at all effective. 10 artists said that even though taking classes online are not fully effective, at this present pandemic situation it is better to take classes online rather than not taking. For the question “Have you come across any unexpected expense. Based on your current financial situation, how would you pay for this expense?”, 5 artists responded that they have availed borrowing from friends and relatives, 10 artists said that they sold their valuables, 6 artists said that they have availed loan facilities from banks and borrowings from friends and relatives and 4 artists responded that they have used money from their savings account . For the question “Have you received or applied for or tried to apply for any income assistance?”, 22 artists answered that they have availed assistance from community/ religious/ cultural organizations or associations.
The study thus assessed the economic impacts of COVID 19 on Kathakali artists and found that all the 25 respondents were badly affected by the spread of COVID 19. The interview clearly shows that during the first lockdown(March-May 2020), they were of the hope that the situation would change soon and they would be able to perform by the next season which starts from Nov2020 to April 2021. But then they realised that it will take time to overcome this difficult situation and now they are really worried about the uncertain situations ahead. During lockdown1.0, the government provided some assistance in the form of moratorium, loans etc, and they were struggling at that time to get through. But the lockdown 2.0 worsened the situation and now they are moved forcefully to take other jobs to earn livelihood. The study shows that artists

INTERNATIONAL JOURNAL FOR INNOVATIVE RESEARCH IN MULTIDISCIPLINARY FIELD, ISSN: 2455-0620, Special Issue : 26, June-2021
Monthly, Peer-Reviewed, Refereed, Indexed Journal with IC Value: 86.87 Impact Factor: 6.719 Publication Date: 30/06/2021
Available online on - www.ijirmf.com Page 82
with more than 20 years of experience(3 artists out of 25) in this field are still completely reliant on Kathakali as of now. All other artists have decided to continue other jobs along with Kathakali performances because of COVID 19 and concerns about the future uncertainty.
The Government of India undertook certain stringent measures to reduce the spread of coronavirus such as, social distancing, ban on social gatherings, closure of malls, theatres and in fact restrictions were imposed on every place where people would gather. Although these restrictions sealed the professional activities of the artists and were affected economically, it was seen that the lockdown days had some positive effects on their social life. The restrictions on domestic and international travel, closure of schools and colleges, closure of places of worship, quarantine or stay at home orders by the government actually slowed down the busy life of artists. Covid-19 spread created a situation where everybody had to be at home either working from home or attending online classes. Even the artists started exploring the possibilities of teaching and performing online. This led to spending quality time with family members and probably getting time to strengthen their social bonds. Humans by nature are social beings and this characteristic is inbred in every individual. People found numerous ways to stay connected with their friends and family through social media. The impact of Covid-19 on the social life of the artists was assessed in the study. The findings reveal that out of a sample of 25 respondents, 10 artists said they often talk with their neighbours a few times a week, 6 respondents said they talk everyday with their neighbours , 4 respondents either few times a month or once in a month. 14 respondents were found to connect with their friends and family everyday by phone, email or by using the internet and 11 respondents a few times a week. 7 respondents were found to have engaged in volunteering for some organisation or association. Responding to the question ‘Have your personal plans been changed or affected by the following types of restrictions?’ 14 respondents said they were affected by the ban on social gatherings and international travel restrictions and rest of the respondents were affected by the closure of places of worship and domestic travel restrictions. The findings of the study on the social life of the respondents show that the lockdown in Kerala has brought some positive social changes among the respondents. The artists who were busy with their performance schedules and teaching schedules actually were losing out on moments of joy to be with their loved ones. Though virtually they found time to connect with their family and friends which was seen to have enhanced their social life.
CONCLUSION :
The present study focuses on the Kathakali artists and has conducted an in depth telephonic interview with selected Kathakali artists in Kerala. The study result shows that the outbreak of the pandemic had a drastic effect on the Kathakali performing artists and also explains the socio economic impacts of the same. The study result shows that the spread of COVID 19 had worsened the economic condition of Kathakali performing artists due to lockdown and restrictions imposed, which resulted in the cancellation of temple festivals, stage shows both domestic and abroad, shows at tourist centers etc. In order to overcome the economic crisis after the lockdown 1.0, they have availed borrowings from friends & relatives, took bank loans and sold their valuables, but the continuation of the pandemic situation compelled them to join for other jobs to earn their livelihood. The study result also shows that now most of the respondents have decided to continue other jobs along with Kathakali performances. The findings of the study on the social life of the respondents show that the lockdown in Kerala has brought some positive social changes among the respondents. The artists who were busy with their performance schedules and teaching schedules actually were losing out on moments of joy to be with their loved ones. Though virtually they found time to connect with their family and friends which was seen to have enhanced their social life.
The result of the study is useful for the government authorities to understand the economic problems faced by the artists. Even though there are few schemes provided by the government to support the artists, the study result shows that these schemes are limited to completely address the

INTERNATIONAL JOURNAL FOR INNOVATIVE RESEARCH IN MULTIDISCIPLINARY FIELD, ISSN: 2455-0620, Special Issue : 26, June-2021
Monthly, Peer-Reviewed, Refereed, Indexed Journal with IC Value: 86.87 Impact Factor: 6.719 Publication Date: 30/06/2021
Available online on - www.ijirmf.com Page 83
economic problems faced by the artists. The study suggests that more schemes have to be designed to support the artists and this can be done with the help of cultural associations, other NGO, residents associations etc, by arranging at least online programs to support them during the COVID time. The restrictions on international travel also contributed to this issue and hope that once these restrictions are over they will surely get programs from the tourism industry. The generalisation of the study is limited because of the small sample size taken. But the study provides a clear picture of the impact of COVID on the Kathakali artists in Kerala. The in depth interview conducted, helped the researchers to understand the problems faced by the artists in detail. This study can be extended among other performing artists in Kerala to understand their problems. Further research can also be undertaken to understand the psychological impacts of COVID 19 on the performing artists.
REFERENCES:
1. Avantika Matele and Arun Gopalakrishnan(2021), Impact of COVID-19 on Arts and Cultural Organizations and Customer Satisfaction with Measures Taken, Journal of student
research, 10( 1), ISSN: 2167-1907, pp 1-11. 2. Aubertin P and Kriellaars D (2021) “Supporting Holistic Wellbeing for Performing Artists
During the COVID-19 Pandemic and Recovery: Study Protocol.” Front. Psychol. 12:577882. doi: 10.3389/fpsyg.2021.577882
3. G. Nhamo et al.(2020), Counting the Cost of COVID-19 on the Global Tourism Industry, “Implications of COVID-19 on Gaming, Leisure and Entertainment Industry”, pp:273-295, https://doi.org/10.1007/978-3-030-56231-1_12
4. “The economic Review report 2020”, Kerala state planning board, The government of Kerala, Jan 2020.
5. The newspaper article, “Economic impact of Covid-19 is huge, world won't be the same:
PM Modi”, Business Standard, May 27, 2021 , https://www.business-standard.com/article/economy-policy/economic-impact-of-covid-19-is-huge-world-won-t-be-the-same-pm-modi-121052601129_1.html.
6. “Report on The Impact of Covid-19 on Different Sectors of Kerala”, Rajiv Gandhi Institute of Development Studies (RGIDS) Thiruvananthapuram https://rgids.in/wp-content/uploads/2020/09/Final-Report-RGIDS.pdf.
7. Spiro N, Perkins R, Kaye S, Tymoszuk U, Mason-Bertrand A, Cossette I, Glasser S and Williamon A (2021) “The Effects of COVID-19 Lockdown 1.0 on Working Patterns, Income, and Wellbeing Among Performing Arts Professionals in the United Kingdom” (April–June 2020). Front. Psychol. 11:594086. doi: 10.3389/fpsyg.2020.594086.
8. Saji JA, Babu BP, Sebastian SR(2020)”Social influence of COVID-19: An observational study on the social impact of post-COVID-19 lockdown on everyday life in Kerala from a community perspective”J Edu Health Promot 2020;9:360
Websites:
● https://www.hindustantimes.com/editorials/the-economic-impact-of-covid19-101620304853918.html.
● https://www.who.int/news/item/13-10-2020-impact-of-covid-19-on-people's-livelihoods-their-health-and-our-food-systems
● www.keralatourism.org

INTERNATIONAL JOURNAL FOR INNOVATIVE RESEARCH IN MULTIDISCIPLINARY FIELD, ISSN: 2455-0620, Special Issue : 26, June-2021
Monthly, Peer-Reviewed, Refereed, Indexed Journal with IC Value: 86.87 Impact Factor: 6.719 Publication Date: 30/06/2021
Available online on - www.ijirmf.com Page 84
International Conference on
Business, Management, Social and Economical Advancements 26 & 27 June, 2021 Bangkok, Thailand
Jointly organized by: Management Institute, Warsaw University of Life Science - SGGW, Warszawa, Poland,
‘Research Culture Society’ and ‘Scientific Research Association’.
College Autonomy in Indian Higher Education System
Shisira Bania
Lecturer in Education Birmaharajpur College, Sambalpur University, Odisha, India
Email :- [email protected]
Abstract: Higher education plays a key role in a nation's education system as it influences a country's
overall growth. Higher education can make an important contribution to build a strong society, end extreme
poverty and boost shared prosperity; it benefits not just the individual but the entire educational system
(World Bank, 2018). There has been a growing demand for freedom and autonomy to higher educational
institutions, for which Government of India has granted college autonomy to government and private
colleges in the country with an objective to guarantee quality in higher education. This paper aim to explore
the concept, development and present status of College Autonomy in Indian Higher Education System by
analysing different research studies, books, reports, policies, programmes and practices of higher education
in India. Attempt has also been made in this study to discuss the challenges faced by Indian Higher
Education System that led to allow college autonomy in higher education institutions. Major objectives of
autonomous colleges have also been discussed. The findings of the study will be helpful to the higher
education personnel, policy makers to know the need, development of autonomous institutions in India, so
that to make decision, necessary regulatory arrangement for quality improvement in higher education
institutions.
Key words: College Autonomy, Concept, Emergence, Present Status, Conferment.
INTRODUCTION:
Higher education institutions bear a higher duty for providing persons with advanced knowledge and skills necessary for positions of responsibility in the public and commercial sectors, which are critical for the overall qualitative development of society. These institutions generate and disseminate new information through research, act as "conduits" for the transfer, adaption, and diffusion of knowledge developed elsewhere in the globe, and provide guidance and counsel to government, business, and civic society (Gupta,2008). They bear specific duties for preparing students for civic, political, and sociocultural tasks on the one hand, and global citizenship on the other (World Bank, 1994).
Higher education can play a vital role in strengthening society, eradicating severe poverty, and increasing shared prosperity. It may help the community by providing information, advanced skills, fundamental competences, and research (Bania, et.al 2021). It enriches the entire educational system, not just the individual. Graduates with higher education are more ecologically sensitive, have better habits, and participate in civic activities at a greater degree. Also increased tax income from greater incomes, healthier children, and smaller family sizes all contribute to stronger nations. In short, higher education institutions train students not just for appropriate and efficient work skills, but also for active participation in their communities and cultures. Higher education graduates had the largest economic returns in the educational system, with an estimated 17 percent rise in wages, compared to 10 percent for elementary and 7 percent for secondary education. The social advantages are also significant. A highly trained workforce constituted of people with a good post-secondary education is required for a country's spirit of innovation and for its long-term prosperity to be healthy (World Bank, 2018).

INTERNATIONAL JOURNAL FOR INNOVATIVE RESEARCH IN MULTIDISCIPLINARY FIELD, ISSN: 2455-0620, Special Issue : 26, June-2021
Monthly, Peer-Reviewed, Refereed, Indexed Journal with IC Value: 86.87 Impact Factor: 6.719 Publication Date: 30/06/2021
Available online on - www.ijirmf.com Page 85
The importance of higher education has been clearly expressed by Indian first Prime Minister Mr. Jawaharlal Nehru in the following words: “A university stands for humanism, for tolerance, for reason, for the adventure of the ideas and for the search of truth. It stands for onward march of human race towards even higher objectives. If the universities discharge their duties adequately, then it well with the nation and the people”. It indicates that higher education occupies a crucial position in education system of a nation as it affects the overall development of a country.
As per the report of the Yashpal Committee (2009) “A higher education institution is considered as a space where new ideas sprout, take root, and grow tall and strong. It is a one-of-a-kind sphere that encompasses the whole world of knowledge”. It is a gathering place for creative minds to come together, engage, and build ideas of new futures. In the search of knowledge, established concepts of truth are questioned. It is intended to be a repository for universal knowledge that is taught, shared, and kept.
Present Status of Higher Education in India:
India has the third largest higher education system in the world, next to United States of America (USA) and China to educate youth in the age group of 18 to 23 years. Currently there are 993 universities, 39931 Colleges and 10725 Stand Alone Institutions with enrollment of more than 3.74 corer students and 14.16 lacs teachers.
According to the All India Survey on Higher Education (AISHE, 2018) 37.4 million of students has enrolled in higher with 19.2 million males and 18.2 million females. Further as per the report 26.3% is the Gross Enrolment Ratio (GER) in higher education in India for the age group 18-23. Further, according to the survey, GER for male is 26.3% and for female is 26.4%. For Scheduled Castes, the figure is 23 % and for Scheduled Tribes, the figure is 17.2 % as compared to the national GER of 26.3 (AISHE Report, 2018-19)].
Table-1 Number and type of Universities in India.
Source:- (AISHE-2019)
Major Challenges Face by Indian Higher Education
Though higher education plays numerous roles in the rapid changing international and local landscape, the higher education institutions are facing alarming challenges and constraints such as excess demand for access to higher education and failure or reluctance of the governments to supply the same, inadequate funding, demands for accountability, weak infrastructure and institutional management, lack of efficient administrative body, weak and inexperienced faculty,

INTERNATIONAL JOURNAL FOR INNOVATIVE RESEARCH IN MULTIDISCIPLINARY FIELD, ISSN: 2455-0620, Special Issue : 26, June-2021
Monthly, Peer-Reviewed, Refereed, Indexed Journal with IC Value: 86.87 Impact Factor: 6.719 Publication Date: 30/06/2021
Available online on - www.ijirmf.com Page 86
overcrowded classrooms, low levels of teacher training programmes, irrelevant curriculum, student unrest, spineless administration, dubious examination etc (Gupta, 2008).
Many recurring difficulties confront higher education, including increasing and promoting equal access, enhancing learning attainment, supporting educational quality and relevance, enhancing knowledge and technology transfer, and supporting desired values, behaviours, and attitudes. Even when governments understand these concerns, they lack the economic means to solve the issues that are plaguing the current finance paradigm. On the one hand, success in assuring access to and completion of the primary school cycle has led in increased enrolment in post-primary education and, as a result, high enrolment higher education (World Bank Group [WBG], 2017).
Figure-2 summarizes the various challenges and pressures that the higher education system is
experiencing. (Source: World Bank Group, 2017)
The most significant trend has been the fall in public funding on higher education, which
has been a global catastrophe. Most nations have suffered significant cuts in public expenditures for higher education, either by economic reform programmes or convinced of the reason for the state's limited involvement in paying higher education. According to Joshi (2013), India's higher education system is complicated. Governance regulators are overlapping and interwoven across numerous ministries and regulatory agencies. India's Gross Enrollment Ratio (GER) of 15% remains below the global average. Despite relatively slow development in the public sector, the private sector currently accounts for 63% of all higher education institutions and 52% of total enrolments in Indian higher education.
Another important difficulty for India's higher education market is ensuring fair access to good quality higher education for students from low-income families. Students from low-income families are further disadvantaged since they are not intellectually equipped to compete in extremely competitive admission tests that favour urban elite and wealthy students with access to private tuition and coaching. Research at higher education institutions is at an all-time low. The government and society provide insufficient and decreasing financial support for higher education. Many rural colleges are non-viable, under-enrolled, and have severely inadequate infrastructure
As Gupta (2008) examined, “the greatest challenge for higher education in the twenty-first century is striking a balance between market pressures in terms of economy, efficiency, and competition on the one hand, and preservation of traditional values, autonomy, and their role as social critique and political vanguard on the other”.

INTERNATIONAL JOURNAL FOR INNOVATIVE RESEARCH IN MULTIDISCIPLINARY FIELD, ISSN: 2455-0620, Special Issue : 26, June-2021
Monthly, Peer-Reviewed, Refereed, Indexed Journal with IC Value: 86.87 Impact Factor: 6.719 Publication Date: 30/06/2021
Available online on - www.ijirmf.com Page 87
Concept of Autonomy:
Etymologically autonomy means "self norm". Autonomy refers to freedom or liberty for self-governance. It is a freedom for assuming responsibility for itself. The basic philosophy behind autonomy is that a person or group enjoying freedom and autonomy becomes more efficient than a person or a group failing to enjoy such freedom and autonomy as democracy leads to greater creativity, than a dictatorship. Thus, autonomy refers to freedom given to person, group or institution to perform a task on its own without any external control (Bania & Sarangi, 2020).
Autonomy has been described as the power to act without external control; and it is viewed as an organisational or managerial requirement for the fulfilment of responsibilities (Sarup, 1988). Bajaj (1989) defined autonomy in terms of independence in thought and action.
Autonomy simply means granting freedom to all those responsible for carrying out the work themselves. It presents a stronger structure through a decentralised culture of management. For the success of autonomy, it is necessary to assign authority with responsibility and associate management roles. Autonomy ultimately leads to success in academia, administration and financial management in an institution when practised with a sense of duty and transparency.
Development of Autonomous College in India
In the first half of the nineteenth century, many colleges were founded with complete autonomy prior to the establishment of universities in Calcutta, Bombay and Madras. These colleges were Hindu College, Calcutta in 1817, Agra College in 1827, Poona College in 1833, Elphinstone College, Bombay in 1834, Hoogly College in 1836, Patna College in 1840, St. Joseph College, Nagapattinam in 1944, Hislop College, Nagpur in 1944, Bethune College for Women, Calcutta in 1849, Madras Christian College in 1852, and St. John’s College in 1853. With the creation of universities in Calcutta, Bombay and Madras, twenty-seven established autonomous colleges were affiliated to these three universities in 1857. Rules were adopted for common admission, courses of study and syllabi, and examination and publication of results.
The effort to revive the idea of 'autonomy' was taken through the Agra University Amendment Act in the Utter Pradesh Legislative Assembly. This rule, however, was not put into action by the university. In 1964, under the chairmanship of Prof. Mahajani, the Committee on Colleges recommended UGC to pursue a general strategy for development of colleges (Reported in MHRD, 2005).
The first systematic and comprehensive recommendations on college autonomy were made in the report of the Education Commission (1964-66) under the chairmanship of Prof. D.S.Kothari (Ministry of Education, 1966). Since 1968, when the first National Education Policy, based on the report of the Education Commission, was introduced, the focus on reforming the affiliation structure of colleges has persisted.
The system of affiliation, which had been in effect since 1857, worked well because the number of affiliated colleges was small and the universities had a direct involvement and link with the programmes and progress of their affiliated colleges. However, the number of colleges affiliated with universities has grown to almost unprecedented proportions over the last couple of decades. Therefore, the involvement and link between universities and affiliated colleges gradually weakened, limiting the status of affiliated colleges to mechanical bodies. While discovering new directions for higher education to improve its quality and relevance, many education commissions have highlighted the fundamental weakness of the affiliation system, which has hampered the implementation of their key recommendations. Thus, as a potential solution to these challenges, college autonomy was proposed in a gradual manner.
A high-level committee consisting of Dr. D.S.Kothari, Dr. P.B.Gajendragadkar, Dr. A.C.Joshi, Dr. A.L.Mudaliar, Shri P.N.Kripal, Dr. B.Mallick, Dr. K.L.Shrimali, Dr. R.K.Singh, Shri J.P.Naik and Sri K.L.Joshi was constituted by the University Grants Commission (UGC) to review the feasibility and process for implementing the Education Commission's (1946-66) recommendations on autonomous colleges (1946-66) (Reported in MHRD, 2005). The progress
INTERNATIONAL JOURNAL FOR INNOVATIVE RESEARCH IN MULTIDISCIPLINARY FIELD, ISSN: 2455-0620, Special Issue : 26, June-2021
Monthly, Peer-Reviewed, Refereed, Indexed Journal with IC Value: 86.87 Impact Factor: 6.719 Publication Date: 30/06/2021
Available online on - www.ijirmf.com Page 88
until 1978 was disappointing, despite such efforts to implement college autonomy in higher education.
In 1971, the Gajendragadkar Committee outlined its opinion on the matter of autonomy and its need for university by arguing that university autonomy was not a legal concept or a constitutional concept, but rather an intellectual concept and an ethical concept (Reported in Rao et al., 1999). The assertion of autonomy by universities is therefore justified for the delivery of efficient and productive knowledge and for the advancement of knowledge as a specific contribution to the life and growth of the country.
The National Education Policy (MHRD, 1986) proposed that autonomy should be granted to colleges in the selection of students, the recruitment and promotion of teachers, the determination of study courses and teaching methods, and the selection and promotion of areas for research. The Programme of Action (MHRD, 1992) proposed the creation, on a selective basis, of a large number of autonomous colleges and the establishment of autonomous departments within universities.
The Tamilnadu legislature amended University Act to provide autonomous status to colleges on the recommendation of Madras University and Madurai Kamraj University in 1978. Eight colleges under Madras University and four colleges under Madurai Kamraj University became autonomous by June 1978. After such efforts, there were only 21 autonomous colleges in the country in 1984, out of which 16 were in Tamilnadu, one was in Bihar, two were in Andhra Pradesh, one was in Gujarat and one was in Madhya Pradesh (Reported in MHRD, 2005).
In the seventh plan phase, the NPE (MHRD, 1986) proposed for the creation of 500 autonomous colleges in India. It also recommended that guidelines and provision should be made for granting autonomy to colleges through different University Acts. Further the policy suggested that UGC should formulate guidelines and provide assistance to make colleges as autonomous.
The recommendation of NPE -1986 was reviewed by the Rammurthy Committee (MHRD, 1990) and, on the basis of its findings, a revised policy framework was tabled in Parliament on 7th May 1992. Although there was no significant change to the recommendation of NPE-1986, its POA was extensively revised. The revised policy largely accepted the earlier recommendations on autonomous college. The POA stressed the introduction of the scheme to raise the number of autonomous colleges. It is suggested that a Council of Autonomous Colleges should be formed by each state. As a result, there have been 747 autonomous colleges already functioning in India (as on 19.12.2019), out of which Tamilnadu is leading with 208 autonomous colleges (UGC, 2020).
National Education Policy (ME, 2020) stated that “all higher education institutions would gradually shift towards complete autonomy in terms of academic and administrative through the attainment of suitable accreditations to become a vibrant multidisciplinary institution”. Further, as proposed in the New Education Policy (2020) the affiliation scheme will be rolled out over 15 years and a phase-wise approach will be introduced to offer graded autonomy to colleges by a consistent system of graded accreditation. Thus NEP, 2020 strongly recommends autonomy for higher education institutions across the country.
Concept of College Autonomy in Higher Education: Autonomy in higher education as described by the University Grants Commission (UGC)
is a functional status provided to colleges to offer greater flexibility to academic development with regard to enhancing academic quality and excellence (UGC, 2017). Freedom is granted to an autonomous college to be a norm to itself and for self-governance. College autonomy encourages colleges to grant degrees on behalf of the affiliate institution by giving more intellectual and organisational independence to such affiliated colleges.
The UGC guidelines for autonomous colleges (2018) highlighting the importance of autonomous colleges, indicates that bifurcation of colleges from university affiliation system is the only secure and effective way to improve quality of undergraduate education. In addition it

INTERNATIONAL JOURNAL FOR INNOVATIVE RESEARCH IN MULTIDISCIPLINARY FIELD, ISSN: 2455-0620, Special Issue : 26, June-2021
Monthly, Peer-Reviewed, Refereed, Indexed Journal with IC Value: 86.87 Impact Factor: 6.719 Publication Date: 30/06/2021
Available online on - www.ijirmf.com Page 89
highlights that colleges are doing better with academic and administrative freedom and financial funding to such colleges strengthening the idea of autonomy.
Autonomy offers a college to prescribe its own rules for admission, prescribes its courses of study, conduct examination and develop methods of teaching and assessment. Autonomy and freedom (in form of academic, financial and administrative freedom) need to be followed by accountability. Academic autonomy is the free will to decide academic matters such as courses of study, instructional methods, pedagogy, and students’ assessment strategies. Administrative autonomy is the freedom of the organization to conduct its own administration dealings. It is the freedom to administer such activities that stimulates, supports and encourages programmes for the advancement and development of individuals working in the institutions. Financial autonomy is the institution’s freedom to use financial resources allocated to the institution in compliance with its objectives.
The Education Commission (1966) stated that teachers’ academic autonomy is an essential requirement for intellectual development of the country. It is impossible to pursue success in the higher education sector until such an environment prevails. The major stakeholders of higher education such as students, teachers and administrators share a significant responsibility in enhancing the quality of higher education. The Education Commission also stated that college autonomy, primarily a mechanism for the pursuit of academic excellence.
In the year 2018, the Revised Guidelines in the Scheme of Autonomous Colleges (UGC, 2018) states that an autonomous college will have the freedom to i) examine current courses/programs and, reorganise, modify and recommend its own courses of study and syllabi; (ii) develop new courses/programs within the UGC taxonomy; (iii) develop methods of students’ evaluation based on their performance, conduct of test and reporting of results; iv) announcement of results, issue of mark sheets; but the degree will be awarded by the University; v) formulate rules and regulation for admission in compliance with the policy of reservation of the national policy/ state government; vi) may set the fees of the programs/courses at their own level; vii) Create their own Governing Body, Board of Studies Academic Council, and Finance Committee; and viii) appoint their own managerial and administrative personnel and faculty of teaching including Principal. However, the staff will be appointed as per the UGC Regulations 2010 as amended from time to time.
Significant importance has been given to the concept of college autonomy reflected in the National Education Policy (2020) which calls for the establishment of a stage-wise mechanism for granting graded autonomy to colleges through a transparent system of graded accreditation. In addition, it states that colleges will be encouraged, mentored, supported, and incentivized to gradually attain the minimum benchmarks required for each level of accreditation. Each college is expected to be developed into either an autonomous degree-granting college or a constituent college of a university.
Thus, academic autonomy not only provide ample opportunity for colleges to take up innovations to bring quality and relevance in higher education but also brings statutory changes to the institutions as a whole. Objectives of Autonomous Colleges:
. The National Policy on Education (1986-92) formulated the following objectives for autonomous colleges.
An autonomous college will have the freedom to: I. Determine and prescribe its own courses of study and syllabi, and restructure and
redesign the courses to suit local needs. II. prescribe rules for admission in consonance with the reservation policy of the state
government. III. Evolve methods of assessment of students performance, the conduct of
examinations and notification of results.

INTERNATIONAL JOURNAL FOR INNOVATIVE RESEARCH IN MULTIDISCIPLINARY FIELD, ISSN: 2455-0620, Special Issue : 26, June-2021
Monthly, Peer-Reviewed, Refereed, Indexed Journal with IC Value: 86.87 Impact Factor: 6.719 Publication Date: 30/06/2021
Available online on - www.ijirmf.com Page 90
IV. Use modern tools of educational technology to achieve higher standards and greater creativity.
V. Promote healthy practices such as community service, extension activities, projects for the benefit of the society at large, neighbourhood programmes, etc.
Present Status of Approved Autonomous College in India.
As per the UGC accreditation, there are 827 autonomous colleges in India, highest number of autonomous colleges in the state of Tamil Nadu i.e. 227. Good ranking autonomous colleges in India come under the government-affiliated universities, where they are independent to form their academic structure. These autonomous colleges don't have the autonomy to award a degree. The higher education system of India is provided under government (public) colleges/ institutes/ universities controlled by the Government of India and other private colleges/ institutes/ universities controlled by the respective societies. Both the public and private universities are controlled by the University Grants Commission (UGC).
Table- 2- Number of Approved Autonomous Colleges in India.
Sl .No Name of State No. of Autonomous Colleges
1 ANDHRA PRADESH 114 2 ASSAM 03 3 BIHAR 02 4 CHHATISGARH 13 5 GOA 01 6 GUJRAT 05 7 HARAYANA 01 8 HIMACHAL PRADESH 05 9 JAMMU & KASHMIR 04 10 JHARKHAND 05 11 KARNATAKA 79 12 KERALA 22 13 MADHYA PRADESH 44 14 MAHARASTRA 117 15 MANIPUR 02 16 NAGLAND 03 17 ODISHA 48 18 PONDICHERY 04 19 PUNJAB 12 20 RAJASTHAN 07 21 TAMILNADU 227 22 TELENGANA 74 23 UTTAR PRADESH 12 24 UTTARAKHAND 04 25 WEST BENGAL 18 Total State-25
No of University:- 827 Total Autonomous Colleges -827
Source- UGC, India as on 31-03-2021 CONCLUSION:
Academic expansion, quality, and innovation drive the demand for autonomy in higher education. The whole sector of higher education in India is afflicted by a plethora of government

INTERNATIONAL JOURNAL FOR INNOVATIVE RESEARCH IN MULTIDISCIPLINARY FIELD, ISSN: 2455-0620, Special Issue : 26, June-2021
Monthly, Peer-Reviewed, Refereed, Indexed Journal with IC Value: 86.87 Impact Factor: 6.719 Publication Date: 30/06/2021
Available online on - www.ijirmf.com Page 91
regulations and interventions, resulting in numeric expansion without excellence or innovation. An autonomous college is given the right to be a model for itself and to govern itself. College autonomy promotes associated colleges to issue degrees on behalf of the affiliate university by providing them with greater intellectual and organisational flexibility. REFERENCES:
1. Bania, et.al (2021). Effect of Privatisation and College Autonomy on Quality in Higher Education: Parents’ Perception relating to their Satisfaction. Turkish Journal of Computer
and Mathematics Education (TURCOMAT), 12(6), 3421-3430. 2. Bania, S. & Sarangi, H. (2020). Effect of privatisation and college autonomy on quality in
higher education: as perceived by teachers. SHODH SANCHAR BULLETIN, 10(40), 58-64. 9.
3. Bania, S. (2020). Privatization of Higher Education in India Issues, Challenges and Suggestions for Quality Improvement, AEGAEUM JOURNAL, 8 (4), 1556-1564
4. Gupta, A. (2005). International Trends in Private Higher Education and the Indian Scenario. Research & Occasional Paper Series: CSHE. 11.05. Center for Studies in Higher Education. University of California, Berkeley.
5. Gupta, A. (2008). Education in the 21st Century: Looking Beyond University. New Delhi: Shipra Publications.
6. Gupta, D. and Gupta, N. (2012). Higher education in India: structure, statistics and challenges. Journal of Education and Practice, 3(2), 17-24.
7. MHRD. (2019). AISHE Final Report 2018-19. New Delhi , Government of India. 8. Ministry of Education (2020). National education policy-2020. New Delhi: Government of
India. 9. University Grants Commission (1998). Revised Guidelines on the scheme of autonomous
colleges. New Delhi: University of Grants Commission. 10. University Grants Commission (2018). Revised Guidelines on the scheme of autonomous
colleges. New Delhi: University of Grants Commission. 11. University Grants Commission (1987).Revised guidelines on the scheme of autonomous
colleges. New Delhi. UGC. 12. University Grants Commission. (2018). UGC Annual Report 2018-2019. 13. World Bank (1994). World Development Report 1994: Infrastructure for Development.
Washington DC: World Bank. 14. World Bank (2018). The Role of Higher Education in Innovation. Washington DC: World
Bank. Retrieved from http://documents1.worldbank.org/curated/en/729101493052924041/pdf/Higher-education-for-development-an-evaluation-of-the-World-Bank-Group-s-support.pdf
15. Yashpal Committee Report (2009). Report of the committee to Advise on Renovation and
Rejuvenation of Higher Education. New-Delhi: Government of India.

INTERNATIONAL JOURNAL FOR INNOVATIVE RESEARCH IN MULTIDISCIPLINARY FIELD, ISSN: 2455-0620, Special Issue : 26, June-2021
Monthly, Peer-Reviewed, Refereed, Indexed Journal with IC Value: 86.87 Impact Factor: 6.719 Publication Date: 30/06/2021
Available online on - www.ijirmf.com Page 92
International Conference on
Business, Management, Social and Economical Advancements 26 & 27 June, 2021 Bangkok, Thailand
Jointly organized by: Management Institute, Warsaw University of Life Science - SGGW, Warszawa, Poland,
‘Research Culture Society’ and ‘Scientific Research Association’.
Customers’ Satisfaction towards E-Banking Services in the Digital
Era – A study of Selected Public Sector Banks of South Gujarat
Region.
Stuti S. Desai 1
Research Scholar, Dep. of Commerce, Rai University, Saroda, Ahmedabad. Email - [email protected]
M. K. College of Commerce, Old N.H. No. 8, Bholav, Bharuch - 392 001, Gujarat (India).
Dr. Chinmayee J. Bhatt 2
Research Guide, Professor, Dep. of Commerce, Rai University, Saroda, Ahmedabad. Email - [email protected]
Abstract: In this age of digital marketing and technology, the banking sector has been called a
strong part of any country’s economy. Especially in India, it has made rapid growth and progress with new innovations. Today, the graph of e-banking users has gone up in this direction at a time
when both public and private sector banks are constantly striving to make their customers aware
of the importance of conducting electronic banking transactions. Today most of the customers are
turning to do digital banking transactions. Therefore, this study seeks to know the feedback of the
customers of selected public sector banks of South Gujarat and try to know that how satisfied they
are with the e-banking services provided by their banks. For this study primary data has been
collected throughpre designed questionnaire and conducting their personal interview. Descriptive
analysis has been done for this study. The study concludes that the e-banking users of South
Gujarat are satisfied with the e-banking services (ATM, Internet Banking, Mobile Banking and
Telephone Banking) provided by their public sector banks but still these banks need to make more
efforts in the field of digital banking to provide better services to the customers for achieve their
high satisfaction level.
Keywords: Customer Satisfaction, E-Banking Services, Public Sector Banks.
INTRODUCTION:
In this age of digital marketing and technology, the banking sectorhas been called a strong part of any country’s economy. Especially in India, it has made rapid growth and progress with new innovations. Today, the graph of e-banking users has gone up in this direction at a time when both public and private sector banks are constantly striving to make their customers aware of the importance of conducting electronic banking transactions. Today most of the customers are turning to do digital banking transactions. But in India, still there is a big gap between e-banking users at the rural and urban levels. Especially in remote areas of India, very few public sector banks are established but the branch expansion of private sector banks at the village level is very low. Lack of literacy in remote areas leads to lack of awareness about the usage of e-banking services. They still have to rely on public sector banking services. Therefore, there is a big difference in the opinions of users of e-banking services of public and private sector banks and their level of
INTERNATIONAL JOURNAL FOR INNOVATIVE RESEARCH IN MULTIDISCIPLINARY FIELD, ISSN: 2455-0620, Special Issue : 26, June-2021
Monthly, Peer-Reviewed, Refereed, Indexed Journal with IC Value: 86.87 Impact Factor: 6.719 Publication Date: 30/06/2021
Available online on - www.ijirmf.com Page 93
satisfaction. For this study purpose State Bank of India, Bank of India and Corporation Bank has been selected as a public sector bank of South Gujarat.
REVIEW OF LITERATURE:
E-Banking services are basically used by the customers themselves. It requires minimum resources, speedy transactions and lower transaction costs (Southard and Siau, 2004; Witman and Poust, 2008). The growth of usage of E-Banking is due to its advantages for both the banks and customers. These services are cost savings services for the bank’s perspective (Sathye, 1999; Robinson, 2000). E-Banking services are more beneficial for the customers. It mainly includes conveniences of the service because it is time saving and globally accessible service and also charged minimum cost of transactions and more frequently monitoring of accounts among others(Pikkarainen et al, 2004).
Lang and Colgate (2003)found that customers who have IT knowledge they can easily use E-Banking services and therefore they are highly satisfied with these services than who don’t have IT knowledge. Broderick and Vachirapornpuk (2002) show that level of satisfaction and customer involvement in using E-banking services has the greatest impact on the perception of service quality. Dixit N. and Dr. Dutta S. K. (2010) noted that as a developmental country like India there is a necessity to provide well and customised banking services to the customers and it could be possible to provide these services through E-Banking. He also noted that customers have positive perception towards online banking. Radomir et al. (2011) investigated three dimensions in relation with customer satisfaction: human resources, convenience and efficiency and tangible aspects and found that all of them are in a positive relationship with customer satisfaction. Kumbhar Vijay (2011) examined that overall satisfaction of employees, businessmen and professionals are highly satisfied with internet banking services and also found that there is a significant difference between customers’ perception and internet banking services provided by the public and private sector banks. Rod et al (2009) have focused on relationship between service quality, overall internet banking service quality and customer satisfaction in New Zealand. They found there is a significant and positive relationship between online customer service quality and online information systems and overall customer internet banking service quality. Overall internet banking service quality and customer satisfaction were positively correlated. RESEARCH METHODOLOGY:
In this study we have try to know about Customers’ Satisfaction towards E-Banking Services in the Digital Era – A study of Selected Public Sector Banks in South Gujarat region.Here State Bank of India, Bank of India and Corporation bank has been selected to take an opinion of E-Banking users of these banks of South Gujarat region. From each bank we have selected 30 respondents and total 90 respondents among the seven districts of South Gujarat accept Dang district because in this district only State Bank of India has been established as a public sector bank. So for this survey total 570 customers have been selected from South Gujarat by using stratified random sampling method. Primary data has been collected through pre designed questionnaire which is filled by the customers. This study is descriptive by nature. Descriptive analysis has been done for the data analysis.
Objective of the study
To know customers’ satisfaction towards E-Banking services provided by selected public sector banks of South Gujarat.
Limitation of the study
Dang district has only Sate Bank of India as a public sector bank. Any other public sector bank has not been established in this district accept other districts of South Gujarat.

INTERNATIONAL JOURNAL FOR INNOVATIVE RESEARCH IN MULTIDISCIPLINARY FIELD, ISSN: 2455-0620, Special Issue : 26, June-2021
Monthly, Peer-Reviewed, Refereed, Indexed Journal with IC Value: 86.87 Impact Factor: 6.719 Publication Date: 30/06/2021
Available online on - www.ijirmf.com Page 94
Data Analysis and Interpretation:
Descriptive analysis has been done here for the collected data through primary source.
Table 1: The quickness of card delivery
Customers’ Opinion Frequency Percent Extremely Dissatisfied 33 5.8
Dissatisfied 61 10.7
Neutral 63 11.1 Satisfied 279 48.9
Extremely Satisfied 134 23.5
Total 570 100.0
(Source: Primary Data - Survey) Table 1 indicates that 48.9 percent customers are satisfied with the quickness of card delivery service whereas 23.5 percent customers are highly satisfied. Moreover only 5.8 percent customers are highly dissatisfied with this service.
Table 2: The availability of currency
Customers’ Opinion Frequency Percent
Extremely Dissatisfied
21 3.7
Dissatisfied 72 12.6
Neutral 74 13.0
Satisfied 289 50.7
Extremely Satisfied 114 20.0
Total 570 100.0
(Source: Primary Data - Survey) Table 2 shows that 50.7 percent customers are satisfied with the availability of currencywhereas20 percent customers are extremely satisfied with this service. Moreover 13 percent customers are neutral with their opinion and 12.6 percent customers are dissatisfied with this service.
Table 3: Conveniently located
Customers’ Opinion Frequency Percent
Extremely Dissatisfied
4 .7
Dissatisfied 50 8.8
Neutral 23 4.0
Satisfied 211 37.0
Extremely Satisfied 282 49.5
Total 570 100.0
(Source: Primary Data - Survey) Table 3 shows that around 50 percent customers are highly satisfied with the convenience of bank’s location. Very few, only 8.8 percent customers opined that banks are not conveniently located.
Table 4: Capacity building and awareness
Customers’ Opinion Frequency Percent
Extremely Dissatisfied
25 4.4

INTERNATIONAL JOURNAL FOR INNOVATIVE RESEARCH IN MULTIDISCIPLINARY FIELD ISSN: 2455-0620 Special Issue : 26, June – 2021
Monthly, Peer-Reviewed, Refereed, Indexed Journal with IC Value: 86.87 Impact Factor: 6.719 Publication Date: 30/06/2021
Available online on - www.ijirmf.com Page 95
Dissatisfied 23 4.0
Neutral 55 9.6
Satisfied 257 45.1
Extremely Satisfied 210 36.8
Total 570 100.0
(Source: Primary Data - Survey) Table 4 shows that 45.1 percent customers are satisfied with the bank’s service about capacity building and awareness whereas around 37 percent customers are extremely satisfied with this service. Moreover 4 percent customers are dissatisfied and around 4 percent customers are highly dissatisfied with this service.
Table 5: Account information and balance inquiry
Customers’ Opinion Frequency Percent
Extremely Dissatisfied
19 3.3
Dissatisfied 7 1.2
Neutral 247 43.3
Satisfied 297 52.1
Extremely Satisfied 19 3.3
Total 570 100.0
(Source: Primary Data - Survey) Table 5 indicates that around 52 percent customers are satisfied with the service of account information and balance inquiry whereas around 43 percent customers are neutral with their opinion. Moreover around 3 percent customers are equally highly satisfied and highly dissatisfied with this service.
Table 6: Statement request
Customers’ Opinion Frequency Percent
Extremely Dissatisfied
14 2.5
Dissatisfied 6 1.1
Neutral 305 53.5
Satisfied 133 23.3
Extremely Satisfied 112 19.6
Total 570 100.0
(Source: Primary Data - Survey) Table 6 shows that 53.5 percent customers are neutral about statement request service whereas around 23 percent customers are satisfied with this service. Moreover around 20 percent customers are highly satisfied with this service.
Table 7: Clear instructions
Customers’ Opinion Frequency Percent
Extremely Dissatisfied
41 7.2
Dissatisfied 107 18.8
Neutral 55 9.6
Satisfied 249 43.7

INTERNATIONAL JOURNAL FOR INNOVATIVE RESEARCH IN MULTIDISCIPLINARY FIELD ISSN: 2455-0620 Special Issue : 26, June – 2021
Monthly, Peer-Reviewed, Refereed, Indexed Journal with IC Value: 86.87 Impact Factor: 6.719 Publication Date: 30/06/2021
Available online on - www.ijirmf.com Page 96
Extremely Satisfied 118 20.7
Total 570 100.0
(Source: Primary Data - Survey) Table 7 shows that around 44 percent customers are satisfied with the clear instruction service of the bank. 20.7 percent customers are highly satisfied with this service and 18.8 percent customers are dissatisfied with this service.
Table 8: Information about products and services
Customers’ Opinion Frequency Percent
Extremely Dissatisfied 54 9.5
Dissatisfied 109 19.1
Neutral 80 14.0
Satisfied 218 38.2
Extremely Satisfied 109 19.1
Total 570 100.0 (Source: Primary Data - Survey)
Table 8 shows that around 38 percent customers are satisfied with the service of information about products and services whereas around 19 percent customers are equally highly satisfied and dissatisfied with this service.
Table 9: Online directions for new users
Customers’ Opinion Frequency Percent Extremely Dissatisfied 46 8.1
Dissatisfied 111 19.5 Neutral 73 12.8
Satisfied 227 39.8 Extremely Satisfied 113 19.8
Total 570 100.0 (Source: Primary Data - Survey)
Table 9 shows that 39.8 percent customers are satisfied with the service of online directions for new users whereas around 20 percent customers are highly satisfied with this service and 19.5 percent customers are dissatisfied.
Table 10: Stop payment of a cheque
Customers’ Opinion Frequency Percent Extremely Dissatisfied 16 2.8
Dissatisfied 80 14.0 Neutral 88 15.4
Satisfied 228 40.0 Extremely Satisfied 158 27.7
Total 570 100.0 (Source: Primary Data - Survey)
Table 10 shows that 40 percent customers are satisfied with the service of stop payment of cheque whereas around 28 percent customers are highly satisfied. Moreover only 2.8 percent customers are highly dissatisfied with this service.

INTERNATIONAL JOURNAL FOR INNOVATIVE RESEARCH IN MULTIDISCIPLINARY FIELD ISSN: 2455-0620 Special Issue : 26, June – 2021
Monthly, Peer-Reviewed, Refereed, Indexed Journal with IC Value: 86.87 Impact Factor: 6.719 Publication Date: 30/06/2021
Available online on - www.ijirmf.com Page 97
Table 11: Mobile number updation
Customers’ Opinion Frequency Percent Extremely Dissatisfied 44 7.7
Dissatisfied 124 21.8
Neutral 60 10.5
Satisfied 221 38.8 Extremely Satisfied 121 21.2
Total 570 100.0 (Source: Primary Data - Survey)
Table 11 indicates that around 40 percent customers are satisfied with the service of mobile number updation whereas around 22 percent customers are dissatisfied with this service. Moreover 21.2 percent customers are highly satisfied with this service.
Table 12: Information on usage of ATM, Internet banking and Mobile banking
Customers’ Opinion Frequency Percent Extremely Dissatisfied 21 3.7 Dissatisfied 98 17.2 Neutral 45 7.9 Satisfied 271 47.5 Extremely Satisfied 135 23.7 Total 570 100.0
(Source: Primary Data - Survey) Table 12 shows that 47.5 percent customers are satisfied with the service of information on usage of ATM, Internet banking and mobile banking. 23.7 percent customers are highly satisfied with and 17.2 percent customers are dissatisfied with this service.
Table 13: Regeneration of internet banking password
Customers’ Opinion Frequency Percent
Extremely Dissatisfied 56 9.8
Dissatisfied 120 21.1
Neutral 79 13.9
Satisfied 203 35.6
Extremely Satisfied 112 19.6
Total 570 100.0
(Source: Primary Data - Survey) Table 13 shows that around 36 percent customers are satisfied with the service of regeneration of internet banking password whereas 21.1 customers are dissatisfied with this service. Moreover around 20 percent customers are extremely satisfied with this service.
Table 14: Cash back on E - Payment
Customers’ Opinion Frequency Percent
Extremely Dissatisfied 102 17.9
Dissatisfied 158 27.7
Neutral 100 17.5
Satisfied 151 26.5
Extremely Satisfied 59 10.4
Total 570 100.0
(Source: Primary Data - Survey)

INTERNATIONAL JOURNAL FOR INNOVATIVE RESEARCH IN MULTIDISCIPLINARY FIELD ISSN: 2455-0620 Special Issue : 26, June – 2021
Monthly, Peer-Reviewed, Refereed, Indexed Journal with IC Value: 86.87 Impact Factor: 6.719 Publication Date: 30/06/2021
Available online on - www.ijirmf.com Page 98
Table 14 indicates that around 28 percent customers are dissatisfied with the service of cashback on E-Payment whereas around 27 percent customers are satisfied with this service. Moreover around 18 percent customers are highly dissatisfied with this service.
CONCLUSION:
The study concludes that the e-banking users of South Gujarat are satisfied with the e-banking services (ATM, Internet Banking, Mobile Banking and Telephone Banking) provided by their public sector banks but still these banks need to make more efforts in the field of digital banking to provide better services to the customers for achieve their high satisfaction level.Public sector banks in India are not committed to serve their customers in batter way. Especially in remote area we can see a lake of awareness among customers towards E- banking services and also a network problem whereas private sector banks provide better services to their customers.
REFERENCES:
1. Broderick, A. and Vachirapornpuk, S. (2002). Service Quality in Internet Banking: The Importance of Customer Role. Marketing Intelligence and Planning, 20, (6), 327-335.
2. Dixit N. & Dr. Dutta S. K. (2010), Journal of Internet Banking and Commerce, Acceptance of E-banking among Adult Customers: An Empirical Investigation in India, Vol. 15 no. 2.
3. Kumbhar, Vijay (2011), “Service Quality Perception and Customer's Satisfaction in Internet Banking Service : A Case Study OF Public Sector and Private Sector Banks”, Cyber iterature Online Journal, Vol .2,No4 ,pp. 21-30
4. Lang, Bodo and Colgate, Mark (2003), Relationship Quality, On-Line Banking and the Information Technology Gap. International Journal of Bank Marketing, 21(1), 29-37.
5. Pikkarainen, T.; Pikkarainen, K.; Karjaluoto, H. and Pahnila, S. (2004). Consumer acceptance of online banking: an extension of the technology acceptance model. Internet Research, 14, (3), 224–235.
6. Radomir, L., Wilson, A. & Scridon, A.M. (2011). Improving bank quality dimensions to increase customer satisfaction, Management Marketing Journal, IX (1), 126-148.
7. Rod M; N J Ashil; J Shao and J Carrethers (2008), “An Examination of the Relationship between Service Quality Dimensions, Overall Internet Banking S e r v i c e Q u a l i t y a n d C u s t o m e r Satisfaction: A New Zealand study”, Marketing Intelligence & Planning. Vol. 27 No. 1. pp. 103-126.
8. Southard, P.B. and Siau, K. (2004). A survey of online e-banking retail initiatives. Communications of the ACM, 47(10), 99–102.
9. Sathye, M. (1999). Adoption of Internet banking by Australian consumers: an empirical investigation’, International Journal of Bank marketing, 17(7), 324-334.

INTERNATIONAL JOURNAL FOR INNOVATIVE RESEARCH IN MULTIDISCIPLINARY FIELD ISSN: 2455-0620 Special Issue : 26, June – 2021
Monthly, Peer-Reviewed, Refereed, Indexed Journal with IC Value: 86.87 Impact Factor: 6.719 Publication Date: 30/06/2021
Available online on - www.ijirmf.com Page 99
International Conference on
Business, Management, Social and Economical Advancements 26 & 27 June, 2021 Bangkok, Thailand
Jointly organized by: Management Institute, Warsaw University of Life Science - SGGW, Warszawa, Poland,
‘Research Culture Society’ and ‘Scientific Research Association’.
A Study on Motivating Factors for Teachers in Higher
Education: Indian Context
Dr. Sachin Sadashiv Surve
Coordinator, Faculty Development Centre, UGC-Human Resource Development Centre,
Savitribai Phule Pune University, Pune, M.S., India 411007 Email - [email protected],
Ms. Safoora Jamal Ansari
Assistant Professor (Mathematics), S.N.J.B.’s K.K.H.A. Arts, S.M.G.L. Commerce and S.P.H.J. Science College, Chandwad, Nashik,
M.S., India 423101 Email - [email protected],
Mr. Shivanand Ramhari Thorat
Visiting faculty, Department of Psychology, Symbiosis College of Arts and Commerce, Pune, M.S., India
Email - [email protected],
Abstract: India’s higher education system is one of the largest education systems in the world. To achieve sustainable development of the organization it is very important that the stakeholders
should be motivated. One of the most important aspects to excel in higher education is motivated
teachers.
A motivated teacher can do wonders to students and organization hence, it was felt necessary to
study the factors that motivates one to choose teaching profession at higher education, and
continue in it.
Keywords: Teachers, higher education, motivation, motivating factors, motivators.
INTRODUCTION:
In India, teaching profession is no longer considered as an attractive career option by
majority of dynamic youngsters, is rather unfortunate. Very few smart and dynamic youngsters choose teaching profession as their first career choice. Teachers at the primary and secondary level receive professional training which helps them to prepare mentally and emotionally to be a teacher whereas teachers in Higher Education do not get any professional training for the same. To sustain in this profession teachers, need to get motivated. This motivation will help them grow in this profession and deliver innovative ideas. This is needed for the students of higher education for their bright future. Motivation Motivation is a word derived from the word ‘motive’. Motive means needs, desires, wants or drives within the individuals. It is the process of inspiring people to do required actions to achieve

INTERNATIONAL JOURNAL FOR INNOVATIVE RESEARCH IN MULTIDISCIPLINARY FIELD ISSN: 2455-0620 Special Issue : 26, June – 2021
Monthly, Peer-Reviewed, Refereed, Indexed Journal with IC Value: 86.87 Impact Factor: 6.719 Publication Date: 30/06/2021
Available online on - www.ijirmf.com Page 100
the goals. The factors stimulating individual’s behavior can be - desire for money, success, recognition, security, job-satisfaction, status, power, team work or passion etc. Motivation can be defined as the initiation/beginning and continuation of behaviour which is focused on a particular target or goal. For any profession, it is essential for the individuals to have willingness to be in the profession. To be able to contribute effectively in any field and be successful in any profession, it is essential that the individual should be motivated and have joined the profession willfully. This will help individual to have interest in performing their jobs. The process of motivation consists of three stages,
1. A need or drive 2. An encouragement where needs have to be aroused 3. When needs are satisfied, the satisfaction or accomplishment of goals.
When we speak about profession like teaching, especially in higher education it is very essential that the individual entering in this profession should be motivated and excited to be a teacher. In this paper we have tried to identify and highlight factors that proved to be crucial motivators for individuals who have joined and continued in the teaching profession at the level of Higher Education. To prove our point in a better way, we have chosen two trusted and tested theories i.e. Maslow’s Hierarchy of needs theory and McGregor’s Theory X and Theory Y. MASLOW’S HIERARCHY OF NEEDS THEORY
Abraham Maslow is known for his Hierarchy of Needs Theory, which he proposed in 1943 [24]. This theory is a classical depiction of human motivation. His theory is based on the assumption that there is a hierarchy of five levels which cover needs within each individual. The priority of these needs varies. These five levels are as follows:
We can relate the level and need of motivation with priority in the profession of teaching through this diagram. Maslow’s theory also was the root cause of another theory proposed by Douglas McGragor. McGragor proposed two contrasting theories of motivation named Theory X and Theory Y. Theory X explains the importance of heightened supervision, external rewards and penalties, while Theory Y highlights the motivating role of job satisfaction and encourages employees to approach

INTERNATIONAL JOURNAL FOR INNOVATIVE RESEARCH IN MULTIDISCIPLINARY FIELD ISSN: 2455-0620 Special Issue : 26, June – 2021
Monthly, Peer-Reviewed, Refereed, Indexed Journal with IC Value: 86.87 Impact Factor: 6.719 Publication Date: 30/06/2021
Available online on - www.ijirmf.com Page 101
tasks without direct supervision. Use of Theory X and Theory Y can affect employee motivation and productivity in different ways. These theories can be used to implement strategies into practices. It can be seen that Theory X presents pessimistic view of individuals’ nature and behavior at work. While Theory Y presents an optimistic view of the individuals’ behavior at work.
If we correlate it with Maslow’s theory, we can say that theory X assumes that normally people emphasize more on the physiological needs and the safety needs whereas theory Y is based on assumptions that the individuals emphasize more on social needs, esteem needs and the self-actualization needs.
Considering the above and the status of teachers in Higher Education and realizing the importance of motivated individuals in teaching profession, it was felt necessary to study about the dominant motivators influencing individuals to join and stay in teaching profession. LITERATURE REVIEW:
Only motivated teachers can effectively and efficiently perform their duties and justify their roles. Motivation includes effect of beliefs and opinions, observations, values, interests and actions which are all closely associated.
The definition of motivation comprises of three essentials, i.e. need, motivation, goal that triggers action and deciding method that directs the selection of action and the intensity of efforts that is put to the selected actions. In short, we can say that motivation affects behavior, attitude and performance, selection, direction and level of effort.
Efficiency of any organization depends on the way they manage their human resources, which no doubt has become the most important resource in the recent competitive and dynamic environment [29]. Martin [23] argued that if an organization wants to be successful and aims to maintain its success for a longer period of time it is important for it to have a motivated workforce consisting of employees who are ready to learn.
The human elements of the organization are those that are capable of learning, changing, innovating and providing the creative thrust which if properly motivated can ensure the long-run survival of the organization [21].
We can say that the most vital factor of good quality education at Higher Education is motivation, namely the motivation of teachers, scholars and other employees, i.e. all the people working at higher education institutions.
Motivation is “the attribute that moves us to do or not to do something” (Broussard et al. [8]). Motivation refers to “the reasons underlying behavior” (Guay et al.[16]). Intrinsic motivation is motivation that is animated by personal enjoyment, interest or pleasure. Deci et al. [11] observed intrinsic motivation energizes and sustains activities through the spontaneous satisfactions inherent in effective volition of action. It is manifested in behaviors such as play, exploration and challenge seeking that reinforcement contingency. The level of self-efficacy influences how an individual approaches a task, the motivation to engage in a task, the level of efforts exerted toward a particular task, the level of persistence when facing a difficult challenge and ultimately, work performance (Garcia et al.[14]).
Educators considered intrinsic motivation to be more desirable and to result in better learning outcomes than extrinsic motivation (Deci et al.[11]). Self-efficacy is one’s belief in one’s ability to succeed in specific situations or accomplish a task (Bandura [2]).
Gottfried [15] defines academic motivation as “enjoyment of school learning characterized by a mastery orientation; curiosity; persistence; task-endogamy; and the learning of challenging, difficult and novel tasks.” Bandura [2] asserts that cognitive, behavioral, personal and environmental factors interact to determine motivation and behavior. Turner [32] considers

INTERNATIONAL JOURNAL FOR INNOVATIVE RESEARCH IN MULTIDISCIPLINARY FIELD ISSN: 2455-0620 Special Issue : 26, June – 2021
Monthly, Peer-Reviewed, Refereed, Indexed Journal with IC Value: 86.87 Impact Factor: 6.719 Publication Date: 30/06/2021
Available online on - www.ijirmf.com Page 102
motivation to be synonymous with cognitive engagement and defines as “voluntary uses of high-level self-regulated learning strategies, such as paying attention, connection, planning and monitoring.”
The human element of university is represented by its teachers, scientific-research employees, support staff and service employees, who in mutual dependency and close cooperation provide the students with their most crucial product/outcome: knowledge, skills and competences. The idea that university education must be systematically improve resonates in the works and articles of many authors (e.g. Boyer [7]; Doolittle and Camp, [12]; Cowan, [10]; Boud, [5]; Juwah, [19]; Homolová, [18]; Vašutová, [33]; Lueddeke, [22]; Clark and Andrews, [9]; Slavík, [30]; Espedal, Gooderham and Evensen, [13] etc.).
Generally, the motivation, e.g. its orientation, intensity, pressure, and integration with the motivation of more complex wholes (groups, organizations) ranks among the most important and the most basic determinant of every human endeavor; it is important to devote attention just to the dynamical aspects of the motivation. The human potential motivation is really very complicated and dynamically changing, but at the same time, also extraordinary productive and potentially contributive (Blašková and Blaško, [3]). Due to the fact that the motivation of university teachers is constantly confronted and weakened by several complicated situations, activities and perceived social and also individual responsibility, it is necessary to systematically reinforce it. In this sense motivation is activation of a certain internal state (e.g. wishes, efforts) through external stimuli (motivators), (Alexy, Boroš and Sivák, [1]).
For motivation to occur, we must have functional tension giving energy to the individual to perform. Motivation is initiated by the feeling of shortage, internal conflict that the individual strives to eliminate by its behavior and establish balance (Fuchsová and Kravčáková, [20]). Our attitudes determine our preferences. These attitudes, along with the emotions with which they are infused, shape motivation: the energy that is made available for any activity(Spitzer, [31]).The art of managers to motivate their employees means to create interest in them, willingness and taste to actively get involved in accomplishment of activities conforming to the mission and objective of the organization or its parts (Vodáček and Vodáčková, [34]). This definition is fully in accordance also with the view of motivation in the environment of universities, i.e. the motivation of university teachers.
In a research undertaken by Rasheed, Humayon, and Awan [28] on factors affecting teachers’ motivation found that compensation package is the most effective motivator for the teachers in Higher Educational institutions, which focuses on financial benefits and security. Taking reference of this we have tried to find out what are the important factors that work as motivators for Higher Education teachers in India for joining the teaching profession as well as for continuing in the teaching profession. RESEARCH METHOLOGY:
Primary Data: Field survey was conducted to collect primary data. One questionnaire was prepared for this purpose, and filled by respondents. Information was collected through open discussions with selected respondents who are faculty members at Higher Education institutions from different locations.
Secondary data:
In order to conduct the research, the relevant and concerned books, reports, literature from internet and various libraries were referred. Further, important contributions in the subject matter from various journals, magazines, periodicals, reports, bulletins, survey material, newspapers published in India & abroad were also studied.

INTERNATIONAL JOURNAL FOR INNOVATIVE RESEARCH IN MULTIDISCIPLINARY FIELD ISSN: 2455-0620 Special Issue : 26, June – 2021
Monthly, Peer-Reviewed, Refereed, Indexed Journal with IC Value: 86.87 Impact Factor: 6.719 Publication Date: 30/06/2021
Available online on - www.ijirmf.com Page 103
Measures: The questionnaire was developed after consultation with experts and seeking opinions of teachers teaching in different institutes at different levels and different professional age, it was finalized after a pilot study.
The questionnaire consisted of statements highlighting probable motivating factors influencing individuals to join teaching profession and to continue in it. The questionnaire also gathered information of the individuals such as gender, experience, location etc.
Initially responses were received from 204 faculty members. Outliers were removed by using Boxplot method which reduced the sample size to 194 faculty members which were considered for further analyses. Normality of the variable was tested with help of Kolmogorov-Smirnov test. Comparative survey research (cross-sectional) design was employed.
The data were analyzed with the help of SPSS 26.0. It was used to carry out analyses for hypotheses testing and exploratory inferences. One-way MANOVA, one-way ANOVA, Bonferroni (for pairwise comparison), Hochberg’s GT2 (post-hoc test) were employed for testing the hypotheses and drawing exploratory inferences.
HYPOTHESES:
H1: Financial stability and security are effective motivators for male teachers than female teachers for joining and staying in teaching profession at Higher Education.
H2: Passion about teaching profession is an effective motivator for male entering the teaching profession as compared to female teachers.
H3: External motivators play important role for male teachers to join and continue in teaching profession at Higher Education level than female teachers.
QUESTIONNAIRE FOR SURVEY:
In this study, we have measured teacher’s opinion to find out about the major motivators influencing teachers in joining and continuing in teaching profession in higher education. The opinions were collected and measured using 5-point Likert scale, with help of 19 statements clubbed in 2 different domains. The domain wise statements are given below in table1. Table 1: Table showing the statement and parameters used for collecting opinions of teachers on
motivators instrumental for them in joining and continuing in teaching profession.
Domain 1 I chose teaching as profession because __________
I1.1 People around me wanted / motivated me to (My teachers, parents, etc.) I1.2 It’s a coincidence I1.3 I was always passionate about teaching I1.4 Good salary and job security I1.5 Social recognition I1.6 Passion for continuous learning I1.7 Like to be with young generation I1.8 It’s easy to maintain balance in personal and professional life
I1.9 As a student, I could figure out the needs of the students and I decided to
help them fulfill to avoid frustration and waste of talent
Domain 2 I continued in teaching profession because __________
I2.1 I enjoy interacting and being with students I2.2 Financial stability and responsibilities I2.3 It makes me more self-aware and competent I2.4 Healthy Institutional environment and interactions with colleagues

INTERNATIONAL JOURNAL FOR INNOVATIVE RESEARCH IN MULTIDISCIPLINARY FIELD ISSN: 2455-0620 Special Issue : 26, June – 2021
Monthly, Peer-Reviewed, Refereed, Indexed Journal with IC Value: 86.87 Impact Factor: 6.719 Publication Date: 30/06/2021
Available online on - www.ijirmf.com Page 104
I2.5 Job Satisfaction, Feedback of students I2.6 Social recognition I get being a teacher I2.7 It has become a passion now, can’t imagine life without teaching
I2.8 Gives me an opportunity to understand people, behavior, culture, social
aspects from a different perspective I2.9 In provides balance in personal and professional life (work life balance) I2.10 Satisfaction through extra-curricular activities
RESULTS AND DISCUSSION:
Table 2: Mean, standard deviation, and tests of between-subjects effects for gender
(domain 1)
Gender Mean Std. Deviation N
Type III Sum of Squares F
Partial Eta Squared
I1.1 Male 3.68 1.337 94 19.283 11.528** .057
Female 3.05 1.250 100 I1.2 Male 2.34 1.425 94
.313 .155 .001 Female 2.26 1.418 100
I1.3 Male 4.58 .767 94 2.911 4.534* .023
Female 4.34 .831 100 I1.4 Male 3.40 1.185 94
.766 .558 .003 Female 3.53 1.158 100
I1.5 Male 4.19 .883 94 6.687 7.160** .036
Female 3.82 1.038 100 I1.6 Male 4.70 .504 94
.007 .023 .000 Female 4.69 .597 100
I1.7 Male 4.52 .729 94 .497 .796 .004
Female 4.42 .843 100 I1.8 Male 3.91 .968 94
.533 .520 .003 Female 3.81 1.051 100
I1.9 Male 4.35 .812 94 3.560 4.148* .021
Female 4.08 1.021 100
(**p < 0.01) (*p < 0.05)
Table 3: Mean, standard deviation, and tests of between-subjects effects for gender
(domain 2)
Gender Mean Std. Deviation N
Type III Sum of Squares F
Partial Eta Squared
I2.1 Male 4.73 .467 94 .429 1.666 .009
Female 4.64 .541 100 I2.2 Male 3.90 .916 94
.430 .538 .003 Female 3.81 .872 100
I2.3 Male 4.38 .689 94 .218 .459 .002
Female 4.45 .687 100 I2.4 Male 4.01 .909 94
.958 1.330 .007 Female 3.87 .786 100
I2.5 Male 4.39 .779 94 .283 .496 .003
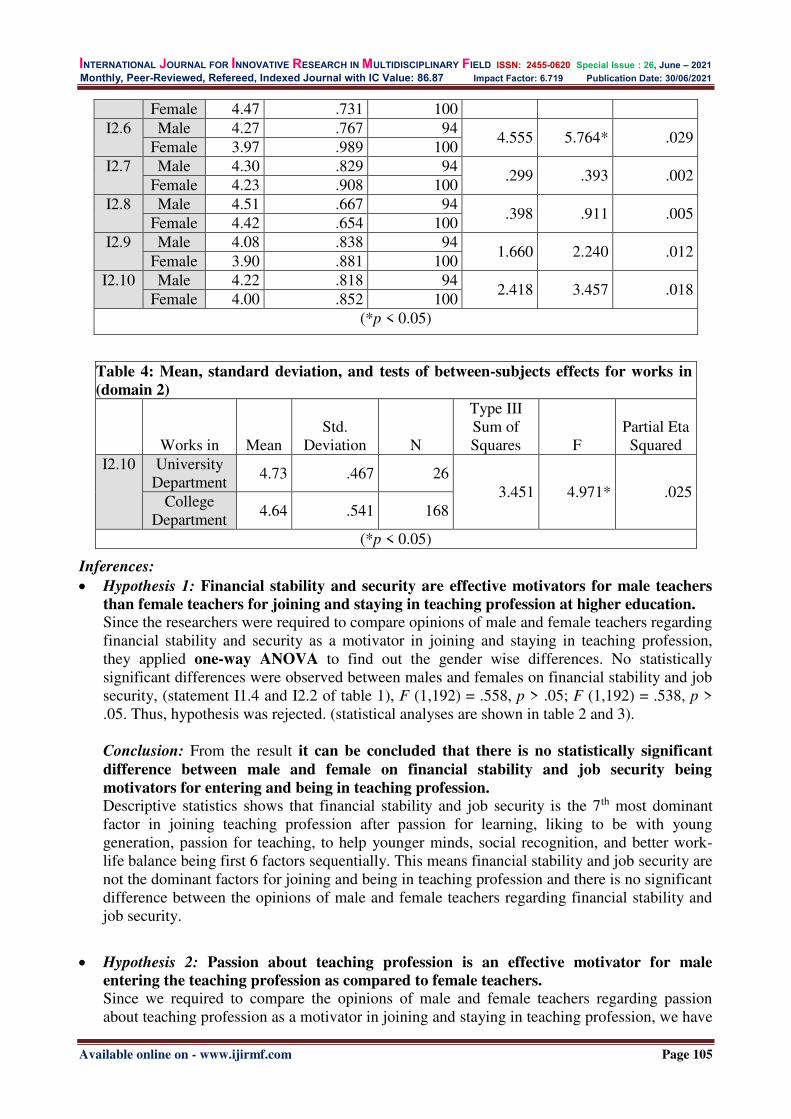
INTERNATIONAL JOURNAL FOR INNOVATIVE RESEARCH IN MULTIDISCIPLINARY FIELD ISSN: 2455-0620 Special Issue : 26, June – 2021
Monthly, Peer-Reviewed, Refereed, Indexed Journal with IC Value: 86.87 Impact Factor: 6.719 Publication Date: 30/06/2021
Available online on - www.ijirmf.com Page 105
Female 4.47 .731 100 I2.6 Male 4.27 .767 94
4.555 5.764* .029 Female 3.97 .989 100
I2.7 Male 4.30 .829 94 .299 .393 .002
Female 4.23 .908 100 I2.8 Male 4.51 .667 94
.398 .911 .005 Female 4.42 .654 100
I2.9 Male 4.08 .838 94 1.660 2.240 .012
Female 3.90 .881 100 I2.10 Male 4.22 .818 94
2.418 3.457 .018 Female 4.00 .852 100
(*p < 0.05)
Table 4: Mean, standard deviation, and tests of between-subjects effects for works in
(domain 2)
Works in Mean Std.
Deviation N
Type III Sum of Squares F
Partial Eta Squared
I2.10 University Department
4.73 .467 26 3.451 4.971* .025
College Department
4.64 .541 168
(*p < 0.05)
Inferences:
Hypothesis 1: Financial stability and security are effective motivators for male teachers
than female teachers for joining and staying in teaching profession at higher education.
Since the researchers were required to compare opinions of male and female teachers regarding financial stability and security as a motivator in joining and staying in teaching profession, they applied one-way ANOVA to find out the gender wise differences. No statistically significant differences were observed between males and females on financial stability and job security, (statement I1.4 and I2.2 of table 1), F (1,192) = .558, p > .05; F (1,192) = .538, p > .05. Thus, hypothesis was rejected. (statistical analyses are shown in table 2 and 3). Conclusion: From the result it can be concluded that there is no statistically significant
difference between male and female on financial stability and job security being
motivators for entering and being in teaching profession.
Descriptive statistics shows that financial stability and job security is the 7th most dominant factor in joining teaching profession after passion for learning, liking to be with young generation, passion for teaching, to help younger minds, social recognition, and better work-life balance being first 6 factors sequentially. This means financial stability and job security are not the dominant factors for joining and being in teaching profession and there is no significant difference between the opinions of male and female teachers regarding financial stability and job security.
Hypothesis 2: Passion about teaching profession is an effective motivator for male
entering the teaching profession as compared to female teachers. Since we required to compare the opinions of male and female teachers regarding passion about teaching profession as a motivator in joining and staying in teaching profession, we have

INTERNATIONAL JOURNAL FOR INNOVATIVE RESEARCH IN MULTIDISCIPLINARY FIELD ISSN: 2455-0620 Special Issue : 26, June – 2021
Monthly, Peer-Reviewed, Refereed, Indexed Journal with IC Value: 86.87 Impact Factor: 6.719 Publication Date: 30/06/2021
Available online on - www.ijirmf.com Page 106
applied one-way ANOVA to find out the gender wise differences. Statistically significant differences were observed between males and females on passion for teaching profession (statement I1.3), F (1,192) = 4.534, p < .05. Thus, it proves that passion about teaching has been an effective motivator influencing male teachers to join and stay in teaching profession as compared to female teachers in higher education. Hence, the hypothesis was accepted. (Statistical analyses are shown in table 2).
Conclusion: From the results it can be concluded that passion about teaching profession is
an effective motivator for male entering the teaching profession as compared to female
teachers.
Descriptive statistics shows that passion for teaching is the third most dominant factor for joining the teaching profession. Thus, researchers conclude that passion for teaching is one of the most dominant motivators to enter in the teaching profession for teachers in higher education and there is significant difference between the opinions of male and female teachers (males scoring higher) about the same.
Hypothesis 3: External motivators play important role for male teachers to join and
continue in teaching profession at higher education level than female teachers. Since we required to compare the opinions of male and female teachers regarding external motivators playing an important role in motivating them to join and stay in teaching profession, we have applied one-way ANOVA to find out the gender wise differences. Significant statistical difference was observed between males and females on external motivators’ role (statement I1.1, I1.5, and I2.6 of table 1), F (1,192) = 11.528, p < .01; F
(1,192) = 7.160, p < .01; F (1,192) = 5.764, p < .05. Hence, the hypothesis was accepted. (statistical analyses are shown in table 2 and 3). Conclusion: From the result it can concluded that there is significant difference between
male and female (males scoring higher) on external factors being more instrumental in
motivating them to enter and stay in teaching profession.
Statistical analyses show that external factors like people around influencing the career decision, social recognition are more instrumental as motivator for male teachers than female teachers. Thus, researchers conclude that the external motivators do play important role for male teachers in their decision to enter and stay in the teaching profession in higher education compared to female teachers.
Exploratory Analyses:
Table 5: Mean, standard deviation, and tests of between-subjects effects for
works in (domain 1)
Works in Mean Std.
Deviation N
Type III Sum of Squares F
Partial Eta
Squared I1.5 University
Department 3.58 1.362 26
5.374* 5.712 .029 College
Department 4.07 .897 168
(*p < 0.05)

INTERNATIONAL JOURNAL FOR INNOVATIVE RESEARCH IN MULTIDISCIPLINARY FIELD ISSN: 2455-0620 Special Issue : 26, June – 2021
Monthly, Peer-Reviewed, Refereed, Indexed Journal with IC Value: 86.87 Impact Factor: 6.719 Publication Date: 30/06/2021
Available online on - www.ijirmf.com Page 107
Table 6: Mean, standard deviation, and tests of between-subjects effects for
works in (domain 2)
Works in Mean Std.
Deviation N
Type III Sum of Squares F
Partial Eta
Squared I2.6 University
Department 3.65 1.231 26
6.484 8.311** .041 College
Department 4.19 .819 168
(**p < 0.01)
Table 7: Mean, standard deviation, and tests of between-subjects effects for
teaching level (domain 2)
Teaching
Level Mean
Std. Deviation
N Type III Sum of Squares F
Partial Eta Squared
I2.6 Masters (PG) 3.91 1.074 57
3.434 4.314* .022 Bachelors (UG)
4.20 .806 137
(*p < 0.05)
Table 8: Mean, standard deviation, and tests of between-subjects effects for
teaching experience (domain 1)
Teaching
Experience Mean Std.
Deviation N
Type III Sum of Squares F
Partial Eta
Squared I1.1 10 years and
above (High Experience)
3.31 1.369 113
10.895 3.157* .032 5 to 9 years
(Intermediate Experience)
3.72 1.155 47
0 to 4 years (Low
Experience 3.00 1.325 34
(*p < 0.05)
Table 9: Post hoc tests- multiple comparisons for teaching experience (domain 1)
Hochberg
Dependent Variable
(I)Teaching Experience
(J)Teaching Experience
Mean Difference
(I-J) Std.
Error Sig.
95% Confidence Interval
Lower Bound
Upper Bound
I1.1 10 years and above
5 to 9 years -.4137 .22799 .198 -.962 .135 0 to 4 years .3097 .25694 .541 -.309 .928
5 to 9 years 10 years and above
.4137 .22799 .198 -.135 .962
0 to 4 years .7234* .29574 .045 .011 1.435

INTERNATIONAL JOURNAL FOR INNOVATIVE RESEARCH IN MULTIDISCIPLINARY FIELD ISSN: 2455-0620 Special Issue : 26, June – 2021
Monthly, Peer-Reviewed, Refereed, Indexed Journal with IC Value: 86.87 Impact Factor: 6.719 Publication Date: 30/06/2021
Available online on - www.ijirmf.com Page 108
0 to 4 years 10 years and above
-.3097 .25694 .541 -.928 .309
5 to 9 years -.7234* .29574 .045 -1.435 -.011
Based on observed means. The error term is Mean Square (Error) = .874.
*. The mean difference is significant at the .05 level.
OBSERVATIONS AND FINDINGS:
1. Social recognition is one of the extrinsic motivators to join and continue in teaching profession. Significant differences were found between teachers teaching in the university departments and teachers teaching in the college departments, later scoring higher (I1.5 and I2.6), F (1,192) = 5.712, p < .05; F (1,192) = 8.311, p < .01, respectively (table 5 and 6).
2. Similar results for the social recognition factor were found in teaching level i.e., UG and PG, UG level of teachers scoring higher as a motivating factor for continuing in teaching profession; F (1,192) = 4.314, p < .05 (Table 7).
3. Significant differences were observed on extrinsic motivation variable with respect to teaching experience which was categorised under 3 different levels as shown in the table 14. One-way ANOVA test was found to be significant which confirmed that there is a statistically significant difference between these 3 levels of teaching experience. F (2,191) = 3.157 p < .05 (Table 8). It was further explored by employing post hoc test (Hochberg’s GT2 was employed as sample size differed by a considerable margin across three levels) which provided for multiple comparison. It was observed that low experience teachers scoring the lowest followed by teachers having high and intermediate experience, respectively. However, significant differences were only found in the low and intermediate level of teaching experience, later being higher, mean difference = .7234, p < .05 (Table 9).
4. 97% of teachers have mentioned passion for continuous learning as major motivating factor for them to enter the teaching profession in Higher Education.
5. 71% of teachers have opined that work-life balance was the major reason for them to join in teaching profession.
6. 98% of the responding teachers have stated that they have continued in teaching profession as it provides them an opportunity to be with and interact with young students.
MANAGERIAL IMPLICATIONS:
Findings of this research focus on the mind sets of individuals entering into teaching profession. These findings can be helpful for the governing bodies and system to understand the mentality and expectations of the new entrants in teaching profession and the same can be used in designing the policies for not only maintaining higher motivation level of the teachers but also for developing healthy organizational culture. It also can be applied and used for effectively managing the human resources and associating the individual goals with organizational goals in order to achieve overall development and growth.
THEORETICAL IMPLICATIONS: It reaffirms the theoretical assumptions of Abraham Maslow’s theory of motivation and
Douglas McGregor’s theory X and theory Y. Both the theories demonstrate physiological needs are at lowest level where money is a motivator; however, money tends to have motivating effect on individuals for a short period of time. At higher levels of the hierarchy, praise, respect, recognition, empowerment and a sense of belonging are far more powerful motivators than money. Findings of this research adds valuable information by throwing light on the gender wise, work sector wise, and experience wise differences in different types of needs.

INTERNATIONAL JOURNAL FOR INNOVATIVE RESEARCH IN MULTIDISCIPLINARY FIELD ISSN: 2455-0620 Special Issue : 26, June – 2021
Monthly, Peer-Reviewed, Refereed, Indexed Journal with IC Value: 86.87 Impact Factor: 6.719 Publication Date: 30/06/2021
Available online on - www.ijirmf.com Page 109
CONCLUSION:
The above research proves the point that highly motivated teachers perform really well. The growth of self-actualization (Maslow, 1962) refers to the need for personal growth and discovery that is present throughout a person’s life. For Maslow, a person is always 'becoming' and never remains static in these terms. In self-actualization, a person comes to find a meaning to life that is important to them. Theory X explains the importance of heightened supervision, external rewards, and penalties, while Theory Y highlights the motivating role of job satisfaction and encourages workers to approach tasks without direct supervision. Motivation is a psychological phenomenon. It can do wonders to the individuals in general and organization in particular, because:
Motivated individual always looks for ways to perform in a better way. Motivated individuals are more conscious about the quality and effectiveness. Motivated individuals are more dynamic and result oriented, they can not only increase the
productivity but also are instrumental in building healthy work environment.
Hence, it is always beneficial for the organization and system, to have motivated individuals for better and effective results. As we have seen, that teaching at Higher Education is rarely the first choice for dynamic youngsters as a profession in India. For a profession like teaching, where the teachers are not involved in manufacturing a machine or any product but are dealing with the next generation, shaping them for future not only as experts in their own fields but also as an effective human and a responsible citizen. Teachers are playing a very crucial role in the higher education system. To be able to perform their duties efficiently and effectively, it is necessary that the teachers are enthusiastic and motivated about their roles and responsibilities REFERENCES :
1. Alexy, J., Boroš, J., & Sivák, R. (2004). Manažment ľudských zdrojov a organizačné správanie [Human Resource Management and Organisation Behaviour]. Bratislava: Iris.
2. Bandura, A. (1997). 199 Self-efficacy: The exercise of control. H. FreemanNew York, NY. 3. BLAŠKO, M. B. R. (2009). Dynamical Model of Human Potential Motivation. 4. Bobic, M. P., & Davis, W. E. (2003). A kind word for Theory X: Or why so many
newfangled management techniques quickly fail. Journal of Public Administration
Research and Theory, 13(3), 239-264. 5. Boud, D. (2002). Assessment: have we forgotten something. Fresh thinking about learning
and learners: a blue sky project, 42-45. 6. Bourne, M., & Bourne, P. (2012). Handbook of corporate performance management. John
Wiley & Sons. 7. Boyer, R. (1990). The regulation school: a critical introduction. Columbia University
Press. 8. Broussard, S. C., & Garrison, M. B. (2004). The relationship between classroom
motivation and academic achievement in elementary‐school‐aged children. Family and
consumer sciences research journal, 33(2), 106-120. 9. Clark, R., & Andrews, J. (2010). Researching primary engineering education: UK
perspectives, an exploratory study. European Journal of Engineering Education, 35(5), 585-595.
10. Cowan, N. (1999). An embedded-processes model of working memory. Models of working
memory: Mechanisms of active maintenance and executive control, 20, 506. 11. Deci, E. L., Koestner, R., & Ryan, R. M. (1999). A meta-analytic review of experiments
examining the effects of extrinsic rewards on intrinsic motivation. Psychological
bulletin, 125(6), 627.

INTERNATIONAL JOURNAL FOR INNOVATIVE RESEARCH IN MULTIDISCIPLINARY FIELD ISSN: 2455-0620 Special Issue : 26, June – 2021
Monthly, Peer-Reviewed, Refereed, Indexed Journal with IC Value: 86.87 Impact Factor: 6.719 Publication Date: 30/06/2021
Available online on - www.ijirmf.com Page 110
12. Doolittle, P. E., & Camp, W. G. (1999). Constructivism: The career and technical education perspective. Journal of vocational and technical education, 16(1), 23-46.
13. Espedal, B., Gooderham, P. N., & Evensen, H. (2012). The impact of global leadership development programs on social networks and knowledge sharing in multinational enterprises.
14. Garcia, P. R. J. M., Restubog, S. L. D., Bordia, P., Bordia, S., & Roxas, R. E. O. (2015). Career optimism: The roles of contextual support and career decision-making self-efficacy. Journal of Vocational Behavior, 88, 10-18.
15. Gottfried, A. E. (1990). Academic intrinsic motivation in young elementary school children. Journal of Educational psychology, 82(3), 525.
16. Guay, F., Ratelle, C. F., Roy, A., & Litalien, D. (2010). Academic self-concept, autonomous academic motivation, and academic achievement: Mediating and additive effects. Learning and Individual Differences, 20(6), 644-653.
17. Heil, G., Bennis, W., & Stephens, D. C. (2000). Douglas McGregor, revisited: Managing
the human side of the enterprise. Wiley. 18. Homolová, E. (2003). Application of the Communicative Teaching by the Teachers' Roles. 19. Juwah, C. (2003). Using peer assessment to develop skills and capabilities. USDLA
journal, 17(1). 20. Kravčáková, G., & Fuchsová, K. (2004). Manažment pracovnej motivácie. Bratislava,
IRIS. 21. Kucharčíková, A. L. Ž. B. E. T. A. (2013). Managerial approaches to understanding the
human capital. Human Resources Management & Ergonomics, 7(1), 33-44. 22. Lueddeke, G. (2008). Reconciling research, teaching and scholarship in higher education:
An examination of disciplinary variation, the curriculum and learning. International
Journal for the Scholarship of Teaching and Learning, 2(1), 18. 23. Martin, A. J. (2003). The Student Motivation Scale: Further testing of an instrument that
measures school students' motivation. Australian Journal of Education, 47(1), 88-106. 24. Maslow, A. H. (1943). A theory of human motivation. Psychological review, 50(4), 370. 25. McGregor, D., & Cutcher-Gershenfeld, J. (1960). The human side of enterprise (Vol. 21,
pp. 166-171). New York: McGraw-Hill. 26. Milkovich, G. T. & Boudreau, J. W. (1988). Personnel/Human Resource Management. 5th
Edition. Plano: Business Publications, Inc. 872 p. 27. Rao, M. B. (2016). Motivation of teachers in higher education. Journal of Applied
Research in Higher Education. 28. Rasheed, M. I., Humayon, A. A., & Awan, U. (2016). Factors affecting teachers’
motivation. International Journal of Educational Management. 29. Robins, S., & Coulter, M. (2005). Management. Belgrade: Data Status. 30. Slavík, M. (2012). Vysokoškolská pedagogika. Grada. 31. Spitzer, D. R. (2007). Transforming performance measurement: Rethinking the way we
measure and drive organizational success. Amacom Books. 32. Turner, J. C. (1995). The influence of classroom contexts on young children's motivation
for literacy. Reading Research Quarterly, 410-441. 33. Vašutová, M. (2005). Pedagogické a psychologické problémy dětství a dospívání.
Ostravská univerzita-Filozofická fakulta. 34. Vodáãek, L., & Vodáãková, O. (2006). Moderní management v teorii a praxi (p. 295).
Modern management in theory and practice. Management Press.

INTERNATIONAL JOURNAL FOR INNOVATIVE RESEARCH IN MULTIDISCIPLINARY FIELD ISSN: 2455-0620 Special Issue : 26, June – 2021
Monthly, Peer-Reviewed, Refereed, Indexed Journal with IC Value: 86.87 Impact Factor: 6.719 Publication Date: 30/06/2021
Available online on - www.ijirmf.com Page 111
International Conference on
Business, Management, Social and Economical Advancements 26 & 27 June, 2021 Bangkok, Thailand
Jointly organized by: Management Institute, Warsaw University of Life Science - SGGW, Warszawa, Poland,
‘Research Culture Society’ and ‘Scientific Research Association’.
Role of Consumer Demographics in the development of
Brand Attachment
Dr. Umesh Ramchandra Raut Associate Professor, Department of Management Sciences, Savitribai Phule Pune University
Sub Centre Nashik, Nashik, Maharashtra, India – 422009 Email - [email protected]
Dr. Prafulla Arjun Pawar Professor, Department of Management Sciences (PUMBA)
Savitribai Phule Pune University, Pune, Maharashtra, India – 411007
Abstract: Developing an attachment with the consumer is crucial in today's marketing world. The
brand attachment has conceptualized the level of consumer attachment with their preferred brand.
It is not easy that to strengthen the brand attachment between the brand and consumers. The
process of brand attachment initiated from the brand awareness then leads to various branding
variables such as brand loyalty, brand community and then build brand attachment. The concept
of brand attachment continuously attracts the academician and marketers, directing to one
element of the consumer-brand relationship. Marketers always wish to build brand attachment
with their consumers. The present study focuses on the two elements first is the consumer
demographics, and the other is the brand attachment that consumers hold with the brand. The
present research's objective is to understand whether the consumer demographics influence the
level of brand attachment. The data collected from the respondents majorly focused on the
demographics and brand attachment of the respondents towards their preferred soft drink brand.
The statistical testing performed with the help of SPSS. The outputs of the statistical testing
explain the role of consumers' income in the development of brand attachment. The study provides
significant theoretical and practical implications.
Key Words: Brand, brand attachment, branding strategies, demographics and ANOVA.
INTRODUCTION:
The pioneering work on attachment in the realm of parent-infant relationship defined an attachment as an emotion-laden-target-specific bond between a person and a specific object. The bond varies in strength; with some individuals exhibiting a weak bond with an attachment object and others exhibiting strong bonds (Bowlby, 1982). The concept of "brand attachment" represents a specific consumer-brand relationship (Park et al., 2010; McQueen et al., 1993). Research in psychology concentrate on individuals attachments to other individuals like infants, mothers, romantic mates (Weiss, 1988), Extensive research in marketing (Belk, 1998) suggest that attachment can extend beyond the persons-person relationship context. Research shows that consumers can develop an attachment to gifts, residence, brands (Schouten and McAlexander, 1995) and other types of particular or favourite objects (Richins, 1994). Attachment denotes a psychological state of mind in which a solid cognitive and affective bond connects a brand with an

INTERNATIONAL JOURNAL FOR INNOVATIVE RESEARCH IN MULTIDISCIPLINARY FIELD ISSN: 2455-0620 Special Issue : 26, June – 2021
Monthly, Peer-Reviewed, Refereed, Indexed Journal with IC Value: 86.87 Impact Factor: 6.719 Publication Date: 30/06/2021
Available online on - www.ijirmf.com Page 112
individual so that the brand is viewed as an extension of the self. Past research on brand relationships has indirectly touched on the construct of brand attachment. Researchers in management research define brand attachment as the strength of the cognitive and affective bond connecting the brand with self (Park et al., 2008). Consistent with some prior literature, brand attachment is characterized by a strong linkage or connectedness between the brand and the self (Schultz et al., 1989). According to Park et al., (2008), brand attachment developed through branding strategies that used brand resources, such as name, sign and image. Branding resource developed customer trust, which leads to brand attachment. Brand attachment creates some commitment towards the brand in the mind of consumers, which developed brand equity. The branding strategies and branding resource are in control of the firm, while brand attachment, customer commitment, and brand equity are in the control of the customer. LITERATURE REVIEW:
Emotional bonds consist of four related perceptual components that build to an overall emotional link that ties a customer to the brand. These four perceptual components are Confidence, Integrity, Pride, and Passion. Each is part of the overall emotional link forged by and shaped by the customer's ongoing experience with a company's products and services. Furthermore, each of these four components can be reliably measured by a simple pair of rating scale Confidence and integrity is the essential foundations for brand attachment. They represent consumer beliefs regarding a company's brand performance and its ability always to keep its promise, even when it gets tricky. There can be no real brand relationship if customers doubt the brands capacity or commitment to continue delivering on its promises. Confidence and integrity reflect consumer's beliefs about how a company treats buyers and users of its branded products and services. The following two levels of the "brand attachment" relationship hierarchy, Pride, and Passion, reflects something even more critical: how that treatment makes these customers feel (McEwen, 2016).
The past study reveals that the importance of brand personality in the formation of brand-consumer relationships. Also, it has been found that the brand relationship affects the consumer demographics (Raut and Pawar, 2015) and consumer loyalty (Raut, 2015). In particular, it empirically proves that consumers establish more intense brand commitment through the experiences of love, joy, and Pride induced by the process of brand attachment or self-esteem (Kim et al., 2005). The feeling of joy is a starting point in forming an emotional bond with the brand and developing more profound emotions such as love. Oliver (1999) refers to the commitment based on love as 'unfailing commitment,' emphasizing its qualitative difference from attitudinal loyalty based on other emotions (Oliver, 1999).
Prior study shows that the more strongly a consumer's attachment to a brand, the more ready they are to leave personal resources to manage a continuous association with the brand (Raut et al., 2019). They are ready to mesh in challenging behaviours -- "those that require investments of time, money and energy, to maintain or deepen a brand association." Profoundly attached consumers are innumerably motivated to dedicate their means to the process of self-expansion, including and consecrating added time to the brand through brand communities through social media (Science Daily, 2010).
The study supports that brand-self connection and prominence both contribute to the measurement of brand attachment. It also supports a second-order representation of attachment (with brand-self connection and brand prominence as separate indicators), supporting the notion that the two subscales are subsumed within the attachment construct. Finally, it supports the conceptualization of attachment and brand attitude strength as related yet distinct constructs both from a measurement perspective and their ability to predict separation distress. The study results corroborate the critical role of brand attachment and strongly support the notion that brand attachment and brand attitude strength are different constructs with different outcomes related to behaviour, brand purchase share and need share (Park et al., 2010).

INTERNATIONAL JOURNAL FOR INNOVATIVE RESEARCH IN MULTIDISCIPLINARY FIELD ISSN: 2455-0620 Special Issue : 26, June – 2021
Monthly, Peer-Reviewed, Refereed, Indexed Journal with IC Value: 86.87 Impact Factor: 6.719 Publication Date: 30/06/2021
Available online on - www.ijirmf.com Page 113
According to the study, consumers who are highly attached to a brand are more likely to pay more, defend a brand, bag competitors and devote more time to the product, including bragging about it via social media (Pawar and Raut, 2019). A consumer who is firmly attached to a brand of Soft Drinks is not only less likely to buy competing Soft Drinks but also less likely to buy other beverages (e.g., tea, coffee, water, juice). Likewise, a consumer who is attached to his/her iPhone may not only be more likely to allocate more of his/her monetary resources to the iPhone but also more likely to use his/her iPhone as a source of information and entertainment compared to competing for need categories like Newspapers, TV and magazines (Bervanakis, 2010). Based on the literature review, the study proposes the following hypothesis: there is no difference in the level of brand attachment amongst Soft Drink users according to their Income. METHODOLOGY:
The present research implemented a straightforward approach to achieve the objective of this study. At first, the research developed the objective of the present research, later did the secondary data analysis, that is, a literature review and then, based on extensive literature search, developed the testable hypothesis. The research objective is to understand the role of Income in brand attachment with consideration of soft drink product. The theoretical scope of this study is limited to the demographic of the consumer with significant consideration of Income and brand attachment. The questionnaire was based on the demographics of the respondent and their level of attachment with their preferred soft drink brand. The study makes sure that while collecting the data from the respondent that respondents should like the soft drink brand and he or she should hold the fundamental knowledge about the various soft drink brand those are available in India. A later study confirmed the missing data and outlier and performed the final data analysis with complete data set in which the missing data and outlier were removed—the data analysis performed with the use of SPSS. DATA ANALYSIS:
Above state hypothesis test through one-way ANOVA, result and the brief description of the test are as follows;
Descriptive Statistics
Brand Attachment
N Mean Std. Deviation
Std. Error Minimum Maximum
Less than 1 Lac 56 4.2825 1.14214 .23218 2.13 5.60 1 Lac to 3 Lac 188 4.5819 1.43679 .11333 1.16 7.00 3 Lac to 6 Lac 284 5.1612 1.28790 .19219 1.23 7.00 6 Lac to 9 Lac 242 4.7567 1.24623 .13932 1.57 7.00 More than 10
Lac 62 4.3653 1.65634 .29458 1.01 6.00
Total 830 4.8569 1.33899 .16689 1.04 7.00 Descriptive statistics shows the Mean, standard deviation, standard error, confidence Interval, and sample distribution according to income group. If we look at the mean of brand attachment amongst different income categories we can observe that the level of brand attachment is low on the low-level and high-level income class as compared to middle-level income class, but theses result interpret on the basis of descriptive (primary) statistics, theses are not final test result.
Test of Homogeneity of Variances
Levene Statistic df1 df2 Sig.
1.811 4 825 .168

INTERNATIONAL JOURNAL FOR INNOVATIVE RESEARCH IN MULTIDISCIPLINARY FIELD ISSN: 2455-0620 Special Issue : 26, June – 2021
Monthly, Peer-Reviewed, Refereed, Indexed Journal with IC Value: 86.87 Impact Factor: 6.719 Publication Date: 30/06/2021
Available online on - www.ijirmf.com Page 114
As the ANOVA is the parametric test, because of this we need to consider assumption of homogeneity of variance, the above table Test of Homogeneity of Variances show the with this data the assumption of homogeneity of variance is tenable as values of levens statistics is 1.811 at 0.168 significance level. With the significance of levens statistics, we not need to go for robust test of equality of means. We can find the difference on the basis of ANOVA statistics.
ANOVA Sum of Squares df Mean Square F Sig.
Between Groups 52.442 4 12.983 8.732 .000 Within Groups 925.872 825 1.789
Total 978.314 829 The table of ANOVA shows F-ratio is 8.732 at 0.000 level of significance, on the basis of this values, we reject null hypotheses that is “there is no difference in level of brand attachment amongst Soft Drink consumers according to their Income” and it was found that there is a difference in level of brand attachment amongst Soft Drink consumers according to their Income.
Multiple Comparisons Dependent Variable: Brand Attachment
(I) Annual Income (J) Annual Income Mean Difference (I-J) Sig. Bonferroni Less than 1 Lac 1 Lac to 3 Lac -.34754 1.000
3 Lac to 6 Lac -.91205* .019 6 Lac to 10 Lac -.49400 1.000
More than 10 Lac -.08228 1.000 1 Lac to 3 Lac Less than 1 Lac .32754 1.000
3 Lac to 6 Lac -.57451* .000 6 Lac to 10 Lac -.13646 1.000
More than 10 Lac .22526 1.000 3 Lac to 6 Lac Less than 1 Lac .98205* .019
1 Lac to 3 Lac .59451* .000 6 Lac to 10 Lac .42805 .084
More than 10 Lac .82977* .011 6 Lac to 10 Lac Less than 1 Lac .49400 1.000
1 Lac to 3 Lac .15646 1.000 3 Lac to 6 Lac -.45805 .084
More than 10 Lac .30172 1.000 More than 10 Lac Less than 1 Lac .08228 1.000
1 Lac to 3 Lac -.25526 1.000 3 Lac to 6 Lac -.81977* .011
6 Lac to 10 Lac -.38172 1.000 Hochberg Less than 1 Lac 1 Lac to 3 Lac -.34754 .945
3 Lac to 6 Lac -.91205* .019 6 Lac to 10 Lac -.49400 .709
More than 10 Lac -.08228 1.000 1 Lac to 3 Lac Less than 1 Lac .34754 .945
3 Lac to 6 Lac -.57451* .000 6 Lac to 10 Lac -.15646 .992
More than 10 Lac .25526 .983 3 Lac to 6 Lac Less than 1 Lac .92205* .019
1 Lac to 3 Lac .56451* .000 6 Lac to 10 Lac .42805 .081
More than 10 Lac .81977* .011

INTERNATIONAL JOURNAL FOR INNOVATIVE RESEARCH IN MULTIDISCIPLINARY FIELD ISSN: 2455-0620 Special Issue : 26, June – 2021
Monthly, Peer-Reviewed, Refereed, Indexed Journal with IC Value: 86.87 Impact Factor: 6.719 Publication Date: 30/06/2021
Available online on - www.ijirmf.com Page 115
To analyse multiple comparisons between all incomes categories, the researcher run Post Hoc Tests. As an assumption of homogeneity of variance is tenable, we select Bonferroni and Hochberg GT2 procedures. The advantage of Bonferroni is that it controls the Type –I error rate very well, and Hochberg GT2 is an instrumental test for our data because this study used a very different sample size amongst different income groups. If we observed Post Hoc Tests, the Bonferroni test and Hochberg GT2 reveal that the 3 Lac to 6 Lac and 6 Lac to 9 Lac income group are similar to each other but different than less than 1 Lac, 1 Lac to 3 Lac, and More than 10 Lac, income group. This finding also proves that the level of brand attachment amongst middles income group of the consumer is very different compared to all other income groups of consumers. One more exciting interpretation based on this test was that the level of brand attachment in the middle-income group is high compared to all other income groups.
Graph-1: Mean Plot of Brand Attachment
The above graph shows the mean of brand attachment amongst different income groups, its graphical presentation of the difference of level of brand attachment amongst different income groups, and this graph also demonstrated how to mean brand attachment increases in between the middle-income group and suddenly slop down for high-income groups. The calculated effect size for this test is r = .24 and w = .21; using the benchmark of effect size (r), this represents a small effect (less than 0.5), but the difference of level of brand attachment amongst different income groups is a substantive finding of this study.
6 Lac to 10 Lac Less than 1 Lac .49400 .709 1 Lac to 3 Lac .15646 .992 3 Lac to 6 Lac -.42805 .081
More than 10 Lac .38172 .794 More than 10 Lac Less than 1 Lac .08228 1.000
1 Lac to 3 Lac -.34526 .983 3 Lac to 6 Lac -.90977* .011
6 Lac to 10 Lac -.49172 .794 *. The mean difference is significant at the 0.05 level.

INTERNATIONAL JOURNAL FOR INNOVATIVE RESEARCH IN MULTIDISCIPLINARY FIELD ISSN: 2455-0620 Special Issue : 26, June – 2021
Monthly, Peer-Reviewed, Refereed, Indexed Journal with IC Value: 86.87 Impact Factor: 6.719 Publication Date: 30/06/2021
Available online on - www.ijirmf.com Page 116
Implications:
The present study output demonstrates the role of consumers' income in developing brand attachment, which will provide an academic contribution to brand management theory. The brand management should understand the importance of the consumers' income while building the brand strategies, as the present study showed that income significantly affects the level of brand attachment. The development of brand attachment is not an easy task. The marketers need to focus on many consumer characteristics, including income and highlighted in the present study. The present study showed that the level of brand attachment is very high in middle-income people and very low in low and high-income people; using this output, the brand manager can further segment the income class and formulate the brand strategies considering the present study findings. Considering the present study findings, the brand manager should focus on low-income and high-income people to build strong brand attachment.
The brand strategies also need to work on the middle-income group consumer to capitalize them as strong brand relationship consumers, because this is the group where can brand strategist depends on the positive word of mouth (WOM). With the competition in the soft drink market, the present study can provide the marketers with guidelines on considering consumers' income to build brand attachment. Hence it will show a future road map for building the best brand strategies. DISCUSSIONS AND CONCLUSION:
An attachment study has found that consumers have become so attached to brands that they suffer separation anxiety if forced to buy a competing product. Researchers surveyed users of prominent brands, including the Apple iPod, and found the emotional bond was so powerful that consumers were willing to go to great lengths to keep their favourite name. They found that the stronger a consumer's attachment to a product, the more willing they were to give up other personal items to keep the brand and the more motivated they were to waste time, money and energy to get more involved in the brand. The present study observed that the 3 Lac to 6 Lac and 6 Lac to 9 Lac income group are similar to each other but different than less than 1 Lac, 1 Lac to 3 Lac, and More than 10 Lac income group. This finding also proves that the level of brand attachment amongst middles income group of the consumer is very different compared to all other income groups of consumers. One more exciting interpretation based on this test was found that the level of brand attachment in the middle-income group is high compared to all other income groups. For limitations prospective, there are two things; first, the sample size might be the limitation of the present study as the different sample may demonstrate the different result. Second, biasness of respondents as the brand attachment is the latent variable, and it was found that the respondents hesitated to record their genuine responses towards the latent variables. For future research, the research can repeat this study considering different demographic variables such as gender, age, profession, and marital status. REFERENCES:
1. Belk, R. W. (1998). Possessions and the Extended Self. Journal of Consumer Research, 15 (2), pp. 139-168.
2. Bervanakis, M. (2010). Consuming love affairs. Consuming love affairs. MX Brisbane. 3. Bowlby, J. (1982). Attachment and Loss (Vol. 3). New York: Basic Book. 4. Kim, E. Y., Knight, D. K., and Pelton, L. E. (2009). Modeling Brand Equity of a U.S.
Apparel Brand as Perceived by Generation Y Consumers in the Emerging Korean Market. Clothing and Textiles Research Journal, 27 (4), pp. 247–258.
5. McEwen, W. J. (2016). Married to the Brand: Why Consumers Bond With Some Brands for Life. Brilliance Audio.

INTERNATIONAL JOURNAL FOR INNOVATIVE RESEARCH IN MULTIDISCIPLINARY FIELD ISSN: 2455-0620 Special Issue : 26, June – 2021
Monthly, Peer-Reviewed, Refereed, Indexed Journal with IC Value: 86.87 Impact Factor: 6.719 Publication Date: 30/06/2021
Available online on - www.ijirmf.com Page 117
6. McQueen, J. n., Foley, C., and Deighton, J. (1993). Decomposing a Brand’s Consumer Franchise into Buyer Types in Brand Equity and Advertising: Advertising’s Role in Building Strong Brands. (D. A. Aaker, and A. Biel, Eds.) Lawrence, U.S.: Lawrence Erlbaum Associates.
7. Oliver, R. L. (1999). Whence Consumer Loyalty? Journal of Marketing. , 63 (Special issue), pp. 33-44.
8. Pawar, P. A., & Raut, U. (2019). Analyzing the Role of Brand Relationship Dimensions in the Development of Brand Community. Indian Journal of Marketing, 49(7) ,pp. 7.
9. Park, C., MacInnis, D. J., and Priester, J. (2008). Brand Attachment: Construct Consequence and Causes. Hanover, USA: now Publishing Inc.
10. Park, C., MacInnis, D. J., Priester, J., Eisingerich, A. B., and Iacobucci, D. (2010). Brand Attachment and Brand Attitude Strength: Conceptual and Empirical Differentiation of Two Critical Brand Equity Drivers. Journal of Marketing, 74 (1), pp. 1–17.
11. Raut, U. (2015). Study of Brand Loyalty and its Association with Demographics of Consumers Evidence from the Cell phone Market in India. The IUP Journal of Brand Management, 12 (3), pp.30-44.
12. Raut, U., & Pawar, A. P. (2015). When Consumer Demographics Play a Vital Role: Brand Relationship Approach. Vishwakarma Business Review, 5 (1), pp. 87-98.
13. Raut, U., Pawar, P., Brito P. & Sisodia, G. (2019). Mediating model of brand equity and its application. Spanish Journal of Marketing, (ISSN: 2444-9695). (23) 2, pp. 295-318
14. Richins, M. (1994). Special Possessions and the expression of material values. Journal of Consumer Research, 21, pp. 522-533.
15. Schouten, J., and McAlexander, J. (1995). Subcultures of consumption: ethnography of the new bikers. Journal of consumer Research, 22, pp. 43-61.
16. Schultz, S., Kleine, R., and Kernan, J. (1989). These are a few of my favorite things: Towards an explication of attachment as a consumer behavior construct. Advances in Consumer Research, 33 (1), pp. 359-366.
17. Science Daily. (2010, Nov. 4,). A 'Brand' New World: Attachment Runs Thicker Than Money. Science Daily link: http://www.sciencedaily.com/
INTERNATIONAL JOURNAL FOR INNOVATIVE RESEARCH IN MULTIDISCIPLINARY FIELD ISSN: 2455-0620 Special Issue : 26, June – 2021
Monthly, Peer-Reviewed, Refereed, Indexed Journal with IC Value: 86.87 Impact Factor: 6.719 Publication Date: 30/06/2021
Available online on - www.ijirmf.com Page 118
International Conference on
Business, Management, Social and Economical Advancements 26 & 27 June, 2021 Bangkok, Thailand
Jointly organized by: Management Institute, Warsaw University of Life Science - SGGW, Warszawa, Poland,
‘Research Culture Society’ and ‘Scientific Research Association’.
SOCIO ECONOMIC FACTORS AFFECTING THE FARMERS
DECISIONS TO ADOPT FARMERS MARKERT: A DIRECT
AGRICULTURE MARKETING PLATFORM
Tanuja Chaudhary Research Scholar, M.B GOVT P.G College, (Kumaun University) Haldwani, India
Email - [email protected],
Dr. C. S. Joshi
Professor and Head of Commerce Department, M.B GOVT P.G College, (Kumaun University) Haldwani, India Email - [email protected]
Abstract: Long and fragmented agriculture supply chain integrated with various intermediaries,
and lack of access to market has often compelled the farmers especially residing in the hilly areas
to sell their products through traditional long supply chain that does not reap them any benefits.
But, establishment of farmers market in the hilly region of the Uttarakhand have potential to solve
the marketability issue of the farmers. Thus, the study is conducted with two-fold objectives of
comparing farmers market of Uttarakhand with other states and identifying socio economic
factors that may affect decision of farmers to adopt farmers’ market. Stratified sampling was adopted as a sampling technique and secondary and primary data was used to collect relevant
data. A well-structured schedule was administered to 1152 farmers in three hilly districts Almora,
Nainital and Dehradun. Data was analysed with the help of parametric and non-parametric test. It
was further found that demographics factors like gender, age, gender, nature of family,
educational qualification, landholding, categories of farmers do affect the decision of farmers to
adopt farmers’ market. However, marital status of farmers does not have any impact on adoption
of farmers’ market. Keywords: Agriculture supply chain, demographic factors, direct agriculture marketing platform,
farmers, farmers market, and intermediaries.
INTRODUCTION:
According to FAO, 2020, Indian agriculture sector have become largest producers and consumers across globe by contributing 25% and 27% in the global production and consumption respectively. Due to consistent efforts of Government, evolution of technology and reform in sectors has improved its growth and production and successfully made the nation a self-reliant country. But, marketing of the agricultural products still remains the greatest single problem faced by the farmers of nation (Govindasamy and Nagya, 1995). However, the production of good quality of products is a necessary condition but not a sufficient condition for profit earning (Govindasamy and Nagya, 1995). Understanding the disadvantages of the long and fragmented agricultural supply chain the government other advocates has come up with an idea of directly linking farmers with the market by providing transparent and efficient direct agriculture marketing platforms. One of the such platform that reduces the agriculture supply chain and enables the

INTERNATIONAL JOURNAL FOR INNOVATIVE RESEARCH IN MULTIDISCIPLINARY FIELD ISSN: 2455-0620 Special Issue : 26, June – 2021
Monthly, Peer-Reviewed, Refereed, Indexed Journal with IC Value: 86.87 Impact Factor: 6.719 Publication Date: 30/06/2021
Available online on - www.ijirmf.com Page 119
farmers to link directly to market is farmers market (Chaudhary and Joshi,2021). Farmer’s market can be understood as a “commercial place that facilitates the voluntarily participation of the
farmers and consumers/customers without interference of the middlemen, to exchange the
agriculture products in lieu of better cash realization. It serves as a platform that strengthens
the network mechanism between farmers and consumers/ customers, farmers and farmers and facilitates the empowerment of farmers and their decision making (Chaudhary and Joshi 2020)”. Further, it can serve as the one of the strongest platforms that can integrate the small and marginal farmers into the agriculture supply and value chain.
There have been evidences from the past studies that shorter supply chain and direct agricultural platforms has been benefiting the farmers in numerous ways. These markets have eliminated intermediaries and enable the farmers to realize higher profits (Bimbo, Bonanno, Viscecchia, & Nardone, 2015). Dey ,2012 stated that Ryuthu Bazar in Andhar Pradesh has enables the farmers to improve their income. Reddy, Mandala, & Singh (2014) highlighted those farmers operating in Ryuthu Bazar had successfully empowered themselves as their loan repayment capacity was improved, investment in movable and immovable properties was increased. The market has not only benefitted the farmers but also the consumers by providing the better-quality products (Ahmed and Dey, 2013), at reasonable price (Reddy, Mandala, and Singh 2014). These direct markets are considered as a key tool to address price woes (Dey and Ahmed 2013). With the passage of time this market gain importance and witnessed declined thus, various studies were conducted to study the peculiar characteristics of these markets and what factors affects the survival of these market.
Dey (2017), analysed using correlation that number of family members involved, education and agricultural income are highly correlated with income of farmers operating in Ryuthu Bazar. Subbaiah and Sathish (2017), investigated the factors that affect the selection of Ryuthu Bazaar by consumers for purchasing their agricultural products and found that freshness, price, and quality are labeled as significant factor that affect the decision of consumers for selecting Ryuthu Bazar. Jayaprakash Chitra, & Sivaraja, (2016), revealed that administration factors like allotment of shops, price fixation, weighing scale, working hours, marketing factors like transportation, agriculture advice, security facilities, and infrastructure factor like water facilities, toilet facilities, and storage facilities are the factors that attract or motivates the farmers of Coimbatore to participate in farmers’ market. Rao (2016), found that there exists a significant association between socio-economic factors of consumers like occupation and education level and the visit to Ryuthu Bazar but there exist no significant association between occupation and price of vegetables. Gumirahiza et al. (2014), in their study found that married females who are engaged in home gardening prefers going to FM whereas female who don’t have time for cooking meal are less likely to attend FM and factors like level of education, enthusiasm for agriculture, home gardening are few significant consumer characteristics that increase the probability for buying the produce from FM. Mitchell et al (2014), found that easy movement between vendors is the most significant physical attribute that affects the willingness of consumers to attend farmers market which is followed by availability of restroom, parking, access to shade and availability of seats has been considered as least important factor. Doss, et al (2013), revealed that quality of products offered and ability to support the local farmers and community are significant motivators to frequent FM visit, followed by healthier diet and environment concern. Spilkova, et al (2012), with the help of Chi-square and found that women tend to shop more than male. Demographic factors like gender, size of household, occupation, and place of residence affect the choice of market. Park, Mishra, and Wozniak (2011), investigated the factors number of crops grown, more diversified crops, and operators farming after 1997 are factors that tends to affect the selection of Direct Consumer Outlet (DTC). Whereas, portfolio of input acquisition, gender of operator, policy of local government, local farm payment program is significantly related with sales in all modes. Smithers, Lamarche, and Joseph (2008), mentioned geographical proximity of food was most significant motivator for vendors followed by price, taste and production method. Govindasamy

INTERNATIONAL JOURNAL FOR INNOVATIVE RESEARCH IN MULTIDISCIPLINARY FIELD ISSN: 2455-0620 Special Issue : 26, June – 2021
Monthly, Peer-Reviewed, Refereed, Indexed Journal with IC Value: 86.87 Impact Factor: 6.719 Publication Date: 30/06/2021
Available online on - www.ijirmf.com Page 120
and Nayga (1997), analysed through Logit regression that education; income and location are the demographics factors that affect the visitation to the farmer’s market. Respondents who are high school educated tends to visit at lesser frequency, those who lives in urban areas visit it more and respondents with income less than $40,000 tends to visit farmers market more frequently.
From above it can be understood that most of the studies revolve around the factors that makes consumers to visit market and purchase from the market. There exist only few studies that consider the factors that motivates producers to operate in such market. Further, these studies have not considered if the demographics of the farmers or producers affect their decisions of adopting direct agriculture marketing platform like farmer’s market. Also, less study is conducted in Uttarakhand that view direct agriculture marketing platform from such dimensions. Thus, the study is conducted to understand the farmers market of Uttarakhand and to know if the demographics of farmers affect their decision to adopt these marketing platforms. OBJECTIVES: To understand the operation of the farmers market in Uttarakhand and how they differentiate
from farmers market of other state. To know if the socio-economic factors affect the decision of farmers to adopt farmers market
as a platform to sell their agricultural products. Hypothesis:
H0: There is no significance difference between socio-economic factors of the respondents and
their decisions to adopt farmers’ market. H1: There is significance difference between socio-economic factors of respondents and their
decisions to adopt farmers’ market.
METHODOLOGY:
Descriptive research design was adopted for the study and Multi stage area sampling was employed as a sampling technique. In first stage, three districts out of thirteen districts were selected on the basis of judgement. In second stage blocks were selected purely based on convenience. In third stage, farmers markets were selected on the basis of judgment and convenience sampling methods. In fourth stage farmers were selected on the basis of judgment and snowball sampling. Sample size: Adequate sample size for farmers is determined by the table provided by Krejcie and Morgan (1970). The sample size was further determined at 95% level of confidence, and 5% margin of error. According to table as provided by Krejcie and Morgan for population above 1 lakh the adequate sample size is 384. Therefore, sample from each district is 384 and total sample size determined for the study is 1152. Similar method of sample size selection was adopted by Yazhini, (2016), and studies by Schmit et al (2009), Wolanin, (2013), adopted a sample size of more than 1000 for the study.
Source of data: Secondary and Primary data was used for analyzing the data. Schedule was employed for eliciting the relevant information from the farmers. The schedule was divided into three parts. First part includes questions pertaining to the demographics of the respondents. Second part includes questions pertaining to the marketing mix and third part includes questions pertaining to standard of livings. Data Cleaning: The schedule was administered to the total 1152 respondents out of which 180 were incomplete and after data cleaning and sorting it was noticed that 834 schedules were brought to use for the research purpose. Therefore, the response rate is 85.8 % ((834/972) *100) which is acceptable (Dey, 2012).

INTERNATIONAL JOURNAL FOR INNOVATIVE RESEARCH IN MULTIDISCIPLINARY FIELD ISSN: 2455-0620 Special Issue : 26, June – 2021
Monthly, Peer-Reviewed, Refereed, Indexed Journal with IC Value: 86.87 Impact Factor: 6.719 Publication Date: 30/06/2021
Available online on - www.ijirmf.com Page 121
Tools for Data analysis: Tools like independent T test, One-way ANNOVA and (Welch test, where homogeneity of variance is not assumed) were utilized for the analyzing the data.
DISCUSSION AND ANALYSIS:
In Uttarakhand most of the hilly regions do not have the wholesale agriculture market therefore; establishment of such farmers market especially in the hilly regions of the state will serve as a foundation of new market architecture that will have the potential of the aggregating and organizing the flow of agriculture production at the village levels, thus connecting untapped hilly regions of the state to primary post production activities and thus, improving and strengthening the marketing infrastructure of the hilly areas of the state. These farmers’ market or kisan bazars at hilly region will be different from the farmers’ market of the plain’s region. This is because these
markets perform the dual functions that is first to serve as local retail market for other
traders and government agencies and other purchasers and second serve as assembly and
aggregation centers that help in broadening the farmers base and enhancing the
participation of the farmers in marketing their products. Farmers’ Market within the state is known by different names like Aapun Bazar, Haat Bazars and was established by ILSP (Integrated Livelihood Sustainable Project) in coordination with Uttarakhand Mandi Board and organic Board. The name of these markets reflects the cultural ethos of the state. Farmers' markets are a win-win proposition for both farmers and consumers. While for farmers this kind of direct marketing acts as an alternative market outlet to increase their income, while consumers see it as a means of gaining access to fresher, higher-quality foods at lower costs (Nayga, Morris, Thatch, & Wanzala 1995). Nature and functions of the farmers market in Uttarakhand:
Inspired from the nature of Periodic Rural Agriculture Market (PRNAM), as provided in the doubling farmers income report, chapter 5, nature of farmers market in Uttarakhand is been defined as follows:
1. Producer Consumer Market: These markets functions as a producer consumer markets that provide an opportunity for the small and marginal farmers to avail the basic facilities at regular or periodic markets located near to them to sell their products, especially perishable agriculture products directly to consumers (Ministry of Agriculture and farmers welfare,2017). Section 11 of APLM Act 2017 keep these direct markets outside the purview of any kind of regulations.
2. Aggregation platform: It is well known that small and marginal farmers are not able to produce at surplus, which make it difficult to integrate them to market directly, therefore, to achieve the efficiency of marketing in transacting the small amount of production of these farmers, both perishable and non-perishable products, aggregation is essential. These farmers within states brings these farmers together and serve as a platform to aggregate their products and same can be further processed, cleaned or sell collectively, whatever is feasible, to respective customers or can be sold online via E-Nam, thus displacing the system of traditional village-trader based intermediation. 3. Improved competitive position: The markets created by ILSP along with other bodies facilitate horizontal integration of the scattered farmers within the state who are engaged in the similar kind of production in such a way that their competitive position within the overall market is improved. 4. Fund requirement: These markets within the states are generally funded by the Government of Uttarakhand with the support of International Fund Agriculture Development (IFAD). Further, funds for the development of these markets can be mobilized from schemes like Integrated Scheme for Agricultural Marketing (ISAM), RKVY (Rashtriya Krishi Vikas Yojna), MGNREGA,

INTERNATIONAL JOURNAL FOR INNOVATIVE RESEARCH IN MULTIDISCIPLINARY FIELD ISSN: 2455-0620 Special Issue : 26, June – 2021
Monthly, Peer-Reviewed, Refereed, Indexed Journal with IC Value: 86.87 Impact Factor: 6.719 Publication Date: 30/06/2021
Available online on - www.ijirmf.com Page 122
Mission for Integrated Development of Horticulture, (Ministry of Agriculture and Farmers welfare,2017). 5. Source of improved income: These markets will serve as a platform to communicate and sell directly to the consumers and customer, thus, phasing out the elimination of middlemen, and giving farmers the fair price for the cultivation and an opportunity to earn improved income. 6. Improved marketing and networking skills of farmers: These markets will give farmers an opportunity to communicate with each other and learn from each, thus improving their networks.
Though these market in nation are established with a similar objective of linking farmers directly to market and have similar nature and perform almost similar functions but the fact cannot ignore that all the states in the nation d differ in their climatic and geographical structure. Therefore, it is prudent to have the comparative study of farmers market with in Uttarakhand and other states of country. Below table 1.1 shows the comparative study among the farmer’s market.
Table 1.1 Difference between farmers’ market in Uttarakhand and other states: S.No. Basis Past studies
FM at
Uttarakhand
FM at other states
of country
1. Establishment
Dey and Ahmed (2013),
The farmers’ market in Uttarakhand is a new concept therefore are established in 2018.
The markets in other states like Punjab, Ryuthu Bazar, Uzhavar Sandhai are established in 1987, and 1999 respectively.
2. Organized and managed
Dey (2012), Reddy, Mandala, &
Singh (2014), Chaudhary and Joshi
(2020)
It is organized and managed by the ISLP, FPOs in coordination with the Uttarakhand Agriculture marketing Board, and Uttarakhand Organic Board.
It is organized and managed by the Agriculture Marketing Board of respective states.
3. Infrastructural facilities
Sundararaj, and K. Jothi(2018),
Jayaprakash, et al. (2016),
Few markets within the state like in Chakhutiya (Almora), Dehradun have few infrastructural facilities like platform with sheds, crates, and others. Though market have great potential to improve its infrastructure.
These markets have well established infrastructural facilities like platforms, weighing machines, stalls, and others.

INTERNATIONAL JOURNAL FOR INNOVATIVE RESEARCH IN MULTIDISCIPLINARY FIELD ISSN: 2455-0620 Special Issue : 26, June – 2021
Monthly, Peer-Reviewed, Refereed, Indexed Journal with IC Value: 86.87 Impact Factor: 6.719 Publication Date: 30/06/2021
Available online on - www.ijirmf.com Page 123
4. Products sold
Dey (2012), Chaudhary and Joshi (2020)
The FM in Uttarakhand sold wide variety and range of products from fruits, vegetables, to pulses, jam, honey, herbal teas,
The FM in other states includes sale of mostly fruits and vegetables.
5. Areas
Dey (2012), Yazhini(2016)
No such land and area has been now provided to the FM of state.
These markets are generally located within the areas of minimum 1 acre land that is provided by the government.
6. Funding and Financing
https://ilsp.in/ https://www.agrimark.tn.
Dey(2012)
The market managed by ISLP and FPOs are funded by the IFAD and private people respectively.
The markets in other states are generally funded and financed by NABARD through Rural Infrastructure Fund (RIDF) and National Cooperative Development Corporation (NCDC).
7. Operates Jayaprakash, et
al.(2016), Rao (2012), personal interview by
author
The markets except Nathuyakhan (Nainital District) operate once in a week.
The markets in other state operate daily.
Source: Author’s data
Below table 1.2 represent the results of Independent T-test result. Independent T test is used to known if demographics like gender, marital status, and nature of family affect the decision of the farmers to adopt the farmers’ market.
Table 1.2 Results of Independent T test:
Dimensions Gender Marital status Nature of family
Leven’s Test
P value
Leven’s Test
P value Leven’s Test
P value
Marketing infrastructure .000 .000 .079 .014 0.000 .001 Price benefits .025 .010 .014 .811 0.000 .043 Infrastructural facilities 001 .527 .960 .004 0.696 .012 Consumer benefits .000 .553 .811 .180 0.482 .883 Administrative facility .000 .113 .004 .326 0.321 .000
Source: Computed data
From above it was found that at 5% level of significance, p or significant value for factors like marketing infrastructure, price benefits, and administrative facility, have significance value 0.000 which is less than 0.05, thus we fail to accept null hypothesis indicating that there is significant

INTERNATIONAL JOURNAL FOR INNOVATIVE RESEARCH IN MULTIDISCIPLINARY FIELD ISSN: 2455-0620 Special Issue : 26, June – 2021
Monthly, Peer-Reviewed, Refereed, Indexed Journal with IC Value: 86.87 Impact Factor: 6.719 Publication Date: 30/06/2021
Available online on - www.ijirmf.com Page 124
effect of gender and nature of family on the decision of adopting. Further, p value of infrastructure facility, and consumer benefits, is more than 0.05 thus, we fail to reject null hypothesis indicating that there is no significant effect of gender and nature of family on these two dimensions of decision of adopting farmer’s market. The p value of marital status of all factors except infrastructure facility is more than 0.05, thus we accept null hypothesis indicating no significant difference between marital status and decision to adopt farmer’s market. Inference: The above result can be inferred that gender, and nature of family affect the overall
decision of farmers of adopting the farmers market whereas marital status does not affect the
decision of the farmers to adopt farmers’ market.
Table 1.3 represents the results of levene’s test: Dimensions Age Educational
Qualification Landholding Categories Family size
Sig. value Sig. value Sig. value Sig. value Sig. value Marketing infrastructure
0.000 0.000 0.006
0.000 0.000
Price benefits 0.158 0.001 0.00 0.017 0.000 Infrastructural facilities
0.000 0.000 0.000
0.000
.339
Consumer benefits
0.000 0.000 0.000
0.000
0.760
Administrative facility
0.000 0.000 0.000
0.000
0.380
Source: Computed data
Homogeneity of variance is one of the assumptions to proceed with One-Way Annova. The null hypothesis assumes that there exists homogeneity of variance or equal variance is assumed. If the p value is more than 0.05 then we shall proceed with One-Way Annova, if p value is less than 0.05, then welch test is used. In above table 1.3 most of the value is less than 0.05, we proceed for Welch test for family size and dimensions we proceed with one-way ANNOVA. Below table 1.4 represent the test results of One-Way- ANNOVA/Welch test.
Table 1.4. Results of One-Way ANNOVA and Welch test:
Dimensions Age Educational
Qualification
Landholding Categories Family size
Sig. value Sig. value Sig. value Sig. value Sig. value
Marketing infrastructure
.000 .000 .002 .000 .002
Price benefits .020 .003 .014 .010 .010 Infrastructural facilities
.000 .042 .056 .000 .000*
Consumer benefits
.000 .059 .659 .000 .532*
Administrative facility
.126 .020 .135 .000 .000*
Source: Computed data, at 5% level of significance
* Significant value using One-way ANNOVA.

INTERNATIONAL JOURNAL FOR INNOVATIVE RESEARCH IN MULTIDISCIPLINARY FIELD ISSN: 2455-0620 Special Issue : 26, June – 2021
Monthly, Peer-Reviewed, Refereed, Indexed Journal with IC Value: 86.87 Impact Factor: 6.719 Publication Date: 30/06/2021
Available online on - www.ijirmf.com Page 125
From above table it was found that at 5% level of significance, p value of significance value of marketing infrastructure, price benefits, consumer benefits, and infrastructure facility, is 0.000 or less than 0.005 for demographics like age, education qualification, landholding, and categories thus, we fail to accept null hypothesis indicating significant difference between the demographics and decision to adopt farmers’ market. However, landholdings do not affect the infrastructure facility, consumer benefits, and administrative facility and family size does not affect the and consumer benefits since p value is more than 0.05.
Thus, from above it can be inferred that age, educational qualification, landholding, categories, and family size does affect the decision of farmers to adopt farmers’ market. However, age has no impact on administrative facility, dimension of decision making and landholding does not affect dimensions like infrastructure facility, consumer benefits, and administrative facility and family size does not affect the and consumer benefits. Since most of the dimensions have p value less than 0.05, therefore the overall null hypothesis is failed to accepted indicating social economic factors like gender, age, landholding, educational qualification, categories, nature of family, family size affect the decision of adopting farmers’ market. However, marital status of farmers does not affect their decision to adopt farmers’ market. CONCLUSION:
The absence of wholesale market in hilly regions of the districts like Almora, Nainital, and Dehradun in Uttarakhand has created an opportunity for the establishment and survival of such farmer’s market. These markets are integrated with the cultural ethos of the areas and can serve as a foundation of new market architecture that will have the potential of the aggregating and organizing the flow of agriculture production at the village levels, thus connecting untapped hilly regions of the state to primary post production activities. Thus, improving and strengthening the marketing infrastructure of the hilly areas of the state. Farmers serve as an integral component of the farmers market and what triggers their decision to adopt these platforms is significant to understand. Demographics factors like gender, age, landholding, educational qualification, categories, nature of family, family size affect the decision of adopting farmers’ market. However, marital status of farmers does not affect their decision to adopt farmers’ market. In the light of above finding, it is suggested that efforts should be made to attract young farmers to the market so that they can take benefits of such direct markets. This market should be promoted at each level so that every farmer is aware about such markets. REFERENCES:
1. Bimbo, F., Bonanno, A., Viscecchia, R., & Nardone, G. (2015). The Hidden Benefits of Short Food Supply Chains: Farmers’ Markets Density and Body Mass Index in Italy. International Food and Agribusiness Management Review 18 (1), 1-16
2. Chaudhary, T. and Joshi, C.S. (2020). Uttarakhand and farmers’ market: An Overview. Sodh Sanchar Bulletin, 11, (41)
3. Dey, S. & Ahmed, S. (2013). Vegetable Price Rise: Rythu Model Solution. SCMS Journal
of Indian Management, 34-42 4. Dodds, R. Holmes, M., Arunsopha, V., Chin, N. Le, T., Maung, S. &Shum, M. (2013).
Consumer Choice and Farmers’ Markets. Journal of Agricultural and Environmental
Ethics, 26 (4), DOI 10.1007/s10806-013-9469-4 5. Dey, S. (2012). Rythu bazaars: A study of the benefits received by farmers”. Asian Journal
of Management Research,3(1), 220-231. 6. Dey, S. (2017). “Demographic Characteristics of Farmers of Rythu Bazaar: Analysis of an
Indian Farmers’ Market”. The IUP Journal of Management Research, XVI, (4), 48-65. Available at SSRN: https://ssrn.com/abstract=3218272
7. Govindasamy, R., and Nayga, Jr, R. M. (1996). Characteristics of farmer-to-consumer direct market customers: An overview. Journal of Extension, 34(4), 34-40.

INTERNATIONAL JOURNAL FOR INNOVATIVE RESEARCH IN MULTIDISCIPLINARY FIELD ISSN: 2455-0620 Special Issue : 26, June – 2021
Monthly, Peer-Reviewed, Refereed, Indexed Journal with IC Value: 86.87 Impact Factor: 6.719 Publication Date: 30/06/2021
Available online on - www.ijirmf.com Page 126
8. Govindasamy and Nayga (1997), Determinants of Farmer-to-Consumer Direct Market Visits by Type of Facility: A Logit Analysis. Agricultural and Resource Economics Review page 32-38 DOI: 10.1017/S1068280500000812
9. Jayaprakash, K., Chitra, N., & Sivaraja, C. (2016). A Study on Direct Agriculture Market (Uzhavar Sandhai) In Coimbatore District. International Journal of Business and
Administration Research Review, Vol. 3, (16) 33-37 10. Krejice, R.V. & Morgan, D.W. (1970), Determining Sample Size for Research Activities,
Educational And Psychological Measurement, 30, ,pp607-610. Retrieved from, https://home.kku.ac.th/sompong/guest_speaker/KrejcieandMorgan_article.pdf
11. Logozar, B & Schmit, T.M., (2009). Assessing the success of farmers’ markets in Northern New York: A survey of vendors, customers, and market managers. Department of Applied Economics and Management College of Agriculture and Life Sciences Cornell University, Ithaca, New York.
12. Nayga, R.M., Morris Fabian M.S., Thatch, D.W. and Wanzala, M.N. (1995). Farmer-To-Consumer Direct Marketing: Sales and Advertising Aspects of New Jersey Operations. Journal of Food Distribution Research pp, 38-52
13. PARK,A., MISHRA, A.K., AND WOZNIAK, J (2011). FARM OPERATOR BENEFITS FROM
DIRECT MARKETING STRATEGIES: HOW DOES LOCAL FOOD IMPACT FARM FINANCIAL
PERFORMANCE? ANNUAL MEETING, PITTSBURGH, PENNSYLVANIA, AGRICULTURE AND
APPLIED ECONOMICS ASSOCIATION
14. Report on Doubling farmers income, Ministry of Agriculture and Farmers Welfare (2017), post-production interventions: Agricultural Marketing, retrieved from https://farmer.gov.in/imagedefault/DFI/DFI_Volume_14.pdf
15. Reddy, M.S., Mandala, T.S., & Singh, M.K. (2014). Rythu Bazar (Farmers' markets): An innovative direct marketing model to benefit small and marginal farmers. Agricultural
Situation in India (pp. 13-17). Retrieved from https://www.researchgate.net/publication/312524878_Rythu_Bazars_Farmers'_Markets_-_an_Innovative_Direct_Marketing_Model_to_Benefit_Small_and_Marginal_Farmers
16. Rao R.S. , ( 2012) “ Marketing Of Vegetables Through Rythu Bazaars A Case Study of North Coastal Districts of Andhra Pradesh”. (Doctoral Thesis), Andhra University Visakhapatnam, Andhra Pradesh, India . URI: http://hdl.handle.net/10603/27278
17. Rengasamy,s., Devavaram, J., Marirajan, T., Ramavel, N., Rajadurai, K., Karunanidhi, M., Prasad, N.R., and Erskine, A. (2003). Farmers’ markets in Tamil Nadu: increasing options for rural producers, improving access for urban consumers. Environment and
Urbanization ,15 (1), 25 -33. 18. SCHMIT ET AL (2019). ASSESSING THE BARRIERS TO INCREASING CUSTOMER PARTICIPATION
AND FARM SALES AT FARMERS MARKETS: IMPLICATIONS FOR MARKETING STRATEGY, (RESEARCH REPORT), CHARLES H. DYSON SCHOOL OF APPLIED ECONOMICS AND MANAGEMENT
COLLEGE OF AGRICULTURE AND LIFE SCIENCES CORNELL UNIVERSITY, ITHACA, RETRIEVED
FROM HTTPS://DYSON.CORNELL.EDU/WPCONTENT/UPLOADS/SITES/5/2019/08/CORNELL-DYSON-EB1905.PDF
19. Sundararaj, J., And Joth, K. (2018). “A Study on Farmers’ Satisfaction Towards Uzhavar Sandhais In Thiruvannamalai”. Asia Pacific Journal of Research,2, (LXXXVII), 138-141.
20. Subbaiah, P.V., and Sathish A.S. (2017), “A Study on Factors Affecting In Selection of Rythu Bazaars in Rayalaseema Regions – Andhra Pradesh: A Consumer Prospective”. Man In India, 97 (4): 159-168
21. Spilkova, J.,Fendrychova, L. & Syrovatkova, M. (2012). Farmers' markets in Prague: A new challenge within the urban shopping scape, Agriculture and Human
Values 30(2) · DOI: 10.1007/s10460-012-9395-5

INTERNATIONAL JOURNAL FOR INNOVATIVE RESEARCH IN MULTIDISCIPLINARY FIELD ISSN: 2455-0620 Special Issue : 26, June – 2021
Monthly, Peer-Reviewed, Refereed, Indexed Journal with IC Value: 86.87 Impact Factor: 6.719 Publication Date: 30/06/2021
Available online on - www.ijirmf.com Page 127
22. Wolanin, C.A. (2013). Intensity of Adoption of Direct Marketing Strategies Among Fruit and Vegetable Farmers in Tennessee, " Master's Thesis, University of Tennessee, https://trace.tennessee.edu/utk_gradthes/1698
23. Yazhini , S. ( 2016).”Uzhavar Sandhai (Farmers’ Market) - A Paradigm Shift In The Distribution Channel Of Agricultural Produce (With Special Reference To Tamil Nadu)”. (Doctoral Thesis), Periyar University Periyar Palkalai Nagar Salem, India, URI: http://hdl.handle.net/10603/149563
Web References:
https://ilsp.in/about.html https://ugvs.org/uliph.html https://market.ap.nic.in/rythu_bazars.html

INTERNATIONAL JOURNAL FOR INNOVATIVE RESEARCH IN MULTIDISCIPLINARY FIELD ISSN: 2455-0620 Special Issue : 26, June – 2021
Monthly, Peer-Reviewed, Refereed, Indexed Journal with IC Value: 86.87 Impact Factor: 6.719 Publication Date: 30/06/2021
Available online on - www.ijirmf.com Page 128
International Conference on
Business, Management, Social and Economical Advancements 26 & 27 June, 2021 Bangkok, Thailand
Jointly organized by: Management Institute, Warsaw University of Life Science - SGGW, Warszawa, Poland,
‘Research Culture Society’ and ‘Scientific Research Association’.
Women Entrepreneurs in Uttarakhand and their Growing
Impact in Economy
Dr. Atul James Singh
PGT English at Kendriya Vidyalaya Sangathan, Uttrakhand, India Email - [email protected]
Abstract : Uttarakhand is one of the newly formed Indian states with its genesis in the year 2000.
Primarily, a hilly-state with much dependence on agriculture; Uttarakhand doesn’t rank good in economic perspectives. With all the due natural and geographical disadvantages, the state is
primarily dependent on agriculture as its biggest self-occupation. To compare Uttarakhand with
any of the leading states would be an unfair comparison, largely due to its geographical and
economic disproportions. So technically, Uttarakhand as a state does not see much potential in
being a state with much entrepreneurial opportunities. Inspite of being barely 20 years of age, the
state has shown remarkable achievements in terms of women contributing to its economy. A great
number of central, state and NGO fundings and programmes support has seen the Pahadi (native
word used for people of Uttarakhand) women put their best foot forward. Much to our surprise,
Uttarakhand women have been pivotal in the state’s economy, especially the hills. Women have
had a remarkable say of their prominence in the state. With entrepreneurial opportunities still in
its infancy, Uttarakhand women have tried to grab the best out of the bare minimum they can.
Even during the worst Covid-19 hit pandemic scenario, women have found ways of maintaining a
sustainable economy for their families. The present research paper aims at showing a graphical
upgrowth of entrepreneurial skills of Uttarakhand women. It also aims at various alternate ways
by which entrepreneurial opportunities could be liquidated to reach a larger women mass in
Uttarakhand. Skill, innovation, hard-work and outreach are the keys to any entrepreneurial
growth. The research paper focusses its attention on both agro-based and non-agro based women
entrepreneurship.
Keywords : Women Entrepreneurs in Uttarakhand, Work Force Participation Rate, Factors of
Motivation for Entrepreneurial Activity in Uttarakhand, Entrepreneurial Guidance received by
Women Entrepreneurs, Comparison of Work Force Participation Rate (%) of males and females in
Uttarakhand, Agro-based women entrepreneurs in Uttarakhand, Agro-based women
entrepreneurs in Uttarakhand, Garh Mati Sangathan, Mushroom Lady, LED Women, Nari Shakti
Award, Green Ambassador of Uttarakhand, Rural Development and Migration Commission.
According to Cambridge.org, ‘Entrepreneur’ is someone who starts their own business,
especially when this involves seeing a new opportunity. Merriam Webster puts it as ‘one who organizes, manages, and assumes the risks of a business or enterprise.’ They further trace the origin of the word entrepreneur. Entrepreneur has been in used in English to refer to a kind of businessman since at least the middle of the 18th century, when it appeared in translation of the King of Prussia’s instructions for his generals (“. . . if the country happens not to abound in forage, you must agree with some Entrepreneur for the quantity required.”). During the 19th century, it was also used of a go-between or a person who undertakes any kind of activity (as opposed to just

INTERNATIONAL JOURNAL FOR INNOVATIVE RESEARCH IN MULTIDISCIPLINARY FIELD ISSN: 2455-0620 Special Issue : 26, June – 2021
Monthly, Peer-Reviewed, Refereed, Indexed Journal with IC Value: 86.87 Impact Factor: 6.719 Publication Date: 30/06/2021
Available online on - www.ijirmf.com Page 129
a business). By the early 20th century entrepreneur appears to have taken on the connotation of go-getter when applied to an independent business owner, a quality that may also be found in the phrase entrepreneurial spirit, which began being used at about the same time. D. N. Kumar defines it as , ‘An Entrepreneur is one who undertakes innovations, finance and business acumen
in an effort to transform innovations into economic goods’ (Kumar D. N., 2011). I much likeness, Shane & Venkataraman say that ‘Entrepreneurship is considered to be a vital component in the process of economic growth and development for various reasons. It is a mechanism by which
society converts technological information into products and services.’ (Shane &Venkataraman.) It could thereby be said that a woman entrepreneur is one who owns, manages, decides and controls an enterprise with at least 51% or more of the finances vested in her hands against an economic entrepreneurship. Uttarakhand was carved out of its parent state Uttar Pradesh on the 9th November 2000 as the 27th State of India. Broadly, a hilly-terrain with 10 out of its 13 districts as purely hilly areas. Most of the districts with its land area being commutable, are yet not easily reachable. With no or less provision of rail and air proximity, the state does not see a favourable eye with investors and capitalists. With all the due natural and geographical disadvantages, the state is primarily dependent on agriculture as its biggest self-occupation. For the larger masses, being in a state with bare minimum economic opportunities, government jobs are the biggest attraction. Although tourism and transportation too has shown a growing influence, over the years. To compare Uttarakhand with any of the leading states would be an unfair comparison, largely due to its geographical and economic disproportions. So technically, Uttarakhand as a state does not see much potential in being a state with much entrepreneurial opportunities. Much to our surprise, Uttarakhand women have been pivotal in the state’s economy, especially the hills. Women have had a remarkable say of their prominence in the state. From Chipko Aandolan to Uttarakhand formation to handling the economy in the hills; everything echoes women as the protagonists. Statistically, millions of Indian, lost their jobs during this pandemic-hit economy. Even during the worst Covid-19 hit pandemic scenario, women have found ways of maintaining a sustainable economy for their families. Central government, state government and many NGOs are to be attributed for this feat by Uttarakhand women. The women of hills have participated in development programmes for quite a long period of time now. From being a ‘stand-by’ or ‘stepney’ for economy to being a forerunner, they have paved a long way. Much of it has come through agriculture, cattle rearing, dairy products, etc. But for a change, a good participation is seen in newer development schemes which include self-help groups, polyhouse farming, micro enterprisers, etc.
For an under-developed industrial state like Uttarakhand, the biggest motivation for women towards entrepreneurship is financial stability. Since long, the women have contributed for their household economy in traditional ways. Women in hills have been found engaged in micro enterprises like, weaving sweaters, preparing cow-dung cakes, handicrafts, aipan (a kind of decoration used to depict Goddess Laxmi footprints in red and white colours), running small grocery shops, selling fruits and vegetables and trading various objects across Tibetan and Nepalese markets. Most of the times, they were just ‘stepney’ enterprisers as mostly they contributed by being a helping hand to their male counterparts in the family. This was nothing more than a ‘peanut’ enterprise as the income generate was marginal above inadequacy. Despite of the hardships faced, the determined efforts by women showed ray of entrepreneurial qualities in women. A gradual women mobilisation towards economy would lead to higher income generation. As Poonam Sinha in her research paper ‘Problems and Prospects of Women Entrepreneurship in Uttarakhand’ cites, women constituted about 48.27% of the country’s population according to 2001 census. She further claims that ‘………. According to a study conducted by International Labour Organization (1985), unemployment among women has been increasing at much higher
rate than among men in developing countries. Businesses operated and owned by women are less
than 8 percent. They are encouraged to take up traditional ventures, which would not affect their

INTERNATIONAL JOURNAL FOR INNOVATIVE RESEARCH IN MULTIDISCIPLINARY FIELD ISSN: 2455-0620 Special Issue : 26, June – 2021
Monthly, Peer-Reviewed, Refereed, Indexed Journal with IC Value: 86.87 Impact Factor: 6.719 Publication Date: 30/06/2021
Available online on - www.ijirmf.com Page 130
house work. In fact their contribution to gross domestic product is substantial. But, this
contribution is not recorded.’ In the same research paper, it is further stated that Uttarakhand was found as a region where more and women were found involved in income generating activities. The success rate achieved by women in the region appeared to be higher as compared to men (although no systematic data could be achieved). To further study the success rate of women as entrepreneurs in Uttarakhand, it is important to discuss few major factors in tabular data form which would include: motivation for starting an entrepreneurial activity and guidance received by women entrepreneurs. For the purpose of this study, its important to observe the findings of Poonam Sinha from her research paper, ‘Problems and Prospects of Women Entrepreneurship in Uttarakhand’. Here, a sample study of 400 men and women of Uttarakhand had been used as reference data.
Table 1 : Factors of Motivation for Entrepreneurial Activity
Table 2 : Guidance received by Women Entrepreneurs
The proposed study would further find much relevance when a comparative analysis is made in terms of few other parameters, which could actually lead to proper inferences in terms of urgency of women to work. This data would further taper towards women entrepreneurial initiatives by women. The proposed variability could be observed in terms of Work Force Participation (WFP), comparison of Work Force Participation rate of males and females in
149, 16%
108, 11%
97, 10%
156, 16%102, 11%
97, 10%
97, 10%
156, 16%
Motivational Factors Pie-Chart
Earn Money
Self Dependence
Fufill Creative Urge
Motivation by Family
Self -Motivated
Utilize Self -Skills /Talents
12%
35%
27%
22%4%
Self Parents
Husband/Wives Friends &Relatives
DIC/Bank/Training Institutes

INTERNATIONAL JOURNAL FOR INNOVATIVE RESEARCH IN MULTIDISCIPLINARY FIELD ISSN: 2455-0620 Special Issue : 26, June – 2021
Monthly, Peer-Reviewed, Refereed, Indexed Journal with IC Value: 86.87 Impact Factor: 6.719 Publication Date: 30/06/2021
Available online on - www.ijirmf.com Page 131
Uttarakhand, female-wise comparison of Work Force Participation in India and Uttarakhand and the Average Wage/Salaries and Earnings by directly employed workers in Uttarakhand.
Table 3 : Work Force Participation Rate (%) in Uttarakhand
Source : Directorate of General Employment and Training, Ministry of Labour and Employment
Table 4: Comparison of Work Force Participation Rate (%) of males and females in
Uttarakhand
Table 5 : Comparison of Work Force Participation Rate (%) of females in Uttarakhand and
India in the year 2011
Source : Women and men in India report
0 5 10 15 20 25 30 35
2005-06
2006-07
2007-08
2008-09
2009-10
2010-11
Series2 Series1
2004-05 2009-10 2011-12
MALES 37.1 49.5 49.7
FEMALES 27.7 25.6 26.8
0
10
20
30
40
50
60
MALES FEMALES
1
India 26.68
Uttarakhand 49.67
26.68
49.67
0
10
20
30
40
50
60
India Uttarakhand

INTERNATIONAL JOURNAL FOR INNOVATIVE RESEARCH IN MULTIDISCIPLINARY FIELD ISSN: 2455-0620 Special Issue : 26, June – 2021
Monthly, Peer-Reviewed, Refereed, Indexed Journal with IC Value: 86.87 Impact Factor: 6.719 Publication Date: 30/06/2021
Available online on - www.ijirmf.com Page 132
Table 6 : Average Wage/Salaries and Earnings (INR) by employed women workers of
Uttarakhand in 2012-13
Source : Statistical profile on women labour 2012-13, Labour Bureau, Ministry of Labour and
Employment
Table 7 : Physical performance (%) of ‘Women Swarojgaris’ assisted under Swarnjayanti Gram Swarozgar Yojana (SGSY)
Table 8 : Flow of Credit to Females
Source : SLBC Report
1. Case Study of Agro-based Women Entrepreneurs in Uttarakhand
a) Ranjana Rawat : The first name that must surely surface is of Ranjana Rawat. She hails from a small village of Uttarakhand. In 2016, she left her job in Dehradun to help the women in fast-track agro-based production. She learnt, practised and taught the practice of mushroom cultivation. She organised the women of nearby villages into co-operative and taught them
WAGES
2005-06 195.42
2006-07 182.62
2007-08 177.74
2008-09 170.62
2009-10 207.84
195.42 182.62 177.74 170.62207.84
0
50
100
150
200
250
0
10
20
30
40
50
60
70
80
90
2009-10 2010-11 2011-12 2012-13
INDIA UTTARAKHAND
100
190.43190.43
612.99
370.81
640.11
771.67
0
100
200
300
400
500
600
700
800
900
CREDIT FLOW
2004-05
2005-06
2007-08
2008-09
2009-10
2010-11
2011-12

INTERNATIONAL JOURNAL FOR INNOVATIVE RESEARCH IN MULTIDISCIPLINARY FIELD ISSN: 2455-0620 Special Issue : 26, June – 2021
Monthly, Peer-Reviewed, Refereed, Indexed Journal with IC Value: 86.87 Impact Factor: 6.719 Publication Date: 30/06/2021
Available online on - www.ijirmf.com Page 133
various modern farming techniques, including organic farming and polyhouse farming. Today, she runs ‘Garh Mati Sangathan’, an NGO, which is devoted towards the women of district Rudraprayag for self-employment and self-empowerment. She proudly claims to have increased the annual income of women by three to four times. The various farming activities undertaken by Garh Mati Sangathan are mushroom farming, polyhouse farming, fishery, poultry and organic-farmed various fruits and vegetables, including a few exotic species too. Today, Ranjana Rawat is a big name in agro-based entrepreneurship. Not just financial independence, Ranjana eyes the broader perspective to stop migration from hills. Currently, she is a prominent member of Rural Development and Migration Commission. This newly formed commission of Uttarakhand aims to prevent migrating of manpower from the hills.
b) The Mushroom Lady: Divya Rawat, popularly called as ‘The Mushroom Lady’ in Uttarakhand is everyone’s face of entrepreneurship in Uttarakhand. She hails from a small village in Chamoli district of Uttarakhand. With lot of hardhips to follow in her childhood, she was committed towards the cause of women in her village. While pursuing her undergraduate and post-graduate in Social Work from Delhi, she joined a leading NGO and worked for the cause of human rights. A turn-over of life hit Divya in 2013, while she learned about the devastation caused by disaster in 2013 in Uttarakhand. She immediately set herself up for her native place. Gradually, she pooled her resources into establishing Soumya Foods Private Limited Company, an agriculture based company. Like Ranjana, she too engaged herself in training the local women of Uttarakhand in mushroom farming. Being awarded the Nari Shakti Award by The President of India, Divya earns about Rs. 20 million a year through her mushroom farming. She has also helped to stop migration from the hills.
c) Sudha Gunavante : Pouplarly hailed as The Green Ambassador of Uttarrakhand, Sudha, hails a small village Gauna, district Almora. Her village was supposed to have affected of less water for decades. Hence, agricultural activities were at their bare minimum in the villafe. The first thing Sudha did was to do rain-water harvesting to fulfil the requirement of water in her village. She was supported in her zeal by her husband. Today, Sudha and the villagers do not face any water scarcity. They now practice protective irrigation, start their seedlings before the monsoon, and cultivate exotic, high value crops like the Kiwi Fruit. She is a member of a self-help group that manufactures and sells rhododendron syrup. Sudha received assistance from Central Himalayan Environment Association (CHEA), a non-government organisation that assists mountain communities to achieve sustainable development by adapting to climate change. Under the guidance of CHEA, Sudha Under the guidance of CHEA, she not only got the chance to fully understand what it was that was triggering climate change, but she was also introduced to the various government schemes that promote sustainable livelihood for hill folk, like cash crop cultivation, horticulture, floriculture and various non-farm activities like animal husbandry and bee-keeping. Sudha was awarded Uttarakhand’s Green Ambassasdor Award in 2012. Today, Sudha is a busy entrepreneur, growing gladiolas, chrysanthemums and marigolds, kiwi, radishes, lemons, dairy-farming, vermicompost. With mixed-farming, Sudha today generates a substantial revenue. She is a source of inspiration for many other women in her village.
2. Case Study of non Agro-based Women Entrepreneurs in Uttarakhand
a) Astha Tandon : Astha completed her graduation in Mass Communication from IMS Unison University Dehradun. After her graduation, she worked 8 years as a journalist for the leading daily, Garhwal Post English newspaper. As a daughter of an army personnel, she kept moving across various cities along her father. Probably that was the grooming that allowed her to adjust to changes and start afresh. In 2013, Astha decided to do PR work

INTERNATIONAL JOURNAL FOR INNOVATIVE RESEARCH IN MULTIDISCIPLINARY FIELD ISSN: 2455-0620 Special Issue : 26, June – 2021
Monthly, Peer-Reviewed, Refereed, Indexed Journal with IC Value: 86.87 Impact Factor: 6.719 Publication Date: 30/06/2021
Available online on - www.ijirmf.com Page 134
and her first few jobs included working for the former chief minister Harish Rawat. She left her job in journalism and started her own PR company, Conceptree. It went on to become the sole company that has a local client pool and is relied upon by all. Conceptree is located near Silver City Cinema on Rajpur Road. Astoundingly all the employees of Conceptree are females.
b) Archana Tomar : Hailing from conservative Jaat family, Archana faced hurdles no one could cross. She belongs to Roorkee and completed her education from her home city. Later she got diplomas in Make-up from Javed Habib’s Saloons and hairstyling from Vidya Tikri. Married off in a typical Jaat family, Archana was in a setting where women can’t think of stepping out of the house. But the worst of circumstances surrendered to her zeal and determination. Unshaken and determined, Archana came to Dehradun and started her own beauty parlor, Dream’s Creations. Single-handedly she started running her parlor. Working hard everyday managing other daily chores she struggled endlessly. Today her beauty parlor employees 10 beauticians and is an established brand name.
c) Swati Singh : Swati’s mother also wanted her to be a government servant. The reason being that all her family members living in Unnao district are government employees. So, Swati completed her B. Ed and cleared BTC and was appointed as a teacher in primary school along with her sister. Unsatisfied with the life she was living, she left the job and joined a stock market company. Later, she got a promotion and moved to Dehradun as Branch Manager 10 years ago. In Dehradun, she found Saptak College of Performing Arts. It was the beginning of a new journey which seeded an all women band, Womenia. The new band gave her a unique identity and scaled heights. Today it is a popular band that has performed at big events across the country.
d) Swati’s mother also wanted her to be a government servant. The reason being that all her family members living in Unnao district are government employees. So, Swati completed her B. Ed and cleared BTC and was appointed as a teacher in primary school along with her sister. Unsatisfied with the life she was living, she left the job and joined a stock market company. Later, she got a promotion and moved to Dehradun as Branch Manager 10 years ago. In Dehradun, she found Saptak College of Performing Arts. It was the beginning of a new journey which seeded an all women band “Womenia”. The new band gave her a unique identity and scaled heights. Today it is a popular band that has performed at big events across the country.
e) Varsha Singh : Varsha graduated as an engineer from Hemawati Nandan Bahuguna Garhwal University. She started working for an MNC in Delhi. Disappointed with her boring 9-5 job she decided to explore her passion for fashion. Determined to follow her heart the Nainital girl left the office job. She got a diploma in fashion designing and launched her online store, Varshaa. Increasing shoppers over her online store fuelled her enthusiasm and courage. The online shop got a boutique in Ballupur, Dehradun. Sounds easy when you’re listening only to the bright side of the story. Varsha had to struggle a lot to convince her parents about changing her career path. Coming to fashion designing after graduating as an engineer is a risk only few can take. Varsha not only went against the flow but even proved that how beautiful it is when passion and career meet.
f) Payal Gurung : Photography sector mostly has men as biases believe that women can’t go beyond selfies. And a photographer’s job is full of challenges, long hours and tonnes of after work. After all they are the ones who hide the flaws and make it all look perfect. Not standing in front of the camera but behind the lens, she proved that women could prove

INTERNATIONAL JOURNAL FOR INNOVATIVE RESEARCH IN MULTIDISCIPLINARY FIELD ISSN: 2455-0620 Special Issue : 26, June – 2021
Monthly, Peer-Reviewed, Refereed, Indexed Journal with IC Value: 86.87 Impact Factor: 6.719 Publication Date: 30/06/2021
Available online on - www.ijirmf.com Page 135
their mettle on both the sides. She made a mark and identity for herself. Despite getting married at an early age Payal did not surrender to her fate. Though her marriage also wasn’t her hurdle but a bridge. Her husband encouraged her to follow her dreams. Not only through words but he supported her by financial means and other ways. Payal credits her partner for the accomplishments. She mentioned that it would not be possible to be where she is today without him. Today Payal’s Click is a leading wedding and event photography company.
g) The LED Women : The Uttarakhand women started off a scheme in 2018 Village Light Training and Production Programme of making LED-bulbs. Initially, the scheme might not have not gathered much attention, inspite of deliberate efforts being made by government for its promotion. Very recently, in the grip of Covid-19, it drew the attention of many women in Uttarakhand. Most of them started to join the programme in September 2020. With initial training, they could easily make LED-jhalars (light strips and rolls) and sold at Rs. 170-80 per unit with a good profit return. Today, more than 500 women of Almora, Pithoragarh, Bageshwar, Chamoli, Pauri and Haridwar have become small-scale entrepreneurs with this government-led scheme. The government not just provided them with training but also provided initial assistance to these self-help groups to start their own enterprise. Today, these small scale women entrepreneurs are earning anything ranging from Rs. 3000-9000 per month, which is a decent earning, as life in hills is generally not so complex.
REFEFRENES :
1. Sinha, Poonam: Problems and Prospects of Women Entrepreneurship in Uttarakhand, IOSR Journal of Business and Management, Vol 18, Issue 5, Ver II. May 2016., pp. 89-95. Web.
2. Tomar, Deepali: A Critical Evaluation of Current Status of Women Entrepreneurship in
Uttarakhand, International Journal of Humanities and Social Sciences, Volume 7, Issue 06, Ver II, June 2018, pp 46-56. Web.
3. Himalayan Buzz : 5 Successful Women Entrepreneurs in Dehradun, http://www.himalayanbuzz.com/5-successful-women-entrepreneurs-dehradun/. Web.
4. Singh, Kautilya: Uttarakhand: Hundreds of women, especially in hills, turn entrepreneurs, January 24, 2021. https://timesofindia.indiatimes.com/city/dehradun/transforming-adversity-
into-opportunity-hundreds-of-women-especially-in-hills-turn-entrepreneurs-by-taking-up-
manufacturing-of-led-lights/articleshow/80426002.cms. Web.
INTERNATIONAL JOURNAL FOR INNOVATIVE RESEARCH IN MULTIDISCIPLINARY FIELD ISSN: 2455-0620 Special Issue : 26, June – 2021
Monthly, Peer-Reviewed, Refereed, Indexed Journal with IC Value: 86.87 Impact Factor: 6.719 Publication Date: 30/06/2021
Available online on - www.ijirmf.com Page 136
International Conference on
Business, Management, Social and Economical Advancements 26 & 27 June, 2021 Bangkok, Thailand
Jointly organized by: Management Institute, Warsaw University of Life Science - SGGW, Warszawa, Poland,
‘Research Culture Society’ and ‘Scientific Research Association’.
INNOVATION AND TECHNOLOGICAL ENTREPRENEURSHIP
WITH FUSION OF TWO INTERNATIONAL ART
SHALU KANSAL Research Scholar, Mewar University, Gangrar, Chittorgarh, Rajasthan.
Email I.D: - [email protected]
Dr. MEENU AGARWAL Associate Professor, Department of Home Science (Head of the Deptt.)
Ginni Devi Modi Girls P.G. college Modinagar Ghaziabad (U.P), C.C.S.U Meerut. Email I.D: - [email protected] / [email protected]
Abstract: Innovation is a necessity for human survival with new options. Innovation is the mother
of new entrepreneurs and also an inspiration for the fusion of two International traditional art i.e.,
Madhubani painting of India and Mola technique of Kuna Panama of South America. Madhubani
painting is famous for its unique design, colour combination and making process. Mola technique
is known for its multi-layered reversable applique blouse. Both of the art has different unique
properties so fusion of the two can create a good innovation for textile Industry. In the present
study 24 Madhubani painting were selected at first stage based on inclusion criteria like simple
design with original colour combination and without intricacies to maintain its originality. Out of
these 24 samples, 15 motifs were extracted at second stage and finally 8 motifs were developed
with Mola technique. Final sample were embellished with different technique and evaluated by the
twenty textile experts with ranking method on the basis of four different parameters like colour
combination, style uniqueness and overall appearance. Each parameter carries five marks thus
total hundred marks by twenty experts and four hundred maximum marks if we added all four
parameters. Each experts awarded maximum five marks for most liked and one for least liked
condition. After analysing the data sample number six scored maximum marks with first rank and
sample number seven scored minimum with eight rank.
Keywords: Madhubani painting, Mola technique, extracted motifs, fusion.
INTRODUCTION:
MADHUBANI PAINTING: - Madhubani painting is one of the many famous traditional art forms of India. History
revels the relation of this painting art with Mithila region, Madhubani district in Bihar. Some of its initial references were found the ancient history in the period of Ramayana. On the occasion of wedding on Sita, daughter of King Janak these painting were created by the painters to decorate marriage place. Traditionally this art of painting was passed down from generation to generation in the family of Mithila region mainly by women. Madhubani painting were very attractive, neat and clean mostly portray people and natural scenes like wedding ceremony natural object like Sun, Moon. These paintings were done by the women of Madhubani region. Bihar to decorate their home on freshly plasted mud walls and floor of huts at the time of festival and ceremony. Presently these are done on cloth, handmade paper and canvas also. Madhubani painting are made from paste of powdered rice.

INTERNATIONAL JOURNAL FOR INNOVATIVE RESEARCH IN MULTIDISCIPLINARY FIELD ISSN: 2455-0620 Special Issue : 26, June – 2021
Monthly, Peer-Reviewed, Refereed, Indexed Journal with IC Value: 86.87 Impact Factor: 6.719 Publication Date: 30/06/2021
Available online on - www.ijirmf.com Page 137
Natural dyes, bright colours and the different style of motifs are uniqueness of the Madhubani painting. Basically, there are five main types/style of Madhubani painting are: -
Bharani style Kachani style Geru style Godana style Gobar style
MOLA: -
The mola is a traditional style of dress of is Guhal people from San Blas Island in Panama and Colombia. It is a kind of a upper garment called blouse which is attached together with two front and back reversible appliquéd panel. In this style of blouse Kuna’s women generally wear a wrapped skirt called (Sabu ret) and a kind of red and yellow coloured scarf which is known as (musue). Beaded ornaments are used for arm and legs called(wini), for nose used gold nose ring(olosu), with matching earing called (dulemor) are used.
Mola is a handmade technique of reversible appliqué. This reversible appliqué is applied usually two to seven layers multi coloured cotton fabric. In this technique each layer is cut according to the design and pattern. Cut part are turned inside and sewed with the invisible hemming stitch/ blind stitch. The size of the stitch should be very small with same colour thread. One by one layers are cut and stitch together. The neatness is depending on the size of the stitch. With this technique multi coloured unique designs are created. Contrasting colours scheme are used to create variety of patterns, two to four layers design are easy to make but more than 4 layers pattern are quite difficult and need more practice and patience for creating beautiful pattern. Some basic embroidery stitches are used to embellished the garment. The knowledge was passed down from generation to generation.
SCOPE OF THE STUDY: -
There are a wide range of embroidery and reversable applique available in the market of different motifs and printing but no designing is available related to Madhubani motifs with Mola techniques. So, this study is an attempt to create a new work of art by fusion of two International traditional arts in a unique style.
OBJECTIVES:
To extract motifs from traditional Indian Madhubani painting. To prepare a catalogue of samples by fusion of extracted Madhubani motifs with using
mola technique of Kuna, Panama of South America. To get evaluated these developed samples by the textile experts.
LITREATURE REVIEW:
According to Arty, Zen, Courtesy (2004) resulted "Artistic hand fan painting in Madhubani style. Though Madhubani can also be printed, the hand fans were created for artistic look of Madhubani style".
Vishushini (5 Jan. 2010) developed "Madhubani painting on silk Dupattas”. This project was worked on to create some exclusive pattern on silk and cotton Dupattas and stoles".
Sharma, Somya (2010) results “MADHUBANI PAINTING WITH INNOVATIVE TECHNIQUE FOR SAREES ADORNMENT’’ was undertaken with an aim to create a new range of saris with screen printing.

INTERNATIONAL JOURNAL FOR INNOVATIVE RESEARCH IN MULTIDISCIPLINARY FIELD ISSN: 2455-0620 Special Issue : 26, June – 2021
Monthly, Peer-Reviewed, Refereed, Indexed Journal with IC Value: 86.87 Impact Factor: 6.719 Publication Date: 30/06/2021
Available online on - www.ijirmf.com Page 138
METHODOLOGY:
The methodology was divided in following sections: -
STUDY PLAN
In the first step of the study 24 Madhubani painting were collected.
COLLECTED MADHUBANI PAINTING
PAINTING NO- 01 PAINTING NO- 02 PAINTING NO- 03
PAINTING NO- 04 PAINTING NO- 05 PAINTING NO- 06
PAINTING NO- 07 PAINTING NO- 08 PAINTING NO- 09
COLLECTION OF 24 MADHUBANI PAINTING
PREPARE 15 EXTRACTED MOTIFS FROM PAINTING
DEVELOPMENT OF 8 SAMPLES WITH USING MOLA TECHNIQUE
EVALUATION OF SAMPLES BY THE 20 TEXTILE EXPERTS WITH RANKING METHOD

INTERNATIONAL JOURNAL FOR INNOVATIVE RESEARCH IN MULTIDISCIPLINARY FIELD ISSN: 2455-0620 Special Issue : 26, June – 2021
Monthly, Peer-Reviewed, Refereed, Indexed Journal with IC Value: 86.87 Impact Factor: 6.719 Publication Date: 30/06/2021
Available online on - www.ijirmf.com Page 139
PAINTING NO- 10 PAINTING NO- 11 PAINTING NO- 12
PAINTING NO- 13 PAINTING NO- 14 PAINTING NO- 15
PAINTING NO- 16 PAINTING NO- 17 PAINTING NO- 18
PAINTING NO- 19 PAINTING NO- 20 PAINTING NO- 21
PAINTING NO- 22 PAINTING NO- 23 PAINTING NO- 24
In the second step of the study out of 24 collected Madhubani painting 15 motifs were extracted from for developing a new sample.

INTERNATIONAL JOURNAL FOR INNOVATIVE RESEARCH IN MULTIDISCIPLINARY FIELD ISSN: 2455-0620 Special Issue : 26, June – 2021
Monthly, Peer-Reviewed, Refereed, Indexed Journal with IC Value: 86.87 Impact Factor: 6.719 Publication Date: 30/06/2021
Available online on - www.ijirmf.com Page 140
EXTRACTED MOTIFS
EXTRACTED
MOTIF’S NO -01
EXTRACTED MOTIF’S NO -02
EXTRACTED MOTIFS NO
-03
EXTRACTED MOTIFS
NO -04
EXTRACTED MOTIFS
NO -05
EXTRACTED MOTIFS NO
-06
EXTRACTED MOTIFS
NO -07
EXTRACTED MOTIFS
NO -08
EXTRACTED MOTIFS NO
-09
EXTRACTED MOTIFS
NO -10
EXTRACTED MOTIFS
NO -11
EXTRACTED MOTIFS NO
-12

INTERNATIONAL JOURNAL FOR INNOVATIVE RESEARCH IN MULTIDISCIPLINARY FIELD ISSN: 2455-0620 Special Issue : 26, June – 2021
Monthly, Peer-Reviewed, Refereed, Indexed Journal with IC Value: 86.87 Impact Factor: 6.719 Publication Date: 30/06/2021
Available online on - www.ijirmf.com Page 141
EXTRACTED MOTIFS
NO -13
EXTRACTED MOTIFS
NO -14
EXTRACTED MOTIFS NO
-15
In the next step of the study 8 extracted motifs were short listed to prepare a sample using mola technique on cotton fabric. Original colour combination of Madhubani painting were used to make samples. In the last phase of the study all samples were evaluated by the 20 textile experts with ranking method on the basis of colour combination, style, uniqueness, and overall appearance. Each parameter contains five points so evaluation of each sample is done out of twenty points with the help of evaluation sheet. The experts gave their score to all 8 samples. After calculating the score board of different expert’s evaluation sheet samples were ranked to 1 to 8.
ANALYSIS AND DISCUSSION: - The data collection through interview schedule were coded, tabulated and analysed. To
quantify the data regarding the assessment of samples were evaluated by ranking method When the quality of a product is assessed by means of human sensory organs the
evaluation is said to be sensory or subjective or organoleptic. The evaluation deals with measuring, analysing and interpreting the quality of an apparel as they receive by the sense of sight, touch, and texture.
RESULT AND DISCUSSION: - Table no. 1 Level of acceptance of Selected sample through ranking method
Selected
sample
no
Parameters Total
score
obtaine
d
Maxim
um
score
Rank
Color
combinati
on/ score
obtained
out of 100
Style/
score
obtaine
d out
of 100
Uniqueness
/ score
obtained
out of 100
Overall
appearance/
score
obtained out
of 100
01 95 95 94 94 378 400 2 02 87 85 90 90 358 400 6 03 92 87 85 86 350 400 7 04 86 94 95 92 367 400 4 05 89 92 95 94 370 400 3 06 94 95 96 95 380 400 1 07 84 86 85 90 345 400 8 08 89 87 92 94 362 400 5

INTERNATIONAL JOURNAL FOR INNOVATIVE RESEARCH IN MULTIDISCIPLINARY FIELD ISSN: 2455-0620 Special Issue : 26, June – 2021
Monthly, Peer-Reviewed, Refereed, Indexed Journal with IC Value: 86.87 Impact Factor: 6.719 Publication Date: 30/06/2021
Available online on - www.ijirmf.com Page 142
Above table shows that sample no-06 secured 1 rank, sample no-01 got 2 rank, sample no-05 got 3 rank, sample no-04 obtained 4 rank, sample no-08 secured 5 rank, sample no-02 got 6 rank, sample no-03 obtained 7 rank and sample no-07 goof 8 rank.
Figure No. 1 Level of acceptance of Selected sample through Ranking Scale
SELECTED SAMPLE
SELECTED SAMPLE N0 -01 SELECTED SAMPLE N0 -02
SELECTED SAMPLE N0 -03 SELECTED SAMPLE N0 -04
78
80
82
84
86
88
90
92
94
96
98
1 2 3 4 5 6 7 8
Pa
ram
ete
rs
Selected samples
Acceptance score of Selected sample
Color combination/ score obtained
out of 100
Style/ score obtained out of 100
Uniqueness/ score obtained out of
100
Overall acceptability/ score
obtained out of 100

INTERNATIONAL JOURNAL FOR INNOVATIVE RESEARCH IN MULTIDISCIPLINARY FIELD ISSN: 2455-0620 Special Issue : 26, June – 2021
Monthly, Peer-Reviewed, Refereed, Indexed Journal with IC Value: 86.87 Impact Factor: 6.719 Publication Date: 30/06/2021
Available online on - www.ijirmf.com Page 143
SELECTED SAMPLE N0 -05 SELECTED SAMPLE N0 -06
SELECTED SAMPLE N0 -07 SELECTED SAMPLE N0 -08
RECOMMENDATIONS: -
In this study various kind of textiles articles can be made on different kind of fabrics to check the different results.
This method can be used in commercial scale for mass production. And last but not the least it will help to many innovations and technological
entrepreneurship to the textile industry.
CONCLUSION: - Madhubani painting is one of the oldest painting of Bihar region in India and Mola
technique is also a traditional art of Kuna, Panama South America. Fusion of both traditional art was found that the combination was very attractive and liked by most of the expert. The combination of Madhubani and Mola technique will provide a new dimension in the field of textile industry.
BIBLIOGRAPHY:
1. Chaudhary,K.,2003, ‘Mithila pride’,www.madhbani.com. 2. Thakur, U.,2003, ‘Madhubani paintings’, pp. 14-17,book, google.com/b
ooks?isbn=81701771563 3. Gillow, J.,1999, ‘ A visual guide to traditional technique world textile’ pp- 181-187,thames
and Hudson, united kingdom 4. Vishushini, A.,2010, Asian Journal of Home Science,‘Madhubani painting on silk dupatta’,
Vol.5 No. 1. (http://www.hindagrihorticulturalsociety.co.in) 5. Sharma, S., 2010, ‘ A study on Madhubani painting with innovative technique for saris
adornment’, an unpublished dissertation. 6. Arty,Z.C.,2004, Asian Journal of Home Science, ‘Artistic hand fan painting in Madhubani
style’, Vol.1 No. 1. (http://www.hindagrihorticulturalsociety.co.in)

INTERNATIONAL JOURNAL FOR INNOVATIVE RESEARCH IN MULTIDISCIPLINARY FIELD ISSN: 2455-0620 Special Issue : 26, June – 2021
Monthly, Peer-Reviewed, Refereed, Indexed Journal with IC Value: 86.87 Impact Factor: 6.719 Publication Date: 30/06/2021
Available online on - www.ijirmf.com Page 144
Web References:
https://en.wikipedia.org/wiki/Madhubani_art https://www.slideshare.net/sareeworlds/madubani-painting-pdf https://craftatlas.co/crafts/molas https://en.wikipedia.org/wiki/Mola_(art_form)
Painting sources: P-1 https://lifesmadness.wordpress.com/2013/02/02/madhubani-painting-of-sun/comment-page-1/ P-2 - https://www.pepperfry.com/handmade-paper-16x-2x-13-madhubani-mithila-painting-of-bright-sun-by-imithila-1699451.html P-3 https://www.artzolo.com/traditional-art/sun-madhubani-painting P-4 https://www.pinterest.fr/pin/451134087668406159/ P-5 https://in.pinterest.com/pin/464644886535576980/ P-6 http://lovemadhubani.blogspot.com/2013/03/madhubani-border-designs.html P-7 http://www.marrymeweddings.in/wpblog/a-truly-different-wedding-celebration.html/madhubani P-8 https://www.novica.com/ P-9 https://www.pinterest.cl/pin/565483296943104170/ P-10 - https://www.justdial.com/Shine-India-Madhubani-Painting-of-Green-Fish-as-per-Vastu-26x18-Inch-Multciolour/pid-98715184 P-11 https://hubpages.com/art/The-General-Characteristics-of-Madhubani-Paintings-An-Indian-Folk-Art P-12 https://in.pinterest.com/pin/130604457931326996/ P-13 https://fineartamerica.com/featured/majestic-deepti-mittal.html P-14 https://theindiacrafthouse.com/products/cotton-silk-madhubani-dupatta-with-woven-colored-border-soldiers-elephants P-15 https://www.artpal.com/madhubani?i=62172-27 P-16 http://www.columbia.edu/itc/mealac/pritchett/00routesdata/0400_0499/pantheon/lingam/lingam.html P-17 https://www.facebook.com/219421601436235/photos/a.423714701006923/423714704340256/?type=3 P-18 https://www.gangesindia.com/products/shivalinga-served-by-auspicious-nagas-madhubani-painting P-19 https://www.instructables.com/id/Radha-Krishna-in-Madhubani-Art-Form/ P-20 https://www.shopclues.com/anu-criation-original-madhubani-painting-radha-krishna.html P-21 - https://www.shopclues.com/madhubani-painting-61.html P-22 - https://www.redbag.in/products/shri-krishna-playing-flute-under-the-tree-madhubani-painting P-23 - https://matterden.com/products/local-tribal-artist-traditional-art-madhubani-7 P-24 https://www.novica.com/p/colorful-indian-madhubani-painting-of-tree/228173/

INTERNATIONAL JOURNAL FOR INNOVATIVE RESEARCH IN MULTIDISCIPLINARY FIELD ISSN: 2455-0620 Special Issue : 26, June – 2021
Monthly, Peer-Reviewed, Refereed, Indexed Journal with IC Value: 86.87 Impact Factor: 6.719 Publication Date: 30/06/2021
Available online on - www.ijirmf.com Page 145
International Conference on
Business, Management, Social and Economical Advancements 26 & 27 June, 2021 Bangkok, Thailand
Jointly organized by: Management Institute, Warsaw University of Life Science - SGGW, Warszawa, Poland,
‘Research Culture Society’ and ‘Scientific Research Association’.
Sustainable Development: Where Does the North East India
Stand?
Dr. Ira Das
Associate Professor, Department of Economics Pragjyotish College, Guwahati, Assam, India
E-mail: [email protected]
Abstract : United Nations (UN) adopted the Sustainable Development Goals (SDGs) in 2015 and
expected to be achieved by the year 2030. Together with the UN, NITI Aayog in India, initiated
SDG India Index in 2018 to track progress on the SDGs in the country. Recently the third and
current edition of ‘SDG India Index and Dashboard’ (Index 3.0), 2020-21 was published. UNDP
has been working in the North East region of the country in the areas of promoting sustainable
development and it is said that UNDP has been able to carry out key development interventions in
the North East (NE) India which has yielded strong results in the areas of inclusive and equitable
growth and public service delivery. Therefore, an attempt has been made in this research paper to
analyse the performance of the States of the NE India in the SDGs on the basis of the recent
report. The areas in which the NE States performed well and the areas in which the NE States
performed bad are also tried to remain focused in the study. From the study it is revealed that the
performance of all the NE States except Sikkim and Mizoram, is not satisfactory, as they
performed below all India average. The paper highlighted some remarkable achievements of the
States like providing food subsidy to the people, gross value addition per worker in agriculture,
literacy etc. On the other hand, the areas in which the NE States have failed to perform are
maternal mortality, drop-out, unemployment etc. Governments of the NE States have already taken
some initiatives to improve on the performances.
Key Words: Sustainable Development Goals (SDGs), performance, equitable growth,
development.
INTRODUCTION:
Currently the entire world is suffering from the COVID-19 pandemic and all are realising that all the inhabitants of the Earth are closely linked with each other for welfare of all. The climate change, poverty, inequality etc. all are due to the ill-planned development and man-made events only. There arises the need of sustainable development that tells about the way of development which can satisfy needs of the present generation without compromising the needs of future generation.
United Nations adopted the Sustainable Development Goals (SDGs) in 2015 and anticipated to be achieved by the year 2030. Together with the UN, National Institute for Transforming India (NITI) Aayog in India, initiated SDG India Index in 2018 to track progress on the SDGs in the country. While the second edition of the Index was launched in 2019, recently the third and current edition of ‘SDG India Index and Dashboard’ (Index 3.0), 2020-21 published in March 2021 and it covers 17 SDGs which are: (1) No Poverty, (2) Zero Hunger, (3) Good Health and Well-being, (4) Quality Education, (5) Gender Equality, (6) Clean Water and Sanitation, (7) Affordable and Clean

INTERNATIONAL JOURNAL FOR INNOVATIVE RESEARCH IN MULTIDISCIPLINARY FIELD ISSN: 2455-0620 Special Issue : 26, June – 2021
Monthly, Peer-Reviewed, Refereed, Indexed Journal with IC Value: 86.87 Impact Factor: 6.719 Publication Date: 30/06/2021
Available online on - www.ijirmf.com Page 146
Energy, (8) Decent Work and Economic Growth, (9) Industry, Innovation and Infrastructure, (10) Reduced Inequality, (11) Sustainable Cities and Communities, (12) Responsible Consumption and Production, (13) Climate Action, (14) Life below Water, (15) Life on Land, and, (16) Peace, Justice and Strong Institutions and (17) Partnerships for the Goals.
The main objectives of this report were to rank the States/UTs based on their performance across the selected 16 SDGs and to promote healthy competition among them in their journey towards achieving the global goals. The composite score ranges from 0 to 100. Classification criteria based on SDG India Index Score is as follows: Aspirant: 0-49, Performer: 50-64, Front Runner: 65-99, Achiever: 100. Widening regional disparity in the country has attracted wide attention of the policymakers (Kurian, 2000). Therefore, it is pertinent to study the performance of a particular region or area towards achieving these important SDGs. Despite some of the limitations of this global effort to measure where countries stand on the SDGs as highlighted by Jeffrey Sachs et al. (2016), however, this is the measurement given by UNDP to be followed by the countries for inclusive, balanced and sustainable development.
SDGs and the North East (NE) India : The North East India comprises of eight States - Arunachal Pradesh, Assam, Manipur,
Meghalaya, Mizoram, Nagaland, Sikkim and Tripura and the NE States constitutes 8% of the country’s geographical area and 3.76 % of India's population. The NE States have immense natural resources, accounting for 34% of the country’s water resources and almost 40% of India’s hydropower potential. The NER is strategically located with the adjacent five foreign countries Nepal, Bhutan, China, Myanmar and Bangladesh and it is connected with mainland India only with 22 k.m. narrow corridors (Refer Map.1). The region is also an entry point for the Southeast Asian markets. This bio-diversity and resource-rich region, with its vast fertile organic farmland and huge untapped human capital, has the potential to be India’s most prosperous region (FICCI, 2014).
Map.1.Map of the North Eastern Region
Source: https://www.google.com, www.jagranjosh.com
However, at the same time, the region faces its own set of environmental and developmental challenges. For over a decade now, UNDP has been working in the North Eastern region in the areas of promoting sustainable, equitable development and inclusive growth. “With a regional base in Guwahati and project teams spread across the States, UNDP has been able to carry out key development interventions in the North East which has yielded strong results in the areas of inclusive and equitable growth and public service delivery” (UN, 2018). The UNDP India Country Programme Document (2018-2022) signed with Government of India, stresses on “systems strengthening as the single most important innovation to achieve last mile impact”. Under the Aspirational District Programme of NITI Aayog, UNDP is providing technical support

INTERNATIONAL JOURNAL FOR INNOVATIVE RESEARCH IN MULTIDISCIPLINARY FIELD ISSN: 2455-0620 Special Issue : 26, June – 2021
Monthly, Peer-Reviewed, Refereed, Indexed Journal with IC Value: 86.87 Impact Factor: 6.719 Publication Date: 30/06/2021
Available online on - www.ijirmf.com Page 147
to districts of the North East in the areas of Health and Nutrition, Education, Agriculture and Water Resources, Financial inclusion and skill development and Basic Infrastructure. UNDP is also implementing projects like the Resilience Building of Communities, Capacity Building of MSMEs, Alternate Vaccine Delivery system, Disaster and Climate Change Risk Reduction and SECURE Himalaya Project in various districts and States of the region. (UN, 2018).
With this backdrop, this paper aims at to analyse the performance of the States of the North East India in the way to achieve these sustainable development goals in 2030. An attempt is also made to highlight the remarkable areas of achievements and failures in the region.
OBJECTIVES OF THE STUDY:
The specific objectives of the study are (i) To analyse the performance of the States of the NE India in the SDGs in 2021. (ii) To focus on the areas or goals in which the NE States performed well and the areas
in which the NE performed bad.
DATA SOURCE AND METHODOLOGY:
The study is based on the secondary data collected mainly from the report ‘SDG India Index and Dashboard’ (Index 3.0): Partnerships in the decade of Action, published by National Institute for Transforming India (NITI) Aayog in India, Government of India together with United Nations (UN) in March 2021.
In this study, results and discussions are done on the basis of the calculated data in the report only. To arrive at the objectives, simple mathematical tools and descriptive methods are used. In the main report of NITI Aayog, composite indices with equal weights assigned were developed on the basis of quantitative data on the first 16 Goals while a qualitative assessment was made for Goal 17. It is constructed using 115 indicators which cover 70 targets from 16 Goals.
RESULTS AND DISCUSSIONS:
Performance of the States of the NE India in SDGs:
From the study it is revealed that the composite index provided the national average score as 66 points and Kerala performed the best with 75 score out of 100. Bihar was ranked the last with 52 score. Assam was placed third from the bottom with score 57. Among all the North Eastern (NE) States, Sikkim performed the best and Assam performed worst. It is evident from Table 1 that the performance of all the NE States except Sikkim and Mizoram, is not satisfactory, as they performed below all India average.
It is to be noted that the four NE States Sikkim, Mizoram, Tripura and Arunachal Pradesh have occupied position in the list of top States in the list of 16 SDGs i.e Mizoram and Sikkim in Goal seven, Mizoram in Goal 10, Tripura in Goal 12 and Arunachal in Goal 15.
From Table 1 it is evident that while comparing this report with the 2019 estimated data, all the States have marginally improved and Mizoram has improved significantly its score by 12 points which is the top gainer among all the States of the country.
Table 1. SDGs Composite Index Scores of the N E States and India
NE States and India
Total Scores =100
An increase in score points from 2019 Position
Arunachal Pradesh 60 +7 6 Assam 57 +2 8
Manipur 64 +4 4 Meghalaya 60 +6 7 Mizoram 68 +12 2 Nagaland 61 +4 5
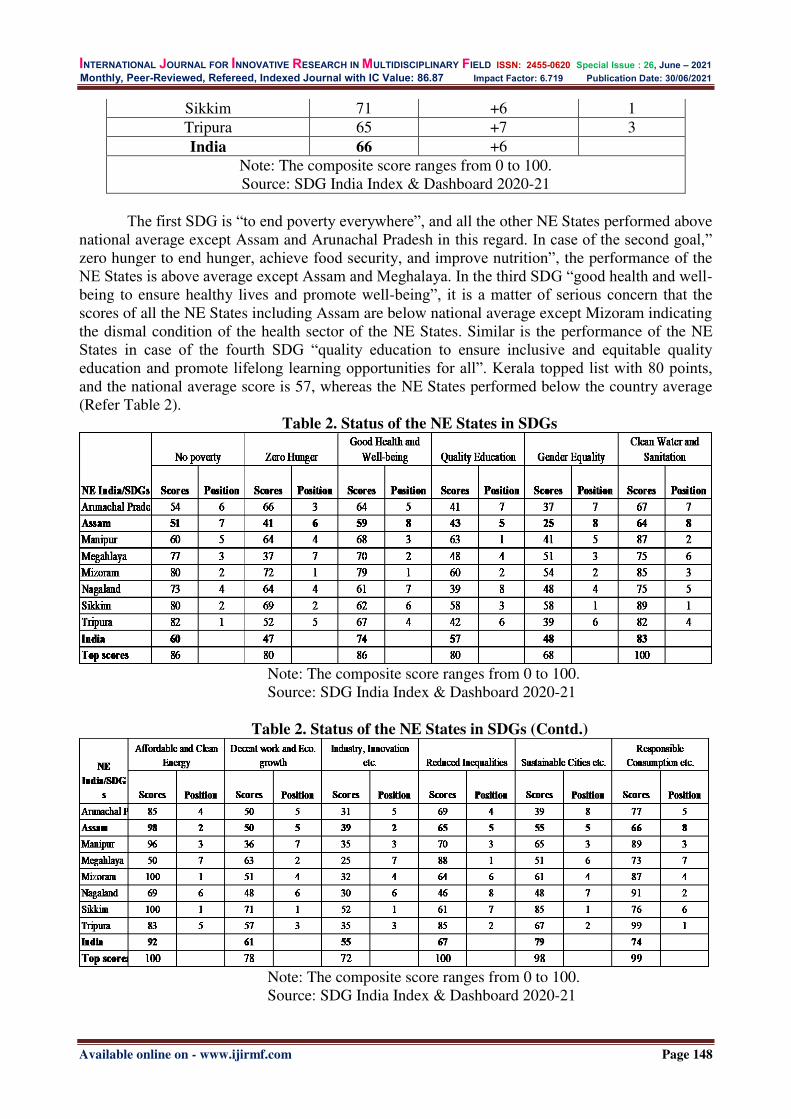
INTERNATIONAL JOURNAL FOR INNOVATIVE RESEARCH IN MULTIDISCIPLINARY FIELD ISSN: 2455-0620 Special Issue : 26, June – 2021
Monthly, Peer-Reviewed, Refereed, Indexed Journal with IC Value: 86.87 Impact Factor: 6.719 Publication Date: 30/06/2021
Available online on - www.ijirmf.com Page 148
Sikkim 71 +6 1 Tripura 65 +7 3 India 66 +6
Note: The composite score ranges from 0 to 100. Source: SDG India Index & Dashboard 2020-21
The first SDG is “to end poverty everywhere”, and all the other NE States performed above national average except Assam and Arunachal Pradesh in this regard. In case of the second goal,” zero hunger to end hunger, achieve food security, and improve nutrition”, the performance of the NE States is above average except Assam and Meghalaya. In the third SDG “good health and well-being to ensure healthy lives and promote well-being”, it is a matter of serious concern that the scores of all the NE States including Assam are below national average except Mizoram indicating the dismal condition of the health sector of the NE States. Similar is the performance of the NE States in case of the fourth SDG “quality education to ensure inclusive and equitable quality education and promote lifelong learning opportunities for all”. Kerala topped list with 80 points, and the national average score is 57, whereas the NE States performed below the country average (Refer Table 2).
Table 2. Status of the NE States in SDGs
Note: The composite score ranges from 0 to 100.
Source: SDG India Index & Dashboard 2020-21
Table 2. Status of the NE States in SDGs (Contd.)
Note: The composite score ranges from 0 to 100.
Source: SDG India Index & Dashboard 2020-21
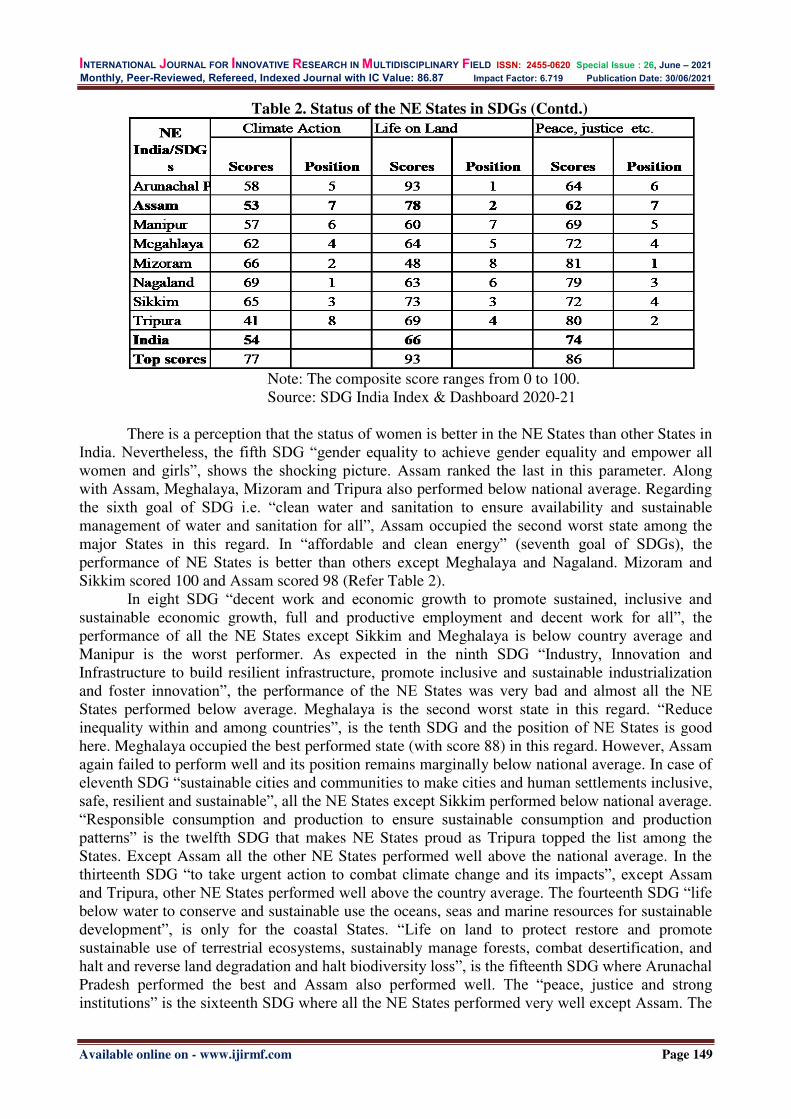
INTERNATIONAL JOURNAL FOR INNOVATIVE RESEARCH IN MULTIDISCIPLINARY FIELD ISSN: 2455-0620 Special Issue : 26, June – 2021
Monthly, Peer-Reviewed, Refereed, Indexed Journal with IC Value: 86.87 Impact Factor: 6.719 Publication Date: 30/06/2021
Available online on - www.ijirmf.com Page 149
Table 2. Status of the NE States in SDGs (Contd.)
Note: The composite score ranges from 0 to 100.
Source: SDG India Index & Dashboard 2020-21
There is a perception that the status of women is better in the NE States than other States in India. Nevertheless, the fifth SDG “gender equality to achieve gender equality and empower all women and girls”, shows the shocking picture. Assam ranked the last in this parameter. Along with Assam, Meghalaya, Mizoram and Tripura also performed below national average. Regarding the sixth goal of SDG i.e. “clean water and sanitation to ensure availability and sustainable management of water and sanitation for all”, Assam occupied the second worst state among the major States in this regard. In “affordable and clean energy” (seventh goal of SDGs), the performance of NE States is better than others except Meghalaya and Nagaland. Mizoram and Sikkim scored 100 and Assam scored 98 (Refer Table 2).
In eight SDG “decent work and economic growth to promote sustained, inclusive and sustainable economic growth, full and productive employment and decent work for all”, the performance of all the NE States except Sikkim and Meghalaya is below country average and Manipur is the worst performer. As expected in the ninth SDG “Industry, Innovation and Infrastructure to build resilient infrastructure, promote inclusive and sustainable industrialization and foster innovation”, the performance of the NE States was very bad and almost all the NE States performed below average. Meghalaya is the second worst state in this regard. “Reduce inequality within and among countries”, is the tenth SDG and the position of NE States is good here. Meghalaya occupied the best performed state (with score 88) in this regard. However, Assam again failed to perform well and its position remains marginally below national average. In case of eleventh SDG “sustainable cities and communities to make cities and human settlements inclusive, safe, resilient and sustainable”, all the NE States except Sikkim performed below national average. “Responsible consumption and production to ensure sustainable consumption and production patterns” is the twelfth SDG that makes NE States proud as Tripura topped the list among the States. Except Assam all the other NE States performed well above the national average. In the thirteenth SDG “to take urgent action to combat climate change and its impacts”, except Assam and Tripura, other NE States performed well above the country average. The fourteenth SDG “life below water to conserve and sustainable use the oceans, seas and marine resources for sustainable development”, is only for the coastal States. “Life on land to protect restore and promote sustainable use of terrestrial ecosystems, sustainably manage forests, combat desertification, and halt and reverse land degradation and halt biodiversity loss”, is the fifteenth SDG where Arunachal Pradesh performed the best and Assam also performed well. The “peace, justice and strong institutions” is the sixteenth SDG where all the NE States performed very well except Assam. The

INTERNATIONAL JOURNAL FOR INNOVATIVE RESEARCH IN MULTIDISCIPLINARY FIELD ISSN: 2455-0620 Special Issue : 26, June – 2021
Monthly, Peer-Reviewed, Refereed, Indexed Journal with IC Value: 86.87 Impact Factor: 6.719 Publication Date: 30/06/2021
Available online on - www.ijirmf.com Page 150
last i.e. the seventeenth SDG is the “partnerships for the goals to strengthen the global partnership for sustainable development” is a qualitative parameter (Refer Table 2).
Areas of Achievements and Failures in SDGs:
When the overall performance of NE States is compared with the other States of India, some remarkable achievements of the States can be observed (refer Table 2). In MNREGA, Mizoram topped the list of providing employment. Arunachal Pradesh, Manipur and Sikkim achieved the target of 100 percent in case of food subsidy. In case of underweight children, Sikkim is the best performing state at lowest 11 percent. Regarding gross value added (GVA) in agriculture Arunachal Pradesh and Tripura have already surpassed the targeted level. Nagaland recorded the lowest death rate. Manipur and Tripura have remarkable achievements with 100 percent enrolment at elementary level. Mizoram at 98.5 percent is the closest to achieve the target of 100 percent literacy. The lowest rate of crimes against women was in Nagaland at about 4 crimes per 1,00,000 female population while the highest share of female operational landholders was in Meghalaya. Regarding proper drinking water, Manipur, Meghalaya, Mizoram, Nagaland and Sikkim have achieved the target. Mizoram is the best performer in coverage of social security benefits. Notably, the mobile density is over 100 percent in eleven States including Mizoram. It is worthwhile to note that in political inclusion (Lok Sabha and Panchayati Raj Institutions), Tripura and Meghalaya had the highest percentage of women elected to the Lok Sabha.
Some of the disappointments include that the highest percentage of households living in katcha houses was in Arunachal Pradesh. Mizoram had the highest percentage increase in desertified area. Notably, the desertified area increased by more than 1 lakh hectares in Assam, Nagaland and Tripura. Assam has the highest maternal mortality rate while Nagaland has the lowest immunization coverage in the country. Sikkim has the highest suicide rate. Arunachal Pradesh has the highest percentage of drop-out at secondary level, followed by Assam. The highest rate of crime against women was witnessed in Assam. In Domestic violence, Assam recorded the highest number of victims. In political inclusion, Nagaland and Mizoram are the worst performers with no women representation.
Assam had the lowest share of rural population that had access to an improved source of drinking water. Nagaland had the highest unemployment rate. Only eight States in India, including Assam, Manipur, Mizoram, and Nagaland fell short of achieving the 100 percent target of households covered by bank account. Meghalaya recorded the lowest performance in road connectivity.
Table 3. The Performance of the NE States in 16 SDGs
S.N. SDGs\NE India Arunachal
Pradesh Assam Manipur Meghalaya Mizoram Nagaland Sikkim Tripura India
1 No poverty P P P F F F F F P
2 Zero Hunger F AA P A F P F P A
3 Good Health
and Well-being P P F F F P P F F
4 Quality
Education A A P A P A P A
5 Gender Equality A A A P P A P A A
6 Clean Water and
Sanitation F P F F F F F F F
7 Affordable and Clean Energy F F F P Ac F Ac F F
8 Decent work
and Eco. growth P P A P P A F P P
9 Industry,
Innovation etc. A A A A A A P A P
10 Reduced
Inequalities F F F F F F P F F

INTERNATIONAL JOURNAL FOR INNOVATIVE RESEARCH IN MULTIDISCIPLINARY FIELD ISSN: 2455-0620 Special Issue : 26, June – 2021
Monthly, Peer-Reviewed, Refereed, Indexed Journal with IC Value: 86.87 Impact Factor: 6.719 Publication Date: 30/06/2021
Available online on - www.ijirmf.com Page 151
11 Sustainable Cities etc. A P F P P A F F F
12
Responsible Consumption
and Production F F F F F F F F F
13 Climate Action P P P P F F F A P
14 Life on Water
15 Life on Land F F P P A P F F F
16 Peace, justice
etc. P P F F F F F F F
17 Partnerships for
the Goals
Note:
A=Aspirants (0-49); P= Performers (50-64); F=Front-Runner (65-99); Achievers (100) From Table 3, it is evident that the overall performance of the NE States towards
achieving the SDGs is performers and only in the seventh goal i.e. Clean and Affordable
Energy, the two NE States performed as Achievers.
Policy Initiatives taken by the Government of the NE India
Governments of the NE States have already taken some initiatives in this regard to improve on the performances. In Assam, vision document, “Assam 2030: Our Dreams, Our Commitment” has been prepared. The Assam Agenda: 2030 prepared to guide policy and implementation. SDG mapping of departments and schemes have already completed. SDG monitoring framework prepared for State and district level. Integrating SDGs, outcome budget prepared for years 2018-19, 2019-20 & 2020-21. The Government of Assam has officially adopted the “Transforming Our World: The 2030 Agenda for Sustainable Development” since January 1st, 2016.The State has constituted eight working groups with representatives of concerned departments to prepare action plans for achieving the goals. It has also set up a ‘Centre for SDGs’ and a Nodal Cell in Guwahati to ensure successful implementation of the goals. All departments have been directed to set up an exclusive cell for the SDGs and develop a charter of activities. A two-day ‘Partnership Conference’ has been held by Assam to contextualize the goals in the State and to facilitate the laying down of a road map on the process of implementing the goals. A draft vision document, entitled ‘Everything for Everyone – Achieving inclusive and Sustainable Development’ has also been launched. NITI Aayog has organized Sustainable Development Goals Conclave 2020: Partnerships, Cooperation, and Development of North Eastern States in Guwahati, Assam, in 24th February 2020. This conclave was attended by all Chief Ministers of North Eastern States, among others. The three-day event discussed the issues like SDG localization in the North East, economic prosperity and sustainable livelihoods, climate adaptive agriculture, health, and nutrition, among others by the representations from the North-Eastern States, Central Ministries, academia, civil society, and international development organizations.
CONCLUSION:
From the above analysis, it is evident that the performance of all the NE States except Sikkim and Mizoram, is not satisfactory, as they performed below all India average. The paper highlighted some remarkable achievements of the States like providing food subsidy to the people, gross value addition per worker in agriculture, literacy etc. On the other hand, the areas in which the NE States have failed to perform are maternal mortality, drop-out, unemployment etc. Governments of the NE States have already taken some initiatives to improve on the performances. It is evident from the report that the overall performance of the NE States
towards achieving the SDGs is performers and only in the seventh goal i.e. in Clean and
Affordable Energy, the two NE States performed as Achievers.
INTERNATIONAL JOURNAL FOR INNOVATIVE RESEARCH IN MULTIDISCIPLINARY FIELD ISSN: 2455-0620 Special Issue : 26, June – 2021
Monthly, Peer-Reviewed, Refereed, Indexed Journal with IC Value: 86.87 Impact Factor: 6.719 Publication Date: 30/06/2021
Available online on - www.ijirmf.com Page 152
The pandemic has challenged the health infrastructure, adversely affected livelihoods and aggravated the inequality in the country. The coordinated efforts of both the Union and the State governments are needed to cope with this adverse situation. Long-term planning with proper implementation and monitoring is required for success of these efforts.
Implementation of Act East Policy in proper sense with better connectivity with the neighbouring countries can open ample opportunities for the resource rich North East States.
REFERENCES:
1. Federation of India’s Chambers of Commerce and Industry FICCI (2014), “Gateway to the 2. ASEAN: India’s North East Frontier” Retrieved 9 June 2021 from www.ficci.in 3. Jeffrey Sachs, Guido Schmidt-Traub, Christian Kroll, David Durand Delacre and Katerina
Teksoz (2016). Report Part Title: Some limitations and conclusions of this analysis, Retrieved 10 May 2021 from Stable URL: http://www.jstor.com/stable/resrep15881.10
4. Government of Assam (2020). Assam-2030: In Light of the SDGs. Retrieved 15 June 2021 from http://niti.gov.in/writereaddata/files/Assam_SDG.pdf
5. Kurian, N J (2000).Widening Regional Disparities in India, Economic & Political
Weekly, 35(&): 538–50. 6. National Institution for Transforming India (NITI) Aayog (2021). SDG India Index &
Dashboard2020-21: Partnerships in the Decade of Action. Government of India, New Delhi.
7. The CSR Journal (February 25, 2020). CSR News: SDG Conclave 2020 in North East India. Retrieved 16 June 2021 from
8. https://thecsrjournal.in/csr-news-sdg-conclave-2020-in-north-east-india/ 9. United Nations (2015): Transforming Our World: The 2030 Agenda for Sustainable
Development, United Nations, New York.United Nations (2018). UNDP North East Best Practices Portfolio. Retrieved 15 June 2021 from www.undp.org

INTERNATIONAL JOURNAL FOR INNOVATIVE RESEARCH IN MULTIDISCIPLINARY FIELD ISSN: 2455-0620 Special Issue : 26, June – 2021
Monthly, Peer-Reviewed, Refereed, Indexed Journal with IC Value: 86.87 Impact Factor: 6.719 Publication Date: 30/06/2021
Available online on - www.ijirmf.com Page 153
International Conference on
Business, Management, Social and Economical Advancements 26 & 27 June, 2021 Bangkok, Thailand
Jointly organized by: Management Institute, Warsaw University of Life Science - SGGW, Warszawa, Poland,
‘Research Culture Society’ and ‘Scientific Research Association’.
ANALYSIS OF STRESS FACTORS AMONG TEACHERS IN
PRIVATE EDUCATIONAL INSTITUTIONS: A STUDY IN
WESTERN ODISHA
Swagatika Nanda
Research Scholar, Department of Business Administration, Utkal University, Bhubaneswar, Odisha
Email - [email protected]
Dr.Muna Kalyani
Associate Professor, Department of Business Administration, Utkal University, Bhubaneswar, Odisha
Abstract: This study analyses the various factors that influence the stress among teachers in
private educational institutions in western odisha. Data were collected from 533 teachers through
questionnaire. Data were analyzed through SPSS23.The results of this study shows that six factors
influencing the stress among teachers like work load, work conditions, relationship with
colleagues, school administration, career development, student behavior. This study also
suggested various techniques to manage stress among teachers.
Keywords: Teachers, Stress, Private educational institutions, Western Odisha.
INTRODUCTION:
In today’s society the demanding performance, top competition leads to causes stress among professionals. Stress causes damage that is upon underestimated and it is a social phenomenon that has to be closely examined and evaluated. In the competing society the life of an individual is full of stress at worldwide. Stress is extensible reaction to an outward situation which causes physicals mental and behavioral changes. Stress occurred due to the unfullillment of desired demand in the workplace. Hans Seyle said that “stress is the human response to changes that occur as a part of daily living”. Stress occurs when an individual is faced with a situation or event that he or she perceives is outside of their resources. “Stress is a demand made upon the adaptive capacities to the mind and body”. David, F. (1989). According to Conish and Swindle (1994) Occupational stress as “It is a mental and physical condition which effects an individual’s productivity, effectiveness, personal health and quality of work.” According to Rees (1997) stated “Occupational stress in particular, is the inability to cope with the pressures in a job.”
In the present context teaching is a very challenging job. It is observed by the various researcher stress can be occurred in education sector is very significantly. Teachers are doing their works in lot of pressures that arises stress among the teachers. Teaching has become a highly stressful profession. Teachers are facing many new challenges in education sector. Teachers duty is not only complete by teaching they have doing another assignment likes handling the students problems, parents meeting, administrative works etc. over loaded works with limited time causes stress in private institutions. More stress cannot satisfy the employees they cannot contribute more than the responsibilities or assigned duty. The productivity of organization reduces. Mostly
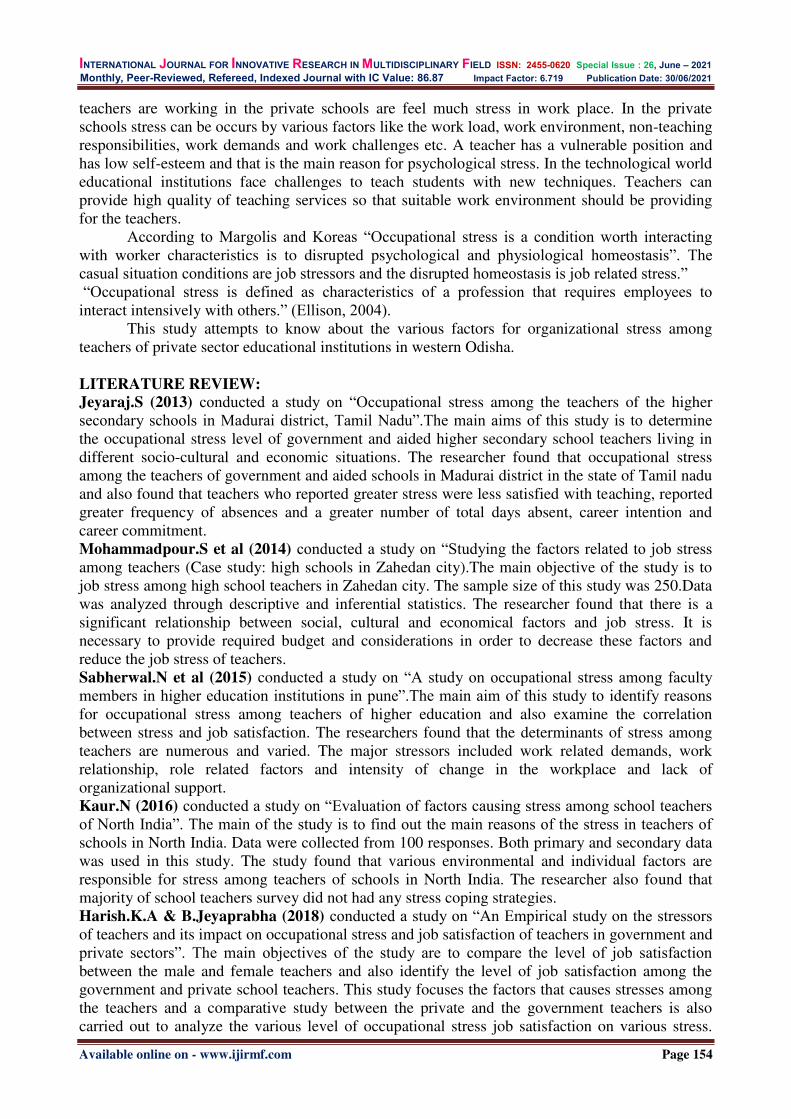
INTERNATIONAL JOURNAL FOR INNOVATIVE RESEARCH IN MULTIDISCIPLINARY FIELD ISSN: 2455-0620 Special Issue : 26, June – 2021
Monthly, Peer-Reviewed, Refereed, Indexed Journal with IC Value: 86.87 Impact Factor: 6.719 Publication Date: 30/06/2021
Available online on - www.ijirmf.com Page 154
teachers are working in the private schools are feel much stress in work place. In the private schools stress can be occurs by various factors like the work load, work environment, non-teaching responsibilities, work demands and work challenges etc. A teacher has a vulnerable position and has low self-esteem and that is the main reason for psychological stress. In the technological world educational institutions face challenges to teach students with new techniques. Teachers can provide high quality of teaching services so that suitable work environment should be providing for the teachers.
According to Margolis and Koreas “Occupational stress is a condition worth interacting with worker characteristics is to disrupted psychological and physiological homeostasis”. The casual situation conditions are job stressors and the disrupted homeostasis is job related stress.” “Occupational stress is defined as characteristics of a profession that requires employees to interact intensively with others.” (Ellison, 2004).
This study attempts to know about the various factors for organizational stress among teachers of private sector educational institutions in western Odisha.
LITERATURE REVIEW:
Jeyaraj.S (2013) conducted a study on “Occupational stress among the teachers of the higher secondary schools in Madurai district, Tamil Nadu”.The main aims of this study is to determine the occupational stress level of government and aided higher secondary school teachers living in different socio-cultural and economic situations. The researcher found that occupational stress among the teachers of government and aided schools in Madurai district in the state of Tamil nadu and also found that teachers who reported greater stress were less satisfied with teaching, reported greater frequency of absences and a greater number of total days absent, career intention and career commitment. Mohammadpour.S et al (2014) conducted a study on “Studying the factors related to job stress among teachers (Case study: high schools in Zahedan city).The main objective of the study is to job stress among high school teachers in Zahedan city. The sample size of this study was 250.Data was analyzed through descriptive and inferential statistics. The researcher found that there is a significant relationship between social, cultural and economical factors and job stress. It is necessary to provide required budget and considerations in order to decrease these factors and reduce the job stress of teachers. Sabherwal.N et al (2015) conducted a study on “A study on occupational stress among faculty members in higher education institutions in pune”.The main aim of this study to identify reasons for occupational stress among teachers of higher education and also examine the correlation between stress and job satisfaction. The researchers found that the determinants of stress among teachers are numerous and varied. The major stressors included work related demands, work relationship, role related factors and intensity of change in the workplace and lack of organizational support. Kaur.N (2016) conducted a study on “Evaluation of factors causing stress among school teachers of North India”. The main of the study is to find out the main reasons of the stress in teachers of schools in North India. Data were collected from 100 responses. Both primary and secondary data was used in this study. The study found that various environmental and individual factors are responsible for stress among teachers of schools in North India. The researcher also found that majority of school teachers survey did not had any stress coping strategies. Harish.K.A & B.Jeyaprabha (2018) conducted a study on “An Empirical study on the stressors of teachers and its impact on occupational stress and job satisfaction of teachers in government and private sectors”. The main objectives of the study are to compare the level of job satisfaction between the male and female teachers and also identify the level of job satisfaction among the government and private school teachers. This study focuses the factors that causes stresses among the teachers and a comparative study between the private and the government teachers is also carried out to analyze the various level of occupational stress job satisfaction on various stress.

INTERNATIONAL JOURNAL FOR INNOVATIVE RESEARCH IN MULTIDISCIPLINARY FIELD ISSN: 2455-0620 Special Issue : 26, June – 2021
Monthly, Peer-Reviewed, Refereed, Indexed Journal with IC Value: 86.87 Impact Factor: 6.719 Publication Date: 30/06/2021
Available online on - www.ijirmf.com Page 155
The researcher found that female secondary school teachers are high level of occupational stress as compare to male higher secondary school teachers and also found that negative relationship between occupational stress and job satisfaction among teachers. Tiwari.P (2020) conducted a study on “A study on factors causing stress of private’s school teacher”. The main of this study is to identify the major factors causing stress to primary school teachers in private schools. This study is descriptive study.The researcher found that workload and extra duties as a cause of teachers stress. Occupational stress equally affected their physical and mental conditions.
RESEARCH GAPS: Following gaps have been observed from the literature reviewed:
Insufficient study has been conducted on organizational stress among teachers in private educational institutions in India.
Most of the study cannot properly identify the causes of stress that directly affected the teachers.
The impact of stress among teachers in private educational institutions has not been measured properly.
RESEARCH OBJECTIVE:
To identify the various factors that influences the stress among teachers in private educational institutions.
HYPOTHESIS:
There is no significant relationship between employment factors and organizational stress among teachers in private educational institutions.
METHODOLOGY: Factor analysis was used for the data analysis. The collected data was reduced with the help of factor analysis. The extraction method used was principle component analysis followed by varimax with Kaizer Normalization. The outcome of factor analysis are shown in tables.
RESULTS AND DISCUSSION
TABLE-1 KMO and Bartlett’s test KMO and Bartlett's Test
Kaiser-Meyer-Olkin Measure of Sampling Adequacy.
.817
Bartlett's Test of Sphericity
Approx. Chi-Square 5879.173 df 1275 Sig. .000
Source: SPSS23 output based on primary data
TABLE-2 Total Variance Explained
Component
Initial Eigenvalues Extraction Sums of Squared Loadings
Total % of Variance
Cumulative % Total
% of Variance
Cumulative %
1 7.937 15.562 15.562 7.937 15.562 15.562 2 2.123 4.162 19.725 2.123 4.162 19.725 3 1.751 3.432 23.157 1.751 3.432 23.157 4 1.581 3.099 26.256 1.581 3.099 26.256 5 1.540 3.020 29.277 1.540 3.020 29.277

INTERNATIONAL JOURNAL FOR INNOVATIVE RESEARCH IN MULTIDISCIPLINARY FIELD ISSN: 2455-0620 Special Issue : 26, June – 2021
Monthly, Peer-Reviewed, Refereed, Indexed Journal with IC Value: 86.87 Impact Factor: 6.719 Publication Date: 30/06/2021
Available online on - www.ijirmf.com Page 156
6 1.507 2.955 32.232 1.507 2.955 32.232 7 1.486 2.914 35.145 1.486 2.914 35.145 8 1.384 2.713 37.858 1.384 2.713 37.858 9 1.344 2.635 40.493 1.344 2.635 40.493 10 1.297 2.543 43.036 1.297 2.543 43.036 11 1.228 2.408 45.444 1.228 2.408 45.444 12 1.196 2.345 47.789 1.196 2.345 47.789 13 1.176 2.307 50.096 1.176 2.307 50.096 14 1.138 2.232 52.328 1.138 2.232 52.328 15 1.098 2.152 54.480 1.098 2.152 54.480 16 1.056 2.070 56.550 1.056 2.070 56.550 17 1.024 2.009 58.559 1.024 2.009 58.559 18 .990 1.942 60.500 19 .967 1.897 62.397 20 .941 1.845 64.243 21 .908 1.781 66.023 22 .894 1.753 67.776 23 .881 1.727 69.504 24 .870 1.706 71.210 25 .827 1.621 72.831 26 .796 1.561 74.392 27 .773 1.516 75.908 28 .749 1.469 77.377 29 .716 1.404 78.781 30 .709 1.390 80.171 31 .683 1.339 81.510 32 .659 1.291 82.801 33 .626 1.227 84.028 34 .603 1.181 85.209 35 .592 1.161 86.370 36 .568 1.113 87.483 37 .542 1.064 88.547 38 .521 1.022 89.569 39 .519 1.018 90.586 40 .507 .994 91.580 41 .505 .991 92.571 42 .470 .921 93.492 43 .467 .915 94.407 44 .433 .848 95.255 45 .418 .819 96.074 46 .398 .780 96.854 47 .380 .745 97.599 48 .343 .673 98.272 49 .327 .641 98.913 50 .294 .576 99.490 51 .260 .510 100.000
Extraction Method: Principal Component Analysis. Source: : SPSS23 output based on primary data
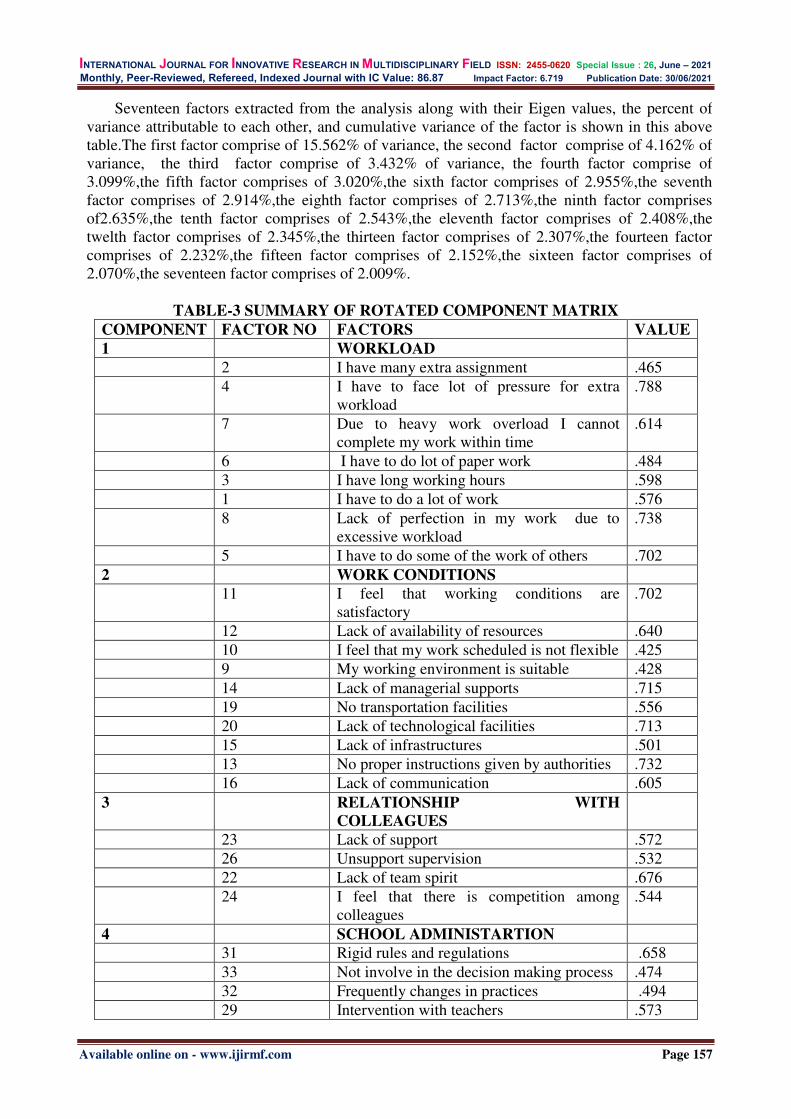
INTERNATIONAL JOURNAL FOR INNOVATIVE RESEARCH IN MULTIDISCIPLINARY FIELD ISSN: 2455-0620 Special Issue : 26, June – 2021
Monthly, Peer-Reviewed, Refereed, Indexed Journal with IC Value: 86.87 Impact Factor: 6.719 Publication Date: 30/06/2021
Available online on - www.ijirmf.com Page 157
Seventeen factors extracted from the analysis along with their Eigen values, the percent of variance attributable to each other, and cumulative variance of the factor is shown in this above table.The first factor comprise of 15.562% of variance, the second factor comprise of 4.162% of variance, the third factor comprise of 3.432% of variance, the fourth factor comprise of 3.099%,the fifth factor comprises of 3.020%,the sixth factor comprises of 2.955%,the seventh factor comprises of 2.914%,the eighth factor comprises of 2.713%,the ninth factor comprises of2.635%,the tenth factor comprises of 2.543%,the eleventh factor comprises of 2.408%,the twelth factor comprises of 2.345%,the thirteen factor comprises of 2.307%,the fourteen factor comprises of 2.232%,the fifteen factor comprises of 2.152%,the sixteen factor comprises of 2.070%,the seventeen factor comprises of 2.009%.
TABLE-3 SUMMARY OF ROTATED COMPONENT MATRIX COMPONENT FACTOR NO FACTORS VALUE
1 WORKLOAD 2 I have many extra assignment .465 4 I have to face lot of pressure for extra
workload .788
7 Due to heavy work overload I cannot complete my work within time
.614
6 I have to do lot of paper work .484 3 I have long working hours .598 1 I have to do a lot of work .576 8 Lack of perfection in my work due to
excessive workload .738
5 I have to do some of the work of others .702 2 WORK CONDITIONS 11 I feel that working conditions are
satisfactory .702
12 Lack of availability of resources .640 10 I feel that my work scheduled is not flexible .425 9 My working environment is suitable .428 14 Lack of managerial supports .715 19 No transportation facilities .556 20 Lack of technological facilities .713 15 Lack of infrastructures .501 13 No proper instructions given by authorities .732 16 Lack of communication .605 3 RELATIONSHIP WITH
COLLEAGUES
23 Lack of support .572 26 Unsupport supervision .532 22 Lack of team spirit .676 24 I feel that there is competition among
colleagues .544
4 SCHOOL ADMINISTARTION 31 Rigid rules and regulations .658 33 Not involve in the decision making process .474 32 Frequently changes in practices .494 29 Intervention with teachers .573

INTERNATIONAL JOURNAL FOR INNOVATIVE RESEARCH IN MULTIDISCIPLINARY FIELD ISSN: 2455-0620 Special Issue : 26, June – 2021
Monthly, Peer-Reviewed, Refereed, Indexed Journal with IC Value: 86.87 Impact Factor: 6.719 Publication Date: 30/06/2021
Available online on - www.ijirmf.com Page 158
30 Time pressure .405
5 CAREER DEVELOPMENT 39 Unclear performance appraisal system .501 36 Job insecurity .744 43 Seminar/conference conducted very rarely .668 42 Lack of scope for research work .588 40 Lack of training programme .575 41 I am not getting opportunity to utilize my
abilities and experience .413
38 Lack of appreciation .632 6 STUDENTS BEHAVIOUR 51 I give appropriate opportunities to students
for adequate motivation .558
46 Student response is not so good .432 49 Problem in managing student’s behavior .513 44 Students are impatience in nature .765 45 Lack of concentration in class .543 47 I feel disappointed when students do not
follow instructions .456
50 Managing conflict arises among students .753 FACTOR-1
First component comprised eight factors commonly known as workload which have been categorized as I have to face lot of pressure for extra workload.788, Lack of perfection in my work due to excessive workload.738, I have to do some of the work of others.702, Due to heavy work overload I cannot complete my work within time.614, I have long working hours.598, I have to do a lot of work.576, I have to do lot of paper work.484, I have many extra assignment.465.These factors are contributes stress among teachers at the private educational institutions to meet the demand of the organizational requirement.
FACTOR-2
Second component comprised ten factors commonly known as work conditions which has been categorized as No proper instructions given by authorities.732,Lack of managerial supports.715, Lack of technological facilities.713, I feel that working conditions are satisfactory.702, Lack of availability of resources.640, Lack of communication.605, No transportation facilities.556, Lack of infrastructures.501, My working environment is suitable.428, I feel that my work scheduled is not flexible.425.These factors were contributes stress among teachers. Poor working conditions raises dissatisfaction towards the job and causes stress among teachers.
FACTOR-3
Third component comprised five factors commonly known as relationship with colleagues which has been categorized as Lack of support.676, Lack of support.572, I feel that there is competition among colleagues.544, Unsupported supervision.532. These factors were contributes the stress among teachers. Poor relationship with colleagues creates stress among teachers.
FACTOR-4
Fourth component comprised six factors commonly known as school administrations which has been categorized as rigid rules and regulations.658, Intervention with teachers.573, frequently changes in practices.494, not involve in the decision making process.474.Due to strict rules and

INTERNATIONAL JOURNAL FOR INNOVATIVE RESEARCH IN MULTIDISCIPLINARY FIELD ISSN: 2455-0620 Special Issue : 26, June – 2021
Monthly, Peer-Reviewed, Refereed, Indexed Journal with IC Value: 86.87 Impact Factor: 6.719 Publication Date: 30/06/2021
Available online on - www.ijirmf.com Page 159
regulations teachers are faces lot of problems. Frequently changes practices causes stress among teachers because adoption of new practices is difficult task for many individuals.
FACTOR-5
Fifth component comprised seven factors commonly known as career development which has been categorized as Job insecurity .744, Seminar/conference conducted very rarely.668, Lack of appreciation.632, Lack of training programme .575, Unclear performance appraisal system.501, I am not getting opportunity to utilize my abilities and experience.413. Job insecurity is the major factors to creates stress among teachers. Due to lack of opportunities to utilize their knowledge may give rise to the dissatisfaction towards the job.
FACTOR-6
Sixth component comprised seven factors commonly known as student behaviours which has been categorized as Students are impatience in nature.765, Managing conflict arises among students.753, I give appropriate opportunities to students for adequate motivation.558, Lack of concentration in class.543, Problem in managing student’s behavior.513, I feel disappointed when students do not follow instructions.456, Student response is not so good.432.Due to student behaviours teachers were facing lot of stress.
CONCLUSION:
Organizational stress is a biggest challenge for employees in all sectors. Teaching is called as noblest profession. In recent scenario teaching is also a stressful profession. Teachers were not confined only in the teaching activities they perform many additional assignment. The study identified the various factors that contributes the stress among teachers working in private educational institutions. The major factors of stress among teachers are workload, work conditions, relationship with colleagues, school administrations, career development, and student discipline. Hence, necessary steps should be taken to reduce the level of stress among teachers by means of training programmes, workshop/seminar, and flexibility in workload, effective performance appraisal system, maintaining student discipline, and relationship with colleagues. coping with changing practices in teaching, self management. Quality students can be developed and nurtured with strong and stress free teachers.
SCOPE FOR FUTURE RESEARCH:
The research came up with preliminary contributions in terms of stress and coping strategies. 1. This research covers only private educational institutions in western Odisha with limited
samples. In future all other categories of teachers and also study in Odisha and nationwide. 2. For minimize the stress among teachers detailed study can be conducted on coping
mechanism in further research. 3. This research work gives a platform for the future research in the relevant and related areas
like stress and job satisfaction, stress and job performance, universities teachers, management teachers, technical teachers. The future research may also extend to the non-teaching staffs in educational institutions.
REFERENCES
1. Areekkuzhiyil.S (2014). Factors influencing the organizational stress among teachers working in Higher Education sector in Kerla: An Empirical Analysis. Research and pedagogic interventions, Vol.2(2).
2. Harish.K.A, B.Jeyaprabha (2018).A study of the occupational stress and job satisfaction of teachers of government and private sectors. International journal of pure and applied mathematics.Vol.118,No.11

INTERNATIONAL JOURNAL FOR INNOVATIVE RESEARCH IN MULTIDISCIPLINARY FIELD ISSN: 2455-0620 Special Issue : 26, June – 2021
Monthly, Peer-Reviewed, Refereed, Indexed Journal with IC Value: 86.87 Impact Factor: 6.719 Publication Date: 30/06/2021
Available online on - www.ijirmf.com Page 160
3. Kaur.N (2016).Evaluation of factors causing stress among school teachers of North India.Semanticscholar.com
4. Mohammadpur.S, Vafadar.M, Poorhasan.R & Asgahi.P.E (2014).Studying the factors related to job stress among teachers (case study: high schools in Zahedan city).Asian journal of research in social sciences and humanities.Vol.4,No.10,pp.270-281.
5. Margaret.K, Simon.N & Sabina.M (2018).Sources of occupational stress and coping strategies among teachers in Borstal institutions in Kenya, vol.2, issue.1, Edelweiss: psychiatry open access.
6. Skaalvik.M.E & Skaalvik.S (2015) .Job satisfaction, stress and coping strategies in the teaching profession-What do teachers say? International Education Studies,Vol.8,No.3,ISSN 1913-9020.
7. Qusar.N (2018). A study of occupational stress among school teachers. International journal of Human resource & industrial research.Vol.5, Issue.9, pp-37-44.
8. Tiwari.P (2020). A study on factors causing stress of Private’s school teacher. International journal of research and analytical reviews.Vol.7, Issue.1.

INTERNATIONAL JOURNAL FOR INNOVATIVE RESEARCH IN MULTIDISCIPLINARY FIELD ISSN: 2455-0620 Special Issue : 26, June – 2021
Monthly, Peer-Reviewed, Refereed, Indexed Journal with IC Value: 86.87 Impact Factor: 6.719 Publication Date: 30/06/2021
Available online on - www.ijirmf.com Page 161
International Conference on
Business, Management, Social and Economical Advancements 26 & 27 June, 2021 Bangkok, Thailand
Jointly organized by: Management Institute, Warsaw University of Life Science - SGGW, Warszawa, Poland,
‘Research Culture Society’ and ‘Scientific Research Association’.
Strategies of Interpersonal Managerial Communication in
Thirukkural
Dr. Alka Jain
Senior Research Fellow, ICSSR, India Email - [email protected]
Abstract: Strategic Management is the buzz word in the modern corporate world. Managerial
communication is the heart of any business. Whatever actions you take in your business they are
based on the overall or the ‘Master Strategy’ of your business. Same way, whatever a manager communicates, is also based on strategies. Hence, it is named as strategic managerial
communication. The present research attempts to explore the concept of strategic managerial
communication in an ancient Indian book- Thirukkural. The book was authored by Tiruvalluvar, A
Jain saint, explaining the management techniques useful for the then social, economical and
political environment of the country. For the present research paper, communication skills as
explained in Thirukkural will be analysed with a special focus on the public speaking art. The
paper will conclude with the findings based on the analysis of those verses which talk about public
speaking.
INTRODUCTION to Thirukkural :
The tirukkural is an ancient Tamil text consisting of 1330 couplets, written around 30 B.C. First printed edition of Thirukkural was published in 1812, but palm leaf versions existed before 1812. The Government of Tamilnadu declared the date of Tirukkural somewhere after 31 BCE- the year of birth of Thiruvalluvar. Hence we can say that Tirukkural reflects the ancient era of our country when the Jain religion was prospering.It is divided into 133 chapters. Each chapter is a collection of beautiful verses. All the chapters address various social, economic and political issues. Historians have a disputed view on the authorship of Thirukkural. Some believe that the book was written by a Jain saint, while others believe the book was authored by a Hindu Saint. Saint here stands for a knowledgeable person rather than the one following religious rituals. Kural is a special arrangement of words to form a couplet.
METHODS AND MATERIALS :
The study is historical by nature. For the purpose of present research, Thirukkural has been explored through the translation of this Tamil text in its printed and online versions. For modern managerial communication, books authored by western and Indian scholars, and research papers have been used. The ancient strategies of communication explored from Tirukkural have been analyzed and their relevance in the modern corporate world is assessed.
RESEARCH QUESTIONS :
● Does Thirukkural talk about the four pillars of managerial communication?

INTERNATIONAL JOURNAL FOR INNOVATIVE RESEARCH IN MULTIDISCIPLINARY FIELD ISSN: 2455-0620 Special Issue : 26, June – 2021
Monthly, Peer-Reviewed, Refereed, Indexed Journal with IC Value: 86.87 Impact Factor: 6.719 Publication Date: 30/06/2021
Available online on - www.ijirmf.com Page 162
● Are the ancient managerial (verbal) communication strategies relevant to the modern managerial communication needs?
Managerial communication (Modern scholars) ● Geraldine opines that managerial communication happens at five levels- Intrapersonal,
interpersonal, group, organizational and intercultural. Intrapersonal is analysing internal behavior by listening, observing etc. before the communication starts. Interpersonal communication is between two or more persons communicating, group talks about the communication between two groups such as different departments, different branches. Or from one person to the group. When the communication is between two organizations, it is organizational communication. Same way, when people from different cultures communicate with each other , that is called intercultural communication.
● According to Bernard “Communication is the foundation for all group activities and the first executive function is to develop and maintain a system of communication”.
● According to Herber G. Hicks’s definition, “Communication is basic to an organization’s existence – from birth of the organisation on through its continuing life. When communication stops, organised activity ceases to exist”
Managerial Communication (Tirukkural)
The ancient book Thiruvalluvar is like a modern handbook of management. As far as managerial communication is concerned, it is scattered over many chapters and many verses. In this paper, the author has made an attempt to analyse interpersonal managerial communication only, but the book has all the five types of managerial communication skills with complete details which are relevant for today’s managers. Though there is a conflict in the authorship of the book, for the purpose of this paper, the author follows the belief of many scholars that Thiruvalluvar was a Jain preacher. The book is divided into thirteen chapters. Each chapter talks about a different issue emerging in the then societies and economies. Mainly interpersonal managerial communication from chapters 69, 70 and 71 is discussed in this paper.
Table1: Analysis of strategic Managerial Communication in Thirukkural
S.
No.
Couplet Text Meaning Strategic
Managerial
communication
skill
1 69/3 स्वामिलाभाय येनात्तो भारो भपूमि िंडले
आवश्यकं मि िद्वाणयां पांमडत्यं सवविोमिकि्|
The one who takes the responsibility of of conveying the king’s message to other kings , he should be compulsorily wisest of all.
Wisdom/presence of mind
2 ●संके्षप भाषणं वाणयां िाियंु कट्वभाषणं
सदुिूा: सािनैरेिै: कुवंमि स्वामिनो मििं|
There are only three means by which an ambassador can benefit his own king- To be able to give detailed information in brief sentences, Sweet talk, Be
Command over his speech

INTERNATIONAL JOURNAL FOR INNOVATIVE RESEARCH IN MULTIDISCIPLINARY FIELD ISSN: 2455-0620 Special Issue : 26, June – 2021
Monthly, Peer-Reviewed, Refereed, Indexed Journal with IC Value: 86.87 Impact Factor: 6.719 Publication Date: 30/06/2021
Available online on - www.ijirmf.com Page 163
alert and should not use indecent language.
3 70/6 कालोमस्ि साम्प्रिं कीदृक् रकृमिश्चास्य कीदृशी इमिपवूं सिालोच्य वाचा िदनिुोदयेि्|
While conveying news of the unpleasant nature, gauge his mood and wait for the right moment and speak in a manner that pleases him. You should please a king by using the words that suit the situation and the reference.
(Environment analysis) Skill of gauging the mood of listener and then speaking
4 69/6 रभावोत्पामदका वाणी वैदषु्यंसियज्ञिा रत्यतु्पन्न िमित्वं च दिूस्य रथि गुणा:|
Influential speech, intellect and intelligence, calmness, a sharp mind to see and foresee correct timings of his action/speech are the primary qualities of an ambassador (The communicator).
Influential speech with Correct timing
5 69/7 स्थानावसर किवव्यबोिे यस्यािी पाटवं आलोमचिोक्त शब्दों य: स दिूो दिू उच्यिे |
He is chief (among ambassadors) who understands the proper decorum (before foreign princes), seeks the (proper) occasion, knows the (most suitable) place, and delivers his message after (due) consideration.
Choosing appropriate place and timing
6 69/9 आवेशादमप न ब्रिेू दवुावक्यं यो मवचक्षण:
पर राष्रे स एवामस्ि योग्य शासन िारक:|
Those who are wise enough, do not use indecent language, such are the people who can be chosen for conveying messages to other kings.
Selection of decent words
7 70/1 नामिदरू सिीपस्थो नपंृ सेवेि् पंमडि: शीि बािा मनवतृ्त्याथव यथामग्नि ्सेविे जन:|
Whoever approaches the king (superior bosses), his approach should not be too personal or too formal. He should be advised to behave as if being warmed by a fire, hence he should not go too near neither very far from the fire
(Status difference) Behavioral skills in managerial communication with a wider purpose to protect the sender

INTERNATIONAL JOURNAL FOR INNOVATIVE RESEARCH IN MULTIDISCIPLINARY FIELD ISSN: 2455-0620 Special Issue : 26, June – 2021
Monthly, Peer-Reviewed, Refereed, Indexed Journal with IC Value: 86.87 Impact Factor: 6.719 Publication Date: 30/06/2021
Available online on - www.ijirmf.com Page 164
8 70/4 राज्ञा: परुो न केनािा कत्तवव्यं कणवभाषणं
मस्ििैमगिे च नो काय ेआत्िनो भमूिमिमच्ििा |
You should not smile and laugh with others when standing in front of the king. You should not even make indecent gestures in his presence. nor should you whisper or share jokes with others in royal audience.
Skill of appropriate facial expressions
9 70/7 िोदो भवमि या: श्रतु्वा वाचस्िा व्यािारेन ्नपंृ यामभश्च कोSमपलाभो न पचृ््यिानो निा वदेि|
Discuss only those things which please the king . Do not discuss the issues which may displease him even if he asks about them. Hence you should sort out the information that pleases the boss and good for him.
Selection of appropriate topics of discussion
10 72/1 onwards
मचत्त ेसरुुमच सम्प्पन्नो बाक्कलायां मवशारद: श्रोिभृावं मवमदत्वादावनरुूपं वदेद ्वच:|
The pure who know the classification of words having first ascertained the nature (of the court) will not (through fear) falter in their speech before the powerful body.
Structured content in the speech
Source: Tirukkural(translated text)
Relevance of the strategies of Ancient managerial communication skills in the modern
communication
Good communication helps you in staying connected. Effective communication is a prerequisite for leadership. It helps in building strong relationships. Top hirers today look for candidates who are efficient in writing good business letters. The skill of direct, clear and compelling communication is the key to success for a manager. Geraldine, in his book mentions four pillars of managerial communication, these four pillars are - Purpose, audiences, strategy and structure help in creating a strong managerial communication platform for the employees and the employer. The analysis of Tirukkural verses gives the managerial communication, that has all the four components focuses on the audiences, purpose.
Purpose: The only purpose of any communication is to convey the message of a sender to his/her receiver. But Tirukkural also talks about a wider purpose. The verse 70/1 says while communicating with the kings (the senior audiences) a careful behavior is to be followed so that the sender is always protected from his power of punishing the sender if gets angry after receiving the message. This makes the ancient managerial communication wiser.

INTERNATIONAL JOURNAL FOR INNOVATIVE RESEARCH IN MULTIDISCIPLINARY FIELD ISSN: 2455-0620 Special Issue : 26, June – 2021
Monthly, Peer-Reviewed, Refereed, Indexed Journal with IC Value: 86.87 Impact Factor: 6.719 Publication Date: 30/06/2021
Available online on - www.ijirmf.com Page 165
Audiences: Since the king was the supreme manager in the ancient states, hence whatever managerial communication is discussed in Tirukkural, is considered to be between a king and his subordinates. So the kings and his authorized designatories are treated as different levels of managers in the paper. They are the audiences in the managerial communication of Tirukkural.
Strategy: Nine couplets have been taken from Tirukkural to analyse the strategic communication in the ancient India. strategies used by the ancient Indians were to use influential speech with correct timing, choosing appropriate place and timing, selection of decent words, not being aggressive, appropriate facial expressions with an appropriate topic of discussion during the communication. The pillar- strategy is the main focus of this paper.
Structure: Chapter 72 discusses the art of ‘व्याख्यान’- the structure of a speech. There are 10 verses in the chapter which talk about the style and structure of the communication. First verse has been shown in the table, others can be referred to from the book list given in the references. Tirukkural explains that the speech should be designed as per the taste and preference of the receiver. If the communication is for wise people, it should be designed accordingly and if for ignorants, the speaker is advised to change the structure.
Relevance of the Tirukkural Managerial Communication in the Modern Corporate World
Whatever Tirukkural skills are listed in the Table 1, can also be seen in the modern managerial book authored by Geraldine. When I was going through the modern book, it was as if the same ideas are being expressed even after hundreds of years. The resemblance in the ideas expressed in both the books (Tirukkural and “Managerial Communication) proves that the strategies and skills in interpersonal managerial communication are relevant even today. Because these books are used to teach managerial communication to the management students, who apply the theories learnt from these books in their career.
CONCLUSION:
In this paper, a comparison has been drawn in the managerial communication strategies from the ancient book ‘Tirukkural’ and the modern book ‘Managerial Communication’ authored by Geraldine E. Hyne. It has been analyzed that the strategies needed for managerial communication found in Tirukkural are also found in the modern book. Both the books talk about intrapersonal, interpersonal, group, organizational and intercultural communication. Though in this paper, only interpersonal managerial communication has been addressed, there is further scope of research to analyze if all other types ofthe Tirukkural managerial communication strategies are also relevant in modern managerial communication. Both the books talk about the personal biases, which might influence the communication at a moment, factors from the receiver and the environment which may affect the receipt of the message. Both the books discuss the importance of context for the message, formulating a strategy as per the context. And the strategies suggested by both the authors are also similar.
LIMITATIONS:
The researcher is not a Tamilian, hence Sanskrit, Hindi and English translations of the Tamil book are used for the analysis.
Sole dependence on translations may bring in some additions/substractions to the original text, but if we do not use the translation tool to explore the ancient Indian scriptures, future generations may be deprived of our ancient treasure of wisdom
For the understanding of modern managerial communication, Geraldine’s book is the main resource.More books should be used in further studies.

INTERNATIONAL JOURNAL FOR INNOVATIVE RESEARCH IN MULTIDISCIPLINARY FIELD ISSN: 2455-0620 Special Issue : 26, June – 2021
Monthly, Peer-Reviewed, Refereed, Indexed Journal with IC Value: 86.87 Impact Factor: 6.719 Publication Date: 30/06/2021
Available online on - www.ijirmf.com Page 166
REFERENCES:
1. Ka Naa Subramanyam, ‘Thiruvalluvar and His Thirukkural’ Bhartiya Jnanpeeth, New Delhi, 1987.
2. Dr. Inderraj Baid, ‘Jain Tamil Sahityaaur Thirukkural’ Samyag Gyan Pracharak Mandal, Jaipur,1987.
3. Geraldine E. Hynes, ‘Managerial Communication: Strategies and Applications’ SAGE Publications, Asia-Pacific Pte Ltd. U.S.A., 2016.
4. Govind Rai Jain Shastri, ‘Kural Kavya’, Vitrag Wani Trust Registered, Tikam Garh, M.P.,2001.
5. P. S. Sundaram, ‘The Kural. Penguin Books: London, 1990. 6. https://en.wikipedia.org/wiki/Dating_the_Tirukkural retrieved on 18th June, 2021. 7. http://jainology.blogspot.com/2007/11/saint-tiruvalluvar-was-jain.html, retrieved on 19th
June, 2021.

INTERNATIONAL JOURNAL FOR INNOVATIVE RESEARCH IN MULTIDISCIPLINARY FIELD ISSN: 2455-0620 Special Issue : 26, June – 2021
Monthly, Peer-Reviewed, Refereed, Indexed Journal with IC Value: 86.87 Impact Factor: 6.719 Publication Date: 30/06/2021
Available online on - www.ijirmf.com Page 167
International Conference on
Business, Management, Social and Economical Advancements 26 & 27 June, 2021 Bangkok, Thailand
Jointly organized by: Management Institute, Warsaw University of Life Science - SGGW, Warszawa, Poland,
‘Research Culture Society’ and ‘Scientific Research Association’.
An Analysis of Production Functions of Women Micro
Entrepreneurs in Kerala
Dr. Sheena M.S.1
1 Post Doctoral Fellow, Department of Commerce, University of Kerala, Trivandrum.
Email - [email protected]
Dr. Gabriel Simon Thattil 2
2 Professor& Head of the Department of Commerce, University of Kerala, Trivandrum.
Abstract: Micro enterprises comprise a widely divergent spectrum of establishment ranging from
micro and rural enterprise to modern industrial units with their sophisticated technologies. The
contribution of micro enterprises to the national economy is enormous. This paper examines
various production functions of women micro entrepreneurs in Kerala. The respondents of the
study consisted of 380 registered women entrepreneurs in Kerala and data were collected through
structured interview schedule. For the purpose of analysis, statistical tools like Paired t test,
ANOVA and MANOVA were used. The result indicates that women entrepreneurs face many
hurdles in the production of their products and DICs involvements reduce the entire production
problems.
Keywords: Women Micro Entrepreneurs, Production Problem, District Industrial Centers.
INTRODUCTION :
Micro enterprises usually use manual skills, operations, traditional tools, and cover local requirements and local needs. The enterprise is defined in terms of the number of workers employed. A business unit that provides employment opportunities to four or five workers is registered as micro enterprises. Those which are owned and operated by women are known as women micro enterprises. This sector plays a vital role in the economy of any country by doing income generation activities and providing employment opportunities to the weaker sections of people and especially contributing national income. Women owned micro enterprises mainly improve women’s standard of living and also improve the poor people’s status through income generating activities and social; development activities.
OBJECTIVES OF THE STUDY :
To identify various production problems of women micro entrepreneurs in Kerala. To study the involvements of DICs in production function of women micro entrepreneurs
in Kerala.
HYPOTHESES:
H0: Involvement of DIC in the production function of women manufacturing micro units not significantly reduce their production problems.

INTERNATIONAL JOURNAL FOR INNOVATIVE RESEARCH IN MULTIDISCIPLINARY FIELD ISSN: 2455-0620 Special Issue : 26, June – 2021
Monthly, Peer-Reviewed, Refereed, Indexed Journal with IC Value: 86.87 Impact Factor: 6.719 Publication Date: 30/06/2021
Available online on - www.ijirmf.com Page 168
RESEARCH METHODOLOGY :
The present study is descriptive in nature. The data for the study were collected from both primary and secondary sources. The secondary data were collected from various publications and also from personal discussion with officials of various agencies. Women entrepreneurs who were registered under District Industrial Centres in Kerala from the year 2019 to 2020 are considered as the population of the study. From 2019 to 2020, 10328 women enterprises were registered under DICs in Kerala. A sample of 380 women enterprises were selected randomly. Structured interview schedule was adopted for collecting responses from the respondents and Paired t test, ANOVA and MANOVA was used for analyzing the data.
REVIEW OF LITERATURE :
Basargekar, P. (2007) in his study, “Women Entrepreneurs: Challenges Faced”, analyses the evolution of various concepts and definitions of entrepreneurship with special reference to women, and presents the institutional support to women entrepreneurs in the country. The article suggests that for marketing the products women entrepreneurs must establish their credibility in terms of quality and competitiveness of product and service. The enormous difficulties faced by women entrepreneurs in marketing their products have inspired many entrepreneurs to find out innovative ways to overcome them. The collective effort for marketing will not only help in reducing the marketing cost, and enable the enterprises to reach a large number of customers and but will also help them to enhance their brand value, which will be helpful in the long run.
Begum Rasiya, A. (1993) in her study, “Problems of Women Entrepreneurs in Kerala”, assessed that scarcity of raw materials, shortage capital, shortage of finance, lack of support from family etc. are the major factors faced by the women entrepreneurs. She also revealed that only domestic production and supply is the main reason for the low growth.
Districts Industrial Centers have an active role in eliminating the problems of SSI units registered under DIC; the problems related to production, finance, marketing, and another related areas. The development commissioner, SSI, Government of India (1992) conducted a survey of SSI Units registered under District Industrial Centers in the State and union territories. The aim of the study is to evaluate the progress of SSI units registered under District Industrial Centers. The study revealed the progress in present contribution level of SSI units registered under DIC. Progress mainly related to employment production turnover etc. related to SSI units.
From the foregoing review it is seen that women entrepreneurs face various hurdles in their functioning and District Industrial Centers help the functioning of their enterprises.
ANALYSIS:
Table No. 1
The opinion of Women Micro Entrepreneurs about their Production Problems
Production Problems Ver
y l
ow
Lo
w
aver
age
Hig
h
Ver
y
hig
h
Mean SD t Sig.
Lack of availability of Local inputs
N 21 175 162 22 0 2.49 0.69 -14.478 0.000
% 5.53 46.05 42.63 5.79 0.00
Unaffordability of transportation cost
N 35 95 183 62 5 2.76 0.88 -5.415 0.000
% 9.21 25.00 48.16 16.32 1.32
Poor storage capacity for regular functioning
N 200 129 43 8 0 1.63 0.77 -34.868 0.000
% 52.63 33.95 11.32 2.11 0.00
High priced inputs N 29 92 197 62 0
2.77 0.81 -5.562 0.000 % 7.63 24.21 51.84 16.32 0.00

INTERNATIONAL JOURNAL FOR INNOVATIVE RESEARCH IN MULTIDISCIPLINARY FIELD ISSN: 2455-0620 Special Issue : 26, June – 2021
Monthly, Peer-Reviewed, Refereed, Indexed Journal with IC Value: 86.87 Impact Factor: 6.719 Publication Date: 30/06/2021
Available online on - www.ijirmf.com Page 169
Manufacturing N 198 73 64 45 0
1.88 1.07 -20.258 0.000 % 52.11 19.21 16.84 11.84 0.00
Marketing N 3 71 220 86 0
3.02 0.67 0.692 0.489 % 0.79 18.68 57.89 22.63 0.00
Competition N 10 77 202 79 12
3.02 0.80 0.384 0.701 % 2.63 20.26 53.16 20.79 3.16
market condition N 24 107 173 67 9
2.82 0.88 -4.083 0.000 % 6.32 28.16 45.53 17.63 2.37
Branding N 202 159 19 0 0
1.52 0.59 -48.778 0.000 % 53.16 41.84 5.00 0.00 0.00
quality of product N 237 128 15 0 0
1.42 0.57 -54.363 0.000 % 62.37 33.68 3.95 0.00 0.00
Source: Primary Data Table no.1, which presents that women entrepreneurs have no strong response to high and
very high production problems. Poor storage capacity for regular functioning, manufacturing problems, branding problems, and quality of product problems are the variables that the women manufacturing micro-entrepreneurs have a strong disagreement, about which means the response is low and very low. And other variables like lack of availability of local inputs, unaffordability of transportation cost, high priced inputs and market condition are shown to be average and low-level problems affecting the sample respondents. Its mean value is less than 3. The result of one sample t-test shows there exists a significant difference in the opinion among women manufacturing micro entrepreneurs in their production problems like lack of availability of local inputs, poor storage capacity for regular functioning, manufacturing problems, branding problems, and quality of product problems. Unaffordability of transportation cost, high priced inputs and market condition are the moderate problems and the responses are scattered over the scale. Its mean value is less than 3. The results of its one sample t-test used to exhibits there is a significant relation in these production problems. Marketing and competition are the average problems affecting the majority of the respondents of women manufacturing micro enterprises have the mean score is 3.02 respectively, using one sample t-test which has no significant difference in production problems. Which is equal to the mean of the response scale and both these factors are the average production problems faced by women manufacturing micro enterprises.
Table No. 2
Weights computed for the elements of DICs Involvement in Production function by the Paired
ranking Method
Production function Weights
Support on technology innovation 0.067
Financial support to improve technology 0.200
Intervention during technology break down 0.133
Helps to locate the source of Raw material 0.067
Helps to locate the source of Machinery 0.067
Checking exploitation by middlemen 0.022
Provide training at the Initial Stage 0.178 Provide training During the Course of
production 0.156
Monitoring and periodic assessment 0.111 Source: Primary Data

INTERNATIONAL JOURNAL FOR INNOVATIVE RESEARCH IN MULTIDISCIPLINARY FIELD ISSN: 2455-0620 Special Issue : 26, June – 2021
Monthly, Peer-Reviewed, Refereed, Indexed Journal with IC Value: 86.87 Impact Factor: 6.719 Publication Date: 30/06/2021
Available online on - www.ijirmf.com Page 170
On perusal, it is clear that from the table no.2, financial support to improve technology goes to the highest weight of 0.200 and it is followed by providing training at the initial stage assigned weight to 0.178. Checking exploitation by middlemen goes to least weight score of 0.022.
Table No. 3
Descriptive statistics of the level of Involvements of DICs in the Production function
Mean 2.80
Median 2.83
SD 0.43
Minimum 1.62
Maximum 3.69 Source: Primary Data
Descriptive statistics of the level of involvements of DIC in production function shows to get mean of 2.8008, median 2.83, 0.43437 as standard deviation, 1.62 as a minimum value and 3.69 is stated as the maximum value.
Table No. 4
DICs Involvement in the Production function
Category Number Percent
Low 105 27.6
Medium 163 42.9
High 112 29.5
Total 380 100 Source: Primary Data
Table No. 4 reveals that a number of sample respondents from each category, the majority of 163 sample respondents are medium group category, 112 number of sample respondents are in high group category and the rest of 105 sample respondents are in the low group category.
Table No. 5
The mean opinion of the low, medium, and high Involvement of DICs in Production Problem of
Women micro Enterprises
Production Problems
Total Low Medium High ANOVA MANOVA
Mean SD Mean SD Mean SD Mean SD F Sig. F Sig. Lack of availability of Local inputs 2.49 0.69 2.41 0.68 2.40 0.73 2.68 0.60 6.286 0.002
9.102 0.000
Unaffordability of transportation cost 2.76 0.88 2.63 0.71 2.83 0.91 2.77 0.98 1.661 0.191 Poor storage capacity for regular functioning 1.63 0.77 2.05 0.73 1.59 0.81 1.29 0.51 30.694 0.000 High priced inputs 2.77 0.81 2.86 0.81 2.75 0.82 2.71 0.79 0.989 0.373
Manufacturing 1.88 1.07 2.60 1.12 1.87 1.03 1.23 0.54 57.005 0.000
Marketing 3.02 0.67 3.11 0.66 3.08 0.75 2.86 0.50 5.141 0.006
Competition 3.02 0.80 3.24 0.85 3.02 0.89 2.79 0.52 8.631 0.000 market condition 2.82 0.88 2.83 0.90 2.94 0.96 2.62 0.69 4.745 0.009

INTERNATIONAL JOURNAL FOR INNOVATIVE RESEARCH IN MULTIDISCIPLINARY FIELD ISSN: 2455-0620 Special Issue : 26, June – 2021
Monthly, Peer-Reviewed, Refereed, Indexed Journal with IC Value: 86.87 Impact Factor: 6.719 Publication Date: 30/06/2021
Available online on - www.ijirmf.com Page 171
Branding 1.52 0.59 1.60 0.61 1.58 0.59 1.36 0.55 6.101 0.002 quality of product 1.42 0.57 1.70 0.67 1.44 0.53 1.13 0.33 31.967 0.000
Source: Primary Data Table no.6.7, which depicts that the high involvement of DICs reduced the entire
production problems of women manufacturing micro enterprises. DICs’ high involvement reduced the production problems such as poor storage capacity for regular functioning (1.29), high priced inputs (2.71), manufacturing (1.23), marketing (2.86), competition (2.79), market condition (2.62), branding(1.36) and quality of product (1.13) as it mean score is low when compared to medium and low-level DICs involvement. From this except market condition, all other production problems are medium level problem where there is medium level involvement of DICs and very high-level problem in DICs low-level involvements. Lack of availability of local inputs is very low level in DICs’ medium level involvement and mediumly in DICs low-level involvement and it is very high in DICs high-level involvements. Unaffordability of transportation cost problem is high in DICs’ medium level involvement, mediumly in DICs high-level involvement and very low in DICs low-level involvement. The result of One Way ANOVA shows unaffordability of transportation cost and high priced inputs problem have no significant difference in the low, medium and high-level involvements of DIC, its significant value is above 0.050. By comparing all production problems of women micro units, marketing and competition problem is a very highly affecting problem in DICs involvement. In every stage of involvement, these problems are to get a very high mean score (above 3) compared to other problem factors. Using MANOVA all production problems related to women micro units show significant difference because its significant value is below 0.050. Hence reject the null hypothesis. Involvement of DIC in the production function of women micro units not significantly reduce their production problems. Accept alternative hypothesis, involvements of DIC in the production function of women micro units significantly reduce their production problems.
FINDINGS & CONCLUSION:
All production problems are of medium and low level in nature. DICs’ involvement in production reduces the production problems. Women micro entrepreneurs face problems in lack of availability of local inputs, unaffordability of transportation cost, poor storage capacity for regular functioning, high priced inputs, manufacturing problems, marketing problems, competition, market condition, branding problem and quality of the product.
REFERENCES : 1. Basargekar, P. (2007). Women entrepreneurs: Challenges faced. ICFAI Journal of
Entrepreneurship Development, 4(4), 6-15. 2. Begum Rasiya, A. (1993). Study on the problems of Women entrepreneurs in Kerala. Ph.D
thesis, Kerala University. 3. Government of India, Report on the All India Census of SSI Units-Summary, Office of the
Directorate Commissioner (SSI) Ministry of Industries, New Delhi 1992. 4. MSME Annual Report 2009. Government of India: Ministry of Micro, Small and Medium
Enterprises. 5. MSME Annual Report 2010. Government of India: Ministry of Micro, Small and Medium
Enterprises.

INTERNATIONAL JOURNAL FOR INNOVATIVE RESEARCH IN MULTIDISCIPLINARY FIELD ISSN: 2455-0620 Special Issue : 26, June – 2021
Monthly, Peer-Reviewed, Refereed, Indexed Journal with IC Value: 86.87 Impact Factor: 6.719 Publication Date: 30/06/2021
Available online on - www.ijirmf.com Page 172
International Conference on
Business, Management, Social and Economical Advancements 26 & 27 June, 2021 Bangkok, Thailand
Jointly organized by: Management Institute, Warsaw University of Life Science - SGGW, Warszawa, Poland,
‘Research Culture Society’ and ‘Scientific Research Association’.
Thoughts for Research on Strategic Intuition in Business
Prof. Markus A. Launer
Ostfalia University of Applied Sciences Campus Suderburg, Germany Email :- [email protected]
Abstract: Research on intuition slowly enters the business literature and research. However, most
research approaches concentrate on the traditional, classical, and holistic intuition, uncritical
perception, and unconscious intuition type. This article is a short paper on the theme of strategic
intuition based on the research program “Intuition (RHIA)” at the Ostfalia University Campus Suderburg. It suggests to research intuition in a multi-dimensional approach across different
disciplines. In particular, strategic intuition should be researched based on neurology (emotional
intuition), unconscious science (unconscious thought theory), and para-psychology (anticipation).
INTRODUCTION:
Intuition, or intuitive decision-making, becomes more and more an issue in research on business management. Strategic decisions in business cannot be explained by normative or rational decision-making theory nor by behavioral economics
1. However, behavioral economics is the effort to increase the explanatory and predictive power of economic theory by providing it with more psychologically plausible foundations2. It was Tversky and Kahneman3 that described the irrationalities in human decision making which started a new era in behavioral economics4. Heuristic decisions based on knowledge and experience entered the literature on behavioral economics5. New research now considers intuition as a decision-making basis. It may be time to add intuition to the concept of behavioral economics and business administration.
Markus Launer and his team research in an EU-financed project intuition in different workplaces (Intuition (RHIA). It is a mixed research approach with interviews and empirically with questionnaires in a worldwide sample of 5570 answers from 30 countries6. First pre-tests were performed7 8and a new multi-dimensional measurement instrument in the making.
Measuring manager’s intuition:
Slowly, there is more literature on intuition in business. Dane and Pratt explored intuition and its role in managerial decision-making in a broad approach9. The definition of intuition were affectively charged judgments that arise through rapid, nonconscious, and holistic decision-making. However, strategic managerial decisions are not rapid. Liebowitz and Paliszkiewicz et al. described how well executives do by trusting their intuition in a holistic approach10. The book excellently describes the holistic type of intuition. However, as most authors they concentrate on the comparison between rationality (deliberation) and intuition. They also gathered a broad range of literature on intuition in business displaying the wide range of applied intuition11. However, intuition is much more than the opposite of rationality and emotions.
Measuring scales like from Epstein (CEST)12, Epstein and Pacini (REI)13, Scott and Bruce (GDMS)14, Burns and D’Zurilla (PMPI)15, Pretz et al16 and Betsch (PID)17 describe intuition in a cognitive, dual-process, domain-specific approach. Pachur and Spaar developed a domain-general measurement scale (USID) assembling these different types of intuitions and scales18. However, it

INTERNATIONAL JOURNAL FOR INNOVATIVE RESEARCH IN MULTIDISCIPLINARY FIELD ISSN: 2455-0620 Special Issue : 26, June – 2021
Monthly, Peer-Reviewed, Refereed, Indexed Journal with IC Value: 86.87 Impact Factor: 6.719 Publication Date: 30/06/2021
Available online on - www.ijirmf.com Page 173
does not yet comprise the intuition of managers completely. Therefore, a multi-dimensional measuring tool is needed. Launer is developing a manager focused measuring instrument with multiple dimensions from different research fields19.
Different kind of intuitions are pre-dominant in different industries and different managerial levels20. Launer, Paliszkiewicz and Cetin showed that top-level managers have a higher, stronger intuition than managers on middle and first level management21. However, when there are different types of intuition, what specific types are typical for top managers? Therefore, first a broader definition on intuition is needed. “Intuition is an unconscious, spontaneous or slow decision-making process over time based on holistic, effortless thoughts, learned heuristics, affective feelings and emotions, a perception without awareness as well as un unexplainable anticipation capability”22.
Emotional Intuition – important in healthcare as well as for managers
Top managers have to have a high level of emotional intuition. Daniel Goleman argues that emotionally intelligent leaders are now "must-haves" for business23. Latest research shows that the emotional intuition level is as high as on the first level managers, e.g. in healthcare sector and other service industries with working carefully with humans24. Managers need to have a feeling for people. The feeling could be the so-called gut feeling. The typical intuition scales are measuring affective emotions only in a general way. According to studies in neurology, there are more feelings sending neural messages for decision-making. The interoception approach by Craig describes how well people have homeostatic sensory ability and relate to visceral sensation25. Based on these results, there is much more than gut feeling such as feelings on the skin, the heart rate or other. Damasio even described that emotional experiences are embodied in humans and thus influence intuitive decisions26. The information processing system controlling feelings appears to be activated before participants are aware that they had made a decision. Physiological somatic markers direct the individual’s attention to the undesirable outcomes that can result from certain actions. LeDoux even based intuition on emotions such as anger and aggression27. Important in this regard is the ability of awareness of the body’s messages. Some managers reported in interviews that they just feel the right decision within their body - others don`t. Male managers admitted secretly that they very often ask their wife’s at home what they feel about a decision. It is argued that results from neurology need to be added to intuition research, e.g. for strategic decisions.
Spontaneous intuition is best for emergencies – learned heuristics
The key problem in intuition research for business is that business decisions are not being made spontaneous. Spontaneous decisions are being described as a snap decision, quick or immediate, swiftly decision, knowing based on experience and in memory of a similar situation28. Human information processing theory29 describe spontaneous decisions in a two-process theory of human information processing automated and controlled processes. Automatic processing are described as an activation of a previously learned sequence of elements in long-term memory30. Most of the intuition research therefore ask for fast and quick decisions described as spontaneous intuition. Spontaneous decision-making can be based on learned heuristics as described by the German researcher Gigerenzer, Todd and the ABC Research Group31. Klein described intuition in business based on his Recognition-Primed Decision (RPD) Model32, e.g. in rapid decision making situations in industries like fire fighters, military, and aerospace33. However, this type of spontaneous, quick decision-making is more necessary for police officers, fire brigade, military, and emergency doctors. Other authors base intuitive decisions in business on the classical, holistic, uncritical perception and unconscious intuition. However, this intuition type is also about fast and quick decisions. One of the problems in measuring intuition is the concentration on spontaneous and affective decision-making. Moxley et al from the Florida State University, researched the role

INTERNATIONAL JOURNAL FOR INNOVATIVE RESEARCH IN MULTIDISCIPLINARY FIELD ISSN: 2455-0620 Special Issue : 26, June – 2021
Monthly, Peer-Reviewed, Refereed, Indexed Journal with IC Value: 86.87 Impact Factor: 6.719 Publication Date: 30/06/2021
Available online on - www.ijirmf.com Page 174
of slow deliberation for experts but was concentrating on rational decision processes34. So what is missing?
Unconscious Thoughts are important but hardly researched
A suitable theory for slow decision-making process is the theory of Unconscious Thoughts. This intuition type describes the decision-making process over a day, a week, or even month. It perfectly fits the typical business environment. The problem with this approach is that many influences interfere the thought process, there is a distraction from the problem, and there is a lack of a precise description what people feel at what time. For researchers, it is difficult to measure and evaluate. Dijksterhuis is concentrating on this problem35 and found out that decisions in complex situations get better results when people are distracted from the problem for some time36. However, psychologist make a great effort to fight his results37. Despite the critics, managers were being asked about their decision-making style over a longer period. It was shown that top-Managers have a significant higher unconscious thought ability than middle- and first-level managers do38.
The unconscious thought process is not yet researched in depth. Nevertheless, it can be said that the assurance for a strategic decision just comes over time, not spontaneous and not only by rational analysis39. In the military, it is mandatory to sleep one night before making a complaint. People get different opinions and seek various inspirations. After some time, people just know the right thing to do without analyzing all information systematically. In this field, much more research should be done. However, the two intuition types still do not fully describe the strategic intuition. So far, it describes more or less the information someone’s body is given to them. However, what is if the right answer is not available within your body? Strategic business decisions are about future developments, how people will act, how markets will react. It sounds illogic that information of future events is stored in a human`s body. However, some top-managers have the ability to make the right strategic decisions. Entrepreneurs creating innovations for the future. Is it all feeling trends and developments? Or is there something missing?
In soccer and football, it is common to talk about the anticipation of the flight path of a flying ball, the next steps of the rival team, or the goalkeeper just knows what direction the penalty kick will go. However, intuition in sports are based on learned heuristics anticipating the effects of one's own action, reflected in the model of the “triadic phase structure of the action”40. This is the first stage before the realization and interpretation of an action. Through the postulated common coding of perception and action, the internal models that control one's own movement execution are assigned the function of enabling the anticipation of the consequences of other people's actions. But sometimes, people, sportsmen, managers, just know what will happen. How can it be explained?
Anticipation – an avoided research area :
The answer might be the anticipation of future events based on precognition and/or premonitions. Launer asked managers about their ability to anticipate future events. The results were not yet clear. It is suspected that the existing empirical scales do not really ask the questions in the right way managers relate to it properly. However, the group of priests, yoga teachers and meditating people clearly stated that they have this ability to foresee future events. It seems that people with a balance of body and soul, a strong connection to their inner body also have another ability: precognition and premonition. The information can only come from outside their body. Quantum physics may explain this phenomenon. Since all people and substances are information, some people may receive this information via sensors we do not know yet. Many esoteric researchers are working on this phenomenon; however, most might have a not suitable research basis. Often, there is a misinterpretation of quantum physics. The basis of our universe is information, not energy, waves or particles.

INTERNATIONAL JOURNAL FOR INNOVATIVE RESEARCH IN MULTIDISCIPLINARY FIELD ISSN: 2455-0620 Special Issue : 26, June – 2021
Monthly, Peer-Reviewed, Refereed, Indexed Journal with IC Value: 86.87 Impact Factor: 6.719 Publication Date: 30/06/2021
Available online on - www.ijirmf.com Page 175
Schneider, book author on quantum physics and religion, researches the area of quantum physics in this regards and clarifies the basic assumptions41. Thalbourne, an Australian psychologist who worked in the field of parapsychology, developed the so-called sheep-goat-scales to measure para-normal beliefs42. The questions may be to esoteric for managers. Bem et al summarized plenty of studies on para-normal abilities in meta studies43. However, there are accusations of an error of data in search of statistical significance to support the claims of the paranormal. Radin showed the existence of premonition in his experiments with a sophisticated lie detector and more advanced measurement instruments44. McCartney trains physicians and more and more managers in energy and balance methods with great success.
Sciences is not yet clear of this research area and almost all scientific researchers avoid this research field. It is not well received at universities and might affect even careers negatively. There is a complete new field to be researched where science just started to look at. Nevertheless, one thing is for sure, good strategic managers and entrepreneurs need to know the developments in the future. In interviews, managers admitted they just know where to go. Others, who don`t, seeked help with astrologists and card reading – anonymously. No manager would ever publicly admit that they use esoteric techniques for their business decisions.
CONCLUSION:
For researching strategic intuition, researchers should expand upon the existing intuition measures. Spontaneous, heuristic intuition seems to be for emergencies only. Emotional intuition based on neurology science is important as well the unconscious thought theory. Maybe intuition research should expand into para-psychology to start explaining the anticipation of future trends. REFERENCES:
1 Beck, H. Behavioral Economics. Springer Gabler: Wiesbaden, Germany, 2014. 2 Angner, E.; Loewenstein, G. (2012). Behavioral Economics. In Handbook of the philosophy of science of economic Mäki, U., Eds.; Amsterdam: Elsevier, Netherlands, 2012, p. 641-690. 3 Tversky, A.; Kahneman, D.S. Availability: A heuristic for judging frequency and probability. Cognitive Psychology 1973, 5(2), p. 207-232. 4 Einhorn, H.J.; Hogarth, R.M. Behavioral decision theory: processes of judgment and choice. Annual Review of Psychology 1981, 32, p. 53-88. 5 Gigerenzer, G.; Selten, R. Rethinking rationality. In Bounded rationality: The adaptive toolbox Gigerenzer G.; Selten R., Eds.; Cambridge: MIT Press, USA, 2002, p. 1-12. 6 Marcial, D.; Launer, M. (2019): Towards the Measurement of Digital Trust in the Workplace: A Proposed Framework, in: International Journal of Scientific Engineering and Science, Volume 3, Issue 12, p. 1-7, 2019 ISSN (Online): 2456-7361 7 Marcial, D.; Launer, M. Test-retest Reliability and Internal Consistency of the Survey Questionnaire on Digital Trust in the Workplace, in: Solid State Technology 2021, 64(2), p. 4369-4381. 8 Launer, M.; Marcial, D.; Gaumann, Ch. Pre-Print Reliabilty and Consitancy Test of the global Survey Digital Trust & Intuition at the Workplace (Survey Digital Trust & Intuition), in: Research Gate, 2020. 9 Dane, E.; Pratt, M.G. Exploring Intuition and its Role in Managerial Decision Making. Academy of Management Review 2007, 32(1), p. 33-54. 10 Liebowitz, J.; Chan, Y.; Jenkin, T.; Spicker, D.; Paliszkiewicz, J.; Babiloni, F. How Well Do Executives Trust Their Intuition, CRC Press: Boca Raton, USA, 2019. 11 Liebowitz, J.; Paliszkiewicz, J.; Gołuchowski, J. Intuition, Trust, and Analytics; CRC Press: Boca Raton, USA, 2018. 12 Epstein, S. The implications of Cognitive–Experiential Self-theory for research in social psychology and personality, Journal for the Theory of Social Behavior 1985, 15, p. 283–310. 13 Epstein, S.; Pacini, R.; Denes-Raj, V; Heier, H. Individual differences in intuitive-experiential and analytical-reasoning thinking styles. Journal of Personality and Social Psychology 1996, 71, p. 390-405.

INTERNATIONAL JOURNAL FOR INNOVATIVE RESEARCH IN MULTIDISCIPLINARY FIELD ISSN: 2455-0620 Special Issue : 26, June – 2021
Monthly, Peer-Reviewed, Refereed, Indexed Journal with IC Value: 86.87 Impact Factor: 6.719 Publication Date: 30/06/2021
Available online on - www.ijirmf.com Page 176
14 Scott, S.G., Bruce, R.A. Decision-making style: The development and assessment of a new measure. Educational and Psycho-logical Measurement 1995, 55, p. 818–831. 15 Burns, L.R.; D’Zurilla, T.J. Individual differences in perceived information-processing styles in stress and coping situations: Development and validation of the perceived modes of processing inventory. Cognitive Therapy and Research 1999, 23, p. 345–371. 16 Pretz, J.E.; Totz, K.S. Measuring individual differences in affective, heuristic, and holistic intuition. Personality and Individual Differences 2007, 43(5), p. 1247-1257. 17 Betsch, C. Präferenz für Intuition und Deliberation (PID): Inventar zur Erfassung von affekt- und kognitionsbasiertem Entscheiden [Preference for Intuition and Deliberation (PID): An Inventory for Assessing Affect- and Cognition-Based Decision-Making]. Zeitschrift für Differentielle und Diagnostische Psychologie 2004, 25(4), p. 179–197. 18 Pachur, T.; Spaar, M. Domain-specific preferences for intuition and deliberation in decision making. Journal of Applied Re-search in Memory and Cognition 2015, 4(3),p. 303-311. 19 Launer, M., Cetin, F. (2021): Core Model Intuition, in print 20 Launer, M., Svenson, F. (2020): INTUITION - Different Intuition Types for different Job / Industry Types, Project: Rationality, Heuristics, Intuition & Anticipation (RHIA), presented and discussed at 4th international Conference: Ostfalia Service Management Congress, November 2020 21 Launer, M., Paliskiwicz, J., Cetin, F. (2021): Intuition on different manager levels, in: Presentation and Conference Proceedings at the IACIS Conference Europe, Warsaw, Poland. 22 Launer, M.; Svenson, F., Ohler, D., Ferwagner, M., Meyer, J. Rationalität, Heuristik, Intuition, Bauchgefühl & Antizipation (RHIBA), Suderburger Working Paper 2020, 10, p. 1-79. 23 Goleman, D.; Boyatzis, R.; McKee, A. The new leaders: Transforming the art of leadership into the science of results; Time Warner: London, UK, 2002. 24 Paliskiwicz, J., Cetin, F.; Launer, M. (2021): Intuitive decision-making styles of different levels of management positions in a diversified sample, in: Presentation and Conference Proceedings at the IACIS Conference Europe, a Conference of the International Association for Computer Information Systems, Warsaw, Poland. 25 Craig, A.D. How do you feel? Interoception: the sense of the physiological condition of the body. Nature reviews. Neuroscience 2002, 3(8), p. 655–666. 26 Damasio, A. The feeling of what happens: Body, emotion and the making of consciousness; Vintage: London, UK, 1999. 27 LeDoux, J. The emotional brain; Touchstone/Simon & Schuster: New York, USA, 1996. 28 Epstein, S.; Pacini, R. Some basic issues regarding dual process theories from the perspective of cognitive–experiential self-theory. In Dual-process theories in social psychology Chaiken, S.; Trope, Y, Eds.; New York: Guildford Press, USA, 1999, p. 462–482. 29 Lindsay, P.H.; Norman, D.A. Human Information Processing: An Introduction to Psychology, Academic Press: Cambridge, USA, 1977. 30 Shiffrin, R.M.; Schneider, W. Controlled and automatic human information processing: II. Perceptual learning, automatic attending and a general theory. Psychological Review 1977, 84(2), p. 127–190. 31 Gigerenzer, G.; Todd, P.M. Fast and frugal heuristics: the adaptive toolbox. In Simple heuristics that make us smart Gigerenzer, G.; Todd, P.M.; the ABC Research Group, Eds., Oxford University Press: New York, USA, 1999, p. 3-36. 32 Klein, G.A. Sources of Power: How People Make Decisions (20th ed.); MIT Press: Cambridge, UK, 1998. 33 Klein, G.A. A Recognition-Primed Decision (RPD) Model of Rapid Decision Making. In Decision making in action: Models in methods Klein, G.A.; Orasanu, J.; Calderwood, R.; Zsambok, C.E., Eds., Ablex: Norwood, USA, 1993, p. 138–147. 34 Moxley, J.H.; Ericsson, K.; Charness, N.; Krampe, R.T. The role of intuition and deliberative thinking in experts’ superior tactical decision-making. PubMed Cognition 2012, 124(1), p. 72-78. 35 Dijksterhuis, A. Think different: the merits of unconscious thought in preference development and decision making. Journal of Personality and Social Psychology 2004, 87(5), p. 586-598. 36 Dijksterhuis, A.; Nordgren, L.F. A Theory of Unconscious Thought. Perspectives on psychological science: a journal of the Association for Psychological Science 2006, 1(2), p. 95-109.

INTERNATIONAL JOURNAL FOR INNOVATIVE RESEARCH IN MULTIDISCIPLINARY FIELD ISSN: 2455-0620 Special Issue : 26, June – 2021
Monthly, Peer-Reviewed, Refereed, Indexed Journal with IC Value: 86.87 Impact Factor: 6.719 Publication Date: 30/06/2021
Available online on - www.ijirmf.com Page 177
37 Čavojová, V.; Ballová Mikušková, E. Failure to Replicate the Unconscious Thought Advantages. International Journal of Indus-trial and Manufacturing Engineering 2014, 8(7), p. 2079-2084. 38 Launer, M.; Çetin, F.; Svenson, F.; Ohler, D. Exploring intuitive decision-making differences in varying industries from a worldwide sample. Conference Paper at the IACIS Conference Europe of the International Association for Computer Information Systems, 2021 39 Launer, M.; Svenson, F.; Çetin, F.; Balasubramanian, K.; Konar, R. Intuition at the workplace in the hotel industry - an empirical analysis of rational & five different intuition decision-making types. Conference Presentation: Gloserv Conference, University of South Florida, USA, 2021 40 Nitsch, J.R. Handlungstheoretische Grundlagen der Sportpsychologie. In Einführung in die Sportpsychologie, Teil I: Grundthemen Gabler H.; Nitsch J.R.; Singer R., Eds.; Hofmann Verlag: Schorndorf, Germany, 2000, p. 43-164. 41 Schneider, D. Jesus Christus Quantenphysiker — Warum die moderne Naturwissenschaft Vater, Sohn und Heiliger Geist zur Erklärung der Welt benötigt, Amazon, 2014 42 Thalbourne M.A.; Delin P.S. A new instrument for measuring the sheep-goat variable: Its psychometric properties and factor structure. Journal of the Society for Psychical Research 1993, 59, p. 172–86. 43 Bem, D.; Tressoldi, P.; Rabeyron, T.; Duggan, M. Feeling the future: A meta-analysis of 90 experiments on the anomalous anticipation of random future events. PMC (US National Library of Medicine - National Institutes of Health) 2015, 4, p. 1188. 44 Radin, D. Electrodermal Presentiments of Future Emotions. Journal of Scientific Exploration 2004, 18(2), p. 253-273.

Benefits to publish in IJIRMF:
IJIRMF is an Open-Access, peer reviewed, Indexed, Refereed International Journal with
wide scope of publication.
Author Research Guidelines & Support.
Platform to researchers and scholars of different study field and subject.
Reliable and Rapidly growing Publication with nominal APC/PPC.
Prestigious Editorials from different Institutes of the world.
Communication of authors to get the manuscript status time to time.
Full text of all articles in the form of PDF format and Digital Object Identification System.
Individual copy of “Certificate of Publication” to all Authors of Paper. Indexing of Journal databases like Google Scholar, Academia, Scribd, Mendeley, Internet
Archive, Bing, ISSUU, ResearchBib etc.
Open Access Journal Database for High visibility and promotion of your article with
keyword and abstract.
Organize Conference / Seminar and publish its papers with ISSN.
Published By
RESEARCH CULTURE SOCIETY & PUBLICATION
Email: [email protected]
Web Email: [email protected]
WWW.IJIRMF.COM