Q1 FY 2021-22 JUNE 2021 - Punjab National Bank
49
Follow our Official Page ‘pnbindia’ FINANCIAL RESULTS Q1 FY 2021-22 JUNE 2021
-
Upload
khangminh22 -
Category
Documents
-
view
0 -
download
0
Transcript of Q1 FY 2021-22 JUNE 2021 - Punjab National Bank

Follow our Official Page ‘pnbindia’
FINANCIAL RESULTS
Q1 FY 2021-22
JUNE 2021

Page I
Content
Key Highlights1
Business Performance2
Financial Performance3
Asset Quality4
Share Holding & Capital5
Network, Digitalization & FI6
Group Business & RRBs7
3-4
Slide No
33-35
36-43
44-45
17-24
25-32
5-16
2
Awards & Way Forward8 46-47

Page I
Core Strengths
Improving Operating EfficiencyAcross Key Financial & Productivity Metrics
Strong Distribution NetworkPAN India Presence
Total Delivery Channels: 3685110641 Domestic & 2 International
Branches, 13690 ATMs & 12518 BCs
Synergy realization through rationalization of Branches and ATM
Rationalization of 503 Branches &388 ATMs
Focus on Digitalization and Expanding Digital Footprints
PNB One Mobile App : ‘One for All’‘All for One’
Strong and Granular Low Cost Deposit Base
Domestic CASA Ratio: 45.15%
3
Adequately CapitalizedCRAR % : 15.19%
126 Years of BankingExperience & Resilience
Technology Driven Credit UnderwritingPNB LenS (Lending Solution) –
for Uniform and Efficient Credit Underwriting

Page I
Key Financial Highlights -June’21
2.73%Global NIM %
15.19%
CRAR
45.15%
Domestic CASA Share8.3% YoY Gr
Savings Deposit
15.5% YoY GrOperating Profit
91.2%
43.64%Cost-Income Ratio
Net Profit
4
Net Interest Income6.6% YoY Gr
Retail Term Deposit
10.7% YoY Gr
₹ 8270 Crore
Total Recovery(Incl Up-gradation)
(Retail TD + CASA) Share
53.9%
RAM Share to domestic Advances
232.1 % YoY Gr
Page I
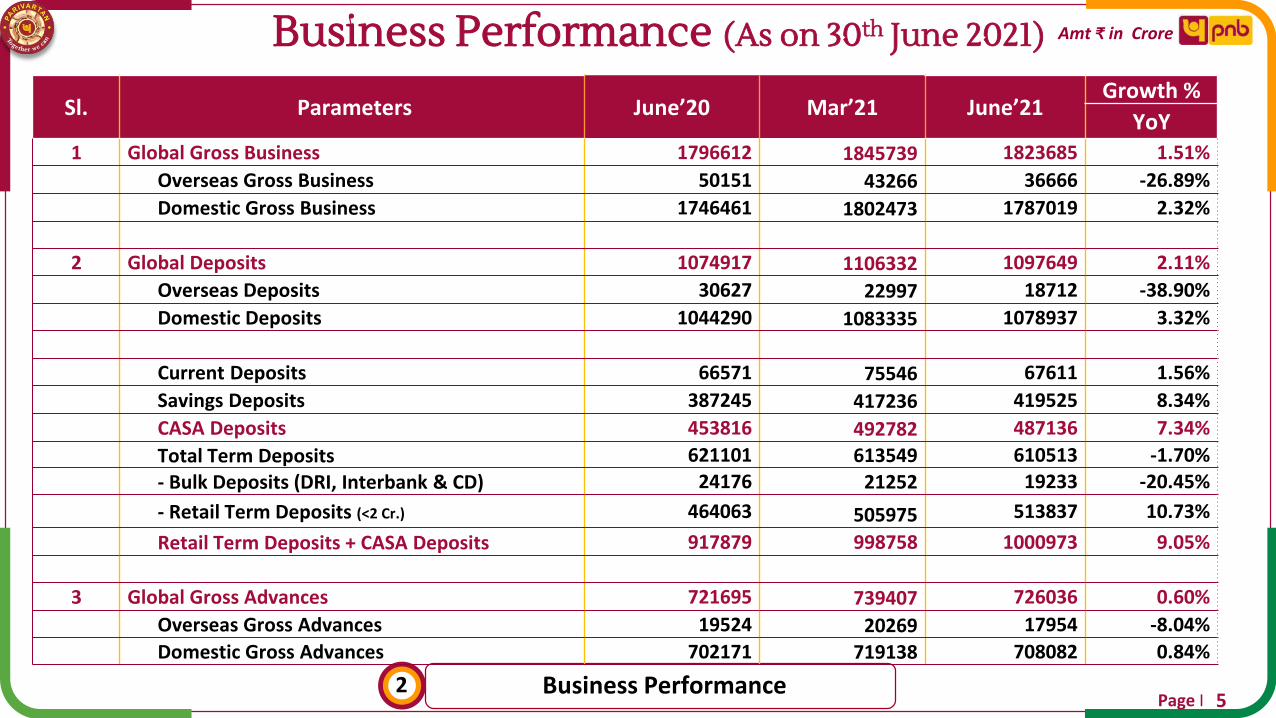
Business Performance (As on 30th June 2021)
Business Performance2
Sl. Parameters June’20 Mar’21 June’21Growth %
YoY1 Global Gross Business 1796612 1845739 1823685 1.51%
Overseas Gross Business 50151 43266 36666 -26.89%
Domestic Gross Business 1746461 1802473 1787019 2.32%
2 Global Deposits 1074917 1106332 1097649 2.11%
Overseas Deposits 30627 22997 18712 -38.90%
Domestic Deposits 1044290 1083335 1078937 3.32%
Current Deposits 66571 75546 67611 1.56%
Savings Deposits 387245 417236 419525 8.34%
CASA Deposits 453816 492782 487136 7.34%
Total Term Deposits 621101 613549 610513 -1.70%
- Bulk Deposits (DRI, Interbank & CD) 24176 21252 19233 -20.45%
- Retail Term Deposits (<2 Cr.) 464063 505975 513837 10.73%
Retail Term Deposits + CASA Deposits 917879 998758 1000973 9.05%
3 Global Gross Advances 721695 739407 726036 0.60%
Overseas Gross Advances 19524 20269 17954 -8.04%
Domestic Gross Advances 702171 719138 708082 0.84%
5
Amt ₹ in Crore

Page I
CASA Performance
Business Performance26
Amt ₹ in Crore
Domestic CASA Share %
66571 67611
Jun'20 June'21
Current Deposits
1.6%
387245 419525
Jun'20 June'21
Savings Deposits
8.3%
6.37% 6.26%
37.08% 38.89%
Jun'20 June'21
Current Deposits % Savings Deposits %
43.45% 45.15%
85.4%
91.2%
Jun'20 Jun'21
(Retail TD < Rs. 2 Cr + CASA) Share %
Page I
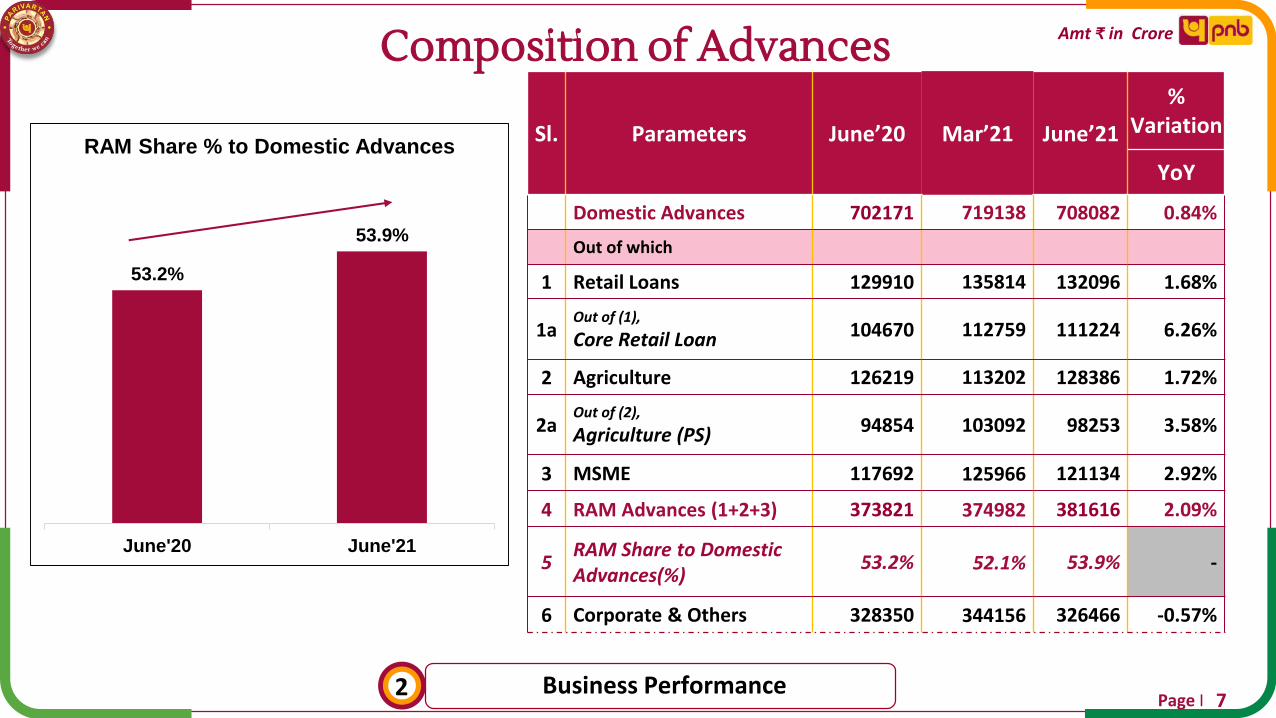
Composition of Advances
Business Performance7
2
Amt ₹ in Crore
Sl. Parameters June’20 Mar’21 June’21
% Variation
YoY
Domestic Advances 702171 719138 708082 0.84%
Out of which
1 Retail Loans 129910 135814 132096 1.68%
1aOut of (1),
Core Retail Loan 104670 112759 111224 6.26%
2 Agriculture 126219 113202 128386 1.72%
2aOut of (2),
Agriculture (PS) 94854 103092 98253 3.58%
3 MSME 117692 125966 121134 2.92%
4 RAM Advances (1+2+3) 373821 374982 381616 2.09%
5RAM Share to Domestic Advances(%)
53.2% 52.1% 53.9% -
6 Corporate & Others 328350 344156 326466 -0.57%
53.2%
53.9%
June'20 June'21
RAM Share % to Domestic Advances

Page I
Composition of Core Retail Advances
Business Performance8
2
Amt ₹ in Crore
Rating profile of Retail Advances
Risk Profiling based on Cibil Scores.
* “-1” Denotes No Credit History.
49.8% 50.9%
10.2% 10.4%
21.2% 19.8%
18.8% 18.9%
June'20 June'21
Abv 725 701-725 upto 700 -1
Above700
(60.0%)
Above700
(61.3%)
8522
10016
June'20 June'21
Vehicle/Car Loan
17.5%7904
10308
June'20 June'21
Personal Loan
30.4%
66761 70848
June'20 June'21
Housing Loan
6.1%104670 111224
June'20 June'21
Core Retail Loan
6.3%

Page I
Priority Sector Achievement
Business Performance2
Sl. ParametersMandated
TargetsJune’20 Mar’21* June’21
ANBC 672161 682197 674350
1 Priority Sector 270558 298140 283935
% to ANBC 40% 40.25% 41.34% 42.10%
2Agriculture - PS(Incl RIDF, IBPC & PSLC)
118527 132185 120658
% to ANBC 18% 17.63% 18.20% 17.89%
3 Small and Marginal Farmers 56943 57392 61900
% to ANBC 9% 8.47% 8.38% 9.17%
4 Weaker Section 73981 82086 85050
% to ANBC 11% 11.01% 11.36% 12.61%
5 Micro Enterprises (PS) 53545 56136 53501
% to ANBC 7.5% 7.97% 7.98% 7.93%
9
Amt ₹ in Crore
*Achievement is on absolute basis;
% to ANBC is on Quarterly average basis.

Page I
MSME Portfolio Mix
Business Performance210
Amt ₹ in Crore
Mudra Loans JUNE’20 JUNE’21
Amount Sanctioned 2362 2179
Amount Disbursed 1283 2046
Performance under PMMY
Upto 30.06.2021 No of Loans Sanctioned - 174460Total Amount Sanctioned - Rs 174 Crore
45.0% 44.3% 44.2%
43.0%36.5% 36.6%
12.0%19.2% 19.2%
JUNE'20 MAR'21 JUNE'21
Segment Mix
Micro Small Medium
Performance under GECL Facility
GECLAs on
June’21
Amount Sanctioned 13512
Amount Disbursed 12008

Page I
External Rating (Standard FB) Portfolio & Advances on Benchmark Rates
Business Performance2
Portfolio > Rs. 100 Crore
Sl Rating GradeJune’21
Amt. % Share
1 AAA 85399 44.0%
2 AA 39500 20.3%
3 A 28687 14.8%
4 BBB 18233 9.4%
Total BBB & Above 171819 88.5%
5 BB 6064 3.1%
6 B 3599 1.9%
7 C 87 0.0%
8 D 7243 3.7%
Total BB & Below 16993 8.7%
9 Unrated 5476 2.8%
Total 194287 100.0%
11
Amt ₹ in Crore
Advances Mix of Benchmark rate
12.3% 10.9% 11.0%
19.3%
10.7% 10.7%
0.4%
0.2% 0.20%
60.0%
50.4% 48.6%
6.0%
14.3% 14.9%
2.0%
13.6% 14.6%
June'20 Mar'21 June'21
Base Rate Fixed BPLR
MCLR RLLR FC & Others

Page I
Diversified Industry Portfolio & Key Sectors
Business Performance2
Sl. Diversified Industry Portfolio(Excl. TWO)
June’20 Mar’21 June’21
O/S O/S O/S% to Total
Industry Adv.1 Infrastructure 89659 103329 99782 45.8%
-Energy 43709 40296 40752 18.7%-Tele-Communication 17555 17774 17540 8.1%-Roads & Ports 23143 34863 35550 16.3%-Other Infra 5252 10396 5940 2.7%
2 Basic Metal & Metal Products 34146 23402 21057 9.7%-Iron & Steel 31539 20386 18059 8.3%
3 Textiles 13199 13592 12817 5.9%4 Food Processing 11895 18086 19166 8.8%5 Chemical & Chemical Products 8079 10806 9009 4.1%6 Other Industries 48336 53179 55840 25.7%
Total 205314 222394 217671 100.0%
12
Amt ₹ in Crore
Sl. Key Sectors June’20 Mar’21 June’21Growth%
YoY1 Capital Market 2194 987 803 -63.4%2 Commercial Real Estate 19748 19681 18338 -7.13%3 NBFC 81165 87538 83601 3.0%4 Aviation 4333 6353 6177 42.6%5 Tourism, Hotel & Restaurant 1501 1690 1671 11.3%

Page I
NBFC & Energy Sector
Business Performance213
Energy Sector
Amt ₹ in Crore
O/s (Funded) as on30-06-2021 : ₹ 83601 Cr
45968, 55.0%22040
26.4%
75489.0%
9911.2% 7054
8.4%
External Rating wise Portfolio
AAA AA A BBB BB & below
NBFC SectorO/s (Funded) as on
30-06-2021 : ₹ 40752 Cr
23568
(28.2%)
60033
(71.8%)
Pvt Sector
Public Sector
33370
(39.9%)
50231
(60.1%)
HFC Others
18933
(46.5%)
21818
(53.5%)
Pvt Sector
Public Sector
21427, 61.3%
1062630.4%
682, 2.0%
21916.3%
External Rating wise Std. Portfolio
A & Above BBB,BB & B C & D Unrated
External Rating Std. Portfolio30-06-2021 : ₹ 34926 Cr

Page I
One Time Restructuring of Advances
Business Performance214
As per RBI's guidelines dated Aug 6, 2020 Amt ₹ in Crore
Sl.Loan and aggregate exposure
category
Restructuring Implemented Provisions Made
No. of accounts Amount involved % of Provision Amt
1 Personal loans 5990 757 10% 76
2 Other Exposures 324 4931 10% 493
3 Total (1+2) 6314 5688 10% 569
4 MSME loans 13955 1099 5% 55
Grand Total (3+4) 20269 6787 - 624
As per RBI's guidelines dated May 5, 2021
Sl.Loan and aggregate exposure
category
Restructuring Implemented Provisions Made
No. of accounts Amount involved % of Provision Amt
1 Individual Borrowers 56523 3396 10% 340
2 Small Business 1530 320 10% 32
3 Total (1+2) 58053 3716 10% 372
4 MSME loans 83852 2886 10% 288
Grand Total (3+4) 141905 6602 10% 660
*Other Exposures includes corporate loans >Rs. 25 Crore as per RBI guidelines.
Page I
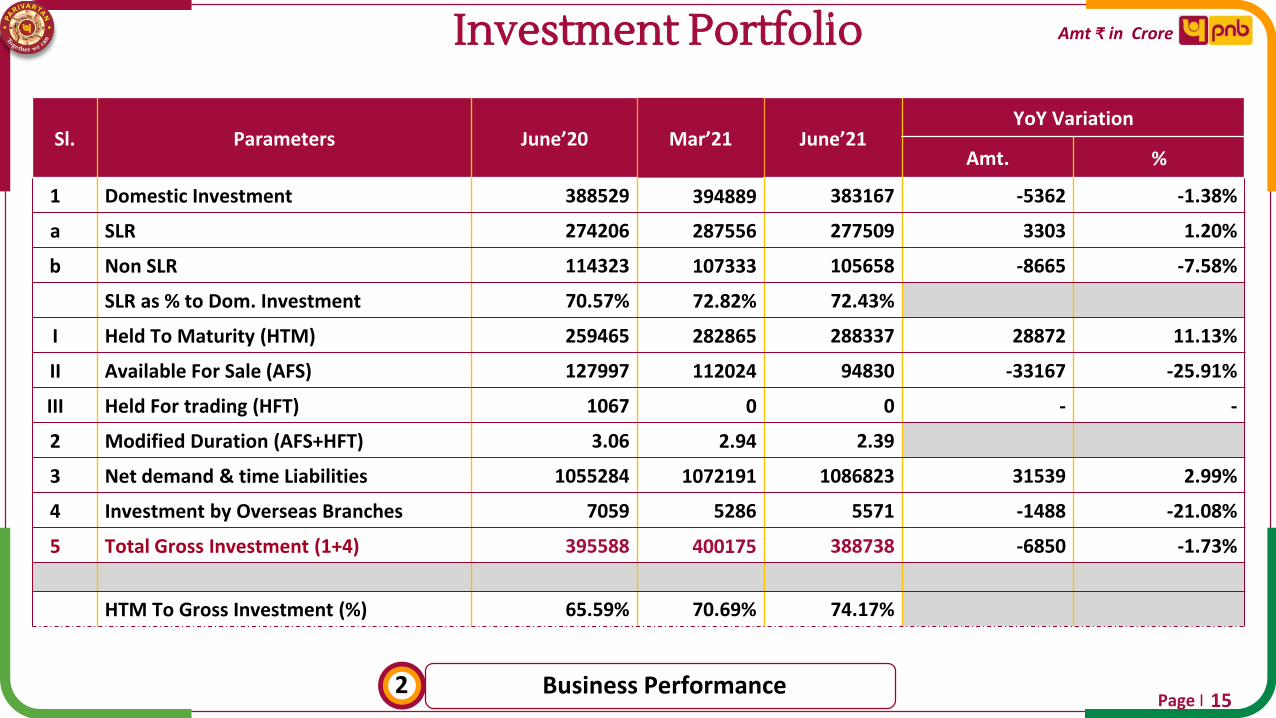
Investment Portfolio
Business Performance215
Sl. Parameters June’20 Mar’21 June’21YoY Variation
Amt. %
1 Domestic Investment 388529 394889 383167 -5362 -1.38%
a SLR 274206 287556 277509 3303 1.20%
b Non SLR 114323 107333 105658 -8665 -7.58%
SLR as % to Dom. Investment 70.57% 72.82% 72.43%
I Held To Maturity (HTM) 259465 282865 288337 28872 11.13%
II Available For Sale (AFS) 127997 112024 94830 -33167 -25.91%
III Held For trading (HFT) 1067 0 0 - -
2 Modified Duration (AFS+HFT) 3.06 2.94 2.39
3 Net demand & time Liabilities 1055284 1072191 1086823 31539 2.99%
4 Investment by Overseas Branches 7059 5286 5571 -1488 -21.08%
5 Total Gross Investment (1+4) 395588 400175 388738 -6850 -1.73%
HTM To Gross Investment (%) 65.59% 70.69% 74.17%
Amt ₹ in Crore

Page I
Non SLR Investment
Business Performance216
Sl. ParametersJune’20 Mar’21 June’21 Y-o-Y Variation
O/S % Share O/S % Share O/S % Share Amt Gr. %
1 PSU Bonds 20164 17.6% 21055 19.6% 20666 19.6% 502 2.49%
2Corporate and Other Bonds & Debentures
12331 10.8% 12407 11.5% 11908 11.3% -423 -3.43%
3 Special Govt. Sec excl. Recap Bonds 1394 1.2% 1253 1.2% 1253 1.2% -141 -10.11%
4 CG Recap. Bond 55274 48.4% 55274 51.5% 55274 52.3% 0 0.00%
5 Share of PSU/Corporate/Others 8935 7.8% 8718 8.1% 8459 8.0% -476 -5.33%
6 Venture Capital Fund 336 0.3% 337 0.3% 356 0.3% 20 5.95%
7 Regional Rural Bank 599 0.5% 814 0.8% 814 0.8% 215 35.89%
8 Security Receipts 2439 2.1% 2050 1.9% 2018 1.9% -421 -17.26%
9 Subsidiaries JV 3196 2.8% 3205 3.0% 3220 3.1% 24 0.75%
10 Other 9656 8.5% 2221 2.1% 1690 1.6% -7966 -82.50%
Total Non SLR Investment 114323 100% 107333 100.00% 105658 100.0% -8665 -7.58%
Amt ₹ in Crore

Page I
Income
Financial Performance3
Sl. Parameters Q1
FY21Q4
FY21Q1
FY22
YoY Variation
Amt. %
1 Interest Income (2+3+4) 20638 18790 18921 -1717 -8.3%
2 Interest on Advances 13919 11869 12322 -1597 -11.5%
3 Interest on Investments 6093 5987 5964 -129 -2.1%
4 Other Interest Income 626 934 635 9 1.5%
5 Other Income (6+7+8+9) 3655 3742 3594 -61 -1.7%
of which
6 Fee Based Income 1604 1551 1635 31 1.9%
7 Recovery in Written off Accounts 719 1150 833 114 15.9%
8 Trading Profit 1324 975 1118 -206 -15.6%
9 Others 8 67 8 - -
10 Total Income (1+5) 24293 22532 22515 -1778 -7.3%
17
Amt ₹ in Crore

Page I
Fee Based Income
Financial Performance3
Sl. Parameters Q1
FY21Q4
FY21Q1
FY22
YoY Variation
Amt. %
Fee Based Income 1604 1551 1635 31 1.9%
1 Processing Fees 520 213 573 53 10.2%
2 LC/BG Income 229 231 104 -125 -54.6%
3 Income from Insurance & MF 69 124 64 -5 -7.2%
4 Govt. Business 31 63 35 4 12.9%
5 Exchange Profit 103 153 131 28 27.2%
6 Miscellaneous Fee Income 652 767 728 76 11.7%
18
Amt ₹ in Crore

Page I
Expenses
Financial Performance3
Sl. Parameters Q1
FY21Q4
FY21Q1
FY22
YoY Variation
Amt. %
1 Total Interest Paid (2+3+4) 13856 11852 11694 -2162 -15.6%
2 Interest Paid on Deposits 13030 11102 10977 -2053 -15.8%
3 Interest Paid on Borrowings 296 163 127 -169 -57.0%
4 Others 530 587 591 61 11.5%
5 Operating Expenses (6+7) 5156 5045 4722 -434 -8.4%
6 Establishment Expenses 3307 2700 2956 -351 -10.6%
Of Which
Employee Benefits (AS-15) 750 16 545 -205 -27.3%
7 Other Operating Expenses 1849 2346 1766 -83 -4.5%
8 Total Expenses (1+5) 19013 16897 16416 -2597 -13.7%
19
Amt ₹ in Crore

Page I
Profit & Provisions
Financial Performance320
Amt ₹ in Crore
Sl. ParametersQ1
FY21Q4
FY21Q1
FY22
YoY Variation
Amt. %
1 Net Interest Income 6781 6938 7227 446 6.6%
2 Other Income 3655 3742 3594 -61 -1.7%
3 Operating Income (1+2) 10436 10680 10821 385 3.7%
4 Operating Expenses 5156 5045 4722 -434 -8.4%
5 Operating Profit 5280 5634 6099 819 15.5%
6 Provisions other than Tax 4686 4686 4679 -7 -0.1%
Of which
a NPAs 4836 5294 3248 -1588 -32.8%
b Standard Advances incl. Standard Restructured 520 -1526 1193 673 129.4%
c Depreciation on Investment -745 478 229 974 -
d Others 74 440 9 -65 -87.8%
7 Profit Before Tax 594 948 1420 826 139.1%
8 Provision for Income Tax 286 362 397 111 38.8%
9 Net Profit 308 586 1023 715 232.1%
Annualized %
Page I
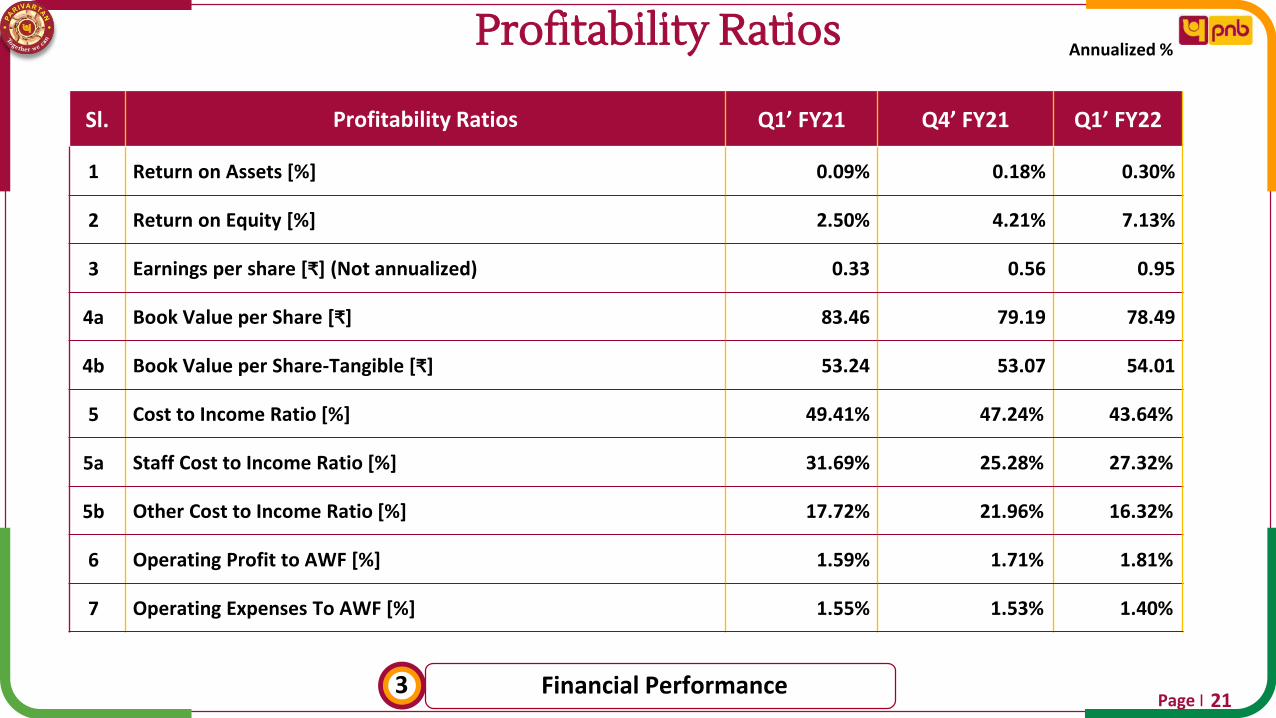
Profitability Ratios
Financial Performance3
Sl. Profitability Ratios Q1’ FY21 Q4’ FY21 Q1’ FY22
1 Return on Assets [%] 0.09% 0.18% 0.30%
2 Return on Equity [%] 2.50% 4.21% 7.13%
3 Earnings per share [₹] (Not annualized) 0.33 0.56 0.95
4a Book Value per Share [₹] 83.46 79.19 78.49
4b Book Value per Share-Tangible [₹] 53.24 53.07 54.01
5 Cost to Income Ratio [%] 49.41% 47.24% 43.64%
5a Staff Cost to Income Ratio [%] 31.69% 25.28% 27.32%
5b Other Cost to Income Ratio [%] 17.72% 21.96% 16.32%
6 Operating Profit to AWF [%] 1.59% 1.71% 1.81%
7 Operating Expenses To AWF [%] 1.55% 1.53% 1.40%
21

Page I
Efficiency Ratios (Quarter)
Financial Performance322
Cost of Deposits [%] Cost of Funds [%] NIM [%]
4.92%
4.22% 4.07%
5.01%
4.31% 4.14%
June'20(Q1)
Mar'21(Q4)
Jun'21(Q1)
Global Domestic
4.18%
3.59% 3.47%
4.29%
3.70% 3.56%
June'20(Q1)
Mar'21(Q4)
Jun'21(Q1)
Global Domestic
2.50%2.68% 2.73%
2.59%2.83% 2.80%
June'20(Q1)
Mar'21(Q4)
Jun'21(Q1)
Global Domestic
7.64%
6.79% 6.91%
7.81%
6.97% 7.07%
June'20(Q1)
Mar'21(Q4)
Jun'21(Q1)
Global Domestic
6.21%5.69% 5.61%
6.38%5.90% 5.75%
June'20(Q1)
Mar'21(Q4)
Jun'21(Q1)
Global Domestic
6.50% 6.45% 6.28%6.59% 6.49% 6.34%
June'20(Q1)
Mar'21(Q4)
Jun'21(Q1)
Global Domestic
Yield on Advances [%] Yield on Funds [%] Yield on Investment [%]
(Annualised)

Page I
Productivity Ratios
Financial Performance323
in ₹ Lakhs
17631885 1854
Jun’20 Mar’21 Jun'21
Business per Employee
15468
16844 16888
Jun’20 Mar’21 Jun'21
Business per Branch
22.1423.88 25.23
Jun’20 Mar’21 Jun'21
Operating Profit per Employee
193
213230
Jun’20 Mar’21 Jun'21
Operating Profit per Branch
(*Cumulative Annualised)
* *

Page I
Balance Sheet
Financial Performance3
Sl. Parameters 30th June’20 31th March’21 30th June’21
CAPITAL & LIABILITIES
1 Capital 1882 2096 2202
2 Reserves and Surplus 84407 88842 92173
3 Deposits 1074917 1106332 1097649
4 Borrowings 44471 42840 35647
5 Other Liabilities and Provisions 26723 20523 20861
Total Liabilities 1232401 1260633 1248532
ASSETS
1 Cash and Balances with RBI 36174 43959 47030
2 Balances with Banks 71722 67391 74629
3 Investments 389754 392983 381862
4 Loans & Advances 656197 674230 661289
5 Fixed Assets 10987 11021 10887
6 Other Assets 67567 71049 72835
Total Assets 1232401 1260633 1248532
24
Amt ₹ in Crore

Page I
Asset Quality Ratios
Asset Quality425
14.11% 14.12% 14.33%
5.39% 5.73% 5.84%
June'20 Mar’21 June'21
NPA Ratios
Gross NPA% Net NPA%
80.75% 80.14% 80.26%
65.34%63.06% 62.93%
June'20 Mar’21 June'21
Provision Coverage Ratio
PCR%- (Incl. TWO) PCR%- (excl TWO)
2.54%
2.24%1.76%
June'20 Mar’21 June'21
Credit Cost
Credit Cost
1069
5967
3954603
10324316
Jun'20 Mar'21 Jun'21
Total Recovery incl Upgradation(Qtr)
Cash Recovery Up Gradation
1672
69998270
Amt ₹ in Crore
(FY)

Page I
Movement of NPA
Asset Quality4
Sl. Parameters Q1 FY’21 Q4 FY’21 FY 21 Q1 FY’22
1 NPA as at the beginning of Year/Quarter 105165 94479 105165 104423
2 Cash Recovery 1069 5967 11442 3954
3 Up-gradation 603 1032 2363 4316
Cash Recovery & Up-gradation 1672 6999 13805 8270
4a) Consequential Write Off
41202156 3675 676
b) Technical Write Off 5072 12202 1571
5 Total Reduction (2+3+4) 5792 14228 29682 10516
6 Fresh Addition 2476 24172 28940 10168
-Fresh slippages 1917 23185 25001 8241
-Debits in existing NPA A/cs 558 987 3939 1927
7 Gross NPAs at end of the period 101849 104423 104423 104076
8 Eligible Deductions incl. Provisions 66546 65848 65848 65495
9 Net NPAs 35303 38576 38576 38581
10 Recovery in written-off A/cs 719 1150 2498 833
26
Amt ₹ in Crore

Page I
Asset Classification: Global Advances
Asset Quality 4
Sl. Parameters
June’20 Mar’21 June’21 YoY Variation
O/S Share% O/S Share% O/S Share% Amt. Var. %
1 Standard 619846 85.89% 634984 85.88% 621960 85.67% 2114 0.34%
2 Gross NPA 101849 14.11% 104423 14.12% 104076 14.33% 2227 2.19%
2a Sub-Standard 15366 2.13% 22980 3.11% 24792 3.41% 9426 61.34%
2b Doubtful 70619 9.79% 60328 8.16% 57985 7.99% -12634 -17.89%
2c Loss 15864 2.20% 21116 2.86% 21299 2.93% 5435 34.26%
Total Advances(1+2) 721695 100% 739407 100% 726036 100.0% 4341 0.60%
27
Amt ₹ in Crore

Page I
NPA Classification: Sector Wise
Asset Quality428
Amt ₹ in Crore
Sl. ParametersJune’20 Mar’21 June’21
GNPA GNPA% GNPA GNPA% GNPA GNPA%
1 Retail Loans 4458 3.43% 7167 5.26% 7833 5.92%
Out of Which,
1a Housing 2354 2.88% 3767 4.41% 4391 5.24%
1b Car/Vehicle 472 5.49% 575 5.58% 601 5.99%
1c Personal Loan 142 1.83% 260 2.49% 284 2.76%
2 Agriculture (PS+NPS) 19132 15.20% 22201 19.62% 23384 18.21%
3 MSME 17389 14.80% 26859 21.32% 28145 23.23%
4 Corporate & Others 58328 17.80% 46184 13.42% 42730 13.09%
5 Domestic NPA (1+2+3+4) 99307 14.10% 102411 14.24% 102092 14.42%
6 Overseas NPA 2542 13.00% 2013 9.96% 1984 11.05%
7 Global NPA (5+6) 101849 14.11% 104423 14.12% 104076 14.33%
Page I
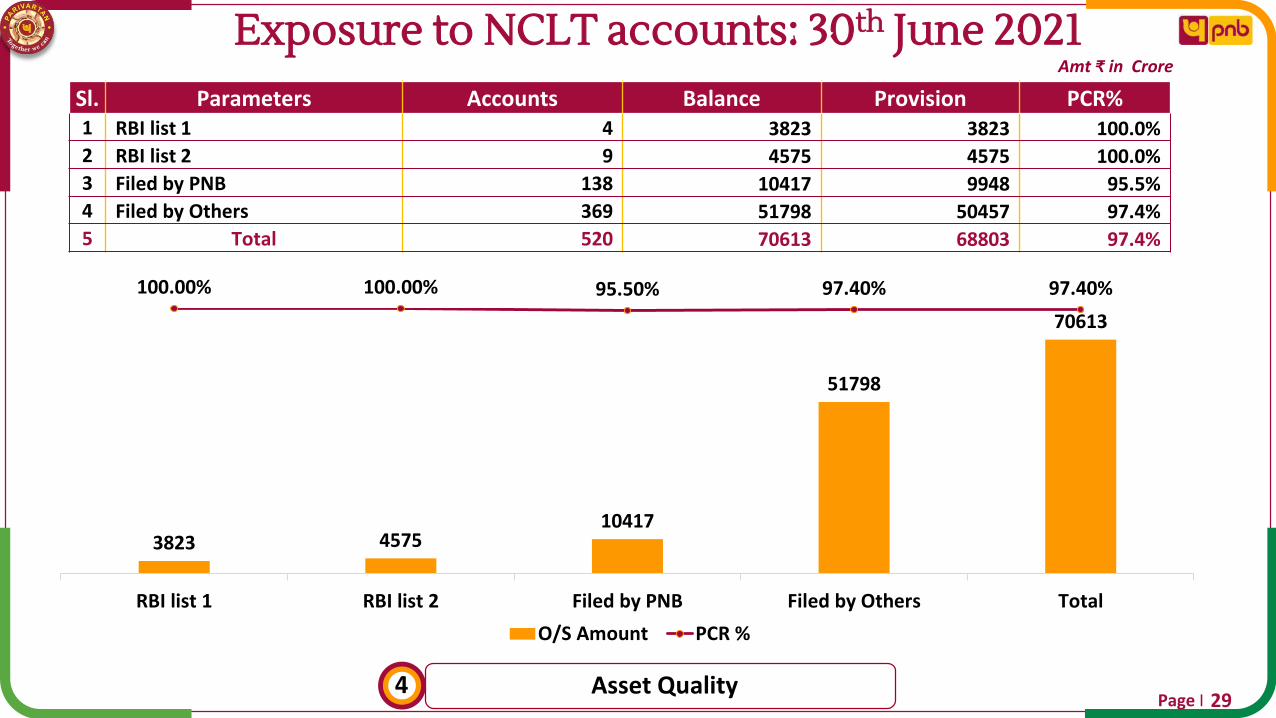
Exposure to NCLT accounts: 30th June 2021
Asset Quality4
Sl. Parameters Accounts Balance Provision PCR%1 RBI list 1 4 3823 3823 100.0%
2 RBI list 2 9 4575 4575 100.0%
3 Filed by PNB 138 10417 9948 95.5%
4 Filed by Others 369 51798 50457 97.4%
5 Total 520 70613 68803 97.4%
29
Amt ₹ in Crore
3823 457510417
51798
70613
100.00% 100.00% 95.50% 97.40% 97.40%
-500.0 0%
-400.0 0%
-300.0 0%
-200.0 0%
-100.0 0%
0.0 0%
100 .00%
0
100 00
200 00
300 00
400 00
500 00
600 00
700 00
800 00
RBI list 1 RBI list 2 Filed by PNB Filed by Others Total
O/S Amount PCR %

Page I
Standard Restructured Advances
Asset Quality4
Sl Movement of Std. Restructured AdvancesJune’20
(Qtr)Mar’21
(FY)June’21
(Qtr)
A Opening Balance 2236 2236 2372
B Total Addition 70 794 33
1 Fresh Restructuring 53 773 33
2 Up-gradation 17 21 0
C Reduction 8 658 49
1 In eligible 5 16 36
2 Down-gradation to NPA 1 19 9
3 Exit/Failure 2 623 4
Closing Balance (A+B-C) 2298 2372 2356
30
Sl. Sector wise Std. Restructured June’ 21
A Agriculture & Allied 1388
B MSME 160
C Corporate & Others 808
Total 2356
Amt ₹ in Crore

Page I
Position of SMA Accounts( > Rs. 5 Crore)
Asset Quality431
Amt ₹ in Crore
As on Gross Global Advances SMA 2SMA 2 as a % of Gross Global
Advances
Mar’21 739407 13708 1.85%
June’21 726036 12524 1.72%
Sector Wise Position – as on 30.06.2021
CATEGORY Domestic Advances SMA 2 SMA 2 as a % of Advances
Agriculture 128386 868 0.68%
MSME 121134 2679 2.21%
Retail 132096 348 0.26%
Corporate & Others 326466 8629 2.64%
Total Domestic Advances 708082 12524 1.77%

Page I
Asset Quality Control – Multi Prong Approach
Asset Quality432
Verticalized Credit Delivery Model
• Large Corporate
Branches (Loans
above Rs. 50 Crore)
• Mid Corporate
Centres (Loans upto
Rs. 50 Crore)
• PNB Loan Points
(RAM Loans upto Rs.
1 Crore)
PNB Lens – The Lending Solution
• Technology Driven
Credit Underwriting
Model
• Uniformity in Process
Across the Bank
• Rolled out for Retail,
Agri and MSME
(Upto Rs. 25 Crore)
Continuous Follow Up for Collections
• Dedicated Credit
Monitoring Vertical
• Use of SMSes and
Out-Bound Call
Centres to Follow up
with Customers
• Mobile app for field
Functionaries to
Monitor SMAs
Strong Recovery Measures
• Sustained Recovery
Efforts
• Special OTS Scheme
• Online Portal for
monitoring of NPA
Accounts
• Mega e- Auctions

Page I
Share holding Pattern – 30th June 2021
Share Holding & Capital533
Amt ₹ in Crore
73.1%
8.9%
2.4%
11.2%
2.5%1.9%
Govt. of India
FIs/Banks/Insurance
Mutual Funds
Resident Individual
FIIs
Others
Raised Rs 1800 Crore under Tier I Equity through Qualified Institutional Placement during Q1 FY’22

Page I
Capital Adequacy
Share Holding & Capital5
Sl. Parameters June’20 Mar’21 June’21
1 Tier I 63745 69713 73330
Common Equity 58697 64351 67955
Additional Tier I 5048 5362 5376
2 Tier II 14781 17145 15970
3 Total (Tier I+II) 78526 86858 89300
4 Risk-weighted Assets 621981 606585 587813
1 Tier I % 10.25% 11.50% 12.47%
Common Equity % 9.44% 10.62% 11.56%
Additional Tier I % 0.81% 0.88% 0.91%
2 Tier II % 2.38% 2.82% 2.72%
3 Total (Tier I+II) % 12.63% 14.32% 15.19%
34
Amt ₹ in Crore
9.44%10.62%
11.56%
0.81%
0.88%
0.91%2.38%
2.82%
2.72%
June'20 Mar'21 June'21
CRAR%
CET AT I Tier II
12.63%
14.32%
15.19%

Page I
Capital Optimization
Share Holding & Capital5
Sl. Parameters June’20 Mar’21 June’21 YoY Variation1 Credit RWA 497376 490310 474391 -4.62%
Of which Credit RWA (Domestic FB) 374105 366545 354699 -5.19%
2 Market RWAs 59052 50722 43795 -25.84%3 Operational RWAs 65553 65553 69628 6.22%4 Total RWAs 621981 606585 587813 -5.49%
5 Global Credit Exposure 842843 905762 889481 5.53%6 Credit Exposure (Domestic FB) 769441 807704 797766 3.68%7 RWA/Advances 74% 67% 66%8 Credit RWA Density (Domestic FB) 49% 46% 44%
9 Total NFB O/S 73401 66631 64730 -11.81%10 NFB RWA 31896 28315 26875 -15.74%
11 Leverage Ratio 4.12 4.37 4.64
35
Amt ₹ in Crore
Sl. Concentration Risk June’20 Mar’21 June’21
1 Exposure to Top 20 Borrowers as % of Total Exposure 17.16% 15.23% 15.31%
2 Exposure to Top 10 Groups as % of Total Exposure 12.96% 12.93% 11.72%
Page I
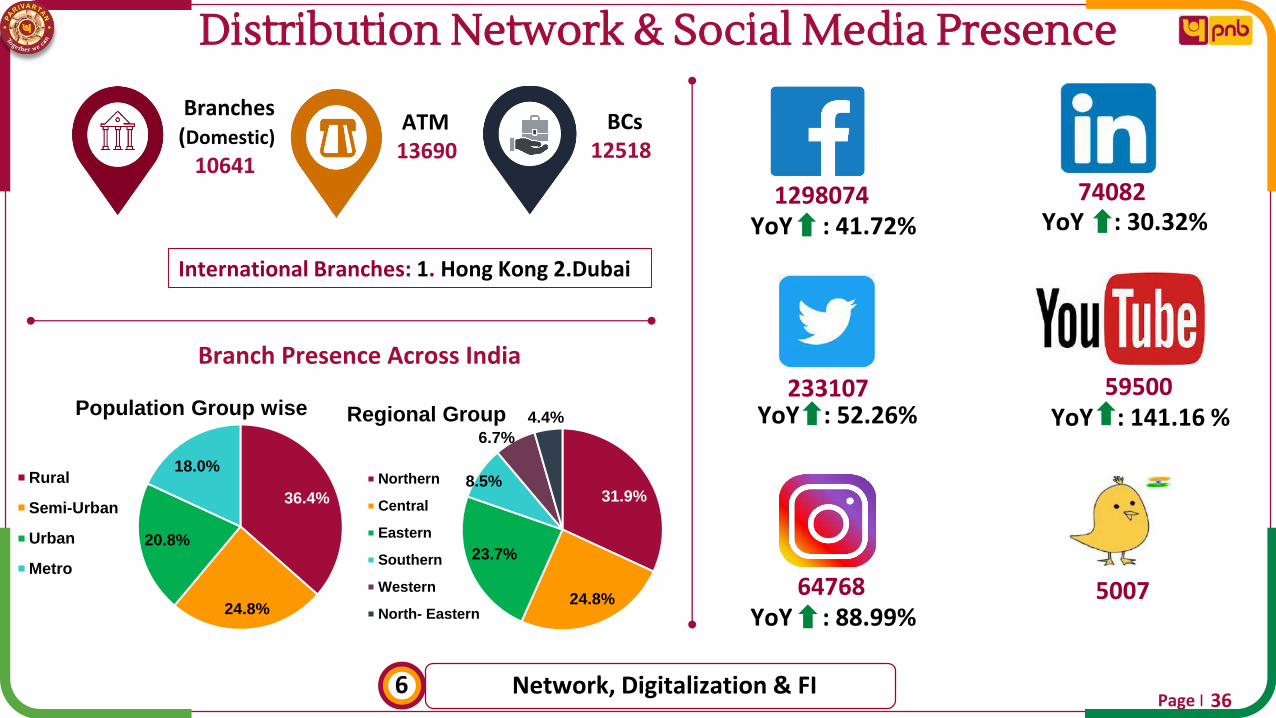
Distribution Network & Social Media Presence
Network, Digitalization & FI636
ATM13690
Branches (Domestic)
10641
BCs12518
International Branches: 1. Hong Kong 2.Dubai
Branch Presence Across India
31.9%
24.8%
23.7%
8.5%
6.7%
4.4%Regional Group
Northern
Central
Eastern
Southern
Western
North- Eastern
36.4%
24.8%
20.8%
18.0%
Population Group wise
Rural
Semi-Urban
Urban
Metro
YoY : 41.72%
74082 YoY : 30.32%
233107 YoY : 52.26% YoY : 141.16 %
5007 YoY : 88.99%
64768
59500
1298074

Page I
Digital Transactions
Network, Digitalization & FI637
19.16
36.45
Q1 FY21 Q1 FY22
90% YOY Increase in UPI Transactions
No. of UPI Txns (Crore)
40%
11%
49%
60%11%
29%
71% ADC Transactions out of Total Transactions
Digital Transactions ATM + BNA
Branches + BC
June’20
June’21
31%
1%1%
2%
65%
75%
1%
2%
4%
18%
Share of Digital Transactions
UPI IMPS IB+MB NEFT Others
June’20
June’21

Page I
Augmenting Digital Base
Network, Digitalization & FI638
233
262
Jun'20 Jun'21
Nu
mb
ers
(in
Lac
s)
12.4% YoY Growth in Internet Banking Users
No. of IBS users (Retail)
169
251
Jun'20 Jun'21
Nu
mb
ers
(in
lacs
)
49% YoY Growth in PNB One (M-Bank) Users
No. of MBS users
1.34
4.00
Jun'20 Jun'21
Nu
mb
ers
(in
Lac
s)
198% YoY Growth in Bharat QR Users
Bharat QR Code
421
447
Jun'20 Jun'21
Nu
mb
ers
(in
lacs
)
6.2% YoY Growth in Debit Card
Debit Card

Page I
Credit Card Business
Network, Digitalization & FI639
PNB Signature PNB Millennial Corporate Credit Card
9% Y-o-Y increase in Credit Card Issuance
27% Y-o-Y increase in No. of Transactions through Credit
Cards
65% Y-o-Y increase in Volume of Transactions through
Credit Cards
Launch of New Credit Cards

Page I
Recent Digital Initiatives
640
Network, Digitalization & FI
Internet Banking Change Home Branch.
Change account variant (for current account customers)
View Senior Citizen Scheme (SCSS)
Password resetting for NRI customers without debit
card
Mobile Banking
Insta-Demat Account opening.
Link of opening online account through video KYC
Others
Bharat bill pay system (BBPS Post log-in) & Positive Pay
System in both IBS and MBS.
Page I6
41Network, Digitalization & FI
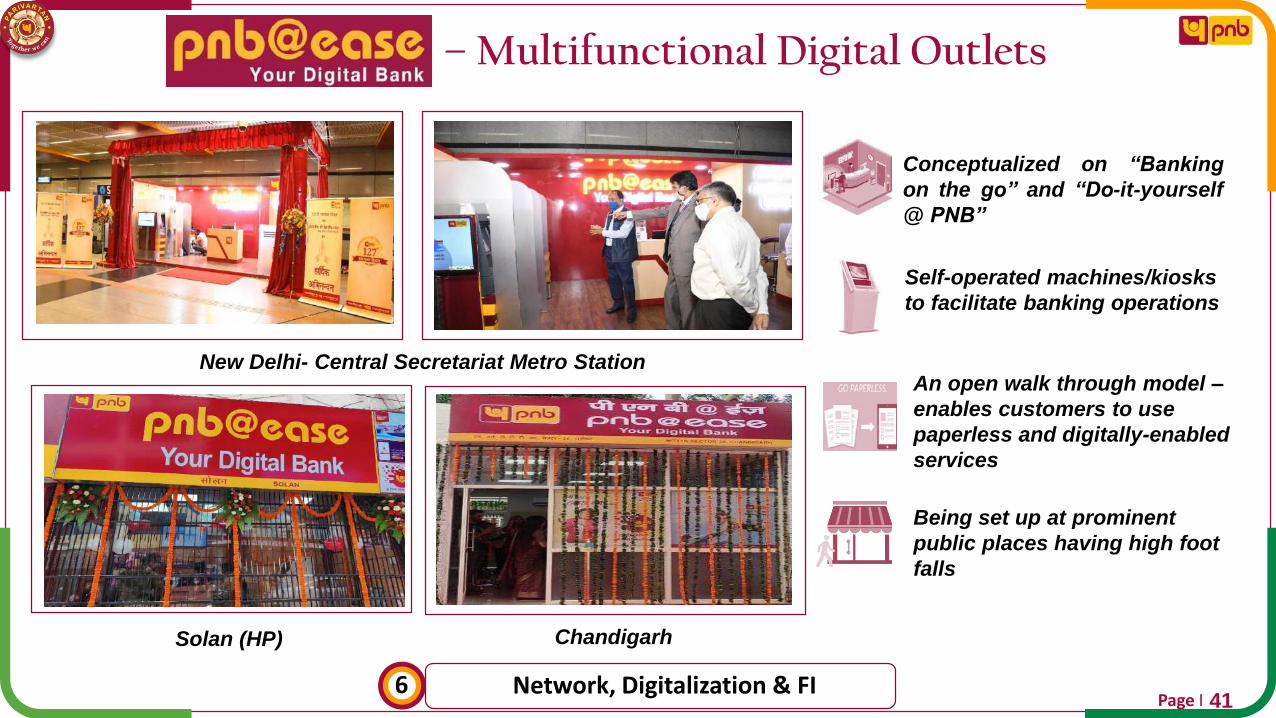
– Multifunctional Digital Outlets
Conceptualized on “Banking
on the go” and “Do-it-yourself
@ PNB”
Self-operated machines/kiosks
to facilitate banking operations
An open walk through model –
enables customers to use
paperless and digitally-enabled
services
Being set up at prominent
public places having high foot
falls
New Delhi- Central Secretariat Metro Station
Solan (HP) Chandigarh

Page INetwork, Digitalization & FI6
42
IBBIC shall design, build, implement and commercialize Distributed Ledger Technology (DLT) solutions for the financial services sector with initial focus on Trade Finance
IBBIC is a joint initiative of 18 Scheduled Commercial Banks of India & PNB has subscribed equity share constituting 5.55% of the issued and paid-up capital of IBBIC.
Indian Banks' Blockchain Infrastructure Company (IBBIC)
Fintech Initiatives

Page I
Financial Inclusion : Profitable Business Proposition
Network, Digitalization & FI6
Sl. Jansuraksha Schemes Enrollment Up To June’21
1 Pradhan Mantri Jeevan Jyoti Bima Yojana 22.02 Pradhan Mantri Suraksha Bima Yojana 108.13 Atal Pension Yojana 14.8
Nos. in Lakh
43
385 395
As on June'20 As on June'21
PMJDY Accounts
11291
13487
As on June'20 As on June'21
Deposit Mobilized by BCs
386
536
Q1 FY21 Q1 FY22
Txns done by BCs
4070 3938
As on June'20 As on June'21
PMJDY Avg. BalanceAmt in ₹ Amt ₹ in Crore

Page I
Performance of Subsidiaries, Joint Venture and Associates
44Group Business & RRBs7
Type Name of the entityCountry of
Incorporation
Proportion of
Ownership%
Results
(3/6/9/12 M) Total
Income
Total
Expenses
Gross
ProfitNet Profit
Associates PNB Housing Finance Ltd India 32.59% Mar’21 (12M) 7624 6417 1207 930
Subsidiaries PNB Investment Services Ltd. India 100.00% Mar’21 (12M) 8 6 2 1
Subsidiaries PNB Gilts Ltd. India 74.07% Mar’21 (12M) 1052 438 614 454
Associates PNB MetLife India Insurance Co. Ltd India 30.00% Mar’21 (12M) 9558 9445 113 101
Associates Canara HSBC OBC Life Insurance Co. Ltd India 23.00% June’21 (3M) 1423 1502 -79 -79
SubsidiariesPNB (International) Ltd.(FY : 1st April to 31st March)
UK 100.00% Mar’21 (12M) 177 150 27 -75
Associates India SME Asset Reconstruction Co. Ltd India 20.90% Mar’21 (12M) 11 10 1 0
SubsidiariesDruk PNB Bank Ltd.(FY : 1st January to 31st December)
Bhutan 51.00% Dec’20 (12M) 123 95 28 6
Joint Venture
Everest Bank Ltd.(FY : 16th July to 15th July)
Nepal 20.03% April’21 (9M) 605 471 134 94
(Amount in INR Crore)

Page I
Performance of RRBs
Group Business & RRBs7
Consolidated Position FY 2020 FY 2021
Total Income 10118 11267
Total Expenses 10473 10551
Operating profit 1648 2870
Net Profit -472 481
Capital adequacy ratio 9.41% 9.95%
Business 161918 175191
Loans and advances 57445 62750
Deposits 104472 112440
RRBs: 1.DBGB: Dakshin Bihar Gramin Bank, Patna2.SHGB: Sarva Haryana Gramin Bank, Rohtak3.HPGB: Himachal Pradesh Gramin Bank, Mandi4.PGB: Punjab Gramin Bank, Kapurthala
5. PUPGB: Prathama Uttar Pradesh Gramin Bank, Moradabad6. TGB- Tripura Gramin Bank7. MRB- Manipur Rural Bank8. AGVB- Assam Gramin Vikash Bank9. BGVB- Bangiya Gramin Vikash Bank
45
Amt ₹ in Crore

Page I
Awards for Excellence
Awards & Way Forward846
Finnoviti Awards 2021-
PNB Verify product won the award
“Indian Society for Training & Development Award for Innovative
Training Practices- “2nd Position under
Services (BSFI & IT/ITES Category)
IBA Banking Technology Awards 2021 -Joint Runner up - Cyber Security
Initiatives
Finacle Client Innovation Award by Infosys– Runner Up for PNB’s path breaking “Process Innovations”
Assocham
Runner Up under Digital service under PSB Merged Category
Special Commemorative Award 2021 by NABARD
Best PSU in the fields of Agriculture Credit, Micro Finance, Financial Inclusion and Technology Adoption.
Page I
Way Forward
Awards & Way Forward847
Analytics Driven Approach for Deepening of Customer
Relationship and Pricing
Implementing strong Recovery Measures to improve Asset Quality
Leveraging Digital Credit Underwriting Capabilities for
uniform credit processing standards across the Bank
Sustained profitability and robust capital position
Focus on Cost Optimization
through realization of
synergies in various segments
Differentiated Customer
Experience through
pnb@ease Outlets

Page I
Disclaimer
48
This presentation has been prepared by Punjab National Bank (the “Bank”), solely for general information
purposes, without regard to any specific objectives, financial situations or informational needs of any
particular person.
Except for the historical information contained herein, statements in this presentation which contain words or
phrases such as “is”, “aims”, “will”, “would”, “indicating”, “expected to”, “guidance“, “way forward”, “expected”,
“estimate”, “objective”, “goal”, “strategy”, “philosophy”, “project” etc. and similar expressions or variations of
such expressions may constitute ‘forward-looking statements’. These forward-looking statements involve a
number of risks, uncertainties and other factors that could cause actual results to differ materially from those
suggested by the forward-looking statements. These risks and uncertainties include, dynamic and complex
internal and external environment having bearing on bank’s ability to successfully implement our
strategy, future levels of non-performing loans, our growth and expansion in business, the impact of any
acquisitions, the adequacy of our allowance for credit losses, our provisioning policies, technological
implementation and changes, the actual growth in demand for banking products and services, investment
income, cash flow projections, our exposure to market risks as well as other risks. Punjab National Bank
undertakes no obligation to update the forward-looking statements to reflect events or circumstances after the
date thereof.
Note: All financial numbers in the presentation are from Audited Financials or Limited Reviewed financials or
based on Management estimates.

Page I
Thank You!
49