IBM Tivoli Netcool Service Quality Management Center V4.2 ...
Upload
khangminh22Category
view
1download
0
IBM Netcool Operations InsightVersion 1 Release 4.1
Integration Guide
SC27-8601-08
IBM

NoteBefore using this information and the product it supports, read the information in “Notices” on page 403.
This edition applies to version 1.4.1.2 of IBM Netcool Operations Insight (product number 5725-Q09) and to allsubsequent releases and modifications until otherwise indicated in new editions.
© Copyright IBM Corporation 2014, 2018.US Government Users Restricted Rights – Use, duplication or disclosure restricted by GSA ADP Schedule Contractwith IBM Corp.

Contents
About this publication . . . . . . . . viiAccessing terminology online . . . . . . . . viiTivoli technical training . . . . . . . . . . viiTypeface conventions . . . . . . . . . . . vii
Solution overview . . . . . . . . . . 1What's new . . . . . . . . . . . . . . . 1Supported products and components . . . . . . 6About Netcool Operations Insight . . . . . . . 10
About Operations Management. . . . . . . 11About Network Management . . . . . . . 15About Performance Management . . . . . . 20About Service Management . . . . . . . . 21
Deployment of Netcool Operations Insight . . . . 22Deployment examples . . . . . . . . . . 22Deployment scenarios . . . . . . . . . . 24
Which documentation do I need? . . . . . . . 31
Installing Netcool Operations Insight 35Quick reference to installing . . . . . . . . . 35Planning for installation . . . . . . . . . . 41
Planning for an on-premises installation . . . . 41Downloading Netcool Operations Insightcomponents . . . . . . . . . . . . . . 48Installing Operations Management . . . . . . 48
Installing on premises . . . . . . . . . . 48Installing Network Management . . . . . . . 57
Installing the Probe for SNMP and Syslog Probe 58Optional: Preparing the ObjectServer forintegration with Network Manager . . . . . 59Preparing the database for Network Manager . . 60Installing Network Manager IP Edition andNetcool Configuration Manager . . . . . . 61Configuring integration with NetcoolConfiguration Manager . . . . . . . . . 66Installing the Network Manager Insight Pack . . 90
Installing Performance Management . . . . . . 93Installing Network Performance Insight . . . . 93Enabling the integration with NetworkPerformance Insight . . . . . . . . . . 94Configuring Network Performance Insight . . . 95
Installing the Device Dashboard . . . . . . . 95About the Device Dashboard . . . . . . . 95Installing the Device Dashboard . . . . . . 96Configuring the Device Dashboard . . . . . 97
Installing Agile Service Manager . . . . . . . 98Configuring Single Sign-On . . . . . . . . . 99
Upgrading to the latest NetcoolOperations Insight . . . . . . . . . 101Upgrading to Netcool Operations Insight V1.4.1.2 101Upgrading to Netcool Operations Insight V1.4.1.1 103Upgrading to Netcool Operations Insight V1.4.1 104
Downloading product and components. . . . 104Upgrading Operations Analytics - Log Analysis 106
Upgrading Network Performance Insight . . . 107Upgrading the Device Dashboard . . . . . 107Installing Agile Service Manager . . . . . . 109Applying the latest fix packs . . . . . . . 109Upgrading the Insight Pack. . . . . . . . 110
Event search. . . . . . . . . . . . 113Netcool/OMNIbus Insight Pack . . . . . . . 114Configuring event search . . . . . . . . . 121Configuring single sign-on for the event searchcapability. . . . . . . . . . . . . . . 125Customizing event management tools . . . . . 126Adding custom apps to the Table View toolbar . . 129Using Event Search . . . . . . . . . . . 130
Event search workflow for operators . . . . 134Troubleshooting event search . . . . . . . . 135
Event Analytics . . . . . . . . . . 139Event Analytics overview . . . . . . . . . 139Installing and uninstalling Event Analytics . . . 140
Prerequisites. . . . . . . . . . . . . 140Installing Event Analytics . . . . . . . . 141Uninstalling Event Analytics . . . . . . . 159
Event Analytics Configuration. . . . . . . . 160Configuring the historical event database . . . 161Specifying the primary and backup ObjectServer 162Adding report fields . . . . . . . . . . 162Configuring event suppression . . . . . . 163Configuring event pattern processing . . . . 164Reviewing the configuration . . . . . . . 165Exporting the Event Analytics configuration . . 165Generated properties file . . . . . . . . 166
Configure Analytics portlet . . . . . . . . . 170Setting the Impact data provider and otherportlet preferences. . . . . . . . . . . 171Viewing current analytics configurations . . . 172Creating a new or modifying an existinganalytics configuration . . . . . . . . . 174Manually running an unscheduled analyticsconfiguration . . . . . . . . . . . . 176Stopping an analytics configuration . . . . . 177Deleting an analytics configuration . . . . . 177Changing the expiry time for related eventsgroups . . . . . . . . . . . . . . 178Changing the choice of fields for the EventIdentity . . . . . . . . . . . . . . 179
View Seasonal Events portlet . . . . . . . . 180Viewing a list of seasonal event configurationsand events . . . . . . . . . . . . . 181Reviewing a seasonal event. . . . . . . . 181Sorting columns in the View Seasonal Eventsportlet . . . . . . . . . . . . . . . 182Exporting all seasonal events for a specificconfiguration to Microsoft Excel . . . . . . 183
© Copyright IBM Corp. 2014, 2018 iii

Exporting selected seasonal events for a specificconfiguration to Microsoft Excel . . . . . . 184
Seasonal Event Rules . . . . . . . . . . . 184Creating a seasonal event rule . . . . . . . 185Seasonal event rule states . . . . . . . . 189Modifying the default seasonal event ruleexpiry time . . . . . . . . . . . . . 189Viewing performance statistics for seasonalevent rules . . . . . . . . . . . . . 190Modifying an existing seasonal event rule . . . 191Viewing seasonal event rules grouped by state 192Modifying a seasonal event rule state . . . . 192Applying rule actions to a list of events . . . 193Setting the column value for an event . . . . 194Updating the NOI_DefaultValues properties fileto suppress and unsuppress events . . . . . 195
Seasonal Event Graphs . . . . . . . . . . 196Viewing seasonal event graphs for a seasonalevent . . . . . . . . . . . . . . . 197Viewing historical events from seasonalitygraphs. . . . . . . . . . . . . . . 198Exporting seasonal event graphs for a specifiedseasonal event to Microsoft Excel . . . . . . 198Editing confidence thresholds of Seasonal EventGraphs . . . . . . . . . . . . . . 199
Historical events . . . . . . . . . . . . 201Viewing historical events for a seasonal event 202Exporting historical event data . . . . . . 202Exporting historical event data for a specifiedseasonal event to Microsoft Excel . . . . . . 203
Related events . . . . . . . . . . . . . 204Work with related events . . . . . . . . 205Extra details about related events. . . . . . 214Correlation rules and related events . . . . . 218
Creating patterns . . . . . . . . . . . . 223Starting the Events Pattern portlet . . . . . 224Creating an event pattern . . . . . . . . 225Applying a regular expression to the patterncriteria . . . . . . . . . . . . . . 228Editing a pattern criteria regular expression . . 229Viewing related event details in the EventsPattern portlet . . . . . . . . . . . . 229Suggested patterns . . . . . . . . . . 230Editing an existing pattern . . . . . . . . 230Deleting an existing pattern . . . . . . . 231Exporting pattern generalization test results toMicrosoft Excel . . . . . . . . . . . . 231Configuring the type properties used for eventpattern creation in Netcool/Impact . . . . . 232
Reference. . . . . . . . . . . . . . . 238Netcool/Impact installation components . . . 238Configuring the Event Analytics ObjectServer 238Configuring Oracle database connection withinNetcool/Impact . . . . . . . . . . . 239Configuring DB2 database connection withinNetcool/Impact . . . . . . . . . . . 241Configuring MS SQL database connectionwithin Netcool/Impact . . . . . . . . . 243Netcool/Impact remote connection . . . . . 245Adding a cluster to the Netcool/Impactenvironment. . . . . . . . . . . . . 245
Extra failover capabilities . . . . . . . . 246Viewing historical events in the Event Viewer 247Understanding the timeline chart . . . . . . 247
Troubleshooting Event Analytics . . . . . . . 248Event relationships display in the Event Viewer,only if the parent and child events match thefilter . . . . . . . . . . . . . . . 259
IBM Networks for Operations Insight 263About Networks for Operations Insight . . . . 263
About Networks for Operations Insightdashboards . . . . . . . . . . . . . 263Scenario: Monitoring bandwidth usage . . . . 264
About the Network Health Dashboard . . . . . 265Monitoring the network using the NetworkHealth Dashboard . . . . . . . . . . . 265Administering the Network Health Dashboard 276Developing custom dashboards . . . . . . 282
Device Dashboard . . . . . . . . . . . . 290Troubleshooting network issues using theDevice Dashboard . . . . . . . . . . . 290Configuring the Performance Insights widget 297Configuring thresholds . . . . . . . . . 298Administering the Device Dashboard . . . . 301
Traffic Details dashboard . . . . . . . . . 302Traffic Details dashboard views . . . . . . 302Displaying NetFlow performance data fromNetwork Health Dashboard . . . . . . . 303Displaying NetFlow performance data fromEvent Viewer . . . . . . . . . . . . 307Monitoring NetFlow performance data fromTraffic Details dashboard . . . . . . . . 308
Network Performance Insight Dashboards. . . . 309Getting started with Network PerformanceInsight Dashboards . . . . . . . . . . 311Network Performance Overview dashboards 316NetFlow dashboards . . . . . . . . . . 330On Demand Filtering dashboards . . . . . 363
Topology search . . . . . . . . . . 371Supported products and components . . . . . 372Network Manager Insight Pack . . . . . . . 372
Content of the Insight Pack. . . . . . . . 373Configuring topology search . . . . . . . . 374
Configuring single sign-on for the topologysearch capability . . . . . . . . . . . 377
Using Topology Search . . . . . . . . . . 378
Configuring integration to IBMConnections . . . . . . . . . . . . 381IBM Connections Overview . . . . . . . . 381Parameters for the IBMConnections function . . . 382IBMConnections Project and artifacts . . . . . . 384Automatic topic management . . . . . . . . 385Automatic topic management with eventmanagement tools . . . . . . . . . . . . 386Enabling historical events . . . . . . . . . 386
iv IBM Netcool Operations Insight: Integration Guide

Release notes . . . . . . . . . . . 387
Notices . . . . . . . . . . . . . . 403Trademarks . . . . . . . . . . . . . . 404
Contents v

vi IBM Netcool Operations Insight: Integration Guide

About this publication
This guide contains information about how to integrate the components of the IBMNetcool Operations Insight solution.
Important: The sections in this guide that deal with Operations Management onIBM Cloud Private include links to version 2.1.0.1 of IBM Cloud Privatedocumentation on the IBM Knowledge Center, as that was the latest versionavailable when this guide was published. We recommend using the latest versionof the IBM Cloud Private documentation, so always check if there is a later versionthan V2.1.0.1.
Accessing terminology onlineThe IBM Terminology Web site consolidates the terminology from IBM productlibraries in one convenient location. You can access the Terminology Web site at thefollowing Web address:
http://www.ibm.com/software/globalization/terminology.
Tivoli technical trainingFor Tivoli® technical training information, refer to the following IBM® TivoliEducation Web site at http://www.ibm.com/software/tivoli/education.
Typeface conventionsThis publication uses the following typeface conventions:
Bold
v Lowercase commands and mixed case commands that are otherwisedifficult to distinguish from surrounding text
v Interface controls (check boxes, push buttons, radio buttons, spinbuttons, fields, folders, icons, list boxes, items inside list boxes,multicolumn lists, containers, menu choices, menu names, tabs, propertysheets), labels (such as Tip and Operating system considerations)
v Keywords and parameters in text
Italic
v Citations (examples: titles of publications, diskettes, and CDs)v Words defined in text (example: a nonswitched line is called a
point-to-point line)v Emphasis of words and letters (words as words example: "Use the word
that to introduce a restrictive clause."; letters as letters example: "TheLUN address must start with the letter L.")
v New terms in text (except in a definition list): a view is a frame in aworkspace that contains data
v Variables and values that you must provide: ... where myname represents...
Monospace
v Examples and code examples
© Copyright IBM Corp. 2014, 2018 vii

v File names, programming keywords, and other elements that are difficultto distinguish from surrounding text
v Message text and prompts addressed to the userv Text that the user must typev Values for arguments or command options
Bold monospace
v Command names, and names of macros and utilities that you can typeas commands
v Environment variable names in textv Keywordsv Parameter names in text: API structure parameters, command
parameters and arguments, and configuration parametersv Process namesv Registry variable names in textv Script names
viii IBM Netcool Operations Insight: Integration Guide

Solution overview
Read about the key concepts and capabilities of IBM Netcool Operations Insight.
This chapter consists of the following sections:
Deployment modes“Deployment examples” on page 22“Deployment scenarios” on page 24
Important: The sections in this guide that deal with Operations Management onIBM Cloud Private include links to version 2.1.0.1 of IBM Cloud Privatedocumentation on the IBM Knowledge Center, as that was the latest versionavailable when this guide was published. We recommend using the latest versionof the IBM Cloud Private documentation, so always check if there is a later versionthan V2.1.0.1.Related tasks:“Installing the Device Dashboard” on page 96Related reference:“Release notes” on page 387
What's newNetcool Operations Insight V1.4.1 and its subordinate releases, such as V1.4.1.1,includes a range of new features and functions.
Summary of new features
Netcool Operations Insight V1.4.1 and its subordinate releases offer the followingnew features and functions. This description of new features and functions is alsoavailable in the Release notes.
Version 1.4.1.2Version 1.4.1.1Version 1.4.1
Netcool Operations Insight V1.4.1.2
1.4.1.2The following features and functions are introduced in V1.4.1.2. After youinstall all the products, components, and fixes that are included in NetcoolOperations Insight, you can benefit from all these features.
Updated product versions
The Netcool Operations Insight V1.4.1.2 solution includes featuresdelivered by the fix packs and fix pack extensions of the products andversions listed on the following web page:
https://www.ibm.com/developerworks/community/wikis/home?lang=en#!/wiki/Tivoli%20Netcool%20OMNIbus/page/From%201.4.1.1%20to%201.4.1.2
© Copyright IBM Corp. 2014, 2018 1

The products are available on Passport Advantage and Fix Central, asspecified on that web page.
For more information on the products and components that make upNetcool Operations Insight, see “Supported products and components” onpage 6.
For information on upgrading to Netcool Operations Insight V1.4.1.2, see“Upgrading to Netcool Operations Insight V1.4.1.2” on page 101.
New featuresThe following features and functions are available in the new NetcoolOperations Insight V1.4.1.2 components. For version numbers of theNetcool Operations Insight V1.4.1.2 components, see the relevant page atthis link.
Operations Management for Operations InsightThe base Netcool Operations Insight solution provides thefollowing new features and functions.
Netcool/OMNIbusIBM Netcool/OMNIbus Web GUI now provides improvedresponsiveness of Event Viewer when dealing with largenumber of events. This is achieved by avoiding use of theDashboard Application Services Hub CURI API forperformance critical data transfers.
Web GUI passwords used for system-to-systemauthentication can now be updated in real time withoutany service interruption. These real-time password updatesare made possible by means of an API.
IBM Tivoli Netcool/OMNIbus integrations include thefollowing probe and gateway updates:v Two new probes: A containerized version of the Probe
for IBM Cloud Private, and the probe for GenericMulti-technology Operations Systems Interface (MTOSI)
v Updates to the Probe for Message Bus and the Gatewayfor Message Bus to enable integration with NetCrackerMANO and the Kafka server.
Netcool/ImpactNetcool/Impact now contains the following updates andadditions, as well as fixes for various issues:v Updated browser, database, and operating system
supportv Change to the setNameServer script to accommodate
integration with IBM Tivoli Business Service Manager.
Event AnalyticsSignificant improvements have been made to the process ofconfiguring Event Analytics. Instead of editing the NOIShared Configuration properties file through the commandline, a new GUI-based setup wizard guides you throughthe Event Analytics configuration process. You must runthe Event Analytics configuration wizard after upgradingto Netcool/Impact v7.1.0.13 to verify and save yourconfiguration.
2 IBM Netcool Operations Insight: Integration Guide
For more information, see “Event Analytics Configuration”on page 160.
Network Management for Operations InsightThe Network Management solution extension provides thefollowing new features and functions.
Network ManagerNetwork Manager now provides functionality to configurethe default network layer that the Network Hop Viewdisplays. For more information, see Changing defaulttopology layer for the Network Hop View.
This release also provides network operators the option tochoose any of the configured base layers for geographicalmaps directly from the GIS Device Map. For moreinformation, see Viewing devices in a geographical context.
Performance Management for Operations InsightThe Performance Management for Operations Insight solutionextension, made up of the Network Performance Insight product,provides the following new features and functions.v Ability to integrate Network Performance Insight within Netcool
Operations Insight without the need for any integration withNetwork Manager. There are two versions of this integration:– Flow information only: this version requires integration of
Network Performance Insight only. Flow data is available inthe form of top 10 information and detailed views of flowacross specific interfaces. However, performance data, such asSNMP, IP SLA, and queue drop data is not available.
– Flow and performance information: this version integratesNetwork Performance Insight and Cacti. This provides acomplete flow and performance solution, as performance datathat was provided by Network Manager in earlier versions isnow provided by Cacti.
For more information on these new scenarios, see NetworkPerformance Insight 1.2.3: Scenarios.
v Enhancements to Network Performance Insight dashboardsinclude side-by-side charts for easy comparison, and theintroduction of a new Network Traffic Overview dashboard forthe new Flow information only integration. For moreinformation, see “Network Performance Insight Dashboards” onpage 309.
v Extended support for IP SLA data now includes support forJuniper's real-time performance monitoring (RPM) data andHuawei's network quality analysis (NQA) data.
Service Management for Operations InsightThe Service Management for Operations Insight solution extensionprovides the following new features and functions.
Agile Service ManagerAgile Service Manager now provides improvedfunctionality to customize user interface elements anddefine global settings, as well as the ability to synchronizeAgile Service Manager and Netcool/OMNIbus events bydeploying the Netcool/OMNIbus Probe for Message Bus
Solution overview 3

together with the Netcool/OMNIbus Gateway for MessageBus. This version of Agile Service Manager also ships anumber of new observers.
For more information, see Agile Service Managerdocumentation: About this release.
Netcool Operations Insight V1.4.1.1
1.4.1.1The following features and functions are introduced in V1.4.1.1. After youinstall all the products, components, and fixes that are included in NetcoolOperations Insight, you can benefit from these features.
Updated product versions
The Netcool Operations Insight V1.4.1.1 solution includes featuresdelivered by the fix packs and fix pack extensions of the products andversions listed on the following web page:
https://www.ibm.com/developerworks/community/wikis/home?lang=en#!/wiki/Tivoli%20Netcool%20OMNIbus/page/From%201.4.1%20to%201.4.1.1
The products are available on Passport Advantage and Fix Central, asspecified on that web page.
For more information on the products and components that make upNetcool Operations Insight, see “Supported products and components” onpage 6.
For information on upgrading to Netcool Operations Insight V1.4.1.1, see“Upgrading to Netcool Operations Insight V1.4.1.1” on page 103.
New featuresThe following features and functions are available in the new NetcoolOperations Insight V1.4.1.1 components. For version numbers of theNetcool Operations Insight V1.4.1.1 components, see the relevant page atthis link.
Netcool/OMNIbusNetcool/OMNIbus now provides functionality to disable specificciphers from individual SSL/TLS protocols. Probes running inslave mode can now forward-on ProbeWatch events. Probes areresilient to field drops on alerts.status table, and do not requires arestart or removal of SAF files.
Netcool/ImpactNetcool/Impact now contains the following updates and additions,as well as fixes for various issues:v Updated browser, database, and operating system support.v Multi-tenant capability added. This allows the display of two
table widgets on the same page using the same dataset, and thedisplay of nested child information from a parent line.
Event AnalyticsSignificant improvements have been made to reduce report runtimes as well as reduce memory consumption. In addition, theView Related Events portlet now displays Events, Groups, andGroups Sources more quickly once an item is selected. As part ofthis update, each tab in the View Related Events portlet now listsall configurations in the panel on the left of the portlet following
4 IBM Netcool Operations Insight: Integration Guide

the successful run of a configuration. Configurations are displayedin the panel even if there are no events or groups in a particularstate for a given configuration. If no data exists for a particularstate, the panels will display a No items to display message. Theconfiguration will be listed in all five tabs, New, Watched, Active,Expired, and Archived.
Network ManagerNetwork Manager now provides event status on probes that areconfigured to monitor IP Service Level Agreements (IP SLA). Thisrelease also adds support for changing the default connectivity inthe Network Hop View.
Netcool Configuration ManagerNetcool Configuration Manager now provides a priority level forcertain service URIs, and fixes for various issues.
Network Performance InsightNetwork Performance Insight now provides new dashboards, tosupport Operations using flow data organized by type of service(ToS), protocol, and other details. The new dashboards also supportnetwork planning and engineering teams by providing detailedinformation associated with QoS queues and on-demanddashboards that show performance of a specific interface over aperiod for a set of KPIs. For more information, see “NetworkPerformance Insight Dashboards” on page 309.
Agile Service ManagerAgile Service Manager provides a series of new functionality,including the ability to customize user interface elements, mergeresources, and specify more detailed user preferences. There arealso a number of new observers that are now available. For moreinformation, see Agile Service Manager documentation: About thisrelease.
Netcool Operations Insight V1.4.1
The following features and functions are introduced in V1.4.1. After you install allthe products, components, and fixes that are included in Netcool OperationsInsight, you can benefit from all these features.
Updated product versions
The Netcool Operations Insight 1.4.1 solution includes features deliveredby the fix packs and fix pack extensions of the products and versions listedon the following web page:
https://www.ibm.com/developerworks/community/wikis/home?lang=en#!/wiki/Tivoli%20Netcool%20OMNIbus/page/From%201.4.0.5%20to%201.4.1
The products are available on Passport Advantage and Fix Central, asspecified on that web page.
More information: “Supported products and components” on page 6
New Service Management for Operations Insight solution extensionThis solution extension widens the scope of the base solution to provideservice management capability. The extension is made up of the IBM AgileService Manager product. Agile Service Manager provides operationsteams with complete up-to-date visibility and control over dynamic
Solution overview 5

infrastructure and services. Agile Service Manager lets you query a specificnetworked resource, and then presents a configurable topology view of itwithin its ecosystem of relationships and states, both in real time andwithin a definable time window. For more information, seehttps://www-01.ibm.com/support/knowledgecenter/SS9LQB. Thisversion of Netcool Operations Insight supports Agile Service ManagerV1.1.1.
Device Dashboard now includes performance metric timelinesUsing the Device Dashboard you can now view performance metrictimeline data covering the last 12 hours of data, and zoom in and out ofthe timeline to see metric values and trends at any time during the last 12hours. You can view timelines for any performance metric on a device orits interfaces.
More information: “Displaying performance timelines” on page 296
Supported products and componentsReview the products and components included in Netcool Operations Insight.
IBM Netcool Operations Insight includes the product and component versionslisted on the following web pages, where you can also find information on theeAssemblies and fix packs required to download and install. Select the relevantversion of IBM Netcool Operations Insight.
Note: Only the combination of product and component releases specified on theversion's web page is supported in that version of IBM Netcool Operations Insight.
https://www.ibm.com/developerworks/community/wikis/home?lang=en#!/wiki/Tivoli%20Netcool%20OMNIbus/page/Release%20details
Product and component details
Tivoli Netcool/OMNIbus core components V8.1.0This product includes the following components. It is installed byInstallation Manager. It is part of the base Netcool Operations Insightsolution, so it must be installed, configured, and running before you canstart the Networks for Operations Insight feature setup.v Server components (includes ObjectServers)v Probe and gateway featurev Accelerated Event Notification (AEN) client
For systems requirements, see http://ibm.biz/BdjpTP.
Important: The ObjectServer that manages the event data must be at V8.1.
Tivoli Netcool/OMNIbus Web GUI V8.1.0This component includes the following subcomponents and add-ons. It isinstalled by Installation Manager. It is part of the base Netcool OperationsInsight solution. The following extensions to the Web GUI are supplied inNetcool Operations Insight:v Tools and menus for integration with Operations Analytics - Log
Analysis.v Extensions for Netcool Operations Insight: This supports the Event
Analytics capability.
6 IBM Netcool Operations Insight: Integration Guide

Important: Both the Impact Server Extensions and the Web GUIextensions must be installed for the Event Analytics capability to work.
The Web GUI is installed into Dashboard Application Services Hub, whichis part of Jazz for Service Management. Jazz for Service Management isdistributed as separate installation features in Installation Manager. Forsystems requirements, see http://ibm.biz/BdjpwT .
DB2® V10.5 Enterprise Server Edition databaseDB2 is the default database used for the Netcool Operations Insightsolution. Other types of databases are also possible. For more information,see http://ibm.biz/BdiVYg.
Gateway for JDBCThis product is required for the base Netcool Operations Insight solution. Itis installed by Installation Manager. The system requirements are the sameas for Tivoli Netcool/OMNIbus V8.1. It is required for the transfer of eventdata from the ObjectServer to the IBM DB2 database.
Netcool/Impact V7.1.0This product includes the following components. It is part of the baseNetcool Operations Insight solution. It is installed by Installation Manager.v Impact serverv GUI serverv Impact Server extensions: Includes the policies that are used to create the
event analytics algorithms and the integration to IBM Connections.
Important: Both the Impact Server Extensions and the Web GUIextensions must be installed for the Event Analytics capability to work.
For system requirements, see https://ibm.biz/BdRNLF.
IBM Operations Analytics - Log Analysis V1.3.3 and V1.3.5Netcool Operations Insight works with IBM Operations Analytics - LogAnalysis V1.3.3 and 1.3.5. IBM Operations Analytics - Log Analysis is partof the base Netcool Operations Insight solution. It is installed byInstallation Manager. For system requirements, search for "Hardware andsoftware requirements" within the relevant version of IBM OperationsAnalytics - Log Analysis at https://www.ibm.com/support/knowledgecenter/SSPFMY.
Note: Operations Analytics - Log Analysis Service Desk Extension V1.1 isavailable with IBM Operations Analytics - Log Analysis V1.3.5.
Note: Operations Analytics - Log Analysis Standard Edition is included inNetcool Operations Insight. For more information about OperationsAnalytics - Log Analysis editions, search for "Editions" at the OperationsAnalytics - Log Analysis Knowledge Center, at https://www.ibm.com/support/knowledgecenter/SSPFMY.
OMNIbusInsightPack_v1.3.0.2 for IBM Operations Analytics - Log AnalysisThis product is part of the base Netcool Operations Insight solution. It isrequired to enable the event search capability in Operations Analytics - LogAnalysis. The Insight Pack is installed into Operations Analytics - LogAnalysis.
Gateway for Message Bus V8.0This product is part of the base Netcool Operations Insight solution. It is
Solution overview 7

installed by Installation Manager. The system requirements are the same asfor Tivoli Netcool/OMNIbus V8.1.0. It is used for the following purposes:v Transferring event data to the IBM Operations Analytics - Log Analysis
product.v Supports the transfer of event data to Agile Service Manager by
integrating with the Agile Service Manager Event Observer.
Jazz for Service Management V1.1.3.0This component provides the GUI framework for the Netcool OperationsInsight solution. It is installed by Installation Manager, and it includes thefollowing subcomponents.v Dashboard Application Services Hub V3.1.3.0v Reporting Services (previously called Tivoli Common Reporting V3.1)
Note: For the cumulative patch to use for this version of Jazz for ServiceManagement, see the web page for the relevant version of NetcoolOperations Insight at this location: https://www.ibm.com/developerworks/community/wikis/home?lang=en#!/wiki/Tivoli%20Netcool%20OMNIbus/page/Release%20details
For the system requirements for Dashboard Application Services Hub, seehttp://ibm.biz/BdiVYN. The instance of Dashboard Application ServicesHub hosts the V8.1 Web GUI and the Seasonal Event Reports portlet. Jazzfor Service Management is included in the Web GUI installation packagebut is installed as separate features.
You can set up Network Manager and Netcool Configuration Manager towork with Reporting Services by installing their respective reports wheninstalling the products. Netcool/OMNIbus V8.1.0 and later can beintegrated with Reporting Services V3.1 to support reporting on events. Toconfigure this integration, connect Reporting Services to a relationaldatabase through a gateway. Then, import the report package that issupplied with Netcool/OMNIbus into Reporting Services. For moreinformation about event reporting, see http://www-01.ibm.com/support/knowledgecenter/SSSHTQ_8.1.0/com.ibm.netcool_OMNIbus.doc_8.1.0/omnibus/wip/install/task/omn_con_ext_deploytcrreports.html.
Network Manager IP Edition V4.2.0This product includes the core and GUI components for the optionalNetworks for Operations Insight feature.
For system requirements, see https://www.ibm.com/support/knowledgecenter/SSSHRK_4.2.0/install/task/pln_planninginst.html.
Network Manager Insight Pack V1.3.0.0 for IBM Operations Analytics - LogAnalysis
This product is part of the Networks for Operations Insight feature. It isrequired to enable the topology search capability in Operations Analytics -Log Analysis. The Insight Pack is installed into Operations Analytics - LogAnalysis. It requires that the OMNIbusInsightPack_v1.3.0.2 is installed.
Note: The Network Manager Insight Pack V1.3.0.0 can share a data sourcewith the OMNIbusInsightPack_v1.3.0.2 only. It cannot share a data sourcewith previous versions of the Tivoli Netcool/OMNIbus Insight Pack.
Probe for SNMPThis product is optional for the base Netcool Operations Insight solution. Itis used in environments that have SNMP traps. It is required for the
8 IBM Netcool Operations Insight: Integration Guide
Networks for Operations Insight feature. For installations of the probe onthe Tivoli Netcool/OMNIbus V8.1 server, use the instance of the probe thatinstalls with IBM Installation Manager.
Syslog ProbeThis product is optional for the base Netcool Operations Insight solution. Itis required for the Networks for Operations Insight feature. Forinstallations of the probe on the Tivoli Netcool/OMNIbus V8.1 server, usethe instance of the probe that installs with IBM Installation Manager.
Netcool Configuration Manager V6.4.2This product has the following components. It is part of the optionalNetworks for Operations Insight feature.v Core componentsv Driversv OOBC component
System requirements are available on this Software Product CompatibilityReports (SPCR) page.
IBM Network Performance Insight V1.2.3Network Performance Insight is a network traffic performance monitoringsystem. It provides comprehensive and scalable visibility on network trafficwith visualization and reporting of network performance data for complex,multivendor, multi-technology networks. The end user is able to performthe following tasks: visualize flow across selected interfaces, displayperformance anomaly events in the Tivoli Netcool/OMNIbus EventViewer, and view performance anomaly and performance timeline data inthe Device Dashboard. For more information, see http://www-01.ibm.com/support/knowledgecenter/SSCVHB/welcome.
IBM Alert NotificationIBM Alert Notification provides instant notification of alerts for any criticalIT issues across multiple monitoring tools. It gives IT staff instantnotification of alerts for any issues in your IT operations environment. Formore information, see http://www-01.ibm.com/support/knowledgecenter/SSY487/com.ibm.netcool_OMNIbusaas.doc_1.2.0/landingpage/product_welcome_alertnotification.html.
IBM Runbook AutomationIBM Runbook Automation empowers IT operations teams to be moreefficient and effective. Operators can focus their attention where it is reallyneeded and receive guidance to the best resolution with recommendedactions and pre-filled context. With Runbook Automation you can:v Investigate and delegate problems faster and more efficiently.v Diagnose and fix problems faster and build operational knowledge.v Easily create, publish, and manage runbooks and automations.v Keep score to track achievements and find opportunities for
improvement.
For more information, see http://www-01.ibm.com/support/knowledgecenter/SSZQDR/com.ibm.rba.doc/RBA_welcome.html.
More information
For more information about the component products of Netcool OperationsInsight, see the websites listed in the following table.
Solution overview 9

Table 1. Product information
Product Website
IBM Netcool OperationsInsight
http://www.ibm.com/support/knowledgecenter/SSTPTP/welcome
IBM TivoliNetcool/OMNIbus andWeb GUI
http://www-01.ibm.com/support/knowledgecenter/SSSHTQ/landingpage/NetcoolOMNIbus.html
IBM TivoliNetcool/Impact
http://www-01.ibm.com/support/knowledgecenter/SSSHYH/welcome
IBM Operations Analytics- Log Analysis
http://www-01.ibm.com/support/knowledgecenter/SSPFMY/welcome
Netcool/OMNIbusGateways
http://www-01.ibm.com/support/knowledgecenter/SSSHTQ/omnibus/gateways/common/Gateways.html
Jazz for ServiceManagement
http://www.ibm.com/support/knowledgecenter/SSEKCU/welcome
IBM Tivoli NetworkManager
https://www.ibm.com/support/knowledgecenter/SSSHRK
IBM Tivoli NetcoolConfiguration Manager
http://www-01.ibm.com/support/knowledgecenter/SS7UH9/welcome
Network PerformanceInsight
http://www-01.ibm.com/support/knowledgecenter/SSCVHB/welcome
Agile Service Manager https://www-01.ibm.com/support/knowledgecenter/SS9LQB/welcome
Runbook Automation http://www-01.ibm.com/support/knowledgecenter/SSZQDR/com.ibm.rba.doc/RBA_welcome.html
Alert Notification http://www.ibm.com/support/knowledgecenter/SSY487/com.ibm.netcool_OMNIbusaas.doc_1.2.0/landingpage/product_welcome_alertnotification.html
About Netcool Operations InsightIBM Netcool Operations Insight consists of a base operations managementsolution. It can be optionally extended by integrating Network Management,Performance Management, and Service Management solution extensions.
The full name of the Netcool Operations Insight base solution is OperationsManagement for Operations Insight. This base solution provides the capability ofmonitoring the health and performance of IT and network infrastructure acrosslocal, cloud and hybrid environments. It also incorporates strong eventmanagement capabilities, and leverages real-time alarm and alert analytics,combined with broader historic data analytics.
You can optionally extend this base solution by adding the following solutionextensions:
Network Management for Operations InsightNetwork Management adds network discovery, visualization, eventcorrelation, topology-based root-cause analysis, and configuration andcompliance management capabilities. It also adds network dashboardingand topology search capabilities. The extension is provided by integratingthe Network Manager and Netcool Configuration Manager products.
10 IBM Netcool Operations Insight: Integration Guide

Performance Management for Operations InsightPerformance Management adds performance management capability,including a wide range of dashboarding and flow capabilities . Theextension is provided by integrating the Network Performance Insightproduct.
Service Management for Operations InsightService Management adds service management capability, includingup-to-date visibility and control over dynamic infrastructure and services.For example, you can query a specific networked resource, and thenpresents a configurable topology view of it within its ecosystem ofrelationships and states, both in real time and within a definable timewindow. The extension is provided by integrating the Agile ServiceManager product.
About Operations ManagementUse this information to understand more about the Netcool Operations Insightbase solution.
Operations Management capabilitiesUse this information to understand the capabilities of Operations Management.
Operations Management is made up of the following products and components:v IBM Tivoli Netcool/OMNIbusv Tivoli Netcool/OMNIbus Web GUIv IBM Tivoli Netcool/Impactv IBM Operations Analytics - Log Analysisv Event Analyticsv Event Searchv IBM Connections Integration
Operations Management leverages real-time alarm and alert analytics, combinedwith broader historic data analytics. Netcool Operations Insight is powered by thefault management capabilities of IBM Tivoli Netcool/OMNIbus and IBM's leadingbig data technologies within IBM Operations Analytics - Log Analysis, providingpowerful event search and historical analysis in a single solution. OperationsManagement integrates infrastructure and operations management into a singlecoherent structure across business applications, virtualized servers, networkdevices and protocols, internet protocols, and security and storage devices, andincludes the following capabilities:
The components and capabilities of Operations Management are described below:
Event AnalyticsEvent Analytics performs statistical analysis of Tivoli Netcool/OMNIbushistorical event data. You can use the results of seasonal analysis to createnetwork, device, or suppression rules to reduce the number of events, oruse the results of related event analysis to deploy Netcool/Impactcorrelation rules to group events together under a single parent, therebyreducing the number of events that are presented to operators.
Event SearchEvent search applies the search and analysis capabilities of OperationsAnalytics - Log Analysis to events that are monitored and managed byTivoli Netcool/OMNIbus.
Solution overview 11

IBM Connections IntegrationNetcool/Impact enables social collaboration through IBM Connections byautomatically providing updates to key stake holders.
Operations Management tasksUse this information to understand the tasks that users can perform usingOperations Management.
Operations Management tasks fall into the following categories:v Event Search tasksv Event Analytics tasks
Event Search tasks
Using Event Search, Operations staff can use the analytics available in OperationsAnalytics - Log Analysis to determine how the monitoring environment isperforming over time.
Using Event SearchNetwork operators can diagnose and triage events in the Event Viewer byusing the search and analysis capabilities within Event Search. An exampleof this is the use of Event Search to narrow down the cause of an eventstorm by running the Event Search dashboard and timeline tools againstselected events in the Event Viewer.
Configuring Event SearchAdministrators can make extra event data available within Event Search, toprovide Operations with a more semantically rich set of data to use inEvent Search dashboard and timeline tools. This, in turn, helps operators tomore effectively diagnose and triage events using Event Search.
Administrators can also customize Event Search dashboards, to enableOperations to more effectively analyse event data.
Event Analytics tasks
Using Event Analytics, Operations staff can determine event patterns, groups, andseasonality, and use this knowledge to build rules that create parent and syntheticevents, thereby reducing event count and presenting operators with events that arecloser to the underlying incidents.
Using Event AnalyticsOperations staff can review generated analytics reports, and drill into thereports to see seasonality graphs, related event groups, and event patterns.Based on an analysis of the report data, they can set up rules to act on liveevents and thereby reduce event count and improve the quality of theevents in the Event Viewer.
Configuring Event AnalyticsAdministrators can customize Event Analytics in a variety of ways:v Making custom data available within seasonal and related event reports
to provide Operations with a richer set of analytics data.v Changing the mechanism used by seasonality to suppress events.v Configuring how event pattern processing is performed.
In addition, administrators can set up configuration scans to run againsthistorical data over a specified time range. They can specify which type of
12 IBM Netcool Operations Insight: Integration Guide

analytic to run and can set up a schedule so that analytics reports areautomatically generated for Operations.
Related tasks:“Using Event Search” on page 130
Operations Management data flowUse this information to understand how event data is retrieved from a monitoredapplication environment and transferred between the products and components ofthe base Netcool Operations Insight in order to provide Event Analytics and EventSearch capabilities.
The following figure shows a simplified data flow between the products of thebase Netcool Operations Insight solution.
1
2
3
4
5
6
7
8
910
10
Related Events GUI
Seasonality GUI
HistoricalEvent
Database Gatewayfor JDBC
Web GUI
EventSearch
timelines
Eventdashboards
Netcool/OMNIbusInsight Pack
OperationsAnalytics - Log
Analysis
Gatewayfor Message Bus
Netcool/OMNIbus
Monitoredenvironment
Probes
Event Analytics
Event Search
Netcool/Impact
Analyticsalgorithms
Figure 1. Data flow for the Netcool Operations Insight base solution.
Solution overview 13
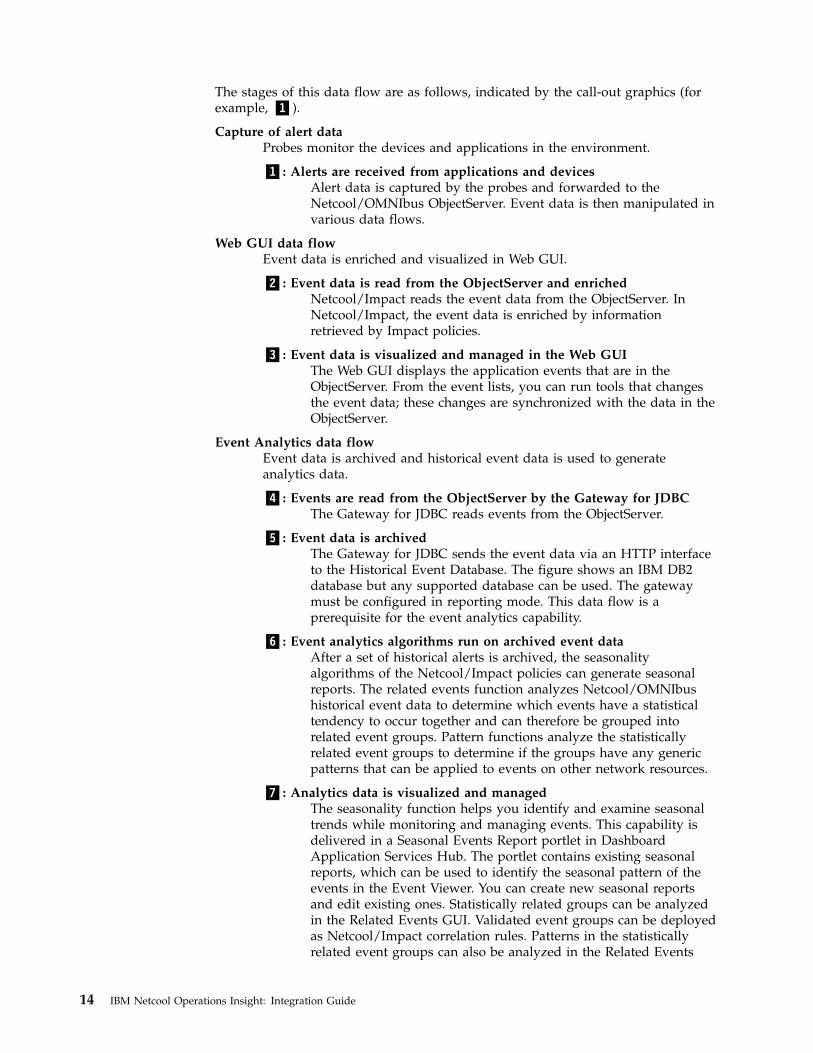
The stages of this data flow are as follows, indicated by the call-out graphics (forexample, ▌1▐).
Capture of alert dataProbes monitor the devices and applications in the environment.
▌1▐: Alerts are received from applications and devicesAlert data is captured by the probes and forwarded to theNetcool/OMNIbus ObjectServer. Event data is then manipulated invarious data flows.
Web GUI data flowEvent data is enriched and visualized in Web GUI.
▌2▐: Event data is read from the ObjectServer and enrichedNetcool/Impact reads the event data from the ObjectServer. InNetcool/Impact, the event data is enriched by informationretrieved by Impact policies.
▌3▐: Event data is visualized and managed in the Web GUIThe Web GUI displays the application events that are in theObjectServer. From the event lists, you can run tools that changesthe event data; these changes are synchronized with the data in theObjectServer.
Event Analytics data flowEvent data is archived and historical event data is used to generateanalytics data.
▌4▐: Events are read from the ObjectServer by the Gateway for JDBCThe Gateway for JDBC reads events from the ObjectServer.
▌5▐: Event data is archivedThe Gateway for JDBC sends the event data via an HTTP interfaceto the Historical Event Database. The figure shows an IBM DB2database but any supported database can be used. The gatewaymust be configured in reporting mode. This data flow is aprerequisite for the event analytics capability.
▌6▐: Event analytics algorithms run on archived event dataAfter a set of historical alerts is archived, the seasonalityalgorithms of the Netcool/Impact policies can generate seasonalreports. The related events function analyzes Netcool/OMNIbushistorical event data to determine which events have a statisticaltendency to occur together and can therefore be grouped intorelated event groups. Pattern functions analyze the statisticallyrelated event groups to determine if the groups have any genericpatterns that can be applied to events on other network resources.
▌7▐: Analytics data is visualized and managedThe seasonality function helps you identify and examine seasonaltrends while monitoring and managing events. This capability isdelivered in a Seasonal Events Report portlet in DashboardApplication Services Hub. The portlet contains existing seasonalreports, which can be used to identify the seasonal pattern of theevents in the Event Viewer. You can create new seasonal reportsand edit existing ones. Statistically related groups can be analyzedin the Related Events GUI. Validated event groups can be deployedas Netcool/Impact correlation rules. Patterns in the statisticallyrelated event groups can also be analyzed in the Related Events
14 IBM Netcool Operations Insight: Integration Guide

GUI. These patterns can be extracted and deployed asNetcool/Impact generalized patterns.
Event Search data flowEvent data is indexed in Operations Analytics - Log Analysis and used todisplay event dashboard and timelines.
▌8▐: Events are read from the ObjectServer by Gateway for Message BusThe Gateway for Message Bus reads events from the ObjectServer.
▌9▐: Event data is transferred for indexing to Operations Analytics - LogAnalysis
The Gateway for Message Bus sends the event data via an HTTPinterface to the Operations Analytics - Log Analysis product wherethe event data is indexed. The Tivoli Netcool/OMNIbus InsightPack V1.3.0.0 parses the event data into a format suitable for useby Operations Analytics - Log Analysis. The diagram shows thedefault IDUC connection, which sends only event inserts. For eventinserts and reinserts, the Accelerated Event Notification client canbe deployed, which can handle greater event volumes. See“On-premises scenarios for Operations Management” on page 26.
▌10▐: Event search data is visualizedEvent search results are visualized in Operations Analytics - LogAnalysis event dashboards and timelines by performing right-clicktools from event lists in Web GUI.
Related information:
Tivoli Netcool/OMNIbus architecture
IBM Operations Analytics - Log Analysis architecture
Overview of Netcool/Impact deployments
About Network ManagementUse this information to understand more about the Network Management forOperations Insight solution extension.
Network Management capabilitiesUse this information to understand the capabilities of Network Management.
Network Management is made up of the following products and components:v Network Managerv Netcool Configuration Managerv Topology Search
Networks for Operations Insight is an optional solution extension that can beadded to a deployment of the base Netcool Operations Insight solution to provideservice assurance in dynamic network infrastructures. The capabilities of Networksfor Operations Insight include network discovery, visualization, event correlationand root-cause analysis, and configuration and compliance management. Itcontributes to overall operational insight into application and network performancemanagement. The Networks for Operations Insight capability is provided throughthe Network Manager and Netcool Configuration Manager products.
The components and capabilities of Network Management are described below:
Solution overview 15

Network Health DashboardThis dashboard leverages the capabilities of Network Manager,Netcool/OMNIbus, and Netcool Configuration Manager products todisplay availability, performance, event, and configuration data for selectednetwork views.
The Network Health Dashboard displays device and interface availabilitywithin that network view. It also reports on performance by presentinggraphs, tables, and traces of KPI data for monitored devices and interfaces.A dashboard timeline reports on device configuration changes and eventcounts, enabling correlation of events with configuration changes. Thedashboard includes the Event Viewer for more detailed event information.
Topology SearchThis capability provides insight into network performance by determininglowest cost routes between two endpoints on the network over time. Thetopology search capability is an extension of the Networks for OperationsInsight feature. It applies the search and analysis capabilities of OperationsAnalytics - Log Analysis to give insight into network performance. Eventsthat have been enriched with network data are analyzed by the NetworkManager Insight Pack and are used to calculate the lowest-cost routesbetween two endpoints on the network topology over time. The eventsthat occurred along the routes over the specified time period are identifiedand shown by severity. The topology search requires the Networks forOperations Insight feature to be installed and configured.
Network Management tasksUse this information to understand the tasks that users can perform usingNetwork Management.
Network Management tasks fall into the following categories:v Custom dashboard development tasksv Network Health Dashboard tasksv Topology Search tasks
Custom dashboard development tasks
Administrators can create pages that act as "dashboards" for displayinginformation on the status of parts of your network, and they can edit existingdashboards, such as the Network Health Dashboard. They can select from thewidgets that are provided with Network Manager, Tivoli Netcool/OMNIbus WebGUI, and also from other products that are deployed in your DashboardApplication Services Hub environment.
Network Health Dashboard tasks
The Network Health Dashboard displays device and interface availability withinthat network view. It also reports on performance by presenting graphs, tables, andtraces of KPI data for monitored devices and interfaces. A dashboard timelinereports on device configuration changes and event counts, enabling correlation ofevents with configuration changes. The dashboard includes the Event Viewer formore detailed event information.
Monitoring the networkOperations staff can use Network Health Dashboard to monitor thenetwork by selecting a network view within an area of responsibility, such
16 IBM Netcool Operations Insight: Integration Guide

as a geographical area, or a specific network service such as BGP or VPN,and reviewing the data that appears in the other widgets on thedashboard.
Administering the dashboardAdministrators can configure how data is displayed, and which data isdisplayed in the Network Health Dashboard.
Topology Search tasks
This capability provides insight into network performance by determining lowestcost routes between two endpoints on the network over time.
Using Topology SearchOperations staff can use the analytics available in the Topology Searchcapability to obtain insight into network performance. For example, theycan visualize the lowest-cost routes between two endpoints on the networktopology over time.
Configuring Topology SearchAdministrations staff can configure and customize these tools to match thenetwork and alerting ecosystem.
Related concepts:“About the Network Health Dashboard” on page 265Related tasks:“Developing custom dashboards” on page 282“Using Topology Search” on page 378
Network Management data flowUse this information to understand how event data is retrieved from a monitoredapplication environment and transferred between the products and components ofNetwork Management in order to provide Topology Search, Network HealthDashboard and Device Dashboard capabilities.
The following figure shows a simplified data flow between the products ofNetwork Management and, where appropriate, Operations Management.
Solution overview 17

Collection of network topology, polling, and configuration data
▌1▐: Network discovery is runBased on configurations set up by network administrators,Network Manager gathers data about the network. The discoveryfunction identifies what entities, for example routers and switches,are on the network and interrogates them, for example, forconnectivity information.
▌2▐ Network topology is storedNetwork Manager classifies and stores the network topology thatwas discovered in step ▌1▐ in the NCIM topology database.
▌3▐: Network devices and interfaces are polledBased on configurations set up by network administrators,Network Manager polling policies are run to determine whether anetwork device is up or down, whether it exceeds key performanceparameters, and identifies inter-device link faults.
▌4▐: Changes to device configuration and policy changes are detectedNetcool Configuration Managerdiscovers whether there are anychanges to device configuration or policy violations.
1
NCIMTopolog
3
4
5
67
2
8
9
10
11
12
13
14
14
5
15
15
15
16
Monitoredenvironment
Network Management
Operations Management
Network Manager
OperationsAnalytics -
Log Analysis
Networkdiscovery
NetworkManagerInsight Pack
Netcool Configuration Manager
Topology Search
NCMServer
NCM GUIConfigurationVisualization
DeviceDashboard
NetworkHealthDashboard
Network ManagerGUIsTopologyVisualization
Networkpolling
Probes
Netcool/OMNIbus
Web GUI
EventSearch
timelines
Figure 2. Simplified data flow
18 IBM Netcool Operations Insight: Integration Guide

Collection and enrichment of alert data
▌5▐: Alerts are received from applications and devicesAlert data is captured by probes and forwarded to theObjectServer.
▌6▐: Network events are generated if polls failNetwork Manager generates fault alerts if device and interfacepolls (step ▌2▐) fail. Network Manager converts the results of therelevant polls into events, and sends these network events to theObjectServer.
▌7▐: Network configuration events are generated if device configurationschange
Netcool Configuration Manager generates events for theconfiguration changes and policy violations (referred to hereafteras network configuration events) that were detected in step ▌3▐.Configuration change and policy violation events are sent via theProbe for SNMP to the ObjectServer.
▌8▐: Events are enriched using topology dataNetwork events (generated in step ▌6▐) and network configurationevents (generated in step ▌7▐) are passed to the Event Gateway,where they are enriched with network topology data. For example,the system location, contact information, and product serialnumber can be added to the events. The events are returned to theObjectServer.
Once steps ▌5▐ to ▌8▐ are complete the Netcool/OMNIbus ObjectServer containsthe application events from the probes, network events from Network Manager,and the network configuration events from Netcool Configuration Manager.
Visualization of events and topology
▌9▐ Event are visualized and monitoredThe Tivoli Netcool/OMNIbus Web GUI displays the applicationevents, network events, and network configuration events that arein the ObjectServer.
▌10▐ Event information is sharedThe event information is shared between the Web GUI and theNetwork Manager GUIs, for example, the Network Views and HopView.
▌11▐ Network topology is visualizedThe Network Manager GUIs display the network topology datathat is in the NCIM database. This data is enriched by theconfiguration change and policy event information from theObjectServer.
▌12▐ Network configuration events are analyzedConfiguration changes and policy violations are displayed forfurther analysis in the following GUIs:v Network Manager GUIsv Web GUI Event Viewer
v Netcool Configuration Manager Activity Viewer, wizards, andother Netcool Configuration Manager user interfaces
Solution overview 19
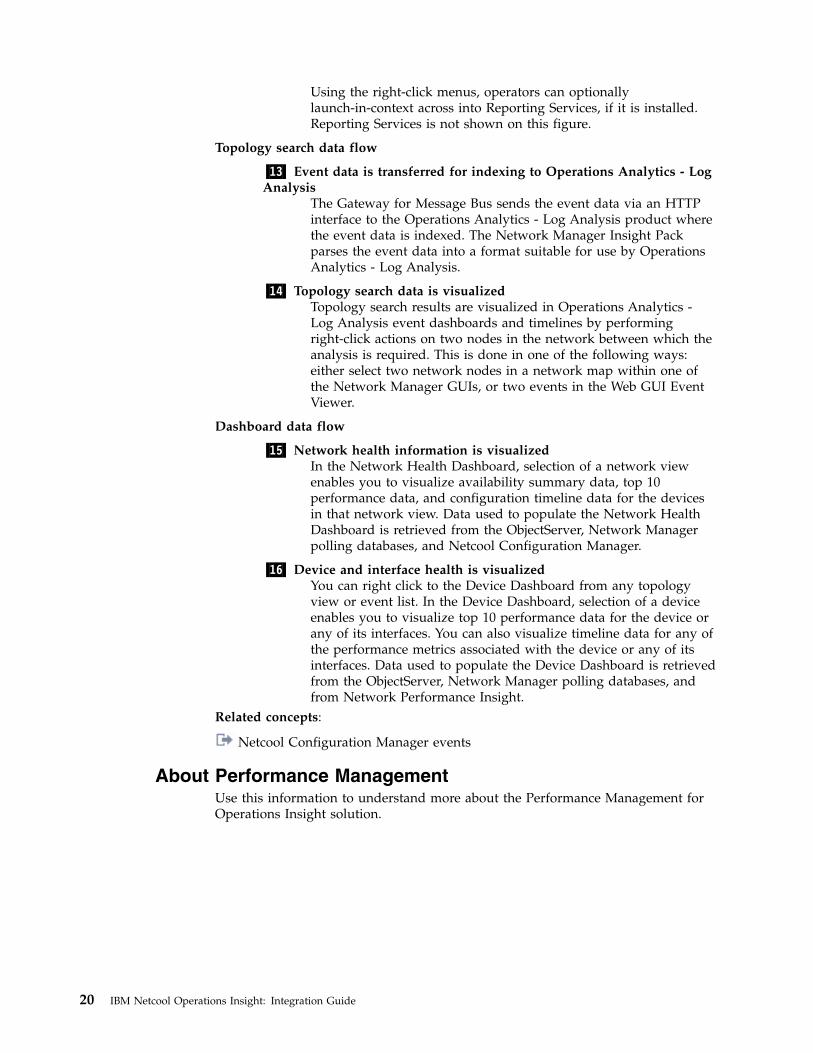
Using the right-click menus, operators can optionallylaunch-in-context across into Reporting Services, if it is installed.Reporting Services is not shown on this figure.
Topology search data flow
▌13▐ Event data is transferred for indexing to Operations Analytics - LogAnalysis
The Gateway for Message Bus sends the event data via an HTTPinterface to the Operations Analytics - Log Analysis product wherethe event data is indexed. The Network Manager Insight Packparses the event data into a format suitable for use by OperationsAnalytics - Log Analysis.
▌14▐ Topology search data is visualizedTopology search results are visualized in Operations Analytics -Log Analysis event dashboards and timelines by performingright-click actions on two nodes in the network between which theanalysis is required. This is done in one of the following ways:either select two network nodes in a network map within one ofthe Network Manager GUIs, or two events in the Web GUI EventViewer.
Dashboard data flow
▌15▐ Network health information is visualizedIn the Network Health Dashboard, selection of a network viewenables you to visualize availability summary data, top 10performance data, and configuration timeline data for the devicesin that network view. Data used to populate the Network HealthDashboard is retrieved from the ObjectServer, Network Managerpolling databases, and Netcool Configuration Manager.
▌16▐ Device and interface health is visualizedYou can right click to the Device Dashboard from any topologyview or event list. In the Device Dashboard, selection of a deviceenables you to visualize top 10 performance data for the device orany of its interfaces. You can also visualize timeline data for any ofthe performance metrics associated with the device or any of itsinterfaces. Data used to populate the Device Dashboard is retrievedfrom the ObjectServer, Network Manager polling databases, andfrom Network Performance Insight.
Related concepts:
Netcool Configuration Manager events
About Performance ManagementUse this information to understand more about the Performance Management forOperations Insight solution.
20 IBM Netcool Operations Insight: Integration Guide

Capabilities of Performance Management for Operations InsightUse this information to understand the capabilities of Performance Management.
The extension is made up of the following product: Network Performance Insight
Network Performance Insight is a network traffic performance monitoring system.It provides comprehensive and scalable visibility on network traffic withvisualization and reporting of network performance data for complex, multivendor,multi-technology networks. The end user is able to perform the following tasks:visualize flow across selected interfaces, display performance anomaly events inthe Tivoli Netcool/OMNIbus Event Viewer, and view performance anomaly andperformance timeline data in the Device Dashboard. For more information, seehttp://www-01.ibm.com/support/knowledgecenter/SSCVHB/welcome.
The components and capabilities of Performance Management are described below:
Device Dashboard (networks and performance)This dashboard leverages the capabilities of Network Manager, andNetcool/OMNIbus to display event data, and top 10 performance metricdata for a selected network device and its interfaces.
Note: This capability requires that both Network Management andPerformance Management are integrated into your Netcool OperationsInsight solution.
Traffic Details DashboardUse the Traffic Details dashboard to monitor network performance andflow details for a particular interface. Network Performance Insightprovides built-in and interactive dashboards that cover the entire trafficdata representation.
Network Performance Insight® DashboardsIf you are a network planner or engineer, then use Network PerformanceInsight Dashboardsto view top 10 information on interfaces across yournetwork, including the following:v Congestionv Traffic utilizationv Quality of service
About Service ManagementUse this information to understand more about the Service Management forOperations Insight solution extension.
Capabilities of Service Management for Operations InsightUse this information to understand the capabilities of Service Management.
The extension is made up of the following product: Agile Service Manager
Agile Service Manager provides operations teams with complete up-to-datevisibility and control over dynamic infrastructure and services. Agile ServiceManager lets you query a specific networked resource, and then presents aconfigurable topology view of it within its ecosystem of relationships and states,both in real time and within a definable time window. For more information, seehttps://www-01.ibm.com/support/knowledgecenter/SS9LQB.
The components and capabilities of Service Management are described below:
Solution overview 21

Topology ViewerUsing the Topology Viewer you can use elastic search features to easilylocate and visualize near real-time and historical configurable views ofmultidomain topologies, including IT, network, storage, and applicationdata. This enables you to reduce the complexity of managing modern andhybrid services, across vendors, data centers and traditional managementsilos.
Observer and API integrationEase and rapidity of integration with any topology source is provided bymeans of observers and APIs. Observers are provided for a wide range ofdata, including event data, Network Manager topology data, TADDMtopology data, OpenStack data, multiple file formats, REST, Docker, andVMware. This ensures rapid time-to-value, by providing up-to-datevisibility and control over dynamic infrastructure and services.
Deployment of Netcool Operations InsightUse this information for guidance on deployment of your Netcool OperationsInsight installation.
Deployment examples1.4.1.2
Use these examples to help you plan your deployment architecture.
Example of an on-premises physical deployment1.4.1.2
Use this example to familiarize yourself with the architecture of an on-premisesphysical deployment of Netcool Operations Insight. The architecture described inthis example can be scaled up and extended for failover, a multitiered architecture,load balancing, and clustering.
This scenario assumes that there are no existing Netcool Operations Insightproducts in your environment, so no backup, restore, or upgrade information isgiven. The information supplied in this scenario is high-level and covers the mostsalient points and possible issues you might encounter that are specific to NetcoolOperations Insight. The steps to install the Networks for Operations Insight featureare included, but skip these steps if you want to install only the base solution. Thisscenario is end-to-end and you must perform the tasks in the specified order.
For more information about each task in this scenario, see the Related concept,task, and information links at the bottom of each page.
The following figure shows the simplified installation architecture that this scenarioadheres to.
22 IBM Netcool Operations Insight: Integration Guide

For information on the product and component versions supported in the currentversion of Netcool Operations Insight including supported fix packs, see“Supported products and components” on page 6.
Server 1Hosts the Netcool/OMNIbus core components, the Gateway for JDBC,Gateway for Message Bus, and Netcool/Impact. Configurations are appliedto the ObjectServer to support the event analytics and topology searchcapabilities. Event analytics is part of the base Netcool Operations Insightsolution. Topology search is part of the Networks for Operations Insightfeature. The default configuration of the Gateway for Message Bus is totransfer event inserts to Operations Analytics - Log Analysis through anIDUC channel. This connection can be changed to forward events reinsertsand inserts through the Accelerated Event Notification client.
Server 2Hosts an IBM DB2 database and Operations Analytics - Log Analysis. TheTivoli Netcool/OMNIbus Insight Pack and the Network Manager InsightPack are installed into Operations Analytics - Log Analysis. The TivoliNetcool/OMNIbus Insight Pack is part of the base Netcool OperationsInsight solution. The Network Manager Insight Pack is part of theNetworks for Operations Insight feature. The REPORTER schema isapplied to the DB2 database so that events can be transferred from theGateway for JDBC. Various installation methods are possible for DB2. Formore information, see https://ibm.biz/BdEWtm.
Server 3Hosts Dashboard Application Services Hub, which is a component of Jazzfor Service Management. Jazz for Service Management provides the GUIframework and the Reporting Services component. The Netcool/OMNIbusWeb GUI and the Event Analytics component are installed into DashboardApplication Services Hub. In this setup Reporting Services is also installedon this server, together with parts of the Networks for Operations Insightfeature: the Network Manager IP Edition GUI components, Netcool
Server 1
Netcool/Impact
Gatewayfor JDBC
Gatewayfor Message
Bus
ObjectServer
Netcool/OMNIbus
Web GUI,EventAnalytics
Server 3
Dashboard ApplicationServices Hub
NW ManagerGUIs andNCM GUI
ReportingServicesV3.1
IBM DB2
database
OperationsAnalytics - Log
Analysis
Server 2
NW Managercore
Topologydatabase(NCIM)
Server 4
Server 5
NetworkPerformanceInsight
Server 6
Agile ServiceManager coreand observers
Agile ServiceManager UI
NCMPresentation andworker servers
Figure 3. Simplified installation architecture for the installation scenario
Solution overview 23

Configuration Manager, and the Agile Service Manager UI. This simplifiesthe configuration of the GUI server, and provides the reporting engine andthe report templates provided by the products on one host.
Note: You can set up Network Manager and Netcool ConfigurationManager to work with Reporting Services by installing their respectivereports when installing the products. Netcool/OMNIbus V8.1.0 and latercan be integrated with Reporting Services V3.1 to support reporting onevents. To configure this integration, connect Reporting Services to arelational database through a gateway. Then, import the report packagethat is supplied with Netcool/OMNIbus into Reporting Services. For moreinformation about event reporting, see http://www-01.ibm.com/support/knowledgecenter/SSSHTQ_8.1.0/com.ibm.netcool_OMNIbus.doc_8.1.0/omnibus/wip/install/task/omn_con_ext_deploytcrreports.html.
Server 4Hosts the Netcool Configuration Manager presentation and worker server,the Network Manager IP Edition core components, and the NCIM topologydatabase, which are all components of the Networks for Operations Insightfeature. This setup assumes large networks where discovering the networkand creating and maintaining the network topology can require significantsystem resources.
Server 5Hosts the Network Performance Insight components that support theperformance management feature. For information on installation andconfiguration of Network Performance Insight, see “Installing PerformanceManagement” on page 93.
Server 6Hosts the Agile Service Manager components that support the servicemanagement feature, including the Agile Service Manager core and theAgile Service Manager observers. For information on installation andconfiguration of Agile Service Manager, see the Agile Service Managerdocumentation at https://www.ibm.com/support/knowledgecenter/SS9LQB_1.1.0/welcome_page/kc_welcome-444.html.
Deployment scenariosUse this information to understand how to model your deployment to handle theexpected event volumes in Netcool/OMNIbus and to reflect the capacity that youplan for IBM Operations Analytics - Log Analysis, and what to consider if youplan to deploy the Networks for Operations Insight feature.Related tasks:“Installing Netcool Operations Insight” on page 35
Deployment scenarios for Operations ManagementWhen you plan a deployment, it is important to consider the relationship betweenthe event volumes that are supported by Netcool/OMNIbus and the capacity ofOperations Analytics - Log Analysis to analyze events.
24 IBM Netcool Operations Insight: Integration Guide

Deployment scenarios for Operations Management:
In a deployment of Operations Management on premises a number of deploymentscenarios are available, providing low to very high event volumes.
Deployment considerations for Operations Management:
The desired volume of events determines whether a basic, failover, or desktoparchitecture or a multitier architecture is deployed. The Gateway for Message Buscan be configured to support event inserts only or both inserts and reinserts.
The following explains the architecture and event volume, and the event analysiscapacity of Operations Analytics - Log Analysis in more detail.
Note: Operations Analytics - Log Analysis Standard Edition is included in NetcoolOperations Insight. For more information about Operations Analytics - LogAnalysis editions, search for "Editions" at the Operations Analytics - Log AnalysisKnowledge Center, at https://www.ibm.com/support/knowledgecenter/SSPFMY.
Event volumeEvent inserts are the first occurrence of each event and reinserts are everyoccurrence of each event. By default, the Gateway for Message Bus isconfigured to accept only event inserts from ObjectServers through anIDUC channel. To support event inserts and reinserts, you can configureevent forwarding through the Accelerated Event Notification (AEN) client.
Note: Event Search functionality varies as follows depending on the choiceof channel:v IDUC channel: Event Search functionality is limited. Chart display
functionality is fully available, but you will not be able to perform adeep dive into events or search for event modifications.
v AEN channel: All Event Search functionality is available. However, aspart of your Netcool/OMNIbus configuration you will also have toinstall triggers in the ObjectServer.
For more information, search for Integrating with Operations Analytics - LogAnalysis in the IBM Tivoli Netcool/OMNIbus Gateway for Message BusReference Guide.
Architecture of Netcool/OMNIbusBasic, failover, and desktop architectures support low and mediumcapacity for analyzing events. Multitiered architectures support higherOperations Analytics - Log Analysis capacities. In a multitier architecture,the connection to the Gateway for Message Bus supports higher capacity atthe collection layer than at the aggregation layer.
For more information about these architectures, see the IBM TivoliNetcool/OMNIbus Installation and Deployment Guide and also theNetcool/OMNIbus Best Practices Guide.
Capacity of Operations Analytics - Log AnalysisThe capacity of the Operations Analytics - Log Analysis product to handleevent volumes. For the hardware levels that are required for expectedevent volumes, see the Operations Analytics - Log Analysis documentationat http://www-01.ibm.com/support/knowledgecenter/SSPFMY/welcome.If capacity is limited, you can use the deletion tool to remove old data.
Connection layerThe connection layer is the layer of the multitier architecture to which the
Solution overview 25

Gateway for Message Bus is connected. This consideration applies onlywhen the Netcool/OMNIbus product is deployed in a multitierarchitecture. The connection layer depends on the capacity of OperationsAnalytics - Log Analysis. For more information about multitierarchitectures, see the IBM Tivoli Netcool/OMNIbus Installation andDeployment Guide and also the Netcool/OMNIbus Best Practices Guide.
On-premises scenarios for Operations Management:
This topic presents the scenarios available in a deployment of OperationsManagement together with the associated architectures.
The deployment scenarios and associated architecture diagrams are shown below.v “Deployment scenarios”v “Illustrations of architectures” on page 28
Deployment scenarios
This section describes possible deployment scenarios.v “Deployment scenario 1: low capacity with IDUC channel”v “Deployment scenario 2: medium capacity with AEN channel”v “Deployment scenario 3: medium capacity with IDUC channel” on page 27v “Deployment scenario 4: high capacity with IDUC channel” on page 27v “Deployment scenario 5: high capacity with AEN channel” on page 27v “Deployment scenario 6: very high capacity with AEN channel” on page 27
Deployment scenario 1: low capacity with IDUC channel
Table 2. Inserts only, standard architecture, low capacity
Eventvolume
ArchitectureofNetcool/OMNIbus
Capacity ofOperationsAnalytics -LogAnalysis
Connectionlayer
IDUC or AEN Illustration ofthisarchitecture
Inserts only Basic,failover, anddesktoparchitecture
Low Not applicable IDUC See Figure 4on page 28.Disregard thereference toreinserts initem ▌1▐.
Deployment scenario 2: medium capacity with AEN channel
Table 3. Inserts and reinserts, standard architecture, medium capacity
Eventvolume
ArchitectureofNetcool/OMNIbus
Capacity ofOperationsAnalytics -LogAnalysis
Connectionlayer
IDUC or AEN Illustration ofthisarchitecture
Inserts andreinserts
Basic,failover, anddesktoparchitecture
Medium Not applicable AEN See Figure 4on page 28.
26 IBM Netcool Operations Insight: Integration Guide

Deployment scenario 3: medium capacity with IDUC channel
Table 4. Inserts only, multitier architecture, medium capacity
Eventvolume
ArchitectureofNetcool/OMNIbus
Capacity ofOperationsAnalytics -LogAnalysis
Connectionlayer
IDUC or AEN Illustration ofthisarchitecture
Inserts only Multitier Medium Aggregationlayer
IDUC See Figure 5on page 29.Disregard thereference toreinserts initem ▌1▐.
Deployment scenario 4: high capacity with IDUC channel
Table 5. Inserts only, multitier architecture, high capacity
Eventvolume
ArchitectureofNetcool/OMNIbus
Capacity ofOperationsAnalytics -LogAnalysis
Connectionlayer
IDUC or AEN
Inserts only Multitier High Collectionlayer
IDUC See Figure 6on page 30.Disregard thereference toreinserts initem ▌1▐.
Deployment scenario 5: high capacity with AEN channel
Table 6. Inserts and reinserts, multitier architecture, high capacity
Eventvolume
ArchitectureofNetcool/OMNIbus
Capacity ofOperationsAnalytics -LogAnalysis
Connectionlayer
IDUC or AEN
Inserts andreinserts
Multitier High Aggregationlayer
AEN See Figure 5on page 29.
Deployment scenario 6: very high capacity with AEN channel
Table 7. Inserts and reinserts, multitier architecture, very high capacity
Eventvolume
ArchitectureofNetcool/OMNIbus
Capacity ofOperationsAnalytics -LogAnalysis
Connectionlayer
IDUC or AEN
Inserts andreinserts
Multitier Very high Collectionlayer
AEN See Figure 6on page 30.
Solution overview 27

Illustrations of architectures
The following sections show the architecture of Operations Analytics - LogAnalysis deployments and how they fit into the various architectures ofNetcool/OMNIbus deployments with the Gateway for Message Bus.
The data source that is described in the figures is the raw data that is ingested bythe Operations Analytics - Log Analysis product. You define it when you configurethe integration between the Operations Analytics - Log Analysis andNetcool/OMNIbus products.v “Basic, failover, and desktop architectures”v “Multitier architecture, events are sent from the Aggregation layer” on page 29v “Multitier architecture, events are sent from the Collection layer” on page 30
Basic, failover, and desktop architectures
The following figure shows how the integration works in a basic, failover, ordesktop Netcool/OMNIbus architecture. This figure is an illustration of thearchitectures that are described in Table 2 on page 26 and Table 3 on page 26. Inthe case of the architecture in Table 2 on page 26, disregard item ▌1▐ in this figure.
Figure 4. Basic, failover, and desktop deployment architecture
28 IBM Netcool Operations Insight: Integration Guide

Multitier architecture, events are sent from the Aggregation layer
The following figure shows how the integration works in a multitierNetcool/OMNIbus architecture, with events sent from the Aggregation layer. Thisfigure is an illustration of the architectures that are described in Table 4 on page 27and Table 6 on page 27. In the case of the architecture in Table 4 on page 27,disregard item ▌1▐ in this figure.
Figure 5. Multitier architecture deployment - Aggregation layer
Solution overview 29

Multitier architecture, events are sent from the Collection layer
The following figure shows how the integration works in a multitierNetcool/OMNIbus architecture, with events sent from the Collection layer. This isa best practice for integrating the components. This figure is an illustration of thearchitectures that are described in Table 5 on page 27 and Table 7 on page 27. Inthe case of the architecture in Table 5 on page 27, disregard item ▌1▐ in this figure.
Related concepts:
Overview of the standard multitiered architecture
Overview of the AEN clientRelated tasks:
Sizing your Tivoli Netcool/OMNIbus deployment
Configuring and deploying a multitiered architecture“Installing Netcool/OMNIbus and Netcool/Impact” on page 49Related reference:
Failover configuration
Example Tivoli Netcool/OMNIbus installation scenarios (basic, failover, anddesktop architectures)Related information:
Message Bus Gateway documentation
IBM Operations Analytics - Log Analysis documentation
IBM developerWorks: Tivoli Netcool OMNIbus Best Practices
Figure 6. Multitier architecture deployment - Collection layer (best practice)
30 IBM Netcool Operations Insight: Integration Guide

Deployment considerations for Network ManagementNetworks for Operations Insight is an optional feature that integrates networkmanagement products with the products of the base Netcool Operations Insightsolution.
The Networks for Operations Insight feature includes Network Manager IP Editionand Netcool Configuration Manager. Deploying these products depends on yourenvironment and the size and complexity of your network. For guidance ondeployment options, see guidance provided in the respective productdocumentation:v Network Manager IP Edition: https://www.ibm.com/support/
knowledgecenter/SSSHRK_4.2.0/overview/concept/ovr_deploymentofitnm.htmlv Netcool Configuration Manager: http://www-01.ibm.com/support/
knowledgecenter/SS7UH9_6.4.2/ncm/wip/planning/concept/ncm_plan_planninginstallation.html
Which documentation do I need?The documentation for the Netcool Operations Insight solution describes scenariosfor a fresh installation and upgrades from various existing environments, invarying levels of detail. You do not need to read the entire documentation set tounderstand how to get started with Netcool Operations Insight. Check here whichdocumentation applies best to your environment and read only the documentationthat is useful to you.
The following table describes the installation and upgrade scenarios that are in thisdocumentation and links to each section.
Table 8. Sections of the documentation for installation and upgrade scenarios
Install or upgrade Scenario Described here
Fresh installation: no existingproducts in the environment
At-a-glance overview, for aproof of concept
Quick Start Guide
Quick reference, tounderstand in more detailthe tasks involved ininstalling Netcool OperationsInsight
“Quick reference toinstalling” on page 35
End-to-end overview ofinstalling all the productsand components in NetcoolOperations Insight, in therecommended order
Performing a freshinstallation
Upgrade from previousversions
End-to-end overview ofupgrading all the productsand components in NetcoolOperations Insight fromV1.4.0.5, in the recommendedorder
“Upgrading to the latestNetcool Operations Insight”on page 101
The following table shows which documentation to read if you want to find outhow to set up one of the individual capabilities that is included in NetcoolOperations Insight.
Solution overview 31

Table 9. Scenarios for setting up Netcool Operations Insight capabilities. Scenarios forsetting up Netcool Operations Insight capabilities
Capability Scenario Link
Event search Installing or upgrading theInsight Pack
“Installing the TivoliNetcool/OMNIbus InsightPack” on page 55
Configuring the capability “Configuring event search”on page 121
Event analytics Adding a new eventanalytics to an existingenvironment
“Installing Event Analytics”on page 141
Upgrading an existing eventanalytics
“Upgrading Event Analytics”on page 145
Networks for OperationsInsight
Adding Networks forOperations Insight to anexisting environment
“Installing NetworkManagement” on page 57
Topology search Installing the Insight Pack “Installing the NetworkManager Insight Pack” onpage 90
Configuring the capability “Configuring topologysearch” on page 374
Integration with IBMConnections
Configuring the capability “Configuring integration toIBM Connections” on page381
Network Performance Insight Network Performance Insight is a network trafficperformance monitoring system. It provides comprehensiveand scalable visibility on network traffic with visualizationand reporting of network performance data for complex,multivendor, multi-technology networks. The end user isable to perform the following tasks: visualize flow acrossselected interfaces, display performance anomaly events inthe Tivoli Netcool/OMNIbus Event Viewer, and viewperformance anomaly and performance timeline data in theDevice Dashboard. For more information, seehttp://www-01.ibm.com/support/knowledgecenter/SSCVHB/welcome.
Agile Service Manager Agile Service Manager provides operations teams withcomplete up-to-date visibility and control over dynamicinfrastructure and services. Agile Service Manager lets youquery a specific networked resource, and then presents aconfigurable topology view of it within its ecosystem ofrelationships and states, both in real time and within adefinable time window. For more information, seehttps://www-01.ibm.com/support/knowledgecenter/SS9LQB.
IBM Alert Notification IBM Alert Notification provides instant notification of alertsfor any critical IT issues across multiple monitoring tools. Itgives IT staff instant notification of alerts for any issues inyour IT operations environment. For more information, seehttp://www-01.ibm.com/support/knowledgecenter/SSY487/com.ibm.netcool_OMNIbusaas.doc_1.2.0/landingpage/product_welcome_alertnotification.html.
32 IBM Netcool Operations Insight: Integration Guide
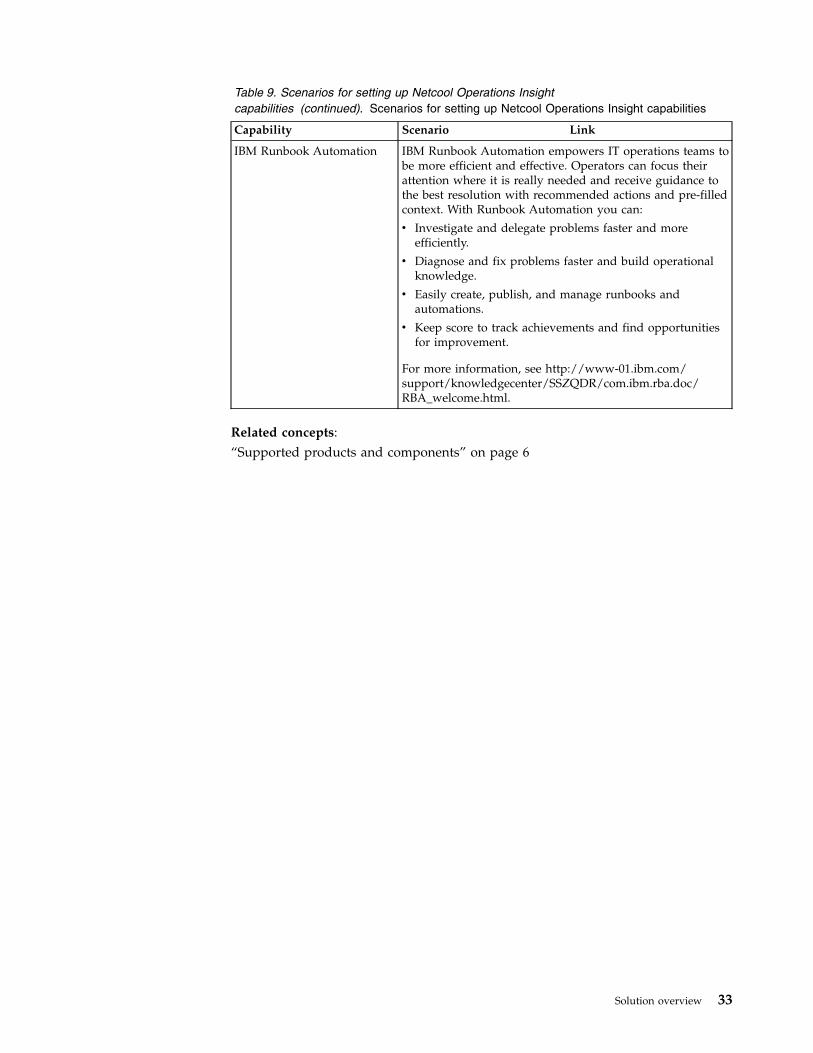
Table 9. Scenarios for setting up Netcool Operations Insightcapabilities (continued). Scenarios for setting up Netcool Operations Insight capabilities
Capability Scenario Link
IBM Runbook Automation IBM Runbook Automation empowers IT operations teams tobe more efficient and effective. Operators can focus theirattention where it is really needed and receive guidance tothe best resolution with recommended actions and pre-filledcontext. With Runbook Automation you can:
v Investigate and delegate problems faster and moreefficiently.
v Diagnose and fix problems faster and build operationalknowledge.
v Easily create, publish, and manage runbooks andautomations.
v Keep score to track achievements and find opportunitiesfor improvement.
For more information, see http://www-01.ibm.com/support/knowledgecenter/SSZQDR/com.ibm.rba.doc/RBA_welcome.html.
Related concepts:“Supported products and components” on page 6
Solution overview 33

34 IBM Netcool Operations Insight: Integration Guide

Installing Netcool Operations Insight
Plan the installation and complete any pre-installation tasks before installingNetcool Operations Insight.
About this task
This chapter consists of the following sections:
“Planning for installation” on page 41“Downloading Netcool Operations Insight components” on page 48“Installing Operations Management” on page 48
Important: The sections in this guide that deal with Operations Management onIBM Cloud Private include links to version 2.1.0.1 of IBM Cloud Privatedocumentation on the IBM Knowledge Center, as that was the latest versionavailable when this guide was published. We recommend using the latest versionof the IBM Cloud Private documentation, so always check if there is a later versionthan V2.1.0.1.Related concepts:“Deployment scenarios” on page 24
Quick reference to installingUse this information as a quick reference if you are new to Netcool OperationsInsight and want to perform an installation from scratch. This overview assumesdetailed knowledge of the products in Netcool Operations Insight. It does notprovide all the details. Links are given to more information, either within theNetcool Operations Insight documentation, or in the product documentation of theconstituent products of Netcool Operations Insight.
This topic lists the high-level steps for installing Netcool Operations Insight. Formore information about where to download the documentation as PDF files, see“Where to obtain PDF publications” on page 40.
“Installing Operations Management”“Installing Network Management” on page 37“Installing Performance Management” on page 39“Installing Service Management” on page 40
Installing Operations Management
You can install Operations Management on premises.
“Installing Operations Management on premises”
Installing Operations Management on premises
The following table lists the high-level steps for installing Operations Managementon premises.
For information on the product and component versions to install, including whichfix packs to apply, see “Supported products and components” on page 6.
© Copyright IBM Corp. 2014, 2018 35

Tip: To verify the versions of installed packages, select View Installed Packagesfrom the File menu on the main IBM Installation Manager screen.
Table 10. Quick reference for installing Operations Management on premises
Item Action More information
1 Prepare for the installation by checkingthe prerequisites.
For information about hardware and software compatibility ofeach component, and detailed system requirements, see the IBMSoftware Product Compatibility Reports website:http://www-969.ibm.com/software/reports/compatibility/clarity/index.html
“Checking prerequisites” on page 42
2 Install IBM Installation Manager on eachhost where components of the NetcoolOperations Insight are to be installed.
Installation Manager is included in thecompressed file distribution of IBM TivoliNetcool/OMNIbus and OperationsAnalytics - Log Analysis. DownloadInstallation Manager separately if you areinstalling directly from an IBM repositoryor from a local repository. If you need toinstall Installation Manager separately,you can download it from IBM FixCentral.
http://www.ibm.com/support/fixcentral/
“Obtaining IBM Installation Manager” on page 44
“Installing Installation Manager (GUI or console example)” onpage 46
3 Install the Netcool/OMNIbus corecomponents, and apply the latestsupported fix pack. Associated tasksinclude creating and startingObjectServers, and setting up failover or amultitier architecture.
“Installing Netcool/OMNIbus and Netcool/Impact” on page 49
See “Supported products and components” on page 6 for latestsupported fix packs.
See the IBM Tivoli Netcool/OMNIbus Installation and DeploymentGuide.
4 Install the DB2 database. Apply theREPORTER schema.
“Installing DB2 and configuring the REPORTER schema” on page50
5 Install the Gateway for JDBC and theGateway for Message Bus. See the IBM Tivoli Netcool/OMNIbus Gateway for JDBC Reference
Guide and the IBM Tivoli Netcool/OMNIbus Gateway for Message BusReference Guide.
6 Install Netcool/Impact, and apply thelatest supported fix pack.
“Installing Netcool/OMNIbus and Netcool/Impact” on page 49
See “Supported products and components” on page 6 for latestsupported fix packs.
See the IBM Tivoli Netcool/Impact Netcool/Impact Installation Guide.
7 Configure the ObjectServer to support therelated events function of the EventAnalytics capability. Run the nco_sqlutility against therelatedevents_objectserver.sql file,which is delivered with Netcool/Impact.
“Configuring the Event Analytics ObjectServer” on page 238
8 Install a supported version of IBMOperations Analytics - Log Analysis.Create a data source called “omnibus”.
http://www-01.ibm.com/support/knowledgecenter/SSPFMY/welcome
See step 3 on page 122 in “Configuring event search” on page 121.
See “Supported products and components” on page 6 forsupported versions.
36 IBM Netcool Operations Insight: Integration Guide

Table 10. Quick reference for installing Operations Management on premises (continued)
Item Action More information
9 Configure the Gateway for Message Busas the interface between the ObjectServerand Operations Analytics - Log Analysis.Optionally configure the AcceleratedEvent Notification Client if you do notwant to use the default IDUC channel.
“Configuring the Gateway for JDBC and Gateway for MessageBus” on page 52
See the IBM Tivoli Netcool/OMNIbus Gateway for Message BusReference Guide.
10 To support Event Search, install the latestsupported version of TivoliNetcool/OMNIbus Insight Pack.
See the OMNIbusInsightPack_v1.3.0.2 READMENote: You can install both insight packs later, see step 18.
See “Supported products and components” on page 6 for latestsupported versions.
11 Install the Netcool/OMNIbus Web GUI,and apply the latest supported fix pack.
During the installation, ensure that thelatest supported versions are selected forthe following components, based on theinformation in “Supported products andcomponents” on page 6:
v IBM WebSphere® Application Server.
v Jazz for Service Management.
v Netcool/OMNIbus Web GUI
In addition, make the following selectionsduring the installation:
v When installing Jazz for ServiceManagement, Installation Managerdiscovers two required packages in theJazz™ repository. Select the Jazz forService Management extension for IBMWebSphere V8.5 and DashboardApplication Services Hub V3.1.3.0packages for installation.
v IBM WebSphere SDK Java TechnologyEdition V7.0.x.
v Install the Netcool Operations InsightExtensions for IBM TivoliNetcool/OMNIbus Web GUI feature.To install Event Analytics withseasonality reporting, ensure thatinstall Event Analytics is selected.
“Installing Dashboard Application Services Hub and the UIcomponents” on page 53
See “Installing Dashboard Application Services Hub and the UIcomponents” on page 53 and also the IBM Tivoli Netcool/OMNIbusInstallation and Deployment Guide.
See “Supported products and components” on page 6 for latestsupported fix packs.
12 Configure the Web GUI for integrationwith Operations Analytics - Log Analysis.In the server.init file, set the scala.*properties appropriately.
See “Installing Dashboard Application Services Hub and the UIcomponents” on page 53 and also the IBM Tivoli Netcool/OMNIbusInstallation and Deployment Guide.
Back to top
Installing Network Management
The following table lists the high-level steps for installing Network Management.
Installing 37

For information on the product and component versions to install, including whichfix packs to apply, see “Supported products and components” on page 6.
Tip: To verify the versions of installed packages, select View Installed Packagesfrom the File menu on the main IBM Installation Manager screen.
Table 11. Quick reference for installing Network Management
Item Action More information
1 Installing the Probe for SNMP and SyslogProbe for Network Manager
“Installing the Probe for SNMP and Syslog Probe” on page 58
2 Optional: Configure the ObjectServer forintegration with Network Manager byobtaining the ConfigOMNI script from theNetwork Manager installation packageand running it against the ObjectServer.
See “Optional: Preparing the ObjectServer for integration withNetwork Manager” on page 59 and also the IBM Tivoli NetworkManager IP Edition Installation and Configuration Guide.Important: If you have already installed TivoliNetcool/OMNIbus, the Netcool/OMNIbus Knowledge Library,and the Probe for SNMP, you can now install Network Manager,and do not need to follow the steps in this task. The NetworkManager installer configures Tivoli Netcool/OMNIbus for youduring the installation process. If the ObjectServer setup changesafter you have already installed and configured Network Managerand Tivoli Netcool/OMNIbus, then you must reintegrate theObjectServer with Network Manager as described in this topic.
3 Prepare the topology database for use byNetwork Manager
“Preparing the database for Network Manager” on page 60
4 Install Network Manager core and GUIcomponents, and apply the latestsupported fix pack.
“Installing Network Manager IP Edition and NetcoolConfiguration Manager” on page 61
See “Supported products and components” on page 6 for latestsupported fix packs.
See the IBM Tivoli Network Manager IP Edition Installation andConfiguration Guide.
5 Install and configure NetcoolConfiguration Manager and apply thelatest supported fix pack. This involvesconfiguring the integration with NetworkManager.
“Installing Network Manager IP Edition and NetcoolConfiguration Manager” on page 61
“Configuring integration with Netcool Configuration Manager”on page 66
For more information about fix packs for Netcool ConfigurationManager 6.4.2 , see https://www.ibm.com/support/knowledgecenter/SS7UH9_6.4.2/ncm/wip/relnotes/ncm_rn_top.html.
See “Supported products and components” on page 6 for latestsupported fix packs.
See the IBM Tivoli Netcool Configuration Manager Installation andConfiguration Guide and the IBM Tivoli Netcool ConfigurationManager Integration Guide.
6 To support Topology Search, install thelatest supported version of NetworkManager Insight Pack and configure theconnection to the NCIM topologydatabase.
“Network Manager Insight Pack” on page 372
See the Network Manager Insight Pack V1.3.0.0 README.Note: To install both insight packs at this stage, see summary taskInstalling the Insight Packs.
See “Supported products and components” on page 6 for latestsupported versions.
38 IBM Netcool Operations Insight: Integration Guide

Table 11. Quick reference for installing Network Management (continued)
Item Action More information
7 Configure the topology search capability.Run nco_sql against thescala_itnm_configuration.sql file, whichis delivered in the Netcool/OMNIbus fixpack.
Install the tools and menus to launch thecustom apps of the Network ManagerInsight Pack in the Operations Analytics -Log Analysis UI from the Web GUI.
“Configuring topology search” on page 374
8 Configure the Web GUI to launch thecustom apps of the Network ManagerInsight Pack from the event lists.
See step 3 on page 376 of “Configuring topology search” on page374.
Back to top
Installing Performance Management
The following table lists the high-level steps for installing PerformanceManagement.
For information on the product and component versions to install, including whichfix packs to apply, see “Supported products and components” on page 6.
Tip: To verify the versions of installed packages, select View Installed Packagesfrom the File menu on the main IBM Installation Manager screen.
Table 12. Quick reference for installing Performance Management
Item Action More information
1 To add the performance managementfeature, set up Network PerformanceInsight and follow the steps forintegrating it with Netcool/OMNIbus andNetwork Manager.
“Installing Performance Management” on page 93
2 Install and configure the DeviceDashboard to view performanceinformation.
“Installing the Device Dashboard” on page 95
Back to top
Installing 39

Installing Service Management
The following table lists the high-level steps for installing Service Management.
Table 13. Quick reference for installing Service Management
Item Action More information
1 To add the service management feature,install the Agile Service Manager core,observers, and UI, and then follow thesteps for integrating the observers:
v Integrate the Event Observer with theNetcool/OMNIbus gateway.
v Integrate the ITNM Observer with theNetwork Manager ncp_model Topologymanager process.
“Installing Agile Service Manager” on page 98
Back to top
Where to obtain PDF publications
You can obtain Netcool Operations Insight publications, including the Insight PackREADMEs, in PDF format from http://www-01.ibm.com/support/knowledgecenter/SSTPTP_1.4.0.1/soc/integration/reference/soc_ref_PDFbooks.html.
You can obtain IBM Tivoli Netcool/OMNIbus and Web GUI publications from theFTP download site at ftp://public.dhe.ibm.com/software/tivoli/Netcool/NetcoolOmnibus/.
You can obtain IBM Tivoli Netcool/OMNIbus gateway publications from IBMKnowledge Center at https://ibm.biz/BdE7Lv. Click the entry in the table ofcontents for the gateway that you required, for example Gateway for JDBC andthen click PDF version.
You can obtain Netcool/Impact publications from the Netcool/Impact wiki athttps://ibm.biz/BdE79r.
The Operations Analytics - Log Analysis documentation is available from IBMKnowledge Center only. However, you can use the My Collections function tosave the documentation and download it as a PDF. For an example of how to dothis, see Creating your own PDF of a subset of topics using My Collections.
You can obtain Network Manager publications from https://www.ibm.com/support/knowledgecenter/SSSHRK_4.2.0/common/reference/ref_pdfbookset.html.
You can obtain Netcool Configuration Manager publications from the IBMKnowledge Center at http://www-01.ibm.com/support/knowledgecenter/SS7UH9_6.4.2/ncm/wip/common/reference/ncm_ref_PDFdocset.dita.
40 IBM Netcool Operations Insight: Integration Guide

Planning for installationRead about deployment considerations and system requirements for NetworkManager.
Planning for an on-premises installationPrepare of an on-premises installation of base Netcool Operations Insight and ofNetcool Operations Insight solution extensions.
About this task
Procedure
Ports used by products and componentsUse this information to understand which ports are used by the different productsand components that make up the Netcool Operations Insight solution.
The following table lists sample ports that you might need to configure, andprovides links to Netcool Operations Insight product and componentdocumentation where you can access detailed information.
Table 14. Default port information
Product Example default ports Links
Netcool/OMNIbus Aggregation ObjectServer primaryport
Process agent ports
Gateway server port
IBM Eclipse Help System server port
Port numbers for individualNetcool/OMNIbus probes
ObjectServer ports can be configuredusing the Netcool Configurationwizard. See http://ibm.biz/BdskVc.
Default ports used byNetcool/OMNIbus. Seehttp://ibm.biz/BdskVr.
Ports for a Netcool/OMNIbus basicarchitecture. See http://ibm.biz/BdsWi9.
Ports for a Netcool/OMNIbus basicfailover architecture. Seehttp://ibm.biz/BdsWqw.
Ports for a Netcool/OMNIbusdesktop server architecture. Seehttp://ibm.biz/BdsWqt.
Netcool/OMNIbus Web GUI Jazz for Service Management WASprofile
v HTTP port
v HTTPS port
Jazz for Service Management portavailability requirements. Seehttp://ibm.biz/BdsWzf.
Firewall Ports to open for DASHServices. See http://www-01.ibm.com/support/docview.wss?uid=swg21687730 for atechnote.
Installing 41

Table 14. Default port information (continued)
Product Example default ports Links
Netcool/Impact Netcool/Impact server
v HTTP port
v HTTPS port
Netcool/Impact GUI
v HTTP port
v HTTPS port
Assigning Netcool/Impact ports. Seehttp://ibm.biz/BdsWyK.
Assigning Netcool/Impact datasource and service ports. Seehttp://ibm.biz/BdsWyG.
Note: It is not possible to installNetcool/Impact GUI and Jazz forService Management using the samedefault port numbers (16310/16311)on the same server. In this case youmust modify the port numbersduring installation.
Operations Analytics - Log Analysis Application WebConsole Port
Application WebConsole Secure Port
Database Server Port
Data Collection Server Port
Default ports used by OperationsAnalytics - Log Analysis:
v V1.3.5: see http://ibm.biz/BdsWyn.
v V1.3.3: see http://ibm.biz/BdiyPy
DB2 Enterprise Server Editiondatabase
Port 50000.Note: This port is also configurablefollowing installation.
Network Performance Insight Ports must be assigned for thefollowing Network PerformanceInsight components:
v Ambari Metrics
v Hadoop Distributed File System(HDFS)
v Apache Kafka
Default ports used by NetworkPerformance Insight:
v V1.2.2: see http://ibm.biz/BdjABs
v V1.2.1: see http://ibm.biz/Bdih2W
Related concepts:“Installing DB2 and configuring the REPORTER schema” on page 50Related tasks:“Installing Netcool/OMNIbus and Netcool/Impact” on page 49“Installing IBM Operations Analytics - Log Analysis” on page 51“Installing Network Performance Insight” on page 93
Checking prerequisitesBefore you install each product, run the IBM Prerequisite Scanner (PRS) to ensurethat the target host is suitable, and no installation problems are foreseeable. Alsocheck the maxproc and ulimit settings on the servers you are configuring to ensurethey are set to the appropriate minimum values.
Before you beginv For information about hardware and software compatibility of each component,
and detailed system requirements, see the IBM Software Product CompatibilityReports website: http://www-969.ibm.com/software/reports/compatibility/clarity/index.html
Tip: When you create a report, search for Netcool Operations Insight and selectyour version (for example, V1.4). In the report, additional useful information is
42 IBM Netcool Operations Insight: Integration Guide

available through hover help and additional links.For example, to check the compatibility with an operating system for eachcomponent, go to the Operating Systems tab, find the row for your operatingsystem, and hover over the icon in the Components column. For more detailedinformation about restrictions, click the View link in the Details column.
v Download IBM Prerequisite Scanner from IBM Fix Central athttp://www.ibm.com/support/fixcentral/. Search for “IBM PrerequisiteScanner”.
v After you download the latest available version, decompress the .tar archiveinto the target directory on all hosts.
v On the IBM Tivoli Netcool/Impact host, set the environment variableIMPACT_PREREQ_BOTH=True so that the host is scanned for both the Impact Serverand the GUI Server.
For a list of all product codes, see http://www.ibm.com/support/docview.wss?uid=swg27041454
About this task
Operations Analytics - Log Analysis and IBM DB2 are not supported by IBMPrerequisite Scanner. For the installation and system requirements for theseproducts, refer to the documentation.
Procedure
Using the IBM Prerequisite Scannerv On the IBM Tivoli Netcool/OMNIbus and IBM Tivoli Netcool/Impact host, run
IBM Prerequisite Scanner as follows:
Product Command
IBM Tivoli Netcool/OMNIbus prereq_checker.sh NOC detail
IBM Tivoli Netcool/Impact prereq_checker.sh NCI detail
v On the host for the GUI components:
Product Command
Jazz for Service Management prereq_checker.sh ODP detail
Dashboard Application Services Hub prereq_checker.sh DSH detail
IBM Tivoli Netcool/OMNIbus Web GUI prereq_checker.sh NOW detail
v On the Networks for Operations Insight host
Product Command
IBM Tivoli Network Manager prereq_checker.sh TNM detail
IBM Tivoli Netcool Configuration Manager prereq_checker.sh NCM detail
Tivoli Common Reporting prereq_checker.sh TCR detail
Check the maxproc settings.v Open the following file: /etc/security/limits.d/90-nproc.confv Set nproc to a value of 131073Check the ulimit settings.v Open the following file: /etc/security/limits.conf
Installing 43

v Set nofile to a value of 131073Related tasks:
Installation prerequisites for Operations Analytics - Log Analysis V1.3.5
Installation prerequisites for Operations Analytics - Log Analysis V1.3.3
System requirements for DB2 products
Installation requirements for DB2 products
Obtaining IBM Installation ManagerPerform this task only if you are installing directly from an IBM repository or alocal repository. IBM Installation Manager is required on the computers that hostNetcool/OMNIbus, Netcool/Impact, Operations Analytics - Log Analysis, and theproducts and components that are based on Dashboard Application Services Hub.In this scenario, that is servers 1, 2, and 3. The installation packages of theproducts include Installation Manager.
Before you begin
Create an IBM ID at http://www.ibm.com. You need an IBM ID to downloadsoftware from IBM Fix Central.
Note:
On Red Hat Enterprise Linux, the GUI mode of the Installation Manager uses thelibcairo UI libraries. The latest updates for RHEL 6 contain a known issue thatcauses the Installation Manager to crash. Before installingInstallation Manager onRed Hat Enterprise Linux 6, follow the instructions in the following technote toconfigure libcairo UI libraries to a supported version: http://www.ibm.com/support/docview.wss?uid=swg21690056
Remember: The installation image of Netcool/OMNIbus V8.1.0 available fromIBM Passport Advantage and on DVD includes Installation Manager. You onlyneed to download Installation Manager separately if you are installingNetcool/OMNIbus directly from an IBM repository or from a local repository.
You can install Installation Manager in one of three user modes: Administratormode, Nonadministrator mode, or Group mode. The user modes determine whocan run Installation Manager and where product data is stored. The following tableshows the supported Installation Manager user modes for products in IBM NetcoolOperations Insight.
Table 15. Supported Installation Manager user modes
Product Administrator modeNonadministrator
modeGroup mode
IBM TivoliNetcool/OMNIbus(IncludesOMNIbus Core,Web GUI, and theGateways.)
X X X
IBM TivoliNetcool/Impact
X X X
44 IBM Netcool Operations Insight: Integration Guide

Table 15. Supported Installation Manager user modes (continued)
Product Administrator modeNonadministrator
modeGroup mode
IBM OperationsAnalytics - LogAnalysis (InsightPacks areinstalled by theOperationsAnalytics - LogAnalysispkg_mgmtcommand.)
X
Procedure
The IBM Fix Central website offers two approaches to finding product files: Selectproduct and Find product. The following instructions apply to the Find productoption.1. Go to IBM Fix Central at http://www.ibm.com/support/fixcentral/ and search
for IBM Installation Manager.a. On the Find product tab, enter IBM Installation Manager in the Product
selector field.b. Select V1.8.2.1 (or later) from the Installed Version list.c. Select your intended host operating system from the Platform list and click
Continue.2. On the Identity Fixes page, choose Browse for fixes and Show fixes that apply
to this version (1.X.X.X). Click Continue.3. On the Select Fixes page, select the installation file appropriate to your
intended host operating system and click Continue.4. When prompted, enter your IBM ID and password.5. If your browser has Java™ enabled, choose the Download Director option.
Otherwise, select the HTTP download option.6. Start the installation file download. Make a note of the download location.
What to do next
Install Installation Manager. See http://www.ibm.com/support/docview.wss?uid=swg24034941.Related information:
IBM Installation Manager overview
Installing 45
Installing Installation Manager (GUI or console example)You can install Installation Manager with a wizard-style GUI or an interactiveconsole, as depicted in this example.
Before you begin
Take the following actions:v Extract the contents of the Installation Manager installation file to a suitable
temporary directory.v Ensure that the necessary user permissions are in place for your intended
installation, data, and shared directories.v The console installer does not report required disk space. Ensure that you have
enough free space before you start a console installation.
Before you run the Installation Manager installer, create the following targetdirectories and set the file permissions for the designated user and group thatInstallation Manager to run as, and any subsequent product installations:
Main installation directoryLocation to install the product binary files.
Data directoryLocation where Installation Manager stores information about installedproducts.
Shared directoryLocation where Installation Manager stores downloaded packages that areused for rollback.
Ensure that these directories are separate. For example, run the followingcommands:mkdir /opt/IBM/NetcoolIMmkdir /opt/IBM/NetcoolIM/IBMIMmkdir /opt/IBM/NetcoolIM/IBMIMDatamkdir /opt/IBM/NetcoolIM/IBMIMSharedchown -R netcool:ncoadmin /opt/IBM/NetcoolIM
About this task
The initial installation steps are different depending on which user mode you use.The steps for completing the installation are common to all user modes andoperating systems.
Installation Manager takes account of your current umask settings when it sets thepermissions mode of the files and directories that it installs. Using Group mode,Installation Manager ignores any group bits that are set and uses a umask of 2 ifthe resulting value is 0.
Procedure1. Install in Group mode:
a. Use the id utility to verify that your current effective user group is suitablefor the installation. If necessary, use the following command to start a newshell with the correct effective group:newgrp group_name
b. Use the umask utility to check your umask value. If necessary, change theumask value.
46 IBM Netcool Operations Insight: Integration Guide

c. Change to the temporary directory that contains the Installation Managerinstallation files.
d. Use the following command to start the installation:
GUI installation./groupinst -dL data_location
Console installation./groupinstc -c -dL data_location
In this command, data_location specifies the data directory. Youmust specify a data directory that all members of the group canaccess.
Remember: Each instance of Installation Manager requires adifferent data directory.
2. Follow the installer instructions to complete the installation. The installerrequires the following input at different stages of the installation:
GUI installation
v In the first page, select the Installation Manager package.v Read and accept the license agreement.v When prompted, enter an installation directory or accept the default
directory.v Verify that the total installation size does not exceed the available
disk space.v When prompted, restart Installation Manager.
Console installation
v Read and accept the license agreement.v When prompted, enter an installation directory or accept the default
directory.v If required, generate a response file. Enter the directory path and a
file name with a .xml extension. The response file is generated beforeinstallation completes.
v When prompted, restart Installation Manager.
Results
Installation Manager is installed and can now be used to install IBM NetcoolOperations Insight.
Note: If it is not possible for you to install Netcool Operations Insight componentsin GUI mode (for example, security policies at your site might limit the display ofGUI pages) then you can use the Installation Manager web application to installthe Netcool Operations Insight base solution components, which are as follows:v IBM Tivoli Netcool/OMNIbus core componentsv IBM Tivoli Netcool/OMNIbus 8 Plus Gateway for Message Busv Tivoli Netcool/OMNIbus Web GUI and the Web GUI extensions for Event
Analyticsv IBM Tivoli Netcool/Impact and the Netcool/Impact extensions for Event
Analytics
However, note that the following Netcool Operations Insight base solutioncomponents cannot be installed by using the Installation Manager web application:
Installing 47

v Dashboard Application Services Hubv Operations Analytics - Log Analysis
Dashboard Application Services Hub also cannot be installed in console mode.
What to do next
If required, add the Installation Manager installation directory path to your PATHenvironment variable.Related information:
IBM Installation Manager V1.8.5 documentation: Working from a web browser
Downloading Netcool Operations Insight components
1.4.1.2
You need to download the products that make up the Netcool Operations Insightsolution from different locations.
About this task
Refer to the following webpage for information on where to obtain downloads foreach product and component.
https://www.ibm.com/developerworks/community/wikis/home?lang=en#!/wiki/Tivoli%20Netcool%20OMNIbus/page/Release%20details
Note: Only the combination of product and component releases specified on theversion's web page is supported in that version of IBM Netcool Operations Insight.
Installing Operations Management
1.4.1.2
You can install the Netcool Operations Insight base solution, also known asOperations Management for Operations Insight on premises.
Installing on premises1.4.1.2
Follow these intructions to install the Netcool Operations Insight base solution,also known as Operations Management for Operations Insight on premises.
48 IBM Netcool Operations Insight: Integration Guide

Installing Netcool/OMNIbus and Netcool/ImpactObtain and install the Netcool/OMNIbus core components, Netcool/Impact, andthe Gateway for JDBC and Gateway for Message Bus. All these products areinstalled by IBM Installation Manager. You can use IBM Installation Manager todownload the installation packages for these products and install them in a singleflow. Extra configuration of each product is required after installation.
Procedurev Install the Netcool/OMNIbus V8.1.0 core components. After the installation, you
can use the Initial Configuration Wizard (nco_icw) to configure the product, forexample, create and start ObjectServers, and configure automated failover or amultitier architecture. See related links later for instructions on installingNetcool/OMNIbus.
v Install the Netcool/Impact GUI server and Impact server. See related links laterfor instructions on installing Netcool/Impact.
v Apply the latest supported Netcool/OMNIbus core and Netcool/Impact fixpacks. Also ensure that you apply the appropriate IBM Tivoli Netcool/ImpactServer Extensions for Netcool Operations Insight feature. This is delivered in theNetcool/Impact fix pack. For information on the product and componentversions supported in the current version of Netcool Operations Insightincluding supported fix packs, see “Supported products and components” onpage 6 The IBM Tivoli Netcool/Impact Server Extensions for Netcool OperationsInsight feature is required for the event analytics capability. Fix packs areavailable from IBM Fix Central, see http://www.ibm.com/support/fixcentral/.
v Create the connection from Netcool/Impact to the DB2 database as described in“Configuring DB2 database connection within Netcool/Impact” on page 241.
v Configure the ObjectServer to support the related events function of the eventanalytics capability. This requires a ParentIdentifier column in the alerts.statustable. Add the column using the SQL utility as described in “Configuring theEvent Analytics ObjectServer” on page 238.
v Configure the ObjectServer to support the topology search capability. In$NCHOME/omnibus/extensions, run the nco_sql utility against thescala_itnm_configuration.sql file../nco_sql -user root -password myp4ss -server NCOMS< /opt/IBM/tivoli/netcool/omnibus/extensions/scala/scala_itnm_configuration.sql
Triggers are applied to the ObjectServer that delay the storage of events until theevents are enriched by Network Manager IP Edition data from the NCIMdatabase.
v Install the Gateway for JDBC and Gateway for Message Bus. After installation,create the connection between the ObjectServer and the gateways in the ServerEditor (nco_xigen). See related links later for instructions on creating connectionsin the Server Editor.
v Configure the integration between Netcool/Impact and IBM Connections. Thisinvolves importing the $IMPACT_HOME/add-ons/IBMConnections/importDataproject into Netcool/Impact and adding IBM Connections properties to the$IMPACT_HOME/etc/NCI_server.props file. After you edit this file, restart theNetcool/Impact server. See related links later for instructions on configuringintegration to IBM Connections and restarting the Impact server.
What to do next
Search on IBM Fix Central for available interim fixes and apply them. Seehttp://www.ibm.com/support/fixcentral/.
Installing 49

Related concepts:
Connections in the Server EditorRelated tasks:
Installing Tivoli Netcool/OMNIbus
Creating and running ObjectServers“Configuring DB2 database connection within Netcool/Impact” on page 241“Configuring the Event Analytics ObjectServer” on page 238“Configuring integration to IBM Connections” on page 381
Restarting the Impact serverRelated reference:“On-premises scenarios for Operations Management” on page 26
Initial configuration wizard“Ports used by products and components” on page 41Related information:
Installing Netcool/Impact
Installing DB2 and configuring the REPORTER schemaNetcool Operations Insight requires a DB2 database with the REPORTER schemafor historical event archiving.
Tip: For information on the housekeeping of historical DB2 event data, as well assample SQL scripts, see the 'Historical event archive sizing guidance' section in theNetcool/OMNIbusBest Practices Guide, which can be found on theNetcool/OMNIbus best-practice Wiki: http://ibm.biz/nco_bps
Procedurev Obtain and download the package for the DB2 database and the Gateway
configuration scripts.v Decompress the packages. Then, as the root system user, run the db2setup
command to install the DB2 database on the host. The db2setup command startsthe DB2 Setup wizard. Install as the root system user because the setup wizardneeds to create a number of users in the process.
v Run IBM Installation Manager on the Netcool/OMNIbus host and install theGateway configuration scripts. The SQL file that is needed to create theREPORTER schema is installed to $OMNIHOME/gates/reporting/db2/db2.reporting.sql.
v In the db2.reporting.sql file, make the following changes.– Uncomment the CREATE DATABASE line.– Set the default user name and password to match the DB2 installation:
CREATE DATABASE reporter @CONNECT TO reporter USER db2inst1 USING db2inst1 @
– Uncomment the following lines, so that any associated journal and detailsrows are deleted from the database when the corresponding alerts aredeleted:-- Uncomment the line below to enable foreign keys-- This helps pruning by only requiring the alert to be-- deleted from the status table, CONSTRAINT eventref FOREIGN KEY (SERVERNAME, SERVERSERIAL) REFERENCESREPORTER_STATUS(SERVERNAME, SERVERSERIAL) ON DELETE CASCADE)
50 IBM Netcool Operations Insight: Integration Guide

This SQL appears twice in the SQL file: once in the details table definitionand once in the journal table definition. Uncomment both instances.
v Run the SQL file against the DB2 database by running the following commandas the db2inst1 system user:$ db2 -td@ -vf db2.reporting.sql
Result
The DB2 installer creates a number of users including db2inst1.Related reference:“Ports used by products and components” on page 41Related information:
Installing DB2 servers using the DB2 Setup wizard (Linux and UNIX)
Gateway for JDBC configuration scripts for Reporting Mode
Installing IBM Operations Analytics - Log AnalysisOperations Analytics - Log Analysis supports GUI, console, and silent installations.The installation process differs for 64-bit and z/OS operating systems.
Procedure
Operations Analytics - Log Analysis can be installed by IBM Installation Manageror you can run the install.sh wrapper script.
Tip: The best practice is to install the Web GUI and Operations Analytics - LogAnalysis on separate hosts.
Restriction: Operations Analytics - Log Analysis does not support installation inGroup mode of IBM Installation Manager.
What to do nextv If the host locale is not set to English United States, set the locale of the
command shell to export LANG=en_US.UTF-8 before you run any OperationsAnalytics - Log Analysis scripts.
v If you plan to deploy only the base Netcool Operations Insight solution, installthe Tivoli Netcool/OMNIbus Insight Pack. See Installing the Insight Packs.Complete only the steps that describe the Tivoli Netcool/OMNIbus Insight Pack.
v Search on IBM Fix Central for available interim fixes and apply them. Seehttp://www.ibm.com/support/fixcentral/.
Related tasks:
Installing Operations Analytics - Log Analysis V1.3.5
Installing Operations Analytics - Log Analysis V1.3.3Related reference:“Ports used by products and components” on page 41
Installing 51
Configuring the Gateway for JDBC and Gateway for MessageBusConfigure the Gateway for JDBC to run in reporting mode, so it can forward eventdata to the DB2 database for archiving. Configure the Gateway for Message Busgateway to forward event data to Operations Analytics - Log Analysis and run itin Operations Analytics - Log Analysis mode.
Before you beginv Install the DB2 database and configure the REPORTER schema so that the
Gateway for JDBC can connect.v Install the gateways on the same host as Tivoli Netcool/OMNIbus core
components (that is, server 1).v Install Operations Analytics - Log Analysis and obtain the URL for the
connection to the Gateway for Message Bus.
Procedurev Configure the Gateway for JDBC. This involves the following steps:
– Obtain the JDBC driver for the target database from the database vendor andinstall it according to the vendor's instructions. The drivers are usuallyprovided as .jar files.
– To enable the gateway to communicate with the target database, you mustspecify values for the Gate.Jdbc.* properties in the $OMNIHOME/etc/G_JDBC.props file. This is the default properties file, which is configured forreporting mode, that is supplied with the gateway.
Here is a sample properties file for the Gateway for JDBC.# Reporting mode propertiesGate.Jdbc.Mode: ’REPORTING’# Table propertiesGate.Jdbc.StatusTableName: ’REPORTER_STATUS’Gate.Jdbc.JournalTableName: ’REPORTER_JOURNAL’Gate.Jdbc.DetailsTableName: ’REPORTER_DETAILS’# JDBC Connection propertiesGate.Jdbc.Driver: ’com.ibm.db2.jcc.DB2Driver’Gate.Jdbc.Url: ’jdbc:db2://server3:50000/REPORTER’Gate.Jdbc.Username: ’db2inst1’Gate.Jdbc.Password: ’db2inst1’Gate.Jdbc.ReconnectTimeout: 30Gate.Jdbc.InitializationString: ’’# ObjectServer Connection propertiesGate.RdrWtr.Username: ’root’Gate.RdrWtr.Password: ’netcool’Gate.RdrWtr.Server: ’AGG_V’
v Configure the Gateway for Message Bus to forward event data to OperationsAnalytics - Log Analysis. This involves the following steps:– Creating a gateway server in the Netcool/OMNIbus interfaces file– Configuring the G_SCALA.props properties file, including specifying the .map
mapping file.– Configuring the endpoint in the scalaTransformers.xml file– Configuring the SSL connection, if required– Configuring the transport properties in the scalaTransport.properties file
v If you do not want to use the default configuration of the Gateway for MessageBus (an IDUC channel between the ObjectServer and Operations Analytics - LogAnalysis and supports event inserts only), configure event forwarding throughthe AEN client. This support event inserts and reinserts and involves thefollowing steps:
52 IBM Netcool Operations Insight: Integration Guide

– Configuring AEN event forwarding in the Gateway for Message Bus– Configuring the AEN channel and triggers in each ObjectServer by enabling
the postinsert triggers and trigger groupv Start the Gateway for Message Bus in Operations Analytics - Log Analysis mode.
For example:$OMNIHOME/bin/nco_g_xml -propsfile $OMNIHOME/etc/G_SCALA.props
The gateway begins sending events from Tivoli Netcool/OMNIbus to OperationsAnalytics - Log Analysis.
v Start the Gateway for JDBC in reporter mode. For example:$OMNIHOME/bin/nco_g_jdbc -jdbcreporter
v As an alternative to starting the gateways from the command-line interface, putthem under process control. For more information about process control, see theIBM Tivoli Netcool/OMNIbus Administration Guide.
Related concepts:Tivoli Netcool/OMNIbus process controlRelated information:Gateway for JDBC documentationGateway for Message Bus documentation
Installing Dashboard Application Services Hub and the UIcomponentsInstall the Dashboard Application Services Hub and all the UI components. Thisapplies to the Netcool/OMNIbus Web GUI, the Event Analytics component, fixpacks, and optionally Reporting Services.
The UI components are installed in two stages. First, IBM WebSphere ApplicationServer and Jazz for Service Management are installed, which provide theunderlying UI technology. Then, the Web GUI and the extension packages thatsupport the Event Analytics component and the event search capability areinstalled. After installation, configure the Web GUI to integrate with OperationsAnalytics - Log Analysis and support the topology search capability.
You can optionally install Reporting Services V3.1 into Dashboard ApplicationServices Hub. You can set up Network Manager and Netcool ConfigurationManager to work with Reporting Services by installing their respective reportswhen installing the products. Netcool/OMNIbus V8.1.0 and later can be integratedwith Reporting Services V3.1 to support reporting on events. To configure thisintegration, connect Reporting Services to a relational database through a gateway.Then, import the report package that is supplied with Netcool/OMNIbus intoReporting Services. For more information about event reporting, seehttp://www-01.ibm.com/support/knowledgecenter/SSSHTQ_8.1.0/com.ibm.netcool_OMNIbus.doc_8.1.0/omnibus/wip/install/task/omn_con_ext_deploytcrreports.html.
Before you beginv Obtain the packages from IBM Passport Advantage. For information about the
eAssembly numbers you need for the packages, see http://www-01.ibm.com/support/docview.wss?uid=swg24043698.
v To install Reporting Services V3.1, ensure that the host meets the extrarequirements at http://www.ibm.com/support/knowledgecenter/SSEKCU_1.1.3.0/com.ibm.psc.doc/install/tcr_c_install_prereqs.html.
Installing 53

Procedure1. Start Installation Manager and install Jazz for Service Management. The
packages that you need to install are as follows.
Package Description
IBM WebSphere Application ServerV8.5.5.12 for Jazz for Service Management
Select V8.5.5.12. If V8.0.5 is also identified,clear it.
IBM WebSphere SDK Java TechnologyEdition V7.0.x.
Jazz for Service Management V1.1.3.0 Select the following items for installation.
v Jazz for Service Management extension forIBM WebSphere V8.5.
v Dashboard Application Services HubV3.1.3.0.
Reporting Services V3.1 This package is optional. Select it if youwant to run reports for events and networkmanagement.
2. Install the packages that constitute the Web GUI and extensions.
Package Description
Netcool/OMNIbus Web GUI This is the base component that installs theWeb GUI.
Install tools and menus for event searchwith IBM SmartCloud Analytics - LogAnalysis
This package installs the tools that launchthe custom apps of the TivoliNetcool/OMNIbus Insight Pack from theevent lists.
Netcool Operations Insight Extensions forIBM Tivoli Netcool/OMNIbus Web GUI
This package installs the Event AnalyticsGUIs.
Netcool/OMNIbus
Web GUI V8.1.0 fix pack, as specified in“Supported products and components” onpage 6.
This is the fix pack that contains theextensions for the topology search capability.
3. Configure the Web GUI. For example, the connection to a data source(ObjectServer), users, groups, and so on. You can use the Web GUIconfiguration tool to do this. For more information, see https://ibm.biz/BdXqcP.
4. Configure the integration with Operations Analytics - Log Analysis. Ensure thatthe server.init file has the following properties set:scala.app.keyword=OMNIbus_Keyword_Searchscala.app.static.dashboard=OMNIbus_Static_Dashboardscala.datasource=omnibusscala.url=protocol://host:portscala.version=1.2.0.3
If you need to change any of these values, restart the Web GUI server.5. Set up the Web GUI Administration API client.6. Install the tools and menus to launch the custom apps of the Network Manager
Insight Pack in the Operations Analytics - Log Analysis UI from the Web GUI.In $WEBGUI_HOME/extensions/LogAnalytics, run the runwaapi command againstthe scalaEventTopology.xml file.
54 IBM Netcool Operations Insight: Integration Guide

$WEBGUI_HOME/waapi/bin/runwaapi -user username -password password -filescalaEventTopology.xml
Where username and password are the credentials of the administrator user thatare defined in the $WEBGUI_HOME/waapi/etc/waapi.init properties file thatcontrols the WAAPI client.
What to do nextv Search on IBM Fix Central for available interim fixes and apply them. See
http://www.ibm.com/support/fixcentral/.v Reconfigure your views in the Web GUI event lists to display the NmosObjInst
column. The tools that launch the custom apps of the Network Manager InsightPack work only against events that have a value in this column. For moreinformation, see the IBM Tivoli Netcool/OMNIbus Web GUI Administration andUser's Guide.
Related concepts:“Installing and uninstalling Event Analytics” on page 140Related tasks:Installing the Web GUIRestarting the serverRelated reference:server.init properties“Ports used by products and components” on page 41
Installing the Tivoli Netcool/OMNIbus Insight PackThis topic explains how to install the Netcool/OMNIbus Insight Pack into theOperations Analytics - Log Analysis product. Operations Analytics - Log Analysiscan be running while you install the Insight Pack. This Insight Pack ingests eventdata into Operations Analytics - Log Analysis and installs custom apps.
Before you beginv Install the Operations Analytics - Log Analysis product. The Insight Pack cannot
be installed without the Operations Analytics - Log Analysis product. IBMOperations Analytics - Log Analysis V1.3.3 and V1.3.5 are supported.
v Download the relevant Insight Pack installation package from IBM PassportAdvantage according to the versions of Netcool Operations Insight andOperations Analytics - Log Analysis installed, as described in the followingtable:
Version of NetcoolOperations Insight
Version of OperationsAnalytics - Log Analysis
Download this TivoliNetcool/OMNIbus InsightPackpackage
1.4.1.2 1.3.5 1.3.1
1.3.3 1.3.0.2
1.4.1.1 1.3.5 1.3.0.2
1.3.3 1.3.0.2
1.4.1 1.3.5 1.3.0.2
1.3.3 1.3.0.2
v Install Python 2.6 or later with the simplejson library, which is required by theCustom Apps that are included in Insight Packs.
Installing 55

Procedure1. Create a new OMNIbus directory under $UNITY_HOME/unity_content.2. Copy the OMNIbusInsightPack_v1.3.0.2.zip installation package to
$UNITY_HOME/unity_content/OMNIbus.3. Use the following command to install the Insight Pack:
$UNITY_HOME/utilities/pkg_mgmt.sh -install $UNITY_HOME/unity_content/OMNIbus/OMNIbusInsightPack_v1.3.0.2.zip
Results
The Insight Pack is installed to the $UNITY_HOME/unity_content/OMNIbus/OMNIbusInsightPack_v1.3.0.2.zip directory. After the installation is completed, theRule Set, Source Type, and Collection required for working withNetcool/OMNIbus events is in place. You can view these resources in theAdministrative Settings page of the Operations Analytics - Log Analysis UI.
What to do nextv If you have not already done so, create a data source for Netcool/OMNIbus
events in Operations Analytics - Log Analysis. See the following topics,depending on your version of Operations Analytics - Log Analysis:– V1.3.3: see https://www.ibm.com/support/knowledgecenter/SSPFMY_1.3.3/
com.ibm.scala.doc/admin/iwa_admin_ds_c.html– V1.3.5: see https://www.ibm.com/support/knowledgecenter/SSPFMY_1.3.5/
com.ibm.scala.doc/admin/iwa_admin_ds_c.html
The best practice is to consolidate all Netcool/OMNIbus events into one datasource. Use a collective name for the path (for example, OMNIbusEvents) and forthe host name (for example, omnihost).
v If you have several ObjectServers, use separate instances of the Gateway forMessage Bus to connect to each ObjectServer. The best practice is for eachgateway to send events to a single data source. For more information aboutconfiguring the gateway to send events to Operations Analytics - Log Analysis,see the IBM Tivoli Netcool/OMNIbus Gateway for Message Bus Reference Guide andsearch for Integrating with Operations Analytics - Log Analysis.
Related concepts:
Data Source creation in Operations Analytics - Log Analysis V1.3.5
Data Source creation in Operations Analytics - Log Analysis V1.3.3Related tasks:“Installing the Tivoli Netcool/OMNIbus Insight Pack” on page 55“Installing the Network Manager Insight Pack” on page 90Related information:
Gateway for Message Bus documentation
56 IBM Netcool Operations Insight: Integration Guide

Installing Network ManagementThis installation scenario describes how to set up the Networks for OperationsInsight feature in the Netcool Operations Insight solution. A sample systemtopology is given on which the installation tasks are based. It is assumed that thecore products of the Netcool Operations Insight solution are already installed andrunning.
The information supplied in this scenario is high-level and covers the most salientpoints and possible issues you might encounter that are specific to the Networksfor Operations Insight feature in the Netcool Operations Insight solution. Thisscenario is end-to-end and you should perform the tasks in the specified order.
For more information, see the Related concept, task, and information links at thebottom of this topic.
Before you beginv Install the components of Netcool Operations Insight as described in “Supported
products and components” on page 6. The Networks for Operations Insightsolution requires that the following products are installed, configured, andrunning as follows:– The Tivoli Netcool/OMNIbus V8.1 server components are installed and an
ObjectServer is created and running. Ensure that the administrator user of theObjectServer was changed from the default.
– The Tivoli Netcool/OMNIbus V8.1 Web GUI is installed and running in aninstance of Dashboard Application Services Hub. The ObjectServer is definedas the Web GUI data source.
– An IBM DB2 database is installed and configured for event archiving, and theGateway for JDBC is installed and configured to transfer and synchronize theevents from the ObjectServer.
– IBM Operations Analytics - Log Analysis is installed and running, andconfigured so that events are forwarded from Tivoli Netcool/OMNIbus toOperations Analytics - Log Analysis via the Gateway for Message Bus. See“Configuring event search” on page 121.
v Obtain the following information about the ObjectServer:– Host name and port number– Installation directory (that is, the value of the $OMNIHOME environment
variable)– Name, for example, NCOMS– Administrator password
v Install and configure the event search and event seasonality features.
If any of the above products are not installed, or features not configured, theymust be configured before you can set up the Networks for Operations Insightfeature.
About this task
This task and the sub-tasks describe the scenario of a fresh deployment of theproducts in the Networks for Operations Insight feature. The system topology is alogical sample. It is not the only system topology that can be used. It is intendedfor reference and to help you plan your deployment. The system topology is asfollows:
Installing 57

v Tivoli Netcool/OMNIbus and Network Manager are installed on separate hosts(that is, a distributed installation). The version of Tivoli Netcool/OMNIbus is8.1.
v The ObjectServer is configured to be the user repository for the products.
Note: All the products of the Netcool Operations Insight solution also supportthe use of an LDAP directory as the user repository.
v Network Manager and Netcool Configuration Manager both use the V8.1ObjectServer to store and manage events.
v In this topology, the default DB2 v10.5 Enterprise Server Edition database isused.
Related concepts:“Network Management data flow” on page 17Related tasks:“Installing Performance Management” on page 93Related reference:“Release notes” on page 387
Installing the Probe for SNMP and Syslog ProbeThe Networks for Operations Insight feature requires the Probe for SNMP and theSyslog Probe. It is important that you install the probes that are included in theentitlement for the Tivoli Netcool/OMNIbus V8.1 product. Although the probes arealso available in the Network Manager IP Edition entitlement, do not install themfrom Network Manager IP Edition. The instances of the probes that are availablewith Tivoli Netcool/OMNIbus V8.1 are installed by IBM Installation Manager.
Procedure1. Change to the /eclipse/tools subdirectory of the Installation Manager
installation directory and run the following command to start InstallationManager:./IBMIM
To record the installation steps in a response file for use with silent installationson other computers, use the -record option. For example, to record to the/tmp/install_1.xml file:./IBMIM -record /tmp/install_1.xml
2. Configure Installation Manager to download package repositories from IBMPassport Advantage®.
3. In the main Installation Manager pane, click Install and follow the installationwizard instructions to complete the installation. The installer requires thefollowing inputs at different stages of the installation:v If prompted, enter your IBM ID user name and password.v Read and accept the license agreement.v Specify an Installation Manager shared directory or accept the default
directory.
Select the nco-p-syslog feature for the Syslog Probe, and select thenco-p-mttrapd feature for the Probe for SNMP. After the installation completes,click Finish.
58 IBM Netcool Operations Insight: Integration Guide

Results
If the installation is successful, Installation Manager displays a success messageand the installation history is updated to record the successful installation. If not,you can use Installation Manager to uninstall or modify the installation.
What to do next
Ensure that both probes are configured:v For more information about configuring the Probe for SNMP, see
http://www-01.ibm.com/support/knowledgecenter/SSSHTQ/omnibus/probes/snmp/wip/reference/snmp_config.html.
v For more information about configuring the Syslog Probe, seehttp://www-01.ibm.com/support/knowledgecenter/SSSHTQ/omnibus/probes/syslog/wip/concept/syslog_intro.html.
Related tasks:
Netcool/OMNIbus V8.1 documentation: Obtaining IBM Installation Manager
Installing Tivoli Netcool/OMNIbus V8.1Related reference:
Tivoli Netcool/OMNIbus V8.1 installable features
Optional: Preparing the ObjectServer for integration withNetwork Manager
If you have already installed Tivoli Netcool/OMNIbus, the Netcool/OMNIbusKnowledge Library, and the Probe for SNMP, you can now install NetworkManager, and do not need to follow the steps in this task. The Network Managerinstaller configures Tivoli Netcool/OMNIbus for you during the installationprocess. If the ObjectServer setup changes after you have already installed andconfigured Network Manager and Tivoli Netcool/OMNIbus, then you mustreintegrate the ObjectServer with Network Manager as described in this topic.
To reintegrate the Network Manager product with the existing TivoliNetcool/OMNIbus V8.1 ObjectServer, run the ConfigOMNI script against theObjectServer.
Procedure1. Use the ConfigOMNI script to configure an ObjectServer to run with Network
Manager.The script creates the Network Manager triggers and GUI account information.If the ObjectServer is on a remote server, then copy the $NCHOME/precision/install/scripts/ConfigOMNI script and the support script $NCHOME/precision/scripts/create_itnm_triggers.sql and put them into the same directory onthe remote ObjectServer. If the ObjectServer is local to Network Manager, thenyou can use both scripts as is.
2. On the ObjectServer host, change to the scripts directory and run theConfigOMNI script.For example, the following configures the ObjectServer called NCOMS2 using theadministrative password NC0M5password, or creates the ObjectServer calledNCOMS2 if it does not exist, in the specified directory (OMNIHOME), and createsor modifies the itnmadmin and itnmuser users in the ObjectServer.
Installing 59
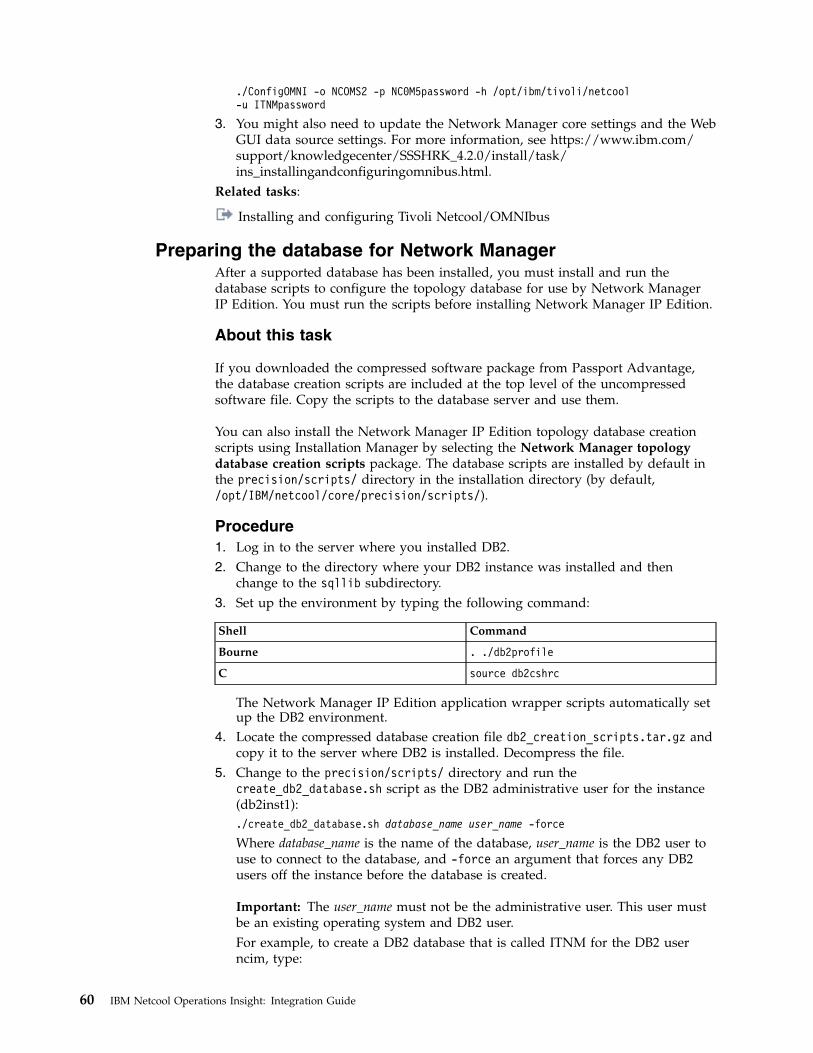
./ConfigOMNI -o NCOMS2 -p NC0M5password -h /opt/ibm/tivoli/netcool-u ITNMpassword
3. You might also need to update the Network Manager core settings and the WebGUI data source settings. For more information, see https://www.ibm.com/support/knowledgecenter/SSSHRK_4.2.0/install/task/ins_installingandconfiguringomnibus.html.
Related tasks:
Installing and configuring Tivoli Netcool/OMNIbus
Preparing the database for Network ManagerAfter a supported database has been installed, you must install and run thedatabase scripts to configure the topology database for use by Network ManagerIP Edition. You must run the scripts before installing Network Manager IP Edition.
About this task
If you downloaded the compressed software package from Passport Advantage,the database creation scripts are included at the top level of the uncompressedsoftware file. Copy the scripts to the database server and use them.
You can also install the Network Manager IP Edition topology database creationscripts using Installation Manager by selecting the Network Manager topologydatabase creation scripts package. The database scripts are installed by default inthe precision/scripts/ directory in the installation directory (by default,/opt/IBM/netcool/core/precision/scripts/).
Procedure1. Log in to the server where you installed DB2.2. Change to the directory where your DB2 instance was installed and then
change to the sqllib subdirectory.3. Set up the environment by typing the following command:
Shell Command
Bourne . ./db2profile
C source db2cshrc
The Network Manager IP Edition application wrapper scripts automatically setup the DB2 environment.
4. Locate the compressed database creation file db2_creation_scripts.tar.gz andcopy it to the server where DB2 is installed. Decompress the file.
5. Change to the precision/scripts/ directory and run thecreate_db2_database.sh script as the DB2 administrative user for the instance(db2inst1):./create_db2_database.sh database_name user_name -force
Where database_name is the name of the database, user_name is the DB2 user touse to connect to the database, and -force an argument that forces any DB2users off the instance before the database is created.
Important: The user_name must not be the administrative user. This user mustbe an existing operating system and DB2 user.For example, to create a DB2 database that is called ITNM for the DB2 userncim, type:
60 IBM Netcool Operations Insight: Integration Guide

./create_db2_database.sh ITNM ncim
6. After you run create_db2_database.sh, restart the database as the DB2administrative user as follows: run db2stop and then run db2start.
7. When running the Network Manager IP Edition installer later on, make sureyou select the option to configure an existing DB2 database. The NetworkManager IP Edition installer can then create the tables in the database either onthe local or a remote host, depending on where your database is installed.The installer populates the connection properties in the following files, you cancheck these files for any problems with your connection to the database:v The DbLogins.DOMAIN.cfg and MibDbLogin.cfg files in $NCHOME/etc/
precision. These files are used by the Network Manager IP Edition coreprocesses.
v The tnm.properties file in $NMGUI_HOME/profile/etc/tnm. These files areused by the Network Manager IP Edition GUI.
Installing Network Manager IP Edition and NetcoolConfiguration Manager
Install Network Manager IP Edition and Netcool Configuration Manager to formthe basis of the Networks for Operations Insight feature.
Before you beginv Ensure you have installed and configured the base products and components of
Netcool Operations Insight, including Tivoli Netcool/OMNIbus,Netcool/Impact, and Operations Analytics - Log Analysis, and the associatedcomponents and configurations. See Supported products for Networks forOperations Insight.
v Obtain the following information about the ObjectServer:– ObjectServer name, for example, NCOMS– Host name and port number– Administrator user ID– Administrator password
v Obtain the following information about your DB2 database:– Database name– Host name and port number– Administrator user ID with permissions to create tables– Administrator user password
v Obtain the packages from IBM Passport Advantage. For information about theeAssembly numbers you need for the packages, see http://www-01.ibm.com/support/docview.wss?uid=swg24043698.
v Obtain the latest supported fix packs for Network Manager IP Edition andNetcool Configuration Manager from IBM Fix Central, at http://www.ibm.com/support/fixcentral/. For information on the product and component versionssupported in the current version of Netcool Operations Insight includingsupported fix packs, see “Supported products and components” on page 6.
v Ensure that a compatible version of Python is installed on this server before youstart. On Linux, Network Manager IP Edition core components require version2.6 or 2.7 of Python to be installed on the server where the core components areinstalled. On AIX, Network Manager IP Edition requires version 2.7.5 of Python.
Installing 61

About this task
These instructions describe the options that are presented in the InstallationManager in wizard mode. Other modes are also available with equivalent options.
Procedure1. Start Installation Manager and install the following packages:
Package Description
Network Manager Core ComponentsVersion V4.2.0.5
Installs the Network Manager IP Editioncore components, sets up connection to thespecified ObjectServer, sets up connection tothe database to be used for the NCIMtopology and creates the tables (needs to beselected), creates Network Manager IPEdition default users, sets up networkdomain, and configures the details for thepoller aggregation.
For more information, seehttps://www.ibm.com/support/knowledgecenter/SSSHRK_4.2.0/install/task/ins_installingcorecomponents.html.Note: The Network Manager IP Edition corecomponents can be installed on server 4 ofthe scenario described in Performing a freshinstallation.
Network Manager GUI ComponentsVersion V4.2.0.5
Installs the Network Manager IP EditionGUI components, sets up connection to thespecified ObjectServer, sets up connection tothe NCIM topology database, and sets upthe default users.
For more information, seehttps://www.ibm.com/support/knowledgecenter/SSSHRK_4.2.0/install/task/ins_installingguicomponents.html.Note: The Network Manager IP Edition GUIcomponents can be installed on server 3 ofthe scenario described in Performing a freshinstallation. The GUI components of otherproducts in the solution, NetcoolConfiguration Manager, and ReportingServices would also be on this host.
62 IBM Netcool Operations Insight: Integration Guide

Package Description
Network Health Dashboard V4.2.0.5 Installs the Network Health Dashboard.
Installing the Network Health Dashboardinstalls the following roles, which allowusers to work with the Network HealthDashboard:
v ncp_networkhealth_dashboard
v ncp_networkhealth_dashboard_admin
v ncp_event_analytics
The new Network Health Dashboard is onlyavailable if you have Network Manager aspart of Netcool Operations Insight. TheNetwork Health Dashboard monitors aselected network view, and displays deviceand interface availability within thatnetwork view. It also reports on performanceby presenting graphs, tables, and traces ofKPI data for monitored devices andinterfaces. A dashboard timeline reports ondevice configuration changes and eventcounts, enabling you to correlate events withconfiguration changes. The dashboardincludes the Event Viewer, for more detailedevent information.Note: The Network Health Dashboard mustbe installed on the same host as theNetwork Manager IP Edition GUIcomponents.
Installing 63

Package Description
Network Manager Reports V4.2.0.5 Installs the reports provided by NetworkManager IP Edition that you can use as partof the Reporting Services feature.Note: Reporting Services requires a DB2database to store its data. This databasemust be running during installation. If thedatabase is installed on the same server asReporting Services, the installer configuresthe database during installation. If thedatabase is on a different server, you mustconfigure the database before you installReporting Services. In the scenario describedin Performing a fresh installation, where theDB2 database is on a different server, youmust set up the remote DB2 database forReporting Services as follows:
1. From the Jazz for Service Managementpackage, copy theTCR_generate_content_store_db2_definition.sh script to the serverwhere DB2 is installed.
2. Run the following command:
./TCR_generate_content_store_db2_definition.shdatabase_name db2_username
Where database_name is the name youwant for the Reporting Services database,and db2_username is the user name toconnect to the content store, that is, thedatabase owner (db2inst1).
3. Copy the generated SQL script to atemporary directory and run it againstyour DB2 instance as the DB2 user(db2inst1), for example:
$ cp tcr_create_db2_cs.sql/tmp/tcr_create_db2_cs.sql$ su – db2inst1 –c "db2 -vtf/tmp/tcr_create_db2_cs.sql"
64 IBM Netcool Operations Insight: Integration Guide

Package Description
Netcool Configuration Manager V6.4.2.6 Installs the Netcool Configuration Managercomponents and loads the required databaseschema. For Server Installation Type, selectPresentation Server and Worker Server toinstall both the GUI and worker servers.
For more information, seehttp://www-01.ibm.com/support/knowledgecenter/SS7UH9_6.4.2/ncm/wip/install/task/ncm_ins_installingncm.html.Note: The Netcool Configuration Managercomponents can be installed on server 3 ofthe scenario described in Performing a freshinstallation.
For more information about fix pack 2, seehttp://www.ibm.com/support/knowledgecenter/SS7UH9_6.4.2/ncm/wip/relnotes/ncm_rn_6422.html.
Reporting Services environment Installs the reports provided by NetcoolConfiguration Manager (ITNCM-Reports)that you can use as part of the ReportingServices feature.
2. Apply the latest supported Network Manager IP Edition and NetcoolConfiguration Manager fix packs. For information on the product andcomponent versions supported in the current version of Netcool OperationsInsight including supported fix packs, see “Supported products andcomponents” on page 6
3. On the host where the Network Manager GUI components are installed, installthe tools and menus to launch the custom apps of the Network ManagerInsight Pack in the Operations Analytics - Log Analysis GUI from the NetworkViews.a. In $NMGUI_HOME/profile/etc/tnm/topoviz.properties, set the
topoviz.unity.customappsui property, which defines the connection toOperations Analytics - Log Analysis. For example:# Defines the LogAnalytics custom App launcher URLtopoviz.unity.customappsui=https://server3:9987/Unity/CustomAppsUI
b. In the $NMGUI_HOME/profile/etc/tnm/menus/ncp_topoviz_device_menu.xmlfile, define the Event Search menu item. Add the item <menu id="EventSearch"/> in the file as shown:<tool id="showConnectivityInformation"/>
<separator/><menu id="Event Search"/>
4. Optional: Follow the steps to configure the integration between NetworkManager IP Edition and Netcool Configuration Manager as described in“Configuring integration with Netcool Configuration Manager” on page 66.
Results
The ports used by each installed product or component are displayed. The portsare also written to the $NCHOME/log/install/Configuration.log file.
Installing 65

What to do nextv To add the performance management feature, see “Installing Performance
Management” on page 93.v To set up the Device Dashboard for the network performance monitoring
feature, see “Installing the Device Dashboard” on page 95.v Search on IBM Fix Central for available interim fixes and apply them. See
http://www.ibm.com/support/fixcentral/.Related reference:
Installing Network ManagerRelated information:
Installing Netcool Configuration Manager
V4.2 download document
Configuring integration with Netcool Configuration ManagerAfter installing the products, you can configure the integration between NetworkManager and Netcool Configuration Manager.Related tasks:
Installing Netcool Configuration ManagerRelated reference:
Netcool Configuration Manager release notes
Installation information checklistRelated information:
Preparing DB2 databases for Netcool Configuration Manager
User role requirementsCertain administrative user roles are required for the integration.
Note: For single sign-on information, see the related topic links.
DASH user roles
The following DASH roles are required for access to the Netcool ConfigurationManager components that are launched from within DASH, such as the NetcoolConfiguration Manager Wizards and the Netcool Configuration Manager - Baseand Netcool Configuration Manager - Compliance clients.
Either create a DASH user with the same name as an existing NetcoolConfiguration Manager user who already has the ‘IntellidenUser' role, or use anappropriate Network Manager user, such as itnmadmin, who is already set up as aDASH user. If you use the Network Manager user, create a corresponding newNetcool Configuration Manager user with the same name (password can differ),and assign the ‘IntellidenUser' role to this new user.
Important: If a DASH user is being created on Network Manager with the samename as an existing Netcool Configuration Manager user. then they also need to beadded to an appropriate Network Manager user group, or alternatively be grantedany required Network Manager roles manually.
Additionally, assign the following roles to your DASH user:
66 IBM Netcool Operations Insight: Integration Guide

v ncp_rest_apiv ncmConfigChangev ncmConfigSynchv ncmIDTUserv ncmPolicyCheckv ncmActivityViewingv ncmConfigViewingv ncmConfigEditv ncmDashService
The following table cross-references security requirements between user interfaces,DASH roles, Netcool Configuration Manager functionality, and NetcoolConfiguration Manager realm content permissions. Use this information to assignDASH roles and define realm content permissions.
Table 16. UI security by DASH roles, Netcool Configuration Manager functionality, and realmcontent permissions
Access DASH role FunctionalityRealm contentpermissions
Apply ModelledCommand Set
ncmConfigChange ExecuteConfigurationChange
View, Execute
Apply NativeCommand Set
ncmConfigChange ExecuteConfigurationChange, ApplyNative CommandSets
View, Execute
Synchronize (ITNCMto Device)
ncmConfigSynch ExecuteConfigurationSynchronization
View, Execute
Submit Configuration ncmConfigChange ExecuteConfigurationChange
View, Execute
Apply Policy ncmPolicyCheck Execute CompliancePolicy
View
View Configuration ncmConfigViewing n/a View
Edit Configuration ncmConfigEdit n/a View, Modify
CompareConfiguration
ncmConfigViewing n/a View
IDT Automatic ncmIDTUser IDT Access, IDTAllow Auto Login
View
IDT Manual ncmIDTUser IDT Access, IDTAllow Manual Login
View
Find Device n/a n/a View
View UOW Log n/a n/a n/a
View IDT Log n/a n/a View
Activity Viewer ncmActivityViewing n/a n/a
DeviceSynchronization
ncp_rest_api n/a n/a
Installing 67

Table 16. UI security by DASH roles, Netcool Configuration Manager functionality, and realmcontent permissions (continued)
Access DASH role FunctionalityRealm contentpermissions
Access DASHservices (throughright-click menus)
ncmDashServices n/a n/a
Reporting Services user roles
Reporting Services and the Netcool Configuration Manager default reports areinstalled together with the DASH components.
Any user who needs to access reports requires the following permissions:v The relevant Reporting Services roles for accessing the Reporting node in the
DASH console. Assign these roles to enable users to run reports to which theyare authorized from the Reporting Services GUI.
v The authorization to access the report set, and the relevant Reporting Servicesroles for working with the reports. Assign these permissions to enable users torun Netcool Configuration Manager reports from Network Manager topologydisplays, the Active Event List, and the Reporting Services GUI.
For information about authorizing access to a report set and assigning roles byuser or group, go to the IBMTivoli Systems Management Information Center athttp://www-01.ibm.com/support/knowledgecenter/SS3HLM/welcome, locate theReporting Services documentation node, and search for authorization and user roles.
Other user roles
To configure the Alerts menu in the Web GUI, the ncw_admin role is required.
Installing the Dashboard Application Services Hub componentsFor integrated scenarios, Netcool Configuration Manager provides the followingDashboard Application Services Hub components: The Activity Viewer, theDashboard Application Services Hub wizards, and the Netcool ConfigurationManager thick-client launch portal.
Before you begin
From Version 6.4.2 onwards, Netcool Configuration Manager reporting is no longerinstalled as part of the Dashboard Application Services Hub componentsinstallation, but rather as part of the Netcool Configuration Manager maininstallation.
Important: Before installing the Dashboard Application Services Hub components,install Netcool Configuration Manager using the 'Integrated' option.
About this task
Restriction: The Netcool Configuration Manager Dashboard Application ServicesHub components must be installed as the same user who installed NetworkManager.
68 IBM Netcool Operations Insight: Integration Guide
Procedure1. Log onto the Dashboard Application Services Hub server.2. Change to the /eclipse subdirectory of the Installation Manager Group
installation directory and use the following command to start InstallationManager:./IBMIMTo record the installation steps in a response file for use with silent installationson other computers, use the '-record response_file' option. For example:IBMIM -record C:\response_files\install_1.xml
3. Configure Installation Manager to download package repositories from IBMPassport Advantage:a. From the main menu, choose File > Preferences.
You can set preferences for proxy servers in IBM Installation Manager.Proxy servers enable connections to remote servers from behind a firewall.
b. In the Preferences window, expand the Internet node and select one of thefollowing options:
FTP ProxySelect this option to specify a SOCKS proxy host address and aSOCKS proxy port number.
HTTP ProxySelect this option to enable an HTTP or SOCKS proxy.
c. Select Enable proxy server.d. In the Preferences window, select the Passport Advantage panel.e. Select Connect to Passport Advantage.f. Click Apply, and then click OK.
4. In the main Installation Manager window, click Install, select IBM DashboardApplications for ITNCM, and then follow the installation wizard instructionsto complete the installation.
5. Accept the license agreement, select an installation directory, and supply thefollowing details:
Netcool Configuration Manager database detailsSid/service name/database name(db2)
Database hostname
Port
Username
Password
Dashboard Application Services Hub administrative credentialsDashboard Application Services Hub administrator username (default issmadmin)
Dashboard Application Services Hub administrator password
Network Manager administrative credentialsDefault is itnmadmin (or the Dashboard Application Services Hubsuperuser, who must have the 'ncw_admin' role in DashboardApplication Services Hub
Password
Installing 69
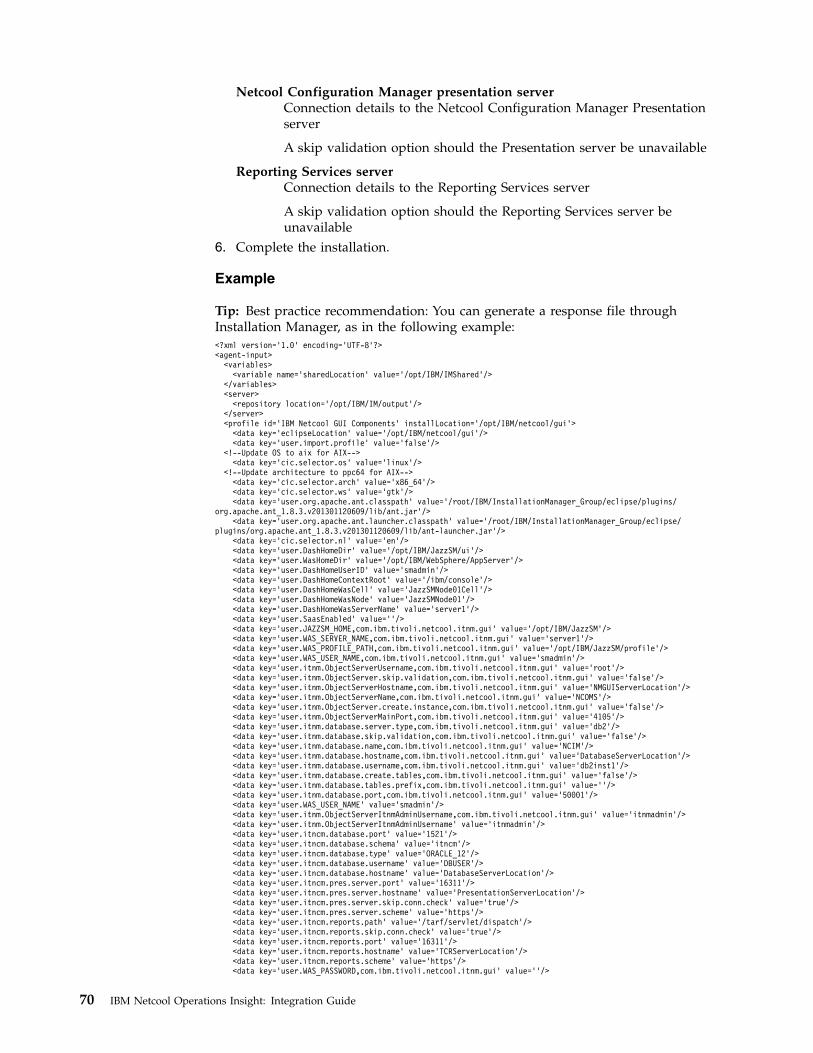
Netcool Configuration Manager presentation serverConnection details to the Netcool Configuration Manager Presentationserver
A skip validation option should the Presentation server be unavailable
Reporting Services server Connection details to the Reporting Services server
A skip validation option should the Reporting Services server beunavailable
6. Complete the installation.
Example
Tip: Best practice recommendation: You can generate a response file throughInstallation Manager, as in the following example:<?xml version=’1.0’ encoding=’UTF-8’?><agent-input>
<variables><variable name=’sharedLocation’ value=’/opt/IBM/IMShared’/>
</variables><server><repository location=’/opt/IBM/IM/output’/>
</server><profile id=’IBM Netcool GUI Components’ installLocation=’/opt/IBM/netcool/gui’><data key=’eclipseLocation’ value=’/opt/IBM/netcool/gui’/><data key=’user.import.profile’ value=’false’/>
<!--Update OS to aix for AIX--><data key=’cic.selector.os’ value=’linux’/>
<!--Update architecture to ppc64 for AIX--><data key=’cic.selector.arch’ value=’x86_64’/><data key=’cic.selector.ws’ value=’gtk’/><data key=’user.org.apache.ant.classpath’ value=’/root/IBM/InstallationManager_Group/eclipse/plugins/
org.apache.ant_1.8.3.v201301120609/lib/ant.jar’/><data key=’user.org.apache.ant.launcher.classpath’ value=’/root/IBM/InstallationManager_Group/eclipse/
plugins/org.apache.ant_1.8.3.v201301120609/lib/ant-launcher.jar’/><data key=’cic.selector.nl’ value=’en’/><data key=’user.DashHomeDir’ value=’/opt/IBM/JazzSM/ui’/><data key=’user.WasHomeDir’ value=’/opt/IBM/WebSphere/AppServer’/><data key=’user.DashHomeUserID’ value=’smadmin’/><data key=’user.DashHomeContextRoot’ value=’/ibm/console’/><data key=’user.DashHomeWasCell’ value=’JazzSMNode01Cell’/><data key=’user.DashHomeWasNode’ value=’JazzSMNode01’/><data key=’user.DashHomeWasServerName’ value=’server1’/><data key=’user.SaasEnabled’ value=’’/><data key=’user.JAZZSM_HOME,com.ibm.tivoli.netcool.itnm.gui’ value=’/opt/IBM/JazzSM’/><data key=’user.WAS_SERVER_NAME,com.ibm.tivoli.netcool.itnm.gui’ value=’server1’/><data key=’user.WAS_PROFILE_PATH,com.ibm.tivoli.netcool.itnm.gui’ value=’/opt/IBM/JazzSM/profile’/><data key=’user.WAS_USER_NAME,com.ibm.tivoli.netcool.itnm.gui’ value=’smadmin’/><data key=’user.itnm.ObjectServerUsername,com.ibm.tivoli.netcool.itnm.gui’ value=’root’/><data key=’user.itnm.ObjectServer.skip.validation,com.ibm.tivoli.netcool.itnm.gui’ value=’false’/><data key=’user.itnm.ObjectServerHostname,com.ibm.tivoli.netcool.itnm.gui’ value=’NMGUIServerLocation’/><data key=’user.itnm.ObjectServerName,com.ibm.tivoli.netcool.itnm.gui’ value=’NCOMS’/><data key=’user.itnm.ObjectServer.create.instance,com.ibm.tivoli.netcool.itnm.gui’ value=’false’/><data key=’user.itnm.ObjectServerMainPort,com.ibm.tivoli.netcool.itnm.gui’ value=’4105’/><data key=’user.itnm.database.server.type,com.ibm.tivoli.netcool.itnm.gui’ value=’db2’/><data key=’user.itnm.database.skip.validation,com.ibm.tivoli.netcool.itnm.gui’ value=’false’/><data key=’user.itnm.database.name,com.ibm.tivoli.netcool.itnm.gui’ value=’NCIM’/><data key=’user.itnm.database.hostname,com.ibm.tivoli.netcool.itnm.gui’ value=’DatabaseServerLocation’/><data key=’user.itnm.database.username,com.ibm.tivoli.netcool.itnm.gui’ value=’db2inst1’/><data key=’user.itnm.database.create.tables,com.ibm.tivoli.netcool.itnm.gui’ value=’false’/><data key=’user.itnm.database.tables.prefix,com.ibm.tivoli.netcool.itnm.gui’ value=’’/><data key=’user.itnm.database.port,com.ibm.tivoli.netcool.itnm.gui’ value=’50001’/><data key=’user.WAS_USER_NAME’ value=’smadmin’/><data key=’user.itnm.ObjectServerItnmAdminUsername,com.ibm.tivoli.netcool.itnm.gui’ value=’itnmadmin’/><data key=’user.itnm.ObjectServerItnmAdminUsername’ value=’itnmadmin’/><data key=’user.itncm.database.port’ value=’1521’/><data key=’user.itncm.database.schema’ value=’itncm’/><data key=’user.itncm.database.type’ value=’ORACLE_12’/><data key=’user.itncm.database.username’ value=’DBUSER’/><data key=’user.itncm.database.hostname’ value=’DatabaseServerLocation’/><data key=’user.itncm.pres.server.port’ value=’16311’/><data key=’user.itncm.pres.server.hostname’ value=’PresentationServerLocation’/><data key=’user.itncm.pres.server.skip.conn.check’ value=’true’/><data key=’user.itncm.pres.server.scheme’ value=’https’/><data key=’user.itncm.reports.path’ value=’/tarf/servlet/dispatch’/><data key=’user.itncm.reports.skip.conn.check’ value=’true’/><data key=’user.itncm.reports.port’ value=’16311’/><data key=’user.itncm.reports.hostname’ value=’TCRServerLocation’/><data key=’user.itncm.reports.scheme’ value=’https’/><data key=’user.WAS_PASSWORD,com.ibm.tivoli.netcool.itnm.gui’ value=’’/>
70 IBM Netcool Operations Insight: Integration Guide

<data key=’user.itnm.ObjectServerItnmUserPassword,com.ibm.tivoli.netcool.itnm.gui’ value=’’/><data key=’user.WAS_PASSWORD’ value=’’/><data key=’user.itnm.ObjectServerItnmUserPassword’ value=’’/><data key=’user.itncm.database.password’ value=’’/>
</profile><install modify=’false’><!-- IBM Dashboard Applications for ITNCM 6.4.2 --><offering profile=’IBM Netcool GUI Components’ id=’com.ibm.tivoli.netcool.itncm.ui.dash’ version=
’6.4.2.20160202_1049’features=’main.feature.activityviewer,main.feature.wizard’ installFixes=’none’/></install><preference name=’com.ibm.cic.common.core.preferences.eclipseCache’ value=’${sharedLocation}’/><preference name=’com.ibm.cic.common.core.preferences.connectTimeout’ value=’30’/><preference name=’com.ibm.cic.common.core.preferences.readTimeout’ value=’45’/><preference name=’com.ibm.cic.common.core.preferences.downloadAutoRetryCount’ value=’0’/><preference name=’offering.service.repositories.areUsed’ value=’false’/><preference name=’com.ibm.cic.common.core.preferences.ssl.nonsecureMode’ value=’false’/><preference name=’com.ibm.cic.common.core.preferences.http.disablePreemptiveAuthentication’ value=’false’/><preference name=’http.ntlm.auth.kind’ value=’NTLM’/><preference name=’http.ntlm.auth.enableIntegrated.win32’ value=’true’/><preference name=’com.ibm.cic.common.core.preferences.preserveDownloadedArtifacts’ value=’true’/><preference name=’com.ibm.cic.common.core.preferences.keepFetchedFiles’ value=’false’/><preference name=’PassportAdvantageIsEnabled’ value=’false’/><preference name=’com.ibm.cic.common.core.preferences.searchForUpdates’ value=’false’/><preference name=’com.ibm.cic.agent.ui.displayInternalVersion’ value=’false’/><preference name=’com.ibm.cic.common.sharedUI.showErrorLog’ value=’true’/><preference name=’com.ibm.cic.common.sharedUI.showWarningLog’ value=’true’/><preference name=’com.ibm.cic.common.sharedUI.showNoteLog’ value=’true’/>
</agent-input>
What to do next
Before you can access the Netcool Configuration Manager Dashboard ApplicationServices Hub components, you must set up the Netcool Configuration ManagerDashboard Application Services Hub users and provide them with appropriateaccess permission.
Once users have been set up, you access the Netcool Configuration ManagerDashboard Application Services Hub components, that is, the Activity Viewer, theDashboard Application Services Hub wizards, and the thick-client launch portal inthe following ways:v You launch the stand-alone Netcool Configuration Manager UIs (sometimes
referred to as the thick-client UIs), from the Dashboard Application Services Hubthick-client launch portal.
v You access the Activity Viewer, the Dashboard Application Services Hubwizards, and a subset of reports in context from Network Manager and TivoliNetcool/OMNIbus.
v You access the complete reports using the Dashboard Application Services HubReporting Services GUI.
Configuring separate database typesUnder certain circumstances, such as when different or remote databases are usedin an integrated environment, you must perform additional database configurationsteps.
About this task
If you are installing Network Manager and ITNCM-Reports together, and if theNetwork Manager database is DB2 and on a different server, then its componentdatabases must be cataloged.
If Network Manager uses an Informix database in a distributed environment andDashboard Application Services Hub is not installed on the same server asNetwork Manager, you ensure that the correct library jars are used.
Installing 71
Procedure1. Required: If Network Manager and ITNCM-Reports are installed together,
and if the Network Manager database is DB2 and on a different server:
a. To connect to a DB2 database on a server remote from your TCRInstallation, ensure that a DB2 client is installed and the remote databasecataloged. When the database server is remote to the WebSphereApplication Server node where configuration is taking place, enter thefollowing command at the node to add a TCP/IP node entry to the nodedirectory:db2 catalog tcpip node <NODENAME> remote <REMOTE> server <PORT>
where
NODENAMESpecifies a local alias for the node to be cataloged.
REMOTESpecifies the fully qualified domain name of the remote DB server.
PORT Is the port on which the database is accessible, typically port 50000.db2 catalog database <database_name> at node <NODENAME>
where
database_nameSpecifies the DB2 database name.
NODENAME Is the local alias specified in the previous step.
b. Add 'source $HOME/sqllib/db2profile' to your <install_user>/.bash_profile. Where $HOME refers to the home directory of the userwhich was configured during the installation of the DB2 client to managethe client (usually db2inst1), and <install_user> is the user who installedNetcool Configuration Manager, usually 'icosuser'.
Note: The .bash_profile is only used for bash shell, and it will be differentfor sh, csh or ksh.
c. Restart your reporting server after this update. However, before restartingthe Reporting Server, check that the amended login profile has beensourced.
Tip: For installations which use a DB2 database, Cognos requires 32 bit DB2client libraries, which will be installed by the 64 bit DB2 client. However,there maybe further dependencies on other 32 bit packages being present onthe system; if such errors are reported, you can check this with 'ldd$library_name'.
2. Required: If Network Manager and ITNCM-Reports are installed together,and if the Network Manager database is Oracle:
a. To connect to an Oracle database from your TCR Installation, ensure thatITNCM-Reports have been installed, and then update the itncmEnv.sh filedefault location:/opt/IBM/tivoli/netcool/ncm/reports/itncmEnv.sh
Export the following variables ( where <install directory> is the NetcoolConfiguration Manager installation directory):
72 IBM Netcool Operations Insight: Integration Guide
ORACLE_HOMEORACLE_HOME=<install directory>/reports/oracleexport ORACLE_HOME
TNS_ADMINTNS_ADMIN=<install directory>/reports/oracle/network/adminexport TNS_ADMIN
LD_LIBRARY_PATHLD_LIBRARY_PATH=<install directory>/reports/oracle:$LD_LIBRARY_PATHexport LD_LIBRARY_PATH
b. Create a tnsnames.ora file located in <install directory>/reports/oracle/network/admin/
c. Add the NCIM database to the tnsnames.ora file. For example: NCIM =(DESCRIPTION = (ADDRESS_LIST = (ADDRESS = (PROTOCOL = TCP)(Host =<Database Server>)(Port = 1521)) ) (CONNECT_DATA = (SERVICE_NAME =NCIM) ))
d. Add 'source <install directory>/reports/itncmEnv.sh' to your<install_user>/.bash_profile.
Note: The .bash_profile is only used for bash shell, and it will be differentfor sh, csh or ksh.
e. Restart your reporting server after this update. However, before restartingthe Reporting Server, check that the amended login profile has beensourced.
Configuring integration with Tivoli Netcool/OMNIbusEnsure that you have Netcool/OMNIbus Knowledge Library (NcKL) EnhancedProbe Rules for Netcool Configuration Manager installed on your TivoliNetcool/OMNIbus server.
Before you begin
Deploy rules specific to Netcool Configuration Manager. These rules have beenbundled with Netcool Configuration Manager and deployed on the NetcoolConfiguration Manager Presentation server during installation, and are located inthe <NCM-INSTALL-DIR>/nckl-rules directory.
Note: This procedure is no longer required for device synchronization withNetwork Manager, and the mapping of devices between Netcool ConfigurationManager and Network Manager.
The standard Netcool/OMNIbus Knowledge Library configuration must have beenapplied to the ObjectServer and to the Probe for SNMP as part of the prerequisitetasks for the integration. The $NC_RULES_HOME environment variable must alsohave been set on the computer where the probe is installed. This environmentvariable is set to $NCHOME/etc/rules on UNIX or Linux.
Tip: To source the Network Manager environment script, run the following script:./opt/IBM/tivoli/netcool/env.sh where opt/IBM/tivoli/netcool is the defaultNetwork Manager directory.
Note: If you have existing Probe for SNMP custom rules that you want topreserve, create backups as required before deploying the Netcool/OMNIbusKnowledge Library rules in step two.
Installing 73

About this task
The location denoted by $NC_RULES_HOME holds a set of Netcool/OMNIbusKnowledge Library lookup files and rules files within a number of sub-directories.In particular, the $NC_RULES_HOME/include-snmptrap/ibm subdirectory contains filesthat can be applied to the Probe for SNMP. To support the integration, you mustadd customized rules for Netcool Configuration Manager to this subdirectory.
Remember: If you have installed Netcool/OMNIbus Knowledge Library (NcKL)Enhanced Probe Rules Version 4.4 Multiplatform English (NcKL4.4) on your TivoliNetcool/OMNIbus server, which is the recommended option, you do not need toinstall the ITNCM-specific Rules files, as documented here.
Procedure
Installing rules files specific to Netcool Configuration Manager (not therecommended option)1. From the server where you have installed Netcool Configuration Manager, copy
the following files:v ncm_install_dir/nckl_rules/nckl_rules.zip
where ncm_install_dir represents the installation location of NetcoolConfiguration Manager, for example /opt/IBM/tivoli/netcool/ncmCopy these files to a temporary location on the computer where the Probe forSNMP is installed.
2. Extract the contents of the nckl_rules.zip file, and then copy the extracted filesto the $NC_RULES_HOME/include-snmptrap/ibm subdirectory.
3. If object server failover has already been configured, proceed to step 4.Otherwise, perform the following steps:a. Go to the folder in which the mttrapd.props has been placed, for example
$NCHOME/omnibus/probes/AIX5, where AIX5 is specific to your operatingsystem.
b. Edit the mttrapd.props file by commenting out the backup object serverreference:#ServerBackup : ’’
4. To ensure that the probe can reference the enhanced lookup and rules files, editthe $NC_RULES_HOME/snmptrap.rules file by uncommenting the followinginclude statements, as shown:include "$NC_RULES_HOME/include-snmptrap/ibm/ibm.master.include.lookupinclude "$NC_RULES_HOME/include-snmptrap/ibm/ibm.master.include.rules"include "$NC_RULES_HOME/include-snmptrap/ibm/ibm-preclass.include.snmptrap.rules"
5. Run the probe. If the probe was already running, force the probe to re-read therules file so that the changes can take effect, for example:Locate the PID of the probe by running the following command on the serverrunning the probe. Look for a process named - nco_p_mttrapdps -eaf | grep mttrapdkill -9 PID
Note: If the probe is installed on a different computer from Network Manageror the DASH portal, you must restart the probe manually.
74 IBM Netcool Operations Insight: Integration Guide

Configuring integration with Network ManagerCopy a number of jar files from the Network Manager GUI server into the NetcoolConfiguration Manager instance of WebSphere.
About this task
Note: The following default locations may differ depending on where WebSpherewas installed on your Network Manager and Netcool Configuration Managerservers.
Procedure
Copy the following jars from the Network Manager GUI server into thecorresponding folder in the Netcool Configuration Manager WebSphere instance.v /opt/IBM/WebSphere/AppServer/etc/vmm4ncos.jks
v /opt/IBM/WebSphere/AppServer/lib/ext/com.ibm.tivoli.ncw.ncosvmm.jar
v /opt/IBM/WebSphere/AppServer/lib/ext/jconn3.jar
Configuring device synchronizationYou configure device synchronization to enable Netcool Configuration Manager touse Network Manager for network device discovery.
Before you begin
During Netcool Configuration Manager 6.4.2 installation you are asked if theproduct is to be integrated or not. If you select Yes the installer will ask thenecessary questions to set up the configuration of device synchronization betweenNetcool Configuration Manager and Network Manager.
A default value of 24 hours (1440mins) is defined in the Netcool ConfigurationManager rseries.properties file for the periodic synchronization with NetworkManager. For the initial synchronization, a large number of devices may alreadyhave been discovered by Network Manager, and it can take a considerable timebefore they are imported into Netcool Configuration Manager. (This also applies ina situation where the discovery scope is widened so that a significant number ofnew devices are added to Network Manager.) Consequently the devices may notyet appear in the NMENTITYMAPPING table in the Netcool ConfigurationManager database, and therefore the context tools (right-click tools) from NetworkManager will not be available for those devices.
Tip: You can reduce this time by editing the rseries.properties file, andchanging the mapping period to 60 (for example). This will speed up the processby which devices are added to the autodiscovery queue on Netcool ConfigurationManager, but will not change the actual time to import each device configuration.
Tip:
If the password for the itnmadmin user has changed on Network Manager,update the locally stored copy on Netcool Configuration Manager as follows:
Use the icosadmin script located in /opt/IBM/tivoli/netcool/ncm/bin.
For example:icosadmin ChangeNmPassword -u itnmadmin -p <new_password>
Installing 75

About this task
The configuration is stored in the rseries.properties file located in the followingdirectory: <ncm-install-dir>/config/properties/
Network Manager:NMEntityMappingComponent/baseURL=https://nmguiservername:16311NMEntityMappingComponent/uri=/ibm/console/nm_rest/topology/devices/domain/NCOMSNMEntityMappingComponent/uriParam=NMEntityMappingComponent/uriProps=#####Note: Complete URL = baseURL+uri+uriProps&uriParam
NMEntityMappingComponent/delay=10 ## delay on startup before first runNMEntityMappingComponent/importRealm=ITNCM/@DOMAINNAMENMEntityMappingComponent/maxDevicesPerRealm=50NMEntityMappingComponent/ncmUser=administratorNMEntityMappingComponent/period=1440 ## Daily (in minutes)NMEntityMappingComponent/user=itnmadminNMEntityMappingComponent/passwd=netcool ## Optional: Install stores securely
Note: You can edit this file and the component configuration properties afterinstall if requirements change.
Before device synchronization runs for the first time ensure that the NetworkManager Rest API user (in our example 'itnmadmin') has the ncp_rest_api role inDASH.
Device synchronization is now done by a new core component of NetcoolConfiguration Manager, and is therefore part of Netcool Configuration ManagerComponent configuration and started automatically when Netcool ConfigurationManager starts. Component start up is configured in <ncm-install-dir>/config/server/config.xml
<component><name>NMEntityMappingComponent</name><class>com.intelliden.nmentitymapping.NMEntityMappingComponent</class></component>
Note: The NMEntityMappingComponent is configured by default so if you wishto stop it being started on Netcool Configuration Manager startup you cancomment it out in the config.xml file.
Note: There is a limit of 50 imported devices per Realm in Netcool ConfigurationManager. If there are more devices than this in a Network Manager domain, theywill be added to sub-realms (labeled 001, 002, etc) in Netcool ConfigurationManager.
Example
Troubleshooting NM ComponentVerify that the component has started in file:<NCM_INSTALL_DIR>/logs/Server.outFri Jul 31 13:30:06 GMT+00:00 2015 - Starting component : NMEntityMappingComponentFri Jul 31 13:30:06 GMT+00:00 2015 - All components started
Verify that the config.xml file has the component specified for startup
Verify that the NMEntityMapping table has the new columns required forthe new component implementation:
76 IBM Netcool Operations Insight: Integration Guide

"NMENTITYMAPPING" ("UNIQUEKEY" BIGINT NOT NULL,"ENTITYID" BIGINT NOT NULL DEFAULT 0,"RESOURCEBROWSERID" BIGINT NOT NULL DEFAULT 0,"DOMAINNAME" VARCHAR(64),"JPAVERSION" BIGINT NOT NULL DEFAULT 1,"ENTITYNAME" VARCHAR(255),"ACCESSIPADDRESS" VARCHAR(64),"SERIALNUMBER" VARCHAR(64),"VENDORTYPE" VARCHAR(64),"MODELNAME" VARCHAR(64),"OSVERSION" VARCHAR(64),"OSIMAGE" VARCHAR(255),"OSTYPE" VARCHAR(64),"HARDWAREVERSION" VARCHAR(64))
Ensure that the Network Manager Rest API user has the ncp_rest_api rolein DASH.
Configuring the Alerts menu of the Active Event ListYou must add access to the Activity Viewer from the Active Event List byconfiguring the Alerts menu.
Procedure1. From the navigation pane, click Administration > Event Management Tools >
Menu Configuration.2. From the Available menus list on the right, select alerts and click Modify.3. From the Menus Editor window, select <separator> from the drop-down list
under Available items, and then click Add selected item to add the item to theCurrent items list. The <separator> item is added as the last item.
4. Under Available items, select menu from the drop-down list. The list of allmenu items that can be added to the Alerts menu is shown.
5. Select the Configuration Management item and click Add selected item. Theitem is added below the <separator> item in the Current items list.
6. Click Save and then click OK.
Results
The Configuration Management submenu and tools are now available in theAlerts menu of the Active Event List, for use with Netcool Configuration Managerevents.
Note: Reports Menu options will not be displayed if the selected event is notenriched.
What to do next
You can optionally create a global filter to restrict the events displayed in theActive Event List to Netcool Configuration Manager events only. You can add thisfilter to the Web GUI either by using the WAAPI client or by using the FilterBuilder. When creating the filter, specify a meaningful name (for example,ITNCMEvents) and define the filter condition by specifying the following SQLWHERE clause:where Class = 87724
Installing 77

For further information about creating filters, see the IBM Tivoli Netcool/OMNIbusWeb GUI Administration and User's Guide in the Tivoli Netcool/OMNIbusInformation Center at http://publib.boulder.ibm.com/infocenter/tivihelp/v8r1/topic/com.ibm.netcool_OMNIbus.doc_7.3.1/omnibus/wip/welcome.htm.
Migrating reportsIf you have custom Reporting Services reports in an existing Netcool ConfigurationManager installation, and are integrating with Network Manager, which has itsown Reporting Services solution, you migrate your custom reports from thestand-alone to the integrated version of Reporting Services.
Before you begin
If you are installing Network Manager on the same server as your existing NetcoolConfiguration Manager installation, you must export your custom reports beforeinstalling Network Manager.
About this task
The report migration procedure is different for single and multiple serverintegrations.
If you are installing Netcool Configuration Manager and Network Manager onthe same server
1. Export the custom reports from the existing Netcool ConfigurationManager version of Reporting Services and copy them to a safelocation.
Note: You export your custom reports before installing NetworkManager to prevent the existing reports from being overwritten.
2. Disable and uninstall the existing Netcool Configuration Managerversion of Reporting Services.
3. Install Network Manager and integrate it with the existing version ofNetcool Configuration Manager as documented.
4. Import the custom reports into the Network Manager version ofReporting Services.
If you are installing Netcool Configuration Manager and Network Manager ondifferent servers
1. Install Network Manager and integrate it with the existing version ofNetcool Configuration Manager as documented.
2. Export the custom reports from the existing Netcool ConfigurationManager version of Reporting Services and copy them to the NetworkManager server.
3. Import the custom reports into the Network Manager version ofReporting Services.
4. Disable the existing Netcool Configuration Manager version ofReporting Services.
78 IBM Netcool Operations Insight: Integration Guide

Exporting custom reports (distributed integration architecture):
After you have installed Network Manager on a server other than your existingNetcool Configuration Manager installation and performed all integration tasks,you export your custom Reporting Services reports. You also disable and uninstallthe existing Netcool Configuration Manager version of Reporting Services.
Before you begin
You export reports after installing Network Manager when all of the followingcircumstances apply to your scenario:v You are already running Reporting Services as part of an existing, non-integrated
Netcool Configuration Manager installation.v You are deploying a distributed integration architecture and have already
installed Network Manager on a server other than your existing version ofNetcool Configuration Manager.
v You have customized Netcool Configuration Manager reports that need to bemigrated into your planned integrated solution.
About this task
When you install the Network Manager version of Reporting Services on a serverother than your existing version of Netcool Configuration Manager, the previousreports as well as the previous version of Reporting Services remain on the NetcoolConfiguration Manager server. To migrate such reports into an integrated solution,you perform the following tasks:
If you are installing Netcool Configuration Manager and Network Manager ondifferent servers
1. Install Network Manager and integrate it with the existing version ofNetcool Configuration Manager as documented.
2. Export the custom reports from the existing Netcool ConfigurationManager version of Reporting Services and copy them to the NetworkManager server.
3. Import the custom reports into the Network Manager version ofReporting Services.
4. Disable the existing Netcool Configuration Manager version ofReporting Services.
Remember: You do not have to migrate the standard Netcool ConfigurationManager reports, because these will be installed together with the NetworkManager version of Reporting Services (in addition to a number of Network Viewreports). You only migrate reports you have customized since installing thestandard reports, or new reports you have created.
Procedure
1. Log into the Netcool Configuration Manager version of Reporting Servicesusing the following URL:http://hostname:16310/ibm/consolewhere hostname is the name of your Netcool Configuration Manager serverand 16310 is the default port number for Reporting Services.
2. Click Reporting > Common Reporting.3. Click Launch on the toolbar, and then select Administration from the
drop-down menu.
Installing 79

4. Select the Configuration tab, then click Content Administration.5. Click New Export to launch the New Export wizard.6. Enter a name and description for the report export, then click Next.7. Accept the default deployment method and click Next.8. Click the Add link and select the ITNCM Reports checkbox, then move
ITNCM Reports to the Selected Entries list.9. Click OK, then Next > Next > Next, accepting the default values.
10. Select New archive, then Next > Next, accepting the default values..11. Click Finish > Run > OK. The reports are exported and the new export
archive is displayed.12. Navigate to the following directory:
/opt/IBM/tivoli/netcool/ncm/tipv2Components/TCRComponent/cognos/deployment,where you can view the report archive, for example:-rw-r--r-- 1 icosuser staff 262637 23 Feb 10:27ncm_export.zipwhere ncm_export.zip is the report archive.
13. Copy the file to the following directory on the Network Manager server:$TIP_HOME/../TCRComponent/cognos/deployment
Results
You have exported the custom reports and copied them to the Network Managerserver.
What to do next
Next, you import the archived reports into the Network Manager version ofReporting Services, and then disable the Netcool Configuration Manager version ofReporting Services.
Importing reports (distributed integration architecture):
After exporting the custom reports and copying them to the Network Managerserver, you import the archived reports into the Network Manager version ofReporting Services, and then disable the Netcool Configuration Manager version ofReporting Services.
Before you begin
You must have exported the custom reports and copied them to the NetworkManager server.
About this task
Procedure
1. Log into the Network Manager Dashboard Application Services Hub.2. Click Reporting > Common Reporting.3. Click Launch on the toolbar, and then select Administration from the
drop-down menu.4. Select the Configuration tab, then click Content Administration.5. Click New Import to launch the New Import wizard. A list of available report
archives will be displayed.
80 IBM Netcool Operations Insight: Integration Guide

6. Select the archive that you exported earlier and click Next.7. Select ITNCM Reports, then Next and Next again, accepting the default
values.8. Click Finish > Run > OK. The reports are imported and the new archive is
displayed in the list of archives.9. Close the Common Reporting tab and click the Common Reporting link in the
navigation pane. The custom reports will now be available in the NetcoolConfiguration Manager version of Reporting Services.
10. Navigate to the following directory:/opt/IBM/tivoli/netcool/ncm/bin/utils/support
11. Run the setPlatform.sh script:bash-3.2$ ./setPlatform.sh and disableReporting, then exit. When the Netcool Configuration Manager server isrestarted, Reporting Services will no longer be running.
Results
You have now completed the migration of custom reports in your distributedcustom environment.
Importing reports (single server integration architecture):
After exporting the custom reports, disabling and uninstalling the NetcoolConfiguration Manager version of Reporting Services, and completing all otherintegration steps, you import the report archive into the Network Manager versionof Reporting Services,
Before you begin
You must have exported the custom reports before installing Network Manager onthe same server as your existing Netcool Configuration Manager installation.
About this task
Procedure
1. Log into the Network Manager Dashboard Application Services Hub.2. Click Reporting > Common Reporting.3. Click Launch on the toolbar, and then select Administration from the
drop-down menu.4. Select the Configuration tab, then click Content Administration.5. Click New Import to launch the New Import wizard. A list of available report
archives will be displayed.6. Select the archive that you exported earlier and click Next.7. Select ITNCM Reports, then Next and Next again, accepting the default values.8. Click Finish > Run > OK. The reports are imported and the new archive is
displayed in the list of archives.9. Close the Common Reporting tab and click the Common Reporting link in the
navigation pane.
Results
The custom reports will now be available in the Netcool Configuration Managerversion of Reporting Services.
Installing 81

Configuring Single Sign-On for Netcool Configuration ManagerThe single sign-on (SSO) capability in Tivoli® products means that you can log onto one Tivoli application and then launch to other Tivoli web-based or web-enabledapplications without having to re-enter your user credentials.
The repository for the user IDs is the Tivoli Netcool/OMNIbus ObjectServer. Auser logs on to one of the participating applications, at which time their credentialsare authenticated at a central repository. With the credentials authenticated to acentral location, the user can then launch from one application to another to viewrelated data or perform actions. Single sign-on can be achieved betweenapplications deployed to DASH servers on multiple machines.
Single sign-on capabilities require that the participating products use LightweightThird Party Authentication (LTPA) as the authentication mechanism. When SSO isenabled, a cookie is created containing the LTPA token and inserted into the HTTPresponse. When the user accesses other Web resources in any other applicationserver process in the same Domain Name Service (DNS) domain, the cookie is sentwith the request. The LTPA token is then extracted from the cookie and validated.If the request is between different cells of application servers, you must share theLTPA keys and the user registry between the cells for SSO to work. The realmnames on each system in the SSO domain are case sensitive and must matchexactly. See Managing LTPA keys from multiple WebSphere® Application Servercells on the WebSphere Application Server Information Center.
When configuring ITNCM-Reports for an integrated installation, ensure youconfigure single sign-on (SSO) on the Reporting Services server. Specifically, youmust configure SSO between the instance of WebSphere that is hosting theNetwork Manager GUI, and the instance of WebSphere that is hosting ITNCMReports. This will prevent unwanted login prompts when launching reports fromwithin Network Manager. For more information, see Configuring WebSphere userregistry in the IBM Tivoli Netcool Configuration Manager Installation and ConfigurationGuide.
Creating user groups for DASH:
To configure single sign-on (SSO) between DASH and Netcool ConfigurationManager, you must create Netcool Configuration Manager groups and roles forDASH.
Before you begin
Note: For SSO between DASH and Netcool Configuration Manager to work, theuser groups specified in this procedure must exist in both DASH and NetcoolConfiguration Manager.
Network Manager and Netcool Configuration Manager users in DASH should usethe same authentication type, for example, ObjectServer.
Note: The IntellidenUser role needs to be assigned to the IntellidenUser group.Similarly, the IntellidenAdminUser role needs to be given to theIntellidenAdminUser group.
82 IBM Netcool Operations Insight: Integration Guide
About this task
Procedure
1. Log onto the WebSphere Administrative console of the Network Manager GUIserver as the profile owner (for example, smadmin).
2. Create a group by selecting Users and Groups > Manage Groups > Create.3. Enter IntellidenUser in the Group name field.4. Click Create, then click Create Like.5. Enter IntellidenAdminUser in the Group name field. IntellidenAdminUser is
required for access to Account Management in Netcool ConfigurationManager.
6. Click Create, then click Close.7. Log off from the WebSphere Administrative console, then log on to the DASH
GUI.8. Select Console Settings > Roles > IntellidenUser.9. Click Users and Groups > Add Groups > Search, then select the
IntellidenUser group, and then click Add.10. Select Console Settings > Roles > IntellidenAdminUser.11. Click Users and Groups > Add Groups > Search, then select the
IntellidenAdminUser group, and then click Add.
What to do next
After creating Netcool Configuration Manager groups and roles for DASH, youcreate Netcool Configuration Manager users for DASH.
Creating users for DASH:
This section explains how to create the Netcool Configuration Manager Intellidensuper-user as well as the default users: administrator, operator, and observer forDASH.
Before you begin
For single sign-on (SSO) between DASH and Netcool Configuration Manager towork, a user must exist (that is, have an account) in both DASH and NetcoolConfiguration Manager.
At install time Netcool Configuration Manager automatically creates four users:Intelliden, administrator, operator, and observer. Of these users, only theIntelliden user must be created in DASH. However, it is advisable that the otherusers are also created.
Note: Only the username must match, it is not necessary that the passwords alsomatch. After single-sign on configuration is complete, the user password entered inDASH will be used to authenticate a Netcool Configuration Manager login.
About this task
This task describes how to create the previously listed Netcool ConfigurationManager users for DASH.
Installing 83

Procedure
1. Log onto the WebSphere console of the Network Manager GUI server as theprofile owner (foe example, smadmin).
2. Click Users and Groups > Manage Users, then click Create.3. Enter Intelliden in the User ID, First name, and Last Name fields.4. Enter the Intelliden user's password in the Password and Confirm Password
fields.5. Click on Group Membership and select Search.6. Highlight the IntellidenAdminUser and IntellidenUser groups in the
matching groups list, and click Add, then click Close.7. Click Create, then click Create Like.8. Enter administrator in the following fields:v User IDv First namev Last Namev Passwordv Confirm password
9. Click on Group Membership and select Search.10. Highlight the IntellidenAdminUser and IntellidenUser groups in the
matching groups list, and click Add, then click Close.11. Click Create and then Close.12. Click Create.13. Enter operator in the following fields:
v User IDv First namev Last Namev Passwordv Confirm password
14. Click on Group Membership and select Search.15. Highlight the IntellidenUser group in the matching groups list, and click
Add and then Close.16. Click Create, then click Create Like.17. Enter observer in the following fields:
v User IDv First namev Last Namev Passwordv Confirm password
18. Click on Group Membership and select Search.19. Highlight the IntellidenUser group in the matching groups list, and click
Add, then click Close.20. Click Create and then Close.
What to do next
After you have created the Netcool Configuration Manager users for DASH, youexport the LTPA keystore to the Netcool Configuration Manager server.
84 IBM Netcool Operations Insight: Integration Guide

Exporting the DASH LTPA keystore:
For added security the contents of the LTPA token are encrypted and decryptedusing a keystore (referred to in the subsequent procedure as the LTPA keystore)maintained by WebSphere. In order for two instances of WebSphere to shareauthentication information via LTPA tokens they must both use the same LTPAkeystore. The IBM Admin Console makes this a simple process of exporting theLTPA keystore on one instance of WebSphere and importing it into another.
About this task
This task describes how to export the LTPA keystore from the instance ofWebSphere running on the Network Manager DASH server to the instance ofWebSphere running on the Netcool Configuration Manager server for keystoresynchronization.
Procedure
1. Launch the DASH Admin Console. For example: http://www.nm_gui_server_ip.com:16310/ibm/console.
2. Navigate to Settings > WebSphere Administrative Console.3. Click Security > Global security.4. Under the Authentication mechanisms and expiration tab, click LTPA.5. Under the Cross-cell single sign-on tab, enter a password in the Password and
Confirm password fields. The password will subsequently be used to importthe LTPA keystore on the Netcool Configuration Manager server.
6. Enter the directory and filename you want the LTPA keystore to be exported toin the Fully qualified key file name field.
7. Complete by clicking Export keys.8. Transfer the LTPA keystore to the Netcool Configuration Manager server.
Results
You will receive a message indicating that the LTPA keystore has been exportedsuccessfully.
What to do next
You now configure the SSO attributes for DASH.Related tasks:“Importing the DASH LTPA keystore to the Netcool Configuration Managerserver” on page 87
Configuring Single Sign-On for Netcool Configuration Manager:
Configuring SSO is a prerequisite to integrating products that are deployed onmultiple servers. All DASH server instances must point to the central user registry.
About this task
Use these instructions to configure single sign-on attributes for the DASH.
Installing 85

Procedure
1. Launch the DASH Admin Console. For example: http://www.nm_gui_server_ip.com:16310/ibm/console.
2. Navigate to Settings > WebSphere Administrative Console.3. Select Security, then click Global Security > Web and SIP Security > Single
sign on (SSO).4. In the Authentication area, expand Web security, then click Global Security >
Web and SIP Security (on the Authentication area) > Single sign on (SSO).5. Select the Enabled option if SSO is disabled.6. Deselect Requires SSL.7. Enter the fully-qualified domain names in the Domain name field where SSO
is effective. If the domain name is not fully qualified, the DASH server doesnot set a domain name value for the LTPAToken cookie and SSO is valid onlyfor the server that created the cookie. For SSO to work across Tivoli®
applications, their application servers must be installed in the same domain(use the same domain name). See below for an example.
8. Optional: Deselect the Interoperability Mode option.9. Optional: Deselect the Web inbound security attribute propagation option.
10. Click OK, then save your changes.11. Stop and restart all the DASH server instances. Log out of the WebSphere
Administrative Console.
Example
If DASH is installed on server1.ibm.com and Netcool Configuration Manager isinstalled on server2.ibm.com, then enter a value of .ibm.com.
What to do next
You enable SSO on Netcool Configuration Manager next.Related tasks:“Importing the DASH LTPA keystore to the Netcool Configuration Managerserver” on page 87
Enabling SSO for Netcool Configuration Manager:
Both Netcool Configuration Manager and Netcool Configuration ManagerWebSphere must be configured to enable SSO.
About this task
This task describes how to enable SSO for Netcool Configuration Manager if it wasnot enabled during installation.
Procedure
1. Navigate to $NCM_installation_dir/utils .2. Run the configSSO.sh script, for example:
cd /opt/IBM/tivoli/netcool/ncm/bin/utils ./configSSO.sh enable
86 IBM Netcool Operations Insight: Integration Guide
What to do next
When SSO is enabled, the interface to Netcool Configuration Manager must acceptan LTPA token as a means of authentication. This is achieved by importing theLTPA keystore to the Netcool Configuration Manager server.
Importing the DASH LTPA keystore to the Netcool Configuration Managerserver:
For added security the contents of the LTPA token are encrypted and decryptedusing a keystore maintained by WebSphere. In order for two instances ofWebSphere to share authentication information via LTPA tokens they must bothuse the same keystore. The IBM admin console makes this a simple process ofexporting the keystore on one instance of WebSphere and importing it into another.
Before you begin
You must have exported the LTPA keystore from the instance of WebSphererunning on the Network Manager DASH server and copied it to the NetcoolConfiguration Manager server in a previous task.
About this task
In this procedure you will import that LTPA keystore to the instance of WebSphererunning on the Netcool Configuration Manager server.
Procedure
1. Logon to the WebSphere Administrative Console for the Netcool ConfigurationManager Presentation Server using the superuser name and password specifiedat install time (typically Intelliden).For example: http://NCM_presentation_server:16316/ibm/console
2. Click Security > Global security.3. Under Authentication mechanisms and expiration, click LTPA.4. Under Cross-cell single sign-on, enter the password in the Password and
Confirm password fields. This password is the one that was used when theLTPA keystore was exported from DASH.
5. Enter the LTPA keystore file name in the Fully qualified key file name field.This is the LTPA keystore that was exported from DASH.
6. Click Import keys.7. Click Save directly to the master configuration.
What to do next
You should now configure single sign-on attributes for the WebSphere instancerunning on the Netcool Configuration Manager server.Related tasks:“Exporting the DASH LTPA keystore” on page 85“Configuring Single Sign-On for Netcool Configuration Manager” on page 85
Installing 87

Configuring single sign-on attributes for Netcool Configuration ManagerWebSphere:
Configuring SSO is a prerequisite to integrating products that are deployed onmultiple servers. All eWAS server instances must point to the central user registry.
About this task
This procedure is performed on the Netcool Configuration Manager eWAS instancerunning on the Netcool Configuration Manager server.
Procedure
1. Logon to the WebSphere Administrative Console for the Netcool ConfigurationManager Presentation Server using the superuser name and password specifiedat install time (typically Intelliden).For example http://NCM_presentation_server:16316/ibm/console
2. In the Authentication area, expand Web security then click Single sign-on.3. Select the Enabled option if SSO is disabled.4. Deselect Requires SSL.5. Leave the domain name blank in the Domain name field.6. Optional: Deselect the Interoperability Mode option.7. Optional: Deselect the Web inbound security attribute propagation option.8. Click Apply to save your changes.9. Click Save Directly to the Master Configuration.
What to do next
You create a federated user repository for Netcool Configuration Manager next.
Creating and configuring a federated user repository for Netcool ConfigurationManager:
The first step for authenticating by using a Tivoli Netcool/OMNIbus ObjectServeris to create a federated user repository for Netcool Configuration Manager.
Before you begin
Important: Before attempting this procedure, complete the following task:“Configuring integration with Network Manager” on page 75
About this task
A federated user repository is built on Virtual Member Manager (VMM), whichprovides the ability to map entries from multiple individual user repositories into asingle virtual repository. The federated user repository consists of a single namedrealm, which is a set of independent user repositories. Each user repository may bean entire external user repository.
This task describes how to create and configure a federated user repository forNetcool Configuration Manager.
88 IBM Netcool Operations Insight: Integration Guide

Procedure
1. Launch the WebSphere Administrative Console from http://<ncmserver-hostname-ip>:<16316>/ibm/console and login using the Netcool ConfigurationManager superuser name and password specified during installation.
Note: The port number may be different for a non-standard installation.2. Select Security > Global security.3. Under the User account repository, select Federated repositories from the
Available realm definitions field, and click Configure.4. Under Repositories in the realm, select Add repositories (LDAP, custom, etc).5. Under General Properties, select New Repository > Custom Repository
6. Update the ObjectServer VMM properties as described here (or per yourcustom repository):
Repository identifierNetcoolObjectServer
Repository adapter class namecom.ibm.tivoli.tip.vmm4ncos.ObjectServerAdapter
Custom PropertiesAdd the following four properties:
Note: Find the exact details from the repository viewable on theNetwork Manager Gui Administrative Console.
Table 17. Custom Properties
Name (case-sensitive Value
username ObjectServer administrator user name
password ObjectServer encrypted administrator userpassword
port1 Object Server port number
host1 Object Server hostname/IP address
7. Click Apply and save your changes directly to the master configuration.8. Under General properties of Repository Reference, update the Unique
distinguished name to o=netcoolObjectServerRepository9. Click OK and save your changes directly to the master configuration, then
click OK again.10. The local repository may not contain IDs that are also in Netcool
Configuration Manager. To mitigate, perform one of the following steps:v Remove the local file repository from the federation of repositories.v Remove all the conflicting users from the local file repository.
11. If prompted, enter the WebSphere Administrator user password in thePassword and Confirm Password fields, and click OK.
12. In Global security under the User account repository, select FederatedRepositories from the Available realm definitions field, and click Set ascurrent.
13. Click Apply and save your changes directly to the master configuration.14. Log out of the Administrative Console.
Installing 89

15. Stop the Netcool Configuration Manager server using the ./itncm.sh stopcommand. Then start the Netcool Configuration Manager server using the./itncm.sh start command.
What to do next
Netcool Configuration Manager will now authenticate with the ObjectServer VMM.
The Netcool Configuration Manager Superuser has been reverted to the usercreated during the Dash profile Installation (which is smadmin by default)
Installing the Network Manager Insight PackThis topic explains how to install the Network Manager Insight Pack into theOperations Analytics - Log Analysis product and make the necessaryconfigurations. Operations Analytics - Log Analysis can be running while youinstall the Insight Pack.
Before you begin
You already completed some of these prerequisites when you installed the TivoliNetcool/OMNIbus Insight Pack. See “Installing the Tivoli Netcool/OMNIbusInsight Pack” on page 55 for more details.v Install the Operations Analytics - Log Analysis product. IBM Operations
Analytics - Log Analysis V1.3.3 and V1.3.5 are supported. For upgrades, migratethe data from previous instances of the product. See the Operations Analytics -Log Analysis documentation on the IBM Knowledge Center.
v Ensure that the OMNIbusInsightPack_v1.3.0.2 is installed before a data source iscreated. For more information, see the readme file for the Tivoli Netcool/OMNIbusInsight Pack.
v Download the Insight Pack installation package from IBM Passport Advantage.The Insight Pack image is contained within the Operations Analytics - LogAnalysis download, see information about Event Search integration and TopologySearch integration in http://www-01.ibm.com/support/docview.wss?uid=swg24043698. The file name of the Insight Pack isNetworkManagerInsightPack_V1.3.0.0.zip.
v Install Python 2.6 or later with the simplejson library, which is required by thecustom apps that are included in the Insight Pack.
v Over large network topologies, the topology search can be performanceintensive. It is therefore important to determine which parts of your networkyou want to use the topology search on. You can define those parts of thenetwork into a single domain. Alternatively, implement the cross-domaindiscovery function in Network Manager IP Edition to create a single aggregationdomain of the domains that you want to search. You can restrict the scope of thetopology search to that domain or aggregation domain. To do so, set thencp.dla.ncim.domain property to the name of the domain. If you still anticipatea detrimental impact on performance, you can also set thencp.spf.multipath.maxLinks property. This property sets a threshold on thenumber of links that are processed when the paths between the two end pointsare retrieved. If the threshold number is breached, only the first identified routebetween the two end points is retrieved. Make these settings in step 3 on page91 of this task. For more information about deploying Network Manager IPEdition to monitor networks of small, medium, and larger networks, see the IBM
90 IBM Netcool Operations Insight: Integration Guide

Tivoli Network Manager IP Edition Product Overview. For more information aboutthe cross-domain discovery function, see the IBM Tivoli Network Manager IPEdition Discovery Guide.
v Obtain the details of the NCIM database that is used to store the networktopology for the Network Manager IP Edition product.
Procedure1. Copy the NetworkManagerInsightPack_V1.3.0.0.zip installation package to
$UNITY_HOME/unity_content.
Tip: For better housekeeping, create a new $UNITY_HOME/unity_content/NetworkManager directory and copy the installation package there.
2. Use the $UNITY_HOME/utilities/pkg_mgmt.sh command to install the InsightPack. For example, to install into $UNITY_HOME/unity_content/NetworkManager,run the command as follows:$UNITY_HOME/utilities/pkg_mgmt.sh -install $UNITY_HOME/unity_content//NetworkManagerNetworkManagerInsightPack_V1.3.0.0.zip
3. In $UNITY_HOME/AppFramework/Apps/NetworkManagerInsightPack_V1.3.0.0/Network_Topology_Search/NM_EndToEndSearch.properties, specify the details ofthe NCIM database.
Tip: You can obtain most of the information that is required from the$NCHOME/etc/precision/DbLogins.cfg or DbLogins.DOMAIN.cfg files (whereDOMAIN is the name of the domain).
ncp.dla.ncim.domainLimits the scope of the topology search capability to a single domain inyour topology. For multiple domains, implement the cross-domaindiscovery function in Network Manager IP Edition and specify the name ofthe aggregation domain. For all domains in the topology, comment out thisproperty. Do not leave it blank.
ncp.spf.multipath.maxLinksSets a limit on the number of links that are processed when the pathsbetween the two end points are retrieved. If the number of links exceedsthe limit, only the first identified path is returned. For example, you specifyncp.spf.multipath.maxLinks = 1000. If 999 links are processed, all pathsbetween the two end points are retrieved. If 1001 links are processed, onepath is calculated and then processing stops.
ncp.dla.datasource.typeThe type of database used to store the Network Manager IP Editiontopology. Possible values are db2 or oracle.
ncp.dla.datasource.driverThe database driver. For DB2, type com.ibm.db2.jcc.DB2Driver. For Oracle,type oracle.jdbc.driver.OracleDriver.
ncp.dla.datasource.urlThe database URL. For DB2, the URL is as follows:jdbc:db2://host:port/name
For Oracle the URL is as follows:jdbc:oracle:thin:@host:port:name
In each case, host is the database host name, port is the port number, andname is the database name, for example, NCIM.
Installing 91

ncp.dla.datasource.schemaType the NCIM database schema name. The default is ncim.
ncp.dla.datasource.ncpgui.schemaType the NCPGUI database schema name. The default is ncpgui.
ncp.dla.datasource.usernameType the database user name.
ncp.dla.datasource.password.Type the database password.
ncp.dla.datasource.encryptedIf the password is encrypted, type true. If not, type false.
ncp.dla.datasource.keyfileType the name of and path to the cryptographic key file, for example$UNITY_HOME/wlp/usr/servers/Unity/keystore/unity.ks.
ncp.dla.datasource.loginTimeoutChange the number of seconds until the login times out, if required.
Optionally change the logging information, which is specified by thejava.util.logging.* properties.
Resultsv The NetworkManagerInsightPack_V1.3.0.0 Insight Pack is installed into the
directory that you created in step 1 on page 91.v The Rule Set, Source Type, and Collection are in place. You can view these
resources in the Administrative Settings page of Operations Analytics - LogAnalysis.
What to do nextv Verify that the Insight Pack was successfully installed.v If you are using an Oracle database, make the extra configurations that are
required to support Oracle. Configure the products to support the topologysearch capability. See the IBM Netcool Operations Insight Integration Guide.
Related concepts:
Data Source creation in Operations Analytics - Log Analysis V1.3.5
Data Source creation in Operations Analytics - Log Analysis V1.3.3Related tasks:“Installing the Tivoli Netcool/OMNIbus Insight Pack” on page 55“Installing the Network Manager Insight Pack” on page 90“Configuring topology search” on page 374Related information:
Gateway for Message Bus documentation
92 IBM Netcool Operations Insight: Integration Guide

Installing Performance ManagementTo add the Performance Management solution extension, install NetworkPerformance Insight and then integrate it with Netcool Operations Insight.Related tasks:“Installing the Device Dashboard” on page 96
Installing Network Performance InsightInstall Network Performance Insight by performing the steps in the Installationsection of the Network Performance Insight documentation.
About this task
In particular, you must ensure that you perform the following tasks as part of theinstallation of Network Performance Insight:v Enable Network Performance Insight integration with Jazz for Service
Management by running the npiDashIntegration script.v Add the relevant singer certificate to your browser to enable single sign-on.v Configure the Netcool/OMNIbus Standard Input probe to enable performance
anomaly events to be displayed in the Netcool/OMNIbus Event Viewer, andverify that the probe starts automatically once installation of NetworkPerformance Insight is complete and the Network Performance Insight EventService has started.
Depending on your version of Netcool Operations Insight, install one of thefollowing Network Performance Insight versions:
Table 18. Network Performance Insight versions
If you are installing... Then install
1.4.1.2
Netcool Operations Insight V1.4.1.2
Network Performance Insight V1.2.3
1.4.1.1
Netcool Operations Insight V1.4.1.1
Network Performance Insight V1.2.2
Netcool Operations Insight V1.4.1.1 Network Performance Insight V1.2.1
Related reference:“Ports used by products and components” on page 41Related information:
1.4.1.2 Network Performance Insight V1.2.3 documentation: Installing andconfiguring
1.4.1.1 Network Performance Insight V1.2.2 documentation: Installing
Network Performance Insight V1.2.1 documentation: Installing
Installing 93
Enabling the integration with Network Performance InsightEnable the integration by creating a kafka.properties file and populating it withrelevant properties.
Before you begin
The Network Performance Insight Kafka server must be available and running inorder to be able to enable the integration.
Procedure1. Copy the kafka.properties file from its default location $NCHOME/precision/
storm/conf/default/ to the following location:$NCHOME/precision/storm/conf/
2. Edit the kafka.properties file as follows:a. Set the kafka producer properties under the kafka.producer property
according to the information at the following link: http://kafka.apache.org/documentation.html#producerconfigs.
b. Set the kafka consumer properties under the kafka.consumer propertyaccording to the information at the following link: http://kafka.apache.org/documentation.html#newconsumerconfigs.
Note: The only mandatory properties are the following:v kafka.consumer.bootstrap.servers
v kafka.producer.bootstrap.servers
3. (Optional) If you anticipate the need to enable and disable the integration oftenthen you can add the kafka.enabled property to facilitate this. To do this, addthe kafka.enabled property to one of the following properties files, and set thisproperty to the value true.v $NCHOME/precision/storm/conf/NMStormTopology.properties
v $NCHOME/precision/storm/conf/kafka.properties
If the property is not present in either file, then this means thatkafka.enabled=true.
4. Restart Apache Storm, by running the following commands:itnm_stop storm
itnm_start storm
Results
To test the output of the integration use the ncp_storm_validate.sh script.Related information:
Kafka producer properties
Kafka consumer properties
Network Manager V4.2 documentation: Starting and stopping ncp_storm
Network Manager V4.2 documentation: ncp_storm_validate.sh
94 IBM Netcool Operations Insight: Integration Guide

Configuring Network Performance InsightIntegrate Network Performance Insight with Netcool Operations Insight byperforming the steps in the Configuring section of the Network PerformanceInsight documentation.Related information:
1.4.1.2 Network Performance Insight V1.2.3 documentation: Installing andconfiguring
1.4.1.1 Network Performance Insight V1.2.2 documentation: Configuring
Network Performance Insight V1.2.1 documentation: Configuring
Installing the Device DashboardInstall the Device Dashboard to view event and performance data for a selecteddevice and its interfaces on a single dashboard.Related concepts:“Device Dashboard” on page 290
About the Device DashboardRead this information before installing the Device Dashboard.
The content of the Device Dashboard varies depending on which NetcoolOperations Insight solution extensions you have installed.
As a minimum you must have the base Netcool Operations Insight solutioninstalled together with the Networks for Operations Insight solution extension inorder to be able to install the Device Dashboard. If you have this combinationinstalled, then the Device Dashboard displays the following content:v Network Hop View portlet, enabling network navigation to a selected device.v Event Viewer portlet, displaying events for a selected device.v Top Performers portlet, displaying the top Network Manager polling data for a
selected device or interface.
If you have the base Netcool Operations Insight solution installed together withboth the Networks for Operations Insight and Performance Management forOperations Insight solution extensions, then, in addition to the Network Hop Viewand the Event Viewer portlets, the Device Dashboard also displays the followingcontent:v Performance Insights portlet, displaying Network Performance Insight
performance anomaly data for a selected device and its interfaces.v Performance Timeline portlet displaying Network Performance Insight
performance timeline data for a selected device and its interfaces.v Capability to launch from a selected interface in the Performance Insights portlet
to the Network Performance Insight Traffic Details dashboard to see flow datafor that interface
Related tasks:“Upgrading the Device Dashboard” on page 107
Installing 95

Installing the Device DashboardFollow these instructions to install the Device Dashboard.
Before you begin
Before you install the Device Dashboard, the following prerequisites must be met:v If your Netcool Operations Insight system includes the Networks for Operations
Insight solution extension only, then Network Manager and the Network HealthDashboard must be installed and configured.
v If your Netcool Operations Insight system includes the Networks for OperationsInsight and the Performance Management for Operations Insight solutionextensions, then the following prerequisites must also be met:– Network Performance Insight must be installed and configured.– Network Manager must be integrated with Network Performance Insight.– All post-installation Network Performance Insight configuration tasks must be
complete.
Note: For more information about the Networks for Operations Insight and thePerformance Management for Operations Insight solution extensions, see theSolution overview.
Procedure
On the host where you installed the Network Manager GUI components, startInstallation Manager and install the following package: Netcool OperationsInsight Widgets version -> Netcool Operations Insight Device Dashboard.Where version is the VRMF version number for the current version of the DeviceDashboard; for example, 1.1.0.2. For information on all current version numbers,see the following web page: https://www.ibm.com/developerworks/community/wikis/home?lang=en#!/wiki/Tivoli%20Netcool%20OMNIbus/page/Release%20detailsThis installs the Device Dashboard, which you can use to troubleshoot networkissues by navigating the network topology and viewing performance anomaliesand trends on any device or interface.
Note: If you installed Network Performance Insight and integrated this as part ofyour Netcool Operations Insight solution, then at the start of this process,Installation Manager asks for Ambari credentials. At this point you must specifyyour Ambari credentials. Ambari is configured during the Network PerformanceInsight installation process and you would have configured Ambari credentials atthat time. Default credentials are as follows:v userid: adminv password: adminRelated concepts:“Solution overview” on page 1Related tasks:“Installing Performance Management” on page 93
96 IBM Netcool Operations Insight: Integration Guide
Configuring the Device DashboardFollowing installation of the Device Dashboard, you must perform thesepost-installation tasks.
Procedure1. The Device Dashboard installation process automatically creates the noi_npi
and noi_npi_admin roles, which allow users to work with the dashboard.Assign these Device Dashboard roles to relevant users. Log in as the DashboardApplication Services Hub administrator to assign the roles noi_npi andnoi_npi_admin as follows:a. Go to Console settings > Roles.b. In Users and Groups, assign roles noi_npi and noi_npi_admin to the
npiadmin user, and assign the noi_npi role to the npiuser user. The noi_npirole provides access to view the Device Dashboard, while the noi_npi_adminrole provides edit access to the Device Dashboard.
Note: You can assign the roles to other individual users or add the role to agroup to control access.
Note: If you do not assign the roles and the user selects Show DeviceDashboard in the right-click tools, the GUI will hang and the user willreceive an encoding error message when logging out, requiring the restartof the browser.
c. Click Save.
If Network Performance Insight is integrated this as part of your NetcoolOperations Insight solution, then you must also complete the followingconfiguration tasks.2. On the same host save the Network Performance Insight profile by performing
the following steps:a. Go to Console Settings > Console Integrations.b. Select NPI.c. Review the information, and click Save. The Network Performance Insight
icon appears on the left in the Navigation bar.3. Configure access to traffic flow data by performing the following steps:
a. Log into the Network Manager GUI server and navigate to the followingfile:$NMGUI_HOME/profile/etc/tnm/tnm.properties
Where $NMGUI_HOME location where the Network Manager GUIcomponents are installed. By default, this location is /opt/IBM/netcool/gui/precision_gui.
b. Open the tnm.properties file for editing.c. Add the following property:
tnm.npi.host.name=https://NPI_Server_Name:9443
Where NPI_Server_Name is the hostname of the Network PerformanceInsight server.
d. Save the tnm.properties file.4. Specify the Network Performance Insight version by performing the following
steps:
Installing 97

a. Log into the Network Manager GUI server and navigate to the followingfile:$NMGUI_HOME/profile/etc/tnm/npi.properties
Where $NMGUI_HOME location where the Network Manager GUIcomponents are installed. By default, this location is /opt/IBM/netcool/gui/precision_gui.
b. Open the npi.properties file for editing.c. Add the following property:
npi.server.version=1.2.2.0
d. Save the npi.properties file.e. Restart the Dashboard Application Services Hub server to enable these
properties to take effect.Related information:
Network Manager V4.2 documentation: User roles
Tivoli Netcool/OMNIbus V8.1 documentation: Restarting the DASH server
Installing Agile Service ManagerInstall Agile Service Manager V1.1.0 Core services, UI, and Observers.
Procedure1. To install the Agile Service Manager Core services, and Observers, proceed as
follows:a. On the server where Agile Service Manager Core services are installed (in
our example, server 6), extract the Agile Service Manager Base andObserver eAssembly archives.
b. Follow the instructions in the Agile Service Manager to complete theinstallation.
2. To install the Agile Service Manager UI, proceed as follows:a. On the server where Dashboard Application Services Hub is installed (in
our example, server 3), extract the Agile Service Manager Base eAssemblyarchive.
b. Start Installation Manager and configure it to point to the followingrepository files: repository.config file for Agile Service Manager
c. See the Agile Service Manager documentation for more information on howto perform the installation, and perform post-installation configurationtasks, such as configuring the Gateway for Message Bus to support theAgile Service Manager Event Observer.
Related information:
Agile Service Manager V1.1.0 documentation: Installing ASM core services
Agile Service Manager V1.1.0 documentation: Installing the ASM UI
Agile Service Manager V1.1.0 documentation: Configuring the Gateway forMessage Bus to support the Event Observer
98 IBM Netcool Operations Insight: Integration Guide

Configuring Single Sign-OnSingle Sign-On (SSO) can be configured to support the launch of tools between theproducts and components of Netcool Operations Insight. Different SSO handshakesare supported; which handshake to configure for which capability is describedhere. Each handshake must be configured separately.
Procedure
Set up the SSO handshake as described in the following table. The table lists whichproducts and components are connected by SSO, which capabilities require whichSSO handshake and additional useful information.
Table 19. SSO handshakes for Netcool Operations Insight
SSO handshake can be configuredbetween these products or components
Handshake isconfigured tosupport thiscapability Additional notes
Operations Analytics- Log Analysis
DashboardApplication ServicesHub
Event search Supports the launch ofright-click tools from theevent lists(That is, theEvent Viewer and ActiveEvent List.) of theNetcool/OMNIbus WebGUI to the custom apps ofthe TivoliNetcool/OMNIbus InsightPack.
Operations Analytics- Log Analysis
DashboardApplication ServicesHub
Topology search Supports the launch ofright-click tools from theWeb GUI event lists to thecustom apps of theNetwork Manager InsightPack.
Supports the launch ofright-click tools from theNetwork Views in theNetwork Manager productfor the custom apps in theNetwork Manager InsightPack.
NetcoolConfigurationManager
DashboardApplication ServicesHub
Networks forOperationsInsight
Supports the launch ofright-click tools from theNetwork Views to theNetcool ConfigurationManager GUIs.
Related tasks:“Configuring single sign-on for the event search capability” on page 125“Configuring single sign-on for the topology search capability” on page 377
Configuring SSO between Operations Analytics - Log Analysis V1.3.5 andDashboard Application Services Hub
Configuring SSO between Operations Analytics - Log Analysis V1.3.3 andDashboard Application Services Hub
Installing 99

“Configuring Single Sign-On for Netcool Configuration Manager” on page 85Related information:
Configuring Jazz for Service Management for SSO
100 IBM Netcool Operations Insight: Integration Guide

Upgrading to the latest Netcool Operations Insight
Follow these instructions to upgrade Netcool Operations Insight from to any V1.4.1or any of its subordinate versions.
Before you begin
Back up all products and components in the environment.Related concepts:
Connections in the Server EditorRelated tasks:
Restarting the Web GUI server
Configuring Reporting Services for Network ManagerRelated reference:
Web GUI server.init fileRelated information:
Gateway for Message Bus documentation
Operations Analytics - Log Analysis Welcome page
Upgrading to Netcool Operations Insight V1.4.1.2
1.4.1.2
This procedure explains how to upgrade from Netcool Operations Insight V1.4.1.1to V1.4.1.2.
About this task
This scenario assumes that Netcool Operations Insight is deployed as shown in thesimplified architecture in the following figure. Depending on how your NetcoolOperations Insight system is deployed, you will need to download the softwareand run the upgrade on different servers.
© Copyright IBM Corp. 2014, 2018 101
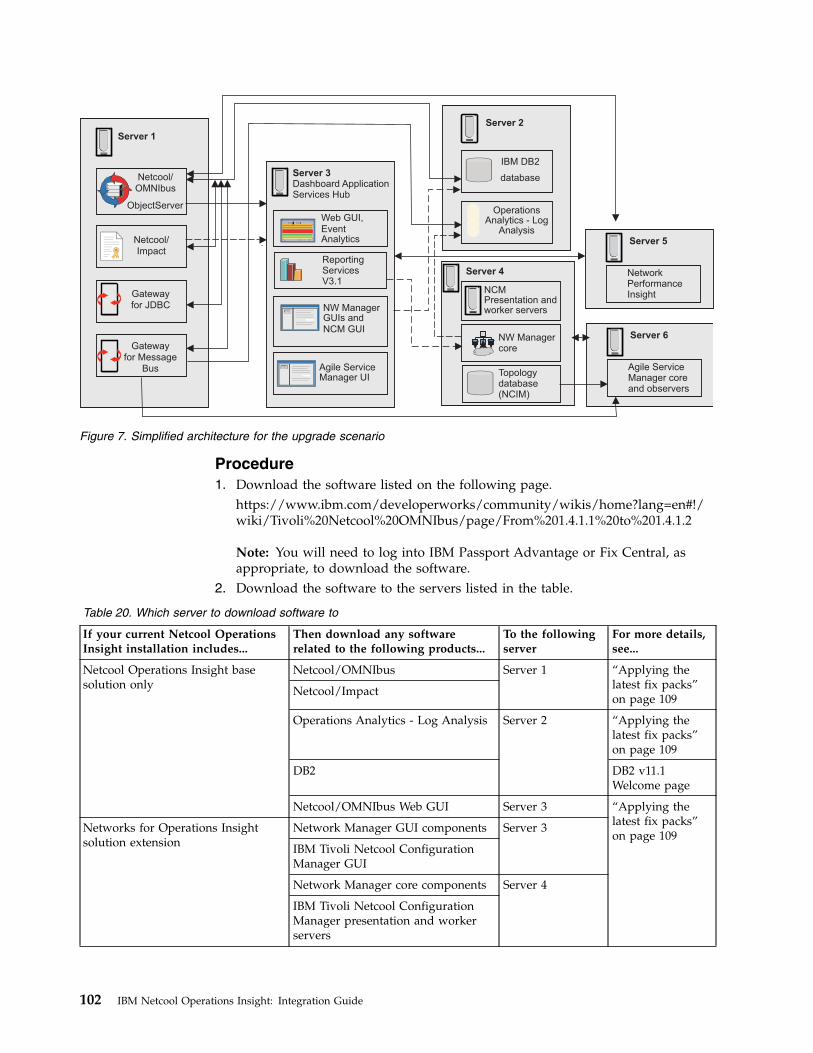
Procedure1. Download the software listed on the following page.
https://www.ibm.com/developerworks/community/wikis/home?lang=en#!/wiki/Tivoli%20Netcool%20OMNIbus/page/From%201.4.1.1%20to%201.4.1.2
Note: You will need to log into IBM Passport Advantage or Fix Central, asappropriate, to download the software.
2. Download the software to the servers listed in the table.
Table 20. Which server to download software to
If your current Netcool OperationsInsight installation includes...
Then download any softwarerelated to the following products...
To the followingserver
For more details,see...
Netcool Operations Insight basesolution only
Netcool/OMNIbus Server 1 “Applying thelatest fix packs”on page 109
Netcool/Impact
Operations Analytics - Log Analysis Server 2 “Applying thelatest fix packs”on page 109
DB2 DB2 v11.1Welcome page
Netcool/OMNIbus Web GUI Server 3 “Applying thelatest fix packs”on page 109
Networks for Operations Insightsolution extension
Network Manager GUI components Server 3
IBM Tivoli Netcool ConfigurationManager GUI
Network Manager core components Server 4
IBM Tivoli Netcool ConfigurationManager presentation and workerservers
Server 1
Netcool/Impact
Gatewayfor JDBC
Gatewayfor Message
Bus
ObjectServer
Netcool/OMNIbus
Web GUI,EventAnalytics
Server 3
Dashboard ApplicationServices Hub
NW ManagerGUIs andNCM GUI
ReportingServicesV3.1
IBM DB2
database
OperationsAnalytics - Log
Analysis
Server 2
NW Managercore
Topologydatabase(NCIM)
Server 4
Server 5
NetworkPerformanceInsight
Server 6
Agile ServiceManager coreand observers
Agile ServiceManager UI
NCMPresentation andworker servers
Figure 7. Simplified architecture for the upgrade scenario
102 IBM Netcool Operations Insight: Integration Guide

Table 20. Which server to download software to (continued)
If your current Netcool OperationsInsight installation includes...
Then download any softwarerelated to the following products...
To the followingserver
For more details,see...
Performance Management forOperations Insight solution extension
Network Performance Insight Server 5 NetworkPerformanceInsight:Upgrading to V1.2.3
Service Management for OperationsInsight solution extension
Agile Service Manager Base Server 3
Server 6
Agile ServiceManagerdocumentationWelcome pageAgile Service Manager Observers Server 6
Upgrading to Netcool Operations Insight V1.4.1.1
1.4.1.1
This procedure explains how to upgrade from Netcool Operations Insight V1.4.1 toV1.4.1.1.
About this task
This scenario assumes that Netcool Operations Insight is deployed as shown in thesimplified architecture in the following figure. Depending on how your NetcoolOperations Insight system is deployed, you will need to download the softwareand run the upgrade on different servers.
Procedure1. Download the software listed on the following page.
Server 1
Netcool/Impact
Gatewayfor JDBC
Gatewayfor Message
Bus
ObjectServer
Netcool/OMNIbus
Web GUI,EventAnalytics
Server 3
Dashboard ApplicationServices Hub
NW ManagerGUIs andNCM GUI
ReportingServicesV3.1
IBM DB2
database
OperationsAnalytics - Log
Analysis
Server 2
NW Managercore
Topologydatabase(NCIM)
Server 4
Server 5
NetworkPerformanceInsight
Server 6
Agile ServiceManager coreand observers
Agile ServiceManager UI
NCMPresentation andworker servers
Figure 8. Simplified architecture for the upgrade scenario
Upgrading 103

https://www.ibm.com/developerworks/community/wikis/home?lang=en#!/wiki/Tivoli%20Netcool%20OMNIbus/page/From%201.4.1%20to%201.4.1.1
Note: You will need to log into IBM Passport Advantage or Fix Central, asappropriate, to download the software.
2. Download the software to the servers listed in the table.
Table 21. Which server to download software to
If your current Netcool OperationsInsight installation includes...
Then download any softwarerelated to the following products...
To the followingserver
For more details,see...
Netcool Operations Insight basesolution only
Netcool/OMNIbus
Netcool/Impact
Server 1 “Applying thelatest fix packs”on page 109
Jazz for Service Management
WebSphere Application Server
Netcool/OMNIbus Web GUI
Server 3
Networks for Operations Insightsolution extension
Network Manager GUI components
IBM Tivoli Netcool ConfigurationManager GUI
Server 3
Network Manager core components
IBM Tivoli Netcool ConfigurationManager presentation and workerservers
Server 4
Performance Management forOperations Insight solution extension
Network Performance Insight Server 5 NetworkPerformanceInsight:Upgrading to V1.2.2
Service Management for OperationsInsight solution extension
Agile Service Manager Base Server 3
Server 6
Agile ServiceManagerdocumentationWelcome pageAgile Service Manager Observers Server 6
Upgrading to Netcool Operations Insight V1.4.1This procedure explains how to upgrade from Netcool Operations Insight V1.4.0.5to V1.4.1.
Downloading product and componentsIn order to upgrade from V1.4.0.5 to V1.4.1.2, you must download software fromPassport Advantage and Fix Central.
About this task
This scenario describes how to upgrade Netcool Operations Insight from V1.4.0.5to the current version, V1.4.1.2. The scenario assumes that Netcool OperationsInsight is deployed as shown in the simplified architecture in the following figure.Depending on how your Netcool Operations Insight system is deployed, you willneed to download the software and run the upgrade on different servers.
104 IBM Netcool Operations Insight: Integration Guide
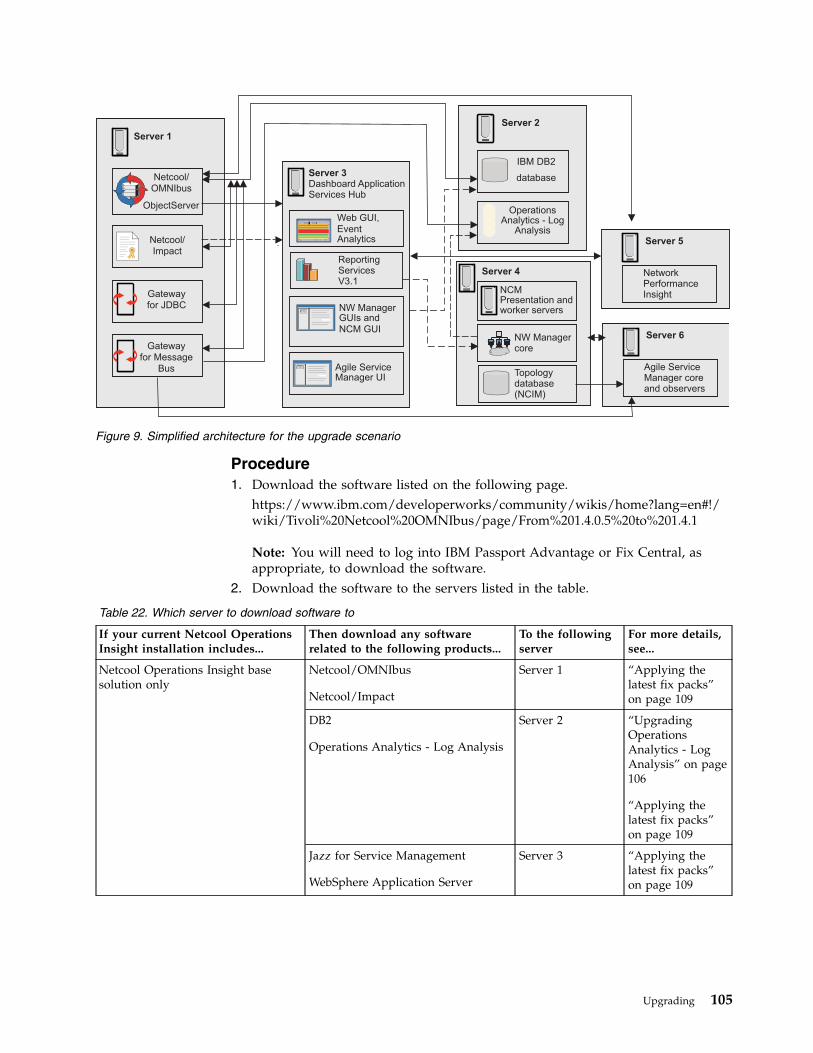
Procedure1. Download the software listed on the following page.
https://www.ibm.com/developerworks/community/wikis/home?lang=en#!/wiki/Tivoli%20Netcool%20OMNIbus/page/From%201.4.0.5%20to%201.4.1
Note: You will need to log into IBM Passport Advantage or Fix Central, asappropriate, to download the software.
2. Download the software to the servers listed in the table.
Table 22. Which server to download software to
If your current Netcool OperationsInsight installation includes...
Then download any softwarerelated to the following products...
To the followingserver
For more details,see...
Netcool Operations Insight basesolution only
Netcool/OMNIbus
Netcool/Impact
Server 1 “Applying thelatest fix packs”on page 109
DB2
Operations Analytics - Log Analysis
Server 2 “UpgradingOperationsAnalytics - LogAnalysis” on page106
“Applying thelatest fix packs”on page 109
Jazz for Service Management
WebSphere Application Server
Server 3 “Applying thelatest fix packs”on page 109
Server 1
Netcool/Impact
Gatewayfor JDBC
Gatewayfor Message
Bus
ObjectServer
Netcool/OMNIbus
Web GUI,EventAnalytics
Server 3
Dashboard ApplicationServices Hub
NW ManagerGUIs andNCM GUI
ReportingServicesV3.1
IBM DB2
database
OperationsAnalytics - Log
Analysis
Server 2
NW Managercore
Topologydatabase(NCIM)
Server 4
Server 5
NetworkPerformanceInsight
Server 6
Agile ServiceManager coreand observers
Agile ServiceManager UI
NCMPresentation andworker servers
Figure 9. Simplified architecture for the upgrade scenario
Upgrading 105

Table 22. Which server to download software to (continued)
If your current Netcool OperationsInsight installation includes...
Then download any softwarerelated to the following products...
To the followingserver
For more details,see...
Networks for Operations Insightsolution extension
Device Dashboard Server 3 “Upgrading theDeviceDashboard” onpage 107
Network Manager core components Server 4
Performance Management forOperations Insight solution extension
Network Performance Insight Server 5 “UpgradingNetworkPerformanceInsight” on page107
Service Management for OperationsInsight solution extension
Agile Service Manager Base Server 3
Server 6
“Installing AgileService Manager”on page 98
“Applying thelatest fix packs”on page 109
Agile Service Manager Observers Server 6
Related information:
Download Netcool Operations Insight
Passport Advantage
Fix Central
Upgrading Operations Analytics - Log AnalysisOptionally upgrade to Operations Analytics - Log Analysis V1.3.5 for OperationsAnalytics Advanced Insights V1.3.6, which is a fully licensed version of OperationsAnalytics - Log Analysis. By performing this upgrade, you are also able to installOperations Analytics - Log Analysis Service Desk Extension V1.1.
Procedure1. On the server where Operations Analytics - Log Analysis is installed (in our
example, server 2), extract the Operations Analytics - Log Analysis andOperations Analytics - Log Analysis Service Desk Extension eAssemblyarchives.
2. Start Installation Manager and configure it to point to the following repositoryfiles:v repository.config file for Operations Analytics - Log Analysis V1.3.5.v repository.config file for Operations Analytics - Log Analysis Service Desk
Extension V1.1.3. In the main Installation Manager window, click Update and complete wizard
instructions similar to the following in order to install the relevant OperationsAnalytics - Log Analysis package groups.a. In the Update Packages tab, select the product group to find related update
packages, and click Next. A list of the available update packages displays.b. From the list of available update packages, select the relevant version, and
click Next.c. In the Licenses tab, review the licenses. Select I accept the terms in the
license agreements and click Next.
106 IBM Netcool Operations Insight: Integration Guide

d. In the Features tab, select the features for your update package, and clickNext.
e. Complete the configuration details, and click Next.f. In the Summary tab, review summary details. If you need to change any
detail click Back, but if you are happy with summary details click Updateand wait for the installation of the update package to complete.
g. When the installation of the update package completes, the windowupdates with details of the installation. Click Finish.
What to do next
You must now migrate data from the previous version of Operations Analytics -Log Analysis. See the Operations Analytics - Log Analysis documentation for moreinformation.Related information:
Operations Analytics - Log Analysis V1.3.5 documentation: Migrating data
Upgrading Network Performance InsightUpgrade Network Performance Insight from V1.2.0 to V1.2.1.
About this task
Network Performance Insight has an inbuilt mechanism for performing productupgrades.
Procedure1. On the server where Network Performance Insight is installed (in our example,
server 5), extract the Network Performance Insight eAssembly archive.2. See the Network Performance Insight documentation for more information on
how to perform the upgrade.Related information:
Network Performance Insight V1.2.1 documentation: Upgrading
Network Performance Insight V1.2.1 documentation: Applying a fix pack
Upgrading the Device DashboardUpgrade the Device Dashboard to V1.1.0.2.Related concepts:“About the Device Dashboard” on page 95
Upgrading the Device DashboardPerform these steps to upgrade the Device Dashboard to V1.1.0.2.
Procedure1. On the server where Dashboard Application Services Hub is installed (in our
example, server 3), extract the Device Dashboard eAssembly archive.2. Start Installation Manager and configure it to point to the following repository
files: repository.config file for Device Dashboard V1.1.0.2.3. In the main Installation Manager window, click Update and complete wizard
instructions similar to the following in order to install the relevant DeviceDashboard package groups.
Upgrading 107

Note: If you installed Network Performance Insight and integrated this as partof your Netcool Operations Insight solution, then at the start of this process,Installation Manager asks for Ambari credentials. At this point you mustspecify your Ambari credentials. Ambari is configured during the NetworkPerformance Insight installation process and you would have configuredAmbari credentials at that time. Default credentials are as follows:v userid: adminv password: admina. In the Update Packages tab, select the product group to find related update
packages, and click Next. A list of the available update packages displays.b. From the list of available update packages, select the relevant version, and
click Next.c. In the Licenses tab, review the licenses. Select I accept the terms in the
license agreements and click Next.d. In the Features tab, select the features for your update package, and click
Next.e. Complete the configuration details, and click Next.f. In the Summary tab, review summary details. If you need to change any
detail click Back, but if you are happy with summary details click Updateand wait for the installation of the update package to complete.
g. When the installation of the update package completes, the windowupdates with details of the installation. Click Finish.
Configuring the Device DashboardIf Network Performance Insight is integrated this as part of your NetcoolOperations Insight solution, then you must also complete the followingconfiguration tasks.
Procedure1. Configure access to traffic flow data by performing the following steps:
a. Log into the Network Manager GUI server and navigate to the followingfile:$NMGUI_HOME/profile/etc/tnm/tnm.properties
Where $NMGUI_HOME location where the Network Manager GUIcomponents are installed. By default, this location is /opt/IBM/netcool/gui/precision_gui.
b. Open the tnm.properties file for editing.c. Add the following property:
tnm.npi.host.name=https://NPI_Server_Name:9443
Where NPI_Server_Name is the hostname of the Network PerformanceInsight server.
d. Save the tnm.properties file.2. Specify the Network Performance Insight version by performing the following
steps:a. Log into the Network Manager GUI server and navigate to the following
file:$NMGUI_HOME/profile/etc/tnm/npi.properties
108 IBM Netcool Operations Insight: Integration Guide

Where $NMGUI_HOME location where the Network Manager GUIcomponents are installed. By default, this location is /opt/IBM/netcool/gui/precision_gui.
b. Open the npi.properties file for editing.c. Add the following property:
npi.server.version=1.2.2.0
d. Save the npi.properties file.e. Restart the Dashboard Application Services Hub server to enable these
properties to take effect.
Installing Agile Service ManagerInstall Agile Service Manager V1.1.0 Core services, UI, and Observers.
Procedure1. To install the Agile Service Manager Core services, and Observers, proceed as
follows:a. On the server where Agile Service Manager Core services are installed (in
our example, server 6), extract the Agile Service Manager Base andObserver eAssembly archives.
b. Follow the instructions in the Agile Service Manager to complete theinstallation.
2. To install the Agile Service Manager UI, proceed as follows:a. On the server where Dashboard Application Services Hub is installed (in
our example, server 3), extract the Agile Service Manager Base eAssemblyarchive.
b. Start Installation Manager and configure it to point to the followingrepository files: repository.config file for Agile Service Manager
c. See the Agile Service Manager documentation for more information on howto perform the installation, and perform post-installation configurationtasks, such as configuring the Gateway for Message Bus to support theAgile Service Manager Event Observer.
Related information:
Agile Service Manager V1.1.0 documentation: Installing ASM core services
Agile Service Manager V1.1.0 documentation: Installing the ASM UI
Agile Service Manager V1.1.0 documentation: Configuring the Gateway forMessage Bus to support the Event Observer
Applying the latest fix packsApply any latest available fix packs to upgrade to the latest version of NetcoolOperations Insight.
About this task
Fix packs can be full image fix packs containing the full product image, or upgradefix packs, containing just the code for fix updates from the last release. Full imagefix packs are made available on Passport Advantage. Upgrade fix packs are madeavailable on Fix Central. For a list of any full image fix packs required for upgradeto the latest version of NOI, see the following link:
Upgrading 109

https://www.ibm.com/developerworks/community/wikis/home?lang=en#!/wiki/Tivoli%20Netcool%20OMNIbus/page/Upgrading
Procedure1. For each fix pack upgrade, start Installation Manager and configure it to point
to the repository.config file for the fix pack.2. In the main Installation Manager window, click Update and complete wizard
instructions similar to the following:a. In the Update Packages tab, select the product group to find related update
packages, and click Next. A list of the available update packages displays.b. From the list of available update packages, select the relevant version, and
click Next.c. In the Licenses tab, review the licenses. Select I accept the terms in the
license agreements and click Next.d. In the Features tab, select the features for your update package, and click
Next.e. Complete the configuration details, and click Next.f. In the Summary tab, review summary details. If you need to change any
detail click Back, but if you are happy with summary details click Updateand wait for the installation of the update package to complete.
g. When the installation of the update package completes, the windowupdates with details of the installation. Click Finish.
Related information:
Fix Central
Passport Advantage
Upgrading the Insight PackFollow these instructions to upgrade an existing Tivoli Netcool/OMNIbus InsightPack to V1.3.0.2. Upgrades are possible from V1.1, V1.1.0.1, V1.2.0.1, V1.3.0.0, andV1.3.0.1.
Procedure1. If you are upgrading from V1.1.0.0 or V1.1.0.1, back up $SCALA_HOME/
AppFramework/Apps/Dashboards/OMNIbus_Event_Dashboard.app. Either rename itor move it back to $SCALA_HOME/AppFramework/Apps/OMNIbusInsightPack_v1.1.0.0/ or $SCALA_HOME/AppFramework/Apps/OMNIbusInsightPack_v1.1.0.1/.
2. Back up the current Insight Pack directory, which is one of the following:v $SCALA_HOME/AppFramework/Apps/OMNIbusInsightPack_v1.1.0.0/
v $SCALA_HOME/AppFramework/Apps/OMNIbusInsightPack_v1.1.0.1/
v $SCALA_HOME/AppFramework/Apps/OMNIbusInsightPack_v1.1.0.2/
Important: Backup of the insight pack directory is critical due to a known issuewhere custom applications saved in $UNITY_HOME//AppFramework/Apps/OMNIbusInsightPack_v<VERSION> can be deleted on upgrade.
3. Copy OMNIbusInsightPack_v1.3.0.2.zip to $SCALA_HOME/unity_content/OMNIbus/. Then, run the following command to apply the upgrade:$SCALA_HOME/utilities/pkg_mgmt.sh -upgrade ../unity_content/OMNIbus/OMNIbusInsightPack_v1.3.0.2.zip
110 IBM Netcool Operations Insight: Integration Guide
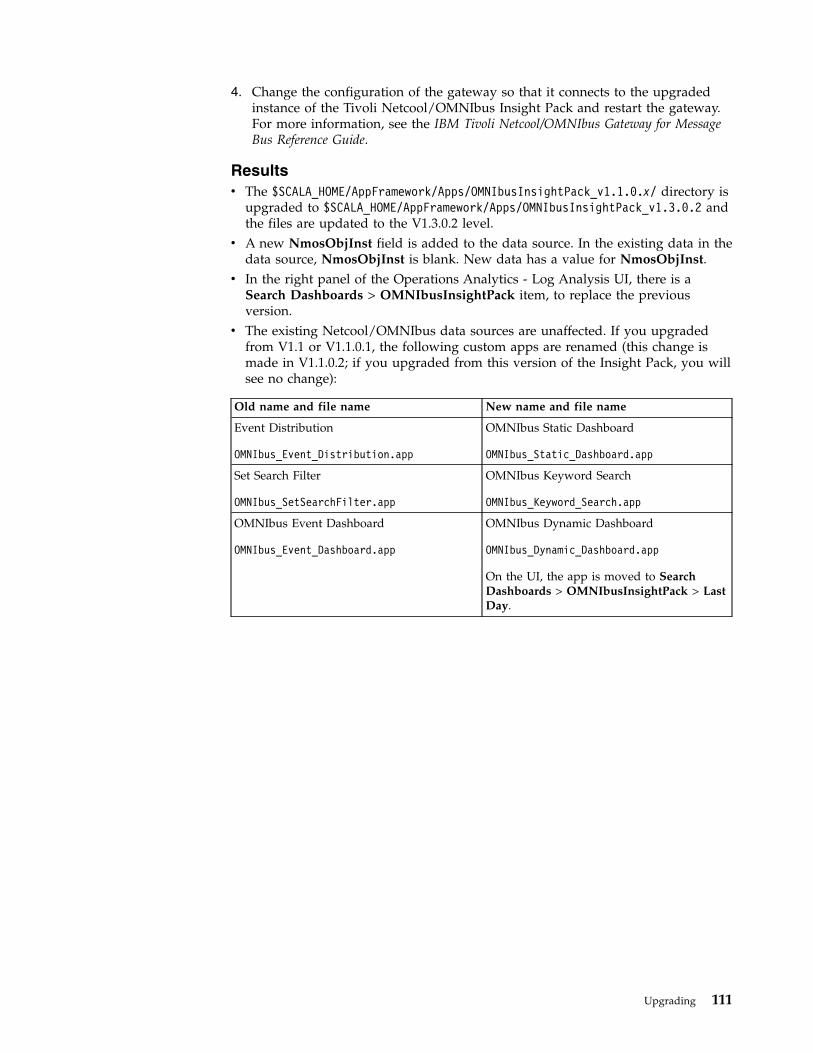
4. Change the configuration of the gateway so that it connects to the upgradedinstance of the Tivoli Netcool/OMNIbus Insight Pack and restart the gateway.For more information, see the IBM Tivoli Netcool/OMNIbus Gateway for MessageBus Reference Guide.
Resultsv The $SCALA_HOME/AppFramework/Apps/OMNIbusInsightPack_v1.1.0.x/ directory is
upgraded to $SCALA_HOME/AppFramework/Apps/OMNIbusInsightPack_v1.3.0.2 andthe files are updated to the V1.3.0.2 level.
v A new NmosObjInst field is added to the data source. In the existing data in thedata source, NmosObjInst is blank. New data has a value for NmosObjInst.
v In the right panel of the Operations Analytics - Log Analysis UI, there is aSearch Dashboards > OMNIbusInsightPack item, to replace the previousversion.
v The existing Netcool/OMNIbus data sources are unaffected. If you upgradedfrom V1.1 or V1.1.0.1, the following custom apps are renamed (this change ismade in V1.1.0.2; if you upgraded from this version of the Insight Pack, you willsee no change):
Old name and file name New name and file name
Event Distribution
OMNIbus_Event_Distribution.app
OMNIbus Static Dashboard
OMNIbus_Static_Dashboard.app
Set Search Filter
OMNIbus_SetSearchFilter.app
OMNIbus Keyword Search
OMNIbus_Keyword_Search.app
OMNIbus Event Dashboard
OMNIbus_Event_Dashboard.app
OMNIbus Dynamic Dashboard
OMNIbus_Dynamic_Dashboard.app
On the UI, the app is moved to SearchDashboards > OMNIbusInsightPack > LastDay.
Upgrading 111

112 IBM Netcool Operations Insight: Integration Guide
Event search
Event search applies the search and analysis capabilities of Operations Analytics -Log Analysis to events that are monitored and managed by TivoliNetcool/OMNIbus. Events are transferred from the ObjectServer through theGateway for Message Bus to Operations Analytics - Log Analysis, where they areingested into a datasource and indexed for searching. After the events are indexed,you can search every occurrence of real-time and historical events. The TivoliNetcool/OMNIbus Insight Pack is installed into Operations Analytics - LogAnalysis and provides custom apps that search the events based on variouscriteria. The custom apps can generate dashboards that present event informationto show how your monitoring environment is performing over time. Keywordsearches and dynamic drilldown functions allow you to go deeper into the eventdata for detailed information. The apps can be run from the Operations Analytics -Log Analysis. Tooling can be installed into the Web GUI that launches the appsfrom the right-click menus of the Event Viewer and the Active Event List. An“event reduction wizard” is also supplied that includes information and apps thatcan help you analyze and reduce volumes of events and minimize the “noise” inyour monitored environment.
Required products and components
Event search requires the following products and components:v Operations Analytics - Log Analysis V1.3.3 or V1.3.5. For the system
requirements of this product, including supported operating systems, see thefollowing topics:– Operations Analytics - Log Analysis V1.3.3: https://www.ibm.com/support/
knowledgecenter/SSPFMY_1.3.3/com.ibm.scala.doc/install/iwa_hw_sw_req_scen_c.html
– Operations Analytics - Log Analysis V1.3.5: https://www.ibm.com/support/knowledgecenter/SSPFMY_1.3.5/com.ibm.scala.doc/install/iwa_hw_sw_req_scen_c.html.
Note: Operations Analytics - Log Analysis Standard Edition is included inNetcool Operations Insight. For more information about Operations Analytics -Log Analysis editions, search for "Editions" at the Operations Analytics - LogAnalysis Knowledge Center, at https://www.ibm.com/support/knowledgecenter/SSPFMY.
v OMNIbusInsightPack_v1.3.0.2v Gateway for Message Bus V8.0v Netcool/OMNIbus core components V8.1.0 fix pack 7 or laterv Netcool/OMNIbus Web GUI V8.1.0 fix pack 5 or later
For the system requirements of the core components and Web GUI forNetcool/OMNIbus V8.1.0, see https://ibm.biz/BdRNaT,Related reference:“On-premises scenarios for Operations Management” on page 26
© Copyright IBM Corp. 2014, 2018 113

Netcool/OMNIbus Insight PackThe Netcool/OMNIbus Insight Pack enables you to view and search both historicaland real time event data from Netcool/OMNIbus in the IBM Operations Analytics- Log Analysis product.
The Insight Pack parses Netcool/OMNIbus event data into a format suitable foruse by Operations Analytics - Log Analysis. The event data is transferred fromNetcool/OMNIbus to Operations Analytics - Log Analysis by the IBM TivoliNetcool/OMNIbus Gateway for Message Bus (nco_g_xml). For more informationabout the Gateway for Message Bus, see http://www-01.ibm.com/support/knowledgecenter/SSSHTQ/omnibus/gateways/xmlintegration/wip/concept/xmlgw_intro.html.
For more information about integrating Netcool/OMNIbus and OperationsAnalytics - Log Analysis, see the IBM Netcool Operations Insight Integration Guide orIBM Knowledge Center at http://www.ibm.com/support/knowledgecenter/SSTPTP/welcome.
Before you begin
This README file is for the OMNIbusInsightPack_v1.3.0.2. It works only with thefollowing product versions. Ensure these product versions are installed in yourenvironment:v Operations Analytics - Log Analysis V1.3 or laterv Gateway for Message Bus V6.0v Netcool/OMNIbus Web GUI V8.1 fix pack 2, or later. Fix packs are available
from IBM Fix Central at http://www-933.ibm.com/support/fixcentral/.
After the Web GUI V8.1 fix pack is applied, check that the server.init has theseproperties set.
Property Value
scala.version 1.2.0.3
scala.app.keyword OMNIbus_Keyword_Search
scala.app.static.dashboard OMNIbus_Static_Dashboard
If you change the settings, restart the server. For more information, seehttp://www-01.ibm.com/support/knowledgecenter/SSSHTQ_8.1.0/com.ibm.netcool_OMNIbus.doc_8.1.0/webtop/wip/reference/web_con_initfileprops.html.
Content of the Insight Pack
The Insight Pack provides the following data ingestion artifacts:v A Rule Set (with annotator and splitter) that parses Netcool/OMNIbus event
data into Delimiter Separated Value (DSV) format.v A Source Type that matches the event fields in the Gateway for Message Bus
map file.v A Collection that contains the provided Source Type.v Custom apps, which are described in Table 23 on page 116.
114 IBM Netcool Operations Insight: Integration Guide

v A wizard to help you analyze and reduce event volumes, which is described in“Event reduction wizard” on page 119. The wizard also contains custom apps,which are described in Table 24 on page 119.
Tip: The data that is shown by the custom apps originates in the alerts.status tableof the Netcool/OMNIbus ObjectServer. For example, the Node identifies theentities from which events originate, such as hosts or device names. For moreinformation about the columns of the alerts.status table, see IBM KnowledgeCenter at http://www-01.ibm.com/support/knowledgecenter/SSSHTQ_8.1.0/com.ibm.netcool_OMNIbus.doc_8.1.0/omnibus/wip/common/reference/omn_ref_tab_alertsstatus.html.
Custom apps
The following table describes the custom apps. The apps are all launched from theOperations Analytics - Log Analysis UI. Some apps can also be launched fromevent lists in the Netcool/OMNIbus Web GUI, that is, the Event Viewer or ActiveEvent List (AEL). The configuration for launching the tools from the Web GUI isnot included in this Insight Pack. To obtain this configuration, install the latest fixpack of the Web GUI V8.1.
Event search 115

Table 23. Custom apps in the Netcool/OMNIbus Insight Pack
Name and file name of app Can alsobelaunchedfrom WebGUI eventlist
Description
OMNIbus Static Dashboard
OMNIbus_Static_Dashboard.app
Yes Opens a dashboard with charts thatshow the following event distributioninformation:
v Event Trend by Severity
v Event Storm by AlertGroup
v Event Storm by Node
v Hotspot by Node and AlertGroup
v Severity Distribution
v Top 5 AlertGroups Distribution
v Top 5 Nodes Distribution
v Hotspot by AlertGroup and Severity
The app searches against the specifieddata source, a time filter specified by theoperator when they launch the tool, andthe Node of the selected events. The appthen generates charts based on the eventsreturned by the search.
Charts supplied by the TivoliNetcool/OMNIbus Insight Pack havechanged in V1.3.0.2. The charts nowspecify a filter of NOT PubType:U whichensures that each event is counted onceonly, even if deduplications occur. Theexception is the keyword search customapp which searches all events, includingmodified ones.
In the Operations Analytics - LogAnalysis UI, the app requires data from asearch result before it can run. If you donot run search before you run the apps,an error is displayed.
1. To run a new search, click Addsearch and specify the string that youwant to search for.
2. A list of corresponding events isdisplayed in the search results.
3. In the left panel, click SearchDashboards > OMNIbusInsightPackand double-click Static EventDashboard.
116 IBM Netcool Operations Insight: Integration Guide

Table 23. Custom apps in the Netcool/OMNIbus Insight Pack (continued)
Name and file name of app Can alsobelaunchedfrom WebGUI eventlist
Description
OMNIbus Keyword Search
OMNIbus_Keyword_Search.app
Yes Uses information from the selectedevents to generate a keyword list withcount, data source filter, and time filterin Operations Analytics - Log Analysis.
The app generates the keyword list fromthe specified columns of the selectedevents. The default columns areSummary, Node, and AlertGroup. Theapp then creates the data source filterwith the value specified by the event listtool and creates the time filter with thevalue that was selected when the toolwas launched.
In the Operations Analytics - LogAnalysis UI, the app requires data from asearch result before it can run. If you donot run search before you run the apps,an error is displayed.
1. To run a new search, click Addsearch and specify the string that youwant to search for.
2. A list of corresponding events isdisplayed in the search results.Switch to the grid view and select therequired entries. Click a columnheader to select the entire column.
3. In the left panel, click SearchDashboards > OMNIbusInsightPackand double-click Keyword Search.
In the Search Patterns section, a list ofkeywords from the selected data isdisplayed. The event count associatedwith those keywords is in parentheses ().
Event search 117

Table 23. Custom apps in the Netcool/OMNIbus Insight Pack (continued)
Name and file name of app Can alsobelaunchedfrom WebGUI eventlist
Description
OMNIbus Dynamic Dashboard
OMNIbus_Dynamic_Dashboard.app
No Searches the events in the “omnibus”data source over the last day andgenerates a dashboard with eight charts.The charts are similar to the chartsgenerated by the OMNIbus StaticDashboard app but they also supportdrill down. You can double-click anydata point in the chart to open a searchworkspace that is scoped to the eventrecords that make up that data point.
To open the dashboard in the OperationsAnalytics - Log Analysis user interface,click Search Dashboards >OMNIbusInsightPack > Last_Day >Dynamic Event Dashboard. Thisdashboard is not integrated with theevent lists in the Web GUI.
OMNIbus_Operational_Efficiency
OMNIbus_Operational_Efficiency.app
No Searches the events from the “omnibus”data source over the last month andgenerates a dashboard with the followingcharts.
v Last Month - Top 10 AlertKeys:Shows the AlertKeys that generatedthe most events, distributed byseverity.
v Last Month - Top 10 AlertGroups:Shows the AlertGroups that generatedthe most events, distributed byseverity.
v Last Month - Top 10 Node: Shows theNodes that generated the most events,distributed by severity.
v Last Month - Hotspot by Node,Group, AlertKey: Combines the threeother charts to show the Nodes,AlertGroups, and AlertKeys thatgenerated the most events in a treemap.
To open the dashboard in the OperationsAnalytics - Log Analysis user interface,click Search Dashboards >OMNIbusInsightPack > Last_Month >Operational Efficiency. This dashboardis not integrated with the event lists inthe Web GUI.
118 IBM Netcool Operations Insight: Integration Guide

Event reduction wizard
The Event_Analysis_And_Reduction app is a guide to analyzing events in yourenvironment and reducing event volumes. It consists of three sets of informationand seven custom apps. The information is designed to help you understand theorigin of high event volumes in your environment and create an action plan toreduce volumes. The information is in the first three nodes of theEvent_Analysis_And_Reduction node on the UI:OMNIbus_Analyze_and_reduce_event_volumes, OMNIbus_Helpful_links, andOMNIbus_Introduction_to_the_Apps. The seven custom apps analyze the originsof the high event volumes in your environment. They are described in thefollowing table. For the best results, run the apps in the order that is given here.The wizard and the app that it contains can be run only from the OperationsAnalytics - Log Analysis UI.
Table 24. Custom apps in the Event_Analysis_And_Reduction wizard
Name and file name ofapp Description
OMNIbus_Show_Event_1_Trend_Severity
OMNIbus_Show_Event_1_Trend_Severity.app
Shows charts with five common dimensions for analyzing trendsin event volumes over time:
v Event trends by severity for the past hour, aggregated byminute.
v Event trends by severity for the past day, aggregated by hour.
v Event trends by severity for the past week, aggregated by day.
v Event trends by severity for the past month, aggregated byweek.
v Event trends by severity for the past year, aggregated bymonth.
OMNIbus_Show_Event_2_HotSpots_Node
OMNIbus_Show_Events_2_HotSpots_Node.app
Analyzes events by node, that is, the entities from which eventsoriginate. Examples include the source end point system, EMS orNMS, probe or gateway, and so on. You can modify this app toanalyze the manager field, so that it shows the top eventvolumes by source system or integration. The app has thefollowing charts:
v The 20 nodes with the highest event counts over the past hour.
v The 20 nodes with the highest event counts over the past day.
v The 20 nodes with the highest event counts over the pastweek.
v The 20 nodes with the highest event counts over the pastmonth.
v The 20 nodes with the highest event counts over the past year.
OMNIbus_Show_Event_3_HotSpots_AlertGroup
OMNIbus_Show_Events_3_HotSpots_AlertGroup.app
Analyzes the origin of events by the classification that iscaptured in the AlertGroup field, for example, the type ofmonitoring agent, or situation. The app has the following charts:
v The 20 AlertGroups with the highest event counts over thepast hour.
v The 20 AlertGroups with the highest event counts over thepast day.
v The 20 AlertGroups with the highest event counts over thepast week.
v The 20 AlertGroups with the highest event counts over thepast month.
v The 20 AlertGroups with the highest event counts over thepast year.
Event search 119
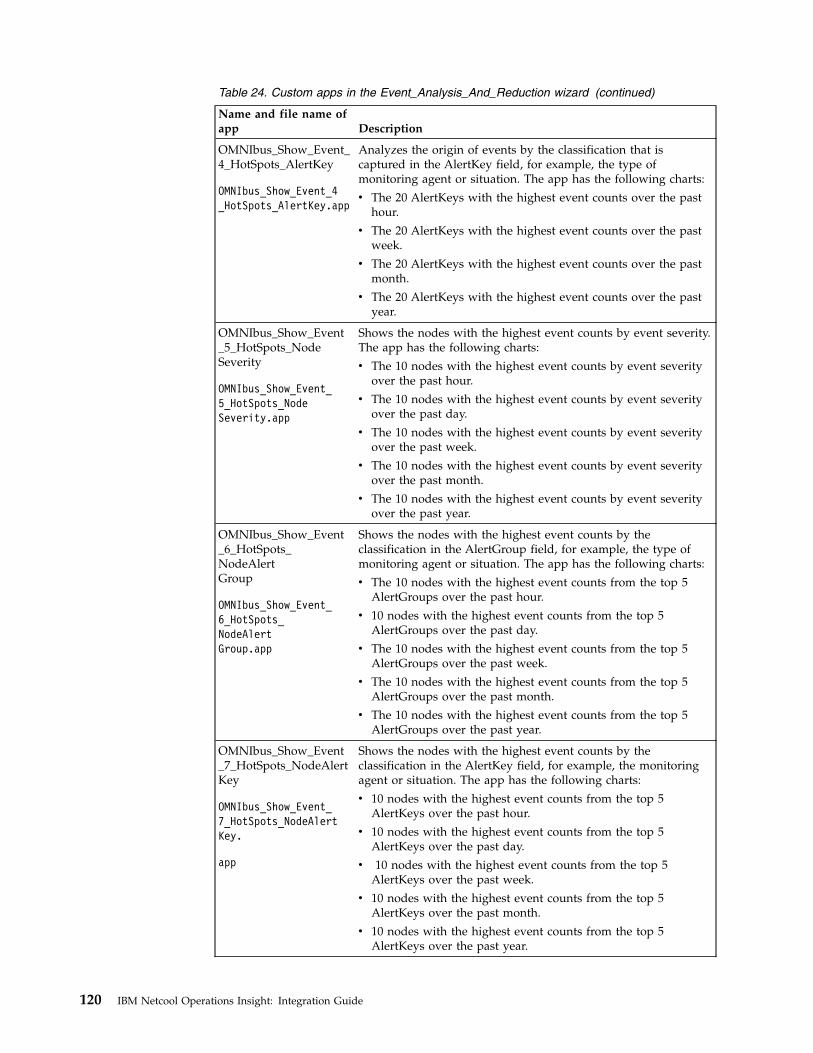
Table 24. Custom apps in the Event_Analysis_And_Reduction wizard (continued)
Name and file name ofapp Description
OMNIbus_Show_Event_4_HotSpots_AlertKey
OMNIbus_Show_Event_4_HotSpots_AlertKey.app
Analyzes the origin of events by the classification that iscaptured in the AlertKey field, for example, the type ofmonitoring agent or situation. The app has the following charts:
v The 20 AlertKeys with the highest event counts over the pasthour.
v The 20 AlertKeys with the highest event counts over the pastweek.
v The 20 AlertKeys with the highest event counts over the pastmonth.
v The 20 AlertKeys with the highest event counts over the pastyear.
OMNIbus_Show_Event_5_HotSpots_NodeSeverity
OMNIbus_Show_Event_5_HotSpots_NodeSeverity.app
Shows the nodes with the highest event counts by event severity.The app has the following charts:
v The 10 nodes with the highest event counts by event severityover the past hour.
v The 10 nodes with the highest event counts by event severityover the past day.
v The 10 nodes with the highest event counts by event severityover the past week.
v The 10 nodes with the highest event counts by event severityover the past month.
v The 10 nodes with the highest event counts by event severityover the past year.
OMNIbus_Show_Event_6_HotSpots_NodeAlertGroup
OMNIbus_Show_Event_6_HotSpots_NodeAlertGroup.app
Shows the nodes with the highest event counts by theclassification in the AlertGroup field, for example, the type ofmonitoring agent or situation. The app has the following charts:
v The 10 nodes with the highest event counts from the top 5AlertGroups over the past hour.
v 10 nodes with the highest event counts from the top 5AlertGroups over the past day.
v The 10 nodes with the highest event counts from the top 5AlertGroups over the past week.
v The 10 nodes with the highest event counts from the top 5AlertGroups over the past month.
v The 10 nodes with the highest event counts from the top 5AlertGroups over the past year.
OMNIbus_Show_Event_7_HotSpots_NodeAlertKey
OMNIbus_Show_Event_7_HotSpots_NodeAlertKey.
app
Shows the nodes with the highest event counts by theclassification in the AlertKey field, for example, the monitoringagent or situation. The app has the following charts:
v 10 nodes with the highest event counts from the top 5AlertKeys over the past hour.
v 10 nodes with the highest event counts from the top 5AlertKeys over the past day.
v 10 nodes with the highest event counts from the top 5AlertKeys over the past week.
v 10 nodes with the highest event counts from the top 5AlertKeys over the past month.
v 10 nodes with the highest event counts from the top 5AlertKeys over the past year.
120 IBM Netcool Operations Insight: Integration Guide

By default the custom apps include all events. To exclude certain events, forexample, events that occur during maintenance windows, customise the searchquery used in the custom apps. For more information, see Customizing the Apps.
Configuring event searchThis section describes how to configure the integration of the Netcool/OMNIbusand Operations Analytics - Log Analysis products. Events are forwarded fromNetcool/OMNIbus to Operations Analytics - Log Analysis by the Gateway forMessage Bus.
Before you beginv Use a supported combination of product versions. For more information, see
“Required products and components” on page 113. The best practice is to installthe products in the following order:1. Netcool/OMNIbus V8.1.0 and the Web GUI2. Gateway for Message Bus. Install the gateway on the same host as the
Netcool/OMNIbus product.3. Operations Analytics - Log Analysis, see one of the following links:
– V1.3.5: see https://www.ibm.com/support/knowledgecenter/SSPFMY_1.3.5/com.ibm.scala.doc/install/iwa_install_ovw.html
– V1.3.3: see https://www.ibm.com/support/knowledgecenter/SSPFMY_1.3.3/com.ibm.scala.doc/install/iwa_install_ovw.html
https://ibm.biz/BdXeZk4. Netcool/OMNIbus Insight Pack, see the Netcool/OMNIbus Insight Pack
README.
Tip: The best practice is to install the Web GUI and Operations Analytics - LogAnalysis on separate hosts.
Restriction: Operations Analytics - Log Analysis does not support installation inGroup mode of IBM Installation Manager.
v Ensure that the ObjectServer that forwards event data to Operations Analytics -Log Analysis has the NmosObjInst column in the alerts.status table.NmosObjInst is supplied by default and is required for this configuration. Youcan use ObjectServer SQL commands to check for the column and to add it if itis missing, as follows.– Use the DESCRIBE command to read the columns of the alerts.status table.– Use the ALTER COLUMN setting with the ALTER TABLE command to add
NmosObjInst to the alerts.status table.
For more information about the alerts.status table and ObjectServer SQLcommands, see the IBM Tivoli Netcool/OMNIbus Administration Guide.
v Configure the Web GUI server.init file as follows:
Note: The default values do not have to be changed on Web GUI V8.1.0 fix pack5 or later.scala.app.keyword=OMNIbus_Keyword_Searchscala.app.static.dashboard=OMNIbus_Static_Dashboardscala.datasource=omnibusscala.url=protocol://host:portscala.version=1.2.0.3
Event search 121

Restart the server if you change any of these values. See the IBM TivoliNetcool/OMNIbus Web GUI Administration and User's Guide.
v Select and plan a deployment scenario. See “On-premises scenarios forOperations Management” on page 26. If your deployment uses the Gateway forMessage Bus for forwarding events via the IDUC channel, you can skip step 5on page 123. If you use the AEN client for forwarding events, complete all steps.
v Start the Operations Analytics - Log Analysis product.v Familiarize yourself with the configuration of the Gateway for Message Bus. See
the IBM Tivoli Netcool/OMNIbus Reference Guide. Knowledge of the gateway isrequired for steps 1, 5 on page 123, and 6 on page 124 of this task.
Procedure
The term data source has a different meaning, depending on which product youconfigure. In the Web GUI, a data source is always an ObjectServer. In theOperations Analytics - Log Analysis product, a data source is a source of raw data,usually log files. In the context of the event search function, the OperationsAnalytics - Log Analysis data source is a set of Netcool/OMNIbus events.1. Configure the Gateway for Message Bus. At a high-level, this involves the
following:v Creating a gateway server in the Netcool/OMNIbus interfaces filev Configuring the G_SCALA.props properties file, including specifying the .map
mapping file.v Configuring the endpoint in the scalaTransformers.xml filev Configuring the SSL connection, if requiredv Configuring the transport properties in the scalaTransport.properties file
For more information about configuring the gateway, see the IBM TivoliNetcool/OMNIbus Gateway for Message Bus Reference Guide.
2. If you are ingesting data that is billable, and do not want data ingested into theNetcool Operations Insight data source to be included in the usage statistics,you need to set the Netcool Operations Insight data source as non-billable. Addthe path to your data source (default is NCOMS, see following step) to a seedfile and restart Operations Analytics - Log Analysis as described in one of thefollowing topics:v V1.3.5: see https://www.ibm.com/support/knowledgecenter/SSPFMY_1.3.5/
com.ibm.scala.doc/admin/iwa_nonbill_ds_t.htmlv V1.3.3: see https://www.ibm.com/support/knowledgecenter/SSPFMY_1.3.3/
com.ibm.scala.doc/admin/iwa_nonbill_ds_t.html
Note: Ensure you follow this step before you configure an “omnibus” datasource for Netcool/OMNIbus events.
3. In Operations Analytics - Log Analysis, start the Add Data Source wizard andconfigure an “omnibus” data source for Netcool/OMNIbus events. Only asingle data source is required. The event management tools in the Web GUIsupport a single data source only.a. In the Select Location panel, select Custom and type the Netcool/OMNIbus
server host name. Enter the same host name that was used for theJsonMsgHostname transport property of the Gateway for Message Bus.
b. In the Select Data panel, enter the following field values:
122 IBM Netcool Operations Insight: Integration Guide

Field Value
File path NCOMS. This is the default value of thejsonMsgPath transport property of theGateway for Message Bus. If you changedthis value from the default, change the valueof the File path field accordingly.
Type This is the name of the data source type onwhich this data source is based.
v To use the default data source type,specify OMNIbus1100.
v To use a customized data source type,specify the name of the customized datasource type; for example: customOMNIbus
Collection OMNIbus1100-Collection
c. In the Set Attributes panel, enter the following field values:
Field Value
Name omnibus. Ensure that the value that you typeis the same as the value of thescala.datasource property in the Web GUIserver.init file. If the Name field has avalue other than omnibus, use the samevalue for the scala.datasource property.
Group Leave this field blank.
Description Type a description of your choice.
4. Configure access to the data source you set up in the previous step. Thisinvolves the following steps in the administrative settings for OperationsAnalytics - Log Analysis:a. Create a role using the Roles tab, for example, noirole, and ensure you
assign the role permission to access the data source.b. Add a user, for example, noiuser, and assign the role you created that has
permissions to access the data source (in this example, noirole).For information about creating and modifying users and roles in OperationsAnalytics - Log Analysis, see one of the following links:v V1.3.5: see https://www.ibm.com/support/knowledgecenter/SSPFMY_1.3.5/
com.ibm.scala.doc/config/iwa_config_pinstall_userrole_ovw_c.htmlv V1.3.3: see https://www.ibm.com/support/knowledgecenter/SSPFMY_1.3.3/
com.ibm.scala.doc/config/iwa_config_pinstall_userrole_ovw_c.html
.
Note: The contents of the Netcool/OMNIbus Insight Pack dashboards areempty unless you log in with a user that has a role assigned with permissionsto access the data source.
5. Configure the Accelerated Event Notification (AEN) client:a. Configure AEN event forwarding in the Gateway for Message Bus.b. Configure the AEN channel and triggers in each ObjectServer by enabling
the following postinsert triggers and trigger group:v scala_triggersv scala_insert
Event search 123

v scala_reinsert
These items are included in the default configuration of the ObjectServer, aswell as the SQL commands to configure the AEN channel, but they aredisabled by default. For more information about configuring the AEN clientin an integration with the Operations Analytics - Log Analysis product,search for Configuring event forwarding using AEN in the IBM TivoliNetcool/OMNIbus Gateway for Message Bus Reference Guide..
6. Start the Gateway for Message Bus in SCA-LA mode. The gateway beginssending Netcool/OMNIbus events to Operations Analytics - Log Analysis.
7. Install the Web GUI with the event search feature. For more information, seethe IBM Tivoli Netcool/OMNIbus Installation and Deployment Guide.
Results
After the configuration is complete, you can search for Netcool/OMNIbus eventsin Operations Analytics - Log Analysis. You can also use the Web GUI eventmanagement tools to launch into Operations Analytics - Log Analysis to displayevent data.
What to do nextv Install any available interim fixes and fix packs for the Operations Analytics -
Log Analysis product, which are available from IBM Fix Central athttp://www.ibm.com/support/fixcentral/.
v You can customize event search in the following ways:– Change the Operations Analytics - Log Analysis index configuration. For
more information, see the Netcool/OMNIbus Insight Pack readme file. If youchange the index configuration, also change the map file of the Gateway forMessage Bus. After the map file is changed, restart the gateway. For moreinformation, search for Map definition file in the Gateway for Message Busdocumentation.
– Customize the Operations Analytics - Log Analysis custom apps that are inthe Insight Pack, or create new apps. For more information, see theNetcool/OMNIbus Insight Pack readme file.
– Customize the Web GUI event list tools. For more information, see“Customizing event management tools” on page 126.
v If the Web GUI and Operations Analytics - Log Analysis are on the same host,configure single sign-on to prevent browser sessions expiring. See “Configuringsingle sign-on for the event search capability” on page 125.
Related tasks:“Customizing event management tools” on page 126
Configuring triggers“Using Event Search” on page 130Related reference:
unity.sh command (for starting SmartCloud Analytics - Log Analysis V1.3.5)
unity.sh command (for starting SmartCloud Analytics - Log Analysis V1.3.3)Related information:
Gateway for Message Bus documentation
124 IBM Netcool Operations Insight: Integration Guide

Configuring single sign-on for the event search capabilityConfigure single sign-on (SSO) between Web GUI and Operations Analytics - LogAnalysis so that users can switch between the two products without having to login each time.
Before you begin
Before performing this task, ensure that the following requirements are met:v All server instances are in same domain; for example, domain_name.uk.ibm.com.v LTPA keys are the same across all server instances.v The LTPA cookie name that is used in Operations Analytics - Log Analysis must
contain the string ltpatoken.
About this task
First create dedicated users in your LDAP directory, which must be used by bothWeb GUI and Operations Analytics - Log Analysis for user authentication, andthen configure the SSO connection.
Table 25. Quick reference for configuring single sign-on
Step Action More information
1. Create the dedicated users and groups in your LDAPdirectory. For example:
1. Create a new Organization Unit (OU) namedNetworkManagement.
2. Under the NetworkManagement OU, create a newgroup named webguildap.
3. Under the NetworkManagement OU, create thefollowing new users: webgui1, webgui2, webgui3,and webgui4.
4. Add the new users to the webguildap group.
The LDAP groups that you want to use in WebGUI must have roles that Web GUI recognizes.For more information, see the following topic:Configuring user authentication for Web GUIagainst an LDAP directory.
2. In the Web GUI, assign the ncw_admin and ncw_userroles to the webguildap group that you created in step1.
For more information see the following topics:
v Assigning roles to Web GUI users andgroups
v Web GUI roles
3. Configure Dashboard Application Services Hub andOperations Analytics - Log Analysis to use the sameLDAP directory for authentication.
For more information on configuring theseproducts to use LDAP, see the followingtopics:
v Configuring Dashboard Application ServicesHub to use LDAP
v Configuring Operations Analytics - LogAnalysis to use LDAP
4. Configure Dashboard Application Services Hub forsingle sign-on. This enables users to access all of theapplications running in Dashboard Application ServicesHub by logging in only once.
For more information see the following topic:Configuring Dashboard Application ServicesHub for single sign-on.
Event search 125

Table 25. Quick reference for configuring single sign-on (continued)
Step Action More information
5. Configure the SSO connection from the OperationsAnalytics - Log Analysis product to the DashboardApplication Services Hub instance in which the WebGUI is hosted. The following steps of the OperationsAnalytics - Log Analysis SSO configuration areimportant:
v Export LTPA keys from the Jazz for ServiceManagement server.
v Update LA ldapRegistryHelper.properties file.
v Run the LA ldapRegistryHelper.sh script.
v Configure LTPA on the Liberty Profile for WAS (copyLTPA keys from Jazz)
For more information see the following topic:Configuring SSO for Operations Analytics -Log Analysis with Jazz for ServiceManagement
6. Assign Operations Analytics - Log Analysis roles to theusers and groups that you created in step 1.
7. In the $SCALAHOME/wlp/usr/servers/Unity/server.xml/server.xml file, ensure that the <webAppSecurity>element has a httpOnlyCookies="false" attribute.
Add this line before the closing </server> element. Forexample:
<webAppSecurity ssoDomainNames="hostname"httpOnlyCookies="false"/></server>
Where The httpOnlyCookies="false" attribute disablesthe httponly flag on the cookie that is generated byOperations Analytics - Log Analysis and is required toenable SSO with the Web GUI
Related tasks:
Configuring user authentication for the Web GUI against LDAP directories
Assigning roles to Web GUI users and groups
Configuring SSO with Operations Analytics - Log Analysis V1.3.5
Configuring SSO with Operations Analytics - Log Analysis V1.3.3Related reference:
Web GUI roles“Troubleshooting event search” on page 135
Customizing event management toolsThe tools in the Event Viewer and AEL search for event data based on fields fromthe Netcool/OMNIbus ObjectServer. The fields are specified by URLs that arecalled when the Operations Analytics - Log Analysis product is started from thetools. You can change the URLs in the tools from the default event fields to searchon fields of your choice.
For example, the Search for similar events > 15 minutes before event tool filtersevents on the AlertGroup, Type, and Severity fields. The default URL is:
126 IBM Netcool Operations Insight: Integration Guide

$(SERVER)/integrations/scala/Search?queryFields=AlertGroup,Type,Severity&queryValuesAlertGroup={$selected_rows.AlertGroup}&queryValuesType={CONVERSION($selected_rows.Type)}&queryValuesSeverity={CONVERSION($selected_rows.Severity)}&firstOccurrences={$selected_rows.FirstOccurrence}&timePeriod=15&timePeriodUnits=minutes
About this task
You can change the URLs in the following ways:v Change the scalaIntegration.xml configuration file and apply the changes with
the Web GUI runwaapi command that is included in the Web GUIAdministration API (WAAPI) client.
v Change the tool configuration in the Web GUI Administration console page.
Procedure
As an example, the following steps show how to use each method to change theURLs in the Search for similar events > 15 minutes before event tool to search onthe AlertKey and Location event fields.v To change the URLs in the scalaIntegration.xml configuration file:
1. In WEBGUI_HOME/extensions/LogAnalytics/scalaIntegration.xml, or theequivalent XML file if you use a different file, locate the following <tool>element:<tool:tool name="scalaSearchByEvent15Minutes">
2. Change the URL in this element as follows. The changes are shown in boldtext:<tool:cgiurl foreach="true" windowforeach="false" target="_blank" method="GET"url="$(SERVER)/integrations/scala/Search?queryFields=AlertKey,Location&queryValuesAlertKey={$selected_rows.AlertKey}&queryValuesLocation={$selected_rows.Location}&firstOccurrences={$selected_rows.FirstOccurrence}&timePeriod=15&timePeriodUnits=minutes"></tool:cgiurl>
3. Use the runwaapi command to reinstall the tools:runwaapi -file scalaIntegration.xml
4. Reinstall the following tool menus to the Event Viewer or AEL alerts menuitem:– scalaStaticDashboard– scalaSimilarEvents– scalaEventByNode– scalaKeywordSearch
v To change the URLs on the Administration page:1. In the Web GUI, click Administration > Event Management Tools > Tool
Creation. Then, on the Tool Creation page, locate thescalaSearchByEvent15Minutes tool.
2. Change the URL as follows. The changes are shown in bold text:$(SERVER)/integrations/scala/Search?queryFields=AlertKey,Location&queryValuesAlertKey={$selected_rows.AlertKey}&queryValuesLocation={$selected_rows.Location}&firstOccurrences={$selected_rows.FirstOccurrence}&timePeriod=15&timePeriodUnits=minutes
Event search 127

3. Refresh the Event Viewer or AEL so that the changes to the tool URL areloaded.
What to do nextv The Gateway for Message Bus uses a lookup table to convert the Severity, Type,
and Class event field integer values to strings. After a tool is changed orcreated, use the CONVERSION function to change these field values to the stringsthat are required by Operations Analytics - Log Analysis.
v Change the other tools in the menu so that they search on the same field. It ismore efficient to change the configuration file and then use the runwaapicommand than to change each tool in the UI. The following table lists the namesof the event management menu items and tools that are displayed in the ToolCreation and Menu Configuration pages.
Table 26. Web GUI menu and tool names
Menu item Menu item name Tool Tool name
Search for events by node scalaEventByNode 15 minutes before event scalaSearchByNode15Minutes
1 hour before event scalaSearchByNode1Hour
1 day before event scalaSearchByNode1Day
1 week before event scalaSearchByNode1Week
1 month before event scalaSearchByNode1Month
1 year before event scalaSearchByNode1Year
Custom ... scalaSearchByNodeCustom
Search for similar events scalaSimilarEvents 15 minutes before event scalaSearchByEvent15Minutes
1 hour before event scalaSearchByEvent1Hour
1 day before event scalaSearchByEvent1Day
1 week before event scalaSearchByEvent1Week
1 month before event scalaSearchByEvent1Month
1 year before event scalaSearchByEvent1Year
Custom ... scalaSearchByEventCustom
Show event dashboard bynode
scalaStaticDashboard 15 minutes before event scalaEventDistributionByNode15Minutes
128 IBM Netcool Operations Insight: Integration Guide

Table 26. Web GUI menu and tool names (continued)
Menu item Menu item name Tool Tool name
1 hour before event scalaEventDistributionByNode1Hour
1 day before event scalaEventDistributionByNode1Day
1 week before event scalaEventDistributionByNode1Week
1 month before event scalaEventDistributionByNode1Month
1 year before event scalaEventDistributionByNode1Year
Custom ... scalaEventDistributionByNodeCustom
Show keywords and eventcount
scalaKeywordSearch 15 minutes before event scalaSetSearchFilter15Minutes
1 hour before event scalaSetSearchFilter1Hour
1 day before event scalaSetSearchFilter1Day
1 week before event scalaSetSearchFilter1Week
1 month before event scalaSetSearchFilter1Month
1 year before event scalaSetSearchFilter1Year
Custom ... scalaSetSearchFilterCustom
v The Show event dashboard by node and Show keywords and event counttools start the OMNIbus Static Dashboard and OMNIbus Keyword Searchcustom apps in Operations Analytics - Log Analysis. For more information aboutcustomizing the apps, see the Insight Pack documentation atftp://public.dhe.ibm.com/software/tivoli/Netcool/NetcoolOperationsInsight/library/opsinsight130/
Related tasks:“Using Event Search” on page 130
Adding custom apps to the Table View toolbarTo quickly launch custom apps, add them to the Table View toolbar of theOperations Analytics - Log Analysis UI. It is good practice to add theOMNIbus_Keyword_Search.app and OMNIbus_Static_Dashboard.app apps to thetoolbar.
Procedurev To add the OMNIbus_Keyword_Search.app app, use a configuration that is similar
to the following example:{"url": "https://hostname:9987/Unity/CustomAppsUI?name=OMNIbus_Keyword_Search&appParameters=[]","icon": "https://hostname:9987/Unity/images/keyword-search.png","tooltip": "OMNIbus Keyword Search"}
Event search 129

Where hostname is the fully qualified domain name of the Operations Analytics -Log Analysis host and keyword-search is the file name for a .png file thatrepresents the app on the toolbar. Create your own .png file.
v To add the OMNIbus_Static_Dashboard.app app, use a configuration that issimilar to the following example:{"url": "https://hostname:9987/Unity/CustomAppsUI?name=OMNIbus_Static_Dashboard&appParameters=[]","icon": "https://hostname:9987/Unity/images/dashboard.png","tooltip": "OMNIbus Static Dashboard"}
Where hostname is the fully qualified domain name of the Operations Analytics -Log Analysis host and dashboard is the file name for a .png file that representsthe app on the toolbar. Create your own .png file.
Related reference:“Netcool/OMNIbus Insight Pack” on page 114Related information:
Adding a shortcut to a Custom App to the Table view toolbar (OperationsAnalytics - Log Analysis V1.3.5)
Adding a shortcut to a Custom App to the Table view toolbar (OperationsAnalytics - Log Analysis V1.3.3)
Using Event SearchThe event search tools can find the root cause of problems that are generating largenumbers of events in your environment. The tools can detect patterns in the eventdata that, for example, can identify the root cause events that cause event storms.They can save you time that would otherwise be spent manually looking for theevent that is causing problems. You can quickly pinpoint the most importantevents and issues.
The tools are built into the Web GUI event lists (AEL and Event Viewer). They runsearches against the event data, based on default criteria, filtered over specific timeperiods. You can search against large numbers of events. You can change thesearch criteria and specify different time filters. When run, the tools start theOperations Analytics - Log Analysis product, where the search results aredisplayed.
Before you beginv Set up the environment for event search. See “Configuring event search” on
page 121.v Familiarize yourself with the Operations Analytics - Log Analysis search
workspace.– If you are using V1.3.3, then see http://www-01.ibm.com/support/
knowledgecenter/SSPFMY_1.3.3/com.ibm.scala.doc/use/iwa_using_ovw.html.
– If you are using V1.3.5, then see http://www-01.ibm.com/support/knowledgecenter/SSPFMY_1.3.5/com.ibm.scala.doc/use/iwa_using_ovw.html.
v To understand the event fields that are indexed for use in event searches,familiarize yourself with the ObjectServer alerts.status table. See
130 IBM Netcool Operations Insight: Integration Guide

http://www-01.ibm.com/support/knowledgecenter/SSSHTQ_8.1.0/com.ibm.netcool_OMNIbus.doc_8.1.0/omnibus/wip/common/reference/omn_ref_tab_alertsstatus.html.
Procedurev To start using the event search tools, select one or more events from an event list
and right-click. From the right-click menu, click Event Search, click a tool, andclick a time filter. The tools are as follows:
Tool Description
Show event dashboard by node Searches for all events that originate fromthe same host name, service name, or IPaddress, which is equivalent to the Nodefield of the ObjectServer alerts.status table.
Search for similar events Searches for all events that have the samefailure type, type, and severity as theselected events. The failure type equates tothe AlertGroup field of the alerts.statustable. The type equates to the Type field.The severity equates to the Severity field.
Search for events by node Searches for all events that originate fromthe same source, that is, host name, servicename, or IP address. This is equivalent tothe Node field of the alerts.status table. Theresults are displayed in a list in in theOperations Analytics - Log Analysis GUI.
Show keywords and event count Extracts a list of keywords from the text ofthe event summary, event source, and failuretype. The event summary text equates to theSummary field of the alerts.status table. Theevent source equates to the Node field. Thefailure type equates to the AlertGroup field.
The time filters are calculated from the time stamp of the selected event orevents. The Operations Analytics - Log Analysis time stamp is equivalent to theFirstOccurrence field of the ObjectServer alerts.status table. The default timefilters are as follows. If you click Custom specify an integer and unit of time,such as 15 weeks.– 15 minutes before event
– 1 hour before event
– 1 day before event
– 1 week before event
– 1 month before event
– 1 year before event
– Custom ...
If a single event is selected that has the time stamp 8 January 2014 08:15:26 AM,and you click Search for events by node > 1 hour before event, the result isfiltered on the following time range: (8 January 2014 07:15:26 AM) to (8 January2014 08:15:26 AM).If multiple events are selected, the time filter is applied from the earliest to themost recent time stamp. For three events that have the time stamps 1 January2014 8:28:46 AM, 7 January 2014 8:23:20 AM, and 8 January 2014 8:15:26 AM, the
Event search 131

Search for events by node > 1 week before event, returns matching events inthe following time range: (25 December 2013 08:28:46 AM) to (08 January 201408:15:26 AM).
Restriction: The Web GUI and Operations Analytics - Log Analysis process timestamps differently. The Web GUI recognizes hours, minutes, and seconds butOperations Analytics - Log Analysis ignores seconds. This problem affects theShow event dashboard by node and Search for events by node. If the timestamp 8 January 2014 07:15:26 AM is passed, Operations Analytics - LogAnalysis interprets this time stamp as 8 January 2014 07:15 AM. So, the results ofsubsequent searches might differ from the search that was originally run.The results are displayed differently depending on the tool. The time filter hasno effect on how the results are displayed.
Tool How search results are displayed
Show event dashboard by node A dashboard is opened for the OMNIbusStatic Dashboard custom app that shows thefollowing information about the distributionof the matching events:
v Event Trend by Severity
v Event Storm by AlertGroup
v Event Storm by Node
v Hotspot by Node and AlertGroup
v Severity Distribution
v Top 5 AlertGroups Distribution
v Top 5 Nodes Distribution
v Hotspot by AlertGroup and Severity
For more information about the OMNIbusStatic Dashboard custom app, see the TivoliNetcool/OMNIbus Insight Pack READMEfile.
Search for similar eventsandSearch for events by node
The results are displayed in the searchtimeline, which shows the distribution ofmatching events over the specified timeperiod. Below the timeline, the list of resultsis displayed. Click Table View or List Viewto change how the results are formatted.Click > or < to move forward and back inthe pages of results. Keywords that occurmultiple times in the search results aredisplayed in the Common Patterns area ofthe navigation pane, with the number ofoccurrences in parentheses ().
Show keywords and event count The keywords are displayed in theConfigured Patterns area of the OperationsAnalytics - Log Analysis GUI. Eachoccurrence of the keyword over the timeperiod is counted and displayed inparentheses () next to the keyword.
v After the results are displayed, you can refine them by performing furthersearches on the results in the search workspace. For example, click a keywordfrom the Configured Patterns list to add it to the Search field.
132 IBM Netcool Operations Insight: Integration Guide

Important: Because of the difference in handling seconds between the twoproducts, if you run a further search against the keyword counts that result fromthe Show keywords and event count tool, you might see a difference in thecount that was returned for a keyword under Configured Patterns and in thesearch that you run in the search workspace.Above the Search field, a sequence of breadcrumbs is displayed to indicate theprogression of your search. Click any of the breadcrumb items to return theresults of that search.
Example
The Show keywords and event count tool can examine what happened before aproblematic event in your environment. Assume that high numbers of criticalevents are being generated in an event storm. A possible work flow is as follows:v You select a number of critical events and click Event search > Show keywords
and event count > 1 hour before event so that you can identify any similaritiesbetween critical events that occurred in the last hour.
v The most recent time stamp (FirstOccurrence) of an event is 1 January 20148:28:00 AM. In the Operations Analytics - Log Analysis GUI, the search resultsshow all keywords from the Summary, Node, and AlertGroup fields and thenumber of occurrences.
v You notice that the string “swt0001”, which is the host name of a switch in yourenvironment, has a high number of occurrences. You click swt0001 and run afurther search, which reduces the number of results to only the events thatcontain “swt0001”.
v From this pared-down results list, you quickly notice that one event shows thatswitch is misconfigured, and that this problem is causing problems downstreamin the environment. You can then return to the event list in the Web GUI andtake action against this single event.
What to do next
Perform the actions that are appropriate for your environment against the eventsthat are identified by the searches. See http://www-01.ibm.com/support/knowledgecenter/SSSHTQ_8.1.0/com.ibm.netcool_OMNIbus.doc_8.1.0/webtop/wip/task/web_use_jsel_manageevents.html? for the Event Viewer andhttp://www-01.ibm.com/support/knowledgecenter/SSSHTQ_8.1.0/com.ibm.netcool_OMNIbus.doc_8.1.0/webtop/wip/task/web_use_ael_managingevents.html? for the AEL.Related concepts:“Operations Management tasks” on page 12Related tasks:“Configuring event search” on page 121“Customizing event management tools” on page 126Related reference:“Troubleshooting event search” on page 135Related information:
Using Operations Analytics - Log Analysis V1.3.5 to search data
Using Operations Analytics - Log Analysis V1.3.3 to search data
Event search examples on IBM DeveloperWorks
Event search 133

Event search workflow for operatorsA typical workflow to show operators how the event search tools can assisttriaging and diagnostics from the event list.
Assume the following situation: An event storm has been triggered but the causeof the storm is unclear. For the past hour, large numbers of critical events havebeen generated. Run the event search tools against the critical events.1. To gain an overview of what has happened since the event storm started, select
the critical events. Then, right-click and click Event search > Show eventdashboard by node > 1 hour before event. The charts that are displayed showhow the critical events break down, by node, alert group, severity, and so on.
2. Check whether any nodes stand out on the charts. If so, close the OperationsAnalytics - Log Analysis GUI, return to the event list and find an event thatoriginates on that node. For example, type a filter in the text box on the EventViewer toolbar like the following example that filters on critical events from themynode node.SELECT * from alerts.status where Node = mynode; and Severity = 5;
After the event list refreshes to show only matching events, select an event,right-click, and click Event search > Search for events by node > 1 hourbefore event.
3. In the search results, check whether an event from that node stands out. If so,close the Operations Analytics - Log Analysis GUI, return to the event list,locate the event, for example, by filtering on the summary or serial number:SELECT * from alerts.status where Node = mynode; and Summary like“Link Down ( FastEthernet0/13 )”;
SELECT * from alerts.status where Node = mynode; and Serial = 4586967;
Action the event.4. If nothing stands out that identifies the cause of the event storm, close the
Operations Analytics - Log Analysis GUI and return to the event list. Select allthe critical events again and click Event search > Show keywords and eventcount > 1 hour before event.
5. From the results, look in the Common Patterns area on the navigation pane.Looks for keywords that are non generic but have a high occurrence, forinstance host name or IP addresses.
6. Refine the search results by clicking relevant keywords to copy them to theSearch field and running the search. All events in which the keyword occursare displayed, and the Common Patterns area is updated.
7. If an event stands out as the cause of the event storm, close the OperationsAnalytics - Log Analysis GUI, return to the event list, and action the event. Ifnot, continuously refine the search results by searching against keywords untila likely root cause event stands out.
For possible actions from the Event Viewer see http://www-01.ibm.com/support/knowledgecenter/SSSHTQ_8.1.0/com.ibm.netcool_OMNIbus.doc_8.1.0/webtop/wip/task/web_use_jsel_manageevents.html. For possible actions from the ActiveEvent List, see http://www-01.ibm.com/support/knowledgecenter/SSSHTQ_8.1.0/com.ibm.netcool_OMNIbus.doc_8.1.0/webtop/wip/task/web_use_ael_managingevents.html. Other actions are possible, depending on thetools that are implemented in your environment.Related information:
Event search examples on IBM DeveloperWorks
134 IBM Netcool Operations Insight: Integration Guide

Using Operations Analytics - Log Analysis V1.3.5 to search data
Using Operations Analytics - Log Analysis V1.3.3 to search data
Troubleshooting event searchHow to resolve problems with your event search configuration.v “You must log in each time you switch between interfaces”v “Operations Analytics - Log Analysis session times out after 2 hours” on page
136v “ Launch to Operations Analytics - Log Analysis fails on Firefox in non-English
locales” on page 136v “Right-click tool fail to start Operations Analytics - Log Analysis from event
lists” on page 136v “Error message displayed when dynamic dashboard is run” on page 137v “Error message displayed on "Show event dashboard by node" tool from event
lists” on page 137v “Chart display in Operations Analytics - Log Analysis changes without
warning” on page 137
You must log in each time you switch between interfaces
The problem occurs if single sign-on (SSO) is not configured. If the Web GUI andOperations Analytics - Log Analysis are on the same host computer, you must login each time you switch between the interfaces in your browser.
This problem happens because each instance of WebSphere Application Server usesthe same default name for the LTPA token cookie: LtpaToken2. When you switchbetween the interfaces, one WebSphere Application Server instance overwrites thecookie of the other and your initial session is ended.
The ways of resolving this problem are as follows:v Customize the domain name in the Web GUI SSO configuration:
1. In the administrative console of the WebSphere Application Server that hoststhe Web GUI, click Security > Global security. Then, click Authentication >Web security and click Single sign-on (SSO)..
2. Enter an appropriate domain name for your organization, for example,ibm.com. By default, the domain name field is empty and the cookie's domainis the host name. If you also customize the domain name in the OperationsAnalytics - Log Analysis WebSphere Application Server, to avoid any conflictensure that the two domain names are different.
3. Restart the Dashboard Application Services Hub server.v Use the fully qualified domain name for accessing one instance of WebSphere
Application Server and the IP address for accessing the other. For example,always access the Web GUI by the fully qualified domain name and alwaysaccess Operations Analytics - Log Analysis by the IP address. To configure theWeb GUI to access Operations Analytics - Log Analysis by the IP address:1. In the $WEBGUI_HOME/etc/server.init file, change the value of the scala.url
property to the IP address of the host, For example:https://3.127.46.125:9987/Unity
Event search 135

2. Restart the Dashboard Application Services Hub server. Seehttp://www-01.ibm.com/support/knowledgecenter/SSSHTQ_8.1.0/com.ibm.netcool_OMNIbus.doc_8.1.0/webtop/wip/task/web_adm_server_restart.html.
Operations Analytics - Log Analysis session times out after 2hours
This problem occurs if SSO is not configured. The first time that you start theOperations Analytics - Log Analysis product from an event list in the Web GUI,you are prompted to log in to Operations Analytics - Log Analysis. You areautomatically logged out after 2 hours and must reenter your login credentialsevery 2 hours. This problem occurs because the default expiration time of theLTPA token is 2 hours.
To resolve this problem, change the session timeout in the Operations Analytics -Log Analysis product as follows:1. In the $SCALA_HOME/wlp/usr/servers/Unity/server.xml file, increase the value
of the <ltpa expiration="120m"/> attribute to the required value, in minutes.For example, to change the session timeout to 540 minutes:</oauthProvider>
<ltpa expiration="540"/><webAppSecurity ssoDomainNames="hostname" httpOnlyCookies="false"/>
</server>
2. Restart the Operations Analytics - Log Analysis WebSphere Liberty Profile.
Launch to Operations Analytics - Log Analysis fails on Firefox innon-English locales
This problem is a known issue when you launch from the Active Event List (AEL)into the Firefox browser.
If your browser is set to a language other than US English (en_us) or English (en),you might not be able to launch into Operations Analytics - Log Analysis from theWeb GUI AEL.
This problem happens because Operations Analytics - Log Analysis does notsupport all the languages that are supported by Firefox.
To work around this problem, try setting your browser language to an alternativelanguage version. For example, if the problem arises when the browser language isFrench[fr], set the language to French[fr-fr]. If the problem arises when the browserlanguage is German[de-de], set the language to German[de].
Right-click tool fail to start Operations Analytics - Log Analysisfrom event lists
The following error is displayed when you start the tools from the right-click menuof an event list:CTGA0026E: The APP name in the query is invalid or it does not exist
This error occurs because the custom app that is defined in the$WEBGUI_HOME/etc/server.init file does not match the file names in the TivoliNetcool/OMNIbus Insight Pack.
136 IBM Netcool Operations Insight: Integration Guide
To resolve this problem, set the scala.app.keyword andscala.app.static.dashboard properties in the server.init file accordingly.v If the properties are set as follows, the version of the Insight Pack needs to be
V1.1.0.2:scala.app.keyword=OMNIbus_Keyword_Searchscala.app.static.dashboard=OMNIbus_Static_Dashboard
v If the properties are set as follows, the version of the Insight Pack needs toV1.1.0.1 or V1.1.0.0:scala.app.keyword= OMNIbus_SetSearchFilterscala.app.static.dashbaord=OMNIbus_Event_Distribution
If you need to change the values of these properties, restart the DashboardApplication Services Hub server afterwards. See http://www-01.ibm.com/support/knowledgecenter/SSSHTQ_8.1.0/com.ibm.netcool_OMNIbus.doc_8.1.0/webtop/wip/task/web_adm_server_restart.html.
Error message displayed when dynamic dashboard is run
The following error is displayed when you run a dynamic dashboard from theOperations Analytics - Log Analysis product:undefined not found in results data
This error is a known defect in the Operations Analytics - Log Analysis product. Toresolve, it close and then reopen the dynamic dashboard.
Error message displayed on “Show event dashboard by node”tool from event lists
An error message is displayed when you start the Show event dashboard by nodetool from an event list.
This error is caused by incompatibility between the version of the Insight Pack andthe and the version of the Operations Analytics - Log Analysis product.
Ensure that the versions are compatible. See “Required products and components”on page 113. For more information about checking which version of the InsightPack is installed, see Checking the version of the Insight Pack.
Chart display in Operations Analytics - Log Analysis changeswithout warning
The sequence in which charts are displayed on the Operations Analytics - LogAnalysis GUI can changes intermittently. This problem is a known defect in theOperations Analytics - Log Analysis product and has no workaround or solution.Related tasks:“Configuring single sign-on for the event search capability” on page 125“Using Event Search” on page 130
Restarting the Dashboard Application Services server
WebSphere Application Server Liberty: Starting and stopping a server from thecommand prompt
Event search 137

138 IBM Netcool Operations Insight: Integration Guide
Event Analytics
Use Event Analytics to help you analyze seasonal trends and related events, whileyou monitor and manage events.
Event Analytics overviewEvent Analytics allows you to identify seasonal patterns of events and relatedevents within their monitored environment.
Seasonal events
Event Analytics uses statistical analysis of IBM Tivoli Netcool/OMNIbus historicalevent data to determine the seasonality of events, such as when and howfrequently events occur. The results of this analysis are output in both reports andgraphs.
The data that is presented in the event seasonality report helps you to identifyseasonal event patterns within their infrastructure. For example, an event thatperiodically occurs at an unscheduled specific time is highlighted. Seasonal EventRules are grouped by state in the Seasonal Event Rules portlet. You canv Use the View Seasonal Events UI to analyze seasonal events and associated
related events.v Deploy validated seasonal event rules, without writing new code. Rules that are
generated in this way can have various actions applied to them.
Related events
Event Analytics uses statistical analysis of Tivoli Netcool/OMNIbus historicalevent data to determine which events have a statistical tendency to occur together.Event Analytics outputs the results of this statistical analysis as event groups, on ascheduled basis. You can:v Use the related events UI to analyze these event groups.v Deploy validated event groups as Netcool/Impact correlation rules with a single
click, without the need to write any code. Correlation rules that are generated inthis way act on real-time event data to show a single synthetic event for theevents in the event group.
v Present all events in the group as children of this synthetic event. This viewdecreases the number of events displayed to your operations staff in the EventViewer.
v Use the Related Event portlet to analyze patterns in groups and deploycorrelation rules based on common event types between the groups.
The system uses the most actionable event in the group as the parent event to beset by the correlation rule. By default, the most actionable event in the group is themost ticketed or acknowledged event. Before you deploy the correlation rule, youcan change the parent event setting. A synthetic event is created with some of theproperties of the parent event, and all the related events are grouped under thissynthetic event.
© Copyright IBM Corp. 2014, 2018 139

Event groups are generated by scheduled runs of related event configurations. Adefault related event configuration is provided. You can create your ownconfigurations and specify which historical data to analyze. For example, you canspecify a custom time range, an event filter, and schedule. For more informationabout related events, see “Related events” on page 204.
You can create a pattern based on the related event groups discovered by therelated event analytic. Patterns are similar to related event groups but patterns,unlike related event groups are not specific to a resource. You can use an event inthe group as the parent event to be set by the correlation rule, or create a syntheticevent as the parent. You can also test the performance of a pattern before it iscreated to check the number of related events groups and events returned for apattern.
Installing and uninstalling Event AnalyticsRead the following topics before you install or uninstall Event Analytics.
PrerequisitesBefore you install Event Analytics you must complete the following preinstallationtasks.
Event Archiving
You must be running a database with archived events. Event Analytics supportsthe DB2 and Oracle databases. Event Analytics support of MS SQL requires aminimum of IBM Tivoli Netcool/Impact 7.1.0.1.
You can use a gateway to archive events to a database. In reporting mode, thegateway archives events to a target database. For more information, seehttp://www.ibm.com/support/knowledgecenter/SSSHTQ/omnibus/gateways/jdbcgw/wip/concept/jdbcgw_intro.html.
Note: The gateway can operate in two modes: audit mode and reporting mode.Event Analytics only supports reporting mode.
Browser Requirements
To display the Seasonal Event Graphs in Microsoft Internet Explorer, you mustinstall the Microsoft Silverlight plug-in.
Reduced Memory
If you are not running Event Analytics on Solaris, remove the comment from oradd the following entry in the jvm.options file:#-Xgc:classUnloadingKickoffThreshold=100
Removing the comment from or adding that entry dynamically reduces memoryrequirements.
140 IBM Netcool Operations Insight: Integration Guide

Installing Event AnalyticsYou can install Event Analytics with the IBM Installation Manager GUI or console,or do a silent installation. Event Analytics supports IBM Installation Manager 1.7.2up to 1.8.4.
For more information about installing and using IBM Installation Manager, see thefollowing IBM Knowledge Center:
http://www-01.ibm.com/support/knowledgecenter/SSDV2W/im_family_welcome.html
Installing Event Analytics (GUI)You can install Event Analytics with the IBM Installation Manager GUI.
Before you beginv Determine which Installation Manager user mode you require.v Ensure that the necessary user permissions are in place for your intended
installation directories.v Configure localhost on the computer where Event Analytics packages are to be
installed.
About this task
The installation of Event Analytics requires you to install product packages for thefollowing product groups:v IBM Tivoli Netcool/Impactv IBM Tivoli Netcool/OMNIbusv IBM Netcool.
The steps for starting Installation Manager are different depending on which usermode you installed it in. The steps for completing the Event Analytics installationwith the Installation Manager wizard are common to all user modes and operatingsystems.
Installation Manager takes account of your current umask settings when it sets thepermissions mode of the files and directories that it installs. If you useAdministrator mode or Non-administrator mode and your umask is 0, InstallationManager uses a umask of 22. If you use Group mode, Installation Manager ignoresany group bits that are set and uses a umask of 2 if the resulting value is 0.
To install the packages and features, complete the following steps.
Procedure1. Start Installation Manager. Change to the /eclipse subdirectory of the
Installation Manager installation directory and use the following command tostart Installation Manager:./IBMIM
To record the installation steps in a response file for use with silent installationson other computers, use the -record response_file option. For example:./IBMIM -record /tmp/install_1.xml
2. Configure Installation Manager to point to either a local repository or an IBMPassport Advantage repository, where the download packages are available.
Event Analytics 141

Within the IBM Knowledge Center content for Installation Manager, see thetopic that is called Installing packages by using wizard mode.
3. In the main Installation Manager window, click Install and follow theinstallation wizard instructions to complete the installation.
4. In the Install tab select the following installation packages, and then click Next.v Packages for IBM Tivoli Netcool/Impact:
IBM Tivoli Netcool/Impact GUI Server_7.1.0.13IBM Tivoli Netcool/Impact Server_7.1.0.13IBM Tivoli Netcool/Impact Server Extensions for Netcool OperationsInsight_7.1.0.13
v Packages for IBM Tivoli Netcool/OMNIbus:IBM Tivoli Netcool/OMNIbus_8.1.0.16
v Packages for IBM Tivoli Netcool/OMNIbus Web GUI:IBM Tivoli Netcool/OMNIbus Web GUI_8.1.0.13Netcool Operations Insight Extensions for IBM Tivoli Netcool/OMNIbusWeb GUI_8.1.0.13
5. In the Licenses tab, review the licenses. If you are happy with the licensecontent select I accept the terms in the license agreements and click Next.
6. In the Location tab, enter information for the Installation Directory andArchitecture or progress with the default values, and click Next.v For IBM Netcool, the default values are /opt/IBM/netcool and 64-bit.v For IBM Netcool Impact, the default values are /opt/IBM/tivoli/impact and
64-bit.7. In the Features tab, select the following features and then click Next. Other
features are auto-selected.
Table 27. Available features
Feature Description
IBM Tivoli Netcool/OMNIbus Web GUI8.1.0.13 > Install base features
To install and run Event Analytics.
Netcool Operations Insight Extensions WebGUI 8.1.0.13 > Install Event Analytics
Contains the Event Analytics components.
8. In the Summary tab, review summary details. If you are happy with summarydetails click Next, but if you need to change any detail click Back.
9. To complete the installation, click Finish.
Results
Installation Manager installs Event Analytics.
What to do next1. Configure the ObjectServer for Event Analytics, see “Configuring the Event
Analytics ObjectServer” on page 238.2. Connect to a valid database from within IBM Tivoli Netcool/Impact. To
configure a connection to one of the Event Analytics supported databases, seethe following topics:v DB2: “Configuring DB2 database connection within Netcool/Impact” on
page 241
142 IBM Netcool Operations Insight: Integration Guide

v Oracle: “Configuring Oracle database connection within Netcool/Impact” onpage 239
v MS SQL: “Configuring MS SQL database connection within Netcool/Impact”on page 243
3. If you add a cluster to the Impact environment, you must update the datasources in IBM Tivoli Netcool/Impact 7.1.0.4. For more information, see“Adding a cluster to the Netcool/Impact environment” on page 245.
4. If you add a cluster to the Impact environment, you must update the datasources in IBM Tivoli Netcool/Impact 7.1.0.13. For more information, see“Adding a cluster to the Netcool/Impact environment” on page 245.
5. You must set up a remote connection from the Dashboard Application ServicesHub to Netcool/Impact. For more information, see “Netcool/Impact remoteconnection” on page 245.
Installing Event Analytics (Console)You can install Event Analytics with the IBM Installation Manager console.
Before you begin
Obtain an IBM ID and an entitlement to download Event Analytics from IBMPassport Advantage. The packages that you are entitled to install are listed inInstallation Manager.
Take the following actions:v Determine which Installation Manager user mode you require.v Ensure that the necessary user permissions are in place for the installation
directories.v Decide which features that you want to install from the installation packages
and gather the information that is required for those features.v Configure localhost on the computer where Event Analytics is to be installed.
About this task
The steps for starting Installation Manager are different depending on which usermode you installed it in. The steps for completing the Event Analytics installationwith the Installation Manager console are common to all user modes and operatingsystems.
Installation Manager takes account of your current umask settings when it sets thepermissions mode of the files and directories that it installs. If you useAdministrator mode or Non-administrator mode and your umask is 0, InstallationManager uses a umask of 22. If you use Group mode, Installation Manager ignoresany group bits that are set and uses a umask of 2 if the resulting value is 0.
Procedure1. Change to the /eclipse/tools subdirectory of the Installation Manager
installation directory.2. Use the following command to start Installation Manager:v ./imcl -c OR ./imcl -consoleMode
3. Configure Installation Manager to download package repositories from IBMPassport Advantage:a. From the Main Menu, select Preferences.b. In the Preferences menu, select Passport Advantage.
Event Analytics 143

c. In the Passport Advantage menu, select Connect to Passport Advantage.d. When prompted, enter your IBM ID user name and password.e. Return to the Main Menu.
4. From the options that are provided on the installer, add the repository that youwant to install.
5. From the Main Menu, select Install.Follow the installer instructions to complete the installation. The installerrequires the following inputs at different stages of the installation:v Select Event Analyticsv When prompted, enter an Installation Manager shared directory or accept the
default directory.v When prompted, enter an installation directory or accept the default
directory.v Clear the features that you do not require.v If required, generate a response file for use with silent installations on other
computers. Enter the directory path and a file name with a .xml extension.The response file is generated before installation completes.
6. When the installation is complete, select Finish.
Results
Installation Manager installs Event Analytics.
What to do next
If you add a cluster to the Impact environment, you must update the data sourcesin IBM Tivoli Netcool/Impact 7.1. For more information, see “Adding a cluster tothe Netcool/Impact environment” on page 245.
Silently installing Event AnalyticsYou can install Event Analytics silently with IBM Installation Manager. Thisinstallation method is useful if you want identical installation configurations onmultiple workstations. Silent installation requires a response file that defines theinstallation configuration.
Before you begin
Take the following actions:v Create or record an Installation Manager response file.
You can specify a local or remote IBM Tivoli Netcool/OMNIbus package and aNetcool Operations Insight Extensions Web GUI package with a repository in theresponse file. You can also specify that Installation Manager downloads thepackages from IBM Passport Advantage. For more information about specifyingauthenticated repositories in response files, search for the Storing credentials topicin the Installation Manager information center:http://www-01.ibm.com/support/knowledgecenter/SSDV2W/im_family_welcome.htmlA default response file is included in the Event Analytics installation package inresponsefiles/platform, where platform can be unix or windows.When you record a response file, you can use the -skipInstall argument tocreate a response file for an installation process without performing theinstallation. For example:
144 IBM Netcool Operations Insight: Integration Guide

– Create or record a skipInstall:IBMIM.exe -record C:\response_files\install_1.xml -skipInstallC:\Temp\skipInstall
v Determine which Installation Manager user mode you require.v Read the license agreement. The license agreement file, license.txt, is stored in
the /native/license_version.zip archive, which is contained in the installationpackage.
v Ensure that the necessary user permissions are in place for your intendedinstallation directories.
v Configure localhost on the computer where Event Analytics is to be installed.
Procedure1. Change to the /eclipse/tools subdirectory of the Installation Manager
installation directory.2. To encrypt the password that is used by the administrative user for the initial
log-in to Dashboard Application Services Hub, run the following command:v ./imutilsc encryptString password
Where password is the password to be encrypted.3. To install Event Analytics, run the following command:v ./imcl -input response_file -silent -log /tmp/install_log.xml
-acceptLicense
Where response_file is the directory path to the response file.
Results
Installation Manager installs Event Analytics.
What to do next
If you add a cluster to the Impact environment, you must update the data sourcesin IBM Tivoli Netcool/Impact 7.1. For more information, see “Adding a cluster tothe Netcool/Impact environment” on page 245.
Upgrading Event AnalyticsYou can upgrade the IBM Netcool Operations Insight packages for Event Analyticsby applying the latest fix packs.
About this task
To upgrade to Event Analytics on an IBM Netcool Operations Insight 1.4.1platform, use the IBM Installation Manager Update functions to locate updatepackages, and update your environment with the following product updatepackages:
IBM Tivoli Netcool/Impact GUI Server_7.1.0.13IBM Tivoli Netcool/Impact Server_7.1.0.13IBM Tivoli Netcool/Impact Server Extensions for Netcool OperationsInsight_7.1.0.13IBM Tivoli Netcool/OMNIbus_8.1.0.16IBM Tivoli Netcool/OMNIbus Web GUI_8.1.0.13Netcool Operations Insight Extensions for IBM Tivoli Netcool/OMNIbus WebGUI_8.1.0.13
Event Analytics 145

Procedure
The product update packages must be updated individually. Complete steps 1 - 3for each product update package.1. Start Installation Manager. Change to the /eclipse subdirectory of the
Installation Manager installation directory and enter the following command tostart Installation Manager:./IBMIM
2. Configure Installation Manager to point to either a local repository or an IBMPassport Advantage repository, where the download package is available.Within the IBM Knowledge Center content for Installation Manager, see thetopic that is called Installing packages by using wizard mode. See the followingURL within the IBM Knowledge Center content for Installation Manager:http://www-01.ibm.com/support/knowledgecenter/SSDV2W/im_family_welcome.html
3. In the main Installation Manager window, click Update and complete thefollowing type of installation wizard instructions to complete the installation ofyour update package:a. In the Update Packages tab, select the product group to find related update
packages, and click Next. A list of the available update packages displays.b. From the list of available update packages, select one update package that
you want to install, and click Next. Remember you can install only oneupdate package at a time.
c. In the Licenses tab, review the licenses. Select I accept the terms in thelicense agreements and click Next.
d. In the Features tab, select the features for your update package, and clickNext.
e. Complete the configuration details, and click Next.f. In the Summary tab, review summary details. If you need to change any
detail click Back, but if you are happy with summary details click Updateand wait for the installation of the update package to complete.
g. When the installation of the update package completes, the windowupdates with details of the installation. Click Finish.
4. To ensure that the seasonal event reports that were created before upgrading toIBM Netcool Operations Insight 1.4.1 are visible, you must run theSE_CLEANUPDATA policy as follows.a. Login as the administrator to the server where IBM Tivoli Netcool/Impact
is stored and running.b. Navigate to the policies tab and search for the SE_CLEANUPDATA policy.c. To open the policy, double-click on the policy.d. To run the policy, select the run button on the policy screen toolbar.
5. To view the event configurations in the View Seasonal Events portlet, rerun theconfigurations. For more information about running event configurations, seethe “Configure Analytics portlet” on page 170 topics.
What to do next1. Verify that the correct packages are installed. After you update each package,
and to ensure that you have the correct environment for Event Analytics onIBM Netcool Operations Insight 1.4.1, verify that the following packages areinstalled.v IBM Tivoli Netcool/Impact packages:
146 IBM Netcool Operations Insight: Integration Guide

IBM Tivoli Netcool/Impact GUI Server_7.1.0.13IBM Tivoli Netcool/Impact Server_7.1.0.13IBM Tivoli Netcool/Impact Server Extensions for Netcool OperationsInsight_7.1.0.13
v IBM Tivoli Netcool/OMNIbus packages:IBM Tivoli Netcool/OMNIbus_8.1.0.16
v IBM Netcool® packages.IBM Tivoli Netcool/OMNIbus Web GUI_8.1.0.13Netcool Operations Insight Extensions for IBM Tivoli Netcool/OMNIbusWeb GUI_8.1.0.13
2. Configure the ObjectServer for Event Analytics. For more information aboutconfiguring the ObjectServer for Event Analytics, see “Configuring the EventAnalytics ObjectServer” on page 238.
3. Connect to a valid database from within IBM Tivoli Netcool/Impact. Toconfigure a connection to one of the Event Analytics supported databases, seethe following topics:v DB2: “Configuring DB2 database connection within Netcool/Impact” on
page 241v Oracle: “Configuring Oracle database connection within Netcool/Impact” on
page 239v MS SQL: “Configuring MS SQL database connection within Netcool/Impact”
on page 2434. If you add a cluster to the Impact environment, you must update the data
sources in IBM Tivoli Netcool/Impact 7.1. For more information, see “Adding acluster to the Netcool/Impact environment” on page 245.
5. If you want to make use of the pattern generalization feature in EventAnalytics, you must configure the type properties used for event patterncreation in IBM Tivoli Netcool/Impact. For more information about configuringthe type properties used for event pattern creation in IBM TivoliNetcool/Impact, see “Configuring the type properties used for event patterncreation in Netcool/Impact” on page 232.
Upgrading Event Analytics from stand-alone installations of IBMTivoli Netcool/OMNIbus and IBM Tivoli Netcool/ImpactIf you have stand-alone installations of IBM Tivoli Netcool/OMNIbus with IBMNetcool/OMNIbus Web GUI and IBM Tivoli Netcool/Impact, you can upgrade toEvent Analytics for IBM Netcool Operations Insight 1.4.1.
Before you begin
Ensure that the following product packages are already installed:v IBM Tivoli Netcool/Impact packages:
IBM Tivoli Netcool/Impact GUI Server_7.1.0.13IBM Tivoli Netcool/Impact Server_7.1.0.13
v IBM Tivoli Netcool/OMNIbus packages:IBM Tivoli Netcool/OMNIbus_8.1.0.16
v IBM Netcool packages:IBM Tivoli Netcool/OMNIbus Web GUI_8.1.0.13
Event Analytics 147

About this task
This upgrade scenario is for users who already use Tivoli Netcool/OMNIbus andNetcool/Impact but do not have the Netcool Operations Insight packages that areneeded for the Event Analytics function, and now want the Event Analyticsfunction.
For this upgrade scenario, you must use IBM Installation Manager to Install theproduct packages that are required for the Event Analytics function, then Updatethe product packages. The Install of product packages locates and installs thefollowing two packages:
IBM Tivoli Netcool/Impact Server Extensions for Netcool OperationsInsight_7.1.0.13Netcool Operations Insight Extensions for IBM Tivoli Netcool/OMNIbus WebGUI_8.1.0.13
To upgrade to IBM Netcool Operations Insight 1.4.1 Event Analytics, complete thefollowing steps.
Procedure1. Start Installation Manager. Change to the /eclipse subdirectory of the
Installation Manager installation directory and enter the following command tostart Installation Manager:./IBMIM
2. Configure Installation Manager to point to either a local repository or an IBMPassport Advantage repository, where the download package is available.Within the IBM Knowledge Center content for Installation Manager, see thetopic that is called Installing packages by using wizard mode. See the followingURL within the IBM Knowledge Center content for Installation Manager:http://www-01.ibm.com/support/knowledgecenter/SSDV2W/im_family_welcome.html
3. To install your packages in the main Installation Manager, click Install andcomplete the steps in the installation wizard to complete the installation ofyour packages:a. In the Install tab, select the following product groups and product
installation packages, and click Next.v IBM Tivoli Netcool/Impact Server Extensions for Netcool Operations
Insight_7.1.0.13v Tivoli Netcool/OMNIbus Web GUI Version 8.1.0.13v Netcool Operations Insight Extensions for IBM Tivoli Netcool/OMNIbus
Web GUI_8.1.0.13b. In the Licenses tab, review the licenses. When you are happy with the
license content select I accept the terms in the license agreements and clickNext.
c. In the Location tab, use the existing package group and location.d. In the Features tab, select the features for your packages, and click Next.e. In the Summary tab, review summary details. If you need to change any
detail click Back, but if you are happy with summary details click Installand wait for installation of the package to complete.
f. When installation of the packages completes, the window updates withdetails of the installation. Click Finish.
148 IBM Netcool Operations Insight: Integration Guide

4. Migrate the rollup configuration. For more information about updating therollup configuration, see “Updating Rollup Configuration” on page 150.
What to do next1. Verify that the correct packages are installed. After you update each package,
and to ensure that you have the correct environment for Event Analytics onIBM Netcool Operations Insight 1.4.1, verify that the following packages areinstalled.v IBM Tivoli Netcool/Impact packages:
IBM Tivoli Netcool/Impact GUI Server_7.1.0.13IBM Tivoli Netcool/Impact Server_7.1.0.13IBM Tivoli Netcool/Impact Server Extensions for Netcool OperationsInsight_7.1.0.13
v IBM Tivoli Netcool/OMNIbus packages:IBM Tivoli Netcool/OMNIbus_8.1.0.16
v IBM Netcool packages.IBM Tivoli Netcool/OMNIbus Web GUI_8.1.0.13Netcool Operations Insight Extensions for IBM Tivoli Netcool/OMNIbusWeb GUI_8.1.0.13
2. Configure the ObjectServer for Event Analytics. For more information aboutconfiguring the ObjectServer for Event Analytics, see “Configuring the EventAnalytics ObjectServer” on page 238.
3. Connect to a valid database from within IBM Tivoli Netcool/Impact. Toconfigure a connection to one of the Event Analytics supported databases, seethe following topics:v DB2: “Configuring DB2 database connection within Netcool/Impact” on
page 241v Oracle: “Configuring Oracle database connection within Netcool/Impact” on
page 239v MS SQL: “Configuring MS SQL database connection within Netcool/Impact”
on page 2434. If you add a cluster to the Impact environment, you must update the data
sources in IBM Tivoli Netcool/Impact 7.1. For more information, see “Adding acluster to the Netcool/Impact environment” on page 245.
5. If you want to make use of the pattern generalization feature in EventAnalytics, you must configure the type properties used for event patterncreation in IBM Tivoli Netcool/Impact. For more information about configuringthe type properties used for event pattern creation in IBM TivoliNetcool/Impact, see “Configuring the type properties used for event patterncreation in Netcool/Impact” on page 232.
Event Analytics 149

Updating Rollup ConfigurationYou can add columns to Seasonal Event reports and Related Events reports.Update the rollup configuration to add columns to reports.
Before you begin
Note: 1.4.1.2 In Netcool/Impact v7.1.0.13 it is recommended to use the EventAnalytics configuration wizard instead of the ./nci_trigger command to editproperties in the NOI Shared Configuration properties file. For more information,see “Adding report fields” on page 162.
You must export the current configuration into the properties file.1. Log in to the server where IBM Tivoli Netcool/Impact is stored and running.2. Go to the <Impact install location>/bin directory.3. Enter the following command.
./nci_trigger NCI <UserID>/<password> NOI_DefaultValues_Export FILENAME<Full Path to the file name>.properties
<UserID>Specifies the ID of the Impact user.
<password>Specifies the password of the Impact user.
<Full Path to the file name>Specifies the directory where the properties file is stored.
About this task
To update the rollup configuration, complete the following steps.
Procedure1. Update the properties file that you created in the Before you being.
a. Specify the number of columns you want to add to the reports:Increase the value of the number_of_rollup_configuration=2 parameterfor seasonal events.Increase the value of the reevent_number_of_rollup_configuration=2parameter for related events.
For example, to add one column to the reports, increase the parametervalue by one from 2 to 3.
b. For a new rollup column, add property information.v For a new Seasonal Event reports column, add the following properties.
rollup_<rollup number>_column_name=<column name>rollup_<rollup number>_display_name=<column_name>_<type>rollup_<rollup number>_type=<type>
v For a new Related Events reports column, add the following properties.reevent_rollup_<rollup number>_column_name=<column name>reevent_rollup_<rollup number>_display_name=<column_name>_<type>reevent_rollup_<rollup number>_type=<type>reevent_rollup_<rollup number>_actionable=<true/false>
<rollup number>Specifies the new column rollup number.
150 IBM Netcool Operations Insight: Integration Guide

<column name>Specifies the new column name. The column name must match thecolumn name in the history table.
<display name>Specifies the new column display name. The display name must matchthe column name in the report.
<type>Specifies one of the following types:
MAX The maximum value observed for the column. If no value isobserved, the value defaults to the minimum value of aninteger.
MIN The minimum value observed for the column. If no value isobserved, the value defaults to the maximum value of aninteger.
SUM The sum of all of the values observed for the column.
NON_ZEROA counting column that counts nonzero occurrences of events.This column can be useful to track the proportion of actionedevents, or how many events had an associated ticket number.
DISTINCTThe number of distinct values that are seen for this key-valuepair.
EXAMPLEDisplays the first non-blank example of a field that containedthis key. The EXAMPLE type is useful when you are runningseasonality on a non-digestible field such asALERT_IDENTIFIER, and you want an example humanreadable SUMMARY to demonstrate the type of problem.
Note: You cannot change the <type> property of a rollupcolumn once the configuration has been updated. You must adda new rollup column and specify a different <type> (with a new<display name> if you are keeping the old rollup).
actionable=<true/false>If this property is set to true for a rollup, the rollup is used todetermine the probable root cause of a correlation rule. This root causedetermination is based on the rollup that has the most actions that aretaken against it. For example, if Acknowledge is part of your rollupconfiguration and has a property value of actionable=true, then theevent with the highest occurrence of Acknowledge is determined to bethe probable root cause. Probable root cause determination uses thedescending order of the actionable rollups, that is, the first actionablerollup is a higher priority than the second actionable rollup. Only fourof the possible <type> keywords are valid for root cause: MAX, MIN,SUM, NON_ZERO.
If this property is set to false for a rollup, the rollup is not used todetermine the probable root cause of a rule. If all rollup configurationshave a property value of actionable=false, the first event that is foundis identified as the parent.
Event Analytics 151

To manually change a root cause event for a correlation rule, see“Selecting a root cause event for a correlation rule” on page 219.
2. Run the following command to update the current configuration:./nci_trigger NCI <UserID>/<password> NOI_DefaultValues_ConfigureFILENAME <Full Path to the file name>.properties
Results
The rollup configuration is updated.
Example
Example 1. To add a third column to the Seasonal Event report, change the rollupconfiguration value to 3, and add the properties.number_of_rollup_configuration=3rollup_1_column_name=SEVERITYrollup_1_display_name=SEVERITY_MINrollup_1_type=MINrollup_2_column_name=SEVERITYrollup_2_display_name=SEVERITY_MAXrollup_2_type=MAXrollup_3_column_name=TYPErollup_3_display_name=TYPE_MAXrollup_3_type=MAX
Example 2. The configuration parameters for a default Related Events report.reevent_rollup_1_column_name=ORIGINALSEVERITYreevent_rollup_1_display_name=ORIGINALSEVERITY_MAXreevent_rollup_1_type=MAXreevent_rollup_1_actionable=truereevent_rollup_2_column_name=ACKNOWLEDGEDreevent_rollup_2_display_name=ACKNOWLEDGED_NON_ZEROreevent_rollup_2_type=NON_ZEROreevent_rollup_2_actionable=truereevent_rollup_3_column_name=ALERTGROUPreevent_rollup_3_display_name=ALERTGROUP_EXAMPLEreevent_rollup_3_type=EXAMPLEreevent_rollup_3_actionable=false
What to do next
To add columns to the Seasonal Event reports, Historical Event portlet, RelatedEventreports, or Related Event Details portlet complete the following steps:1. Log in to the Tivoli Netcool/Impact UI.2. Go to the Policies tab.3. Open the policy that you want to modify. You can modify one policy at a
time.v For Historical Events, open the SE_GETHISTORICALEVENTS policy.v For Seasonal Events, open the SE_GETEVENTDATA policy.v For related events groups, open one of the following policies.
RE_GETGROUPS_ACTIVE
RE_GETGROUPS_ARCHIVED
RE_GETGROUPS_EXPIRED
RE_GETGROUPS_NEW
RE_GETGROUPS_WATCHED
152 IBM Netcool Operations Insight: Integration Guide

Note: Each policy is individually updated. To update two or more policies,you must modify each policy individually.
v For related events, open one of the following policies.RE_GETGROUPEVENTS_ACTIVE
RE_GETGROUPEVENTS_ARCHIVED
RE_GETGROUPEVENTS_EXPIRED
RE_GETGROUPEVENTS_NEW
RE_GETGROUPEVENTS_WATCHED
Note: Each policy is individually updated. To update two or more policies,you must modify each policy individually.
v For related events details group instances table, open the following policy:RE_GETGROUPINSTANCEV1
4. Click the Configure Policy Settings icon.5. Under Policy Output Parameters, click Edit.6. To create a custom schema definition, open the Schema Definition Editor
icon.7. To create a new field, click New.8. Specify the new field name and format.
The new field name must match the display name in the configuration file.The format must match the format in the AlertsHistory Table.The format must be appropriate for the rollup type added. For example,for numerical types such as SUM or NON_ZERO use a numeric format.Use String for DISTINCT, if the base column is String.Refresh the SE_GETHISTORICALEVENTS_DB2 table, or other databasemodel, before you run Event Analytics with the added Historical Eventtable fields.For the RE_GETGROUPS_ policies, only rollup columns with a <type> value ofMAX, MIN, SUM, NON_ZERO are supported. Therefore, add only numericfields to the schema.
9. To complete the procedure, click Ok on each of the open dialog boxes, andSave on the Policies tab.
Note: Columns that are created for the Related Event Details before NetcoolOperations Insight release 1.4.0.1 are displayed as designed. Configurationsand groups that are created after you upgrade to Netcool Operations Insightrelease 1.4.0.1, display the events from the historical event. By adding columnsto the Related Event Details, you can display additional information such asthe owner ID or ticketnumber.
10. To add columns to the Related Event Details, update theRE_COLUMN_EVENT_INSTANCES variable in the RE_CONSTANTS policy in Impact.Add or remove fields from the static array. For example,var RE_COLUMN_EVENT_INSTANCES = "NODE,SUMMARY,ALERTGROUP,SEVERITY,OWNERUID,ACKNOWLEDGED,TALLY";
You can also add the following columns for group instances in the Related EventDetails:v SERVERSERIAL
v SERVERNAME
v TALLY
Event Analytics 153

v OWNERUID
By default, the previously listed columns are hidden for group instances in theRelated Event Details. To display these columns in the Related Event Details, youneed to edit thePolicy_RE_GETGROUPINSTANCEV1_RE_GETGROUPINSTANCEV1.properties file, which islocated in the following directory: $IMPACT_HOME/uiproviderconfig/properties.
Specifically, set the following properties in thePolicy_RE_GETGROUPINSTANCEV1_RE_GETGROUPINSTANCEV1.properties file from theirdefault values of true to the values false (or comment out the field or fields):SERVERSERIAL.hidden=trueSERVERNAME.hidden=trueTALLY.hidden=trueOWNERUID.hidden=true
For example,OWNERUID.hidden=false
Or, for example,#OWNERUID.hidden=true
Migration of rollups in Netcool/Impact v7.1.0.131.4.1.2
Fix pack v7.1.0.13 uses a new format for the creation of rollups that is different toprevious versions of Netcool/Impact. A migration script is automatically executedduring the install or upgrade process to convert pre-existing rollups to the v7.1.0.13format. Run the Event Analytics configuration wizard after the upgrade tov7.1.0.13 to verify and save your configuration (see note below).v In v7.1.0.12 (or earlier) the rollup display names are free-form text with no
formatting applied. For example:reevent_rollup_1_column_name=ORIGINALSEVERITYreevent_rollup_1_type=MAXreevent_rollup_1_display_name=MaxSeverity
In this scenario, Netcool Operations Insight creates a new column in thedatabase called MaxSeverity. The display name in Dashboard ApplicationServices Hub will be MaxSeverity, or whatever is defined in the Netcool/Impactuiprovider/translation directory.With the introduction of the Event Analytics configuration wizard in v7.1.0.13, itwas necessary to apply a new format to rollup display names.
v In v7.1.0.13 a format of <column_name>_<type> is applied to rollup displaynames: For example:reevent_rollup_1_column_name=ORIGINALSEVERITYreevent_rollup_1_type=MAXreevent_rollup_1_display_name=ORIGINALSEVERITY_MAX
Using the wizard, you can apply any display name to a column, in anylanguage. Because creating database columns in any language could have beenerror prone, the format of the names for rollup database columns is now set to<column_name>_<type>. The display name is stored in the uiproviderconfig/translation directory and files. This format makes it is possible to changedisplay names using the Event Analytics configuration wizard. For this reason, amigration script is executed during install/upgrade to transform all pre-existingrollups to the v7.1.0.13 format.
154 IBM Netcool Operations Insight: Integration Guide

Note: You must run the Event Analytics configuration wizard after upgrading toNetcool/Impact v7.1.0.13. The following artifacts will be changed as a result of therollup migration script in Netcool/Impact v7.1.0.13:v Stored metadata for rollups in configurationv Database columns (renamed)v Output parameters for policiesv Properties filesv Translated properties files
Complete the steps of the wizard as described in “Event Analytics Configuration”on page 160 after upgrading to v7.1.0.13 to verify and save any customizations toyour configuration. Backup files containing previous customizations are stored in$IMPACT_HOME/backup/install/gui_backup/<pre-FP13 fp name>/uiproviderconfig/.
Creating a database view to map correct field namesYou can map any customized columns in your Event History database tables tocolumns expected by IBM Tivoli Netcool/Impact for Event Analytics.
Before you begin
You must perform this task if you have customized table columns in your EventHistory database. For example, if you have defined columns called SUMMARYTXT andIDENTIFIERID instead of the default names SUMMARY and IDENTIFIER, you mustperform this task. You create a database view and map back to the actual fieldnames.
About this task
The steps documented here are for a DB2 database. The procedure is similar for anOracle database.
To map customized columns in your Event History database, complete thefollowing steps.
Procedure1. Use the following statement to create the view and point the data types to the
new view.DROP VIEW REPORTER_STATUS_STD;CREATE VIEW REPORTER_STATUS_STD AS SELECT SUMMARYTXT AS SUMMARY,IDENTIFIERID AS IDENTIFIER, * FROM REPORTER_STATUS;
2. Change the data types from REPORTER_STATUS to REPORTER_STATUS_STD. The datatypes for DB2 are AlertsHistoryDB2Table and SE_HISTORICALEVENTS_DB2 underObjectServerHistoryDB2ForNOI data source.
3. Delete RELATEDEVENTS.RE_MAPPINGS records from the table:DELETE FROM RELATEDEVENTS.RE_MAPPINGS WHERE TRUE;
4. Run the Event Analytics Configuration wizard to configure the Netcool/Impactproperties to use for Event Analytics.
5. On the Historical event database configuration screen, connect to the databaseand then select the REPORTER_STATUS_STD (view) from the History tabledrop-down menu as the Table name for Event Analytics.
6. When using any other columns that were mapped in the view, for exampleSummary for SUMMARYTXT, use the new value in any of the wizard screens. In this
Event Analytics 155
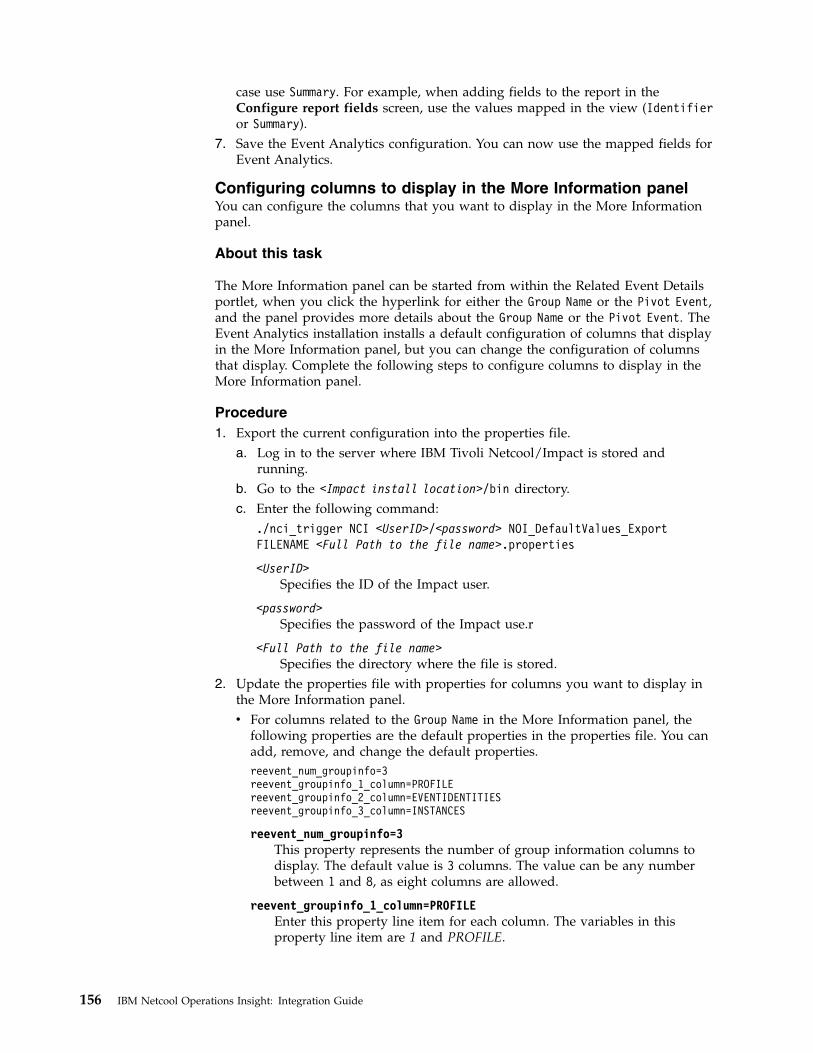
case use Summary. For example, when adding fields to the report in theConfigure report fields screen, use the values mapped in the view (Identifieror Summary).
7. Save the Event Analytics configuration. You can now use the mapped fields forEvent Analytics.
Configuring columns to display in the More Information panelYou can configure the columns that you want to display in the More Informationpanel.
About this task
The More Information panel can be started from within the Related Event Detailsportlet, when you click the hyperlink for either the Group Name or the Pivot Event,and the panel provides more details about the Group Name or the Pivot Event. TheEvent Analytics installation installs a default configuration of columns that displayin the More Information panel, but you can change the configuration of columnsthat display. Complete the following steps to configure columns to display in theMore Information panel.
Procedure1. Export the current configuration into the properties file.
a. Log in to the server where IBM Tivoli Netcool/Impact is stored andrunning.
b. Go to the <Impact install location>/bin directory.c. Enter the following command:
./nci_trigger NCI <UserID>/<password> NOI_DefaultValues_ExportFILENAME <Full Path to the file name>.properties
<UserID>Specifies the ID of the Impact user.
<password>Specifies the password of the Impact use.r
<Full Path to the file name>Specifies the directory where the file is stored.
2. Update the properties file with properties for columns you want to display inthe More Information panel.v For columns related to the Group Name in the More Information panel, the
following properties are the default properties in the properties file. You canadd, remove, and change the default properties.reevent_num_groupinfo=3reevent_groupinfo_1_column=PROFILEreevent_groupinfo_2_column=EVENTIDENTITIESreevent_groupinfo_3_column=INSTANCES
reevent_num_groupinfo=3This property represents the number of group information columns todisplay. The default value is 3 columns. The value can be any numberbetween 1 and 8, as eight columns are allowed.
reevent_groupinfo_1_column=PROFILEEnter this property line item for each column. The variables in thisproperty line item are 1 and PROFILE.
156 IBM Netcool Operations Insight: Integration Guide

1 denotes that this column is your first column. This value can incrementup to 8 per property line item, as eight columns are allowed.
PROFILE represents the column. The following eight columns are allowed.
PROFILESpecifies the relationship profile, or strength of the group.
EVENTIDENTITIESSpecifies a comma-separated list that creates the event identity.
INSTANCESSpecifies the total number of group instances.
CONFIGNAMESpecifies the configuration name under which the group wascreated.
TOTALEVENTSSpecifies the total number of events within the group.
UNIQUEEVENTSSpecifies the total number of unique events within the group.
REVIEWEDSpecifies the review status of a group by a user.
GROUPTTLSpecifies the number of seconds the group will stay active afterthe first event occurs.
v For columns related to the Pivot Event in the More Information panel, thefollowing properties are the default properties in the properties file. You canadd, remove, and change the default properties.reevent_num_eventinfo=1reevent_eventinfo_1_column=INSTANCES
reevent_num_eventinfo=1This property represents the number of group information columns todisplay. The default value is 1 column. The value can be any numberbetween 1 and 6, as six columns are allowed.
reevent_eventinfo_1_column=INSTANCESEnter this property line item for each column. The variables in thisproperty line item are 1 and INSTANCES.
1 denotes that this column is your first column. This value can incrementup to 6 per property line item, as six columns are allowed.
INSTANCES represents the column. The following six columns are allowed:
INSTANCESSpecifies the total number of instances for the related event.
PROFILESpecifies the relationship profile, or strength of the related event.
EVENTIDENTITYSpecifies the unique event identity for the related event.
EVENTIDENTITIESSpecifies a comma-separated list that creates the event identity.
Event Analytics 157
CONFIGNAMESpecifies the configuration name under which the related eventwas created.
GROUPNAMESpecifies the group name under which the related event wascreated.
3. Run the following command to update the current configuration with yourupdated properties:./nci_trigger NCI <UserID>/<password> NOI_DefaultValues_ConfigureFILENAME <Full Path to the file name>.properties
Customization of tables in the Event Analytics UIYou can use the uiproviderconfig files to customize the tables in the EventAnalytics UI.
To customize how tables are displayed in the Event Analytics UI, you can updatethe $IMPACT_HOME/uiproviderconfig/properties and $IMPACT_HOME/uiproviderconfig/translation files that are specific to the policy or data type thatyou want to update.
If you want to update the $IMPACT_HOME/uiproviderconfig/properties and$IMPACT_HOME/uiproviderconfig/translation files, make a backup of the filesbefore you do any updates.
Additional configuration for Netcool/Impact server failover forEvent AnalyticsThe following additional configuration is required if a seasonality report is runningduring a Netcool/Impact node failover. Without this configuration the seasonalityreport might hang in the processing state following the failover. This will give theimpression that the report is running, however it will remain stuck in the phaseand percentage complete level that is displayed following the failover. Any queuedreports will also not run. This is due to a limitation of the derby database. Use theworkaround in this section to avoid this problem.
Procedure1. Locate the jvm.options file in <impact_home>/wlp/usr/servers/<Impact_server
_name>/.2. Uncomment the following line in all the nodes of the failover cluster:
#-Xgc:classUnloadingKickoffThreshold=100
3. Restart all nodes in the failover Netcool/Impact cluster.
Results
Following these changes, any currently running seasonality report will terminatecorrectly during the cluster failover and any queued reports will continue runningafter the failover has completed.
158 IBM Netcool Operations Insight: Integration Guide
Uninstalling Event AnalyticsYou can uninstall Event Analytics with the IBM Installation Manager GUI orconsole, or do a silent uninstall.
For more information about installing and using IBM Installation Manager, see thefollowing IBM information center:
http://pic.dhe.ibm.com/infocenter/install/v1r7/index.jsp
Uninstalling Event AnalyticsUse IBM Installation Manager to remove Event Analytics .
Before you begin
Take the following actions:v Stop all Event Analytics processes.v Back up any data or configuration files that you want to retain.v To do a silent removal, create or record an Installation Manager response file.
Use the -record response_file option.To create a response file without installing the product, use the -skipInstalloption. For example:1. Create or record a skipInstall:
IBMIM.exe -record C:\response_files\install_1.xml -skipInstallC:\Temp\skipInstall
2. To create an uninstall response file, using the created skipInstall:IBMIM.exe -record C:\response_files\uninstall_1.xml -skipInstallC:\Temp\skipInstall
About this task
Note: To uninstall Tivoli Netcool/OMNIbus Web GUI 8.1.0.13, you must firstuninstall the Netcool Operations Insight Extensions for IBM TivoliNetcool/OMNIbus Web GUI_8.1.0.13, including the Event Analytics feature.
Procedure
GUI removal
1. To remove Event Analytics with the Installation Manager GUI:a. Change to the /eclipse subdirectory of the Installation Manager installation
directory.b. Use the following command to start the Installation Manager wizard:
./IBMIM
c. In the main Installation Manager window, click Uninstall.d. Select the offerings that you want to remove and follow the Installation
Manager wizard instructions to complete the removal.
Console removal
2. To remove Event Analytics with the Installation Manager console:a. Change to the /eclipse/tools subdirectory of the Installation Manager
installation directory.b. Use the following command to start the Installation Manager:
Event Analytics 159

./imcl -c
c. From the Main Menu, select Uninstall.d. Select the offerings that you want to remove and follow the Installation
Manager instructions to complete the removal.
Silent removal
3. To silently remove Event Analytics:a. Change to the /eclipse/tools subdirectory of the Installation Manager
installation directory.b. Use the following command to start the Installation Manager:
./imcl -input response_file -silent -log /tmp/install_log.xml-acceptLicense
Where response_file is the directory path to the response file that defines theremoval configuration
Results
Installation Manager removes the files and directories that it installed.
What to do next
Files that Installation Manager did not install, and configuration files that werechanged, are left in place. Review these files and remove them or back them up asappropriate.
Event Analytics Configuration
1.4.1.2
In Netcool/Impact v7.1.0.13 it is recommended to use the Event Analyticsconfiguration wizard instead of the ./nci_trigger command to edit properties inthe NOI Shared Configuration properties file. The setup wizard guides youthrough the Event Analytics configuration process. You must run the EventAnalytics configuration wizard after upgrading to Netcool/Impact v7.1.0.13 toverify and save your configuration.
To launch the wizard, click Insights and select Event AnalyticsConfiguration.
The Event Analytics Configuration wizard consists of two parts:1. Configuring access to the following databases:v The Tivoli Netcool/OMNIbus Historical Event Database, containing historical
event data used to analyze historical events for Event Analytics.v The Tivoli Netcool/OMNIbus ObjectServer, containing live event data to be
enriched based on insights derived from Event Analytics processing.2. Configuring settings to control Event Analytics processing.
160 IBM Netcool Operations Insight: Integration Guide

Configuring the historical event database1.4.1.2
Configure access to the Tivoli Netcool/OMNIbus historical event database thatcontains the data used to analyze historical events for Event Analytics. On thehistorical event database window, you specify the database type, connectiondetails, table name, and timestamp format.
Procedure1. Specify the database type used for the historical event database:v DB2
v Oracle
v MS SQL Server
2. Enter the connection details for the database in the fields provided.
HostnameEnter the name of the server hosting the database.
Port Enter the port number to be used to connect to the server that hosts thedatabase.
UsernameEnter the username for connecting to the database.
PasswordEnter the password for the specified username.
Database NameIn the Database Name field enter the name of the database you want toaccess. For example REPORTER.
Click Connect to validate your connection to the historical event database.3. For the table you want to query, select a Database schema and History table
from the drop-down lists provided.a. The options available under Database schema are based on the username
provided to connect to the historical event database.b. The options available under History table are based on the selected
Database schema.4. Specify the timestamp field used in the historical event database to store the
first occurrence of an event. Also, specify the format of the timestamp data. Thetimestamp format may vary depending on the database type you use.Example timestamp formats:
DB2: yyyy-MM-dd HH:mm:ssMS SQL Server: YYYY-MM-DD hh:mm:ssOracle: yyyy-mm-dd hh24:mi:ss
Click Validate to verify your timestamp data.
Event Analytics 161
Specifying the primary and backup ObjectServer1.4.1.2
On the ObjectServer window, enter the hostname, port, and user credentials toconnect to the primary and backup ObjectServers.
Before you begin
Advanced configuration settings such as selecting an SID or Service Name toconnect the database are not available in the Event Analytics Configuration wizard.If this type of settings exists, see the appropriate backend configurationinstructions for your database type:v “Configuring Oracle database connection within Netcool/Impact” on page 239v “Configuring DB2 database connection within Netcool/Impact” on page 241v “Configuring MS SQL database connection within Netcool/Impact” on page 243
Procedure1. In the fields provided, enter the connection details to the primary ObjectServer:
HostnameEnter the hostname where the primary ObjectServer is installed.
Port Specify the port number that the primary ObjectServer will use.
UsernameEnter the username to access the ObjectServer.
PasswordEnter the password for the specified username.
2. To enable a backup ObjectServer, select the Enable backup ObjectServer checkbox and enter the connection details:
Note: Selecting Enable backup ObjectServer enables the fail back option whenImpact cannot connect to the database. Deselecting this option disables thebackup.
HostnameEnter the hostname where the backup ObjectServer is installed.
Port Specify the port number that the backup ObjectServer will use.The Username and Password are same as the credentials specified for theprimary ObjectServer.Click Connect to connect to the ObjectServer.
Adding report fields1.4.1.2
Select report fields to add additional information to seasonal and related eventreports, historical event reports, and instance reports.
Before you begin
If you add any custom columns to any of the reports defined in the EventAnalytics Setup Wizard and define a column title for this column, then, if youwant translations of the column title to appear in the relevant Event Analytics
162 IBM Netcool Operations Insight: Integration Guide

report, you must edit the relevant translation files. For more information abouttranslating column labels, see https://www.ibm.com/support/knowledgecenter/SSSHYH_7.1.0.11/com.ibm.netcoolimpact.doc/solution/col_label_translations_for_seasonality.html.
If you do not do this, then when the column title is displayed in the relevant EventAnalytics report, it will appear in English, regardless of the locale of the browser.
Procedure1. Specify the Aggregate fields.
You can add aggregate fields to the seasonal and related event reports, byapplying predefined aggregate functions to selected fields from the HistoricalEvent Database. These fields are displayed in the seasonal and related eventreports in the same order as they appear below.Example: To display the maximum severity of all the events that make up arelated event group select the SEVERITY field, then apply the Max aggregatefunction, and click Include in reports: Related.
Note: Once you have saved these settings, you must rerun the relevantconfiguration scans in order for the changes to become visible in your seasonaland related event reports.
2. Specify the Historical report fields.The fields specified here are displayed in the historical event report, in thesame order as they appear below. The historical event report is shown whenyou drill in from a seasonal event to its contributing historical events.
Note: When you next open the historical event report, wait 20 seconds for yourchanges to appear.
3. Specify the Instance report fields.The fields specified here are displayed as additional fields in the instance reportfor a related event group, in the same order as they appear below. The instancereport is shown when you drill into event details from a related event group, toshow the instances of that group.
Note: When you next open the instance event report, wait 20 seconds for yourchanges to appear.
4. Click Save to save your changes.
Configuring event suppression1.4.1.2
Some events might not be important with respect to monitoring your networkenvironment. For events that do not need to be viewed or acted on, eventsuppression is available as an action when creating a seasonal event rule.
About this task
For seasonal event rules, specify the ObjectServer fields to use for suppressing andunsuppressing events.
Procedure1. To suppress an event, select a Suppression field and Suppression field value
from the drop-down lists provided. The field and value that you define here
Event Analytics 163

are used to mark the event for suppression when the incoming event matchesthe seasonal event rule with event suppression selected as one of its actions.
2. To unsuppress an event, select an Unsuppression field and Unsuppressionfield value from the drop-down lists provided. The field and value that youdefine here are used to unsuppress an event when the incoming event matchesthe seasonal event rule with event suppression selected as one of its actions.
3. Click Save to save your changes.
Configuring event pattern processing1.4.1.2
An event pattern is a set of events that typically occur in sequence on a networkresource. For example, on a London router LON-ROUTER-1, the followingsequence of events might frequently occur: FAN-FAILURE, POWER-SUPPLY-FAILURE, DEVICE-FAILURE, indicating that the router fan needs to be changed.Using the related event group feature, Event Analytics will discover this sequenceof events as a related event group on LON-ROUTER-1.Using the event pattern feature, Event Analytics can then detect this related eventgroup on any network resource. In the example above, the related event groupFAN-FAILURE, POWER-SUPPLY-FAILURE, DEVICE-FAILURE detected on theLondon router LON-ROUTER-1 can be stored as a pattern and that pattern can bedetected on any other network resource, for example, on a router in Dallas,DAL-ROUTER-5.
Procedure1. Select the appropriate Historical Event Database column(s) for the following
Global settings:
Default event typeAn event type is a category of event, for example: FAN-FAILURE,POWER-SUPPLY-FAILURE and DEVICE-FAILURE are event types. Bydefault event type information is stored in the following HistoricalEvent Database column: ALERTGROUP. If you have another set of eventsthat you categorize in a different way, then you can specify additionalevent type columns in section 2 below.
Default event identityThe event identity uniquely identifies an event on a specific networkresource. By default the event identity is stored in the followingHistorical Event Database column: IDENTIFIER.
ResourceA resource identifies a network resource on which events occur. In theexample, LON-ROUTER-1 and DAL-ROUTER-5 are examples ofresources on which events occur. By default this resource information isstored in the following Historical Event Database column: NODE.
2. If you have another set of events that you categorize in a different way, youcan add them as Additional event types.a. Select the check box to enable Additional event types.b. Click Add new. Add a row for each distinct set of events.c. Specify the filters and fields listed below for each set of events. Event
Analytics uses these settings to determine event patterns for a set of events.Filters are applied from top to bottom, in the order that they appear in thetable. You can change the order by using the controls at the end of the row.
164 IBM Netcool Operations Insight: Integration Guide

Database filterSpecify the filter that matches this set of historical events in theHistorical Event Database.
ObjectServer filterSpecify the filter that matches the corresponding set of live events inthe ObjectServer. The ObjectServer filter should be semanticallyidentical to the Database filter, except that you should specifyObjectServer column syntax for the columns.
Event type fieldAn event type is a category of event, for example: FAN-FAILURE,POWER-SUPPLY-FAILURE, and DEVICE-FAILURE are event types.For this set of events, specify the Historical Event Database columnthat stores event type information.
Event identity field(s)The event identity uniquely identifies an event on a specificnetwork resource. For this set of events, specify the Historical EventDatabase column or columns that stores event identity information.
Reviewing the configuration1.4.1.2
On the Summary window, review your settings. You can also save the settings hereor click Back to make changes to the settings that you configured.
Procedure1. Review the settings on the Summary window.
Click Back or any of the navigation menu links to modify the settings asappropriate.
2. When you are satisfied with the configuration settings, click Save.
Exporting the Event Analytics configuration1.4.1.2
Use the nci_trigger command to export a saved Event Analytics configuration toanother system.
Procedure1. To generate a properties file from the command-line interface, use the following
command:nci_trigger server <UserID>/<password> NOI_DefaultValues_ExportFILENAME directory/filename
Where:
SERVERThe server where Event Analytics is installed.
<UserID>The user name of the Event Analytics user.
<password>The password of the Event Analytics user.
Event Analytics 165
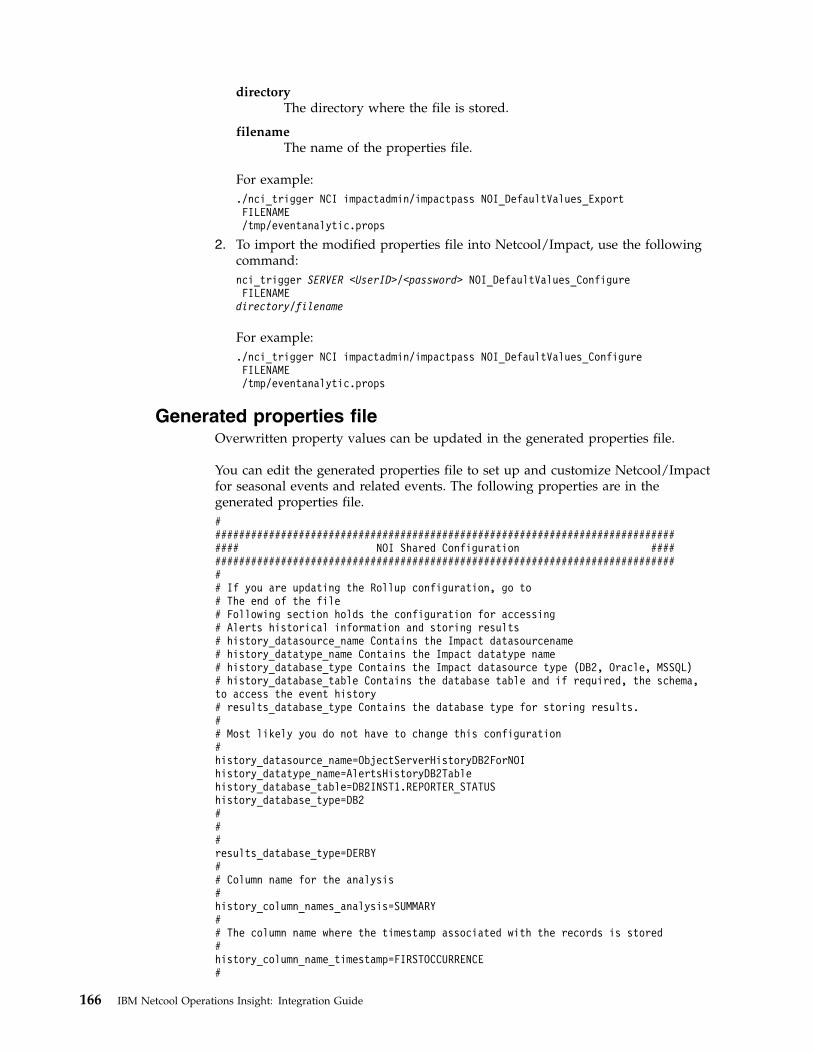
directoryThe directory where the file is stored.
filenameThe name of the properties file.
For example:./nci_trigger NCI impactadmin/impactpass NOI_DefaultValues_ExportFILENAME/tmp/eventanalytic.props
2. To import the modified properties file into Netcool/Impact, use the followingcommand:nci_trigger SERVER <UserID>/<password> NOI_DefaultValues_ConfigureFILENAME
directory/filename
For example:./nci_trigger NCI impactadmin/impactpass NOI_DefaultValues_ConfigureFILENAME/tmp/eventanalytic.props
Generated properties fileOverwritten property values can be updated in the generated properties file.
You can edit the generated properties file to set up and customize Netcool/Impactfor seasonal events and related events. The following properties are in thegenerated properties file.################################################################################## NOI Shared Configuration ################################################################################### If you are updating the Rollup configuration, go to# The end of the file# Following section holds the configuration for accessing# Alerts historical information and storing results# history_datasource_name Contains the Impact datasourcename# history_datatype_name Contains the Impact datatype name# history_database_type Contains the Impact datasource type (DB2, Oracle, MSSQL)# history_database_table Contains the database table and if required, the schema,to access the event history# results_database_type Contains the database type for storing results.## Most likely you do not have to change this configuration#history_datasource_name=ObjectServerHistoryDB2ForNOIhistory_datatype_name=AlertsHistoryDB2Tablehistory_database_table=DB2INST1.REPORTER_STATUShistory_database_type=DB2###results_database_type=DERBY## Column name for the analysis#history_column_names_analysis=SUMMARY## The column name where the timestamp associated with the records is stored#history_column_name_timestamp=FIRSTOCCURRENCE#
166 IBM Netcool Operations Insight: Integration Guide

##history_db_timestampformat=yyyy-MM-dd HH:mm:ss.SSSconfiguration_db_timestampformat=yyyy-MM-dd HH:mm:ss.SSS################################################################################## Seasonality Only Configuration ################################################################################### Will only save and process events of this confidence level or higher#save_event_threshold=.85## Used in determining the confidentialiy level ranges, by determining thethreshold values.# level_threshold_high Level is high, when confidentiality is greater thanor equal to# level_threshold_medium Level is medium, when confidentiality is greaterthan or equal to# level_threshold_low Level is low, when confidentiality is greater than orequal to# If the confidentiality doesn’t meet any of these conditions, level will beset to unknown.#level_threshold_high=99level_threshold_medium=95level_threshold_low=0## Rollup configuration adds additional information to the Seasonal Report data# number_of_rollup_configuration Contains the number of additional rollupconfiguration# rollup_ <number where its 1 to n >_column_nameContains the column name fromwhich the data is retreived# rollup_ <number where its 1 to n >_type Contains the type value# rollup_ <number where its 1 to n >_display_name A name that needs to bedefined in the UI# Types can be defined as follows :# MAX, MIN, SUM, NON_ZERO, DISTINCT and EXAMPLE# MAX: The maximum value observed for the column, if no value is ever seenthis will default to Integer.MIN_VALUE# MIN: The minimum value observed for the column, if no value is ever seenthis will default to Integer.MAX_VALUE# SUM: The sum of the values observed for the column.# NON_ZERO: A counting column, that counts "Non-Zero"/"Non-Blank"occurrences of events, this can be useful to# track the proportion of events that have been actioned,or how many events had a ticket number associated# with them.# DISTINCT: The number of distinct values that have been seem for this key,value pair# EXAMPLE: Show the first non-blank "example" of a field that contained thiskey, useful when running seasonality on a# non-digestible field such as ALERT_IDENTIFIER, and you want anexample human readable# SUMMARY to let you understand the type of problem#number_of_rollup_configuration=2rollup_1_column_name=SEVERITYrollup_1_type=MINrollup_1_display_name=MINSeverityrollup_2_column_name=SEVERITYrollup_2_type=MAXrollup_2_display_name=MAXSeverity################################################################################## Related Events Only Configuration #################################################################################
Event Analytics 167

## Rollup configuration adds additional information to the Related Events data# reevent_number_of_rollup_configuration Contains the number of additionalrollup configuration# reevent_rollup_ <number where its 1 to n >_column_nameContains the columnname from which the data is retrieved# reevent_rollup_ <number where its 1 to n >_type Contains the type value# reevent_rollup_ <number where its 1 to n >_display_name A name that needsto be defined in the UI# reevent_rollup_ <number where its 1 to n >_actionable Numeric only columnthat determines the weight for probable root cause# Types can be defined as follows :# MAX, MIN, SUM, NON_ZERO, DISTINCT and EXAMPLE# MAX: The maximum value observed for the column, if no value is everseen this will default to Integer.MIN_VALUE# MIN: The minimum value observed for the column, if no value is everseen this will default to Integer.MAX_VALUE# SUM: The sum of the values observed for the column.# NON_ZERO: A counting column, that counts "Non-Zero"/"Non-Blank"occurrences of events, this can be useful to# track the proportion of events that have been actioned, orhow many events had a ticket number associated# with them.# DISTINCT: The number of distinct values that have been seem for thiskey, value pair# EXAMPLE: Show the first non-blank "example" of a field that containedthis key, useful when running Seasonality on a# non-digestible field such as ALERT_IDENTIFIER, and you wantan example human readable# SUMMARY to let you understand the type of problem#reevent_number_of_rollup_configuration=3reevent_rollup_1_column_name=ORIGINALSEVERITYreevent_rollup_1_type=MAXreevent_rollup_1_display_name=MAXSeverityreevent_rollup_1_actionable=truereevent_rollup_2_column_name=ACKNOWLEDGEDreevent_rollup_2_type=NON_ZEROreevent_rollup_2_display_name=Acknowledgedreevent_rollup_2_actionable=truereevent_rollup_3_column_name=ALERTGROUPreevent_rollup_3_type=EXAMPLEreevent_rollup_3_display_name=AlertGroupreevent_rollup_3_actionable=false## Group Information adds additional group information under the Show Details ->Group More Information portion of the UI# reevent_num_groupinfo Contains the number of group information columns todisplay# reevent_groupinfo_ <number where its 1 to n >_columnContains the columnname from which the data is retrieved# The following columns are allowed :# PROFILE, EVENTIDENTITIES, INSTANCES, CONFIGNAME, TOTALEVENTS,UNIQUEEVENTS, REVIEWED, GROUPTTL# PROFILE: The relationship profile, or strength of the group.# EVENTIDENTITIES: A comma separated list that creates the event identity.# INSTANCES: The total number of group instances.# CONFIGNAME: The configuration name the group was created under.# TOTALEVENTS: The total number of events within the group.# UNIQUEEVENTS: The total number of unique events within the group.# REVIEWED: Whether the group has been reviewed by a user or not.# GROUPTTL: The number of seconds the group will stay active after thefirst event occurs.#reevent_num_groupinfo=3reevent_groupinfo_1_column=PROFILEreevent_groupinfo_2_column=EVENTIDENTITIES
168 IBM Netcool Operations Insight: Integration Guide

reevent_groupinfo_3_column=INSTANCES## Event Information adds additional event information under the Show Details ->Event More Information portion of the UI# reevent_num_eventinfo Contains the number of event information columns todisplay# reevent_eventinfo_ <number where its 1 to n >_columnContains the column namefrom which the data is retrieved# The following columns are allowed :# PROFILE, INSTANCES, EVENTIDENTITY, EVENTIDENTITIES, CONFIGNAME, and GROUPNAME# PROFILE: The relationship profile, or strength of the related event.# INSTANCES: Total number of instance for the related event.# EVENTIDENTITY: The unique event identity for the related event.# EVENTIDENTITIES: A comma separated list that creates the event identity.# CONFIGNAME: The configuration name the related event was created under.# GROUPNAME: The group name the related event is created under.#reevent_num_eventinfo=1reevent_eventinfo_1_column=INSTANCES#################################################################################### The following properties are used to configure event pattern creation ### type.resourcelist=<columns include information. Comma separated list > ### type.servername.column=<SERVERNAME column name if different than default> ### type.serverserial.column=<SERVERSERIAL column name if different than default> ### type.default.eventid=<default event identities when there is no mactch ### found in the types configuration. Comma separated list ### The id should not include a timestamp component. ### type.default.eventtype=<default event type when there is no match ### found in the types configuration. ### type index starts with 0 ### type_number_of_type_configurations=number of type configurations ### type.index.eventid=event identity column name ### type.index.eventtype=event column includes the type to use ### type.index.filterclause=History DB filter to filter events to find the types ### type.index.osfilterclause=ObjectServer filter tp filter matching events types ### ### ### NOTE : It is recommended to create database index(s) on the reporter status ### table for the fields used in the filtercaluse to speed the query(s). ### Example to create an index: ### create index types_index on db2inst1.reporter_stuats (Severity) ### ### ###Use the following as an example creating one type only ### ###type_number_of_type_configurations=1 ###type.0.eventid=NODE,SUMMARY,ALERTGROUP ###type.0.eventtype=ACMEType ###type.0.filterclause=Vendor =( ’ACME’ ) ###type.0.osfilterclause=Vendor = ’ACME’ ####################################################################################type.resourcelist=NODEtype.default.eventid=IDENTIFIERtype.default.eventtype=ALERTGROUPtype.servername.column=SERVERNAMEtype.serverserial.column=SERVERSERIAL
type_number_of_type_configurations=1type.0.eventid=SUMMARYtype.0.eventtype=ALERTGROUPtype.0.filterclause=( Severity >=3 )type.0.osfilterclause=Severity >=3
Event Analytics 169

Configure Analytics portletThe Configure Analytics portlet contains a list of existing event configurations, orreports. Use this portlet to view, create, modify, delete, run, or stop eventconfigurations.
Note: To access the Configure Analytics portlet, users must be assigned thencw_analytics_admin role.
You can use the Configure Analytics portlet to determine whether an event recursand when it recurs most frequently. For example, an event occurs frequently at 9a.m. every Monday. Knowledge of the type of event and the patterns of recurrencecan help to determine the actions that are required to reduce the number of events.
The Configure Analytics table displays the following columns of information foreach event configuration.
Name Specifies the unique event configuration name.
Event IdentitySpecifies the database fields that identify a unique event in the database.Event seasonality runs on all events selected from the Event Identitydrop-down list. If the Event Identity value is Using Global Settings, theEvent Identity is set up in the configuration file.
Seasonality EnabledSpecifies whether the event configuration has seasonality event analyticsenabled. This column displays one of the following values:v True: Seasonality analytics is enabled.v False: Seasonality analytics is not enabled.
The column displays the value true if seasonality analytics is enabled.
Related Event EnabledSpecifies whether the event configuration has related event analyticsenabled. This column displays one of the following values:v True: Related event analytics is enabled.v False: Related event analytics is not enabled.
Seasonality StatusSpecifies the status of the seasonality event configuration. The column candisplay one of the following status icons: Waiting, Running, Completed, orError.
Related Event StatusSpecifies the status of the related event configuration. The column candisplay one of the following status icons: Waiting, Running, Completed, orError.
Start TimeSpecifies the inclusive start date of historical data for the eventconfiguration.
End TimeSpecifies the inclusive end date of historical data for the eventconfiguration.
Seasonality PhaseSpecifies the phase of the seasonality event configuration run. In total, thiscolumn displays five phases during the run of the seasonality event
170 IBM Netcool Operations Insight: Integration Guide
configuration. For example, when the seasonality event configurationcompletion phase occurs, the value Completed displays in the column.
Seasonality phase progressDisplays the progress of the seasonality event phase, expressed in terms ofpercentage. For example, when the seasonality event configurationcompletion phases finishes, the value 100% displays in the column.
Related Event PhaseSpecifies the phase of the related event configuration run. In total, thiscolumn displays five phases during the run of the related eventconfiguration. For example, when the related event configurationcompletion phase occurs, the value Completed displays in the column.
Related Event Phase ProgressDisplays the progress of the related event phase, expressed in terms ofpercentage. For example, when the related event configuration completionphases finishes, the value 100% displays in the column.
ScheduledIndicates whether the event configuration run is scheduled to run every xnumber of days, weeks, or months. The value Yes displays in the column ifthe event configuration run is scheduled.
Relationship profileThe entry in this column specifies the strength of the relationship betweenthe events in the event groups that are determined by the algorithm. Onevalue is specified.
Strong Represents a high confidence level for relationships between events,but fewer events and fewer event groups. Your event groups might bemissing weaker related events.
Medium Represents medium confidence level for relationships betweenevents, average number of events and fewer event groups. Your eventgroups might be missing weakly related events.
Weak You see more events and more event groups but potentially morefalse positives.
Important: Netcool/Impact does not support Arabic or Hebrew. Event Analyticsusers who are working in Arabic or Hebrew see some untranslated English text.
Setting the Impact data provider and other portlet preferencesIf there are multiple connections with the Impact data provider, you must specifywhich Impact data provider to use.
About this task
If a single connection with the Impact data provider exists, then that connection isused to compile the list of seasonal reports and display them in a table. If there aremultiple connections with the Impact data provider, you must edit your portletpreferences to select one of the options.
Procedure1. To edit your portlet preferences, or as an administrator to edit the portlet
defaults:
Event Analytics 171

v To edit your portlet preferences, click Page Actions > Personalize Page> Widget > Personalize.
v To edit the portlet defaults of all users, click Page Actions > Edit Page >Widget > Edit.
The Configure Analytics dialog box is displayed.2. Select a data provider from the Data Provider drop-down list.3. In the Bidi Settings tab, specify the settings for the display of bidirectional text.
Component directionSelect the arrangement of items in the portlet, left-to-right, orright-to-left. The default setting uses the value that is defined for thepage or the console. If the page and console both use the defaultsetting, the locale of your browser determines the layout.
Text directionSelect the direction of text on the portlet. The default settings use thevalue that is defined for the page or the console. If the page andconsole both use the default setting, the locale of your browserdetermines the text direction. The Contextual Input setting displaystext that you enter in the appropriate direction for your globalizationsettings.
4. To save your changes, complete the following steps.a. Select Save in the Configure Analytics dialog box. The Configure Analytics
dialog box is closed.b. Select Save, which is in the upper right of the window.
Viewing current analytics configurationsAn Administrator can see the list of current analytics configurations and somebasic information about the analytics (related events and seasonal events) related tothose configurations.
About this task
Event Analytics includes a default analytics configuration for you to run a basicconfiguration with default values. You can run, modify, or delete this analyticsconfiguration. To view your analytics configurations, complete the following steps.This task assumes that you have logged into the Dashboard Application ServicesHub as a user with the ncw_analytics_admin role.
Procedure1. Start the Configure Analytics portlet.
a. In the Dashboard Application Services Hub navigation menu, go to theInsights menu.
b. Select Configure Analytics.2. In the Configure Analytics portlet, a table presents a list of analytics
configurations that are already configured. Scroll down the list to view allanalytics configurations. The table automatically refreshes every 60 seconds anddisplays information for select column headings.v To view configuration parameters for a specific analytics configuration, select
a configuration and then select the Modify Selected Configuration icon.v To view progress of the latest action that is taken for an analytics
configuration, look at the content that is displayed in the following columns:
172 IBM Netcool Operations Insight: Integration Guide
Seasonality StatusSpecifies the status of the seasonality event configuration. The columncan display one of the following status icons: Waiting, Running,Completed, or Error.
Related Event StatusSpecifies the status of the related event configuration. The column candisplay one of the following status icons: Waiting, Running, Completed,or Error.
Start TimeSpecifies the inclusive start date of historical data for the eventconfiguration.
End TimeSpecifies the inclusive end date of historical data for the eventconfiguration.
Seasonality PhaseSpecifies the phase of the seasonality event configuration run. In total,this column displays five phases during the run of the seasonality eventconfiguration. For example, when the seasonality event configurationcompletion phase occurs, the value Completed displays in the column.
Seasonality Phase ProgressDisplays the progress of the seasonality event phase, expressed in termsof percentage. For example, when the seasonality event configurationcompletion phases finishes, the value 100% displays in the column.
Related Event PhaseSpecifies the phase of the related event configuration run. In total, thiscolumn displays five phases during the run of the related eventconfiguration. For example, when the related event configurationcompletion phase occurs, the value Completed displays in the column.
Related Event Phase ProgressDisplays the progress of the related event phase, expressed in terms ofpercentage. For example, when the related event configurationcompletion phases finishes, the value 100% displays in the column.
v To view other details about the analytics configuration, look at theinformation displayed in other columns:
NameSpecifies the unique event configuration name.
Event identitySpecifies the database fields that identify a unique event in the database.Event seasonality runs on all events selected from the Event Identitydrop-down list.
ScheduledAdvises whether the analytics configuration is scheduled to query thehistorical events database.
Seasonality EnabledSpecifies whether the event configuration has seasonality event analyticsenabled. This column displays one of the following values:– True: Seasonality analytics is enabled.– False: Seasonality analytics is not enabled.
Event Analytics 173

Related Event EnabledSpecifies whether the event configuration has related event analyticsenabled. This column displays one of the following values:– True: Related event analytics is enabled.– False: Related event analytics is not enabled.
Relationship ProfileThe entry in this column specifies the strength of the relationshipbetween the events in the event groups that are determined by thealgorithm. One value is specified.
Strong Represents a high confidence level for relationships betweenevents, but fewer events and fewer event groups. Your event groupsmight be missing weaker related events.
Medium Represents medium confidence level for relationships betweenevents, average number of events and fewer event groups. Your eventgroups might be missing weakly related events.
Weak You see more events and more event groups but potentially morefalse positives.
Creating a new or modifying an existing analyticsconfiguration
An Administrator can create a new analytics configuration or modify an existinganalytics configuration. You choose the analytics type (related events, seasonalevents, or both) you want to run during the create new analytics configurationoperation.
Before you begin
When you modify an existing analytics configuration, you cannot change thefollowing parameter fields in the dialog box:v Name:
v Name
v Analytics Type
v Event identity
v Event identity:
v Seasonal event analytics
v Related event analytics
Procedure1. Start the Configure Analytics portlet. See “Viewing current analytics
configurations” on page 172.2. Select the Create New Configuration icon to create a new analytics
configuration, or highlight an existing analytics configuration and select theModify Selected Configuration icon to modify an existing analyticsconfiguration. The UI displays a dialog box that contains parameter fields forthe new or existing analytics configuration.
3. Populate the parameter fields in the General tab of the dialog box with thedetails applicable to the analytics configuration.
Name Enter the name of the analytics configuration. The name should reflectthe type of analytics configuration you are creating.
174 IBM Netcool Operations Insight: Integration Guide

For example, TestSeasonality1 and TestRelatedEvents1 might benames you assign to analytics configurations for seasonality events andrelated events. The name for an analytics configuration must be uniqueand not contain certain invalid characters.The invalid character list isthe list of characters listed in the webgui_home/etc/illegalChar.propfile.
Analytics TypeSelect Seasonal event analytics, Related event analytics, or both.
Event identityFrom the drop-down list, select the database fields that identify aunique event in the database. Event seasonality runs on all events thatare selected from the Event Identity drop-down list. For informationabout how to change the fields in the drop-down list, see “Changingthe choice of fields for the Event Identity” on page 179.
Date RangeSelect either RelativeFixed date range or FixedRelative date range
Relative: Enter the time frame that is to be included in the analyticsconfiguration. The relative time frame is measured in Months, Weeks,or Days.
Fixed: The Start date and End date parameter fields are active. Enteran inclusive Start date and End date for the analytics configuration.
Fixed date range: The Start date and End date parameter fields areactive. Enter an inclusive Start date and End date for the analyticsconfiguration.
Relative date range: Enter the time frame that is to be included in theanalytics configuration.
Run everyTo schedule the analytics configuration to run at specific time intervals,enter how frequently the configuration is to run. When you enter avalue greater than zero, the analytics configuration becomes ascheduled configuration.
Note: This option applies to the relative date range only. You cannotapply this option to the fixed date range.
Filter Detail any filters that are applicable to the analytics configuration. Forexample, enter Summary NOT LIKE '%maintenance%'.
* Select the analytics type you want to runSelect Seasonal event analytics, Related event analytics, or both.
4. Populate the parameter fields in the Related Events tab of the dialog box withthe details applicable to the analytics configuration.
Relationship ProfileSelect the strength of the relationship between the events in ananalytics configuration. If this value is set to Strong, there is moreconfidence in the result and less number of groups produced.
Automatically deploy rules discovered by this configurationSelect this option to automatically deploy rules that are discovered bythis analytics configuration.
Event Analytics 175

Relationship Profile Select the strength of the relationship between theevents in an analytics configuration. If this value is set to Strong, there ismore confidence in the result and less number of groups produced.Automatically deploy rules discovered by this configuration Select thisoption if you want to automatically deploy rules that are discovered by thisanalytics configuration.
5. Populate the parameter field in the Advanced tab of the dialog box with thedetails applicable to the analytics configuration. You can use the defined eventidentities, select the Override global event identity to identify unique events inthe database.
Override global event identitySelect this option to enable the Event identity drop-down list.
When the Override global event identity check box is selected, youcannot create a pattern from a configuration. However, you can deploya related events group.
Event identityFrom theEvent identity drop-down list, select the database fields thatidentify a unique event in the database. Event seasonality runs on allevents that are selected from the Event Identity drop-down list. Forinformation about how to change the fields in the drop-down list, see“Changing the choice of fields for the Event Identity” on page 179.
6. Click either Save to save the report without running, or click Save & Run tosave and run the report. You can also cancel the operation by clicking Cancel.
Resultsv If no errors are found by the system validation of the analytics configuration
content, the new or updated analytics configuration and its parameters aredisplayed in the table.
v If errors are found by the system validation of the analytics configurationcontent, you are prevented from saving the configuration and you are asked toreset the invalid parameter.
Manually running an unscheduled analytics configurationAn Administrator can manually run an unscheduled analytics configuration at anystage. You choose the analytics type (related events or seasonal events) you want torun during the run unscheduled analytics operation.
Before you begin
The analytics configuration that you try to manually run cannot have a RelatedEvent Status or Seasonality Status of Running. If you try to manually run ananalytics configuration that is already running, the GUI displays a warningmessage.
Note: Sequentially running reports can take longer to complete than parallelrunning reports in previous releases.
Procedure1. Start the Configure Analytics portlet. See “Viewing current analytics
configurations” on page 172.2. Within the list of analytics configurations that are displayed, select one
configuration.
176 IBM Netcool Operations Insight: Integration Guide

3. From the toolbar, click the Run Selected Configuration icon. Some columns areupdated for your selected analytics configuration.
The icon in the Seasonality Status or Related Event Status column changesto a time glass icon.The text in the Seasonality Phase or Related Event Phase column changesto Waiting to Start.The percentage in the Seasonality Phase Progress or Related Event PhaseProgress column starts at 0% and changes to reflect the percentage completefor the phase.
Results
The analytics configuration is put into the queue for the scheduler to run. As theanalytics configuration is running, the following columns are updated tocommunicate the progress of the run:v Seasonality Status or Related Event Status
v Seasonality Phase or Related Event Phase
v Seasonality Phase Progress or Related Event Phase Progress
What to do next
If you want to stop an analytics configuration that is in Running status, from thetoolbar click the Stop Selected Configuration icon.
Stopping an analytics configurationYou can stop an analytics configuration that is running.
About this task
If you create an analytics configuration and select to run the configuration, youmight realize that some configuration values are incorrect while the configurationis still running. In this situation you can choose to stop the analytics configurationinstead of deleting the configuration or waiting for the configuration run tocomplete. To stop a running analytics configuration, complete the following steps.
Procedure1. Start the related events configuration portlet, see “Viewing current analytics
configurations” on page 172.2. Within the list of analytics configurations that are displayed, select the running
configuration.3. From the toolbar, click the Stop Selected Configuration icon.
Deleting an analytics configurationAnalytics configurations can be deleted individually, regardless of their status.
Procedure1. Start the Configure Analytics portlet, see “Viewing current analytics
configurations” on page 172.2. Select the name of the analytics configuration that you want to delete and from
the toolbar click the Delete Selected Configuration icon.3. Within the confirmation dialog that is displayed, select OK. If you attempt to
delete an analytics configuration with one or more rules created for it, a text
Event Analytics 177

warning dialog box appears with the current rules status for that analyticsconfiguration. The following example illustrates text that the warning dialogbox can contain:Configuration EventAnalytics_Report_1 contains the following rules:
Seasonality Rules:0 watched rules, 1 active rules, 0 expired rules and 0 archived
Related Event Rules:0 watched rules, 0 active rules, 0 expired rules and 0 archived
Delete the rules manually before deleting the configuration.
As the message indicates, manually delete the rule or rules associated with thespecified analytics configuration before deleting the analytics configuration. Inthe example, the one active rule associated with the analytics configurationcalled EventAnalytics_Report_1 would need to be deleted first.
Resultsv The table of analytics configurations refreshes, and the deleted configuration no
longer appears in the list of analytics configurations.v Deleting the analytics configuration does not delete the related results if the
results are in the Deployed or Expired state. However, deleting the analyticsconfiguration does delete the related results that are in the New or Archivedstate.
v You are unable to reuse the name of a deleted analytics configuration until allrelated event groups that contain the name of the deleted configuration aredeleted from the system.
Changing the expiry time for related events groupsYou can modify the expiry time for Active related events groups. When the expirytime is reached, the expired groups and related events display in the View RelatedEvents portlet, within the Expired tab.
About this task
Groups that contain an expired group or pattern continue to correlate. The systemadministrator should review the group and expired group or event.
By default the related events expiry time is 6 months. Complete the following stepsto change the related events expiry time.
Note: Watched related events groups do not expire.
Procedure1. Log in to the Netcool/Impact UI.2. Select the Related Events project.3. Select the Policies tab.4. Within the Policies tab, select to edit the RE_CONSTANTS policy.5. Within the RE_CONSTANTS policy, change the value for the RE_EXPIRE_TIME
constant. Enter your new value in months.6. Save the policy.
178 IBM Netcool Operations Insight: Integration Guide

Results
This change takes effect only with newly discovered related event groups in theActive tabs.
What to do next
If you want to configure the expiry time so that deployed groups never expire,change the value for the RE_EXPIRE_TIME constant to 0 and save the policy for thischange to take effect. You do not need to restart the Impact Server.
If you want to enable the expiry time at any stage, set this variable back to a valuegreater than 0.
Changing the choice of fields for the Event IdentityYou can change which fields, from your event history database, are available forselection as the Event Identity.
About this task
An Event Identity is a database field that identifies a unique event in the eventhistory database. When you configure a related events configuration, you selectdatabase fields for the Event Identity from a drop-down list of available fields.Through configuration of an exception list within Netcool/Impact, you can changethe fields available for selection in the drop-down list. Fields included in theexception list do not appear in the Configure Analytics portlet.
The Netcool/Impact design displays the following default fields in the EventIdentity drop-down list
Alert Group
Alert Key
Node
Summary
Identifier
LOCALNODEALIAS
LOCALPRIOBJ
LOCALROOTOBJ
LOCALSECOBJ
REMOTENODEALIAS
REMOTEPRIOBJ
REMOTEROOTOBJ
REMOTESECOBJ
If you have other database fields that are not in the exception list, these otherfields also appear in the drop-down list. Complete the following steps to modifythe exception list.
Procedure1. Log in to Netcool/Impact.2. From the list of available projects, select the RelatedEvents project.3. Select the Policies tab. Within this tab, select and edit the RE_CONSTANTS
policy.
Event Analytics 179

4. Update the RE_OBJECTSERVER_EXCLUDEDFIELDS variable. Add or remove fieldsfrom the static array. Case sensitivity does not matter.
5. Save the policy.6. Run the policy. If there is an error, check your syntax.
Results
The changes occur when the policy is saved. No restart of Netcool/Impact isneeded.
View Seasonal Events portletThe View Seasonal Events portlet contains a list of configurations, a list of seasonalevents, and seasonal event details.
In addition to viewing the seasonal events, you can mark events as reviewed andidentify the events that were reviewed by others.
The View Seasonal Events portlet displays the following default columns in thegroup table:
ConfigurationDisplays a list of the seasonal event configurations.
Event CountDisplays a count of the number of seasonal events for each seasonal eventconfiguration.
Node Displays the managed entity from which the seasonal event originated. Themanaged entity could be a device or host name, service name, or otherentity.
SummaryDisplays the description of the seasonal event.
Alert GroupDisplays the Alert Group to which the seasonal event belongs.
Reviewed byDisplays the list of user names of the users who reviewed the seasonalevent.
Confidence LevelDisplays icons and text based on the level of confidence that is associatedwith the seasonal event. The confidence level is displayed as high,medium, or low, indicating that an event has a high, medium, or lowseasonality.
Maximum SeverityDisplays the maximum severity of the events that contribute to theseasonality of the selected seasonal event.
Rule CreatedDisplays the name of the seasonal event rule that was created for theseasonal event.
Related Events CountDisplays a count of the number of related events for each seasonal event.
180 IBM Netcool Operations Insight: Integration Guide
First OccurrenceDisplays the date and time when the seasonal event first occurred. Thetime stamp is configurable by users and is displayed in the followingformat:YYYY-MM-DD HH:MM:SS
For example:2012-10-12 09:52:58.0
Viewing a list of seasonal event configurations and eventsYou can view a list of the seasonal event configurations and seasonal events in theView Seasonal Events portlet.
Before you begin
To access the View Seasonal Events portlet, users must be assigned thencw_analytics_admin role.
Procedure
To view a list of the seasonal event configurations and seasonal events, completethe following steps.1. Open the View Seasonal Events portlet.2. By default, the Seasonal Event configurations are listed in the Configuration
table.3. To view a list of seasonal events associated with the configurations, select one
of the following options.a. Select All to view of list of the seasonal events for all of the configurations.b. Select a specific configuration to view a list of the seasonal events for that
configuration.The seasonal events are listed in the Summary table.
Results
The seasonal event configurations and associated seasonal events are listed in theView Seasonal Events portlet.
Reviewing a seasonal eventYou can mark or unmark a seasonal event as reviewed.
About this task
The Reviewed by column in the View Seasonal Events portlet displays the username of the reviewer.
Procedure
To update the review status of an event, complete the following steps.1. Open the View Seasonal Events portlet.2. Select a specific configuration or ALL in the configuration table.3. Select a seasonal event from the events table.4. Right-click the seasonal event and select Mark as Reviewed or Unmark as
Reviewed.
Event Analytics 181

Each seasonal event can be reviewed by multiple users. The reviewers are listedin the Reviewed by column.
Results
The selected seasonal event is marked or unmarked as Reviewed. The Reviewedby column is updated to display the user name of the reviewer.
Sorting columns in the View Seasonal Events portletYou can sort the columns in the View Seasonal Events portlet to organize thedisplayed data.
Before you begin
To access the View Seasonal Events portlet, users must be assigned thencw_analytics_admin role.
About this task
The rows in the View Seasonal Events portlet are sorted by the configurationname. You can change the order of the rows by using the columns to sort the data.
Sorted columns are denoted by an upwards-pointing arrow ordownwards-pointing arrow in the column header, depending on whether thecolumn is sorted in ascending or descending order.
Procedure
To sort the rows by column, complete the following steps.1. Open the View Seasonal Events portlet.2. To sort single columns, complete the following steps.
a. To sort a column, click the column header once. The rows are sorted inascending order.
b. To sort in descending order, click the column header again.c. To unsort the column, click the column header a third time.
3. To sort multiple columns, complete the following steps.a. Sort the first column as a single column.b. Move the mouse pointer over the column header of the next column you
want to sort. Two icons are displayed. One is a standard sorting icon andthe other is a nested sorting icon. The nested sorting icon has a number thatrepresents how many columns are sorted as a result of selecting the option.For example, if this is the second column that you want to sort the number2 is displayed.
c. Click the nested sorting icon. The column is sorted with regard to the firstsorted column.
Tip: When you move the mouse pointer over the nested sorting icon, thehover help indicates that it is a nested sorting option. For example, thehover help for the icon displays “Nested Sort - Click to sort Ascending”.The resulting sort order is ascending with regard to the previous columnson which a sorting order was placed.
182 IBM Netcool Operations Insight: Integration Guide

d. To reverse the order of the nested sort, click the nested sorting icon again.The order is reversed and the nested sorting icon changes to the removesorting icon.
e. To remove nested sorting from a column, move the mouse pointer over thecolumn header and click the Do not sort icon.
Note: In any sortable column after nested sorting is selected, when you clickthe standard sorting icon, it becomes the only sorted column in the table andany existing sorting, including nested is removed.
Results
Sorted columns are marked with an upwards-pointing arrow or adownwards-pointing arrow in the column header to indicate whether the columnis sorted in ascending or descending order. The sorting is temporary and is notretained.
Exporting all seasonal events for a specific configuration toMicrosoft Excel
You can export all seasonal events for a specific configuration to a Microsoft Excelspreadsheet from a supported browser.
Before you begin
You view seasonal events for one or more configurations in the View SeasonalEvents portlet. To access the View Seasonal Events portlet, users must be assignedthe ncw_analytics_admin role.
Procedure
To export all seasonal events for a specific configuration to a Microsoft Excelspreadsheet, complete the following steps.1. Open the View Seasonal Events portlet.2. Select a specific configuration from the configuration table.3. Click the Export Seasonal Events button in the toolbar. After a short time, the
Download export results link displays.4. Click the link to download and save the Microsoft Excel file.
Results
The Microsoft Excel file contains a spreadsheet with the following tabs:v Report Summary: This tab contains a summary report of the configuration that
you selected.v Seasonal Events: This tab contains the seasonal events for the configuration that
you selected.v Export Comments: This tab contains any comments relating to the export for
informational purposes (for example, if the spreadsheet headers are truncated, orif the spreadsheet rows are truncated).
Event Analytics 183
Exporting selected seasonal events for a specificconfiguration to Microsoft Excel
You can export selected seasonal events for a specific configuration to a MicrosoftExcel spreadsheet from a supported browser.
Before you begin
You view seasonal events for one or more configurations in the View SeasonalEvents portlet. To access the View Seasonal Events portlet, users must be assignedthe ncw_analytics_admin role.
Procedure
To export selected seasonal events for a specific configuration to a Microsoft Excelspreadsheet, complete the following steps.1. Open the View Seasonal Events portlet.2. Select a specific configuration from the configuration table.3. Select multiple seasonal events by using the Crtl key and select method. (You
can also select multiple seasonal events by using the click and drag method.)4. After selecting multiple seasonal events, right click on one of the selected
seasonal events and select the Export Selected Events button in the toolbar.After a short time, the Download export results link displays.
5. Click the link to download and save the Microsoft Excel file.
Results
The Microsoft Excel file contains a spreadsheet with the following tabs:v Report Summary: This tab contains a summary report of the configuration that
you selected.v Seasonal Events: This tab contains the seasonal events for the configuration that
you selected.v Export Comments: This tab contains any comments relating to the export for
informational purposes (for example, if the spreadsheet headers are truncated, orif the spreadsheet rows are truncated).
Seasonal Event RulesYou can use seasonal event rules to apply an action to specific events.
You can choose to apply actions to a selected seasonal event, or to a seasonal eventand some or all of its related events.
You can use seasonal event rules to apply actions to suppress and unsuppress anevent, to modify or enrich an event, or to create an event if the selected event doesnot occur when expected.
184 IBM Netcool Operations Insight: Integration Guide

Creating a seasonal event ruleYou can create a watched or deployed seasonal event rule from the View SeasonalEvents portlet.
Before you begin
To access the View Seasonal Events portlet, users must be assigned thencw_analytics_admin role.
Procedure
To create a seasonal event rule in the View Seasonal Events portlet, complete thefollowing steps.1. Open the View Seasonal Events portlet.2. Select a specific configuration or ALL in the configuration table.3. Select a seasonal event from the events table.4. Right-click the seasonal event and select Create Rule.5. Input a unique rule name in the Create Rule window.6. Input the following rule criteria for events and actions in the Create Rule
window.a. To apply rule actions to an event and time condition, see “Applying rule
actions to an event and time condition.”b. To apply actions when an event occurs, see “Applying actions when an
event occurs” on page 187.c. To Applying actions when an event does not occur, see “Applying actions
when an event does not occur” on page 188.7. To save the seasonal event rule, choose one of the following criteria.
a. Select Watch to monitor the rule's performance before it is deployed.b. Select Deploy to activate the rule.
Results
A seasonal event rule is created. To view a list of current seasonal event rules,open the Seasonal Event Rules portlet.
Applying rule actions to an event and time conditionTo create a seasonal event rule, you must specify the selected events or timeconditions, or both in the Create Rule or Modify Existing Rule window.
Before you begin
Create or modify an existing seasonal event rule. To create a seasonal event rule,see “Creating a seasonal event rule.” To modify an existing seasonal event rule, see“Modifying an existing seasonal event rule” on page 191.
About this task
The seasonal event that is selected by default in the Event Selection pane is theseasonal event from which the Create Rule or Modify Existing Rule window wasopened.
Event Analytics 185

Note: A seasonal event rule suppresses events when they occur for a deployedrelated event group. The seasonal rule actions do not apply to the synthetic parentevent that is created.
Note: You can create a seasonal event rule to unsuppress an event or alarm. Thisrule has no actions if there are no suppressed alarms.
Procedure
To specify the selected events and time conditions, complete the following steps inthe Create Rule window.1. To select the all, or one or more of the events that are related to the seasonal
event, complete the following steps.a. To select all of the related events, select the Select all related events check
box.b. To edit or select one or more of the related events, click Edit Selection,
select one or more related events.2. To save the related eventselection, click OK
3. To select a time condition, complete the following steps.a. Select one of the following time condition filter conditions.
AND Select AND to apply rule actions to each of the selected the timeconditions.
OR Select OR to apply rule actions to individual time conditions.b. Select Minute of the Hour, Hour of the Day, Day of Week, or Day of
Month from the drop-down menu.c. Select Is or Is Not from the drop-down menu.d. Select the appropriate minute, hour, day, or date from the drop-down menu.
You can select multiple values from this drop-down menu.
Note: High, medium, and low seasonality labels are applied to this timeselection drop-down menu to indicate the seasonality of the eventsoccurring at that time.
4. Click the add button to add another time condition.5. To save the event selection and time conditions, choose one of the following
criteria.a. Select Watch to monitor the rule's performance before it is deployed.b. Select Deploy to activate the rule.
Results
The seasonal event rule conditions are applied to the selected events, timeconditions, or both.
186 IBM Netcool Operations Insight: Integration Guide
Applying actions when an event occursYou can apply specific actions to occur when an event occurs in a specific timewindow.
Before you begin
Create or modify an existing seasonal event rule. To create a seasonal event rule,see “Creating a seasonal event rule” on page 185. To modify an existing seasonalevent rule, see “Modifying an existing seasonal event rule” on page 191.
Note: To suppress or unsuppress events you must update the noi_default_valuesfile. For more information about the noi_default_values file, see “Updating theNOI_DefaultValues properties file to suppress and unsuppress events” on page195.
About this task
The events that are selected in the Event Selection pane are the events to which theaction is applied when the event occurs in a specific time window. For moreinformation about selecting events, see “Applying rule actions to an event andtime condition” on page 185.
You can suppress events that do not require you to take any direct action, andunsuppress the events after a specified time period.
You can set a column value on an event occurrence and again set it again after aspecified time period.
Procedure
To specify the actions to apply when an event occurs, complete the following stepsin the Actions When Event(s) Occurs in Specified Time Window(s) pane.1. To suppress an event so that no action is taken when it occurs, complete the
following steps.a. Select the Suppress event(s) check box.b. (Optional) To select a column value, see step 3 below.
2. To unsuppress an event after an action occurs, complete the following steps.a. To select the time after the action occurs to unsuppress the event, select a
number from the Perform Action(s) After list, or type an entry in the field.Select Seconds, Minutes, or Hours from the Perform Action(s) Afterdrop-down list.
b. Select the Unsuppress event(s) check box.c. (Optional) To select a column value, see step 4 below.
3. To set the column value after an action occurs, complete the following steps.a. Select the Set Column Values check box and click the Set Column Value
button for Perform Action(s) on Event Occurrence.b. In the Set Column Value page, input values for the ObjectServer columns.c. To save the column values, click Ok.
4. To reset the column value after a specified time period, complete the followingsteps.a. To specify a time period, select a number from the Perform Action(s) After
list, or type an entry in the field. Select Seconds, Minutes, or Hours fromthe Perform Action(s) After drop-down list.
Event Analytics 187

b. Select the Set Column Values check box and click the Set Column Valuebutton for Perform Action(s) After.
c. In the Set Column Value page, input values for the ObjectServer columns.d. To save the column values, click Ok.
5. To save the seasonal event rule, choose one of the following options.a. Select Watch to monitor the rule's performance before it is deployed.b. Select Deploy to activate the rule.
Results
The action to be applied to a rule that occurs in a specific time window is saved.
Applying actions when an event does not occurYou can apply specific actions to occur when an event does not occur in a specifictime window.
Before you begin
Create or modify an existing seasonal event rule. To create a seasonal event rule,see “Creating a seasonal event rule” on page 185. To modify an existing seasonalevent rule, see “Modifying an existing seasonal event rule” on page 191.
About this task
The events that are selected in the Event Selection pane are the events to which theaction is applied if the event does not occur in a specific time window. For moreinformation about selecting events, see “Applying rule actions to an event andtime condition” on page 185.
Procedure
To specify the actions to apply when an event does not occur, complete thefollowing steps in the Actions When Event(s) Does Not Occur in Specified TimeWindow(s) pane.1. To select the time after which the event does not occur to apply the action,
complete the following steps.a. Select a number from the Perform Action(s) After list, or type an entry in
the field.b. Select Seconds, Minutes, or Hours from the Perform Action(s) After
drop-down list.2. To create a synthetic event on a non-occurrence, select the Create event check
box and click Create event.3. To define the event, complete the fields in the new Create Event window.4. To save the synthetic event, click Ok.5. To save the seasonal event rule, choose one of the following options.
a. Select Watch to monitor the rule's performance before it is deployed.b. Select Deploy to activate the rule.
Results
The action to be applied to a rule that does not occur in a specific time window issaved.
188 IBM Netcool Operations Insight: Integration Guide
Seasonal event rule statesSeasonal event rules are grouped by state in the Seasonal Event Rules portlet.
Seasonal event rule states
Seasonal event rules are grouped in the following states.
WatchedA watched seasonal event rule is not active.
You can watch a seasonal event rule to monitor how the rule performsbefore you decide whether to deploy it.
Watched seasonal event rules take no actions on events. It is used to collectstatistics for rule matches for incoming events.
Active A deployed seasonal event rule is active. Active seasonal event rules takedefined actions on live events.
ExpiredAn expired seasonal event rule remains active. If triggered, the seasonalevent rule takes defined actions on live events. The default expiry time is 6MONTHS. To ensure that seasonal event rules are valid, regularly review thestate and performance of the rules. You can customize the expiry time of aseasonal event rule. For more information, see “Modifying the defaultseasonal event rule expiry time.”
ArchivedAn archived seasonal event rule is not active. You can choose to archive awatched, active, or expired seasonal event rule. To delete a seasonal eventrule, it must first be archived.
For more information about changing the state of a seasonal event rule, see“Modifying a seasonal event rule state” on page 192.
Modifying the default seasonal event rule expiry timeYou can change the default seasonal event rules expiry time to a specific time orchoose no expiry time to ensure that a seasonal event rule does not expire.
About this task
To ensure that seasonal event rules are valid, you should regularly review andupdate the state of the rules.
Procedure
To modify or remove the default seasonal event rules expiry time, complete thefollowing steps.1. To generate a properties file from the command line interface, use the following
command:./nci_trigger SERVER <UserID>/<Password> NOI_DefaultValues_Export FILENAMEdirectory/filename
Where
SERVERThe server where Event Analytics is installed.
Event Analytics 189

<UserID>The user name of the Event Analytics user.
<Password>The password of the Event Analytics user.
directoryThe directory where the file is stored.
filenameThe name of the properties file.
For example:./nci_trigger NCI impactadmin/impact NOI_DefaultValues_Export FILENAME/space/noi_default_values
2. To modify the default seasonal event rules expiry time, edit the default valuesof the following parameters.
seasonality.rules.expiration.time.value=6The number of days, hours, or months after which the seasonal eventrule expires. The default value is 6.
seasonality.rules.expiration.time.unit=MONTHThe seasonal event rules expiry time frequency. The default frequencyis MONTH. The following time units are supported:v HOURv DAYv MONTH
3. To import the modified properties file into IBM Tivoli Netcool/Impact, use thefollowing command:./nci_trigger SERVER <UserID>/<Password> NOI_DefaultValues_Configure FILENAMEdirectory/filename
For example:./nci_trigger NCI impactadmin/impact NOI_DefaultValues_Configure FILENAME/space/noi_default_values
Results
The default seasonal event rules expiry time is modified.
Viewing performance statistics for seasonal event rulesYou can view performance statistics for seasonal event rules in the Seasonal EventRules portlet, within the Watched, Active, or Expired tabs of the group table.
Columns in the group table
The group table in the View Seasonal Events portlet displays the seasonal eventrules that you have created. The left-side of the group table has these columns:
Configuration: Displays the list of configuration names for which a seasonalevent rule has been created.Rule Count: Displays the number of seasonal event rules created for eachparticular configuration. This number also indicates the total number ofseasonal event rules created for all configurations under the All item.Rule Name: Displays the name of the seasonal event rule.
190 IBM Netcool Operations Insight: Integration Guide

Last Run: Displays the date and time when the seasonal event rule was lastexecuted. If the column is blank, the seasonal event rule has not been executed.Deployed: Displays the date and time when the seasonal event rule wasdeployed. The term deployed means that the seasonal event rule is available foruse, is actively accumulating rule statistics, and any actions applied to the rulesare being performed.
Note: For the Last Run and Deployed columns, the date is expressed as month,day, year. Likewise, the time is expressed as hours:, minutes:, seconds. The time alsoindicates whether AM or PM. For example: Apr 13, 2015 4:45:17 PM.
Performance statistics in the group table
The performance statistics are displayed in the following columns of the grouptable in the Watched, Active, or Expired tabs in the Seasonal Event Rules portlet.
Suppressed Events: Displays the total number of events that the seasonal eventrule suppressed since the rule was deployed.Unsuppressed Events: Displays the total number of events that the seasonalevent rule unsuppressed since the rule was deployed.Enriched/Modified Events: Displays the total number of events that theseasonal event rule enriched or modified since the rule was deployed.Generated Events on Non-occurrence: Displays the total number of events thatthe seasonal event rule generated since the rule was deployed for events thatdo not meet the event selection criteria (that is, for those matching events thatfall outside of the event selections condition for the rule).
Reset performance statistics
You can reset performance statistics to zero for a group in the Watched, Active, orExpired tabs. To reset performance statistics, right-click on the seasonal event rulename (from the Rule Name column) and from the menu select Reset performancestatistics. A message displays indicating that the operation will reset statistics datafor the selected seasonal event rule. The message also indicates that you will not beable to retrieve this data. Click OK to continue with the operation or Cancel to stopthe operation. A success message displays after you select OK.
Resetting performance statistics to zero for a seasonal event rule also causes thefollowing columns to be cleared: Last Run and Deployed. Note that performancestatistics are not collected for the Archived tab. When a rule is moved betweenstates, the performance statistics are reset. Every time an action is triggered by therule the performance statistics increase.
Modifying an existing seasonal event ruleYou can modify an existing seasonal event rule to update or change the eventselection criteria or actions.
Before you begin
To access the Seasonal Event Rules portlet, users must be assigned thencw_analytics_admin role.
Procedure1. Open the Seasonal Event Rules portlet.
Event Analytics 191

The Seasonal Event Rules portlet lists the seasonal event rules configuration inthe table on the left side, and the seasonal event rules are listed in the table inthe right side.
2. Select the rule that you want to modify from the rule table.3. Right click and select Edit Rule.4. Modify the event selection criteria or actions in the Modify Existing Rule
window.5. To save the seasonal event rule, choose one of the following criteria.
a. Select Watch to monitor the rule's performance before it is deployed.b. Select Deploy to activate the rule.
Results
The seasonal event rule is modified. To view a list of current seasonal event rules,open the Seasonal Event Rules portlet.
Viewing seasonal event rules grouped by stateYou can view seasonal event rules grouped by state in the Seasonal Event Rulesportlet.
Before you begin
To access the Seasonal Event Rules portlet, users must be assigned thencw_analytics_admin role.
Procedure
To view seasonal event rules grouped by state, complete the following steps.1. Open the Seasonal Event Rules portlet.
The Seasonal Event Rules portlet lists the seasonal event rules configuration inthe table on the left side, and the seasonal event rules are listed in the table inthe right side.
2. Select the seasonal event rule state that you want to view from the status tabs.The seasonal event rules are stored in tabs that relate to their status. Forexample, to view a list of the active seasonal event rules configurations andrules, select the Active tab.
Results
The seasonal event rules configurations and rules for the chosen status are listed inthe Seasonal Event Rules portlet.
Modifying a seasonal event rule stateYou can change the state of a seasonal event rule to watched, active, or archivedfrom the Seasonal Event Rules portlet.
Before you begin
To access the Seasonal Event Rules portlet, users must be assigned thencw_analytics_admin role.
192 IBM Netcool Operations Insight: Integration Guide

About this task
The seasonal event rules are stored in tabs that relate to their state. The totalnumber of rules is displayed on the tabs. For example, when you Archive aWatched rule, the rule moves from the Watched tab to the Archived tab in theSeasonal Event Rules portlet and the rules total is updated.
Performance statistics about the rule are logged. You can use performance statisticsto verify that a deployed rule is being triggered and that a monitored rule iscollecting statistics for rule matches for incoming events. Performance statistics arereset when you change the state of a seasonal event rule.
Procedure
To change the state of a seasonal event rule in the Seasonal Event Rules portlet,complete the following steps.1. Open the Seasonal Event Rules portlet.
The Seasonal Event Rules portlet lists the seasonal event rules configuration inthe table on the left side, and the seasonal event rules are listed in the table inthe right side.
2. To change the state of seasonal event rule, complete one of the followingactions:a. To change the state of a watched seasonal event rule, select the Watched
tab. Select a rule from the rule table. To change the state of the ruleright-click the rule and select Deploy or Archive.
b. To change the state of an active seasonal event rule, select the Active tab.Select a rule from the rule table. To change the state of the rule right-clickthe rule and select Watch or Archive.
c. To change the state of an expired seasonal event rule, select the Expired tab.Select a rule from the rule table. To change the state of the rule right-clickthe rule and select Validate, Watch, or Archive.
d. To change the state of an archived seasonal event rule, select the Archivedtab. Select a rule from the rule table. To change the state of the ruleright-click the rule and select Watch or Deploy.
Results
The seasonal event rule state is changed from its current state to its new state. Therule totals are updated to reflect the new seasonal event rule state.
Applying rule actions to a list of eventsYou can apply defined actions to a list of events while you create a seasonal eventrule.
Before you begin
To access the View Seasonal Events portlet, users must be assigned thencw_analytics_admin role.
About this task
One of the events in the list on the Related Event Selection window is the seasonalevent from which you launched the Create Rule dialog box. When the rule youcreated is fired, the rule is fired on the seasonal event and the related events that
Event Analytics 193

you selected. Because the rule is fired on the seasonal event, it is not possible foryou to deselect this seasonal event from the list of related events displayed in theRelated Event Selection window.
Procedure
To select a list of events to which the defined action applies, complete thefollowing steps.1. Open the View Seasonal Events portlet.2. Select a specific configuration or ALL in the configuration table.3. Select a seasonal event from the events table.4. Right-click the seasonal event and select Create Rule.5. To choose all related events:
a. In the Event Selection pane of the Create Rule page, click the Select allrelated events checkbox.
6. Or, to choose one or more related events:a. In the Event Selection pane of the Create Rule page, click the Edit
Selection... control button. The Related Event Selection window displays.Note that the seasonal event from which you launched the Create Ruledialog box has a check mark that you cannot deselect.
b. Select one or more related events from the list displayed in the RelatedEvent Selection window.
c. Click OK.7. To save your changes, choose one of the following options:
a. Select Watch to monitor the rule's performance before it is deployed.b. Select Deploy to activate the rule.
Results
The updated seasonal event rule is saved and the defined actions are applied tothe selected related events.
Setting the column value for an eventYou can set the column value for an event when you set the actions for a rule.
Before you begin
To access the View Seasonal Events portlet, users must be assigned thencw_analytics_admin role.
Procedure
To set the column value, complete the following steps.1. Open the View Seasonal Events portlet.2. Select a specific configuration or ALL in the configuration table.3. Select a seasonal event from the events table.4. Right-click the seasonal event and select Create Rule.5. In the Actions When Event(s) Occurs in Specific Time Window(s) pane, select
from the following options.
194 IBM Netcool Operations Insight: Integration Guide

a. To set the column value to suppress an event, select the Set Column Valuescheck box and click the Set Column Value button for Perform Action(s) onEvent Occurrence.
b. To set the column value to unsuppress an event, select the Set ColumnValues check box and click the Set Column Value button for PerformAction(s) After.
6. In the Set Column Value page, input values for the ObjectServer columns.a. You can add or remove columns by using the plus and minus buttons.
7. To save the column values, click Ok.8. To save the seasonal event rule, choose one of the following options.
a. Select Watch to monitor the rule's performance before it is deployed.b. Select Deploy to activate the rule.
Results
The seasonal event rule that modifies the column values is saved.
Updating the NOI_DefaultValues properties file to suppressand unsuppress events
You must add details about suppressing and unsuppressing events to theNOI_DefaultValues properties file to suppress and unsuppress events.
1.4.1.2
Before you begin
In Netcool/Impact v7.1.0.13 it is recommended to use the Event Analyticsconfiguration wizard instead of the ./nci_trigger command to edit properties inthe NOI Shared Configuration properties file. For more information, see “EventAnalytics Configuration” on page 160.
About this task
To add details about suppressing and unsuppressing events, you must modify theNOI_DefaultValues properties file in the <Impact_install_location>/bin directory.
Procedure1. Log in to the server where IBM Tivoli Netcool/Impact is stored and running.2. Go to the <Impact install location>/bin directory.3. Enter the following command: ./nci_trigger <server_name>
<UserID>/<password> NOI_DefaultValues_Export FILENAME <Full Path to thefile name><name_of_propsfile>
<server_name>Specifies the name of the server where Netcool/Impact is stored andrunning.
<UserID>Specifies the ID of the Netcool/Impact user.
<password>Specifies the password of the Netcool/Impact user.
Event Analytics 195

<Full Path to the file name><name_of_propsfile>Specifies the directory where the NOI_DefaultValues properties file resides.The directory specification includes the name of the NOI_DefaultValuesproperties file.
For example:./nci_trigger NCI impactadmin/impactpass NOI_DefaultValues_Configure/tmp/bin/noi_def_values.props
4. Add the following lines of text to the NOI_DefaultValues properties file:seasonality.suppressevent.column.name=SuppressEsclseasonality.suppressevent.column.type=NUMERICseasonality.suppressevent.column.value=4seasonality.unsuppressevent.column.name=SuppressEsclseasonality.unsuppressevent.column.type=NUMERICseasonality.unsuppressevent.column.value=0
5. To update the NOI_DefaultValues properties file, run the following command:./nci_trigger <server_name> <UserID>/<password> NOI_DefaultValues_ConfigureFILENAME <Full Path to the file name><name_of_propsfile>
For example:./nci_trigger NCI impactadmin/impactpass NOI_DefaultValues_ConfigureFILENAME /tmp/bin/noi_def_values.props
Seasonal Event GraphsThe seasonal event graphs display bar charts and confidence level event thresholdsfor seasonal events.
The Seasonal Event Graphs portlet consists of four charts:
Minute of the hourThe minute or minutes of the hour that the event occurs.
Hour of the dayThe hour or hours of the day that the event occurs.
Day of the weekThe day or days of the week that the event occurs.
Day of the monthThe date or dates of the month that the event occurs.
The confidence level of the data in the charts is displayed in three ways:1. The overall distribution score of each chart is displayed as high (red), medium
(orange), or low (green) seasonality at the top of each chart.2. The degree of deviation of the events is indicated by the high (red) and
medium (orange) seasonality threshold lines on the charts.3. The maximum confidence level of each bar is displayed as high (red), medium
(orange), or low (green).
The default confidence level thresholds are as follows:v High: 99-100%v Medium: 95-99%v Low: 0-95%
To modify the default confidence level thresholds of the charts, see “Editingconfidence thresholds of Seasonal Event Graphs” on page 199.
196 IBM Netcool Operations Insight: Integration Guide

Understanding graphs
The four seasonal event graphs illustrate event seasonality. The graphs depictindependent observations. For example, if the Hour of the day graph indicates ahigh confidence level for 5 p.m., and the Minute of the hour graph indicates ahigh confidence level for minute 35, it does not necessarily mean that the events alloccur at 5:35 p.m. The 5 p.m. value can contain other minute values.
Note: In some instances, Minute of the hour is indicated as having a highconfidence level but the overall confidence level of seasonality is low. This is dueto the high-level statistic that does not include minute of the hour due to poll cycleof monitors.
Note: In some instances, the overall confidence level of a chart is indicated as highalthough none of the bars in the graph are in the red zone. An example of this is asystem failure due to high load and peak times, with no failure outside of thesetimes.
The seasonal event graphs Count refers to the number of observations that arerecorded in each graph. There is a maximum of one observation for each minute,hour, day, and date range. Therefore, the count for each of the graphs can differ.For example, if an event occurs at the following times:
10:31 a.m., 1 June 201310:31 a.m., 2 June 201310:35 a.m., 2 June 2013
There is a count of two observations for 10 a.m., two observations for minute 31,and one observation for minute 35.
Viewing seasonal event graphs for a seasonal eventYou can view seasonal event graphs for the seasonal events that are displayed inthe View Seasonal Events portlet.
Before you begin
To access the View Seasonal Events portlet, users must be assigned thencw_analytics_admin role.
Procedure
To view seasonal event graphs for a seasonal event, complete the following steps.1. Open the View Seasonal Events portlet.2. Select a specific configuration or ALL in the configuration table.3. Select a seasonal event from the events table.4. Right-click the seasonal event and select Show Seasonal Event Graphs.
Results
The Seasonal Event Graphs portlet displays the bar charts and confidence levels forthe selected seasonal event. For more information about charts and thresholdlevels, see the “Seasonal Event Graphs” on page 196 topic.
Event Analytics 197

Viewing historical events from seasonality graphsYou can view a list of historical events from seasonality graphs.
Before you begin
To access the View Seasonal Events portlet, users must be assigned thencw_analytics_admin role.
Procedure
To view a list of historical events from seasonality graphs, complete the followingsteps.1. Open the View Seasonal Events portlet.2. Select a specific configuration or ALL in the configuration table.3. Select a seasonal event from the events table.4. Right-click the seasonal event and select Show Seasonal Event Graphs.5. In the Seasonal Event Graphs tab, you can choose to view all of the historical
events for a seasonal event, or filter the historical events by selecting bars in agraph.a. To view all of the historical events for a seasonal event, select Show
Historical Events in the Actions drop-down list.b. To view the historical events for specific times, hold down the Ctrl key and
click the specific bars in the graphs. Select Show Historical Events forSelected Bars in the Actions drop-down list.Multiple bars that are selected from one chart are filtered by the ORcondition. For example, if you select the bars for 9am or 5pm in the Hour ofthe Day graph, all of the events that occurred between 9am and 10am and allevents that occurred between 5pm and 6pm are displayed in the HistoricalEvent portlet.Multiple bar that are selected from more than one graph are filtered by theAND condition. For example, if you select the bar for 9am in the Hour of theDay graph and Monday in the Day of the Week graph, all of the events thatoccurred between 9am and 10am on Mondays are displayed in the HistoricalEvent portlet.
Results
The historical events are listed in the Historical Event portlet.
Exporting seasonal event graphs for a specified seasonalevent to Microsoft Excel
You can export seasonal event graphs for a specified seasonal event to a MicrosoftExcel spreadsheet from a supported browser.
Before you begin
You view seasonal event graphs for the seasonal events that are displayed in theView Seasonal Events portlet. To access the View Seasonal Events portlet, usersmust be assigned the ncw_analytics_admin role.
198 IBM Netcool Operations Insight: Integration Guide

About this task
In addition to exporting seasonal event graphs to a Microsoft Excel spreadsheet,you also export the historical event data and seasonal event data and confidencelevels for the seasonal event that you selected. Currently, there is no way to exportonly the seasonal event graphs.
Procedure
To export seasonal event graphs for a specified seasonal event to a Microsoft Excelspreadsheet, complete the following steps.1. Open the View Seasonal Events portlet.2. Select a specific configuration from the configuration table.3. Select a seasonal event from the events table.4. Right-click the seasonal event and select Show Seasonal Event Graphs.5. From the Actions menu, select Export Seasonal Event Graphs. After a short
time, the Download export results link displays.6. Click the link to download and save the Microsoft Excel file.
Results
The Microsoft Excel file contains a spreadsheet with the following tabs:v Seasonal Data: This tab contains the seasonal event data and confidence levels
for the seasonal event that you selected.v Seasonality Charts: This tab contains the seasonal event graphs for the seasonal
event that you selected.v Historical Events: This tab contains the historical event data for the seasonal
event that you selected.v Export Comments: This tab contains any comments relating to the export for
informational purposes (for example, if the spreadsheet headers are truncated, orif the spreadsheet rows are truncated).
For more information about charts and threshold levels, see the “Seasonal EventGraphs” on page 196 topic.
Editing confidence thresholds of Seasonal Event GraphsYou can edit the default confidence level thresholds of the Seasonal Event Graphs.
About this task
The confidence level of the data in the charts is displayed in two ways:1. The overall distribution score of each chart is displayed as high (red), medium
(orange), or low (green) seasonality at the top of each chart.2. The degree of deviation of the events is indicated by the high (red) and
medium (orange) seasonality threshold lines on the charts.3. The maximum confidence level of each bar is displayed as high (red), medium
(orange), or low (green).
The default confidence level thresholds are as follows:v High: 99-100%v Medium: 95-99%
Event Analytics 199

v Low: 0-95%
To modify the default confidence level thresholds of the charts, see “Editingconfidence thresholds of Seasonal Event Graphs” on page 199.
Procedure
To edit the default confidence level threshold, complete the following steps:1. To generate a properties file from the command-line interface, use the following
command:nci_trigger server <UserID>/<password> NOI_DefaultValues_ExportFILENAME directory/filename
where
SERVERThe server where Event Analytics is installed.
<UserID>The user name of the Event Analytics user.
<password>The password of the Event Analytics user.
directoryThe directory where the file is stored.
filenameThe name of the properties file.
For example:./nci_trigger NCI impactadmin/impactpass NOI_DefaultValues_ExportFILENAME/tmp/seasonality.props
2. To modify the confidence level thresholds, edit the default values of thefollowing parameters:v level_threshold_high = 99
v level_threshold_medium = 95
v level_threshold_low = 0
Note: Other property values are overwritten by the generated properties file.You might need to update other property values. For a full list of properties,see “Generated properties file” on page 166.
3. To import the modified properties file into Netcool/Impact, use the followingcommand:nci_trigger SERVER <UserID>/<password> NOI_DefaultValues_ConfigureFILENAME
directory/filename
For example:./nci_trigger NCI impactadmin/impactpass NOI_DefaultValues_ConfigureFILENAME/tmp/seasonality.props
200 IBM Netcool Operations Insight: Integration Guide

Historical eventsYou can view a list of historical events for one or more seasonal events in the tablethat displays in the Historical Event portlet. You can also export the dataassociated with the list of historical events for the associated seasonal events to aspreadsheet.
The Historical Event portlet displays a table with the following default columns:
SummaryDisplays the description of the historical event.
Node Displays the managed entity from which the historical event originated.The managed entity could be a device or host name, service name, or otherentity.
SeverityDisplays the severity of the historical event. The following list identifiesthe possible values that can display in the Severity column:v 0: Clearv 1: Indeterminatev 2: Warningv 3: Minorv 4: Majorv 5: Critical
FirstOccurrenceDisplays the date and time in which the historical event was created orfirst occurred. The date is expressed as month, day, year. The time isexpressed as hours:, minutes:, seconds. The time also indicates whether AMor PM. For example: Apr 13, 2015 4:45:17 PM.
LastOccurrenceDisplays the date and time in which the historical event was last updated.The date is expressed as month, day, year. The time is expressed as hours:,minutes:, seconds. The time also indicates whether AM or PM. For example:Jun 2, 2015 5:54:49 PM.
AcknowledgedIndicates whether the historical event has been acknowledged:v 0: Nov 1: Yes
The historical event can be acknowledged manually or automatically bysetting up a correlation rule.
Tally Displays an automatically maintained count of the number of historicalevents associated with a seasonal event.
Event Analytics 201

Viewing historical events for a seasonal eventYou can view a list of historical events for a seasonal event in the table thatdisplays in the Historical Event portlet.
Before you begin
You view seasonal events for which you want a list of historical events in the ViewSeasonal Events portlet. To access the View Seasonal Events portlet, users must beassigned the ncw_analytics_admin role.
Procedure
To view a list of historical events for a seasonal event, complete the followingsteps.1. Open the View Seasonal Events portlet.2. Select a specific configuration or ALL from the configuration table.3. Select a seasonal event from the events table.4. Right-click the seasonal event and select Show Historical Events.
Results
The historical events are listed in the table that displays in the Historical Eventportlet.
Exporting historical event dataYou can export historical event data to a spreadsheet from Firefox or InternetExplorer.
Before you begin
You first view seasonal events for which you want a list of historical events in theView Seasonal Events portlet. To access the View Seasonal Events portlet, usersmust be assigned the ncw_analytics_admin role.
Procedure
To export historical event data, complete the following steps.1. Open the View Seasonal Events portlet.2. Select a specific configuration or ALL from the configuration table.3. Select a seasonal event from the events table.4. Right-click the seasonal event and select Show Historical Events. The historical
events are listed in the table that displays in the Historical Event portlet.5. Select one or more historical events from the table that displays in the
Historical Event portlet.6. To copy the selected historical events:
a. In Firefox, to copy the data from the displayed clipboard click Ctrl+Cfollowed by Enter.
b. In Internet Explorer, to copy the data from the displayed clipboardright-click on the selected historical event and select Copy Ctrl+C from thedrop down menu.
7. Paste the historical event data to your spreadsheet.
202 IBM Netcool Operations Insight: Integration Guide

Exporting historical event data for a specified seasonal eventto Microsoft Excel
You can export historical event data for a specified seasonal event to a MicrosoftExcel spreadsheet from a supported browser.
Before you begin
You first view seasonal events for which you want a list of historical events in theView Seasonal Events portlet. To access the View Seasonal Events portlet, usersmust be assigned the ncw_analytics_admin role.
About this task
In addition to exporting historical event data to a Microsoft Excel spreadsheet, youalso export the seasonal event charts and seasonal event data and confidence levelsfor the seasonal event that you selected. Currently, there is no way to export onlythe historical event data.
Procedure
To export historical event data to a Microsoft Excel spreadsheet, complete thefollowing steps.1. Open the View Seasonal Events portlet.2. Select a specific configuration from the configuration table.3. Select a seasonal event from the events table.4. Right-click the seasonal event and select Show Seasonal Event Graphs.5. From the Actions menu, select Export Seasonal Event Graphs. After a short
time, the Download export results link displays.6. Click the link to download and save the Microsoft Excel file.
Results
The Microsoft Excel file contains a spreadsheet with the following tabs:v Seasonal Data: This tab contains the seasonal event data and confidence levels
for the seasonal event that you selected.v Seasonality Charts: This tab contains the seasonal event graphs for the seasonal
event that you selected.v Historical Events: This tab contains the historical event data for the seasonal
event that you selected.v Export Comments: This tab contains any comments relating to the export for
informational purposes (for example, if the spreadsheet headers are truncated, orif the spreadsheet rows are truncated).
Event Analytics 203

Related eventsUse the related events function to identify and show events that are historicallyrelated and to deploy chosen correlation rules, which are derived from relatedevents configurations. You can create a pattern based on a related events group.The pattern applies the events in the group, which are specific to a resource, to anyresource.
The related events function is accessible through three portlets.v The Configure Analytics portlet. Use this portlet to create, modify, run, and
delete related events configurations.v The View Related Events portlet. Use this portlet to review the events and event
groups that are derived from a related events configuration and to deploycorrelation rules.
v The Related Event Details portlet. Use this portlet to access more detail about anevent or an event group.
To access the View Related Events portlet, users must be assigned thencw_analytics_admin role.
The related events function uses an algorithm with the event database columnsyou select to determine relationships between events.
Related events find signatures and patterns that occur together in the historic eventstream. This discovery allows subject matter experts to easily review the detectedsignatures and derive correlation rules from related events configurations, withouthaving to write correlation triggers or policies.
This diagram shows the relationship between the components for the relatedevents functions.
204 IBM Netcool Operations Insight: Integration Guide

Work with related eventsUse the View Related Events portlet to work with related events and related eventgroups that are derived from your related events configuration.
To access the View Related Events portlet, users must be assigned thencw_analytics_admin role.
In the Configuration, Group, or Event tables you can right-click on a group, aconfiguration, or the All container and a menu is displayed. The menu lists someof the following actions for you to select.
Watch For more information about this action, see “Watching a correlation rule”on page 220.Deploy For more information about this action, see “Deploying a correlationrule” on page 221.Archive For more information about this action, see “Archiving related events”on page 216.Delete This action is only available from within the Archived tab. If you wantto delete event groups from the system, choose this action.
Web GUI (forEvent Viewer)
Related Events GUI
352
Visualization Layer
Netcool/OMNIbus continually archives real-time events to an archived events database.
41
Archived events DB Netcool/Impact Real time ObjectServer
Database Layer
1
2
3
3
4
35
3
The Operator is presented with a reduced number of events in the Event Viewer.
olicies take action on real time events and group child events under a syntheticNetcool/Impact p
parent event.
Netcool/Impact policies are automatically created from the deployed correlation rules.
The Administrator creates a related events configuration. The configuration identifies and groups
related events from the archive database and derives correlation rules. The Administrator watches anddeploys the rules or configures the configuration to automatically deploy the rules.
Figure 10. Related events architecture overview
Event Analytics 205

Reset performance statistics For more information about this action, see“Viewing performance statistics for a correlation rule” on page 222.New This action is only available from within the Archived tab. If you choosethis action, your selected row reinstates into the New tab.Copy Choose this action if you want to copy a row, which you can then pasteinto another document.
Within the View Related Events portlet, in the New, Watched, Active, Expired, orArchived tabs, four tables display information about your related events.
Configuration tableDisplays a list of the related event configurations.
Group Sources tableDisplays the source information for related event groups based on theconfiguration and created patterns.
Groups tableDisplays the related event groups for a selected configuration.
Events tableDisplays the related events for a selected configuration or a selected group.
1.4.1.1
A performance improvement implemented in V1.4.1.2 ensures that the
View Related Events portlet displays Events, Groups, and Groups Sources morequickly once an item is selected. As part of this update, each tab in the ViewRelated Events portlet now lists all configurations in the panel on the left of theportlet following the successful run of a configuration. Configurations aredisplayed in the panel even if there are no events or groups in a particular statefor a given configuration. If no data exists for a particular state, the panels willdisplay a No items to display message. The configuration will be listed in all fivetabs, New, Watched, Active, Expired, and Archived.
Right-click on a configuration in the Configuration table to display a list of menuitems. You can select the following actions from the menu list.
Watch For more information about this action, see “Watching a correlation rule”on page 220.Deploy For more information about this action, see “Deploying a correlationrule” on page 221.Archive For more information about this action, see “Archiving related events”on page 216.Copy Choose this action if you want to copy a row, which you can then pasteinto another document.
Right-click on a pattern in the Group Sources table to display a list of menu items.You can select the following actions from the menu list.
Edit Pattern For more information about this action, see “Editing an existingpattern” on page 230.Delete Pattern For more information about this action, see “Deleting an existingpattern” on page 231.Copy Choose this action if you want to copy a row, which you can then pasteinto another document.
Right-click on a group name in the Groups table to display a list of menu items.You can select the following actions from the menu list.
206 IBM Netcool Operations Insight: Integration Guide
Show details For more information about this action, see “Viewing relatedevents details for a seasonal event” on page 208.Create Pattern For more information about this action, see “Creating patterns”on page 223.Unmark as reviewed For more information about this action, see “Marking arelated events group as reviewed” on page 209.Mark as reviewed For more information about this action, see “Marking arelated events group as reviewed” on page 209.Watch For more information about this action, see “Watching a correlation rule”on page 220.Deploy For more information about this action, see “Deploying a correlationrule” on page 221.Archive For more information about this action, see “Archiving related events”on page 216.Delete This action is only available from within the Archived tab. If you wantto delete event groups from the system, choose this action.Reset performance statistics For more information about this action, see“Viewing performance statistics for a correlation rule” on page 222.New This action is only available from within the Archived tab. If you choosethis action, your selected row reinstates into the New tab.Copy Choose this action if you want to copy a row, which you can then pasteinto another document.
Right-click on an event in the Events table to display a list of menu items. You canselect the following actions from the menu list.
Show details For more information about this action, see “Viewing relatedevents details for a seasonal event” on page 208.Copy Choose this action if you want to copy a row, which you can then pasteinto another document.
Within the View Related Events portlet, you can also complete the following typesof tasks.v View related events.v View related events by group.v Sort a related events view.v View performance statistics for a deployed correlation rule.
Within the Related Event Details portlet, you can also complete the following typesof tasks.v Change the pivot event.v Work with correlation rules and related events.v View events that form a correlation rule.v Select a root cause event for a correlation rule
Event Analytics 207

Viewing related eventsIn the View Related Events portlet, you can view a listing of related events asdetermined by related events configurations that ran.
Procedure1. Log in to the Dashboard Application Services Hub as a user with the
ncw_analytics_admin role.2. In the Dashboard Application Services Hub navigation menu, go to the
Insights menu.3. Under View Analytics, select View Related Events.4. By default, within the View Related Events portlet the New tab opens, this tab
lists related events with a status of New.
What to do next
If you want to see related events with another status, select the relevant toolbarbutton within the View Related Events portlet toolbar.
Viewing related events details for a seasonal eventYou can view related event details for a seasonal event in the Related Event Detailsportlet.
Before you begin
To access the Seasonal Event Rules portlet, users must be assigned thencw_analytics_admin role.
Procedure
To view a list of historical events for a seasonal event, complete the followingsteps.1. Open the View Seasonal Events portlet.2. Select a specific configuration or ALL in the configuration table.3. Select a seasonal event in the events table.4. Right-click the seasonal event and select Show Related Event Details.
Results
The Related Event Details portlet displays the related event details.
Viewing related events by groupFrom the full list of related events, you can view only the related events that areassociated to a specific group.
About this task
A related events configuration can contain one or many related events groups. Arelated events group is determined by a related events configuration and a relatedevents group can be a child of one or more related events configurations.
Note:
v Discovered Groups and any “Suggested patterns” on page 230 are displayed inthe Group Sources table of the View Related Events portlet. Any groups that arecovered by a suggested pattern will not appear under the list of groups
208 IBM Netcool Operations Insight: Integration Guide

associated with Discovered Groups. A group that is a member of a suggestedpatten will only show up under the events of Discovered Groups once thesuggested patten is deleted.
v You might see a different number of Unique Events in a related events groupwhen a Relationship Profile of Strong has been selected for the events in theconfiguration. This is caused by the same events being repeated more than once.
Procedure1. Start the View Related Events portlet, see “Viewing related events” on page
208.2. Within any tab, in the Configuration table, expand the root node All. The list of
related events configurations display.3. In the Configuration table, select a related events configuration. The list of
related events groups display in the Group Sources and Groups tables and therelated events display in the Events table.
4. In the Group table, select a group. The Event table updates and displays onlythe events that are associated to the selected group.
Viewing related events in the Event ViewerTo see the grouping of related events in the Event Viewer, you must apply a viewthat uses the IBM Related Events relationship.
Procedure1. Open the Event Viewer.2. Click Edit Views.3. Select the Relationships tab.4. Select IBM Related events from the drop-down menu.5. Click Save.
Results
This relationship is used to present the results of correlations generated by theRelated Events Analytics functionality.
Marking a related events group as reviewedThe review status for a related events group can be updated in the View RelatedEvents portlet.
About this task
In the View Related Events portlet, within the group table you can modify thereview status for a related events group. The review status values that aredisplayed indicates to Administrators whether related events groups are reviewedor not.
In the View Related Events portlet, in the Groups table you can modify the reviewstatus for a related events group. The review status values that are displayedindicates to Administrators the review status of the related events groups.
Related events groups can display these review status values.Yes. The group is reviewed.No. The group is not reviewed.
Event Analytics 209

To mark a related events group as reviewed or not reviewed, complete thefollowing steps.
Procedure1. View related events, see “Viewing related events” on page 208.2. In the View Related Events portlet, within the group table, select a line item,
which represents a group, and right-click. A menu is displayed.3. From the menu, select Mark as Reviewed or Unmark as Reviewed. A success
message in a green dialog box displays.
Results
The values in the Reviewed column are updated, to one of the following values Yes,No.
When you enable sorting for the group table, you can sort on the Yes or No values.
Sorting a related events viewWithin a related events view, it is possible to sort the information that is displayed.
Before you begin
Within the View Related Events portlet, select the tab view where you want toapply the sorting.
About this task
Sorting by single column or multiple columns is possible within either theConfiguration, Group or Event table. Sorting within the Group or Event table canbe done independently or in parallel by using the sorting arrows that display inthe table column headings. When you apply sorting within the Configuration tablethe configuration hierarchy disappears, but the configuration hierarchy reappearswhen you remove sorting. For more details about rollup information, see“Updating Rollup Configuration” on page 150.
Sorting by single column or multiple columns is possible within the Configuration,Group Sources, Groups or Event table. Sorting within the Groups or Event tablecan be done independently or in parallel by using the sorting arrows that displayin the table column headings. When you apply sorting within the Configurationtable the configuration hierarchy disappears, but the configuration hierarchyreappears when you remove sorting. For more details about rollup information, see“Updating Rollup Configuration” on page 150.
Procedure1. In either the Configuration, Group or Event table, hover the mouse over a
column heading. Arrows are displayed, hover the mouse over the arrow, one ofthe following sort options is displayed.
Click to sort Ascending
Click to sort Descending
Do not sort this column
2. In either the Configuration, Group Sources, Groups or Event table, hover themouse over a column heading. Arrows are displayed, hover the mouse over thearrow, one of the following sort options is displayed.
Click to sort Ascending
210 IBM Netcool Operations Insight: Integration Guide

Click to sort Descending
Do not sort this column
3. Left-click to select and apply your sort option, or left click a second or thirdtime to view and apply one of the other sort options.
4. For sorting by multiple column, apply a sort option to other column headings.Sorting by multiple columns is not limited, as sorting can be applied to allcolumns.
Results
The ordering of your applied sort options, is visible when you hover over columnheadings. The sorting options that you apply are not persistent across portletsessions when you close the portlet the applied sorting options are lost.
Filtering related eventsFiltering capability is possible on the list of related events within the View RelatedEvents portlet.
Procedure1. Start the View Related Events portlet, see “Viewing related events” on page 2082. Within the toolbar, in the filter text box, enter the filter text that you want to
use. Filtering commences as you type.
Results
The event list is reduced to list only the events that match the filter text in at leastone of the displayed columns.
What to do next
To clear the filter text, click the x in the filter text box. After you clear the filtertext, the event list displays all events.
Exporting related events for a specific configuration to MicrosoftExcelYou can export related events for a specific configuration to a Microsoft Excelspreadsheet from a supported browser.
Before you begin
You view related events for one or more configurations in the View RelatedEvents portlet. To access the View Related Events portlet, users must be assignedthe ncw_analytics_admin role.
Procedure
To export related events for a specific configuration to a Microsoft Excelspreadsheet, complete the following steps.1. Open the View Related Events portlet.2. Select a specific configuration from the configuration table.3. Click the Export Related Events button in the toolbar. After a short time, the
Download export results link displays.4. Click the link to download and save the Microsoft Excel file.
Event Analytics 211

Results
The Microsoft Excel file contains a spreadsheet with the following tabs:v Report Summary: This tab contains a summary report of the configuration that
you selected.v Groups Information: This tab contains the related events groups for the
configuration that you selected.v Groups Instances: This tab contains a list of all the related events instances for
all of the related events groups for the configuration that you selected.v Group Events: This tab contains a list of all the events that occurred in the
related events groups for the configuration that you selected.v Instance Events: This tab contains a list of all the events that occurred in all of
the related events instances for all the related events groups for theconfiguration that you selected.
v Export Comments: This tab contains any comments relating to the export forinformational purposes (for example, if the spreadsheet headers are truncated, orif the spreadsheet rows are truncated).
Exporting selected related events groups to Microsoft ExcelYou can export related events groups for a specific configuration to a MicrosoftExcel spreadsheet from a supported browser.
Before you begin
You view related events for one or more configurations in the View RelatedEvents portlet. To access the View Related Events portlet, users must be assignedthe ncw_analytics_admin role.
Procedure
To export related events groups for a specific configuration to a Microsoft Excelspreadsheet, complete the following steps.1. Open the View Related Events portlet.2. Select a specific configuration from the configuration table.3. Select multiple related event groups by using the Ctrl key and select method.
(You can also select multiple related events groups by using the click and dragmethod.)
4. After selecting multiple related event groups, right click on one of the selectedgroups and select the Export Selected Groups button in the toolbar. After ashort time, the Download export results link displays.
5. Click the link to download and save the Microsoft Excel file.
Results
The Microsoft Excel file contains a spreadsheet with the following tabs:v Report Summary: This tab contains a summary report of the configuration that
you selected.v Groups Information: This tab contains the related events groups for the
configuration that you selected.v Groups Instances: This tab contains a list of all the related events instances for
all of the related events groups for the configuration that you selected.
212 IBM Netcool Operations Insight: Integration Guide

v Group Events: This tab contains a list of all the events that occurred in therelated events groups for the configuration that you selected.
v Instance Events: This tab contains a list of all the events that occurred in all ofthe related events instances for all the related events groups for theconfiguration that you selected.
v Export Comments: This tab contains any comments relating to the export forinformational purposes (for example, if the spreadsheet headers are truncated, orif the spreadsheet rows are truncated).
Expired related eventsWhen the automated expiry time is reached for a related events group, the groupand related events are visible in the View Related Events portlet, within theExpired tab.
Even though the expired groups and related events are visible in the Expired tab,you must acknowledge that the group is expired. In the Expired tab, right-click onthe group that you want to acknowledge. A menu is displayed, from the menuselect Validate. The default automated expiry time for an active configuration is sixmonths. To change the expiry time see “Changing the expiry time for relatedevents groups” on page 178.
To perform other actions on related events within the Expired tab, right-click on agroup or event and a menu is displayed. From the menu, select the action that youwant to take.
Impacts of newly discovered groups on existing groupsAn existing related events group can be replaced by newly discovered relatedevent group, or the newly discovered group can be ignored.
The following bullet points describe the Event Analytics functions for managementof newly discovered groups and existing groups.v If a newly discovered group is a subset or same as an existing group within
Watched, Active, Expired, or Archived, then Event Analytics ignores the newlydiscovered group.
v If a newly discovered group is a superset of an existing group within New, thenEvent Analytics deletes the existing group and displays the newly discoveredgroup in New. Otherwise, no changes occur with the existing group.
v If a newly discovered group is a superset of an existing group within Watched,Active, or Expired, then Event Analytics moves the existing group to Archived,and displays the newly discovered group in Watched, Active, or Expired.
v If a newly discovered group is a superset of an existing group within Archived,then Event Analytics adds the newly discovered group in to New and leaves theArchived group where it is.
Event Analytics 213

Extra details about related eventsUse the Related Event Details portlet to access extra details about related events.
Within the Related Event Details portlet, you can complete the following types oftasks.v View the occurrence time of an event.v Switch between tabulated and charted event information.v Remove an event from a related events group.
Only one instance of the Related Event Details portlet can be open at any stage. Ifyou select Show Details for an event or an event group in the View RelatedEvents portlet and the Related Event Details portlet is already open, the detail inthe Related Event Details portlet refreshes to reflect your selected event or eventgroup.
Viewing the occurrence time of an eventYou can get details about the time that an event occurred.
About this task
When you look at the occurrence time of an event, you might be able to relate thisevent to some other events that occurred around the same time. Within a particularevent group, the same event might occur multiple times. For example, if the groupoccurs 10 times within the time period over which the related events report is run,then there are 10 instances of the group. The event might occur in each of thosegroup instances, resulting in 10 occurrence times for that event. Events in strongrelated events groups appear in all group instances, but events in medium or weakrelated events groups might appear in a subset of the group instances. Thisinformation is visible in the Related Event Details portlet by switching betweendifferent instances in the Event Group Instance Table as explained in the followingprocedure.
Procedure1. Start the View Related Events portlet, see “Viewing related events” on page
208.2. Within the View Related Events portlet, in the Events table select an event or in
the Group table select an event group, and right-click. A menu is displayed.3. From the menu, select Show Details and a Related Event Details portlet opens.4. Within the Related Event Details portlet, in the Events tab, two tables are
displayed.v Event Group Instance Table: This table lists each instance of the event group
and the time at which the instance occurred. The time of the group instanceis set to the occurrence time of the event that you selected.– The Unique Events column shows the number of unique events for each
group instance.v Events Table: This table lists the events for a selected group instance and the
occurrence time of each event.– The Offset column displays Not Applicable if the pivot event is not in
the selected group instance. However, if the pivot event is in the selectedgroup instance the Offset column displays an offset time that is related tothe pivot event. For more information about the pivot event, see“Changing the pivot event” on page 217.
214 IBM Netcool Operations Insight: Integration Guide
– The Instances column shows the number of group instances each eventparticipates in.
What to do next
Within the Event Group Instance Table, select another instance of the event group.The Events Table now displays the events in the newly selected group instance.
Switching between tabulated and charted event informationEvent information is visible in table or chart format, within the Related EventDetails portlet.
About this task
A pivot event is an event that acts as a pivot around which you can extrapolaterelated event occurrences, in relation to the pivot event occurrence. To view theevent distribution of a pivot event, complete the following steps to switch fromtabulated event information to charted event information within the Related EventDetails portlet.
Procedure1. Start the View Related Events portlet, see “Viewing current analytics
configurations” on page 172.2. Within the View Related Events portlet, in the Events table select an event or in
the Group table select an event group, and right-click. A menu is displayed.3. From the menu, select Show Details and a Related Event Details portlet opens.4. Within the Related Event Details portlet, in the Events tab, two tables are
displayed.Event Group Instance Table: This table lists each instance of the event groupand the time at which the instance occurred. The time of the group instanceis set to the occurrence time of the event that you selected.Events Table: This table lists the events for a selected group instance.
5. From the Events tab toolbar, select Timeline. The event information displays inchart format.For information about understanding the timeline chart, see “Understandingthe timeline chart” on page 247
Note: The timeline chart scale is displayed as seconds (s), minutes (m), orhours (h). If many timelines are displayed, users might need to scroll down toview all of the timelines. The timeline chart scale is anchored in place at the topof the Timeline view.
Results
The timeline chart shows the event distribution for each event type in the group,relative to the pivot event. Each comb in the timeline chart represents an eventtype and the teeth represent the number of instances of the event type. The pivotevent is not represented by a comb, but the pivot event instance is always at zeroseconds, minutes, or hours. For a selected event group instance, the highlightedtooth on each comb denotes the event type instance relative to the pivot event, inseconds, minutes, or hours.
Event Analytics 215

The long summary labels under the combs in the timeline chart are truncated.Move the mouse cursor over a truncated summary label to see the tooltip thatshows the full summary label.
What to do nextv If there are many event types to view, use the pagination function in addition to
scrolling. In the pagination toolbar, select the page to view and the page size.v If you want to change the pivot event, see “Changing the pivot event” on page
217.v If you want to revert to the tabulated event information, select Events from the
Events tab toolbar.
Removing an event from a related events groupYou can remove an event from a related events group.
About this task
When you believe that an event is no longer related to other events in the relatedevents group, you can remove the event from that events group. When youremove an event from a related events group, the event is hidden from the UI andthe correlation process but the event is not deleted from the system. Complete thefollowing steps to remove an event from a related events group.
Procedure1. View event groups and events in the View Related Events portlet, see “Viewing
related events” on page 208 and “Viewing related events by group” on page208.
2. Within the View Related Events portlet, in the Group table select an eventgroup or in the Event table select an event, and right click. A menu isdisplayed.
3. From the menu, select Show Details and a Related Event Details portlet opens.4. Within the Related Event Details portlet, in either the Events tab on the events
table or in the Correlation Rule tab, right-click on an event. A menu isdisplayed.
5. From the menu, select Remove Event.6. A confirmation message is displayed, select Yes or No.
Results
The event is removed from the group and no longer appears in the event list ineither the Events tab and the Correlation Rule tab.
Archiving related eventsYou can archive related events by archiving the related events group.
Before you begin
View event groups and events in the View Related Events portlet, see “Viewingrelated events” on page 208 and “Viewing related events by group” on page 208.
216 IBM Netcool Operations Insight: Integration Guide

About this task
When you believe that events within a related events group are no longer relevant,you can archive that group. Complete the following steps to archive a relatedevents group.
Procedurev To archive a related events group within the View Related Events portlet,
complete the following steps.1. Within the View Related Events portlet, select the New, Watched, Active, or
Expired tab.2. In your chosen tab, within the Group table select an event group and right
click. A menu is displayed.3. From the menu, select Archive.
v To archive a related events group within the Related Event Details portlet,complete the following steps.1. Within the View Related Events portlet, select the New, Watched, Active, or
Expired tab.2. In your chosen tab, within the Group table select an event group or within
the Event table select an event, and right click. A menu is displayed.3. From the menu, select Show Details, a Related Event Details portlet opens.4. Within the Related Event Details portlet, in either the Events or Correlation
Rule tab, select Archive. A success message is displayed.
Results
The related events group moves into the Archived tab in the View Related Eventsportlet.
What to do next
Within the Archived tab, from the list of archived groups you can select a groupand right click. A menu is displayed with a choice of tasks for your selected group.v If you want to move a group out of the Archived tab and into the New tab,
from the menu select New. A number of actions can be performed with groupsand events within the New tab, see “Work with related events” on page 205.
v If you want to delete a related events group from the system, from the menuselect Delete. This is the only way to delete a related events group from thesystem.
Changing the pivot eventYou can change a pivot event to view related events that are of interest.
About this task
Use a pivot event as a baseline to determine a sequence of events in the group. Apivot event displays in the Related Event Details portlet. Within the Related EventDetails portlet, a pivot event can be changed. Also, a pivot event history, of the 20most recent pivot events, is available for you to revisit.v When you open the Related Event Details portlet from an event in the View
Related Events portlet, that event becomes the pivot event within the RelatedEvent Details portlet.
Event Analytics 217

v When you open the Related Event Details portlet from a group in the ViewRelated Events portlet, one of the events from that group becomes the pivotevent within the Related Event Details portlet. The pivot event is not always theparent event.
Complete the following steps to change the pivot event.
Procedure1. Within the View Related Events portlet, right-click on an event or a group. A
menu is displayed.2. From the menu, select Show Details. The Related Event Details portlet opens.3. Within the Related Event Details portlet, information about the pivot event is
displayed.v In the Event Group Instance table, the Contains Pivot Event column reports
if a group instance has a pivot event, or not. Some groups might not have aPivot Event set because the event identity is different for these events.
v In the Events table, the pivot event is identifiable by a red border.v Next to the Group Name entry, a Pivot Event link displays. To see more details
about the pivot event, click the Pivot Event link and a More Informationwidow opens displaying details about the pivot event.
4. In the Related Event Details portlet, within the Events tab, in the Events table,right-click on the event you want to identify as the pivot event. A menu isdisplayed.
5. From the menu, select Set as Pivot Event.
Results
Your selected event becomes the pivot event with a red border. Data updates in thetimeline chart, in the Pivot Event link, in the Event Group Instance table and inthe Events table.
What to do next
Within the Related Event Details portlet, you can reselect one of your 20 recentpivot events as your current pivot event. From the Events tab toolbar, select eitherthe forward arrow or back arrow to select one of the 20 recent pivot events.
Correlation rules and related eventsA correlation rule is a mechanism that enables automatic action on real-time eventsthat are received by the ObjectServer, if a trigger condition is met. The result isfewer events in the Event Viewer for the operator to troubleshoot.
Writing a correlation rule in code is complex but the related events functionremoves the need for administrators to code a correlation rule. Instead, the relatedevents function derives a correlation rule from your related events configurationand deploys a correlation rule, all through the GUI. After the correlation rule isdeployed in a live environment and if the trigger condition is met, then automaticaction occurs.v The trigger condition is the occurrence of one or more related event types, from
an event group, on the Tivoli Netcool/OMNIbus ObjectServer. Only one eventmust be the parent event. Related event types are derived from your relatedevents configuration.
218 IBM Netcool Operations Insight: Integration Guide

v The automatic action is the automatic creation of a synthetic event with some ofthe properties of the parent event, and the automatic grouping of the eventgroup events under this synthetic event.
Viewing events that form a correlation ruleYou can view the related events that form a correlation rule in the Related EventDetails portlet.
About this task
Administrators can view related events that form a correlation rule to understandassociations between events. Complete the following steps to view related eventsthat form a correlation rule.
Procedure1. Start the View Related Events portlet, see “Viewing current analytics
configurations” on page 172.2. Within the View Related Events portlet, in the Events table select an event or in
the Group table select an event group, and right-click. A menu is displayed.3. From the menu, select Show Details and a Related Event Details portlet opens.4. In the Related Event Details portlet, select the Correlation Rule tab.
Results
A table displays with a list of the related events that make up the correlation rule.
Selecting a root cause event for a correlation ruleYou can select the root cause event for the correlation rule
About this task
When you select the root cause event for the correlation rule, the selected eventbecomes a parent event. A parent synthetic event is created with some of theproperties from the parent event and a parent-child relationship is created betweenthe parent synthetic event and the related events. When these events occur in alive environment, they display in the Event Viewer within a group as child eventsof the parent synthetic event. With this view of events, you can quickly focus onthe root cause of the event, rather than looking at other related events.
To select the root cause event for the correlation rule, complete the following steps.If you want to see automated suggestions about the root cause event for a group,see configuration details in “Updating Rollup Configuration” on page 150.
Procedure1. View all events that form a correlation rule, see “Viewing events that form a
correlation rule”2. In the Related Event Details portlet, within the Correlation Rule tab, right-click
an event and select Use Values in Parent Synthetic Event.
Results
The table in the Correlation Rule tab refreshes and the Use Values in ParentSynthetic Event column for the selected event updates to Yes, which indicates thisevent is now the parent event.
Event Analytics 219

For a related events group, if all of the children of a parent synthetic event arecleared in the Event Viewer, then the parent synthetic event is also cleared in theEvent Viewer. If another related event comes in for that same group, the parentsynthetic event either reopens or re-creates in the Event Viewer, depending on thestatus of the parent synthetic event.
Watching a correlation ruleYou can watch a correlation rule and monitor the rule performance before youdeploy the rule for the rule to correlate live data.
Before you begin
Complete your review of the related events and the parent event that form thecorrelation rule. If necessary, change the correlation rule or related eventsconfiguration.
About this task
When you are happy with the correlation rule, you can choose to Watch thecorrelation rule.
When you choose to Watch the correlation rule, the rule moves out of its existingtab and into the Watched tab within the View Related Events portlet. While therule is in Watched, the rule is not creating synthetic events or correlating but doesrecord performance statistics. You can check the rule's performance before youdeploy the rule for the rule to correlate live data.
Complete the following steps to Watch the correlation rule.
Procedurev Within the View Related Events portlet.
1. View related events by group, see “Viewing related events by group” onpage 208.
2. In the View Related Events portlet, within the group table, select either arelated events group or a related events configuration and right click. Amenu is displayed.
3. From the menu, select Watch.v Within the Related Event Details portlet for a group or an event.
1. View related events or related event groups, see “Viewing related events” onpage 208 and “Viewing related events by group” on page 208.
2. Select an event or a related events group.– In the View Related Events portlet, within the group table, select a related
events group and right click. A menu is displayed.– In the View Related Events portlet, within the event table, select an event
and right click. A menu is displayed.3. From the menu, select Show Details. The Related Event Details portlet
opens.4. In the Related Event Details portlet, within any tab, select Watch.
Results
The rule displays in the Watched tab.
220 IBM Netcool Operations Insight: Integration Guide

What to do next
Within the Watched tab, monitor the performance statistics for the rule. When youare happy with the performance statistics consider “Deploying a correlation rule.”
Deploying a correlation ruleYou can deploy a correlation rule, for the rule to correlate live data.
Before you begin
Complete your review of the related events and the parent event that form thecorrelation rule. If necessary, change the correlation rule or related eventsconfiguration.
About this task
When you are happy with the correlation rule, you can choose to Deploy thecorrelation rule.
When you choose to Deploy the correlation rule, the rule moves out of its existingtab and into the Active tab within the View Related Events portlet. Active rulealgorithm works to identify the related events in the live incoming events andcorrelates them so the operator knows what event to focus on. Performancestatistics about the rule are logged which you can use to verify whether thedeployed rule is being triggered.
Complete the following steps to Deploy the correlation rule.
Procedurev Within the View Related Events portlet.
1. View related events by group, see “Viewing related events by group” onpage 208.
2. In the View Related Events portlet, within the groups table, select either arelated events group or a related events configuration and right click. Amenu is displayed.
3. From the menu, select Deploy.v Within the Related Event Details portlet for a group or an event.
1. View related events or related event groups, see “Viewing related events” onpage 208 and “Viewing related events by group” on page 208.
2. Select an event or a related events group.– In the View Related Events portlet, within the groups table, select a
related events group and right click. A menu is displayed.– In the View Related Events portlet, within the events table, select an event
and right click. A menu is displayed.3. From the menu, select Show Details. The Related Event Details portlet
opens.4. In the Related Event Details portlet, within any tab, select Deploy.
Results
The rule moves out of the New tab and into the Active tab within the ViewRelated Events portlet.
Event Analytics 221

What to do next
When you establish confidence with the rules and groups that are generated by arelated events configuration, you might want all the generated groups to beautomatically deployed in the future. If you want all the generated groups to beautomatically deployed, return to “Creating a new or modifying an existinganalytics configuration” on page 174 and within the Configure Related Eventswindow, tick the option Automatically deploy rules discovered by thisconfiguration.
Viewing performance statistics for a correlation ruleYou can view performance statistics for a correlation rule in the View RelatedEvents portlet, within the Watched, Active, or Expired tabs.
Performance statistics in the group tableTimes Fired: The total number of times the rule ran since the rule becameactive.Times Fired in Last Month: The total number of times that the rule is fired inthe current month. Months are calculated from the creation date of the group.At the beginning of a new month, this value resets back to 0.Last Fired: The last date or time that the rule was fired.Last Occurrence I: The percentage of events that occurred from the group, inthe last fired rule.Last Occurrence II: The percentage of events that occurred from the group inthe second last fired rule.Last Occurrence III: The percentage of events that occurred from the group inthe third last fired rule.
Performance statistics in the event tableOccurrence: The number of times the event occurred, for all the times the rulefired.
Reset performance statistics
You can reset performance statistics to zero for a group in the Watched, Active, orExpired tabs. To reset performance statistics, right-click on the group name andfrom the menu select Reset performance statistics. A message displays indicatingthat the operation will reset statistics data for the selected correlation rule. Themessage also indicates that you will not be able to retrieve this data. Click Yes tocontinue with the operation or No to stop the operation. A success messagedisplays after you select Yes.
Resetting performance statistics to zero for a group also causes the followingcolumns to be cleared: Times Fired, Times Fired in Last Month, and Last Fired.Note that performance statistics are not collected for the Archived tab. When a ruleis moved between states, the performance statistics are reset. Every time an actionis triggered by the rule the performance statistics increase.
222 IBM Netcool Operations Insight: Integration Guide

Related Events statisticsWhen sending some events a synthetic event is created, but the statistics canappear not to be updated.
This is because there are delays in updating the related events statistics. Thesedelays are due to the time window during which the related event groups areopen, so that events can be correlated.
The statistics (Times Fired, Times Fired in last month, last fired) are updated onlywhen the Group Time to Live has expired. The sequence is; synthetic event istriggered, action is done, and the statistics are calculated later.
Take the following query as an example:SELECT GROUPTTL FROM RELATEDEVENTS.RE_GROUPS WHERE GROUPNAME = ’XXX’;
There was an occurrence of the GROUPTTL being equal to 82800000 milliseconds,this is 23 hours. In this instance an update to the statistics wouldn't be visible tothe user for 23 hours. If GROUPTTL is reduced to 10 seconds by running thefollowing command:UPDATE RELATEDEVENTS.RE_GROUPS SET GROUPTTL = 10000 WHERE GROUPNAME = ’XXX’;
Subsequent tests will show that the statistics are updated promptly.
An algorithm creates GROUPTTL based on historical occurrences of the events.There is no default value for GROUPTTL and no best practice recommendation.GROUPTTL should be determined and set on a per case basis.
Creating patternsGroups of related events are discovered using Related Event analytics.Automatically discovered groups in the View Related Events portlet can be used tocreate patterns.
While the discovered groups are specific to a particular resource, the event patternsare not specific to one single resource. A resource can be a host name (“servername”), and is usually a Node field in the ObjectServer events.
For example, assume that Link up and Link down regularly occurs on Node A.Analytics detects the occurrence in the historical data and generates a specificgrouping of those two events for Node A. Likewise, if Link up and Link down alsoregularly occurs on Node B, a grouping of those two events will be generated butspecifically for Node B.
With generalization, the association of such events is encapsulated by the systemas a pattern: Link up / Link down on any Node. In generalization terms, Link Up/ Link Down represents the event type and Node* represents the resource.
A created pattern has the following advantages over a related event group:v For any instance of a pattern, not all of the events in the definition have to occur
for the pattern to apply. This is dependent on the Trigger Action settings. Formore information about Trigger Action setting, see “Creating an event pattern”on page 225.
v The pattern definition encompasses groups of events with the defined eventtypes.
Event Analytics 223

v A single pattern can capture the occurrence of events on any resource. Forexample, with discovered groups, analytics only found historical events thatoccurred on a specific host name, and created groups for each host name. If realtime events happen on different host names in the future, the discovered groupswill not capture them. However, patterns will discover the events because theevent type is the same.
v A pattern can encompass event groupings that were not previously seen in theevent history. An event group that did not previously occur on a specificresource is identified by the pattern, as the pattern is not resource dependent,but event type specific. Note: when selecting an event type (during the eventtype configuration), the column that identifies the event type should be uniqueacross multiple event groups.
v A single pattern definition can encompass multiple event groups. Patterns willact on event types for different host names which might have occurredhistorically (discovered groups) or will happen in future real time events. Forexample, an event type could be “Server Shutting Down”, “Server Starting Up”,“Interface Ping Failure”, and so on. Each group is resource specific, but an eventpattern is event type specific. Therefore, an environment might have multiplegroups for different resources, and an event pattern will encompass all of thosedifferent groups since their event type is the same.
Starting the Events Pattern portletThe administrator can start the Events Pattern portlet from a number of locationson the Event Analytics UI.
Before you begin
To access the View Related Events, Related Event Details, and Events Patternportlets, users must be assigned the ncw_analytics_admin role.
About this task
You can start the Events Pattern portlet from the View Related Events portlet orthe Related Event Details portlet. Starting the Events Pattern portlet directly fromthe Related Event Details portlet ensures that you do not need to return to theView Related Events portlet to start the Events Pattern portlet after you review thedetails of a group.
Procedure
You can start the Events Pattern portlet from the View Related Events portlet orthe Related Event Details portlet.1. To start the Events Pattern portlet from the View Related Events portlet, start
the View Related Events portlet and select one of the following options. Formore information about starting the View Related Events portlet, see “Viewingrelated events” on page 208.a. To create a pattern, complete the following steps.
1) Select a related events group in the Groups table.2) Right-click the related events group and select Create Pattern.
b. To edit an existing pattern, complete the following steps.1) Select a pattern in the Group Sources table.2) Right-click the pattern and select Edit Pattern.
224 IBM Netcool Operations Insight: Integration Guide

2. To start the Events Pattern portlet from the Related Event Details portlet,complete the following steps.a. Start the Related Event Details portlet. For more information, see “Viewing
related events details for a seasonal event” on page 208b. Click Create Pattern.
Note: The Events Pattern portlet is updated with each newly selectedgroup.
What to do next
Input the details of the pattern in the Events Pattern portlet. For more informationabout completing the Events Pattern portlet, see “Creating an event pattern”
Creating an event patternYou can create a pattern based on the automatically discovered groups.
Before you begin
To access the View Related Events and Events Pattern portlets, users must beassigned the ncw_analytics_admin role.
About this task
A related events configuration automatically discovers groups of events that applyto specific managed resources. You can create an event pattern that is not specificto resources based on an automatically discovered group.
Procedure1. Start the Events Pattern portlet for a group. For more information about
starting the portlet, see “Starting the Events Pattern portlet” on page 224.2. Complete the parameter fields in the Pattern Criteria tab of the Events Pattern
portlet.
Merge intoMerge a Related Event Group into an existing pattern or select NONEto create new pattern. To merge a group into a pattern, select from thelist of patterns with one or more event types in common. NONE is thedefault option.
Name The name of the pattern. The name must contain alphanumericcharacters. Special characters are not permitted.
Pattern FilterThe ObjectServer SQL filters that are applied to the pattern. This filteris used to restrict the events to which the pattern is applied. Forexample, enter Summary NOT LIKE '%maintenance%'.
Time between first and last eventThe maximum time that can elapse between the occurrence of the firstevent and the last event in this pattern, which is measured in minutes.The default value is determined by the Related Events Group on whichthe pattern is based. Events that occur outside of this time window arenot considered part of this group.
Trigger ActionSelect the Trigger Action check box to group the live events when the
Event Analytics 225

selected event comes into the ObjectServer. When an event with theselected event type occurs, the grouping is triggered to start. Thecreated grouping includes events that contain all of the selected eventtypes.
For example, if the following three event types are part of the patterncriteria, A, B, and C, with only the Trigger Action check box for event Cselected, the grouping only occurs when an event with event type Coccurs. The grouping contains events that contain all three event types.
Event TypeThe event type or types that are included in the pattern. The EventType is pre-populated with existing event types for the selected pattern,and can be modified.
Resource Column(s)The resource or resources to which the action is applied. The ResourceColumn(s) is pre-populated with existing event type resources for theselected pattern, and can be modified.
Note: The triangle, circle, and square icons signify where the event typesoriginate from when a group is merged into an exiting pattern.
TriangleCommon to both the existing pattern and the group.
Circle Part of the group.
SquarePart of the existing pattern.
Note: Duplicate Event Type and Resource Columns pairs are not permitted.
Regular Expression (Optional) Click the regular expression icon to provide the regularexpression pattern for extracting the resource information from theselected column.
Note: To configure the regular expression for a resource, select oneresource in the resource column.
For example, the application abc on : myhost.xxxxxxx.xxx.com :encountered an unrecoverable error.Assuming that the resource information is always located betweencolons (:), and the host name ends with xxx.com, the following regularexpression extracts this resource information while the Events Pattern iscreated.[^: ]*.com
For more information about creating and editing regular expressions,see “Applying a regular expression to the pattern criteria” on page 228and “Editing a pattern criteria regular expression” on page 229.
3. In the Parent Event tab of the Events Pattern portlet, select one of the followingparent event options.
Most Important Event by TypeThe system checks the events as they occur. The events are rankedbased on the order defined in the UI. The highest ranking event is the
226 IBM Netcool Operations Insight: Integration Guide

parent. The parent event changes if a higher ranking event occurs aftera lower ranking event. To prevent a dynamically changing parentevent, select Synthetic Event.
You can manually reorder the ranking by selecting an event andclicking the Move Up and Move Down arrows.
Synthetic EventCreate an event to act as the parent event or select Use Selected Eventas Template to use an existing event as the parent event.
To create or modify a synthetic event, populate the following parameter fields,as required. All of the synthetic event fields are optional.
Node The managed entity from which the event originated. Displays themanaged entity from which the seasonal event originated.
SummaryThe event description.
SeverityThe severity of the event. Select one of the following values from theSeverity drop-down list.
CriticalMajorMinorWarningIndeterminateClear
Alert GroupThe Alert Group to which the event belongs.
Add additional fieldsSelect the Add additional fields check box to add more fields to thesynthetic parent event.
4. In the Test tab of the Events Pattern portlet, you can run a test to display theexisting auto-discovered groups that match the pattern criteria. The testdisplays the types of events that are matched by the chosen criteria. To run thetest, select Run Test. To cancel the test at any time, select Cancel Test.
5. To save, watch, or deploy the pattern, select one of the following options.v Select Save to save the pattern details to the View Related Events New tab.v Select Watch to add the pattern to the View Related Events Watched tab.v Select Deploy to add the pattern to the View Related Events Active tab.
Results
The events pattern is created and displayed in the Group Sources table in the ViewRelated Events portlet.
Note:
v If the patterns display 0 group and 0 events, the pattern creation process mightnot be finished. To confirm that the process is running,1. Append the policy name to the policy logger file from the Services tab,
Policy Logger service. For more information about configuring the Policy
Event Analytics 227
logger, see https://www.ibm.com/support/knowledgecenter/SSSHYH_7.1.0.12/com.ibm.netcoolimpact.doc/user/policy_logger_service_window.html.
2. Check the following log file.$IMPACT_HOME/logs/<serverName>_policylogger_PG_ALLOCATE_PATTERNS_GROUPS.log
If the process is not running, see the Event Analytics troubleshootinginformation.
v After creating a new pattern, the allocation of groups to the pattern happens inthe background, via a policy. If the new pattern does not have any groupsallocated (this is determined by the data set) then the new pattern will bedeleted. For more information, see the following technote: http://www.ibm.com/support/docview.wss?uid=swg22012714.
Related reference:“Troubleshooting Event Analytics” on page 248
Applying a regular expression to the pattern criteriaYou can apply a regular expression to the pattern criteria to extract informationfrom unstructured data in the selected resource column.
Before you begin
To access the View Related Events and Events Pattern portlets, users must beassigned the ncw_analytics_admin role.
About this task
The regular expression extracts specific information from unstructured data in theselected resource column.
Procedure1. Start the Events Pattern portlet for a group. For more information about
starting the portlet, see “Starting the Events Pattern portlet” on page 224.2. Select the regular expression symbol in the Pattern Criteria tab of the Events
Pattern portlet. The Regular Expression dialog box is displayed.3. Insert the regular expression in the Expression field.4. To change or select the event type to which the regular expression is applied,
select an event type from the drop-don list in the Test Data field.5. To test the regular expression, select Test. The test results are displayed in the
Result field.
Note: If there are multiple matches for the given regular expression, thematches are displayed in the Result field as a comma-separated list.
6. To save and apply the regular expression, select Save. The Regular Expressiondialog box is closed. A confirm symbol is displayed beside the ResourceColumn.
228 IBM Netcool Operations Insight: Integration Guide

Editing a pattern criteria regular expressionYou can edit an existing regular expression that was applied to a pattern criteria toextract information from unstructured data in the selected resource column.
Before you begin
To access the View Related Events and Events Pattern portlets, users must beassigned the ncw_analytics_admin role.
About this task
The regular expression extracts specific information from unstructured data in theselected resource column.
Procedure1. Start the Events Pattern portlet for a group. For more information about
starting the portlet, see “Starting the Events Pattern portlet” on page 224.2. Select the confirm symbol in the Pattern Criteria tab of the Events Pattern
portlet. The Regular Expression dialog box is displayed.3. Edit the regular expression in the Expression field.4. To change or select the event type to which the regular expression is applied,
select an event type from the drop-don list in the Test Data field.5. To test the regular expression, select Test. The test results are displayed in the
Result field.
Note: If there are multiple matches for the given regular expression, thematches are displayed in the Result field as a comma-separated list.
6. To save and apply the regular expression, select Save. The Regular Expressiondialog box is closed. A confirm symbol is displayed beside the ResourceColumn.
Viewing related event details in the Events Pattern portletYou can view the related event details for a selected related events group in theEvents Pattern portlet, when you create a new pattern for the group.
Before you begin
To access the View Related Events and Events Pattern portlets, users must beassigned the ncw_analytics_admin role.
Procedure
To view the related event details in the Events Pattern portlet, complete thefollowing steps.1. Open the View Related Events portlet.2. Select a related events group in the Groups table.3. Right-click the related events group and select Create Pattern. The Events
Pattern portlet is displayed.
Results
The related event details are displayed in the Group instances and Events tables inthe Pattern Criteria tab of the Events Pattern portlet.
Event Analytics 229

Note: The related event details columns in the Pattern Criteria tab of the EventsPattern portlet matches the Related Event Details portlet columns.
Suggested patternsSuggested Patterns are automatically created during a Related EventsConfiguration.
With generalization, the association of events is encapsulated by the system as apattern. Any Suggested Patterns that are generated can be viewed in the GroupSources table of the View Related Events portlet. For more information, see“Viewing related events by group” on page 208.
Note: Patterns are not created when the Override global event identity option isselected in the Configure Analytics portlet.
Right-click on a suggested pattern in the Group Sources table to display a list ofmenu items. You can select the following actions from the menu list.
Edit Pattern For more information about this action, see “Editing an existingpattern.”Delete Pattern For more information about this action, see “Deleting an existingpattern” on page 231.Watch For more information about this action, see “Watching a correlation rule”on page 220.Deploy For more information about this action, see “Deploying a correlationrule” on page 221.Archive For more information about this action, see “Archiving related events”on page 216.Copy Choose this action if you want to copy a row, which you can then pasteinto another document.
Editing an existing patternYou can edit an existing pattern to modify the pattern criteria.
Before you begin
To access the View Related Events and Events Pattern portlets, users must beassigned the ncw_analytics_admin role.
Procedure1. Start the View Related Events portlet. For more information about starting the
View Related Events portlet, see “Viewing related events” on page 208.2. Select a pattern in the Group Sources table.3. Right-click the pattern and select Edit Pattern.4. Modify the parameter fields in the Pattern Criteria and Parent Event tabs. For
more information about modifying the parameters, see “Creating an eventpattern” on page 225.
5. To save, watch, or deploy the pattern, select one of the following options.v Select Save to save the pattern details to the View Related Events New tab.v Select Watch to add the pattern to the View Related Events Watched tab.v Select Deploy to add the pattern to the View Related EventsActive tab.
230 IBM Netcool Operations Insight: Integration Guide
Deleting an existing patternYou can delete an existing pattern to remove it from the Group Sources table.
Before you begin
To access the View Related Events and Events Pattern portlets, users must beassigned the ncw_analytics_admin role.
Procedure1. Start the View Related Events portlet. For more information about starting the
View Related Events portlet, see “Viewing related events” on page 208.2. Select the pattern you want to delete in the Group Sources table.3. Right-click the pattern and select Delete Pattern.4. To delete the pattern, select Yes in the confirmation dialog window.
Results
The selected pattern is deleted.
Exporting pattern generalization test results to MicrosoftExcel
You can export pattern generalization test results for a specific configuration to aMicrosoft Excel spreadsheet from a supported browser.
Before you begin
To access the View Related Events, Related Event Details, and Events Patternportlets, users must be assigned the ncw_analytics_admin role.
About this task
You can start the Events Pattern portlet from the View Related Events portlet orthe Related Event Details portlet. Starting the Events Pattern portlet directly fromthe Related Event Details portlet ensures that you do not need to return to theView Related Events portlet to start the Events Pattern portlet after you review thedetails of a group.
Procedure
To export pattern generalization test results for a specific configuration to aMicrosoft Excel spreadsheet, complete the following steps.1. Open the View Related Events portlet.2. Select a specific configuration from the configuration table.3. Enter the pattern criteria and navigate to the Test tab of the Events Pattern
portlet and select Run Test.4. Click the Export Generalization Test Results button in the toolbar. After a
short time, the Download export results link displays.5. Click the link to download and save the Microsoft Excel file.
Results
The Microsoft Excel file contains a spreadsheet with the following tabs:
Event Analytics 231

v Groups Information: This tab contains the related events groups for theconfiguration that you selected.
v Groups Instances: This tab contains a list of all the related events instances forall of the related events groups for the configuration that you selected.
v Group Events: This tab contains a list of all the events that occurred in therelated events groups for the configuration that you selected.
v Instance Events: This tab contains a list of all the events that occurred in all ofthe related events instances for all the related events groups for theconfiguration that you selected.
v Export Comments: This tab contains any comments relating to the export forinformational purposes (for example, if the spreadsheet headers are truncated, orif the spreadsheet rows are truncated).
Configuring the type properties used for event patterncreation in Netcool/Impact
You can configure how Netcool/Impact handles the creation of event patterns byediting properties in the generated NOI Shared Configuration properties file.
Before you begin
1.4.1.2 In Netcool/Impact v7.1.0.13 it is recommended to use the EventAnalytics configuration wizard instead of the ./nci_trigger command to editproperties in the NOI Shared Configuration properties file. For more information,see “Event Analytics Configuration” on page 160.
Note:
v You should perform this configuration task prior to running any related eventsconfigurations that use the global type properties associated with event patterncreation. It is expected that you will perform this configuration task only whensomething in your environment changes that affects where type information isfound in events.
v Avoid configuring multiple types for the same event. By default, Identifier isused to identify the same events. This can be overridden, but assuming thedefault, you should setup the type properties so that events identified by thesame Identifier only have one type value. For example, if there are 10 eventswith Identifier=xxx and you want to use a type=ALERTGROUP then the eventsshould have the same ALERTGROUP. If events for the same Identifier havemany alert group values, the first one will be picked.
The default NOI Shared Configuration properties file is divided into sections,where each section contains a number of properties that allow you to instruct howNetcool/Impact handles a variety of operations, such as how it should handleevent pattern creation. There are three categories of event pattern creationproperties defined in the NOI Shared Configuration properties file:v Properties related to configuring which table columns in the Event History
database that Netcool/Impact should use in performing the event patternanalysis.
v Properties related to configuring the default unique event identifier and eventtype in the Event History database that you want Netcool/Impact to use whenthere is no match in the event type index related properties.
v Properties related to configuring one or more event identity and event typeindexes.
232 IBM Netcool Operations Insight: Integration Guide

Table 28 describes the event pattern creation properties defined in the NOI SharedConfiguration properties file. Use these descriptions to help you configure thevalues appropriate for your environment.
Table 28. Event pattern creation properties
Global type Description Example
Properties related to configuring table columns in the Event History database
type.resourcelist Specifies the name of the tablecolumn or columns in the EventHistory database thatNetcool/Impact should use inperforming the event patternanalysis.
The NOI Shared Configurationproperties file that you generate withthe nci_trigger command providesthe following default value:
type.resourcelist=NODE
Note: You should use the defaultvalue, NODE.
type.servername.column Specifies the name of the tablecolumn in the Event History databasethat contains the name of the serverassociated with any particular eventthat arrives in the Event Historydatabase.
The NOI Shared Configurationproperties file that you generate withthe nci_trigger command providesthe following default value:
type.servername.column=SERVERNAME
Note: You should use the defaultvalue, SERVERNAME, where possible.
type.serverserial.column Specifies the name of the tablecolumn in the Event History databasethat contains the server serial numberassociated with any particular eventthat arrives in the Event Historydatabase. Note that the server serialnumber should be unique.
The NOI Shared Configurationproperties file that you generate withthe nci_trigger command providesthe following default value:
type.serverserial.column=SERVERSERIAL
Note: You should use the defaultvalue, SERVERSERIAL, where possible.
Properties related to configuring the default unique event identifier and event type in the Event Historydatabase
Event Analytics 233

Table 28. Event pattern creation properties (continued)
Global type Description Example
type.default.eventid This property contains the databasefield in the Event History databasethat you want to specify as thedefault Event Identity. An EventIdentity is a database field thatidentifies a unique event in the EventHistory database. When youconfigure a related eventsconfiguration, you select databasefields for the Event Identity from adrop-down list of available fields. Inthe User Interface, you perform thisfrom the Advanced tab when youwant to override the settings in theconfiguration file.
Netcool/Impact uses the databasefield specified in this property as thedefault Event Identity when there isno match in the value specified in thetype.index.eventid property.
Note: The database field specified forthis property should not contain atimestamp component.
The NOI Shared Configurationproperties file that you generate withthe nci_trigger command providesthe following default value:
type.default.eventid=IDENTIFIER
type.default.eventtype Specifies the default related eventstype to use when creating an eventpattern to generalize.
Netcool/Impact uses this defaultrelated events type when there is nomatch in thetype.index.eventtypeproperty.
Note: You choose the related eventstype values based on the fields forwhich you want to create ageneralized pattern. For example, ifyou want to create a pattern andgeneralize it based on the EVENTIDfor an event, you would specify thatvalue in this property.
When the related eventsconfiguration completes and youcreate a pattern for generalization,the pattern generalization screen willcontain a drop down menu that listsall of the EVENTIDs found in theEvent History database. You can thencreate a pattern/rule that will beapplied to all EVENTIDs selected forthat pattern. This means that you canexpand the definition of the patternto include all types, not just the typesin the Related Events Group.
The NOI Shared Configurationproperties file that you generate withthe nci_trigger command providesthe following default value:
type.default.eventtype=EVENTID
234 IBM Netcool Operations Insight: Integration Guide

Table 28. Event pattern creation properties (continued)
Global type Description Example
Properties related to configuring one or more event identity and event type indexes. You should specify valuesfor each of the properties described in this section.
type_number_of_type_configurations
Specifies the number of types to usein the NOI Shared Configurationproperties file for the global typeconfiguration. There is no limit onhow many types you can configure.
The following example specifies twotypes for the global typeconfiguration:
type_number_of_type_configurations=2
Thus, you would define the othertype.index related properties asfollows. Note that the indexnumbering starts with 0 (zero).
type.0.eventid=Identifiertype.0.eventtype=ACMETypetype.0.filterclause=Vendor=’ACME’type.0.osfilterclause=Vendor=’ACME’type.1.eventid=SUMMARY,NODEtype.1.eventtype=TAURUSTypetype.1.filterclause=Vendor = ’TAURUS’type.1.osfilterclause=Vendor = ’TAURUS’
type.index.eventid Specifies the database field in theEvent History database that youwant to specify as the Event Identity.Multiple fields are separated bycommas.
The following shows an example of adatabase field used as the EventIdentity:
type.0.eventid=SUMMARY
The following shows an example ofmultiple database fields used as theEvent Identity:
type.0.eventid=NODE,SUMMARY, ALERTGROUP
type.index.eventtype Specifies the event type to return forpattern generalization.
Note: The returned event typesdisplay in the event type drop downmenu in the pattern generalizationscreen.
The following example shows anevent type to return for patterngeneralization:
type.0.eventtype=EVENTID
type.index.filterclause Specifies an Event History databasefilter that defines a set of events. Forthe set of events defined by this filter,the event type will be found in thetable column or columns in thetype.index.eventtype property.
Note: It is recommended that youcreate one or more database indexeson the reporter status table for thefields used in thetype.index.filterclause to speedup the query.
type.0.filterclause=Vendor = ’ACME’
Event Analytics 235
Table 28. Event pattern creation properties (continued)
Global type Description Example
type.index.osfilterclause Specifies an ObjectServer filter tofilter matching event types.
Note: The filter that you specify forthe type.index.osfilterclauseproperty should be semanticallyidentical to the filter that you specifyfor the type.index.filterclauseproperty, except for this property youuse the ObjectServer syntax.
type.0.osfilterclause=Vendor = ’ACME’
About this task
To configure the event pattern creation properties that Netcool/Impact uses forgeneralization, you must modify the default NOI Shared Configuration propertiesfile in the <Impact_install_location>/bin directory.
Procedure1. Log in to the server where IBM Tivoli Netcool/Impact is stored and running.2. Go to the <Impact install location>/bin directory.3. Enter the following command: ./nci_trigger <server_name>
<UserID>/<password> NOI_DefaultValues_Export FILENAME <Full Path to thefile name><name_of_propsfile>
<server_name>Specifies the name of the server where Netcool/Impact is stored andrunning.
<UserID>Specifies the ID of the Netcool/Impact user.
<password>Specifies the password of the Netcool/Impact user.
<Full Path to the file name><name_of_propsfile>Specifies the directory where the default NOI Shared Configurationproperties file resides. The directory specification includes the name of thedefault NOI Shared Configuration properties file.
For example:./nci_trigger NCI impactadmin/impactpass NOI_DefaultValues_ExportFILENAME /tmp/noi_def_values.props
4. Go to the directory where you generated the NOI Shared Configurationproperties file and open it for editing.
5. Create a backup copy of the generated NOI Shared Configuration propertiesfile.
6. Using the editor of your choice open the generated NOI Shared Configurationproperties file for editing.
7. Using the information about the event pattern creation properties described inTable 28 on page 233, specify values appropriate to your environment.Remember that the following properties have default values that you shouldnot change:v type.resourcelist
236 IBM Netcool Operations Insight: Integration Guide

v type.servername.column
v type.serverserial.column
8. After specifying appropriate values to the event pattern creation properties,write and then quit the NOI Shared Configuration properties file.
9. To update the values that you specified for the event pattern creation propertiesin the default NOI Shared Configuration properties file, run the followingcommand:./nci_trigger NCI impactadmin/impactpass NOI_DefaultValues_ConfigureFILENAME /tmp/noi_def_values.props
Example
The following example sets the Event Identity, defines a set of events, and findsthe type information in the specified table column or columns in the Event Historydatabase:type_number_of_type_configurations=1type.0.eventid=NODE,SUMMARY,ALERTGROUPtype.0.eventtype=ACMETypetype.0.filterclause=( Vendor = ’ACME’ )type.0.osfilterclause=Vendor = ’ACME’
More specifically, the examples shows that if there is an event and the value forVendor for that event is ACME, then look in the table column called ACMEType to findthe event type.
The following example expands on the previous example by showing twoconfigurations (as indicated by the value 2 in thetype_number_of_type_configurations property:type_number_of_type_configurations=2type.0.eventid=NODEtype.0.eventtype=ACMETypetype.0.filterclause=( Vendor = ’ACME’ )type.0.osfilterclause=Vendor = ’ACME’type.1.eventid=NODE,SUMMARY,ALERTGROUPtype.1.eventtype=TAURUSTypetype.1.filterclause=( Vendor = ’TAURUS’ )type.1.osfilterclause=Vendor = ’TAURUS’
Note: Netcool/Impact attempts to match each event to the filter defined inconfiguration 0 first. If the event matches the filter defined in configuration 0, thenNetcool/Impact defines the event's type as defined in the filter. If the event doesnot match the filter defined in configuration 0, Netcool/Impact attempts to matchthe event to the filter defined in configuration 1. If the event matches the filterdefined in configuration 1, then Netcool/Impact defines the event's type as definedin the filter. Netcool/Impact continues this processing sequence for as manyconfiguration types you define.
If no events match the filters defined in the defined configuration types you define,Netcool/Impact uses the default configuration to determine where type andidentity are to be found.
Event Analytics 237

ReferenceReview reference information for Event Analytics.
Netcool/Impact installation componentsSelect the components of Netcool/Impact that you want to install.
If you purchased IBM Netcool Operations Insight the Impact Server Extensionscomponent is displayed in the list and is selected automatically. This componentcontains extra Impact Server features that work with IBM Netcool OperationsInsight.
If you accept the default selection, both the GUI Server and the Impact Server areinstalled on the same computer. In a production environment, install the ImpactServer and the GUI Server on separate computers. So, for example, if you alreadyinstalled the Impact Server on another computer, you can choose to install the GUIServer alone.
The component Installation Manager is selected automatically on the system that isnot already installed with Installation Manager.
Netcool/Impact does not support Arabic or Hebrew, therefore Event Analyticsusers, who are working in Arabic or Hebrew, see some untranslated English text.
Configuring the Event Analytics ObjectServerYou must run SQL to update the Event Analytics ObjectServer for the RelatedEvents function.
About this task
The SQL provides commands for creating and modifying ObjectServer objects anddata. Complete the following steps to run the SQL to update the ObjectServer.
Procedure1. Copy the SQL file IMPACT_HOME/add-ons/RelatedEvents/db/
relatedevents_objectserver.sql from Netcool/Impact into the tmp directoryon your ObjectServer.
2. Run the SQL against your ObjectServer, enter the following command.On Windows, enter the command %OMNIHOME%\..\bin\redist\isql -U<username> -P <password> -S <server_name> < C:\tmp\relatedevents_objectserver.sql
On Linux and UNIX, enter the command $OMNIHOME/bin/nco_sql -user<username> -password <password> -server <server_name> </tmp/relatedevents_objectserver.sql
3. If you have not previously configured the Event Analytics ObjectServer, youmust enter the following command.
On Windows, enter the command %OMNIHOME%\..\bin\redist\isql -U<username> -P <password> -S <server_name> < C:\tmp\relatedevents_objectserver.sql
On Linux and UNIX, enter the command $OMNIHOME/bin/nco_sql -user<username> -password <password> -server <server_name> </tmp/relatedevents_objectserver.sql
238 IBM Netcool Operations Insight: Integration Guide
4. All users must run the SQL against your ObjectServer, enter the followingcommand.
On Windows, enter the command %OMNIHOME%\..\bin\redist\isql -U<username> -P <password> -S <server_name> < C:\tmp\relatedevents_objectserver_update_fp5.sql
On Linux and UNIX, enter the command $OMNIHOME/bin/nco_sql -user<username> -password <password> -server <server_name> </tmp/relatedevents_objectserver_update_fp5.sql
What to do next
Event correlation for the related events function in Event Analytics, uses aParentIdentifier column that is added the ObjectServer. If the size of thisidentifier field changes in your installation, you must change the value of theParentIdentifier column within the ObjectServer SQL file that creates the eventgrouping automation relatedevents_objectserver.sql, to ensure that both valuesare the same. The updated SQL is automatically picked up.Related tasks:“Installing Netcool/OMNIbus and Netcool/Impact” on page 49
Configuring Oracle database connection within Netcool/ImpactYou can configure a connection to a valid Oracle database from within IBM TivoliNetcool/Impact.
Before you begin
1.4.1.2 In Netcool/Impact v7.1.0.13 it is recommended to use the EventAnalytics configuration wizard instead of the ./nci_trigger command to editproperties in the NOI Shared Configuration properties file. For more information,see “Event Analytics Configuration” on page 160.
To use Oracle as the archive database, you must set up a remote connection toNetcool/Impact. For more information, see “Netcool/Impact remote connection”on page 245.
About this task
Users can run seasonality event reports and related event configurations,specifying the time range and name with Oracle. Complete the following steps toconfigure the ObjectServer data source or data type.
Procedure1. Log in to the Netcool/Impact UI.
https://impacthost:port/ibm/console
2. Configure the ObjectServer data source and data type.a. In the Netcool/Impact UI, from the list of available projects, select the NOI
project.b. Select the Data Model tab, and select ObjectServerForNOI.
1) Click Edit and enter information for <username>, <password>, <hostname>, and <port>.
2) Save the Netcool/Impact data source. Click Test Connection, followedby the Save icon.
Event Analytics 239

c. Edit the data type. Expand the data source ObjectServerForNOI and editthe data type to correspond to the ObjectServer event history database type.For example, AlertsForNOITable.
d. For Base Table, select <database table>.e. To update the schema and table, click Refresh and then click Save.f. Select the Data Model tab, and select ObjectServerHistoryOrclForNOI.
1) Click Edit and enter information for <username>, <password>, <hostname>, <port>, and <sid>.
2) Save the Netcool/Impact data source. Click Test Connection, followedby the Save icon.
g. Edit the data type. Expand the data sourceObjectServerHistoryOrclForNOI and edit the AlertsHistoryOrclTable datatype.
h. For Base Table, select <database name> and <database table name>.i. To update the schema and table, click Refresh and then click Save.j. Edit the data type. Expand the data source ObjectServerHistoryOrclForNOI
and edit the SE_HISTORICALEVENTS_ORACLE data type.k. For Base Table, select <database name> and <database table name>.l. To update the schema and table, click Refresh and then click Save.m. Select the Services tab and ensure that following services are started:
ProcessRelatedEvents
ProcessSeasonalityEvents
ProcessRelatedEventConfig
3. Configure the report generation to use the Oracle database. Export the defaultproperties, change the default configuration, and update the properties.a. Generate a properties file. Go to the <Impact install location>/bin
directory to locate the nci_trigger utility, and run the following commandfrom the command-line interface:nci_trigger <server> <username>/<password> NOI_DefaultValues_ExportFILENAME directory/filename
Where
<server>The server where Event Analytics is installed.
<user name>The user name of the Event Analytics user.
<password>The password of the Event Analytics user.
directoryThe directory where the properties file is stored.
filenameThe name of the properties file.
For example:./nci_trigger NCI impactadmin/impactpass NOI_DefaultValues_ExportFILENAME /tmp/seasonality.props
b. You need to modify the property values that are overwritten by thegenerated properties file. For a full list of properties, see “Generatedproperties file” on page 166.
240 IBM Netcool Operations Insight: Integration Guide

v If you do not have the following values for these properties, update yourproperties file to reflect these property values:history_datasource_name=ObjectServerHistoryOrclForNOIhistory_datatype_name=AlertsHistoryOrclTablehistory_database_table=<database table name>history_database_type=Oracle
v Enter the following value, which is the Oracle database timestamp formatfrom the policy, to the history_db_timestampformat property:history_db_timestampformat=yyyy-mm-dd hh24:mi:ss
Note: The history_db_timestampformat property delivers with theproperties file with a default value of yyyy-MM-dd HH:mm:ss.SSS. Thisdefault timestamp format for the history_db_timestampformat propertydoes not work with Oracle. Thus, you need to perform the previous stepto change the default value to the Oracle database timestamp format fromthe policy (yyyy-mm-dd hh24:mi:ss).
c. Import the modified properties file into Netcool/Impact using the followingcommand:nci_trigger <Server> <username>/<password> NOI_DefaultValues_ConfigureFILENAME directory/filename
For example:./nci_trigger NCI impactadmin/impactpass NOI_DefaultValues_ConfigureFILENAME /tmp/seasonality.props
Configuring DB2 database connection within Netcool/ImpactYou can configure a connection to a valid DB2 database from within IBM TivoliNetcool/Impact.
Before you begin
1.4.1.2 In Netcool/Impact v7.1.0.13 it is recommended to use the EventAnalytics configuration wizard instead of the ./nci_trigger command to editproperties in the NOI Shared Configuration properties file. For more information,see “Event Analytics Configuration” on page 160.
About this task
Users can run seasonality event reports and related event configurations,specifying the time range and name with DB2. Complete the following steps toconfigure the ObjectServer data source or data type.
Procedure1. Log in to the Netcool/Impact UI.
https://impacthost:port/ibm/console
2. Configure the ObjectServer data source and data type.a. In the Netcool/Impact UI, from the list of available projects, select the NOI
project.b. Select the Data Model tab and select ObjectServerForNOI.
1) Click Edit and enter information for <username>, <password>, <hostname>, <port>.
2) To save the Netcool/Impact data source, click Test Connection, followedby the Save icon.
Event Analytics 241

c. Edit the data type. Expand the data source and edit the data type tocorrespond to the ObjectServer event history database type. For example,AlertsForNOITable
d. For Base Table, select <database table>.e. To update the schema and table, click Refresh and then click Save.f. Select the Data Model tab and select ObjectServerHistoryDB2ForNOI.
1) Click Edit and enter information for <username>, <password>, <hostname>, <port>.
2) To save the Netcool/Impact data source, click Test Connection, followedby the Save icon.
g. Edit the data type. Expand the ObjectServerHistoryDB2ForNOI datasource and edit AlertsHistoryDB2Table.
h. For Base Table, select <database name> and <database table name>
i. To update the schema and table, click Refresh and then click Save.j. Select the Services tab and ensure that the following services are started.
ProcessRelatedEvents
ProcessSeasonalityEvents
ProcessRelatedEventConfig
3. Configure the DB2 database connection within Netcool/Impact if it waspreviously configured for Oracle or MSSQL. The following steps configure thereport generation to use the DB2 database. Export the default properties,change the default configuration, and update the properties.a. Generate a properties file, go to the <Impact install location>/bin
directory to locate the nci_trigger, and run the following command fromthe command-line interface.nci_trigger <server> <username>/<password> NOI_DefaultValues_ExportFILENAME directory/filename
where
<server>The server where Event Analytics is installed.
<user name>The user name of the Event Analytics user.
<password>The password of the Event Analytics user.
directoryThe directory where the file is stored.
filenameThe name of the properties file.
For example:./nci_trigger NCI impactadmin/impactpass NOI_DefaultValues_ExportFILENAME /tmp/seasonality.props
b. Update the properties file. Some property values are overwritten by thegenerated properties file, you might need to update other property valuesin the generated properties file. For a full list of effected properties, see“Generated properties file” on page 166.v If you do not have the following parameter values, update your
properties file to reflect these parameter values.
242 IBM Netcool Operations Insight: Integration Guide

history_datasource_name=ObjectServerHistoryDB2ForNOIhistory_datatype_name=AlertsHistoryDB2Tablehistory_database_table=<database table name>history_database_type=DB2
c. Import the modified properties file into Netcool/Impact, enter the followingcommand.nci_trigger <Server> <username>/<password> NOI_DefaultValues_ConfigureFILENAME directory/filename
For example:./nci_trigger NCI impactadmin/impactpass NOI_DefaultValues_ConfigureFILENAME /tmp/seasonality.props
Related tasks:“Installing Netcool/OMNIbus and Netcool/Impact” on page 49
Configuring MS SQL database connection withinNetcool/Impact
You can configure a connection to a valid MS SQL database from within IBM TivoliNetcool/Impact.
Before you begin
1.4.1.2 In Netcool/Impact v7.1.0.13 it is recommended to use the EventAnalytics configuration wizard instead of the ./nci_trigger command to editproperties in the NOI Shared Configuration properties file. For more information,see “Event Analytics Configuration” on page 160.
MS SQL support requires, at minimum, IBM Tivoli Netcool/Impact 7.1.0.1.
To use MS SQL as the archive database, you must set up a remote connection toNetcool/Impact. For more information, see “Netcool/Impact remote connection”on page 245.
About this task
Users can run seasonality event reports and related event configurations,specifying the time range and name with MS SQL. Complete the following steps toconfigure the ObjectServer data source and data type.
Procedure1. Log in to the Netcool/Impact UI.
https://impacthost:port/ibm/console
2. Configure the ObjectServer data source and data type.a. In the Netcool/Impact UI, from the list of available projects, select the NOI
project.b. Select the Data Model tab and select ObjectServerForNOI.
1) Click Edit and enter the following information <username>, <password>,<host name>, <port>.
2) Save the Netcool/Impact data source. Click Test Connection, followedby the Save icon.
Event Analytics 243

c. Edit the data type, expand the data source and edit the data type tocorrespond to the ObjectServer event history database type. For example,AlertsForNOITable
d. For Base Table, select <database table>.e. To update the schema and table, click Refresh and then click Save.f. Select the Data Model tab and select ObjectServerHistoryMSSQLForNOI.
1) Click Edit and enter the following information <username>, <password>,<host name>, <port>, <sid>.
2) Save the Netcool/Impact data source. Click Test Connection, followedby the Save icon.
g. Edit the data type. Expand the data sourceObjectServerHistoryMSSQLForNOI and edit AlertsHistoryMSSQLTable.
h. For Base Table, select <database table name>.i. To update the schema and table, click Refresh and then click Save.j. Select the Services tab and ensure that the following services are started.
ProcessRelatedEvents
ProcessSeasonalityEvents
ProcessRelatedEventConfig
3. Configure the report generation to use the MS SQL database.a. Generate a properties file, go to the <Impact install location>/bin
directory to locate the nci_trigger and in the command-line interface enterthe following command.nci_trigger <server> <username>/<password> NOI_DefaultValues_ExportFILENAME directory/filename
<server>The server where Event Analytics is installed.
<user name>The user name of the Event Analytics user.
<password>The password of the Event Analytics user.
directoryThe directory where the file is stored.
filenameThe name of the properties file.
For example, ./nci_trigger NCI impactadmin/impactpassNOI_DefaultValues_Export FILENAME /tmp/seasonality.props.
b. Update the properties file. Some property values are overwritten by thegenerated properties file, you might need to update other property valuesin the generated properties file. For a full list of effected properties, see“Generated properties file” on page 166.v If you do not have the following parameter values, update your
properties file to reflect these parameter values.history_datasource_name=ObjectServerHistoryMSSQLForNOIhistory_datatype_name=AlertsHistoryMSSQLTablehistory_database_table=<database table name>history_database_type=MSSQL
c. Import the modified properties file into Netcool/Impact, enter thecommand.
244 IBM Netcool Operations Insight: Integration Guide

nci_trigger <Server> <username>/<password> NOI_DefaultValues_ConfigureFILENAME directory/filename
For example,./nci_trigger NCI impactadmin/impactpass NOI_DefaultValues_ConfigureFILENAME /tmp/seasonality.props
Netcool/Impact remote connectionDB2 is the default archive database. To use Oracle or MS SQL as the archivedatabase, you must set up a remote connection to Netcool/Impact.
About this task
The IBM Dashboard console Netcool/Impact connection should use HTTPS.
Procedure1. Log in to the IBM Dashboard console. If you fail to connect to the Dashboard
console, ensure that the firewall on your computer is disabled.2. Click the Console icon.3. Select Connections.4. Click the Create new remote provider icon.5. Enter the Netcool/Impact UI server Host name, Port, Name and Password.6. Click Search.7. Select Impact_NCICLUSTER as your data provider.8. Click OK.
Adding a cluster to the Netcool/Impact environmentIf you add a cluster to the Netcool/Impact environment, you must update the datasources in IBM Tivoli Netcool/Impact.
About this task
Update the following data sources when you add a cluster to the Netcool/Impactenvironment.
seasonalReportDataSource
RelatedEventsDatasource
NOIReportDatasource
Complete the following steps to update the data sources.
Procedure1. In Netcool/Impact, go to the Database Failure Policy.2. Select Fail over or Fail back depending on the high availability type you want.
For more information, see the failover and failback descriptions.3. Go to Backup Source.4. Enter the secondary Impact Server's Derby Host Name, Port, and Database
information.
Standard failoverStandard failover is a configuration in which an SQL database DSA
Event Analytics 245

switches to a secondary database server when the primary serverbecomes unavailable and then continues by using the secondary untilNetcool/Impact is restarted.
FailbackFailback is a configuration in which an SQL database DSA switches to asecondary database server when the primary server becomesunavailable and then tries to reconnect to the primary at intervals todetermine whether it returned to availability.
What to do next
If you encounter error ATKRST132E, see details in “Troubleshooting Event Analytics”on page 248
If you want your Netcool/Impact cluster that is processing events to contain thesame cache and update the cache, at or around the same time, you must run thefile relatedevents_objectserver.sql with nco_sql. Therelatedevents_objectserver.sql file contains the following commands.create database relatedevents;create table relatedevents.cacheupdates persistent (name varchar (20) primary key,updates integer);insert into relatedevents.cacheupdates (name, updates) values (’RE_CACHE’, 0);
Extra failover capabilitiesRelated events use standard ObjectServer components to provide a highavailability solution. These ObjectServer components require extra configuration toensure high availability where there is an ObjectServer pair and the primaryObjectServer goes down before the cache on the Netcool/Impact node refreshes.
In this scenario, if you deploy a correlation rule, the rule is picked up if you havereplication setup between the ObjectServer tables. Otherwise, the new rule is notpicked up and this state continues until you deploy another new rule. Completethe following steps to setup replication between the ObjectServer tables.v In the .GATE.map file, add the following lines.
CREATE MAPPING RE_CACHEMAP(’name’ = ’@name’ ON INSERT ONLY,’updates’ = ’@updates’);
v If your configuration does not use the standard StatusMap file, add the followingline to the StatusMap file that you use to control alerts.status, you can find theStatusMap file in the .tblrep.def file.
’ParentIdentifier’ = ’@ParentIdentifier’
v In the .tblrep.def file, add the following lines.REPLICATE ALL FROM TABLE ’relatedevents.cacheupdates’
USING map ’RE_CACHEMAP’;
For more information about adding collection ObjectServers and displayingObjectServers to your environment, see the following topics within IBMKnowledge Center for IBM Tivoli Netcool/OMNIbus, Netcool/OMNIbus v8.1.0Welcome page.
Setting up the standard multitiered environment
Configuring the bidirectional aggregation ObjectServer Gateway
Configuring the unidirectional primary collection ObjectServer Gateway
246 IBM Netcool Operations Insight: Integration Guide

Viewing historical events in the Event ViewerYou can view historical events in the Event Viewer.
About this task
To view historical events in the Event Viewer, you must create a connection to thehistorical database in IBM Tivoli Netcool/Impact. Complete the following steps.
Procedure1. Log in to the Netcool/Impact GUI and select the NOI project.2. Select the Data Model tab, and click the New Data Source icon.3. Point to Database SQL and select your database type. For example, DB2.4. In the Data Source Name field, enter historicalEventsDatasource.5. Enter your user name and password in the fields that are provided and click
the Save icon.6. In the navigation pane, right-click historicalEventsDatasource and select New
Data Type.7. In the Data Type Name field, enter historicalEventData.8. Enable the Access the data through UI data provider check box.9. Click Refresh and the table description is updated.
10. From the table description, select at least one field as the key field. Then, clickthe Save icon.
11. Within IBM Tivoli Netcool/OMNIbus Web GUI, use the Event Viewerpersonalize screen to change the data provider for the Event Viewer. For moreinformation about customizing event displays in the Web GUI, seehttp://www-01.ibm.com/support/knowledgecenter/SSSHTQ_8.1.0/com.ibm.netcool_OMNIbus.doc_8.1.0/webtop/wip/task/web_cust_jsel_settingportletpreferences.html.
Understanding the timeline chartEvent information in the Related Event Details portlet is available in chart format.
You can use the Related Event Details portlet to view more information aboutrelated events. For example, you can view charted event information on a timelinechart. For more information about how to view the charted event information, see“Switching between tabulated and charted event information” on page 215
The timeline chart shows the event distribution for each event type in the group,relative to the pivot event. The pivot event is always at zero seconds, minutes, orhours.
Each comb in the timeline chart represents an event type and the teeth representthe number of instances of the event type. The blue event markers represent all thetimes the event occurred relative to the pivot event. The red event markers indicatethe time that the event occurred in the selected group instance.
Event Analytics 247
Troubleshooting Event AnalyticsUse the following troubleshooting information to resolve problems with yourEvent Analytics configuration.
If your problem is not listed in this topic, then refer to the Release notes foradditional issues.
Improving Event Analytics performance due to large searchresults
If you are performing an upgrade of Event Analytics from an earlier version, theupgrade repopulates the existing data from the previous version and aligns thisdata with the new schema, tables, and views. It is possible that you might seedegradation in the performance of Event Analytics operations. Examples ofdegradation in performance include but are not limited to:v Reports can hang.v Reports complete, but no data is displaying for seasonal events.
To improve any degradation in the performance of Event Analytics operations dueto the upgrade to 1.3.1 or later releases, run the SE_CLEANUPDATA policy as follows:1. Log in to the server where IBM Tivoli Netcool/Impact is stored and running.
You must log in as the administrator (that is, you must be assigned thencw_analytics_admin role).
2. Navigate to the policies tab and search for the SE_CLEANUPDATA policy.3. Open this policy by double-clicking it.4. Select to run the policy by using the run button on the policy screen toolbar.
The SE_CLEANUPDATA policy cleans up the data. Specifically, the SE_CLEANUPDATApolicy:v Does not remove or delete any data from the results tables. The results tables
hold all the original information about the analysis.v Provides some additional views and tables on top of the original tables to
enhance performance.v Combines some information from related events, seasonal events, rules, and
statistics.v Cleans up only the additional tables and views.
The Seasonal Event Report stops running before completion.
The Seasonal Event Report does not complete running. No errors are displayed.The report progress does not increase.
This problem occurs if a Seasonal Event Report is running when theNetcool/Impact back-end server goes offline while the Impact UI server is stillavailable. No errors are displayed in the Impact UI and no data is displayed in thewidgets/dashboards.
To resolve this problem, ensure that the Netcool/Impact servers are running. Editand rerun the Seasonal Event Report.
248 IBM Netcool Operations Insight: Integration Guide

The Netcool/Impact back-end server fails when you run multipleSeasonal Event Reports
The Seasonal Event Reports do not complete running. No errors are displayed. Thereport progress does not increase.
This problem occurs when multiple Seasonal Event Reports are run simultaneouslywithout increasing the default heap size settings for Netcool/Impact. The defaultheap size setting for Netcool/Impact is 1200 MB. If the heap size is exceeded, theNetcool/Impact back-end server fails.
To resolve this problem, increase the heap size settings. As a guideline, increase theheap size settings to 80% of the free memory on your system.
For more information, see the Increasing the memory for the Java virtual machine onthe Impact profile and Setting the memory for the Java virtual machine on the Impactprofile Netcool/Impact topics. You can access these publications from the IBMTivoli Network Management IBM Knowledge Center (http://www-01.ibm.com/support/knowledgecenter/SSSHYH/).
Error displaying Seasonal Event Graphs in Microsoft InternetExplorer browser
The Seasonal Event Graphs do not display in a Microsoft Internet Explorerbrowser.
This problem happens because Microsoft Internet Explorer requires the MicrosoftSilverlight plug-in to display the Seasonal Event Graphs.
To resolve this problem, install the Microsoft Silverlight plug-in.
Submitted Seasonal Event Report remains at 0%
The Seasonal Event Report does not run. It remains at 0%.
This problem occurs when Event Analytics cannot access theProcessSeasonalityEvents Service. You cannot create a Seasonal Event Reportwithout access to the ProcessSeasonalityEvents Service.
To resolve this issue, ensure that the ProcessSeasonalityEvents Service is runningon the Impact Server.
Creating a Seasonal Event Report displays error message Errorcreating report. Seasonality configuration is invalid
The Seasonal Event Report does not run. An error message is displayed.Error creating report.Seasonality configuration is invalid. Verify settings and retry.
This problem occurs when Event Analytics is not correctly configured before yourun a Seasonal Event Report.
To resolve this problem, review the Event Analytics installation and configurationguides to ensure that all of the prerequisites and configuration steps are complete.Also, if you use a table name that is not the standard REPORTER_STATUS, you mustverify the settings that are documented in the following configuration topics.
Event Analytics 249
“Configuring DB2 database connection within Netcool/Impact” on page 241“Configuring Oracle database connection within Netcool/Impact” on page 239“Configuring MS SQL database connection within Netcool/Impact” on page243
Missing Event Analytics files and directories
The stand-alone Netcool/Impact GUI server contains incorrect column names anduntranslated text strings.
This problem occurs when a stand-alone Netcool/Impact GUI server is installed.Some of the Event Analytics files and directories are not installed correctly.
To resolve this problem, copy the files and directories in the following directory inthe backend server to the stand-alone Netcool/Impact GUI server:$IMPACT_HOME/uiproviderconfig
The seasonality report times out when you use large data sets
Before the seasonality policy starts to process a report, the seasonality policy issuesa database query to find out how many rows of data need to be processed. Thisdatabase query has a timeout when the database contains many rows and thedatabase is not tuned to process the query. Within the <impactinstall>/logs/impact_server.log file, the following message is displayed.02 Sep 2014 13:00:28,485 ERROR [JDBCVirtualConnectionWithFailOver] JDBC ConnectionPool recievederror trying to connect to data source at: jdbc:db2://localhost:50000/database02 Sep 2014 13:02:28,500 ERROR [JDBCVirtualStatement] JDBC execute failed twice.com.micromuse.common.util.NetcoolTimeoutException: TransBlock [Executing SQL query:select count(*)as COUNT from DB2INST1.PRU_REPORTER where ((Severity >= 4) AND ( FIRSTOCCURRENCE >’2007-09-02 00:00:00.000’ )) AND ( FIRSTOCCURRENCE < ’2014-09-02 00:00:00.000’)] timedout after120000ms.
Check that you have indexes for the FIRSTOCCURRENCE field and any additionalfilter fields that you specified, for example, Severity. Use a database tuning utility,or refresh the database statistics, or contact your database administrator for help.Increase the impact.server timeout to a value greater than the default of 120s, seehttp://www-01.ibm.com/support/docview.wss?uid=swg21621488.
The seasonality report stays at 0% complete and does notprogress
Within <install>/impact/logs/NCO_policylogger.log, the following trace entry isvisible with no latter trace entries.12 Sep 2014 11:23:08,817: [ConfigureResults][pool-3-thread-18]Parser log: About toAdd a new Data
This problem occurs if the seasonality services are not started.
To resolve this problem, complete the following steps.1. In the Netcool/Impact UI, select the Seasonality project.2. Within the Seasonality project, select the Services tab.3. In the Services tab, start the following policies.
250 IBM Netcool Operations Insight: Integration Guide

StartSeasonalityProcessing
ProcessSeasonalityEvents
Seasonality reports or related events configurations hang, witherror ATKRST132E logged
When you start cluster members, replication starts and the Netcool/Impactdatabase goes down. Any running seasonality reports or related eventsconfigurations hang and this error message is logged in the Netcool/Impact serverlog.ATKRST132E An error occurred while transferring a request to the following remoteprovider: ’Impact_NCICLUSTER.server.company.com’. Error Message is’Cannot access data provider - Impact_NCICLUSTER.server.company.com’.
To resolve this problem, do a manual restart or a scheduled restart of the affectedreports or configurations.
Within the event viewer, you are unable to view seasonal eventsand error ATKRST103E is logged
When you complete the following type of steps, then within the event viewer theseasonal events are not viewable and error ATKRST103E is logged.1. Open the event viewer and select to edit the widget from the widget menu.2. From the list on the edit screen, select the Impact Cluster data provider.3. Select to view either the seasonality report and the report name.4. Save the configuration.
To resolve the problem, view seasonal events by using the provided seasonalevents pages and view related events parent to child relationships by using theTivoli Netcool/OMNIbus data provider.
Configuring Netcool/Impact for ObjectServer failover
Netcool/Impact does not process new events for Event Analytics after ObjectServerfailover. Seasonal event rule actions are not applied if the Netcool/Impact server isnot configured correctly for ObjectServer failover as new events are processed. Forexample, if a seasonal event rule creates a synthetic event, the synthetic event doesnot appear in the event list, or if a seasonal event rule changes the column valuefor an event, the value is unchanged.
This problem occurs when Netcool/Impact is incorrectly configured forObjectServer failover.
To resolve this problem, extra Netcool/Impact configuration is required forObjectServer failover. To correctly configure Netcool/Impact, complete the steps inthe Managing the OMNIbusEventReader with an ObjectServer pair for New Events orInserts topic in the Netcool/Impact V 7.1.0.3 documentation: https://www.ibm.com/support/knowledgecenter/SSSHYH_7.1.0.12/com.ibm.netcoolimpact.doc/common/dita/ts_serial_value_omnibus_eventreader_failover_failback.html
When configured, Netcool/Impact uses the failover ObjectServer to process theevent.
Event Analytics 251

Update the Seasonal Event date range after you upgrade from7.1.0.2 to 7.1.0.3 or later
After you upgrade from 7.1.0.2 to 7.1.0.3 or later for Netcool/Impact and web GUI,you must update the seasonal event configuration date range. In 7.1.0.2 a seasonalevent configuration has a fixed date range. In 7.1.0.3 or later, the default date rangeis relative.
To update the date range after you upgrade to 7.1.0.3 or later, complete thefollowing steps:v Select the seasonal event configuration in the Configure Analytics portlet.v Click the fixed date range radio button.v Click Save to save the configuration without running, or Save & Run to save
and run the configuration.
The correct fixed date range values are imported from 7.1.0.2.
Seasonal report missing information after you upgrade toNetcool/Impact 7.1.0.3 or later
After you upgrade from Netcool/Impact 7.1.0.1 and 7.1.0.2 to Netcool/Impact7.1.0.3 or later, information is missing from columns in the group table in the ViewSeasonal Events portlet.
Information is missing from specific columns in the group table that is displayedin the View Seasonal Events portlet after you upgrade. The information that ismissing in 7.1.0.3 or later was not displayed in earlier versions of Netcool/Impactand Netcool Operations Insight.
To display the missing information in the columns, rerun the migratedconfiguration in the latest build.
Note: Rerunning the migrated configuration in the latest build overwrites datathat existed for the previously run configuration.
Unable to create patterns for configurations created before youupgraded to Netcool Operations Insight 1.4.0.1 or later
Configurations that are created before you upgrade to Netcool Operations Insight1.4.0.1 or later used the override global event identity setting, which is defined inthe analytics configuration file. You cannot create patterns for groups in thisanalytics configuration.
After you upgrade to Netcool Operations Insight 1.4.0.1 or later, ensure that theevent history database is indexed based on the SERVERSERIAL and SERVERNAME, orequivalent used, fields. If the historical database is created from the defaulthistorical database, the index is in place.
To apply patterns to existing configurations, re-create the configurations in NetcoolOperations Insight 1.4.0.1 or later using the original configuration settings and theglobal event identity.
252 IBM Netcool Operations Insight: Integration Guide

Warning message related to configuring seasonality eventanalytics
When you are configuring an event configuration and seasonality event analytics isenabled, the following warning message appears in the log file.WARNING: Follow this instruction: This error is after the analysis is done.The last step is to reinsert the data for UI views.
You login to the Impact UI, go to the Policies tab, and execute thefollowing policy:
SE_CLEANUPDATA
Following these steps corrects the error and reinserts the data.
Typically, the previous warning message appears in the log file when theseasonality configuration is complete and an error occurred.
To correct the error and reinsert the data, run the SE_CLEANUPDATA policy as follows.
Note: Before you run the SE_CLEANUPDATA policy, it is recommended that youincrease the value specified for the impact.server.timeout property defined in the$IMPACT_HOME/etc/ServerName_server.props properties file. Specifically, replaceimpact.server.timeout=120000 with impact.server.timeout=3600000. The value3600000 allows for 60 minutes to give more time for the Apache Derby database towork in the complex query. You will need to restart the Netcool/Impact serverafter you edit the impact.server.timeout property.1. Log in to the server where IBM Tivoli Netcool/Impact is stored and running.
You must log in as the administrator (that is, you must be assigned thencw_analytics_admin role).
2. Navigate to the policies tab and search for the SE_CLEANUPDATA policy.3. Open this policy by double-clicking it.4. Select to run the policy by using the run button on the policy screen toolbar.
The SE_CLEANUPDATA policy cleans up the data. Specifically, the SE_CLEANUPDATApolicy:v Does not remove or delete any data from the results tables. The results tables
hold all the original information about the analysis.v Provides some additional views and tables on top of the original tables to
enhance performance.v Combines some information from related events, seasonal events, rules, and
statistics.v Cleans up only the additional tables and views.
Unable to run SE_CLEANUPDATA policy
If the Netcool/Impact server timeout is reached when you are running aseasonality report, the following message displays on the Configure Analyticsportlet:Finished with Errors
If you then try to run the SE_CLEANUPDATA policy, the policy locks on theNetcool/Impact server. To work around this issue, you must manually unlock the
Event Analytics 253

file that contains the SE_CLEANUPDATA policy. Then, run the SE_CLEANUPDATApolicySE_CLEANUPDATA policy again. To unlock the SE_CLEANUPDATA policy, followthese steps:1. Log in to the server where IBM Tivoli Netcool/Impact is stored and running.
You must log in as the administrator (that is, you must be assigned thencw_analytics_admin role).
2. Navigate to the policies tab and search for the SE_CLEANUPDATA policy.3. Right-click the SE_CLEANUPDATA policy and select unlock from the drop-down
menu.
Event Analytics configuration Finished with Warnings
The seasonality report or related events configuration completes with a status ofFinished with Warnings. This message indicates that a potential problem wasdetected but it is not of a critical nature. You should review the log file for moreinformation ($NCHOME/logs/impactserver.log). The following is an example of awarning found in impactserver.log:11:12:38,366 WARN [NOIProcessRelatedEvents] WARNING: suggested pattern :RE-sqa122-last36months-Sev3-Default_Suggestion4 includes too many types,could be due to configuration of types/patterns.The size of the data execeeded the column limit.The pattern will be dropped as invalid.
Event Analytics configuration Finished with Errors
One reason for an Event Analytics configuration to complete with a status ofFinished with Errors is because the suggested patterns numbering is notsequential. This can be because, for example, the pattern type found is invalid orthe string is too long to be managed by the Derby database. You should review thelog file for more information ($NCHOME/logs/impactserver.log).
The pattern displays 0 groups and 0 events
The events pattern that is created and displayed in the Group Sources table in theView Related Events portlet displays 0 groups and 0 events
The pattern displays 0 groups and 0 events for one of the following reasons.v The pattern creation process is not finished. The pattern creation process can
take a long time to complete due to large datasets and high numbers ofsuggested patterns.
v The pattern creation process was stopped before it completed.
To confirm the reason that the pattern displays 0 groups and 0 events, completethe following steps.1. To confirm that the process is running,
a. Append the policy name to the policy logger file from the Services tab,Policy Logger service. For more information about configuring the Policylogger, see https://www.ibm.com/support/knowledgecenter/SSSHYH_7.1.0.12/com.ibm.netcoolimpact.doc/user/policy_logger_service_window.html.
b. Check the following log file.$IMPACT_HOME/logs/<serverName>_policylogger_PG_ALLOCATE_PATTERNS_GROUPS.log
254 IBM Netcool Operations Insight: Integration Guide

If the log file shows that the process is running, wait for the process tocomplete. If the log file shows that the process stopped without completing,proceed to step 2.
2. To force reallocation for all configurations and patterns run thePG_ALLOCATE_PATTERNS_GROUPS_FORCE from Global projects policy with noparameters from the UI.
3. Monitor the $IMPACT_HOME/logs/<serverName>_policylogger_PG_ALLOCATE_PATTERNS_GROUPS_FORCE.log log file totrack the completion of the process.
Incomplete, stopped, and uninitiated configurations
Configurations do not complete, are stalled on the Configure Analytics portlet, orfail to start.
These problems occur if the services are not started after Event Analytics isinstalled, or the Netcool/Impact server is restarted.
To resolve these problems, complete the following steps.1. In the Netcool/Impact UI, select the Impact Services tab.2. Ensure that each of the following services is started. To start a service,
right-click the service and select Start.LoadRelatedEventPatterns
ProcessClosedPatternInstances
ProcessPatternGroupsAllocation
ProcessRelatedEventConfig
ProcessRelatedEventPatterns
ProcessRelatedEventTypes
ProcessRelatedEvents
ProcessSeasonalityAfterAction
ProcessSeasonalityConfig
ProcessSeasonalityEvents
ProcessSeasonalityNonOccurrence
UpdateSeasonalityExpiredRules
Event Analytics: Reports fail to run due to event count queriesthat take too long.
Reports fail to run due to large or unoptimized datasets that cause theNetcool/Impact server to timeout and reports fails to complete.
To resolve this issue, increase the Netcool/Impact server timeout value to ensurethat the Netcool/Impact server processes these events before it times out. As aresult of increasing this server timeout value, the Netcool/Impact server waits forthe events to be counted, thus ensuring that the reports complete and display inthe appropriate portlet.
Edit the Netcool/Impact impact.server.timeout value, at$IMPACT_HOME/etc/ServerName_server.props
By default, the impact.server.timeout property is set to 120000 milliseconds,which is equal to 2 minutes. The recommendation is to specify a server timeout
Event Analytics 255

value of at least 5 minutes. If the issue continues, increase the server timeout valueuntil the reports successfully complete and display in the appropriate portlet.
Backup the Apache Derby database before upgrading to EventAnalytics 1.4.0.1
Before you upgrade Event Analytics toNetcool Operations Insight 1.4.0.1, create abackup of the Apache Derby database.
To back up the Apache Derby database, complete the following steps.1. Stop the ImpactDatabase service.2. Back up the files from the $NCHOME/db/<SERVER_NAME>/derby directory.3. Start the ImpactDatabase service again.
To restore the Apache Derby database from a backup file, complete the followingsteps.1. Stop the ImpactDatabase service. Make a copy of the existing ImpactDB
database before you restore the backup file.2. Copy the backup file to the $NCHOME/db/<SERVER_NAME>/derby directory.3. Start the ImpactDatabase service again.
To restore an older version of the Apache Derby database, after a failure completethe following steps, based on the upgrade version.1. Change to the following directory:
cd $IMPACT_HOME/add-ons/NOI/db
2. List the files that reside in the $IMPACT_HOME/add-ons/NOI/db directory. Forexample:ls...noi_derby_updatefp03.sqlnoi_derby_updatefp04.sqlnoi_derby_updatefp05.sqlnoi_derby_upgrade_71fp2.sql...
3. Make backup copies to each file before editing.4. Using a text editor, open each file for editing and find the following line:
connect ’jdbc:derby://__PRIMARY_HOST__:__PRIMARY_PORT__/__PRIMARY_DB__;user=__DBUSER__;password=__DBPASSWORD__;’;
5. Change the connection parameters in each of the files.6. Write and close each file.7. Run the following command:
$IMPACT_HOME/bin/nci_db connect -sqlfile <one of the sql files>
Note: You execute all previous versions of the files until Fix Pack 5 as follows:v noi_derby_upgrade_71fp2.sql -- Start here if you are upgrading Fix Pack 1.v noi_derby_updatefp03.sql -- Start here if you are upgrading Fix Pack 2.v noi_derby_updatefp04.sql -- Start here if you are upgrading Fix Pack 3.
256 IBM Netcool Operations Insight: Integration Guide
v noi_derby_updatefp05.sql
8. Restart the Netcool/Impact server.
Event pattern with the same criteria already exists (errormessage)
An error message is displayed if you create a pattern that has a duplicate patterncriteria selected. Check the following log file to determine which pattern is theduplicate:$IMPACT_HOME/logs/<serverName>_policylogger_PG_SAVEPATTERN.log
Related Event Details page is slow to load
To avoid this problem, create an index on the Event History Database for theSERVERSERIAL and SERVERNAME columns.create index myServerIndex on DB2INST1.REPORTER_STATUS (SERVERSERIAL , SERVERNAME )
It is the responsibility of the database administrator to construct (and maintain)appropriate indexes on the REPORTER history database. The databaseadministrator should review the filter fields for the reports as a basis for an index,and should also review if an index is required for Identity fields.
Export of large Related Event configuration fails
The export a configuration with more then 2000 Related Event groups fails. Anerror message is displayed.Export failed.An invalid response was received from the server.
To resolve this issue, increase the Java Virtual Machine memory heap size settingsfrom the default values. For Netcool/Impact the default value of the Xmx is 2400MB. In JVM, Xmx sets the maximum memory heap size. To improve performance,make the heap size larger than the default setting of 2400 MB. For details aboutincreasing the JVM memory heap size, see https://www.ibm.com/support/knowledgecenter/SSSHYH_7.1.0.12/com.ibm.netcoolimpact.doc/admin/imag_monitor_java_memory_status_c.html.
Configuration run time differences between Netcool/Impact fixpack versions
In comparison to previous fix packs, improvements are noticeable inNetcool/Impact V7.1 fix pack 12 to both run time and heap memory use forseasonal event and related event configurations. Apply the latest available fixpacks to upgrade to the latest version of Netcool Operations Insight.
Export of Event Analytics reports causes log out of DASH
If Netcool/Impact and DASH are installed on the same server, a user might belogged out of DASH when exporting Event Analytics reports from DASH. Theproblem occurs when the Download export result link is clicked in DASH. A newbrowser tab is opened and the DASH user is logged out from DASH.
To avoid this issue, configure SSO between DASH and Netcool/Impact. For moreinformation, see https://www.ibm.com/support/knowledgecenter/
Event Analytics 257

SSSHYH_7.1.0.12/com.ibm.netcoolimpact.doc/admin/imag_configure_single_signon.html.
Two or more returned seasonal events appear to be identical
It is possible for events to have the same Node, Summary, and Alert Group but adifferent Identifier. In this scenario, the event details of two (or more) events canappear to be identical because the Identifier is not displayed in the details.
Display of a Seasonal Event's historical events screen appearsto hang or take a long time
Review the Table Description tab of the SQL Data Type Config settings found onthe NOI Data Model : ObjectServerHistory<databaseType>ForNOI and remove anycolumns that are not required by Event Analytics reports. Is is possible that theRefresh Fields button on that tab has been selected and as a result additional(unwanted) columns are marked for selection/retrieval from the database.1. Switch to the NOI Data Model.2. Expand the ObjectServerHistory collapsible section appropriate to your
historical database type.For example, if you are using DB2 as the historical events database thenexpand the ObjectServerHistoryDB2ForNOI collapsible section.
3. Edit the SE_HISTORICALEVENTS_DB2 datasource to show the SQL DataType Config settings.If you are using a database other than DB2 then select the appropriatedatasource, for example SE_HISTORICALEVENTS_ORACLE for Oracle.
4. Select the Table Description tab and review the available columns.5. To remove a column: select the check box to the left of the column name under
the ID column in Table Description and select Delete Selection.6. Save any changes.
Event Isolation and Correlation (EIC) page does not load if anon-default cluster name is used
If you use a non-default cluster name, for example NCICLUSTER_Z, the EventIsolation and Correlation page might not load successfully. Complete thefollowing steps to resolve this problem:1. Stop the Netcool/Impact GUI server: $IMPACT_HOME/bin/stopGUIServer.sh.2. Copy or rename the file with the correct cluster name. For example:
cp $IMPACT_HOME/opview/displays/NCICLUSTER-EIC_configure.html$IMPACT_HOME/opview/displays/NCICLUSTER_Z-EIC_configure.html
3. Restart the Netcool/Impact GUI server: $IMPACT_HOME/bin/startGUIServer.sh4. Go to the Event Isolation and Correlation page and confirm that the page
displays without errors.
258 IBM Netcool Operations Insight: Integration Guide

Event relationships display in the Event Viewer, only if theparent and child events match the filter
The Event Viewer is only able to show relationships between events if the parentand the child events are all events that match the filter. There are some use casesfor related events where parent or child events might not match the filter.
Background
Netcool/OMNIbus Web GUI is able to show the relationships between events inthe Event Viewer, if the Event Viewer view in use has an associated Web GUIrelationship. This relationship defines which field in an event contains theidentifier of the event's parent, and which field contains the identifier for thecurrent event. For more information about defining event relationships, seehttp://www-01.ibm.com/support/knowledgecenter/SSSHTQ_8.1.0/com.ibm.netcool_OMNIbus.doc_8.1.0/webtop/wip/task/web_cust_jsel_evtrelationshipmanage.html.
The relationship function works from the set of events that are included in theevent list, and the event list displays the events that match the relevant Web GUIfilter. See the following example. If you have a filter that is called Critical toshow all critical events, the filter clause is Severity = 5, then relationshipsbetween these events are shown provided the parent and child events in therelationships all have Severity = 5. If you have a parent event that matches thefilter Severity = 5 but has relationships to child events that have a major severitySeverity = 4, these child relations are not seen in the event list because the childevents do not match the filter. Furthermore, these child relations are not includedin the set of events that are returned to the Event Viewer by the server.
Resolution
To resolve this problem, you must define your filter with appropriate filterconditions that ensures that related events are included in the data that is returnedto the Event Viewer by the server. See the following example, this example buildson the example that is used in the Background section.1. Make a copy of the Critical filter and name the copy CriticalAndRelated. You
now have two filters. Use the original filter when you want to see only criticalevents. You use the new filter to see related events, even if events are notcritical.
2. Manually modify the filter condition of the CriticalAndRelated filter to includethe related events. To manually modify this filter condition, use the advancedmode of the Web GUI filter builder. The following example conditions arebased on the current example.
The main filter condition is Severity = 5.In an event, the field that denotes the identifier of the parent event is calledParentSerial.The value of the ParentSerial field, where populated, is the Serial of anevent.If ParentSerial is 0, this value is a default value and does not referenceanother event.
v Including related child events. To include events that are the immediate childevents of events that match the main filter, set this filter condition.Severity = 5ORParentSerial IN (SELECT Serial FROM alerts.status WHERE Severity = 5)
Event Analytics 259

v Including related parent events. To include events that are the immediateparent of events that match the main filter, set this filter condition.Severity = 5ORSerial IN (SELECT ParentSerial from alerts.status WHERE Severity = 5)
v Including related sibling events. To include events that are the other childevents of the immediate parents of the event that matches the main filter (thesiblings of the events that match the main filter), set this filter condition.Severity = 5ORParentSerial IN (SELECT ParentSerial from alerts.status WHERESeverity = 5 AND ParentSerial > 0)
v Including related parents, children, and siblings together. Combine theprevious types of filter conditions so that the new CriticalAndRelated filterretrieves critical events, and the immediate children of the critical events, andthe immediate parents of the critical events, and the immediate children ofthose parent events (the siblings). You must have this filter condition.Severity = 5ORParentSerial IN (SELECT Serial FROM alerts.status WHERE Severity = 5)ORSerial IN (SELECT ParentSerial from alerts.status WHERE Severity = 5)ORParentSerial IN (SELECT ParentSerial from alerts.status WHERESeverity = 5 AND ParentSerial > 0)
v Including related events that are more than one generation away. In theprevious examples, the new filter conditions go up to only one level, up ordown, from the initial set of critical events. However, you can add more filterconditions to retrieve events that are more than one generation away fromthe events that match the main filter. If you want to retrieve grandchildren ofthe critical events (that is, two levels down from the events that match themain filter condition) and immediate children, set this filter condition.-- The initial set of Critical eventsSeverity = 5OR-- Children of the Critical eventsParentSerial IN (SELECT Serial FROM alerts.status WHERE Severity = 5)-- Children of the previous "child events"ORParentSerial IN (SELECT Serial FROM alerts.status WHERE
ParentSerial IN (SELECT Serial FROM alerts.status WHERE Severity = 5) )
Use a similar principal to retrieve parent events that are two levels up, andsiblings of the parent events. To pull this scenario together, set this filtercondition.-- The initial set of Critical eventsSeverity = 5
OR
-- Children of the Critical eventsParentSerial IN (SELECT Serial FROM alerts.status WHERESeverity = 5)
OR
-- Children of the previous "child events"ParentSerial IN (SELECT Serial FROM alerts.status WHERE
ParentSerial IN (SELECT Serial FROM alerts.status WHERESeverity = 5) )
260 IBM Netcool Operations Insight: Integration Guide

OR
-- Parents of the Critical eventsSerial IN (SELECT ParentSerial from alerts.status WHERE Severity = 5)
OR
-- Parents of the previous "parent events"Serial IN (SELECT ParentSerial from alerts.status WHERE
Serial IN (SELECT ParentSerial from alerts.status WHERE Severity = 5) )OR
-- Other children of the Critical events’ parentsParentSerial IN (SELECT ParentSerial from alerts.status WHERESeverity = 5 AND ParentSerial > 0)
OR
-- Other children of the Critical events’ grandparentsParentSerial IN (SELECT ParentSerial from alerts.status WHERE
Serial IN (SELECT ParentSerial from alerts.status WHERESeverity = 5 AND ParentSerial > 0) AND ParentSerial > 0)
You can continue this principal to go beyond two levels in the hierarchy.However, with each additional clause the performance of the query degradesdue to the embedded subquerying. Therefore, there might be a practical limitto how far away the related events can be.
Event Analytics 261

262 IBM Netcool Operations Insight: Integration Guide

IBM Networks for Operations Insight
Networks for Operations Insight adds network management capabilities to theNetcool Operations Insight solution. These capabilities provide network discovery,visualization, event correlation and root-cause analysis, and configuration andcompliance management that provide service assurance in dynamic networkinfrastructures. It contributes to overall operational insight into application andnetwork performance management.
For documentation that describes how to install Networks for Operations Insight,see Performing a fresh installation. For documentation that describes how toupgrade from an existing Networks for Operations Insight, or transition toNetworks for Operations Insight, see “Upgrading to the latest Netcool OperationsInsight” on page 101.
Before you begin
The Networks for Operations Insight capability is provided through setting up thefollowing products in Netcool Operations Insight:v Network Manager IP Edition, see https://www.ibm.com/support/
knowledgecenter/SSSHRKv Netcool Configuration Manager, see http://www-01.ibm.com/support/
knowledgecenter/SS7UH9/welcome
In addition, you can optionally add on performance management capability bysetting up the Network Performance Insight product and integrating it withNetcool Operations Insight. Performance management capability includes theability to display and drill into performance anomaly and flow data. For moreinformation on Network Performance Insight, see https://www.ibm.com/support/knowledgecenter/SSCVHB.
About Networks for Operations InsightNetworks for Operations Insight provides dashboard functionality that enablesnetwork operators to monitor the network, and network planners and engineers totrack and optimize network performance.
About Networks for Operations Insight dashboardsAs a network operator you can monitor network performance at increasing levelsof detail. As a network planner or engineer, you can display the top 10 interfacesbased on network congestion, traffic utilization, and quality of service (QoS). Youcan also run reports to show historical traffic traffic utilization information overdifferent periods of time up to the last 365 days.
If you are a network operator, then use the dashboards available in Networks forOperations Insight to monitor performance at the level of detail that you require:v Use the Network Health Dashboard to monitor performance of all devices in a
network view.v Use the Device Dashboard to monitor performance at the device or interface
level.v Use the Traffic Details dashboard to monitor traffic flow details across a single
interface.
© Copyright IBM Corp. 2014, 2018 263

If you are a network planner or engineer, then use “Network Performance InsightDashboards” on page 309 to view top 10 information on interfaces across yournetwork, including the following:v Congestionv Traffic utilizationv Quality of service
You can also run flow data reports for any device and interface over differentperiods of time up to the last 365 days.
Scenario: Monitoring bandwidth usageIf a user or application is using a lot of interface bandwidth this can causeperformance degradation across the network. This scenario shows you how to setup the Device Dashboard to monitor bandwidth usage on selected interfaces, andhow to navigate into Traffic Details dashboard to see exactly which user orapplication is using the most bandwidth on that interface.
The first steps involve setting up thresholds for bandwidth performancemonitoring. Once this is done, you can monitor a device or interface at metriclevel, and navigate to more detailed information, such as network flow through aninterface, to determine what is causing performance degradation.
The steps are described in the following table.
Table 29. Scenario for bandwidth performance monitoring
Action More information
1. Ensure that the poll definitions snmpInBandwidth andsnmpOutBandwidth exist and are set up to poll theinterfaces for which you want to monitor bandwidth.
Network Manager documentation:
v Creating poll policies: https://www.ibm.com/support/knowledgecenter/SSSHRK_4.2.0/poll/task/poll_crtpoll.html
v Creating poll defintions: https://www.ibm.com/support/knowledgecenter/SSSHRK_4.2.0/poll/task/crtpolldef.html
2. Within these poll definitions, define anomaly thresholdsettings. Performance anomalies in the Device Dashboardand in the Event Viewer are generated based on thesethreshold settings.
“Defining anomaly thresholds” on page 299
3. Enable the collection of flow data on the devices andinterfaces of interest.
“Defining traffic flow thresholds” on page 298
4. Once your settings in steps 2 and 3 have taken effect,launch the Device Dashboard and point it at the deviceof interest. Within the Performance Insights portlet,proceed as follows:
1. Select the Interfaces tab.
2. Click Metrics and select snmpInBandwidth orsnmpOutBandwidth and find the interface of interestin the table.Note: If the interface of interest is showing aperformance anomaly, this means that bandwidththresholds are being exceeded on this interface.Perform steps 5 and 6 to determine who is using thebandwidth.
“Monitoring performance data” on page 291
264 IBM Netcool Operations Insight: Integration Guide

Table 29. Scenario for bandwidth performance monitoring (continued)
Action More information
5. Right-click the interface of interest and select ShowTraffic Details. The Traffic Details dashboard opens in aseparate tab and displays traffic flow through theselected interface.
“Displaying traffic data on an interface” on page 297
6. Use the controls in the Traffic Details dashboard todisplay the traffic flow view of interest. For example, tosee which source device and application is using themost bandwidth, display the Top Sources withApplication view.
“Traffic Details dashboard views” on page 302
“Monitoring NetFlow performance data from TrafficDetails dashboard” on page 308
About the Network Health DashboardUse the Network Health Dashboard to monitor a selected network view, anddisplay availability, performance, and event data, as well as configuration andevent history for all devices in that network view.Related concepts:“Network Management tasks” on page 16
Monitoring the network using the Network Health DashboardUse this information to understand how to use the Network Health Dashboard todetermine if there are any network issues, and how to navigate from thedashboard to other parts of the product for more detailed information.
The Network Health Dashboard monitors a selected network view, and displaysdevice and interface availability within that network view. It also reports onperformance by presenting graphs, tables, and traces of KPI data for monitoreddevices and interfaces. A dashboard timeline reports on device configurationchanges and event counts, enabling you to correlate events with configurationchanges. The dashboard includes the event viewer, for more detailed eventinformation.
Monitoring the Network Health DashboardMonitor the Network Health Dashboard by selecting a network view within yourarea of responsibility, such as a geographical area, or a specific network servicesuch as BGP or VPN, and reviewing the data that appears in the other widgets onthe dashboard. If you have set up a default network view bookmark that containsthe network views within your area of responsibility, then the network views inthat bookmark will appear in the network view tree within the dashboard.
Before you begin
For more information about the network view tree in the Network HealthDashboard, see “Configuring the network view tree to display in the NetworkHealth Dashboard” on page 273
About this task
Note: The minimum screen resolution for display of the Network HealthDashboard is 1536 x 864. If your screen is less than this minimum resolution, thenyou will see scroll bars on one or more of the widgets in the Network HealthDashboard.
Networks for Operations Insight 265

Displaying device and interface availability in a network view:
Using the Unavailable Resources widget you can monitor, within a selectednetwork view, the number of device and interface availability alerts that have beenopen for more than a configurable amount of time. By default this widget chartsthe number of device and interface availability alerts that have been open for up to10 minutes, for more than ten minutes but less than one hour, and for more thanone hour.
About this task
To monitor the number of open device and interface availability alerts within aselected network view, proceed as follows:
Procedure
1. Network Health Dashboard2. In the Network Health Dashboard, select a network view from the network
view tree in the Network Views at the top left. The other widgets update toshow information based on the network view that you selected. In particular,the Unavailable Resources widget updates to show device and interfaceavailability in the selected network view. A second tab, called "Network View",opens. This tab contains a dashboard comprised of the Network Views GUI, theEvent Viewer, and the Structure Browser, and it displays the selected networkview. You can use this second tab to explore the topology of the network viewthat you are displaying in the Network Health Dashboard.For information about specifying which network view tree to display in theNetwork Health Dashboard, see “Configuring the network view tree to displayin the Network Health Dashboard” on page 273.
3. In the Unavailable Resources widget, proceed as follows:To determine the number of unavailable devices and interface alerts, use thefollowing sections of the chart and note the colors of the stacked bar segmentsand the number inside each segment.
Restriction: By default, all of the bars described below are configured todisplay. However, you can configure the Unavailable Resources widget todisplay only specific bars. For example, if you configure the widget to displayonly the Device Ping and the Interface Ping bars, then only those bars will bedisplayed in the widget.
Note: By default the data in the Unavailable Resources widget is updatedevery 20 seconds.
SNMP Poll FailUses color-coded stacked bars to display the number of SNMP Poll Failalerts within the specified timeframe.
SNMP Link StateUses color-coded stacked bars to display the number of SNMP LinkState alerts within the specified timeframe.
Interface PingUses color-coded stacked bars to display the number of Interface Pingalerts within the specified timeframe.
Device PingUses color-coded stacked bars to display the number of Device Pingalerts within the specified timeframe.
266 IBM Netcool Operations Insight: Integration Guide

Color coding of the stacked bars is as follows:
Table 30. Color coding in the Unavailable Resources widget
YellowNumber of alerts that have been open for up to 10 minutes.
PinkNumber of alerts that have been open for more than 10 minutes and up toone hour.
BlueNumber of alerts that have been open for more than one hour.
Click any one of these bars to show the corresponding alerts for the devicesand interfaces in the Event Viewer at the bottom of the Network HealthDashboard.
Note: You can change the time thresholds that are displayed in this widget.The default threshold settings are 10 minutes and one hour. If your availabilityrequirements are less stringent, then you could change this, for example, to 30minutes and 3 hours. The change applies on a per-user basis.If none of the devices in the current network view is being polled by any oneof these polls, then the corresponding stacked bar will always displays zerovalues. For example, If none of the devices in the current network view is beingpolled by the SNMP Poll Fail poll, then the SNMP Poll Fail bar will alwaysdisplays zero values. If you are able to access the Configure Poll Policies panelin the Network Polling GUI, then you can use the Device Membership field onthat table to see a list all of devices across all network views that are polled bythe various poll policies.
Displaying overall network view availability:
You can monitor overall availability of chassis devices within a selected networkview using the Percentage Availability widget.
About this task
To display overall availability of chassis devices within a selected network view,proceed as follows:
Procedure
1. Network Health Dashboard2. In the Network Health Dashboard, select a network view from the network
view tree in the Network Views at the top left. The other widgets update toshow information based on the network view that you selected. In particular,the Percentage Availability widget updates to show overall availability ofchassis devices in network view. A second tab, called "Network View", opens.This tab contains a dashboard comprised of the Network Views GUI, the EventViewer, and the Structure Browser, and it displays the selected network view.You can use this second tab to explore the topology of the network view thatyou are displaying in the Network Health Dashboard.For information about specifying which network view tree to display in theNetwork Health Dashboard, see “Configuring the network view tree to displayin the Network Health Dashboard” on page 273.
3. In the Percentage Availability widget, proceed as follows:The Percentage Availability widget displays 24 individual hour bars. Each bardisplays a value, which is an exponentially weighted moving average of pingresults in the past hour; the bar only appears on the completion of the hour.
Networks for Operations Insight 267

The bar value represents a percentage availability rate rather than a total countwithin that hour. The color of the bar varies as follows:v Green: 80% or more.v Orange: Between 50% and 80%.v Red: Less than 50%.
Displaying highest and lowest performers in a network view:
You can monitor highest and lowest poll data metrics across all devices andinterfaces within a selected network view using the Top Performers widget.
About this task
To display highest and lowest poll data metrics across all devices and interfaceswithin a selected network view, proceed as follows:
Procedure
1. Network Health Dashboard2. In the Network Health Dashboard, select a network view from the network
view tree in the Network Views at the top left. The other widgets update toshow information based on the network view that you selected. In particular,the Top Performers widget updates to show overall availability of chassisdevices in network view. A second tab, called "Network View", opens. This tabcontains a dashboard comprised of the Network Views GUI, the Event Viewer,and the Structure Browser, and it displays the selected network view. You canuse this second tab to explore the topology of the network view that you aredisplaying in the Network Health Dashboard.For information about specifying which network view tree to display in theNetwork Health Dashboard, see “Configuring the network view tree to displayin the Network Health Dashboard” on page 273.
3. In the Top Performers widget, proceed as follows:Select from the following controls to display chart, table, or trace data in theTop Performers widget.
Metric Click this drop-down list to display a selected set of poll data metrics.The metrics that are displayed in the drop-down list depend on whichpoll policies are enabled for the selected network view. Select one ofthese metrics to display associated data in the main part of the window.
Order Click this drop-down list to display what statistic to apply to theselected poll data metric.v Statistics available for all metrics, except the SnmpLinkStatus metric.
From Top: Displays a bar chart or table that shows the 10 highestvalues for the selected metric. The devices or interfaces with thesemaximum values are listed in the bar chart or table.From Bottom: Displays a bar chart or table that shows the 10lowest values for the selected metric. The devices or interfaceswith these minimum values are listed in the bar chart or table.
v Statistics available for the SnmpLinkStatus metric. In each case, a barchart or table displays and shows devices for the selected statistic.
Unavailable: This statistic displays by default. Devices with thisstatistic are problematic.Admin Down Devices with this statistic are not problematic asAdministrators change devices to this state.
268 IBM Netcool Operations Insight: Integration Guide

Available Devices with this statistic are not problematic.
Note: The widget lists devices or interfaces depending on which metricwas selected:v If the metric selected applies to a device, such as memoryUtilization,
then the top 10 list contains devices.v If the metric selected applies to an interface, such as ifInDiscards,
then the top 10 list contains interfaces.
Show ChartDisplays a bar chart with the 10 highest or lowest values. Show Chartis the display option when you first open the widget.
Show TableDisplays a table of data associated with the 10 highest or lowest values.
Define Filter
This button only appears if you are in Show Table mode. Clickhere to define a filter to apply to the Top Performers table data.
The main part of the window contains the data in one of the following formats:
Chart Bar chart with the 10 highest or lowest values. Click any bar in thechart to show a time trace for the corresponding device or interface.
Table Table of data associated with the 10 highest or lowest values. The tablecontains the following columns:v Entity Name: Name of the device or interface.v Show Trace: Click a link in one of the rows to show a time trace for
the corresponding device or interface.v Last Poll Time: Last time this entity was polled.v Value: Value of the metric the last time this entity was polled.
Trace Time trace of the data for a single device or interface. Navigate withinthis trace by performing the following operations:v Zoom into the trace by moving your mouse wheel forward.v Zoom out of the trace by moving your mouse wheel backward.v Double click to restore the normal zoom level.v Click within the trace area for a movable vertical line that displays
the exact value at any point in time.
Click one of the following buttons to specify which current or historical polldata to display in the main part of the window. This button updates the dataregardless of which mode is currently being presented: bar chart, table, or timetrace.
Restriction: If your administrator has opted not to store poll data for any ofthe poll data metrics in the Metric drop-down list, then historical poll data willnot be available when you click any of the following buttons:v Last Day
v Last Week
v Last Month
Networks for Operations Insight 269

v Last Year
CurrentClick this button to display current raw poll data. When in time tracemode, depending on the frequency of polling of the associated pollpolicy, the time trace shows anything up to two hours of data.
Last DayClick this button to show data based on a regularly calculated dailyaverage.v In bar chart or table mode, the top 10 highest or lowest values are
shown based on a daily exponentially weighted moving average(EWMA).
v In time trace mode, a time trace of the last 24 hours is shown, basedon the average values.
In the Last Day section of the widget EWMA values are calculated bydefault every 15 minutes and are based on the previous 15 minutes ofraw poll data. The data presented in this section of the widget is thenupdated with the latest EWMA value every 15 minutes.
Last WeekClick this button to show data based on a regularly calculated weeklyaverage.v In bar chart or table mode, the top 10 highest or lowest values are
shown based on a weekly exponentially weighted moving average(EWMA).
v In time trace mode, a time trace of the last 7 days is shown, based onthe average values.
In the Last Week section of the widget EWMA values are calculated bydefault every 30 minutes and are based on the previous 30 minutes ofraw poll data. The data presented in this section of the widget is thenupdated with the latest EWMA value every 30 minutes.
Last MonthClick this button to show data based on a regularly calculated monthlyaverage.v In bar chart or table mode, the top 10 highest or lowest values are
shown based on a monthly exponentially weighted moving average(EWMA).
v In time trace mode, a time trace of the last 30 days is shown, basedon the average values.
In the Last Month section of the widget EWMA values are calculatedby default every two hours and are based on the previous two hours ofraw poll data. The data presented in this section of the widget is thenupdated with the latest EWMA value every two hours.
Last YearClick this button to show data based on a regularly calculated yearlyaverage.v In bar chart or table mode, the top 10 highest or lowest values are
shown based on a yearly exponentially weighted moving average(EWMA).
v In time trace mode, a time trace of the last 365 days is shown, basedon the average values.
270 IBM Netcool Operations Insight: Integration Guide

In the Last Year section of the widget EWMA values are calculated bydefault every day and are based on the previous 24 hours of raw polldata. The data presented in this section of the widget is then updatedwith the latest EWMA value every day.
Displaying the Configuration and Event Timeline:
You can display a timeline showing, for all devices in a selected network view,device configuration changes and network alert data over a time period of up to 24hours using the Configuration and Event Timeline widget. Correlation betweendevice configuration changes and network alerts on this timeline can help youidentify where configuration changes might have led to network issues.
About this task
To display a timeline showing device configuration changes and network alert datafor all devices in a selected network view, proceed as follows:
Procedure
1. Network Health Dashboard2. In the Network Health Dashboard, select a network view from the network
view tree in the Network Views at the top left. The other widgets update toshow information based on the network view that you selected. In particular,the Configuration and Event Timeline updates to show configuration changeand event data for the selected network view. A second tab, called "NetworkView", opens. This tab contains a dashboard comprised of the Network ViewsGUI, the Event Viewer, and the Structure Browser, and it displays the selectednetwork view. You can use this second tab to explore the topology of thenetwork view that you are displaying in the Network Health Dashboard.For information about specifying which network view tree to display in theNetwork Health Dashboard, see “Configuring the network view tree to displayin the Network Health Dashboard” on page 273.
3. In the Configuration and Event Timeline widget, proceed as follows:Configuration changes displayed in the Configuration and Event Timeline canbe any of the following. Move your mouse over the configuration change barsto view a tooltip listing the different types of configuration change made at anytime on the timline.
Note: If you do not have Netcool Configuration Manager installed, then noconfiguration data is displayed in the timeline.
Changes managed by Netcool Configuration ManagerThese changes are made under full Netcool Configuration Managercontrol. The timeline differentiates between scheduled or policy-basedchanges, which can be successful (Applied) or unsuccessful (NotApplied), and one-time changes made using the IDT Audited terminalfacility within Netcool Configuration Manager.
AppliedA successful scheduled or policy-based set of deviceconfiguration changes made under the control of NetcoolConfiguration Manager.
Networks for Operations Insight 271

Not AppliedAn unsuccessful scheduled or policy-based set of deviceconfiguration changes made under the control of NetcoolConfiguration Manager.
IDT Device configuration changes made using the audited terminalfacility within Netcool Configuration Manager that allowsone-time command-line based configuration changes to devices.
Unmanaged changes
OOBCOut-of-band-change. Manual configuration change made todevice where that change is outside of the control of NetcoolConfiguration Manager.
Events are displayed in the timeline as stacked bars, where the color of eachelement in the stacked bar indicates the severity of the corresponding events.Move your mouse over the stacked bars to view a tooltip listing the number ofevents at each severity level. The X-axis granularity for both events andconfiguration changes varies depending on the time range that you select forthe timeline.
Table 31. X axis granularity in the Configuration and Event Timeline
If you select this time range Then the X axis granularity is
6 hours 15 minutes
12 hours 30 minutes
24 hours 1 hour
For more detailed information on the different types of configuration change,see the Netcool Configuration Manager knowledge center athttp://www-01.ibm.com/support/knowledgecenter/SS7UH9/welcome.Select from the following controls to define what data to display in theConfiguration and Event Timeline.
Time Select the duration of the timeline:v 6 Hours: Click to set a timeline duration of 6 hours.v 12 Hours: Click to set a timeline duration of 12 hours.v 24 Hours: Click to set a timeline duration of 24 hours.
Events by Occurrence
v First Occurrence: Click to display events on the timeline based onthe first occurrence time of the events.
v Last Occurrence: Click to display events on the timeline based on thelast occurrence time of the events.
Show TableDisplays the configuration change data in tabular form. The tablecontains the following columns.
Note: If you do not have Netcool Configuration Manager installed,then this button is not displayed.v Number: Serial value indicating the row number.v Device: Host name or IP address of the affected device.
272 IBM Netcool Operations Insight: Integration Guide
v Unit of Work (UoW): In the case of automated NetcoolConfiguration Manager configuration changes, the NetcoolConfiguration Manager unit of work under which this configurationchange was processed.
v Result: Indicates whether the change was successful.v Start Time: The time at which the configuration change began.v End Time: The time at which the configuration change completed.v User: The user who applied the change.v Description: Textual description associated with this change.
Show ChartClick here to switch back to the default graph view.
Note: If you do not have Netcool Configuration Manager installed,then this button is not displayed.
Use the sliders under the timeline to zoom in and out of the timeline. Thelegend under the timeline shows the colors used in the timeline to display thefollowing items:v Event severity values.v Configuration change types.
Note: If the integration with Netcool Configuration Manager has been set upbut there is a problem with data retrieval from Netcool ConfigurationManager, then the configuration change types shown in the legend are
marked with the following icon:
Configuring the Network Health DashboardAs an end user, you can configure the Network Health Dashboard to display thedata you want to see.
Configuring the network view tree to display in the Network HealthDashboard:
As a user of the Network Health Dashboard, you can configure a defaultbookmark to ensure that you limit the data that is displayed in the NetworkHealth Dashboard to the network views within your area of responsibility.
About this task
The network views tree in the Network Health Dashboard automatically displaysthe network views in your default network view bookmark. If there are nonetwork views in your default bookmark, then a message is displayed with a linkto the Network Views GUI, where you can add network views to your defaultbookmark. The network views that you add to your default bookmark will bedisplayed in the network tree within the Network Health Dashboard.
Complete the following steps to add network views to your default bookmark.
Procedure
1. Within the displayed message, click the link that is provided. The NetworkViews GUI opens in a second tab.
Networks for Operations Insight 273
2. Follow the instructions in the following topic in the Network ManagerKnowledge Center: https://www.ibm.com/support/knowledgecenter/SSSHRK_4.2.0/visualize/task/vis_addingnetworkviewstobookmark.html
Results
The network views tree in the Network Health Dashboard displays the networkviews in your newly configured default bookmark.
Configuring the Unavailable Resources widget:
As a user of the Network Health Dashboard, you can configure which availabilitydata is displayed in the Network Health Dashboard by the Unavailable Resourceswidget. For example you can configure the widget to display availability databased on ping polls only, and not based on SNMP polls. You can also configure thetime duration thresholds to apply to availability data displayed in this widget. Forexample, by default the widget charts the number of device and interfaceavailability alerts that have been open for up to 10 minutes, more than 10 minutes,and more than one hour. Yon can change these thresholds.
About this task
To configure which availability data is displayed by the Unavailable Resourceswidget, proceed as follows:
Procedure
1. Network Health Dashboard
2. In the Unavailable Resources widget, click User Preferences .3. To configure the Unavailable Resources widget, use the following checkboxes
and number steppers:
DeviceConfigure which device alerts to monitor in the Unavailable Resourceswidget in order to retrieve information on device availability. Bydefault all of these boxes are checked.
Device PingCheck the box to monitor Default Chassis Ping alerts. Selectingthis option causes the Unavailable Resources widget to providean indication of the number of open device ICMP (ping)polling alerts.
SNMP Poll FailCheck the box to monitor SNMP Poll Fail alerts. Selecting thisoption causes the Unavailable Resources widget to provide anindication of the number of open SNMP Poll Fail alerts.
InterfaceConfigure which interface alerts to monitor in the UnavailableResources widget in order to retrieve information on interfaceavailability. By default all of these boxes are checked.
Interface PingCheck the box to monitor Default Interface Ping alerts.Selecting this option causes the Unavailable Resources widgetto provide an indication of the number of open interface ICMP(ping) polling alerts.
274 IBM Netcool Operations Insight: Integration Guide

Link StateCheck the box to monitor SNMP Link State alerts. Selecting thisoption causes the Unavailable Resources widget to provide anindication of the number of open SNMP Link State alerts.
Thresholds
Upper Specify an upper threshold in hours and minutes. By default,the upper threshold is set to one hour. This threshold causesthe chart in the Unavailable Resources widget to update asfollows: when the amount of time that any availability alert inthe selected network view remains open exceeds the one hourthreshold, then the relevant bar in the Unavailable Resourceschart updates to show this unavailability as a blue color-codedbar section.
Lower Specify a lower threshold in hours and minutes. By default, thelower threshold is set to 10 minutes. This threshold causes thechart in the Unavailable Resources widget to update as follows:when the amount of time that any availability alert in theselected network view remains open exceeds the 10 minutethreshold, then the relevant bar in the Unavailable Resourceschart updates to show this unavailability as a as a pinkcolor-coded bar section.
Configuring the Configuration and Event Timeline:
You can configure which event severity values to display on the Configuration andEvent Timeline.
About this task
To configure which event severity values to display on the Configuration andEvent Timeline:
Procedure
1. Network Health Dashboard
2. In the Configuration and Event Timeline widget, click User Preferences .3. To configure the Configuration and Event Timeline, use the following lists:
Available SeveritiesBy default, lists all event severity values and these event severityvalues are all displayed in the Configuration and Event Timeline.
To remove an item from this list, select the item and click theright-pointing arrow. You can select and move multiple values at thesame time.
Selected SeveritiesBy default, no event severity values are displayed in this list. Moveitems from the Available Severities list to this list to show just thosevalues in the Configuration and Event Timeline. For example, to showonly Critical and Major in the Configuration and Event Timeline, movethe Critical and Major items from the Available Severities list to theSelected Severities list.
Networks for Operations Insight 275

To remove an item from this list, select the item and click theleft-pointing arrow. You can select and move multiple values at thesame time.
Administering the Network Health DashboardPerform these tasks to configure and maintain the Network Health Dashboard forusers.
Before you begin
Device configuration change data can only be displayed in the Configuration andEvent Timeline if the integration with Netcool Configuration Manager has been setup. For more information on the integration with Netcool Configuration Manager,see the following topic in the Network Manager Knowledge Center:https://www.ibm.com/support/knowledgecenter/SSSHRK_4.2.0/install/task/con_configintegrationwithncm.html
About this task
Note: The minimum screen resolution for display of the Network HealthDashboard is 1536 x 864. If your screen is less than this minimum resolution, thenyou will see scroll bars on one or more of the widgets in the Network HealthDashboard.
Configuring the Network Health DashboardAs an administrator, you can configure how data is displayed, and which data isdisplayed in the Network Health Dashboard.
About this task
To fit the quantity of widgets onto a single screen, customers need a minimumresolution of 1536 x 864, or higher.
As an administrator, you can configure the Network Health Dashboard in anumber of ways to meet the needs of your operators.
Changing the layout of the dashboardYou can change the layout of the dashboard. For example, you canreposition, or resize widgets. See the information about Editing dashboardcontent and layout on the Jazz for Service Management Knowledge Center:https://www.ibm.com/support/knowledgecenter/SSEKCU
Change the refresh period for all widgets on the Network Health DashboardThe Network Manager widgets within the Network Health Dashboardupdate by default every 20 seconds. You can change this update frequencyby performing the following steps.
Note: The Event Viewer widget updates every 60 seconds by default.1. Edit the the following configuration file: $NMGUI_HOME/profile/etc/
tnm//nethealth.properties.2. Find the following line and update the refresh period to the desired
value in seconds.nethealth.refresh.period=60
3. Save the file.
276 IBM Netcool Operations Insight: Integration Guide

4. Close and reopen the Network Health Dashboard tab to put thechanges into effect.
Change the colors associated with event severity values used in theConfiguration and Event Timeline
You can update the colors associated with event severity values used in theConfiguration and Event Timeline, by performing the following steps:1. Edit the following configuration file: $NMGUI_HOME/profile/etc/tnm/
status.properties.
2. Find the properties status.color.background.severity_number, whereseverity_number corresponds to the severity number. For example 5corresponds to Critical severity.
3. Change the RGB values for the severity values, as desired.4. Save the file.
Disable launch of the Network View tab when selecting a network view in theNetwork Health Dashboard
When a user selects a network view in the Network Health Dashboard, bydefault a second tab is opened, called "Network View". This tab contains adashboard comprised of the Network Views GUI, the Event Viewer, andthe Structure Browser, and displaying the selected network view. If yournetwork views are very large, then displaying this second tab can have animpact on system performance. To avoid this performance impact, you candisable the launch of the Network View tab by performing the followingsteps:1. Edit the following configuration file: $NMGUI_HOME/profile/etc/tnm/
topoviz.properties.2. Find the following lines:
# Defines whether the dashboard network view tree fires a launchPageevent when the user clicks a view in the treetopoviz.networkview.dashboardTree.launchpage.enabled=true
3. Set the propertytopoviz.networkview.dashboardTree.launchpage.enabled to false.
4. Save the file.
Troubleshooting the Network Health DashboardUse this information to troubleshoot the Network Health Dashboard.
Network Health Dashboard log files:
Review the Network Health Dashboard log files to support troubleshootingactivity.
The Network Health Dashboard log files can be found at the following locations:
Table 32. Locations of Network Health Dashboard log files
File Location
Log file $NMGUI_HOME/profile/logs/tnm/ncp_nethealth.0.log
Trace file $NMGUI_HOME/profile/logs/tnm/ncp_nethealth.0.trace
Networks for Operations Insight 277

Data sources for the Network Health Dashboard widgets:
Use this information to understand from where the Network Health Dashboardwidgets retrieve data. This information might be useful for troubleshooting datapresentation issues in the Network Health Dashboard.
Configuration and Event Timeline widget
This widget is populated by the following integrations:v Tivoli Netcool/OMNIbus integration that analyzes Tivoli Netcool/OMNIbus
events and shows a count based on event severity in a specified period.v Netcool Configuration Manager integration that that retrieves configuration
change distribution.
Percentage Availability widget
The data source for this widget is the historical poll data table pdEwmaForDay. Thewidget displays data from the device poll PingResult from the pdEwmaForDay table,scoped as follows:v Scope is the selected network view if called from the Network Health Dashboardv Scope is the in-context devices or interfaces if called from a right-click command
within a topology map.
Note: The widget is updated only at the end of the hour to which the data applies.
Top Performers widget
The data sources for this widgets are the various historical poll data tables:v pdEwmaForDay
v pdEwmaForWeek
v pdEwmaForMonth
v pdEwmaForYear
The scope of the data is as follows:v Scope is the selected network view if called from the Network Health Dashboardv Scope is the in-context devices or interfaces if called from a right-click command
within a topology map.
Unavailable Resources widget
This widget is populated by a Tivoli Netcool/OMNIbus integration that analyzesTivoli Netcool/OMNIbus events and uses the event data to determine whether adevice or interface is affected, and whether the issue is ICMP or SNMP-based.
278 IBM Netcool Operations Insight: Integration Guide

Investigating data display issues in the Network Health Dashboard:
If any of the widgets in the Network Health Dashboard are not displaying data,either there is no data to display, or there is an underlying problem that needs tobe resolved As an administrator, you can configure poll policies and poll definitionso that users are able to display the data that they need to see in the NetworkHealth Dashboard. You can also explore other potential underlying issues, such asproblems with the underlying systems that process and store historical poll data.
About this task
To configure poll policies, see the following topic in the Network ManagerKnowledge Center: https://www.ibm.com/support/knowledgecenter/SSSHRK_4.2.0/poll/task/poll_creatingpollswithmultiplepolldefinitions.html.
When editing a poll policy editor, the following operations in the Poll Policy Editorare important for determining whether data from the poll policy will be availablefor display in the Network Health Dashboard:
Poll EnabledCheck this option to enable the poll policy.
Store? Check this option to store historical data for the poll policy.
Note: Checking this option will activate the historical poll data storagesystem, which will store large amounts of data on your system. For moreinformation on the historical poll data storage system, see the followingtopic in the Network Manager Knowledge Center: https://www.ibm.com/support/knowledgecenter/SSSHRK_4.2.0/poll/task/poll_administeringstorm.html
Network ViewsIn this tab, ensure that the poll policy is active in the network views thatyou want to monitor in the Network Health Dashboard.
Configure poll policies as follows in order to make data available in the variouswidgets of the Network Health Dashboard.
For information on the different Network Manager poll policies and polldefinitions, see the following topic on the Network Manager Knowledge Center:https://www.ibm.com/support/knowledgecenter/SSSHRK_4.2.0/ref/reference/ref_pollingref.html
Unavailable Resources widgetConfigure the following poll policies in order to make data available in theUnavailable Resources widget:
Table 33. Unavailable Resources widget: which poll policies to configure
If you want to show response data for
Then ensure that one or more of thefollowing poll policies is enabled inthe appropriate network views
Chassis devices based on ping polling Any poll policy that uses one or morechassis ping poll definitions. Anexample of a poll policy of this typeis the Default Chassis Ping poll policy
Networks for Operations Insight 279

Table 33. Unavailable Resources widget: which poll policies to configure (continued)
If you want to show response data for
Then ensure that one or more of thefollowing poll policies is enabled inthe appropriate network views
Interfaces based on ping polling Any poll policy that uses one or morechassis ping poll definitions. Anexample of a poll policy of this typeis the Default Interface Ping pollpolicy.
Chassis devices based on SNMP polling Any poll policy that uses one or moreSNMP poll definitions. An example ofa poll policy of this type is thesnmpInBandwidth poll policy.
Interfaces based on SNMP polling SNMP Link State poll policy.
Percentage Availability widgetEnable the Default Chassis Ping poll policy in order to display overallchassis availability data in the Percentage Availability widget.
Top Performers widget
Metrics in the Top Performers widgetTo show a specific metric in the Top Performers widget Metricdrop-down list, you must enable the poll policy that contains apoll definition related to that metric. Alternatively, create a newpoll definition and add it to an enabled poll policy.
Note: These must be poll definition that can be stored and thatfalls into one of the following types:v Basic thresholdv Pingv SnmpLinkState
For example, using the default poll policies and poll definitionsprovided with Network Manager, here are examples of pollpolicies to enable and the corresponding metric that will be madeavailable in the Metric drop-down list:
Table 34. Top Performers widget: examples of poll policies to configure
To display this metric Enable this poll policyWhich contains this polldefinition
ifInDiscards ifInDiscards ifInDiscards
ifOutDiscards ifOutDiscards ifOutDiscards
snmpInBandwidth snmpInBandwidth snmpInBandwidth
Historical poll data in the Top Performers widgetYou can display historical poll data for a metric in the TopPerformers widget by clicking the Last Day, Last Week, LastMonth, and Last Year buttons. To collect historical poll data todisplay in this way, you must select the option to store historicaldata for the related poll definition related to the metric. Forexample, using the default poll policies and poll definitionsprovided with Network Manager, here are examples of polldefinitions to configure.
280 IBM Netcool Operations Insight: Integration Guide

Note: Historical data will only be viewable in the Top Performersonce it has been collected, processed, and stored in theNCPOLLDATA database. For example, if at the time of reading thisyou had selected the option to store poll data for a poll definitionone month ago, then you will only see one month's worth of datain the Last Year option.
Table 35. Top Performers widget: examples of poll definitions to configure
To display historical data forthis metric
Select the Store? option forthis poll definition Within this poll policy
ifInDiscards ifInDiscards ifInDiscards
ifOutDiscards ifOutDiscards ifOutDiscards
snmpInBandwidth snmpInBandwidth snmpInBandwidth
Important: If you have correctly configured storage of historicalpoll data for the metrics you are interested in, but when you clickany of the Last Day, Last Week, Last Month, and Last Yearbuttons you are not seeing any data, then there might be aproblem with the underlying systems that process and storehistorical poll data. In particular, the Apache Storm system thatprocesses historical poll data, might not be running, or ApacheStorm might have lost connection to the NCPOLLDATA database,where historical poll data is stored. For more information, see thefollowing topic in the Network Manager Knowledge Center:https://www.ibm.com/support/knowledgecenter/SSSHRK_4.2.0/poll/task/poll_administeringstorm.html
Configuration and Event TimelineIf a configuration with Netcool Configuration Manager was set up atinstallation time, but configuration change data does not appear in theConfiguration and Event Timeline this might be due to integration issues.For more information on the integration with Netcool ConfigurationManager, see the following topic in the Network Manager KnowledgeCenter: https://www.ibm.com/support/knowledgecenter/SSSHRK_4.2.0/install/task/con_configintegrationwithncm.html
Top Performers widget is unable to display values greater than 32 bit:
The Top Performers widget is unable to display values greater than 32 bit. If nodata is being displayed in the Top Performers widget for a selected metric, thenthis might be due to a number of factors. One possibility is that the value of datain that metric is greater than 32 bit.
If no data is being displayed in the Top Performers widget for a selected metric,then run the following SQL query to determine if there is an error, and if, what theerror code is.SELECT errorcode, value, datalabelFROM ncpolldata.polldata pdINNER JOIN ncpolldata.monitoredobject mo ON mo.monitoredobjectid= pd.monitoredobjectidWHERE datalabel =poll_of_interest
Error codes are listed in the ERROR_CODE values inKNP_POLL_DATA_COLLECTION Support document, at the following location:http://www.ibm.com/support/docview.wss?uid=swg21422092. The error code 112
Networks for Operations Insight 281

indicates that metric contains a polled value that was greater than can be stored ina 32-bit integer field.
Percentage Availability widget takes a long time to refresh:
If the Percentage Availability widget is taking a long time to refresh then onepossible solution is to increase the number of threads available for this widget.This solution is most suitable for customers with large networks.
About this task
Increase the number of threads available by performing the following steps:
Procedure
1. Edit the the following configuration file: $NMGUI_HOME/profile/etc/tnm//nethealth.properties.
2. Find the following lines:## Widget thread count for availability widgetnethealth.threads.availability=5
3. Increase the value of the nethealth.threads.availability property. Themaximum possible value is 10.
4. Save the file.
Developing custom dashboardsYou can create pages that act as "dashboards" for displaying information on thestatus of parts of your network or edit existing dashboards, such as the NetworkHealth Dashboard. You can select from the widgets that are provided withNetwork Manager, Tivoli Netcool/OMNIbus Web GUI, and also from otherproducts that are deployed in your Dashboard Application Services Hubenvironment.
About this task
For information on creating and editing pages in the Dashboard ApplicationServices Hub, see the Jazz for Service Management information center athttps://www.ibm.com/support/knowledgecenter/SSEKCU.
Before you begin
v– Determine which widgets you want on the page.– If you want a custom Web GUI gauge on the page, develop the metric that
will feed the gauge display.– Decide which users, groups, or user roles you want to have access to the page
and assign the roles accordingly.– If you want the widgets to communicate in a custom wire, develop the wires
that will control the communications between the widgets.Related concepts:“Network Management tasks” on page 16
282 IBM Netcool Operations Insight: Integration Guide

Displaying an event-driven view of the networkYou can configure a dashboard to contain a Dashboard Network Views widget andother widgets that are driven by network alert data. Under the configurationdescribed here, when a user clicks a node in the network view tree in theDashboard Network Views widget, the other widgets in the dashboard update toshow data based on events for entities in the selected network view. Thisdashboard is useful for network operations centers that want to see the real-timesituation on the network, as it provides a real-time view of network alerts and ofthe availability of devices and interfaces. No historical polling data is used by anyof the widgets in this dashboard, so this provides an alternative to the NetworkHealth Dashboard if polling data is not being stored.
Before you begin
Depending on the requirements you have of the page, perform some or all of thetasks described in “Developing custom dashboards” on page 282.
About this task
To develop a page that wires a Dashboard Network Views widget and otherwidgets that are driven by network alert data:
Procedure1. Log in as a user that has the iscadmins role.2. Create the page, assign it to a location in the navigation, and specify the roles
that users need to view the page. The default location is Default, and in thistask it is assumed that this default location is used. If you use a differentlocation, then substitute your chosen location wherever you see the locationDefault used in this task.
3. Add the Dashboard Network Views widget to the page.4. Add the Configuration and Event Timeline to the page. If you have configured
the Network Manager integration with Netcool Configuration Manager thenthis widget displays a timeline up to a period of 24 hours, showingconfiguration change data and event data by first occurrence of the event. Ifyou have not set up the integration, then the widget still displays event data onthe timeline.
5. Add the Unavailable Resources widget to the page. This widget displays howmany devices and interfaces within the selected network view are unavailable.
6. Add the Event Viewer to the page.7. Click Save and Exit to save the page.
Note: This page does not requires any wires. The Dashboard Network Viewswidget automatically broadcasts the NodeClickedOn event, and the otherwidgets automatically subscribe to this event and update their data accordingly.
Results
You can now click a network view in the network view tree in the DashboardNetwork Views widget and the other widgets automatically update to show eventdata:v The Unavailable Resources widget displays a bar chart showing how many
devices and interfaces within the selected network view are unavailable. Theexact data shown in this widget depends on whether the following poll policiesare enabled:
Networks for Operations Insight 283

– Devices: Default Chassis Ping and SNMP Poll Fail poll policies must beenabled.
– Interfaces: Default Interface Ping and SNMP Link State poll policies must beenabled.
v The Configuration and Event Timeline displays a timeline showing events byfirst occurrence, and, if the Netcool Configuration Manager integration isconfigured, configuration change data, for all entities in the network view.
v The Event Viewer shows events for all entities in the network view.
Note: Clicking a bar in the Unavailable Resources widget further filters theEvent Viewer to show only the availability events related to the devices orinterfaces in that bar.
Displaying and comparing top performer data for entities in anetwork viewCreate a dashboard containing multiple Top Performers widgets to enable you tocompare historical poll data across multiple entities and metrics in a selectednetwork view. This dashboard is particularly useful for background investigationand analysis in order to determine how devices and interfaces are performing overtime and whether there are any underlying issues.
Before you begin
Depending on the requirements you have of the page, perform some or all of thetasks described in “Developing custom dashboards” on page 282.
About this task
To develop a page that wires a Network Views widget and multiple TopPerformers widgets to enable you to compare historical poll data across multipleentities and metrics in a selected network view:
Procedure1. Log in as a user that has the iscadmins role.2. Create the page, assign it to a location in the navigation, and specify the roles
that users need to view the page. The default location is Default, and in thistask it is assumed that this default location is used. If you use a differentlocation, then substitute your chosen location wherever you see the locationDefault used in this task.
3. Add the Network Views widget to the page.4. Add two Top Performers widgets to the page.
Note: Adding two Top Performers widgets enables you to perform basiccomparisons, such as displaying metric traces on the same device or interfaceover two different time periods. You can add more than two Top Performerswidgets, and this will provide the ability to perform comparisons across awider range of data; for example, adding four Top Performers widgets enablesyou to display metric traces on the same device or interface over four differenttime periods.
5. Click Save and Exit to save the page.
Note: This page does not requires any wires. The Network Views widgetautomatically broadcasts the NodeClickedOn event, and the other widgetsautomatically subscribe to this event and update their data accordingly.
284 IBM Netcool Operations Insight: Integration Guide

What to do next
You can use this dashboard to compare metric traces or charts.
Example: comparing metric traces on the same device or interface over differenttime periods:
Use the custom dashboard that contains the two Top Performers widgets tocompare metric traces on the same device or interface over different time periods;for example, you might see a spike in the current raw data trace for a metric suchas snmpInBandwidth on a specific interface. To determine if this is just an isolatedspike or a more serious ongoing issue, you can, on the same dashboard, alsodisplay a trace for the same snmpInBandwidth metric on the same interface over alonger time period, such as the last day or last week, and then visually determineif there have been continual incidences of high snmpInBandwidth on this interfaceover the last day or week.
About this task
To use the dashboard to compare metric traces on the same device or interfaceover different time periods, proceed as follows:
Procedure
1. In the Network Views widget, select a network view. The two Top Performerswidgets update to show data for the selected network view.
2. From each of the Top Performers widgets, click the Metric drop-down list andselect a metric of interest; for example snmpInBandwidth. Select the samemetric on both Top Performers widgets; this ensures that the top entity in bothchart is always the same.
3. In one of the Top Performers widgets, click the top bar to show the trace forthe entity with the top value in that chart. This displays a time-based trace ofcurrent raw data for the snmpInBandwidth metric.
4. In the other Top Performers widget, click the top bar to show the trace for theentity with the top value in that chart. You are now showing the identical timetrace in both widgets.
5. In the second Top Performers widget, change the timeframe; for example, clickLast Day. You are now showing a current raw data trace of snmpInBandwidthdata in the first widget, and a trace of the last day's worth ofsnmpInBandwidth data for the same interface in the second widget, and youcan compare the more transient raw data in the first widget with data averagesover last day.
Example: comparing different metric traces on the same device or interface:
Use the custom dashboard that contains the two Top Performers widgets tocompare different metric traces on the same device or interface; for example, youmight see a number of incidences of high snmpInBandwidth on a specific interfaceover the last day. To determine if the high incoming SNMP bandwidth usage onthis interface is affecting the outgoing SNMP bandwidth usage on that sameinterface, you can, on the same dashboard, also display a trace for thesnmpOutBandwidth metric on the same interface and also over the last day, andthen visually compare the two traces.
Networks for Operations Insight 285

About this task
To use the dashboard to compare different metric traces on the same device orinterface, proceed as follows:
Procedure
1. In the Network Views widget, select a network view.2. From each of the Top Performers widgets, click the Metric drop-down list and
select a metric of interest; for example snmpInBandwidth. Select the samemetric on both Top Performers widgets; this ensures that the top entity in bothchart is always the same.
3. In one of the Top Performers widgets, click the top bar to show the trace forthe entity with the top value in that chart. This displays a time-based trace ofcurrent raw data for the snmpInBandwidth metric.
4. In the other Top Performers widget, click the top bar to show the trace for theentity with the top value in that chart. You are now showing the identical timetrace in both widgets.
5. In the second Top Performers widget, click the Metric drop-down list andselect snmpOutBandwidth. You are now displaying a trace of incoming SNMPbandwidth usage on the interface with the highest incoming SNMP bandwidthusage in the network view on one widget, and a trace of outgoing SNMPbandwidth usage on that same interface. You can now visually compare thetwo traces to see if there is any correlation.
Example: comparing different Top 10 metric charts:
Use the custom dashboard that contains the two Top Performers widgets tocompare different Top 10 metric charts. This enables you to see the potentialimpact of one metric on another across the devices that are showing the highestperformance degradation on the first metric. For example, you might want tocompare the chart showing those devices showing the highest ten incoming SNMPbandwidth usage values, with the chart showing those devices showing the highestten outgoing SNMP bandwidth usage values.
About this task
To use the dashboard to compare different Top 10 metric charts, proceed asfollows:
Procedure
1. In the Network Views widget, select a network view.2. In one of the Top Performers widgets, click the Metric drop-down list and
select a metric of interest; for example snmpInBandwidth. The Top Performerswidget updates to show a bar chart of the ten interfaces in the network viewwith the highest incoming SNMP bandwidth usage values.
3. In the other Top Performers widget, click the Metric drop-down list and selecta second metric of interest; for example snmpOutBandwidth. The TopPerformers widget updates to show a bar chart of the ten interfaces in thenetwork view with the highest outgoing SNMP bandwidth usage values.
Results
You can now compare the two charts to see if there is any correlation between thedata.
286 IBM Netcool Operations Insight: Integration Guide

Displaying network view event data in a gauge groupYou can use wires to configure a Network Views widget and a DashboardApplication Services Hub gauge group to pass data between each other. Under theconfiguration described here, when a user clicks a node in the network view treein the Network Views widget, the gauge group updates to show a number ofstatus gauges: you can configure as many status gauges as desired. In the exampledescribed here, three gauges are configured: Severity 3 (minor), Severity 4 (major),and Severity 5 (critical), together with a number within each status gaugeindicating how many events at that severity are currently present on the devices inthat network view. The instructions in this topic describe a possible option forwiring the two widgets.
Before you begin
Depending on the requirements you have of the page, perform some or all of thetasks described in “Developing custom dashboards” on page 282.
About this task
To develop a page that wires a Network Views widget and a DashboardApplication Services Hub gauge group:
Procedure1. Log in as a user that has the iscadmins role.2. Create the page, assign it to a location in the navigation, and specify the roles
that users need to view the page. The default location is Default, and in thistask it is assumed that this default location is used. If you use a differentlocation, then substitute your chosen location wherever you see the locationDefault used in this task.
3. Add the Network Views widget to the page.4. Add the Dashboard Application Services Hub gauge group to the page.5. Edit the gauge group widget.6. Select a dataset for the gauge group. In the Gauge Group: Select a Dataset
window, search for the Netcool/OMNIbus WebGUI > All data > FilterSummary dataset. One way to do this is as follows:a. In the search textbox at the top left of the Gauge Group: Select a Dataset
window, type filter.b. Click Search. This search retrieves two Filter Summary datasets.c. Select the dataset that has a provider title labeled Provider:
Netcool/OMNIbus WebGUI > Datasource: All data.7. Configure how you want the gauge group to be displayed. In the Gauge
Group: Visualization Settings window, add three value status gauges byperforming the following steps:.a. Click Choose Widget and select ValueStatus Gauge from the drop-down
list. Then click Add
b. Add two more ValueStatus Gauge widgets, following the instruction inthe previous step.
There should now be three ValueStatus Gauge widgets listed in the SelectedWidgets list.
8. Configure the three value status gauges to show the following:
Networks for Operations Insight 287

v First value status gauge will display the number of Severity 3 (minor)
events, within the Severity 3 (minor) symbol, .v Second value status gauge will display the number of Severity 4 (major )
events, within the Severity 4 (major) symbol, .v Third value status gauge will display the number of Severity 5 (critical)
events, within the Severity 5 (critical) symbol, .
Perform the following steps to configure the Severity 3 (minor) value statusgauge:a. Select the first value status gauge item in the Selected Widgets list.b. Click Required Settings.c. Click the Value drop-down list and select Severity 3 Event Count from the
drop-down list.d. Click Optional Settings.e. Click the Label above Gauge drop-down list and select Severity 3 Event
Count Name from the drop-down list.
f. In the Minor spinner set a threshold value of 0 by typing 0. Thisthreshold value causes any number of Severity 3 (minor) events to generatea Severity 3 value status gauge.
Perform the following steps to configure the Severity 4 (major) value statusgauge:a. Select the first value status gauge item in the Selected Widgets list.b. Click Required Settings.c. Click the Value drop-down list and select Severity 4 Event Count from the
drop-down list.d. Click Optional Settings.e. Click the Label above Gauge drop-down list and select Severity 4 Event
Count Name from the drop-down list.
f. In the Major spinner set a threshold value of 0 by typing 0. Thisthreshold value causes any number of Severity 4 (major) events to generatea Severity 4 value status gauge.
Perform the following steps to configure the Severity 5 (critical) value statusgauge:a. Select the first value status gauge item in the Selected Widgets list.b. Click Required Settings.c. Click the Value drop-down list and select Severity 5 Event Count from the
drop-down list.d. Click Optional Settings.e. Click the Label above Gauge drop-down list and select Severity 5 Event
Count Name from the drop-down list.
f. In the Critical spinner set a threshold value of 0 by typing 0. Thisthreshold value causes any number of Severity 5 (critical) events togenerate a Severity 5 value status gauge.
9. Click Save and Exit to save the page.10. From the page action list, select Edit Page.
288 IBM Netcool Operations Insight: Integration Guide

11. Click Show Wires and then, in the Summary of wires section of thewindow. click New Wire.
12. Specify the wires that connect the Network Views widget to the DashboardApplication Services Hub gauge group.v In the Select Source Event for New Wire window, click Network Views >
NodeClickedOn, and then click OK.v In the Select Target for New Wire window, click Default > This page
name_of_page > Event Viewer , where name_of_page is the name of the pagethat you created in step 2.
v In the Transformation window, select Show Gauge Events, and then clickOK
13. Close the Summary of wires section of the window by clicking the X symbolat the top right corner.
14. Click Save and Exit to save the page.
Results
You can now click a network view in the network view tree in the Network Viewswidget and have the gauge group update to show three status values: Severity 3(minor), Severity 4 (major), and Severity 5 (critical), together with a number withineach status gauge indicating how many events at that severity are currentlypresent on the devices in the selected network view.
Event information for Network Health Dashboard widgetsRefer to this table to get information about the publish events and subscribe eventsfor Network Health Dashboard widgets. Use this event information when youcreate a new custom widget and you want to wire your custom widget with anexisting Network Health Dashboard widget.
Table 36. Event information for Network Health Dashboard widgets
Widget name Event type Event name Event description
Configuration andEvent Timeline
Subscribe event NodeClickedOn Subscribes to aNodeClickedOn eventand displays databased on the eventsViewId and thedatasource.
PercentageAvailability
Subscribe event NodeClickedOn Subscribes to aNodeClickedOn eventand displays databased on the eventsViewId and thedatasource.
Network ManagerPolling Chart
Subscribe event NodeClickedOn Subscribes to aNodeClickedOn eventand displays databased on the eventsViewId and thedatasource.
Networks for Operations Insight 289

Table 36. Event information for Network Health Dashboard widgets (continued)
Widget name Event type Event name Event description
UnavailableResources
Publish event showEvents Click a bar in thedisplayed graph andthe widget publishesa showEvents eventthat contains thename of the transientfilter.
Subscribe event NodeClickedOn Subscribes to aNodeClickedOn eventand displays databased on the eventsViewId and thedatasource.
Device DashboardUse the Device Dashboard to troubleshoot network issues by navigating thenetwork topology and seeing performance anomalies and trends on any device,link, or interface.
The content of the Device Dashboard varies depending on whether you installedNetwork Performance Insight.v If Network Performance Insight is installed, then the Device Dashboard includes
the Performance Insights widget. The Performance Insights widget showsperformance measure values, anomalies, and trends for the selected entity. Formore information, see “Monitoring performance data” on page 291.
v If Network Performance Insight is not installed, then the Device Dashboard doesnot include the Performance Insights widget. Instead, it displays the TopPerformers widget, showing performance measure values only for the selectedentity. For more information, see “Displaying highest and lowest performers in anetwork view” on page 268.
Related tasks:“Installing the Device Dashboard” on page 95
Troubleshooting network issues using the Device DashboardUse the Device Dashboard to troubleshoot any network issue on a device, link, orinterface.
Starting the Device DashboardYou can start the Device Dashboard from an event in the Event Viewer, from adevice in the Network Views, Network Hop View, or Path Views. You can alsostart the Device Dashboard from the Top Performers widget within the NetworkHealth Dashboard.
About this task
Open the Device Dashboard using one of the following options:v Open the Device Dashboard from the Top Performers widget in the Network
Health Dashboard, by completing one of the following tasks.– Press Ctrl and click a bar in the Chart view.– Click an entity name in the Table view.
290 IBM Netcool Operations Insight: Integration Guide
The Device Dashboard opens in a new Dashboard Application Services Hub tab.The Device Dashboard opens in the context of the device or interface that isassociated with the element that you clicked.
v Open the Device Dashboard from any of the topology GUIs. Right-click a device,link, or interface and click Performance Insight > Show Device Dashboard.The topology GUIs include the Network Hop View, Network Views, Path ViewsGUI, and Structure Browser.The Device Dashboard opens in a new tab, in the context of the device, link, orinterface associated with the element that you clicked.
v To open the Device Dashboard from the Event Viewer, right-click an event andclick Performance Insight > Show Device Dashboard.The Device Dashboard opens in a new tab, in the context of the device orinterface that is associated with the element that you clicked.
Changing Device Dashboard focusYou can change the Device Dashboard focus to a different device or link.
Procedure1. To switch focus to a device, click the device in the Device tab in the Topology
widget. If the device is not shown in the Topology widget, complete thefollowing steps.a. Search for the device by using the Network Hop View search feature. For
more information, see https://www.ibm.com/support/knowledgecenter/SSSHRK_4.2.0/visualize/task/vis_searchfordevices.html. The Topologywidget is updated to center on the device that is selected in the searchresults.
b. In the Topology widget, click the device of interest.2. To switch focus to a link, click the link in the Device tab in the Topology
widget. If the link is not shown in the Topology widget, complete the followingsteps.a. Search for a device at one end of the link by using the Network Hop View
search feature. For more information, see https://www.ibm.com/support/knowledgecenter/SSSHRK_4.2.0/visualize/task/vis_searchfordevices.html.The Topology widget is updated to center on the device that is selected inthe search results.
b. In the Topology widget, click the link of interest.
Results
All the widgets on the Device Dashboard update to show data for the device,interface, or link.
Monitoring performance dataYou can monitor performance metrics for a device, link, or interface using thePerformance Insights widget within the Device Dashboard.
Procedure1. Launch the Device Dashboard as described in “Starting the Device Dashboard”
on page 290.2. Ensure that the device, link, or interface of interest is selected. To change the
dashboard context, see “Changing Device Dashboard focus.”3. In the Performance Insights widget, proceed as follows:
Networks for Operations Insight 291

Select from the following controls to display performance metric values,anomalies, and trends in the Performance Insights widget.
Note: Performance anomalies are determined based on the application of staticthresholds to performance data. Anomaly detection is an early warning systemthat indicates that a device, interface, or link, needs attention.
SeverityThis takes the form of a square in a color that indicates the anomalyseverity for this performance metric.v Red: indicates a higher severity anomaly.v Orange: indicates a lower severity anomaly.v Green: no anomaly.
Links For each link displays the NCIM topology database entity identifiers ofthe devices at either end of the link. Roll over this field for more detailsof the devices, such as hostname and IP address.
ConnectionsWithin each link, lists the connections that make up the link. Eachconnection is identified using the NCIM topology database entityidentifiers of the interfaces at either end of the link. Roll over this fieldfor more details of the interfaces, such as interface name, and interfacedescription.
DevicesThis tab contains performance data for the devices that you selected inthe Topology portlet. If you selected interfaces, it shows the devicesthat contain them. If you selected links, it shows the devices at eitherend.
If there are performance anomalies associated with any of the metrics,then the number of the worst severity metrics is shown in a coloredsquare in the tab header.v A number in a red square indicates that there are higher severity
metrics, and indicates the number of higher severity metrics. If a redsquare is showing, there might also be lower severity metrics.
v A number in an orange square indicates that there are lower severitymetrics, but no higher severity metrics, and indicates the number oflower severity metrics.
Filter Type any string to filter the rows displayed in the table.
DeviceLists the device or devices selected in the Topology widget.Expand the device node to see the metrics associated with thedevice.
Metric Lists the performance metrics available for the associateddevice.
Last 30 MinutesDisplays a sparkline showing the trend of the performancemetric over the last 30 minutes. The current value is shownusing a colored dot at the end of the sparkline. The color of thedot indicates whether there is an anomaly associated with thisperformance metric.v Red: indicates a higher severity anomaly.v Orange: indicates a lower severity anomaly.
292 IBM Netcool Operations Insight: Integration Guide

v Black: no anomaly.
SeverityBullet graph, showing a central bar in a color that indicates theanomaly severity. The thresholds that have been applied to theperformance metric are shown in different levels of grayshading in the wider bar. The color of the central bar specifiesthe anomaly severity.v Red: indicates a higher severity anomaly.v Orange: indicates a lower severity anomaly.v Black: no anomaly.
Value Indicates the value of the performance metric based on themost recent poll action.
Links This tab contains performance metric anomaly and trend data for oneor more links. In particular, it displays data for each connection on eachof the selected links.
Note: The Links tab only appears if you selected one or more links inthe Topology widget.
If there are performance anomalies associated with any of the metrics,then the number of the worst severity metrics is shown in a coloredsquare in the tab header.v A number in a red square indicates that there are higher severity
metrics, and indicates the number of higher severity metrics. If a redsquare is showing, there might also be lower severity metrics.
v A number in an orange square indicates that there are lower severitymetrics, but no higher severity metrics, and indicates the number oflower severity metrics.
Filter Type any string to filter the rows displayed in the table.
Links For each link displays the NCIM topology database entityidentifiers of the devices at either end of the link. Roll over thisfield for more details of the devices, such as hostname and IPaddress.
ConnectionsWithin each link, lists the connections that make up the link.Each connection is identified using the NCIM topologydatabase entity identifiers of the interfaces at either end of thelink. Roll over this field for more details of the interfaces, suchas interface name, and interface description.
Metric Lists the performance metrics available for the associatedconnection.
Last 30 MinutesDisplays a sparkline showing the trend of the performancemetric over the last 30 minutes. The current value is shownusing a colored dot at the end of the sparkline. The color of thedot indicates whether there is an anomaly associated with thisperformance metric.v Red: indicates a higher severity anomaly.v Orange: indicates a lower severity anomaly.v Black: no anomaly.
Networks for Operations Insight 293

SeverityBullet graph, showing a central bar in a color that indicates theanomaly severity. The thresholds that have been applied to theperformance metric are shown in different levels of grayshading in the wider bar. The color of the central bar specifiesthe anomaly severity.v Red: indicates a higher severity anomaly.v Orange: indicates a lower severity anomaly.v Black: no anomaly.
Value Indicates the value of the performance metric based on themost recent poll action.
InterfacesDepending on the selection in the Topology widget, this tab containsperformance data for the following interfaces:
If you selected in theTopology widget
Then this tab displaysperformance metric anomalyand trend data for For more information, see
One or more devices All the interfaces on thesedevices.
Interfaces tab: Content whena device or interface isselected in the Topologywidget
One or more interfaces The selected interfaces.
One or more links The interfaces at either endof the connections that makeup these links.
Interfaces tab: Content whena link is selected in theTopology widget
If there are performance anomalies associated with any of the metrics,then the number of the worst severity metrics is shown in a coloredsquare in the tab header.v A number in a red square indicates that there are higher severity
metrics, and indicates the number of higher severity metrics. If a redsquare is showing, there might also be lower severity metrics.
v A number in an orange square indicates that there are lower severitymetrics, but no higher severity metrics, and indicates the number oflower severity metrics.
If there is performance data associated with the interface, you can viewit by opening the Traffic Details widget in a new tab. Right-click aninterface and select Show Traffic Details.
Interfaces tab: Content when a device or interface is selected in theTopology widget
Filter Type any string to filter the rows displayed in the table.
Metric Drop-down list that lists all of the metrics available onthe selected interfaces.
DeviceLists the device or devices that contain the interfacesselected in the Topology widget. Expand the devicenode to see the all the interfaces in that device andassociated status and metric data.
294 IBM Netcool Operations Insight: Integration Guide

InterfaceInterface name of the selected interfaces or of theinterfaces on the selected devices.
Metric Performance metric selected from the Metricdrop-down list.
Last 30 MinutesDisplays a sparkline showing the trend of theperformance metric over the last 30 minutes. Thecurrent value is shown using a colored dot at the endof the sparkline. The color of the dot indicates whetherthere is an anomaly associated with this performancemetric.v Red: indicates a higher severity anomaly.v Orange: indicates a lower severity anomaly.v Black: no anomaly.
SeverityBullet graph, showing a central bar in a color thatindicates the anomaly severity. The thresholds that havebeen applied to the performance metric are shown indifferent levels of gray shading in the wider bar. Thecolor of the central bar specifies the anomaly severity.v Red: indicates a higher severity anomaly.v Orange: indicates a lower severity anomaly.v Black: no anomaly.
Value Indicates the value of the performance metric based onthe most recent poll action.
Interfaces tab: Content when a link is selected in the Topologywidget
Filter Type any string to filter the rows displayed in the table.
Links For each link displays the NCIM topology databaseentity identifiers of the devices at either end of the link.Roll over this field for more details of the devices, suchas hostname and IP address.
ConnectionsWithin each link, lists the connections that make up thelink. Each connection is identified using the NCIMtopology database entity identifiers of the interfaces ateither end of the link. Roll over this field for moredetails of the interfaces, such as interface name, andinterface description.
DeviceSpecifies the device at each end of the connection.
InterfaceSpecifies the interface at each end of the connection.
Metric Performance metric selected from the Metricdrop-down list.
Last 30 MinutesDisplays a sparkline showing the trend of the
Networks for Operations Insight 295

performance metric over the last 30 minutes. Thecurrent value is shown using a colored dot at the endof the sparkline. The color of the dot indicates whetherthere is an anomaly associated with this performancemetric.v Red: indicates a higher severity anomaly.v Orange: indicates a lower severity anomaly.v Black: no anomaly.
SeverityBullet graph, showing a central bar in a color thatindicates the anomaly severity. The thresholds that havebeen applied to the performance metric are shown indifferent levels of gray shading in the wider bar. Thecolor of the central bar specifies the anomaly severity.v Red: indicates a higher severity anomaly.v Orange: indicates a lower severity anomaly.v Black: no anomaly.
Value Indicates the value of the performance metric based onthe most recent poll action.
Displaying performance timelinesYou can view performance metrics for a device, link, or interface in thePerformance Timeline portlet in the Device Dashboard.
About this task
To display performance timelines, complete the following steps.
Procedure1. Start the Device Dashboard as described in “Starting the Device Dashboard” on
page 290.2. Ensure that the device, link, or interface of interest is selected. To change the
dashboard context, see “Changing Device Dashboard focus” on page 291.3. In the Performance Insights portlet, click the sparkline that is associated with
the metric for which you want to display a timeline.You might need to change to a different tab, for example, to the Interfaces tab,to find the metric that you want.The Performance Timeline portlet updates and displays a timeline of theperformance metric that you clicked.The last 30 minutes of data are displayed on the upper timeline. By default, thelast 12 hours of data are displayed on the lower timeline, which is called theviewfinder. You can configure the amount of data that is displayed in theviewfinder by updating the portlet configuration settings. The window in theviewfinder indicates which section of the longer timeline is being displayed inthe upper timeline.
4. Optional: Investigate the performance data by performing the following actions.v To display a different time window, click in the viewfinder.The timeline
updates to display the time period that you clicked.v To display a larger or smaller time window, drag the handles of the
viewfinder window inwards or outwards. By default, the time period is 30minutes.
296 IBM Netcool Operations Insight: Integration Guide

v To view extra information about a particular point, hover over the point inthe timeline.
Displaying traffic data on an interfaceYou can display data about the traffic that is flowing through an interface byopening the Traffic Details portlet from an interface in the Performance Insightsportlet.
About this task
To display traffic data for an interface, complete the following steps.
Procedure1. Start the Device Dashboard as described in “Starting the Device Dashboard” on
page 290.2. Click the device of interest in the Device tab in the Topology portlet.3. Click the Interfaces tab in the Performance Insights portlet.4. Right-click an interface of interest and select Show Traffic Details.
Results
The TrafficDetails portlet in Network Performance Insight opens, and shows trafficinformation for the selected interface.
Configuring the Performance Insights widgetBoth administrators and end users can configure the Performance Insights widgetwithin the Device Dashboard.
About this task
To configure the Performance Insights widget, perform the following steps.
Procedure
1. In the Performance Insights widget, click Edit Preferences .2. To configure communication between the Performance Insights widget and
Network Performance Insight, use the following controls:
NPI HostnameSpecify the hostname of Network Performance Insight server thatprovides performance data for this widget.
Important: You must only ever change this setting based oninstructions from a system administrator.
Port Specify the port on the Network Performance Insight host. This isusually either 8080 or 9443.
3. To configure presentation and refresh of data on the Performance Insightswidget, use the following controls:
Time PeriodSpecify how many minutes of sparkline data to display for eachperformance metric in the Performance Insights widget. Default valueis 30 minutes.
Networks for Operations Insight 297

Refresh RateSpecify how often to refresh the data in the Performance Insightswidget. Default value is 60 seconds.
4. Click OK.
Configuring thresholdsYou can configure thresholds that determine when anomalies or events are raised.
About this task
You can configure traffic flow thresholds, which raise Tivoli Netcool/OMNIbusevents when the thresholds are breached. Traffic flow thresholds use data fromNetwork Performance Insight.
You can configure anomaly thresholds for performance measures. Anomalythresholds use data from Network Manager.
Defining traffic flow thresholdsYou can view details about the traffic flowing across an interface in the TrafficDetails portlet. This feature is available only for interfaces on which traffic flow isenabled.
About this task
You can view details about the traffic flowing across an interface by opening theTraffic Details portlet from the Interfaces tab in the Performance Insights portlet.Right-click an interface that has traffic flow enabled and select Show TrafficDetails.
To view the flow data, you must first enable one or more devices to capture flowdata, and configure one or more interfaces on those devices to capture flow data.Optionally, configure traffic flow thresholds to raise Netcool/OMNIbus eventswhen the thresholds are breached.
Flow protocols vary between router providers. For example, Cisco uses theNetFlow protocol. Flow is usually enabled on key interfaces, to avoid using largeamounts of resources. Flow data is stored by Network Performance Insight. TheTraffic Details portlet is a Network Performance Insight portlet.
To enable traffic flow on interfaces, complete the following steps.
Procedure1. Enable the collection of flow data on the devices of interest, using the
appropriate protocol. For more information, see the following topics in theNetwork Performance Insight Knowledge Center:
v 1.4.1.1 Network Performance Insight V1.2.2: Configuring flow devicesv Network Performance Insight V1.2.1: Configuring flow devices
2. Configure the collection of flow data on the interfaces of interest. For moreinformation, see the following topics in the Network Performance InsightKnowledge Center:
v 1.4.1.1 Network Performance Insight V1.2.2: Configuring flow interfacesv Network Performance Insight V1.2.1: Configuring flow interfaces
298 IBM Netcool Operations Insight: Integration Guide

3. Optional: Configure a traffic flow threshold on one or more interfaces. For moreinformation, see the following topics in the Network Performance InsightKnowledge Center:
v 1.4.1.1 Network Performance Insight V1.2.2: Configuring flow thresholdsv Network Performance Insight V1.2.1: Configuring flow thresholds
Note: It is not necessary to set a flow threshold in order to view flow data.
Defining performance thresholds for anomaly detectionIf your Netcool Operations Insight solution is integrated with NetworkPerformance Insight, then you can define static thresholds for anomaly detection.You define a static threshold for a given KPI within the poll definition that pollsfor that KPI.
About this task
For full information on how to configure poll definitions, see the following topic inthe Network Manager Knowledge Center: https://www.ibm.com/support/knowledgecenter/SSSHRK_4.2.0/poll/task/crtpolldef.html.
About poll definitions and static thresholds:
You specify static thresholds on performance measures on devices and interfaces,by defining the thresholds within the relevant poll definition. If these staticthresholds are violated for any given performance measure on a device orinterface, Netcool/OMNIbus events will be generated at an appropriate severitylevel, and if the context of the Device Dashboard is switched to the relevant deviceor interface, then the anomaly value and any associated performance measuretrends will be shown on the dashboard.Related tasks:
Network Manager V4.2 documentation: Poll definition parameters
Network Manager V4.2 documentation: Threshold polling
Anomaly detection:
By defining static thresholds for a performance measure in the Network ManagerPoll Definition Editor, you can optionally specify definitive threshold values. Ifthese threshold values are overriden for the specified number of consecutiveoccurrences, then a performance anomaly with the appropriate severity level isgenerated.
Defining anomaly thresholds:
Define anomaly thresholds to detect anomalies in performance measures ondevices, links, and interfaces, and display these anomalies in the PerformanceInsights.
Before you begin
Anomaly thresholds are defined within poll definitions.
Restriction:
Networks for Operations Insight 299

You can define anomaly thresholds only for Basic threshold, Chassis Ping, andInterface Ping poll definitions. The poll definition must be set to store historicaldata and specified within an active poll policy.
About this task
To define an anomaly threshold, complete the following steps:
Procedure
1. Create a poll definition, or modify an existing poll definition.v To apply anomaly thresholds to performance measures such as CPU and
memory utilization on devices, and incoming and outgoing bandwidthutilization on interfaces, create or modify a basic threshold poll definition.Creating a basic threshold poll definition is described inhttps://www.ibm.com/support/knowledgecenter/SSSHRK_4.2.0/poll/task/poll_crtbasictholddef.html.
v To apply anomaly thresholds to performance measures associated with pingoperations against devices and interfaces, such as packet loss and ping time,create or modify a chassis or interface ping poll definition. Creating a chassisor interface ping poll definition is described in https://www.ibm.com/support/knowledgecenter/SSSHRK_4.2.0/poll/task/poll_creatingchassisandifpingpolldefs.html.
When you define a new poll definition, all of the tabs in the Poll DefinitionEditor are editable, except for the NPI Anomaly Threshold tab, which is blank.Complete the other tabs but do not complete the NPI Anomaly Threshold.Complete this tab later in the procedure.
2. Ensure that the poll definition is specified in an active poll policy.a. If necessary, create a poll policy. For more information about creating poll
policies, see https://www.ibm.com/support/knowledgecenter/SSSHRK_4.2.0/poll/task/poll_crtpoll.html.
b. Set the poll definition to store historical data, by selecting the Poll PolicyProperties tab in the Poll Policy Editor and clicking the Store? check boxnext to the name of the poll definition.
c. Enable the poll policy. For more information about enabling poll policies,see https://www.ibm.com/support/knowledgecenter/SSSHRK_4.2.0/poll/task/poll_enablepoll.html.
3. Open the poll definition and define anomaly thresholds by following theinstructions in the next step.
4. Click the NPI Anomaly Threshold tab and specify static thresholds fortriggering performance measurement anomalies in the Device Dashboard, andassociated Tivoli Netcool/OMNIbus events.a. In the Upper Limit and Lower Limit fields, specify the upper and lower
threshold limits.b. In the Consecutive Occurrences spinner, specify the number of consecutive
threshold violations that must occur before an anomaly and an event isgenerated.
c. In the Type drop-down list, specify the threshold type. There are three typesof threshold. In each threshold type, the current value is compared to theupper and lower threshold limits.
Upper type threshold
300 IBM Netcool Operations Insight: Integration Guide

Use this type of threshold when the desired value of theperformance measure is lower than the threshold limits.v If the current value exceeds the lower limit but is less than the
upper limit for the specified number of consecutive occurrences,then a lower severity (orange) anomaly is generated on theDevice Dashboard, and a Major Tivoli Netcool/OMNIbus event isgenerated.
v If the current value exceeds the upper limit for the specifiednumber of consecutive occurrences, a higher severity (red)anomaly is generated on the Device Dashboard, and a CriticalTivoli Netcool/OMNIbus event is generated.
Lower type threshold
Use this type of threshold when the desired value of theperformance measure is higher than the threshold limits.v If the current value is less than the upper limit but higher than
the lower limit for the specified number of consecutiveoccurrences, then a lower severity (orange) anomaly is generatedon the Device Dashboard, and a Major Tivoli Netcool/OMNIbusevent is generated.
v If the current value is less than the lower limit, for the specifiednumber of consecutive occurrences, then a higher severity (red)anomaly is generated on the Device Dashboard, and a CriticalTivoli Netcool/OMNIbus event is generated.
Band type thresholdUse this type of threshold when the desired value of theperformance measure is within a band specified by the lower andupper threshold limits. If the current value falls outside of the band(either above or below the band) for the specified number ofconsecutive occurrences, a higher severity anomaly is generated onthe Device Dashboard, and a Critical Tivoli Netcool/OMNIbusevent is generated.
5. Click Save.
Administering the Device DashboardPerform these tasks to administer the Device Dashboard for users.
Changing the Network Performance Insight server for all usersIf you need to change the Network Performance Insight server that provides datato the Device Dashboard, then you must perform the following steps,
Procedure1. Edit the npi.properties file. This file is located by default at
$NMGUI_HOME/profile/etc/tnm/npi.properties, where $NMGUI_HOME is bydefault /opt/IBM/netcool/gui/precision_gui.
2. In the npi.properties file change the following properties to point to the newNetwork Performance Insight server:v npi.server.name
v npi.host.name
3. Instruct each end user to go to the Device Dashboard and change the portletpreferences there to point to the new Network Performance Insight server. Endusers must do this because the portlet preferences override the propertiesdefined in the npi.properties file.
Networks for Operations Insight 301

4. Stop and then restart the WebSphere Application Server.
Traffic Details dashboardUse the Traffic Details dashboard to monitor the network performance details of aparticular interface. Network Performance Insight provides built-in and interactivedashboards that cover the entire traffic data representation.
The Flow data that is collected by Network Performance Insight is shown fromTraffic Details dashboard. It displays the traffic details at interface level.
You can launch the Traffic Details portlet that is available as a widget from thefollowing dashboards:v From Network Health Dashboard
The traffic details for an interface are populated in the Network View page, froma selected network view.
v From Device DashboardRight-click an interface of interest and select Show Traffic from the Interfacestab in the Performance Insights portlet.
v From Event Viewer or AELRight-click a Flow event from the Event Viewer or the AEL and select FlowDashboard, to view the traffic details for the event.
Traffic Details dashboard viewsUse this information to see the list of views that are available in the Traffic Detailsdashboard.
Traffic Details dashboard populates the performance metrics based on the collectedIP network traffic information as the packet enters or exits an interface of a device.This resource provides a view of the applications responsible for traffic volume,either inbound or outbound, through the interface over the selected time period.This data provides granular traffic details at interface level.
You can view the Flow data that is collected by Network Performance Insight fromTraffic Details dashboard. All the widgets in the dashboard display top 10 metricvalues for the resources.
The Traffic Details dashboard views are as follows:v Top Applications with ToSv Top Applicationsv Top Destination Autonomous Systemsv Top Source Autonomous Systemsv Top Autonomous System Conversationsv Top Conversationsv Top Conversations with Applicationv Top Conversations with ToSv Top Destinations with Applicationv Top Destinationsv Top IP Group Conversationsv Top IP Group Conversations with Applicationv Top Source IP Groups with Protocol
302 IBM Netcool Operations Insight: Integration Guide

v Top Destination IP Groups with Protocolv Top Source IP Groups with ToSv Top IP Group Conversations with Protocolv Top IP Group Conversations with ToSv Top Source IP Groups with Applicationv Top IP Group Conversations with ToSv Top Destination IP Groupsv Top Source IP Groupsv Top Destination IP Groups with Applicationv Top Protocols with Conversationv Top Protocols with Destinationv Top Protocols with Applicationv Top Protocols with Sourcev Top Protocolsv Top QoS Hierarchies with Queue IDv Top Sourcesv Top Sources with Applicationv Top ToS
Note: All the data on the Traffic Detail dashboard views is populated based onyour local timezone.
To view all the Top Talker resource views from Traffic Details dashboard, enablethe Flow aggregations. For more information, see Configuring Flow aggregations.
To view all the Top Talker resource views from Traffic Details dashboard, enablethe Flow aggregations. For more information, see Configuring Flow aggregationssection in Installing and Configuring IBM Network Performance Insight.
For more information about the built-in aggregation types and their grouping keys,see Built-in aggregation definitions section in IBM Network Performance Insight: ProductOverview.Related information:
Built-in aggregation definitions
Displaying NetFlow performance data from Network HealthDashboard
IBM Networks for Operations Insight is an optional feature that can be added to adeployment of the base Netcool Operations Insight solution to provide serviceassurance in dynamic network infrastructures. The capabilities of Networks forOperations Insight include network discovery, visualization, event correlation androot-cause analysis, and configuration and Compliance Management that provideservice assurance in dynamic network infrastructures.
The Network Health Dashboard monitors a selected network view, and displaysdevice and interface availability within that network view. It also reports onperformance by presenting graphs, tables, and traces of KPI data for monitoreddevices and interfaces. Traffic Details portlet can be launched for the interfaces thatare available in the Structured Browser.
Networks for Operations Insight 303

The Network Health Dashboard includes the Event Viewer for detailed eventinformation. You can start the Traffic Details portlet to display the NetFlow trafficdetails for the interface that violated a set threshold value.
Adding the Network Performance Insight widget in NetworkHealth dashboardDashboards or pages, are an arrangement of one or more widgets in the work areaand contain the widgets that are needed to complete tasks. Users whose roles haveEditor or Manager access to a dashboard can edit a dashboard's layout andcontent. You can add multiple widgets in a screen. When you are adding widgets,you can also rearrange the widgets as needed.
About this task
By default, the Network Health Dashboard page displays the Network View,Structure Browser , and Event Viewer widgets.
To view the traffic details from Network Health Dashboard for the first time, youneed to add the Network Performance Insight widget.
Procedure1. Log in to Jazz for Service Management server.
2. Click the Incident icon ( ) and select Network Health Dashboard underNetwork Availability.
3. In the Network Health Dashboard, select a network view.A second tab, called Network View, opens.
4. In the tab bar, click Page Actions icon ( ) and select Edit Page.The dashboard is changed to show the widget palette and a series of buttons inthe tab bar. The menu that is associated with the Edit options icon for eachwidget is updated so that you can edit its layout and content.
5. Click the NPI folder from the widget palette.The NPI folder name is based on the launch-in-context tool that is created forNetwork Performance Insight.The NPI folder name is based on the launch-in-context tool that is created forNetwork Performance Insight. For more information, see Configuringlaunch-in-context integration with Network Performance Insight in IntegratingNetwork Performance Insight.
6. Click and drag the Traffic Details widget from the palette.To assist you in positioning the widget, use the background layout grid. Youcan change the size of the layout grid and have widgets snap to the layoutguide lines through the Layout button in the tab bar.
7. Click Save and Exit to exit the dashboard from the edit mode after youcomplete the editing.
Related information:
Editing dashboard content and layout
304 IBM Netcool Operations Insight: Integration Guide
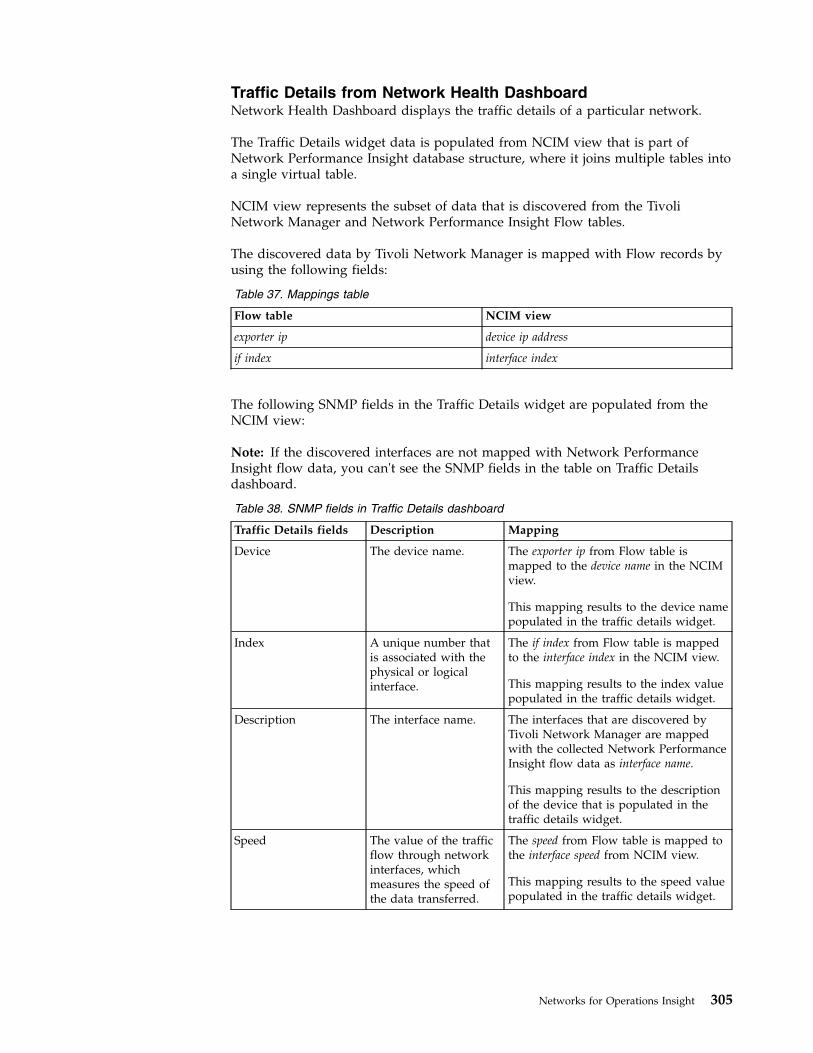
Traffic Details from Network Health DashboardNetwork Health Dashboard displays the traffic details of a particular network.
The Traffic Details widget data is populated from NCIM view that is part ofNetwork Performance Insight database structure, where it joins multiple tables intoa single virtual table.
NCIM view represents the subset of data that is discovered from the TivoliNetwork Manager and Network Performance Insight Flow tables.
The discovered data by Tivoli Network Manager is mapped with Flow records byusing the following fields:
Table 37. Mappings table
Flow table NCIM view
exporter ip device ip address
if index interface index
The following SNMP fields in the Traffic Details widget are populated from theNCIM view:
Note: If the discovered interfaces are not mapped with Network PerformanceInsight flow data, you can't see the SNMP fields in the table on Traffic Detailsdashboard.
Table 38. SNMP fields in Traffic Details dashboard
Traffic Details fields Description Mapping
Device The device name. The exporter ip from Flow table ismapped to the device name in the NCIMview.
This mapping results to the device namepopulated in the traffic details widget.
Index A unique number thatis associated with thephysical or logicalinterface.
The if index from Flow table is mappedto the interface index in the NCIM view.
This mapping results to the index valuepopulated in the traffic details widget.
Description The interface name. The interfaces that are discovered byTivoli Network Manager are mappedwith the collected Network PerformanceInsight flow data as interface name.
This mapping results to the descriptionof the device that is populated in thetraffic details widget.
Speed The value of the trafficflow through networkinterfaces, whichmeasures the speed ofthe data transferred.
The speed from Flow table is mapped tothe interface speed from NCIM view.
This mapping results to the speed valuepopulated in the traffic details widget.
Networks for Operations Insight 305

If you do not see data in the Traffic Details dashboard, see Integration problem:Traffic Details dashboard cannot be launched from Network Health Dashboard section inTroubleshooting IBM Network Performance Insight.Related information:
Data storage
Launching Traffic Details dashboard from Network Health dashboard:
The Traffic Details widget displays the details of an interface from a selectednetwork device.
About this task
Browse from Network Health dashboard to view the specific traffic details of aninterface in the Traffic Details page.
By default, the Traffic Details page displays the details for Top Ingress interfaces atIngress level, Top Egress interfaces at Egress level. Whereas, Top Interfaces and allTop Networks display the traffic details as Both.
Procedure
1. Log in to Jazz for Service Management server.
2. Click the Incident icon ( ) and select Network Health Dashboard underNetwork Availability.The dashboard page populates the configured network devices.
3. Select a view from the Network Views bookmark that you configured from theNetwork Health Dashboard.The other widgets update to show information based on the network view thatyou selected.The Network View dashboard opens in another tab. This dashboard containsNetwork Views GUI, the Event Viewer, the Structure Browser, and the TrafficDetails, and it displays the selected network view.
4. Double-click a network from the Network View.For example, double-click All Routers.
5. Click an entity or device from the Network View.The selected entity details are displayed on the Structure Browser .
6. Click the Show Interfaces icon ( ) from the Structure Browser .List of interfaces for the entity is displayed.
7. Click an interface.The traffic details data with the interface details is displayed on the TrafficDetails.
8. Select an entity from View list.For information on monitoring traffic details, see “Monitoring NetFlowperformance data from Traffic Details dashboard” on page 308.
9. Optional: Click the Maximize icon ( ) from the upper right of the TrafficDetails widget.The traffic details dashboard is displayed in full screen mode.
306 IBM Netcool Operations Insight: Integration Guide

Displaying NetFlow performance data from Event ViewerYou can monitor and manage network performance from events that are generatedby Tivoli Netcool/OMNIbus on Web GUI.
About this task
You can access the events from the following widgets:v Managing events in the Event Viewer
Use the JavaScript Event Viewer to monitor and manage events. You can accessEvent Viewers in any page in Dashboard Application Services Hub that hosts anEvent Viewer widget.
v Monitoring events in Active Event ListsThe Active Event List (AEL) is an interactive Java applet for displaying alertdata from the ObjectServer. Communication between the ObjectServer and theAEL is bidirectional. The AEL presents alert information from the alerts.statustable in the ObjectServer to operators. Operators can perform actions againstalerts such as changing the results from the alert properties in the alerts.statustable from the AEL.
Procedure1. Log in to Jazz for Service Management server.
2. Click Incident ( ) > Events > Event Viewer in the navigation bar.3. Right-click an event that is labeled as NPI/Flow under the Manager column
from the Event Viewer and select one of the following commands. Both ofthese commands launch the Traffic Details dashboard.v Flow Dashboard
v Performance Insight > Show Traffic
The Traffic Details dashboard that is associated with the selected event isdisplayed in another window.
Note: You can launch the Traffic Details dashboard from Flow events only.Flow events are marked in the Event Viewer using the value NPI/Flow in theManager column.
4. Optional: Right-click a Flow event from Incident ( ) > Events > ActiveEvent List (AEL) and select Flow Dashboard.The Traffic Details dashboard that is associated with the selected event isdisplayed in another window.
Related information:
Configuring launch-in-context integration with Network Performance Insight
Event severity levels
Networks for Operations Insight 307

Monitoring NetFlow performance data from Traffic Detailsdashboard
After launching the Traffic Details dashboard, you can display the different viewsof NetFlow data for a selected interface.
About this task
By default, the Traffic Details page displays the data about the top ingress, topegress, or both flows for an interface.
Procedure1. Select Traffic Details for Ingress, Egress, or Both from the list.2. Select any dashboard view from the View list.
For more information about dashboard views, see “Traffic Details dashboardviews” on page 302.
3. Click
to select a start date from the Start field.
4. Click
to select start time.
5. Click
to select an end date from the End field.
6. Click
to select end time.7. Click Update to update the details for selected date and time.
Two red lines are displayed in the graph that notify the Upper Threshold andLower Threshold limits are crossed. When you hover over the area charts, atooltip is flashed giving you the details for that particular source.For more information about aggregated data for a specific duration, see Datastorage section in Network Performance Insight overview. The graphicalpresentation of data is updated for the selected date and time.
8. Click
to refresh the page.9. Select one or more interfaces from the legend on the right.
It displays the top 10 interface details.10. Optional: Clear the check box for a particular interface.
The details for that interface are hidden.11. Optional: Check the Remaining check box.
It displays the details for the remaining traffic on the interfaces.
Note: If the upper limit and lower limit of a threshold is crossed, two extracheck boxes for Upper Threshold and Lower Threshold are seen in the legend.
The table at the bottom displays top 10 interface details. The table displays thefollowing details for an interface:
Rank Display the number in ascending order.
GroupingDisplays the interface for which you are viewing the data. Forexample, if you select Top Protocols from the View list, the groupingthat is displayed is for Protocol.
The columns change depending on the view selected. The maingrouping keys for the Traffic Details dashboard can be defined as:
308 IBM Netcool Operations Insight: Integration Guide

Table 39. Grouping
Grouping Key Description
Application Applications are mapped based on port, protocol, andIP address or network.
Destination Destination can be a host computer to which thenetwork flow comes from a source computer.
Destination AS Autonomous systems that a specific route passesthrough to reach one destination.
Destination IP Group A group of destinations that you want to control byspecifying the IP addresses. A grouping of endpointsfor traffic accounting, billing purpose.
Protocol It is a standard that is defined on how a networkconversation is established. It delivers the packetsfrom the source host to the destination host.
Source Source is the IP address from which traffic isoriginated.
Source AS Autonomous systems that a specific route passesthrough from a source to reach one destination.
Source IP Group A group of sources that you want to control byspecifying the IP addresses. A grouping of endpointsfor traffic accounting, billing purpose.
Source ToS The class of service, which examines the priority ofthe traffic.
QoS Hierarchy QoS behavior at multiple policy levels, whichprovides the visibility of how the defined trafficclasses are performing.
QoS Queue ID QoS Queues provide bandwidth reservation andprioritization of traffic as it enters or leaves a networkdevice.
Octets Displays the amount of data that is used in KB and Bytes.
PercentagePercentage of traffic on the grouping that occupies the traffic.
Note: If the top 10 interface table is not shown, reduce the zoom percentageof your current browser.
Related information:
Built-in aggregation definitions
Network Performance Insight Dashboards
1.4.1.1
After the system is configured as per your requirements, Network PerformanceInsight can start collecting, aggregating, and storing the network performance data.The data is rendered on various ready-to-use dashboards that it offers.
The aggregated data from different database tables provide the individual toptalker views in Traffic Details dashboard and Network Performance InsightDashboards.
Networks for Operations Insight 309
You can view the network traffic performance data from two locations:v Traffic Details dashboard that can be launched from multiple locations.v Network Performance Insight Dashboards
Categories of Network Performance Insight Dashboards:v Network Performance Overview dashboardv Network Performance Overview by Deviation dashboardv NetFlow dashboardsv On Demand Filtering dashboards
Network Performance Insight Dashboards can be grouped functionally as follows:v Operational dashboardsv Analytical dashboardsv Strategic dashboardsv On-demand dashboards
Important: When Network Performance Insight is used to collect, aggregate, andrender the NetFlow data alone, the following dashboards are applicable. For moreinformation about the NetFlow only data deployment scenario, see Scenario 3 -NetFlow only data.v “NetFlow dashboards” on page 330v On Demand Filtering - Flow dashboard
The following dashboards that display performance data are not applicable in thisscenario:v Network Performance Overview dashboardv Network Performance Overview by Deviation dashboardv On Demand Filtering - IPSLA dashboardv On Demand Filtering - Device Health dashboard
Note: When Network Performance Insight is used to collect, aggregate, and renderthe NetFlow data alone, the following dashboards are applicable. For moreinformation, see Scenario 3 - NetFlow only data from Installing and Configuring IBMNetwork Performance Insight:v “NetFlow dashboards” on page 330v On Demand Filtering - Flow dashboard
The following dashboards that display performance data are not applicable in thisscenario:v Network Performance Overview dashboardv Network Performance Overview by Deviation dashboardv On Demand Filtering - IPSLA dashboardv On Demand Filtering - Device Health dashboard
310 IBM Netcool Operations Insight: Integration Guide

Getting started with Network Performance Insight Dashboards1.4.1.1
This information provides instructions and general information on how to use theNetwork Performance Insight Dashboards that render network performance datafrom Network Performance Insight.
The Network Performance Insight Dashboards report the network performancedata that is gathered and stored by the Network Performance Insight and itscomponents.
Network Performance Insight Dashboards are federated on Dashboard ApplicationServices Hub portal and you can derive the following information from them:v Summary level views of the network and see how your network resources are
performing.v Detailed views from the listener and drill-down widgets. You can switch
between different metric views to analyze and monitor your network.v Monitor Top Talker resource views that help to understand network insights at a
more granular level.v Share this information with other stakeholders by generating and sending the
report information in PDF, CSV, or XLS format.
Accessing the Network Performance Insight Dashboards1.4.1.1
Access the Network Performance Insight Dashboards from Dashboard ApplicationServices Hub portal.
Procedure1. Log in to Dashboard Application Services Hub portal with npiadmin and
netcool credentials.
2. Click Console Integrations icon ( ) in the navigation bar and selectDashboards under Performance.The page loads with menu bar to navigate to different Network PerformanceInsight Dashboards.a. Click Home to see the two types of Network Performance Overview
dashboards from the menu bar.v Network Performance Overview
Network Performance Overview: Top 10 dashboard offers summary levelcurrent view of the managed network.
v Network Performance Overview by Deviation
Network Performance Overview by Deviation: Top 10 Deviationsdashboard offers summary level deviation view of the managed network.
b. Click NetFlow to see Network Traffic Overview dashboard and all thebuilt-in Top N resource views.You can see the following dashboards:
Networks for Operations Insight 311

Dashboard group Available views
Network Traffic Overview Network Traffic Overview: Top 10 Trafficdashboard that contains various widgets.
Applications v Top Applications with ToS
v Top Applications
Autonomous Systems v Top Destination Autonomous Systems
v Top Source Autonomous Systems
v Top Autonomous System Conversations
Conversations v Top Conversations
v Top Conversations with Application
v Top Conversations with ToS
Destinations v Top Destinations with Application
– Applications Response Time
v Top Destinations
IP Address Grouping v Top IP Group Conversations
v Top IP Group Conversations withApplication
v Top Source IP Groups with Protocol
v Top Destination IP Groups with Protocol
v Top Source IP Groups with ToS
v Top IP Group Conversations withProtocol
v Top Destination IP Groups with ToS
v Top Source IP Groups with Application
v Top IP Group Conversations with ToS
v Top Destination IP Groups
v Top Source IP Groups
v Top Destination IP Groups withApplication
Protocols v Top Protocols with Conversation
v Top Protocols with Destination
v Top Protocols with Application
v Top Protocols with Source
v Top Protocols
QoS Queue v QoS Queue Drops
Sources v Top Sources
v Top Sources with Application
ToS v Top ToS
c. Click On Demand Filtering to see the following views:v Flow
v IPSLA
v Device Health
312 IBM Netcool Operations Insight: Integration Guide

Generic functions of Network Performance Insight Dashboards1.4.1.1
Use this information to understand the generic interactivity and filtering functionsthat are available on Network Performance Insight Dashboards.
Procedurev Generic interactivity that is applicable for all Network Performance Insight
Dashboards:
1. Click Auto Refresh ( ) icon to enable or disable auto refresh.If auto refresh option is enabled, the dashboard metrics are refreshed withlatest values.
2. Click Save Dashboard ( ) icon to save the dashboard view.
3. Click Save As ( ) icon and select PDF, CSV, or XLS to save and exportthe dashboard to the selected file format.
Note: In a PDF file format, the complete data is populated in the next pageon a tabular format. You need to click the grid to view the complete data.
4. To maximize the widget display, click .
5. To minimize the widget display, click .v Generic interactivity that is applicable for only the NetFlow and On Demand
Filtering dashboards and widgets:
1. To change to a different chart type, click
and select a different charttype from the widget.The widget renders according to the selected chart type.
2. To hide the widget, click .
3. To display the widget, click .
4. From the Datasource icon ( ), click to list the options to choose otherperformance metric.
Note: The Datasource icon is available on Network Performance Overview,Network Performance Overview by Deviation, and NetFlow dashboardswidgets.
5. Click the column header from any grid widgets to sort in ascending ordescending order.You can sort the data in numerical or alphabetical, depending on what typeof data is populated in the grid widget.
6. The following
icon on a widget indicates that it is a drill-down chart.Click one of the elements from the chart widget.For example, in a bar chart, click one of the bars to further drill down to onehierarchy level down which correspond to the bar that you selected.
Networks for Operations Insight 313

v Filtering options that are applicable for Network Performance InsightDashboards.The filter options and list differ based on the different types of NetworkPerformance Insight Dashboards.
Table 40. Filter options
Filter name Filter descriptionNetwork PerformanceInsight Dashboards
Device The list contains theconfigured or discovereddevices.
NetFlow dashboards
Application Response Timedashboard
On Demand Filtering Flowdashboard
On Demand Filtering DeviceHealth dashboard
Interface The list contains the interfacefor the selected device.
NetFlow dashboards
Application Response Timedashboard
Direction The list contains the directionof traffic on the interface,which is either Inbound orOutbound.
NetFlow dashboards
On Demand Filtering Flowdashboard
Target Server/Application The list contains theavailable target servers.
Application Response Timedashboard
Aggregation Type The list contains theavailable NetFlowdashboards.
On Demand Filtering Flowdashboard
TopN From the list, you can chooseN number of Top Performersto compare historical polldata across multiple entitiesand metrics in a selectednetwork view.
On Demand Filtering Flowdashboard
SLA Test The IPSLA operations (SLATest) list contains optionsfrom the following functionalareas:
v Availability monitoring
v Network monitoring
v Application monitoring
v Voice monitoring
v Video monitoring
On Demand Filtering IPSLAdashboard
Source The list contains theconfigured or discovereddevices.
On Demand Filtering IPSLAdashboard
Sort By Select from the list to sort theresult by top or bottom.
On Demand Filtering IPSLAdashboard
On Demand Filtering DeviceHealth dashboard
314 IBM Netcool Operations Insight: Integration Guide

Table 40. Filter options (continued)
Filter name Filter descriptionNetwork PerformanceInsight Dashboards
KPI The list contains theavailable performancemetrics.
On Demand Filtering IPSLAdashboard
On Demand Filtering DeviceHealth dashboard
Time Period The dashboard data ispopulated based on theNetwork Performance Insightserver time zone.
v Last Hour, filters the last 1hour of the current time.
v Last 6 Hours, filters thelast 6 hours of the currenttime.
v Last 12 Hours, filters thelast 12 hours of the currenttime.
v Last 24 Hours, filters thelast 24 hours from thecurrent time and day.
v Last 7 Days, filters the last7 days from the currenttime and day.
v Last 30 Days, filters thelast 30 days from thecurrent time and day.
v Last 365 Days, filters thelast 365 days from thecurrent time and day.
v Custom, from the TimePeriod Selection, you canfilter based on a specificdate and time range.
View the start and end timeon the dashboard title bar.The start and end time isdisplayed according to thefilter you select.
For example, if the currenttime is 3.00 PM on 11/13/17and you select the filter forLast 24 Hours. The dashboarddisplays the time period as:11/12/17, 3:00 PM -11/13/17, 2:59 PM<Timezone>.
NetFlow dashboards
Application Response Timedashboard
On Demand Filtering Flowdashboard
On Demand Filtering IPSLAdashboard
On Demand Filtering DeviceHealth dashboard
v For Network Performance Overview, Network Performance Overview byDeviation and Network Traffic Overview dashboards, only Time Period filteringoption is available with Last Hour and Last 24 Hours filters.
Networks for Operations Insight 315
What to do next
Click Apply Filter to apply the filter selection.
The dashboard reloads the data according to the filter selections.
Network Performance Overview dashboards1.4.1.1
Network Performance Overview summarizes a high-level view of your network,application, and device performance data in a single location. It gives you fullcontrol over how you investigate and analyze the measurements. You can navigateto the detailed views from here that focus on specific diagnostics. All the widgetsin the dashboard display the metrics values for top 10 resources.
Network Performance Overview dashboards provide advanced monitoring of yournetwork from a single pane of glass and you can drill down to specific detailsfrom here. Two types of overview dashboards are available that display data bycurrent values and by deviation.
All the widgets in this dashboard display the metrics by current values for top 10resources in your network.
You can access network traffic congestion, network traffic utilization, applicationperformance, quality of service, and device performance easily and quickly fromthe widgets in this dashboard for the following areas:
Congestion
Network congestion can occur due to high data volumes and not enoughcapacity to support the applications that are involved. It can lead to delaysand packet drops and cause brownouts. Some of the reasons for congestionmight be as follows:v Network data in the route is more than the network capacity.v Poor network designv Inefficient internet routing. Border Gateway Protocol (BGP) that sends all
traffic through shortest logical path is not congestion aware and transitpaths can become overloaded.
v Incorrect QoS configuration or no QoS implementation
Typical effects include queuing delays, packet loss, or refusing newconnections to the resource. From these widgets, you can understandwhich interfaces are experiencing congestion by observing the inbound andoutbound packet discard deviations.
This data can be correlated with QoS queue drops and total applicationresponse time.v When a router receives NetFlow data at a rate faster than it can
transmit, the device buffers the extra traffic until bandwidth is available.This buffering process is called queuing. You can use QoS to define thepriorities to transmit the records from the queue.
v The application response time is represented as total delay, which is thesum of max client network delay, max server network delay andapplication delay.
Quality of Service
316 IBM Netcool Operations Insight: Integration Guide

When real-time data is passed in a network (for example, video, audio, orVoIP), implementing the Quality of Service is crucial for a good userexperience. These dashboards help to understand the round-trip time forthe successful echo operations.
You can use this dashboard to troubleshoot issues with business-criticalapplications by determining the round-trip delay times, testing connectivityto the devices, and probe loss.
Voice performance is monitored with the help of the widgets in the Qualityof Service section.
Traffic
To ensure adequate network bandwidth for users to use thebusiness-critical applications, you can correlate bandwidth utilization ondifferent interfaces and the applications that consume the bandwidth. Youcan then see the applications that are impacted on the interfaces withhigh-bandwidth utilization.
Device load
Faulty devices can create a bottleneck to your network. High CPUutilization and memory loads can adversely affect the performance of thedevice and network. To understand the critical health of the monitoreddevices, the Device load widgets are useful.
Network Performance Overview dashboard1.4.1.2
All the widgets in this dashboard display the metrics by current values for top 10resources in your network.
Available widgets and their interactivity
The master-listener and drill-down widget interactions can be seen in the followingways:
v For any widgets with the ( ) drill-down icon, from the chart, click any barthat represents the interface or metric to open the drill-down dashboard page,which contains the associated widgets.
v For the other widgets that are having a master-listener interaction, click any ofthe bars that represent the interface to change the listener widget that displaysthe related data for the selected interface.
Available widgets and their interactivity
The master-listener and drill-down widget interactions can be seen in the followingways:
v For any widgets with the ( ) drill-down icon, from the chart, click any barthat represents the interface or metric to open the drill-down dashboard page,which contains the associated widgets.
v For the other widgets that are shown in the diagram to be in a master-listener ordrill-down interaction, click any of the bars that represent the interface to changethe listener widget that displays the related data for the selected interface.
Networks for Operations Insight 317
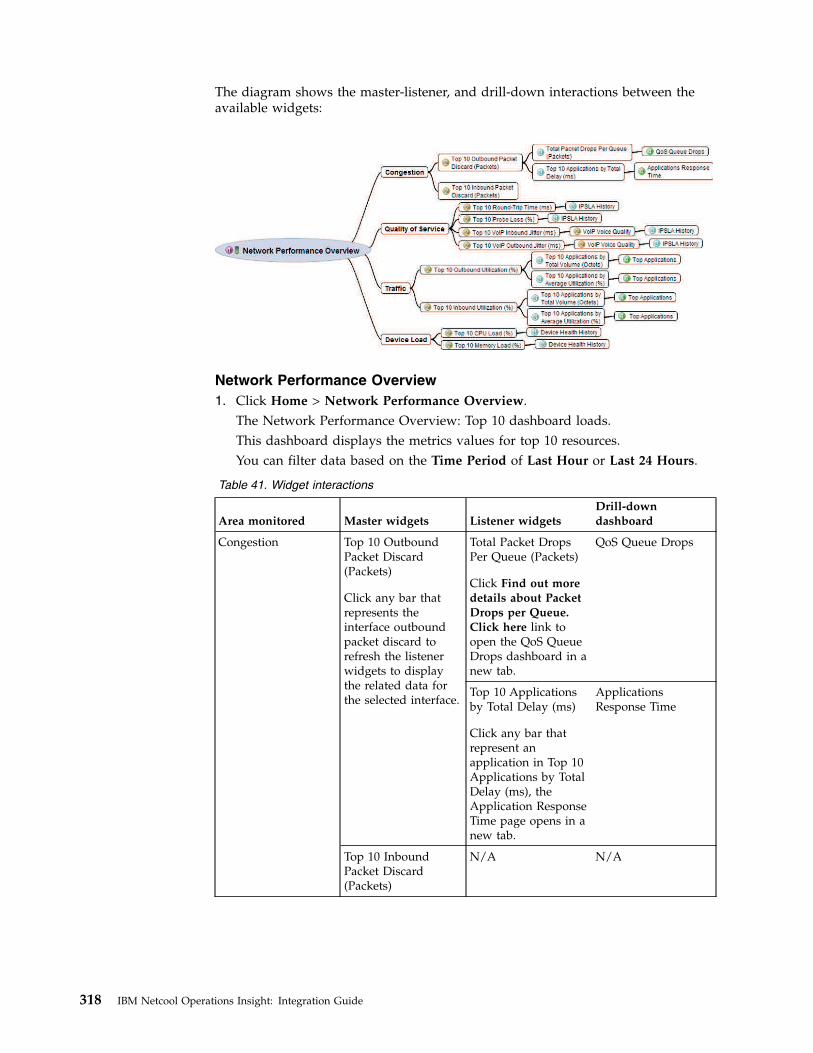
The diagram shows the master-listener, and drill-down interactions between theavailable widgets:
Network Performance Overview1. Click Home > Network Performance Overview.
The Network Performance Overview: Top 10 dashboard loads.This dashboard displays the metrics values for top 10 resources.You can filter data based on the Time Period of Last Hour or Last 24 Hours.
Table 41. Widget interactions
Area monitored Master widgets Listener widgetsDrill-downdashboard
Congestion Top 10 OutboundPacket Discard(Packets)
Click any bar thatrepresents theinterface outboundpacket discard torefresh the listenerwidgets to displaythe related data forthe selected interface.
Total Packet DropsPer Queue (Packets)
Click Find out moredetails about PacketDrops per Queue.Click here link toopen the QoS QueueDrops dashboard in anew tab.
QoS Queue Drops
Top 10 Applicationsby Total Delay (ms)
Click any bar thatrepresent anapplication in Top 10Applications by TotalDelay (ms), theApplication ResponseTime page opens in anew tab.
ApplicationsResponse Time
Top 10 InboundPacket Discard(Packets)
N/A N/A
318 IBM Netcool Operations Insight: Integration Guide

Table 41. Widget interactions (continued)
Area monitored Master widgets Listener widgetsDrill-downdashboard
Quality of Service Top 10 Round-TripTime (ms)
Click any bar thatrepresents theround-trip timebetween a source anddestination device IPaddresses to open theIPSLA Historydashboard in a newtab.
N/A
IPSLA History
Top 10 Probe Loss(%)
Click any bar thatrepresents the probeloss between a sourceand destinationdevice IP addressesto open the IPSLAHistory dashboard ina new tab.
N/A
Top 10 VoIP InboundJitter (ms)
or
Top 10 VoIPOutbound Jitter (ms)
Click any bar thatrepresents the VoIPInbound orOutbound Jitterbetween a source anddestination device IPaddresses to refreshthe listener widgets.
Note: Click the Data
Source icon ( ) totoggle between Top10 VoIP InboundJitter (ms) and Top 10VoIP Outbound Jitter(ms) widgets.
VoIP Voice Quality
The widget displaysthe following metricsfor the same devices:
v MOS
v IcPIF
Click Source -Destination:<IP_Address>-<IP_Address> toopen the IPSLAHistory dashboard ina new tab.
Networks for Operations Insight 319
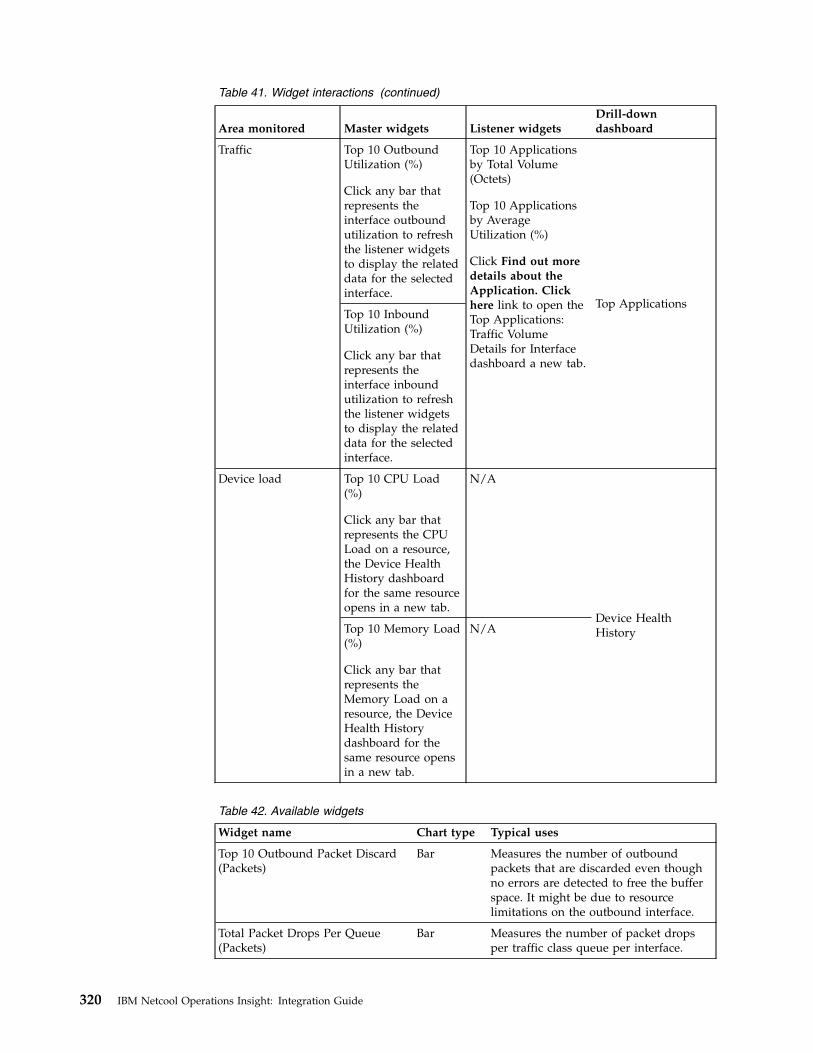
Table 41. Widget interactions (continued)
Area monitored Master widgets Listener widgetsDrill-downdashboard
Traffic Top 10 OutboundUtilization (%)
Click any bar thatrepresents theinterface outboundutilization to refreshthe listener widgetsto display the relateddata for the selectedinterface.
Top 10 Applicationsby Total Volume(Octets)
Top 10 Applicationsby AverageUtilization (%)
Click Find out moredetails about theApplication. Clickhere link to open theTop Applications:Traffic VolumeDetails for Interfacedashboard a new tab.
Top ApplicationsTop 10 InboundUtilization (%)
Click any bar thatrepresents theinterface inboundutilization to refreshthe listener widgetsto display the relateddata for the selectedinterface.
Device load Top 10 CPU Load(%)
Click any bar thatrepresents the CPULoad on a resource,the Device HealthHistory dashboardfor the same resourceopens in a new tab.
N/A
Device HealthHistoryTop 10 Memory Load
(%)
Click any bar thatrepresents theMemory Load on aresource, the DeviceHealth Historydashboard for thesame resource opensin a new tab.
N/A
Table 42. Available widgets
Widget name Chart type Typical uses
Top 10 Outbound Packet Discard(Packets)
Bar Measures the number of outboundpackets that are discarded even thoughno errors are detected to free the bufferspace. It might be due to resourcelimitations on the outbound interface.
Total Packet Drops Per Queue(Packets)
Bar Measures the number of packet dropsper traffic class queue per interface.
320 IBM Netcool Operations Insight: Integration Guide

Table 42. Available widgets (continued)
Widget name Chart type Typical uses
Top 10 Inbound Packet Discard(Packets)
Bar Measures the number of inboundpackets that are discarded even thoughno errors are detected to free the bufferspace. It might be due to resourcelimitations on the inbound interface.
Top 10 Applications by Total Delay(ms)
Bar Measures maximum total time that ittakes an application to respond to userrequests. The total delay is the sum ofmax client network delay, max servernetwork delay, and application delay.
Top 10 Round-Trip Time (ms) Bar Measures the time that is taken betweensending a UDP echo request messagefrom a source device to the destinationdevice and receiving a UDP echo replyfrom the destination device. It is usefulin troubleshooting issues withbusiness-critical applications bydetermining the round-trip delay timesand testing connectivity betweendevices.
Top 10 Probe Loss (%) Bar Measures the percentage of probes lost.it shows the completion status of an RTToperation.
Top 10 VoIP Inbound Jitter (ms) Bar Measures the variance in latency overtime in incoming direction between twodevices in your network.
Top 10 VoIP Outbound Jitter (ms) Bar Measures the variance in latency overtime in outgoing direction between twodevices in your network.
Networks for Operations Insight 321

Table 42. Available widgets (continued)
Widget name Chart type Typical uses
VoIP Voice Quality Badge Measures voice performance that isimportant for delivering voice qualityservices. This widget shows two metrics:
v Mean Opinion Scores (MOS).
A common benchmark to determinevoice quality is MOS. With MOS, awide range of listeners can judge thequality of voice samples on a scale of1 (bad quality) to 5 (excellent quality).The Cisco IOS implementation ofMOS takes RTT delay and packet lossinto the MOS calculation. However,jitter is not included.
The following colors on the widgetdenote the severity of degradation ofvoice quality:
– Green, when the MOS value is 5 ormore
– Light Green, when the MOS valueis 4
– Yellow, when the MOS value is 3
– Red, when the MOS value is in therange 0 - 2
v Impairment/Calculated PlanningImpairment Factor (IcPIF)
IcPIF values are expressed in a typicalrange of 5 (low impairment) to 55(high impairment). Typically, IcPIFvalues that are numerically less than20 are considered adequate.
The following colors on the widgetdenote the severity of degradation ofvoice quality:
– Green, when the IcPIF value is inthe range 5 - 19
– Light Green, when the IcPIF valueis in the range 20 - 39
– Yellow, when the IcPIF value is inthe range 40 - 54
– Red, when the IcPIF value is 55 ormore
Top 10 Outbound Utilization (%) Bar Measures outbound bandwidthutilization for the highest OutboundPacket Discards on the interfaces.
Top 10 Applications by TotalVolume (Octets)
Bar Measures the corresponding applicationswith highest bandwidth utilization byvolume.
Top 10 Inbound Utilization (%) Bar Measures the bandwidth utilization forincoming traffic for the highest InboundPacket Discards on the interfaces.
322 IBM Netcool Operations Insight: Integration Guide

Table 42. Available widgets (continued)
Widget name Chart type Typical uses
Top 10 Applications by AverageUtilization (%)
Bar Measures the corresponding applicationswith highest bandwidth utilization bypercentage.
Top 10 CPU Load (%) Bar Measure the total CPU utilization inpercentage across all vendor devices inyour network. Currently, NetworkPerformance Insight supports thefollowing vendors:
v Cisco
v Huawei
v Juniper
Top 10 Memory Load (%) Bar Measure the total memory usage inpercentage across all vendor devices inyour network. Currently, NetworkPerformance Insight supports thefollowing vendors:
v Cisco
v Huawei
v Juniper
Network Performance Overview by Deviation dashboard1.4.1.1
For all the widgets that display the metrics by deviation, the values are calculatedby computing deviation for the current data that is compared against an averagevalue on the same day of week over the last four weeks.
Available widgets and their interactivity
The master-listener and drill-down widget interactions can be seen in the followingways:
v For any widgets with the ( ) drill-down icon, from the chart, click any barthat represents the interface or metric to open the drill-down dashboard page,which contains the associated widgets.
v For the other widgets that are having a master-listener interaction, click any ofthe bars that represent the interface to change the listener widget that displaysthe related data for the selected interface.
Available widgets and their interactivity
The master-listener and drill-down widget interactions can be seen in the followingways:
v For any widgets with the ( ) drill-down icon, from the chart, click any barthat represents the interface or metric to open the drill-down dashboard page,which contains the associated widgets.
Networks for Operations Insight 323

v For the other widgets that are shown in the diagram to be having amaster-listener interaction, click any of the bars that represent the interface tochange the listener widget that displays the related data for the selectedinterface.
The diagram shows the master-listener, and drill-down interactions between theavailable widgets:
Network Performance Overview1. Click Home > Network Performance Overview.
The Network Performance Overview: Top 10 dashboard loads.This dashboard displays the metrics values for top 10 resources.You can filter data based on the Time Period of Last Hour or Last 24 Hours.
324 IBM Netcool Operations Insight: Integration Guide

Table 43. Widget interactions
Area monitored Master widgets Listener widgetsDrill-downdashboard
Congestion Top 10 OutboundPacket DiscardDeviation (%)
Click any bar thatrepresents theinterface outboundpacket discarddeviation to refreshthe listener widgetsto display the relateddata for the selectedinterface.
Total Packet DropsPer Queue (Packets)
Click Find out moredetails about PacketDrops per Queue.Click here link toopen the QoS QueueDrops dashboard in anew tab.
QoS Queue Drops
Top 10 Applicationsby Total Delay (ms)
Click any bar thatrepresent anapplication in Top 10Applications by TotalDelay (ms), theApplication ResponseTime page opens in anew tab.
ApplicationsResponse Time
Top 10 InboundPacket DiscardDeviation (%)
N/A N/A
Networks for Operations Insight 325

Table 43. Widget interactions (continued)
Area monitored Master widgets Listener widgetsDrill-downdashboard
Quality of Service Top 10 Round-TripTime Deviation (%)
Click any bar thatrepresents theround-trip timebetween a source anddestination device IPaddresses to open theIPSLA Historydashboard in a newtab.
N/A
IPSLA History
Top 10 Probe LossDeviation (%)
Click any bar thatrepresents the probeloss between a sourceand destinationdevice IP addressesto open the IPSLAHistory dashboard ina new tab.
N/A
Top 10 VoIP InboundJitter Deviation (%)
or
Top 10 VoIPOutbound JitterDeviation (%)
Click any bar thatrepresents the VoIPInbound orOutbound JitterDeviation between asource anddestination device IPaddresses to refreshthe listener widgets.
Note: Click the Data
Source icon ( ) totoggle between Top10 VoIP OutboundJitter Deviation (%)and Top 10 VoIPInbound JitterDeviation (%)widgets.
VoIP Voice Quality
The widget displaysthe following metricsfor the same devices:
v MOS
v IcPIF
Click Source -Destination:<IP_Address>-<IP_Address> toopen the IPSLAHistory dashboard ina new tab.
326 IBM Netcool Operations Insight: Integration Guide

Table 43. Widget interactions (continued)
Area monitored Master widgets Listener widgetsDrill-downdashboard
Traffic Top 10 OutboundUtilization Deviation(%)
Click any bar thatrepresents theinterface outboundutilization deviationto refresh the listenerwidgets to displaythe related data forthe selected interface.
Top 10 Applicationsby Total Volume(Octets)
Top 10 Applicationsby AverageUtilization (%)
Click Find out moredetails about theApplication. Clickhere link to open theTop Applications:Traffic VolumeDetails for Interfacedashboard a new tab.
Top ApplicationsTop 10 InboundUtilization Deviation(%)
Click any bar thatrepresents theinterface inboundutilization deviationto refresh the listenerwidgets to displaythe related data forthe selected interface.
Device load Top 10 CPU LoadDeviation (%)
Click any bar thatrepresents the CPULoad Deviation on aresource, the DeviceHealth Historydashboard for thesame resource opensin a new tab.
N/A
Device HealthHistoryTop 10 Memory Load
Deviation (%)
Click any bar thatrepresents theMemory LoadDeviation on aresource, the DeviceHealth Historydashboard for thesame resource opensin a new tab.
N/A
Networks for Operations Insight 327

Table 44. Available Widgets
Widget name Chart type Typical uses
Top 10 Outbound PacketDiscard Deviation (%)
Bar Measures the number of outbound packetsthat are discarded even though no errorsare detected to free the buffer space. Itmight be due to resource limitations on theoutbound interface.
Total Packet Drops Per Queue(Packets)
Bar Measures the number of packet drops pertraffic class queue per interface.
Top 10 Inbound Packet DiscardDeviation (%)
Bar Measures the number of inbound packetsthat are discarded even though no errorsare detected to free the buffer space. Itmight be due to resource limitations on theinbound interface.
Top 10 Applications by TotalDelay (ms)
Bar Measures maximum total time that it takesan application to respond to user requests.The total delay is the sum of max clientnetwork delay, max server network delay,and application delay.
Top 10 Round-Trip TimeDeviation (%)
Bar Measures the time that is taken betweensending a UDP echo request message froma source device to the destination deviceand receiving a UDP echo reply from thedestination device. It is useful introubleshooting issues with business-criticalapplications by determining the round-tripdelay times and testing connectivitybetween devices.
Top 10 Probe Loss Deviation(%)
Bar Measures the percentage of probes lost. itshows the completion status of an RTToperation.
Top 10 VoIP Inbound JitterDeviation (%)
Bar Measures the variance in latency (jitter)deviation over time in incoming directionbetween two devices in your network.
Top 10 VoIP Outbound Jitter(ms)
Bar Measures the variance in latency (jitter)deviation over time in outgoing directionbetween two devices in your network.
328 IBM Netcool Operations Insight: Integration Guide

Table 44. Available Widgets (continued)
Widget name Chart type Typical uses
VoIP Voice Quality Badge Measures voice performance that isimportant for delivering voice qualityservices. This widget shows two metrics:
v Mean Opinion Scores (MOS).
A common benchmark to determinevoice quality is MOS. With MOS, a widerange of listeners can judge the quality ofvoice samples on a scale of 1 (badquality) to 5 (excellent quality). The CiscoIOS implementation of MOS takes RTTdelay and packet loss into the MOScalculation. However, jitter is notincluded.
The following colors on the widgetdenote the severity of degradation ofvoice quality:
– Green, when the MOS value is 5 ormore
– Light Green, when the MOS value is 4
– Yellow, when the MOS value is 3
– Red, when the MOS value is in therange 0 - 2
v Impairment/Calculated PlanningImpairment Factor (IcPIF)
IcPIF values are expressed in a typicalrange of 5 (low impairment) to 55 (highimpairment). Typically, IcPIF valuesnumerically less than 20 are consideredadequate.
The following colors on the widgetdenote the severity of degradation ofvoice quality:
– Green, when the IcPIF value is in therange 5 - 19
– Light Green, when the IcPIF value isin the range 20 - 39
– Yellow, when the IcPIF value is in therange 40 - 54
– Red, when the IcPIF value is 55 ormore
Top 10 Outbound UtilizationDeviation (%)
Bar Measures outbound bandwidth utilizationdeviation for the highest Outbound PacketDiscards on the interfaces.
Top 10 Applications by TotalVolume (Octets)
Bar Measures the corresponding applicationswith highest bandwidth utilization byvolume.
Top 10 Inbound UtilizationDeviation (%)
Bar Measures the bandwidth utilizationdeviation for incoming traffic for thehighest Inbound Packet Discard Deviationon the interfaces.
Networks for Operations Insight 329

Table 44. Available Widgets (continued)
Widget name Chart type Typical uses
Top 10 Applications byAverage Utilization (%)
Bar Measures the corresponding applicationswith highest bandwidth utilization bypercentage.
Top 10 CPU Load Deviation(%)
Bar Measure the total CPU utilization deviationin percentage across all vendor devices inyour network. Currently, NetworkPerformance Insight supports the followingvendors:
v Cisco
v Huawei
v Juniper
Top 10 Memory LoadDeviation (%)
Bar Measure the total memory usage deviationin percentage across all vendor devices inyour network. Currently, NetworkPerformance Insight supports the followingvendors:
v Cisco
v Huawei
v Juniper
NetFlow dashboards1.4.1.1
Network flow monitoring is often used to resolve network performance issues andensure Quality of Service (QoS) for key applications and services.
Network flow monitoring gives visibility to an effective network and infrastructuremanagement. Network Performance Insight Dashboards track the flow ofapplications and key services over all areas of the network, such as devices,servers, and more and offer insights into network bandwidth utilization.
Network Performance Insight Dashboards populates the performance metricsbased on the collected IP network traffic information as the packet enters or exitsan interface of a device.
When you select an interface for a device, this resource provides a view of theapplications responsible for traffic volume, either inbound or outbound, throughthe interface over the selected time period. This data provides granular detailsabout network traffic that passes through an interface.
To view NetFlow dashboards, you first need to configure Network PerformanceInsight. Each configuration setting is associated with a separate Top N dashboard.For more information, see Configuring Network Performance Insight systemenvironment.
To view the NetFlow dashboards, you first need to configure NetworkPerformance Insight. Each configuration setting is associated with a separate Top Ndashboard. For more information, see Configuring Network Performance Insightsystem environment section in Installing and Configuring IBM Network PerformanceInsight.
330 IBM Netcool Operations Insight: Integration Guide

Drill-down dashboard views
The diagram shows the flow dashboard groups and the available views.
Network Traffic Overview dashboard1.4.1.2
Network traffic overview dashboard provides comprehensive bandwidth analysisand performance metrics monitoring capabilities by monitoring the worstperforming interfaces. This helps you to understand further the interface utilizationtrend and also the IP traffic composition that is related to that interface based onthe flow data collected.
Use Network Traffic Overview dashboard to monitor network performance detailsof a particular interface, the traffic trends, and the usage patterns of your network.It identifies the network Top Talkers on applications that use the most networkbandwidth.
Available widgets and their interactivity
The master-listener and drill-down widget interactions can be seen in the followingways:
Networks for Operations Insight 331
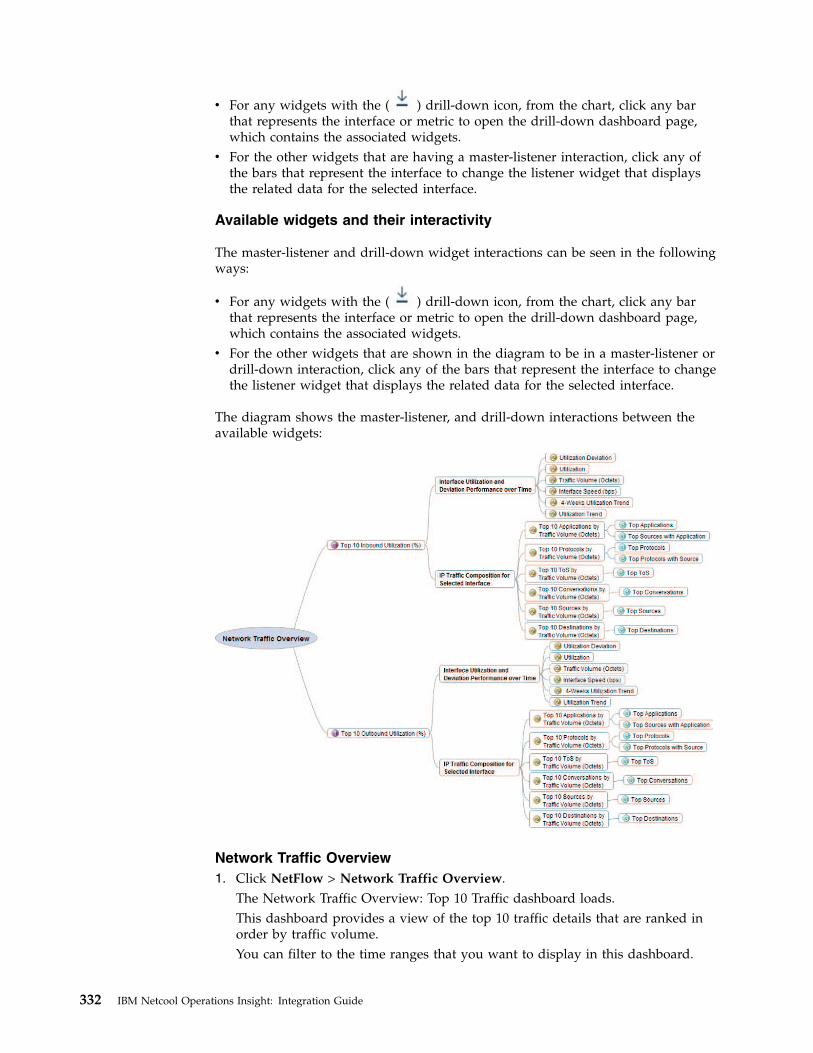
v For any widgets with the ( ) drill-down icon, from the chart, click any barthat represents the interface or metric to open the drill-down dashboard page,which contains the associated widgets.
v For the other widgets that are having a master-listener interaction, click any ofthe bars that represent the interface to change the listener widget that displaysthe related data for the selected interface.
Available widgets and their interactivity
The master-listener and drill-down widget interactions can be seen in the followingways:
v For any widgets with the ( ) drill-down icon, from the chart, click any barthat represents the interface or metric to open the drill-down dashboard page,which contains the associated widgets.
v For the other widgets that are shown in the diagram to be in a master-listener ordrill-down interaction, click any of the bars that represent the interface to changethe listener widget that displays the related data for the selected interface.
The diagram shows the master-listener, and drill-down interactions between theavailable widgets:
Network Traffic Overview1. Click NetFlow > Network Traffic Overview.
The Network Traffic Overview: Top 10 Traffic dashboard loads.This dashboard provides a view of the top 10 traffic details that are ranked inorder by traffic volume.You can filter to the time ranges that you want to display in this dashboard.
332 IBM Netcool Operations Insight: Integration Guide

Table 45. Widget interactions
Master widgets Listener widgets Drill-down dashboard
Top 10 Inbound Utilization(%)
or
Top 10 Outbound Utilization(%)
Click any bar that representsthe interface inbound oroutbound utilization torefresh the listener widgetsto display the related datafor the selected interface.
The listener widgets from theInterface Utilization andDeviation Performance overTime pane are:
v Utilization Deviation
v Utilization
v Traffic Volume (Octets)
v Interface Speed (bps)
v 4-Weeks Utilization Trend
v Utilization Trend
N/A
The listener widgets from theIP Traffic Composition forSelected Interface pane are:
v Top 10 Applications byTraffic Volume(Octets)Click
Find out more detailsabout top users withapplication. Click here toopen the Top Sources withApplication dashboard.
v Top 10 Protocols by TrafficVolume (Octets)Click
Find out more detailsabout top users withprotocol. Click here toopen the Top Protocolswith Source dashboard.
v Top 10 ToS by TrafficVolume (Octets)
v Top 10 Conversations byTraffic Volume (Octets)
v Top 10 Sources by TrafficVolume (Octets)
v Top 10 Destinations byTraffic Volume (Octets)
Click the listener widgetstitle bar to drill down to theNetFlow dashboards for amore detailed information onthe flow data.
v Top Applications
v Top Sources withApplication
v Top Protocols
v Top Protocols with Source
v Top ToS
v Top Conversation
v Top Sources
v Top Destinations
For more information, see“NetFlow dashboards” onpage 330.
Table 46. Available Widgets
Widget name Chart type Typical uses
Top 10 Inbound Utilization (%) Bar Display the top 10 worst performinginbound or outbound interfaces, which arebased on the interface utilization metric thatis calculated from the flow data collected.The data is displayed based on the selectedtime period.
Top 10 Outbound Utilization(%)
Bar
Networks for Operations Insight 333

Table 46. Available Widgets (continued)
Widget name Chart type Typical uses
Utilization Deviation Badge Display the interface utilization deviationpercentage.
The utilization deviation metric iscalculated by comparing the interfaceutilization values of the previous fourweeks over the same time period.
Utilization Badge Display the interface utilization percentage.
Traffic Volume (Octets) Badge Display the traffic volume in octets for theselected interface.
Interface Speed (bps) Badge Display the interface speed in bits persecond (bps).
4-Weeks Utilization Trend Bar Displays the interface utilization trend ofthe selected interface.
Note: The deviation is calculated based onthe 30-minutes aggregation table.
Utilization Trend Timeseries Displays the time-series utilizationperformance of the selected interface andtime period.
Top 10 Applications by TrafficVolume (Octets)
Donut Displays the top 10 applications, whichconsumed the most network bandwidth forthe selected interface.
Top 10 Protocols by TrafficVolume (Octets)
Donut Displays the top 10 protocols, whichconsumed the most network bandwidth forthe selected interface.
Top 10 ToS by Traffic Volume(Octets)
Donut Displays the top 10 Type of Services (ToS)which consumed the most networkbandwidth for the selected interface.
Top 10 Conversations byTraffic Volume (Octets)
Donut Displays the top 10 conversation (the source- destination IP addresses) which consumedthe most network bandwidth for theselected interface.
Top 10 Sources by TrafficVolume (Octets)
Donut Displays the top 10 sources IP, whichconsumed the most network bandwidth forthe selected interface.
Top 10 Destinations by TrafficVolume (Octets)
Donut Displays the top 10 destinations IP, whichconsumed the most network bandwidth forthe selected interface.
Navigate to different NetFlow dashboards1.4.1.1
This section describes the navigation from an existing NetFlow dashboard toanother NetFlow Top 10 dashboard view.
You can choose to navigate to a different NetFlow dashboard, by clicking theaggregation type to view options available.
For example,
334 IBM Netcool Operations Insight: Integration Guide

1. Click NetFlow > Applications > Top Applications
The Top Applications: Traffic Volume Details for Interface dashboard loads.2. From the Select aggregation type to view pane, you can click any of the
options to view the NetFlow dashboard.The selected NetFlow Top 10 dashboard loads in a new tab.
Aggregation type to view
The views are categorized into the following types:v Aggregationv IP Grouping aggregation
The table explains which NetFlow dashboard is loaded based on your aggregationtype selection.
Table 47. Aggregation type to view
Aggregation NetFlow Dashboards
>> Applications Top Applications
>> Applications with ToS Top Applications with ToS
>> Sources Top Sources
>> Sources with Application Top Sources with Application
>> Destinations Top Destinations
>> Destinations with Application Top Destinations with Application
>> Conversations Top Conversations
>> Conversations with Application Top Conversations with Application
>> Conversations with ToS Top Conversations with ToS
>> Protocols Top Protocols
>> Protocols with Application Top Protocols with Application
>> Protocols with Conversation Top Protocols with Conversation
>> Protocols with Destination Top Protocols with Destination
>> Protocols with Source Top Protocols with Source
>> AS Conversation Top Autonomous System Conversations
>> Destination AS Top Destination Autonomous Systems
>> Source AS Top Source Autonomous Systems
>> ToS Top ToS
Table 48. IP Grouping aggregation type to view
IP Grouping aggregation NetFlow Dashboards
>> Source IP Groups Top Source IP Groups
>> Source IP Groups with Application Top Source IP Groups with Application
>> Source IP Groups with ToS Top Source IP Groups with ToS
>> Source IP Groups with Protocol Top Source IP Groups with Protocol
>> Destination IP Groups Top Destination IP Groups
>> Destination IP Groups with Application Top Destination IP Groups with Application
>> Destination IP Groups with ToS Top Destination IP Groups with ToS
Networks for Operations Insight 335

Table 48. IP Grouping aggregation type to view (continued)
IP Grouping aggregation NetFlow Dashboards
>> Destination IP Groups with Protocol Top Destination IP Groups with Protocol
>> IP Group Conversations Top IP Group Conversations
>> IP Groups Conversations withApplication
Top IP Group Conversations withApplication
>> IP Groups Conversations with ToS Top IP Group Conversations with ToS
>> IP Groups Conversations with Protocol Top IP Group Conversations with Protocol
Applications dashboards1.4.1.1
This topic gives you an overview of the Applications dashboards usage.
Top Applications with ToS1. Click NetFlow > Applications > Top Applications with ToS.
The Top Applications with ToS: Traffic Volume Details for Interface dashboardloads.This dashboard provides a top 10 view of network traffic segmented by Type ofService (ToS) method for an interface.
Note: Dashboard filters allow you to choose different views of data to bedisplayed on the active dashboard tab. You can select the filter values or timeranges that you want to display in dashboards to which the filter is assigned.
Table 49. Available Widgets
Widget Name Chart Type Description
Top 10 Applications with ToS Donut Displays the top 10 applications name byType of Service (ToS) method for aninterface.
The percentage of the Applications withToS is based on the selected applicationwith ToS that is shown by the widget.The individual application in the legendadds up to 100%. This percentage can beabsolute or relative.
Traffic Volume Trend Timeseries This timeseries widget displays theTraffic Volume trend in octets across aselected time.
You can choose to display the Utilizationtrend in percentage or the ThroughputTrend in bit per second (bps).
It describes how the application uses theinterface bandwidth in octets, bps, orpercentage.
336 IBM Netcool Operations Insight: Integration Guide

Table 49. Available Widgets (continued)
Widget Name Chart Type Description
Top 10 Applications with ToS Grid Displays the Top 10 traffic data (in octetsand packets) of device applications withToS through the selected interface.
The columns that are displayed dependon the flow direction set, either Inboundor Outbound for the selected timeperiod.
Top Applications1. Click NetFlow > Applications > Top Applications.
The Top Applications: Traffic Volume Details for Interface dashboard loads.This dashboard provides a view of the top 10 applications responsible formonitored traffic on your network, ranked in order of traffic volume for aninterface.
Table 50. Available Widgets
Widget Name Chart Type Description
Top 10 Applications Donut Displays the top 10 applications namewith its total traffic volume in octets.
The percentage of the application isbased on the selected application that isshown by the widget. The individualapplication in the legend adds up to100%. This percentage can be absolute orrelative.
Traffic Volume Trend Timeseries This timeseries widget displays theTraffic Volume trend in octets across aselected time.
You can choose to display the Utilizationtrend in percentage or the Throughputtrend in bit per second (bps).
It describes how the application uses theinterface bandwidth in octets, bps, orpercentage.
Top 10 Applications Grid Displays the Top 10 traffic data (in octetsand packets) of device applicationsthrough the selected interface.
The columns that are displayed dependon the flow direction set, either Inboundor Outbound for the selected timeperiod.
Networks for Operations Insight 337

Autonomous Systems dashboards1.4.1.1
This topic gives you an overview of the Autonomous Systems dashboards usage.
Top Destination Autonomous Systems1. Click NetFlow > Autonomous Systems > Top Destination Autonomous
Systems.The Top Destination Autonomous Systems: Traffic Volume Details for Interfacedashboard loads.
This dashboard provides a view of the top 10 list of destination AutonomousSystems with highest bandwidth consumption. Destination Autonomous Systemsare listed with the amount of data that is transferred, in both octets and packets,and the percentage of traffic utilization generated by the autonomous system overthe specified time period.
Note:
You can select the filter values or time ranges that you want to display indashboards to which the filter is assigned.
Table 51. Available Widgets
Widget Name Chart Type Description
Top 10 DestinationAutonomous Systems
Donut Displays the top 10 destinationAutonomous Systems name with its totaltraffic volume in octets.
The percentage of the destination isbased on the selected destination that isshown by the widget. The individualdestination in the legend adds up to100%. This percentage can be absolute orrelative.
Traffic Volume Trend Timeseries This timeseries widget displays theTraffic Volume trend in octets across aselected time.
You can choose to display the Utilizationtrend in percentage or the Throughputtrend in bit per second (bps).
It describes how the destination ofAutonomous Systems traffic uses theinterface bandwidth in octets, bps, orpercentage.
338 IBM Netcool Operations Insight: Integration Guide

Table 51. Available Widgets (continued)
Widget Name Chart Type Description
Top 10 DestinationAutonomous Systems
Grid Displays the Top 10 traffic data (in octetsand packets) that flows in the selectedautonomous systems destination throughthe selected interface of a device.
Displays the Top 10 traffic data (in octetsand packets) of device destination ofAutonomous Systems through theselected interface.
The columns display depend on the flowdirection, either Inbound or Outboundfor the selected time period.
Top Source Autonomous Systems1. Click NetFlow > Autonomous Systems > Top Source Autonomous Systems.
The Top Source Autonomous Systems: Traffic Volume Details for Interfacedashboard loads.
This dashboard provides a view of the top 10 list of source Autonomous Systemswith highest bandwidth consumption. Source Autonomous Systems are listed withthe amount of data that is transferred, in both octets and packets, and thepercentage of traffic utilization generated by the autonomous system over thespecified time period.
Table 52. Available Widgets
Widget Name Chart Type Description
Top 10 Source AutonomousSystems
Donut Displays the top 10 source AutonomousSystems name with its total trafficvolume in octets.
The percentage of the source is based onthe selected source that is shown by thewidget. The individual application in thelegend adds up to 100%. This percentagecan be absolute or relative.
Traffic Volume Trend Timeseries This timeseries widget displays theTraffic Volume trend in octets across aselected time.
You can choose to display the Utilizationtrend in percentage or the ThroughputTrend in bit per second (bps).
It describes how the conversation ofAutonomous Systems traffic uses theinterface bandwidth in octets, bps, orpercentage.
Networks for Operations Insight 339

Table 52. Available Widgets (continued)
Widget Name Chart Type Description
Top 10 Source AutonomousSystems
Grid Displays the Top 10 traffic data (in octetsand packets) that flows in the selectedautonomous systems sources through theselected interface of a device.
The columns display depend on the flowdirection, either Inbound or Outboundfor the selected time period.
Top Autonomous System Conversations1. Click NetFlow > Autonomous Systems > Top Autonomous System
Conversations.The Top Autonomous System Conversations: Traffic Volume Details forInterface dashboard loads.This dashboard provides a view of the top 10 list of Autonomous Systemconversations with highest bandwidth consumption. Autonomous SystemConversations are listed with the amount of data that is transferred, in bothoctets and packets, and the percentage of traffic utilization generated by theautonomous system over the specified time period.
Table 53. Available Widgets
Widget Name Chart Type Description
Top 10 Autonomous SystemConversations
Donut Displays the top 10 Autonomous Systemconversations name with its total trafficvolume in octets.
The percentage of the conversation isbased on the selected conversation that isshown by the widget. The individualconversation in the legend adds up to100%. This percentage can be absolute orrelative.
Traffic Volume Trend Timeseries This timeseries widget displays theTraffic Volume trend in octets across aselected time period.
You can choose to display the Utilizationtrend in percentage or the ThroughputTrend in bit per second (bps).
It describes how the conversation ofAutonomous Systems traffic uses theinterface bandwidth in octets, bps, orpercentage.
Top 10 Autonomous SystemConversations
Grid Displays the Top 10 traffic data (in octetsand packets) that flows in the selectedautonomous systems conversationthrough the selected interface of adevice.
The columns display depend on the flowdirection, either Inbound or Outboundfor the selected time period.
340 IBM Netcool Operations Insight: Integration Guide

Conversations dashboards1.4.1.1
This topic gives you an overview of the Conversations dashboards usage.
Top Conversations with Application1. Click NetFlow > Conversations > Top Conversations with Application.
The Top Conversations with Application: Traffic Volume Details for Interfacedashboard loads.This dashboard provides a view of the top 10 most bandwidth consumingconversations with applications that are conducted over your monitorednetwork. Conversations with application are listed with the amount of data thatis transferred in the conversation, in both octets and packets.
Note:
You can select the filter values or time ranges that you want to display indashboards to which the filter is assigned.
Table 54. Available Widgets
Widget Name Chart Type Description
Top 10 Conversations withApplication
Donut Displays the top 10 conversations withapplication name with its total trafficvolume in octets.
The percentage of the conversations withapplication is based on the selection onthe widget. The individual conversationwith application in the legend adds upto 100%. This percentage can be absoluteor relative.
Traffic Volume Trend Timeseries This timeseries widget displays theTraffic Volume trend in octets across aselected time period.
You can choose to display the Utilizationtrend in percentage or the Throughputtrend in bit per second (bps).
It describes how the conversation trafficuses the interface bandwidth in octets,bps, or percentage.
Top 10 Conversations withApplication
Grid Displays the Top 10 traffic data (in octetsand packets) that flows in the selectedconversations with application throughthe selected interface of a device.
The columns display depend on the flowdirection, either Inbound or Outboundfor the selected time period.
Top Conversations with ToS1. Click NetFlow > Conversations > Top Conversations with ToS.
The Top Conversations with ToS: Traffic Volume Details for Interface dashboardloads.
Networks for Operations Insight 341

This dashboard provides a view of the top 10 most bandwidth consumingconversations with ToS conducted over your monitored network. Conversationswith ToS are listed with the amount of data that is transferred in theconversation, in both octets and packets.
Table 55. Available Widgets
Widget Name Chart Type Description
Top 10 Conversations withToS
Donut Displays the top 10 conversations withToS name with its total traffic volume inoctets.
The percentage of the conversations withToS is based on the selection on thewidget. The individual conversation inthe legend adds up to 100%. Thispercentage can be absolute or relative.
Traffic Volume Trend Timeseries This timeseries widget displays theTraffic Volume trend in octets across aselected time period.
You can choose to display the Utilizationtrend in percentage or the Throughputtrend in bit per second (bps).
It describes how the conversation trafficuses the interface bandwidth in octets,bps, or percentage.
Top 10 Conversations withToS
Grid Displays the Top 10 traffic data (in octetsand packets) that flows in the selectedconversations with ToS through theselected interface of a device.
The columns display depend on the flowdirection, either Inbound or Outboundfor the selected time period.
Top Conversations1. Click NetFlow > Conversations > Top Conversations.
The Top Conversations: Traffic Volume Details for Interface dashboard loads.This dashboard provides a view of the top 10 most bandwidth consumingconversations, which are conducted over your monitored network.Conversations are listed with the amount of data that is transferred in theconversation, in both octets and packets.
Table 56. Available Widgets
Widget Name Chart Type Typical uses
Top 10 Conversations Donut Displays the top 10 conversations namewith its total traffic volume in octets.
The percentage of the conversations isbased on the selected conversation that isshown by the widget. The individualconversation in the legend adds up to100%. This percentage can be absolute orrelative.
342 IBM Netcool Operations Insight: Integration Guide

Table 56. Available Widgets (continued)
Widget Name Chart Type Typical uses
Traffic Volume Trend Timeseries This timeseries widget displays theTraffic Volume trend in octets across aselected time period.
You can choose to display the Utilizationtrend in percentage or the ThroughputTrend in bit per second (bps).
It describes how the conversation trafficuses the interface bandwidth in octets,bps, or percentage.
Top 10 Conversations Grid Displays the Top 10 traffic data (in octetsand packets) that flows in the selectedconversations through the selectedinterface of a device.
The columns display depend on the flowdirection, either Inbound or Outboundfor the selected time period.
Destinations dashboards1.4.1.1
This topic gives you an overview of the Destinations dashboards usage.
Top Destinations with Application1. Click NetFlow > Destinations > Top Destinations with Application.
The Top Destinations with Application: Traffic Volume Details for Interfacedashboard loads.This dashboard provides a view of the top 10 destinations with applicationresponsible for monitored traffic on your network, ranked in order of trafficvolume.
Note:
You can select the filter values or time ranges that you want to display indashboards to which the filter is assigned.
Table 57. Available Widgets
Widget Name Chart Type Description
Top 10 Destinations withApplication
Donut Displays the top 10 destinations withapplication name with its total trafficvolume in octets.
The percentage of the destinations withapplication is based on the selection onthe widget. The individual destinationwith application adds up to 100%. Thispercentage can be absolute or relative.
Networks for Operations Insight 343

Table 57. Available Widgets (continued)
Widget Name Chart Type Description
Traffic Volume Trend Timeseries This timeseries widget displays theTraffic Volume trend in octets across aselected time period.
You can choose to display the Utilizationtrend in percentage or the Throughputtrend in bit per second (bps).
It describes how the destinations trafficuses the interface bandwidth in octets,bps, or percentage.
Top 10 Destinations withApplication
Grid Displays the Top 10 traffic data (in octetsand packets) that flows in the selecteddestination with application through theselected interface of a device.
The columns display depend on the flowdirection, either Inbound or Outboundfor the selected time period.
You can drill down to the ApplicationsResponse Time page by clicking therequired application or category fromthis widget to view the network responsetime issues.
Top Destinations1. Click NetFlow > Destinations > Top Destinations.
The Top Destinations: Traffic Volume Details for Interface dashboard loads.This dashboard provides a view of the top 10 domains that serve asdestinations of traffic on the network, ranked by percentage of the total trafficover the specified time period.
Table 58. Available Widgets
Widget Name Chart Type Description
Top 10 Destinations Donut Displays the top 10 destinations namewith its total traffic volume in octets.
The percentage of the destinations isbased on the selected destinations thatare shown by the widget. The individualdestination adds up to 100%. Thispercentage can be absolute or relative.
Traffic Volume Trend Timeseries This timeseries widget displays theTraffic Volume trend in octets across aselected time period.
You can choose to display the Utilizationtrend in percentage or the Throughputtrend in bit per second (bps).
It describes how the destinations trafficuses the interface bandwidth in octets,bps, or percentage.
344 IBM Netcool Operations Insight: Integration Guide

Table 58. Available Widgets (continued)
Widget Name Chart Type Description
Top 10 Destinations Grid Displays the Top 10 traffic data (in octetsand packets) that flows in the selecteddestinations through the selectedinterface of a device.
The columns display depend on the flowdirection, either Inbound or Outboundfor the selected time period.
IP Address Grouping dashboards1.4.1.1
This topic gives you an overview of the IP Address Grouping dashboards usage.
Top IP Group Conversations1. Click NetFlow > IP Address Grouping > Top IP Group Conversations.
The Top IP Group Conversations: Traffic Volume Details for Interfacedashboard loads.This dashboard provides a view of the top 10 bandwidth consumingconversations that is associated with an IP address group, which is responsiblefor the most traffic on your network.
Note:
You can select the filter values or time ranges that you want to display indashboards to which the filter is assigned.
Table 59. Available Widgets
Widget Name Chart Type Description
Top 10 IP GroupConversations
Donut Displays the top 10 IP Groupconversations and its total traffic volumein octets.
The percentage of the IP Groupconversations is based on the selectionon the widget. The individual IP Groupconversations add ups to 100%. Thispercentage can be absolute or relative.
Traffic Volume Trend Timeseries This timeseries widget displays theTraffic Volume trend in octets across aselected time period.
You can choose to display the Utilizationtrend in percentage or the Throughputtrend in bit per second (bps).
It describes how the IP Groupconversations traffic utilize the interfacebandwidth in octets, bps, or percentage.
Networks for Operations Insight 345
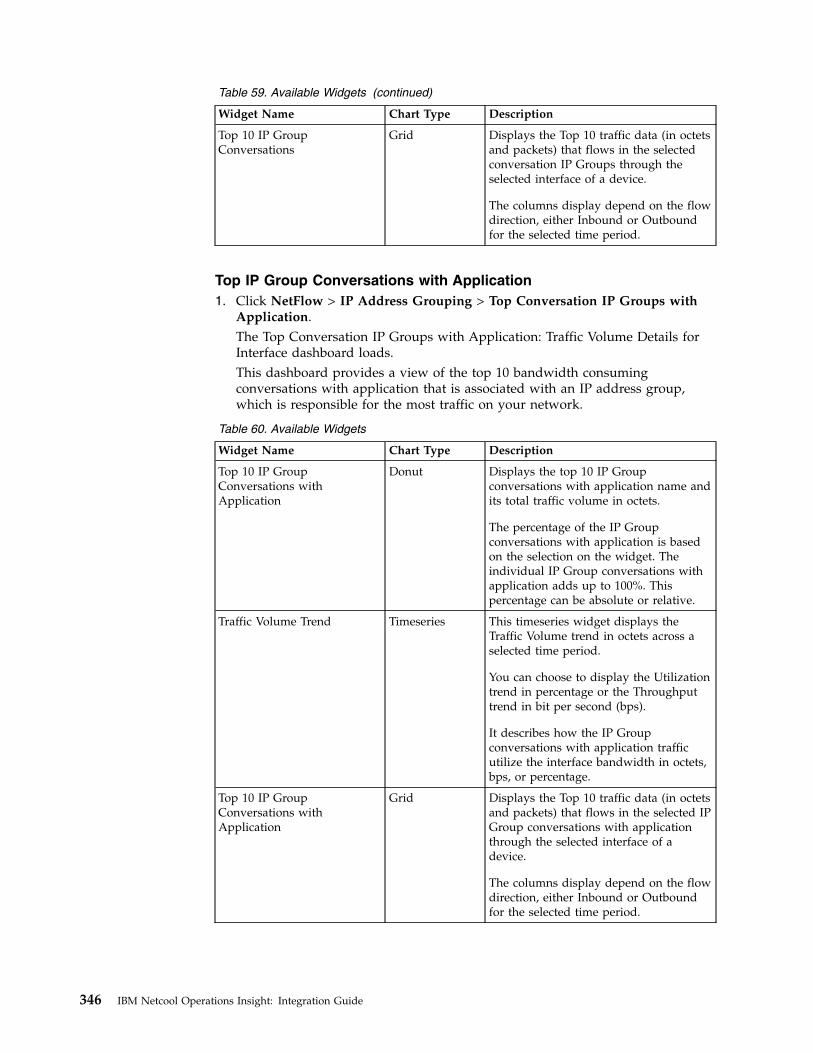
Table 59. Available Widgets (continued)
Widget Name Chart Type Description
Top 10 IP GroupConversations
Grid Displays the Top 10 traffic data (in octetsand packets) that flows in the selectedconversation IP Groups through theselected interface of a device.
The columns display depend on the flowdirection, either Inbound or Outboundfor the selected time period.
Top IP Group Conversations with Application1. Click NetFlow > IP Address Grouping > Top Conversation IP Groups with
Application.The Top Conversation IP Groups with Application: Traffic Volume Details forInterface dashboard loads.This dashboard provides a view of the top 10 bandwidth consumingconversations with application that is associated with an IP address group,which is responsible for the most traffic on your network.
Table 60. Available Widgets
Widget Name Chart Type Description
Top 10 IP GroupConversations withApplication
Donut Displays the top 10 IP Groupconversations with application name andits total traffic volume in octets.
The percentage of the IP Groupconversations with application is basedon the selection on the widget. Theindividual IP Group conversations withapplication adds up to 100%. Thispercentage can be absolute or relative.
Traffic Volume Trend Timeseries This timeseries widget displays theTraffic Volume trend in octets across aselected time period.
You can choose to display the Utilizationtrend in percentage or the Throughputtrend in bit per second (bps).
It describes how the IP Groupconversations with application trafficutilize the interface bandwidth in octets,bps, or percentage.
Top 10 IP GroupConversations withApplication
Grid Displays the Top 10 traffic data (in octetsand packets) that flows in the selected IPGroup conversations with applicationthrough the selected interface of adevice.
The columns display depend on the flowdirection, either Inbound or Outboundfor the selected time period.
346 IBM Netcool Operations Insight: Integration Guide

Top Source IP Groups with Protocol1. Click NetFlow > IP Address Grouping > Top Source IP Groups with Protocol.
The Top Source IP Groups with Protocol: Traffic Volume Details for Interfacedashboard loads.This dashboard provides a view of the top 10 source hosts that contribute totraffic on the network with protocols that are associated with IP address group,which is responsible for the most traffic on your network.
Table 61. Available Widgets
Widget Name Chart Type Description
Top 10 Source IP Groups withProtocol
Donut Displays the top 10 source IP Groupswith protocol name and its total trafficvolume in octets.
The percentage of the source IP Groupswith protocol is based on the selectionon the widget. The individual source IPGroups with protocol adds up to 100%.This percentage can be absolute orrelative.
Traffic Volume Trend Timeseries This timeseries widget displays theTraffic Volume trend in octets across aselected time period.
You can choose to display the Utilizationtrend in percentage or the Throughputtrend in bit per second (bps).
It describes how the source IP Groupswith protocols traffic utilize the interfacebandwidth in octets, bps, or percentage.
Top 10 Source IP Groups withProtocol
Grid Displays the Top 10 traffic data (in octetsand packets) that flows in the selectedsource IP Groups with protocol throughthe selected interface of a device.
The columns display depend on the flowdirection, either Inbound or Outboundfor the selected time period.
Top Destination IP Groups with Protocol1. Click NetFlow > IP Address Grouping > Top Destination IP Groups with
Protocol.The Top Destination IP Groups with Protocol: Traffic Volume Details forInterface dashboard loads.This dashboard provides a view of the top 10 domains that serve asdestinations of traffic on the network with protocol that are associated with anIP address group, which is responsible for the most traffic on your network.
Networks for Operations Insight 347

Table 62. Available Widgets
Widget Name Chart Type Description
Top 10 Destination IP Groupswith Protocol
Donut Displays the top 10 destination IPGroups with protocol name and its totaltraffic volume in octets.
The percentage of the destination IPGroups with protocols based on theselection on the widget. The individualdestination IP Groups with protocol addsup to 100%. This percentage can beabsolute or relative.
Traffic Volume Trend Timeseries This timeseries widget displays theTraffic Volume trend in octets across aselected time period.
You can choose to display the Utilizationtrend in percentage or the Throughputtrend in bit per second (bps).
It describes how the destination IPGroups with protocols traffic utilize theinterface bandwidth in octets, bps, orpercentage.
Top 10 Destination IP Groupswith Protocol
Grid Displays the Top 10 traffic data (in octetsand packets) that flows in the selecteddestination IP Groups with protocolthrough the selected interface of adevice.
The columns display depend on the flowdirection, either Inbound or Outboundfor the selected time period.
Top Source IP Groups with ToS1. Click NetFlow > IP Address Grouping > Top Source IP Groups with ToS.
The Top Source IP Groups with ToS: Traffic Volume Details for Interfacedashboard loads.This dashboard provides a view of the top 10 source hosts that contribute totraffic on the network with ToS associated with IP address groups, which isresponsible for the most traffic on your network.
Table 63. Available Widgets
Widget Name Chart Type Description
Top 10 Source IP Groups withToS
Donut Displays the top 10 source IP Groupswith ToS name and its total trafficvolume in octets.
The percentage of the source IP Groupswith ToS is based on the selection on thewidget. The individual source IP Groupswith ToS adds up to 100%. Thispercentage can be absolute or relative.
348 IBM Netcool Operations Insight: Integration Guide

Table 63. Available Widgets (continued)
Widget Name Chart Type Description
Traffic Volume Trend Timeseries This timeseries widget displays theTraffic Volume trend in octets across aselected time period.
You can choose to display the Utilizationtrend in percentage or the Throughputtrend in bit per second (bps).
It describes how the source IP Groupswith ToS traffic utilize the interfacebandwidth in octets, bps, or percentage.
Top 10 Source IP Groups withToS
Grid Displays the Top 10 traffic data (in octetsand packets) that flows in the selectedsource IP Groups with ToS through theselected interface of a device.
The columns display depend on the flowdirection, either Inbound or Outboundfor the selected time period.
Top IP Group Conversations with Protocol1. Click NetFlow > IP Address Grouping > Top Conversation IP Groups with
Protocol.The Top Conversation IP Groups with Protocol: Traffic Volume Details forInterface dashboard loads.This dashboard provides a view of the top 10 bandwidth consumingconversations with protocols that are associated with an IP address group,which is responsible for the most traffic on your network.
Table 64. Available Widgets
Widget Name Chart Type Description
Top 10 Conversation IPGroups with Protocol
Donut Displays the top 10 conversation IPGroups with protocol name and its totaltraffic volume in octets.
The percentage of the conversation IPGroups with protocol based on theselection on the widget. The individualconversation IP Groups with protocoladds up to 100%. This percentage can beabsolute or relative.
Traffic Volume Trend Timeseries This timeseries widget displays theTraffic Volume trend in octets across aselected time period.
You can choose to display the Utilizationtrend in percentage or the Throughputtrend in bit per second (bps).
It describes how the conversation IPGroups with protocols traffic utilize theinterface bandwidth in octets, bps, orpercentage.
Networks for Operations Insight 349
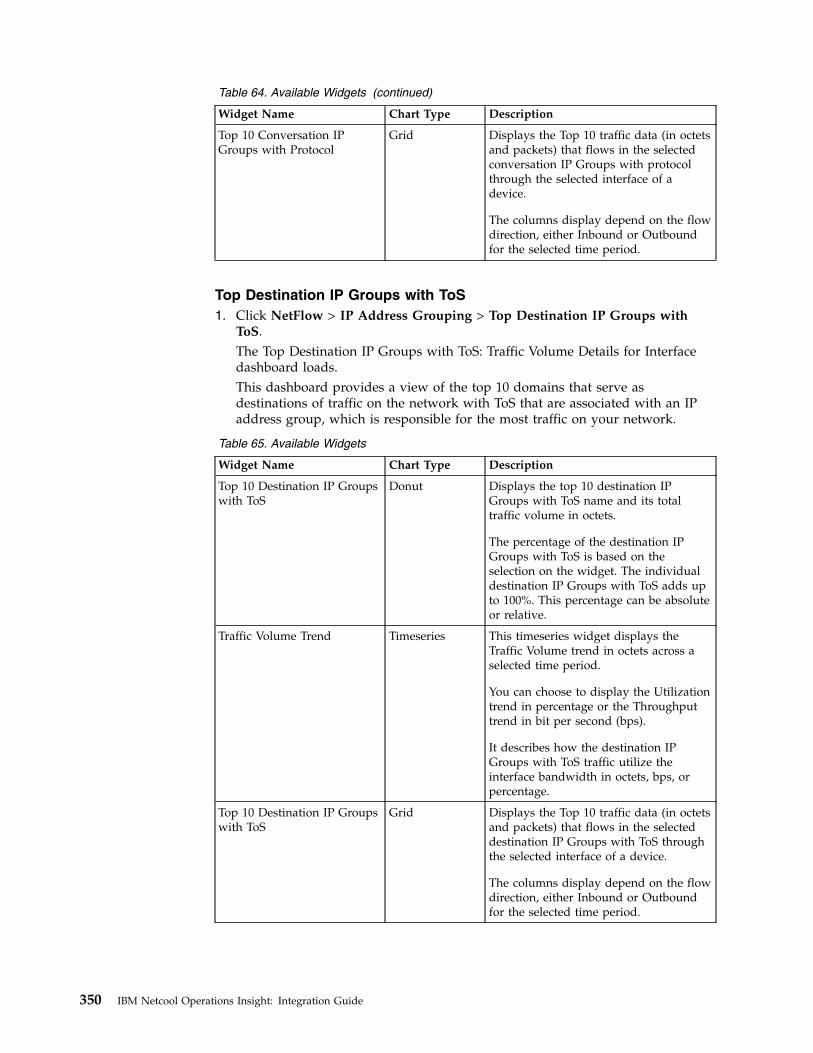
Table 64. Available Widgets (continued)
Widget Name Chart Type Description
Top 10 Conversation IPGroups with Protocol
Grid Displays the Top 10 traffic data (in octetsand packets) that flows in the selectedconversation IP Groups with protocolthrough the selected interface of adevice.
The columns display depend on the flowdirection, either Inbound or Outboundfor the selected time period.
Top Destination IP Groups with ToS1. Click NetFlow > IP Address Grouping > Top Destination IP Groups with
ToS.The Top Destination IP Groups with ToS: Traffic Volume Details for Interfacedashboard loads.This dashboard provides a view of the top 10 domains that serve asdestinations of traffic on the network with ToS that are associated with an IPaddress group, which is responsible for the most traffic on your network.
Table 65. Available Widgets
Widget Name Chart Type Description
Top 10 Destination IP Groupswith ToS
Donut Displays the top 10 destination IPGroups with ToS name and its totaltraffic volume in octets.
The percentage of the destination IPGroups with ToS is based on theselection on the widget. The individualdestination IP Groups with ToS adds upto 100%. This percentage can be absoluteor relative.
Traffic Volume Trend Timeseries This timeseries widget displays theTraffic Volume trend in octets across aselected time period.
You can choose to display the Utilizationtrend in percentage or the Throughputtrend in bit per second (bps).
It describes how the destination IPGroups with ToS traffic utilize theinterface bandwidth in octets, bps, orpercentage.
Top 10 Destination IP Groupswith ToS
Grid Displays the Top 10 traffic data (in octetsand packets) that flows in the selecteddestination IP Groups with ToS throughthe selected interface of a device.
The columns display depend on the flowdirection, either Inbound or Outboundfor the selected time period.
350 IBM Netcool Operations Insight: Integration Guide
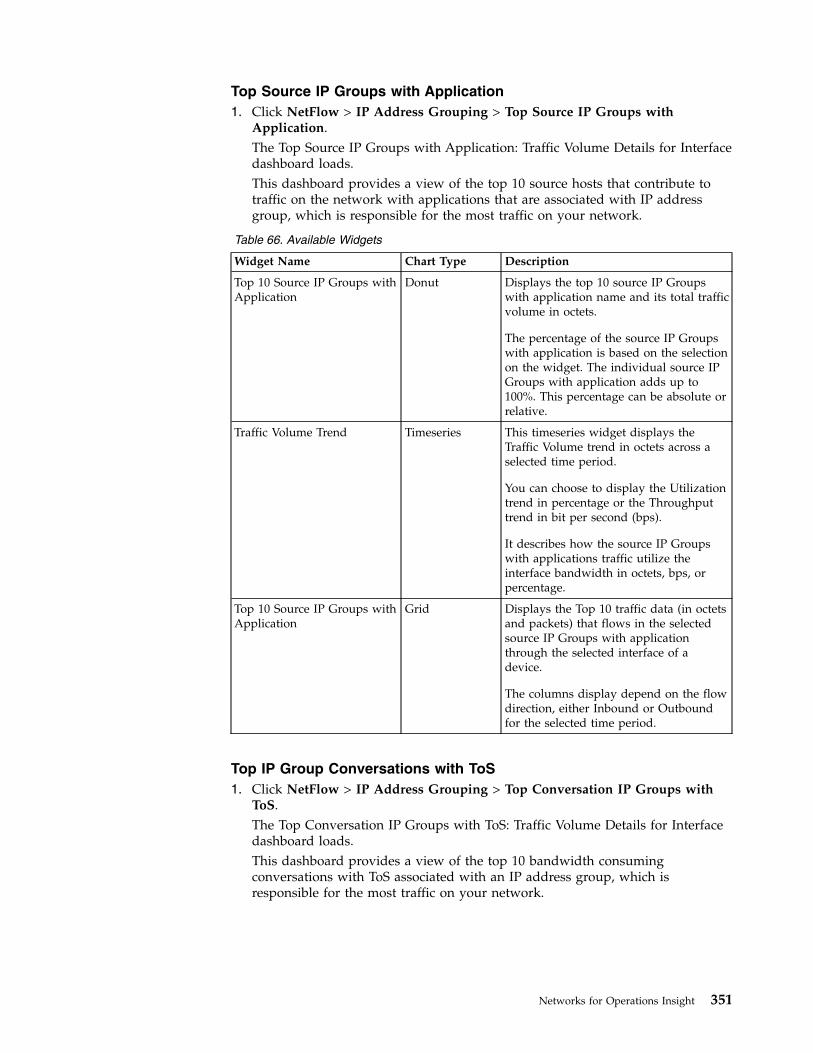
Top Source IP Groups with Application1. Click NetFlow > IP Address Grouping > Top Source IP Groups with
Application.The Top Source IP Groups with Application: Traffic Volume Details for Interfacedashboard loads.This dashboard provides a view of the top 10 source hosts that contribute totraffic on the network with applications that are associated with IP addressgroup, which is responsible for the most traffic on your network.
Table 66. Available Widgets
Widget Name Chart Type Description
Top 10 Source IP Groups withApplication
Donut Displays the top 10 source IP Groupswith application name and its total trafficvolume in octets.
The percentage of the source IP Groupswith application is based on the selectionon the widget. The individual source IPGroups with application adds up to100%. This percentage can be absolute orrelative.
Traffic Volume Trend Timeseries This timeseries widget displays theTraffic Volume trend in octets across aselected time period.
You can choose to display the Utilizationtrend in percentage or the Throughputtrend in bit per second (bps).
It describes how the source IP Groupswith applications traffic utilize theinterface bandwidth in octets, bps, orpercentage.
Top 10 Source IP Groups withApplication
Grid Displays the Top 10 traffic data (in octetsand packets) that flows in the selectedsource IP Groups with applicationthrough the selected interface of adevice.
The columns display depend on the flowdirection, either Inbound or Outboundfor the selected time period.
Top IP Group Conversations with ToS1. Click NetFlow > IP Address Grouping > Top Conversation IP Groups with
ToS.The Top Conversation IP Groups with ToS: Traffic Volume Details for Interfacedashboard loads.This dashboard provides a view of the top 10 bandwidth consumingconversations with ToS associated with an IP address group, which isresponsible for the most traffic on your network.
Networks for Operations Insight 351

Table 67. Available Widgets
Widget Name Chart Type Description
Top 10 Conversation IPGroups with ToS
Donut Displays the top 10 conversation IPGroups with ToS name and its totaltraffic volume in octets.
The percentage of the conversation IPGroups with ToS based on the selectionon the widget. The individualconversation IP Groups with ToS addsup to 100%. This percentage can beabsolute or relative.
Traffic Volume Trend Timeseries This timeseries widget displays theTraffic Volume trend in octets across aselected time period.
You can choose to display the Utilizationtrend in percentage or the Throughputtrend in bit per second (bps).
It describes how the conversation IPGroups with ToS traffic utilize theinterface bandwidth in octets, bps, orpercentage.
Top 10 Conversation IPGroups with ToS
Grid Displays the Top 10 traffic data (in octetsand packets) that flows in the selectedconversation IP Groups with ToS throughthe selected interface of a device.
The columns display depend on the flowdirection, either Inbound or Outboundfor the selected time period.
Top Destination IP Groups1. Click NetFlow > IP Address Grouping > Top Destination IP Groups.
The Top Destination IP Groups: Traffic Volume Details for Interface dashboardloads.This dashboard provides a view of the top 10 domains that serve asdestinations of traffic on the network that are associated with an IP addressgroup, which is responsible for the most traffic on your network.
Table 68. Available Widgets
Widget Name Chart Type Description
Top 10 Destination IP Groups Donut Displays the top 10 destination IPGroups and its total traffic volume inoctets.
The percentage of the destination IPGroups based on the selection on thewidget. The individual destination IPGroups adds up to 100%. Thispercentage can be absolute or relative.
352 IBM Netcool Operations Insight: Integration Guide

Table 68. Available Widgets (continued)
Widget Name Chart Type Description
Traffic Volume Trend Timeseries This timeseries widget displays theTraffic Volume trend in octets across aselected time period.
You can choose to display the Utilizationtrend in percentage or the Throughputtrend in bit per second (bps).
It describes how the destination IPGroups with applications traffic utilizethe interface bandwidth in octets, bps, orpercentage.
Top 10 Destination IP Groups Grid Displays the Top 10 traffic data (in octetsand packets) that flows in the selecteddestination IP Groups through theselected interface of a device.
The columns display depend on the flowdirection, either Inbound or Outboundfor the selected time period.
Top Source IP Groups1. Click NetFlow > IP Address Grouping > Top Source IP Groups.
The Top Source IP Groups: Traffic Volume Details for Interface dashboardloads.This dashboard provides a view of the top 10 source hosts that contribute totraffic on the network that are associated with IP address group, which isresponsible for the most traffic on your network.
Table 69. Available Widgets
Widget Name Chart Type Description
Top 10 Source IP Groups Donut Displays the top 10 source IP Groupsand its total traffic volume in octets.
The percentage of the source IP Groupsbased on the selection on the widget.The individual source IP Groups adds upto 100%. This percentage can be absoluteor relative.
Traffic Volume Trend Timeseries This timeseries widget displays theTraffic Volume trend in octets across aselected time period.
You can choose to display the Utilizationtrend in percentage or the Throughputtrend in bit per second (bps).
It describes how the source IP Groupswith applications traffic utilize theinterface bandwidth in octets, bps, orpercentage.
Networks for Operations Insight 353

Table 69. Available Widgets (continued)
Widget Name Chart Type Description
Top 10 Source IP Groups Grid Displays the Top 10 traffic data (in octetsand packets) that flows in the selectedsource IP Groups through the selectedinterface of a device.
The columns display depend on the flowdirection, either Inbound or Outboundfor the selected time period.
Top Destination IP Groups with Application1. Click NetFlow > IP Address Grouping > Top Destination IP Groups with
Application.The Top Destination IP Groups with Application: Traffic Volume Details forInterface dashboard loads.This dashboard provides a view of the top 10 domains that serve asdestinations of traffic on the network with applications that are associated withan IP address group, which is responsible for the most traffic on your network.
Table 70. Available Widgets
Widget Name Chart Type Description
Top 10 Destination IP Groupswith Application
Donut Displays the top 10 destination IPGroups with application name and itstotal traffic volume in octets.
The percentage of the destination IPGroups with application based on theselection on the widget. The individualdestination IP Groups with applicationadds up to 100%. This percentage can beabsolute or relative.
Traffic Volume Trend Timeseries This timeseries widget displays theTraffic Volume trend in octets across aselected time period.
You can choose to display the Utilizationtrend in percentage or the Throughputtrend in bit per second (bps).
It describes how the destination IPGroups with applications traffic utilizethe interface bandwidth in octets, bps, orpercentage.
Top 10 Destination IP Groupswith Application
Grid Displays the Top 10 traffic data (in octetsand packets) that flows in the selecteddestination IP Groups with applicationthrough the selected interface of adevice.
The columns display depend on the flowdirection, either Inbound or Outboundfor the selected time period.
354 IBM Netcool Operations Insight: Integration Guide

Protocols dashboards1.4.1.1
This topic gives you an overview of the Protocols dashboards usage.
Top Protocols with Conversation1. Click NetFlow > Protocols > Top Protocols with Conversation.
The Top Protocols with Conversation: Traffic Volume Details for Interfacedashboard loads.This dashboard provides a view of the top 10 of the protocols withconversation used most for traffic on your monitored network.
Note:
You can select the filter values or time ranges that you want to display indashboards to which the filter is assigned.
Table 71. Available Widgets
Widget Name Chart Type Description
Top 10 Protocols withConversation
Donut Displays the top 10 protocols withconversation name and its total trafficvolume in octets.
The percentage of the protocols withconversation is based on the selection onthe widget. The individual protocol withconversation adds up to 100%. Thispercentage can be absolute or relative.
Traffic Volume Trend Timeseries This timeseries widget displays theTraffic Volume trend in octets across aselected time period.
You can choose to display the Utilizationtrend in percentage or the Throughputtrend in bit per second (bps).
It describes how the protocols withconversations traffic utilize the interfacebandwidth in octets, bps, or percentage.
Top 10 Protocols withConversation
Grid Displays the Top 10 traffic data (in octetsand packets) that flows in the selectedprotocols with conversation through theselected interface of a device.
The columns display depend on the flowdirection, either Inbound or Outboundfor the selected time period.
Top Protocols with Destination1. Click NetFlow > Protocols > Top Protocols with Destination
The Top Protocols with Destination: Traffic Volume Details for Interfacedashboard loads.This dashboard provides a view of the top 10 of the protocols with destinationused most for traffic on your monitored network.
Networks for Operations Insight 355

Table 72. Available Widgets
Widget Name Chart Type Description
Top 10 Protocols withDestination
Donut Displays the top 10 protocols withdestination name and its total trafficvolume in octets.
The percentage of the protocols withdestinations is based on the selection onthe widget. The individual protocol withdestination adds up to 100%. Thispercentage can be absolute or relative.
Traffic Volume Trend Timeseries This timeseries widget displays theTraffic Volume trend in octets across aselected time period.
You can choose to display the Utilizationtrend in percentage or the Throughputtrend in bit per second (bps).
It describes how the protocols withdestination traffic utilize the interfacebandwidth in octets, bps, or percentage.
Top 10 Protocols withDestination
Grid Displays the Top 10 traffic data (in octetsand packets) that flows in the selectedprotocols with destination through theselected interface of a device.
The columns display depend on the flowdirection, either Inbound or Outboundfor the selected time period.
Top Protocols with Application1. Click NetFlow > Protocols > Top Protocols with Application
The Top Protocols with Application: Traffic Volume Details for Interfacedashboard loads.This dashboard provides a view of the top 10 of the protocols with applicationused most for traffic on your monitored network.
Table 73. Available Widgets
Widget Name Chart Type Description
Top 10 Protocols withApplication
Donut Displays the top 10 protocols withapplication name and its total trafficvolume in octets.
The percentage of the protocols withapplication is based on the selection onthe widget. The individual protocol withapplication adds up to 100%. Thispercentage can be absolute or relative.
356 IBM Netcool Operations Insight: Integration Guide

Table 73. Available Widgets (continued)
Widget Name Chart Type Description
Traffic Volume Trend Timeseries This timeseries widget displays theTraffic Volume trend in octets across aselected time period.
You can choose to display the Utilizationtrend in percentage or the Throughputtrend in bit per second (bps).
It describes how the protocols withapplication traffic utilize the interfacebandwidth in octets, bps, or percentage.
Top 10 Protocols withApplication
Grid Displays the Top 10 traffic data (in octetsand packets) that flows in the selectedprotocols with application through theselected interface of a device.
The columns display depend on the flowdirection, either Inbound or Outboundfor the selected time period.
Top Protocols with Source1. Click NetFlow > Protocols > Top Protocols with Source
The Top Protocols with Source: Traffic Volume Details for Interface dashboardloads.This dashboard provides a view of the top 10 of the protocols with source usedmost for traffic on your monitored network.
Table 74. Available Widgets
Widget Name Chart Type Description
Top 10 Protocols with Source Donut Displays the top 10 protocols with sourcename and its total traffic volume inoctets.
The percentage of the protocols withsource is based on the selection on thewidget. The individual protocol withsource adds up to 100%. This percentagecan be absolute or relative.
Traffic Volume Trend Timeseries This timeseries widget displays theTraffic Volume trend in octets across aselected time period.
You can choose to display the Utilizationtrend in percentage or the Throughputtrend in bit per second (bps).
It describes how the protocols withsource traffic utilize the interfacebandwidth in octets, bps, or percentage.
Networks for Operations Insight 357

Table 74. Available Widgets (continued)
Widget Name Chart Type Description
Top 10 Protocols with Source Grid Displays the Top 10 traffic data (in octetsand packets) that flows in the selectedprotocols with source through theselected interface of a device.
The columns display depend on the flowdirection, either Inbound or Outboundfor the selected time period.
Top Protocols1. Click NetFlow > Protocols > Top Protocols
The Top Protocols: Traffic Volume Details for Interface dashboard loads.This dashboard provides a view of the top 10 of the protocols used most fortraffic on your monitored network.
Table 75. Available Widgets
Widget Name Chart Type Description
Top 10 Protocols Donut Displays the top 10 protocols name withits total traffic volume in octets.
The percentage of the protocols is basedon the selected destinations that areshown by the widget. The individualprotocol adds up to 100%. Thispercentage can be absolute or relative.
Traffic Volume Trend Timeseries This timeseries widget displays theTraffic Volume trend in octets across aselected time period.
You can choose to display the Utilizationtrend in percentage or the Throughputtrend in bit per second (bps).
It describes how the protocols traffic usesthe interface bandwidth in octets, bps, orpercentage.
Top 10 Protocols Grid Displays the Top 10 traffic data (in octetsand packets) that flows in the selectedprotocols through the selected interfaceof a device.
The columns display depend on the flowdirection, either Inbound or Outboundfor the selected time period.
358 IBM Netcool Operations Insight: Integration Guide

QoS Queue dashboards1.4.1.1
This topic gives you an overview of the QoS Queue dashboard usage.
QoS Queue Drops1. Click NetFlow > QoS Queue > QoS Queue Drops.
The QoS Queue Drops: Outbound Traffic Details for Interface dashboard loads.This dashboard provides a view of the top 10 most QoS Queue Drops for trafficon your monitored network for an outbound interface of a device.It provides the visibility of how the defined traffic classes are performing interms of packet drops.
Note:
You can select the filter values or time ranges that you want to display indashboards to which the filter is assigned.
Table 76. Available Widgets
Widget Name Chart Type Description
QoS Queue Drops Donut Displays the top 10 QoS Queue Drops IDwith its total drops in packets.
The percentage of the QoS Queue Dropsis based on the selection on the widget.The individual QoS Queue Drop adds upto 100%. This percentage can be absoluteor relative.
Packet Drop Trend Timeseries This timeseries widget displays thePacket Drop trend in packets across aselected time period.
QoS Queue Drops Grid Displays the Top 10 QoS Queue Dropsdata in packets that flows in the selectedqueue for an outbound interface of adevice.
Sources dashboards1.4.1.1
This topic gives you an overview of the Sources dashboards usage.
Top Sources1. Click NetFlow > Sources > Top Sources.
The Top Sources: Traffic Volume Details for Interface dashboard loads.This dashboard provides a view of the top 10 sources of traffic used most fortraffic on your monitored network.
Note:
You can select the filter values or time ranges that you want to display indashboards to which the filter is assigned.
Networks for Operations Insight 359

Table 77. Available Widgets
Widget Name Chart Type Description
Top 10 Sources Donut Displays the top 10 sources name withits total traffic volume in octets.
The percentage of the sources is basedon the selected sources that are shownby the widget. The individual sourceadds up to 100%. This percentage can beabsolute or relative.
Traffic Volume Trend Timeseries This timeseries widget displays theTraffic Volume trend in octets across aselected time period.
You can choose to display the Utilizationtrend in percentage or the Throughputtrend in bit per second (bps).
It describes how the sources traffic usesthe interface bandwidth in octets, bps, orpercentage.
Top 10 Sources Grid Displays the Top 10 traffic data (in octetsand packets) that flows in the selectedsources through the selected interface ofa device.
The columns display depend on the flowdirection, either Inbound or Outboundfor the selected time period.
Top Sources with Application1. Click NetFlow > Sources > Top Sources with Application.
The Top Sources with Application: Traffic Volume Details for Interfacedashboard loads.This dashboard provides a view of the top 10 sources of traffic with applicationused most for traffic on your monitored network.
Table 78. Available Widgets
Widget Name Chart Type Description
Top 10 Sources withApplication
Donut Displays the top 10 sources withapplication name with its total trafficvolume in octets.
The percentage of the sources withapplications is based on the selection onthe widget. The individual sources withapplication adds up to 100%. Thispercentage can be absolute or relative.
360 IBM Netcool Operations Insight: Integration Guide

Table 78. Available Widgets (continued)
Widget Name Chart Type Description
Traffic Volume Trend Timeseries This timeseries widget displays theTraffic Volume trend in octets across aselected time period.
You can choose to display the Utilizationtrend in percentage or the Throughputtrend in bit per second (bps).
It describes how the sources withapplications traffic utilize the interfacebandwidth in octets, bps, or percentage.
Top 10 Sources withApplications
Grid Displays the Top 10 traffic data (in octetsand packets) that flows in the selectedsources with applications through theselected interface of a device.
The columns display depend on the flowdirection, either Inbound or Outboundfor the selected time period.
ToS dashboards1.4.1.1
This topic gives you an overview of the ToS dashboard usage.
Top ToS1. Click NetFlow > ToS > Top ToS.
The Top ToS: Traffic Volume Details for Interface dashboard loads.This dashboard provides a view of the top 10 most bandwidth consuming Typeof Service (ToS) for an interface.
Note:
You can select the filter values or time ranges that you want to display indashboards to which the filter is assigned.
Table 79. Available Widgets
Widget Name Chart Type Description
Top 10 ToS Donut Displays the top 10 ToS name with itstotal traffic volume in octets.
The percentage of the ToS is based onthe selected ToS shown by the widget.The individual source adds up to 100%.This percentage can be absolute orrelative.
Networks for Operations Insight 361
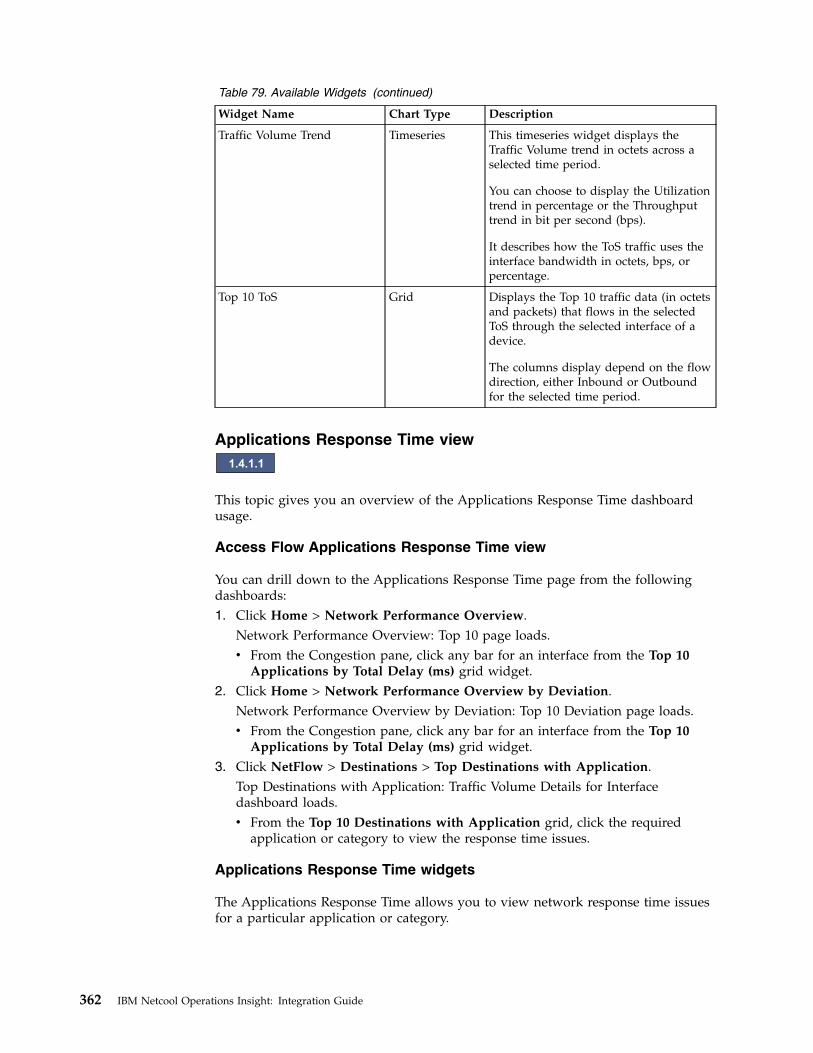
Table 79. Available Widgets (continued)
Widget Name Chart Type Description
Traffic Volume Trend Timeseries This timeseries widget displays theTraffic Volume trend in octets across aselected time period.
You can choose to display the Utilizationtrend in percentage or the Throughputtrend in bit per second (bps).
It describes how the ToS traffic uses theinterface bandwidth in octets, bps, orpercentage.
Top 10 ToS Grid Displays the Top 10 traffic data (in octetsand packets) that flows in the selectedToS through the selected interface of adevice.
The columns display depend on the flowdirection, either Inbound or Outboundfor the selected time period.
Applications Response Time view1.4.1.1
This topic gives you an overview of the Applications Response Time dashboardusage.
Access Flow Applications Response Time view
You can drill down to the Applications Response Time page from the followingdashboards:1. Click Home > Network Performance Overview.
Network Performance Overview: Top 10 page loads.v From the Congestion pane, click any bar for an interface from the Top 10
Applications by Total Delay (ms) grid widget.2. Click Home > Network Performance Overview by Deviation.
Network Performance Overview by Deviation: Top 10 Deviation page loads.v From the Congestion pane, click any bar for an interface from the Top 10
Applications by Total Delay (ms) grid widget.3. Click NetFlow > Destinations > Top Destinations with Application.
Top Destinations with Application: Traffic Volume Details for Interfacedashboard loads.v From the Top 10 Destinations with Application grid, click the required
application or category to view the response time issues.
Applications Response Time widgets
The Applications Response Time allows you to view network response time issuesfor a particular application or category.
362 IBM Netcool Operations Insight: Integration Guide

Table 80. Applications Response Time Widgets
Widget Name Chart Type Description
Response Time Trend Timeseries Displays the target server maximum totaldelay trend in milliseconds for thespecified time period.
Response Time inmilliseconds (ms)
Grid The grid populates the top networkdelay time of a client, server, and theapplication from the category youselected.
The following are the network delay thatis shown in milliseconds (ms):
v Client Network delay
v Server Network delay
v Application delay
v Total delay
On Demand Filtering dashboards1.4.1.1
You can view the network issues for troubleshooting with On Demand Filteringdashboards, which displays information about your network.
On Demand Filtering helps you to investigate in detail the performance of aspecific interface over a period for a set of KPIs. You can identify the latency orjitter in your network for further troubleshooting.
On Demand Filtering consists of Flow, IPSLA, and Device Health dashboards. Itprovides real-time and historical KPI that actively monitors the network status andnetwork quality experience. Probes are one of the most effective ways to gaininsights to facilitate root-cause analysis across network interfaces. You can alsoview the historical trend of loss and latency at the network interface level fortroubleshooting network connectivity issues.
The Device Health dashboard shows the network health related KPIs such as CPU,Memory, Interface traffic, and Utilization. IPSLA dashboard supports Cisco IPSLAKPIs such as Jitter and Latency while the Flow dashboard displays the total octetfor all the different aggregation views.
Categories of On Demand Filtering dashboards:v Flow dashboardv IPSLA dashboardv Device Health dashboard
Networks for Operations Insight 363

Flow dashboard1.4.1.2
On demand filtering Flow dashboard helps to identify any anomalies from justvisualizing the network interfaces traffic volume trend charts. It can be further drilldown to check the historical data for further troubleshooting.
NetFlow1. Click On Demand Filtering > Flow.
The Flow dashboard loads.Flow dashboard displays the total flow interfaces for either inbound oroutbound traffic. For example, it displays the total flow interface for theselected device based on the aggregation type and time range.By default, the dashboard displays the total flow interface for Applicationaggregation type.
2. From the filter options, choose the Device, Direction, Aggregation Type, TopN, and Time period and click Apply Filter.
Note: You can select the filter values or time ranges that you want to displayin dashboards to which the filter is assigned.The dashboard refreshes the data according to the filter attribute values.You can detect the anomalies from monitoring the spikes, dips, or irregulartrend in the performance data from the Total Flow Interface(s): <N> dynamiccharts. Each page displays a maximum of two dynamic charts. This dynamicchart dynamically charts the interfaces.
Note: <N> denotes the number of total flow enabled interfaces.
Table 81. Total Flow Interface(s): <N> dynamic charts
Widget name Description Drill-down dashboard
Trend For <Interface Name> It's a dynamic chart thatallows drill down to theFlow History dashboard forthe selected aggregation typeview.
Each of the dynamic chartsshows either inbound oroutbound flow traffic volumetrend of an interface peraggregation view for theselected device.
The data is displayed inaccordance to the filterattribute values.
It displays the Flow Historydashboard for the selectedaggregation type view withthe filter attribute values.
The Flow History dashboardconsist of two sets ofinformation:
1. A timeseries chart thatdisplays the trafficvolume in octets for theselected time period.
2. Predefined time range ofhistorical data for theselected interface of anaggregation type viewfor:
v Last 24 Hours
v Last 7 Days
v Last 30 Days
v Last 365 Days
3. Click the identified data point from the dynamic chart to drill down.
364 IBM Netcool Operations Insight: Integration Guide

The Flow History dashboard for the selected aggregation type view page loadsin a new tab. It displays the detailed flow data and the historical data for theselected aggregation type view with the filter attribute values.
Table 82. Available widgets
Widget name Chart type Description
<Time Period> <Device IP>>> <Interface Name> >><Aggregation Type>
For example: Last Hour10.55.239.219 >>10.55.239.219-Fa0/1 >>Applications
Timeseries It displays the flow traffic volume inoctets.
By default, the information is shownbased on the filter attribute values fromthe Flow On Demand Filteringdashboard.
Flow History Data
Last 24 Hours <Device IP> >><Interface Name> >><Aggregation Type>
For example: Last 24 Hours10.55.239.219 >>10.55.239.219-Fa0/1 >>Applications
Timeseries Displays flow traffic volume in octets forthe selected interface for the last 24hours from the current time.
The historical data is displayed inaccordance to the filter attribute values.
Last 7 Days <Device IP> >><Interface Name> >><Aggregation Type>
For example: Last 7 Days10.55.239.219 >>10.55.239.219-Fa0/1 >>Applications
Timeseries Displays flow traffic volume in octets forthe selected interface for the last 7 daysfrom the current time.
The historical data is displayed inaccordance to the filter attribute values.
Last 30 Days <Device IP> >><Interface Name> >><Aggregation Type>
For example: Last 30 Days10.55.239.219 >>10.55.239.219-Fa0/1 >>Applications
Timeseries Displays flow traffic volume in octets forthe selected interface for the last 30 daysfrom the current time.
The historical data is displayed inaccordance to the filter attribute values.
Last 365 Days <Device IP> >><Interface Name> >><Aggregation Type>
For example: Last 365 Days10.55.239.219 >>10.55.239.219-Fa0/1 >>Applications
Timeseries Displays flow traffic volume in octets forthe selected interface for the last 365days from the current time.
The historical data is displayed inaccordance to the filter attribute values.
4. You can select the filter values or time ranges that you want to display in thecharts from the Flow History dashboard filter options.From the filter options, choose the Device, Interface, Direction, AggregationType, Top N, and Time period and click Apply Filter.The dashboard refreshes the data according to the filter attribute values.
Networks for Operations Insight 365

IPSLA dashboard1.4.1.1
On Demand Filtering IPSLA dashboard helps you to identify the probes betweenthe source and destination IP addresses. You can identify the latency or jitter inyour network over a period for a set of KPIs for further troubleshooting.
IPSLA1. Click On Demand Filtering > IPSLA.
The IPSLA dashboard loads.IPSLA dashboard can be used to access the network quality that uses networkparameters such as delay, loss, jitter, and more to identify network issues thatcause service quality degradation.
2. From the filter options, choose the SLA Test, Source, Sort By, KPI, and Timeperiod and click Apply Filter.
Note:
v You can select the filter values or time ranges that you want to display indashboards to which the filter is assigned.
v The KPI list is populated based on the selected Service Level Agreement(SLA) Test list option.
The dashboard refreshes the data according to the filter attribute values.This dashboard provides the IPSLA metric monitoring details for the selectedKPI over the selected time period.You can detect the anomalies from monitoring the spikes, dips, or irregulartrend in the performance data from the Total probes dynamic charts. Each pagedisplays a maximum of four dynamic charts.
Table 83. Total Probes dynamic charts
Widget name Description Drill-down dashboard
Trend For <Source IP> -<Destination IP>
Its a dynamic chart thatallows drill down to theIPSLA History dashboard forthe source IP.
Each of the dynamic chartdynamically plot the probes,which helps to identify thenetwork connectivity issueson end-to-end between theselected router and devicesby using IP addresses.
The data is displayed inaccordance to the filterattribute values.
It displays the IPSLA Historydashboard for the selectedsource and with other filterattribute values.
The IPSLA Historydashboard consist of two setsof information:
1. A timeseries chart thatdisplays the probe countsfor the selected timeperiod..
2. Predefined time range ofhistorical data for theselected KPI for:
v Last 24 Hours
v Last 7 Days
v Last 30 Days
v Last 365 Days
3. Click the identified data point from the dynamic chart to drill down.
366 IBM Netcool Operations Insight: Integration Guide

The IPSLA History dashboard for the selected source and destination IP pageloads in a new tab. It displays the detailed IPSLA data and the historical databased on the filter attribute values from IPSLA On Demand Filteringdashboard.
Table 84. Available widgets
Widget name Chart type Description
<Time Period> Probe Count(count) >> Source <IP> >>Destination <IP>
For example: Last Hour ProbeCount (count) >> Source10.25.238.209 >> Destination4.10.110.50
Timeseries It displays the probe count of theselected IPSLA KPI trend.
By default, the information is shownbased on the filter attribute values fromthe IPSLA On Demand Filteringdashboard.
Probe History Data
Last 24 Hours Probe Count(count) >> Source <IP>>>Destination <IP>
For example: Last 24 HoursProbe Count (count) >>Source 10.25.238.209 >>Destination 4.10.110.50
Timeseries Displays the probe history data of last 24hours from the current time of theselected source and destination IP.
The historical data is displayed inaccordance to the filter attribute values.
Last 7 Days Probe Count(count) >> Source <IP>>>Destination <IP>
For example: Last 7 DaysProbe Count (count) >>Source 10.25.238.209 >>Destination 4.10.110.50
Timeseries Display the probe history data of last 7days from the current time of theselected source and destination IP.
The historical data is displayed inaccordance to the filter attribute values.
Last 30 Days Probe Count(count) >> Source <IP>>>Destination <IP>
For example: Last 30 DaysProbe Count (count) >>Source 10.25.238.209 >>Destination 4.10.110.50
Timeseries Display the probe history data of last 30days from the current time of theselected source and destination IP.
The historical data is displayed inaccordance to the filter attribute values.
Last 365 Days Probe Count(count) >> Source <IP>>>Destination <IP>
For example: Last 365 DaysProbe Count (count) >>Source 10.25.238.209 >>Destination 4.10.110.50
Timeseries Display the probe history data of last 365days from the current time of theselected source and destination IP.
The historical data is displayed inaccordance to the filter attribute values.
4. You can select the filter values or time ranges that you want to display in thecharts from the IPSLA History dashboard filter options.From the filter options, choose the SLA Test, Source, Destination, KPI, andTime period and click Apply Filter.The dashboard refreshes the data according to the filter attribute values.
Networks for Operations Insight 367

Device Health dashboard1.4.1.1
On demand filtering Device Health dashboard helps to identify any anomaliesfrom just visualizing the network entities trend charts. It can be further drill downto check the historical data for further troubleshooting.
Device Health1. Click On Demand Filtering > Device Health.
The Device Health dashboard loads with device health monitoring details forthe selected KPI over the selected time period.
2. From the filter options, choose the Device, KPI, Sort By, and Time period andclick Apply Filter.
Note: You can select the filter values or time ranges that you want to displayin dashboards to which the filter is assigned.The dashboard refreshes the data according to the filter attribute values.The Device Health dashboard shows the network health related KPIs such asCPU, memory, interface traffic, and utilization. You can detect the anomaliesfrom monitoring the spikes, dips, or irregular trend in the performance datafrom these network related health entities dynamic charts. Each page displays amaximum of four dynamic charts.
Table 85. Total network related health entities dynamic charts
Widget name Description Drill-down dashboard
Trend For <Network relatedhealth Entities>
Note: <Network related healthEntities> denotes either TotalInterfaces, CPU, Memory, orTemperature.
Displays the selected KPItrend over the selected timeperiod.
Its a dynamic chart thatallows drill down to theDevice Health Historydashboard for the selectedKPI.
Each of the dynamic chartdynamically plot the totalinterfaces, CPU, Memory, orTemperature based on thefilter attribute values.
It displays the Device HealthHistory dashboard for theselected KPI and with otherfilter attribute values.
The Device Health Historydashboard consist of two setsof information:
1. A timeseries chart thatdisplays the total networkrelated health entities forthe selected time period.
2. Predefined time range ofhistorical data for theselected KPI for:
v Last 24 Hours
v Last 7 Days
v Last 30 Days
v Last 365 Days
3. Click the identified data point from the dynamic chart to drill down.The Device Health History dashboard for the selected KPI page loads in a newtab. It displays the detailed Device Health data and the historical data based onthe filter attribute values from Device Health On Demand Filtering dashboard.
368 IBM Netcool Operations Insight: Integration Guide

Table 86. Available widgets
Widget name Chart type Description
<Time Period> <KPI> >><Device IP> >> <ResourceName>
For example: Last HourInbound Utilization (%) >>10.55.239.100 >> Fa0/1
Timeseries It displays the selected KPI trend overthe selected time period.
By default, the information is shownbased on the filter attribute values fromthe Device Health On Demand Filteringdashboard.
Last 24 Hours <KPI> >><Device IP> >> <ResourceName>
For example: Last 24 HoursInbound Utilization (%) >>10.55.239.100 >> Fa0/1
Timeseries It displays the entity history data of last24 hours from the current time of theselected device.
The historical data is displayed inaccordance to the filter attribute values.
Last 7 Days <KPI> >><Device IP> >> <ResourceName>
For example: Last 7 DaysInbound Utilization (%) >>10.55.239.100 >> Fa0/1
Timeseries It displays the entity history data of last7 days from the current time of theselected device.
The historical data is displayed inaccordance to the filter attribute values.
Last 30 Days <KPI> >><Device IP> >> <ResourceName>
For example: Last 30 DaysInbound Utilization (%) >>10.55.239.100 >> Fa0/1
Timeseries It displays the entity history data of last30 days from the current time of theselected device.
The historical data is displayed inaccordance to the filter attribute values.
Last 365 Days <KPI> >><Device IP> >> <ResourceName>
For example: Last 365 DaysInbound Utilization (%) >>10.55.239.100 >> Fa0/1
Timeseries It displays the entity history data of last365 days from the current time of theselected device.
The historical data is displayed inaccordance to the filter attribute values.
4. You can select the filter values or time ranges that you want to display in thecharts from the Device Health History dashboard filter options.From the filter options, choose the Device, KPI, Resource, and Time periodand click Apply Filter.The dashboard refreshes the data according to the filter attribute values.
Networks for Operations Insight 369

370 IBM Netcool Operations Insight: Integration Guide

Topology search
The topology search capability is an extension of the Networks for OperationsInsight feature. It applies the search and analysis capabilities of OperationsAnalytics - Log Analysis to give insight into network performance. Events thathave been enriched with network data are analyzed by the Network ManagerInsight Pack and are used to calculate the lowest-cost routes between twoendpoints on the network topology over time. The events that occurred along theroutes over the specified time period are identified and shown by severity. Thetopology search requires the Networks for Operations Insight feature to beinstalled and configured. The topology search capability can plot the lowest-costroute across a network between two end points and display all the events thatoccur on the devices on the routes.
The Network Manager IP Edition product enriches all the event data that isgenerated by the devices on the network topology. It is stored in TivoliNetcool/OMNIbus, so that the Operations Analytics - Log Analysis product cancross-reference devices and events. The Gateway for Message Bus is used to passevent data from Tivoli Netcool/OMNIbus to Operations Analytics - Log Analysis.Also, the Network Manager Insight Pack reads topology data from the NCIMdatabase in Network Manager IP Edition to identify the paths in the topologybetween the devices.
The scope of the topology search capability is that of the entire topology network,which includes all NCIM domains. To restrict the topology search to a singledomain, you can configure a properties file that is included in the NetworkManager Insight Pack.
After the Insight Pack is installed, you can run the apps from the OperationsAnalytics - Log Analysis UI. With Network Manager IP Edition installed andconfigured, the apps can also be run as right-click tools from the Network Views.With Tivoli Netcool/OMNIbus Web GUI installed and configured, the apps can berun as right-click tools from the Event Viewer and Active Event List (AEL).
The custom apps use the network-enriched event data and the topology data fromthe Network Manager IP Edition NCIM database. They plot the lowest-cost routesacross the network between two nodes (that is, network entities) and count theevents that occurred on the nodes along the routes. You can specify different timeperiods for the route and events. The algorithm uses the speed of the interfacesalong the routes to calculate the routes that are lowest-cost. That is, the fastestroutes from start to end along which a packet can be sent. The network topology isbased on the most recent discovery. Historical routes are not accounted for. If yournetwork topology is changeable, the routes between the nodes can change overtime. If the network is stable, the routes stay current.
Before you begin
Ensure that you have a good knowledge of your network before you implementthe topology search capability. Over large network topologies, the topology searchcan be performance intensive. It is therefore important to determine which parts ofyour network you want to use the topology search on. You can define those partsof the network into a single domain. Alternatively, implement the cross-domaindiscovery function in Network Manager IP Edition to create a single aggregation
© Copyright IBM Corp. 2014, 2018 371

domain of the domains that you want to search. You can restrict the scope of thetopology search to that domain or aggregation domain. For more informationabout deploying Network Manager IP Edition to monitor networks of small,medium, and larger networks, see the IBM Tivoli Network Manager IP EditionProduct Overview. For more information about the cross-domain discovery function,see the IBM Tivoli Network Manager IP Edition Discovery Guide.Related concepts:“Network Manager Insight Pack”
Supported products and componentsThe topology search capability is supported on a specific combination of productsand components. Ensure that your environment has the requisite support beforeyou enable topology search. These requirements apply to both new and upgradedenvironments.
The topology search capability requires the following products and components.v Operations Analytics - Log Analysis V1.3 or later with the
OMNIbusInsightPack_v1.3.0.2 and the NetworkManagerInsightPack_V1.3.0.0.v Tivoli Netcool/OMNIbus Core V8.1.0.2 and Tivoli Netcool/OMNIbus Web GUI
V8.1.0.2 or later. Install the Install tools and menus for event search with IBMSmartCloud Analytics - Log Analysis feature as part of the Web GUIinstallation.
v Gateway for Message Bus package version 6.0 or later. Earlier package versionsdo not include the configurations that are required for the topology searchcapability.
v Network Manager V4.1.1.1 or later. The topology search capability requires thatthe NCIM database for the network topology is IBM DB2 9.7 or 10.1. Oracle 10gor 11g is also supported, but requires more configuration than DB2. Althoughthe Network Manager product supports other databases for storing the topology,the topology search capability is supported only on these databases.
Related tasks:“Installing Netcool Operations Insight” on page 35
Network Manager Insight PackThe Network Manager Insight Pack reads event data and network topology dataso that it can be searched and visualized in the IBM Operations Analytics - LogAnalysis product.
The Network Manager IP Edition product enriches all the event data that isgenerated by the devices on the network topology. It is stored in TivoliNetcool/OMNIbus, so that the Operations Analytics - Log Analysis product cancross-reference devices and events. The Gateway for Message Bus is used to passevent data from Tivoli Netcool/OMNIbus to Operations Analytics - Log Analysis.Also, the Network Manager Insight Pack reads topology data from the NCIMdatabase in Network Manager IP Edition to identify the paths in the topologybetween the devices.
The scope of the topology search capability is that of the entire topology network,which includes all NCIM domains. To restrict the topology search to a singledomain, you can configure a properties file that is included in the Network
372 IBM Netcool Operations Insight: Integration Guide

Manager Insight Pack.For more information about cross-domain discoveries andaggregation domains, see the IBM Tivoli Network Manager IP Edition DiscoveryGuide.
This readme is for the Network Manager Insight Pack V1.3.0.0.Related concepts:
About cross-domain discoveriesRelated tasks:“Topology search” on page 371
Configuring cross-domain discoveries
Content of the Insight PackThe data ingestion artifacts that are included in the Network Manager InsightPack.v Custom apps, which are described in Table 87 on page 374.
A rule set, source type, and collection are provided in theOMNIbusInsightPack_v1.3.0.2, which the Network Manager Insight Pack uses.
Custom apps
The following table describes the custom apps in the Insight Pack. After the InsightPack is installed, you can run the apps from the Operations Analytics - LogAnalysis UI. With Network Manager IP Edition installed and configured, the appscan also be run as right-click tools from the Network Views. With TivoliNetcool/OMNIbus Web GUI installed and configured, the apps can be run asright-click tools from the Event Viewer and Active Event List (AEL).
The custom apps use the network-enriched event data and the topology data fromthe Network Manager IP Edition NCIM database. They plot the lowest-cost routesacross the network between two nodes (that is, network entities) and count theevents that occurred on the nodes along the routes. You can specify different timeperiods for the route and events. The algorithm uses the speed of the interfacesalong the routes to calculate the routes that are lowest-cost. That is, the fastestroutes from start to end along which a packet can be sent. The network topology isbased on the most recent discovery. Historical routes are not accounted for. If yournetwork topology is changeable, the routes between the nodes can change overtime. If the network is stable, the routes stay current.
The apps count the events that occurred over predefined periods of time, relativeto the current time, or over a custom time period that you can specify. For thepredefined time periods, the current time is calculated differently, depending onwhich product you run the apps from. Network Manager IP Edition uses thecurrent time stamp. The Tivoli Netcool/OMNIbus Web GUI uses the time that isspecified in the FirstOccurrence field of the events.
Topology search 373

Table 87. Custom apps that are included in the Network Manager Insight Pack
Custom app name and file name Description
Find alerts between twonodes on layer 2 topology
NM_Show_Alerts_Between_Two_Nodes_Layer2.app
This app shows the distribution of alerts onthe least-cost routes between two networkend points in a layer 2 topology. Chartsshow the alert distribution by severity andalert group for each route over the specifiedtime period. The ObjectServer field for thealert group is AlertGroup. A list of theroutes is displayed from which you cansearch the events that occurred on eachroute over the specified time period.
In the Operations Analytics - Log AnalysisUI, the app requires search results beforeyou can run it. In the search results, selectthe NmosObjInst column and then run theapp. The app finds the events between the 2nodes on which each selected eventoriginated.
Find alerts between twonodes on layer 3 topology
NM_Show_Alerts_Between_Two_Nodes_Layer3.app
This app shows the distribution of alerts onthe least-cost routes between two networkend points in a layer 3 topology. Chartsshow the alert distribution by severity andalert group for each route over the specifiedtime period. The ObjectServer field for thealert group is AlertGroup. A list of theroutes is displayed from which you cansearch the events that occurred on eachroute over the specified time period.
In the Operations Analytics - Log AnalysisUI, the app requires search results beforeyou can run it. In the search results, selectthe NmosObjInst column and then run theapp. The app finds the events between the 2nodes on which each selected eventoriginated.
For more information about running the apps, see the IBM Netcool OperationsInsight Integration Guide.
Configuring topology searchBefore you can use the topology search capability, configure the TivoliNetcool/OMNIbus core and Web GUI components, the Gateway for Message Busand Network Manager IP Edition.
Before you begin
Set up the environment for each product as follows:v Ensure you have a combination of supported products and components. See
“Supported products and components” on page 372.v Configure the event search capability, including the Gateway for Message Bus.
See “Configuring event search” on page 121. The topology search capabilityrequires that the Gateway for Message Bus is configured to forward event datato Operations Analytics - Log Analysis.
374 IBM Netcool Operations Insight: Integration Guide

v If your Operations Analytics - Log Analysis is upgraded from a previousversion, migrate the data to your V1.3 instance. See one of the following topics:– Operations Analytics - Log Analysis V1.3.5: https://www.ibm.com/support/
knowledgecenter/SSPFMY_1.3.5/com.ibm.scala.doc/admin/iwa_admin_backup_restore.html
– Operations Analytics - Log Analysis V1.3.3: https://www.ibm.com/support/knowledgecenter/SSPFMY_1.3.3/com.ibm.scala.doc/admin/iwa_admin_backup_restore.html
v Ensure that the ObjectServer that forwards event data to Operations Analytics -Log Analysis has the NmosObjInst column in the alerts.status table.NmosObjInst is supplied by default and is required for this configuration. Youcan use ObjectServer SQL commands to check for the column and to add it if itis missing, as follows.– Use the DESCRIBE command to read the columns of the alerts.status table.– Use the ALTER COLUMN setting with the ALTER TABLE command to add
NmosObjInst to the alerts.status table.
For more information about the alerts.status table and ObjectServer SQLcommands, see the IBM Tivoli Netcool/OMNIbus Administration Guide.
v Configure the Tivoli Netcool/OMNIbus Web GUI V8.1.0.4 as follows:– Install the Netcool Operations Insight Extensions for IBM Tivoli
Netcool/OMNIbus Web GUI package. IBM Installation Manager installs thispackage separately from the Web GUI. It needs to be explicitly selected.
– Check the server.init file to ensure that the scala* properties are set asfollows:scala.app.keyword=OMNIbus_Keyword_Searchscala.app.static.dashboard=OMNIbus_Static_Dashboardscala.datasource=omnibusscala.url=protocol://host:portscala.version=1.2.0.3
This configuration needed for new environments and for environments thatare upgraded from versions of Operations Analytics - Log Analysis that areearlier than 1.2.0.3.
– Set up the Web GUI Administration API client, which is needed to install theevent list tooling that launches Operations Analytics - Log Analysis. See theIBM Tivoli Netcool/OMNIbus Installation and Deployment Guide.
v Install and configure the Insight Packs as follows:1. Install the OMNIbusInsightPack_v1.3.0.2. If your environment is upgraded
from a previous version of Netcool Operations Insight, upgrade to thisversion of the Insight Pack. See “Netcool/OMNIbus Insight Pack” on page114.
2. Create a data source.3. Obtain and install the Network Manager Insight Pack V1.3.0.0. See
“Installing the Network Manager Insight Pack” on page 90.
Procedure1. In $NCHOME/omnibus/extensions, run the nco_sql utility against the
scala_itnm_configuration.sql file../nco_sql -user root -password myp4ss -server NCOMS< /opt/IBM/tivoli/netcool/omnibus/extensions/scala/scala_itnm_configuration.sql
Topology search 375

Triggers are applied to the ObjectServer that delay the storage of events untilthe events are enriched by Network Manager IP Edition data from the NCIMdatabase.
2. If the Gateway for Message Bus is not configured to forward event data toOperations Analytics - Log Analysis, perform the required configurations.1
3. Install the tools and menus to launch the custom apps of the Network ManagerInsight Pack in the Operations Analytics - Log Analysis UI from the Web GUI.In $WEBGUI_HOME/extensions/LogAnalytics, run the runwaapi command againstthe scalaEventTopology.xml file.
$WEBGUI_HOME/waapi/bin/runwaapi -user username -password password -filescalaEventTopology.xml
Where username and password are the credentials of the administrator user thatare defined in the $WEBGUI_HOME/waapi/etc/waapi.init properties file thatcontrols the WAAPI client.
4. On the host where the Network Manager GUI components are installed, installthe tools and menus to launch the custom apps of the Network ManagerInsight Pack in the Operations Analytics - Log Analysis GUI from the NetworkViews.a. In $NMGUI_HOME/profile/etc/tnm/topoviz.properties, set the
topoviz.unity.customappsui property, which defines the connection toOperations Analytics - Log Analysis. For example:# Defines the LogAnalytics custom App launcher URLtopoviz.unity.customappsui=https://server3:9987/Unity/CustomAppsUI
b. In the $NMGUI_HOME/profile/etc/tnm/menus/ncp_topoviz_device_menu.xmlfile, define the Event Search menu item. Add the item <menu id="EventSearch"/> in the file as shown:<tool id="showConnectivityInformation"/>
<separator/><menu id="Event Search"/>
5. Start the Gateway for Message Bus in Operations Analytics - Log Analysismode. For example:$OMNIHOME/bin/nco_g_xml -propsfile $OMNIHOME/etc/G_SCALA.props
The gateway begins sending events from Tivoli Netcool/OMNIbus toOperations Analytics - Log Analysis.
What to do nextv Configure single sign-on (SSO) between the products.v Reconfigure your views in the Web GUI to display the NmosObjInst column.
The tools that launch the custom apps of the Network Manager Insight Packwork only against events that have a value in this column. For moreinformation, see the IBM Tivoli Netcool/OMNIbus Web GUI Administration andUser's Guide.
1. At a high-level, this involves the following:
v Creating a gateway server in the Netcool/OMNIbus interfaces file
v Configuring the G_SCALA.props properties file, including specifying the xml1302.map
v Configuring the endpoint in the scalaTransformers.xml file
v Configuring the SSL connection, if required
v Configuring the transport properties in the scalaTransport.properties file
376 IBM Netcool Operations Insight: Integration Guide

Related tasks:“Installing the Network Manager Insight Pack” on page 90Related reference:“Supported products and components” on page 372Related information:
Gateway for Message Bus documentation
Configuring single sign-on for the topology search capabilityConfigure single sign-on (SSO) between the Dashboard Application Services Hubthat hosts the Network Manager IP Edition GUI components and OperationsAnalytics - Log Analysis so that users can switch between the two productswithout having to log in each time. First, create dedicated users in your LDAPdirectory, which must be used by both products for user authentication, and thenconfigure the SSO connection.
Procedure1. Create the dedicated users and groups in your LDAP directory. For example:
a. Create a new Organization Unit (OU) named NetworkManagement.b. Under the NetworkManagement OU, create a new group named itnmldap.c. Under the NetworkManagement OU, create the following new users: itnm1,
itnm2, itnm3, and itnm4.d. Add the new users to the itnmldap group.
2. In Dashboard Application Services Hub, assign the itnmldap group that youcreated in step 1 to a Network Manager IP Edition user group that can accessthe Network Views. Network Manager IP Edition user roles are controlled byassignments to user groups. Possible user groups that can access the NetworkViews are Network_Manager_IP_Admin and Network_Manager_User.
3. Configure the SSO connection from the Operations Analytics - Log Analysisproduct to the Dashboard Application Services Hub instance in which NetworkManager IP Edition is hosted. For more information about configuring SSO forOperations Analytics - Log Analysis, see the Operations Analytics - LogAnalysis documentation. The following steps of the Operations Analytics - LogAnalysis SSO configuration are important:v Assign Operations Analytics - Log Analysis roles to the users and groups
that you created in step 1.v In the $SCALAHOME/wlp/usr/servers/Unity/server.xml/server.xml file,
ensure that the <webAppSecurity> element has a httpOnlyCookies="false"attribute. Add this line before the closing </server> element. For example:<webAppSecurity ssoDomainNames="hostname" httpOnlyCookies="false"/></server>
The httpOnlyCookies="false" attribute disables the httponly flag on thecookie that is generated by Operations Analytics - Log Analysis and isrequired to enable SSO with Network Manager IP Edition GUI.
Related tasks:
Configuring SSO between Operations Analytics - Log Analysis V1.3.5 andDashboard Application Services Hub
Configuring SSO between Operations Analytics - Log Analysis V1.3.3 andDashboard Application Services Hub
Topology search 377

Using Topology SearchAfter the topology search capability is configured, you can have OperationsAnalytics - Log Analysis show you the events that occurred within a specific timeperiod on routes between two devices in the network topology. This capability isuseful to pinpoint problems on the network, for example, in response to a denial ofservice attack on a PE device.
The custom apps of the Network Manager Insight Pack can be run from theOperations Analytics - Log Analysis and, depending on your configuration, fromthe Network Views in Network Manager IP Edition and the event lists in the WebGUI. The custom apps support searches on Layer 2 and Layer 3 of the topology.The custom apps use the network-enriched event data and the topology data fromthe Network Manager IP Edition NCIM database. They plot the lowest-cost routesacross the network between two nodes (that is, network entities) and count theevents that occurred on the nodes along the routes. You can specify different timeperiods for the route and events. The algorithm uses the speed of the interfacesalong the routes to calculate the routes that are lowest-cost. That is, the fastestroutes from start to end along which a packet can be sent. The network topology isbased on the most recent discovery. Historical routes are not accounted for. If yournetwork topology is changeable, the routes between the nodes can change overtime. If the network is stable, the routes stay current.
Before you beginv Knowledge of the events in your topology is required to obtain meaningful
results from the topology search, for example, how devices are named in yourenvironment, or with what information devices are enriched. Device names areusually indicative of their functions. This level of understanding helps you runsearches in Operations Analytics - Log Analysis.
v Configure the products to enable the topology search capability. See“Configuring topology search” on page 374.
v To avoid reentering user credentials when launching between products,configure SSO.
v Create the network views that visualize the parts of the network that you areresponsible for and want to search. See https://www.ibm.com/support/knowledgecenter/SSSHRK_4.2.0/admin/task/adm_crtnwview.html.
v Reconfigure your views in the Web GUI to display the NmosObjInst column.The tools that launch the custom apps of the Network Manager Insight Packwork only against events that have a value in this column. For moreinformation, see the IBM Tivoli Netcool/OMNIbus Web GUI Administration andUser's Guide.
Procedure
The flow of this procedure is to select the two nodes, select the tool and a timeperiod over which the tool searches the historical event data. Then, in theOperations Analytics - Log Analysis UI, select the route that you are interested inand view the events. You can run searches on the events to refine the results.1. Run the topology search from one of the products, as follows:v Web GUI event lists:
a. In an Event Viewer or AEL, select two rows that have a value in theNmosObjInst column.
378 IBM Netcool Operations Insight: Integration Guide

b. Right click and click Event Search > Find events between two nodes >Layer 2 Topology or Event Search > Find events between two nodes >Layer 3 Topology, depending on which layer of the topology you want tosearch.
c. Click a time filter, or click Custom and select one.v Network Manager IP Edition network views:
a. Select two devices.b. Click Event Search > Find Events Between 2 Nodes > Layer 2 Topology
or Event Search > Find Events Between 2 Nodes > Layer 3 Topologydepending on which layer of the topology you want to search.
c. Click a time filter, or click Custom and select one.v Operations Analytics - Log Analysis UI. In the Operations Analytics - Log
Analysis UI, the app requires search results before you can run it. In thesearch results, select the NmosObjInst column. The app finds the eventsbetween the two nodes on which each selected event originated.
Important: Select the NmosObjInst cells only. Do not select the entire rows.If you select the entire rows, no results are found, or incorrect routesbetween the entities on the network are found.In the Search Dashboards section of the UI, clickNetworkManagerInsightPack > Find events between two nodes on layer 2topology or Find events between two nodes on layer 3 topology, dependingwhich network layer you want to view.
See “Example” on page 380 for an example of how to run the apps from theOperations Analytics - Log Analysis UI.The results of the search are displayed on the Operations Analytics - LogAnalysis UI as follows:
Find alerts between two nodes on layer 2 topologyThis app shows the distribution of alerts on the least-cost routesbetween two network end points in a layer 2 topology. Charts show thealert distribution by severity and alert group for each route over thespecified time period. The ObjectServer field for the alert group isAlertGroup. A list of the routes is displayed from which you can searchthe events that occurred on each route over the specified time period.
Find alerts between two nodes on layer 3 topologyThis app shows the distribution of alerts on the least-cost routesbetween two network end points in a layer 3 topology. Charts show thealert distribution by severity and alert group for each route over thespecified time period. The ObjectServer field for the alert group isAlertGroup. A list of the routes is displayed from which you can searchthe events that occurred on each route over the specified time period.
The apps count the events that occurred over predefined periods of time,relative to the current time, or over a custom time period that you can specify.For the predefined time periods, the current time is calculated differently,depending on which product you run the apps from. Network Manager IPEdition uses the current time stamp. The Tivoli Netcool/OMNIbus Web GUIuses the time that is specified in the FirstOccurrence field of the events.
Restriction: The Web GUI and Operations Analytics - Log Analysis processtime stamps differently. The Web GUI recognizes hours, minutes, and secondsbut Operations Analytics - Log Analysis ignores seconds. This problem affectsthe Show event dashboard by node and Search for events by node. If the timestamp 8 January 2014 07:15:26 AM is passed, Operations Analytics - Log
Topology search 379
Analysis interprets this time stamp as 8 January 2014 07:15 AM. So, the resultsof subsequent searches might differ from the search that was originally run.
2. From the bar charts, identify the route that is of most interest. Then, on theright side of the UI, click the link that corresponds to that route. A search resultis returned that shows all the events that occurred within the specified timeframe on that network route.
3. Refine the search results. You can use the patterns that are listed in SearchPatterns. For example, to search the results for critical events, click SearchPatterns > Severity > Critical. A search string is copied to the search field.Then, click Search.
4. Extend and refine the search as required. For more information about searchesin Operations Analytics - Log Analysis, see one of the following links:v Operations Analytics - Log Analysis V1.3.5: https://www.ibm.com/support/
knowledgecenter/SSPFMY_1.3.5/com.ibm.scala.doc/use/iwa_using_ovw.html
v Operations Analytics - Log Analysis V1.3.3: https://www.ibm.com/support/knowledgecenter/SSPFMY_1.3.3/com.ibm.scala.doc/use/iwa_using_ovw.html
Example
An example of how to run the custom apps from the Operations Analytics - LogAnalysis UI. This example searches between 2 IP addresses: 172.20.1.3 and172.20.1.5.1. To run a new search, click Add search and type NodeAlias:"172.20.1.3" OR
NodeAlias:"172.20.1.5". Operations Analytics - Log Analysis returns all eventsthat have the NodeAlias 172.20.1.3, or the NodeAlias 172.20.1.5.
2. In the results display, switch to grid view. Scroll across until you see theNmosObjInst column. Identify 2 rows that have different NmosObjInst values.
3. For these rows, select the cells in the NmosObjInst column.4. In the Search Dashboards section of the UI, click NetworkManagerInsightPack
> Find events between two nodes on layer 2 topology or Find events betweentwo nodes on layer 3 topology, depending which network layer you want toview.
Related concepts:“Network Management tasks” on page 16
380 IBM Netcool Operations Insight: Integration Guide
Configuring integration to IBM Connections
IBM Tivoli Netcool/Impact provides integration to IBM Connections by using aNetcool/Impact IBMConnections action function. The IBMConnections actionfunction allows users to query forums and topics lists, create a new forum, create anew topic, and update existing topics. The IBMConnections action function packageis available in the directory $IMPACT_HOME/integrations/IBMConnections.
About this task
Complete the following steps to configure Netcool/Impact to integrate with theIBM Connections Server.
Procedure1. Go to the directory $IMPACT_HOME/add-ons/IBMConnections, this directory is the
IBM Connections integration package. The package includes the followingsubdirectory:
importDataA project that includes policies, data source, data type, and a service. Theproject serves an example to show how to connect, create, update, andtopics in IBM Connections
2. Import the project $IMPACT_HOME/bin/nci_ import <ServerName>__Extraction_Directory__/importData.
3. Within the $IMPACT_HOME/etc/<NCI>_server.props file, add the followingparameters:
impact.ibmconnections.forum.title.maxsize= number. Default value is 0.Any string size can be used.impact.ibmconnections.forum.content.maxsize= number. Default value is 0.Any string size can be usedimpact.ibmconnections.topic.title.maxsize= number. Default value is 255,for a topic and a reply.impact.ibmconnections.topic.content.maxsize = number. Default value is0. Any string size can be used
4. Restart Netcool/Impact servers.Related tasks:“Installing Netcool/OMNIbus and Netcool/Impact” on page 49
IBM Connections OverviewIBM Connections is a leading social software platform that can help yourorganization to engage the right people, accelerate innovation, and deliver results.
This integrated, security-rich platform helps people engage with networks ofexperts in the context of critical business processes. Now everyone can act withconfidence and anticipate and respond to emerging opportunities
For information about IBM Connections, refer to
http://www-03.ibm.com/software/products/en/conn
© Copyright IBM Corp. 2014, 2018 381

Parameters for the IBMConnections functionThe integration between Netcool/Impact and IBM Connections uses a new policyaction function that is called the IBMConnections function. The IBMConnectionsfunction can be used within any policy to connect to the IBM Connections Serverand to perform an action on the IBM Connections Server. The function accepts twoinput parameters, the Action Option parameter and the Impact Object parameter.
Action Option Parameter
The Action Option parameter accepts one of the following action entries, which arecase insensitive. Some action entries require property information that iscase-sensitive.
In the content of an IBM Connections forum, topic, or reply, you can use HTMLformatting tags br, b, and a. For more information about the supported HTMLtags, see http://www-03.ibm.com/software/products/en/conn.
CREATEFORUMCreates a forum.
Enter the following property information that is case-sensitive. The tags mustbe created before they pass to a variable name.
props.ForumTitle=title;
props.ForumContent=full text of the body;
props.ForumTags=List_Of_Tags; Is optional, the object must be aNetcool/Impact object.Tags=NewObject();
Tags.Tag1=some tag;
Tags.Tag2=some tag2; Is optional if want more than one tag.
CREATETOPICCreates a topic.
Enter the following property information that is case-sensitive:props.TopicTitle=title;
props.TopicContent=full text of the body;
props.ForumId=forum id: Where the forum id is an ID and not a forumname.
DELETEFORUMDeletes the forum name that was created by the logged in user and any topicor reply belonging to it.
Enter the following property information that is case-sensitive:props.ForumId=forumId; Or props.ForumId=forumTitle;props.FirstMatchOnly=true; Or props.FirstMatchOnly=false; Theprops.FirstMatchOnly property deletes the first matching forum ormatching topic that it finds, or else it deletes any matching forum ormatching topic and its default value is true.
DELETEPUBLICFORUMDeletes the given public forum name and any topic or reply belonging to it.
Enter the following property information that is case-sensitive:props.ForumId=forumId; Or props.ForumId=forumTitle;
382 IBM Netcool Operations Insight: Integration Guide

props.FirstMatchOnly=true; Or props.FirstMatchOnly=false;Theprops.FirstMatchOnly property deletes the first matching forum ormatching topic that it finds, or else it deletes any matching forum ormatching topic and its default value is true.
DELETEREPLYDeletes a topic reply in the topic in the forum id.
Enter the following property information that is case-sensitive:props.ForumId=forumId; Where the forumId is an ID and not a title.props.TopicTitle=title; Or props.TopicTitle=id;props.ReplyTitle=replytitle; Or props.ReplyTitle=replyid;props.FirstMatchOnly=true; Or props.FirstMatchOnly=false;Theprops.FirstMatchOnly property deletes the first matching forum ormatching topic that it finds, or else it deletes any matching forum ormatching topic and its default value is true.
DELETETOPICDeletes a topic in the forum id.
Enter the following property information that is case-sensitive:props.ForumId=forumId; Where the forumId is an ID and not a title.props.TopicTitle=title; Or props.TopicTitle=id;props.FirstMatchOnly=true; Or props.FirstMatchOnly=false;Theprops.FirstMatchOnly property deletes the first matching forum ormatching topic that it finds, or else it deletes any matching forum ormatching topic and its default value is true.
GETCOMMUNITYFORUMIDGets the ID of the community that is created by the logged in user
Enter the following property information that is case-sensitive:props.CommunityName=Community name;
props.ForumName=forum name;
GETFORUMTOPICSGets list of topics for the forum id
Enter the following property information that is case-sensitive:props.ForumId=forum id;
GETMYCOMMUNITYIDGets the ID of the community for the logged in user
Enter the following property information that is case-sensitive:props.CommunityName=Community name;
GETMYFORUMID Gets the ID of the forum that is created by the logged in user.
Enter the following property information that is case-sensitive:props.ForumName=actual forum name that is created by the logged inuser
GETMYFORUMSGets all the forums for the logged in user
GETPUBLICCOMMUNITYID Gets the ID of the given public community ID
Configuring integration to IBM Connections 383

Enter the following property information that is case-sensitive:props.CommunityName=Community name;
GETPUBLICFORUMIDGets the ID of the given public forum name
Enter the following property information that is case-sensitive:props.ForumName=actual public forum name
GETPUBLICFORUMSGets list of all public forums
GETTOPICREPLIESGets list of replies for a topic
Enter the following property information that is case-sensitive:props.TopicId=topic id; Where topic id must be the topic id not the topicname.
REPLYTOTOPICCreates a reply to an existing topic
Enter the following property information that is case-sensitive:props.TopicId=topic id; Where topic id is a topic ID not a topic nameprops.ReplyTitle=title;
props.ReplyContent=full text of the body;
Impact Object Parameter
The Impact Object parameter accepts the following property information. Theauthentication, and connection property information is mandatory.
props = NewObject();
props.Protocol=https;
props.Host=IBM Connections Server Host/IP;
props.Port=_PORT_;
props.Username=userName;
props.Password=password; The password can be encrypted by using either theNetcool/Impact nci_crypt tool or the policy function Encrypt(). If thepassword is encrypted, you must use the propertyprops.DecryptPassword=true;
IBMConnections Project and artifactsThe imported IBMConnections project includes artifacts that are categorized intofour categories.
Data sourcesv IBMConnectionsObjectServerDSA
v Internal
Data typesv TopicCreationTracker
– An internal data type that is used to track the topic creation to avoidduplicate names.
384 IBM Netcool Operations Insight: Integration Guide

v InternetOutageEvents
– ObjectServer data type that can be used to view the critical events in the UIData Provider widgets. It populates the severity as status data type to showcolorful images.
Policiesv IBMConnectionsUtils
– Includes a utility function to extract value from a data item.v IBMConnectionsUtilsCaller
– Shows how to call the utility function in IBMConnectionsUtils.v IBMConnectionsUtilsJS
– For JavaScript policies.v IBMConnectionsUtilsCallerJS
– For JavaScript policies.v NetworkMonitorExample
– Example policy that is run by an event reader to create and update topics.v NetworkMonitorForOpView
– Example policy that is run by the operator view from the ObjectServer EventList tool.
v Opview_IBMConnectionsOpView
– Is run by the AEL tool.
Servicesv NetworkMonitorExample
– Connects to the object server data source and uses a default filter of Node in('US','France','UK')and Identifier Like ’Monitoring Network for’. Youcan change the default filter at any time. It runs the policyNetworkMonitorExample.
Automatic topic management
The IBM Connections integration package includes NetworkMonitorExample eventreader service that connects to the Netcool/OMNIbus Object Server and filters forspecific events. When there is a match, the service runs the policy that eitherupdates the topic by sending a reply to the topic, or creates a topic if a topic doesnot exist.
The forum that is used in this example is the same name as the AlertKey in theObject Server event, forumName = @IBMConnections_Forum
You can use the sql scripts in the $IMPACT_HOME/integrations/IBMConnections/dbdirectory to create extra fields in the Object Server or you can use existing fields.
The topic title is created as a combination of a hardcoded string and the node fieldfrom the event:topicTitleVar="Network Monitor is down on node: @Node@" ;IBMConnectionsUtils.extractParametersAndSubstitute(topicTitleVar,EventContainer,result);topicTitle = result;
Configuring integration to IBM Connections 385

The policy checks if the topic was created by querying the internal data typeTopicCreationTracker. If the topic exists, the policy sends a reply instead ofcreating a new one.
Automatic topic management with event management toolsThe operator view policy is updated to run the NetworkMonitorForOpView policythat automatically updates an existing topic or creates a new topic.
Procedure1. Create the event management tool, refer to the Netcool/OMNIbus
documentation.2. In the event management tool, select the executable box tab and enter the
following text: start "" "https://<impactgui_server>:<port>/opview/displays/NCICLUSTER-IBMConnectionsOpView.html?Node=@Node&Serial=@Serial&Severity=@Severity&Acknowledged=@Acknowledged&AlertKey=@AlertKey&AlertGroup=@AlertGroup&Summary=@Summary"
NCICLUSTER Is the default cluster but if you are using a different cluster namethen update the URL with your cluster name.The above text is an example of text to enter for an Object Server on Windows.
3. Add the new event management tool to the AlertsStatus tools menu, refer tothe Netcool/OMNIbus documentation.
4. When you right-click on an event, click the tool to start the URL and run thepolicy. The operator view is started and gives a notification that the topic iscreated or updated, along with a link to the topic URL to use.
Related information:
Creating event management tools
Enabling historical eventsCreate a connection to the historical database in Impact to view historical events inthe Event Viewer.
Procedure1. Log in to Dashboard Application Services Hub and select the Data Model tab.2. Click the New Data Source icon.3. Point to Database SQL and select your database type. For example DB2.4. In the Data Source Name field enter: historicalEventsDatasource.5. Enter your Username and Password in the fields provided and click the Save
icon.6. In the left-hand navigation pane, right-click ImpactHistoricalEventData and
select New Data Type.7. In the Data Type Name field enter: historicalEventData.8. Click Refresh.
386 IBM Netcool Operations Insight: Integration Guide

Release notes
IBM Netcool Operations Insight V1.4.1 is available. Compatibility, installation, andother getting-started issues are addressed in these release notes.
Contentsv “Description”v “Compatibility”v “Release history”v “System requirements”v “New product features and functions” on page 388v “Known problems at eGA” on page 393v “Support” on page 402
Description
Netcool Operations Insight combines real-time event consolidation and correlationcapabilities of Netcool Operations Insight with Event Search and Event Analytics.It further delivers seasonality analysis to assist in detecting regularly occurringissues. Netcool Operations Insight also enables real-time enrichment andcorrelation to enable agile responses to alerts raised across disparate systemsincluding application topology.
Compatibility
IBM Netcool Operations Insight includes the product and component versionslisted on the following web pages, where you can also find information on theeAssemblies and fix packs required to download and install. Select the relevantversion of IBM Netcool Operations Insight.
Note: Only the combination of product and component releases specified on theversion's web page is supported in that version of IBM Netcool Operations Insight.
https://www.ibm.com/developerworks/community/wikis/home?lang=en#!/wiki/Tivoli%20Netcool%20OMNIbus/page/Release%20details
For more information about the Netcool Operations Insight products andcomponents, see “Supported products and components” on page 6
Release history
Full release history is given on the following web page.
https://www.ibm.com/developerworks/community/wikis/home?lang=en#!/wiki/Tivoli%20Netcool%20OMNIbus/page/Release%20history
System requirements
For information about hardware and software compatibility of each component,and detailed system requirements, see the IBM Software Product CompatibilityReports website:
© Copyright IBM Corp. 2014, 2018 387

http://www-969.ibm.com/software/reports/compatibility/clarity/index.html
Tip: When you create a report, search for Netcool Operations Insight and selectyour version (for example, V1.4). In the report, additional useful information isavailable through hover help and additional links.For example, to check the compatibility with an operating system for eachcomponent, go to the Operating Systems tab, find the row for your operatingsystem, and hover over the icon in the Components column. For more detailedinformation about restrictions, click the View link in the Details column.
New product features and functions
IBM Netcool Operations Insight V1.4.1 and its subordinate releases offer thefollowing new features and functions.
Netcool Operations Insight V1.4.1.2
1.4.1.2The following features and functions are introduced in V1.4.1.2. After youinstall all the products, components, and fixes that are included in NetcoolOperations Insight, you can benefit from all these features.
Updated product versions
The Netcool Operations Insight V1.4.1.2 solution includes featuresdelivered by the fix packs and fix pack extensions of the products andversions listed on the following web page:
https://www.ibm.com/developerworks/community/wikis/home?lang=en#!/wiki/Tivoli%20Netcool%20OMNIbus/page/From%201.4.1.1%20to%201.4.1.2
The products are available on Passport Advantage and Fix Central, asspecified on that web page.
For more information on the products and components that make upNetcool Operations Insight, see “Supported products and components” onpage 6.
For information on upgrading to Netcool Operations Insight V1.4.1.2, see“Upgrading to Netcool Operations Insight V1.4.1.2” on page 101.
New featuresThe following features and functions are available in the new NetcoolOperations Insight V1.4.1.2 components. For version numbers of theNetcool Operations Insight V1.4.1.2 components, see the relevant page atthis link.
Operations Management for Operations InsightThe base Netcool Operations Insight solution provides thefollowing new features and functions.
Netcool/OMNIbusIBM Netcool/OMNIbus Web GUI now provides improvedresponsiveness of Event Viewer when dealing with largenumber of events. This is achieved by avoiding use of theDashboard Application Services Hub CURI API forperformance critical data transfers.
Web GUI passwords used for system-to-systemauthentication can now be updated in real time without
388 IBM Netcool Operations Insight: Integration Guide

any service interruption. These real-time password updatesare made possible by means of an API.
IBM Tivoli Netcool/OMNIbus integrations include thefollowing probe and gateway updates:v Two new probes: A containerized version of the Probe
for IBM Cloud Private, and the probe for GenericMulti-technology Operations Systems Interface (MTOSI)
v Updates to the Probe for Message Bus and the Gatewayfor Message Bus to enable integration with NetCrackerMANO and the Kafka server.
Netcool/ImpactNetcool/Impact now contains the following updates andadditions, as well as fixes for various issues:v Updated browser, database, and operating system
supportv Change to the setNameServer script to accommodate
integration with IBM Tivoli Business Service Manager.
Event AnalyticsSignificant improvements have been made to the process ofconfiguring Event Analytics. Instead of editing the NOIShared Configuration properties file through the commandline, a new GUI-based setup wizard guides you throughthe Event Analytics configuration process. You must runthe Event Analytics configuration wizard after upgradingto Netcool/Impact v7.1.0.13 to verify and save yourconfiguration.
For more information, see “Event Analytics Configuration”on page 160.
Network Management for Operations InsightThe Network Management solution extension provides thefollowing new features and functions.
Network ManagerNetwork Manager now provides functionality to configurethe default network layer that the Network Hop Viewdisplays. For more information, see Changing defaulttopology layer for the Network Hop View.
This release also provides network operators the option tochoose any of the configured base layers for geographicalmaps directly from the GIS Device Map. For moreinformation, see Viewing devices in a geographical context.
Performance Management for Operations InsightThe Performance Management for Operations Insight solutionextension, made up of the Network Performance Insight product,provides the following new features and functions.v Ability to integrate Network Performance Insight within Netcool
Operations Insight without the need for any integration withNetwork Manager. There are two versions of this integration:– Flow information only: this version requires integration of
Network Performance Insight only. Flow data is available inthe form of top 10 information and detailed views of flow
Release Notes 389

across specific interfaces. However, performance data, such asSNMP, IP SLA, and queue drop data is not available.
– Flow and performance information: this version integratesNetwork Performance Insight and Cacti. This provides acomplete flow and performance solution, as performance datathat was provided by Network Manager in earlier versions isnow provided by Cacti.
For more information on these new scenarios, see NetworkPerformance Insight 1.2.3: Scenarios.
v Enhancements to Network Performance Insight dashboardsinclude side-by-side charts for easy comparison, and theintroduction of a new Network Traffic Overview dashboard forthe new Flow information only integration. For moreinformation, see “Network Performance Insight Dashboards” onpage 309.
v Extended support for IP SLA data now includes support forJuniper's real-time performance monitoring (RPM) data andHuawei's network quality analysis (NQA) data.
Service Management for Operations InsightThe Service Management for Operations Insight solution extensionprovides the following new features and functions.
Agile Service ManagerAgile Service Manager now provides improvedfunctionality to customize user interface elements anddefine global settings, as well as the ability to synchronizeAgile Service Manager and Netcool/OMNIbus events bydeploying the Netcool/OMNIbus Probe for Message Bustogether with the Netcool/OMNIbus Gateway for MessageBus. This version of Agile Service Manager also ships anumber of new observers.
For more information, see Agile Service Managerdocumentation: About this release.
Netcool Operations Insight V1.4.1.1
1.4.1.1The following features and functions are introduced in V1.4.1.1. After youinstall all the products, components, and fixes that are included in NetcoolOperations Insight, you can benefit from these features.
Updated product versions
The Netcool Operations Insight V1.4.1.1 solution includes featuresdelivered by the fix packs and fix pack extensions of the products andversions listed on the following web page:
https://www.ibm.com/developerworks/community/wikis/home?lang=en#!/wiki/Tivoli%20Netcool%20OMNIbus/page/From%201.4.1%20to%201.4.1.1
The products are available on Passport Advantage and Fix Central, asspecified on that web page.
For more information on the products and components that make upNetcool Operations Insight, see “Supported products and components” onpage 6.
390 IBM Netcool Operations Insight: Integration Guide

For information on upgrading to Netcool Operations Insight V1.4.1.1, see“Upgrading to Netcool Operations Insight V1.4.1.1” on page 103.
New featuresThe following features and functions are available in the new NetcoolOperations Insight V1.4.1.1 components. For version numbers of theNetcool Operations Insight V1.4.1.1 components, see the relevant page atthis link.
Netcool/OMNIbusNetcool/OMNIbus now provides functionality to disable specificciphers from individual SSL/TLS protocols. Probes running inslave mode can now forward-on ProbeWatch events. Probes areresilient to field drops on alerts.status table, and do not requires arestart or removal of SAF files.
Netcool/ImpactNetcool/Impact now contains the following updates and additions,as well as fixes for various issues:v Updated browser, database, and operating system support.v Multi-tenant capability added. This allows the display of two
table widgets on the same page using the same dataset, and thedisplay of nested child information from a parent line.
Event AnalyticsSignificant improvements have been made to reduce report runtimes as well as reduce memory consumption. In addition, theView Related Events portlet now displays Events, Groups, andGroups Sources more quickly once an item is selected. As part ofthis update, each tab in the View Related Events portlet now listsall configurations in the panel on the left of the portlet followingthe successful run of a configuration. Configurations are displayedin the panel even if there are no events or groups in a particularstate for a given configuration. If no data exists for a particularstate, the panels will display a No items to display message. Theconfiguration will be listed in all five tabs, New, Watched, Active,Expired, and Archived.
Network ManagerNetwork Manager now provides event status on probes that areconfigured to monitor IP Service Level Agreements (IP SLA). Thisrelease also adds support for changing the default connectivity inthe Network Hop View.
Netcool Configuration ManagerNetcool Configuration Manager now provides a priority level forcertain service URIs, and fixes for various issues.
Network Performance InsightNetwork Performance Insight now provides new dashboards, tosupport Operations using flow data organized by type of service(ToS), protocol, and other details. The new dashboards also supportnetwork planning and engineering teams by providing detailedinformation associated with QoS queues and on-demanddashboards that show performance of a specific interface over aperiod for a set of KPIs. For more information, see “NetworkPerformance Insight Dashboards” on page 309.
Release Notes 391

Agile Service ManagerAgile Service Manager provides a series of new functionality,including the ability to customize user interface elements, mergeresources, and specify more detailed user preferences. There arealso a number of new observers that are now available. For moreinformation, see Agile Service Manager documentation: About thisrelease.
Netcool Operations Insight V1.4.1
The following features and functions are introduced in V1.4.1. After you install allthe products, components, and fixes that are included in Netcool OperationsInsight, you can benefit from all these features.
Updated product versions
The Netcool Operations Insight 1.4.1 solution includes features deliveredby the fix packs and fix pack extensions of the products and versions listedon the following web page:
https://www.ibm.com/developerworks/community/wikis/home?lang=en#!/wiki/Tivoli%20Netcool%20OMNIbus/page/From%201.4.0.5%20to%201.4.1
The products are available on Passport Advantage and Fix Central, asspecified on that web page.
More information: “Supported products and components” on page 6
New Service Management for Operations Insight solution extensionThis solution extension widens the scope of the base solution to provideservice management capability. The extension is made up of the IBM AgileService Manager product. Agile Service Manager provides operationsteams with complete up-to-date visibility and control over dynamicinfrastructure and services. Agile Service Manager lets you query a specificnetworked resource, and then presents a configurable topology view of itwithin its ecosystem of relationships and states, both in real time andwithin a definable time window. For more information, seehttps://www-01.ibm.com/support/knowledgecenter/SS9LQB. Thisversion of Netcool Operations Insight supports Agile Service ManagerV1.1.1.
Device Dashboard now includes performance metric timelinesUsing the Device Dashboard you can now view performance metrictimeline data covering the last 12 hours of data, and zoom in and out ofthe timeline to see metric values and trends at any time during the last 12hours. You can view timelines for any performance metric on a device orits interfaces.
More information: “Displaying performance timelines” on page 296
392 IBM Netcool Operations Insight: Integration Guide

Known problems at eGA
The following problems with IBM Netcool Operations Insight V1.4.0.4 Marchrelease were known at the time of eGA.v “Solution-level problems”v “Device Dashboard”v “Event Analytics” on page 395v “Event Search” on page 398v “Globalization” on page 400v “Network Health Dashboard” on page 401v “Operations Analytics - Log Analysis” on page 402
Solution-level problems
1.4.1.1
Unable to create new users in LDAP using WebSphere
Application ServerWhen a new user is created using the WebSphere ApplicationServer, the UniqueName attribute references thedefaultFileBasedRealm instead of LDAP. This means that the newuser cannot be assigned to groups and therefore cannot beassigned roles in LDAP.
Device Dashboard
Device Dashboard is unable to differentiate between anomaly thresholdsconfigured for poll definitions that have the same metric name
The Device Dashboard is unable to differentiate between anomalythresholds configured for poll definitions that have the same metricname. To ensure that metrics are correctly distinguished in theDevice Dashboard Performance Insights portlet ensure that anypoll definitions created have a unique metric name.
However, this workaround does not apply to the Default ChassisPing and Default Interface Ping poll definitions, which by defaultboth use a metric with the name PingTime. The consequences ofthis are best illustrated using an example:1. Assume you set and enable an anomaly threshold on the
Default Chassis Ping poll definition, with the intention ofviewing anomalies against the chassis ping time metric.
2. Assume also that you do not set an anomaly threshold on theDefault Interface Ping poll definition, as you do not want toview anomalies against the interface ping time metric.
3. However, the threshold you set and enabled on the DefaultChassis Ping poll definition will apply to both the chassis andthe interface ping time metrics. Consequently in the Interfacestab of the Performance Insights portlet, selecting PingTimefrom the Metric drop-down list will return unexpectedanomalies in the portlet.
The workaround is to set and enable the same thresholds on boththe Default Chassis Ping and Default Interface Ping polldefinitions.
Tooltip on sparkline in Performance Insights portlet displaysunnecessary scroll bar
The sparklines in the Performance Insights portlet each have an
Release Notes 393

associated tooltip. Some of these tooltips display an unnecessaryvertical scrollbar. This issue can safely be ignored.
Performance Insights portlet: sorting the data by Value does not workIn the Interfaces tab within the Performance Insights portletsorting the data by clicking the Value column does not work.
When launching a new Device Dashboard by right-clicking an event inthe Event Viewerwithin an existing Device Dashboard the DeviceDashboard does not refresh with the new entity identifier
When launching a new Device Dashboard by right-clicking anevent in the Event Viewer within an existing Device Dashboardthe newly launched Device Dashboard does not refresh with theentity identifier corresponding to the selected event. To workaround this issue, select Event Viewer from the DashboardApplication Services Hub navigation, select the relevant event andlaunch the Device Dashboard from there.
Integration problem: Widgets do not open when selecting "Show Traffic"When right-clicking and selecting Show Traffic from any networktopology (for example, Network Hop View), widgets do not open.To work around this issue, find the device in Event Viewer ,right-click and select Show Traffic.
Device Dashboard does not launch from a Network Hop View openedwithin a new browser tab
If you launch a Network Hop View within a new browser tab byrunning the Find in > Network Hop View from any other GUI,then you will not be able to launch the Device Dashboard fromthat Network Hop View.
Performance Insights portlet filter values are cleared on refresh ofDevice Dashboard
You can apply filters in the Device Dashboard PerformanceInsights portlet, in both the Device and Interfaces tabs. However,when the Device Dashboard is refreshed, any values entered intothe Interfaces tab filter field are automatically cleared. You willneed to enter filter values again after the refresh.
Note: This issue does not affect values entered into the Device tabfilter field.
Performance Insights portlet filter values are cleared when switchingtabs When you switch from the Interfaces to the Device tab in the
Device Dashboard Performance Insights portlet, any values enteredinto the Interfaces tab filter field are automatically cleared. Youwill need to enter filter values again.
Note: This issue does not apply when you switch from the Deviceto the Interfaces tab.
When portlet preferences are saved Device Dashboard portlets are notdisplayed properly
After changing portlet preferences in the following DeviceDashboard portlets, unexpected results occur in the followingportlets:v Performance Insights portlet: metric and count data disappear
from the portlet, and the preferences do not take effect.
394 IBM Netcool Operations Insight: Integration Guide

v Performance Timeline portlet: timeline data disappears; however,the portlet preferences are saved and are automatically appliedwhen graph is next rendered, either automatically on the nextrefresh or by clicking a sparkline.
To resolve this issue, do the following:v Performance Insights portlet: click a device in the Topology
portlet. This forces a manual refresh of the Performance Insightsportlet.
v Performance Timeline portlet: click any sparkline in thePerformance Insights portlet. This reinstates the PerformanceTimeline portlet and refreshes the content of the portlet.
Occasionally the content of the Device Dashboard Performance Insightsportlet does not update when you select a different interface metric
When selecting a new interface metric from the Metric drop-downlist in the Performance Insights portlet Interfaces tab, the contentof portlet occasionally does not update. To work around this issue,select the metric twice from the drop-down list.
Event AnalyticsIf your problem is not listed in this section, then refer to TroubleshootingEvent Analytics for additional issues.
1.4.1.2 View Related Events > Groups: right-click menu itemsdisplayed in capital letters
If you Deploy, Watch, or Archive a related event group from theright-click menu in the View Related Events > Groups panel andthen immediately right-click again to access the menu before thegroup has moved, the menu appears with capital letters. There isno impact on moving groups in this manner.
1.4.1.2 Time window for Suggested Patterns displays large values
The time window displayed for suggested patterns mayoccasionally display a very large value in minutes (more than oneday in minutes). This is due to anomalies in the data beingprocessed by the event analytics algorithms. If this situation is seenfor a suggested pattern, the advised course of action is to eitheredit the pattern so that the time window is reduced and save thispattern, or to rerun the Event Analytics configuration in theConfigure Analytics portlet. This should resolve the issue.
1.4.1.2 Related events groups and patterns from the Watched tab notmoving to the Expired tab
You can modify the expiry time for Watched or Active relatedevents groups. When the expiry time is reached, expired groupsand related events from the Watched tab are not moved to theExpired tab within the View Related Events portlet.
1.4.1.2 Parts of the Events Pattern screen not displaying because aninvalid group is selected
If you attempt to create an event pattern with groups that haveEventID as null, the check boxes for Trigger Action, Event Typeand Resource Columns do not appear on the Pattern Criteria tab.
Release Notes 395

An error message is displayed if you try to save the pattern. Toavoid this issue, ensure that only valid groups are used to createpatterns.
1.4.1.2 View Related Events error: "Failed to load data"
The error "Failed to load data" can appear if you select All fromthe Configuration pane, when the state is Active or Watched, andthere is more than one set of related event configurations withdata. To avoid this issue, select the individual configurationsinstead.
1.4.1.1 Chart data retrieved from the server is incorrectly formatted
Problems can occur when displaying Seasonal Event Graphs if youare experiencing network latency or a slow network connectionbetween your browser and the DASH/Impact machine. In such ascenario, an incomplete graph page might be displayed with thefollowing error message:
Chart data retrieved from the server is incorrectly formattedTypeError: Cannot read property ’grammar’ of null
1.4.1.1 Related Events with a medium or weak relationship profiledisplayed as strong
In the Related Events Details view under More Information,related events with a medium or weak relationship profile mightbe incorrectly displayed as a strong relationship profile.
1.4.1.1 Event Analytics configurations are deleted on Netcool/Impactcluster node failover
Following a Netcool/Impact cluster node failover, the runningconfiguration will be correctly stopped but any queuedconfigurations will be lost on the secondary node. Theseconfigurations cannot be retrieved and must be recreated on thesecondary node.
For more information, see the following technote:http://www.ibm.com/support/docview.wss?uid=swg22012656.
Suggested pattern with a blank Event Type parameter field
When editing a suggested pattern, the Event Type parameter fieldwill be empty if the property type.0.eventtype is set to a valuethat is empty in the database. To avoid this issue, ensure that thetype.0.eventtype property is not set to an empty value in theEvent History Database. Selecting an event type field that containsall null values in the history database will result in the patterncriteria section of the create or edit pattern screen appearing blank.
Blank fields during creation of synthetic event on non-occurrence.Users are given the option to supply one or more values foradditional columns by selecting Set additional fields. With theexception of the values specified in the Create Event window, onlythe values of Node and Summary are copied into the synthetic event.
396 IBM Netcool Operations Insight: Integration Guide

Removing Netcool/Impact data models that are no longer needed.This issue refers to the following Netcool/Impact data models thatare no longer needed after you upgrade to the IBM NetcoolOperations Insight fix pack. Use the Netcool/Impact GUI toremove these data models:
ObjectServerHistoryDB2ForSeasonality
ObjectServerHistoryOrclForSeasonality
ObjectServerHistoryMSSQLForSeasonality
Note: If you choose not to remove these data models, there is noimpact to the Event Analytics functionality. You would removethese data models only for cosmetic purposes.
Note: See Notes on upgrading in the “New product features andfunctions” on page 388 section of these Release Notes forinformation about upgrading.
Event summary is truncatedThe event summary is occasionally truncated in the Related EventsDetails portlet Timeline view. To view the event summary, modifythe screen resolution temporarily.
Seasonal event rule with time condition does not runA seasonal event rule, with an action to run after a specific timethat is more than 25 seconds, is not run. To ensure that a seasonalevent rule that is scheduled to run after a specific time runscorrectly, select a time condition of less than or equal to 25seconds.
Edit selection window hangs when 'selecting all' for a large number ofrelated events during seasonal event rule creation
When creating a seasonal event rule for an event with a largenumber of related events, you can check the Select all relatedevents check box to associate all the related events with theseasonal event rule. The problem occurs when a large number ofrelated events, on the order of 1000 or more, are selected and Editselection is clicked. The Edit selection window is displayed but itremains in a loading state.
To avoid this issue, split the report into smaller reports and createrules around reports with fewer related events.
Incorrectly displaying 'No event selected' error message
When creating a pattern for related events and clicking UseSelected Event as Template, if you have not selected an event, thesystem correctly displays the 'No event selected' error message.However, if you then do select an event and click Use SelectedEvent as Template again, the error message persists
In this case, you can disregard and close the error message. It willnot affect the creation of the pattern.
When testing an event pattern collapsed sections do not display correctlywhen reopened
Following testing of an event pattern, if you collapse the Groups,Group Instances, and Events sections in the Test tab of the EventsPatten GUI using the splitters provided and then you expand the
Release Notes 397

sections again, the data columns in the Groups and Events panelsbecome very narrow and the data cannot be read.
To work around this issue, you can do one of the following:v Resize the window frame. This causes the columns to resize so
that the data becomes visible.v Manually resize the column widths or refresh the page. Either of
these actions causes the columns to be displayed correctly again
Event Search
1.4.1.1
Severity colors in Operations Analytics - Log Analysis charts
use random colors for event severity values
Note: This issue is fixed in version 1.4.1.2.
Operations Analytics - Log Analysis charts, such as Event Trend bySeverity, Event Storm by AlertGroup, and Severity Distribution, userandom colors for chart elements that represent event severityvalues, and do not use the standard event severity colors used inWeb GUI Event Viewer. For example, a pie chart in the SeverityDistribution chart portlet might contain a blue pie chart segmentrepresenting events of critical severity, even though the standardcolor for critical severity in the Web GUI Event Viewer is red.
Furthermore, if two or more charts are presented on a dashboard,then it is likely that the color used for a given event severity in onechart portlet on that dashboard page will differ from the sameevent severity in another chart portlet on that same dashboardpage.
Note: Each chart has its own severity color legend. Refer to theseverity color legend on each chart to determine which colors areused on that chart to denote different severity values.
This use of random colors that differ from the standard eventseverity colors used in Web GUI Event Viewer is intentional, and ismeant to enable you to distinguish between event severity valueson a chart.
1.4.1.1 HeatMap chart types do not render correctly
Note: This issue is fixed in version 1.4.1.2.
The HeatMap type charts fail to render when using IBMOperations Analytics - Log Analysis V1.3.3, displaying thefollowing error: Parameter category is invalid for Heat Map.The error is caused by a difference in the way charts are defined inOperations Analytics - Log Analysis 1.3.2 and 1.3.3.
The following charts are affected:v In OMNIbusInsightPack > Last Day > Dynamic Event
Dashboard:– Hotspots by Node and Alert Group– Hotsport by AlertGroup and Severity
v In OMNIbus_Static_Dashboard, opened from the Web GUIEventSearch tab by right-clicking and selecting Show Event
Dashboard by Node:
398 IBM Netcool Operations Insight: Integration Guide
– Hotspots by Node and AlertGroup– Hotspots by AlertGroup and Severity
To correct this problem, edit the following chart specification files,and search for all instances of category and change them tocategories:v $UNITY_HOME/AppFramework/Apps/OMNIbusInsightPack_v1.3.0.2/
Last_Day/OMNIbus_Dynamic_Dashboard.app
v $UNITY_HOME/AppFramework/Apps/OMNIbusInsightPack_V1.3.0.2/OMNIbus_Static_Dashboard.app
Right-click keyword search results hidden by defaultThis issue affects Event Search prior to Operations Analytics - LogAnalysis version 1.3.5. When using the Event Search right-clickmenu within Web GUI and selecting Show keywords and eventcount, the search results in Event Search are empty. The problem iscaused by the Search Patterns pane being hidden by default in theOperations Analytics - Log Analysis user interface.
To view the Show keywords and event count results, click theRestore Section triangle icon on the left side of the Event Searchuser interface.
Hotspots by Node, AlertKey not displaying.If the Hotspots by Node, Alert Group and AlertKey chart fails todisplay in the Last_Month->Operational Status Dashboard theSOLR heap size might need increasing.
Note: The Hotspots by Node, Alert Group and AlertKey chart isCPU intensive and can be slow to render for systems with a largeamount of data.
More information: Search runtime exceptions and IBM SmartCloudAnalytics - Log Analysis Performance and Tuning Guide.
Hover values for the Event Trend by Severity charts do not appear tomatch the axes.
When hovering over a point on a particular severity the valuesreturned might not appear to match the axes on the chart. It isbecause the hover values represent that severity only, whereas thevalues on the axes are cumulative. For example, if there are 20Intermediate severity events and 26 Major severity eventsdisplayed on the line above, the Major events will appear against46 on the Y-axis.
Drill down does not return results.The drill down function is not available for the type Omnibus TreeMap. This affects some of the charts in the Operational Efficiencydashboard in the Last Month folder, and in the OMNIbusOperations Manager and OMNIbus Spot Important Alertsdashboards in the Last Hour folder.
If drill down is required for these charts you can use the defaultTree Map specification instead. To change specification, click thechart settings icon on the right of the chart and change Chart Typefrom OMNIbus Tree Map to Tree Map.
Help text not rendered correctly for Event Analysis and Reduction inbi-directional locales.
This affects the help text in the Event Analysis and Reduction
Release Notes 399

dashboards for Analyze and Reduce Event Volumes, Introductionto the Apps, and Helpful Links. The help text is not renderedcorrectly in the Arabic and Hebrew locales.
You can view text directly as an HTML file in a browser thatsupports bi-directional locales. The relevant files areAnalyze_and_reduce_event_volumes.html,Introduction_to_the_Apps.html,and Helpful_links.html. The filesare located in $UNITY_HOME/AppFramework/Apps/OMNIbusInsightPack_v1.3.0.2/locale/<LOCALE>/LC_MESSAGES.
GlobalizationThe following issues affect the non-English language versions of NetcoolOperations Insight.
Event Search: count and time stamp hover help are not translated insome charts
This issue affects the OMNIbusInsightPack_v1.3.0.2. The followingtexts are not translated and appear in English only:v Hover help for time stamp and count in stacked bar charts, heat
maps and pie chartsv Legend for the Count field in the “Hotspots by Node and
AlertGroup” chart and “Hotspots by AlertGroup and Severity”chart of the xxxOMNIbus Static Dashboard custom app
v Legend for the Count field in the “Last Day - Hotspots byAlertGroup and Severity” chart, “'Last Day - Event Storm byNode” chart, and “Last Day - Hotspots by Node andAlertGroup” of the OMNIbus Dynamic Dashboard custom app
Network Health Dashboard: In the Top Performers widget, the Japanesetranslation of the time to refresh is not displayed correctly
In the Top Performers widget, the Japanese translation of the timeto refresh is not displayed correctly. The correct word order inJapanese has the number preceding the text; however, the wordorder displayed has the number following the text.
Topology Search: error message only partially translatedThis issue affects the Network Manager Insight Pack V1.3.0.0. Ifyou attempt to run a topology search between two nodes on thesame device, the error message that is displayed is only partiallytranslated. The error message in full is as follows:An error occurred calculating the path between ’X’ and ’X’,
The source and destination Node’s cannot be the same
(Where X is the value of the NmosObjInst for the device. The firsthalf of the message, An error occurred calculating the pathbetween 'X' and 'X', is translated. The second half of the messageThe source and destination Node's cannot be the same is nottranslated and always appears in English.
IBM Installation Manager
Console mode: cannot install Netcool/OMNIbus core and Web GUI orNetcool/Impact at the same time.
When you install Netcool/OMNIbus core and Web GUI orNetcool/Impact at the same time with Installation Manager -console mode, the installation paths for Web GUI andNetcool/Impact are not prompted for and the installation fails. If
400 IBM Netcool Operations Insight: Integration Guide

you are performing the installation with Installation Manager -console mode, you must install the components separately.
Note: Installing Jazz for Service Management and IBM WebSphereApplication Server is not supported for Installation Manager -console mode.
Network Health DashboardThe known problems vary depending on which version of NetworkManager is installed.
1.4.1.1 If you have Network Manager 4.2.0.4 installedThere are no known problems for the Network Health Dashboard.
If you have Network Manager 4.2.0.3 installedThe Network Health Dashboard has the following knownproblems.
Must install Network Health Dashboard with the NetworkManager GUI Components
For Fix Packs 1, 2, and 3, if you want to install theNetwork Health Dashboard, you must install it in the sameIBM Installation Manager session as the Network ManagerGUI Components. Otherwise, some interaction betweenwidgets and pages might not work.
If you upgrade the Network Manager GUI Componentsfrom Fix Pack 1 to 2, or 2 to 3, you must upgrade theNetwork Health Dashboard in the same IBM InstallationManager session.
If you roll back the Network Manager GUI Componentsfrom Fix Pack 2 to Fix Pack 1, you must roll back theNetwork Health Dashboard in the same IBM InstallationManager session.
If you roll back the Network Manager GUI Componentsfrom Fix Pack 3 to Fix Pack 2, you do not need to roll backthe Network Health Dashboard in the same IBMInstallation Manager session.
If you encounter problems with upgrading or rolling backthe Network Manager GUI Components, apply thefollowing workaround: Uninstall the Network HealthDashboard, retry the GUI upgrade or rollback, thenreinstall the Network Health Dashboard.
Network Health Dashboard does not work after rolling backfrom Fix Pack 3
If you update from Network Manager 4.2 to 4.2 Fix Pack 3and then roll back to 4.2, the Network Health Dashboarddoes not function. Take a backup of your system beforeupgrading, and restore the backup instead of rolling backthe product.
You must install the Network Health Dashboard with the NetworkManager GUI Components
If you want to install the Network Health Dashboard. you mustinstall it in the same IBM Installation Manager session as the
Release Notes 401

Network Manager GUI Components. Otherwise, some interactionbetween widgets and pages might not work.
You must roll back the Network Manager GUI Components and theNetwork Health Dashboard packages together
If you have installed the Network Manager 4.2 GA release and theNetwork Health Dashboard, and you then updated to 4.2 Fix Pack1, and at this point you want to roll back one or more packages,then you must roll back the Network Manager GUI Componentsand the Network Health Dashboard packages together. If you rollback one of these packages without the other, there is a risk thatyour system will become corrupted.
Operations Analytics - Log Analysis
Operations Analytics - Log Analysis installation fails Operations Analytics - Log Analysis V1.3.x requires a minimum 5GB disk space on all supported operating systems. If less than 5GB is found, the installer hangs. No error message is displayed. Ifthis problem occurs, terminate the installer.
Support
IBM Electronic Support offers a portfolio of online support tools and resources thatprovides comprehensive technical information to diagnose and resolve problemsand maintain your IBM products. IBM has many smart online tools and proactivefeatures that can help you prevent problems from occurring in the first place, orquickly and easily troubleshoot problems when they occur. For more information,see:
http://www.ibm.com/support/electronicsupportRelated concepts:“Solution overview” on page 1
402 IBM Netcool Operations Insight: Integration Guide

Notices
This information was developed for products and services offered in the U.S.A.IBM may not offer the products, services, or features discussed in this document inother countries. Consult your local IBM representative for information on theproducts and services currently available in your area. Any reference to an IBMproduct, program, or service is not intended to state or imply that only that IBMproduct, program, or service may be used. Any functionally equivalent product,program, or service that does not infringe any IBM intellectual property right maybe used instead. However, it is the user's responsibility to evaluate and verify theoperation of any non-IBM product, program, or service.
IBM may have patents or pending patent applications covering subject matterdescribed in this document. The furnishing of this document does not give youany license to these patents. You can send license inquiries, in writing, to:
IBM Director of LicensingIBM CorporationNorth Castle DriveArmonk, NY 10504-1785 U.S.A.
For license inquiries regarding double-byte (DBCS) information, contact the IBMIntellectual Property Department in your country or send inquiries, in writing, to:
Intellectual Property LicensingLegal and Intellectual Property LawIBM Japan, Ltd.1623-14, Shimotsuruma, Yamato-shiKanagawa 242-8502 Japan
The following paragraph does not apply to the United Kingdom or any othercountry where such provisions are inconsistent with local law:
INTERNATIONAL BUSINESS MACHINES CORPORATION PROVIDES THISPUBLICATION "AS IS" WITHOUT WARRANTY OF ANY KIND, EITHEREXPRESS OR IMPLIED, INCLUDING, BUT NOT LIMITED TO, THE IMPLIEDWARRANTIES OF NON-INFRINGEMENT, MERCHANTABILITY OR FITNESSFOR A PARTICULAR PURPOSE.
Some states do not allow disclaimer of express or implied warranties in certaintransactions, therefore, this statement might not apply to you.
This information could include technical inaccuracies or typographical errors.Changes are periodically made to the information herein; these changes will beincorporated in new editions of the publication. IBM may make improvementsand/or changes in the product(s) and/or the program(s) described in thispublication at any time without notice.
Any references in this information to non-IBM Web sites are provided forconvenience only and do not in any manner serve as an endorsement of those Websites. The materials at those Web sites are not part of the materials for this IBMproduct and use of those Web sites is at your own risk.
© Copyright IBM Corp. 2014, 2018 403
IBM may use or distribute any of the information you supply in any way itbelieves appropriate without incurring any obligation to you.
Licensees of this program who wish to have information about it for the purposeof enabling: (i) the exchange of information between independently createdprograms and other programs (including this one) and (ii) the mutual use of theinformation which has been exchanged, should contact:
IBM Corporation2Z4A/10111400 Burnet RoadAustin, TX 78758 U.S.A.
Such information may be available, subject to appropriate terms and conditions,including in some cases payment of a fee.
The licensed program described in this document and all licensed materialavailable for it are provided by IBM under terms of the IBM Customer Agreement,IBM International Program License Agreement or any equivalent agreementbetween us.
Any performance data contained herein was determined in a controlledenvironment. Therefore, the results obtained in other operating environments mayvary significantly. Some measurements may have been made on development-levelsystems and there is no guarantee that these measurements will be the same ongenerally available systems. Furthermore, some measurement may have beenestimated through extrapolation. Actual results may vary. Users of this documentshould verify the applicable data for their specific environment.
Information concerning non-IBM products was obtained from the suppliers ofthose products, their published announcements or other publicly available sources.IBM has not tested those products and cannot confirm the accuracy ofperformance, compatibility or any other claims related to non-IBM products.Questions on the capabilities of non-IBM products should be addressed to thesuppliers of those products.
All statements regarding IBM's future direction or intent are subject to change orwithdrawal without notice, and represent goals and objectives only.
This information contains examples of data and reports used in daily businessoperations. To illustrate them as completely as possible, the examples include thenames of individuals, companies, brands, and products. All of these names arefictitious and any similarity to the names and addresses used by an actual businessenterprise is entirely coincidental.
If you are viewing this information in softcopy form, the photographs and colorillustrations might not be displayed.
TrademarksIBM, the IBM logo, and ibm.com are trademarks or registered trademarks ofInternational Business Machines Corp., registered in many jurisdictions worldwide.Other product and service names might be trademarks of IBM or other companies.A current list of IBM trademarks is available on the Web at “Copyright andtrademark information” at www.ibm.com/legal/copytrade.shtml.
404 IBM Netcool Operations Insight: Integration Guide

Adobe, Acrobat, PostScript and all Adobe-based trademarks are either registeredtrademarks or trademarks of Adobe Systems Incorporated in the United States,other countries, or both.
Java and all Java-based trademarks and logos are trademarks or registeredtrademarks of Oracle and/or its affiliates.
Linux is a trademark of Linus Torvalds in the United States, other countries, orboth.
Microsoft, Windows, Windows NT, and the Windows logo are trademarks ofMicrosoft Corporation in the United States, other countries, or both.
UNIX is a registered trademark of The Open Group in the United States and othercountries.
Other product and service names might be trademarks of IBM or other companies.
Notices 405
Copyright © 2022 FDOKUMEN