IBM Cognos BI – New Features in Framework Manager
24
Guideline IBM Cognos BI – New Features in Framework Manager Product(s): Framework manager Area of Interest: Modeling
-
Upload
khangminh22 -
Category
Documents
-
view
0 -
download
0
Transcript of IBM Cognos BI – New Features in Framework Manager

Guideline
IBM Cognos BI – New Features inFramework ManagerProduct(s): Framework manager
Area of Interest: Modeling

IBM Cognos BI – New Features in Framework Manager 10.2.2
Copyright and Trademarks Licensed Materials - Property of IBM.
© Copyright IBM Corp. 2014
IBM, the IBM logo, and Cognos are trademarks or registered trademarks of International BusinessMachines Corp., registered in many jurisdictions worldwide. Other product and service names mightbe trademarks of IBM or other companies. A current list of IBM trademarks is available on the Web athttp://www.ibm.com/legal/copytrade.shtml
While every attempt has been made to ensure that the information in this document is accurate andcomplete, some typographical errors or technical inaccuracies may exist. IBM does not acceptresponsibility for any kind of loss resulting from the use of information contained in this document.The information contained in this document is subject to change without notice.
This document is maintained by the IBM Business Analytics Proven Practices team. You cansend comments, suggestions, and additions to [email protected].
2

IBM Cognos BI – New Features in Framework Manager 10.2.2
Table of ContentsIntroduction......................................................................................................................4
Purpose of Document.................................................................................................................4Applicability...............................................................................................................................4Assumptions..............................................................................................................................4
Overview...........................................................................................................................4
New Features Described.............................................................................................................5
Bridge Table Workshop Objectives......................................................................................6
Understanding the Data.............................................................................................................6Understanding Standard Multi-Fact Query Results........................................................................6Understanding Bridge Table Query Results..................................................................................7Bridge Table Workshop Steps.....................................................................................................8
Filter Join Optimization Workshop Objectives.....................................................................15
Filter Join Optimization Workshop Steps....................................................................................15
Summary Query Subject Workshop Objectives...................................................................19
Summary Query Subject Workshop Steps..................................................................................19
3

IBM Cognos BI – New Features in Framework Manager 10.2.2
Introduction
Purpose of Document
This document will describe and provide workshops to try out new features in Framework Manager10.2.2. These features include bridge table awareness, filter join optimization, and summary querysubjects.
Applicability
This document was written specifically for new features in IBM Cognos 10.2.2.
Assumptions
This document assumes knowledge of modeling in Framework Manager and working with databasesand configuring connectivity from IBM Cognos BI.
OverviewFramework Manager is a Windows application for importing data definitions, commonly referred to asmetadata, and modeling that information to provide simplified and accurate data access for businessreporting and analysis. Common calculations, multilingual capabilities, and security can be added toincrease business value. Framework Manager can also be use to extend a relational model todimensionally modeled relational model (DMR) for an OLAP-like experience within the Cognos BIstudios.
Framework Manager models can be published as packages and deployed to IBM Cognos BI whereself-service users and professional report designers can create reports based on the package content.
4

IBM Cognos BI – New Features in Framework Manager 10.2.2
New Features Described
New features in IBM Cognos 10.2.2 are mainly exclusive to Dynamic Query Mode (DQM) and include:
• Bridge Query Subjects – Now, obtaining correct results with bridge tables is simple. Thiscan be achieved by setting the (DQM) Usage property of the query subject that representsthe bridge to "Bridge". This will let the IBM Cognos BI server know that the associatedtable is a bridge table, not a fact table like the many side of a join normally implies, so thatit can plan queries accordingly for correct results. This setting ensures no double countingand no missing entries. When a user applies a filter to a bridge in a multi-fact query, bothfact tables will be filtered accordingly.
• Filter Join Optimization – This feature is set with the (DQM) Filter Type setting in theproperties of a relationship.
• The purpose of the filter join optimization is to improve performance by filtering theMany side of a join using the values retrieved on the One side of the join.
• This can minimize the amount of data retrieved by the Cognos BI server and localprocessing of that data, particularly when blending data from disparate datasources where the Many side has orders of magnitude more rows than the Oneside.
• Summary Query Subjects – A summary query subject, defined using the (DQM) Usageproperty of the query subject, allows you to specify grouping and aggregation of data in themetadata model in ways previously only possible in Report Studio and Cognos WorkspaceAdvanced. This allows authors and self-service users to obtain the desired values that areaggregated on a specified grouping with drag-and-drop gestures instead of having to typeexplicit aggregate calculations. Now you can define complex aggregation once in themodel and easily reuse it in as many reports as you want.
Also, previously all filters defined in Framework Manager were detail filters. In other words,the filter was processed before any aggregation occurred. When a query subject is configuredto be a Summary query subject, you can have an embedded filter applied before or afteraggregation just like in the Cognos BI studios.
• Parameter Map Freshness – Previously, parameter map values were cached for theduration of a user session, potentially resulting in stale results in the reports if the parametermap values on the underlying source had changed. Now it is possible to specify precisely(down to the second) how long parameter map values will be cached if at all. This feature isset on a new property for Parameter Maps called Freshness. See the documentation forsettings. This feature applies to both Compatible Query Mode (CQM) and DQM.
The following workshops will focus on Bridge Tables, Filter Join Optimization, and Summary QuerySubjects.
5
IBM Cognos BI – New Features in Framework Manager 10.2.2
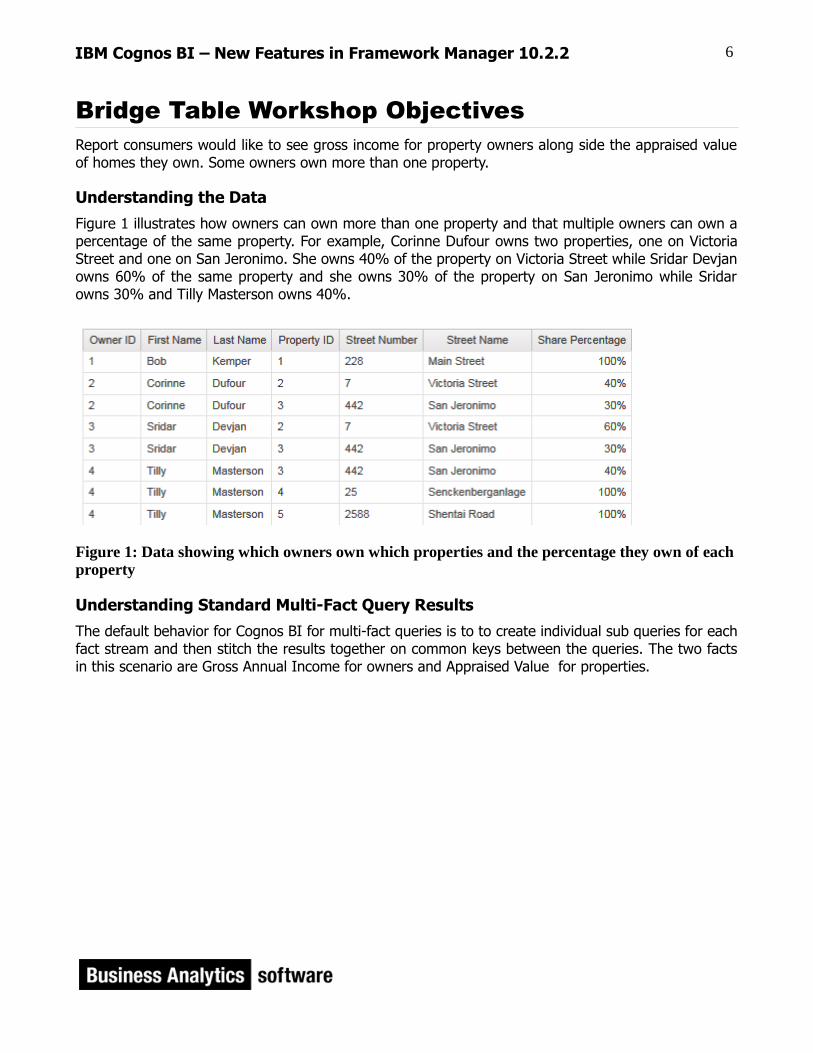
Bridge Table Workshop ObjectivesReport consumers would like to see gross income for property owners along side the appraised valueof homes they own. Some owners own more than one property.
Understanding the Data
Figure 1 illustrates how owners can own more than one property and that multiple owners can own apercentage of the same property. For example, Corinne Dufour owns two properties, one on VictoriaStreet and one on San Jeronimo. She owns 40% of the property on Victoria Street while Sridar Devjanowns 60% of the same property and she owns 30% of the property on San Jeronimo while Sridarowns 30% and Tilly Masterson owns 40%.
Figure 1: Data showing which owners own which properties and the percentage they own of each property
Understanding Standard Multi-Fact Query Results
The default behavior for Cognos BI for multi-fact queries is to to create individual sub queries for eachfact stream and then stitch the results together on common keys between the queries. The two factsin this scenario are Gross Annual Income for owners and Appraised Value for properties.
6

IBM Cognos BI – New Features in Framework Manager 10.2.2
In the case of queries that are linked via a bridge table but do not include any items from the bridgetable, the result will return all items from either side of the bridge table and arbitrarily stitch themtogether. This ensures that no records are lost, but the items in a row may not necessarily becorrelated to one another. This is evidenced in Figure 2 where the row that displays data for CorinneDufour shows a property on Senckenberganlage. As seen in the raw data earlier, she does not ownthis property, hence the correlation is not what might be expected.
Figure 2: Query results showing uncorrelated data
Essentially, only one record per owner and per property is returned and stitched together. In mostcases this is fine, but in the case where the intent was for the query to treat the joining table betweenthese two fact streams as a bridge table, then these results are unexpected.
Understanding Bridge Table Query Results
If configured correctly, when a bridge table is used to join multiple fact streams together, you will seethe correct correlations. You will also see repeating fact data, but IBM Cognos is aware of this and willnot double-count these values when aggregating.
In Figure 3 you can now see the correct properties correlated with Corrine Dufour's rows. In the firstrow for Corinne, you can see that she has a Gross Annual Income value of $68,000 and owns aproperty on San Jeronimo which has an Appraised value of $820,000. On the second row for Corinne,you can see that the value for Gross Annual Income is still $68,000, but she owns a property onVictoria Street with an Appraised Value of $2,550,000. If you look to other owners of these sameproperties, their appraised values will be the same. This makes sense since the value of a propertywill not changed based on the owner and an owner's gross annual income will not change based onwhich property they own. This is why it is important to not double-count these repeating values.
7

IBM Cognos BI – New Features in Framework Manager 10.2.2
Figure 3: Query results showing properly correlated data based on the bridge table data combinations
In the following steps, you will examine the data in the data source and examine the results that arereturned before and after configuring the model to identify a specific query subject as a bridge table.
To complete this workshop, you will need to create a BridgeTable database in the supported vendor ofyour choice using the data in the supplied BridgeTableData.xls spreadsheet. Once the database iscreated, you will need to create a JDBC data source connection to it by the same name in CognosConnection. For DQM connectivity instructions, please refer to the Dynamic Query Guide that shipswith the product.
8

IBM Cognos BI – New Features in Framework Manager 10.2.2
Bridge Table Workshop Steps
1. Open IBM Cognos Framework Manager.2. Click on Open a project, navigate to the BridgeTable model folder provided with this
document, select BridgeTable.cpf, and then click Open.3. In the Project Viewer, expand the BridgeTable namespace, followed by the Business View
namespace.
Figure 4: Project Viewer with specified objects expanded
9

IBM Cognos BI – New Features in Framework Manager 10.2.2
4. Double-click on the Business View namespace to give it focus and then in the middle pane,click on the Diagram tab.
Figure 5: Diagram pane showing objects and their relationships in the Business View
The diagram indicates the relationships between the query subjects. Owners containsinformation about the property owners and has a one-to-many relationship to the Owner Factquery subject which contains their gross annual income. Property contains information aboutproperties and has a one-to-many relationship with Property Fact that contains their appraisalvalues. Owner and Property both have a one-to-many relationship to Owner-Property Bridgewhich contains all owner to property combinations along with the percentage of ownership forthe properties.
10

IBM Cognos BI – New Features in Framework Manager 10.2.2
5. In the diagram, multi-select the following items (click the first item and then Ctrl-click therest):
▪ First Name and Last Name from Owner ▪ Gross Annual Income from Owner Fact▪ Street Number and Street Name from Property▪ Appraised Value from Property Fact
Figure 6: Diagram with specified items selected
6. Right-click on one of the highlighted items, and then click Test.
11

IBM Cognos BI – New Features in Framework Manager 10.2.2
7. Click the Auto Sum check box in the top right corner to emulate studio behavior, which is toauto group and summarize, and then click Test Sample.
Figure 7: Test Results window showing results of the query
The results appear as described in the Workshop Objectives section where the property data isnot directly correlated to the owner data.
You will now publish this package and create a simple list report with a summary footer to seethe overall totals.
8. Click Close, and then in the Project Viewer, expand Packages.
9. Right-click on Bridge Table, click Publish Packages, click Next twice, and then clickPublish.
10. Click Finish, and then click Close.
11. Open Internet Explorer, In the Address bar, type the location of your IBM Cognos BIgateway location (example http://localhost/ibmcognos), and then press Enter on thekeyboard.
12. Click Author advanced reports, and then under list of all packages, click Bridge Table.
12

IBM Cognos BI – New Features in Framework Manager 10.2.2
Report Studio opens.
13. Click Create New, click List, and then click OK.14. In the Source pane, expand Owner, and then drag and drop First Name and Last Name to
the List object in the report layout to the right.
Figure 8: Report Studio with items added to the list object
15. Expand Owner Fact, and then drag and drop Gross Annual Income to the list to the rightof Last Name.
16. Expand Property, and then drag and drop Street Number and Street Name to the right ofGross Annual Income.
13

IBM Cognos BI – New Features in Framework Manager 10.2.2
17. Expand Property Fact, and then drag and drop Appraised Value to the right of StreetName.
Figure 9: Report Studio with all specified items added to the list object
18. In the List, click Gross Annual Income, and then Ctrl-click Appraised Value.19. On the toolbar, click the Summarize button ( ), and then click Automatic Summary.
Figure 10: List object with summary row added
20. On the toolbar, click the Run Report button ( ).
14

IBM Cognos BI – New Features in Framework Manager 10.2.2
Notice the totals in the report output. The overall summary is 2,416,000 for Gross AnnualIncome and 4,957,000 for Appraised Value. Once the bridge table is configured, the reportdetails should change, but not the overall summary values.
Figure 11: Report output showing correct summary row values
You will now return to Framework Manager and configure the model accordingly for this scenario.
21. Close the browser window for IBM Cognos Viewer but leave the Report Studio window open asyou will return to the report you authored to test you model changes.
22. In Framework Manager, in the Diagram pane, click the Owner-Property Bridge querysubject.
23. In the Properties pane, change the (DQM) Usage property from Default to Bridge.24. Using the previous Publish Package steps, publish the Bridge Table package again, click Yes
when prompted to overwrite the existing package, and then click Finish and close anyinformation windows.
25. Return to your report in Report Studio.26. In the Source pane, click the Change Report Package button ( ).27. In the Report Package dialog, select Bridge Table, and then click OK.
This action ensures you are using the latest version of the package.
28. Click OK to the information message indicating the report specification is valid.29. Run the report and examine the output.
15

IBM Cognos BI – New Features in Framework Manager 10.2.2
Notice the overall summary totals are the same, but the detail rows now display all thecombinations of owners and their properties.
Figure 12: Report output displaying the expected combination results for owners and their properties with the correct summary row values
Filter Join Optimization Workshop ObjectivesIn this work shop you will simply explore the effect of changing the (DQM) Filter Type property of arelationship to see how you can leverage optimizing join filters when dealing with joins acrossmultiple data sources. Although this example does not use multiple data sources, the generatedSQL demonstrates the benefits to using this feature.
This workshop uses the CS-Sample Model 10.2.2 provided as well as the GOSALESDW sampledatabase that ships with the product. A data source called great_outdoors_warehouse will needto be configured in Cognos Connection using a JDBC connection. Please refer to the BusinessIntelligence Installation and Configuration Guide for samples setup instructions and the DynamicQuery Guide for DQM connectivity.
Filter Join Optimization Workshop Steps
1. In Framework Manager, from the File menu, click on Open, navigate to the CS-SampleModel 10.2.2 model folder provided with this document, select CS-Sample Model10.2.2.cpf, and then click Open.
2. In the Project Viewer, expand the Great Outdoors Sales namespace.
16

IBM Cognos BI – New Features in Framework Manager 10.2.2
3. Double-click on the Business View namespace to give it focus and then in the middlepane, click the Diagram tab.
The diagram appears in the middle pane. You will modify the relationship between OrderMethod and Sales in the next few steps, but first you will test a query to see analyze thegenerated SQL.
Figure 13: Diagram showing a few items from the model such as Order Method and Sales and the relationships between them
4. In the Diagram, select Order Method from the Order Method Query Subject, and thenCtrl-click Revenue from Sales.
5. Right-click one of the selected items, and then click Test.
6. Select Auto Sum in the top right corner, and then click Test Sample.
17

IBM Cognos BI – New Features in Framework Manager 10.2.2
7. Click the Query Information tab.
Figure 14: Query information tab in the Test Results window showing Cognos and Native SQL
Notice the inner join between the two tables on ORDER_METHOD_KEY. If these twotables came from two separate data sources then the queries would be sent to each datasource independently and the results joined together locally on the BI server. This could bea costly operation if the fact table on the many side of the relationship had a large data set(in the millions or billions).
To avoid bringing back the entire fact table, we can filter the table with the items found inthe Order Method table which is considerably smaller. To do so, we will change the (DQM)Filter Type property of the relationship.
8. Click Close, and then in the diagram, click the relationship between Order Method andSales Fact.
9. In the Properties pane, change the (DQM) Filter Type property from None to In.
10. Run the same test again and look at the SQL.
Notice in the Cognos and Native SQL there is a Where Clause (bolded below) in the subselect statement for the fact table that filters on each of the ORDER_METHOD_KEYvalues found in the SLS_ORDER_METHOD_DIM table.
Cognos SQL
WITH Order_Method AS (
18

IBM Cognos BI – New Features in Framework Manager 10.2.2
SELECT SLS_ORDER_METHOD_DIM.ORDER_METHOD_EN AS Order_Method, SLS_ORDER_METHOD_DIM.ORDER_METHOD_KEY AS Order_Method_Key FROM great_outdoors_warehouse..gosalesdw.SLS_ORDER_METHOD_DIM SLS_ORDER_METHOD_DIM ), Sales AS ( SELECT SLS_SALES_FACT.SALE_TOTAL AS Revenue, SLS_SALES_FACT.ORDER_METHOD_KEY AS ORDER_METHOD_KEY FROM great_outdoors_warehouse..gosalesdw.SLS_SALES_FACT SLS_SALES_FACT WHERE SLS_SALES_FACT.ORDER_METHOD_KEY IN ( 601, 602, 603, 604, 605, 606, 607 ) )SELECT Order_Method.Order_Method AS Order_Method, SUM(Sales.Revenue) AS RevenueFROM Order_Method INNER JOIN Sales ON Order_Method.Order_Method_Key = Sales.ORDER_METHOD_KEY GROUP BY Order_Method.Order_Method
Native SQL
SELECT "Order_Method"."Order_Method" AS "Order_Method", SUM("Sales"."Revenue") AS "Revenue" FROM ( SELECT "SLS_ORDER_METHOD_DIM"."ORDER_METHOD_EN" AS "Order_Method", "SLS_ORDER_METHOD_DIM"."ORDER_METHOD_KEY" AS "Order_Method_Key" FROM "gosalesdw"."SLS_ORDER_METHOD_DIM" "SLS_ORDER_METHOD_DIM" ) "Order_Method" INNER JOIN ( SELECT "SLS_SALES_FACT"."SALE_TOTAL" AS "Revenue", "SLS_SALES_FACT"."ORDER_METHOD_KEY" AS "ORDER_METHOD_KEY" FROM "gosalesdw"."SLS_SALES_FACT" "SLS_SALES_FACT" WHERE "SLS_SALES_FACT"."ORDER_METHOD_KEY" IN ( 601, 602, 603, 604, 605, 606,607 ) ) "Sales" ON "Order_Method"."Order_Method_Key" = "Sales"."ORDER_METHOD_KEY" GROUP BY "Order_Method"."Order_Method"
19

IBM Cognos BI – New Features in Framework Manager 10.2.2
You can use the Between setting if you wish to filter between the min and max values inthe smaller table and the Table setting if you want the generated filter to be a table valueconstructor form of the IN predicate.
11. Click Close.
Keep this model open for the next workshop.
Summary Query Subject Workshop ObjectivesIn this work shop you will explore the effect of changing the (DQM) Usage property of the MonthlyRevenue Above 100 Million query subject to see how you can leverage a summary query subjectin Framework Manager modeling. The Monthly Revenue Above 100 Million query subject simplyconsists of the Month Key from the GO_TIME_DIM table and Revenue from SLS_SALES_FACTand a filter attempting to filter on Revenue greater than 100 million. The intent of this querysubject is to create an aggregate of Revenue, which is originally stored at the day level in thedatabase, to the month level.
This type of aggregation is still done at run time and is not an approach to optimize queries, butrather an approach to create sub queries that produce values that you can further manipulate in aparent query. In this example we are aggregating Revenue at the month level and then applyingan after aggregation filter to see which monthly revenue values are above 100 million.
This workshop uses the same model and configuration as the previous workshop.
Summary Query Subject Workshop Steps
1. In the Diagram pane, double-click Monthly Revenue Above 100 Million.2. Click the Filters tab and take note of the filter.
Figure 15: Query Subject Definition window showing the filter tab contents
The filter called Revenue above 100 million is attempting to filter out Revenue less than100 million. But this filter, in it's current state, can only filter detail rows in the data.
3. Click the Test tab, select Auto Sum, and then click Test Sample.
No results are returned.
20
IBM Cognos BI – New Features in Framework Manager 10.2.2
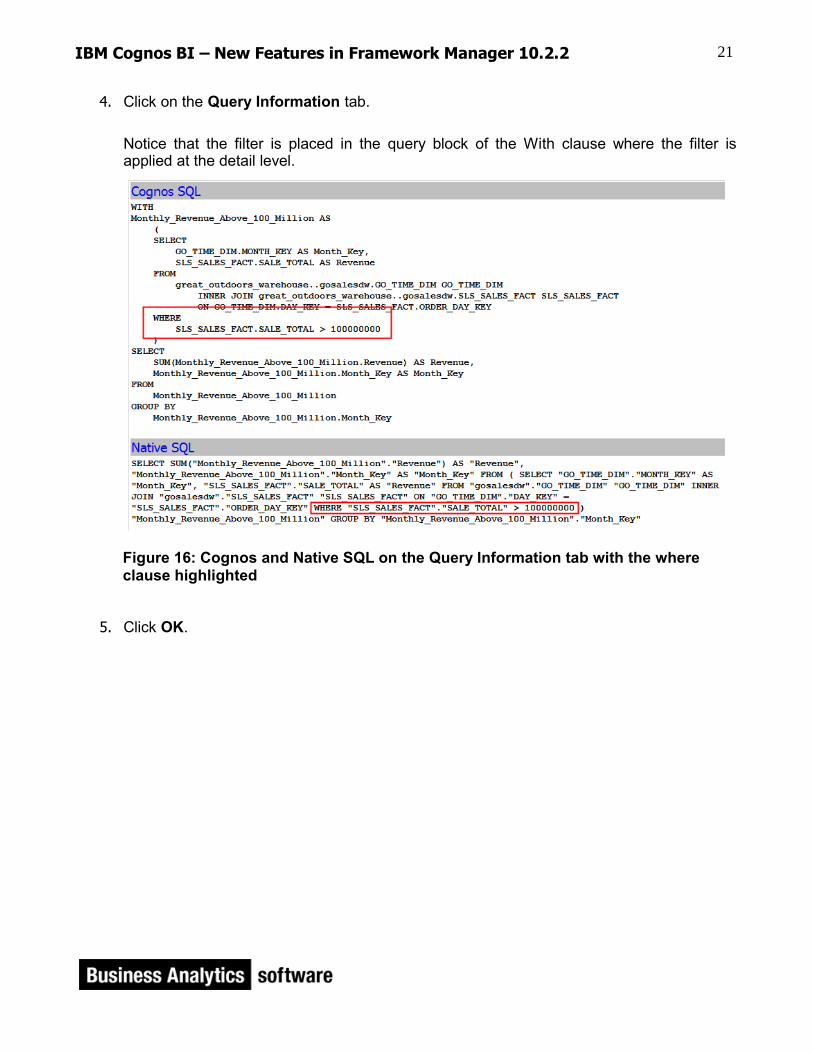
4. Click on the Query Information tab.
Notice that the filter is placed in the query block of the With clause where the filter isapplied at the detail level.
Figure 16: Cognos and Native SQL on the Query Information tab with the where clause highlighted
5. Click OK.
21

IBM Cognos BI – New Features in Framework Manager 10.2.2
6. In the Properties pane, change the (DQM) Usage property from Default to SummaryQuery.
Figure 17: Properties pane with (DQM) Usage property changing to Summary Query
7. Double-click Monthly Revenue Above 100 Million again, and then click the Filter tab.
Notice there is now a (DQM) Application column where you can set the filter to be before orafter auto aggregation.
Figure 18: Query Subject Definition window showing the filter tab contents now witha (QM) Application column
In this case, we want after auto aggregation so we can see products with revenue greaterthan 100 million at the Month aggregate level.
8. Change the (DQM) Application column to After Auto Aggregation.
9. Click the Test tab, and then click Test Sample.
Results are now returned.
22

IBM Cognos BI – New Features in Framework Manager 10.2.2
Figure 19: Query results with the After Auto Aggregation filter applied and only Revenue values above 100 million
Notice that we did not need to select Auto Sum. The query subject does this automatically.If you select Auto Sum now and retest, the results will be the same. Also notice that thefilter is working as expected and we only see months where revenue is above 100 million.
10. Click on the Query Information tab.
Now we can see there is one query to summarize the Revenue values,RSF_Monthly_Revenue_Above_100_Million, and another to filter on those summarizedvalues, Monthly_Revenue_Above_100_Million.
Figure 20: Cognos and Native SQL on the Query Information tab with the where clause highlighted
23

IBM Cognos BI – New Features in Framework Manager 10.2.2
11. Click OK, and then in the Diagram, using Ctrl-click, select Year and Month from Time andRevenue from Monthly Revenue Above 100.
12. Right-click one of the selected items, click Test, and then click Test Sample.
Again, we can see that the Revenue values are aggregated to the month level without theneed to to enable the Auto Sum feature and that the values are filtered accordingly.
Figure 21: Query results showing the values filtered as expected without the Auto Sum enabled
24